annual report 2012 - steppe cement ltd
TRANSCRIPT
Annual Report 2012
Steppe Cement Ltd. 2
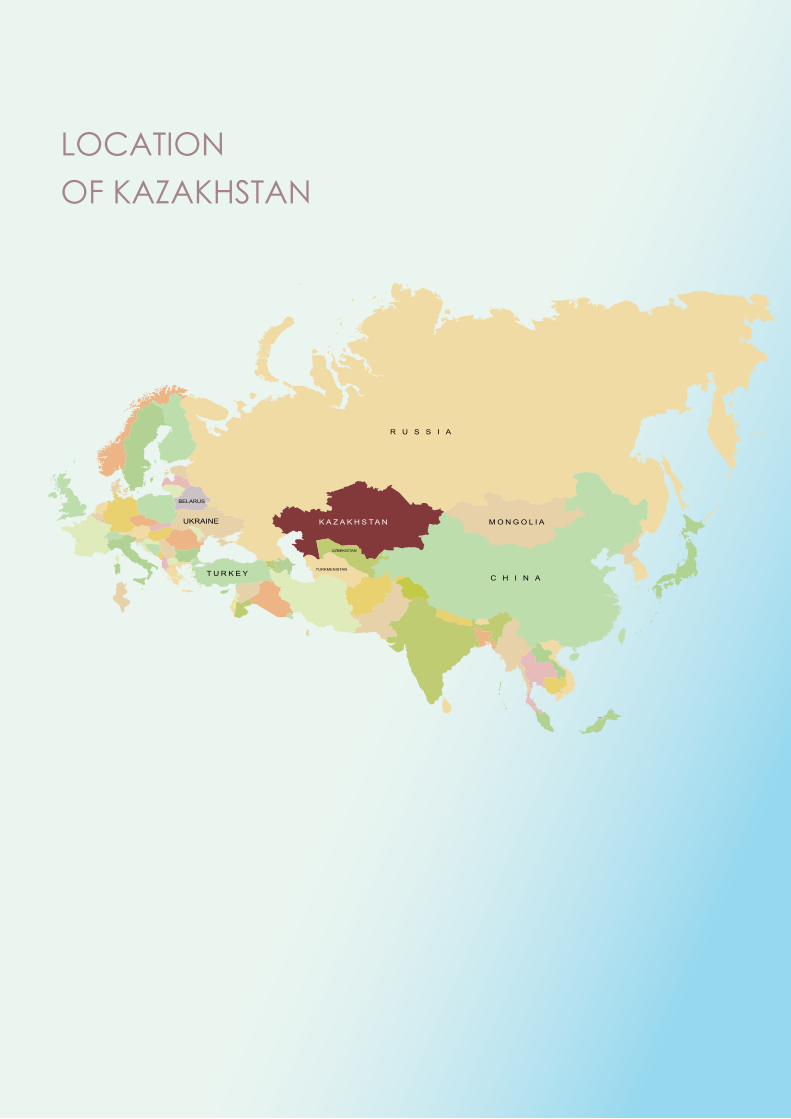
LOCATION OF KAZAKHSTAN

Annual Report 20123
PLANT LOCATION IN KAZAKHSTAN
Aktobe
Karaganda
Almaty
Shymkent
Astana
SemeySteppe Cement Plant
Atrau
Aktau
KAZAKHSTAN
Steppe Cement Ltd. 4
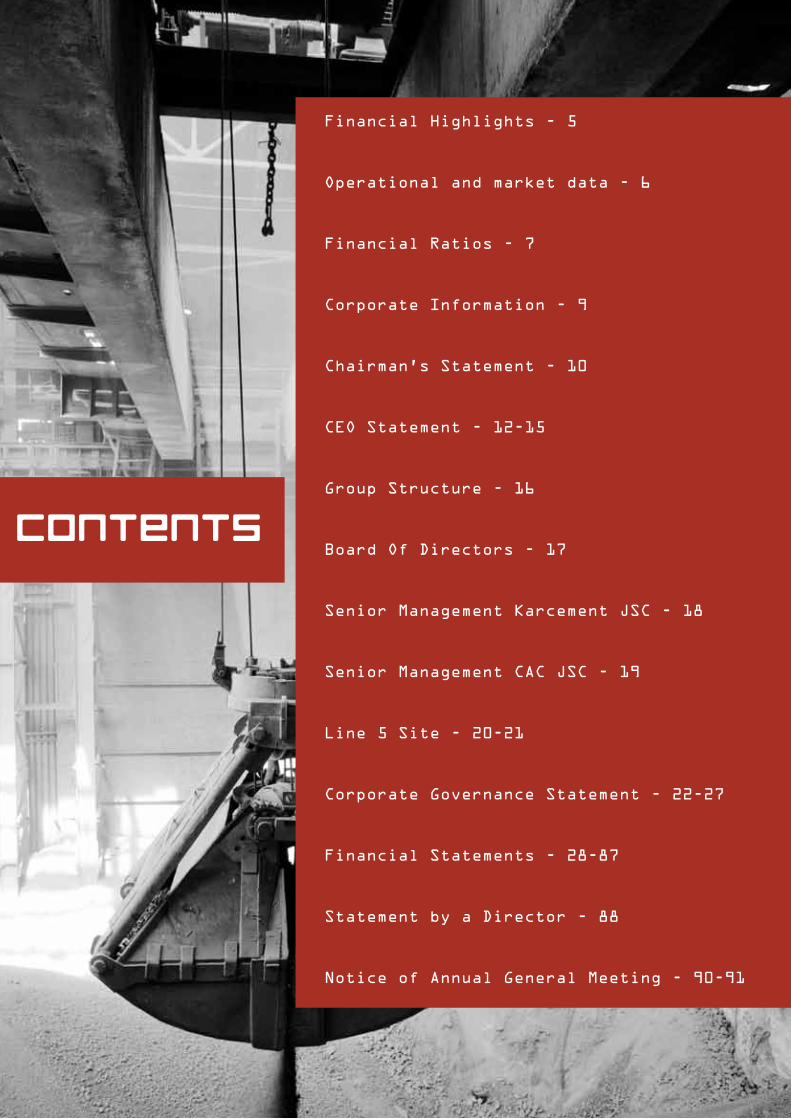
CONTENTS
Financial Highlights - 5
Operational and market data - 6
Financial Ratios - 7
Corporate Information - 9
Chairman’s Statement - 10
CEO Statement - 12-15
Group Structure - 16
Board Of Directors - 17
Senior Management Karcement JSC - 18
Senior Management CAC JSC - 19
Line 5 Site - 20-21
Corporate Governance Statement - 22-27
Financial Statements - 28-87
Statement by a Director - 88
Notice of Annual General Meeting - 90-91
Annual Report 20125
18.6
128.9
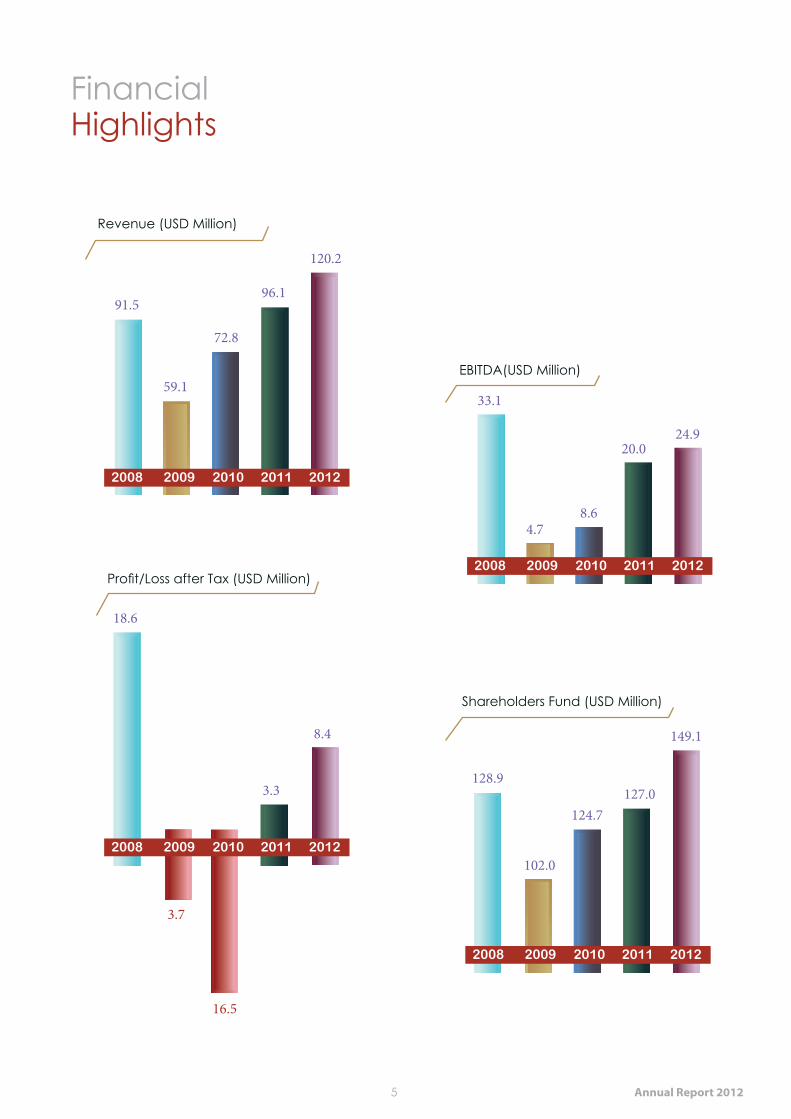
Financial Highlights
Revenue (USD Million))
Shareholders Fund (USD Million)
EBITDA(USD Million)
96.191.5
33.1
127.03.3
20.0
120.2
149.18.4
24.9
59.1
102.0
4.7
72.8
124.7
16.5
3.7
8.6
20092008 2010 2011 2012
Profit/Loss after Tax (USD Million)20092008 2010 2011 2012
20092008 2010 2011 2012
20092008 2010 2011 2012
Steppe Cement Ltd. 6
20 1.675
18 1.6
6214 0.8
96
20 1.6 8019 1.684
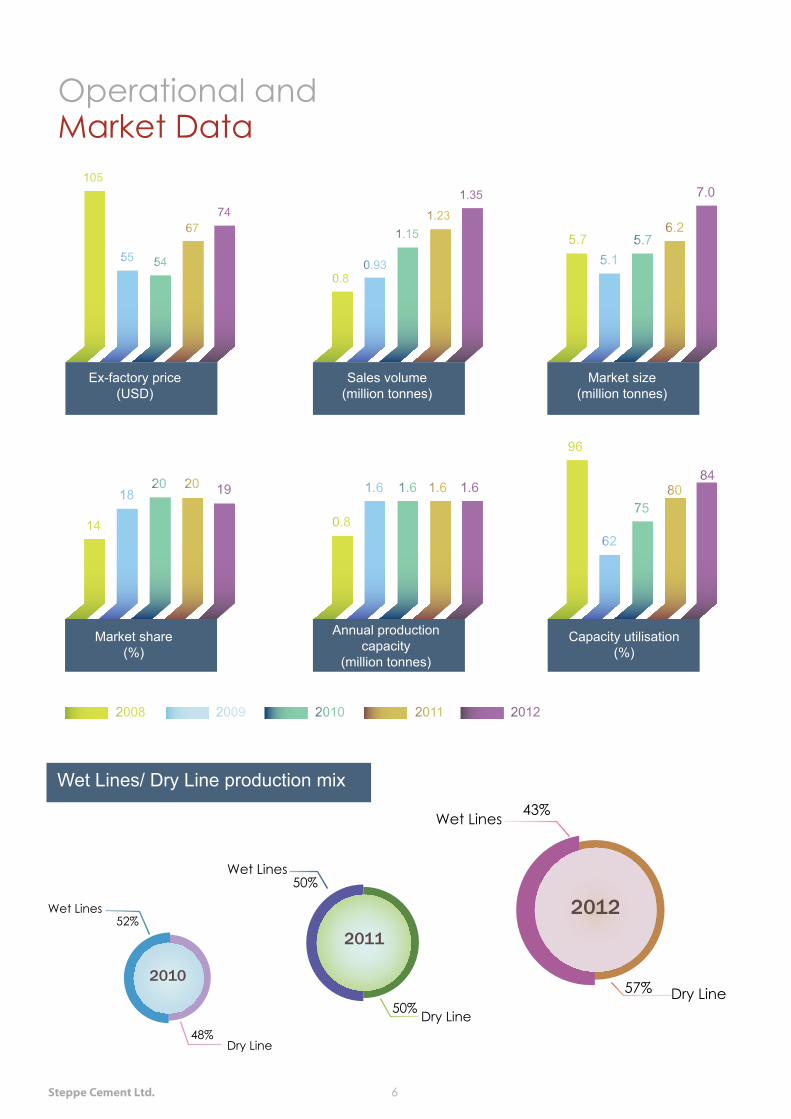
Operational and Market Data
Wet Lines/ Dry Line production mix
2011
2012
2010
Wet Lines
Wet Lines
Wet Lines
Dry LineDry Line
Dry Line
50%
43%
50%57%
52%
48%
Ex-factory price (USD)
54
1.15 5.755 0.93 5.1
105
0.8
5.767
1.236.2
741.35 7.0
Market share (%)
Sales volume (million tonnes)
Annual production capacity
(million tonnes)
Market size (million tonnes)
Capacity utilisation (%)
20122009 20112008 2010
Annual Report 20127
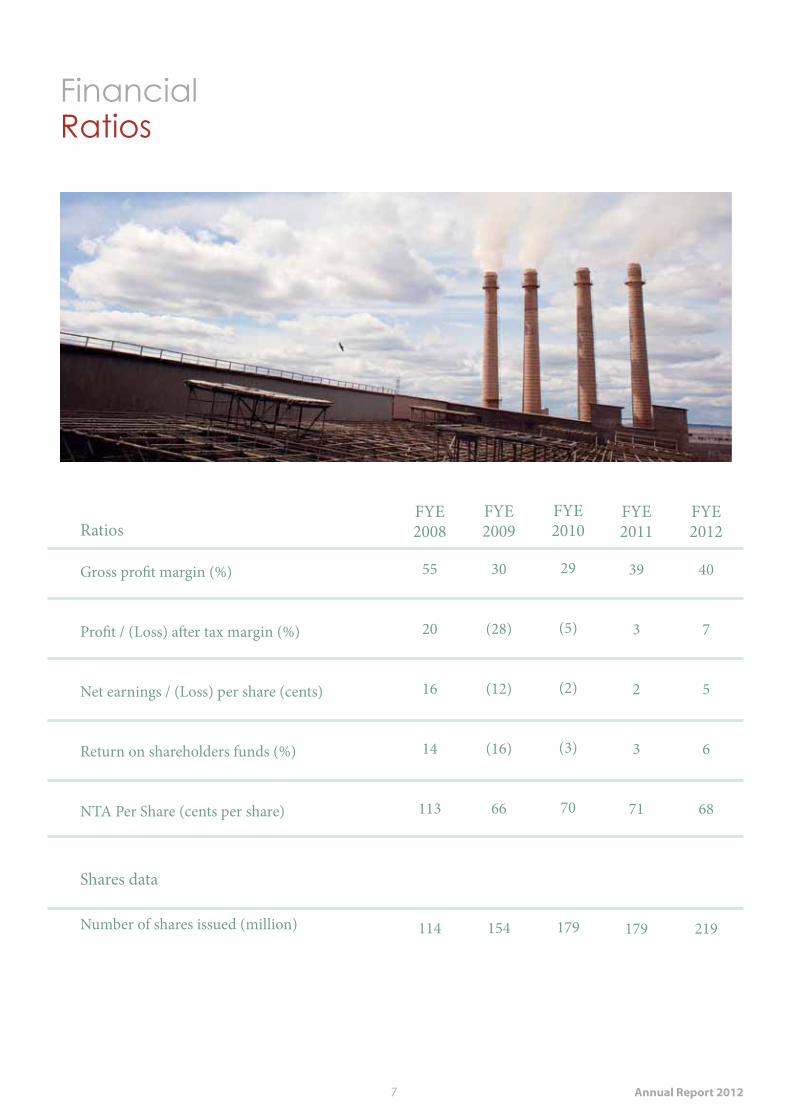
FinancialRatios
Gross profit margin (%)
Profit / (Loss) after tax margin (%)
Net earnings / (Loss) per share (cents)
Return on shareholders funds (%)
NTA Per Share (cents per share)
29
(5)
(2)
(3)
70
179
55
20
16
14
113
114
30
(28)
(12)
(16)
66
154Number of shares issued (million)
Shares data
RatiosFYE2008
FYE2009
FYE2010
FYE2011
FYE2012
39
3
2
3
71
179
40
7
5
6
68
219

Steppe Cement Ltd. 8
Annual Report 20129
CorporateInformation
ListingAlternative Investment Market (AIM) in London Since 15 September 2005
AIM Stock Code STCM
Bloomberg TickerSTCM LN Equity
Reuters TickerSTCM L
Company RegistrationLL04433
Country of incorporationFederal Territory of Labuan, Malaysia
Head Office Address10th Floor Rohas Perkasa, West WingNo.8, Jalan Perak 50450 Kuala LumpurMalaysia
Main Country of Operation(Operating Subsidiaries’ Address)472380, Aktau VillageKaraganda RegionRepublic of Kazakhstan
Company SecretaryTMF Trust Labuan Limited (formerly known as Equity Trust Secretaries Ltd)
Nominated AdvisorRFC Ambrian LimitedLevel 14, 19-31 Pitt StreetSydney, NSW 2000 Australia
Level 15 QV1Building 250 St Georges TcePerth, WA 6000Australia
BrokerWesthouse Securities Limited One Angel Court London EC2R 7HJ
BankersEuropean Bank of Reconstruction and DevelopmentSB HSBC Bank Kazakhstan JSCHalyk Bank JSCBank Center Credit JSC
Group AuditorDeloitte & ToucheUnit 3(I2) Main Office TowerFinancial Park LabuanJalan Merdeka87000 Wilayah Persekutuan LabuanMalaysia
UK RegistrarComputershare Investor Services PLCPO Box 82The PavilionsBridgwater RoadBristol BS99 7NH
Solicitor Kazakh LawBMF Group LLPAlatau Business Center151 Abay Street, Almaty 050009,Republic of Kazakhstan
Adelaida Legal Group, LLP12/1 Kunayev Street, Block 5B, 4th floor, Office #1, Astana 010000, Republic of Kazakhstan
Steppe Cement Ltd. 10
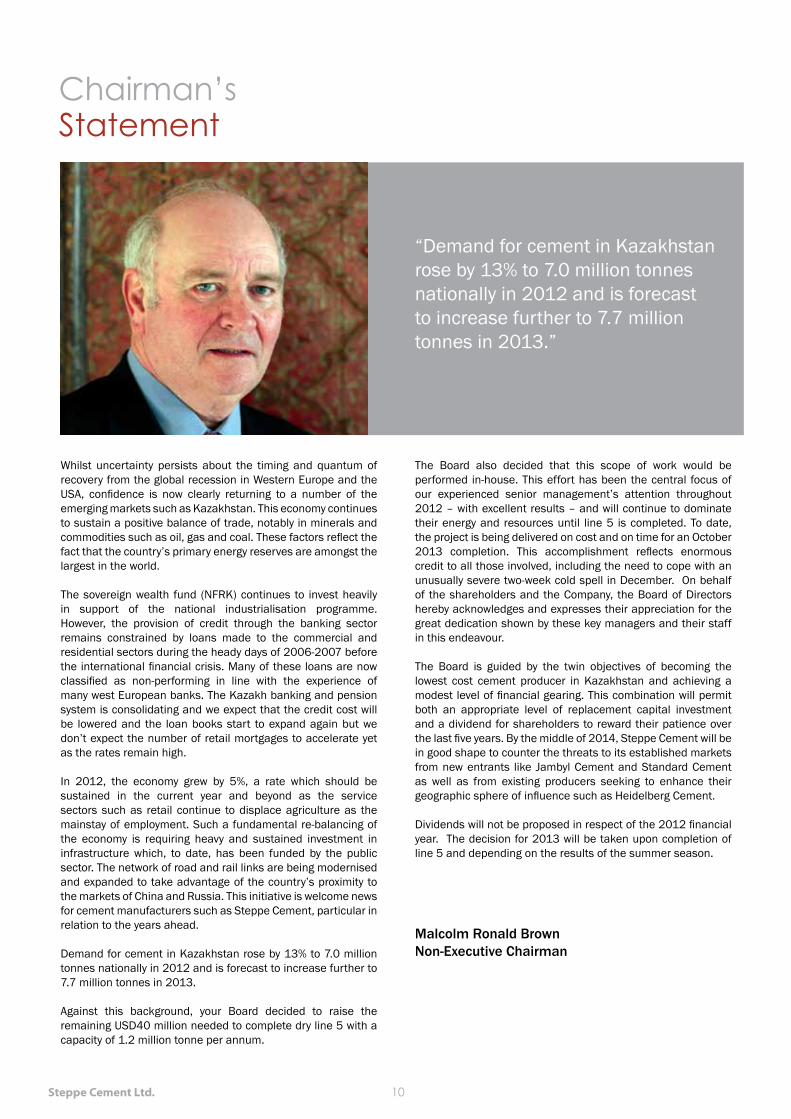
Chairman’s Statement
Whilst uncertainty persists about the timing and quantum of recovery from the global recession in Western Europe and the USA, confidence is now clearly returning to a number of the emerging markets such as Kazakhstan. This economy continues to sustain a positive balance of trade, notably in minerals and commodities such as oil, gas and coal. These factors reflect the fact that the country’s primary energy reserves are amongst the largest in the world.
The sovereign wealth fund (NFRK) continues to invest heavily in support of the national industrialisation programme. However, the provision of credit through the banking sector remains constrained by loans made to the commercial and residential sectors during the heady days of 2006-2007 before the international financial crisis. Many of these loans are now classified as non-performing in line with the experience of many west European banks. The Kazakh banking and pension system is consolidating and we expect that the credit cost will be lowered and the loan books start to expand again but we don’t expect the number of retail mortgages to accelerate yet as the rates remain high.
In 2012, the economy grew by 5%, a rate which should be sustained in the current year and beyond as the service sectors such as retail continue to displace agriculture as the mainstay of employment. Such a fundamental re-balancing of the economy is requiring heavy and sustained investment in infrastructure which, to date, has been funded by the public sector. The network of road and rail links are being modernised and expanded to take advantage of the country’s proximity to the markets of China and Russia. This initiative is welcome news for cement manufacturers such as Steppe Cement, particular in relation to the years ahead.
Demand for cement in Kazakhstan rose by 13% to 7.0 million tonnes nationally in 2012 and is forecast to increase further to 7.7 million tonnes in 2013.
Against this background, your Board decided to raise the remaining USD40 million needed to complete dry line 5 with a capacity of 1.2 million tonne per annum.
The Board also decided that this scope of work would be performed in-house. This effort has been the central focus of our experienced senior management’s attention throughout 2012 – with excellent results – and will continue to dominate their energy and resources until line 5 is completed. To date, the project is being delivered on cost and on time for an October 2013 completion. This accomplishment reflects enormous credit to all those involved, including the need to cope with an unusually severe two-week cold spell in December. On behalf of the shareholders and the Company, the Board of Directors hereby acknowledges and expresses their appreciation for the great dedication shown by these key managers and their staff in this endeavour.
The Board is guided by the twin objectives of becoming the lowest cost cement producer in Kazakhstan and achieving a modest level of financial gearing. This combination will permit both an appropriate level of replacement capital investment and a dividend for shareholders to reward their patience over the last five years. By the middle of 2014, Steppe Cement will be in good shape to counter the threats to its established markets from new entrants like Jambyl Cement and Standard Cement as well as from existing producers seeking to enhance their geographic sphere of influence such as Heidelberg Cement.
Dividends will not be proposed in respect of the 2012 financial year. The decision for 2013 will be taken upon completion of line 5 and depending on the results of the summer season.
Malcolm Ronald BrownNon-Executive Chairman
“Demand for cement in Kazakhstan rose by 13% to 7.0 million tonnes nationally in 2012 and is forecast to increase further to 7.7 million tonnes in 2013.”
Annual Report 201211
Steppe Cement Ltd. 12
CEO’sStatement
In 2012 Steppe Cement posted a net profit of USD8.4 million with higher capacity utilization at 85%. Sales volume improved by 10% while selling prices increased by 14%, which was well above the overall inflation rate of 6% for the year. Steppe Cement’s EBITDA rose to USD24.9 million compared with USD19.9 million in 2011.
During the year Steppe Cement decided to pursue the completion of line 5, taking its total capacity to 2 million tonnes from the dry lines and 0.8 million tonnes from the wet lines. The total cost of the line 5 project is USD105 million of which USD65 million was spent in 2007 and 2008. To complete the financing, Steppe Cement issued bonds in November 2012 for USD10 million nominal amount with a 10% coupon maturing in November 2017 and also completed a share offer with 40 million new shares issued for trading on the AIM market of the London Stock Exchange in December 2012. The share offer was oversubscribed by existing shareholders and raised USD15.7 million net of expenses. The total amount of outstanding and fully paid shares now stands at 219 million. These proceeds, together with the surplus cash flow from operations in 2012 and 2013, will allow the company to fund the completion of line 5 by October 2013.
The market volume increased by 13% in 2012 and we expect a 10% increase in 2013
The Kazakh cement market in 2012 was 7 million tonnes, an increase of 13% compared to 6.2 million tonnes in 2011. Our expectations are that overall market demand in 2013 will increase by 10% to 7.7 million tonnes. This increase in market size will mostly be taken up by new entrants in 2011 and 2012. We expect our new line 5 to be commissioned in October 2013 after the high selling season, so it will not have an effect on our 2013 volumes.
Imports declined again in 2012 and the share of local producers increased from 85% to 87%. Steppe Cement’s average cement
selling prices increased by 14% to USD89 per tonne delivered (equivalent to USD75 per tonne ex-factory) when compared to the previous year.
Steppe Cement managed to maintain a market share of 19.3% in the cement market of Kazakhstan in 2012 (compared with 20% in 2011). In 2013 Steppe Cement expects to see its selling price increase but its market share drop as demand is increasing faster than our production capacity. We hope to recover our market share in 2014 as line 5 comes fully on stream.
The dry line continues to improve its performance while the wet lines will be used to cover the balance of demand until line 5 is commissioned.
The four wet lines produced 583,850 tonnes in 2012, a decrease of 5% as compared to 2011. The dry line contributed 765,711 tonnes, 57% of total sales of Steppe Cement and an increase of 25% over 2011. We expect to maintain similar levels of production in 2013 due to the extreme weather conditions experienced during the last winter. Once line 5 is brought into production in October 2013, we expect to see a sharp increase in the volume of cement produced from the dry lines resulting in a significant reduction in production costs per tonne.
The sharp increase in production from line 6 in 2012 was achieved through increased reliability of the equipment and a reduction in downtime. Reliability of line 6 in 2012 was 81%, 5% higher than 2011, resulting in an additional 248 operating hours. Major improvements in line 6 during the year included:
• Kiln tyres and rollers were grinded to remove all distortions and uneven load on kiln bearings and girth gear.
• A redesigned kiln inlet tongue that has increased its lifetime from 4 months to more than 8 months and the removal of the retainer ring at the kiln outlet.
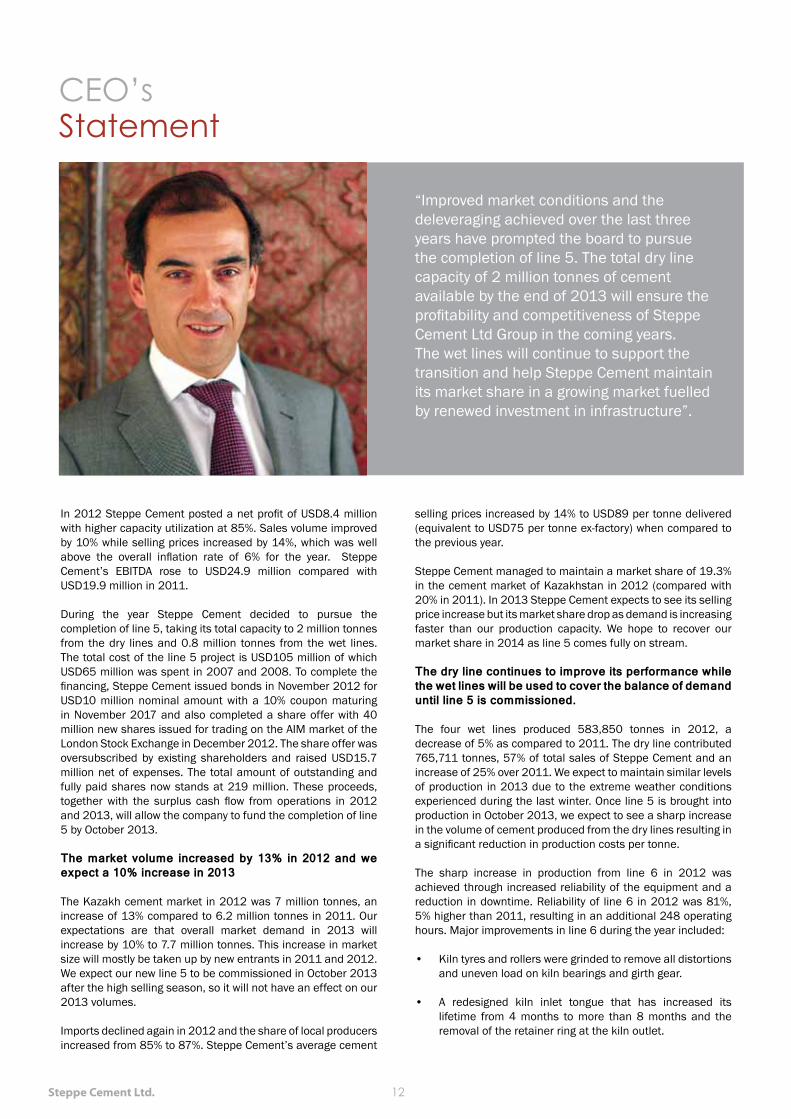
“Improved market conditions and the deleveraging achieved over the last three years have prompted the board to pursue the completion of line 5. The total dry line capacity of 2 million tonnes of cement available by the end of 2013 will ensure the profitability and competitiveness of Steppe Cement Ltd Group in the coming years. The wet lines will continue to support the transition and help Steppe Cement maintain its market share in a growing market fuelled by renewed investment in infrastructure”.
Annual Report 201213
CEO’sStatement
• The replacement of the girth gear links.
• Raw mills iron ore hopper was modified to improve material flow especially during winter.
• The separator of cement mill 3 was completed. Its performance will be tested during 2013 and, depending on the outcome, we will replicate the project in the other cement mills in the dry line.
• Overall production in the cement mills in the dry line increased by 34% in 2012 in anticipation of a rise in sales beginning in 2014.
During 2013 we will concentrate most of our capital investment on line 5 but we plan to continue improving the cement mill section as well as replacing of the pre-heater fans with a target to increase production from line 6 by up to 5%. Planned capital expenditure on line 6 will be limited to USD3 million during the year, most of it to be shared with line 5.
We are aiming to complete an electricity bypass line to supply electricity directly from Kegoc (the Kazakhstan National electricity grid company) to Karcement JSC during 2013. The target is to reduce the electricity costs to the dry lines by 30%. The total investment is USD2.5 million and the initial savings is estimated at approximately USD3 million per year. Most of the capital investment was completed in the second half of 2012.
Health and safety
In 2012, our subsidiary Karcement JSC embarked on preparations to be certified on ISO 14001 (environmental management system) and BS OHSAS 18001 (occupational health and safety management systems). In January 2013, two separate compliance audits were carried out by TUV Germany & Rastama Cert Kazakhstan that approved Karcement JSC as complying with these standards. We will extend progressively these certifications to the other operating subsidiaries.
Cost of production in dry and wet lines
Full production costs increased in 2012 by 12% (above the annual inflation rate of 6%). The major elements were the increases in electricity, coal and transportation costs. Once line 5 and the electrical bypass are completed, we expect our overall variable production cost to decrease in 2014 by at least 10%. The continuing increase in capacity utilization has also enabled us to bring down fixed production costs per tonne.
Selling expenses, reflecting mostly delivery costs, increased from USD12 per tonne in 2011 to USD14.7 per tonne in 2012. This is a combination of higher wagon rental rates and rates charged by the national railway company as well as direct deliveries by truck to clients in the area surrounding the factory. The regional market mix of sales was more focused in the central and northern regions during 2012. In 2013 transportation
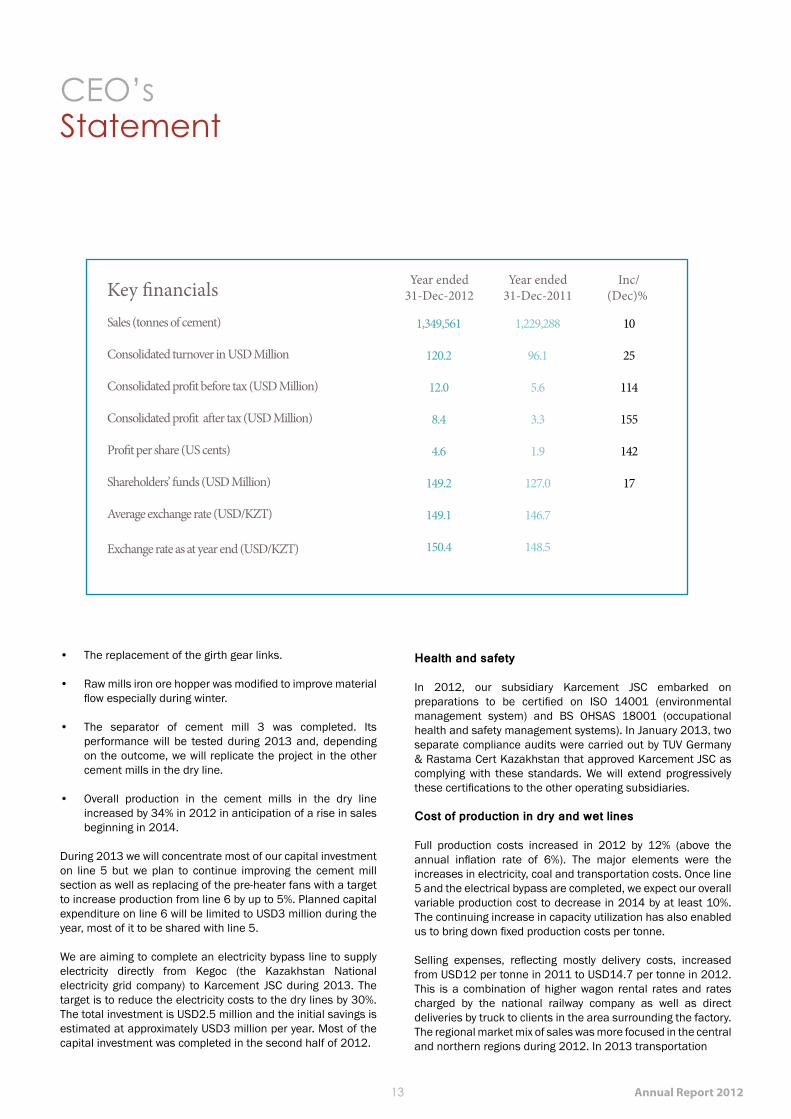
Key financials Year ended31-Dec-2012
Year ended31-Dec-2011
Inc/(Dec)%
Sales (tonnes of cement)
Consolidated turnover in USD Million
Consolidated profit before tax (USD Million)
Consolidated profit after tax (USD Million)
Profit per share (US cents)
Shareholders’ funds (USD Million)
Average exchange rate (USD/KZT)
Exchange rate as at year end (USD/KZT)
10
25
114
155
142
17
1,349,561
120.2
12.0
8.4
4.6
149.2
149.1
150.4
1,229,288
96.1
5.6
3.3
1.9
127.0
146.7
148.5
Steppe Cement Ltd. Annual Report 201214 15
CEO’sStatement
tariffs will increase again but we expect to pass these costs to customers.
General and administrative expenses increased by 4% in 2012
The labour count stood at 1,025 on 31 March 2013 compared with 1,030 on 31 March 2012. We now have 706 employees in the wet lines and administration and 319 in the dry line.
Line 5 project
Due to the improving market and our financial position, we decided to pursue the completion of line 5 within an additional budget of USD40 million. As of April 2013 we are on track to complete on or below budget, and on time for October 2013. The commissioning will be done through the winter of 2013 and we expect line 5 to replace most of the production from the wet lines by the summer of 2014, with its extra capacity going towards meeting increased sales.
Line 5 will have a total capacity of 1.2 million tonnes of cement and the cash cost savings per tonne when compared to the wet lines are preliminarily estimated at USD15/tonne.
Financing
After discussions with our existing banks (EBRD and HSBC) that held most of the assets under pledge, the board decided to finance the expansion through the issue of bonds and a share issue:
The company raised KZT1.49 billion in unsecured bonds with a 10% coupon on the Kazakhstan Stock Exchange in November 2012. The net proceeds were KZT1,426 million (approximately USD9.5 million). The bonds mature in November 2017.In December 2012 Steppe Cement issued 40 million new shares at 25p per share raising GBP9.7 million net of expenses (approximately USD15.5 million). We would like to thank our shareholders for the continuous support they have given us over the years and this issue was no exception as it was oversubscribed and 83% of existing shareholders participated. The current total number of shares on issue stands at 219 million.
The balance USD15 million will come from internally generated cash flows from operations during 2012 and 2013.
At the end of 2012, we had outstanding loans with EBRD and HSBC of USD30.1 million and USD13.4 million respectively that mature in stages till September 2015, where the average inter-est charged was 6-month USD Libor + 5.9% per annum.
We have secured a revolving working capital credit line from Halyk Bank for USD20 million at 10.75% per annum. It will be used to build stocks in the coming winters. By the end of 2012 only USD1.7 million from this short-term line was used.
In 2012 finance costs decreased to USD3.5 million from USD4.9 million in 2011 after we paid down loans during most of the year before issuing the bonds to finance line 5 in Novem-ber and USD0.8 million of finance costs was capitalised into property, plant and equipment since project line 5 resumed active development from 1 July 2012. We will continue to pay down the existing loans in 2013. Depreciation remained stable at USD9.4 million during 2012.
The cash balance (including short-term investments) on 31 December 2012 was USD20 million and the total indebted-ness (bank borrowings plus bonds) was USD55 million on the same date.
The statutory corporate income tax rate remains at 20% in Kazakhstan but Karcement JSC, our wholly owned subsidiary, will enjoy its last year of 0% income tax rate under tax holiday in 2013. In 2014, we may consider merging our subsidiaries Central Asia Cement (wet lines) and Karcement (dry lines) if it results in net administrative savings after taking into account tax considerations.
Javier del Ser Chief Executive Officer
-
-
Steppe Cement Ltd. 16
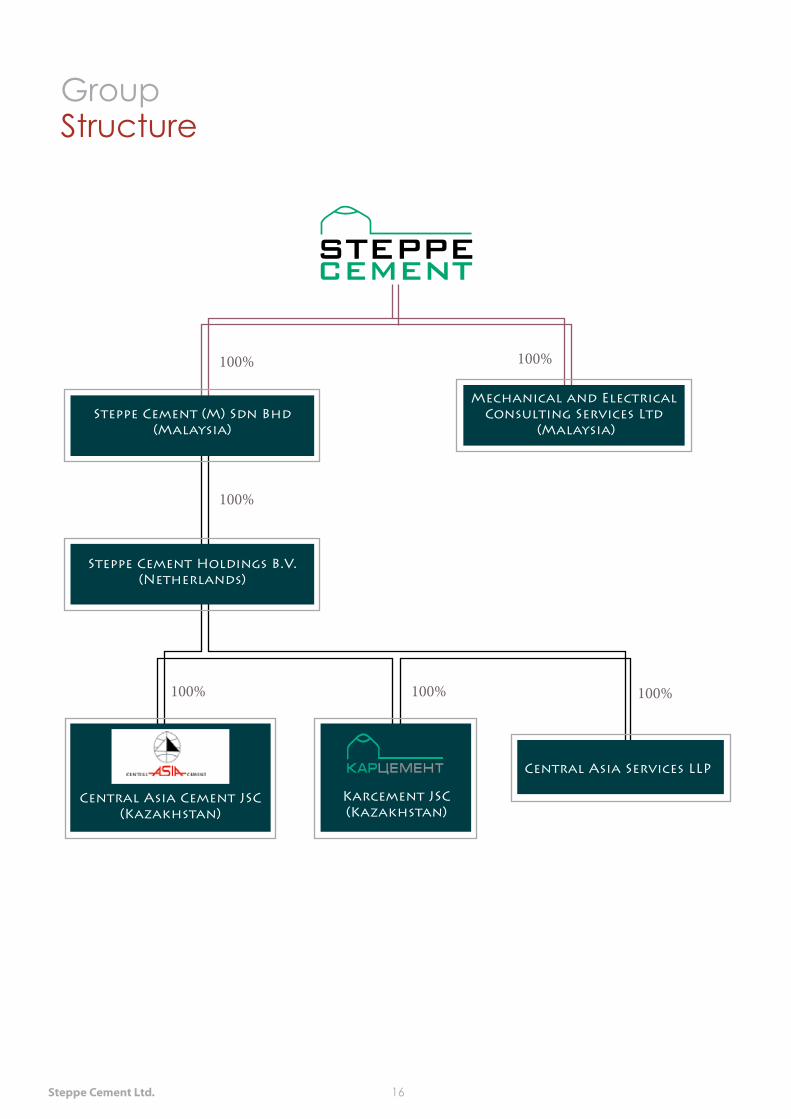
GroupStructure
Mechanical and Electrical Consulting Services Ltd
(Malaysia)Steppe Cement (M) Sdn Bhd
(Malaysia)
Central Asia Cement JSC(Kazakhstan)
Central Asia Services LLP
Karcement JSC(Kazakhstan)
Steppe Cement Holdings B.V.(Netherlands)
100%100%
100%100% 100%
100%

Annual Report 201217
Board ofDirectors
Malcolm Brown, 65 years of age, is a UK national with a background as an analyst and corporate finance adviser. He has significant experience with the European building materials sector and has been involved in a number of cement related transactions. Mr Brown worked with HSBC Investment Bank and its predecessor James Capel for 34 years as a director, senior analyst and adviser until his retirement in 2006. The research output, supported by a strong specialist sales team, enabled James Capel and subsequent to its purchase, by HSBC, to establish a leading position in the building material and construction sector in both the primary and the secondary market. This was reflected in the external poll ratings and the expanded number of corporate brokerships.
Some of the mandates in which Mr Brown was actively involved included the privatisation of the cement industry in Serbia and those in Algeria. In the former case, following the cessation of hostilities it was decided in 2001 that the three plants Beocin, Novi Popovac and Kosjeric should be sold and following a successful competitive auction, which was fast-tracked these were acquired by Lafarge, Holcim and Titan respectively. In Algeria HSBC won the mandate to advise the government on the sale of its cement assets and it was decided to prepare three out of the twelve plants for auction. Regrettably, although this had proceeded a long way, even to soliciting offers from international cement groups, the government withdrew at the eleventh hour in the face of strong union opposition.
Javier del Ser Perez 47, is a Chartered Engineer (Spain), master in Structural Engineering and has a degree in Finance from HEC. Javier has lived in Kazakhstan since 1996, when he was appointed as the Investment Adviser to a large investment fund focused on the country. It was through this role that Javier first became involved with the Group’s cement business. He is the Chairman of the Company’s operating subsidiaries, Central Asia Cement and Karcement. Javier has other business interests in Kazakhstan, including being a Director and large shareholder in the Chagala Group. Javier is also a Director of Steppe Cement Holding B.V. and Mechanical and Electrical Consulting Services Ltd.
Paul Rodzianko 67, is an international business executive with extensive experience in the energy, infrastructure and green technology sectors. He serves as Chairman or Independent Director of several emerging companies. He volunteers as Chairman of the Hermitage Museum Foundation. In addition, he serves on the boards of the US-Russia Business Council, the Kennan Council of the Woodrow Wilson International Center, the International Tax & Investment Center, the American-Russian Cultural Cooperation Foundation. He was previously director and vice-chairman of the US-Kazakhstan Business Association and member of the board of Energibolaget i Sverige (Sweden). He has served in senior executive capacities at Access Industries, Bogatyr Access Komir (Kazakhstan), the General Electric Company, Grace Geothermal Corporation, GreenFuel Technologies Corporation, CNPC-Aktobemunaigas (Kazakhstan), Sterling Grace & Co., Tyumen Oil Company (Russia), DataPort at the World Trade Center, and Mt. Hope Hydro. Paul holds a B.A. from Princeton University and an M.A. from the Institute of Critical Languages. He is a Fellow of The Explorers Club and the Royal Geographic Society.
MALCOLM BROWN NON-EXECUTIVE CHAIRMAN
JAVIER DEL SER PEREZ CHIEF EXECUTIVE OFFICER
Paul Rodzianko Non-Executive Director
Whilst at HSBC Mr Brown was also engaged to find acquisitions on the Indian sub-continent for Holcim (Switzerland), Cimpor (Portugal) and Votorantim (Brazil). He has also worked with Vicat and Ciments Francais on opportunities in Egypt. Mr Brown is currently the Managing Director of a small consultancy business, Carbery Cement Consultants, which provides strategic advice to mid cap, familycontrolled businesses in the cement industry.
Steppe Cement Ltd. 18
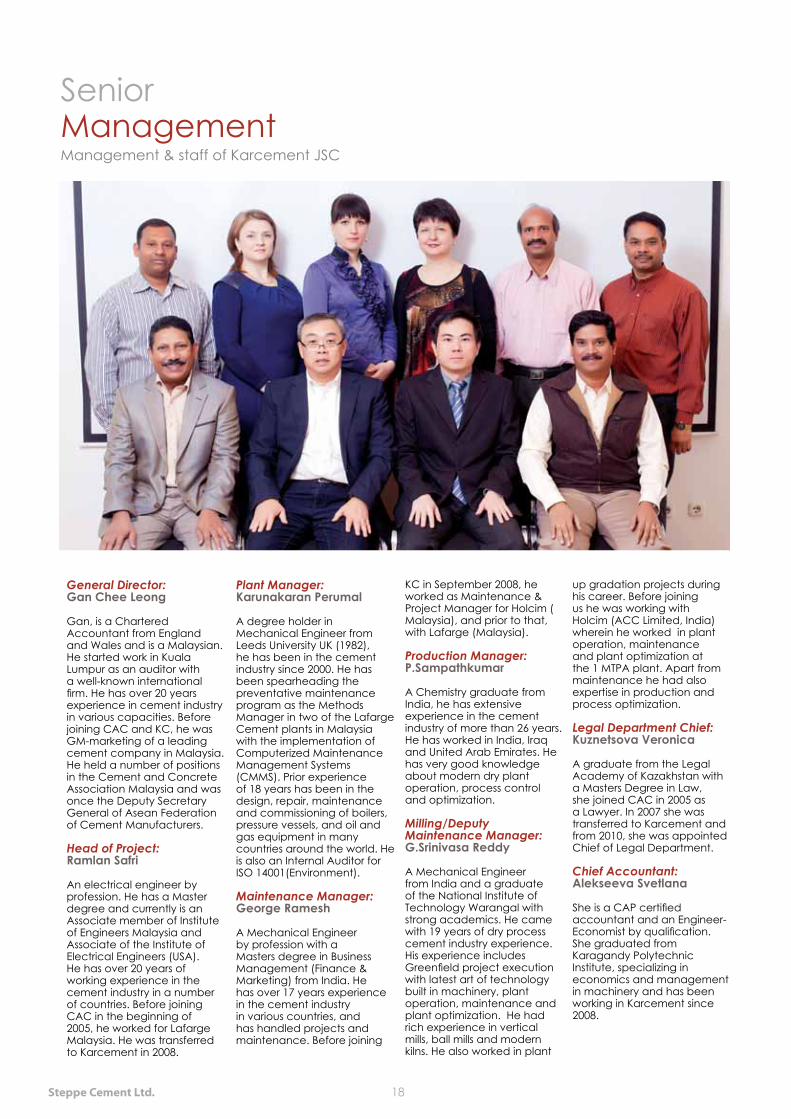
SeniorManagementManagement & staff of Karcement JSC
General Director: Gan Chee Leong
Gan, is a Chartered Accountant from England and Wales and is a Malaysian. He started work in Kuala Lumpur as an auditor with a well-known international firm. He has over 20 years experience in cement industry in various capacities. Before joining CAC and KC, he was GM-marketing of a leading cement company in Malaysia. He held a number of positions in the Cement and Concrete Association Malaysia and was once the Deputy Secretary General of Asean Federation of Cement Manufacturers.
Head of Project: Ramlan Safri
An electrical engineer by profession. He has a Master degree and currently is an Associate member of Institute of Engineers Malaysia and Associate of the Institute of Electrical Engineers (USA). He has over 20 years of working experience in the cement industry in a number of countries. Before joining CAC in the beginning of 2005, he worked for Lafarge Malaysia. He was transferred to Karcement in 2008.
Plant Manager: Karunakaran Perumal
A degree holder in Mechanical Engineer from Leeds University UK (1982), he has been in the cement industry since 2000. He has been spearheading the preventative maintenance program as the Methods Manager in two of the Lafarge Cement plants in Malaysia with the implementation of Computerized Maintenance Management Systems (CMMS). Prior experience of 18 years has been in the design, repair, maintenance and commissioning of boilers, pressure vessels, and oil and gas equipment in many countries around the world. He is also an Internal Auditor for ISO 14001(Environment).
Maintenance Manager: George Ramesh
A Mechanical Engineer by profession with a Masters degree in Business Management (Finance & Marketing) from India. He has over 17 years experience in the cement industry in various countries, and has handled projects and maintenance. Before joining
KC in September 2008, he worked as Maintenance & Project Manager for Holcim ( Malaysia), and prior to that, with Lafarge (Malaysia).
Production Manager: P.Sampathkumar
A Chemistry graduate from India, he has extensive experience in the cement industry of more than 26 years. He has worked in India, Iraq and United Arab Emirates. He has very good knowledge about modern dry plant operation, process control and optimization.
Milling/Deputy Maintenance Manager: G.Srinivasa Reddy
A Mechanical Engineer from India and a graduate of the National Institute of Technology Warangal with strong academics. He came with 19 years of dry process cement industry experience. His experience includes Greenfield project execution with latest art of technology built in machinery, plant operation, maintenance and plant optimization. He had rich experience in vertical mills, ball mills and modern kilns. He also worked in plant
up gradation projects during his career. Before joining us he was working with Holcim (ACC Limited, India) wherein he worked in plant operation, maintenance and plant optimization at the 1 MTPA plant. Apart from maintenance he had also expertise in production and process optimization.
Legal Department Chief: Kuznetsova Veronica
A graduate from the Legal Academy of Kazakhstan with a Masters Degree in Law, she joined CAC in 2005 as a Lawyer. In 2007 she was transferred to Karcement and from 2010, she was appointed Chief of Legal Department.
Chief Accountant: Alekseeva Svetlana
She is a CAP certified accountant and an Engineer-Economist by qualification. She graduated from Karagandy Polytechnic Institute, specializing in economics and management in machinery and has been working in Karcement since 2008.
Annual Report 201219
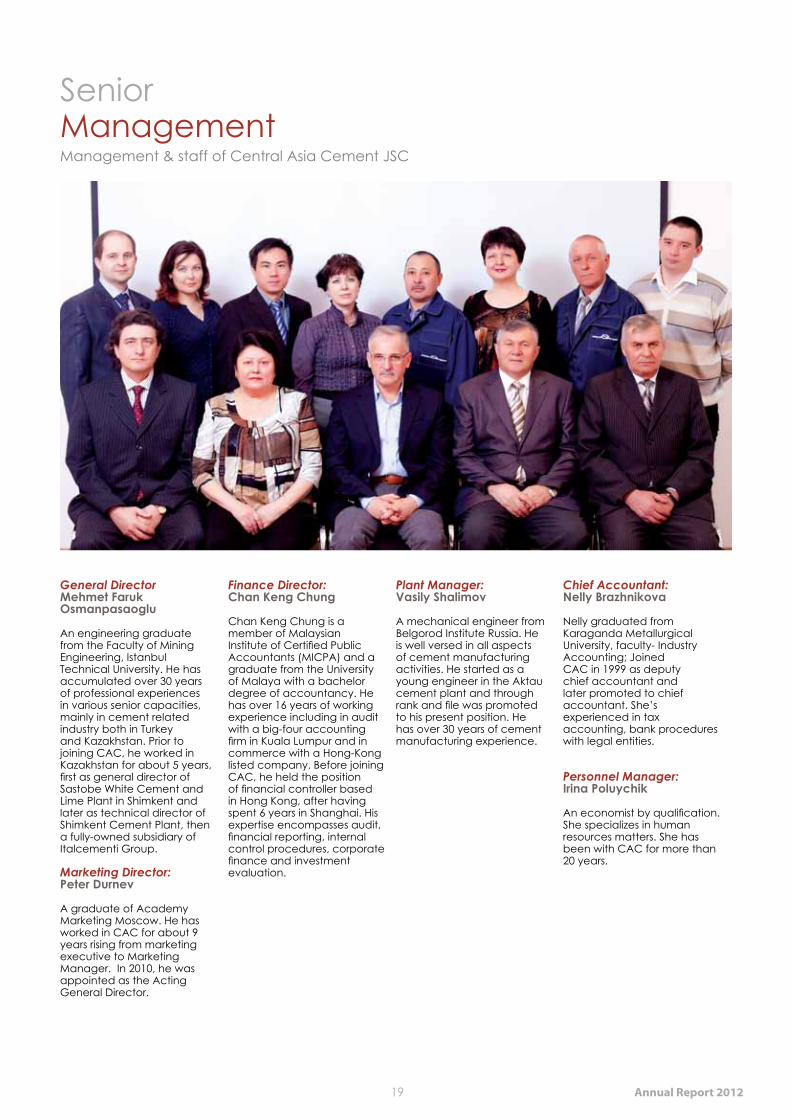
SeniorManagementManagement & staff of Central Asia Cement JSC
General DirectorMehmet Faruk Osmanpasaoglu
An engineering graduate from the Faculty of Mining Engineering, Istanbul Technical University. He has accumulated over 30 years of professional experiences in various senior capacities, mainly in cement related industry both in Turkey and Kazakhstan. Prior to joining CAC, he worked in Kazakhstan for about 5 years, first as general director of Sastobe White Cement and Lime Plant in Shimkent and later as technical director of Shimkent Cement Plant, then a fully-owned subsidiary of Italcementi Group. Marketing Director: Peter Durnev
A graduate of Academy Marketing Moscow. He has worked in CAC for about 9 years rising from marketing executive to Marketing Manager. In 2010, he was appointed as the Acting General Director.
Finance Director: Chan Keng Chung
Chan Keng Chung is a member of Malaysian Institute of Certified Public Accountants (MICPA) and a graduate from the University of Malaya with a bachelor degree of accountancy. He has over 16 years of working experience including in audit with a big-four accounting firm in Kuala Lumpur and in commerce with a Hong-Kong listed company. Before joining CAC, he held the position of financial controller based in Hong Kong, after having spent 6 years in Shanghai. His expertise encompasses audit, financial reporting, internal control procedures, corporate finance and investment evaluation.
Plant Manager: Vasily Shalimov
A mechanical engineer from Belgorod Institute Russia. He is well versed in all aspects of cement manufacturing activities. He started as a young engineer in the Aktau cement plant and through rank and file was promoted to his present position. He has over 30 years of cement manufacturing experience.
Chief Accountant: Nelly Brazhnikova
Nelly graduated from Karaganda Metallurgical University, faculty- Industry Accounting; Joined CAC in 1999 as deputy chief accountant and later promoted to chief accountant. She’s experienced in tax accounting, bank procedures with legal entities.
Personnel Manager: Irina Poluychik
An economist by qualification. She specializes in human resources matters. She has been with CAC for more than 20 years.
Steppe Cement Ltd. Annual Report 201220 21
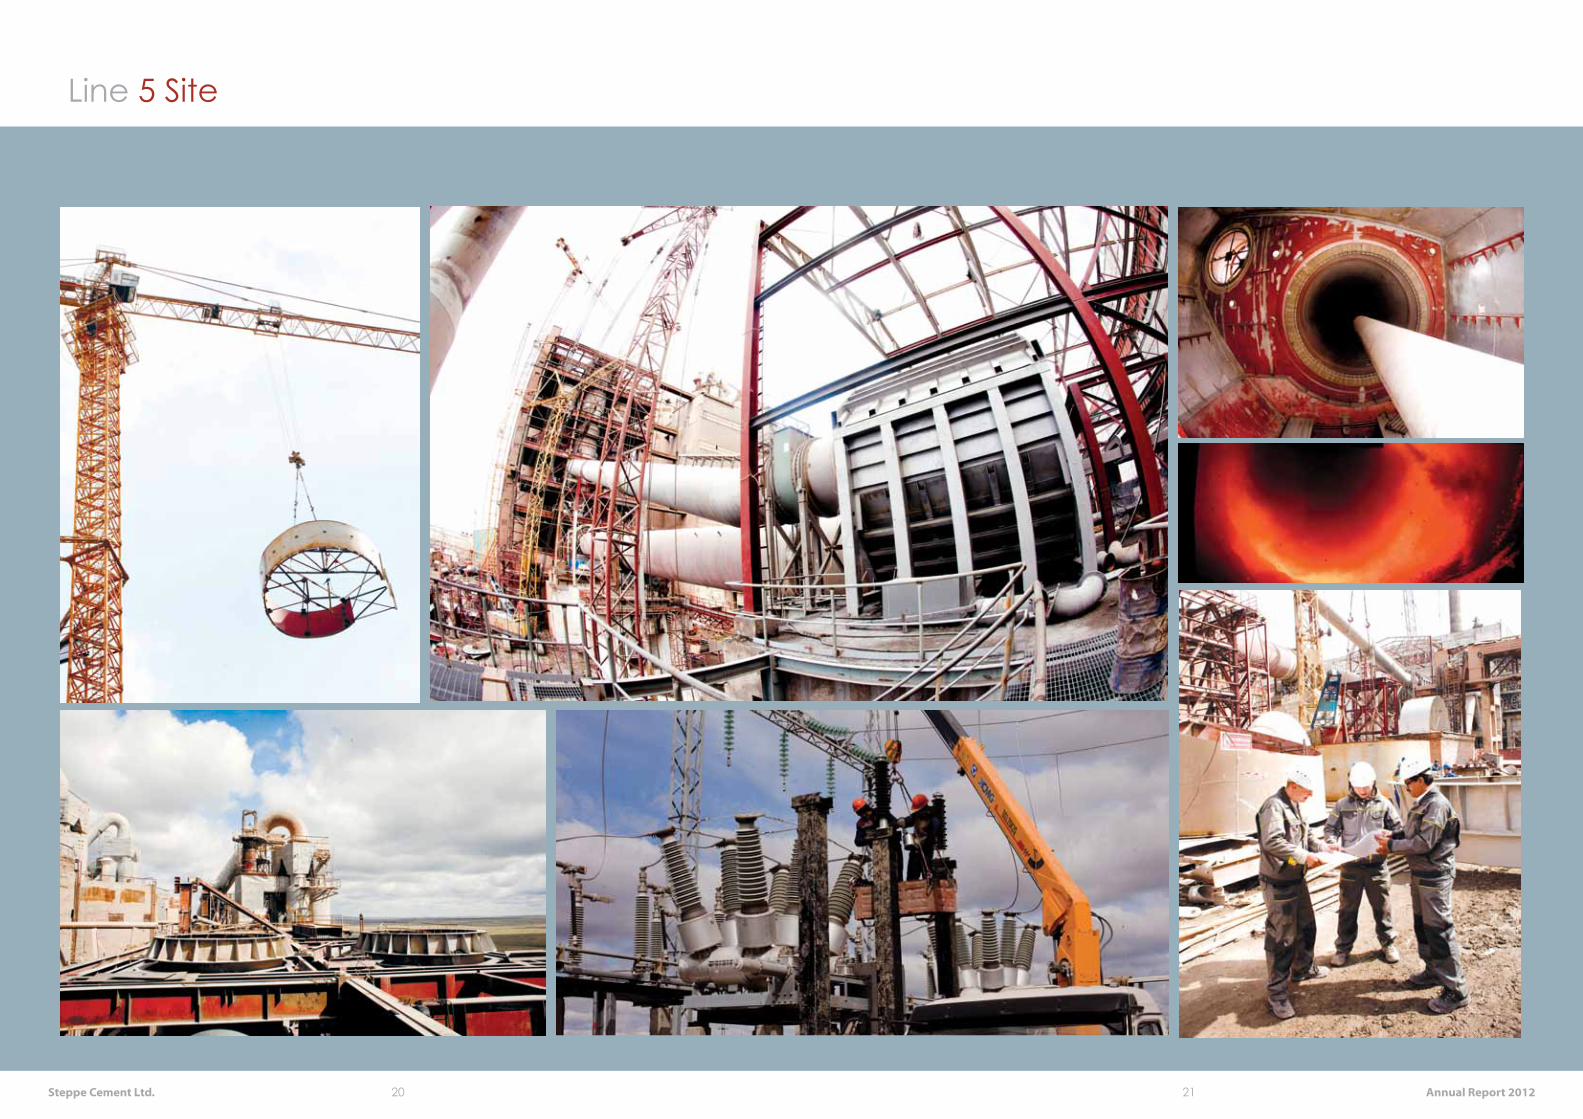
Line 5 Site
Steppe Cement Ltd. 22
Corporate Governance
CORPORATE GOVERNANCE STATEMENT
The Board of Directors (“Board”) is fully committed and strives to take the necessary measures to uphold the best principles and practices of corporate governance in the Group. Good corporate governance is fundamental to the Group’s discharge of its corporate responsibilities and accountability to protect and enhance the financial performance and shareholders’ value of the Group.
Steppe Cement is not required to comply with the UK Combined Code of Corporate Governance (“Combined Code”) published by the UK Financial Reporting Council. The Combined Code applies to companies listed on the Main Board but not AIM companies.
The Quoted Companies Alliance (“QCA”) has published a set of corporate governance guidelines for AIM companies as a minimum standard to follow. The QCA guidelines are less rigorous than the Combined Code and recommendations include the following:
• Separation of Chairman and CEO roles –both roles should not be performed by the same individual;
• Independent non-executive directors – at least two independent non-executive directors, one of whom may be the Chairman.
• Establishment of Audit, Remuneration and Nomination Committees and that Audit and Remuneration Committees should comprise at least two independent non-executive directors.
• Re-election of directors – All directors should be submitted to re-election at regular intervals subject to continued satisfactory performance of the directors.
• Dialogue with shareholders – there should be a dialogue with shareholders based on mutual understanding of objectives.
• Matters reserved for the Board – there be a formal schedule of matters specifically reserved for the Board’s decision;
• Timely information – the Board should be supplied with timely information to discharge its duties;
• Review of internal controls annually. The review should encompass all material controls including financial, operational and compliance controls and risk management systems.
Steppe Cement complies with the QCA guidelines. Nonetheless, Steppe Cement adopts the principal requirements of the Combined Code, as far as practicable, to ensure high standards of corporate governance.
BOARD OF DIRECTORS
• The Board’s primary objective is to protect and enhance long-term shareholders’ value. The Board is responsible for:
• formulating the Group’s strategic direction and major policies;
• review performance of the Group and monitor the achievement of management’s goals;
• approval of the Group’s financial statements, annual report and announcements;
• approval of Group’s operational and capital budgets; • approval of major contracts, capital expenditure,
acquisitions and disposals; • setting the remuneration, appointing, removing and
creating succession policies for directors and senior executives,
• the effectiveness and integrity of the Group’s internal control and management information systems; and
• overall corporate governance of the Group.
BOARD PROCESSES
The Board has established a framework for the management of the Group including a system of internal control, risk management practices and the establishment of appropriate ethical standards. The Board holds regular meetings to discuss strategy, operational matters and any extraordinary meetings at such other times as may be necessary to address any specific and significant matters that may arise. The Board has determined that individual directors have the right qualification and experience to perform their duties and responsibilities as directors.
Board Meetings
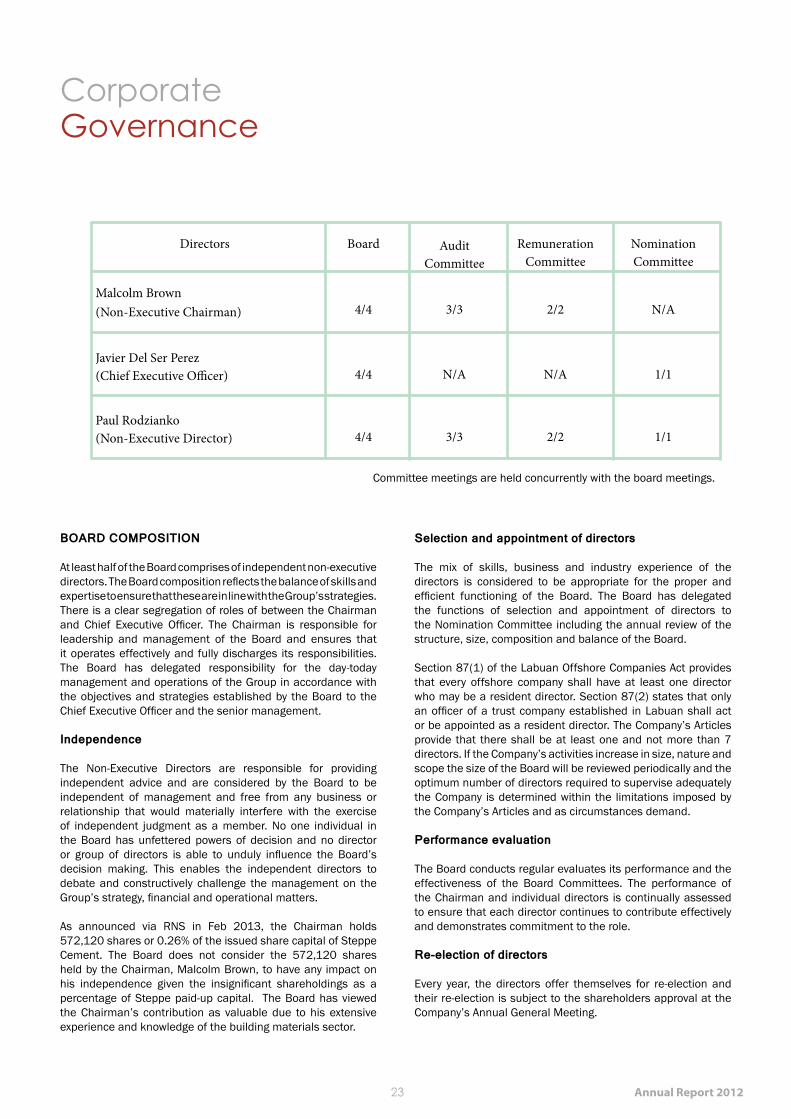
During the year ended 31 December 2012, 4 board meetings were held. The following is the attendance record of the directors:
Annual Report 201223
Corporate Governance
Directors Board Audit Committee
Remuneration Committee
NominationCommittee
Malcolm Brown(Non-Executive Chairman) 4/4 3/3 2/2 N/A
Javier Del Ser Perez(Chief Executive Officer) 4/4 N/A N/A 1/1
Paul Rodzianko(Non-Executive Director) 4/4 3/3 2/2 1/1
BOARD COMPOSITION
At least half of the Board comprises of independent non-executive directors. The Board composition reflects the balance of skills and expertise to ensure that these are in line with the Group’s strategies. There is a clear segregation of roles of between the Chairman and Chief Executive Officer. The Chairman is responsible for leadership and management of the Board and ensures that it operates effectively and fully discharges its responsibilities. The Board has delegated responsibility for the day-today management and operations of the Group in accordance with the objectives and strategies established by the Board to the Chief Executive Officer and the senior management.
Independence
The Non-Executive Directors are responsible for providing independent advice and are considered by the Board to be independent of management and free from any business or relationship that would materially interfere with the exercise of independent judgment as a member. No one individual in the Board has unfettered powers of decision and no director or group of directors is able to unduly influence the Board’s decision making. This enables the independent directors to debate and constructively challenge the management on the Group’s strategy, financial and operational matters.
As announced via RNS in Feb 2013, the Chairman holds 572,120 shares or 0.26% of the issued share capital of Steppe Cement. The Board does not consider the 572,120 shares held by the Chairman, Malcolm Brown, to have any impact on his independence given the insignificant shareholdings as a percentage of Steppe paid-up capital. The Board has viewed the Chairman’s contribution as valuable due to his extensive experience and knowledge of the building materials sector.
Selection and appointment of directors
The mix of skills, business and industry experience of the directors is considered to be appropriate for the proper and efficient functioning of the Board. The Board has delegated the functions of selection and appointment of directors to the Nomination Committee including the annual review of the structure, size, composition and balance of the Board.
Section 87(1) of the Labuan Offshore Companies Act provides that every offshore company shall have at least one director who may be a resident director. Section 87(2) states that only an officer of a trust company established in Labuan shall act or be appointed as a resident director. The Company’s Articles provide that there shall be at least one and not more than 7 directors. If the Company’s activities increase in size, nature and scope the size of the Board will be reviewed periodically and the optimum number of directors required to supervise adequately the Company is determined within the limitations imposed by the Company’s Articles and as circumstances demand.
Performance evaluation
The Board conducts regular evaluates its performance and the effectiveness of the Board Committees. The performance of the Chairman and individual directors is continually assessed to ensure that each director continues to contribute effectively and demonstrates commitment to the role.
Re-election of directors
Every year, the directors offer themselves for re-election and their re-election is subject to the shareholders approval at the Company’s Annual General Meeting.
Committee meetings are held concurrently with the board meetings.
Steppe Cement Ltd. 24
Corporate Governance
Remuneration policy
Remuneration levels are competitively set to attract and retain appropriately qualified and experienced directors and senior executives. The Board has delegated the setting of broad remuneration policy to the Remuneration Committee. The purpose of the policy is to ensure the remuneration package properly reflects the person’s duties and responsibilities and level of performance, and that remuneration is competitive in attracting, retaining and motivating people of the highest quality. Where necessary, independent advice on the appropriateness of remuneration packages is obtained.
Independence advice and insurance
The Board may seek independent consultant’s advice at the Company’s expense in relation to director’s rights and duties and the engagement is subject to prior approval of the Chairman and this will not be withheld unreasonably. The company maintains a Directors’ and Officers’ Liability Insurance policy that provides appropriate cover in respect of legal action brought against its directors.
BOARD COMMITTEES
The Board has established the Nomination Committee, the Remuneration Committee and the Audit Committee and delegated certain functions to these committees as set out in each Committee’s Terms of Reference.
Nomination Committee
The Committee comprises of majority independent Non-Executive Directors. The Terms of Reference of the Nomination Committee was approved by the Board. The Nomination Committee meets at least once a year.
The Nomination Committee’s members comprises of:
1. Paul Rodzianko (Chairman)
2. Javier Del Ser Perez
The principal objectives of the Committee are to review that the Board structure, size, composition and the mix of skills and expertise to ensure that these are in line with
the Group’s strategies and to recommend to the Board the potential candidates for directorship. The selection criteria for selection and recruitment of the potential candidates for directorship shall include qualifications of the individual, experience, knowledge and achievements, credibility and background and ability of the candidates to contribute effectively to the Board and Group.
The functions of the Nomination Committee include:
• Review annually the structure, size and composition of the Board taking into account the Group’s strategies;
• Identify and nominate the potential candidates to the Board for approval;
• Monitor the appointment process of directors; • Recommend to the Board for approval on the re-
appointment of directors; • Oversee the succession planning of directors taking into
consideration of the Group’s strategies; • Report and make recommendations to the Board on the
Committee’s activities; and • Review and update the Terms of Reference at least once
a year.
Remuneration Committee
The Remuneration Committee comprises entirely of independent Non-Executive Directors. The functions of the Remuneration Committee are governed by the Terms of Reference which was approved by the Board. The Remuneration Committee meets at least twice (2) a year.
The principal objectives of the Committee are to ensure that the broad remuneration policy and practices of the Group reflect the level of responsibilities, performance, relevant legal requirements and high standards of governance. In determining such policy, the Committee shall ensure that remuneration levels are appropriately and competitively set to attract, retain and motivate people of the highest quality.
The functions of the Remuneration Committee include:
Determine and review the broad remuneration policy of the Chairman, Chief Executive Officer, Executive Directors and Senior Executives;
Annual Report 201225
Corporate Governance
Review the contracts for the Chairman, Chief Executive Officer, Executive Directors and the contractual terms;
Obtain information on the remuneration of other listed companies of similar size and industry;
Report and make recommendations to the Board on the Committee’s activities; and
Review and update the Terms of Reference every two (2) years, or more frequently as required to ensure its ongoing relevance and effectiveness.
The Remuneration Committee’s members comprises of:
1. Malcolm Brown (Chairman)
2. Paul Rodzianko
Audit Committee
The Audit Committee comprises entirely of independent Non-Executive Directors. The functions of the Audit Committee are governed by the Terms of Reference which was approved by the Board. The Audit Committee meets at least three times (3) a year.
The principal objectives of the Committee are to monitor and review the adequacy, integrity and compliance of the Group’s
financial reporting and policies, internal controls system and procedures including risk management, and compliance and the external audit process. The Committee shall make the necessary recommendations to the Board to achieve its objectives.
The functions of the Audit Committee include:
• Review the Group’s financial statements, regulatory announcements relating to the Group’s results;
• Review the Group’s significant accounting policies and practices;
• Review compliance with international financial reporting standards, regulatory and other legal requirements;
• Review and advise the Board on the appointment, nomination and re-appointment of the external auditors;
• Oversee the relationship with the external auditors, including the engagement of auditors, the audit scope, plan, remuneration and objectivity;
• Evaluate and monitor the adequacy and effectiveness of the internal controls system and procedures including risk management and compliance;
• Monitor and review the performance and effectiveness of the internal audit function;
• Report and make recommendations to the Board on the Committee’s activities; and
• Review and update the Terms of Reference at least once a year and recommend any changes to the Board for approval.
Steppe Cement Ltd. Annual Report 201226 27
Corporate Governance
Corporate Governance
The Audit Committee’s members comprises of:
1. Paul Rodzianko (Chairman)
2. Malcolm Brown
BUSINESS CONDUCT AND ETHICS
In the course of business, the Board acknowledges the need to maintain high standards of business and ethical conduct by all Directors, management and employees of the Group. In this respect, the Group has the responsibility to observe local laws, customs and culture of each country in which it operates in particular Kazakhstan and to adopt the high standards of business practice, procedure and integrity. All Directors and employees are expected to act with the utmost integrity and objectivity, striving at all times to enhance the reputation and performance of the Group.
Conflict of interest
All Directors must keep the Board advised, on an ongoing basis, of any interest that could potentially conflict with those of the Group. Where the Board believes that a significant conflict exists for a director on a board matter, the director concerned does not receive the relevant board papers and is not present at the meeting whilst the item is considered. Directors are required to take into consideration any potential conflicts of interest when accepting appointments to other Boards.
INVESTOR RELATIONS
The Board recognises and values the importance of managing its relationship with the investing community. The Board is committed and communicates regularly with shareholders on the Group’s strategy, financial performance, developments and prospects via issuance of annual and interim financial statements to shareholders, stock exchange announcements and in meetings.
The Group’s management meets regularly with fund managers, analysts and shareholders to convey information about the development of the Group’s performance and operations in Kazakhstan.
Annual General Meeting
The Annual General Meeting (“AGM”) provides the main forum and opportunity for discussion and interaction between the Board and the shareholders. The Board encourages the active participation of shareholders, both individuals and institutional at the AGM on important and relevant matters. The results of the AGM are announced via Regulatory News Service to the public after the AGM.
INTERNAL CONTROL
The Board places importance on the maintenance of a strong internal control system in the Group, including compliance and risk management practices to ensure good corporate governance. The Board regularly evaluates and monitors the effectiveness of the internal control system.
Purpose
The Group’s internal control system is designed to safeguard the Group’s assets and enhance the shareholders investments.
The Group’s internal control system is designed to manage rather than fully eliminate the risk of failure to achieve business objectives. Therefore, that the internal control system can only provide reasonable but not absolute assurance against material misstatement or loss.
Key elements
The key elements of the Group’s internal control system are:
Control - an organisational structure is in place with clearly defined levels of responsibility and authority together with appropriate reporting procedures, particularly with respect to financial information and capital expenditure.
Financial Reporting and Budgeting – A financial reporting and budgeting system with an annual budget approved by the directors has been established to monitor the performance of the subsidiaries. The management evaluates the actual against budget to identify and explain the causes of the significant variances for appropriate action. The budgets are revised regularly taking into internal and external variables such as
performance, costs, capital expenditure requirements, macro outlook and other relevant factors.
Risk Management and Compliance – Risk management and compliance policies, controls and practices are in place for the Group to identify, assess, manage and monitor key business risks and exposure and for evaluation of their financial impact and other implications.
Monitoring and review mechanism
The Audit Committee is tasked to monitor and review the adequacy and effectiveness of the internal control system and procedures including risk management and compliance. The Group’s internal audit function is responsible for conducting internal audits based on the risk-based audit plan approved annually by the Audit Committee. The internal audit function provides regular reports to the Audit Committee highlighting the observations, recommendations and management action to improve the internal control system. The scope of work, authority and resources of the internal audit function are reviewed by the Audit Committee at annually. The Audit Committee also deliberates on control issues highlighted by the external auditors during the course of statutory audits.
Steppe Cement Ltd. 28
FINANCIAL STATEMENTSFOR THE YEAR ENDED 31 DECEMBER 2012
(In United States Dollar)
Annual Report 201229
STEPPE CEMENT LTD(Incorporated in Labuan FT, Malaysia under the Labuan Companies Act, 1990)AND ITS SUBSIDIARY COMPANIES
FINANCIAL STATEMENTS
CONTENTS PAGE(S)
Independent auditors’ report 30 - 31
Income statements 32
Statements of comprehensive income 33
Statements of financial position 34 - 35
Statements of changes in equity 36 - 38
Statements of cash flows 39 - 41
Notes to the financial statements 42 - 87
Statement by director 88
Steppe Cement Ltd. 30
Report on the Financial Statements
We have audited the financial statements of STEPPE CEMENT LTD, which comprise the statements of financial position of the Group and of the Company as of 31 December 2012, and the income statements, statements of comprehensive income, statements of changes in equity and cash flow statements of the Group and of the Company for the year then ended, and a summary of significant accounting policies and other explanatory information, as set out on pages 32 to 87.
Directors’ Responsibility for the Financial Statements
The directors of the Company are responsible for the preparation of financial statements that give a true and fair view in accordance with International Financial Reporting Standards and the Labuan Companies Act, 1990 in Malaysia and for such internal control as the directors determine is necessary to enable the preparation of financial statements that are free from material misstatement, whether due to fraud or error.
Auditors’ Responsibility
Our responsibility is to express an opinion on these financial statements based on our audit. We conducted our audit in accordance with approved standards on auditing in Malaysia. Those standards require that we comply with ethical requirements and plan and perform the audit to obtain reasonable assurance whether the financial statements are free from material misstatement.
An audit involves performing procedures to obtain audit evidence about the amounts and disclosures in the financial statements. The procedures selected depend on the auditors’ judgement, including the assessment of the risks of material misstatement of the financial statements, whether due to fraud or error. In making those risk assessments, the auditors consider internal control relevant to the entity’s preparation of financial statements that give a true and fair view in order to design audit procedures that are appropriate in the circumstances, but not for the purpose of expressing an opinion on the effectiveness of the entity’s internal control. An audit also includes evaluating the appropriateness of accounting policies used and the reasonableness of accounting estimates made by the directors, as well as evaluating the overall presentation of the financial statements.
We believe that the audit evidence that we have obtained is sufficient and appropriate to provide a basis for our qualified audit opinion.
Basis for Qualified Opinion
Revaluation of land and buildingsAs disclosed in Note 9 to the financial statements, the carrying amount of the land and buildings, which are measured at fair value less accumulated depreciation and impairment losses recognized at the date of revaluation, amounted to USD4,799,143 as at 31 December 2012. The fair values of the land and buildings were determined based on an independent appraisal performed on 27 August 2010 and they have not been revalued since then. According to International Accounting Standard 16, “Property, Plant and Equipment”, for property, plant and equipment that is accounted for under revaluation model, revaluations shall be made with sufficient regularity to ensure that the carrying amount does not differ materially from that which would be determined using fair value at the end of the reporting period. The directors are of the opinion that the carrying amounts of the land and buildings since the date of revaluation until 31 December 2012 do not differ significantly from their fair values. However, we were unable to obtain sufficient appropriate audit evidence relating to the fair values of the land and buildings as of 1 January 2012 and 31 December 2012. Consequently, we were unable to determine whether any adjustments were necessary in respect of the carrying amounts of the land and buildings and the revaluation reserve of the Group as of 31 December 2012 and the elements making up the income statement and the statement of changes in equity of the Group for the year then ended.
Independent Auditors’ReportREPORT TO THE MEMBERS OF STEPPE CEMENT LTD(Incorporated in Labuan FT, Malaysia under the Labuan Companies Act, 1990)
Annual Report 201231
Classification of bank loanAs disclosed in Note 19 to the financial statements, borrowings as at 31 December 2012 included non-current bank loans of USD31,178,377. Certain covenants in the bank loan agreement relating to a non-current loan of USD23,998,287 had been breached as of 31 December 2012 and the Group does not have an unconditional right to defer its settlement for at least twelve months after that date. Under such circumstance, the non-current loan should be classified as a current liability as required by International Accounting Standard 1, “Presentation of Financial Statements”. Had the non-current bank loan been classified as a borrowing under current liabilities as at 31 December 2012, the total current liabilities of the Group would have been adjusted from USD30,021,426 to USD54,019,713 and its net current assets of USD19,953,000 would have been adjusted to net current liabilities of USD4,045,287 as explained in Note 2 to the financial statements.
Qualified Opinion
In our opinion, except for the possible effects of the matters discussed in the basis for qualified opinion paragraphs, the financial statements give a true and fair view of the state of affairs of the Group and of the Company as of 31 December 2012 and of the financial performance and the cash flows for the year then ended in accordance with International Financial Reporting Standards and the Labuan Companies Act, 1990 in Malaysia. Other matters
This report is made solely to the members of the Company, as a body, in accordance with Section 117 of the Labuan Companies Act, 1990 in Malaysia and for no other purpose. We do not assume responsibility towards any other person for the contents of this report.
DELOITTE & TOUCHEAAL 0011Chartered Accountants
HIEW KIM TIAMPartner - 1717/08/13 (J)Chartered Accountant
Steppe Cement Ltd. 32
The Group The Company
Note 2012 2011 2012 2011
USD USD USD USD
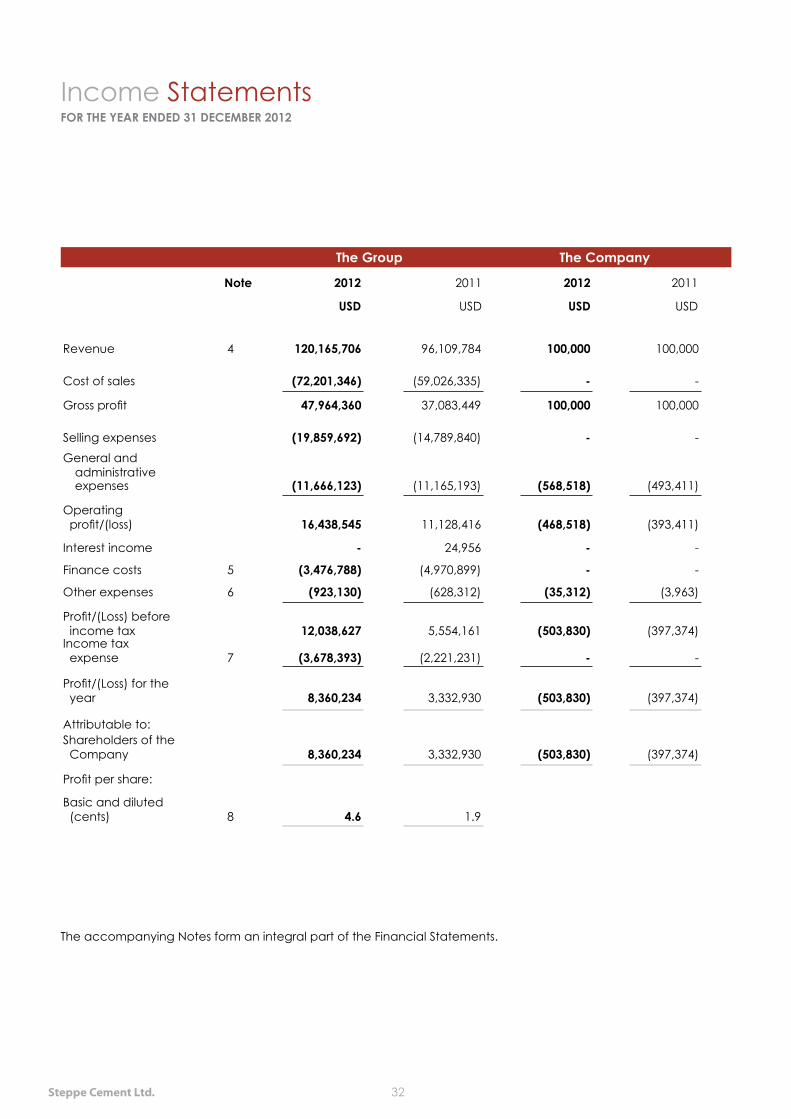
Revenue 4 120,165,706 96,109,784 100,000 100,000
Cost of sales (72,201,346) (59,026,335) - -
Gross profit 47,964,360 37,083,449 100,000 100,000
Selling expenses (19,859,692) (14,789,840) - -General and
administrativeexpenses (11,666,123) (11,165,193) (568,518) (493,411)
Operating profit/(loss) 16,438,545 11,128,416 (468,518) (393,411)
Interest income - 24,956 - -
Finance costs 5 (3,476,788) (4,970,899) - -
Other expenses 6 (923,130) (628,312) (35,312) (3,963)
Profit/(Loss) before income tax 12,038,627 5,554,161 (503,830) (397,374)Income tax expense 7 (3,678,393) (2,221,231) - -
Profit/(Loss) for the year 8,360,234 3,332,930 (503,830) (397,374)
Attributable to:Shareholders of the Company 8,360,234 3,332,930 (503,830) (397,374)
Profit per share:
Basic and diluted (cents) 8 4.6 1.9
The accompanying Notes form an integral part of the Financial Statements.
Income StatementsFOR THE YEAR ENDED 31 DECEMBER 2012
Annual Report 201233
The Group The Company
Note 2012 2011 2012 2011
USD USD USD USD
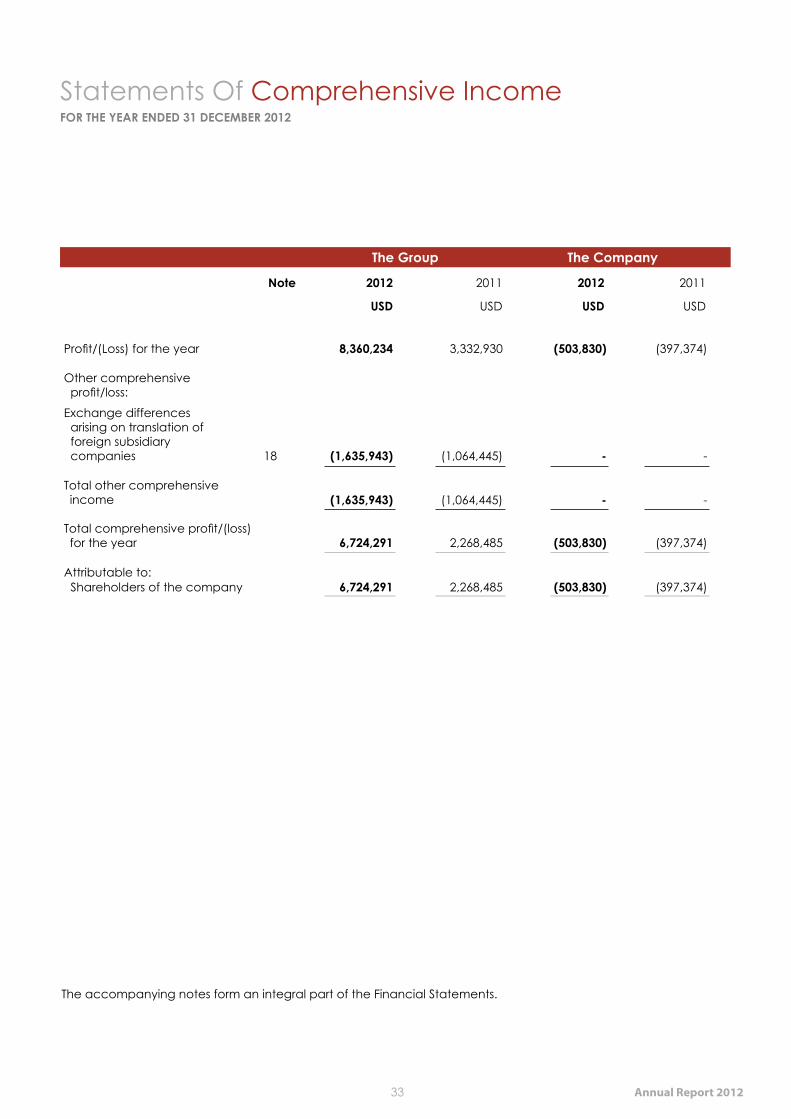
Profit/(Loss) for the year 8,360,234 3,332,930 (503,830) (397,374)
Other comprehensive profit/loss:
Exchange differences arising on translation of foreign subsidiary companies 18 (1,635,943) (1,064,445) - -
Total other comprehensive income (1,635,943) (1,064,445) - -
Total comprehensive profit/(loss) for the year 6,724,291 2,268,485 (503,830) (397,374)
Attributable to: Shareholders of the company 6,724,291 2,268,485 (503,830) (397,374)
The accompanying notes form an integral part of the Financial Statements.
Statements Of Comprehensive IncomeFOR THE YEAR ENDED 31 DECEMBER 2012
Steppe Cement Ltd. 34
The Group The Company
Note 2012 2011 2012 2011
USD USD USD USD
Assets
Non-Current Assets
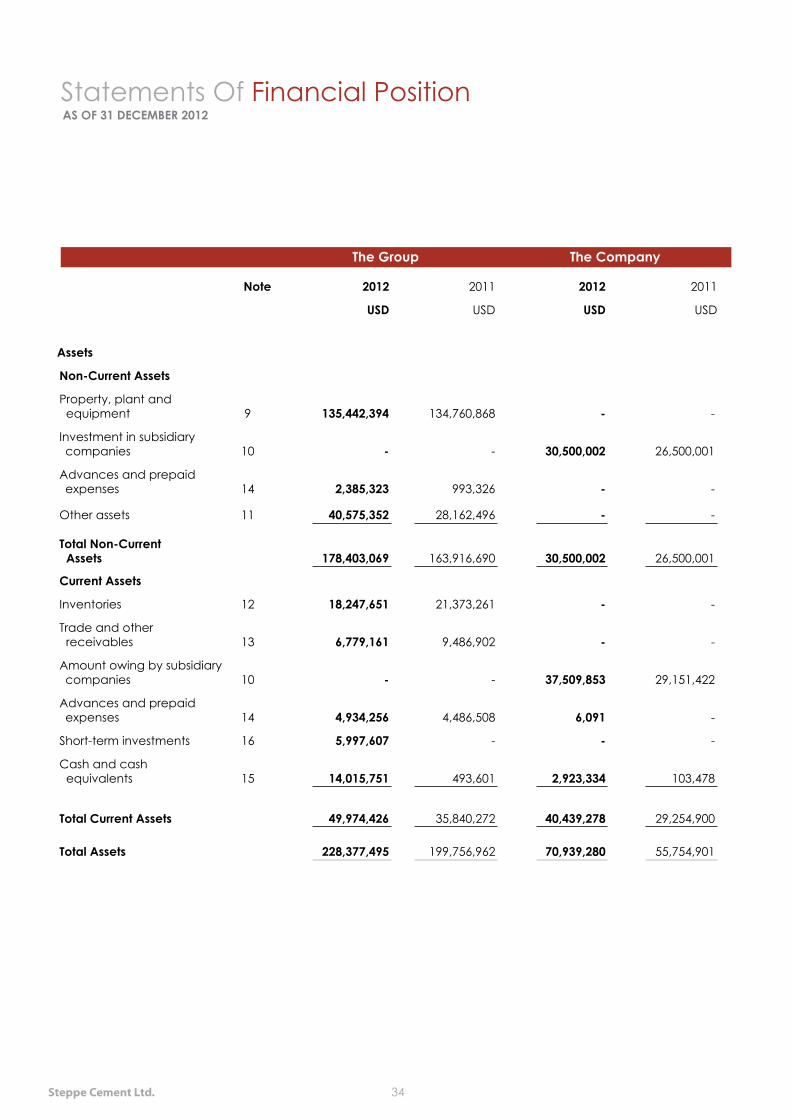
Property, plant and equipment 9 135,442,394 134,760,868 - -
Investment in subsidiary companies 10 - - 30,500,002 26,500,001
Advances and prepaid expenses 14 2,385,323 993,326 - -
Other assets 11 40,575,352 28,162,496 - -
Total Non-Current Assets 178,403,069 163,916,690 30,500,002 26,500,001
Current Assets
Inventories 12 18,247,651 21,373,261 - -
Trade and other receivables 13 6,779,161 9,486,902 - -
Amount owing by subsidiary companies 10 - - 37,509,853 29,151,422
Advances and prepaid expenses 14 4,934,256 4,486,508 6,091 -
Short-term investments 16 5,997,607 - - -
Cash and cash equivalents 15 14,015,751 493,601 2,923,334 103,478
Total Current Assets 49,974,426 35,840,272 40,439,278 29,254,900
Total Assets 228,377,495 199,756,962 70,939,280 55,754,901
Statements Of Financial PositionAS OF 31 DECEMBER 2012

Annual Report 201235
The Group The Company
Note 2012 2011 2012 2011
USD USD USD USD
Equity and LiabilitiesCapital and Reserves
Share capital 17 73,760,924 58,298,542 73,760,924 58,298,542
Revaluation reserve 18 8,033,718 9,477,390 - -
Translation reserve 18 (21,644,809) (20,008,866) - -
Retained earnings/ (Accumulated loss)
89,024,541 79,220,635 (3,940,050) (3,436,220)
Total Equity 149,174,374 126,987,701 69,820,874 54,862,322
Non-Current Liabilities
Borrowings 19 40,663,029 43,212,391 - -
Deferred tax liabilities 20 8,518,666 6,176,157 - -
Total Non-Current Liabilities 49,181,695 49,388,548 - -
Current Liabilities
Trade and other payables 21 8,025,685 7,840,918 - -
Accrued and other liabilities 22 7,079,815 3,660,604 1,118,406 892,579
Borrowings 19 14,527,492 11,434,750 - -
Taxes payable 23 388,434 444,441 - -
Total Current Liabilities 30,021,426 23,380,713 1,118,406 892,579
Total Liabilities 79,203,121 72,769,261 1,118,406 892,579
Total Equity and Liabilities 228,377,495 199,756,962 70,939,280 55,754,901
The accompanying Notes form an integral part of the Financial Statements.
Statements Of Financial PositionAS OF 31 DECEMBER 2012
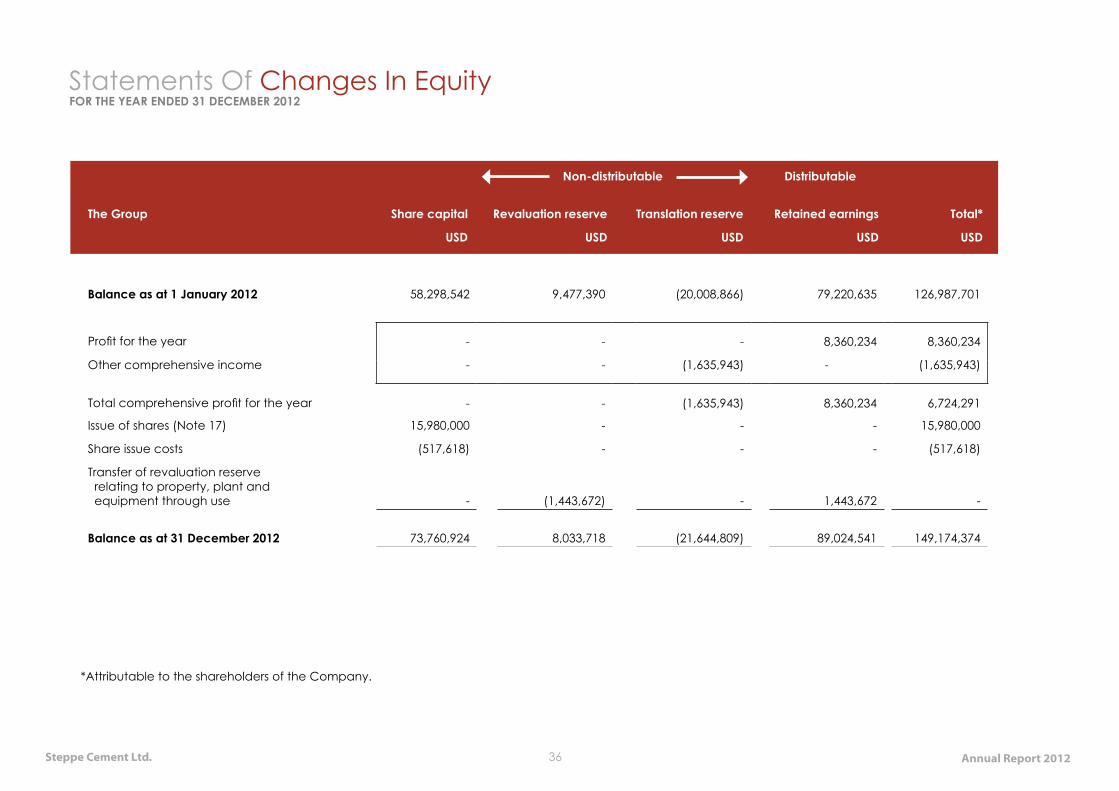
Steppe Cement Ltd. 36 Annual Report 2012
Non-distributable Distributable
The Group Share capital Revaluation reserve Translation reserve Retained earnings Total*
USD USD USD USD USD
Balance as at 1 January 2012 58,298,542 9,477,390 (20,008,866) 79,220,635 126,987,701
Profit for the year - - - 8,360,234 8,360,234
Other comprehensive income - - (1,635,943) - (1,635,943)
Total comprehensive profit for the year - - (1,635,943) 8,360,234 6,724,291
Issue of shares (Note 17) 15,980,000 - - - 15,980,000
Share issue costs (517,618) - - - (517,618)
Transfer of revaluation reserve relating to property, plant and equipment through use - (1,443,672) - 1,443,672 -
Balance as at 31 December 2012 73,760,924 8,033,718 (21,644,809) 89,024,541 149,174,374
*Attributable to the shareholders of the Company.
Statements Of Changes In EquityFOR THE YEAR ENDED 31 DECEMBER 2012
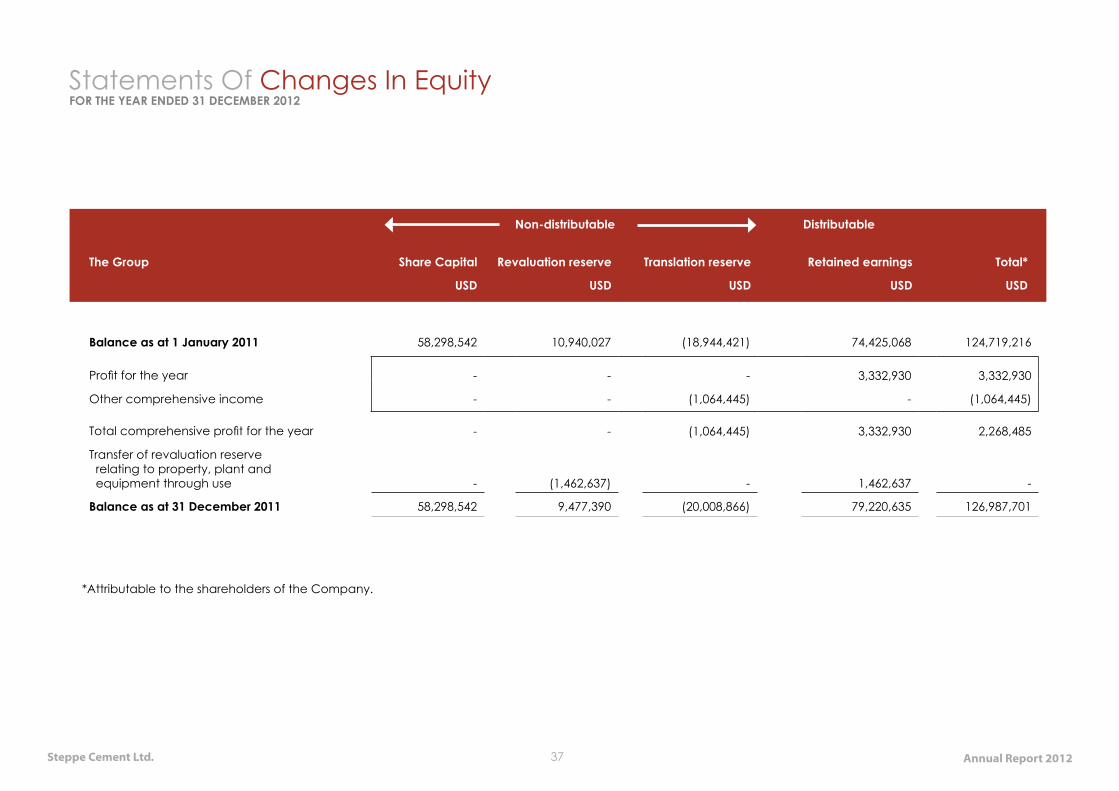
Steppe Cement Ltd. 37 Annual Report 2012
Non-distributable Distributable
The Group
Share Capital Revaluation reserve Translation reserve Retained earnings Total*
USD USD USD USD USD
Balance as at 1 January 2011 58,298,542 10,940,027 (18,944,421) 74,425,068 124,719,216
Profit for the year - - - 3,332,930 3,332,930
Other comprehensive income - - (1,064,445) - (1,064,445)
Total comprehensive profit for the year - - (1,064,445) 3,332,930 2,268,485
Transfer of revaluation reserve relating to property, plant and equipment through use - (1,462,637) - 1,462,637 -
Balance as at 31 December 2011 58,298,542 9,477,390 (20,008,866) 79,220,635 126,987,701
*Attributable to the shareholders of the Company.
Statements Of Changes In EquityFOR THE YEAR ENDED 31 DECEMBER 2012
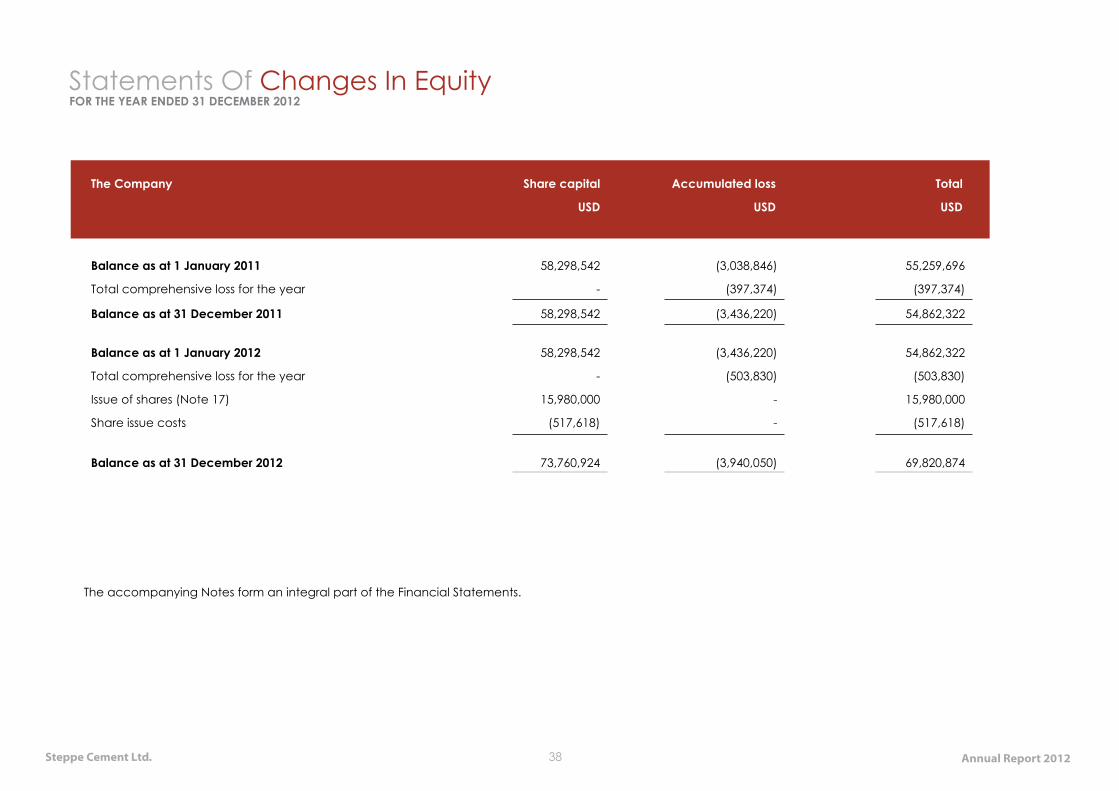
Steppe Cement Ltd. 38 Annual Report 2012
The Company Share capital Accumulated loss Total
USD USD USD
Balance as at 1 January 2011 58,298,542 (3,038,846) 55,259,696
Total comprehensive loss for the year - (397,374) (397,374)
Balance as at 31 December 2011 58,298,542 (3,436,220) 54,862,322
Balance as at 1 January 2012 58,298,542 (3,436,220) 54,862,322
Total comprehensive loss for the year - (503,830) (503,830)
Issue of shares (Note 17) 15,980,000 - 15,980,000
Share issue costs (517,618) - (517,618)
Balance as at 31 December 2012 73,760,924 (3,940,050) 69,820,874
The accompanying Notes form an integral part of the Financial Statements.
FOR THE YEAR ENDED 31 DECEMBER 2012 Statements Of Changes In Equity
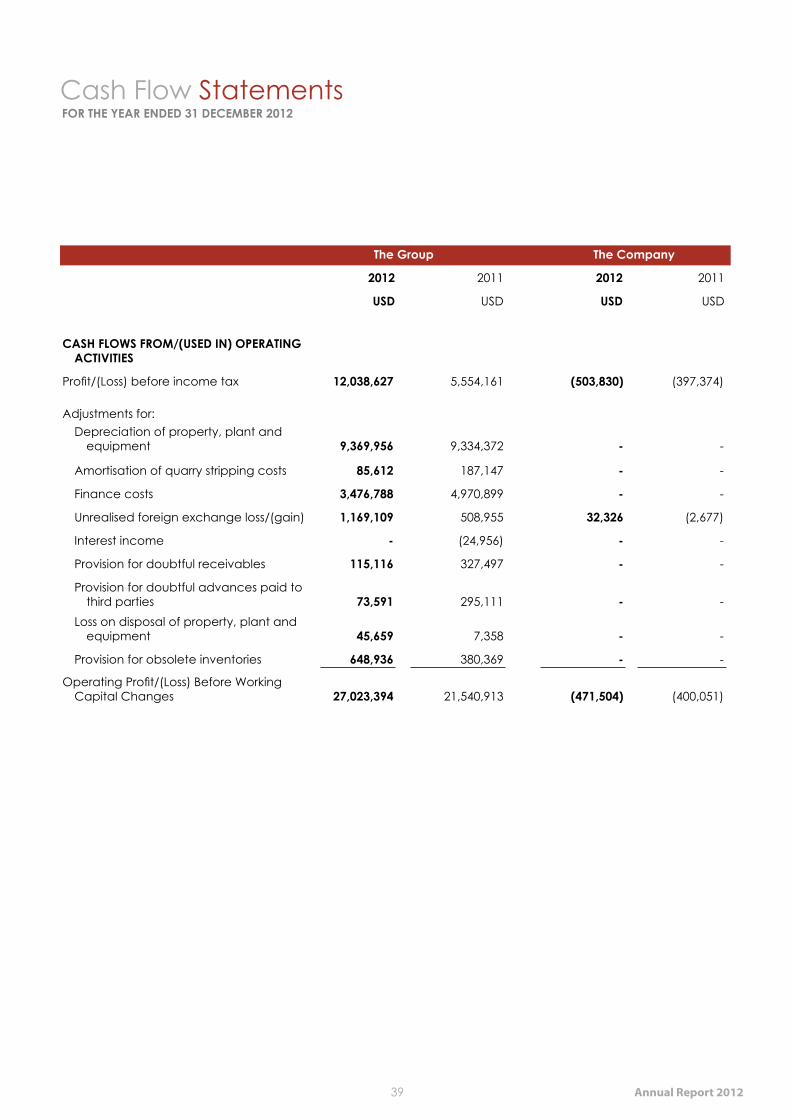
Annual Report 201239
The Group The Company
2012 2011 2012 2011
USD USD USD USD
CASH FLOWS FROM/(USED IN) OPERATING ACTIVITIES
Profit/(Loss) before income tax 12,038,627 5,554,161 (503,830) (397,374)
Adjustments for: Depreciation of property, plant and
equipment 9,369,956 9,334,372 - -
Amortisation of quarry stripping costs 85,612 187,147 - -
Finance costs 3,476,788 4,970,899 - -
Unrealised foreign exchange loss/(gain) 1,169,109 508,955 32,326 (2,677)
Interest income - (24,956) - -
Provision for doubtful receivables 115,116 327,497 - -
Provision for doubtful advances paid to third parties 73,591 295,111 - -
Loss on disposal of property, plant and equipment 45,659 7,358 - -
Provision for obsolete inventories 648,936 380,369 - -
Operating Profit/(Loss) Before Working Capital Changes 27,023,394 21,540,913 (471,504) (400,051)
Cash Flow StatementsFOR THE YEAR ENDED 31 DECEMBER 2012
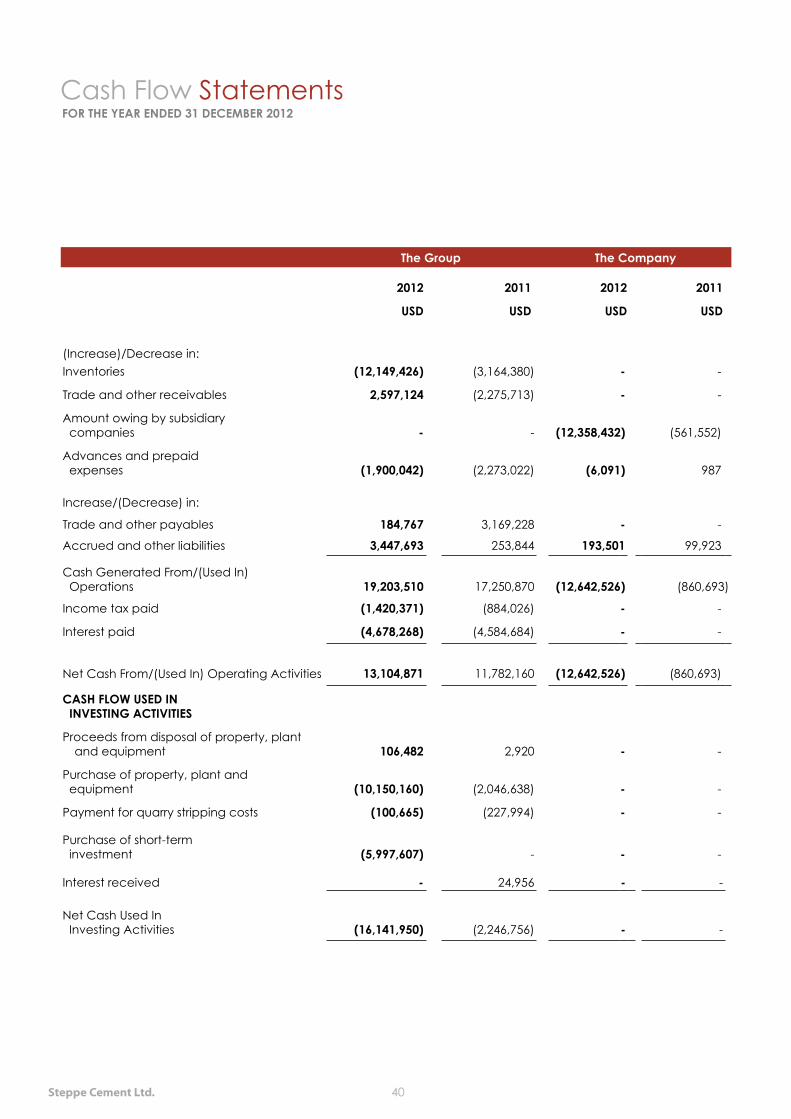
Steppe Cement Ltd. 40
The Group The Company
2012 2011 2012 2011
USD USD USD USD
(Increase)/Decrease in:Inventories (12,149,426) (3,164,380) - -
Trade and other receivables 2,597,124 (2,275,713) - -
Amount owing by subsidiary companies - - (12,358,432) (561,552)
Advances and prepaid expenses (1,900,042) (2,273,022) (6,091) 987
Increase/(Decrease) in:
Trade and other payables 184,767 3,169,228 - -
Accrued and other liabilities 3,447,693 253,844 193,501 99,923
Cash Generated From/(Used In) Operations 19,203,510 17,250,870 (12,642,526) (860,693)
Income tax paid (1,420,371) (884,026) - -
Interest paid (4,678,268) (4,584,684) - -
Net Cash From/(Used In) Operating Activities 13,104,871 11,782,160 (12,642,526) (860,693)
CASH FLOW USED IN INVESTING ACTIVITIES Proceeds from disposal of property, plant
and equipment 106,482 2,920 - -
Purchase of property, plant and equipment (10,150,160) (2,046,638) - -
Payment for quarry stripping costs (100,665) (227,994) - -
Purchase of short-term investment (5,997,607) - - -
Interest received - 24,956 - -
Net Cash Used In Investing Activities (16,141,950) (2,246,756) - -
Cash Flow StatementsFOR THE YEAR ENDED 31 DECEMBER 2012
Annual Report 201241
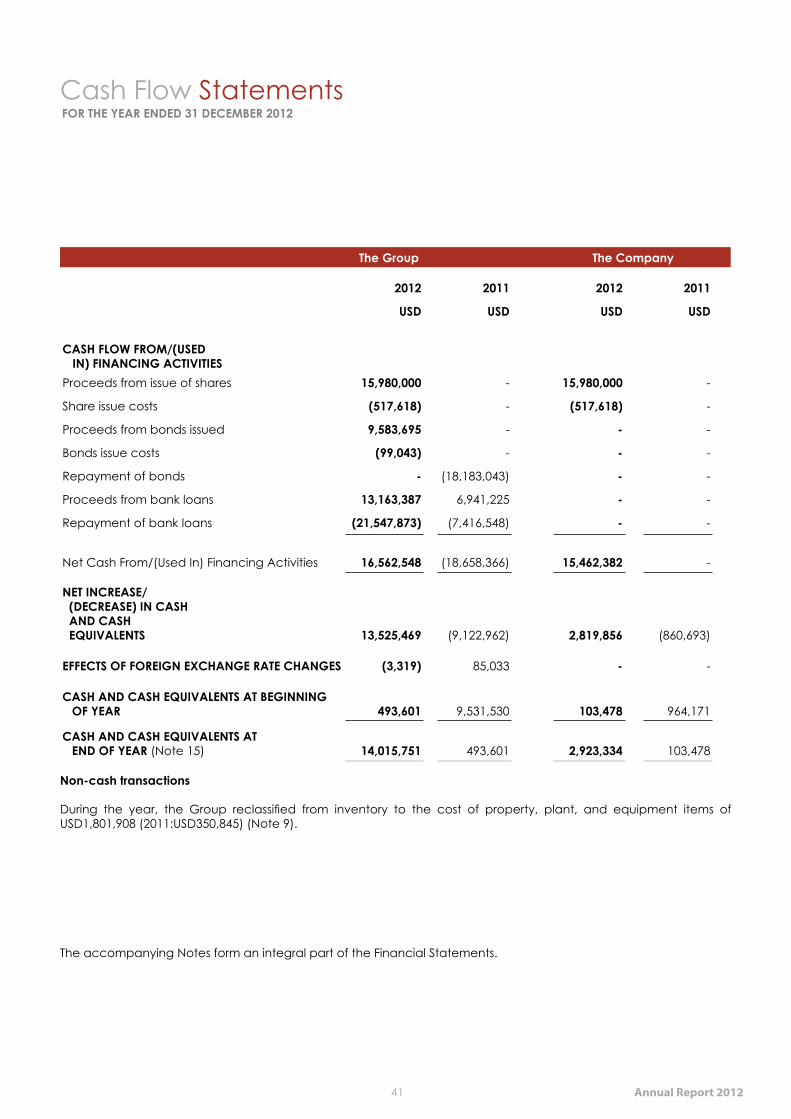
The Group The Company
2012 2011 2012 2011
USD USD USD USD
CASH FLOW FROM/(USED IN) FINANCING ACTIVITIESProceeds from issue of shares 15,980,000 - 15,980,000 -
Share issue costs (517,618) - (517,618) -
Proceeds from bonds issued 9,583,695 - - -
Bonds issue costs (99,043) - - -
Repayment of bonds - (18,183,043) - -
Proceeds from bank loans 13,163,387 6,941,225 - -
Repayment of bank loans (21,547,873) (7,416,548) - -
Net Cash From/(Used In) Financing Activities 16,562,548 (18,658,366) 15,462,382 -
NET INCREASE/ (DECREASE) IN CASH AND CASH EQUIVALENTS 13,525,469 (9,122,962) 2,819,856 (860,693)
EFFECTS OF FOREIGN EXCHANGE RATE CHANGES (3,319) 85,033 - -
CASH AND CASH EQUIVALENTS AT BEGINNING OF YEAR 493,601 9,531,530 103,478 964,171
CASH AND CASH EQUIVALENTS AT END OF YEAR (Note 15) 14,015,751 493,601 2,923,334 103,478
Non-cash transactions
During the year, the Group reclassified from inventory to the cost of property, plant, and equipment items of USD1,801,908 (2011:USD350,845) (Note 9).
The accompanying Notes form an integral part of the Financial Statements.
Cash Flow StatementsFOR THE YEAR ENDED 31 DECEMBER 2012
Notes To The Financial Statements31 DECEMBER 2012
Steppe Cement Ltd. 42
1. GENERAL INFORMATION
Steppe Cement Ltd (“the Company”) is incorporated and domiciled in Malaysia. The principal place of business of the Company and its subsidiaries (the “Group”) is located at Aktau village, Karaganda region, the Republic of Kazakhstan. The Company’s shares are listed on the Alternative Investment Market of the London Stock Exchange.
The registered office of the Company is located at Brumby Centre, Lot 42, Jalan Muhibbah, 87000 Labuan FT, Malaysia.
The Company’s principal activity is investment holding. The principal activities of the subsidiary companies are disclosed in Note 10.
The financial statements of the Group and the Company have been approved by the Board of Directors and were authorised for issuance on 6 May 2013.
2. BASIS OF PREPARATION OF FINANCIAL STATEMENTS
Basis of preparation
Except for the revaluation of land and buildings and classification of a bank loan in the financial statements of the Group as disclosed in Notes 9 and 19, respectively, to the financial statements, the financial statements of the Group and the Company have been prepared in accordance with International Financial Reporting Standards (“IFRS”) issued by the International Accounting Standards Board (“IASB”).
The Group’s financial statements have been prepared on a going concern basis, which assumes that the realisation of assets and the settlement of liabilities will occur in the ordinary course of business within the foreseeable future.
As at 31 December 2012, the statement of financial position of the Group would have reported net current liabilities of USD4,045,287 had the bank loan of USD23,998,287 been classified as a current liability in accordance with International Accounting Standard (IAS) 1 “Presentation of Financial Statements” that requires that such liabilities are classified as current liabilities.
The directors believe that the Group will have access to sufficient financing to continue its activities on a going concern basis. The Company had three successful exercises of share sales to shareholders on London Stock Exchange from 2009 to 2012 totaling USD47 million. In October 2012, the Group’s subsidiary, Central Asia Cement JSC, successfully listed bonds of USD33,235,842 on Kazakhstan Stock Exchange, out of which USD9,904,281 has been issued in November 2012. The remaining USD23,331,561 of unissued bonds represents a readily available option of financing for the Group. In March 2013, the Group’s subsidiary, Karcement JSC, received an offer for a loan facility of USD30,000,000 from a major bank in Kazakhstan. Besides, internally-generated fund from the operation of the Group is expected to remain sufficient given the improved market conditions. In addition, all existing banking facilities will be continuously available for the Group’s use.
After considering these factors, the directors consider the Group will have sufficient working capital to meet in full its financial obligations as and when they fall due for the foreseeable future. Accordingly, the financial statements of the Group have been prepared on a going concern basis. Should the Group be unable to operate as a going concern, adjustments would have to be made to write down the value of all assets to their recoverable amounts, to provide for any further liabilities which might arise and to reclassify non-current assets and liabilities as
Notes To The Financial Statements31 DECEMBER 2012
Annual Report 201243
current assets and liabilities, respectively. The effects of these potential adjustments have not been reflected in the financial statements.
Adoption of new and revised Standards
New and revised IFRSs in issue and effective
The Group has adopted the following new or revised Standards and Interpretations issued by the IASB and the International Financial Reporting Interpretations Committee (the “IFRIC”) which became effective for the Group’s annual consolidated financial statement for the year ended 31 December 2012:
• IFRS 7 “Financial Instruments: Disclosures” – amendments enhancing disclosures about transfers of financial assets effective from annual periods beginning on or after 1 January 2013. The amendments increase the disclosure requirements for transactions involving the transfer of financial assets in order to provide greater transparency around risk exposures when financial assets are transferred.
• IAS 12 “Income Taxes” – limited scope amendment (recovery of underlying assets); effective for annual periods beginning on or after 1 January 2012. The Group has applied the amendments to IAS 12 in the current year. Under the amendments, investment properties that are measured using the fair value model in accordance with IAS 40 “Investment Property” are presumed to be recovered entirely through sale for the purposes of measuring deferred taxes unless the presumption is rebutted.
The adoption of these Standards and Interpretations has not led to any changes in the Group’s accounting policies. Amendments did not result in significant impact on the Group’s consolidated financial statements.
New and revised IFRSs in issue but not yet effective
At the date of authorisation for issue of these financial statements, the new and revised Standards and Interpretations which were in issue but not yet effective:
IFRS 9 Financial Instruments3
IFRS 10 Consolidated Financial Statements4
IFRS 11 Joint Arrangements4
IFRS 12 Disclosure of Interests in Other Entities4
IFRS 13 Fair Value Measurement1
Amendments to IFRS 7 Disclosures – Offsetting Financial Assets1 Amendment to IFRS 9 and IFRS 7 Mandatory Effective Date of IFRS 9 and Transition Disclosures3
Amendment to IFRS 10, IFRS 11 And IFRS 12 Consolidated financial statements, Joint Arrangements and Disclosure of Interests in Other Entities: Transition Guidance1
IAS 19 (as revised in 2011) Employee Benefits1
IAS 27 (as revised in 2011) Separate Financial Statements4
IAS 28 (as revised in 2011) Investments in Associates and Joint Ventures4
Amendments to IAS 32 Offsetting financial Assets and Financial Liabilities2 Amendments to IFRSs Annual Improvements to IFRSs 2009-2011 Cycle except for the Amendment to IAS 11
IFRIC 20 Stripping Costs in the Production Phase of a Surface Mine1
Notes To The Financial Statements31 DECEMBER 2012
Steppe Cement Ltd. 44
1Effective for annual periods beginning on or after 1 January 2013, with earlier application permitted.2Effective for annual periods beginning on or after 1 January 2014, with earlier application permitted. The new offsetting disclosure requirements are effective for annual periods beginning on or after 1 January 2013.3Effective for annual periods beginning on or after 1 January 2015, with earlier application permitted.4Each of the five standards becomes effective for annual periods beginning on or after 1 January 2013, with earlier application permitted if all the other standards in the ‘package of five’ are also early applied (except for IFRS 12 that can be applied earlier on its own).
IFRS 9 Financial Instruments
IFRS 9 “Financial Instruments”, issued in November 2009 and amended in October 2010, introduces new requirements for the classification and measurement of financial assets and financial liabilities and for derecognition.
Key requirements of IFRS 9:
• all recognised financial assets that are within the scope of IAS 39 “Financial Instruments: Recognition and Measurement” to be subsequently measured at amortised cost or fair value. Specifically, debt investments that are held within a business model whose objective is to collect the contractual cash flows, and that have contractual cash flows that are solely payments of principal and interest on the principal outstanding are generally measured at amortised cost at the end of subsequent accounting periods. All other debt investments and equity investments are measured at their fair values at the end of subsequent accounting periods. In addition, under IFRS 9 “Financial Instruments”, entities may make an irrevocable election to present subsequent changes in the fair value of an equity investment (that is not held for trading) in other comprehensive income, with only dividend income generally recognised in profit or loss.
• with regard to the measurement of financial liabilities designated as at fair value through profit or loss, IFRS 9 “Financial Instruments” requires that the amount of change in the fair value of the financial liability, that is attributable to changes in the credit risk of that liability, is presented in other comprehensive income, unless the recognition of the effects of changes in the liability’s credit risk in other comprehensive income would create or enlarge an accounting mismatch in profit or loss. Changes in fair value attributable to a financial liability’s credit risk are not subsequently reclassified to profit or loss. Previously, under IAS 39 “Financial Instruments: Recognition and Measurement”, the entire amount of the change in the fair value of the financial liability designated as at fair value through profit or loss was recognised in profit or loss.
The directors anticipate that the adoption of IFRS 9 “Financial Instruments” in the future may have a significant impact on amounts reported in respect of the Group’s financial assets and financial liabilities. However, it is not practicable to provide a reasonable estimate of the effect of IFRS 9 “Financial Instruments” until a detailed review has been completed.
New and Revised Standards on Consolidation, Joint Arrangements, Associates and Disclosures
In May 2011, a package of five Standards on consolidation, joint arrangements, associates and disclosures was issued, including IFRS 10 “Consolidated Financial Statements”, IFRS 11 “Joint Arrangements”, IFRS 12 “Disclosure of Interest in Other Entities”, IAS 27 (as revised in 2011) “Separate Financial Statements” and IAS 28 (as revised in 2011) “Investments in Associates and Joint Ventures”.
Notes To The Financial Statements31 DECEMBER 2012
Annual Report 201245
Key requirements of these five Standards are described below:
IFRS 10 “Consolidated Financial Statements” replaces the parts of IAS 27 “Consolidated and Separate Financial Statements” that deal with consolidated financial statements. SIC-12 Consolidation – Special Purpose Entities will be withdrawn upon the effective date of IFRS 10 “Consolidated Financial Statements”. Under IFRS 10 “Consolidated Financial Statements”, there is only one basis for consolidation, that is, control. In addition, IFRS 10 “Consolidated Financial Statements” includes a new definition of control that contains three elements: (a) power over an investee, (b) exposure, or rights, to variable returns from its involvement with the investee, and (c) the ability to use its power over the investee to affect the amount of the investor’s return. Extensive guidance has been added in IFRS 10 “Consolidated Financial Statements” to deal with complex scenarios.
IFRS 11 “Joint Arrangements” replaces IAS 31 “Interests in Joint Ventures”. IFRS 11 Joint Arrangements deals with how a joint arrangement of which two or more parties have joint control should be classified. SIC-13 Jointly Controlled Entities – Non-monetary Contributions by Venturers will be withdrawn upon the effective date of IFRS 11 “Joint Arrangements”.
IFRS 12 “Disclosure of Interests in Other Entities” is a disclosure standard and is applicable to entities that have interests in subsidiaries, joint arrangements, associates and/or unconsolidated structured entities. In general, the disclosure requirements in IFRS 12 are more extensive than those in the current standards.
The directors have considered the impact from the adoption of these new standards commencing 1 January 2013 and anticipated that the adoption would have no effect on consolidation. IFRS 13 Fair Value Measurement
IFRS 13 “Fair Value Measurement” establishes a single source of guidance for fair value measurements and disclosures about fair value measurements. The Standard defines fair value, establishes a framework for measuring fair value, and requires disclosures about fair value measurements. The scope of IFRS 13 “Fair Value Measurement” is broad; it applies to both financial instrument items and non-financial instrument items for which other IFRSs require or permit fair value measurements and disclosures amount fair value measurements, except in specified circumstances. In general, the disclosure requirements in IFRS 13 “Fair Value Measurement” are more extensive than those required in the current standards. For example, quantitative and qualitative disclosures based on the three-level fair value hierarchy currently required for financial instruments only under IFRS 7 “Financial Instruments: Disclosures” will be extended by IFRS 13 “Fair Value Measurement” to cover all assets and liabilities within its scope.
The directors anticipate that the application of the new standard may affect certain amounts reported in the financial statements and result in more extensive disclosures in the financial statements.
IFRIC 20 Stripping Costs in the Production Phase of a Surface Mine
IFRIC 20 applies to waste removal costs that are incurred in surface mining activity during the production phase of the mine (‘production stripping costs’). Under the Interpretation, the costs from this waste removal activity (‘stripping’) which provide improved access to ore is recognised as a non-current asset (‘stripping activity asset’) when certain criteria are met, whereas the costs of normal on-going operational stripping activities are accounted for in accordance with IAS 2 “Inventories”. The stripping activity asset is accounted for as an addition to, or as an enhancement of, an existing asset and classified as tangible or intangible according to the nature of the existing asset of which it forms part.
Notes To The Financial Statements31 DECEMBER 2012
Steppe Cement Ltd. 46
The directors anticipate that the implementation of IFRIC 20 Stripping Costs in the Production Phase of a Surface Mine may not have material impact on the financial statements.
The Group and the Company will adopt all relevant new and revised Standards and Interpretations from their respective effective dates.
3. SIGNIFICANT ACCOUNTING POLICIES Basis of Accounting
The financial statements of the Group and the Company have been prepared under the historical cost convention except the revaluation of land and building to fair values in accordance with IAS 16 “Property, Plant and Equipment” (Note 9).
Historical cost is generally based on the fair value of the consideration given in exchange for assets.
The principal accounting policies are set out below.
Basis of Consolidation
The consolidated financial statements incorporate the financial statements of the Company and entities controlled by the Company (its subsidiary companies). Control is achieved where the Company has the power to govern the financial and operating policies of an entity so as to obtain benefits from its activities.
Income and expenses of subsidiaries acquired or disposed of during the year are included in the consolidated statement of comprehensive income from the effective date of acquisition and up to the effective date of disposal, as appropriate. Total comprehensive income of subsidiaries is attributed to the owners of the Company and to the non-controlling interests even if this results in the non-controlling interests having a deficit balance.
Where necessary, adjustments are made to the financial statements of subsidiary companies to bring its accounting policies to be in line with those used by other subsidiaries of the Group.
All intra-group transactions, balances, income and expenses are eliminated in full on consolidation.
Changes in the Group’s ownership interests in existing subsidiaries
Changes in the Group’s ownership interests in subsidiaries that do not result in the Group losing control over the subsidiaries are accounted for as equity transactions. The carrying amounts of the Group’s interests and the non-controlling interests are adjusted to reflect the changes in their relative interests in the subsidiaries. Any difference between the amount by which the non-controlling interests are adjusted and the fair value of the consideration paid or received is recognised directly in equity and attributed to owners of the Company.
When the Group loses control of a subsidiary, the profit or loss on disposal is calculated as the difference between (i) the aggregate of the fair value of the consideration received and the fair value of any retained interest and (ii) the previous carrying amount of the assets (including goodwill), and liabilities of the subsidiary and any non-controlling interests. When assets of the subsidiary are carried at revalued amounts or fair values and the related cumulative gain or loss has been recognised in other comprehensive income, the amounts previously recognised in other
Notes To The Financial Statements31 DECEMBER 2012
Annual Report 201247
comprehensive income are accounted for as if the Company had directly disposed of the relevant assets (i.e. reclassified to profit or loss or transferred directly to retained earnings as specified by applicable IFRSs). The fair value of any investment retained in the former subsidiary at the date when control is lost is regarded as the fair value on initial recognition for subsequent accounting under IAS 39 Financial Instruments: Recognition and Measurement or, when applicable, the cost on initial recognition of an investment in an associate or a jointly controlled entity.
Revenue
Revenue is measured at the fair value of the consideration received or receivable. Revenue of the Group represents sales of cement, transmission and distribution of electricity and interest income. Sales of cement and transmission and distribution of electricity are stated at invoice value net of discounts, rebates, commissions and returns. Revenue of the Company represents management fee.
Revenue is recognised on the following bases:- Gross invoiced value of goods sold: upon shipment/delivery of goods net of discounts,
rebates, commissions and returns and when the risks and rewards of ownership have passed to the customers.
- Interest income: on an accrual basis by reference to the principal outstanding and at the effective interest rate applicable.
- Management fee income: on accrual basis in accordance with the substance of the relevant agreement. Management fee determined on a time basis is recognised on a straight-line basis over the period of the agreement.
Foreign Currencies
The individual financial statements of each group entity are presented in the currency of the primary economic environment in which the entity operates (its functional currency). For the purpose of the financial statements of the Group, the results and financial position of each entity are expressed in United States Dollar, which is the functional currency of the Company, and the presentation currency for the financial statements of the Group.
In preparing the financial statements of the individual entities, transactions in currencies other than the entity’s functional currency are recorded at the rates of exchange prevailing on the dates of the transactions. At each reporting date, monetary items denominated in foreign currencies are retranslated at the rates prevailing on the reporting date. Non-monetary items carried at fair value that are denominated in foreign currencies are retranslated at the rates prevailing on the date when the fair value was determined. Non-monetary items that are measured in terms of historical cost in a foreign currency are not retranslated.
Exchange differences arising on the settlement of monetary item and on the retranslation of monetary items are included in the income statement for the period. Exchange differences arising on the retranslation of non-monetary items carried at fair value are included in the income statement for the period except for differences arising on the retranslation of non-monetary item in respect of which gains and losses are recognised in other comprehensive income. For such non-monetary items, any exchange component of that gain or loss is also recognised in other comprehensive income.
For the purposes of presenting financial statements, the assets and liabilities of the Group’s foreign operation (including comparatives) are expressed in United States Dollar using exchange rates prevailing on the reporting date. Income and expense items (including comparatives) are translated at the average rates at the dates of the transactions. Exchange differences arising, if any, are recorded in other comprehensive income and accumulated in the Group’s translation
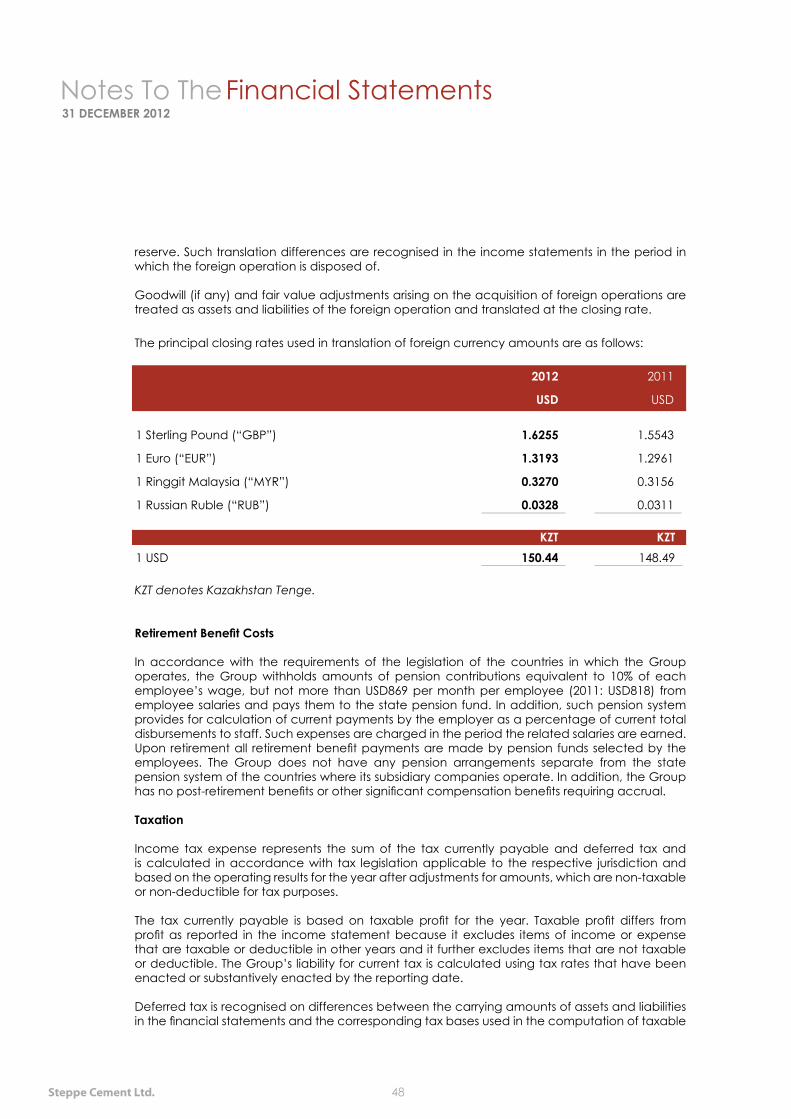
Notes To The Financial Statements31 DECEMBER 2012
Steppe Cement Ltd. 48
reserve. Such translation differences are recognised in the income statements in the period in which the foreign operation is disposed of.
Goodwill (if any) and fair value adjustments arising on the acquisition of foreign operations are treated as assets and liabilities of the foreign operation and translated at the closing rate.
The principal closing rates used in translation of foreign currency amounts are as follows:
2012 2011
USD USD
1 Sterling Pound (“GBP”) 1.6255 1.5543
1 Euro (“EUR”) 1.3193 1.2961
1 Ringgit Malaysia (“MYR”) 0.3270 0.3156
1 Russian Ruble (“RUB”) 0.0328 0.0311
KZT KZT1 USD 150.44 148.49
KZT denotes Kazakhstan Tenge.
Retirement Benefit Costs
In accordance with the requirements of the legislation of the countries in which the Group operates, the Group withholds amounts of pension contributions equivalent to 10% of each employee’s wage, but not more than USD869 per month per employee (2011: USD818) from employee salaries and pays them to the state pension fund. In addition, such pension system provides for calculation of current payments by the employer as a percentage of current total disbursements to staff. Such expenses are charged in the period the related salaries are earned. Upon retirement all retirement benefit payments are made by pension funds selected by the employees. The Group does not have any pension arrangements separate from the state pension system of the countries where its subsidiary companies operate. In addition, the Group has no post-retirement benefits or other significant compensation benefits requiring accrual.
Taxation
Income tax expense represents the sum of the tax currently payable and deferred tax and is calculated in accordance with tax legislation applicable to the respective jurisdiction and based on the operating results for the year after adjustments for amounts, which are non-taxable or non-deductible for tax purposes.
The tax currently payable is based on taxable profit for the year. Taxable profit differs from profit as reported in the income statement because it excludes items of income or expense that are taxable or deductible in other years and it further excludes items that are not taxable or deductible. The Group’s liability for current tax is calculated using tax rates that have been enacted or substantively enacted by the reporting date.
Deferred tax is recognised on differences between the carrying amounts of assets and liabilities in the financial statements and the corresponding tax bases used in the computation of taxable
Notes To The Financial Statements31 DECEMBER 2012
Annual Report 201249
profit, and are accounted for using the liability method. Deferred tax liabilities are generally recognised for all taxable temporary differences and deferred tax assets are recognised to the extent that it is probable that taxable profits will be available against which deductible temporary differences can be utilised. Such assets and liabilities are not recognised if the temporary difference arises from goodwill or from the initial recognition (other than in a business combination) of other assets and liabilities in a transaction that affects neither the taxable profit nor the accounting profit.
The carrying amount of deferred tax assets is reviewed at the end of each reporting period and reduced to the extent that it is no longer probable that sufficient taxable profits will be available to allow all or part of the asset to be recovered.
Deferred tax assets and liabilities are measured at the tax rates that are expected to apply in the period when the liability is settled or the asset realised, based on the tax rates (and tax laws) that have been enacted or substantively enacted by the end of the reporting period. The measurement of deferred tax liabilities and assets reflects the tax consequences that would follow from the manner in which the entity expects, at the end of the reporting period, to recover or settle the carrying amount of its assets and liabilities. Deferred tax is charged or credited to the income statement, except when it relate to items that are recognised outside profit or loss (whether in other comprehensive income or charged or credited directly to equity), in which case the deferred tax is also dealt outside profit or loss, or where they arise from the initial accounting for a business combination. In the case of a business combination, the tax effect is included in the accounting for the business combination.
Deferred tax assets and liabilities are offset when there is a legally enforceable right to set off current tax assets against current tax liabilities and when they relate to income taxes levied by the same taxation authority and the Group intends to settle its current tax assets and liabilities on a net basis.
Property, Plant and Equipment
Property, plant and equipment are stated at cost less accumulated depreciation and accumulated impairment loss, if any, except for certain land and buildings which are stated at their revalued amounts. The initial cost of property, plant and equipment consists of its purchase price, including import duties, taxes and any directly attributable cost to bring the property, plant and equipment to its working condition and location for its intended use.
Properties in the course of construction for production, rental or administrative purposes or for purposes not yet determined are carried at cost less any recognised impaired loss. Cost includes professional fees and, for qualifying assets, borrowing costs capitalised in accordance with the Group’s accounting policy.
Capitalised cost includes major expenditures for improvements and replacements that extend the useful lives of the assets or increase their revenue generating capacity. Repairs and maintenance expenditures that do not meet the foregoing criteria for capitalisation are charged to the income statement as incurred.
Land and buildings held for use in the production or supply of goods or services, or for administrative purposes, which are stated at their revalued amounts, being the fair value at the date of revaluation, less any subsequent accumulated depreciation and subsequent accumulated impairment losses, if any. Revaluations are performed with sufficient regularity such that the carrying amounts do not differ materially from those that would be determined using fair values at the end of each reporting date.
Notes To The Financial Statements31 DECEMBER 2012
Steppe Cement Ltd. 50
Any revaluation increase arising on revaluation of such land and buildings is recognised in other comprehensive income and the accumulated revaluation reserve, except to the extent that it reverses a revaluation decrease for the same asset previously recognised in the income statement, in which case, the increase is credited to the income statement to the extent of the decrease previously charged. A decrease in the carrying amount arising on revaluation of such land and buildings is recognised in profit or loss to the extent that it exceeds the balance, if any, held in the revaluation reserve relating to a previously revalued asset.
Revaluation surplus is transferred to retained earnings as the revalued asset is used by the Group. The amount transferred is calculated as the difference between depreciation determined based on the revalued carrying amount of the asset and depreciation based on the asset’s original cost.
Depreciation on revalued buildings is recognised in the income statement. On the subsequent sale or retirement of revalued assets, the attributable revaluation surplus remaining in the revaluation reserve is transferred directly to retained earnings.
Depreciation of property, plant and equipment commences when the assets are ready for their intended use.
The estimated useful lives, residual values and depreciation method of assets are reviewed at the end of each reporting period with the effect of any changes in estimate accounted for on a prospective basis. Depreciation is charged so as to write off the cost of assets, other than freehold land, land improvement and construction in progress, on a straight-line basis over their estimated useful lives as follows:
Buildings 25 years
Machinery and equipment 14 years
Other assets 5 - 10 years
Computer software 1 - 10 years
An item of property, plant and equipment is derecognised upon disposal or when no future economic benefits are expected to arise from the continued use of the asset. Any gain or loss arising on the disposal or retirement of an item of property, plant and equipment is determined as the difference between the net proceeds and the carrying amount of the asset and is recognised in the income statement in the reporting period when such asset was derecognised. Quarry Stripping Costs
The cost of removal of the overburden from the quarry is deferred until the commencement of physical extraction of limestone from the site. Such costs are amortised over the expected life of the quarry from the date of commencement of extraction.
Impairment of Tangible Assets
At the end of each reporting period, the Group reviews the carrying amounts of its tangible assets to determine whether there is any indication that those assets have suffered an impairment loss. If any such indication exists, the recoverable amount of the asset is estimated in order to determine the extent of the impairment loss (if any). Where it is not possible to estimate the recoverable amount of an individual asset, the Group estimates the recoverable amount of the
Notes To The Financial Statements31 DECEMBER 2012
Annual Report 201251
cash-generating unit to which the asset belongs. Where a reasonable and consistent basis of allocation can be identified, corporate assets are also allocated to individual cash-generating units, or otherwise they are allocated to the smallest group of cash-generating units for which a reasonable and consistent allocation basis can be identified.
Recoverable amount is the higher of the fair value less costs to sell and the value in use. In assessing value in use, the estimated future cash flows are discounted to their present value using a pre-tax discount rate that management believes reflects the current market assessments of the time value of money and the risks specific to the asset.
If the recoverable amount of an asset is estimated to be less than its carrying amount, the carrying amount of the asset is reduced to its recoverable amount. An impairment loss is recognised immediately in the income statement unless the relevant asset is carried at a revalued amount in which case the impairment loss is treated as a revaluation decrease (see accounting policy on property, plant and equipment above).
Where an impairment loss subsequently reverses, the carrying amount of the asset (or cash-generating unit) is increased to the revised estimate of its recoverable amount, but so that the increased carrying amount does not exceed the carrying amount that would have been determined had no impairment loss been recognised for the asset (or cash-generating unit) in prior years. A reversal of an impairment loss is recognised immediately in income statement unless the relevant asset is carried at a revalued amount in which case the reversal of the impairment loss is treated as a revaluation increase (see accounting policy on property, plant and equipment above).
Inventories
Inventories are stated at the lower of cost and net realisable value. Costs comprise direct materials and, where applicable, direct labour costs and those overheads that have been incurred in bringing the inventories to their present location and condition. Cost is calculated using the weighted average method. Net realisable value represents the estimated selling price less all estimated costs of completion and the estimated costs necessary to make the sale.
At each reporting date, the Group evaluates its inventory balances for excess quantities and obsolescence and, if necessary, records an allowance to reduce inventory for obsolete, slow-moving raw materials and spare parts. Provision is determined based on inventory ageing as follows:
More than 1 year 33.3%
More than 2 years 66.7%
More than 3 years 100%
Provisions
Provisions are recognised when the Group has a present obligation (legal or constructive) as a result of a past event, and it is probable that the Group will be required to settle that obligation and a reliable estimate can be made of the amount of the obligation. Provisions are measured at the directors’ best estimate of the expenditure required to settle the obligation at the reporting date, and are discounted to present value where the effect is material.
The amount recognised as a provision is the best estimate of the consideration required to settle the present obligation at the end of the reporting period, taking into account the risks and
Notes To The Financial Statements31 DECEMBER 2012
Steppe Cement Ltd. 52
uncertainties surrounding the obligation. Where a provision is measured using the cash flows estimated to settle the present obligation, its carrying amount is the present value of those cash flows (where the effect of the time value of money is material).
When some or all of the economic benefits required to settle a provision are expected to be recovered from a third party, a receivable is recognised as an asset if it is virtually certain that reimbursement will be received and the amount of the receivable can be measured reliably.
Contingent Liabilities and Contingent Assets
Contingent liabilities are not recognized in the statement of financial position but are disclosed unless the possibility of any outflow in settlement is remote. A contingent asset is not recognized in the statement of financial position but disclosed when an inflow of economic benefits is probable.
Financial Instruments
Financial assets and financial liabilities are recognised in the Group’s statement of financial position when the Group becomes a party to the contractual provisions of the financial instrument.
Financial assets and financial liabilities are initially measured at fair value. Transaction costs that are directly attributable to the acquisition or issue of financial assets and financial liabilities (other than financial assets and financial liabilities at fair value through profit or loss) are added or deducted from the fair value of the financial assets or financial liabilities, as appropriate, on initial recognition. Transaction costs directly attributable to the acquisition of financial assets or financial liabilities at fair value through profit or loss are recognized immediately in the income statement.
Effective Interest Method
The effective interest method is a method of calculating the amortised cost of a financial asset or liability and of allocating interest income or expense over the relevant period. The effective interest rate is the rate that exactly discounts estimated future cash receipts or payments (including all fees, paid or received, which comprise an integral part of the effective interest rate, transaction costs and other premiums or discounts) through the expected life of the financial asset, or, where appropriate, a shorter period.
Financial Assets
Financial assets are classified into the following specified categories: financial assets “at fair value through profit or loss” (“FVTPL”), “held-to-maturity” investments, “available-for-sale” (“AFS”) financial assets and “loans and receivables”. The classification depends on the nature and purpose of the financial assets and is determined at the time of initial recognition.
Loans and receivables are non-derivative financial assets with fixed or determinable payments that are not quoted in an active market. Loans and receivables (including cash and cash equivalents, short-term investments and trade and other receivables) are measured at amortised cost using the effective interest method, less any impairment. Interest income is recognised by applying the effective interest rate, except for short-term receivables where the recognition of interest would be immaterial.
The Group does not have financial assets designated as FVTPL, held-to-maturity or AFS.
Notes To The Financial Statements31 DECEMBER 2012
Annual Report 201253
Cash and Cash Equivalents
Cash and cash equivalents comprise cash on hand and demand deposits and other short-term highly liquid investments with initial maturity period of up to three months that are readily convertible to a known amount of cash and are subject to an insignificant risk of changes in value. When cash and cash equivalents are restricted, they are disclosed in the notes to the financial statements.
Short-term Investments
Short-term investments represent fixed short-term deposits in banks with original maturity of more than three months.
Trade and Other Receivables
Trade and other receivables are recognised and carried at the original invoice amount less an allowance for any uncollectible amounts. An estimate of an allowance for estimated doubtful debts is accrued by the Group when a known receivable is not collected within contractual terms. The allowance for doubtful debts is reviewed periodically, and as adjustments become necessary, they are reported as an expense (income) in the period in which they become known. Bad debts are written-off against allowance made previously.
Impairment of Financial Assets
The Group provides an allowance for impairment of financial assets other than those at fair value through profit or loss when there is an objective evidence of impairment of a financial asset or group of assets. The allowance for impairment of financial assets represents a difference between the carrying value of the assets and present value of estimated future cash inflows, including amounts expected to be received on guarantees and security discounted using the original effective interest rate on this financial instrument, which is reflected at amortised value. If in a subsequent period the value of the financial asset increases, and such an increase can be objectively connected with an event which happen after recognition of the impairment then the previously recognised impairment loss is reversed with an adjustment of the allowance account.
For financial assets carried at cost, the impairment loss is measured as the difference between the asset’s carrying amount and the present value of estimated future cash flow, discounted at the current market rate of return for a similar financial instrument.
For certain categories of financial assets, such as trade receivables, assets that are assessed not impaired individually are, in addition, assessed for impairment on a collective basis. Objective evidence of impairment for a portfolio of receivables could include the Group’s past experience of collecting payments, an increase in the number of delayed payments in the portfolio past the average credit period of 30 days, as well as observable changes in national or local economic conditions that correlate with default on receivables.
The changes in impairment allowances are charged to income statement and the assets are reduced by the amount of the impairment allowances. The factors evaluated by the Group in determining whether the evidence of impairment is objective includes information on liquidation of borrowers, solvency and exposure to financial risks, insolvency trends regarding similar financial assets, general economic condition and fair value of security and guarantees. These and other factors individually or combined, represent mainly an objective evidence to recognise an impairment loss on the financial assets or a group of financial assets.
Notes To The Financial Statements31 DECEMBER 2012
Steppe Cement Ltd. 54
Financial Liabilities and Equity Instruments Issued by the Group
Debt and equity instruments are classified as either financial liabilities or as equity in accordance with the substance of the contractual arrangement. An equity instrument is any contract that evidences a residual interest in the assets of an entity after deducting all of its liabilities. Equity instruments are recorded at the proceeds received, net of direct issue costs.
Financial liabilities are classified as either financial liabilities ‘at FVTPL’ or ‘other financial liabilities’.
Other financial liabilities (including debt securities issued, borrowings and trade and other payables) are subsequently measured at amortised cost using the effective interest method.
The Group does not have financial liabilities designated as FVTPL.
Offset of Financial Assets and Liabilities
Financial assets and liabilities are offset and recorded on a net basis in the statement of financial position when the entity is legally empowered to offset certain amounts and the entity intends to either record on a net basis or receive assets and offset liabilities simultaneously.
Derecognition of Financial Assets and Liabilities
Financial Assets
The Group derecognises a financial asset only when the contractual rights to the cash flows from the asset expire; or it transfers the financial asset and substantially all the risks and rewards of ownership of the asset to another entity.
On derecognition of a financial asset in its entirety, the difference between the asset’s carrying amount and the sum of the consideration received and receivable and the cumulative gain or loss that had been recognised in other comprehensive income and accumulated in equity is recognised in the income statement.
Financial Liabilities
The Group derecognises financial liabilities when, and only when, the Group’s obligations are discharged, cancelled or they expire. The difference between the carrying amount of the financial liability derecognised and the consideration paid and payable is recognised in the income statement. Borrowing Costs
Borrowing costs directly attributable to the acquisition, construction or production of qualifying assets, which are assets that necessarily take a substantial period of time to get ready for their intended use or sale, are added to the cost of those assets until such time as the assets are substantially ready for their intended use or sale. Investment income earned on the temporary investment of specific borrowings pending their expenditure on qualifying assets is deducted from the borrowing costs eligible for capitalisation.
All other borrowing costs are recognised in the income statement in the period in which they are incurred.

Notes To The Financial Statements31 DECEMBER 2012
Annual Report 201255
Cash Flow Statement
The Group and the Company adopt the indirect method in the preparation of the cash flow statement.
Critical Accounting Judgements and Key Sources of Estimation Uncertainty
The preparation of financial statements in conformity with IFRS requires the directors to make judgements, estimates and assumptions that affect the reported amounts of assets and liabilities, revenues and expenses and the disclosure of contingent assets and liabilities. Due to the inherent uncertainty in making those judgements, estimates, actual results reported in future periods could differ from such estimates.
The estimates and underlying assumptions are reviewed on an ongoing basis. Revisions to accounting estimates are recognised in the period in which the estimate is revised if the revision affects only that period, or in the period of the revision and future periods if the revision affects both current and future periods.
Revaluation of Property, Plant and Equipment
The Group’s land and buildings are measured at fair value at the date of revaluation less accumulated depreciation and impairment losses recognised. The carrying amount of the land and buildings was determined by professional valuers on 27 August 2010. Valuation techniques used by the professional valuer are subjective and involve the use of professional judgment in the estimation of amongst other things, the Group’s future cash flows from operations and appropriate discount factors and relevant market information.
As at 31 December 2012, the directors consider that the carrying value of land and buildings is reflective of the fair value of these assets.
Impairment of Property, Plant and Equipment
The Group assesses at each reporting date whether there is any indication that an asset may be impaired. If any such indication exists, or when annual impairment testing for an asset is required, the Group makes an estimate of the asset’s recoverable amount. The recoverable amount and the fair values are typically determined using a discounted cash flow method which incorporates reasonable market participant assumptions. These estimates, including the methodologies used, can have a material impact on the fair value and ultimately the amount of any property, plant and equipment impairment. An asset’s recoverable amount is the higher of an asset’s or cash-generating unit’s fair value less costs to sell and its value in use and is determined for an individual asset. Where the carrying amount of an asset exceeds its recoverable amount, the asset is considered impaired and is written down to its recoverable amount. In assessing value in use, the estimated future cash flows are discounted to their present value using a pre-tax 13.20% (2011: 13.20%) discount rate that reflects current market assessment of the time value of money and the risks specific to the assets. During the financial year, the Group did not recognise impairment losses.
The determination of impairment of property, plant and equipment involves the use of estimates that include, but not limited to, the cause, timing and amount of the impairment. Impairment is determined based on a large number of factors, such as expected growth in the industry, changes in the future availability of financing, technological obsolescence, discontinuance of service, current replacement costs and other changes in circumstances that indicate an impairment exists. In 2012 and 2011, the directors did not identify any indicators of impairment.
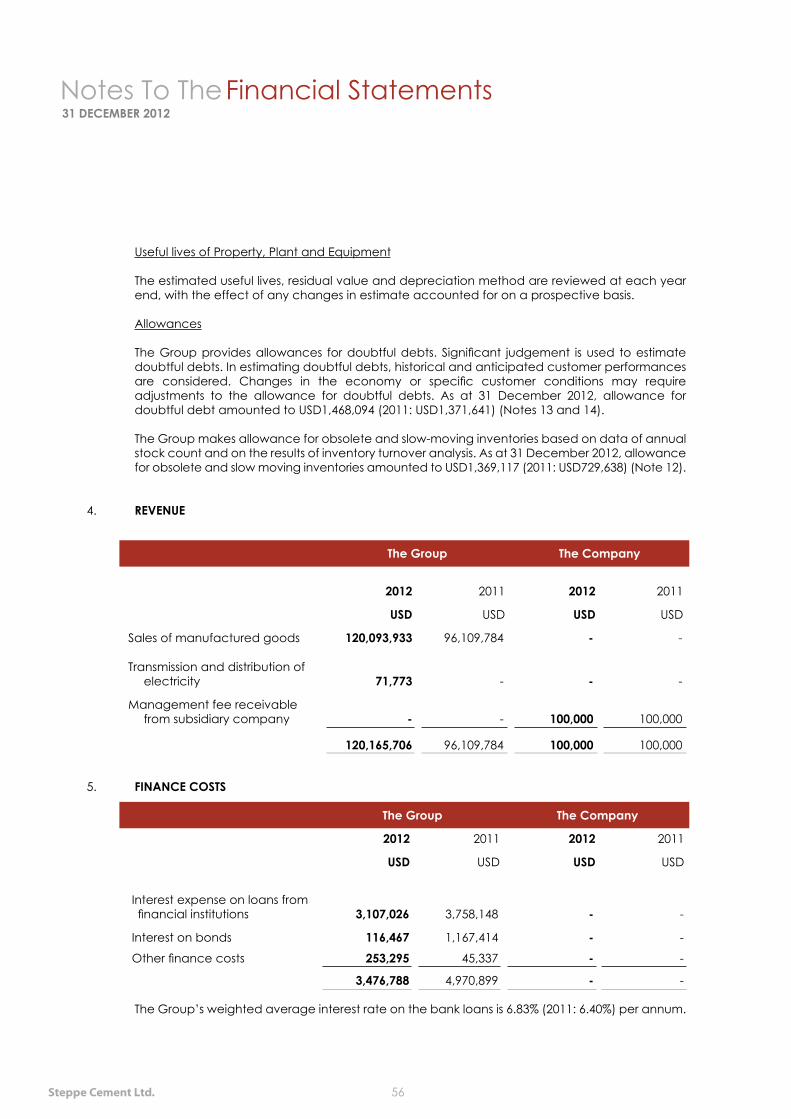
Notes To The Financial Statements31 DECEMBER 2012
Steppe Cement Ltd. 56
Useful lives of Property, Plant and Equipment
The estimated useful lives, residual value and depreciation method are reviewed at each year end, with the effect of any changes in estimate accounted for on a prospective basis.
Allowances
The Group provides allowances for doubtful debts. Significant judgement is used to estimate doubtful debts. In estimating doubtful debts, historical and anticipated customer performances are considered. Changes in the economy or specific customer conditions may require adjustments to the allowance for doubtful debts. As at 31 December 2012, allowance for doubtful debt amounted to USD1,468,094 (2011: USD1,371,641) (Notes 13 and 14).
The Group makes allowance for obsolete and slow-moving inventories based on data of annual stock count and on the results of inventory turnover analysis. As at 31 December 2012, allowance for obsolete and slow moving inventories amounted to USD1,369,117 (2011: USD729,638) (Note 12).
4. REVENUE
The Group The Company
2012 2011 2012 2011
USD USD USD USD
Sales of manufactured goods 120,093,933 96,109,784 - -
Transmission and distribution of electricity 71,773 - - -
Management fee receivable from subsidiary company - - 100,000 100,000
120,165,706 96,109,784 100,000 100,000
5. FINANCE COSTS
The Group The Company
2012 2011 2012 2011
USD USD USD USD
Interest expense on loans from financial institutions 3,107,026 3,758,148 - -
Interest on bonds 116,467 1,167,414 - -
Other finance costs 253,295 45,337 - -
3,476,788 4,970,899 - -
The Group’s weighted average interest rate on the bank loans is 6.83% (2011: 6.40%) per annum.
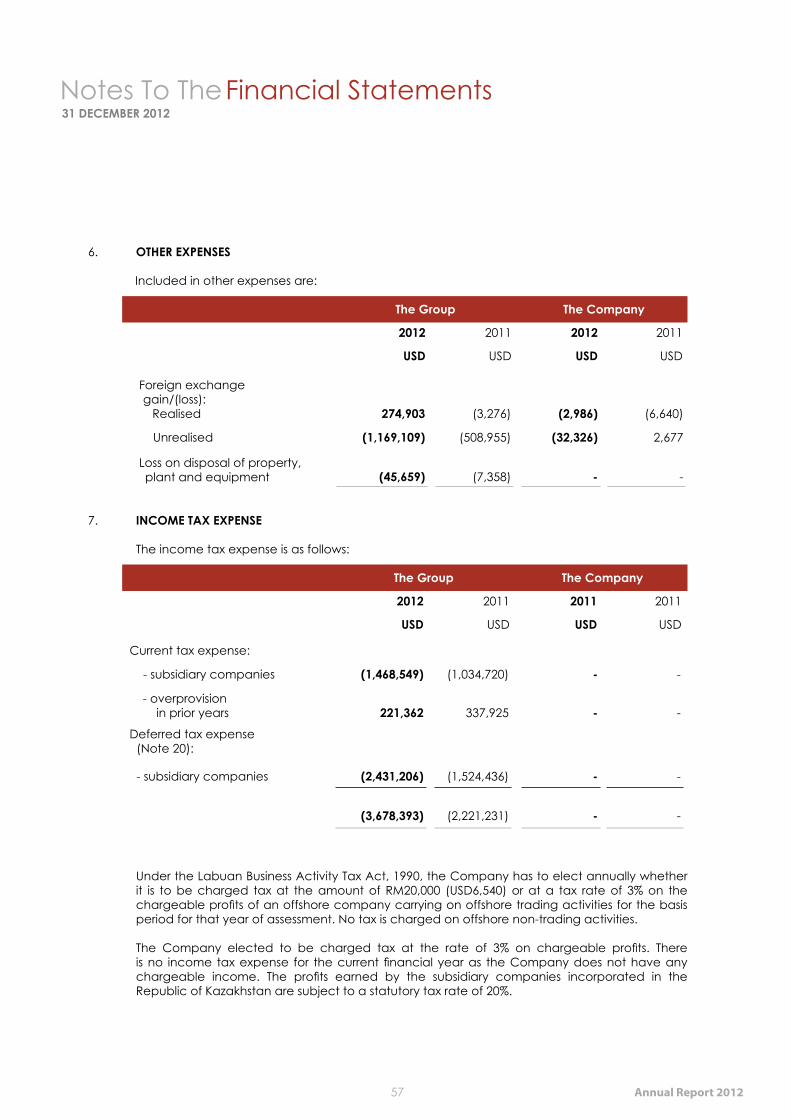
Notes To The Financial Statements31 DECEMBER 2012
Annual Report 201257
6. OTHER EXPENSES
Included in other expenses are:
The Group The Company
2012 2011 2012 2011
USD USD USD USD
Foreign exchange gain/(loss): Realised 274,903 (3,276) (2,986) (6,640)
Unrealised (1,169,109) (508,955) (32,326) 2,677
Loss on disposal of property, plant and equipment (45,659) (7,358) - -
7. INCOME TAX EXPENSE
The income tax expense is as follows:
The Group The Company
2012 2011 2011 2011
USD USD USD USD
Current tax expense:
- subsidiary companies (1,468,549) (1,034,720) - -
- overprovision in prior years 221,362 337,925 - -
Deferred tax expense (Note 20): - subsidiary companies (2,431,206) (1,524,436) - -
(3,678,393) (2,221,231) - -
Under the Labuan Business Activity Tax Act, 1990, the Company has to elect annually whether it is to be charged tax at the amount of RM20,000 (USD6,540) or at a tax rate of 3% on the chargeable profits of an offshore company carrying on offshore trading activities for the basis period for that year of assessment. No tax is charged on offshore non-trading activities.
The Company elected to be charged tax at the rate of 3% on chargeable profits. There is no income tax expense for the current financial year as the Company does not have any chargeable income. The profits earned by the subsidiary companies incorporated in the Republic of Kazakhstan are subject to a statutory tax rate of 20%.
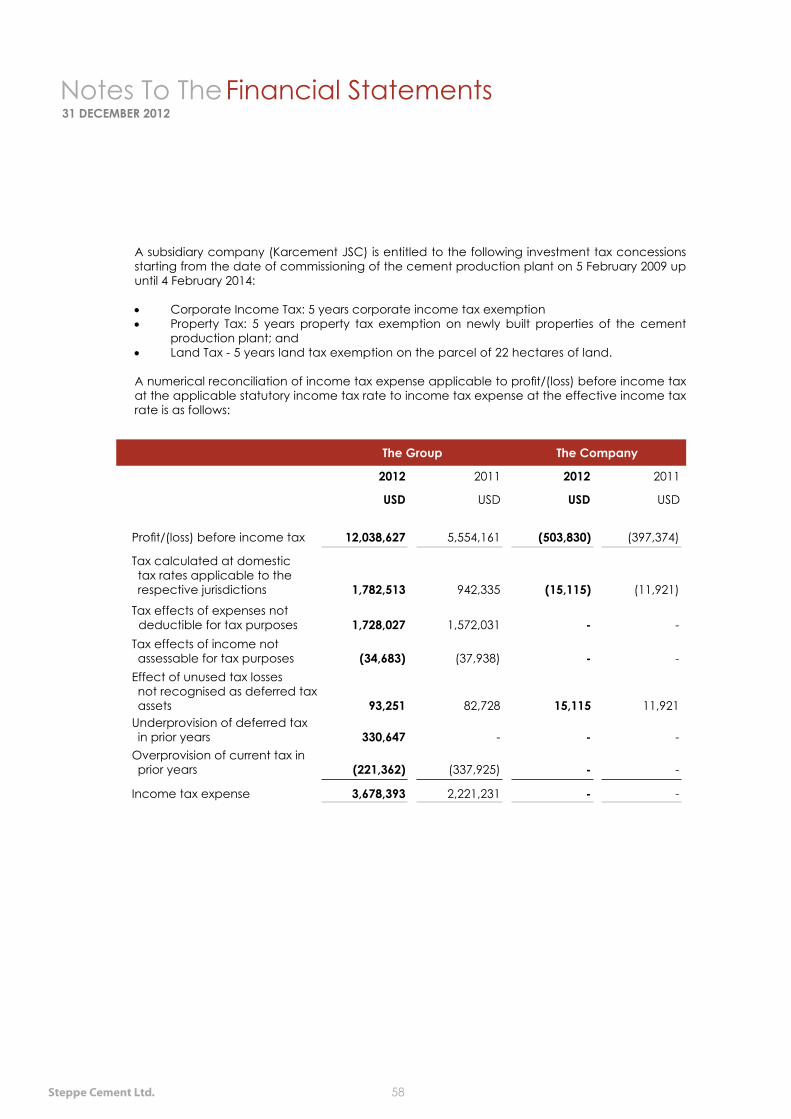
Notes To The Financial Statements31 DECEMBER 2012
Steppe Cement Ltd. 58
A subsidiary company (Karcement JSC) is entitled to the following investment tax concessions starting from the date of commissioning of the cement production plant on 5 February 2009 up until 4 February 2014:
• Corporate Income Tax: 5 years corporate income tax exemption • Property Tax: 5 years property tax exemption on newly built properties of the cement
production plant; and• Land Tax - 5 years land tax exemption on the parcel of 22 hectares of land.
A numerical reconciliation of income tax expense applicable to profit/(loss) before income tax at the applicable statutory income tax rate to income tax expense at the effective income tax rate is as follows:
The Group The Company
2012 2011 2012 2011
USD USD USD USD
Profit/(loss) before income tax 12,038,627 5,554,161 (503,830) (397,374)
Tax calculated at domestic tax rates applicable to the respective jurisdictions 1,782,513 942,335 (15,115) (11,921)
Tax effects of expenses not deductible for tax purposes 1,728,027 1,572,031 - -Tax effects of income not assessable for tax purposes (34,683) (37,938) - -
Effect of unused tax losses not recognised as deferred tax assets 93,251 82,728 15,115 11,921
Underprovision of deferred tax in prior years 330,647 - - -
Overprovision of current tax in prior years (221,362) (337,925) - -
Income tax expense 3,678,393 2,221,231 - -

Notes To The Financial Statements31 DECEMBER 2012
Annual Report 201259
8. PROFIT PER SHARE
Basic and diluted
The Group
2012 2011
USD USD
Profit attributable to ordinary shareholders 8,360,234 3,332,930
2012 2011
Number of ordinary shares in issue at beginning of year 179,000,000 179,000,000
Issue of ordinary shares during the year 40,000,000 -
Number of ordinary shares in issue at end of year 219,000,000 179,000,000
Weighted average number of ordinary shares in issue 181,410,959 179,000,000
2012 2011
Profit per share, basic and diluted (cents) 4.6 1.9
The basic profit per share is calculated by dividing the profit attributable to shareholders of the Company by the weighted average number of ordinary shares in issue during the financial year.
There are no dilutive instruments outstanding for the years ended 31 December 2012 and 2011.
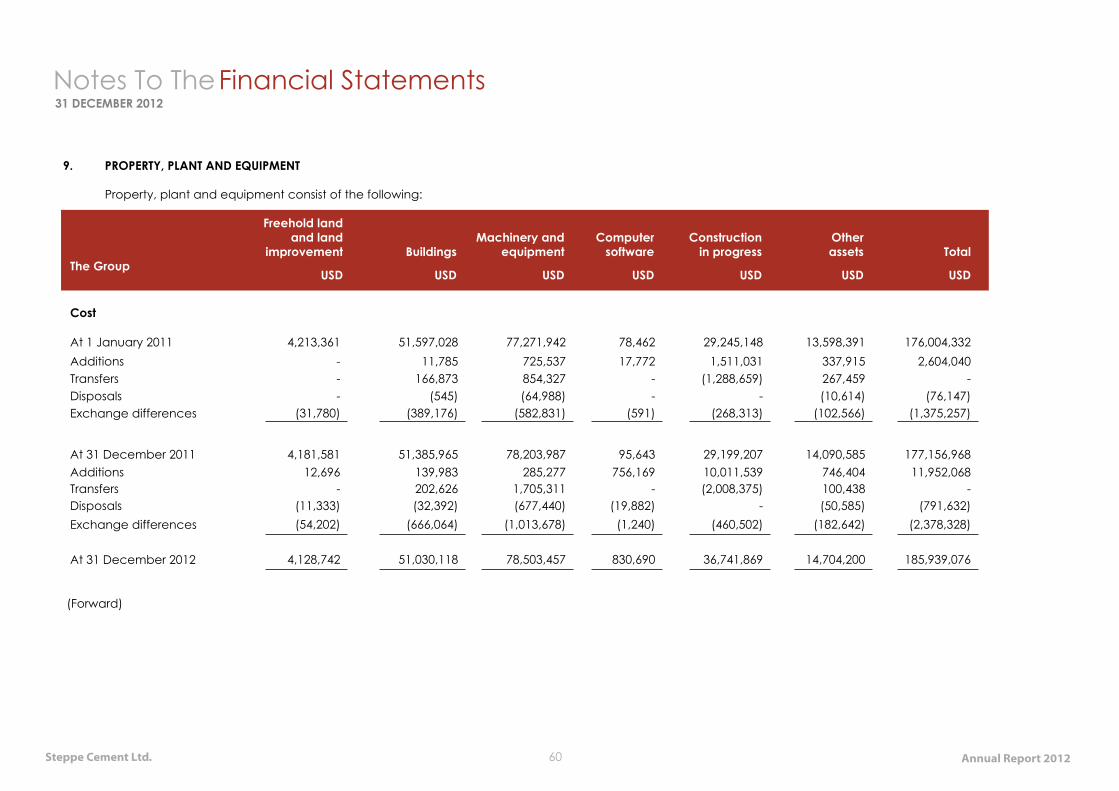
Steppe Cement Ltd. 60 Annual Report 2012
Notes To The Financial Statements31 DECEMBER 2012
9. PROPERTY, PLANT AND EQUIPMENT
Property, plant and equipment consist of the following:
The Group
Freehold land and land
improvement BuildingsMachinery and
equipmentComputer
softwareConstruction
in progressOtherassets Total
USD USD USD USD USD USD USD
Cost
At 1 January 2011 4,213,361 51,597,028 77,271,942 78,462 29,245,148 13,598,391 176,004,332Additions - 11,785 725,537 17,772 1,511,031 337,915 2,604,040Transfers - 166,873 854,327 - (1,288,659) 267,459 -Disposals - (545) (64,988) - - (10,614) (76,147)Exchange differences (31,780) (389,176) (582,831) (591) (268,313) (102,566) (1,375,257)
At 31 December 2011 4,181,581 51,385,965 78,203,987 95,643 29,199,207 14,090,585 177,156,968Additions 12,696 139,983 285,277 756,169 10,011,539 746,404 11,952,068Transfers - 202,626 1,705,311 - (2,008,375) 100,438 -Disposals (11,333) (32,392) (677,440) (19,882) - (50,585) (791,632)Exchange differences (54,202) (666,064) (1,013,678) (1,240) (460,502) (182,642) (2,378,328)
At 31 December 2012 4,128,742 51,030,118 78,503,457 830,690 36,741,869 14,704,200 185,939,076
(Forward)
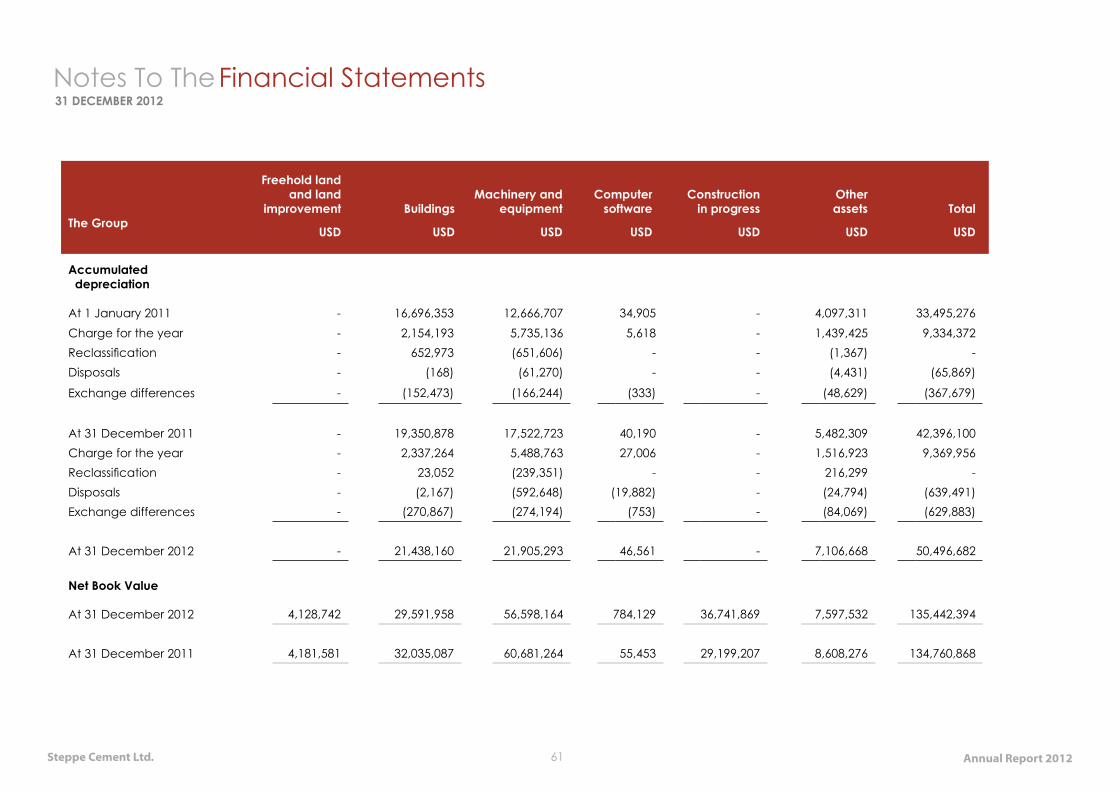
Steppe Cement Ltd. 61 Annual Report 2012
Notes To The Financial Statements31 DECEMBER 2012
The Group
Freehold land and land
improvement BuildingsMachinery and
equipmentComputer
softwareConstruction
in progressOtherassets Total
USD USD USD USD USD USD USD
Accumulated depreciation
At 1 January 2011 - 16,696,353 12,666,707 34,905 - 4,097,311 33,495,276Charge for the year - 2,154,193 5,735,136 5,618 - 1,439,425 9,334,372Reclassification - 652,973 (651,606) - - (1,367) -Disposals - (168) (61,270) - - (4,431) (65,869)
Exchange differences - (152,473) (166,244) (333) - (48,629) (367,679)
At 31 December 2011 - 19,350,878 17,522,723 40,190 - 5,482,309 42,396,100Charge for the year - 2,337,264 5,488,763 27,006 - 1,516,923 9,369,956Reclassification - 23,052 (239,351) - - 216,299 -Disposals - (2,167) (592,648) (19,882) - (24,794) (639,491)Exchange differences - (270,867) (274,194) (753) - (84,069) (629,883)
At 31 December 2012 - 21,438,160 21,905,293 46,561 - 7,106,668 50,496,682
Net Book Value
At 31 December 2012 4,128,742 29,591,958 56,598,164 784,129 36,741,869 7,597,532 135,442,394
At 31 December 2011 4,181,581 32,035,087 60,681,264 55,453 29,199,207 8,608,276 134,760,868
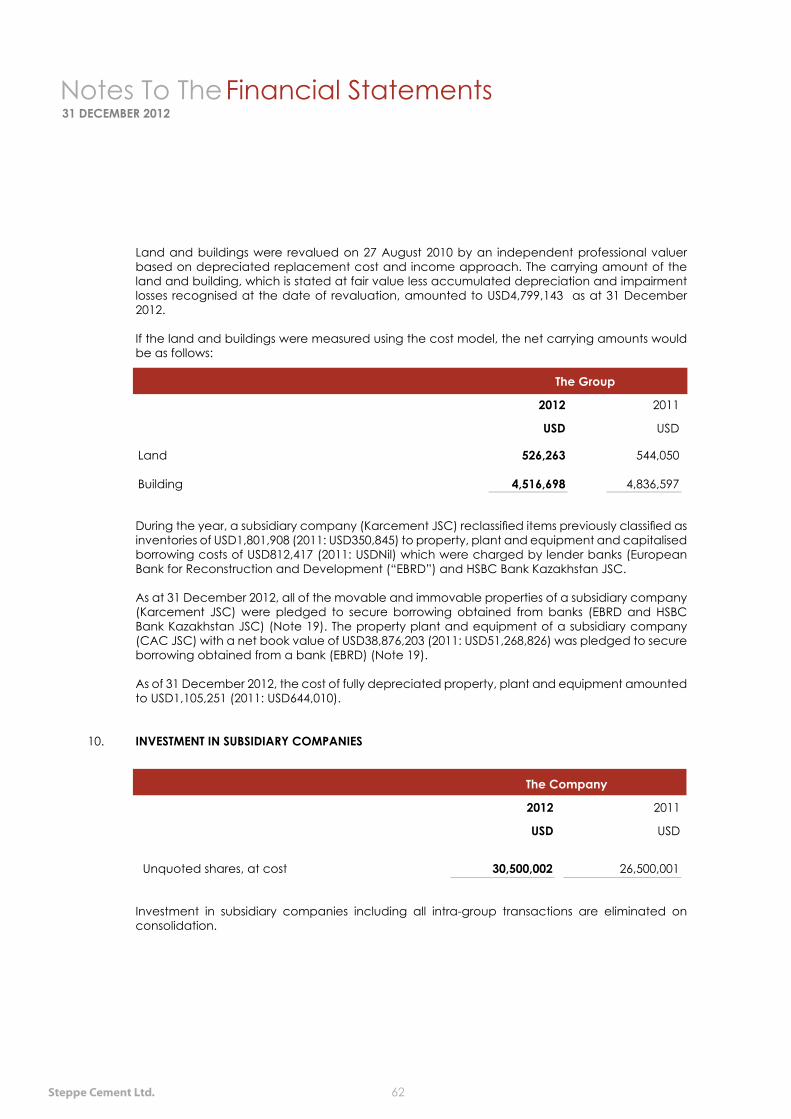
Notes To The Financial Statements31 DECEMBER 2012
Steppe Cement Ltd. 62
Land and buildings were revalued on 27 August 2010 by an independent professional valuer based on depreciated replacement cost and income approach. The carrying amount of the land and building, which is stated at fair value less accumulated depreciation and impairment losses recognised at the date of revaluation, amounted to USD4,799,143 as at 31 December 2012.
If the land and buildings were measured using the cost model, the net carrying amounts would be as follows:
The Group
2012 2011
USD USD
Land
Building
526,263
4,516,698
544,050
4,836,597
During the year, a subsidiary company (Karcement JSC) reclassified items previously classified as inventories of USD1,801,908 (2011: USD350,845) to property, plant and equipment and capitalised borrowing costs of USD812,417 (2011: USDNil) which were charged by lender banks (European Bank for Reconstruction and Development (“EBRD”) and HSBC Bank Kazakhstan JSC.
As at 31 December 2012, all of the movable and immovable properties of a subsidiary company (Karcement JSC) were pledged to secure borrowing obtained from banks (EBRD and HSBC Bank Kazakhstan JSC) (Note 19). The property plant and equipment of a subsidiary company (CAC JSC) with a net book value of USD38,876,203 (2011: USD51,268,826) was pledged to secure borrowing obtained from a bank (EBRD) (Note 19).
As of 31 December 2012, the cost of fully depreciated property, plant and equipment amounted to USD1,105,251 (2011: USD644,010).
10. INVESTMENT IN SUBSIDIARY COMPANIES
The Company
2012 2011
USD USD
Unquoted shares, at cost 30,500,002 26,500,001
Investment in subsidiary companies including all intra-group transactions are eliminated on consolidation.
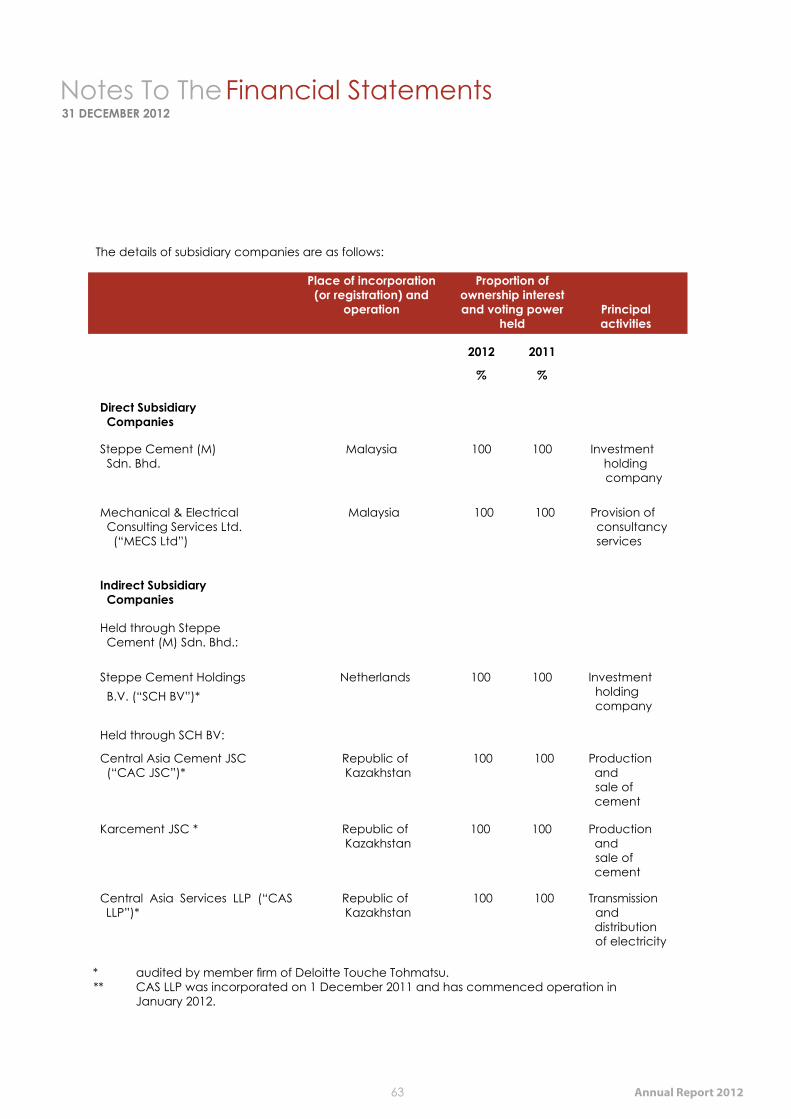
Notes To The Financial Statements31 DECEMBER 2012
Annual Report 201263
The details of subsidiary companies are as follows:
Place of incorporation (or registration) and
operation
Proportion of ownership interest and voting power
heldPrincipal activities
2012 2011
% %
Direct Subsidiary Companies
Steppe Cement (M) Sdn. Bhd.
Malaysia 100 100 Investment holding
company
Mechanical & Electrical Consulting Services Ltd. (“MECS Ltd”)
Malaysia 100 100 Provision of consultancy services
Indirect Subsidiary Companies
Held through Steppe Cement (M) Sdn. Bhd.:
Steppe Cement Holdings B.V. (“SCH BV”)*
Netherlands 100 100 Investment holding company
Held through SCH BV:
Central Asia Cement JSC (“CAC JSC”)*
Republic of Kazakhstan
100 100 Production and
sale of cement
Karcement JSC * Republic of Kazakhstan
100 100 Production and
sale of cement
Central Asia Services LLP (“CAS LLP”)*
Republic of Kazakhstan
100 100 Transmission and distribution
of electricity
* audited by member firm of Deloitte Touche Tohmatsu.** CAS LLP was incorporated on 1 December 2011 and has commenced operation in January 2012.
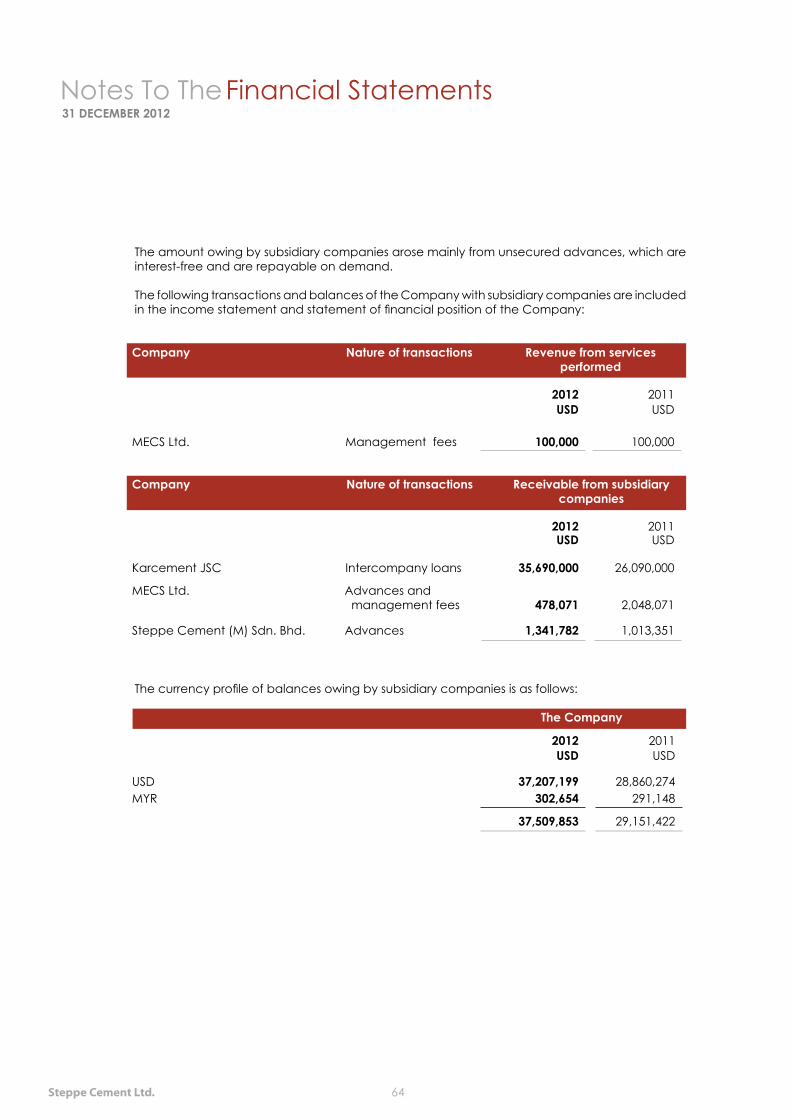
Notes To The Financial Statements31 DECEMBER 2012
Steppe Cement Ltd. 64
The amount owing by subsidiary companies arose mainly from unsecured advances, which are interest-free and are repayable on demand.
The following transactions and balances of the Company with subsidiary companies are included in the income statement and statement of financial position of the Company:
Company Nature of transactions Revenue from services performed
2012 2011USD USD
MECS Ltd. Management fees 100,000 100,000
Company Nature of transactions Receivable from subsidiary companies
2012 2011USD USD
Karcement JSC Intercompany loans 35,690,000 26,090,000
MECS Ltd. Advances and management fees 478,071 2,048,071
Steppe Cement (M) Sdn. Bhd. Advances 1,341,782 1,013,351
The currency profile of balances owing by subsidiary companies is as follows:
The Company
2012 2011USD USD
USD 37,207,199 28,860,274MYR 302,654 291,148
37,509,853 29,151,422
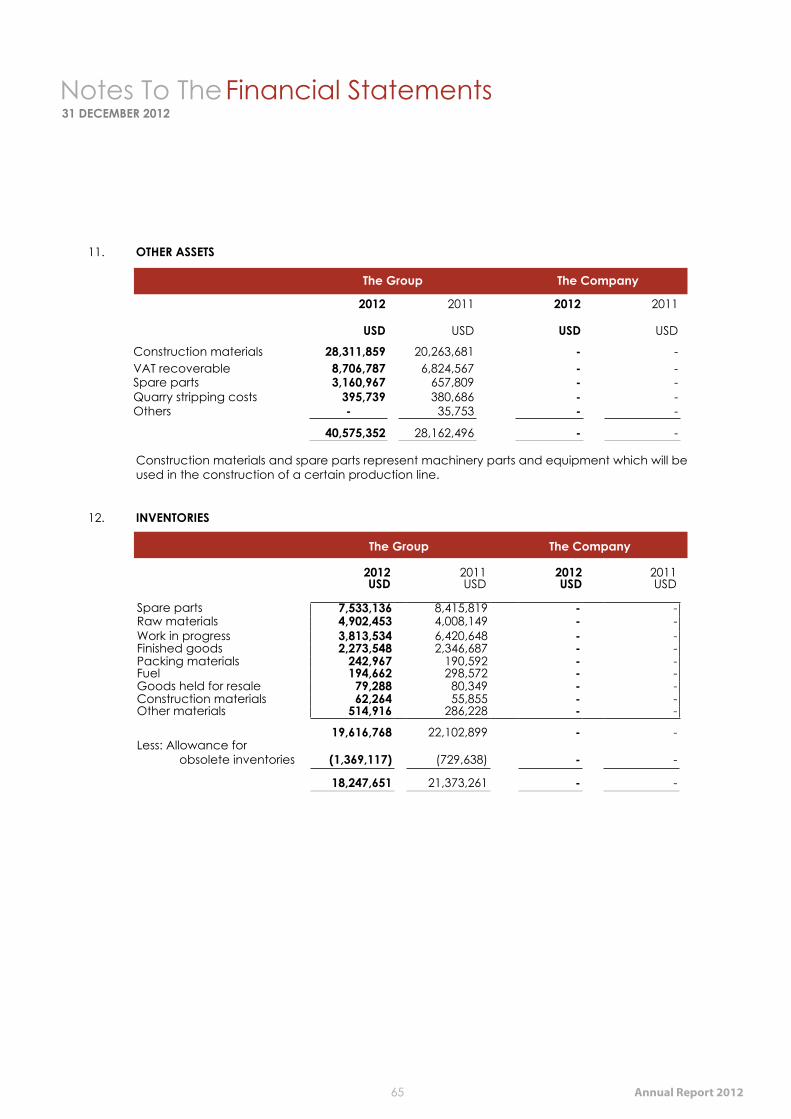
Notes To The Financial Statements31 DECEMBER 2012
Annual Report 201265
11. OTHER ASSETS
The Group The Company
2012 2011 2012 2011
USD USD USD USD
Construction materials 28,311,859 20,263,681 - -VAT recoverable 8,706,787 6,824,567 - -Spare parts 3,160,967 657,809 - -Quarry stripping costs 395,739 380,686 - -Others - 35,753 - -
40,575,352 28,162,496 - -
Construction materials and spare parts represent machinery parts and equipment which will be used in the construction of a certain production line.
12. INVENTORIES
The Group The Company
2012 2011 2012 2011USD USD USD USD
Spare parts 7,533,136 8,415,819 - -Raw materials 4,902,453 4,008,149 - -Work in progress 3,813,534 6,420,648 - -Finished goods 2,273,548 2,346,687 - -Packing materials 242,967 190,592 - -Fuel 194,662 298,572 - -Goods held for resale 79,288 80,349 - -Construction materials 62,264 55,855 - -Other materials 514,916 286,228 - -
19,616,768 22,102,899 - -Less: Allowance for
obsolete inventories (1,369,117) (729,638) - -
18,247,651 21,373,261 - -
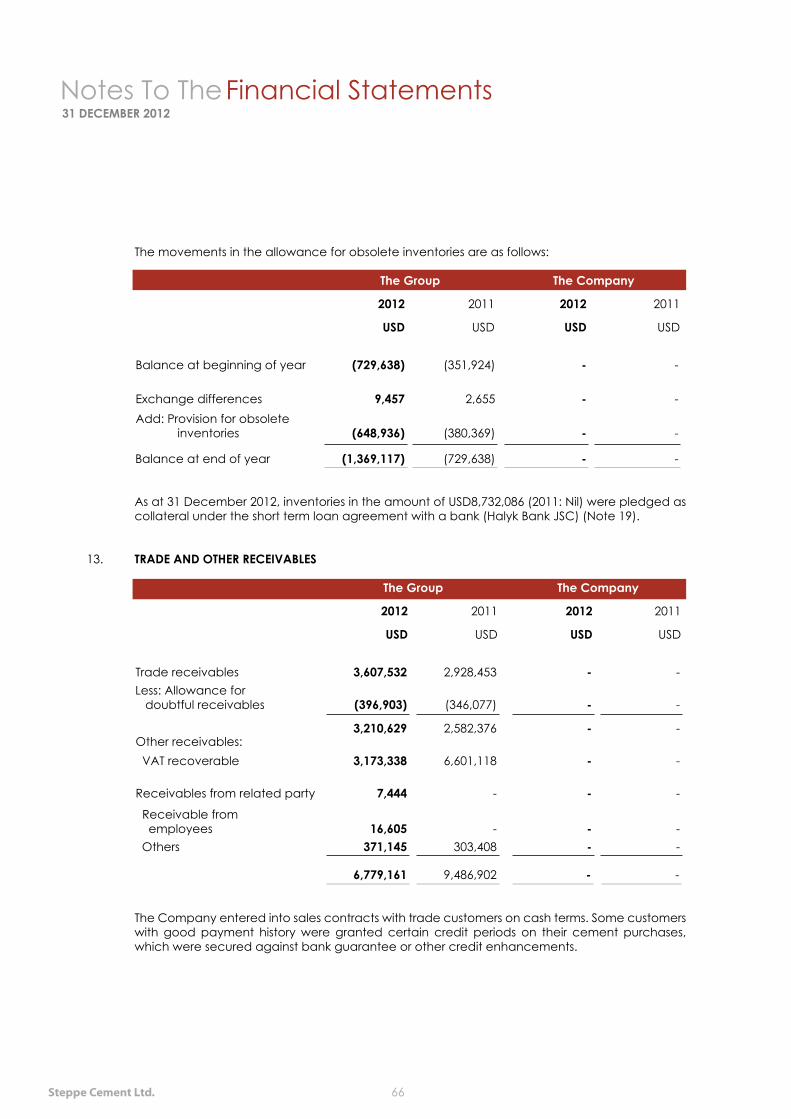
Notes To The Financial Statements31 DECEMBER 2012
Steppe Cement Ltd. 66
The movements in the allowance for obsolete inventories are as follows:
The Group The Company
2012 2011 2012 2011
USD USD USD USD
Balance at beginning of year (729,638) (351,924) - -
Exchange differences 9,457 2,655 - -Add: Provision for obsolete
inventories (648,936) (380,369) - -
Balance at end of year (1,369,117) (729,638) - -
As at 31 December 2012, inventories in the amount of USD8,732,086 (2011: Nil) were pledged as collateral under the short term loan agreement with a bank (Halyk Bank JSC) (Note 19).
13. TRADE AND OTHER RECEIVABLES
The Group The Company
2012 2011 2012 2011
USD USD USD USD
Trade receivables 3,607,532 2,928,453 - - Less: Allowance for doubtful receivables (396,903) (346,077) - -
3,210,629 2,582,376 - -Other receivables: VAT recoverable 3,173,338 6,601,118 - - Receivables from related party 7,444 - - -
Receivable from employees 16,605 - - - Others 371,145 303,408 - -
6,779,161 9,486,902 - -
The Company entered into sales contracts with trade customers on cash terms. Some customers with good payment history were granted certain credit periods on their cement purchases, which were secured against bank guarantee or other credit enhancements.
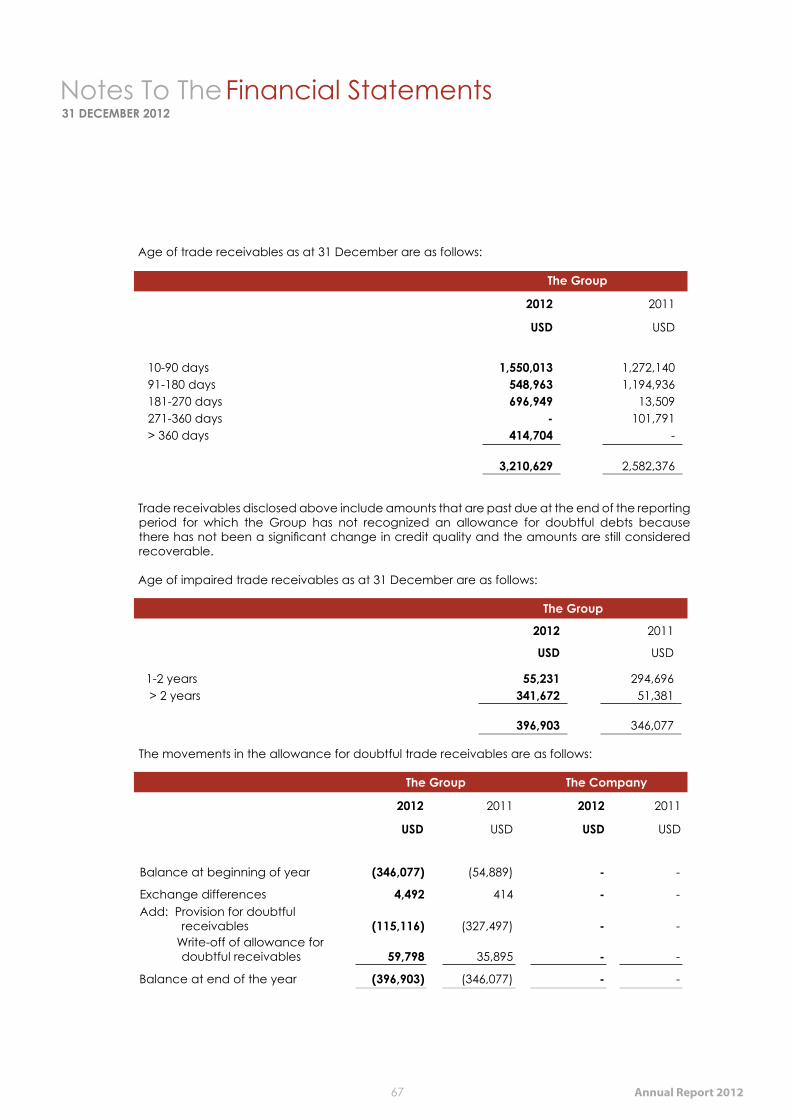
Notes To The Financial Statements31 DECEMBER 2012
Annual Report 201267
Age of trade receivables as at 31 December are as follows:
The Group
2012 2011
USD USD
10-90 days 1,550,013 1,272,14091-180 days 548,963 1,194,936181-270 days 696,949 13,509271-360 days - 101,791> 360 days 414,704 -
3,210,629 2,582,376
Trade receivables disclosed above include amounts that are past due at the end of the reporting period for which the Group has not recognized an allowance for doubtful debts because there has not been a significant change in credit quality and the amounts are still considered recoverable.
Age of impaired trade receivables as at 31 December are as follows:
The Group
2012 2011
USD USD
1-2 years 55,231 294,696 > 2 years 341,672 51,381
396,903 346,077 The movements in the allowance for doubtful trade receivables are as follows:
The Group The Company
2012 2011 2012 2011
USD USD USD USD
Balance at beginning of year (346,077) (54,889) - -
Exchange differences 4,492 414 - -Add: Provision for doubtful
receivables (115,116) (327,497) - -Write-off of allowance for doubtful receivables 59,798 35,895 - -
Balance at end of the year (396,903) (346,077) - -
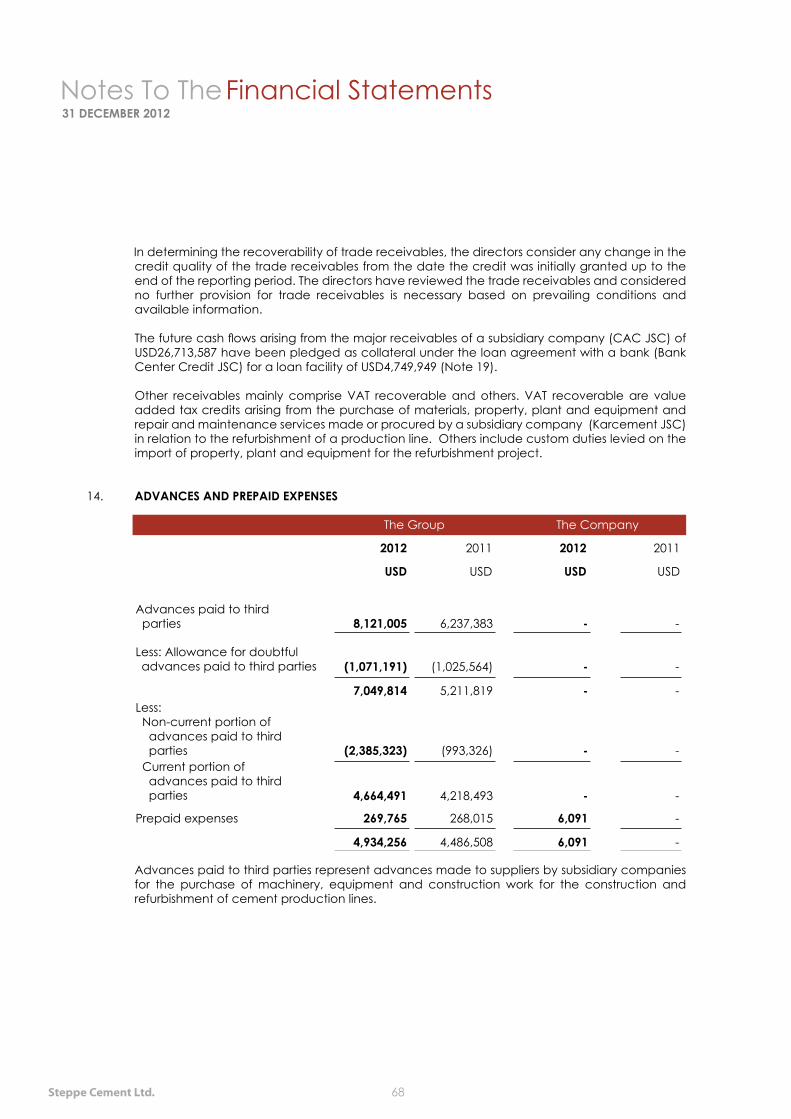
Notes To The Financial Statements31 DECEMBER 2012
Steppe Cement Ltd. 68
In determining the recoverability of trade receivables, the directors consider any change in the credit quality of the trade receivables from the date the credit was initially granted up to the end of the reporting period. The directors have reviewed the trade receivables and considered no further provision for trade receivables is necessary based on prevailing conditions and available information.
The future cash flows arising from the major receivables of a subsidiary company (CAC JSC) of USD26,713,587 have been pledged as collateral under the loan agreement with a bank (Bank Center Credit JSC) for a loan facility of USD4,749,949 (Note 19).
Other receivables mainly comprise VAT recoverable and others. VAT recoverable are value added tax credits arising from the purchase of materials, property, plant and equipment and repair and maintenance services made or procured by a subsidiary company (Karcement JSC) in relation to the refurbishment of a production line. Others include custom duties levied on the import of property, plant and equipment for the refurbishment project.
14. ADVANCES AND PREPAID EXPENSES
The Group The Company
2012 2011 2012 2011
USD USD USD USD
Advances paid to third parties 8,121,005 6,237,383 - -
Less: Allowance for doubtful advances paid to third parties (1,071,191) (1,025,564) - -
7,049,814 5,211,819 - -Less: Non-current portion of advances paid to third parties (2,385,323) (993,326) - - Current portion of advances paid to third parties 4,664,491 4,218,493 - -
Prepaid expenses 269,765 268,015 6,091 -
4,934,256 4,486,508 6,091 -
Advances paid to third parties represent advances made to suppliers by subsidiary companies for the purchase of machinery, equipment and construction work for the construction and refurbishment of cement production lines.
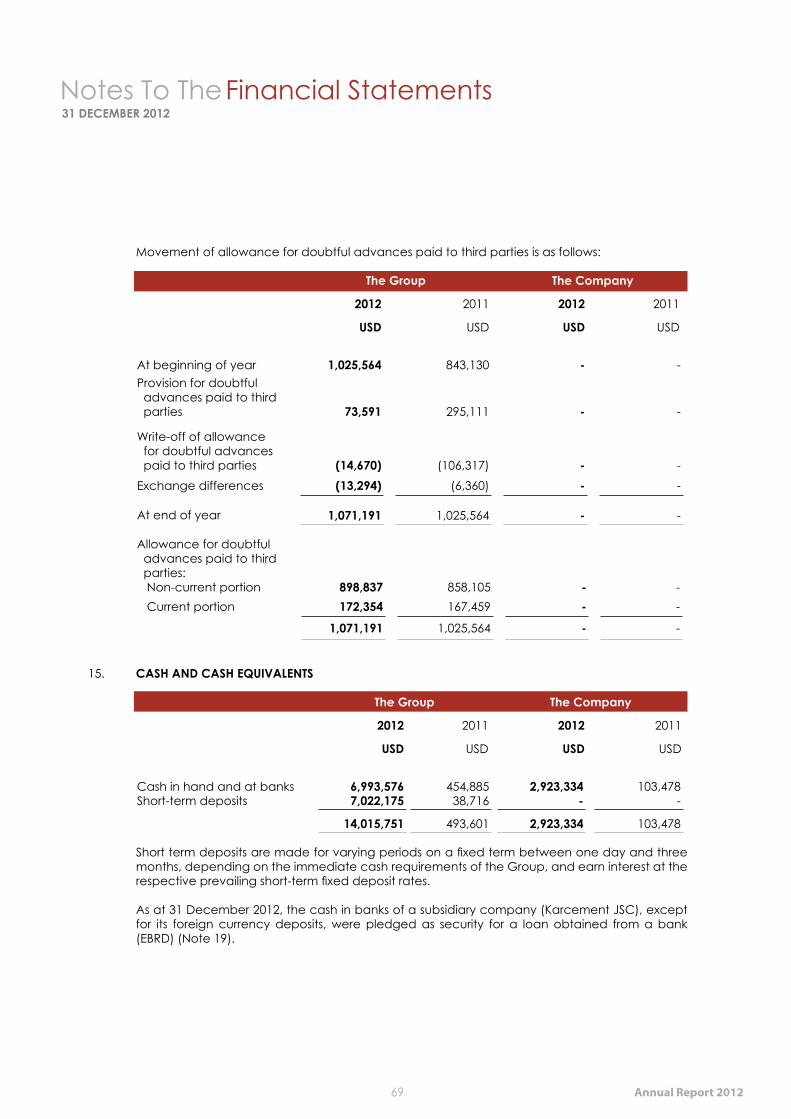
Notes To The Financial Statements31 DECEMBER 2012
Annual Report 201269
Movement of allowance for doubtful advances paid to third parties is as follows:
The Group The Company
2012 2011 2012 2011
USD USD USD USD
At beginning of year 1,025,564 843,130 - -Provision for doubtful advances paid to third parties 73,591 295,111 - -
Write-off of allowance for doubtful advances paid to third parties (14,670) (106,317) - -Exchange differences (13,294) (6,360) - -
At end of year 1,071,191 1,025,564 - -
Allowance for doubtful advances paid to third parties: Non-current portion 898,837 858,105 - - Current portion 172,354 167,459 - -
1,071,191 1,025,564 - -
15. CASH AND CASH EQUIVALENTS
The Group The Company
2012 2011 2012 2011
USD USD USD USD
Cash in hand and at banks 6,993,576 454,885 2,923,334 103,478Short-term deposits 7,022,175 38,716 - -
14,015,751 493,601 2,923,334 103,478
Short term deposits are made for varying periods on a fixed term between one day and three months, depending on the immediate cash requirements of the Group, and earn interest at the respective prevailing short-term fixed deposit rates.
As at 31 December 2012, the cash in banks of a subsidiary company (Karcement JSC), except for its foreign currency deposits, were pledged as security for a loan obtained from a bank (EBRD) (Note 19).
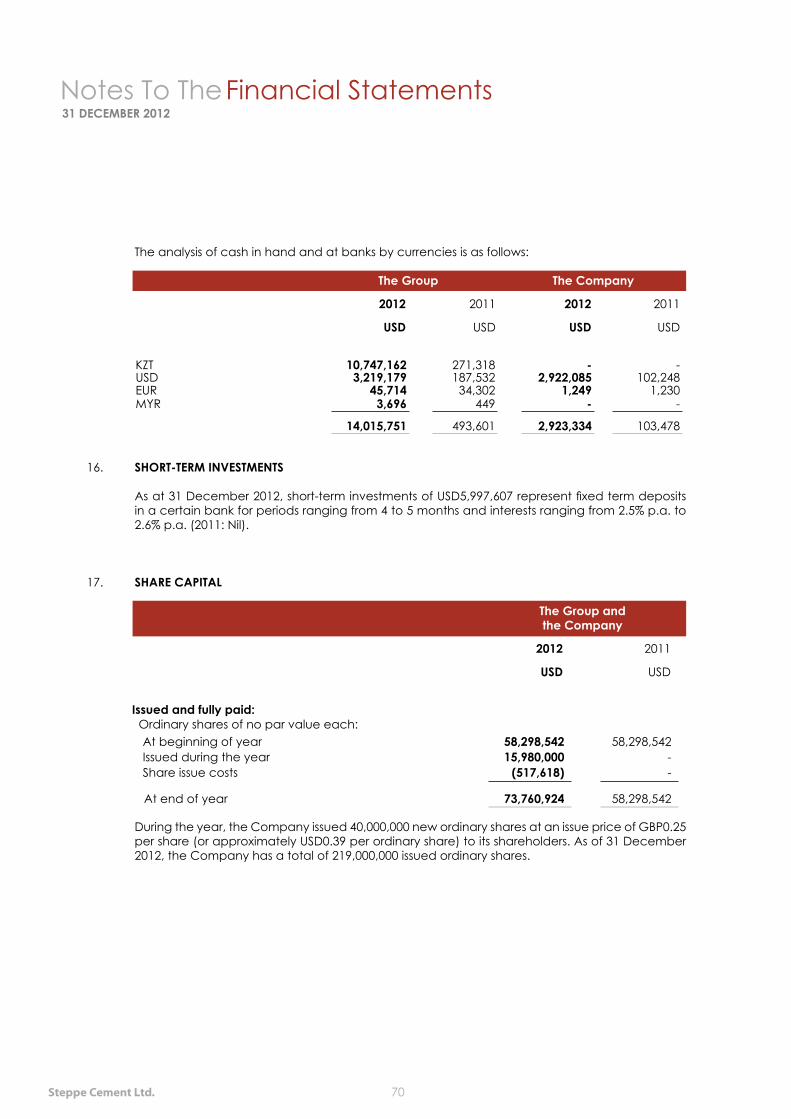
Notes To The Financial Statements31 DECEMBER 2012
Steppe Cement Ltd. 70
The analysis of cash in hand and at banks by currencies is as follows:
The Group The Company
2012 2011 2012 2011
USD USD USD USD
KZT 10,747,162 271,318 - -USD 3,219,179 187,532 2,922,085 102,248EUR 45,714 34,302 1,249 1,230MYR 3,696 449 - -
14,015,751 493,601 2,923,334 103,478
16. SHORT-TERM INVESTMENTS
As at 31 December 2012, short-term investments of USD5,997,607 represent fixed term deposits in a certain bank for periods ranging from 4 to 5 months and interests ranging from 2.5% p.a. to 2.6% p.a. (2011: Nil).
17. SHARE CAPITAL
The Group andthe Company
2012 2011
USD USD
Issued and fully paid: Ordinary shares of no par value each: At beginning of year 58,298,542 58,298,542 Issued during the year 15,980,000 - Share issue costs (517,618) -
At end of year 73,760,924 58,298,542
During the year, the Company issued 40,000,000 new ordinary shares at an issue price of GBP0.25 per share (or approximately USD0.39 per ordinary share) to its shareholders. As of 31 December 2012, the Company has a total of 219,000,000 issued ordinary shares.
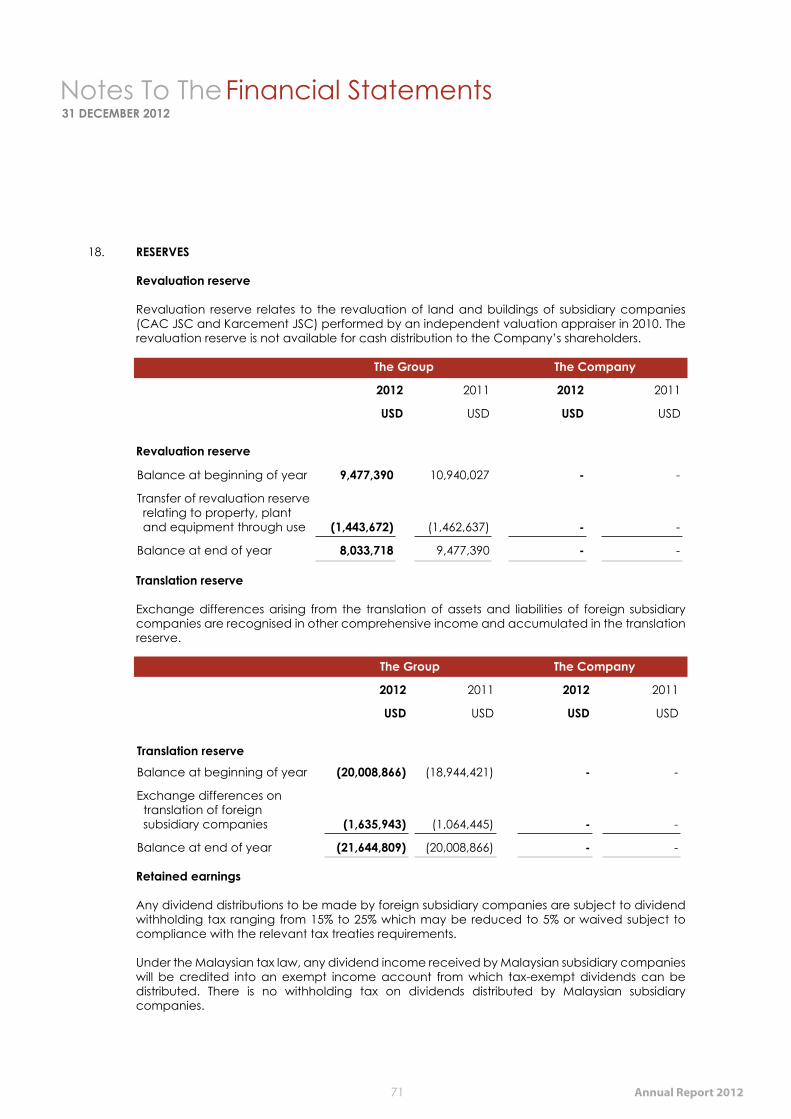
Notes To The Financial Statements31 DECEMBER 2012
Annual Report 201271
18. RESERVES
Revaluation reserve
Revaluation reserve relates to the revaluation of land and buildings of subsidiary companies (CAC JSC and Karcement JSC) performed by an independent valuation appraiser in 2010. The revaluation reserve is not available for cash distribution to the Company’s shareholders.
The Group The Company
2012 2011 2012 2011
USD USD USD USD
Revaluation reserve
Balance at beginning of year 9,477,390 10,940,027 - -
Transfer of revaluation reserve relating to property, plant and equipment through use (1,443,672) (1,462,637) - -
Balance at end of year 8,033,718 9,477,390 - -
Translation reserve
Exchange differences arising from the translation of assets and liabilities of foreign subsidiary companies are recognised in other comprehensive income and accumulated in the translation reserve.
The Group The Company
2012 2011 2012 2011
USD USD USD USD
Translation reserveBalance at beginning of year (20,008,866) (18,944,421) - -
Exchange differences on translation of foreign subsidiary companies (1,635,943) (1,064,445) - -
Balance at end of year (21,644,809) (20,008,866) - -
Retained earnings
Any dividend distributions to be made by foreign subsidiary companies are subject to dividend withholding tax ranging from 15% to 25% which may be reduced to 5% or waived subject to compliance with the relevant tax treaties requirements.
Under the Malaysian tax law, any dividend income received by Malaysian subsidiary companies will be credited into an exempt income account from which tax-exempt dividends can be distributed. There is no withholding tax on dividends distributed by Malaysian subsidiary companies.
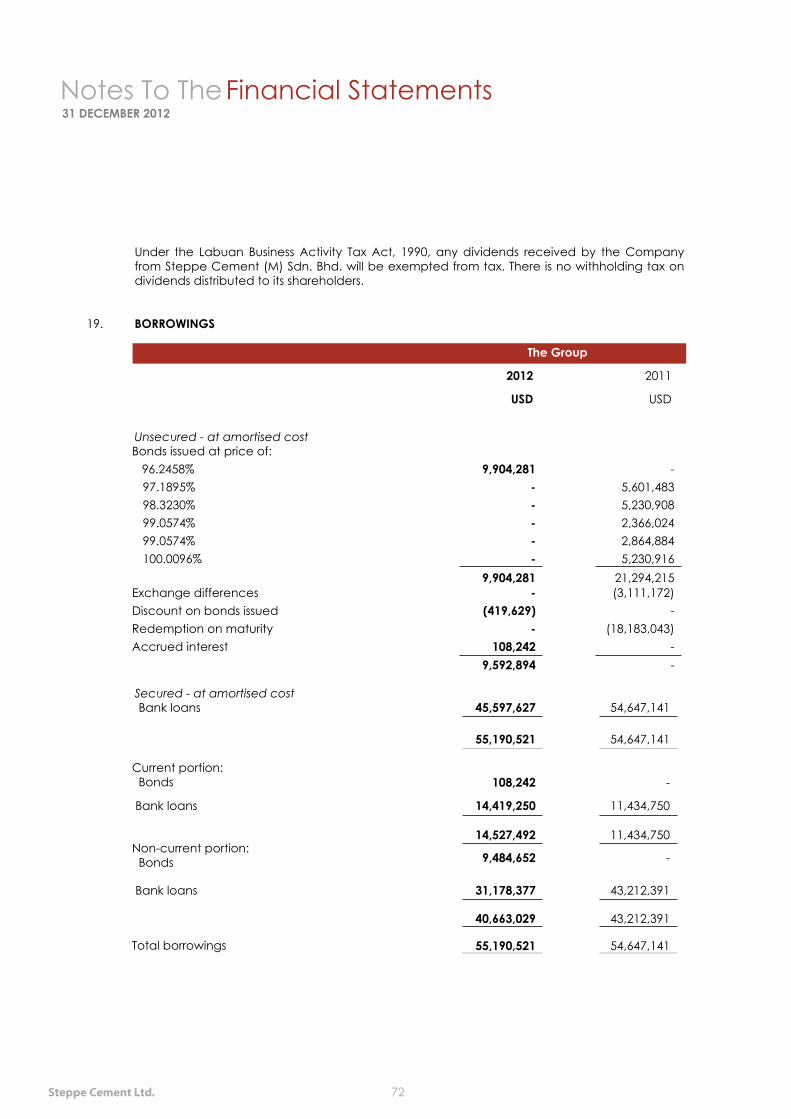
Notes To The Financial Statements31 DECEMBER 2012
Steppe Cement Ltd. 72
Under the Labuan Business Activity Tax Act, 1990, any dividends received by the Company from Steppe Cement (M) Sdn. Bhd. will be exempted from tax. There is no withholding tax on dividends distributed to its shareholders.
19. BORROWINGS
The Group
2012 2011
USD USD
Unsecured - at amortised costBonds issued at price of: 96.2458% 9,904,281 -
97.1895% - 5,601,48398.3230% - 5,230,90899.0574% - 2,366,02499.0574% - 2,864,884100.0096% - 5,230,916
9,904,281 21,294,215Exchange differences - (3,111,172)Discount on bonds issued (419,629) -Redemption on maturity - (18,183,043)Accrued interest 108,242 -
9,592,894 -
Secured - at amortised cost Bank loans 45,597,627 54,647,141
55,190,521 54,647,141
Current portion: Bonds 108,242 - Bank loans
14,419,250 11,434,750
14,527,492 11,434,750Non-current portion: Bonds 9,484,652 - Bank loans 31,178,377 43,212,391
40,663,029 43,212,391
Total borrowings 55,190,521 54,647,141
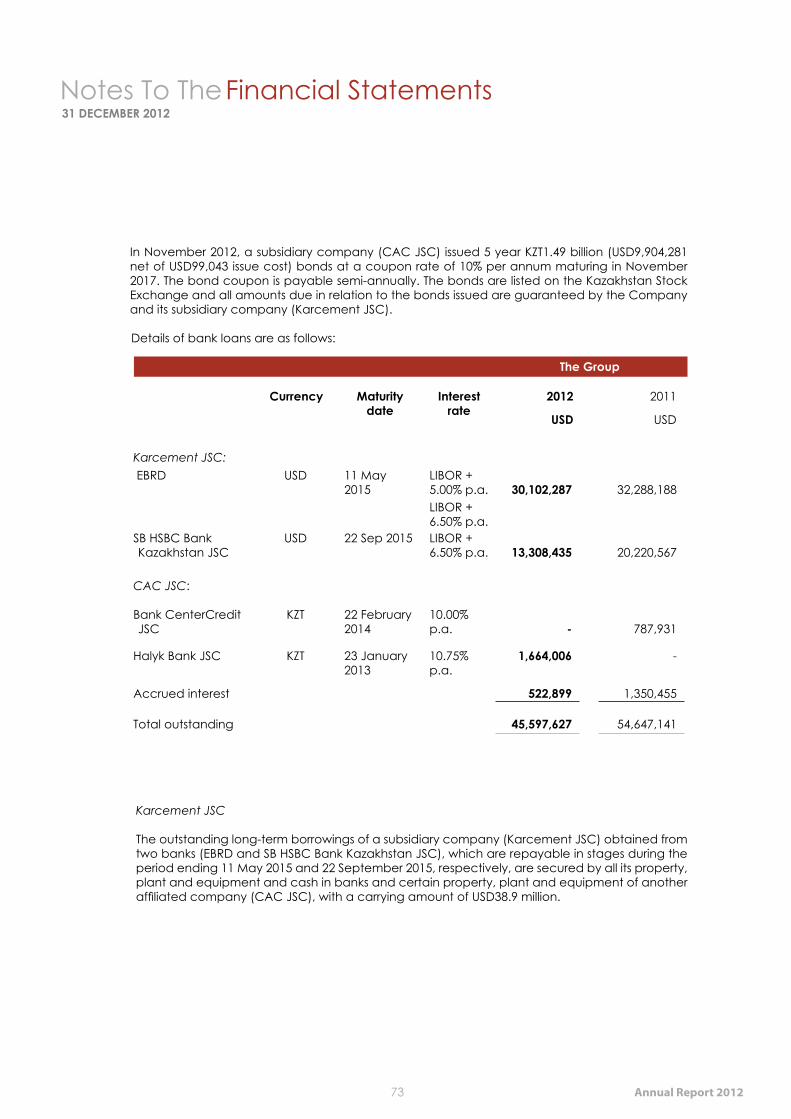
Notes To The Financial Statements31 DECEMBER 2012
Annual Report 201273
In November 2012, a subsidiary company (CAC JSC) issued 5 year KZT1.49 billion (USD9,904,281 net of USD99,043 issue cost) bonds at a coupon rate of 10% per annum maturing in November 2017. The bond coupon is payable semi-annually. The bonds are listed on the Kazakhstan Stock Exchange and all amounts due in relation to the bonds issued are guaranteed by the Company and its subsidiary company (Karcement JSC).
Details of bank loans are as follows:
The Group
Currency Maturity date
Interest rate
2012 2011
USD USD
Karcement JSC: EBRD USD 11 May
2015LIBOR + 5.00% p.a. 30,102,287 32,288,188LIBOR + 6.50% p.a.
SB HSBC Bank Kazakhstan JSC
USD 22 Sep 2015 LIBOR + 6.50% p.a. 13,308,435 20,220,567
CAC JSC:
Bank CenterCredit JSC
KZT 22 February 2014
10.00% p.a. - 787,931
Halyk Bank JSC KZT 23 January 2013
10.75%p.a.
1,664,006 -
Accrued interest 522,899 1,350,455
Total outstanding 45,597,627 54,647,141
Karcement JSC
The outstanding long-term borrowings of a subsidiary company (Karcement JSC) obtained from two banks (EBRD and SB HSBC Bank Kazakhstan JSC), which are repayable in stages during the period ending 11 May 2015 and 22 September 2015, respectively, are secured by all its property, plant and equipment and cash in banks and certain property, plant and equipment of another affiliated company (CAC JSC), with a carrying amount of USD38.9 million.
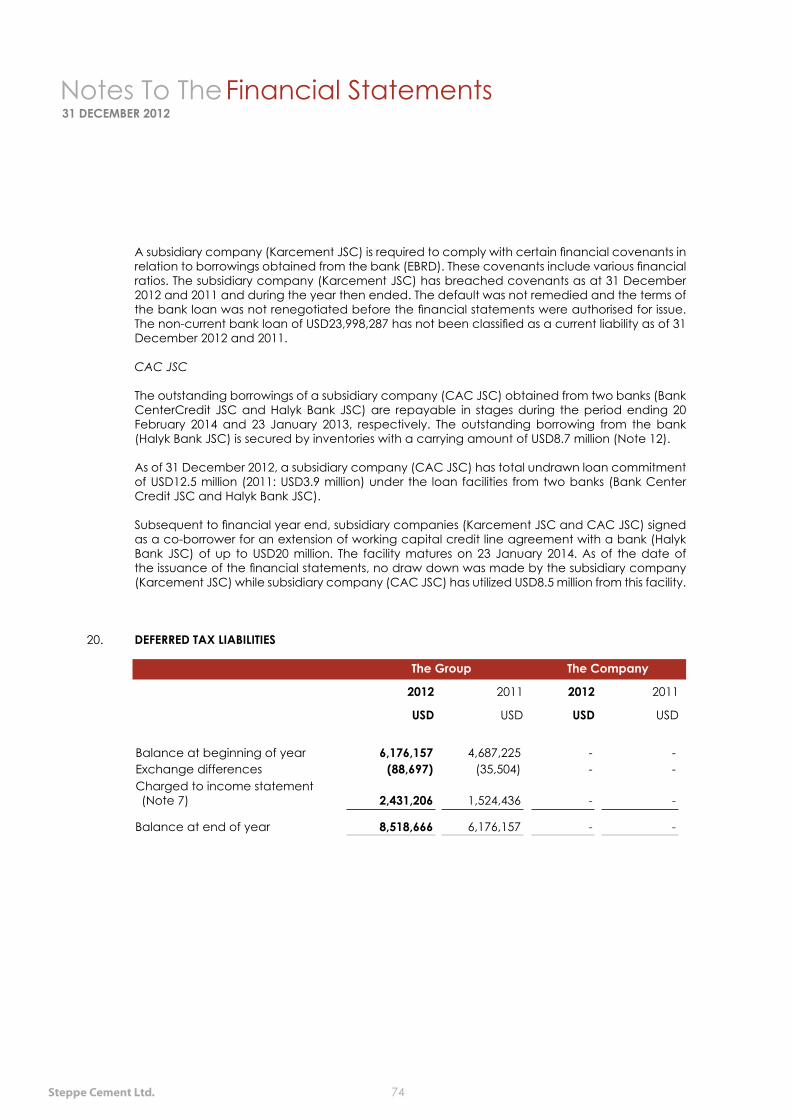
Notes To The Financial Statements31 DECEMBER 2012
Steppe Cement Ltd. 74
A subsidiary company (Karcement JSC) is required to comply with certain financial covenants in relation to borrowings obtained from the bank (EBRD). These covenants include various financial ratios. The subsidiary company (Karcement JSC) has breached covenants as at 31 December 2012 and 2011 and during the year then ended. The default was not remedied and the terms of the bank loan was not renegotiated before the financial statements were authorised for issue. The non-current bank loan of USD23,998,287 has not been classified as a current liability as of 31 December 2012 and 2011.
CAC JSC
The outstanding borrowings of a subsidiary company (CAC JSC) obtained from two banks (Bank CenterCredit JSC and Halyk Bank JSC) are repayable in stages during the period ending 20 February 2014 and 23 January 2013, respectively. The outstanding borrowing from the bank (Halyk Bank JSC) is secured by inventories with a carrying amount of USD8.7 million (Note 12).
As of 31 December 2012, a subsidiary company (CAC JSC) has total undrawn loan commitment of USD12.5 million (2011: USD3.9 million) under the loan facilities from two banks (Bank Center Credit JSC and Halyk Bank JSC).
Subsequent to financial year end, subsidiary companies (Karcement JSC and CAC JSC) signed as a co-borrower for an extension of working capital credit line agreement with a bank (Halyk Bank JSC) of up to USD20 million. The facility matures on 23 January 2014. As of the date of the issuance of the financial statements, no draw down was made by the subsidiary company (Karcement JSC) while subsidiary company (CAC JSC) has utilized USD8.5 million from this facility.
20. DEFERRED TAX LIABILITIES
The Group The Company
2012 2011 2012 2011
USD USD USD USD
Balance at beginning of year 6,176,157 4,687,225 - -Exchange differences (88,697) (35,504) - -Charged to income statement (Note 7) 2,431,206
1,524,436 - -
Balance at end of year 8,518,666 6,176,157 - -

Notes To The Financial Statements31 DECEMBER 2012
Annual Report 201275
The movement in deferred income tax liabilities of the Group are as follows:
Opening balance
Exchange rate differences
Recognised in profit or loss
Closing balance
USD USD USD USD
2012
Temporary differencesDifference in carrying value of property, plant and equipment (12,262,981) 156,045 339,115 (11,767,821)
Inventories 145,929 (3,014) 130,908 273,823Trade receivables 69,217 (993) 11,157 79,381Accrued unused leaves 40,959 (479) (6,095) 34,385Tax payables 39,255 (646) 15,964 54,573Tax losses 5,791,464 (62,216) (2,922,255) 2,806,993
(6,176,157) 88,697 (2,431,206) (8,518,666)
Opening balance
Exchange rate differences
Recognised in profit or loss
Closing balance
USD USD USD USD
2011
Temporary differencesDifference in carrying value of property, plant and equipment (11,630,956) 87,728 (719,753) (12,262,981)Trade receivables 10,979 (83) 58,321 69,217Inventories 70,388 (531) 76,072 145,929Accrued unused leaves 39,832 (300) 1,427 40,959Tax payables 84,447 (637) (44,555) 39,255Tax losses 6,738,085 (50,673) (895,948) 5,791,464
(4,687,225) 35,504 (1,524,436) (6,176,157)

Notes To The Financial Statements31 DECEMBER 2012
Steppe Cement Ltd. 76
21. TRADE AND OTHER PAYABLES
The Group The Company
2012 2011 2012 2011
USD USD USD USD
Trade payables 7,993,991 7,824,728 - -Others 31,694 16,190 - -
8,025,685 7,840,918 - -
The standard credit period granted by creditors ranges from 1 to 30 days.
The analysis of trade and other payables balance by currencies is as follows:
The Group The Company
2012 2011 2012 2011
USD USD USD USD
KZT 4,930,510 6,474,132 - -USD 2,551,223 920,170 - -EUR 297,202 416,681 - -RUB 240,302 29,935 - -GBP 6,448 - - -
8,025,685 7,840,918 - -
22. ACCRUED AND OTHER LIABILITIES
The Group The Company
2012 2011 2012 2011
USD USD USD USD
Accrued electricity charges 3,977,486 1,152,872 - -Advances received from customers 1,039,996 661,553 - -Accrued directors fees 967,208 822,665 967,208 822,665Accrued salaries 589,228 453,336 - -Accrued unused leaves 171,982 204,842 - -Site restoration accrual 92,077 75,601 - -Others 241,838 289,735 151,198 69,914
7,079,815 3,660,604 1,118,406 892,579
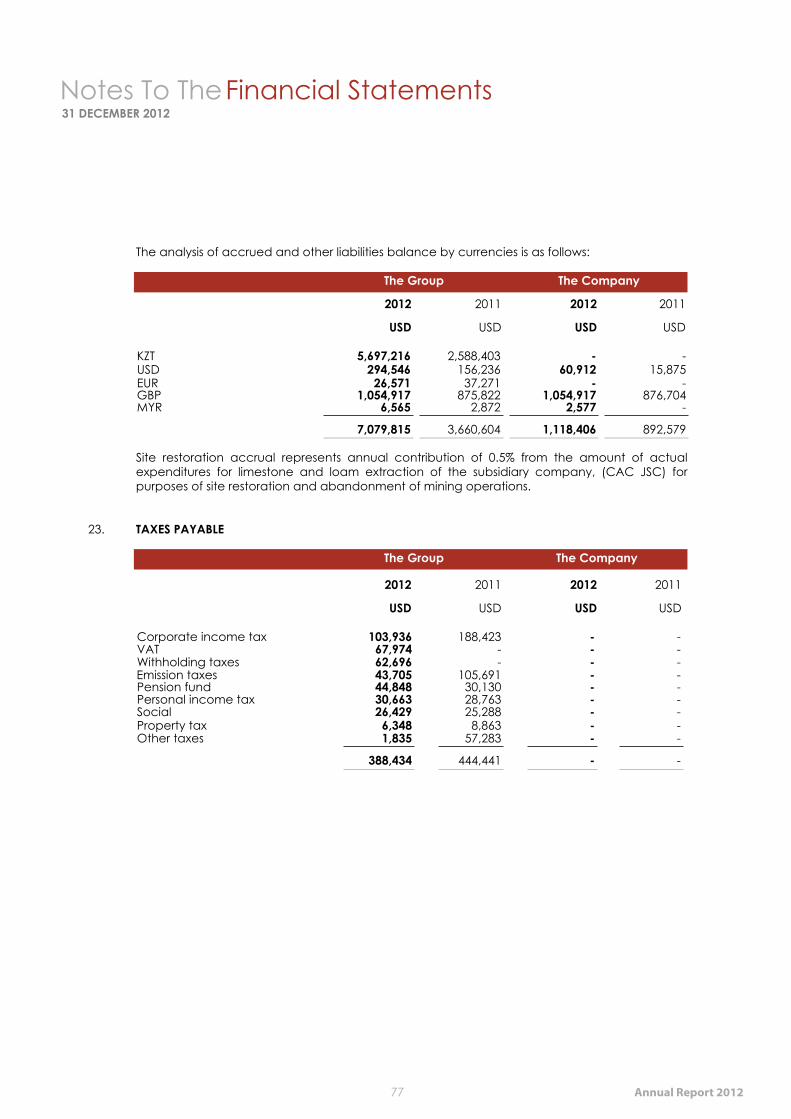
Notes To The Financial Statements31 DECEMBER 2012
Annual Report 201277
The analysis of accrued and other liabilities balance by currencies is as follows:
The Group The Company
2012 2011 2012 2011
USD USD USD USD
KZT 5,697,216 2,588,403 - -USD 294,546 156,236 60,912 15,875EUR 26,571 37,271 - -GBP 1,054,917 875,822 1,054,917 876,704MYR 6,565 2,872 2,577 -
7,079,815 3,660,604 1,118,406 892,579
Site restoration accrual represents annual contribution of 0.5% from the amount of actual expenditures for limestone and loam extraction of the subsidiary company, (CAC JSC) for purposes of site restoration and abandonment of mining operations.
23. TAXES PAYABLE
The Group The Company
2012 2011 2012 2011
USD USD USD USD
Corporate income tax 103,936 188,423 - -VAT 67,974 - - -Withholding taxes 62,696 - - -
Emission taxes 43,705 105,691 - -Pension fund 44,848 30,130 - -Personal income tax 30,663 28,763 - -Social 26,429 25,288 - -Property tax 6,348 8,863 - -Other taxes 1,835 57,283 - -
388,434 444,441 - -
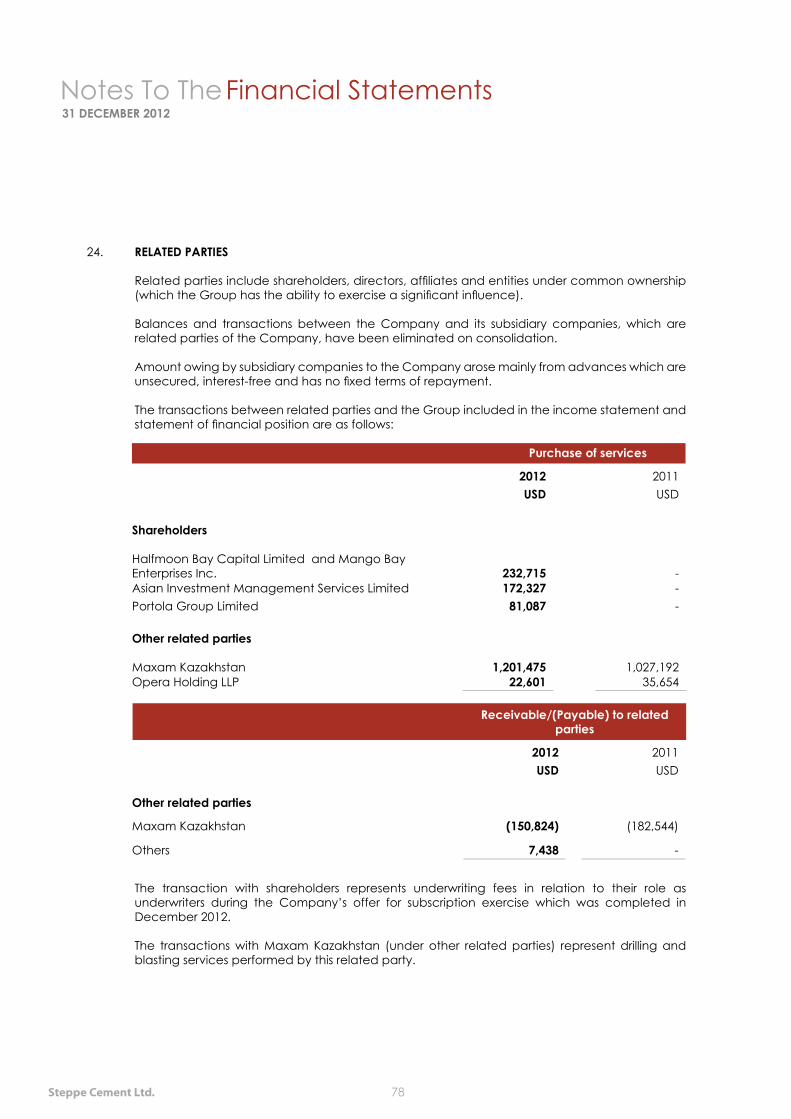
Notes To The Financial Statements31 DECEMBER 2012
Steppe Cement Ltd. 78
24. RELATED PARTIES
Related parties include shareholders, directors, affiliates and entities under common ownership (which the Group has the ability to exercise a significant influence).
Balances and transactions between the Company and its subsidiary companies, which are related parties of the Company, have been eliminated on consolidation.
Amount owing by subsidiary companies to the Company arose mainly from advances which are unsecured, interest-free and has no fixed terms of repayment.
The transactions between related parties and the Group included in the income statement and statement of financial position are as follows:
Purchase of services
2012 2011USD USD
Shareholders Halfmoon Bay Capital Limited and Mango Bay Enterprises Inc. 232,715 -Asian Investment Management Services Limited 172,327 -Portola Group Limited 81,087 -
Other related parties
Maxam Kazakhstan 1,201,475 1,027,192Opera Holding LLP 22,601 35,654
Receivable/(Payable) to related parties
2012 2011USD USD
Other related parties
Maxam Kazakhstan (150,824) (182,544)
Others 7,438 -
The transaction with shareholders represents underwriting fees in relation to their role as underwriters during the Company’s offer for subscription exercise which was completed in December 2012.
The transactions with Maxam Kazakhstan (under other related parties) represent drilling and blasting services performed by this related party.
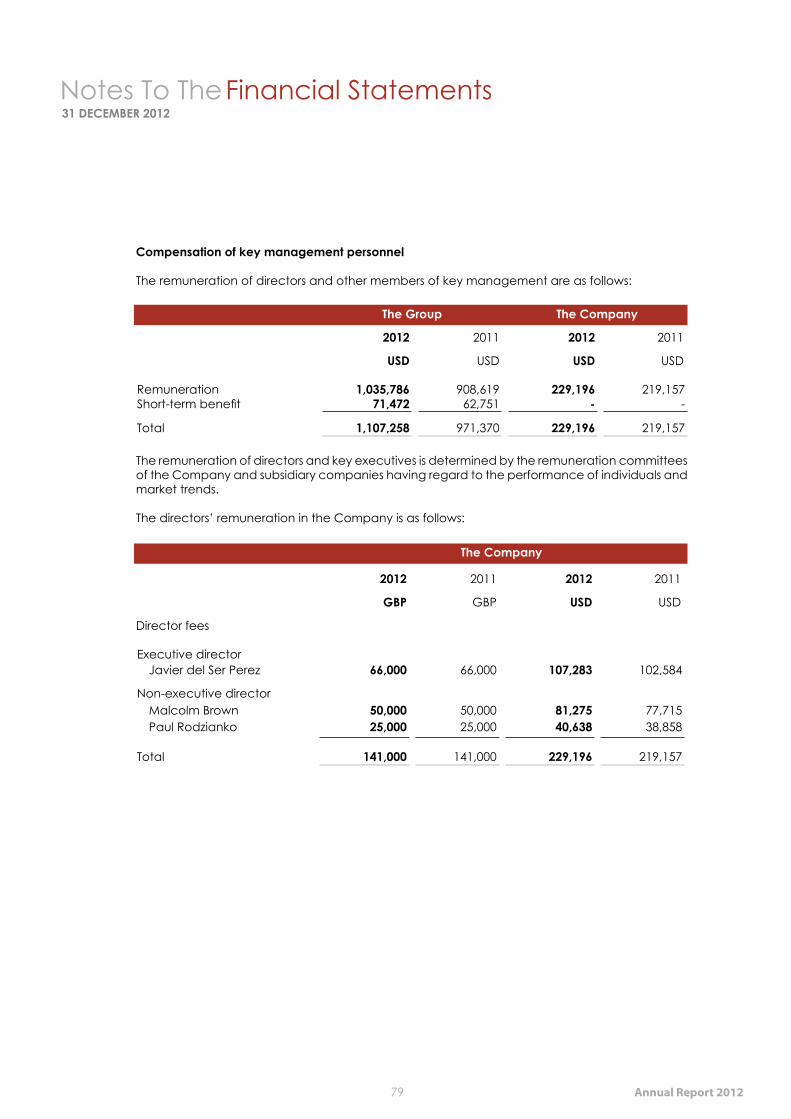
Notes To The Financial Statements31 DECEMBER 2012
Annual Report 201279
Compensation of key management personnel
The remuneration of directors and other members of key management are as follows:
The Group The Company
2012 2011 2012 2011
USD USD USD USD
Remuneration 1,035,786 908,619 229,196 219,157Short-term benefit 71,472 62,751 - -
Total 1,107,258 971,370 229,196 219,157
The remuneration of directors and key executives is determined by the remuneration committees of the Company and subsidiary companies having regard to the performance of individuals and market trends.
The directors’ remuneration in the Company is as follows:
The Company
2012 2011 2012 2011
GBP GBP USD USD
Director fees
Executive directorJavier del Ser Perez 66,000 66,000 107,283 102,584
Non-executive directorMalcolm Brown 50,000 50,000 81,275 77,715Paul Rodzianko 25,000 25,000 40,638 38,858
Total 141,000 141,000 229,196 219,157
Notes To The Financial Statements31 DECEMBER 2012
Steppe Cement Ltd. 80
25. FINANCIAL INSTRUMENTS
Capital Risk Management
The Group’s capital risk management objectives are to maximise value to shareholders and to ensure that the Group’s subsidiary companies will continue to operate as going concern through optimisation of debt and equity balance.
The Group’s capital structure consists of net debt (as detailed in Note 19 offset by cash and cash equivalents) and equity attributable to the shareholders of the Group. Equity attributable to the shareholders of the Group includes share capital, reserves and retained earnings. The Group monitors and reviews its capital structure based on its business and operating requirements.
The Group is not subject to any externally imposed capital requirements.
Financial Risk Management Objectives and Policies
The operations of the Group are subject to a various financial risks which include foreign currency risk, credit risk, liquidity risk and interest rate risk.
The Group continuously manages its exposures to risks and/or costs associated with the financing, investing and operating activities of the Group. (i) Foreign Currency Risk
The Group undertakes trade and non-trade transactions with its trade customers and suppliers which are denominated in foreign currencies. As a result, the amount outstanding is exposed to currency translation risks.
The Group monitors the fluctuations in exchange rate of foreign currencies to limit currency risk.
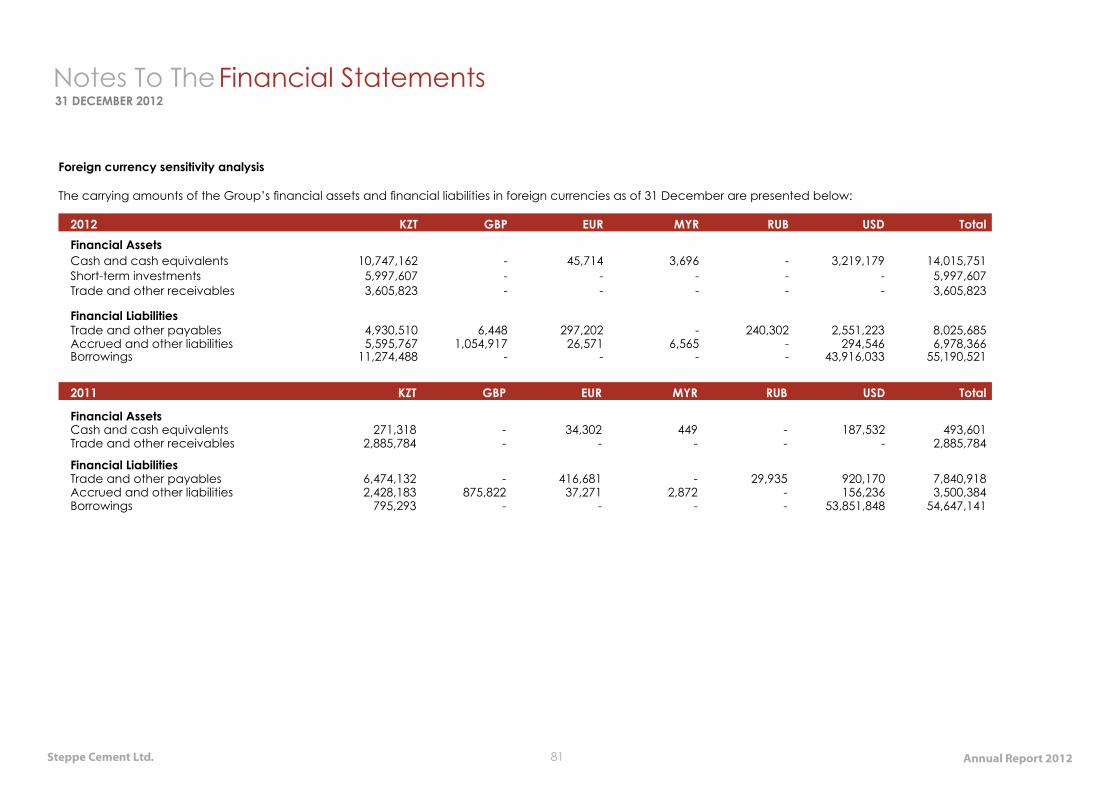
Steppe Cement Ltd. 81 Annual Report 2012
Notes To The Financial Statements31 DECEMBER 2012
Foreign currency sensitivity analysis
The carrying amounts of the Group’s financial assets and financial liabilities in foreign currencies as of 31 December are presented below:
2012 KZT GBP EUR MYR RUB USD TotalFinancial AssetsCash and cash equivalents 10,747,162 - 45,714 3,696 - 3,219,179 14,015,751Short-term investments 5,997,607 - - - - - 5,997,607Trade and other receivables 3,605,823 - - - - - 3,605,823
Financial LiabilitiesTrade and other payables 4,930,510 6,448 297,202 - 240,302 2,551,223 8,025,685Accrued and other liabilities 5,595,767 1,054,917 26,571 6,565 - 294,546 6,978,366Borrowings 11,274,488 - - - - 43,916,033 55,190,521
2011 KZT GBP EUR MYR RUB USD Total
Financial AssetsCash and cash equivalents 271,318 - 34,302 449 - 187,532 493,601Trade and other receivables 2,885,784 - - - - - 2,885,784
Financial LiabilitiesTrade and other payables 6,474,132 - 416,681 - 29,935 920,170 7,840,918Accrued and other liabilities 2,428,183 875,822 37,271 2,872 - 156,236 3,500,384Borrowings 795,293 - - - - 53,851,848 54,647,141
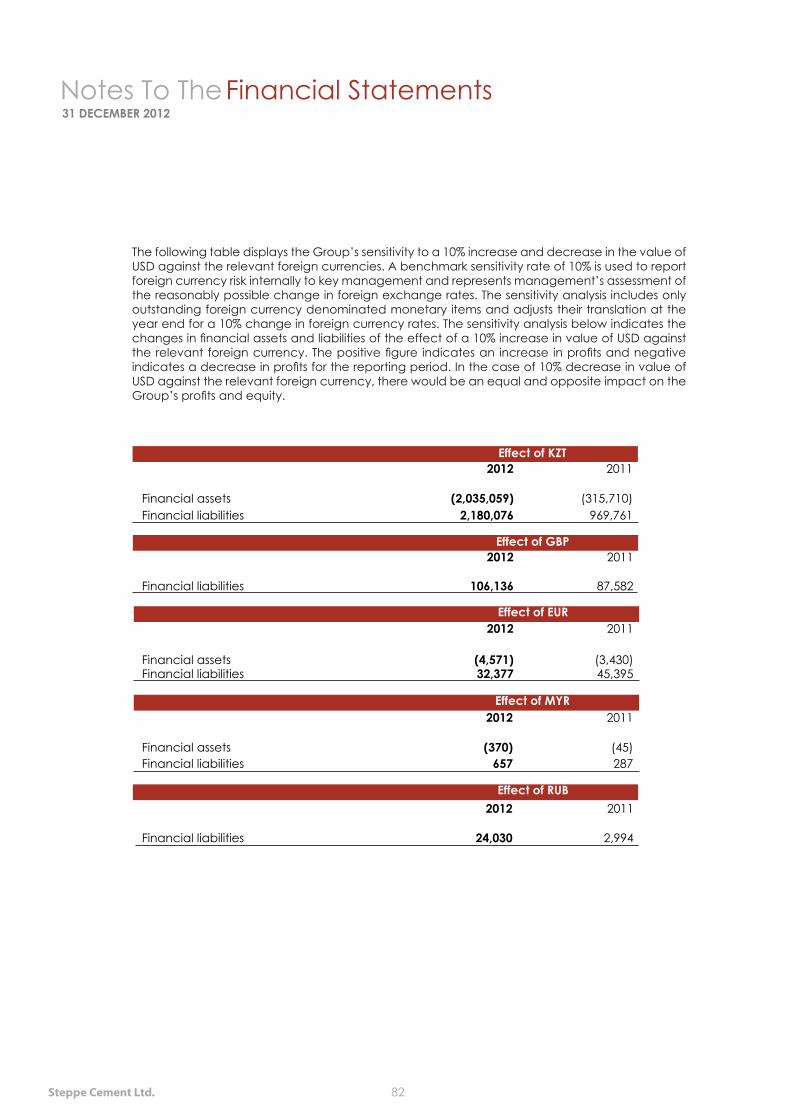
Notes To The Financial Statements31 DECEMBER 2012
Steppe Cement Ltd. 82
The following table displays the Group’s sensitivity to a 10% increase and decrease in the value of USD against the relevant foreign currencies. A benchmark sensitivity rate of 10% is used to report foreign currency risk internally to key management and represents management’s assessment of the reasonably possible change in foreign exchange rates. The sensitivity analysis includes only outstanding foreign currency denominated monetary items and adjusts their translation at the year end for a 10% change in foreign currency rates. The sensitivity analysis below indicates the changes in financial assets and liabilities of the effect of a 10% increase in value of USD against the relevant foreign currency. The positive figure indicates an increase in profits and negative indicates a decrease in profits for the reporting period. In the case of 10% decrease in value of USD against the relevant foreign currency, there would be an equal and opposite impact on the Group’s profits and equity.
Effect of KZT2012 2011
Financial assets (2,035,059) (315,710)Financial liabilities 2,180,076 969,761
Effect of GBP2012 2011
Financial liabilities 106,136 87,582
Effect of EUR2012 2011
Financial assets (4,571) (3,430)Financial liabilities 32,377 45,395
Effect of MYR2012 2011
Financial assets (370) (45)Financial liabilities 657 287
Effect of RUB 2012 2011
Financial liabilities 24,030 2,994
Notes To The Financial Statements31 DECEMBER 2012
Annual Report 201283
(ii) Credit Risk
Credit risk arising as a result of counterparties’ failure to meet the term of contracts with financial instruments of the Group is normally limited to the amounts, if any, by which the amount of liabilities of the counterparties exceeds the Group’s liabilities before these counterparties. The Group’s policy provides for conducting operations with financial instruments with a number of creditworthy counterparties. The maximum exposure to credit risk equals the carrying amount of each financial asset.
Concentration of credit risk can arise when several debts are due from one borrower or group of borrowers with similar borrowing terms for which there is a basis to expect that changes in economic terms or other circumstances can equally affect their capacity to meet their obligations.
The Company’s policy requires constant control over there being adequate credit history for customers with whom transactions are concluded and that transactions do not exceed set credit limits.
Concentration of credit risk on accounts receivable is limited due to large customer profile on the basis of prepayment made against deliverables and sales of cement only.
(iii) Liquidity Risk
Ultimate responsibility for liquidity risk management rests with the Board of Directors, which has built an appropriate liquidity risk management framework for the management of the Group’s short, medium and long-term funding and liquidity management requirements. The Group manages liquidity risk by maintaining adequate reserves, bank loans and accessible credit lines. The Group actively monitors its forecasts and actual cash flows and matches the maturity profiles of financial assets and liabilities to determine any shortfall in cash requirements.
As at 31 December 2012, a subsidiary company (CAC JSC) has total undrawn loan commitment of USD12.5 million under the loan facilities from two banks (Bank Center Credit JSC and Halyk Bank JSC) (Note 19) to meet its funding requirements and to further reduce liquidity risk.
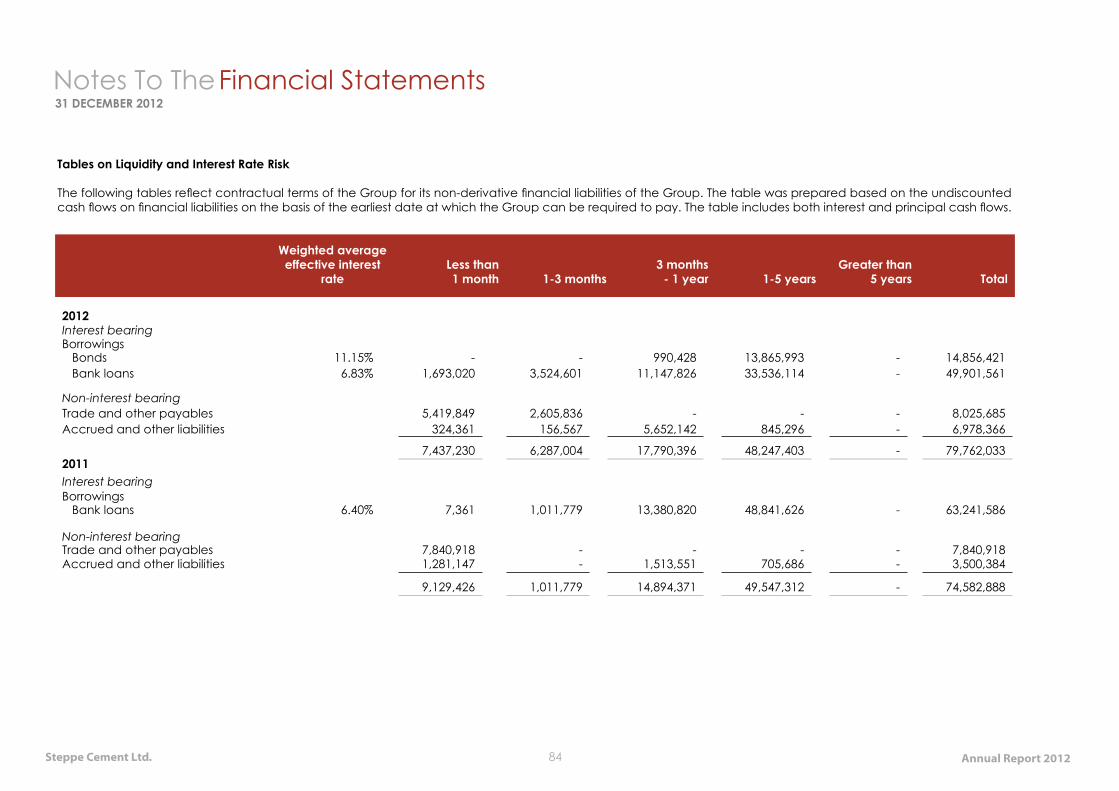
Steppe Cement Ltd. 84 Annual Report 2012
Notes To The Financial Statements31 DECEMBER 2012
Tables on Liquidity and Interest Rate Risk
The following tables reflect contractual terms of the Group for its non-derivative financial liabilities of the Group. The table was prepared based on the undiscounted cash flows on financial liabilities on the basis of the earliest date at which the Group can be required to pay. The table includes both interest and principal cash flows.
Weighted average effective interest
rateLess than1 month 1-3 months
3 months - 1 year 1-5 years
Greater than 5 years Total
2012Interest bearingBorrowings Bonds 11.15% - - 990,428 13,865,993 - 14,856,421 Bank loans 6.83% 1,693,020 3,524,601 11,147,826 33,536,114 - 49,901,561
Non-interest bearingTrade and other payables 5,419,849 2,605,836 - - - 8,025,685Accrued and other liabilities 324,361 156,567 5,652,142 845,296 - 6,978,366
7,437,230 6,287,004 17,790,396 48,247,403 - 79,762,0332011Interest bearingBorrowings Bank loans 6.40% 7,361 1,011,779 13,380,820 48,841,626 - 63,241,586
Non-interest bearingTrade and other payables 7,840,918 - - - - 7,840,918Accrued and other liabilities 1,281,147 - 1,513,551 705,686 - 3,500,384
9,129,426 1,011,779 14,894,371 49,547,312 - 74,582,888
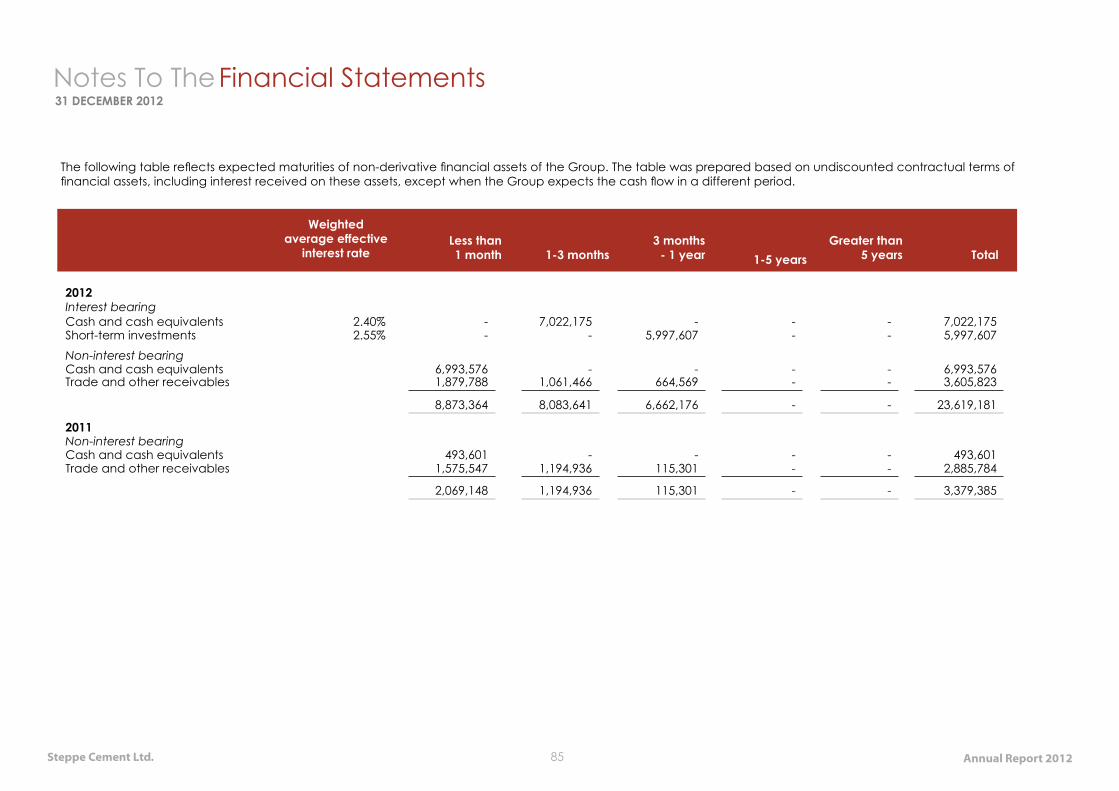
Steppe Cement Ltd. 85 Annual Report 2012
Notes To The Financial Statements31 DECEMBER 2012
The following table reflects expected maturities of non-derivative financial assets of the Group. The table was prepared based on undiscounted contractual terms of financial assets, including interest received on these assets, except when the Group expects the cash flow in a different period.
Weighted average effective
interest rateLess than1 month 1-3 months
3 months - 1 year 1-5 years
Greater than 5 years Total
2012Interest bearingCash and cash equivalents 2.40% - 7,022,175 - - - 7,022,175Short-term investments 2.55% - - 5,997,607 - - 5,997,607Non-interest bearingCash and cash equivalents 6,993,576 - - - - 6,993,576Trade and other receivables 1,879,788 1,061,466 664,569 - - 3,605,823
8,873,364 8,083,641 6,662,176 - - 23,619,181
2011Non-interest bearingCash and cash equivalents 493,601 - - - - 493,601Trade and other receivables 1,575,547 1,194,936 115,301 - - 2,885,784
2,069,148 1,194,936 115,301 - - 3,379,385
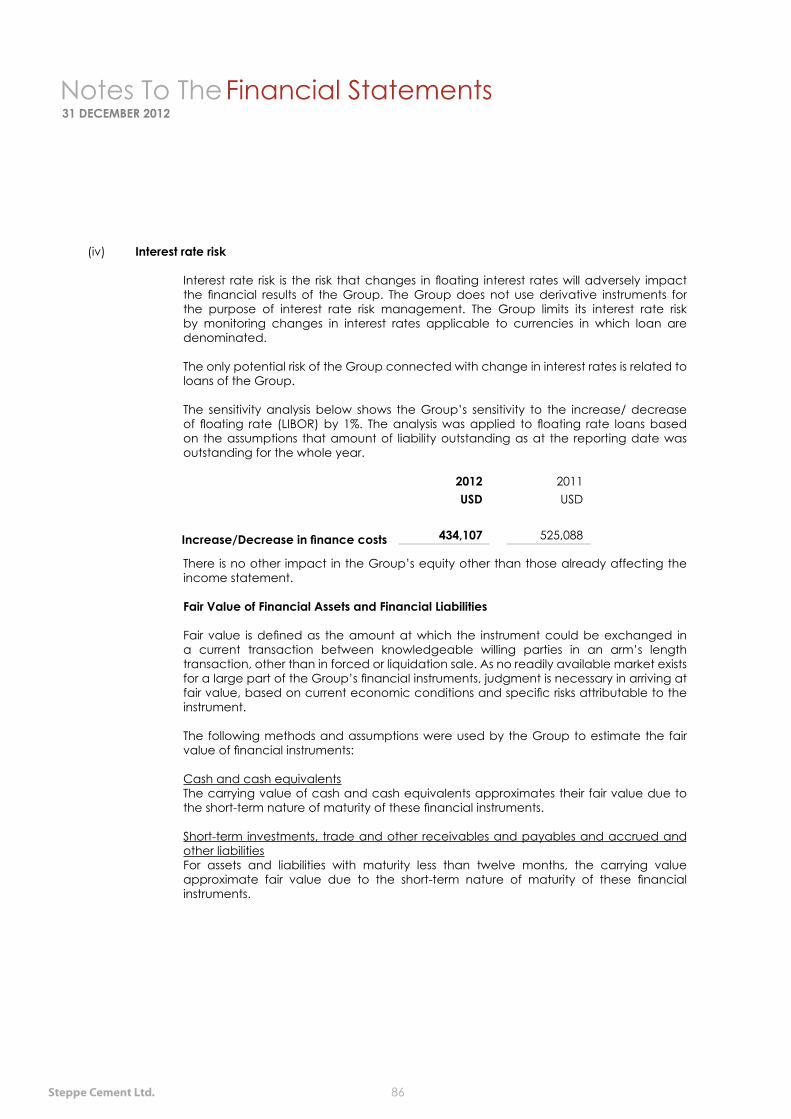
Notes To The Financial Statements31 DECEMBER 2012
Steppe Cement Ltd. 86
(iv) Interest rate risk
Interest rate risk is the risk that changes in floating interest rates will adversely impact the financial results of the Group. The Group does not use derivative instruments for the purpose of interest rate risk management. The Group limits its interest rate risk by monitoring changes in interest rates applicable to currencies in which loan are denominated.
The only potential risk of the Group connected with change in interest rates is related to loans of the Group.
The sensitivity analysis below shows the Group’s sensitivity to the increase/ decrease of floating rate (LIBOR) by 1%. The analysis was applied to floating rate loans based on the assumptions that amount of liability outstanding as at the reporting date was outstanding for the whole year.
2012 2011USD USD
Increase/Decrease in finance costs 434,107 525,088
There is no other impact in the Group’s equity other than those already affecting the income statement.
Fair Value of Financial Assets and Financial Liabilities
Fair value is defined as the amount at which the instrument could be exchanged in a current transaction between knowledgeable willing parties in an arm’s length transaction, other than in forced or liquidation sale. As no readily available market exists for a large part of the Group’s financial instruments, judgment is necessary in arriving at fair value, based on current economic conditions and specific risks attributable to the instrument.
The following methods and assumptions were used by the Group to estimate the fair value of financial instruments:
Cash and cash equivalentsThe carrying value of cash and cash equivalents approximates their fair value due to the short-term nature of maturity of these financial instruments.
Short-term investments, trade and other receivables and payables and accrued and other liabilitiesFor assets and liabilities with maturity less than twelve months, the carrying value approximate fair value due to the short-term nature of maturity of these financial instruments.
Notes To The Financial Statements31 DECEMBER 2012
Annual Report 201287
BorrowingsThe fair values of the borrowings are estimated by discounting expected future cash flows at market interest rates prevailing at the end of the relevant year with similar maturities adjusted by credit risk.
As at 31 December 2012 and 2011, the fair values of financial assets and financial liabilities approximate their carrying values.
26. CONTINGENCIES
Litigation - The Group has been and continues to be the subject of legal proceedings and adjudications. The directors are of the opinion that the resolution of any legal claim will have no material financial impact to the Group.
Site restoration - A subsidiary company is legally required to restore mining sites. The estimated cost of site restoration and abandonment of mining operation are accrued based on 0.5% of certain mining expenditure. The Group is legally required to provide financial support to cover site restoration and abandonment cost if the site restoration cost accrued by a subsidiary is insufficient.
27. COMMITMENTS
The Group has outstanding commitments for the purchases of equipment, materials and services from various suppliers for rehabilitation of its production lines. The Group’s outstanding purchase commitments not provided for as at 31 December 2012 amounted to USD1,635,516 (2011: USD643,962).
28. SEGMENTAL REPORTING
No industry and geographical segmental reporting are presented as the Group’s primary business is in the production and sale of cement which is located in Karaganda region, the Republic of Kazakhstan.
Steppe Cement Ltd. 88
STEPPE CEMENT LTD(Incorporated in Labuan FT, Malaysia under the Labuan Companies Act, 1990)AND ITS SUBSIDIARY COMPANIES
I, JAVIER DEL SER PEREZ, on behalf of the directors of STEPPE CEMENT LTD, state that, in the opinion of the Directors, the accompanying statements of financial position and the related statements of income, changes in equity and cash flows are drawn up in accordance with International Financial Reporting Standards so as to give a true and fair view of the state of affairs of the Group and of the Company as of 31 December 2012 and for the year ended on that date.
Signed in accordance with aresolution of the Directors,
____________________________JAVIER DEL SER PEREZ
Labuan6 May 2013
Statement By A Director
Annual Report 201289
Steppe Cement Ltd. 90
NOTICE IS HEREBY GIVEN that the 2013 ANNUAL GENERAL MEETING of the Company will be held at the office of Steppe Cement Ltd, Suite 10, 10th Floor, West Wing, Rohas Perkasa, 8 Jalan Perak, Kuala Lumpur, Malaysia on Monday, 3 June 2013 at 2.30 p.m. for the purpose of considering and if thought fit, passing the following Resolutions:
ORDINARY RESOLUTION
1. ADOPTION OF AUDITED FINANCIAL STATEMENTS
To receive and adopt the audited financial statements for year ended 31 December 2012.
RESOLUTION 1
2. RE-ELECTION OF DIRECTORS
To re-elect the following Directors who offered themselves for re-election:
2.1 Malcolm Ronald Brown
2.2 Javier Del Ser Perez
2.3 Paul Rodzianko
RESOLUTION 2
To transact any other business of which due notice shall have been given in accordance with the Labuan Companies Act, 1990.
BY ORDER OF THE BOARD
TMF Secretaries Limited(f.k.a. Equity Trust Secretaries Ltd.)Corporate SecretaryLabuan F.T., MalaysiaDate: 13 May 2013
Notice of2013 AGM
Annual Report 201291
Notes:
1. A member of the Company entitled to attend and vote at this meeting is entitled to appoint a proxy to appoint and vote instead of him.
2. The instrument appointing a proxy shall be produced at the place appointed for the meeting before the time for holding the meeting at which the person named in such instrument proposes to vote.
3. The instrument appointing a proxy shall be in writing under the hand of the appointer, unless the appointer, is a corporation or other form of legal entity other than one or more individuals holding as joint owners, in which case the instrument appointing a proxy shall be in writing under the hand of an individual duly authorised by such corporation or legal entity to execute the same.
4. Copies of the proxy form and form of instruction are available at the UK Registrar Computershare Investor Services PLC, The Pavilions, Bridgwater Road BS13 8AE.
S T E P P E C E M E N T LT D( C o r p o r a t e O f f i c e )
1 0 t h F l o o r , R o h a s P e r k a s a , W e s t W i n g N o . 8 , J a l a n P e r a k , 5 0 4 5 0 ,
K u a l a L u m p u r M a l a y s i a .
Te l : + ( 6 0 3 ) 2 1 6 1 7 5 5 2 / 7 5 4 2F a x : + ( 6 0 3 ) 2 1 6 1 8 7 3 0
e m a i l : i r @ s t e p p e c e m e n t . c o mw w w. s t e p p e c e m e n t . c o m