annual report 2012 - fic english-email.pdf · fic annual report 2012 ... your company settled...
TRANSCRIPT

Annual Report 2012


FIC Annual Report 2012
His HighnessSheikh Nawaf Al-Ahmad Al-Jaber Al-Sabah
Crown Prince
His Highness Sheikh Sabah Al-Ahmad Al-Jaber Al-Sabah
Amir of the State of Kuwait


FIC Annual Report 2012
9131618273032333435
36-3738-81
CONTENTS
Mission StatementBoard of Directors’ Report Group Strategic Investments Economic ReportReport Of Fatwa And Shari’a Supervisory BoardAuditor’s ReportConsolidated Income StatementConsolidated Statement Of Comprehensive IncomeConsolidated Statement Of Financial PositionConsolidated Statement Of Changes In EquityConsolidated Cash Flow Statement Notes To The Consolidated Financial Statements

6

7
FIC Annual Report 2012
BOARD MEMBERS
Khalid S. Al-SanaousiChairman and Managing Director
Bader Mohammad Al Qattan Vice Chairman
Bader Ali Abdulla BenaianMember
Khalifa Abdulla Al-AjeelMember
Ahmad Abdulgadir Mohammad Member
Abdulmehsen Hamad Al Hamad Member
Marzouk Fajhan Al MutairiMember

8

9
FIC Annual Report 2012
Uphold Stakeholder,s interests by being a Professionally Managed Financial Institution offering Shari
,a Compliant Investment Products and Services for Local and International Clients
MISSION STATEMENT

10
FATWA AND SHARI’A SUPERVISORY BOARD
Sheikh Dr. Ali Mohyiddeen Al-QaradaghiChairman
Sheikh Dr. Essa Zaki ShaqraMember
Sheikh Dr. Abdulaziz Khalefa Al-QassarMember

11
FIC Annual Report 2012
EXECUTIVE MANAGEMENT
Tareq A. Al-AdsaniDeputy C.E.O
Omar Salem Al-MutawaaDeputy C.E.O
Mohamed Ajami AbdulbakiGeneral Legal Consultant
Ahamed Nawal SaheedVice President - Business Development
& Real Estate Investment
Fahad M. Al-Alloush Vice President - Business Development
& Real Estate Investment
Fawaz AL-AyyarVice President - Asset Management
Mohammad G. AL-Ghaith Vice President- Direct Investment

12

13
FIC Annual Report 2012
Board of Directors’ Report
In the Name of Allah the most Merciful
Dear shareholders,As the global and regional markets lean towards a sort of fragile stability, we meet you today to present to you our main achievements of the company during the past year.
The strong financial base and stable performance of the company in the past years as well as its conservative strategies, have contributed significantly to transform the company from cutback of losses, and addressing liquidity constraints to a stage today where we have recorded profits. Your company settled Kuwaiti Dinar 20 million of debts to two local banks and a GCC bank as part of restructuring of debts during 2012 which has brought down the company’s debt to Kuwaiti Dinar 29 million. One of the key strategic activities of the Company is to improve the performance of Subsidiary and Associate Companies towards achieving sustainable profitability. These efforts which included reorganization of companies have resulted in most subsidiaries and associate companies starting to record profitability since recovering from the consequences of the financial crisis.
Arkan Al Kuwait Real Estate Company successfully completed several exits at attractive prices in line with its geographical expansion strategy along with achieving desired growth and profitability which will have positive impacts to shareholders. Burgan Company for Well Drilling, Trading & Maintenance K.S.C.C also continued the expansion of its activities and was awarded several new tenders from oil companies. Burgan Company made good progress in the enhancement of its administrative and technical structure to be in line with its expansion strategy. First Education Company also made further growth in its investments in both universities and schools in several countries in the Arab region. The company is planning to entering into new educational projects in Kuwait and other regional countries. The company also entered into the field of training with a view to achieve further growth in its business lines. First Energy Resources Company witnessed many significant positive developments in relation to its subsidiary company the Kuwait Valves Company, especially after obtaining the approval from governmental oil companies in Kuwait for the supply and maintenance of oil valves. The Company was also awarded several tenders.

14
Your company is continuing to develop asset management activities by selecting investment opportunities of appropriate returns and risk profiles to meet the requirements of investors. The current portfolio of assets under management is approximately Kuwaiti Dinars 150 million.
Your company is pursuing promoting investments in the Sultanate of Oman, where it has a strong presence in the real estate sector through its associate company, Tameer Investment Oman. The company has a range of projects in different real estate sectors such as commercial complexes, industrial warehouses, investment properties, and a project to develop a tourist resort complex in the city of Salalah, as well as the development of a mixed-use complex (residential, commercial and offices) in Muscat, the capital of Oman.
The Company manages several diversified real estate portfolios in the Kingdom of Saudi Arabia in diversified sectors of residential, offices, hospitality and warehousing. The Company has begun sale of units in one of these portfolios; a residential project comprising 80 villas spread over three locations in Riyadh, with a project value of around Kuwaiti Dinar 7.5 million. This project represents the first achievements of the company’s projects in the residential sector in the Kingdom of Saudi Arabia in collaboration with Shomoul Real Estate Company, the developer and marketer of the project units.
The Company also manages a real estate portfolio in the hospitality sector which involves developing a 5 star hotel in Riyadh with a cost around Kuwaiti Dinars 22 million. This hotel is located in one of the prime locations in Riyadh. The construction of this hotel is expected to be completed in the middle of 2015. Further, the Company is targeting to offer additional real estate investment opportunities in the Kingdom of Saudi Arabia and Sultanate of Oman.
During the second quarter of last year, the Company completed all its requirements of the Capital Markets Authority (CMA) within the stipulated period. The Company is in the process of submitting its requirements of the Kuwait Companies Law No. 25 of 2012 which is expected to be completed during the first quarter of 2013.
The Board of Directors was reconstituted after the Annual General Meeting which was held on 8th July 2012 to hold interim elections to elect members to the Board of Directors. The composition of new major shareholders includes leading companies conducting businesses in vital economic sectors in the country. The strong coordination of the major shareholders of the Company with respect to direction of the Company and its business decisions along with their expertise and strong reputation is expected to contribute towards enhancing the performance of the Company in accordance with its ambitious strategy.
As for the strategic steps of the Company for 2013, your company will focus on completing the restructuring of the company’s assets to rebalance sector and geographic concentration and increase the liquidity. The Company will also take steps towards exiting of certain assets, the proceeds of which will be invested in income producing investments, and will increase fund management business line which is expected to be one of the main activities in the future. The Company, God willing, will continue to enhance the performance of subsidiaries and associate companies to become an important source of income. We can not fail to emphasize that the Company is in the process of complying its requirements with respect to the new Kuwait Companies Law No. 25 of 2012 having successfully completed compliance with the rules and instructions of the Capital Markets Authority.

15
FIC Annual Report 2012
With respect to our results for fiscal year ended 31 December 2012 are as follows:
2012 2011 Change rateNet Profit (KD million) 2.9 2 45%Revenue (KD million) 8.2 14.4 -43%Expenses (KD million) 5.1 11.4 -55%Total assets (KD million) 147 165 -11%Return on Assets 2% 1%Return on shareholders, equity 3.15% 2.3%Earning per share (fils) 4.5 3.2Bonus shares - -Cash dividends - -Capital increase - -
Based on these results the Board of Directors has recommended to the General Assembly not to distribute dividends for the fiscal year ended 31 December 2012.
We extend our sincere thanks and gratitude to all governmental authorities for the support extended to the company, and we ask the Allah Almighty to continue the blessings of security and safety to our dear Kuwait under the leadership of His Highness the Emir Sheikh Sabah Al-Ahmad Al-Jaber Al-Sabah and Crown Prince His Highness Sheikh Nawaf Al-Ahmad Al-Jaber Al-Sabah and protect it from any adversity. We also thank the company’s customers and shareholders for their valued trust and confidence placed on us and the members of the Sharia Supervisory Board for their blessed efforts. The Board expresses its sincere appreciation to the employees of your Company in their dedicated work towards achieving the Company’s goals.
May Allah bless your deeds,
Khalid Saud Al-Sanousi Chairman

16
Real Estate Sector
GROUP STRATEGIC INVESTMENTS
Country of Incorporation : Kingdom of BahrainCapital : B.D 6.900.000 million FIC contribution % : 35.29 %Nature of business : Real estate development and investment in Kingdom of Bahrain.
Sahab Al Khaleej Real Estate Co.
Country of Incorporation : Kingdom of Saudi Arabia Capital : SAR 2,000 million FIC contribution % : 9.91 %Nature of business : Real estate development and investment in Kingdom of Saudi Arabia.
Al Muttahed Company
Country of Incorporation : OmanCapital : OR 18،507 million FIC contribution % : 37.40 %Nature of business : Real estate development and investment in Oman.
Taameer Investment Company
Country of Incorporation : Kuwait Capital : KD 22.116 million FIC contribution % : 29.03 %Nature of business : Real estate development and investment in Kuwait and Arabian Gulf region.
Arkan Al-Kuwait Real Estate Company
Financial Sector
Country of Incorporation : Kingdom of Saudi Arabia Capital : SAR 60 million FIC contribution % : 40.00 %Nature of business : Provide of Islamic financial and investment services as well as asset management in the Kingdom of Saudi Arabia.
Adeem Capital
adeemcapital

17
FIC Annual Report 2012
Energy Sector
Asian Petroleum Company
First Education Company
Country of Incorporation : Kuwait Capital : KD 0.2 millionFIC contribution % : 66.6 %Nature of business : Oil field, Services, Supply & Construction.
Country of Incorporation : Kuwait Capital : KD 15 millionFIC contribution % : 17.16 %Nature of business : Investment in the Education sector.
Country of Incorporation : Kuwait Capital : KD 20,962,500 millionFIC contribution % : 20.46 %Nature of business : Drilling & Exploration.
Burgan Well Drilling Company
First Energy Resources CompanyCountry of Incorporation : Kuwait Capital : KD 21.650 million (50% paid up)FIC contribution % : 33.21 %Nature of business : Investment company in the energy, oil and gas sector.
Education Sector

18
THE ECONOMIC REPORT
KuwaitThe year 2012 was one marked by ups and downs for Kuwait, with a record profit highlighting the country’s economic growth, but also exposing its reliance on oil revenues. While the planning of new infrastructure projects and growth in the banking sector showed that the country is recovering well from the effects of the 2009 economic crisis, the political scene was dominated by tensions between the government and opposition.
Kuwait’s GDP is forecast to grow by 6.3% in 2012 (8.2%:2011), building on a strong performance in 2011 which produced growth of 5.7%. At the end of the 2011-12 fiscal years, the country posted a record budget surplus of KD 13.2 billion (29.8% of GDP) as revenue driven by oil sector grew by 41%.Local banks posted strong 2012 returns, with many institutions recovering from negative growth in the second quarter caused by allocating funds for provisioning against potential defaults. A number of banks have signaled their intention to continue approaching lending with caution. However slowdown in project awards has impacted credit growth for Banks as they struggle with high non performing loans ratios and balance sheet restructuring issues.
The Kuwait Stock Exchange ended 2012 with the KSE price Index recording an increase of 2.07% (KSE Weighted Index rose by 2.97%) to close at 5,934, following four consecutive years of losses. Trading activity in the Kuwait Stock Exchange witnessed sharp growth in 2012, with the total volume traded increasing by 120% in 2012, while the turnover rose by 19% to KD 7.3 billion. Financial and Services was the most actively traded index accounting for 35% of the traded turnover and 28% of the volumes.

19
FIC Annual Report 2012
The Real Estate market ended year 2012 with a positive outcome where the market liquidity rose by 15.8% to KD 3.3 billion. Housing activity, both private and investment captured 91% of the real estate market liquidly.
The country is expected to follow the pattern of previous years by ending the 2012-13 fiscal years with a budget surplus. In the medium term Kuwait’s fiscal policy is expected to remain expansionary and the Current expenditure will rise as the government wage bill rises. Real GDP in Kuwait is expected to grow at 2.2% and 3.3% in 2013 and 2014 respectively, supported by stable oil production. Signs of a greater determination by Kuwaiti authorities to implement large infrastructure projects associated with the government’s 4 year development plan should ease the economy’s dependence on growth in the consumer sector. The construction industry in particular should see significant growth on the back of key projects.
These will add to large fiscal and trade surpluses, which will provide a buffer against any fresh turbulence in the global economy. Whilst implementing large projects provide significant challenges moreover, the economy faces broader long term challenges most notably the need to create viable private sector jobs.
The budget is forecast to remain in huge surplus, though could decline to under 20% of GDP over the next two years as oil revenues plateau but spending pushes higher. Meanwhile, strong oil receipts are expected to keep the current account surplus strong in 2013 and 2014 at 35-45% of GDP implying a continued build up in Kuwait’s foreign assets.
GCCThe GCC countries combined GDP is estimated to grow by 5.4% to reach USD 1.48 trillion in 2012 driven by robust oil prices and government deployment of massive fiscal surpluses to develop non-hydrocarbon sectors. The OPEC Crude Basket averaged at around $110 per barrel during 2012, compared to $107 in 2011. With Oil prices remaining above the budget forecasts of all GCC governments and aided by expanded oil production most GCC governments have retained their expansionary fiscal policies, with strong infrastructure spending.

20
Saudi Arabia remains the region’s largest economy with nominal GDP forecasted to reach USD 657 bn, an increase of 6% in 2012 (7.1%: 2011). Much of this expansion is expected to come from strong energy prices, higher-than-expected oil output and increased state spending as part of the government’s long-term capital works programme.
Qatar’s Real GDP is forecasted to grow at 6.3% in 2012 (14.1%: 2011) to USD 184.6 bn. Qatar government’s initiatives to consolidate several years of economic expansion, while channeling a budgetary surplus towards large-scale capital works projects, helped the country achieve its aim of more moderate growth for 2012. The estimates are down significantly on figures from 2011 when Qatar’s economy expanded by 14.1%. Winning the right to host the World Cup helped accelerate Qatar’s long-term infrastructure development programme.
While 2012 may have been marked by an ongoing political stalemate and effects from regional and local unrest, Bahrain managed to overcome negative pressures and produce solid growth for 2012 with a real GDP growth of 2% in 2012 ( 2.1%: 2011). However, the country’s political intractability remains quite salient, as small-scale anti-government demonstrations continue in the midst of a protest ban. Oman recorded a GDP growth of 5% ( 5.4%: 2011) on the back of infrastructure development.
In stark contrast to the emerging markets, which surged in 2012 due to the large influx of liquidity, the GCC equity markets’ performance was lackluster. While the MSCI World and Emerging Market indices increased 13.2% and 15.1%, respectively, Saudi Arabia, the largest market in the GCC, recorded an increase of 6.0% in 2012. Strong corporate earnings catalyzed market growth in Kuwait with the index ended 2012 with a gain of 2.1% as measured by Kuwait Price index. In 2012, Dubai market outperformed other GCC markets and surged by 19.9% followed by the Abu Dhabi market that rose by 9.5%. Investors returned to the Dubai and Abu Dhabi markets in 2012 following a recovery in property prices. All the GCC markets ended the year on a positive note with the exception of Bahrain Bourse losing 6.83%, and Qatar, the only GCC market that gained in 2011, reported a 4.8% decline in 2012. Political unrest in the Middle East continued for a second year and had an adverse impact on the markets in 2012.
Meanwhile, the UAE remains the second largest economy with a nominal GDP forecasted to reach USD 361.9 in 2012, a growth of 4% ( 5.2%: 2011). The UAE economy has benefited from its status as a safe haven’ amidst the political turmoil across the Arab World, which helped to lift the Tourism and Hospitality sector in Dubai. Dubai’s debt problems are no longer a drag on overall sentiment, following several positive developments in terms of restructuring and rescheduling of the overall debt profile. One sector that continues to see a slow recovery is real estate, Abu Dhabi has targeted non-oil growth in line with its bid to diversify the emirate’s economy and reduce dependence on oil revenue. Initiatives include a plan to increase non-oil exports from 1% of GDP, which is the current figure, to 11% by 2030.

21
FIC Annual Report 2012
The year 2012 witnessed several key developments that shaped GCC equity markets’ performance including the implementation of the by laws and regulations of the Capital Markets Law issued by the Capital Markets Authority in Kuwait, the recovery of the real estate sector in Dubai and the announcement from the Saudi Capital Markets Authority that it would allow listing by foreign companies that already have their shares listed on other regulated exchanges.
Demand for Dubai properties and prices have been on a rebound during most of 2012, and the trend is expected to continue through 2013. An improvement in the Dubai economy has given a strong impetus to the Real Estate sector, with prices and sales activity showing a sustained trend of improvement. However, Abu Dhabi remains subdued due to supply overhang and pressure on prices has continued to take their toll. Meanwhile, in Saudi Arabia, the announcement of mortgage framework has failed to enthuse much interest, due to a gap in the supply of low-cost housing.
Despite healthy rates of economic growth, GCC inflation remains low which is expected to average to 2.4% in 2012. A slight pickup in inflation to 3% is seen in 2013.
OutlookGCC economic growth is set to slow to 3.6% in 2013 from 5.4% in 2012 as the three year surge in regional oil production comes to an end. However, the business conditions are expected to remain solid as governments maintain higher levels of investment and social spending. An oil price of $100 per barrel will allow most GCC governments to finance higher spending without draining their financial resources. However, a major global economic downturn could drive oil prices downwards that would put government fiscal balances under pressure. Interest rates are expected to stay at recent record lows and the banking sector profitability should see an improvement so long as the global economy does not deteriorate.
In Saudi Arabia, growth is anticipated to moderate this year with GDP projected to expand by around 4% in 2013 (6%: 2012) as demand for energy eases. Oil production remains near record highs, and government spending continues to expand. While growth may moderate in 2013, a number of sectors, including construction and banking, look set to continue expanding.

22
The Qatar GDP is expected to ease to around 5% in 2013 (6.3%: 2012) and beyond. The IMF also expects the oil and gas sector’s contribution to remain flat, with gas production having now reached the government’s target, economic expansion was set to fall to mid-range single digits, while ongoing high capital spending by the state would maintain growth for the non-energy sector UAE’s economy as a whole could see a growth of a more modest 2.6% in 2013 (4% :2012). Over the next four years, Dubai will have to repay or renegotiate $50bn worth of debt, with $9.4bn-$9.8bn of this expected in 2013. Any delays in servicing this debt could undermine the confidence. Abu Dhabi’s economy is expected to continue expanding into 2013. The Bahrain economy is expected to witness a slowdown in growth to 2.8% (2% 2012) in 2013. Modestly expanding oil production and a recovering services sector will keep real GDP growth at around 3% in the next few years, around half the rate witnessed in the five years prior to the onset of the global recession. Oman GDP is expected to slightly decrease to 3.2% in 2013 (3.9% :2011)
GCC government spending is seen rising by 6-8% over the next two years. A major global economic downturn could see global oil market fundamentals loosen by than anticipated, pushing oil prices below $100 per barrel. This would put government fiscal balances under pressure and cause cuts in spending or delays in project execution wakening economic growth. Banking sector profitability should see an improvement after provisioning affected 2012. Interest rates are expected to stay at recent record lows, in order to manage exchange rate pegs against the US dollar.
GLOBAL ECONOMY AND OUTLOOK
Global financial conditions continued its improvement in the second half of the year of 2012 with a GDP growth of 3.3 % (3.8%: 2011). The main sources of acceleration were emerging market economies, where activity picked up broadly as expected, and the United States, where growth surprised on the upside. Financial conditions stabilized and capital flows to emerging markets remained strong

23
FIC Annual Report 2012In the United States a supportive a financial market environment and the turnaround in the housing market have helped to improve household balance sheets. The GDP is forecast to grow by 2.2% in 2012 (1.8%: 2011). The priority in the United States is to avoid excessive fiscal consolidation in the short term and promptly raise the debt ceiling. The recovery of the housing market plus abundant shale oil will help the manufacturing sector. These two factors will be working to the benefit of the US.
The euro area continues to pose a large downside risk to the global outlook. In particular, risks of prolonged stagnation in the euro area as a whole will rise if the momentum for reform is not maintained. The GDP in 2012 is forecast to contract by 0.4%. The near-term outlook for the euro area is expected to contract by 0.2 percent in 2013. This reflects delays in improved bank liquidity to private sector borrowing conditions, and still-high uncertainty about the ultimate resolution of the crisis despite recent progress. EIU expects five of the Euro 15 in recession in 2013, with Greece, Portugal and Spain needing further bailouts. The UK is, on the other side, stabilizing with labor costs coming down rapidly.
In Japan, the priority is to underpin the renewed emphasis on raising growth and inflation with more ambitious monetary policy easing, and adopting a credible medium-term fiscal consolidation plan. The Japan GDP is forecast to grow by 2.2% in 2012 (-0.8% in 2011). Japan is expected to expand by 1.2 percent in 2013. The recession is expected to be short-lived because the effects of temporary factors, such as the car subsidy and disruptions to trade with China, will subside. The sizeable fiscal stimulus package and further monetary easing will give growth at least a near-term boost, with support from a pickup in external demand and a weaker yen.
Although the steady decline in global exports and imports across the globe is likely to continue through 2013, the growth in emerging market and developing economies is on track to record 5.6 percent in 2013 a slight increase from 5.3% in 2012. Nevertheless, growth is not projected to rebound to the high rates recorded in 2010–11. But weakness in advanced economies will weigh on external demand. Moreover, the space for further policy easing has diminished, while supply bottlenecks and policy uncertainty have hampered growth in economies such as, Brazil, India.

24
China recorded a GDP growth of 7.8% in 2012 a significant decline from 9.2% in 2012. The GDP growth is expected to be around 8% in the next three years. Ensuring sustained rapid growth in China requires continued progress with market-oriented structural reforms and rebalancing of the economy more toward private consumption. In other emerging market and developing economies, requirements differ. In the Middle East and North Africa region, many countries will need to maintain macroeconomic stability under difficult internal and external conditions.
The projections by IMF imply that global growth will strengthen gradually through 2013, averaging 3.5 percent on an annual basis, a moderate uptick from 3.2 percent in 2012. A further strengthening to 4.1 percent is projected for 2014, assuming recovery takes a firm hold in the euro area economy.

25
FIC Annual Report 2012

26

27
FIC Annual Report 2012
REPORT OF FATWA AND SHARI’A BOARD
Praise be to Allah, the Lord of the Universe and Prayers and Peace upon the Messenger of Allah who was sent as Blessing to the world, Mohammad may Prayers and Peace be upon him, his family, his companions and his followers until the Day of Judgment.
We, the Fatwa and Shari’a Board of First Investment Company (“the Company”), state hereby that we have reviewed the principles followed and the contracts pertaining to the transactions and deals made by the Company during the year ended 31st December, 2012, have exercised our control duties as a preview to expressing our opinion on whether the Company has complied with the dictates and principles of Islamic Shari’a Law to specific edicts, decisions and guidelines issued by our board.
It is our view that:1. The contracts, operations and transactions concluded by the Company during the year ended 31st December, 2012, which we have reviewed, were carried out in conformity with the dictates and principles of Islamic Shari’a Law.
2. The distributions of profits and encumbrances of losses against the investment accounts conform with our approved principles which conform with the dictates and principles of the Islamic Shari’a Law.
3. All earnings realized from sources or through ways prohibited by the dictates and principles of the Islamic Shari’a Law have been disbursed in charitable activities.
We hereby take this opportunity to express our appreciation and thanks to the management of the Company for its kind cooperation to our board, as well as the shareholders and other parties dealing with the Company.
We pray to Allah Almighty to bless their efforts and dedication to serve the Islamic economy, and develop our nation in ways that shall yield benefits to all parties involved.
Note: Zakat amount per share is : 1.724 fils, and it is payable on shareholder.
Sheikh Dr. Ali Mohyiddeen Al-QaradaghiChairman
Sheikh Dr. Essa Zaki ShaqraMember
Sheikh Dr. Abdulaziz Khalefa Al-QassarMember

28

First Investment Company K.S.C. (Closed)
and its Subsidiaries
CONSOLIDATED FINANCIAL STATEMENTS31 December 2012

30

31
FIC Annual Report 2012

32
First Investment Company K.S.C. (Closed) and its Subsidiaries
2012 2011 Notes KD KD
INCOMEMurabaha and ijara income 68,431 84,777Rental income 634,399 -Realised gain on financial assets at fair value through statement of income 4 54,009 750,064
Unrealised loss on financial assets at fair value throughstatement of income 4 (125,959) (48,875)Gain on disposal of financial assets available-for-sale 2,821,193 4,211,269Gain on disposal of properties under development 12 153,277 3,055,552Gain on disposal of investment properties 92,113 202,423Gain on revaluation of investment properties 13 137,324 467,458Management fees 988,115 814,775Dividend income 5 110,533 188,723Gain on disposal of associates 11 772,299 2,416,626Share of results of associates 11 896,278 (87,598)Gain on settlement of murabaha payables 17 1,110,365 2,278,000Other income 501,243 40,169
8,213,620 14,373,363EXPENSESReversal (provision) of murabaha and ijara receivables – net 9 453,980 (432,859)Impairment of financial assets available-for-sale 10 (1,439,964) (1,144,319)Provision and write off of other assets 14 (192,161) (1,659,751)Staff costs (2,133,210) (1,796,815)Foreign exchange gain (loss) 949,906 (378,859)Depreciation (136,333) (99,811)Finance costs (1,680,876) (4,833,582)Other expenses (956,633) (1,086,809)
(5,135,291) (11,432,805)
PROFIT BEFORE CONTRIBUTION TO KUWAIT FOUNDATION FOR THE ADVANCEMENT OF SCIENCES (“KFAS”), NATIONAL LABOUR SUPPORT TAX (“NLST”), ZAKAT AND DIRECTORS’ REMUNERATION
3,078,329 2,940,558
Contribution to KFAS (16,799) (12,691)Contribution to NLST (64,600) (56,861)Zakat (24,805) (19,902)Directors’ remuneration (7,000)
PROFIT FOR THE YEAR 2,972,125 2,844,104
Attributable to:Owners of the Parent Company 2,909,976 2,066,288Non-controlling interests 62,149 777,816
2,972,125 2,844,104
BASIC AND DILUTED EARNINGS PER SHARE ATTRIBUTABLE TO THE OWNERS OF THE PARENT COMPANY 6 4.5 fils 3.2 fils
The attached notes 1 to 26 form part of these consolidated financial statements.
CONSOLIDATED STATEMENT OF INCOMEFor the year ended 31 December 2012

33
First Investment Company K.S.C. (Closed) and its Subsidiaries FIC Annual Report 2012
2012 2011Note KD KD
Profit for the year 2,972,125 2,844,104
Other comprehensive income
Financial assets available-for-sale:Unrealised (loss) gain (1,920,672) 1,640,864Transferred to consolidated statement of income on impairment 10 1,439,964 1,144,319
Net unrealised (loss) gain on financial assets available-for-sale (480,708) 2,785,183Share of other comprehensive income of associates 47,351 578,147Exchange differences on translation of foreign operations (406,842) 433,646
Other comprehensive (loss) income for the year (840,199) 3,796,976
Total comprehensive income for the year 2,131,926 6,641,080
Attributable to:
Owners of the Parent Company 1,987,405 6,094,538Non-controlling interests 144,521 546,542
2,131,926 6,641,080
.
CONSOLIDATED STATEMENT OF COMPREHENSIVE INCOME Year ended 31 December 2012
The attached notes 1 to 26 form part of these consolidated financial statements.

2012 2011Notes KD KD
ASSETS Bank balances and cash 7 8,116,741 9,314,660Financial assets at fair value through statement of income 8 1,351,240 1,804,747Murabaha and ijara receivables 9 2,116,007 2,383,916Financial assets available-for-sale 10 32,266,092 65,062,640Investment in associates 11 53,000,509 55,293,202Properties under development 12 17,383,621 17,857,359Investment properties 13 26,816,298 6,383,054Other assets 14 4,372,229 5,521,857Property and equipment 1,198,768 1,193,129
TOTAL ASSETS 146,621,505 164,814,564
EQUITY AND LIABILITIES EquityShare capital 15 65,107,055 65,107,055Share premium 15 18,250,362 18,250,362Treasury share 15 (104,693) -Statutory reserve 16 517,892 216,274Share options reserve 3 3,016,890 3,016,890Treasury shares reserve 15 1,090,539 1,090,539Cumulative changes in fair values 134,667 632,864Foreign currency translation reserve 555,528 979,902Retained earnings 4,458,372 1,850,014
Equity attributable to owners of the Parent Company 93,026,612 91,143,900Non-controlling interests 19,750,500 19,873,439
Total equity 112,777,112 111,017,339
LiabilitiesMurabaha and sukuk payables 17 29,560,317 48,939,220Other liabilities 18 4,284,076 4,858,005
Total liabilities 33,844,393 53,797,225
TOTAL EQUITY AND LIABILITIES 146,621,505 164,814,564
34
First Investment Company K.S.C. (Closed) and its SubsidiariesCONSOLIDATED STATEMENT OF FINANCIAL POSITIONAt 31 December 2012
Khalid S. Al-SanaousiChairman and Managing Director
Badar Mohammed Al-Qatan Vice Chairman
The attached notes 1 to 26 form part of these consolidated financial statements.

35
First Investment Com
pany K.S.C. (Closed) and its SubsidiariesC
ON
SOLIDATED STATEM
ENT O
F CH
ANG
ES IN EQ
UITYFor the year ended 31 D
ecember 2012
The attached notes 1 to 26 form part of these consolidated financial statem
ents.
Attributable to owners of the Parent Company
Non-controllinginterests
Total equity
Sharecapital
Sharepremium
Treasury shareStatutoryreserve
Shareoptions reserve
Treasuryshares reserve
Cumulative changes in fair values
Foreigncurrency
translationreserve
Retained earnings
(accumulated losses)
Sub-totalKD
KD KD
KD KD
KD KD
KDKD
KD KD
KD
As at 1 January 201265,107,055
18,250,362-
216,2743,016,890
1,090,539632,864
979,9021,850,014
91,143,90019,873,439
111,017,339
Profit for the year-
- -
- -
- -
- 2,909,976
2,909,976 62,149
2,972,125Other comprehensive (loss) income for the year
- -
- -
- -
(498,197)(424,374)
- (922,571)
82,372(840,199)
Total comprehensive (loss) income for the year-
- -
- -
- (498,197)
(424,374)2,909,976
1,987,405144,521
2,131,926Purchase treasury share
- -
(104,693)-
- -
- -
- (104,693)
- (104,693)
Transfer to reserve -
- -
301,618-
- -
- (301,618)
- -
- Distribution to non-controlling interests
- -
- -
- -
- -
- -
(267,460)(267,460)
At 31 December 201265,107,055
18,250,362(104,693)
517,8923,016,890
1,090,539134,667
555,5284,458,372
93,026,61219,750,500
112,777,112
As at 1 January 201165,107,055
21,490,583-
7,275,9883,016,890
1,090,539(2,735,106)
319,622(10,516,209)
85,049,3628,931,900
93,981,262
Profit for the year-
- -
- -
- -
- 2,066,288
2,066,288777,816
2,844,104Other comprehensive income (loss) for the year
- -
- -
- -
3,367,970660,280
- 4,028,250
(231,274)3,796,976
Total comprehensive income for the year-
- -
- -
- 3,367,970
660,2802,066,288
6,094,538546,542
6,641,080Write-off of accumulated losses (Note 15)
- (3,240,221)
- (7,275,988)
- -
- -
10,516,209-
- -
Transfer to reserve -
- -
216,274-
- -
- (216,274)
- -
- Arising on business combination
- -
- -
- -
- -
- -
13,965,28813,965,288
Distribution to non-controlling interests-
- -
- -
- -
- -
- (3,570,291)
(3,570,291)
At 31 December 201165,107,055
18,250,362-
216,2743,016,890
1,090,539632,864
979,9021,850,014
91,143,90019,873,439
111,017,339
FIC Annual Report 2012

36
First Investment Company K.S.C. (Closed) and its Subsidiaries
2012 2011 Notes KD KD
OPERATING ACTIVITIESProfit for the year 2,972,125 2,844,104Adjustments for:Depreciation 136,333 99,811Finance costs 1,680,876 4,833,582Murabaha and ijara income (68,431) (84,777)Gain on disposal of financial assets available-for-sale (2,821,193) (4,211,269)Gain on revaluation on investment properties (137,324) (467,458)Gain on disposal of properties under development 12 (153,277) (3,055,552)Gain on disposal of investment properties (92,113) (202,423)Dividend income 5 (110,533) (188,723)Gain on disposal of associates 11 (772,299) (2,416,626)Share of results of associates 11 (896,278) 87,598 Gain on settlement of murabaha and sukuk payables 17 (1,110,365) (2,278,000)( Reversal) provision against murabaha and ijara receivables – net 9 (453,980) 432,859Impairment of financial assets available-for-sale 10 1,439,964 1,144,319Provision and write-off of other assets 14 192,161 1,659,751Foreign exchange (gain) loss (949,906) 378,859
(1,144,240) (1,423,945)Changes in operating assets and liabilities:Financial assets at fair value through statement of income 416,123 (1,100,694)Murabaha and ijara receivables 452,430 2,802,571Other assets 1,194,563 51,542Other liabilities 89,033 536,052
1,007,909 865,526Murabaha and ijara income received 62,911 33,830Finance costs paid (2,337,133) (5,758,082)
Net cash used in operating activities (1,266,313) (4,858,726)
INVESTING ACTIVITIESArising on acquisition of a subsidiary - 1,500,103Dividend income received 5 110,533 188,723Purchase of financial assets available-for-sale - (914,388)Proceeds from disposal of financial assets available-for-sale 970,444 270,611Purchase of investment properties (807,096) -Proceeds from disposal of investment properties 6,117,856 1,856,801Purchase of investment in associates 11 (2,123,062) (5,595)Proceeds from disposal of investment in associates 1,936,000 11,160,567Dividends received from associates 319,992 -
Purchase of properties under development (543,217) (876,239)Proceeds from sale of properties under development 1,213,877 12,235,066Purchase of property and equipment (141,972) (114,525)
Net cash flows from investing activities 7,053,355 25,301,124
CONSOLIDATED STATEMENT OF CASH FLOWSFor the year ended 31 December 2012
The attached notes 1 to 26 form part of these consolidated financial statements.
37
First Investment Company K.S.C. (Closed) and its Subsidiaries FIC Annual Report 2012
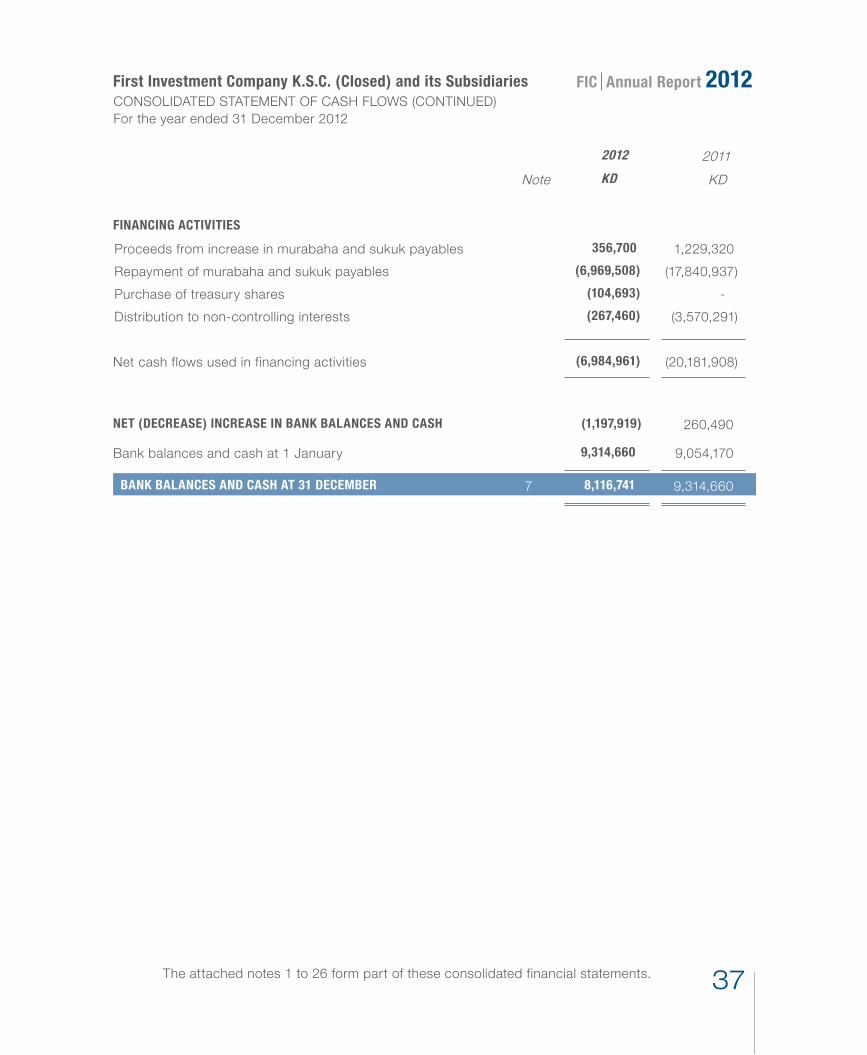
2012 2011 Note KD KD
FINANCING ACTIVITIES
Proceeds from increase in murabaha and sukuk payables 356,700 1,229,320Repayment of murabaha and sukuk payables (6,969,508) (17,840,937)Purchase of treasury shares (104,693) -Distribution to non-controlling interests (267,460) (3,570,291)
Net cash flows used in financing activities (6,984,961) (20,181,908)
NET (DECREASE) INCREASE IN BANK BALANCES AND CASH (1,197,919) 260,490
Bank balances and cash at 1 January 9,314,660 9,054,170
BANK BALANCES AND CASH AT 31 DECEMBER 7 8,116,741 9,314,660
The attached notes 1 to 26 form part of these consolidated financial statements.
CONSOLIDATED STATEMENT OF CASH FLOWS (CONTINUED)For the year ended 31 December 2012

38
First Investment Company K.S.C. (Closed) and its Subsidiaries
1 CORPORATE INFORMATION
The consolidated financial statements of First Investment Company K.S.C. (Closed) (the “Parent Company”) and its subsidiaries (together, the “Group”) for the year ended 31 December 2012 were authorised for issue in accordance with a resolution of the Board of Directors of the Parent Company on 20 March 2013. The shareholders’ General Assembly has the power to amend these consolidated financial statements after issuance.
The Parent Company is a Kuwaiti shareholding company incorporated on 26 July 1997 under the Commercial Companies Law No. 15 of 1960 and amendments thereto and is regulated by the Central Bank of Kuwait (“CBK”) and Capital Market Authority (“CMA”) as an investment company. The Parent Company’s shares are listed on Kuwait Stock Exchange. The Parent Company’s registered office is at Souk Al Safat, Abdullah Mubarak Street, Kuwait City.
The Parent Company is principally engaged in the provision of investment and financial services and all activities are carried out in compliance with the memorandum of association, the article of association and the Islamic Sharia.
2.1 BASIS OF PREPARATION
The consolidated financial statements of the Group have been prepared in accordance with the regulations of the State of Kuwait for financial services institutions regulated by the CBK. These regulations require adoption of all International Financial Reporting Standards (IFRS) except for the IAS 39 requirement for collective provision, which has been replaced by CBK’s requirement for a minimum general provision made on all applicable credit facilities that are not provided specifically.
The consolidated financial statements have been prepared on a historical cost basis, except for the financial assets at fair value through statement of income, financial assets available-for-sale and investment properties that have been measured at fair value.
The consolidated financial statements are presented in Kuwaiti Dinars which is also the functional currency of the Parent Company.
The Companies Law issued on 26 November 2012 by Decree Law no 25 of 2012 (the “Companies Law”), which was published in the Official Gazette on 29 November 2012, cancelled the Commercial Companies Law No 15 of 1960. According to article 2 of the Decree, the Company has a period of 6 months from 29 November 2012 to regularize its affairs in accordance with the Companies Law.
NOTES TO THE CONSOLIDATED FINANCIAL STATEMENTSAt 31 December 2012

39
First Investment Company K.S.C. (Closed) and its Subsidiaries FIC Annual Report 2012
2.2 BASIS OF CONSOLIDATION
The consolidated financial statements comprise the financial statements of the Parent Company and its subsidiaries as at 31 December 2012.
Subsidiaries are fully consolidated from the date of acquisition, being the date on which the Group obtains control, and continue to be consolidated until the date when such control ceases. Control is achieved where the Group has the power to govern the financial and operating policy of an entity so as to obtain benefits from its activities. This occurs when the Group has more than 50% voting power through ownership or agreements, except where minority rights are such that a minority shareholder is able to prevent the Group from exercising control. In addition control may exist without having more than 50% voting power through ownership or agreements, or in the circumstances of enhanced minority rights, as a consequence of de facto control. De facto control is control without the legal right to exercise unilateral control, and involves decision making ability that is not shared with others and the ability to give directions with respect to the operating and financial policies of the entity concerned.
The financial statements of the subsidiaries are prepared for the same reporting period as the Parent Company, using consistent accounting policies. All intra-group balances, transactions, unrealised gains and losses resulting from intra-group transactions and dividends are eliminated in full.
Total comprehensive income/loss within a subsidiary is attributed to the non-controlling interest even if that results in a deficit balance.
A change in the ownership interest of a subsidiary, without a loss of control, is accounted for as an equity transaction. If the Group loses control over a subsidiary, it:
• Derecognises the assets (including goodwill) and liabilities of the subsidiary• Derecognises the carrying amount of any non-controlling interest• Derecognises the cumulative translation differences recorded in other comprehensive income• Recognises the fair value of the consideration received• Recognises the fair value of any investment retained• Recognises any surplus or deficit in statement of income • Reclassifies the Parent Company’s share of components previously recognised in other comprehensive
income to statement of income or retained earnings, as appropriate.
NOTES TO THE CONSOLIDATED FINANCIAL STATEMENTSAt 31 December 2012

40
First Investment Company K.S.C. (Closed) and its Subsidiaries
2.2 BASIS OF CONSOLIDATION (Continued)
Details of subsidiaries are set out below:
NameCountry of
Incorporation% equity interest Principal activity
2012 2011
Al Marwa Holding Company K.S.C. (Closed) Kuwait 99.22% 99.22% Holding company
FIC Projects Development Company Cayman Islands 100% 100% Real estate investmentDeema Real Estate Investment Company L.L.C. Saudi Arabia 95% 95% Real estate investment
First Energy Resource Company K.S.C.(Closed) Kuwait 33.21% 33.21% Investment in energy sector
First Investment Fund E.C. (1) Bahrain 100% 100% Special purpose company for fiduciary assets
FIC Sukuk Company Limited Cayman Islands 100% 100% Holding assets on trust of
sukuk holders
Masadar Energy Company for General Trading W.L.L Kuwait 98% 98% General trading
Shomoul Real Estate Company L.L.C. Saudi Arabia 50% 50% Real estate investment
Yasmeen Al Kuwait Real Estate Company W.L.L. Kuwait 97% 97% Real estate trading
Q80 Valve Industries Factory Kuwait 66.6% 66.6% ManufacturingAsian Petroleum Facilities Maintenance Company W.L.L.
Kuwait 66.6% 66.6% Investment in energysector
1) The Parent Company holds voting capital in First Investment Fund E.C. to manage the funds and fiduciary assets and does not have a beneficial interest in the underlying assets in its capacity as a holding company.
2.3 SUMMARY OF SIGNIFICANT ACCOUNTING POLICIES
a) Business Combinations and GoodwillBusiness combinations are accounted for using the acquisition method. The cost of an acquisition is measured as the aggregate of the consideration transferred, measured at acquisition date fair value and the amount of any non- controlling interest in the acquiree. For each business combination, the acquirer measures the non-controlling interest in the acquiree either at fair value or at the proportionate share of the acquiree’s identifiable net assets. Acquisition costs incurred are expensed and included in other expenses.
When the Group acquires a business, it assesses the financial assets and liabilities assumed for appropriate classification and designation in accordance with the contractual terms, economic circumstances and pertinent conditions as at the acquisition date.
NOTES TO THE CONSOLIDATED FINANCIAL STATEMENTSAt 31 December 2012

41
First Investment Company K.S.C. (Closed) and its Subsidiaries FIC Annual Report 2012
2.3 SUMMARY OF SIGNIFICANT ACCOUNTING POLICIES (Continued)a) Business Combinations and Goodwill (continued)
If the business combination is achieved in stages, the acquisition date fair value of the acquirer’s previously held equity interest in the acquiree is remeasured to fair value at the acquisition date through the consolidated statement of income.
Any contingent consideration to be transferred by the acquirer will be recognised at fair value at the acquisition date. Contingent consideration classified as an asset or liability that is a financial instrument and within the scope of IAS 39 Financial Instruments: Recognition and Measurement, is measured at fair value with changes in fair value recognised either in either profit or loss or as a change to other comprehensive income. If the contingent consideration is not within the scope of IAS 39, it is measured in accordance with the appropriate IFRS. Contingent consideration that is classified as equity is not remeasured and subsequent settlement is accounted for within equity.
Goodwill is initially measured at cost being the excess of the cost of an acquisition over the Group’s share of the acquiree’s fair value of the net identifiable assets as at the date of the acquisition. Any excess, at the date of acquisition, of the Group’s share in the acquiree’s fair value of the net identifiable assets over the cost of the acquisition is recognised in the consolidated statement of income.
After initial recognition, goodwill is measured at cost less any accumulated impairment losses. For the purpose of impairment testing, goodwill acquired in a business combination is, from the acquisition date, allocated to each of the Group’s cash-generating units (CGU) that are expected to benefit from the combination, irrespective of whether other assets or liabilities of the acquiree are assigned to those units.
Where goodwill forms part of a CGU and part of the operation within that unit is disposed of, the goodwill associated with the operation disposed of is included in the carrying amount of the operation when determining the gain or loss on disposal of the operation. Goodwill disposed of in this circumstance is measured based on the relative values of the operation disposed of and the portion of the CGU retained.
b) Revenue recognitionRevenue is recognized to the extent that it is probable that the economic benefits will flow to the Group and the revenue can be reliably measured, regardless of when the payment is being made. Revenue is measured at fair value of the consideration received or receivable, taking into account contractually defined terms of payment. The Group assesses its revenue arrangements against specific criteria in order to determine if it is acting as principal or agent. The Group has concluded that it is acting as a principal in all of its revenue arrangements.
The following specific recognition criteria must also be met before revenue is recognized:
• Sale of properties is recognised when the risk and rewards of ownership have passed to the buyer usually evidenced by transfer of title of the properties.
• Murabaha and ijara income are recognised on a time proportion basis so as to yield a constant periodic rate of return based on the net balance outstanding.
NOTES TO THE CONSOLIDATED FINANCIAL STATEMENTSAt 31 December 2012

42
First Investment Company K.S.C. (Closed) and its Subsidiaries
2.3 SUMMARY OF SIGNIFICANT ACCOUNTING POLICIES (Continued)b) Revenue recognition (continued)
• Rental income arising from operating leases of investment properties is accounted for on an accrual basis on contract terms.
• Management fees relating to portfolios and fund management, custody and on-going advisory services are recognised as earned.
• Dividend income is recognised when the Group’s right to receive the payment is established.
c) Share based payment transactions The Group operates an equity-settled, share-based Employee Stock Option Plan (ESOP). The cost of equity-settled transactions with employees is measured under the intrinsic value method. Under this method, the cost is determined by comparing the market value of the Parent Company’s shares at each reporting date and the date of final settlement to the exercise price with any change in intrinsic value recognised in the consolidated statement of income.
The cost of equity-settled transactions is recognised, together with a corresponding increase in equity, over the period in which the performance conditions are fulfilled, ending on the date on which the relevant employees exercise their rights. The cumulative expense recognised for equity-settled transactions at each reporting date until the exercise date, reflects the extent to which the exercise period has expired and the number of awards that, in the opinion of the Board of Directors at that date, based on the best available estimate of the number of equity instruments that will ultimately vest.
d) Financial instruments - initial recognition and subsequent measurement
i) Financial assets
Initial recognition and measurement
Financial assets within the scope of IAS 39 are classified as “financial assets at fair value through statement of income”, “loans and receivables” (murabaha and ijara receivables) and “financial assets available-for-sale”. The Group determines the classification of its financial assets at initial recognition.
All financial assets are recognised initially at fair value plus transaction costs, except in the case of financial assets recorded at fair value through statement of income.
Purchases or sales of financial assets that require delivery of assets within a time frame established by regulation or convention in the market place (regular way trades) are recognised on the trade date, i.e., the date that the Group commits to purchase or sell the asset.
Subsequent measurement
The subsequent measurement of financial assets depends on their classification as follows:
Financial assets at fair value through statement of income
These are financial assets that are either financial assets held for trading or those designated as at fair value through statement of income upon initial recognition. A financial asset is classified in this category only if they are acquired principally for the purpose of generating profit from short-term fluctuation in price or if so designated by the management only if criteria under IAS 39 are satisfied.
NOTES TO THE CONSOLIDATED FINANCIAL STATEMENTSAt 31 December 2012

43
First Investment Company K.S.C. (Closed) and its Subsidiaries FIC Annual Report 2012
2.3 SUMMARY OF SIGNIFICANT ACCOUNTING POLICIES (Continued)d) Financial instruments - initial recognition and subsequent measurement (continued)i) Financial assets (continued)
Financial assets at fair value through statement of income (continued)
Financial assets at fair value through statement of income are carried in the statement of financial position at fair value. Resultant unrealised gains and losses arising from changes in fair value are included in the consolidated statement of income.
The Group evaluates its financial assets held for trading to determine whether the intention to sell them in the near term is still appropriate. When in rare circumstances the Group is unable to trade these financial assets due to inactive markets and management’s intention to sell them in the foreseeable future significantly changes, the Group may elect to reclassify these financial assets. The reclassification to loans and receivables, available-for-sale or held to maturity depends on the nature of the asset. This evaluation does not affect any financial assets designated at fair value through statement of income using the fair value option at designation, these instruments cannot be reclassified after initial recognition.
Financial assets available-for-sale
Financial assets available-for-sale are those financial assets that are not classified as financial assets at fair value through statement of income or held for trading.
After initial recognition, financial assets available-for-sale are subsequently measured at fair value with unrealised gains and losses recognised in the consolidated statement of other comprehensive income until the investment is derecognised, at which time the cumulative gain or loss is recognised in consolidated statement of income, or determined to be impaired, is reclassified to the consolidated statement of income and removed from the available-for-sale reserve. Investments whose fair value cannot be reliably measured are carried at cost less impairment losses, if any.
The Group evaluates whether the ability and intention to sell its financial assets available-for-sale in the near term is still appropriate. When, in rare circumstances, the Group is unable to trade these financial assets due to inactive markets and management’s intention to do so significantly changes in the foreseeable future, the Group may elect to reclassify these financial assets. Reclassification to loans and receivables is permitted when the financial assets meet the definition of loans and receivables and the Group has the intent and ability to hold these assets for the foreseeable future or until maturity. Reclassification to the held-to-maturity category is permitted only when the entity has the ability and intention to hold the financial asset accordingly.
For a financial asset reclassified from the available-for-sale category, the fair value carrying amount at the date of reclassification becomes its new amortised cost and any previous gain or loss on the asset that has been recognised in equity is amortised to consolidated statement of income over the remaining life of the investment using the effective interest rate (EIR) method. Any difference between the new amortised cost and the maturity amount is also amortised over the remaining life of the asset using the EIR. If the asset is subsequently determined to be impaired, then the amount recorded in equity is reclassified to the consolidated statement of income.
NOTES TO THE CONSOLIDATED FINANCIAL STATEMENTSAt 31 December 2012

44
First Investment Company K.S.C. (Closed) and its Subsidiaries
2.3 SUMMARY OF SIGNIFICANT ACCOUNTING POLICIES (continued)d) Financial instruments - initial recognition and subsequent measurement (continued)
i) Financial assets (continued)
Reclassification from financial assets available-for-sale to investment in associates is made upon acquisition of significant influence over the investment. Such transfer is made at original cost and any gain or loss previously classified in cumulative changes in fair value reserve is reversed to bring the carrying value to its original cost.
Loans and receivablesLoans and receivables are non-derivative financial assets with fixed or determinable payments that are not quoted in an active market. After initial measurement, such financial assets are subsequently measured at amortised cost using the EIR method, less impairment. Amortised cost is calculated by taking into account any discount or premium on acquisition and fees or costs that are an integral part of the EIR.
Loans and receivables comprises of following:
Murabaha and ijara receivables Murabaha is an Islamic transaction involving the purchase and immediate sale of an asset at cost plus an agreed profit. The amount due is settled on a deferred payment basis.
Ijara is an Islamic transaction involving purchase and immediate lease of an asset where the lessor conveys to the lessee the right to use the asset for an agreed period of time in return for a payment or a series of payments. At the end of the lease term, the lessee has the option to purchase the asset.
Murabaha and ijara receivables arising from the Group’s financing of transactions on an Islamic basis are stated at amortised cost. Third party expenses such as legal fees, incurred in granting a murabaha or ijara are treated as part of the cost of the transaction.
All murabaha and ijara receivables are recognized when the legal right to control the use of the underlying asset is transferred to the customer.
Derecognition of financial assetsA financial asset (or, where applicable a part of a financial asset or part of a group of similar financial assets) is derecognised when:
• the rights to receive cash flows from the asset have expired • the Group has transferred its rights to receive cash flows from the asset or has assumed an obligation
to pay the received cash flows in full without material delay to a third party under a ‘pass through’ arrangement; and either (a) the Group has transferred substantially all the risks and rewards of the asset, or (b) the Group has neither transferred nor retained substantially all the risks and rewards of the asset, but
has transferred control of the asset.
NOTES TO THE CONSOLIDATED FINANCIAL STATEMENTSAt 31 December 2012

45
First Investment Company K.S.C. (Closed) and its Subsidiaries FIC Annual Report 2012
2.3 SUMMARY OF SIGNIFICANT ACCOUNTING POLICIES (continued)d) Financial instruments - initial recognition and subsequent measurement (continued)
i) Financial assets (continued)Derecognition of financial assets (continued)
When the Group has transferred its rights to receive cash flows from an asset or has entered into a pass-through arrangement, and has neither transferred nor retained substantially all of the risks and rewards of the asset, nor transferred control of the asset, the asset is recognised to the extent of the Group’s continuing involvement in the assets. In that case, the Group also recognises an associated liability. The transferred asset and the associated liability are measured on a basis that reflects the rights and obligations that the Group has retained.
Continuing involvement that takes the form of a guarantee over the transferred asset is measured at the lower of the original carrying amount of the asset and the maximum amount of consideration that the Group could be required to repay.
ii) Impairment of financial assetsAn assessment is made at each reporting date to determine whether there is any objective evidence that a financial asset or a group of financial assets may be impaired. A financial asset or a group of financial assets is deemed to be impaired if, and only if, there is objective evidence of impairment as a result of one or more events that have occurred after the initial recognition of the asset and that loss event has an impact on the estimated future cash flows of the financial asset or the group of financial assets that can be reliably estimated. If such evidence exists, an impairment loss is recognised in the consolidated statement of income.
Evidence of impairment may include indications that the debtors or a group of debtors is experiencing significant financial difficulty, default or delinquency in profit or principal payments, the probability that they will enter bankruptcy or other financial reorganisation and when observable data indicate that there is a measurable decrease in the estimated future cash flows, such as changes in arrears or economic conditions that correlate with defaults. If such evidence exists, an impairment loss is recognised in the consolidated statement of income.
Loans and receivablesLoans and receivables are subject to credit risk provision for loan impairment if there is objective evidence that the Group will not be able to collect all amounts due. The amount of the provision is difference between the carrying amount and the recoverable amount, being the present value of expected future cash flows, including amount recoverable from guarantee and collateral, discounted based on the contractual interest rate. The amount of loss arising from impairment is taken to the consolidated statement of income.
In addition, in accordance with CBK instructions, a minimum general provision of 1% for cash facilities and 0.5% for non cash facilities is made on all applicable credit facilities (net of certain categories of collateral), that are not provided for specifically.
NOTES TO THE CONSOLIDATED FINANCIAL STATEMENTSAt 31 December 2012

46
First Investment Company K.S.C. (Closed) and its Subsidiaries
2.3 SUMMARY OF SIGNIFICANT ACCOUNTING POLICIES (continued)
d) Financial instruments - initial recognition and subsequent measurement (continued)ii) Impairment of financial assets (continued)
Financial assets available-for-saleFor financial assets available-for-sale, the Group assesses at each reporting date whether there is objective evidence that a financial asset or a group of financial assets available-for-sale is impaired.
In the case of equity investments classified as financial assets available-for-sale, objective evidence would include a significant or prolonged decline in the fair value of the equity investment below its cost. ‘Significant’ is evaluated against the original cost of the investment and ‘prolonged’ against the period in which the fair value has been below its original cost. Where there is evidence of impairment, the cumulative loss measured as the difference between the acquisition cost and the current fair value, less any impairment loss on those financial assets available-for-sale previously recognised in the consolidated statement of income, is removed from other comprehensive income and recognised in the consolidated statement of income. Impairment losses on equity investments are not reversed through the consolidated statement of income; increases in their fair value after impairment is recognised directly in other comprehensive income.
iii) Financial liabilities
Initial recognition and measurementFinancial liabilities within the scope of IAS 39 are classified as financial liabilities at fair value through statement of income and loans and borrowings (‘murabaha payables’ and ‘other liabilities’), as appropriate. The Group determines the classification of its financial liabilities at initial recognition.
All financial liabilities are recognised initially at fair value plus, in the case of loans and borrowings, directly attributable transaction costs.
Financial liabilities designated upon initial recognition at fair value through profit or loss are designated at the initial date of recognition, and only if the criteria in IAS 39 are satisfied. The Group has not designated any financial liability as at fair value through profit or loss.
Subsequent measurementThe measurement of financial liabilities depends on their classification as follows:
Murabaha payableMurabaha payable represents the amount payable on a deferred settlement basis for assets purchased under murabaha arrangements. Murabaha payable is stated at the gross amount of the payable, net of deferred profit payable. Profit payable is expensed on a time apportionment basis taking account of the profit rate attributable and the balance outstanding.
Other liabilitiesLiabilities are recognised for amounts to be paid in the future for goods or services received, whether billed by the supplier or not.
NOTES TO THE CONSOLIDATED FINANCIAL STATEMENTSAt 31 December 2012

47
First Investment Company K.S.C. (Closed) and its Subsidiaries FIC Annual Report 2012
2.3 SUMMARY OF SIGNIFICANT ACCOUNTING POLICIES (continued)
d) Financial instruments - initial recognition and subsequent measurement (continued)iii) Financial liabilities (continued)
Derecognition of financial liabilitiesA financial liability is derecognised when the obligation specified in the contract is discharged, cancelled or expired. When an existing financial liability is replaced by another from the same lender on substantially different terms, or the terms of an existing liability are substantially modified, such an exchange or modification is treated as a derecognition of the original liability and the recognition of a new liability, and the difference in the respective carrying amounts is recognised in consolidated statement of income.
iv) Offsetting of financial instrumentsFinancial assets and financial liabilities are offset and the net amount reported in the consolidated statement of financial position if, and only if, there is a currently enforceable legal right to offset the recognised amounts and there is an intention to settle on a net basis, or to realise the assets and settle the liabilities simultaneously.
v) Fair value of financial instrumentsThe fair value of financial instruments that are traded in active markets at each reporting date is determined by reference to quoted market prices or dealer price quotations (bid price for long positions and ask price for short positions), without any deduction for transaction costs.
For financial instruments not traded in an active market, the fair value is determined using appropriate valuation techniques. Such techniques may include using recent arm’s length market transactions; reference to the current fair value of another instrument that is substantially the same; a discounted cash flow analysis or other valuation models.
An analysis of fair values of financial instruments and further details as to how they are measured are provided in Note 24.
e) Investment in associatesAn associate is an entity in which the Group has significant influence and which is neither a subsidiary nor a joint venture. The Group’s investments in its associates are accounted for using the equity method.
Under the equity method, investment in associates is initially recognised at cost and adjusted thereafter for the post-acquisition change in the Group’s share of net assets of the associate. The Group recognises in the consolidated statement of income its share of the total recognised profit or loss of the associate from the date that influence or ownership effectively commenced until the date that it effectively ceases. Distributions received from an associate reduce the carrying amount of the investment. Adjustments to the carrying amount may also be necessary for changes in the Group’s share in the associate arising from changes in the associate’s equity that have not been recognised in the associate’s statement of income. The Group’s share of those changes is recognised in statement of comprehensive income.
Goodwill relating to the associate is included in the carrying amount of the investment and is neither amortised nor individually tested for impairment.
NOTES TO THE CONSOLIDATED FINANCIAL STATEMENTSAt 31 December 2012

48
First Investment Company K.S.C. (Closed) and its Subsidiaries
2.3 SUMMARY OF SIGNIFICANT ACCOUNTING POLICIES (continued)e) Investment in associates (continued)
The reporting dates of the associates and the Group are identical and in case of different reporting date of associate from that of the Group, adjustments are made for the effects of significant transactions or events that occur between that date and the date of the Group’s consolidated financial statements. The associate’s accounting policies conform to those used by the Group for the like transactions and events in similar circumstances.
The consolidated statement of income reflects the Group’s share of results of operations of the associates. When there has been a change recognised directly in the equity of the associate, the Group recognises its share of any changes and discloses this, when applicable, in the consolidated statement of changes in equity. Unrealised gains and losses resulting from transactions between the Group and its associate are eliminated to the extent of the Group’s interest in the associate.
After application of the equity method, the Group determines whether it is necessary to recognize an additional impairment loss on the Group’s investment in its associate. The Group determines at each reporting date whether there is any objective evidence that the investment in the associate is impaired. If this is the case, the Group calculates the amount of impairment as the difference between the recoverable amount of the associate and its carrying value and recognizes the amount as ‘impairment loss’ in the consolidated statement of income.
Upon loss of significant influence over the associate, the Group measures and recognises any retaining investment at its fair value. Any difference between the carrying amount of the associate upon loss of significant influence and the fair value of the remaining investment and proceeds from disposal is recognised in the consolidated statement of income.
f) Investment propertiesInvestment properties are initially measured at cost, including transaction costs. Subsequent to initial recognition, investment properties are stated at fair value, which reflects market conditions at the reporting date. Gains or losses arising from changes in the fair values of investment properties are included in the consolidated statement of income in the period in which they arise.
Investment properties are derecognized either when they have been disposed of or when permanently withdrawn from use and no future economic benefit is expected from its disposal. Any gains or losses on the retirement or disposal of investment property are recognized in the consolidated statement of income in the period of derecognition.
Transfers are made to investment properties only when there is a change in use, evidenced by the end of owner occupation, commencement of an operating lease to another party or completion of construction or development. Transfers are made from investment properties only when there is a change in use, evidenced by commencement of owner occupation or commencement of development with a view to sale. For a transfer from investment property to owner occupied property, the deemed cost for subsequent accounting is the fair value at the date of change in use.
NOTES TO THE CONSOLIDATED FINANCIAL STATEMENTSAt 31 December 2012
49
First Investment Company K.S.C. (Closed) and its Subsidiaries FIC Annual Report 2012
2.3 SUMMARY OF SIGNIFICANT ACCOUNTING POLICIES (continued)
g) Properties under development Properties under development are developed for future sale in the ordinary course of business, rather than to be held for rental or capital appreciation and are stated at lower of cost and net realizable value. Cost includes freehold rights for land, amounts paid to contractors for construction, borrowing costs, planning and design costs, cost of site preparation, professional fees for legal services, property transfer taxes, construction overheads and other related costs. Net realizable value is based on estimated selling price in the ordinary course of the business, based on market prices at the statement of financial position date, less costs to completion and the estimated cost of sale.
h) Impairment of non-financial assetsThe Group assesses at each reporting date whether there is an indication that an asset may be impaired. If any indication exists, or when annual impairment testing for an asset is required, the Group estimates the asset’s recoverable amount. An asset’s recoverable amount is the higher of an asset’s or CGU’s fair value less costs to sell and its value in use and is determined for an individual asset, unless the asset does not generate cash inflows that are largely independent of those from other assets or groups of assets. When the carrying amount of an asset or CGU exceeds its recoverable amount, the asset is considered impaired and is written down to its recoverable amount. In assessing value in use, the estimated future cash flows are discounted to their present value using a discount rate that reflects current market assessments of the time value of money and the risks specific to the asset. In determining fair value less costs to sell, an appropriate valuation model is used. These calculations are corroborated by available fair value indicators.
An assessment is made at each reporting date whether there is any indication that previously recognised impairment losses may no longer exist or may have decreased. If such indication exists, the Group estimates the asset’s or CGUs recoverable amount. A previously recognised impairment loss is reversed only if there has been a change in the assumptions used to determine the asset’s recoverable amount since the last impairment loss was recognised. The reversal is limited so that the carrying amount of the asset does not exceed its recoverable amount, nor exceed the carrying amount that would have been determined, net of depreciation, had no impairment loss been recognised for the asset in prior years. Such reversal is recognized in the consolidated statement of income unless the asset is carried at a revalued amount, in which case, the reversal is treated as a revaluation increase.
i) Employees’ end of service benefitsProvision is made for amounts payable to employees under the Kuwaiti labour Law, employee contracts and applicable labour laws in the countries where the subsidiaries operate. This liability, which is unfunded, represents the amount payable to each employee as a result of termination of the reporting date.
j) Treasury sharesTreasury shares consist of the Parent Company’s own issued shares that have been reacquired by the Parent Company and not yet reissued or cancelled. The treasury shares are accounted for using the cost method. Under this method, the weighted average cost of the shares reacquired is charged to a contra account in the equity. When the treasury shares are reissued, gains are credited to a separate account in equity, “treasury shares reserve”, which is not distributable. Any realised losses are charged to the same account to the extent of the credit balance on that account. Any excess losses are charged to retained earnings then to the Group’s voluntary reserve and statutory reserve. Gains realised subsequently on the
NOTES TO THE CONSOLIDATED FINANCIAL STATEMENTSAt 31 December 2012

50
First Investment Company K.S.C. (Closed) and its Subsidiaries
2.3 SUMMARY OF SIGNIFICANT ACCOUNTING POLICIES (continued)j) Treasury shares (continued)
sale of treasury shares are first used to offset any previously recorded losses in the order of reserves, retained earnings and the treasury shares reserve account. No cash dividends are paid on these shares.
The issue of bonus shares increases the number of treasury shares proportionately and reduces the average cost per share without affecting the total cost of treasury shares. Part of the reserves created or appropriated and retained earnings equivalent to the cost of treasury shares is not available for distribution throughout the holding period.
k) Foreign currency translation
The Group’s consolidated financial statements are presented in Kuwaiti Dinars, which is also the Parent Company’s functional and presentation currency. Each entity in the Group determines its own functional currency and items included in the financial statements of each entity are measured using that functional currency.
i) Transactions and balancesTransactions in foreign currencies are initially recorded by the Group entities at their respective functional currency rate ruling at the date of the transaction. Monetary assets and liabilities denominated in foreign currencies are retranslated at the functional currency rate of exchange ruling at reporting date. All differences are taken to consolidated statement of income.
Non-monetary items that are measured in terms of historical cost in a foreign currency are translated using the exchange rates as at the dates of the initial transactions. Non-monetary items measured at fair value in a foreign currency are translated using the exchange rates at the date when the fair value is determined. The gain or loss arising on retranslation of non-monetary items is treated in line with the recognition of gain or loss on change in fair value of the item (i.e. translation differences on items whose fair value gain or loss is recognised in other comprehensive income or consolidated statement of income is also recognised in other comprehensive income or consolidated statement of income, respectively).
ii) Group companiesAssets and liabilities of foreign entities are translated into Kuwaiti Dinars at the year end rates of exchange and the results of these entities are translated into Kuwaiti Dinars at the average rates of exchange for the year. On equity accounting, the carrying value of the associates is translated into Kuwaiti Dinars at the year end rates of exchange and the results of the associates are translated into Kuwaiti Dinars at the average rates of exchange for the year. All exchange differences are taken to the foreign currency translation reserve until disposal at which time they are recognised in the consolidated statement of income.
l) Fiduciary assetsAssets held in trust or in a fiduciary capacity are not treated as assets of the Group and accordingly are not included in these consolidated financial statements, but are disclosed in this note of the consolidated financial statements.
m) ProvisionsProvisions are recognised when the Group has a present obligation (legal or constructive) arising from a past event and the costs to settle the obligation are both probable and able to be reliably measured.
NOTES TO THE CONSOLIDATED FINANCIAL STATEMENTSAt 31 December 2012

51
First Investment Company K.S.C. (Closed) and its Subsidiaries FIC Annual Report 2012
2.3 SUMMARY OF SIGNIFICANT ACCOUNTING POLICIES (continued)n) Taxation
Kuwait Foundation for the Advancement of Sciences (KFAS)The Parent Company calculates the contribution to KFAS at 1% of taxable profit for the year in accordance with the modified calculation based on the Foundation’s Board of Directors resolution, which states that the income from associates and subsidiaries, Board of Directors’ remuneration and transfer to statutory reserve should be excluded from profit for the year when determining the contribution.
National Labour Support Tax (NLST)The Parent Company calculates NLST in accordance with Law No. 19 of 2000 and the Minister of Finance Resolution No. 24 of 2006 at 2.5% of taxable profit for the year after deducting Board of Directors’ remuneration for the year. As per law, income from associates and subsidiaries, cash dividends from listed companies which are subjected to NLST are deducted from the profit for the year.
ZakatZakat is calculated at 1% of the profit of the Parent Company in accordance with Law No. 46 of 2006 and the Ministry of Finance resolution No. 58/2007.
2.4 SIGNIFICANT ACCOUNTING JUDGMENTS, ESTIMATES AND ASSUMPTIONS
The preparation of the Group’s consolidated financial statements requires management to make judgments, estimates and assumptions that affect the reported amounts of revenues, expenses, assets and liabilities, and the disclosure of contingent liabilities, at the reporting date. However, uncertainty about these assumptions and estimates could result in outcomes that could require a material adjustment to the carrying amount of the asset or liability affected in future periods.
JudgmentsIn the process of applying the Group’s accounting policies, management has made the following judgments, which have the most significant effect on the amounts recognised in the consolidated financial statements:
Classification of investmentsManagement decides on acquisition of an investment whether it should be classified as at fair value through statement of income or available-for-sale.
Classification of investments as fair value through statement of income depends on how management monitors the performance of these investments. When they have readily available reliable fair values and the changes in fair values are reported as part of statement of income in the management accounts, they are classified as fair value through statement of income.
All other financial assets are classified as available-for-sale.
Classification of real estate Management decides on acquisition of a real estate whether it should be classified as trading, property held for development or investment property.
NOTES TO THE CONSOLIDATED FINANCIAL STATEMENTSAt 31 December 2012

52
First Investment Company K.S.C. (Closed) and its Subsidiaries
2.4 SIGNIFICANT ACCOUNTING JUDGMENTS, ESTIMATES AND ASSUMPTIONS (continued)
The Group classifies property as property under development if it is acquired with the intention of development and for future sale in the ordinary course of business.
The Group classifies property as investment property if it is acquired to generate rental income or for capital appreciation, or for undetermined future use.
Estimates and assumptionsThe key assumptions concerning the future and other key sources of estimation uncertainty at the reporting date, that have a significant risk of causing a material adjustment to the carrying amounts of assets and liabilities within the next financial year, are described below. The Group based its assumptions and estimates on parameters available when the consolidated financial statements were prepared. Existing circumstances and assumptions about future developments, however, may change due to market changes or circumstances arising beyond the control of the Group. Such changes are reflected in the assumptions when they occur.
Impairment of investment in associatesAfter application of the equity method, the Group determines whether it is necessary to recognise any impairment loss on the Group’s investment in its associated companies, at each reporting date based on existence of any objective evidence that the investment in the associate is impaired. If this is the case the Group calculates the amount of impairment as the difference between the recoverable amount of the associate and its carrying value and recognises the amount in the consolidated statement of income.
Impairment of investmentsThe Group treats available-for-sale equity investments as impaired when there has been a significant or prolonged decline in the fair value below its cost or where other objective evidence of impairment exists. The determination of what is “significant” or “prolonged” requires considerable judgment.
Valuation of unquoted investmentsValuation of unquoted equity investments is normally based on one of the following:
• Recent arm’s length market transactions;• Current fair value of another instrument that is substantially the same;• The expected cash flows discounted at current rates applicable for items with similar terms and
risk characteristics; and• Other valuation models.
The determination of the cash flows and discount factors for unquoted equity investments requires significant estimation.
Valuation of investment propertiesFair value of investment properties is determined based on valuations by independent registered real estate assessors which have relevant experience in the local and international property market.
NOTES TO THE CONSOLIDATED FINANCIAL STATEMENTSAt 31 December 2012

53
First Investment Company K.S.C. (Closed) and its Subsidiaries FIC Annual Report 2012
2.5 CHANGES IN ACCOUNTING POLICY AND DISCLOSURES
New and amended standards and interpretationsThe accounting policies adopted are consistent with those of the previous financial year, except for the following new and amended to IFRS and IFRIC interpretation effective as of 1 January 2012:
IAS 12 Income Taxes – Recovery of Underlying AssetsThe amendment clarified the determination of deferred tax on investment property measured at fair value and introduces a rebuttable presumption that deferred tax on investment property measured using the fair value model in IAS 40 should be determined on the basis that its carrying amount will be recovered through sale. It implies the requirement that deferred tax on non-depreciable assets that are measured using the revaluation model in IAS 16 always be measured on a sale basis of the asset. The amendment becomes effective for annual periods beginning on or after 1 January 2012 and has been no effect on the Group’s financial position, performance or its disclosures.
IFRS 7 Financial Instruments: Disclosures — Enhanced Derecognition Disclosure RequirementsThe amendment requires additional disclosure about financial assets that have been transferred but not derecognised to enable the user of the Group’s financial statements to understand the relationship with those assets that have not been derecognised and their associated liabilities. In addition, the amendment requires disclosures about the entity’s continuing involvement in derecognised assets to enable the users to evaluate the nature of, and risks associated with, such involvement. The amendment is effective for annual periods beginning on or after 1 July 2011. The Group does not have any assets with these characteristics so there has been no effect on the presentation of its financial statements.
2.6 STANDARDS ISSUED BUT NOT YET EFFECTIVE
The standards and interpretations that are issued, but not yet effective, up to the date of issuance of the Group’s financial statements are disclosed below. The Group intends to adopt these standards, if applicable, when they become effective.
IAS 1 Presentation of Items of Other Comprehensive Income – Amendments to IAS 1The amendments to IAS 1 change the grouping of items presented in other comprehensive income (OCI). Items that could be reclassified (or ‘recycled’) to profit or loss at a future point in time (for example upon derecognition or settlement) would be presented separately from items that will never be reclassified. The amendment affects presentation only and has no impact on the Group’s financial position or performance. The amendment becomes effective for annual periods beginning on or after 1 July 2012.
IAS 19 Employee Benefits (Revised)The IASB has issued numerous amendments to IAS 19. These range from fundamental changes such as removing the corridor mechanism and the concept of expected returns on plan assets to simple clarifications and re-wording. These amendments are not expected to impact the Group’s financial position or performance and become effective on 1 January 2013.
NOTES TO THE CONSOLIDATED FINANCIAL STATEMENTSAt 31 December 2012

54
First Investment Company K.S.C. (Closed) and its Subsidiaries
2.6 STANDARDS ISSUED BUT NOT YET EFFECTIVE (continued)
IAS 28 Investments in Associates and Joint Ventures (as revised in 2011)As a consequence of the new IFRS 11 Joint Arrangements, and IFRS 12 Disclosure of Interests in Other Entities, IAS 28 Investments in Associates, has been renamed IAS 28 Investments in Associates and Joint Ventures, and describes the application of the equity method to investments in joint ventures in addition to associates. The revised standard becomes effective for annual periods beginning on or after 1 January 2013.
IAS 32 Offsetting Financial Assets and Financial Liabilities — Amendments to IAS 32These amendments clarify the meaning of “currently has a legally enforceable right to set-off”. The amendments also clarify the application of the IAS 32 offsetting criteria to settlement systems (such as central clearing house systems) which apply gross settlement mechanisms that are not simultaneous. These amendments are not expected to impact the Group’s financial position or performance and become effective for annual periods beginning on or after 1 January 2014.
IFRS 7 Disclosures — Offsetting Financial Assets and Financial Liabilities — Amendments to IFRS 7These amendments require an entity to disclose information about rights to set-off and related arrangements (e.g., collateral agreements). The disclosures would provide users with information that is useful in evaluating the effect of netting arrangements on an entity’s financial position. The new disclosures are required for all recognised financial instruments that are set off in accordance with IAS 32 Financial Instruments: Presentation. The disclosures also apply to recognised financial instruments that are subject to an enforceable master netting arrangement or similar agreement, irrespective of whether they are set off in accordance with IAS 32. These amendments will not impact the Group’s financial position or performance and become effective for annual periods beginning on or after 1 January 2013.
IFRS 9 Financial Instruments: Classification and MeasurementIFRS 9, as issued, reflects the first phase of the IASB’s work on the replacement of IAS 39 and applies to classification and measurement of financial assets and financial liabilities as defined in IAS 39. The standard was initially effective for annual periods beginning on or after 1 January 2013, but Amendments to IFRS 9 Mandatory Effective Date of IFRS 9 and Transition Disclosures, issued in December 2011, moved the mandatory effective date to 1 January 2015. In subsequent phases, the IASB will address hedge accounting and impairment of financial assets. The adoption of the first phase of IFRS 9 will have an effect on the classification and measurement of the Group’s financial assets, but will not have an impact on classification and measurements of financial liabilities. The Group will quantify the effect in conjunction with the other phases, when the final standard including all phases is issued.
IFRS 10 Consolidated Financial Statements, IAS 27 Separate Financial StatementsIFRS 10 replaces the portion of IAS 27 Consolidated and Separate Financial Statements that addresses the accounting for consolidated financial statements. It also addresses the issues raised in SIC-12 Consolidation Special Purpose Entities.
IFRS 10 establishes a single control model that applies to all entities including special purpose entities. The changes introduced by IFRS 10 will require management to exercise significant judgment to determine which entities are controlled and therefore are required to be consolidated by a Parent Company, compared with the requirements that were in IAS 27. Based on the preliminary analyses performed, IFRS 10 is not expected to have any impact on the currently held investments of the Group.
NOTES TO THE CONSOLIDATED FINANCIAL STATEMENTSAt 31 December 2012

55
First Investment Company K.S.C. (Closed) and its Subsidiaries FIC Annual Report 2012
2.6 STANDARDS ISSUED BUT NOT YET EFFECTIVE (continued)
This standard becomes effective for annual periods beginning on or after 1 January 2013.
IFRS 11 Joint ArrangementsIFRS 11 replaces IAS 31 Interests in Joint Ventures and SIC-13 Jointly-controlled Entities — Non-monetary Contributions by Ventures. IFRS 11 removes the option to account for jointly controlled entities (JCEs) using proportionate consolidation. Instead, JCEs that meet the definition of a joint venture must be accounted for using the equity method.
This new standard will have no impact on the Group’s financial statements and become effective for annual periods beginning on or after 1 January 2013.
IFRS 12 Disclosure of Interests in Other EntitiesIFRS 12 includes all of the disclosures that were previously in IAS 27 related to consolidated financial statements, as well as all of the disclosures that were previously included in IAS 31 and IAS 28. These disclosures relate to an entity’s interests in subsidiaries, joint arrangements, associates and structured entities. A number of new disclosures are also required, but has no impact on the Group’s financial position or performance. This standard becomes effective for annual periods beginning on or after 1 January 2013.
IFRS 13 Fair Value MeasurementIFRS 13 establishes a single source of guidance under IFRS for all fair value measurements. IFRS 13 does not change when an entity is required to use fair value, but rather provides guidance on how to measure fair value under IFRS when fair value is required or permitted. The Group is currently assessing the impact that this standard will have on the financial position and performance, but based on the preliminary analyses, no material impact is expected. This standard becomes effective for annual periods beginning on or after 1 January 2013.
3 EMPLOYEE STOCK OPTION PLAN
The Parent Company operates share option plan to reward the performance of its employees. Under this plan, the Parent Company may issue shares for cash to eligible employees by increasing its share capital. This scheme is in operation for a period from 1 January 2003. The total capital increase to meet the requirements of the scheme should not exceed 10% of the Parent Company’s share capital at 31 December 2002.
No share option were issued or exercised during the current year (2011: Nil). Accordingly no charge was recorded in the consolidated statement of income (2011: Nil).
NOTES TO THE CONSOLIDATED FINANCIAL STATEMENTSAt 31 December 2012

56
First Investment Company K.S.C. (Closed) and its Subsidiaries
4 GAIN (LOSS) ON FINANCIAL ASSETS AT FAIR VALUE THROUGH STATEMENT OF INCOME
Realised gain (loss) Unrealised loss
2012 2011 2012 2011 KD KD KD KD
Held for trading 54,009 (965,042) (125,959) (48,875)Designated - 1,715,106 - -
54,009 750,064 (125,959) (48,875)
5 DIVIDEND INCOME
2012 2011KD KD
Financial assets at fair value through statement of income 9,012 95,770Financial assets available-for-sale 101,521 92,953
110,533 188,723
6 BASIC AND DILUTED EARNINGS PER SHARE ATTRIBUTABLE TO OWNERS OF THE PARENT COMPANY
Basic and diluted earnings per share are computed by dividing the profit for the year attributable to owners of the Parent Company by the weighted average number of shares outstanding during the year after adjusting for treasury shares as follows:
2012 KD
2011 KD
Profit attributable to owners of the Parent Company (KD) 2,909,976 2,066,288
Weighted average number of outstanding shares 651,070,551 651,070,551Less: weighted average number of treasury shares (66,082) -
Weighted average number of shares 651,004,469 651,070,551
Basic and diluted earnings per share attributable to owners of the Parent Company
4.5 fils 3.2 fils
The Parent Company had no outstanding dilutive potential shares.
NOTES TO THE CONSOLIDATED FINANCIAL STATEMENTSAt 31 December 2012

57
First Investment Company K.S.C. (Closed) and its Subsidiaries FIC Annual Report 2012
7 BANK BALANCES AND CASH
2012 2011
KD KD
Cash 400 400
Bank balances 8,116,341 9,314,260
8,116,741 9,314,660
Bank balances include KD nil (2011: KD 2,199,333), held with portfolio managers, which can only be used for trading in securities listed on the Saudi Stock Exchange (Tadawul).
8 FINANCIAL ASSETS AT FAIR VALUE THROUGH STATEMENT OF INCOME
2012 2011
KD KD
Held for trading
Quoted equity securities - 158,627
Managed funds and portfolio 1,029,976 1,449,562
Designated
Unquoted equity securities 321,264 196,558
1,351,240 1,804,747
Managed funds and portfolios are primarily invested in money market instruments and certain equity securities. .
NOTES TO THE CONSOLIDATED FINANCIAL STATEMENTSAt 31 December 2012

58
First Investment Company K.S.C. (Closed) and its Subsidiaries
9 MURABAHA AND IJARA RECEIVABLES
Murabaha Ijara Total
2012 2011 2012 2011 2012 2011 KD KD KD KD KD KD
Gross amount 3,158,582 5,657,834 176,162 724,453 3,334,744 6,382,287Less:deferred income - (4,590) - - - (4,590)
3,158,582 5,653,244 176,162 724,453 3,334,744 6,377,697Less: general provision (546,783) (550,783) - - (546,783) (550,783)Less: specific provision (495,792) (2,718,545) (176,162) (724,453) (671,954) (3,442,998)
Total provision(1,042,575) (3,269,328) (176,162) (724,453) (1,218,737) (3,993,781)
2,116,007 2,383,916 - - 2,116,007 2,383,916
Murabaha receivables amounting to KD 1,363,575 have been fully settled subsequent to the year end. Average profit rate attributable to murabaha receivables during the year was 2.75% (2011: 4.16%) per annum.
Movement in total provision on murabaha and ijara receivables is as follows:
2012 2011KD KD
At 1 January 3,993,781 1,963,672
(Reversal) provision for the year – net (453,980) 432,859Written off during the year (2,321,064) -Specific provision arising on business combination - 1,597,250
At 31 December 1,218,737 3,993,781
NOTES TO THE CONSOLIDATED FINANCIAL STATEMENTSAt 31 December 2012

59
First Investment Company K.S.C. (Closed) and its Subsidiaries FIC Annual Report 2012
10 FINANCIAL ASSETS AVAILABLE-FOR-SALE
2012 2011 KD KD
Unquoted equity securities 31,906,889 33,884,881Quoted equity securities 198,646 6,905,703Sukuk - 23,655,161Unquoted managed funds 160,557 264,172Real estate portfolios - 352,723
32,266,092 65,062,640
Unquoted equity securities are stated at cost, less impairment, if any, due to the unpredictable nature of their future cash flows and lack of other suitable methods for arriving at a reliable fair value of these investments. There is no active market for these financial assets and the Group intends to hold them for the long term. Management has performed a review of its unquoted equity investments to assess whether impairment has occurred in the value of these investments and recorded an impairment loss of KD 1,434,935 (2011: KD 600,000) in the consolidated statement of income. Based on the latest available financial information, management is of the view that no further impairment provision is required as at 31 December 2012 in respect of these investments.
During the year, the Group has recorded impairment loss of KD 5,029 (2011: KD 447,912) on quoted equity investments and KD nil (2011: KD 96,407) on unquoted managed funds where there has been a significant or prolonged decline in fair value.
During the current year, a quoted equity security with a carrying value of KD 6,593,439 and acquisition cost of KD 6,060,911 has been transferred to a financial institution against settlement of murabaha payables of KD 7,617,661 (Note 17) resulting in a gain of KD 1,556,750 which is recognised in the consolidated statement of income.
During the current year, the Parent Company has disposed its investment in sukuks in exchange of portfolio of investment properties with a fair value of KD 25,144,156 determined by two independent valuers and recognised a gain of KD 1,130,997 in the consolidated statement of income. This portfolio has been classified as investment properties (Note 13).
NOTES TO THE CONSOLIDATED FINANCIAL STATEMENTSAt 31 December 2012

60
First Investment Company K.S.C. (Closed) and its Subsidiaries
11 INVESTMENT IN ASSOCIATES
Details of associates are as follows:
NameCountry of
incorporation% equity interest Principal activity
2012 2011
First Real Estate Investment Company K.S.C. (Closed) (a) Kuwait - 19.79% Real estate investment
First Education Company K.S.C. (Closed) Kuwait 17.16% 16.49% Investments in educational sector
Taameer Investment Company (O.L.L.C) Oman 37.40% 37.40% Real estate investment
Arkan Al-Kuwait Real Estate Company K.S.C.(Closed) Kuwait 29.03% 28.86% Real estate financing
and leasing
First Investment Bank B.S.C. (Closed) (b) Bahrain - 26.66% Investment bank
Sahab Al-Khalij Real Estate Company B.S.C. (Closed) Bahrain 35.29% 35.29% Real estate investment
Adeem Capital (Saudi Closed Joint Stock Company) Saudi Arabia 40% 40% Asset management
Al Jazeera Al Oula Real Esate (W.L.L) (c) Saud Arabia 20.90% - Real estate investment
Burgan Company for Well Drilling K.S.C. (Closed) (“BCWD”) (d) Kuwait 20.46% 20.07% Investment in energy
Sector
a) During the year, the Parent Company has transferred its entire stake in First Real Estate Company K.S.C. (Closed) with a carrying value of KD 3,240,286 to a financial institution against settlement of a murabaha payable amounting to KD 3,938,662 (Note 17) and accrued profit amounting to KD 69,549 resulting in a gain of KD 767,925 which is recognised in the consolidated statement of income.
NOTES TO THE CONSOLIDATED FINANCIAL STATEMENTSAt 31 December 2012

61
First Investment Company K.S.C. (Closed) and its Subsidiaries FIC Annual Report 2012
11 INVESTMENT IN ASSOCIATES (continued)
b) During the year, First Investment Bank B.S.C. (Closed) has been liquidated. Accordingly, the Group has received final payment of KD 1,624,309 as its proportionate share in the net assets on its liquidation and recorded a gain of KD 4,374 in the consolidated statement of income.
c) During the year, the Parent Company has invested in Al Jazeera Al Oula Real Estate W.L.L. (“JORE”) of KD 1,412,667 which represents 20.90% of the net assets of JORE. Currently, the Parent Company also holds 79.10% of the net assets of JORE in a fiduciary capacity which is not reflected in the Group’s consolidated statement of financial position.
d) During the year, the Group finalised the purchase price allocation (PPA) exercise of BCWD, and the provisional values of assets acquired and liabilities assumed at acquisition date have been adjusted to reflect the fair values determined through PPA. Effect of PPA is as follows:
TotalKD
Total assets at acquisition date 171,175,238Effect of PPA:Fair value adjustment to property, plant and equipment (i) 330,626Intangible assets (ii) 48,094,501Other adjustments (iii) (9,303,147)
210,297,218
Total liabilities at acquisition date (118,574,793)
Fair value of total net assets 91,722,425
Group’ share in fair value of total net assets (20.07%) 18,408,690Less: Cost of 20.07% interest (24,303,578)
Goodwill 5,894,888
NOTES TO THE CONSOLIDATED FINANCIAL STATEMENTSAt 31 December 2012

62
First Investment Company K.S.C. (Closed) and its Subsidiaries
11 INVESTMENT IN ASSOCIATES (continued)
i) Management has estimated that the remaining useful life of property, plant and equipment is same as stated in BCWD financial statements.
ii) Intangible assets represent fair value of customer related contracts amounting to KD 23,077,846, fair value of license and brand name amounting to KD 22,766,655 and rights of utilization of land amounting to KD 2,250,000. Management estimated that the useful life of these intangible assets is indefinite.
iii) Other adjustments represent adjustments to ‘Prepayments and other receivable’ amounting to KD 9,303,147 in relation to deferred penalties from a customer for certain contracts.
Classification of an investment as an investment in associate where the Group holds less than 20% ownership of the investee is based on the existence of significant influence exercised by the Group. This is evidenced by the Group’s representation on the Board of Directors and participation in the policy and decision making process of the investee to a sufficient degree for the Group to demonstrate that it has significant influence over the associate.
The movement in the carrying value of investment in associates is as follows:
2012 2011KD KD
At 1 January 55,293,202 49,208,962
Additions 2,255,609 5,595
Arising on acquisition of a subsidiary (Note 19) - 10,528,716
Disposals (5,944,238) (13,788,694)
Dividend received (319,992) -
Gain on disposal 772,299 2,416,626
Transfer from financial assets available-for-sale - 13,774,862
Transfer to subsidiaries (Note 19) - (7,082,356)
Foreign currency translation adjustment 64,841 (265,698)
Cumulative change in fair value 565 582,787
Share of results 896,278 (87,598)
Treasury shares reserve (18,055) -
At 31 December 53,000,509 55,293,202
NOTES TO THE CONSOLIDATED FINANCIAL STATEMENTSAt 31 December 2012

63
First Investment Company K.S.C. (Closed) and its Subsidiaries FIC Annual Report 2012
11 INVESTMENT IN ASSOCIATES (continued)
The following table illustrates summarised financial information of the Group’s investment in associates:
2012 2011KD KD
Share of associate’s statement of financial position:
Assets 71,742,384 74,943,802
Liabilities (27,169,385) (28,245,603)
Net assets 44,572,999 46,698,199
Goodwill 8,427,510 8,595,003
53,000,509 55,293,202
Share of associate’s revenue and results:
Revenue 8,945,044 3,479,848
Result – Profit (Loss) 896,278 (87,598)
Investment in associates include quoted associates with a carrying value of KD 35,401,811 (2011: KD 34,568,583) having a market value of KD 13,604,310 (2011: KD 13,260,995).
The reporting dates of certain associates are not more than three months from that of the Group. In the opinion of management, there were no significant events or transactions between the reporting dates of associates and 31 December 2012.
12 PROPERTIES UNDER DEVELOPMENT 2012 2011KD KD
At 1 January 17,857,359 36,771,351Additions 543,217 2,654,010Disposals (1,352,302) (21,294,454)Foreign currency adjustment 335,347 (273,548)
At 31 December 17,383,621 17,857,359
During the year the Group has disposed off certain of its properties under development, which resulted in a gain of KD 153,277 (2011: 3,055,552).
NOTES TO THE CONSOLIDATED FINANCIAL STATEMENTSAt 31 December 2012

64
First Investment Company K.S.C. (Closed) and its Subsidiaries
13 INVESTMENT PROPERTIES 2012 2011KD KD
At 1 January 6,383,054 1,950,803Addition 25,951,251 -Transfers 352,723 8,785,795Disposals (6,117,856) (4,784,863)Gain on disposal 92,113 -Revaluation gain 137,324 467,458Foreign currency adjustment 17,689 (36,139)
At 31 December 26,816,298 6,383,054
Investment properties are stated at fair values which have been determined based on valuations performed by accredited independent valuers as at 31 December 2012. The fair values of the properties have been determined based on transactions observable in the market.
Additions during the year includes real estate portfolio with a fair value of KD 25,144,156 which have been received in exchange of the Parent Company’s investment in sukuks (Note 10). Legal ownership of this portfolio is in the process of being registered in the name of the Parent Company.
14 OTHER ASSETS
2012 2011KD KD
Receivable from sale of property under development 1,216,651 2,383,474Other receivables 3,111,402 7,131,375Management fees receivable 111,423 105,937
4,439,476 9,620,786Less: provision (67,247) (4,098,929)
At 31 December 4,372,229 5,521,857
NOTES TO THE CONSOLIDATED FINANCIAL STATEMENTSAt 31 December 2012

65
First Investment Company K.S.C. (Closed) and its Subsidiaries FIC Annual Report 2012
14 OTHER ASSETS (continued)
Movement in provision against other assets is as follows: 2012 2011
KD KD
At 1 January 4,098,929 4,449,976Charge for the year 192,161 1,659,751Written off (4,223,843) (2,010,798)
At 31 December 67,247 4,098,929
15 SHARE CAPITAL, SHARE PREMIUM AND TREASURY SHARES
a) Share capital and share premium;
The authorised, issued and fully paid up in cash, capital of the Parent Company amounted to 651,070,551 shares (2011: 651,070,551 shares) of 100 fils each.
Share premium is not available for distribution.
The Board of Directors of the Parent Company has recommended no cash dividends or bonus shares for the year ended 31 December 2012. This proposal is subject to approval by the shareholders’ Annual General Assembly meeting.
On 8 May 2012, the Annual General Assembly of the shareholders of the Parent Company approved no cash dividends or bonus shares for the year ended 31 December 2011.
On 9 May 2011, the Annual General Assembly of the shareholders of the Parent Company approved no cash dividends or bonus shares for the year ended 31 December 2010. It approved the write-off of accumulated losses of KD 10,516,209 as of 31 December 2010, against share premium of KD 3,240,221 and statutory reserve of KD 7,275,988.
b) Treasury shares; 2012 2011
Number of treasury shares 860,000 -Percentage of issued shares 0.13% -Cost of treasury shares in KD 104,693 -Market value in KD 104,920 -
Treasury shares reserve equivalent to the cost of treasury shares have been earmarked as non-distributable.
NOTES TO THE CONSOLIDATED FINANCIAL STATEMENTSAt 31 December 2012

66
First Investment Company K.S.C. (Closed) and its Subsidiaries
16 RESERVES
a) Statutory reserveAs required by the Law of Commercial Companies and the Parent Company’s Articles of Association, 10% of the profit for the year attributable to owners of the Parent Company before contribution to KFAS, NLST, Zakat, and Directors’ remuneration is transferred to statutory reserve. The Parent Company may resolve to discontinue such annual transfers when the reserve totals 50% of the paid up share capital.
Distribution of the reserve is limited to the amount required to enable the payment of a dividend of 5% of paid up share capital to be made in years when retained earnings are not sufficient for the payment of dividend of that amount.
b) Voluntary reserveIn accordance with Article 49 of the Parent Company’s Articles of Association, a percentage of the profit for the year attributable to Parent Company’s shareholders proposed by the board of directors to be allocated to voluntary reserve. The Annual General Assembly of shareholders may, upon a recommendation by the Board of Directors, resolve to discontinue such annual transfers.
The Board of Directors have not recommended any transfer to voluntary reserve for the current year.
17 MURABAHA AND SUKUK PAYABLES2012 2011KD KD
Murabaha payables 2,360,317 21,672,220Sukuk payable 27,200,000 27,267,000
29,560,317 48,939,220
During the current year, the management of the Parent Company has settled its murabaha payables amounting to KD 12,666,688 with certain banks and financial institutions by transfer of certain assets (which includes financial assets available-for-sale (Note 10) and investment in associates (Note 11)) resulting in total gain on transfer of assets of KD 2,324,675 which has been recognised in the consolidated financial statements. On settlement of murabaha payables, the Parent Company received a discount of KD 1,110,365 which has been recognised in the consolidated statement of income.
Murabaha payablesMurabaha payables represent murabaha contracts with various financial institutions. The average effective cost attributable to these contracts are 5 % (2011: 3.58% to 5.00%) per annum.
The terms of the financing agreement of murabaha facility amounting to KD nil (2011: KD 3,719,365) restrict the use of the facility to trading in Tadawul listed Shariah compliant shares.
NOTES TO THE CONSOLIDATED FINANCIAL STATEMENTSAt 31 December 2012

67
First Investment Company K.S.C. (Closed) and its Subsidiaries FIC Annual Report 2012
17 MURABAHA AND SUKUK PAYABLES (continued)
Sukuk payableOn 16 September 2010, the Parent Company entered into a restructuring agreement with a financial institution, a related party, which settled its entire obligations and liabilities under the original murabaha payables amounting to KD 42,097,000 by issuing a sukuk certificate by FIC Sukuk Company Limited, a Cayman Island special purpose vehicle (“SPV”). The SPV had been established by the Parent Company to hold on trust all rights, title interests and benefits of the sukuk assets for the sukuk holder under the terms of the restructuring agreement with the financial institution. As part of the restructuring agreement, the Parent Company will transfer the beneficial interest of certain assets (which may include financial assets at fair value through statement of income, financial assets available-for-sale and investment in associates) (“Sukuk Assets”) to the SPV which will hold these assets in trust for the sukuks held by the financial institution. During the prior year, the sukuk liability of KD 14,830,000 was settled by transferring a financial asset available-for-sale.
Repayment of the remaining sukuk payables will be in four semi-annual instalments starting from 31 March 2014. The profit rate of the sukuk payables is 6 months CBK discount rate plus 250 basis points per annum. It also requires, among other things, certain restrictions on the payment of dividends and a requirement to maintain a minimum ratio of total liabilities to total equity of 1.5:1 of the Group.
18 OTHER LIABILITIES 2012 2011
KD KD
Other payables 2,308,801 2,307,431Accrued expenses 1,975,275 2,550,574
4,284,076 4,858,005
19 BUSINESS COMBINATION
Business combinations in 2011On 1 July 2011, the Parent Company entered into an agreement with a shareholder of FERCO (an associate at the time), whereby the shareholder had transferred only its members voting rights in FERCO’s Board of Directors to the Parent Company. As a result of this agreement, the Parent Company controls FERCO through majority of representation (4 out of total 7) on the Board of Directors of FERCO. Accordingly, FERCO had become a subsidiary of the Group and had been consolidated from the date of exercise of control. The Parent Company holds an effective equity interest of 33.21% in FERCO which was previously classified as “investment in associates”.
As a result of the business combination of FERCO, the following subsidiary companies of FERCO also became subsidiaries of the Group:
NOTES TO THE CONSOLIDATED FINANCIAL STATEMENTSAt 31 December 2012

68
First Investment Company K.S.C. (Closed) and its Subsidiaries
19 BUSINESS COMBINATION (continued)
Previously held equity interest
Additional interest through
FERCO
Post acquisition
equity interest
Asian Petroleum Facilities Maintenance Company W.L.L. 50% 50% 100%Q80 Valve Industries Factory 50% 50% 100%
These business combinations have been accounted for in accordance with IFRS 3 Business Combinations. As the business combinations were achieved in stages, the Group re-measured its previously held equity interests in FERCO and its subsidiaries at the business combination date fair value which is not materially different from the carrying value of previously held equity interest. Accordingly, no gain or loss was recorded in the consolidated statement of income.
20 RELATED PARTY TRANSACTIONS
Related parties represent associated companies, managed funds, major shareholders, directors and key management personnel of the Group, and entities controlled, jointly controlled or significantly influenced by such parties. Pricing policies and terms of these transactions are approved by the Group’s management.
Transactions with related parties are as follows:2012 2011
AssociatesMajor
shareholder Total TotalKD KD KD KD
Consolidated statement of incomeGain on disposal of investment properties 92,113 - 92,113 4,319,246Management fees - 41,402 41,402 123,030Finance costs - 1,400,458 1,400,458 2,152,086
Consolidated statement of financial positionSukuk payable (Note 17) - 27,200,000 27,200,000 27,267,000Management fees receivable - 25,162 25,162 13,429
Key management personnel compensation2012 2011 KD KD
Salaries and other short term benefits 368,650 307,651Terminal benefits 132,223 53,467
500,873 361,118
Other transactionsThe Group also manages portfolios on behalf of related parties amounting to KD 5,985,105 (2011: KD 65,372,152) which are not reflected in the Group’s consolidated statement of financial position.
NOTES TO THE CONSOLIDATED FINANCIAL STATEMENTSAt 31 December 2012

69
First Investment Com
pany K.S.C. (Closed) and its SubsidiariesN
OTES TO
THE C
ON
SOLIDATED FIN
ANC
IAL STATEMEN
TSAt 31 D
ecember 2012
Kuwait
Saudi ArabiaOthers
Total
Year ended 31 December
20122011
20122011
20122011
20122011
KDKD
KDKD
KDKD
KDKD
Revenue3,412,366
3,200,6114,566,976
7,120,645234,278
4,052,1078,213,620
14,373,363Expenses
(3,943,998)(7,805,254)
(536,993)(2,875,439)
(654,300)(752,112)
(5,135,291)(11,432,805)
Results – Profit (loss)(531,632)
(4,604,643)4,029,983
4,245,206(420,022)
3,299,9953,078,329
2,940,558
At 31 December
Operating assets
54,160,31257,849,806
74,049,68185,381,677
18,411,51221,583,081
146,621,505164,814,564
Operating liabilities
32,032,89448,047,829
1,811,4995,460,485
-288,911
33,844,39353,797,225
Other disclosures:
Investment in associates (Note 11)
37,942,81940,199,692
3,049,3811,643,592
12,008,30913,449,918
53,000,50955,293,202
(Reversal) provision against murabaha
receivables – net (Note 9)(453,980)
432,859-
--
-(453,980)
432,859
Provision against other assets (Note 14)192,161
--
1,659,751-
-192,161
1,659,751Im
pairment of financial assets available-
for-sale (Note 10)785,664
37,718-
410,194654,300
696,4071,439,964
1,144,319
21 SEGM
ENT INFORMATION
Managem
ent monitors the operating results of its geographical segm
ents separately for the purpose of making decisions about resource allocation and
performance assessm
ent. Segm
ent performance is evaluated based on return on investm
ents. For managem
ent purposes, the Group is organised into three m
ajor geographical segm
ents:•
Kuwait•
Saudi Arabia•
Others
The Group does not have any inter-segm
ent transactions.
FIC Annual Report 2012

70
First Investment Company K.S.C. (Closed) and its Subsidiaries
22 FINANCIAL RISK MANAGEMENT
Risk is inherent in the Group’s activities but it is managed through a process of ongoing identification, measurement and monitoring, subject to risk limits and other controls. This process of risk management is critical to the Group’s continuing profitability and each individual within the Group is accountable for the risk exposures relating to his or her responsibilities. The Group is exposed to credit risk, liquidity risk and market risk. Market risk is subdivided into profit rate risk, foreign currency risk and equity price risk. It is also subject to operating risks. The independent risk control process does not include business risks such as changes in the environment, technology and industry. They are monitored through the Group’s strategic planning process. The Board of Directors are ultimately responsible for the overall risk management approach and for approving the risk strategies and principles.
22.1 CREDIT RISK
Credit risk is the risk that one party to a financial instrument will fail to discharge an obligation and cause the other party to incur a financial loss. The Group manages and controls credit risk by setting limits on the amount of risk it is willing to accept for individual counterparties and for geographical and industry concentrations, and by monitoring exposures in relation to such limits.
The Group’s policy is to enter into murabaha and ijara arrangements only with recognised, creditworthy third parties. The maximum exposure equals the carrying amount as disclosed below. In addition, these receivable balances are monitored on an ongoing basis to assess the potential loss as a result of the risks to which it is exposed and take corrective action.
With respect to credit risk arising from other financial assets of the Group, which comprise bank balance and other assets, the Group’s exposure to credit risk arises from default of the counterparty, with a maximum exposure equal to the carrying amount of these instruments.
Maximum exposure to credit riskThe table below shows the maximum exposure to credit risk for the components of the consolidated statement of financial position, without taking account of any collateral and other credit enhancements.
BY CLASS OF FINANCIAL ASSETS
2012 2011 KD KD
Bank balances (excluding cash on hand) 8,116,341 9,314,260Murabaha and ijara receivables 2,116,007 2,383,916Other assets 4,372,229 5,521,857
Total credit risk exposure 14,604,577 17,220,033
The maximum exposure to a single counterparty is KD 3,402,834 (2011: KD 2,199,333).
NOTES TO THE CONSOLIDATED FINANCIAL STATEMENTSAt 31 December 2012

71
First Investment Company K.S.C. (Closed) and its Subsidiaries FIC Annual Report 2012
22 FINANCIAL RISK MANAGEMENT (continued)
22.1 CREDIT RISK (continued)
Collateral and other credit enhancements
The murabaha and ijara receivables from non-financial institutions are secured against real estate and unquoted securities. Management monitors the market value of collateral and requests additional collateral in accordance with the underlying agreement during its review of the adequacy of the provision for credit losses.
The Group can sell the collateral in case of default by the borrower in accordance with the agreements entered with the borrowers. The Group has an obligation to return the collateral on settlement of the receivable.
The fair value of collateral that the Group holds relating to murabaha receivables at 31 December 2012 amounted to KD 1,117,776 (2011: KD 1,357,064).
Risk concentration of the maximum exposure to credit risk
Concentrations arise when a number of counterparties are engaged in similar business activities, or activities in the same geographic region, or have similar economic features that would cause their ability to meet contractual obligations to be similarly affected by changes in economic, political or other conditions. Concentrations indicate the relative sensitivity of the Group’s performance to developments affecting a particular industry or geographic location.
The Group’s assets, before taking into account any collateral held or credit enhancements can be analysed by the industry sectors as follows:
2012 2011 KD KD
Banks and financial institutions 8,985,934 11,195,592Construction and real estate 3,052,149 3,678,773Individuals 2,566,494 2,345,668
14,604,577 17,220,033
Credit quality of financial assets that are neither past due nor impaired
For murabaha and ijara receivables, neither internal credit grading system nor external credit grades are used by the Group. Currently, the Group is limiting the Islamic financing activities to certain credit worth customers only. During the year no major new financing is granted by the Group.
The Group manages the credit quality by ensuring that adequate collaterals are available for all the individual facilities granted, which the management reviews on a regular basis.
The Group seeks to avoid undue concentrations of risks with individuals or groups of customers in specific locations or business through diversification of financing and investing activities.
NOTES TO THE CONSOLIDATED FINANCIAL STATEMENTSAt 31 December 2012

72
First Investment Company K.S.C. (Closed) and its Subsidiaries
22 FINANCIAL RISK MANAGEMENT (continued)
22.1 CREDIT RISK (continued)
Financial asset by class that are individualy determined to be impaired
Gross exposure
Impairmentprovision
KD KD
At 31 December 2012
Ijara receivables 176,162 (176,162)
Murabaha receivables 1,795,346 (1,042,575)
Other assets 67,247 (67,247)
Gross exposure
Impairmentprovision
KD KD At 31 December 2011
Ijara receivables 724,453 (724,453)Murabaha receivables 4,200,099 (2,718,545)Other assets 4,098,929 (4,098,929)
Analysis of past due but not impaired The Group does not have any past due but not impaired financial assets at 31 December 2012 and 31 December 2011.
NOTES TO THE CONSOLIDATED FINANCIAL STATEMENTSAt 31 December 2012

73
First Investment Company K.S.C. (Closed) and its Subsidiaries FIC Annual Report 2012
22 FINANCIAL RISK MANAGEMENT (continued)
22.2 LIQUIDITY RISK
Liquidity risk is the risk that the Group will be unable to meet its net funding requirements. Liquidity risk can be caused by market disruptions or credit downgrades which may cause certain sources of funding to dry up immediately. To guard against this risk, management has diversified funding sources and assets are managed with liquidity in mind, maintaining a healthy balance of cash and cash equivalents, and readily marketable securities.
The table below summarises the maturity profile of the Group’s assets and liabilities. The maturity profile of bank balances and cash, murabaha and ijara receivables and murabaha payables at the reporting date is based on contractual repayment arrangements. The maturity profile for the remaining assets and liabilities is determined based on management’s estimate of liquidation of those financial assets and settlement of financial liabilities. The maturity profile is monitored by management to ensure adequate liquidity is maintained.
The maturity profile of assets and liabilities at 31 December was as follows:
Maturing within one yearWithin 3 to 6 6 to 12 Sub - Over
2012 3 months months Months Total 1 year TotalKD KD KD KD KD KD
ASSETSBank balances and cash 8,116,741 - - 8,116,741 - 8,116,741Financial assets at fair value through statement of income 819,692 - - 819,692 531,548 1,351,240
Murabaha and ijara receivables 864,556 - - 864,556 1,251,451 2,116,007Financial assets available-for-sale - 1,482,793 1,596,120 3,078,913 29,187,179 32,266,092Investment in associates - - 474,428 474,428 52,526,081 53,000,509
Properties under development - 7,668,020 7,668,020 15,336,040 2,047,581 17,383,621
Investment properties - - - - 26,816,298 26,816,298Other assets 3,384,030 325,040 413,364 4,122,434 249,795 4,372,229Property and equipment - - - - 1,198,768 1,198,768
TOTAL ASSETS 13,185,019 9,475,853 10,151,932 32,812,804 113,808,701 146,621,505
LIABILITIESMurabaha and sukuk payables 300,000 1,703,617 356,700 2,360,317 27,200,000 29,560,317Other liabilities 1,598,263 957,064 129,000 2,684,327 1,599,749 4,284,076
TOTAL LIABILITIES 1,898,263 2,660,681 485,700 5,044,644 28,799,749 33,844,393
NET LIQUIDITY GAP 11,286,756 6,815,172 9,666,232 27,768,160 85,008,952 112,777,112
NOTES TO THE CONSOLIDATED FINANCIAL STATEMENTSAt 31 December 2012

74
First Investment Company K.S.C. (Closed) and its Subsidiaries
22 FINANCIAL RISK MANAGEMENT (continued)
22.2 LIQUIDITY RISK (continued)
Maturing within one year
Within 3 to 6 6 to 12 Sub- Over2011 3 months months Months total 1 year Total
KD KD KD KD KD KD ASSETS
Bank balances and cash 9,314,660 - - 9,314,660 - 9,314,660
Financial assets at fair value through statement of income
- - 974,903 974,903 829,844 1,804,747
Murabaha and ijara receivables 1,383,716 33,000 36,430 1,453,146 930,770 2,383,916
Financial assets available- for-sale 6,593,439 1,288,756 1,200,242 9,082,437 55,980,203 65,062,640
Investment in associates 4,860,349 - - 4,860,349 50,432,853 55,293,202
Properties underdevelopment - 876,239 15,019,421 15,895,660 1,961,699 17,857,359
Investment properties 3,604,846 - 375,000 3,979,846 2,403,208 6,383,054Other assets 593,699 718,522 3,201,728 4,513,949 1,007,908 5,521,857Property and equipment - - - - 1,193,129 1,193,129
TOTAL ASSETS 26,350,709 2,916,517 20,807,724 50,074,950 114,739,614 164,814,564
LIABILITIES
Murabaha and sukukpayables 20,231,365 1,290,855 150,000 21,672,220 27,267,000 48,939,220
Other liabilities 2,575,945 36,822 86,068 2,698,835 2,159,170 4,858,005
TOTAL LIABILITIES 22,807,310 1,327,677 236,068 24,371,055 29,426,170 53,797,225
NET LIQUIDITY GAP 3,543,399 1,588,840 20,571,656 25,703,895 85,313,444 111,017,339
NOTES TO THE CONSOLIDATED FINANCIAL STATEMENTSAt 31 December 2012

75
First Investment Company K.S.C. (Closed) and its Subsidiaries FIC Annual Report 2012
22 FINANCIAL RISK MANAGEMENT (continued)
22.2 LIQUIDITY RISK (continued)
The table below summarises the maturity profile of the Group’s financial liabilities at 31 December based on contractual undiscounted repayment obligations.
Within3 months
KD
3 to 6 months
KD
6 to 12 months
KD
Over 1 yearKD
TotalKD
2012
Financial liabilities
Murabaha and sukuk payables 631,853 1,710,864 981,420 29,090,187 32,414,324
Other liabilities 1,598,263 957,064 129,000 1,599,749 4,284,076
2,230,116 2,667,928 1,110,420 30,689,936 36,698,400
Within3 months
KD
3 to 6 months
KD
6 to 12 months
KD
Over 1 yearKD
TotalKD
2011Financial liabilitiesMurabaha and sukuk payables 20,774,835 1,292,340 833,543 31,301,022 54,201,740Other liabilities 2,575,945 36,822 86,068 2,159,170 4,858,005
23,350,780 1,329,162 919,611 33,460,192 59,059,745
22.3 MARKET RISK
Market risk is the risk that the fair value of an asset will fluctuate as a result of changes in market variables such as profit rates, foreign exchange rates, and equity prices, whether those changes are caused by factors specific to the individual investment or its issuer or factors affecting all investments traded in the market.
Market risk is managed on the basis of pre-determined asset allocations across various asset categories, diversification of assets in terms of geographical distribution and industry concentration, a continuous appraisal of market conditions and trends and management’s estimate of long and short term changes in fair value.
NOTES TO THE CONSOLIDATED FINANCIAL STATEMENTSAt 31 December 2012

76
First Investment Company K.S.C. (Closed) and its Subsidiaries
22 FINANCIAL RISK MANAGEMENT (continued)
22.3 MARKET RISK (continued)
22.3.1 Profit rate risk
Profit rate risk arises from the possibility that changes in profit rates will affect future cash flows or the fair values of financial instruments. The Group is not exposed to profit rate risk on its profit bearing assets and liabilities as a result of reasonably possible changes in profit rates since the Group is not exposed to any floating rate profit bearing assets and liabilities.
22.3.2 Foreign currency risk
Foreign currency risk is the risk that the fair value or future cash flows of a financial instrument will fluctuate due to changes in foreign exchange rates.
Foreign currency risk is managed by the Investment Department of the Parent Company on the basis of limits determined by the Board of Directors and a continuous assessment of the Group’s open positions and current and expected exchange rate movements. Management believes that there is minimal risk of significant losses due to exchange rate fluctuations and consequently the Group does not hedge foreign currency exposures. The Group had the following net foreign currency exposure at 31 December:
2012 2011 KD KD
Equivalent Equivalent
Saudi Riyal 8,405,895 36,044,900Qatari Riyal 135,445 638,186Omani Riyal 11,091,086 10,155,670Bahraini Dinar 948,857 1,385,402US Dollar 181,393 2,237,273UAE Dirham 24,674 18,090Euro - 18,934
20,787,350 50,498,455
NOTES TO THE CONSOLIDATED FINANCIAL STATEMENTSAt 31 December 2012

77
First Investment Company K.S.C. (Closed) and its Subsidiaries FIC Annual Report 2012
22 FINANCIAL RISK MANAGEMENT (continued)
22.3 MARKET RISK (continued)
22.3.2 Foreign Currency risk (continued)
The table below analyses the effect on profit (loss) and equity of an assumed 5% strengthening or weakening in value of the currency rate against the Kuwaiti Dinar from levels applicable at the year end, with all other variables held constant:
2012 2011
Currency
Change in
currency rate in
%
Effect on consolidated statement of
incomeKD
Effect on equity
KD
Change in
currency rate in
%
Effect on consolidated statement of
incomeKD
Effect on equity
KD
Saudi Riyal +5 +156,018 +264 ,277 +5 +1,216,107 +589,378Qatari Riyal +5 +6,772 - +5 +46 +31,863Omani Riyal +5 +1,582 +552,973 +5 +14,446 +522,229US Dollars +5 +1,042 +8,028 +5 +879 +110,984UAE Dirham +5 +1,234 - +5 +904 -EURO +5 - - +5 +946 -Bahraini Dinar +5 - +47,443 +5 - +69,270
22.3.3 Equity price risk
Equity price risk arises from changes in the fair values of equity investments. Equity price risk is managed by the Investment Department of the Parent Company. The Group manages this through diversification of investments in terms of geographical distribution and industry concentration. The majority of the Group’s quoted investments are listed on GCC Stock Exchanges.
The effect on the Group’s profit (loss) (as a result of a change in the fair value of financial assets at fair value through statement of income at 31 December) and equity (as a result of a change in the fair value of financial assets available-for-sale at 31 December) due to a reasonably possible change in market indices, with all other variables held constant is as follows:
2012 2011
Market indices
Change in equityprice
%
Effect on consolidated statement of
incomeKD
Effect on equity
KD
Change in equity
price%
Effect on consolidated statement of
incomeKD
Effect on equity
KD
Kuwait +5 - +3,874 +5 +13,781 +2,139Saudi Arabia +5 - - +5 - +243,958
NOTES TO THE CONSOLIDATED FINANCIAL STATEMENTSAt 31 December 2012

78
First Investment Company K.S.C. (Closed) and its Subsidiaries
22 FINANCIAL RISK MANAGEMENT (continued)
22.3 MARKET RISK (continued)
22.3.4 Prepayment risk
Prepayment risk is the risk that the Group will incur a financial loss because its customers and counterparties repay or request repayment earlier or later than expected. The Group is not significantly exposed to prepayment risk.
22.4 OPERATIONAL RISK
Operational risk is the risk of loss arising from systems failure, human error, fraud or external events. When controls fail to perform, operational risks can cause damage to reputation, have legal or regulatory implications, or lead to financial loss. The Group cannot expect to eliminate all operational risks, but through a control framework and by monitoring and responding to potential risks, the Group is able to manage the risks. Controls include effective segregation of duties, access, authorisation and reconciliation procedures, staff training and assessment processes.
23 FIDUCIARY ACCOUNTS
The Group manages portfolios on behalf of customers and maintains cash balances and securities in fiduciary accounts which are not reflected in the Group’s consolidated statement of financial position. Assets under management at 31 December 2012 amounted to KD 107,716,806 (2011: KD 178,204,566). The total income earned from fiduciary activities amounted to KD 549,344 (2011: KD 555,997).
24 FAIR VALUES OF FINANCIAL INSTRUMENTS
Fair value is the amount at which an asset, liability or financial instrument could be exchanged or settled between knowledgeable willing parties in an arm’s length transaction. Underlying the definition of fair value is the presumption that the Group is a going concern without any intention, or need, to liquidate, curtail materially the scale of its operations or undertake a transaction on adverse terms. Financial instruments comprise financial assets and financial liabilities.
Financial assets consist of cash and bank balances, financial assets at fair value through statement of income, financial assets available-for-sale and receivables. Financial liabilities consist of murabaha and sukuk payables and other liabilities.
The fair values of financial instruments, with the exception of certain financial assets available-for-sale carried at cost (Note 10) are not materially different from their carrying values.
NOTES TO THE CONSOLIDATED FINANCIAL STATEMENTSAt 31 December 2012

79
First Investment Company K.S.C. (Closed) and its Subsidiaries FIC Annual Report 2012
24 FAIR VALUES OF FINANCIAL INSTRUMENTS (continued)
Determination of fair value and fair value hierarchy:The Group uses the following hierarchy for determining and disclosing the fair values of financial instruments:Level 1: quoted prices in active market for the same instrument.Level 2: quoted prices in active market for similar instruments or other valuation techniques for which all
significant inputs are based on observable market data; andLevel 3: valuation techniques for which any significant input is not based on observable market data.
The following table shows an analysis of financial assets recorded at fair value by level of the fair value hierarchy:
31 December 2012 Level 1 Level 2 Level 3 Total
KD KD KD KD
Investment securitiesFinancial assets at fair value
through statement of income - Equity securities - - - - - Managed funds and portfolios - - 1,029,976 1,029,976
Financial assets available-for-sale - Equity securities 198,646 - - 198,646
- Managed funds and portfolios - - 160,557 160,557
31 December 2011 Level 1 Level 2 Level 3 Total KD KD KD KD
Investment securitiesFinancial assets at fair value
through statement of income - Equity securities 158,627 - - 158,627 - Managed funds and portfolios - - 1,449,562 1,449,562
Financial assets available-for-sale - Equity securities 6,905,703 - - 6,905,703 - Managed funds and portfolios - - 616,895 616,895
During the reporting period ended 31 December 2012, there were no transfers between level 1 and level 2 fair value measurements.
NOTES TO THE CONSOLIDATED FINANCIAL STATEMENTSAt 31 December 2012

80
First Investment Company K.S.C. (Closed) and its Subsidiaries
24 FAIR VALUES OF FINANCIAL INSTRUMENTS (continued)
The following table shows a reconciliation of the beginning and closing balances of level 3 financial assets which are recorded at fair value.
At 1 January
2012
Lossrecorded
in the consolidated statement of
income
Gain / (loss) recorded in
equity
Net purchases,
sales, transfers and settlements
At31 December
2012
KD KD KD KD KD
Financial assets at fair value through statement of income - Managed funds and portfolios
1,449,562 (71,950) - (347,636) 1,029,976
Financial assets available-for-sale
- Managed funds and portfolios
616,895 (25,379) 34,975 (465,934) 160,557
At 1 January
2011
Gain / (loss)recorded
in the consolidated statement of
income
Gain / (loss) recorded in
equity
Net purchases,
sales, transfers
and settlements
At31
December 2011
KD KD KD KD KD
Financial assets at fair value through statement of income - Managed funds and portfolios
20,671,973 1,681,712 - (20,904,123) 1,449,562Financial assets available-for-sale
- Managed funds and portfolios 902,555 (149,766) 4,619 (140,513) 616,895
NOTES TO THE CONSOLIDATED FINANCIAL STATEMENTSAt 31 December 2012

81
First Investment Company K.S.C. (Closed) and its Subsidiaries FIC Annual Report 2012
25 COMMITMENTS AND CONTINGENCIES
Commitments
2012KD
2011KD
Capital commitments for properties under development 11,941,202 11,827,581
Operating lease rentals due within one year 72,330 72,330
12,013,532 11,899,911
ContingenciesAt 31 December 2012, the Group had provided bank guarantees amounting to KD 1,364,769 (2011: KD 1,364,769) and corporate guarantees amounting to KD 1,454,873 for which the management anticipates that no material liabilities will arise. These expire within a period of 3 months from the reporting date.
26 CAPITAL MANAGEMENT
The primary objective of the Group’s capital management is to ensure that it maintains healthy capital ratios in order to support its business and maximise shareholder value.
The Group manages its capital structure and makes adjustments to it, in light of changes in economic conditions. To maintain or adjust the capital structure, the Group may adjust the dividend payment to shareholders, return capital to shareholders or issue new shares. No changes were made in the objectives, policies or processes during the years ended 31 December 2012 and 31 December 2011.
The Group monitors capital using a gearing ratio, which is net debt divided by equity attributable to the owners of the Parent Company. The Group’s policy is to keep the gearing ratio less than 1. The Group includes within net debt, Islamic borrowings less bank balances and cash. Capital represents equity attributable to owners of the Parent Company.
2012 KD
2011 KD
Islamic borrowings 29,560,317 48,939,220Less: Bank balances and cash (8,116,741) (9,314,660)
Net debt 21,443,576 39,624,560
Equity attributable to owners of the Parent Company 93,026,612 91,143,900
Gearing ratio 0.23 0.43
NOTES TO THE CONSOLIDATED FINANCIAL STATEMENTSAt 31 December 2012
