annual report 2012 - dvb bank/media/files/d/dvb-bank... · the company 01 – 33 01 mission...
TRANSCRIPT

2012Annual Report

DVB Bank SE | Group Annual Report 2012
Contents
Group management report 40 – 159
41 Strategy and structure
44 Shipping Finance
60 Aviation Finance
78 Land Transport Finance
94 Important deals 2012
96 Financial Institutions
101 Investment Management
108 ITF International Transport Finance Suisse AG
110 Financial position and performance
125 Remuneration report
129 Non-financial performance indicators
131 Report on material events after the reporting date
132 Report on opportunities and risks
155 Report on expected developments for 2013
158 Explanatory disclosures under takeover law
159 Report of the Board of Managing Directors
on relations with affiliated companies
Consolidated financial statements 160 – 216
161 Income statement
161 Appropriation of profits
162 Statement of comprehensive income
163 Statement of financial position
164 Statement of changes in equity
165 Cash flow statement
166 Segment report
167 Notes
Audit opinion 217
Further information 218 – 228
218 DVB worldwide
220 Key words
222 Glossary
226 Abbreviations
228 Imprint
U3 Key figures at a glance
U4 Events 2012
The Company 01 – 33
01 Mission Statement
02 About us
08 Letter to our shareholders and business partners
11 The Board of Managing Directors
12 Report of the Supervisory Board
17 The Supervisory Board
18 Corporate Governance Report 2012
26 Employees and sustainability
Financial and equity markets 34 – 39
34 Financial markets and DVB’s financial markets activities
36 Equity markets and the DVB share
39 Financial calendar 2013
Reference to the internet
Legal notice
Further information
Symbols

DVB Bank SE | Group Annual Report 2012
Key figures at a glance
€ mn
1 Jan 2012– 31 Dec 2012
1 Jan 2011– 31 Dec 2011
%
Earnings data
Net interest income 230.0 258.3 –11.0
Allowance for credit losses –70.7 –59.2 19.4
Net interest income after allowance for credit losses 159.3 199.1 –20.0
Net fee and commission income 130.7 116.2 12.5
Results from investments in companies accounted for using the equity method 8.5 0.1 –
Net other operating income/expenses 42.7 17.3 –
Income 341.2 332.7 2.6
General administrative expenses –184.0 –189.4 –2.9
Consolidated net income before IAS 39 and taxes 157.2 143.3 9.7
Net income from financial instruments in accordance with IAS 39 –15.8 4.4 –
Consolidated net income before taxes 141.4 147.7 –4.3
Key financial indicators (%)
Return on equity (before taxes) 12.9 14.0 –1.1 pp
Cost/income ratio 46.5 47.8 –1.3 pp
€ mn 31 Dec 2012 31 Dec 2011 %
Key items from the statement of financial position
Business volume 25,117.9 23,919.8 5.0
Customer lending volume 22,146.9 21,706.4 2.0
Total assets 23,804.8 22,031.0 8.1
Loans and advances to customers 19,908.3 18,739.0 6.2
Deposits from customers 5,172.9 4,460.3 16.0
Securitised liabilities 11,391.4 9,830.1 15.9
Subordinated liabilities 411.8 400.6 2.8
Equity 1,328.9 1,210.0 9.8
Own funds in accordance with the German Banking Act
Tier 1 capital 1,236.0 1,178.8 4.9
Tier 2 and tier 3 capital 201.1 125.6 60.1
Total 1,437.1 1,304.4 10.2
Capital ratios in accordance with the German Banking Act (%)
Basel II
Tier 1 ratio 20.3 19.7 0.6 pp
Total capital ratio 23.6 21.8 1.8 pp
Ratings 2012 2011 2010
Standard & Poor’s
Long-term counterparty credit rating A+ A+ A
Short-term credit rating A-1 A-1 A-1
Outlook stable stable negative
Fitch Ratings1)
Long-term issuer default rating A+ A+ A+
Short-term issuer default rating F1+ F1+ F1+
1) Within the scope of the German Co-operative Financial Services Network’s rating

DVB Bank SE | Group Annual Report 2012
Events 2012
24 April11th DVB Bank Breakfast Meeting in Hamburg – Mr Ronald Widdows, CEO of Rickmers Holding and Rickmers Line spoke to around 60 shipping industry representatives about the difficult market conditions in the container sector.
14 May Successful placement of our debut €500 million senior unsecured benchmark bond – a second issue followed on 24 August. Thanks to enormous demand from a variety of investors, both issues benefited from an oversubscribed, highly diversified order book. With these placements, we succeeded in building a benchmark yield curve, whilst broadening our investor base.
13 June Ordinary Annual General Meeting in Frankfurt/Main – with 96.69% of DVB’s share capital represented, shareholders passed all proposed resolutions, including a resolution to pay a dividend of €0.60 per share.
20–21 September19th ISTAT Europe Conference in Rome – Mr Bertrand Grabowski moderated the “Aircraft Finance Panel” consisting of high-ranking aviation industry and bank representatives.
9 OctoberAnnual client reception at the Mandarin Oriental Hotel in New York City – Messrs Driese, Lunde and Grabowski welcomed 214 guests from the shipping, aviation, and land transport industries.
27 NovemberBusiness meetings in Curaçao – Mr Driese, Mr Lunde and three further DVB representatives met Prime Minister Stanley Betrian.
11–12 JanuaryAnnual DVB client event at the Swissôtel The Stamford, in Singapore and meetings with the press – DVB’s members of the Board of Managing Directors, Messrs Wolfgang Driese, Dagfinn Lunde and Bertrand Grabowski, together with DVB colleagues, welcomed 168 guests from various Asian nations, representing the shipping and aviation industries. During the course of the event, our members of the Board of Managing Directors met with daily and trade press journalists to discuss developments on the financial and transport markets.
8 March Annual Accounts Press and Analysts’ Conference – Messrs Driese and Lunde presented the consolidated results for 2011.
9 MarchBreakfast meeting with journalists in London – DVB’s three members of the Board of Managing Directors presented DVB, answering questions regarding trends on the shipping, aviation and land transport markets.
4 AprilSale of a stake in DVB’s wholly-owned subsidiary TES Holdings (TES) – DVB, Mitsubishi Corporation and Development Bank of Japan (DBJ) entered into an agreement by which Mitsubishi would acquire 35.0% and DBJ 25.0% of TES’s capital from DVB. DVB remains the largest stakeholder with 40% of the shares. The sale was closed in June, after antitrust approvals were granted.
11 AprilAnnual client reception in Norway – Messrs Driese and Lunde, together with additional DVB representatives, welcomed around 175 guests to the Shippungklubben in Oslo. Guest speaker Prof Øystein Noreng from the Norwegian School of Business presented the topic "Oil market – fundamentals and price risk“.

Anhang 1
UN T E RNE HMEN F IN A N z- UND A K T IE NM ä RK T E KON z E RNL AGE BE RICH T KON z E RN A B SCHLUS S
DVB Bank SE | Group Annual Report 2012
The leading specialist in international transport finance
At DVB, we make deals work. This means striving to seek and develop intelligent and appropriate solutions that meet and even exceed our clients’ needs and expectations. We go the extra mile to constantly and thoroughly research and study our industry. Often, this leads us to challenge conventional wisdom when offering our focused range of financing services.

DVB Bank SE | Group Annual Report 2012
Photographer
Linda Slingerland,
Operations & Premises,
Rotterdam
DVB Bank SE | Group Annual Report 2012
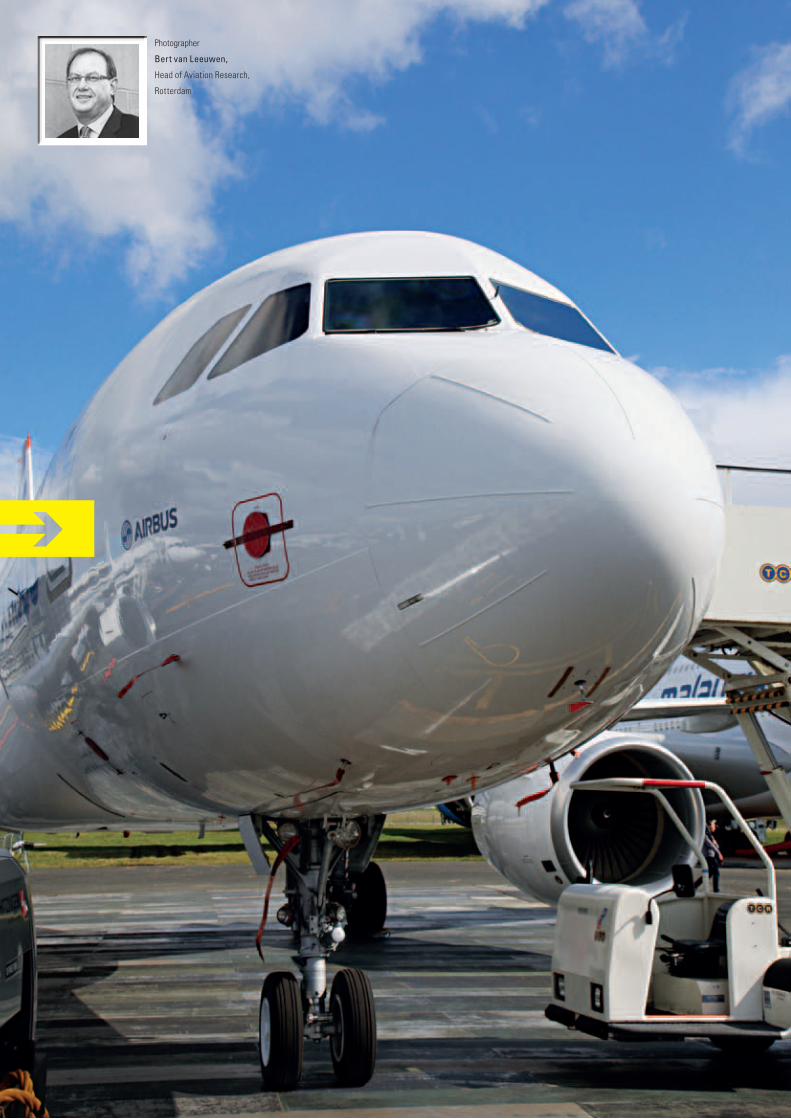
The market situation remained tense in numerous international maritime shipping segments throughout 2012. Prevailing high
levels of excess capacity, combined with low freight and time charter rates, dominated the three key segments of container,
crude oil and bulk shipping in particular. Yet despite these troubled waters, our Shipping Finance team once again supported
our clients successfully in the sectors we cover with valuable expertise concerning different vessel types, value-creation
chains, freight flows and networks. Thanks to our specialist, sector-specific know-how, we are in a position to anticipate
trends on shipping markets ahead of our competitors. This means that we can support our clients in an optimum manner with
customised financing solutions, adapt our risk management to changed market conditions, and act as a reliable partner to the
shipping industry for the long term. Our shipping finance expertise once again enabled us to generate sound financial results
in 2012. Moreover, we won accolades from renowned industry magazines: two from Marine Money and one from Lloyd’s List.
Shipping Finance – specific sector expertise
DVB Bank SE | Group Annual Report 2012
Photographer
Bert van Leeuwen,
Head of Aviation Research,
Rotterdam

DVB Bank SE | Group Annual Report 2012
After a few turbulent years, the aviation market calmed down to some extent during 2012. Air passenger transport in particular
benefited from strong demand, albeit with some regional divergence in terms of growth rates. The air freight market, however,
showed some weakness in view of slowing growth in global trade and a shift in freight volumes to other means of transport.
As a leading arranger, underwriter and provider of asset-based finance to the aviation industry, during 2012 our Aviation
Finance team was once again active in a market suffering from financing shortages on the part of commercial banks. Our team
supported aviation clients around the globe with intelligent and customised solutions provided through our innovative Aviation
platform. This integrated approach to business at the interface between “money and metal” goes far beyond the traditional
range of banking; moreover, it benefits from our seasoned team of experts and profound research capabilities. Thanks to this,
we were once again able to serve a highly diversified client base throughout 2012, with an attractive financing mix for new and
used aircraft – which the renowned industry magazine Air Finance Journal honoured with three awards.
Aviation Finance – integrated platform solutions

DVB Bank SE | Group Annual Report 2012
Photographer
Wouter Radstake,
Head of Land Transport Research,
Frankfurt/Main

DVB Bank SE | Group Annual Report 2012
Land transport markets continued to be characterised by volatility during 2012, particularly in Europe and North America.
Whilst the situation on the European transport market and on the carload transport market in North America remained difficult,
North American intermodal freight, rail passenger and road transport markets developed favourably. Road transport and North
American long-haul rail passenger transport even returned to pre-crisis levels. Meanwhile, the Australian market continued its
growth path. In this market environment, our Land Transport Finance team provided an extensive range of financing, advisory
and research services across these key target regions during 2012. Our clients clearly appreciated the clear focus on asset-
based finance and in-depth market expertise which they can draw upon at any stage of the market cycle. Thanks to close
co-operation and continuous dialogue with our clients, we were successful in devising efficient financing structures –
wherever possible, in colaboration with our colleagues from other teams. This strategy turned out to be particularly successful
for our Land Transport Finance division in 2012 – which once again scooped a coveted award from Global Transport Finance
magazine.
Land Transport Finance – consistent client franchise

8
DVB Bank SE | Group Annual Report 2012
Letter to our shareholders and business partners
Despite a severe and worrying climate, the global economy continues to grow – albeit at a slower pace. Demographic and consumption factors create inevitable pressures that – quite simply – mean more goods and people need to be transported globally. In some cases, even in times like these, a selective few banks can report stable results. DVB is proud to be one of those banks.
For 2012, our mission was to achieve a result comparable to last year. Due to the very challenging circumstances we foresaw, this was quite an ambitious undertaking. Nevertheless, we, DVB, achieved what we set out to do. And as with every year, we would like to thank our employees for their commitment. Their accom-plishment, in such a challenging climate, to produce this “com-parable” result, has been remarkable – they have truly earned our heartfelt gratitude. We are also confident that all at DVB have the professional awareness to acknowledge the efforts we shall again need to call upon for the foreseeable future.
Ladies and Gentlemen,
In their efforts to overcome the economic turmoil affecting the global economy, exacerbated by the host of problems displayed by Europe, the intricate magic act of achieving growth and prosperity in the midst of austerity is something that most have yet to master. Attempts and measures to curb certain large (and systemically important) banks, have forced the change from regulation to over-regulation, which is now affecting every bank.
There are also plenty of other factors that banks are struggling with; a generic slump in the developed markets versus an impres-sive yet volatile growth in new and emerging economies. Demand factors now seem to change much more rapidly, with commodity prices and financial markets displaying caution one day and illogical exuberance the next. Indeed, the global economy is riddled with contradiction, extremes, and uncertainty.
DVB stands by the general consensus, that there is growing demand for transport; but it is moderate, and in certain sectors, is being swallowed up by excess capacity. We would like to emphasise that about 85% of DVB’s financing business is within a fairly stable environment. However, the remainder treads in troubled waters and is under the close scrutiny of those with a vested interest in what we do.
Wolfgang F. Driese, CEO and Chairman of the Board of Managing Directors

9
DVB Bank SE | Group Annual Report 2012
T hE C OM PA N y F IN A NCI A L A ND EqUI T Y M A RK E T S GROUP M A N AGE MEN T RE P OR T C ONSOL IDAT E D F IN A NCI A L S TAT E MEN T S
Letter to our shareholders and business partners
At €157.2 million, our consolidated net income before IAS 39 and taxes was 9.7% higher than last year’s excellent result. One key driver was net fee and commission income, which reached its highest-ever level, posting a 12.5% year-on-year increase. In addition to income from the lending business, advisory services and asset management commissions also grew significantly.
Joining forces with two major Japanese partners in our subsidiary TES has not only opened up new business opportunities, but it is also the reason for the healthy increase in net other operating income and expenses (from €17.3 million to €42.7 million).
Our efficiency indicator (cost/income ratio) improved to 46.5%. Costs decreased by 2.9%, a first for some time, with our divest-ment in TES playing an important role. At 12.9%, our return on equity was also within the target range, although down slightly from last year. We shall propose to the Annual General Meeting an unchanged dividend of €0.60 per share, which corresponds to a dividend yield of 2.47%.
Unfortunately, it is not all blue skies and sunshine, or even plain sailing for that matter. In certain segments of maritime shipping, this crisis, now in its fifth year, has persisted longer than ever before. Following the withdrawal of many important ship financ-
ing providers, the liquidity needed to stabilise the asset values of used vessels is not there. Competent negotiation partners in the form of “exit” banks are also hard to come by and there is generally a lack of motivation to actively work together to find solutions when severe problems arise.
DVB currently finances a total of about 1,600 vessels with a lend-ing volume of approximately €12.6 billion. 18% of this exposure is subject to close risk monitoring, in which we continue to invest a great deal of care and time. Over the course of the year, we need to find a new “home port” for between 15 and 20 vessels. We have a team of specialists solely dedicated to this purpose.
At €70.7 million, net allowance for credit losses during the year reached a high level, with ship financings accounting for almost the entire amount. Related expenses for “risk positions” in financing and for the vessels we hold totalled €27.6 million, which were accounted for mainly as interest expenses. In addition to the number of acute problem exposures and overall risk costs, we were affected by and faced some larger-sized defaults despite our considerable efforts to mitigate such risks. We have actively learned from these experiences in a bid to minimise the potential for any similar surprises in the future.
Dagfinn Lunde, Member of the Board of Managing Directors Bertrand Grabowski, Member of the Board of Managing Directors

10
DVB Bank SE | Group Annual Report 2012
Letter to our shareholders and business partners
• During the first quarter, we are looking to promote our “Offshore” activities to become our fourth business division, joining Shipping Finance, Aviation Finance and Land Transport Finance. This will make the breadth and diversity of our financing activities even more evident.
• Theobjectiveofourproject“Unity”istoensurethefuturesuccess of our Shipping Finance division. We will focus on improving processes, adapting structures to other areas and enhancing efficiency. We will prepare for the project through-out 2013, with the rollout to largely be completed in 2014.
• Wewillcontinuetoworkonadjustingournetinterestmarginaccording to the risk profile of our financing business. This means we will also strive to improve the parameters of the anticipated stable environment of funding costs.
• Funding will return to being conservative; and so it follows that our long-term lending business will continue to be refinanced on a fully-matched basis. We will also continue to expand the range of funding instruments, sources and structures.
Our forecast
Going forward, our planning for 2013 is based on a new financing volume of €5.1 billion with a gross interest margin of 316 basis points. We subsequently project a net fee and commission income at approximately the previous year’s level. Overall costs should increase modestly, but risk costs will remain high. Hence, the result before taxes (before IAS 39) in 2013 is planned to be slightly higher than the previous year.
We have once again set an ambitious goal for ourselves that calls for tremendous dedication and focus during these challenging times. We are prepared, yet remain cautious of the regulatory environment, which makes effective and efficient planning extremely difficult. Hence, we anticipate heightened operational risk and increased costs for managing the Bank as the regulators essentially make hard times even harder.
Nonetheless, we will confront these challenges head on.
Yours sincerely,
Our outlook regarding our business environment
We are all aware of the prevailing global economic conditions, which are set to remain challenging. Nonetheless, the global economy is forecast to grow by at least 3% and possibly a little faster in the second half of the year. It can therefore be suggested that, global trade – one of the main drivers of transport demand – has the potential to grow by 4% to 6%. However, as we previously mentioned, this will vary considerably from region to region.
Nonetheless, DVB will steer safely through these turbulent times. As mentioned earlier, it is important to bear in mind that 85% of our business is conducted in stable sectors. Aircraft financing will continue to produce very good results, and the same will apply for land transport financing and offshore financing.
Working closely with our fellow TES stakeholders, the Mitsubishi Group and the Development Bank of Japan (DBJ), will continue to stimulate our investment fund business.
High oil prices drives investment in oil production and as a result, our financings in the offshore sector.
The outlook for product and chemical tankers, in addition to gas transport (liquefied natural gas and liquefied petroleum gas) is improving. Conversely, for crude oil tankers, container vessels and bulk carriers, the horizon still looks gloomy for 2013, mainly due to excess capacity. Hence, it is these subsectors that will be the focus of our risk management activities. Further insolvencies should be expected in these segments, which unfortunately will imply defaults for loans given by the Bank.
Our outlook on the measures we will take
• Asof1January2013,wehaveconsiderablyexpandedthesize of our restructuring unit and equipped the respective team with a wider mandate. This means that any shipping exposures that possess a perceived threat of default will be managed by this unit, with the aim of stabilisation.
Wolfgang F. DrieseCEO and Chairman of the Board of Managing Directors
Dagfinn LundeMember of the Board of Managing Directors
Bertrand GrabowskiMember of the Board of Managing Directors
Frankfurt/Main, March 2013DVB Bank SE

11
DVB Bank SE | Group Annual Report 2012
T hE C OM PA N y F IN A NCI A L A ND EqUI T Y M A RK E T S GROUP M A N AGE MEN T RE P OR T C ONSOL IDAT E D F IN A NCI A L S TAT E MEN T S
The Board of Managing Directors
Wolfgang F. Driese CEO and Chairman of the Board of Managing Directors and bank directorBorn 1949 in Berlin, Germany
Client areas in business divisions:Shipping Credit, Aviation Credit, Land Transport CreditStrategic Management and Restructuring TeamShipping Research, Offshore Research, Aviation Research, Land Transport ResearchFinancial Institutions Investment Management (Shipping & Intermodal Investment Management, Aviation Investment Management)
Client areas in affiliates:DVB LogPay GmbHITF International Transport Finance Suisse AG
Product/service areas:Group Risk ManagementGroup ControllingGroup Corporate CommunicationsGroup Compliance Office
Bertrand Grabowski Member of the Board of Managing Directors and bank directorBorn 1956 in Guerche-de-Bretagne, France
Client areas in business divisions:Aviation FinanceLand Transport Finance
Client areas in affiliates:DVB Transport Finance LtdTES Holdings Ltd (40% shareholding)
Product/service areas:Group AuditGroup Treasury
Dagfinn LundeMember of the Board of Managing Directors and bank directorBorn 1948 in Tokke, Norway
Client areas in business divisions:Shipping FinanceOffshore FinanceDVB Corporate Finance
Client areas in affiliates:DVB Capital Markets LLC
Product/service areas:Group Human ResourcesGroup Operations Group Accounting and Taxes
Chairman of the Supervisory Board DVB Bank America N.V., Willemstad, CuraçaoChairman of the Board of Directors DVB Holding (US) Inc., New York, USA DVB Transport (US) LLC, New York, USAMember of the Board of Directors DVB Transport Finance Ltd, London, United Kingdom DVB Group Merchant Bank (Asia) Ltd, Singapore DVB Capital Markets LLC, New York, USAChairman of the Board of Directors ITF International Transport Finance Suisse AG, zurich, Switzerland DVB Invest (Suisse) AG, zurich, Switzerland
Chairman of the Board of Directors DVB Transport Finance Ltd, London, United Kingdom TES Holdings Ltd, Bridgend, Wales, United KingdomMember of the Board of Directors DVB Transport (US) LLC, New York, USA DVB Capital Markets LLC, New York, USA DVB Holding (US) Inc., New York, USA
Chairman of the Board of Directors DVB Capital Markets LLC, New York, USA DVB Group Merchant Bank (Asia) Ltd, SingaporeMember of the Supervisory Board DVB Bank America N.V., Willemstad, Curaçao Capital Equipment Management Holding GmbH, Hamburg, GermanyMember of the Board of Directors DVB Holding (US) Inc., New York, USA DVB Transport (US) LLC, New York, USA DVB Service (US) LLC, New York, USA

12
DVB Bank SE | Group Annual Report 2012
Report of the Supervisory Board
Throughout 2012, the entire Supervisory Board concerned itself – in great detail and on a continuous basis – with the persistently difficult market conditions in container, bulk and crude oil shipping. Further issues we consistently focused on during the year were the risk management for the various Transport Finance portfolios as well as liquidity requirements. We advised the Board of Managing Directors concerning the Bank’s strategic direction and implementation of related decisions. These topics formed part of the ever more complex regulatory requirements faced by the Bank, which we also need to deal with in our Supervisory Board work.
Co-operation with the Board of Managing Directors
As in previous years, the 2012 business year was once again characterised by numerous legal and regulatory changes. The Supervisory Board supported the Board of Managing Directors with the implementation of its strategic objectives, regarding compliance with all legal and regulatory provisions, and gave advice.
Dear shareholders,
Our performance in 2012 once again demonstrated that DVB held its course, even in rough seas – especially when compared to competitors – and mastered the troubled waters we were navi-gating. A point particularly worth mentioning is that only around 18% of DVB Group’s Shipping Finance portfolio was impacted by the unfavourable conditions, whilst Aviation Finance, Land Transport Finance and most parts of Shipping Finance, especially the two Offshore segments, once again contributed to DVB Group’s satisfying results. We would like to express our sincere thanks and appreciation to the Board of Managing Directors and all members of staff for their performance and the results achieved.
The Supervisory Board, jointly with its committees – the Credit Committee and the Executive Committee – has fulfilled the obli-gations imposed on it by law, the Memorandum and Articles of Association, and the Bank’s Internal Regulations throughout the past business year. We have taken decisions on transactions and issues requiring approval, closely advised the Bank’s Board of Managing Directors, and have continuously supervised the management of the Company and the Group by the Board of Managing Directors. We were also consulted on decisions of fundamental importance, in good time.

13
DVB Bank SE | Group Annual Report 2012
T hE C OM PA N y F IN A NCI A L A ND EqUI T Y M A RK E T S GROUP M A N AGE MEN T RE P OR T C ONSOL IDAT E D F IN A NCI A L S TAT E MEN T S
Report of the Supervisory Board
Martin Wolfert
Dr Peter KlausDeputy Chairman of the Supervisory Board
Prof Dr h.c. Stephan Götzl
Flemming Robert Jacobs
Frank WesthoffChairman of the Supervisory Board
Wolfgang Köhler Dr Klaus Nittinger
Dorinus Legters Adnan Mohammed

14
DVB Bank SE | Group Annual Report 2012
Report of the Supervisory Board
Main issues during the meeting on 6 March 2012 were the key parameters of the 2011 consolidated financial statements, business development during the first months of 2012 as well as the consideration and confirmation of the single-entity financial statements of DVB Bank SE for the 2011 business year. The external auditors, who took part in this meeting, responded to our questions in full. We duly noted and approved the dividend proposal for 2011, the Report of the Supervisory Board, and the Corporate Governance Report for 2011. We then discussed the Bank’s liquidity strategy and its implementation throughout DVB in detail. The Board of Managing Directors then provided an extensive report on the Company’s personnel structure. We also concerned ourselves with the disposal of a stake in TES Holdings Ltd, and approved this sale of a part of DVB’s shareholding to two renowned Japanese investors.
At the meeting on 29 March 2012, we discussed the IFRS con-solidated financial statements 2011 with the auditors, and approved the consolidated financial statements. We adopted the proposals for resolutions to be passed by the Annual General Meeting 2012. The Head of Internal Audit presented the annual Audit Report. We discussed and resolved several capital increases for Group entities; the Board of Managing Directors informed us about projects requiring our approval. This was followed by a discussion concerning the business risk strategy. This meeting also focused on various topics related to the Board of Managing Directors. Specifically, we discussed the assessment basis for variable remuneration for the members of the Board of Managing Directors for the business year 2012, and determined bonus payments for the year 2011 to the members of the Board of Managing Directors, based on the recommendations put for-ward by the Executive Committee. We also approved payments under DVB’s Long-Term Incentive Plan (LTI) 2009 for the members of the Board of Managing Directors, and extended the appoint-ment of Mr Dagfinn Lunde as a member DVB Bank SE’s Board of Managing Directors. Mr Bertrand Grabowski, whose portfolio on the Board of Managing Directors also includes responsibility for Aviation Finance, provided a detailed report of current business developments, including the outlook for 2012 and the risk situation in the aviation industry.
Mr Dagfinn Lunde, whose portfolio on the Board of Managing Directors also includes responsibility for Shipping Finance, con-tinued this detailed reporting during the meeting on 1 October 2012. In particular, he explained the current structure of the Shipping Finance portfolio, illustrating the risk situation in the various maritime shipping market segments, based on up-to-date research material. Furthermore, he gave a detailed account of most recent developments in the Shipping Finance division. This was followed by a similar presentation delivered by the Head of Land Transport Finance.
Key topics of discussion were DVB’s business and financial performance in an increasingly challenging environment (espe-cially in some parts of the shipping industry), developments on the international transport markets, as well as the Bank’s activities in managing risk, liquidity, and capital. During Supervisory Board meetings, the Board of Managing Directors comprehensively informed us on the development of strategic parameters of DVB’s business model, resulting adjustments to future business policy, as well as on company management and planning (including the planning parameters for the Bank’s financial resources, budgeted results, liquidity and human resources), Corporate Governance issues as well as on events, results and transactions that were and still are important to DVB.
The Credit Committee in particular discussed DVB’s risk situation and risk management in detail, providing regular and detailed information to the plenary meetings of the Supervisory Board. The minutes of Credit Committee meetings are made available to all Supervisory Board members. Moreover, the Supervisory Board was informed about current events and transactions of fundamental importance which were subject to joint discussions with the Board of Managing Directors and – where required – approved by the Supervisory Board. Mr Wolfgang Driese, CEO and Chairman of the Board of Managing Directors, and Mr Frank Westhoff, Chairman of the Supervisory Board, held regular discussions which focused on issues specific to the Bank, and on decisions to be made, in a timely and comprehensive manner. The Board of Managing Directors informed us in writing of important developments between Supervisory Board meetings, thus permitting the Supervisory Board members to exercise their control function at any time. We adopted any resolutions that were necessary between Supervisory Board meetings by way of circulation.
The Supervisory Board’s activities and co-operation with the Board of Managing Directors were always characterised by mutual trust, and by open and constructive discussions.
Meetings of the Supervisory Board
The Supervisory Board met during four scheduled plenary meet-ings in 2012; during these meetings, we regularly discussed the business development of the Bank and its subsidiaries. The Board of Managing Directors and the division heads gave a detailed account of the sector-specific and macro-economic environment on the international transport markets, as well as on the specific risk situation concerning ships, aircraft, and rolling stock on the respective transport markets.

15
DVB Bank SE | Group Annual Report 2012
T hE C OM PA N y F IN A NCI A L A ND EqUI T Y M A RK E T S GROUP M A N AGE MEN T RE P OR T C ONSOL IDAT E D F IN A NCI A L S TAT E MEN T S
Report of the Supervisory Board
The Head of Group Compliance presented the 2012 Compliance Report. During this meeting, we once again dealt with personnel topics, and extended the appointment of Mr Bertrand Grabowski as a member of the Board of Managing Directors of DVB Bank SE.
The last Supervisory Board meeting during the year under review took place on 22 November 2012. Besides the report of the Board of Managing Directors concerning DVB’s current business development, discussions focused on the Bank’s short-term and long-term strategic direction. In this context, we approved the planning for 2013, and discussed the medium-term planning until 2017 with the members of the Board of Managing Directors. We resolved a capital increase for DVB Transport Finance Ltd, United Kingdom. The Heads of Shipping & Intermodal Investment Management and Aviation Investment Management provided a detailed report on current business developments within their respective areas, and offered a forecast for the years ahead. We received a presentation on the activities of the subsidiary ITF International Transport Finance Suisse AG (ITF Suisse). Specifically, the director of ITF Suisse informed us about current developments in the market for loan sub-participations and explained the risk situation of ITF Suisse’s portfolio.
We then looked into the Bank’s operational implementation of the recommendations of the German Corporate Governance Code, resolving on any resulting changes to the Internal Regulations for the Supervisory Board. By way of conclusion, the Remuneration Committee which the Bank has established voluntarily, in accord-ance with section 6 of the Remuneration Systems of institutions (InstitutsVergV), submitted its annual report.
There were no members of the Supervisory Board who attended less than half of meetings during the period under review. No conflicts of interest were disclosed during the period under review.
Supervisory Board Committees
During its four meetings, the Credit Committee discussed and, where required, approved all credit exposures of DVB that were subject to reporting requirements by virtue of law or under the Internal Regulations, in detail and without delay. In addition, the Credit Committee was regularly involved in approving lending exposures, where such approval was required, by way of circu-lation. During the meetings, detailed portfolio analyses were used to discuss the structure of the loan portfolio (and related planning) and risk issues – specifically regarding credit, liquidity, country and market price risks. Of particular importance in this context were the performance of funded assets, risk management measures taken, and the specific analysis of individual non-performing exposures.
In addition, the Committee members discussed and adopted various strategies for specific shipping sectors, as well as changes to existing lending policies. Discussions on the credit risk strategy formed a focal point of deliberations. The Committee discussed the impact of changed regulatory provisions on DVB and its subsidiaries in detail, together with the resulting changes to risk positions. Furthermore, Ernst & Young GmbH Wirtschafts-prüfungsgesellschaft, Stuttgart, informed the members of the Credit Committee of the results of an audit of the Bank’s lending business. The Board of Managing Directors kept the members of the Committee regularly informed about non-performing exposures and those subject to particular risks, and also about unusual events in the lending business. It informed the Committee, without delay, about vessels or aircraft controlled by DVB.
The Executive Committee met twice during the reporting period. In addition to the duties which the Supervisory Board has con-ferred upon the Executive Committee, the Committee in 2012 discussed, in particular, the legal and regulatory requirements governing the remuneration of the Board of Managing Directors and the implementation of these requirements. The Committee prepared the discussion of these issues in the plenary meeting of the Supervisory Board, and dealt with general personnel matters pertaining to the Managing Directors. Furthermore, concerning the conclusion of employment contracts with executive staff, where the annual remuneration was in excess of a set threshold, the Committee was kept informed by the Board of Managing Directors as requested, and always in good time.
The Chairman of the Credit Committee and the Executive Com-mittee, kept the entire Supervisory Board informed on topics dealt with by the Committees, to the extent that such issues were fundamentally important, or were also discussed in the plenary meetings of the Supervisory Board.

16
DVB Bank SE | Group Annual Report 2012
Report of the Supervisory Board
Co-operation with external auditors for the financial statements 2012
The consolidated financial statements and the group management report of DVB Bank SE for the 2012 business year have been examined, following an audit of the accounting records, and certified without qualification, by Ernst & Young AG, Wirtschafts-prüfungsgesellschaft, Stuttgart, the external auditors appointed by the General Meeting. The Chairman of the Supervisory Board obtained information on the scope of the audit in advance, and discussed focal points with the auditors in detail. The auditors’ reports were distributed to all members of the Supervisory Board in good time before the meeting held on 28 March 2013, during which the consolidated financial statements were discussed. The auditors who certified the consolidated financial statements took part in this meeting. During this meeting, they gave a detailed account of their audit as a whole, and provided detailed answers to our questions regarding focal points of the audit.
The subsequent examination by the Supervisory Board of the consolidated financial statements and group management report as at 31 December 2012, as presented by the Board of Managing Directors, gave no cause for objections. We thus approved the consolidated financial statements as at 31 December 2012.
The Board of Managing Directors has prepared and submitted the mandatory report on business relationships with affiliated companies during the business year 2012; this report has been examined and certified without qualification by the external auditors, as follows: “Having duly examined and assessed this report in accordance with professional standards, we confirm that the report is free from factual misrepresentations, and that the company did not pay any excessive consideration with regard to the transactions identified in the report.” Following its review and examination of the report on relations with affiliated companies, the Supervisory Board approved the results of the audit of the financial statements. In particular, the Supervisory Board has no objections regarding the declaration made by the Board of Managing Directors pursuant to section 312 (3) of the AktG.
Frankfurt am Main, 28 March 2013For the Supervisory Board
Frank Westhoff Chairman
DVB’s Corporate Governance
We conducted efficiency reviews using detailed questionnaires at the end of March 2012, both in the plenary meeting of the Supervisory Board and in the Credit Committee. The results of this survey were presented and analysed in the respective Super-visory Board and Credit Committee meetings on 29 March 2012. There were only a few points where minor proposals for improve-ment were made; we discussed these proposals and resolved to take the corresponding measures. The Credit Committee and the Supervisory Board consider their work to be efficient.
Implementation of the recommendations of the German Corporate Governance Code was discussed in depth during the Supervisory Board meeting in November 2012. Together with the Board of Managing Directors, we have issued the eleventh Declaration of Compliance in accordance with section 161 of the German Public Limited Companies Act (referring to the German Corporate Governance Code as amended on 15 May 2012) which was pub-lished in the electronic German Federal Gazette and on DVB’s website on 7 December 2012.
All Declarations of Compliance issued by DVB since 2002 are available for download from our website
www.dvbbank.com > Investor Relations > Corporate Governance > Declarations of Compliance
Once again, we determined that, according to our own assess-ment, a sufficient number of independent members serve as Supervisory Board members. Dr Peter Klaus has assumed the role of an expert in finance within the Supervisory Board.
Training and continuous professional development
DVB supports us with respect to training or continuous profes-sional development measures, covering various topical areas, which we need to perform our duties as Supervisory Board members. During the period under review, several Supervisory Board members took part in an internal workshop covering Basel III.

17
DVB Bank SE | Group Annual Report 2012
T hE C OM PA N y F IN A NCI A L A ND EqUI T Y M A RK E T S GROUP M A N AGE MEN T RE P OR T C ONSOL IDAT E D F IN A NCI A L S TAT E MEN T S
The Supervisory Board
Supervisory Board Shareholder representatives Frank Westhoff Chairman Member since 30 June 2006 Dr Peter Klaus Deputy Chairman Member since 10 June 2009 Prof Dr h. c. Stephan Götzl Member since 10 June 2009 Flemming Robert Jacobs Member since 10 June 2005 Wolfgang Köhler Member since 21 September 2009 Dr Klaus Nittinger Member since 10 June 2009
Employee representatives Masahide Kubo Member since 1 October 2011 until 16 January 2013 Dorinus Legters Member since 4 November 2008 Adnan Mohammed Member since 15 February 2013 Martin Wolfert Member since 7 October 2008
Supervisory Board Committees
Credit Committee Frank Westhoff Chairman Dr Peter Klaus Deputy Chairman Flemming R. Jacobs Martin Wolfert
Executive Committee Frank Westhoff Chairman Dr Peter Klaus Deputy Chairman Dorinus Legters

Corporate Governance Report 201218
DVB Bank SE | Group Annual Report 2012
DVB’s dual-board structure
DVB Bank SE opted for a dual-board structure comprising two executive bodies, in addition to the General Meeting: one managing the Bank and its business (managing body: the Board of Managing Directors) and one supervising the management (supervisory body: the Supervisory Board). DVB’s dual-board structure is organised in the following manner:
The Board of Managing Directors – DVB’s managing body
Pursuant to Article 7 of the Memorandum and Articles of Associ-ation of DVB Bank SE, the Board of Managing Directors consists of a minimum of two members who are appointed by the Super-visory Board for a period of no more than five years. The Board of Managing Directors currently has three members.
The Supervisory Board selects those candidates for appointment as members of the Board of Managing Directors who are best qualified in the context of the Bank’s business model. Specific expertise in the transport finance business is decisive, whereas criteria such as gender or nationality are irrelevant (section 5.1.2 (1) sentence 2 of the Code).
Reappointments, for no more than five years per term, are permitted. In principle, the term of office of a Managing Director ends when reaching the age of 65.
In the following declaration pursuant to section 3.10 of the German Corporate Governance Code (the Code) and section 289a (1) of the German Commercial Code (HGB), the Board of Managing Directors and Super-visory Board of DVB Bank SE report on the Bank’s corporate governance.
DVB is a leading global specialist in international transport finance. As a listed company, DVB must observe the recommen-dations and proposals of the Code. The Board of Managing Directors and the Supervisory Board therefore use the Code as a guideline on how to enhance the transparency of business decisions for shareholders, business partners, employees, and the general public. The two Boards review the Code’s recom-mendations – as amended by the Government Commission of the German Corporate Governance Code – and how DVB is implementing them on an annual basis.
DVB’s corporate governance is shaped by four essential parameters:
• responsibleandeffectivecorporategovernanceandcontrolby the Board of Managing Directors and the Supervisory Board;
• theprotectionofstakeholderinterests(shareholders, investors, clients, business partners and staff);
• regularfinancialreportingandindependentaudits;and
• transparentcommunications.
Dual-board structure
Board of Managing Directors
Management body
Corporate strategy
Controlling
Risk management
Compliance
Preparation of the financial statements
and management reports
Minimum of two members
reports to formally approves of
close co-operation to the benefit of the enterprise
reports to
advises, approves, controls, appoints, dismisses
Supervisory Board
Supervising body
Examination, confirmation/approval of
financial statements and resolutions
Members:
six shareholder representatives
three employee representatives
Credit Committee,
Executive Committee
Four scheduled meetings a year
reports to formally approves of
General Meeting
Each share carries one vote.
Resolutions on e.g. the profit appropriation, changes of the Memorandum and Articles of Association as well as legal transactions requiring approval
Appointment of the shareholder representatives on the Supervisory Board and of the auditor

Corporate Governance Report 2012 19
DVB Bank SE | Group Annual Report 2012
T hE C OM PA N y F IN A NCI A L A ND EqUI T Y M A RK E T S GROUP M A N AGE MEN T RE P OR T C ONSOL IDAT E D F IN A NCI A L S TAT E MEN T S
The Board of Managing Directors manages the business in the Company’s best interests, and in order to achieve a sustained increase in its value. In doing so, the Board of Managing Directors considers the interests of shareholders, investors, clients, and business partners – as well as those of the Bank’s employees. DVB’s business model and its strategic position in the relevant global transport markets are determined and refined by the Board of Managing Directors in co-ordination with the Supervisory Board. In addition, the members of the Board of Managing Directors ensure that the Company is managed in accordance with legal regulations, the Memorandum and Articles of Association, and the Internal Regulations. Moreover, the Board of Managing Directors directs the parent company – DVB Bank SE – and the DVB Group, using efficient management tools; specifically, these include financial controls, risk management, and compliance.
Regarding the members of the Board of Managing Directors, no conflicts of interest pursuant to section 4.3 of the Code occurred during the 2012 business year.
More information on the composition of the Board of Managing Directors and the distribution of responsibilities amongst its members is available on page 11 of this annual report.
The Supervisory Board – DVB’s supervisory body
Pursuant to Article 11 (1) of the Memorandum and Articles of Association of DVB Bank SE, the Supervisory Board consists of total of nine members, comprising six shareholder representatives and three employee representatives. The current members of the Supervisory Board are appointed for the period until the conclusion of the General Meeting that passes a resolution on the formal approval for the fourth financial year following the commencement of their term of office (section 11 (2) of the Memorandum and Articles of Association); this will be the Annual General Meeting to be held in 2014. Re-appointments are permissible.
With regard to the election of Supervisory Board Members it shall be generally ensured that any such candidate will not attain the age of 68 years during their term of office as a Member of the Supervisory Board. In special cases, however, this threshold may be exceeded by two years. Former members of the Board of Managing Directors may only be elected to the Supervisory Board after a period of two years has elapsed following their retirement from the Board of Managing Directors, unless their election is proposed by a shareholder holding a stake exceeding 25% of the voting rights of DVB Bank SE.
The Supervisory Board continually advises and supervises the Board of Managing Directors in its management of the business. It is involved in every major business decision. Transactions that require Supervisory Board approval, pursuant to Article 18 of the Memorandum and Articles of Association, include the purchase and sale of companies, the conclusion of inter-company agree-ments and the development of new or the discontinuation of existing business segments, to the extent that the relevant measure has material importance for the DVB Group. In addition, the Supervisory Board is responsible for the appointment and removal of Managing Directors.
The Supervisory Board conducts its business in accordance with its Internal Regulations. It is directed by the Chairman of the Supervisory Board, who sets the agenda for each meeting, chairs the plenary meetings, and signs the meeting minutes. The Internal Regulations of the Supervisory Board also provide for various methods of casting votes; for each poll, the Chairman of the Supervisory Board selects the most appropriate method from amongst these options.
The Supervisory Board has formed two committees, the Executive Committee and the Credit Committee:
• The Executive Committee consists of three Supervisory Board members, including the Chairman and Deputy Chairman of the Supervisory Board, plus an employee representative. The Committee’s tasks are defined in its Internal Regulations: the Executive Committee is responsible for preparing resolutions on the conclusion, extension or termination of contracts with the Managing Directors, and regarding their remuneration; the resolutions are passed by the plenary meeting of the Supervisory Board.
• ThefourmembersoftheCreditCommitteeareelectedfromamongst the members of the Supervisory Board by the plenary meeting; they meet at least four times per year. More-over, the Credit Committee also passes resolutions or holds polls by way of circulation; where appropriate, Committee members communicate via conference calls. The Supervisory Board has delegated authority to the Credit Committee, within the scope of specific Internal Regulations, for certain decisions to be taken on behalf of the Supervisory Board. Specifically, this includes dealing with all DVB Group expo-sures which must be submitted to the Supervisory Board for acknowledgement or approval, as well as all major loans and loans subject to higher risks. Where required, the Credit Committee approves any such loans. Moreover, the Board of Managing Directors co-ordinates the lending policies with the Credit Committee, and keeps the Committee informed on a regular basis about problem loans, exposures subject to higher risk, and unusual events related to the lending business.

Corporate Governance Report 201220
DVB Bank SE | Group Annual Report 2012
Moreover, the Internal Regulations of the Supervisory Board provide for an examination of efficiency, to be performed regularly, where the members of the Supervisory Board critically evaluate their own work.
The Supervisory Board has not established an Audit Committee. However, an independent member of the Supervisory Board has special skills and experience in the fields of accounting and audit of financial statements.
Moreover, the Supervisory Board has not established a Nomination Committee. Instead, candidates are selected within the scope of a differentiated, multi-level co-ordination process involving the Board of Managing Directors, the Chairman of the Supervisory Board and the plenary meeting of the Supervisory Board. This process serves to identify those individuals who possess the requisite transport finance expertise, whilst also fulfilling the personal requirements set out in the Company’s Memorandum and Articles of Association. Criteria such as gender or nationality are irrelevant for this purpose. The Supervisory Board then proposes the candidates chosen in this manner to the Annual General Meeting. In accordance with section 5.4.3 of the Code, future Supervisory Board elections will be conducted individually for each member. In future, within the scope of proposals for election to be submitted to the Annual General Meeting, DVB will disclose each candidate’s personal or business relations with DVB, its executive bodies, or a major shareholder in DVB, as well as proposals for election to the function of Chairman of the Supervisory Board.
Communications between the managing body and the supervisory body are generally structured as follows: between scheduled Supervisory Board meetings, the Chairman of the Board of Managing Directors informs the Chairman of the Supervisory Board – regularly, without delay and always up to date – on the Bank’s strategy, planning, and business development; on the risk situation, and risk management; on the Bank’s Compliance status, important decisions to be taken, and on significant issues. During its meetings, the supervisory body is kept informed, regularly and comprehensively, on developments of strategic parameters pertaining to DVB’s business model, resulting adjust-ments to future business policy, as well as on corporate govern-ance and planning (including financial planning, comprising the planning of DVB’s financial position and financial performance, and human resources planning).
For further information, please refer to the Report of the Supervisory Board (on pages 12 to 16 of this report), which also gives a detailed description of the work of the Super-visory Board and the focal issues discussed during 2012, as well as the processes of communication and co-ordination between the Board of Managing Directors and the Super-visory Board. The current composition of the Supervisory Board, and of its committees, is shown on page 17.

Corporate Governance Report 2012 21
DVB Bank SE | Group Annual Report 2012
T hE C OM PA N y F IN A NCI A L A ND EqUI T Y M A RK E T S GROUP M A N AGE MEN T RE P OR T C ONSOL IDAT E D F IN A NCI A L S TAT E MEN T S
Remuneration of members of the Board of Managing Directors and Supervisory Board
The main features of the remuneration systems for members of the Board of Managing Directors and the Supervisory Board, together with details regarding their remuneration and share-holdings, are set out in the Remuneration Report on pages 125 to 128, which is a part of the group management report.
Please visit our website www.dvbbank.com> Investor Relations > Corporate Governance for general information
on the Code and the way DVB Bank SE has implemented it. There, you will also find the full text of the Corporate Governance Report pursuant to section 3.10 of the Code, and the Corporate Governance Statement pursuant to section 289a of the HGB (which includes the detailed report on the compensation systems for the Management Board and Supervisory Board in accordance with sections 4.2.5 and 5.4.6 of the Code).
Expenses for the remuneration of current and former members of the Board of Managing Directors, and of members of the Supervisory Board totalled €2.8 million (2011: €3.5 million). The total amount is broken down as follows:
General Meeting – protecting shareholders’ interests
DVB’s shareholders exercise their rights prior to or during the General Meeting, as provided by law or in the Memorandum and Articles of Association. The ordinary Annual General Meeting of DVB Bank SE takes place during the first six months after the end of each financial year (Article 21 of the Memorandum and Articles of Association). Shareholders’ regular duties include
accepting the financial statements confirmed by the Supervisory Board and the consolidated financial statements approved by the Supervisory Board; passing resolutions on the appropriation of distributable profit, on the formal approval of the members of the Board of Managing Directors and the Supervisory Board, and on the appointment of the external auditors.
The invitation to the General Meeting of DVB Bank SE, including the agenda, is published in the German Federal Gazette; it is additionally sent to shareholders via their custodian banks. In addition, the convening notice and agenda can easily be accessed via our website as soon as the General Meeting has been convened. For easy reference, we also provide a summary agenda.
www.dvbbank.com > Investor Relations > Annual General Meeting
The website also contains information on shareholder rights pursuant to sections 122 (2), 126 (1), 127, 131 (1) of the German Public Limited Companies Act (AktG). The Bank offers the addi-tional service of allowing shareholders to appoint one of the proxies named by DVB to exercise their voting rights at the General Meeting. Pursuant to section 134 (3) sentence 4 of the AktG, we provide a proxy form which can be used for electronic transmission of a proxy by fax or e-mail.
Our Memorandum and Articles of Association do not currently provide for the casting of votes by post.
More information on the topics discussed during the Annual General Meeting 2012 is available in the chapter “Equity markets and the DVB share” on page 38 of this annual report.
Board of Managing Directors 76.9%
thereof:
54.2% Fixed remuneration component
22.7% Bonus payments
Former members of the Board of
Managing Directors and their surviving dependants 13.3%
Supervisory Board 9.8%
Remuneration of the Board of Managing Directors and Supervisory Board 2012

Corporate Governance Report 201222
DVB Bank SE | Group Annual Report 2012
Transparent communications
We regularly publish information relevant to shareholders and the general public, in addition to DVB’s annual reports:
• We published two ad-hoc disclosures during the period under review: regarding DVB’s preliminary and unaudited consoli-dated financial statements 2011 (on 8 March 2012), and on the sale of a stake in TES Holdings Ltd (on 3 April 2012).
• WedidnotpublishanyDirectors’Dealingsnoticesin2012.
Our website www.dvbbank.com > Investor Relations > Publications > Directors’ Dealings includes a link to
the “News Aktuell” media portal, where Directors’ Dealings notices published by DVB can be viewed.
• Asalistedpubliccompany,DVBBankSEisobligedtoissuean annual Declaration of Compliance, in which the Board of Managing Directors and the Supervisory Board provide details on their compliance with the recommendations of the Code, and give reasons for any deviations. DVB published its eleventh Declaration of Compliance on 7 December 2012; the declaration covers the years 2012 and 2013, and is available on the Bank’s website.
All Declarations of Compliance issued by DVB since 2002 are available for download from our website
www.dvbbank.com> Investor Relations > Corporate Governance > Declarations of Compliance.
• Wecompiledallpublicationsrelevanttoshareholdersduringthe business year 2011 in an Annual Document pursuant to section 10 of the German Securities Prospectus Act (WpPG). We published this document on our website on 8 March 2012.
Regular financial reporting and independent audits
We use financial reports to supply our shareholders and the general public with regular information about DVB’s financial position and performance. DVB publishes two annual reports for each concluded business year. The annual report of DVB Bank SE comprises the Bank’s financial statements in accordance with the HGB, whilst DVB Group’s annual report contains its IFRS consolidated financial statements. Both sets of financial state-ments are prepared by the Board of Managing Directors. They are subjected to a review by the independent external auditors appointed at the Annual General Meeting before being confirmed (single-entity financial statements) by, or receiving final approval (consolidated financial statements) from the Supervisory Board.
The single-entity report of DVB Bank SE is only published on the Bank’s website in German. The Group Annual Report is available for download from our website in both English and German. Since 2011, we have also published our Group Annual Report – in both languages – as an easy-to-read HTML report.
This online report is expected to be available at the end of April 2013, on our website www.dvbbank.com
> Investor Relations > Publications > Financial Reports > DVB Group’s Annual Report 2012, or directly via www.dvbbank-annualreport.com.
During the year, we also publish a half-yearly financial report that includes condensed consolidated financial statements and interim management statements during the first and second half of the year, covering key financial data for the first three months and nine months of the business year, respectively. All these three financial reports are prepared according to IFRS.
The Annual General Meeting on 13 June 2012 appointed Ernst & Young GmbH Wirtschaftsprüfungsgesellschaft, Stuttgart, as auditors for the 2012 business year. The mandate covers the audit of the single-entity financial statements and the consolidated financial statements prepared by DVB for the 2012 business year, as well as any review of the condensed financial statements and interim management report as at 30 June 2012, and of the interim consolidated financial statements prepared prior to the Ordinary General Meeting 2013.

Corporate Governance Report 2012 23
DVB Bank SE | Group Annual Report 2012
T hE C OM PA N y F IN A NCI A L A ND EqUI T Y M A RK E T S GROUP M A N AGE MEN T RE P OR T C ONSOL IDAT E D F IN A NCI A L S TAT E MEN T S
• Weactivelyusetheinternetforallrelevantpublicationstoensure that information is provided to shareholders and the public in a timely, concurrent and comprehensive manner. The Bank’s website is the point of contact frequently used by interested financial markets participants.
• Since2008,wehavealsoprovidedadedicatedinformationservice: our Investor Relations newsletter, “Performance”. This is designed to actively relay target group-specific infor-mation about DVB’s performance and its business divisions.
• Followingin-depthresearch,welaunchedDVB’spresence in the social media at the beginning of 2012 by opening com-munications channels on Twitter (short messages), YouTube (video clips), Slideshare (presentations and reports) and Flickr (photography). We use these modern platforms as a targeted means of bringing DVB’s communications products closer to our stakeholders, and to encourage interaction with the Bank.
Our website www.dvbbank.com > Investor Relations > Media > Social Media provides a transparent overview
of our social media activities.
• Within the scope of both regular and ad-hoc events – including the Annual General Meeting, the Annual Accounts Press and Analyst Conference, as well as follow-up rating discussions, road shows and one-on-one meetings – we maintain a con-tinuous, direct and intensive dialogue with shareholders, rating and bank analysts, and the financial media.
• Wecompilethescheduleddatesofmaterialrecurringeventsand publications in the financial calendar, which is published on the Bank’s Investor Relations website in good time, and is permanently made available there. This allows all those interested to be informed without undue delay.
Management tools
The key tools employed to manage the business are financial controls, the risk management system, and the compliance function.
Financial controlling
The Board of Managing Directors has an extensive set of controls at its disposal: it uses them for value-driven and integrated over-all management of the Bank – taking into account both income and risk parameters. From an ex-ante point of view, the key task is to distinguish beneficial options from disadvantageous ones – with a focus on the transparent and consistent design of target systems, alternatives, and forecasts. Ex-post analyses, in contrast, are carried out within the framework of a systematic cycle of planning, management and control. This means identifying con-crete measures and management options that are specifically designed to meet the requirements of the respective management areas.
The information gained through analysing risk-adjusted profit-ability provides transparency regarding the value created throughout the Group, and in the various units managed. The metrics used internally to assess the performance of each unit are economic value added (EVA) and return on risk-adjusted capital (RORAC). Both indicators measure the performance generated on the risk capital invested. Risk-adjusted profitability data is a key input factor for allocating capital and resources within the enterprise.
All of DVB’s divisions and areas are covered by a uniform value-driven management system. Besides income, risk is another key dimension of all ex-ante and ex-post analyses.

Corporate Governance Report 201224
DVB Bank SE | Group Annual Report 2012
DVB’s (narrowly defined) risk management system distinguishes between operative and strategic risk management. Operative risk management is defined as the implementation of the risk strategy by the various business divisions, as prescribed by the Board of Managing Directors. In addition to defining risk policy guidelines, strategic risk management also coordinates and sup-ports operative risk management processes by cross-divisional committees.
The risk control function – which is independent from risk man-agement in the narrower sense – comprises the identification, quantification, limitation and monitoring of risks, plus risk reporting. A differentiated and sophisticated DVB Group Risk Report is submitted to the entire Board of Managing Directors and the Supervisory Board on a quarterly basis, informing the two Boards about the Group’s risk exposure. Furthermore, DVB has installed reporting systems for all relevant types of risk. This ensures that the risks are at all times transparent to the authorised persons with responsibility for those risks.
For more details regarding risk management, please refer to the report on opportunities and risks on pages 132 to 154 of this Annual Report.
Compliance
DVB defines compliance as adherence to the law and the Com-pany’s Memorandum and Articles of Association, as well as compliance with internal rules and regulations and voluntary obligations. The Compliance Office has been mandated by the Board of Managing Directors to ensure that regulatory compli-ance is implemented throughout the Group. Thus, the scope of the function includes – but is not limited to – money laundering prevention, prevention of market abuse or market manipulation, data protection, conflicts of interest, anti-corruption, and com-pliance with the Markets in Financial Instruments Directive. In accordance with section 33 (1) sentence 2 no. 5 of the WpHG, the Head of Compliance submits a Compliance Report to the Board of Managing Directors and the Supervisory Board, at least once a year; this report complies with the requirements pursuant to sections 31 et seq. of the WpHG and of the MaComp (Minimum Requirements for the Compliance Function and Additional Requirements Governing Rules of Conduct, Organisation and Transparency pursuant to sections 31 et seq. of the WpHG).
In essence, the Group’s focus is on achieving defined income and cost targets, whilst maintaining its risk-bearing capacity and ensuring compliance with regulatory requirements. In addition to the strategic plan and a detailed one-year plan, the standardised toolbox also provides for regular projections of full-year results carried out over the course of the year. The periodic management information system is built on top of an integrated data ware-house, with ad-hoc studies and analyses used as required.
DVB’s tools for measuring risk-adjusted profitability are also integrated in the “Integrated risk and capital management system used throughout the Dz BANK Group”.
Risk Management
DVB’s Board of Managing Directors has established an adequate and well-functioning risk management system that fulfils the Bank’s own commercial needs and complies with legal require-ments. With the methods, models, organisational rules and IT systems implemented, DVB is able to recognise material risks at an early stage, and to respond appropriately by taking suitable measures. The suitability and effectiveness of DVB’s risk manage-ment system are regularly reviewed by internal and external auditors.
DVB operates a Group-wide risk management system, which complies with all statutory and regulatory requirements. This risk management system comprises adequate provisions and measures with respect to risk strategy, risk-bearing capacity, risk management, and risk monitoring, plus a multi-level frame-work for the early detection of risks. In addition to the structural and procedural organisation, these measures also apply to the processes for identifying, assessing, managing, monitoring and communicating the risks.

Corporate Governance Report 2012 25
DVB Bank SE | Group Annual Report 2012
T hE C OM PA N y F IN A NCI A L A ND EqUI T Y M A RK E T S GROUP M A N AGE MEN T RE P OR T C ONSOL IDAT E D F IN A NCI A L S TAT E MEN T S
Sustainable conduct – both commercially and socially – is a key element of DVB’s corporate culture. To ensure a professional, uniform and exemplary standard of conduct throughout the Group, the Board of Managing Directors developed a Code of Conduct at the beginning of 2010. The values enshrined in this Code of Conduct must be observed vis-à-vis our clients and business partners as well as all fellow employees.
The Code of Conduct outlines DVB’s mission statement based on four core values:
• We offer our clients professional expertise on transport markets and transport assets – throughout all market cycles.
• Wesupportourclientsaroundtheworldwithtailor-madefinancing solutions and services. Our products meet all relevant legal and ethical standards.
• Entrepreneurialvisionandstrengthguidesoureverythoughtand action.
• We create a working environment for all DVB staff that promotes expertise, creativity, dedication, teamwork and variety.
In this way, the Code of Conduct is also designed to manage ethical and legal challenges arising during day-to-day work, providing guidance in the event of any conflicts.
Our website www.dvbbank.com> Investor Relations > Compliance also contains DVB’s Code of Conduct.
Compliance staff have been appointed in each of the Bank’s locations, directly reporting in this capacity to the Head of Com-pliance. Where possible, automated monitoring systems have been implemented, which ensure that any potential breaches are automatically alerted to the central function in Frankfurt/Main. The local Compliance Officers must additionally escalate any potential breach of internal policies/procedures as well as external rules and regulations.
All staff attend regular trainings on compliance-related topics. We have partnered with an external provider to conduct web-based training sessions. Specifically, mandatory webinars were carried out focused on money laundering prevention, operational risk, data protection and security, conflicts of interest, and the Code of Conduct. In addition, we conducted regional follow-up group trainings on anti-money laundering and anti-corruption measures where we use a training video covering the topics, provided information concerning special regional requirements, and offered the opportunity to discuss the key learnings.

26
DVB Bank SE | Group Annual Report 2012
Employees and sustainability
In 2012, DVB once again achieved excellent results on the troubled waters of the international transport markets with its focused business model. Our main objective throughout every market situation is to secure and enhance the business model for the long term.
Securing the business model for the long term
DVB has earned an excellent reputation as a specialised niche provider of advisory and financing services in the international transport finance business. We take the responsibility for main-taining and developing our good name and the DVB company brand very seriously. Our unique business model will continue to develop successfully on the cyclical transport markets as long as it lastingly secures even greater confidence – from our clients, investors and staff – in DVB. A capable management structure is in place, and our management teams have extensive expertise in the global transport and financial markets.
In order to continually and successfully apply our focused business model in cyclical and even in volatile markets, it is crucial that we proactively identify all the risks that we are exposed to. We call upon Controlling, Risk Management, and Compliance to ensure that all legal, regulatory and statutory requirements are being met. Compliance is responsible for preventing money laundering, market abuse or manipulation, ensuring data protec-tion, handling conflicts of interest, and compliance with the Markets in Financial Instruments Directive. All employees receive compliance training on a regular basis, to ensure that everyone is aware of and familiar with defined responsibilities and require-ments.
Fostering fair and transparent competition is a cornerstone of our business philosophy, underpinned by clearly defined and strict compliance guidelines:
• Rulestopromotefaircompetition(ConflictofInterestPolicy)
• Rulestopreventcorruption(AntiCorruptionandBribery)
• Guidelinesrelatingtoacceptinggiftsandbenefits (Gifts and Gratuities)
• Procedureforreportinganyirregularities(Whistleblowing)
The Board of Managing Directors implemented a Code of Conduct in the spring of 2010, in order to secure and deepen employee awareness of, and understanding for, compliant and ethically faultless conduct. We are proud of the experienced and effective team, which maintains exemplary standards of conduct towards clients and investors.
The Code of Conduct can be viewed on our website www.dvbbank.com under Investor Relations > Compliance.

27
DVB Bank SE | Group Annual Report 2012
T hE C OM PA N y F IN A NCI A L A ND EqUI T Y M A RK E T S GROUP M A N AGE MEN T RE P OR T C ONSOL IDAT E D F IN A NCI A L S TAT E MEN T S
Employees and sustainability
DVB pursues a cycle-neutral business model: this is why the Bank has remained a reliable partner to its clients, continuing to provide financing and advice even in a market environment that continues to be challenging. This strengthens the trust, and deepens the intensity of our client relationships for the long term.
Accordingly, we support our Transport Finance and Investment Management clients with their financing projects on a long-term basis. As at 31 December 2012, 75.2% of our clients had been using our range of services for more than five years (previous year: 75.3%). Of our client relationships in the Transport Finance and Investment Management business divisions, we have main-tained
• 3.1% forlessthanoneyear,• 8.1% forbetweenonetothreeyears,• 13.6% forbetweenthreetofiveyears,• 42.2% forbetweenfivetotenyears,• 20.8% forbetweententofifteenyears,and• 12.2% forfifteenyearsandlonger.
Whilst the average length of client relationships differs between the business divisions, it is worth noting that Investment Management only commenced operations in 2001.
DVB’s diversity management approach
DVB’s business model is international in every respect:
• Wemaintainaglobalpresenceattwelvekeytransporthubs:at our Frankfurt/Main head office, as well as seven European locations (Athens, Bergen, Hamburg, London, Oslo, Rotterdam and zurich), plus offices in North and South America (New York and Curaçao) and in Asia (Singapore and Tokyo).
• Ourclientbaseistrulyinternational.
• Ouremployeesbelongtoawidevarietyofculturalcircles,and come from many different nations.
Client structure and sustained client loyalty
At the end of 2012, DVB’s global client base comprised 624 clients or client groups (previous year: 633). Most of our clients are domiciled in Europe (48.2%), followed by Asia (19.2%) and North America (18.9%). They are divided between Shipping Finance with 52.2%, Aviation Finance with 26.4%, Land Transport Finance with 8.0%, ITF Suisse with 6.5% and Investment Management with 2.7%.
%60
50
40
30
20
10
0
2.8 3.6 1.6 5.4
Less than 1 year
14.7
6.9
6.0 5.9
1 to 3 years
15.5
13.4 15.0
6.9
3 to 5 years
53.1
44.7
36.2
33.7
5 to 10 years
23.5 20.8
16.9
12.3
10 to 15 years
23.0
13.1 15.4
9.5
15 years and longer
Shipping Finance Aviation Finance Land Transport Finance Investment Management
Length of client relationship by business division

28
DVB Bank SE | Group Annual Report 2012
Employees and sustainability
Active and sustainable human resources work
Thanks to DVB’s largely stable staff base, during 2012 we were able to focus on integrating the 50 new colleagues who joined the Bank since 2010. Another focal aspect of our work was to support managers in promoting staff within their area of respon-sibility, and to enhance their qualification.
Development of the personnel structure in 2012
In 2011, the Bank’s staffing level had risen significantly, by 40 people or 7.9% – in 2012 the number of active employees increased by only ten (+1.8%), reaching a total of 558. This figure does not reflect the nine employees with inactive employment relationships, such as the non-working phase of semi-retirement, maternity or other parental leave. The staffing numbers for the years 2008 to 2012 shown here also include employees of the DVB LogPay GmbH subsidiary, but no longer the employees of TES Aviation Group.
Rising staff numbers over recent years were largely due to a significant increase in workload, in response to greater legal and regulatory requirements that had to be absorbed by additional staff. This trend prevailed during 2012, affecting staffing levels in the product and service areas in particular: at 199 employees, the number was 5.3% higher than in the previous year (year-end 2011: 189 employees). Hence, the increase in staff numbers in
2012 was fully attributable to these teams. We hope that, going forwards, any new legal or regulatory requirements will not lead to such a significant increase in personnel again.
Regardless of rising staffing levels in the service areas, employees in the product and service areas continue to account for approx-imately one-third of DVB’s overall staff base; this is consistent with our long-term target of having two-thirds of our workforce employed in front-office teams, with the remaining one-third in product and services teams.
Staff levels 2008 – 2012
700
600
500
400
300
200
100
0
14
513
2008
10
505
2009
5
508
2010
7
548
2011
9
558
2012
Staff members in the active phase of employment Staff members in the passive phase of employment
Number of
staff members
For detailed statistical information about our employees, please refer to the “Non-financial performance indicators“ portion of the management report on pages 129–130 of this report.
Transport Finance/Investment Management 305 (–1 staff)
Product and service areas 199 (+10 staff)
DVB LogPay 54 (+1 staff)
Distribution of 558 employees by business division

29
DVB Bank SE | Group Annual Report 2012
T hE C OM PA N y F IN A NCI A L A ND EqUI T Y M A RK E T S GROUP M A N AGE MEN T RE P OR T C ONSOL IDAT E D F IN A NCI A L S TAT E MEN T S
Employees and sustainability
Of the total of 558 employees, 348 were men and 210 were women, as at the end of 2012. The breakdown by age and gender is as follows:
Diversity as a human resources management task
Diversity management has been a part of day-to-day life at DVB for quite some time. To cite a few statistical details, DVB’s employees hail from a total of 40 different countries, and there are 31 different nationalities represented within our core Transport Finance business.
Nationalities 2012
Employees at DVB
Employees in Transport Finance/
Investment ManagementNumber % Number %
German 228 40.9 47 15.4
Dutch 72 12.9 57 18.7
British 65 11.6 48 15.7
Norwegian 31 5.5 29 9.5
US-American 30 5.4 24 7.9
Singaporean 29 5.2 22 7.2
Greek 20 3.6 16 5.3
33 additional nationalities within DVB 83 14.9 – –
24 additional nationalities in Transport Finance/Investment Management – – 62 20.3
Total 558 100.0 305 100.0
Number of employees
140
120
100
80
60
40
20
0
51
29 22
Younger than
30 years
85
47
38
30 – 34 years old
110
64
46
35 – 39 years old
110
67
43
40 – 44 years old
83
62
21
45 – 49 years old
53
34
19
50 – 54 years old
66
45
21
55 years
and older
Female Male Total
Age structure and gender allocation 2012
30
DVB Bank SE | Group Annual Report 2012
Employees and sustainability
Recruitment
To fill open positions, we first look for experienced specialists, whether it be in Transport Finance or in our product and service areas. Accordingly, we generally recruit personnel with the help of recruitment consultants. Fortunately we have increasingly been able to fill positions through referrals from our own employees, or through unsolicited applications. No recruitment measures are necessary for our trainee programme, as there are plenty of qualified candidates who apply directly.
DVB’s focus on diversity, as outlined above, is also reflected in our recruitment activities: to the extent possible within the scope of staff selection, we strive to promote a heterogeneous personnel structure at all of DVB’s office locations, in terms of gender, age and nationality.
Personnel development
DVB’s business environment constantly gives rise to new and complex issues that our organisation has to deal with. The goal of human resources development is to equip managers and staff with the skills to deal with these challenges in the best possible way.
Annual employee reviews are one of our key development instru-ments: they provide a platform for open dialogue, between manager and employee, regarding the employee’s skills, expertise and potential for development. For this purpose, Group Human Resources provides managers with a discussion guideline that is deliberately kept lean. The guideline serves as an orientation for structuring the discussion, leaving scope for further discussion issues. Development measures planned for the employee are noted in the guideline, and are implemented by manager and employee, with support provided by Group Human Resources.
Besides the employee review, the determination of the bonus has been deliberately set up as a separate process. Determining bonuses is based on achieving explicit quantitative or qualitative targets that have been mutually agreed upon by employees and their managers.
In-house training courses are one of the focal points of current personnel development measures. In this context, the following factors constitute particular challenges:
• Ourstaffmembersworkacrossseveralcontinents,withsome very diverse cultural backgrounds.
• Wemustevaluatenewlearningtechniques,and
• draw up a concept that we can integrate into DVB’s corporate culture and internal processes.
A first step in the course of this personnel development drive during 2012 was a major in-house training initiative to develop presentation skills: in co-operation with a specialist training provider from the United Kingdom, we conducted tailor-made presentation skills courses at several locations. Participants rated the courses as extremely effective, praising the practical relevance and feasibility of the contents imparted. Further training courses have been scheduled for 2013.
We have been conducting our trainee programme successfully for many years. The roughly 18-month programme covers all the major aspects of our Transport Finance business, including relationship management and loan management. The financial and global economic crisis made stable and definitive human resources planning challenging, which resulted in lower trainee appointments. Since 2011, new trainees have been accepted into the programme.
Leadership and management
One of DVB’s main characteristics – our dynamic approach – is embedded in our concept of leadership. Our executive staff need to respond quickly and flexibly. DVB’s flat hierarchical structure helps decision-makers to respond quickly, precisely and in a targeted manner, even to complex issues or transactions.

31
DVB Bank SE | Group Annual Report 2012
T hE C OM PA N y F IN A NCI A L A ND EqUI T Y M A RK E T S GROUP M A N AGE MEN T RE P OR T C ONSOL IDAT E D F IN A NCI A L S TAT E MEN T S
Employees and sustainability
The course, which will cover several days, will focus on the following core topics, and on ways and means to implement them in practice:
• givingandreceivingfeedback;• discoveringtalentsandpromotingthem;• coachingemployees;• workingonone’sowncareerdevelopment.
We will ensure the sustainable effect of this course, and the transfer of imparted knowledge into practice, through a set of interwoven measures. For instance, managers may use the tool box mentioned above. Furthermore, we plan to extend the training course to include the next management level.
DVB’s Talent Management Programme is a key achievement for qualifying our management staff, developing a culture of open feedback, and towards creating a shared vision of management.
Demographics management
In demographics management, it is important to identify long-term trends and confront challenges to resolve them constructively. One long-term trend that we contend with is demographic development. All of the industrialised countries in which DVB is represented are undergoing similar changes: the population and the workforce are ageing. At the end of 2012, 119 of the 558 employees were over 50 years old (21.3% of the workforce) and 159 staff members have been with DVB for more than 10 years (28.5% of the workforce).
Given the heavy workloads and the new challenges that con-stantly arise, we are confronting the question of how DVB can motivate these experienced employees for the long term, and secure their loyalty to DVB. This is where our in-house training concept comes in: by establishing a variety of learning options, and sustainably integrating them in our corporate environment, we secure the readiness and commitment of our employees.
Work-life balance
Flexibility is a cornerstone of achieving a work-life balance, which is why we at DVB believe that flexible work hours are so important – without amending our existing policy to make them possible. For years, there has been the so-called honours work schedule at every DVB office. This system of flexible working hours is based on flexitime without a set schedule. Employees schedule their workday themselves, in co-ordination with their managers, and take account of the times that they absolutely need to be present.
Managers, as well as the members of the Board of Managing Directors, are also always accessible under our open-door policy in order to engender internal transparency and an open exchange. Being receptive to new ideas and challenging of opinions is at the heart of our concept of management.
In an organisation with a manageable number of employees such as DVB, we believe it is more productive to promote a personal approach, offering a high degree of autonomy rather than a top-down management style. Given this background, employee management, training and development are not administered centrally; instead, they are primarily the responsibility of man-agers. Group Human Resources provides support.
Specifically, this means that we are currently developing a “tool box” for our executive staff, comprising tools for analysing needs for development, structuring employee appraisal discussions and specific training proposals – all tied into a programme for managers that enables them to apply these tools: the DVB Talent Management Programme.
DVB Talent Management Programme
DVB conducted a Management Survey amongst all its Senior Vice Presidents and Managing Directors in 2011. The results of this survey showed that the ongoing professional development of management staff is a key aspect of our human resources work.
For instance, those surveyed expressed their desire for proactive Human Resources development and for new development per-spectives, including outside traditional careers. Our aim is not to centralise the work managers are responsible for in overseeing, training and developing employees, but rather to better equip those managers for their management duties. That is why we developed a training for managers, to enable them to deploy our development tools in a targeted manner. Encompassing all executive staff below the Board of Managing Directors, the course will take place during the first half of 2013, in co-operation with an international business school.
The training concept was developed over a period of several months. Group Human Resources discussed the results of the 2011 Management Survey with the training provider and also conducted interviews with DVB’s managers concerning the corporate culture, talent management and executive career development. The Works Council also contributed to the design of the programme.

32
DVB Bank SE | Group Annual Report 2012
Employees and sustainability
At the end of 2012, the share of part-time employees in DVB’s staff remained virtually constant, at 9.5% – or 44 female employees and nine male employees. This underscores our receptive attitude to part-time solutions that, whenever possible and appropriate, we also encourage. In addition to this traditional way of scaling back working hours, we are also receptive to setting up schedules on an individual basis to make it possible to better balance professional and personal demands, not only as concerns motherhood and raising children, but also for family members who are ill or require care, for instance.
Another step in fostering a work-life balance at DVB is the option of working from home on a regular basis for special job demands – or doing so on a short-term basis in certain situations. This type of flexibility is very important to DVB.
Health and safety at the workplace
Promoting the health of our employees at the workplace is a top priority. We established the Committee for Occupational Health and Safety to be responsible for the creation, maintenance and development of safe and ergonomic workplaces, as well as the identification of potential risks and the prevention of accidents and work-related health problems. We contribute to a comfortable working environment with modern and high-quality office facilities that foster effective work.
Occupational health consulting is carried out by an external provider in Frankfurt/Main. This company supports the Bank in occupational safety, accident prevention and all other health and safety issues. At a local level, managers are responsible for risk assessment and management as part of occupational safety, and for enacting measures to prevent work-related health problems.
We offer employees at all of our offices a thorough health check-up, and provide assistance with vaccinations when necessary. To protect our employees in the event of illness, disability or accident, we make an extensive insurance programme available at each of our offices, further supplemented by global policies.
Whilst the in-house restaurant at our Bergen office is run by the local branch, DVB has handed over the operation of its employee restaurant in Frankfurt/Main and Rotterdam to an external service provider.
Environmentally friendly travel policies
DVB’s Travel Policy stipulates that employees should ideally opt for public transit for business trips, and to get to work every day. We assist in getting job tickets whenever possible and practicable. In order to limit plane trips to only what is truly necessary, DVB uses phone and video conferences whenever possible and practical for meetings: these can be convened at every office (with the exception of Oslo and Tokyo) using state-of-the-art conference technology.
Remuneration systems
The group of the twenty largest industrial nations and emerging market countries, the G20, has launched a variety of initiatives relating to the remuneration systems in banks since 2009. They were implemented at a national level in 2010. With the German Ordinance Regarding the Regulatory Requirements for Remuner-ation Systems of Institutions (referred to in this section as the “Ordinance”) which came into force on 13 October 2010, the German Federal Ministry of Finance has detailed the requirements for remuneration systems implemented by financial institutions, in the context of the German Banking Act. The Ordinance applies to all employees of DVB, at all locations.
The Board of Managing Directors carried out a detailed risk analysis, as required pursuant to the Ordinance, and determined that the Bank only needs to comply with the general requirements set out in the Ordinance. In this context, the Board of Managing Directors has assessed remuneration aspects as follows:
• Remuneration is geared towards the Bank’s strategic objectives.
• Theratiooffixedtovariableremunerationisappropriate.
• Theremunerationstructuredoesnotgiverisetoconflicts of interest regarding staff members working in front-office or back-office teams.
• Employeesaresufficientlyinformedoftheremuneration systems that are relevant to them, in writing.
For payments made during 2011, the Board of Managing Directors has determined an appropriate upper limit for the ratio of fixed to variable remuneration.

33
DVB Bank SE | Group Annual Report 2012
T hE C OM PA N y F IN A NCI A L A ND EqUI T Y M A RK E T S GROUP M A N AGE MEN T RE P OR T C ONSOL IDAT E D F IN A NCI A L S TAT E MEN T S
Open communication – An essential part of DVB’s culture
DVB is internationally active in selected segments of the trans-port market, and is accordingly represented at pivotal transport locations. A culture of open information and communication within DVB is imperative for us across all of our offices. To this end, we have implemented the following instruments:
• TheGlobalManagementConference,whichhasbeentakingplace annually since 2001, serves to promote and ensure close communication between the Board of Managing Directors and managers. Regular topics discussed include the Bank’s strategic planning, operational issues and planning for other business activities as well as medium-term budgeting. The event is also accompanied by a supporting programme that aims at promoting team spirit amongst managers.
• ColleaguesfromtheTransportFinancedivisionsgatheratdivisional meetings to discuss major market trends and con-clusions for structuring the portfolio. The optimisation of organisational procedures and communication processes is also regularly on the agenda.
• BackofficestaffatDVB’sinternationallocationsalsomeetonce a year to discuss current issues. One of their objectives is to work together to optimise business processes.
• Theregularvirtualgeneralemployeemeeting,aweb-confer-ence launched in 2009, enables employees to contribute their questions directly to the discussion between the SE Works Council and the Board of Managing Directors. This forum has successfully cemented itself as an important part of our corporate culture.
• Officepartiesarealsoorganisedlocally,asteam-buildingmeasures.
In consultation with the Works Council, we amended our bonus policy in 2010. qualitative aspects of performance that are diffi-cult or impossible to assess and describe quantitatively should be better reflected in determining the bonus. Consequently, we introduced a modifier element into our bonus policy for 2011. This element provides the Board of Managing Directors with evaluation latitude in determining the bonus, whilst making case-by-case solutions possible.
Collaborating with the works councils
In 2012 we were once again able to swiftly confront new chal-lenges and develop pragmatic solutions. This was only possible thanks to the good co-operation that took place with the SE Works Council, as well as with local Works Councils in Germany and the Netherlands.
Employees and sustainability
For more information about our remuneration system, please refer to the "Remuneration Report", which forms part of the Management Report, on pages 125 – 128.

34
DVB Bank SE | Group Annual Report 2012
by purchasing such securities. Whilst the ECB has not set any limit for such purchases, they are strictly conditional. For instance, only government bonds of those euro member countries will be purchased which previously agreed upon a rescue programme under the auspices of the European Financial Market Stabilisation Facility (EFSF) or the ESM, and provided that the countries con-cerned comply with the conditions imposed under such rescue programmes.
US Federal Reserve (Fed) launches third bond-purchasing programme
The Fed adhered to its expansive monetary policy throughout 2012. Faced with persistently high unemployment as well as uncertainty regarding economic developments and financial policy in the United States, the Fed launched its third bond-purchasing programme in September 2012, which provides for monthly purchases of mortgage-backed securities in the amount of US$40 billion. The Fed indicated that it would only cease these purchases once the situation on the US labour market has clearly improved. In addition, the Fed continued its existing special programmes, particularly “Operation Twist”, the pro-gramme designed to switch its government bond holdings to longer maturities. The objective of these quantitative measures is to stimulate the US economy through lower longer-term yields.
The euro recovered only during the second half of 2012
The year 2012 was a turbulent one for the currency, once again overshadowed by the European sovereign debt crisis. Whilst the euro still posted gains compared to the US dollar during the first quarter of 2012, with the exchange rate rising to above US$1.34 by the end of February, the currency then lost ground until the summer 2012, against the background of growing con-cerns about the continued existence of the European currency area. The euro thus fell to its yearly low of US$1.21 at the end of July 2012. However, the euro largely recovered during the second half of the year: thanks to the ECB’s crisis management, the single currency visibly stabilised during September. This was supported by a decision from the German Constitutional Court which gave its ”green light” for the ESM and the fiscal pact in September 2012. Toward the end of the year, the euro benefited additionally from the progress made with the OMT bond repur-chasing programme, as well as from the release of further aid for Greece. Given these conflicting factors, the euro/US dollar exchange rate closed the year 2012 at a rate of US$1.32, up three cents from the previous year-end (US$1.29).
The European sovereign debt crisis remained acute throughout 2012, and was the key driver for euro zone financial markets.
Financial markets calmed down at the beginning of the year, as a three-year repo transaction by the European Central Bank (ECB) bolstered the liquidity supply of European commercial banks. Moreover, in March 2012 a second rescue package worth €130 billion was agreed upon for Greece, and for the refinancing of Greek debt held by private-sector creditors.
The European Union (EU) – Rescue package for Spanish banks
The economic outlook worsened palpably during the second quarter of 2012, as troubled euro member states suffered further ratings downgrades, and distressed commercial banks at the euro periphery caused further concerns about an unchecked escalation of the sovereign debt crisis. These euro zone countries saw a marked widening in risk premiums on their government bond issues. This reflected a loss of confidence by investors, which increasingly threatened the ability of Spain and Italy to refinance, and to meet their financial obligations. Public discus-sions increasingly questioned the continued existence of the euro zone. Responding to this renewed escalation of the euro debt crisis, the EU approved a €100 billion credit line for Spain, earmarked to salvage the country’s ailing banking sector. Moreover, progress made with the ratification of the European Stability Mechanism (ESM) and the fiscal pact brought relief to the situation.
ECB – A more prominent role for its monetary policy
The ECB took centre stage in fighting the crisis during the second half of the year, by boosting its expansive monetary policy. In response to the weakening euro zone economy and the renewed intensification of the euro sovereign debt crisis, the ECB cut its key interest rate in July 2012, from 1.0% to a new all-time low of 0.75%. In addition, it lowered the interest rate for overnight deposits by European commercial banks with the ECB to 0.0% for the first time. With its Outright Monetary Transactions (OMT) securities purchasing programme, the ECB underlined a clear commitment to the euro in September 2012, together with its obligation to do everything it takes – within the boundaries of its mandate – to preserve the currency’s existence. The pur-pose of this special bond-purchasing programme is to counter excessive price fluctuations affecting euro government bonds,
Financial markets and DVB’s financial markets activities

35
DVB Bank SE | Group Annual Report 2012
T HE C OMPA N Y F IN A NC I A L A ND Eq U I T y M A R K E T S GROUP M A N AGE MEN T RE P OR T C ONSOL IDAT E D F IN A NCI A L S TAT E MEN T S
Financial markets and DVB’s financial markets activities
DVB’s financial markets activities
DVB continued to consistently implement its business model, which focuses on financing, structuring, and advisory services in the international Transport Finance business, throughout 2012. By generally avoiding the so-called credit surrogates business, the bank was protected from the direct negative impact of the financial markets and international sovereign debt crises.
2012 was characterised by a general recovery on international financial markets. As in the previous years, DVB’s funding activi-ties benefited from the Bank’s integration into the German Cooperative Financial Services Network, which has sufficient liquidity available.
DVB’s funding volume with interest-bearing liabilities totalled €19.9 billion in 2012, of which 97.5% had long-term maturities.
Given that our lending business in international Transport Finance is predominantly US-dollar-based, it is very important for us to establish a hedge between assets and liabilities with regard to currency exposure. To the extent possible, we want to benefit from a “natural” hedge, through matched currencies. We con-sistently pursued this objective in 2012: commercially, €4.7 billion (+4.4%) of our aggregate funding was denominated in euro, whilst €15.0 billion (+7.9%) was denominated in US dollars and €0.2 billion in other currencies.
We also consistently expanded the Bank’s investor base, in line with our strategy. Newly-originated promissory note loans placed with institutional investors exceeded the one billion euro threshold for the first time in 2012. Moreover, we succeeded in placing €295 million and US$50 million in ship covered bonds. As another milestone in our funding activities, we established a euro benchmark curve, achieving notable success with the public placement of two €500 million public euro-denominated bonds. The three- and five-year issues were oversubscribed several times. With a public CHF100 million bond issue, we also success-fully expanded our investor base from a regional perspective.
Development of DVB’s ratings
Since December 2011, DVB Bank SE has been rated A+/A-1/stable by ratings agency Standard & Poor’s (S&P). These ratings remained unchanged in 2012.
In early 2012, DVB Bank SE was rated A1/P-1/D+/negative by Moody’s Investors Service (Moody’s). In the course of a pan-European rating review of banks which commenced in February 2012, Moody’s changed the ratings grades of several German banks and their subsidiaries in June 2012. In this context, DVB’s ratings were also downgraded, by up to three notches, in several rating categories. This resulted in a significant divergence compared to the Bank’s S&P ratings, as well as vis-à-vis the A+/F1+ rating assigned by FitchRatings to the German Coopera-tive Financial Services Network. The Bank terminated its rating agreements with Moody’s, with effect from November 2012.
Long-term refinancing vehicles 97.5%
thereof:
52.8% Uncovered bearer bonds
38.7% Promissory notes/long-term deposits
4.5% Ship covered bonds
1.5% Own funds in accordance with the KWG
Short-term deposits from other banks/customers 2.5%
Refinancing instruments 2012
36
DVB Bank SE | Group Annual Report 2012
Equity markets and the DVB share
The Dow Jones Industrial index finished 2012 with a clear rise – at 13,104 points, it was up 7.3% on year-end 2011. The Japanese Nikkei-225 index ended the year at 10,395 points, up 22.9% year-on-year. Finally, the performance of the Chinese stock exchange was positive in 2012 – the most important indices, the SH COMP (Shanghai Stock Exchange Composite Index) and CSI 300 (China Securities Index) were up by 3.2% and 7.5% year-on-year, respectively.
DVB shares – Quite resilient
Although bank shares fell under pressure throughout 2012, DVB’s share price proved to be satisfactorily robust under the described market conditions, exhibiting remarkable stability compared to other market participants. Over the course of 2012, the volatility of DVB shares was moderate on subdued trading. The highest price for the year of €25.50 was touched on 10 April 2012. The lowest price of €22.05 was recorded on 2 July 2012. The year-end share price was €24.26. Accordingly, the Bank’s market capitalisation was €1.1 billion at the end of 2012. The comparatively stable share performance is attributable to the continued stability of the Bank’s business development, and also to the narrow market in which the shares trade, due to the low free float.
Following a brief uptrend at the beginning of the year, European equity markets suffered massive losses during the first months of 2012. A gloomy global eco-nomic outlook and revived fears about the continued existence of the euro zone influenced investor behaviour and equity market levels. At times, the German blue-chip DAX index fell below 6,000 index points, stabilising around 6,500 points at the mid-year point.
Equity markets – Price losses followed by a rally
The DAX was only able to shake off the paralysing uncertainty that prevailed early in the year when concerns about the continued existence of European Monetary Union declined palpably during the second half. This calming was triggered by public statements from heads of government or state, who declared their firm commitment to the euro’s durability and the preservation of the single currency zone. Moreover, the ECB underscored its com-mitment by agreeing to the unlimited purchase of government bonds issued by distressed euro zone member countries, albeit subject to strict conditions. Toward the end of the year, investors in German blue chips and on other European exchanges received further encouragement, thanks to a prospective renewed bond purchase programme by the US Federal Reserve, and from a Greek bond repurchasing operation. Investor interest slowed down toward the end of the year, due to renewed uncertainty caused by the US budget dispute (the so-called “fiscal cliff”).
Against this background, the DAX closed the year 2012 at 7,612 points, up 29.1% (31 Dec 2011: 5,898 points). Other European and overseas equity markets also posted significant year-on-year gains.
• TheFTSE100(FinancialTimesStockExchange,London)wasup 5.9%, to 5,898 points.
• TheCAC40,theFrenchbenchmarkindexfortheParisianstock exchange, rose 15.4% to 3,641 points.
• TheFTSEMIBindex(FinancialTimesStockExchange,MilanoItalia Borsa) gained 7.8% and closed at 16,273 points.
The shares of DVB Bank SE (WKN: 804550, ISIN: DE0008045501) are listed in on the Frankfurt Stock Exchange in the General Standard. Since the capital increase conducted in 2008, the share capital pursuant to the Memorandum and Articles of Association amounted to €118,791,945.12 and is divided into 46,467,370 notional no-par value shares.

37
DVB Bank SE | Group Annual Report 2012
T HE C OMPA N Y F IN A NC I A L A ND Eq U I T y M A R K E T S GROUP M A N AGE MEN T RE P OR T C ONSOL IDAT E D F IN A NCI A L S TAT E MEN T S
Equity markets and the DVB share
Shareholder structure remained unchanged
The shareholder structure was unchanged in the 2012 business year. Dz BANK AG remains DVB’s majority shareholder. Its stake did not change in 2012 and remained constant at 95.45% at the end of the year. The remaining 4.55% of shares are held in free float.
Shareholders were paid a dividend of €0.60 per notional no-par value share from DVB Bank SE’s net retained profit for 2011. The Supervisory and Management Boards will propose to the Annual General Meeting on 13 June 2013 that the dividend payment remains unchanged, at €0.60 per notional no-par value share for the 2012 business year.
DVB share data (€)
2012
2011
2010
2009
2008
Business year high 25.50 26.10 27.50 28.00 28.60
Business year low 22.05 23.50 24.50 21.00 20.00
Year-end price 24.26 23.95 25.00 25.00 26.10
Number of shares outstanding at year-end 46,467,370 46,467,370 46,467,370 46,467,370 46,467,370
Market capitalisation at year-end 1,127,298,396 1,112,893,512 1,161,684,250 1,161,684,250 1,212,798,357
Dividends 0.60 0.60 0.60 0.60 0.60
Dividend yield 2.47% 2.51% 2.40% 2.40% 2.30%
Pay-out ratio 22.0% 26.0% 26.5% 37.4% 26.6%
Basic earnings per share 2.75 2.32 2.28 1.61 2.44
DVB share´s last price: €24.26 Dow Jones EURO STOXX Bank Index, last price: 111.77 points Source: Bloomberg
Share performance 2003–2012 Dow Jones EURO STOXX Bank Index DVB share price performance (points) (€)
525
450
375
300
225
150
75
0
2003 2004 2005 2006 2007 2008 2009 2010 2011 2012
35
30
25
20
15
10
5
0

38
DVB Bank SE | Group Annual Report 2012
Equity markets and the DVB share
Shareholders and the General Meeting
On 13 June 2012, DVB Bank SE held its 25th Annual General Meeting since 1988 at company headquarters in Frankfurt/Main. The agenda was published on time in the German Federal Gazette, on 4 May 2012, and on our website, and distributed in a media bundle throughout Europe as required.
Item 1 on the agenda was the acceptance of the financial state-ments confirmed by the Supervisory Board and the approved consolidated financial statements. Agenda items 2 to 5 contained resolutions proposed by the Board of Managing Directors and/or the Supervisory Board:
• ontheappropriationofnetretainedprofitforthe2011 business year;
• ontheformalapprovalofthemembersoftheBoardof Managing Directors and the Supervisory Board for the 2011 financial year; and
• ontheappointmentoftheexternalauditorsforthe2012business year.
In the general debate, shareholders and shareholder repre-sentatives asked numerous in-depth questions about agenda items and specific topics relating to the situation on the transport markets and the Bank’s business development.
Given that Dz BANK currently has a 95.44% stake in the Bank’s share capital, voting results and attendance have been stable for many years now. In the final vote, 96.69% of the shares entitled to vote were represented. Shareholders and shareholder representatives approved the individual resolution proposals with a clear majority of 99.9%. It should be noted in particular that our shareholders voted in favour of the dividend distribution of €0.60 per notional no-par value share that has remained unchained since 2008, confirming the stable dividend policy of the Board of Managing Directors and Supervisory Board.
In-depth information is available at our website: www.dvbbank.com > Investor Relations > General Meeting.

39
DVB Bank SE | Group Annual Report 2012
T HE C OMPA N Y F IN A NC I A L A ND Eq U I T y M A R K E T S GROUP M A N AGE MEN T RE P OR T C ONSOL IDAT E D F IN A NCI A L S TAT E MEN T S
Financial calendar 2013
7 March Annual Accounts Press and Analysts’ Conference Publication of the single-entity Annual Report 2012
on our website 28 March Publication of the Group Annual Report 2012
on our website By 15 May Publication of the Interim Management Statement
during the first half of 2013 (for the first three months, ending on 31 March 2013)
13 June Annual General Meeting
Frankfurt/Main
14 June Dividend payment
(German Securities ID 804550) By 14 August Publication of the
Half-Yearly Financial Report 2013 By 14 November Publication of the Interim Management Statement
during the second half of 2013 (for the first nine months, ending on 30 September 2013)
6 December Publication of the
Declaration of Compliance for 2013/2014

Anhang40
DVB Bank SE | Group Annual Report 2012
Group management report
41 Strategy and structure
44 Shipping Finance
60 Aviation Finance
78 Land Transport Finance
94 Important deals 2012
96 Financial Institutions
101 Investment Management
108 ITF International Transport Finance Suisse AG
110 Financial position and performance
125 Remuneration report
129 Non-financial performance indicators
131 Report on material events after the reporting date
132 Report on opportunities and risks
155 Report on expected developments for 2013
158 Explanatory disclosures under takeover law
159 Report of the Board of Managing Directors
on relations with affiliated companies
€ mn350
300
250
200
150
100
50
0
310.8
193.2
105.5
28.6
2008
225.2
194.3
97.8
7.3
2009
277.1
193.0
124.4
5.9
2010
332.7
258.3
116.2
17.3
2011
341.2
230.0
130.7
42.7
2012
Net interest income Net fee and commission income Net other operating income Total income
Earnings development 2008 – 2012

41
DVB Bank SE | Group Annual Report 2012
T HE C OMPA N Y F IN A NCI A L A ND EqUI T Y M A RK E T S GROUP M A N AGE M E N T R E P OR T C ONSOL IDAT E D F IN A NCI A L S TAT E MEN T S
Strategy and structure
DVB’s mission statement captures both the Bank’s real accomplishments and its vision of the future: “We are the leading specialist in international transport finance.” DVB’s business model is characterised by a clearly defined focus, a unique specialisation, and a cycle-neutral approach.
DVB enjoys a unique position, thanks to its strategic focus on the international transport market, with the submarkets of shipping, aviation, and land transport. As a highly-specialised niche pro-vider, the Bank offers its 624 clients and client groups from the international transport sector a broad range of customised financial services. We concentrate on arranging and providing structured financing solutions, on advisory services, and on investment activities for our clients. Notwithstanding the high cyclicality of the transport markets, the transport sector overall remains on a long-term growth path. Understanding this recurring cycle of sequential transport market phases, DVB has developed a cycle-neutral business model that once again offered a wide variety of business opportunities during 2012 – despite the challenging market environment.
Core products and services
DVB has continuously enhanced its core skills and areas of exper-tise over recent years. The Bank’s financial services can largely be allocated to six value-adding areas. Our Asset & Market Research prepares in-depth analyses of transport assets and markets. Leveraging this business intelligence in our Shipping Finance, Aviation Finance and Land Transport Finance divisions, we support our clients in the key product areas of Structured Asset Financing, Private Equity Sourcing and Investments, Asset Management, Advisory Services, Risk Distribution, and Loan Participations.
Structured Asset Financing
Drawing on our Structured Asset Finance core service, our three Transport Finance divisions offer financing solutions relating to transport assets. In addition to traditional asset finance, we offer our clients tailor-made structured and tax-optimised solutions for complex financing projects, often covering multiple jurisdictions.
Private Equity Sourcing and Investments
Thanks to the extensive analytic output provided by our Asset & Market Research unit, and the resultant expertise regarding transport markets, we are an ideal partner for clients requiring equity capital and investors seeking suitable investment projects in the relevant sectors. Our Investment Management division comprises two teams: Shipping & Intermodal Investment Manage-ment (SIIM) and Aviation Investment Management (AIM). SIIM comprises NFC Shipping Funds, Cruise/Ferry Investment Funds, Intermodal Equipment Funds (container boxes among others), and the Stephenson Capital Fund (rolling stock for rail transport). AIM manages the Deucalion Aviation Funds, which comprise a portfolio of several closed-end funds investing in aircraft and aircraft engines.
Asset Management
In 2012, we once again demonstrated that, in addition to being a financing and advisory specialist, we provide our clients with services that focus closely on the specific assets. Thus, we offer far more than the traditional range of banking services. Our asset-focused services – “close to the metal” – are available to operators and investors, but also to our competitors. Based in London, DVB’s Aviation Asset Management provides our aviation clients with a broad spectrum of services ranging from lease management, lease advisory, technical management and analysis, to remarketing.
Advisory Services
DVB’s involvement in improving the value creation chain linking the various assets in the global transport market is not restricted to providing finance, but includes advisory services as well. These advisory services are available to existing clients in Shipping Finance, Aviation Finance and Land Transport Finance, as well as to other interested parties – covering consultancy related to corporate acquisitions and divestments, strategic decision-making on finance and capital structure, refinancing, and the funding of acquisitions.
The DVB Group is referred to in this report either as “DVB” or the “DVB Group”, whereas the parent European public limited-liability company is referred to by its registered name “DVB Bank SE”.

42
DVB Bank SE | Group Annual Report 2012
Additional special products
Our customer-specific services for aircraft engines, provided by Cardiff-based TES Aviation Group, bring us even closer “to the metal”. DVB’s New York-based subsidiary DVB Capital Markets LLC, which holds a broker-dealer licence, offers the product Pub-lic Debt and Equity to the transport sector; in particular, it pro-vides our Shipping Finance clients with financial advisory ser-vices and supports them in raising capital in the US capital mar-kets via underwritings, public offerings and private placements of equity, debt and equity-linked securities.
DVB’s competitive strengths
Despite the difficult market environment in the wake of the sov-ereign debt crisis, DVB maintained its unique focus on selected transport markets, and its organisational structure in 2012. We strive to further expand our competitive position, through a con-tinued efficiency enhancement of our products and services. We will take further steps to enhance our unique brand profile in terms of asset know-how and special asset services.
Risk Distribution
We usually employ our own capital when financing the assets of our Transport Finance clients. Notwithstanding this commitment, we syndicate portions of this lending volume – which can be substantial – to other financial institutions on the international banking market. Both for DVB and its clients, this placement of credit risks is important to ensure sufficient liquidity and adequate risk transfer.
Loan Participations
Our wholly-owned, zurich-based subsidiary ITF International Transport Finance Suisse AG was established in 2007. ITF Suisse actively participates in the international interbank market for senior asset-based lending, in the Group’s strategic target seg-ments of Shipping Finance, Aviation Finance, and Land Transport Finance.
Asset & Market Research
Our Asset & Market Research provides the basis for the activities of our business divisions, leveraging our long-standing research know-how to provide financing products and advisory services, as well as optimising the raising of equity finance.
Strategy and structure
Shipping Finance Business areas Container Business Cruise & Ferry Crude Oil & LNG Tanker Chemical, LPG & Product Tanker Dry Bulk
Offshore Drilling & Production Offshore Support
Products and services Structured Asset Financing Risk Distribution Advisory Services Public Debt and Equity
Aviation Finance Business areas Passenger aircraft Freighter aircraft Aircraft engines
Products and services Structured Asset Financing Risk Distribution Advisory Services Aviation Asset Management
Aero Engine Financing and Engine Asset Management
Land Transport Finance
Business areas Rail rolling stock Mobile road & logistics equipment
Products and services Structured Asset Financing Risk Distribution Advisory Services
Investment Management
Business areas Fund management: Shipping & Inter modal Invest ment Management Aviation Investment Management
Products and services Private Equity Sourcing and Investments
ITF Suisse
Business areas Interbank market
Products and services Loan Participations (senior asset-based lending)
Asset & Market Research
DVB’s business divisons and products

43
DVB Bank SE | Group Annual Report 2012
T HE C OMPA N Y F IN A NCI A L A ND EqUI T Y M A RK E T S GROUP M A N AGE M E N T R E P OR T C ONSOL IDAT E D F IN A NCI A L S TAT E MEN T S
Our competitive strengths clearly set us apart from other market participants. It is this competitive edge that allows us to successfully deal with the challenges of cyclical markets, and to act in the best interests of our discerning clients. Specifically, our competitive strengths can be summarised as follows:
• DVB features a very clearly defined and cycle-neutral business model that offers a wide variety of business opportunities. We are acting on a global platform.
• DVBiscommittedtoaconservativebusinesspolicyandtolong-term sustainability – much to our clients’ benefit.
• DVBoffersafocusedrangeofproductsandservices–including complementary products that go beyond the typical scope of banking.
• DVB operates with a flat hierarchy supported by a manageable business size, which in turn facilitates transparency as well as quick information flows and swift decision-making.
• DVBworksonthebasisofarenowned,award-winningandsophisticated Asset & Market Research. This enables us to be a professional partner to the transport industry.
• DVB holds a credit portfolio that is diversified by multiple criteria and categories including asset types, vintage, manu-facturers, regions, borrowers, users and in terms of the assets’ employment.
• DVBtendersabalancedriskprofileandaforward-thinking,consistent approach in risk management.
Global presence and legal structure
With offices in twelve locations – Frankfurt/Main, Athens, Bergen, Hamburg, London, Oslo, Rotterdam and zurich (Europe), New York and Curaçao (North and South America), as well as in Singapore and Tokyo (Asia) – our business divisions Shipping Finance, Aviation Finance, Land Transport Finance, Investment Management and ITF Suisse have a worldwide presence in the transport markets and their various segments. This global pres-ence at key transport locations enables us to take into account the international dimension as well as the local specifics of the markets in which our clients operate.
The following overview illustrates the legal structure of the DVB Group, including the parent company DVB Bank SE, with its registered office in Frankfurt/Main, the Group’s material, fully-consolidated subsidiaries (highlighted yellow), and its branches and representative offices (highlighted blue).
Strategy and structure
Subsidiaries of DVB (each 100%)
DVB Holding (US) Inc., New York, USA
DVB Capital Markets LLC, New York, USA
DVB Transport (US) LLC, New York, USA
DVB Bank America N.V., Willemstad, Curaçao
DVB Group Merchant Bank (Asia) Ltd, Singapore
DVB Transport Finance Ltd, London, United Kingdom
DVB Transport Finance Ltd, Tokyo Branch, Tokyo, Japan
ITF International Transport Finance Suisse AG, zurich, Switzerland
DVB Holding GmbH, Frankfurt/Main, Germany
DVB LogPay GmbH, Eschborn, Germany
Branches and representative offices of DVB
DVB Bank SE, Rotterdam Branch, The Netherlands
DVB Bank SE, London Branch, United Kingdom
DVB Bank SE, Nordic Branch, Bergen/Oslo, Norway
DVB Bank SE, Shipping Department, Hamburg, Germany
DVB Bank SE, Representative Office Greece, Athens, Greece
DVB’s legal structure

44
DVB Bank SE | Group Annual Report 2012
Shipping Finance
Dry bulk carriers
Many market players had wished for a very different 2012. Unfortunately, it was similar to that of the past few years, with 2012 being the fifth consecutive year wherein record-breaking newbuild deliveries entered the market. With economic uncer-tainty in the US, recession in Europe and slowdown in India and China, positive news was limited. Preliminary figures indicated that dry bulk demand grew at the slower pace of 4.1% to reach 3.6 billion tonnes in 2012, compared to the 5.4% growth rate of 2011.
Coal was the major driver of dry bulk demand with a 7% increase to an estimated total seaborne trade of 1.1 billion tonnes in 2012. Iron ore trade is projected to have grown by 4.9% largely on account of the restocking seen in China during the last quarter of 2012. According to preliminary data, the global grain trade dropped by 4.3% during the year marking a change of trend from 2011 when it increased by 7.4%. This reduction was mainly a result of extremely dry weather in the US, countries of the former Soviet Union and Brazil, leading to a huge increase in prices of most agricultural commodities.
The dry bulk fleet stood at 9,744 vessels of 662.6 million dead weight tonnes (dwt) with an average age of 10.9 years. Only 1,377 vessels, equating to 43.8 million dwt, were over 25 years of age. This represents about 6.6% of the current fleet. On the other hand, the order book stands at 1,490 vessels of 117.1 million dwt amounting to 17.7% of the current fleet. Contracting activity in 2012 resulted in new orders for 305 vessels aggregating 21.1 million dwt. This was the lowest level of contracting seen during the last ten years and resulted in a decline of the ratio of the order book to the current fleet. This does not give much comfort however: the decrease follows several years of record-breaking contracting and newbuild deliveries. In 2012, some 1,229 vessels aggregating 101.2 million dwt were delivered – the first time in the history of dry bulk shipping that more than 100 million dwt were delivered in a single year.
Against the backdrop of prevailing high oversupply and of low freight and time charter rates especially in three important segments of the maritime shipping industry (container ships, crude oil tankers and dry bulk carriers), we have once again been able to support our clients with selected new transactions. Our unique sector coverage, in-depth market expertise, and engrained risk management helped to maintain a solid financial performance in 2012.
Shipping Finance – Market review
Although trade volumes are expected to increase in 2013, massive oversupply existed in most sectors during 2012. With low freight rates as well as low time charter rates, scrapping reached record levels. Nevertheless, there have been too many vessels in the current fleet and new tonnage has still been contracted. As yard forward cover decreases, there will be every incentive for shipyards to entice owners with lower prices: everyone in this industry has a different view on the market and their own strategy with which to implement it. A review of the historical development of inactive vessels shows that the number of vessels in lay-up increased in 2012 (with dry bulk vessels leading all other sectors). This trend should result in additional vessels being scrapped. In addition, further scrapping could be predicated on higher oil prices and new regulations such as Energy Efficient Design Index (EEDI) moving the industry towards more energy-efficient vessels. This will have an impact on when such efficient vessels enter the fleet in numbers. The tremendous growth of the Chinese fleet has not helped the shipping environment. China’s increasing demand for commodities, the building of ships and the expansion of its own fleet are trends that suggest future spot activity in the major shipping sectors will likely pivot on the actions of the Chinese. The shipping sectors performing well in 2012 included offshore support, offshore drilling, Liquefied Natural Gas (LNG) carriers and car carriers. Prospects are prom-ising for certain subsectors of Liquefied Petroleum Gas (LPG) vessels and chemical carriers.

45
DVB Bank SE | Group Annual Report 2012
T HE C OMPA N Y F IN A NCI A L A ND EqUI T Y M A RK E T S GROUP M A N AGE M E N T R E P OR T C ONSOL IDAT E D F IN A NCI A L S TAT E MEN T S
Shipping Finance
Scrapping increased yet again in 2012. While being a positive indicator, the number of newbuild deliveries overshadowed it by a wide margin. Some 518 vessels aggregating 31.9 million dwt were sent to the breakers. This is less than one third of the dwt capacity added to the fleet during the year. Scrapping levels need to exceed the newbuild deliveries just to start counteracting the massive deliveries seen in the recent past. Unless there are sustained levels of unprecedented scrapping and no new contracting, the dry bulk market will continue to remain in its current dire straits.
Container ships
Gloomy economic conditions in the European countries and a slowdown of the Chinese economy curtailed the container trade growth. In order to restore profitability, liner operators managed their capacity through super-slow steaming, cascading, and postponing their newbuild delivery schedule. This paid dividends as line operators successfully achieved general rate increases during the first half of 2012. Freight rates started to recover, and remained at relatively healthy levels. However without support from trade growth volume, freight rates began falling in June. This resulted in the Shanghai Containerised Freight Index ending
22.3% lower at the end of 2012 from the May peak of 1,450 points. Based on preliminary data, global container trade growth slowed to 5%–6% growth as compared to the 7% year-on-year growth seen in 2011.
At year-end 2012, the container vessel fleet stood at 5,108 vessels, aggregating 16.2 million Twenty-foot Equivalent Units (TEU), with an average age of 10.7 years. Overcapacity is still the biggest threat to the container vessel sector. The current order book stands at 476 vessels of 3.4 million TEU, representing 21% of fleet capacity and is concentrated in the Very Large Container Ships and Super Post Panamax subsectors; which together account for 72.6% of the order book. A total of 178 vessels aggregating to 332,000 TEU were scrapped in 2012. This equates to only 2% of the current fleet. The growing idle tonnage restricted active fleet growth. With the winter season service withdrawals, the inactive fleet ended 2012 at 242 vessels of 462,000 TEU, equating to 2.9% of the fleet in TEU terms. While an increase in idle tonnage keeps the active fleet capacity in check, it is temporary in nature – as evidenced by the peak lay-up of 12.5% of fleet capacity in January 2010 and the current inactive capacity, which stands at just 2.9%.
1,400
1,200
1,000
800
600
400
200
0
Jan 2010 Apr 2010 Jul 2010 Oct 2010 Jan 2011 Apr 2011 Jul 2011 Oct 2011 Jan 2012 Apr 2012 Jul 2012 Oct 2012 Dec 2012
Super Post Panamax Post Panamax Panamax Sub Panamax Handymax Feedermax Feeder Source: LMIU, DVB, January 2013
Container vessel idle capacity in 2010 – 2012
TEU (000’s)
Total (Dec 2012)242 vessels 462,371 TEU 2.9% of fleet

46
DVB Bank SE | Group Annual Report 2012
Shipping Finance
At the same time, the net increase in the crude tanker fleet was nearly 2% during 2012. Of the 211 vessels scheduled for delivery at the beginning of the year, actual deliveries in 2012 stood at around 150, resulting in slippage of 30%. Scrapping over the same period increased to 63 vessels; the highest level since 2003. However, newbuild contracting also gained momentum; inter-estingly, orders were placed by oil majors and national oil com-panies, rather than independent owners.
Sluggish demand and fleet oversupply led to a further decline in employment rates for all tanker sizes. Accordingly, earnings across all subsectors continued to deteriorate: one-year time charter rates for Very Large Crude Carriers (VLCC) declined another 15% over the year, while on the spot market the Baltic Dirty Tanker Index Time Charter Equivalent annual average of the two most characteristic VLCC routes (Middle East to US Gulf of Mexico and Middle East to Japan) was US$94/day. As with earnings, asset values declined further in 2012, with five-year-old VLCCs losing an additional 12% in value and five-year-old Aframaxes about 23%.
Crude oil tankers
The macroeconomic uncertainties in the US, the euro zone sovereign debt crisis and the slowdown of developing economies, most notably China and India, led to subdued world oil demand growth in 2012. As per the International Energy Agency, oil demand for 2012 is estimated to have averaged 89.9 million barrels/day; approximately 1% higher than that of 2011. Demand growth stemmed primarily from countries that were not members of the Organisation for Economic Co-operation and Development (OECD), while amongst OECD members, oil demand contracted by 1%.
The map of seaborne crude oil trade flows was redrawn to some extent in 2012. The US increased domestic production by nearly one million barrels per day. New or upgraded pipelines were used to export greater amounts of crude oil. However, some oil producers exported considerably less of their production either due to sanctions or increased domestic demand. All in all, global seaborne oil exports, based on preliminary data, declined margin-ally in 2012 as compared to 2011.
180
150
120
90
60
30
0
q1 q2 q3 q4
2006
q1 q2 q3 q4
2007
q1 q2 q3 q4
2008
q1 q2 q3 q4
2009
q1 q2 q3 q4
2010
q1 q2 q3 q4
2011
q1 q2 q3 q4
2012
Very Large Crude Carriers (310,000 dwt, five years old) Suezmax (160,000 dwt, five years old) Aframax (105,000 dwt, five years old) Source: Clarkson Research Services Ltd, January 2013
Five-year-old crude tanker resale values
US$ mn
118 120
7682
64 66.5
130
95
68.5
145
96
70
163
105
79
93
65
50
79
56
39
93
65
47
83
57
40
584735
65
47
32
57
4027.5

47
DVB Bank SE | Group Annual Report 2012
T HE C OMPA N Y F IN A NCI A L A ND EqUI T Y M A RK E T S GROUP M A N AGE M E N T R E P OR T C ONSOL IDAT E D F IN A NCI A L S TAT E MEN T S
Shipping Finance
Offshore vessels
Exploration and Production (E&P) spending for crude oil increased again in 2012 confirming the recovery trend initiated in 2010. Oil prices remained high, as in 2011, with an average price of US$110/barrel for Brent crude. Growth in demand for oil as well as geopolitical events continued to put upward pressure on prices. This tightened the drilling market even further, and while demand kept growing, the number of new rig deliveries was low, due to the limited contracting in 2009 and 2010. Jack-ups, drillships and semi-submersible vessels all benefited from higher utilisation in 2012 as compared to 2011. This resulted in higher day rates for drillships and semi-submersible vessels, while day rates for jack-ups remained rather flat as demand growth was met by the reactivation of existing units. State-of-the-art units benefited more from the improving environment than the older and less sophisticated units. Demand for offshore support vessels continued to increase in 2012, leading to improved utilisation as a whole for Anchor Handling Tug and Supply (AHTS) vessels and Platform Supply Vessels (PSV). As a consequence, day rates for both asset types rose in West Africa, Brazil and south-east Asia. The North Sea market proved to be disappointing as day rates remained flat and even decreased for the larger PSVs with the market being affected by oversupply. Only the larger AHTS vessels benefited from a strong rate increase in this region thanks to limited deliveries. Investments in offshore vessels maintained the high levels seen in 2011, with over US$40 billion invested in new contracts. While ordering activity declined for offshore drilling rigs and AHTS vessels, it remained strong for PSVs, with a total of 160 units ordered in 2012.
Shipping Finance – Strategy
Our sectorised approach to Shipping Finance translates into a broad and profound coverage, enabling DVB to collect and amass in-depth knowledge of the assets, clients, value-chains, cargo flows and networks in the distinct sectors. This expert knowledge allows us to recognise and understand developments in particular sectors and the general market quicker than the competition, and to act proactively when required. This expertise is unique to our Shipping Finance team. More so, this approach and commitment bring us closer to our clients, solidifying our reputation as a trusted partner in the shipping industry.
Shipping Finance increased its lending volume in 2012, capitalis-ing on attractive opportunities arising from the retreat of many competitors. DVB aims to continue this path during 2013. Our approach, described below, was tested by the crisis: the results prove that it works.
Organisational set-up
The organisation is run on a few basic principles; namely, an intimate knowledge of the market, assets and clients, an ability to respond quickly to a changing market environment, as well as ownership and responsibility from top to bottom. These principles have shaped the organisation and the way the business is steered.
The Shipping Finance client coverage teams were reorganised during 2008, from a geographic client orientation to a sector-oriented focus, reflecting the shipping companies’ global operat-ing model. The shipping and offshore clients – and the industry – have thus been covered by distinct sector groups working in unison.

48
DVB Bank SE | Group Annual Report 2012
Shipping Finance also prides itself on the quality of its staff: great effort has been put into attracting, retaining and developing the best shipping finance professionals. These professionals are not only technically proficient, but also have a passion for the shipping industry. After having realigned resources, and strength-ened the division’s risk management infrastructure, our bench of shipping professionals is now remarkable in its breadth and depth of experience.
The combination of sectorisation, a flat organisational structure, quality staff, and award-winning research has enabled Shipping Finance to identify possible dangers, act quickly in response to the changing environment and drive innovation within the sector teams. This allows us to better serve our clients, gauge risks better, and to be entrepreneurial. Our commitment to shipping finance has made us successful in the past, and will drive us forward in the future. This contribution to the market also attracts appreciation among experts. In 2012 our Shipping Finance business division won three awards from renowned transport magazines: “Securitisation Deal of the Year 2011” and “Leasing (East) Deal of the Year 2011” (both Marine Money) as well as “Shipping Financier of the Year 2012” (Lloyd’s List).
The main benefits of this sector approach are:
• Increased client- and sector-specific knowledge – relationship managers are more in tune with the industry and know well their clients’ specific needs, the assets in each sector, and the networks and value-chains within these sectors. They have become sector experts, rather than shipping finance generalists.
• Research also covers the various sectors individually. Our market coverage and research result in clients enjoying the benefit of increased expertise, whilst at the same time sector market intelligence is fed back into the research department.
In addition to the sectors, the organisational structure of Shipping Finance is flat. There are no more than two layers between the client’s relationship manager and the responsible member of the Board of Managing Directors. This makes Shipping Finance nimble, and permits top management attention to address an issue directly when required.
Shipping Finance
Shipping Finance – Seven global sectors (as at 31 December 2012)
1 Container Business Group
(container vessels, container boxes, car carriers, reefers)
2 Cruise & Ferry Group
(ocean/river cruise, ferries, RoRo’s)
3 Crude Oil & LNG Tanker Group
(crude oil and LNG tankers)
4 Chemical, LPG & Product Tanker Group
(chemical, specialist, LPG, product and asphalt/bitumen tankers)
5 Dry Bulk Group
(barges, dry cargo, combination and bulk carriers)
6 Offshore Drilling & Production Group
(jack-ups, drill ships, semi-subs, FPSO, FSO, FPU)
7 Offshore Support Group
(AHTS, PSV, subsea, diving and heavy lift vessels, others)

49
DVB Bank SE | Group Annual Report 2012
T HE C OMPA N Y F IN A NCI A L A ND EqUI T Y M A RK E T S GROUP M A N AGE M E N T R E P OR T C ONSOL IDAT E D F IN A NCI A L S TAT E MEN T S
Approach to shipping finance
Our approach to shipping finance is guided on the following characteristics:
• Ourriskmanagementisingrainedintheprocess,fromclientacquisition to loan management. This approach ensures that the risks committed to are manageable and that loans are assessed impartially throughout the term.
• Our portfolio is well diversified across sectors and geographic regions.
• Ourempiricalandfundamentalresearchsupportsallaspectsof the decision-making process, from proposals to reviews. We know the assets, and analyse each financed vessel thor-oughly to ascertain its adequacy.
• Thevesselswefinancearetrackedfromtheshipyardtothescrapyard, in order to ascertain that quality, tradability and hence values are within adequate parameters.
DVB’s risk management platform plays a central role in pro-actively identifying possible problem areas and credits, in order to preclude small problems from turning into large ones and to stay ahead of the curve. This proactive approach is evidenced best by the stringent observation of quarterly stress testing procedures aimed at flushing out any possible upcoming issues in the portfolio. We have also increased the frequency of calling on clients, and have institutionalised the formal reporting of these calls.
Additionally, our specialised Restructuring Asset Management (RAM), established in 2009, has become a dedicated resource in supporting the sector teams’ efforts of restructuring problem loans. This capability was further strengthened in 2012 when the Board of Managing Directors decided to create the Strategic Management and Restructuring Team (SMRT). This move aims at adding a valuable and unrivalled work-out competence to an already sophisticated risk management and restructuring platform. The existing RAM team and a selected number of key commercial managers form SMRT’s core. Upon becoming opera-tional on 1 January 2013, they will take on direct transactional responsibility for existing Special Credit and Watch List cases, and going forward, a wider scope of client and project responsi-bilities that is yet to be determined by the Board of Managing Directors. The close co-operation of all sector and support personnel is critical to the team’s success.
All of these measures have served to further ingrain risk manage-ment within the Bank’s main processes, by completely involving this and research throughout the life cycle of a loan (“cradle-to-grave concept”). This – combined with intimate knowledge of our clients and markets, engendered by sectorisation – has supported a solid financial performance during the last years, and the maintenance of a sound loan portfolio.
Shipping Finance

50
DVB Bank SE | Group Annual Report 2012
Shipping Finance
The finance professionals working within DVBCF are seasoned individuals with strong corporate finance backgrounds at bulge-bracket investment banks, who specialise in rendering tailor-made advice and providing creative solutions to the challenges and commercial opportunities of the Bank’s clients. They frequently work seamlessly with DVB’s relationship managers to identify and solve problems for their common clients, but the team can equally work in an independent advisory capacity to deliver significant added value and superior economic returns to their clients. DVBCF operates via DVB’s New York, London, and Oslo offices. In the United States, DVBCF acts through DVB Capital Markets LLC, a broker/dealer registered with the Securities and Exchange Commission and regulated by the Financial Industry Regulatory Authority. In Europe, DVBCF acts through DVB Bank SE (London Branch), which is regulated by the Financial Services Authority and through DVB Bank SE (Oslo Branch), which is reg-ulated by Finanstilsynet.
Public Debt and Equity
In 2012, interest rates remained near historically low levels while the attractive covenants, favourable terms and conditions, and bullet amortisations often available through bond finance continued to draw many companies to the public markets for high-yield debt. Within the shipping and maritime space, there was noticeable activity in the US while issuance was particularly strong in the Nordic markets, where energy-related offshore companies were active on the back of strong industry funda-mentals and high demand.
Additionally, larger companies seeking fresh equity to fund acquisitions, strengthen their balance sheets, and, in certain cases, provide incremental liquidity for future investments, accessed the public equity markets – which were receptive to select issuers and specific corporate situations throughout the year. Private equity funds continued to explore avenues to invest in shipping to capitalise on historically low asset values, but their strategic and financial objectives typically focused on companies and opportunities with stable cash flow and longer-term contract coverage.
Throughout the year, DVBCF worked closely with DVB’s relation-ship managers and industry divisions to support strategic client dialogue, help identify new and diverse sources of funds in the capital markets, and access those markets on advantageous terms.
Shipping Finance – Products
During 2012, Shipping Finance continued to serve its clients with products tailored to meet their specific business needs. The following range of products and services are offered:
• StructuredAssetFinancing• AdvisoryServices• PublicDebtandEquity–CapitalMarketsand
Private Placements
Asset & Market Research forms the basis of our unique Shipping Finance business model.
Structured Asset Financing
Structured Asset Financing comprises all lending activities of Shipping Finance. As principal activity, key product and chief revenue driver, the lending business encompasses mainly senior secured and second lien structures. The main focus of our lending activities is to customise each financing to the specific needs and circumstances of the client, whilst ensuring that risk and profit-ability are adequately addressed. Our sector teams market the lending product globally through offices in Europe (Athens, Bergen, Hamburg, London, Oslo and Rotterdam), in Asia (Singapore and Tokyo), and in North and South America (New York and Curaçao).
Advisory Services
DVB Corporate Finance (DVBCF) provides advisory, mergers and acquisitions (M&A), corporate finance, and capital markets services to DVB’s clients in the global transportation industry. At any particular stage in the life-cycle of a company, and through-out strong and weak industrial and financial markets, companies frequently seek and benefit from our professional advice regard-ing the optimal strategy to pursue and achieve their financial and corporate objectives. Whether a client requires discreet assistance to value and sell a company or subsidiary business, confirmation that a transaction has been fairly structured and executed through the provision of a fairness opinion, innovative support to restructure or optimise a balance sheet, or third-party insight regarding the development or diversification of its business, DVBCF is well-qualified to provide critical guidance and support on a timely and responsive basis.

51
DVB Bank SE | Group Annual Report 2012
T HE C OMPA N Y F IN A NCI A L A ND EqUI T Y M A RK E T S GROUP M A N AGE M E N T R E P OR T C ONSOL IDAT E D F IN A NCI A L S TAT E MEN T S
Shipping Finance
Shipping Research
The focus of Shipping Research (SR) is on the discovery, creation and dissemination of knowledge surrounding the assets DVB finances, its shipping markets/sectors and trade flows in distinct sectors. In addition to this research function, SR is also respon-sible for the strategic planning, technical supervision/review of the assets financed and under consideration, as well as for the commercial assessment of critical shipping contracts such as those for shipbuilding, contracts of affreightment, and other employment contracts when so instructed by the Credit Com-mittee.
The team covers 15 main sectors and 66 subsectors within the shipping and offshore markets, providing analysis via newsletters and research papers on the sectors and subsectors. Additionally, semi-annually SR produces a strategic outlook for the Board of Managing Directors and relationship managers in the form of a strategic plan. The team is completely woven into the Shipping Finance loan life cycle and provides essential market, sector, asset and technical expertise for each credit decision.
SR is composed of twelve professionals with various back-grounds in the shipping industry and with hands-on experience in commercial management, sales and purchase, chartering and technical operations of vessels. Last but not least, the team possesses a background in economics and finance. Moreover, SR has its own Technical Committee, consisting of master mariners and chief engineers reporting directly to the head of SR.
Shipping Finance – Portfolio analysis
The business division performed well: it was able to not only achieve solid revenues and a stable loan production year-on-year, but also (just as importantly) managed to control losses and maintain a prudent risk posture.
Structured Asset Financing – Loan portfolio and income
The currently constrained activity of larger traditional shipping lenders presented good opportunities for Shipping Finance in 2012 to fill the void and win attractive risk-reward transactions with customers that were previously out of reach, in terms of pricing. Our business model brought about better insight and coverage of the market, due to our dedicated and sector-focused expertise. At the same time we were still able to continue com-mitting capital selectively to the most attractive business opportunities. This combination created an effective and profit-able proposition in 2012, and allowed Shipping Finance to choose the deals offering the best risk-reward profile. Consequently, new customer lending (loans and advances inclusive of guarantees and indemnities) totalled €2.5 billion over 96 new facilities in 2012, compared to a new business volume of €2.5 billion over 93 facilities in 2011.

52
DVB Bank SE | Group Annual Report 2012
Shipping Finance
We concluded our new transactions with established and new clients. Some of the 2012 transaction highlights were:
• ThemergeranddebtrestructuringofEpicShippingHoldingsLtd and Pantheon Inc. for which DVB acted as a mandated advisor. Jefferies Funds was brought in as new external shareholder, with DVB as arranger to refinance US$150 million of senior debt. DVB acted on all fronts and provided true additional value for the client.
• ThefacilityforChile’sCompañíaSudAmericanadeVapores(CSAV), which finances two new state-of-the-art super-post panamax vessels geared for the growing Latin America trade. It marks DVB’s inaugural lead arranging transaction as ECA agent with Korean export credit agency K-Sure, who provided 90% ECA cover for the debt. CSAV needs these vessels in 2013 to readjust its fleet composition from a global approach towards a more regional one. Prior to the vessels’ deployment in CSAV’s own trade, the vessels were employed on a one-year time charter to Maersk, which further enhances the project.
• Atrueclubdealwithsixotherbanks(Citi,BankofAmerica,Nordea, ING, SEB and BNP Paribas), in which DVB took an equal share of up to US$100 million as Joint Mandated Lead Arranger and Bookrunner. This gave Sovcomflot, the largest Russian shipping company, a commitment of US$700 million to refinance. The loan facility is secured by 34 tankers owned by Sovcomflot’s 100% subsidiary Fiona Trust and Holding Corporation, a Liberia-registered company with 96 vessels.
Net interest income was up 3.3, to €94.4 million (previous year: €91.4 million), as a result of attractive new business based on risk-adequate interest margins (2012: 349 basis points; 2011: 304 basis points). Due to the prevailing difficult market conditions in some segments of the maritime shipping industry, allowance for credit losses was recognised in an amount of €67.1 million, an increase of 90.6%. Total allowance for credit losses in Shipping Finance was €92.2 million in 2012, compared to €79.3 million at the end of 2011. This level of provisioning provides a necessary cushion for potential losses. Shipping Finance thus remains in control of its loan book, and the portfolio is adequately provi-sioned for. Due to the high provisioning though, income and net segment income before taxes both declined by 27.1% and 37.6%, respectively.
Extract from Shipping Finance’s segment report
€ mn 2012 2011 %
Net interest income 94.4 91.4 3.3
Allowance for credit losses –67.1 –35.2 90.6
Net interest income after
allowance for credit losses 27.3 56.2 –51.4
Net fee and
commission income 62.4 61.4 1.6
Income
(excluding the IAS 39 result) 85.8 117.7 –27.1
General
administrative expenses1) –37.7 –40.4 –6.7
Net segment income
before taxes 50.7 81.2 –37.6
1) Only those costs are allocated to DVB’s operating business divisions for which they are directly responsible. General costs of operations, overheads or, for example, IT costs, are not allocated to the operating business divisions.

53
DVB Bank SE | Group Annual Report 2012
T HE C OMPA N Y F IN A NCI A L A ND EqUI T Y M A RK E T S GROUP M A N AGE M E N T R E P OR T C ONSOL IDAT E D F IN A NCI A L S TAT E MEN T S
Shipping Finance
In 2012 the Shipping Finance customer lending volume increased again, leading to a 5.3% growth in the loan book to €11.9 billion (previous year: €11.3 billion). In US dollar terms the loan portfolio grew by 7.5%, to US$15.7 billion (previous year: US$14.6 billion). The strong loan production numbers were countered by high pre- and repayments of about 27%. Diversification and granularity in the portfolio are key pillars of Shipping Finance’s risk manage-ment philosophy: the Shipping Finance portfolio thus remained well diversified across the shipping spectrum, in terms of sector/subsector, asset, geographic exposure, client concentration and types of financing. Additionally, based on Shipping Research’s input, the portfolio is managed away from perceived higher risk areas.
Looking at the financed vessel types, for instance, the overall Shipping Finance portfolio demonstrates its high degree of diversification. The tanker exposure, accounting for 32.2% of the overall portfolio, grew from €3.6 billion in 2011 to €3.8 billion in 2012 – mainly due to an increase in financed product tankers and gas tankers. At the same time, Shipping Finance decreased its exposure to crude oil tankers from 12.7% in 2011 to 11.9% in 2012. Offshore (support) vessels made up the second-largest port-folio share rising slightly to 21.2% (+0.2 percentage points). The bulk carrier exposure increased as well to 18.4% (+0.7 percent-age points). In view of the currently challenging market conditions, container carrier/container box exposures were reduced to 16.0% (–1.2 percentage points).
Tankers 32.2%
thereof:
11.9% Crude oil tankers
8.1% Product tankers
7.4% Chemical tankers
4.8% Gas tankers
Offshore 21.2%
thereof:
5.5% Anchor handlers
5.0% Platform supply vessels
3.3% Drillships
2.5% Rigs
4.9% Others
Bulk carriers 18.4%
Container carriers 9.8%
Container boxes 6.2%
Cruise ships 4.0%
Ferries/
passenger vessels 3.2%
F(P)SO 0.8%
Others 4.2%
thereof:
2.0% Car carriers
0.8% General cargo
0.7% Reefers
0.1% Roll-on/roll-off vessels
0.6% Miscellaneous
Shipping Finance portfolio by vessel type

54
DVB Bank SE | Group Annual Report 2012
Shipping Finance
The loan-to-value (LTV) ratio, one key metric of loan performance, developed as follows: 84.7% of the overall loan exposure had an LTV ratio equal to or lower than 60% at the end of 2012, compared to 86.5% at the end of 2011.
During 2012, the granularity of the Shipping Finance portfolio was good, with the average lending exposure per client standing at €36.3 million (an increase of 10.0% from €33.0 million in 2011). The largest individual client exposure stood at €217.7 million compared to €206.9 million in 2011. The number of clients where exposure exceeded €50 million totalled 79 at year-end 2012 versus 65 at year-end 2011.
Geographically, the portfolio is also well diversified, being mainly oriented towards Europe (47.1%). Of this European expo-sure, the exposure to German clients was further reduced to 3.6% (–0.3 percentage points), while the share of Norwegian exposures grew to 13.6% (+0.7 percentage points). Client expo-sure towards Australia/Asia increased by 1.7 percentage points, to 24.8%, whereas exposure in North and South America declined 0.1 percentage points to 18.9% and in the Middle East by 2.3 percentage points to 3.4%.
Another key pillar of DVB’s risk management approach is to quickly take action in response to any covenant breaches (value maintenance clauses – VMC) and otherwise). The vessel values are monitored diligently to establish impending VMC breaches quickly and to be able to take swift action. To further illustrate the point: during 2012 a total of 89 transactions had a VMC breach. Thereof, 36 transactions were repaired, 10 transactions were partly repaired, 21 transactions were waived and 22 transactions still have an outstanding VMC breach. The total funds required to repair the outstanding VMC breaches equals €60.4 million.
Europe 47.1%
thereof:
13.6% Norway
5.7% United Kingdom
3.6% Germany
3.0% Cyprus
2.3% Greece
1.6% Switzerland
0.9% The Netherlands
16.4% Others
Australia/Asia 24.8%
thereof:
7.6% South Korea
5.9% Singapore
3.7% China
3.1% India
1.5% Hong Kong
1.1% Japan
1.9% Others
North and
South America 20.0%
thereof:
17.1% USA
2.9% Others
Middle East 3.4%
Offshore 2.6%
Central America/
Carribbean 2.1%
Shipping Finance portfolio by country risk

55
DVB Bank SE | Group Annual Report 2012
T HE C OMPA N Y F IN A NCI A L A ND EqUI T Y M A RK E T S GROUP M A N AGE M E N T R E P OR T C ONSOL IDAT E D F IN A NCI A L S TAT E MEN T S
Shipping Finance
Structured Asset Financing – Deal of the Year 2012
In March 2012, Vega Offshore AS, an offshore supply vessel (OSV) company matching inexpensive Far East-built OSV tonnage with long-term time charter contracts in OSV markets internation-ally, mandated the Advisory Services team of Shipping Finance as exclusive financial advisor for the purpose of raising equity. The key challenge was the stretched timing: contract obligations towards Petrobras, a Brazilian corporation performing in several sectors of the oil, gas and energy industry, required swift access to equity so that vessels could be delivered, modified and trans-ferred from China to Brazil. Proposed structures varied, with different levels of compensation to the Vega founders.
Eventually Nautilus Marine Acquisition Corporation, a newly-organised blank check company formed for the purpose of acquiring or merging with an operating business, made the best offer. For Nautilus, the transaction represented a compelling story to its public investors due to the long-term contract cover and attractive earnings before taxes, interest, depreciation and amortisation multiple valuation. Nautilus was under time pressure though to complete the acquisition before initial public
offering proceeds would be returned to public investors upon expiry of its investment window in February 2013. So the main challenge of the deal was in bridging Vega’s almost immediate cash requirements with the required filing time needed to close the transaction. The solution: sourcing the needed equity as a bridge investment from a Greek private investor with a close relationship to the Nautilus backers.
Our Shipping Finance colleagues in Singapore helped early in the process, presenting an initial debt structure, with main comfort being in the long-term charter coverage at very cash-generative time charter contracts, the Vega founders’ previous experience from bringing vessels to Brazil, and the reputable ship manager Thome Offshore Management assuming technical management of the vessels. The full capitalisation of the project was therefore composed of a DVB senior debt facility and Advisory sourced equity. All in all, the transaction illustrated characteristics that are actively encouraged at DVB, namely: teamwork, in this case even cross-border between Singapore, Oslo and New York as well as creativity and perseverance to deliver and execute a complicated transaction in a short timeframe, whilst balancing the interests of the different parties involved.
Shipping Finance – Deal of the year 2012

56
DVB Bank SE | Group Annual Report 2012
Shipping Finance
• ShippingResearchisfullyinvolvedinthecreditprocess–and not only with market research. All technical aspects of the respective assets are also researched and commented upon, in order to flag any possible negative effects on the tradability and value of the assets financed.
• TheRAMteam,operatingasSMRTwithextendedrestruc-turing capabilities as at 1 January 2013, is fully involved in the stress testing of the portfolio and is dedicated to providing support, along with advising the sector teams on all stressed/distressed loans. RAM is also involved in all Watch List com-mittee discussions.
The above-mentioned protocols are geared towards flagging possible problems early, and allocating adequate resources to assess, quantify, qualify and formulate an appropriate and swift response.
RAM’s team of restructuring and work-out specialists reports directly to the Head of Credit, and the Chairman of the Board of Managing Directors. At the end of 2012, 6.4% of the loan port-folio was on the Closely Monitored List (2011: 9.4%). 7.0% of the portfolio was on the Watch List subject to close monitoring and a formal monthly review (2011: 6.8%). Moreover, 2.8% of the portfolio is being discussed by the early-warning Risk Manage-ment Forum and 3.2% of the portfolio was classified as special credits. All of this monitoring materially decreases the likelihood of unpleasant surprises.
DVB’s risk management infrastructure, combined with its unique sector coverage model and supported by Shipping Research’s market research and technical expertise, provides the Bank with exclusive positioning in the market, and is a source of lasting competitive advantage.
Structured Asset Financing – Risk management
Risk management is completely woven into the life cycle of all loans. It is not limited to simply conducting due diligence pre-closing: it is a platform for continuous vigilance, and monitoring of the overall portfolio health and loan management. The risk platform is in place and functioning well – however, increased volatility of the macro-environment coupled with increased clock speed in the shipping ecosystem has led our Group Risk Manage-ment (GRM), supported by Shipping Research, to implement measures that spot impending problems before they materialise. To this end, the following initiatives (driven by GRM) are now institutionalised:
• Higherfrequencyofclientcalling: Formalised and improved feedback from each client interaction
where the involvement of credit officers was mandatory, and elevation of the risk dialogue with clients through the use of a minimum requirement questionnaire.
• Increasedreporting: Monthly VMC and arrears overview; Closely Monitored List
frequency changed from quarterly to monthly.
• Stresstestingprocedure(stressingProbabilityofDefaultandvaluations) on a quarterly basis – the results form the basis for discussion between our relationship managers and their clients. They also feed into an Early Warning List.
• Continuousevent-drivenratingupdatesandreviewsoftheportfolio to refresh ratings and values.

57
DVB Bank SE | Group Annual Report 2012
T HE C OMPA N Y F IN A NCI A L A ND EqUI T Y M A RK E T S GROUP M A N AGE M E N T R E P OR T C ONSOL IDAT E D F IN A NCI A L S TAT E MEN T S
Shipping Finance
Shipping Finance – Outlook 2013 for the key shipping segments
The demand for maritime shipping is expected to increase during the course of 2013. The outlook for shipping companies in many of the major sectors will remain challenging given the current fleet capacity and the quantum of newbuildings delivering in 2013. We anticipate scrapping of vessels to continue at high levels which could be justified by high bunker fuel costs and new regulations moving the industry towards more energy-efficient vessels through the implementation of EEDI. Scrapping of vessels may limit fleet growth in 2013, and possibly set the stage for a better 2014 as demand growth continues.
Despite lower worldwide economic activity and developed nations consuming less oil, world oil demand continues to grow; albeit at a slower growth pace of one million barrels a day. This steadily growing demand and the stabilisation of oil prices at higher levels has been the driver for increasing oil and gas E&P spending. Offshore drilling and support assets will continue to benefit; although with ample shipyard capacity available for such units, the threat of oversupply remains ever present. In addition, escalating operating costs – notably due to a lack of qualified personnel and increasing local requirements/regulations – impact offshore owners’ profitability.
As a limited number of gas reliquefaction projects are scheduled to become operational in 2013, the demand for LNG carriers will not alter dramatically. Shale gas exports from the US will augment this trade, although the real impact of such exports will only be significant in subsequent years.
Besides LNG carriers, there are other shipping sectors we anticipate will have a better year in 2013 than they did in 2012. These include chemical tankers, LPG carriers and car carriers.
Offshore vessels
Offshore activity is expected to continue growing in 2013, although possibly at a slower pace than in 2012. The most active areas are likely to remain in the so-called Golden Triangle, formed by the US Gulf of Mexico, West Africa and Brazil, where fields are primarily located in deep and ultra-deep waters. Offshore activity prospects have however been revised downwards in Brazil from last year’s expectations, as Petrobras strives to reduce costs. Sustained offshore activity is also expected in the North Sea and Asia/Pacific. Demand for drilling units and offshore support vessels is thus forecast to continue growing, especially for the state-of-the-art units. More specifically, the semi-sub-mersible market is likely to remain tight as the order book appears manageable. Given its larger order book, the drillship fleet will experience significant growth in 2013 and 2014. Although a number of drilling programmes are under consideration, forward contract coverage is not yet in place for 2014. As a result, utili-sation rates could drop should these drilling programmes fail to materialise. Given the limited order book, state-of-the-art AHTS vessels are expected to benefit from increasing utilisation. However, the continued ordering of state-of-the-art PSVs places downward pressure on future utilisation levels.
Crude oil tankers
Market fundamentals are expected to weaken further in 2013 for the crude tanker market. Although oil demand is forecast to increase by 1% to 90.8 million barrels per day, the changes in trade flows we witnessed in 2012 will continue to be consoli-dated. US imports of oil will probably decrease further, while new refining capacity comes online in crude oil producing countries such as Iran, Russia, Saudi Arabia and the United Arab Emirates. The decline in global crude oil exports will further remove avail-able crude cargoes from the market. On the other hand, fleet oversupply will continue, driving fleet employment to its lowest since the late 1980s. Even if we account for a 30% slippage as

58
DVB Bank SE | Group Annual Report 2012
between producing and consuming regions. With the rapid expansion of projects in the Middle East and the export of excess US shale gas, the tonne-mile demand is forecast to improve, although we are likely to see some changes in traditional LNG seaborne trade routes. Nonetheless, the export volumes of shale gas from the US may be curbed due to domestic industries lobbying hard to limit exports in an attempt to maintain domestic natural gas prices at lower levels. Australia will also be a major player in this change, once its planned massive liquefaction plants become operational. However, fleet growth remains a threat as the order book stands at 26% of the existing fleet. This is likely to impact post-2013 fleet utilisation. While we maintain our optimism of this sector for the next two years, we advise caution post-2013, when a large number of vessels will join the LNG fleet.
Dry bulk carriers
As foreseen last year, 2012 became the fifth consecutive year of increasingly higher numbers of newbuild deliveries entering the market. Newbuild contracting resulted in a further 305 vessels, aggregating 21.1 million dwt, added to the order book. Some 1,136 vessels of 89.5 million dwt are scheduled for delivery in 2013. While lower than last two years, this equates to about 13% of the current fleet. With demand for dry bulk commodities expected to grow at 7.2% in 2013, fleet growth – after accounting for scrapping – will easily surpass demand growth. As a result, we continue to remain negative for both earnings and asset values in 2013; notwithstanding any seasonal spikes. While we have seen some bankruptcies in the past few years, we expect to see a lot more in 2013 as cash reserves of most owners are depleted through their support of negative fleet cash flows in recent years. Further downside risks exist in the form of an economic slowdown in China, global economic recession, and excessive contracting of energy-efficient vessels.
Container ships
We expect container trade demand to improve in 2013 subject to a recovery of the global economy. The incoming supply of larger container vessels, however, poses the biggest threat to the market. Such supply side pressure will probably continue into 2014 when one factors in postponements. In the face of the incoming supply, and the limitations of the capacity discipline measures, freight rates are expected to be under pressure again in 2013. This will affect the profitability of liner operators; it will also depress time charter rates and asset values. New regulations such as EEDI are also likely to have an impact on the market once such EEDI-compliant vessels enter the fleet in numbers.
was the case in 2012, we expect at least another 90 crude tankers to join the fleet in 2013. As a result, freight rates and asset values will probably decrease further to historically low levels. Nonetheless, declining newbuild prices and new environmental regulations will most likely result in new contracting. It is possible that 2014 will be less gloomy. However, the prolonged slump in the world economy combined with an increasing fleet oversupply, are together expected to keep pressure on market fundamentals for most of 2014 as well. Therefore, a visible recovery in earnings and asset values will not materialise in the foreseeable future.
Product tankers
Subject to a stable global economy, we expect to see positive growth in demand for refined products in all global regions, barring Western Europe, in 2013. In terms of cargo availability, massive expansion of the refining capacity in Asia and the Middle East is likely to be positive for the product tanker market. Given the growing disparity between refinery supply and demand regions, we expect product tankers to benefit from increasing tonne-mile demand. Long-range product tankers will probably be the largest beneficiaries of this trend. Nonetheless, the fleet oversupply situation remains and its effect on market balance cannot be understated. The current order book stands at 11% of the existing fleet. Despite an improved demand scenario expected from 2013 onwards, a large number of scheduled deliveries are likely to prevent any form of quick recovery both in earnings and in asset values. From 2014 onwards, both earnings and asset values will probably improve slowly, although fleet utilisation rates are not expected to reach pre-crisis levels any time soon. On a note of caution, it is worth mentioning the fact that the current uncertain macroeconomic environment along with political instability in some regions has the ability to derail our cautiously optimistic demand forecasts.
Liquefied natural gas tankers
The LNG tanker market has remained buoyant, with rates touch-ing near-term highs in 2012. Nonetheless, we notice a slight slowdown in demand growth compared to the impressive recovery that we witnessed post-2010. The main reason for this is that LNG tanker demand is constrained by the pace at which lique-faction capacity becomes operational. With most of the major liquefaction facilities planned to be operational prior to 2013 already on-stream, only marginal growth is likely during the next couple of years. Major increases in liquefaction capacity are expected to be operational only post-2015. On the positive side, these marginal increases will translate into increased tonne-mile demand for LNG tankers, due to the large geographical distance
Shipping Finance

59
DVB Bank SE | Group Annual Report 2012
T HE C OMPA N Y F IN A NCI A L A ND EqUI T Y M A RK E T S GROUP M A N AGE M E N T R E P OR T C ONSOL IDAT E D F IN A NCI A L S TAT E MEN T S
Shipping Finance – Portfolio outlook 2013
Pessimistic news and sentiment have dominated the shipping market for the last few years. It has become trendy to look at the whole industry critically, without considering that the market itself consists of many sectors and subsectors – each having its own supply/demand dynamics and long-term drivers. Many times we warned about the state of certain sectors but, as a focused expert, we are also able to differentiate and identify those sectors and subsectors that are expected to perform well.
It is this expertise that will steer our decisions on where to employ our capital going forward. We will do new business selectively and with measure in 2013: instead of seeking growth in traditional shipping, we will focus on the offshore and the gas sectors that continue to enjoy solid prospects. These sectors have high entry barriers and require a high level of technical proficiency, thus providing insulation from the supply-driven volatility characteristic of the bulk shipping market. Yet with asset values depressed in some segments, some attractive low-risk propositions abound in the bulk segments as well.
We expect that volatility will prevail; therefore, our Shipping Finance division will take a selective stance on new business. The abiding market conditions will enable us to reach a new clientele that was previously out of our margin scope. These players are established shipping companies with proven operational and commercial track records of riding out the cycles, corporate names with limited exposure to open market risk (either through committed contracted employment and/or by being close to the underlying cargo flows) and those with the proven ability to access multiple sources of financing (instead of being dependent upon only one source of capital).
In 2013 the number of inactive vessels, defaults and corporate restructurings, especially in the container vessel, crude oil tanker and dry bulk sectors, is expected to increase. Shipping companies with large capital expenditure programmes, unfunded commit-ments and/or upcoming balloons, are at particular risk. There-fore, we expect 2013 to be a year of increased volatility and stress; but crisis also brings opportunities for those players with knowledge, expertise and dedication. With its extensive coverage and expert sector knowledge, Shipping Finance is well positioned for the year ahead. It has the right combination to do well in this difficult market and secure business with the most attractive risk-reward profile. Our Shipping Finance business model has been tested through the crisis, and we are confident in its ability to evolve and adapt quickly to external shocks. Our restructuring expertise has been improved; the new SMRT team is ready to take on all risk-related challenges. With our vigilance sharpened by robust and frequent stress testing, our focus is clear – stay in control, and minimise losses.
Shipping Finance

60
DVB Bank SE | Group Annual Report 2012
Aviation Finance
Air cargo showed a less favourable development, contracting by 1.5% during 2012 after having already fallen by 0.6% the year before. This air cargo slowdown was caused by lower world trade growth but also by a modal shift towards more sea transport. Despite the air cargo malaise, once again the Middle Eastern carriers prospered and increased their market share. But Asia/Pacific carriers were amongst the victims of the Middle East expansion, posting a decline in volume.
The International Air Transport Association’s (IATA) financial forecast as of December 2012 projects a system-wide net profit (excluding bankruptcy reorganisation costs) for the global com-mercial airlines of US$6.7 billion, down on the 2011 result of US$8.8 billion. Clearly, several airlines were unable to stay out of the red, but in the end a surprisingly low number of them had to file for bankruptcy, including well-known names such as Spanair and Malev.
After an excellent 2011, the global aircraft manufacturers again enjoyed a strong market with new orders for over 2,600 western-built commercial jets for civil operators. As of the end of 2012, the backlog for commercial jets stood at around 9,750 units, or 47% of the in-service fleet. A year earlier, the backlog was only 8,740 or 43% of the in-service fleet. Over two-thirds of the orders outstanding were for two single-aisle jet-families only, the Boeing 737 and the Airbus A320.
For our Aviation Finance division, 2012 was another strong year. During the year we were again a leader in an air finance market still relatively starved of commercial banking liquidity. Since we do not target low-risk, low-margin ECA-supported business, each dollar of the €1.6 billion we loaned during 2012 was “in demand” commercial finance. As the year came to a close, we had completed a satisfying mix of new and used aircraft financings for a diversified group of clients in terms of geographic location and credit standing.
Aviation Finance – Market review
After years of turmoil, 2012 finally offered commercial aviation a relatively uneventful year. Despite continuing challenges faced by the world economy faced during the year, the global commercial aviation business enjoyed relatively strong demand, at least in terms of passenger traffic. With an increase in world revenue passenger kilometres (RPK) of 5.3%, passenger traffic growth was in line with the expected long-term trend of about 5%. In October 2012, hurricane Sandy caused a major disruption of air traffic in the US, but fortunately the industry did not experience any other major troubles caused by natural disasters, terrorist acts or political unrest. However, growth in 2012 was unevenly distributed over the regions though. The Middle Eastern airlines strengthened their position partly at the expense of the established Western European and Asian carriers. The domestic Chinese and Brazilian markets were the frontrunners in terms of market growth. The Indian domestic market stood out as the only major market with negative growth.

61
DVB Bank SE | Group Annual Report 2012
T HE C OMPA N Y F IN A NCI A L A ND EqUI T Y M A RK E T S GROUP M A N AGE M E N T R E P OR T C ONSOL IDAT E D F IN A NCI A L S TAT E MEN T S
Aviation Finance
There was only a minimal increase in the number of commercial jets in storage, underlining the strength of the market. The majority of stored aircraft represented equipment with outdated technology, but also a growing number of relatively modern (but surplus) 50-seater regional jets. In general the market seems to have an increasing preference for newer, more efficient aircraft, while older planes are falling out of favour, resulting already in the – still incidental – part-out of relatively young aircraft. The persistently high fuel price and the more challenging finance environment for older aircraft may explain part of this trend.
A number of equity investors, in particular from Asia, were attracted by the prospering aircraft leasing business and several major lessors changed ownership. Despite the positive mood in
the leasing market, cracks may appear in the leasing model as lease rates for some of the more popular aircraft types showed softness, and lessors reported that placing certain aircraft types on new leases was challenging. In some cases, lessors reported additional write-downs to adjust book values of older aircraft to market levels. In the air finance market, the export credit agencies (ECA) continued to play an important role assisting global airlines and lessors in financing new aircraft purchases. Commercial bank funding was not up to earlier levels, but notable new entrants from emerging countries provided funding for, mainly, the local carriers. Capital markets as well as lessors’ equity were the other major funding sources.
25,000
20,000
15,000
10,000
5,000
0
2002
2003
2004
2005
2006
2007
2008
2009
2010
2011
2012
50
40
30
20
10
0
Stored fleet as % of total fleet (right scale) Backlog as % of total fleet (right scale) Backlog as % of in-service fleet (right scale)
Total fleet (left scale) Stored (left scale) Backlog (left scale) In-service fleet (left scale) Source: Ascend and DVB Aviation Research, December 2012
Number of jets %
Backlog and storage as percentage of commercial jet fleet (western-built jets)
Ultimo 2012:– Backlog was 9,844 or 45.7% of the in-service fleet– Stored fleet was 2,640 or 10.9% of the total fleet

62
DVB Bank SE | Group Annual Report 2012
Aviation Finance
their capacity increase to 2.9%, demand for RPKs still expanded by 5.1%. Finally, the North American operators reduced inter-national capacity by 0.3%, which together with a minimal expansion of domestic capacity by 0.4% resulted in an overall capacity increase of just 0.1% when compared to 2011. Demand slightly exceeded this level, and total RPK grew by 1.1%.
The global airlines enjoyed another year of positive net profits in 2012. Effectively, 2009 was the last year IATA had to report a negative result of US$4.6 billion. During 2012, the outlook improved and IATA adjusted its net profit forecast in December 2012 to US$6.7 billion, not too far off the US$8.8 billion in 2011. Two regions were responsible for over 80% of the industry profit: Asia/Pacific and North America. The rapidly expanding Middle Eastern carriers recorded only US$0.8 billion in net profit and runner-up in volume growth Latin America scored only US$0.4 billion. Europe and Africa reportedly could only reach breakeven.
Traffic growth and airline profitability
IATA figures indicate a 5.3% growth in global passenger traffic during 2012, just above the 20-year average of 5.0%. Interna-tional traffic increased by a healthy 6.0%, while domestic traffic lagged behind with just 4% growth, mainly as the result of a very sluggish 0.8% growth in the large US domestic market. Global capacity expressed in available seat kilometres (ASK) only increased by 3.9%, resulting in a close-to-record passenger load factor of 79.1%.
The Middle Eastern airlines enjoyed a 15.2% growth in RPKs, thereby still exceeding the enormous 12.4% increase in capacity (ASK). Some way behind, the Latin American market took second position with 9.5% growth in traffic and 7.5% more capacity than 2011. The smaller African region enjoyed a healthy 7.2% traffic growth, against only 6.5% more capacity. The Asia/Pacific airlines showed an average performance, with 6.0% gain in RPKs and 5.2% more capacity. While European carriers restricted
40
30
20
10
0
–10
–20
–30
Jan 2005 Jul 2005 Jan 2006 Jul 2006 Jan 2007 Jul 2007 Jan 2008 Jul 2008 Jan 2009 Jul 2009 Jan 2010 Jul 2010 Jan 2011 Jul 2011 Jan 2012 Jul 2012
105
90
75
60
45
30
15
0
RPK growth FTK growth Pax load factor Source: IATA, December 2012
Air traffic volume year-on-year RPK and FTK growth Pax load factor (%) (%)

63
DVB Bank SE | Group Annual Report 2012
T HE C OMPA N Y F IN A NCI A L A ND EqUI T Y M A RK E T S GROUP M A N AGE M E N T R E P OR T C ONSOL IDAT E D F IN A NCI A L S TAT E MEN T S
Aviation Finance
Global airlines’ earnings before interest and tax (EBIT) as a percentage of revenues was just 2.1%. Again it turned out that the North American carriers have learned to be profitable despite slow market growth. They reached a 3.4% EBIT margin, probably helped by the increasing market consolidation. Asia/Pacific, the Middle East and Latin America reported EBIT margins of between 2% and 3%, while Europe and Africa stayed well below 1%. It may be interesting to note that since 2005, the annual number of start-up airlines has steadily decreased, potentially handling the established carriers more pricing power.
Air cargo market
Relatively positive developments in the passenger market stand in sharp contrast to the international cargo market. After a 2011 volume loss of 0.6% in terms of Revenue Tonne Kilometres (RTK), the cargo carriers were hit even harder with a loss of 1.5% in 2012. Capacity grew by 0.2% and this obviously had a very negative effect on the freight load factor, which dropped to 45.2%. Apart from the slowdown in world trade growth, it seems the commodity mix of world trade is favouring sea trade. In addition, a modal shift away from air cargo may have taken place. The pure – main deck – cargo operators came under additional pressure as a result of competition from the huge increase in belly cargo space offered by modern widebody passenger aircraft. Finally the decrease in military charter contracts caused problems for those carriers that had relied on this kind of – relatively profitable – business in the past. World Airways and Southern Air were amongst the victims of the air cargo crisis.
Aircraft orders
Contrary to 2010 and 2011, no major new aircraft programmes were launched in 2012. Despite this, the total order volume did not fall much behind the record level of 2011. The industry is in the midst of a wide-ranging aircraft generation change, with many of the established programmes about to be replaced by new and more fuel-efficient designs. Experience shows that especially the last-off-the-line aircraft of the old design may be subject to increased value volatility, while the value prospects for early production versions of the new generation may offer a much better value outlook, provided these early aircraft do not suffer from substandard specifications.
According to Ascend’s online database, a gross total of 2,622 western-built commercial jets were ordered by civil operators. 183 orders were cancelled. Boeing benefitted in 2012 from massive interest in the new 737 MAX that was announced in July 2011. With officially 1,339 new gross orders (1,203 net, including cancellations), Boeing beat Airbus, who announced a still-respectable gross order total of 914 aircraft (net 833).
The 737 MAX led Boeing sales with 914 firm orders, of which over 60% came from just five customers. As of end-2012, the A320neo still had the lead in the new narrowbody competition with a total of 1,734 orders, while the Boeing 737 MAX had accumulated 1,064. While very few changes to the A320neo design were announced in 2012, Boeing continued to fine-tune its 737 MAX. For financiers and investors in commercial aviation, the A320 and Boeing 737 are of crucial importance as these two families represent close to 70% of the total order book.
The larger widebody Boeing 787 Dreamliner and Airbus A380 did not do too well in 2012. Both suffered technical “teething problems” that for the Boeing 787 culminated in early 2013 in the temporary grounding of the type. Airbus only managed to sell another nine A380s while Boeing’s year-end 787 sales total was negative as a result of 50 new orders but 62 cancellations. Airbus’ direct answer to the Boeing 787, the slightly larger A350XWB, with first flight scheduled in 2013, booked 27 net orders. In the meantime, two well-proven twin-aisle families continued to prosper. Airbus’ A330 family booked 80 gross orders (net 58), the majority for the A330-300. Additionally, Airbus increased competitiveness of the type, announcing a more capable 242 tonne version of the -300. Boeing had significant sales successes with its proven 777 family. The stretched -300ER took 73 of the 75 orders. Neither the Airbus A330 Freighter, nor the Boeing 777 Freighter saw their order total increase in 2012.

64
DVB Bank SE | Group Annual Report 2012
Aviation Finance
Aircraft production and deliveries
With regard to production and deliveries, the two dominant aircraft manufacturers again broke a record by delivering more than 1,150 commercial jet aircraft to civil operators in a single year. Most of Airbus and Boeing’s deliveries were to carriers in the Asia/Pacific region (47%), followed by Europe (20%) and North America (13%). The Middle East is especially important for twin-aisle deliveries, taking 36% of all 777 deliveries. Boeing and Airbus delivered 585 and 581 aircraft respectively in 2012, an increase of approximately 17% compared to the volume of last year. Especially, production in the single-aisle segment posted another rapid expansion: according to Ascend Online, Boeing’s 737NG deliveries increased from 365 to 405, while Airbus delivered 453 A320 family aircraft compared to 419 the year before. While “the jury is still out,” many industry observers fear there may be some overproduction in the single-aisle seg-ment. The manufacturers, however, are only building aircraft against concrete orders and almost no “white tails” (unsold aircraft) left the factories.
With respect to widebodies, the Boeing 777 delivery volume increased to 83 aircraft in 2012, ten more than the year before. The Boeing 767 had 26 aircraft delivered, six more than in 2011. Production of the Boeing 787 eventually got under way with 46 deliveries. The Boeing 747-8 finally counted 25 deliveries. The A330 production line added 98 aircraft to the market last year, an increase of 14 when compared to 2011, while 30 A380 mega-jets were delivered. Due to technical/production challenges and significant reworking required for the first deliveries, a slower than anticipated production ramp-up for the Boeing 787 Dream-liner cannot be avoided. This will potentially extend the use of older planes with carriers that had hoped to take delivery of new Dreamliners in 2013.
The other widebodies, Boeing’s 767-300 and 747-8, as well as Airbus’ A340, continued to struggle in 2012. For Boeing it has been important to keep the 767 manufacturing line open until the production of the military tanker-transport version KC-46A starts. The 767-300ER received 22 net orders in 2012, 19 of which came from FedEx for the freighter version. Maybe more worrying is the lack of market interest in the new 747-8. Seven -8s were sold but six were cancelled, leaving a net order intake of just one.
Moving on to the other manufacturers, Brazil’s Embraer saw its order total for the large regional E-Jets increase from 1,051 to 1,093, indicating only 42 net new orders in 2012. At the end of 2012, their commercial jet backlog only stood at 185, the majority for the E-190. Early 2013, however, brought some major develop-ments for Embraer. Republic Airways ordered 47 E-175 jets to operate under the American Eagle brand. Embraer also announced a remarkable switch from General Electric (GE) engines to arch-rival Pratt & Whitney’s geared turbofans for the second generation E-Jets, scheduled to enter service in 2018.
Embraer’s main rival, Canada’s Bombardier, booked a total of 73 additional CRJ orders, including an order for 40 CRJ900s from Delta Air Lines. The new CSeries first flight was resched-uled for mid-2013. During 2012, Bombardier only booked 15 net orders for the CSeries. The CSeries, as well as the new Embraer E-Jets, will be competing against a number of smaller and larger newcomers in the regional jet market. The Russian/Italian Sukhoi Superjet reportedly booked ten net orders in 2012, while Mitsubishi had reason to celebrate as its MRJ design received an order for 100 aircraft from Sky West Airlines. Newcomers in the larger single-aisle category COMAC (China) and Irkut (Russia) focused their efforts on the financial community, and mainly booked orders from (local) leasing companies. The COMAC C919 received 115 orders, including 20 from internation-ally well-respected lessor BOC Aviation. Irkut could only convince lessor Aviakapital to sign up for 35 MS-21s.

65
DVB Bank SE | Group Annual Report 2012
T HE C OMPA N Y F IN A NCI A L A ND EqUI T Y M A RK E T S GROUP M A N AGE M E N T R E P OR T C ONSOL IDAT E D F IN A NCI A L S TAT E MEN T S
Aviation Finance
Aircraft leasing
Operating lessors continued their expansion during 2012, and the leased share in the commercial jet fleet increased to 36%. Lessors generally concentrate on the more liquid aircraft: as an example, the A320 has a lessor-managed share of 54% in the global fleet of the type, slightly above the 51% of the Boeing 737-800. Generally, twin-aisle planes are somewhat less popular in lessor circles, but the A330 seems to be an exception with a leased share of 43% versus only 26% for the Boeing 777. The lessors’ share in the commercial jet backlog lies below 20%, indicating that a significant part of their expansion has come from sale-and-lease-back transactions. It seems a number of airlines that placed large orders in the recent past counted on the continued availability of a significant sale-and-lease-back capacity. There are some concerns that lessors may reach the limits of their exposure to some individual carriers in the near future.
Lessors enjoyed significant interest from new investors from Asia. RBS Royal Bank of Scotland Group sold its aviation leasing unit to Sumitomo Mitsui Financial Group. Mitsubishi UFJ Lease & Finance Company entered into a deal to buy Oaktree Capital Group’s Jackson Square Aviation. American International Group agreed to sell nearly all of its ILFC airplane leasing business to a Chinese consortium. Some concerns surround the aircraft leasing business. The widespread policy of depreciating an aircraft over a 25-year period to a residual value of 15% is the subject of an industry-wide debate. Values and lease rates of older aircraft seem to come under pressure as airlines show an increasing preference for the most modern and efficient equipment under the influence of high fuel costs. Availability of ECA financing and sale-and-lease-back capacity stimulate the new equipment market, while lack of commercial bank funding and the closing of certain countries for older equipment depress the used equip-ment market. An analysis of Ascend’s historic market values indicates that the residual value of, for example, a ten-year-old aircraft such as the Airbus A320 today is much lower compared to a similar aircraft ten years ago.
Aviation Finance – Strategy
DVB features a unique platform of Aviation Finance services and products, and an impressive track record of highly structured transactions to go with it. The Aviation platform has been meticulously built, with innovation and a view to being a constant provider of aviation capital and services during different economic cycles. This strategy is truly a reflection of the Aviation Finance mission statement: “To be able, as a hybrid institution, at any period in time and at any point along the industry cycle, to provide our customers with the most efficient blend of capital and services”.
Today, DVB is one of the largest providers of recourse and non-recourse commercial debt to passenger and cargo airlines, and to aircraft lessors worldwide, with a total exposure that has grown steadily to €6.9 billion, financing 858 aircraft and 55 spare engines. We view the continuing development of our asset-based lending practice as a way of further profitably expanding our business in the sector, and specifically consider our willingness to assume residual value risks – based on in-depth research, together with our knowledge of the market and specific aircraft – as a competitive advantage. As such, DVB will continue to adopt a proactive approach to maintaining and growing its portfolio, in line with well-established lending guidelines and principles. Our strategy is to build on this core business, and to provide aviation customers with a seamless one-stop shop to develop financing solutions for core aviation assets. No other aviation finance bank can boast its own aircraft asset management team, let alone its own combination of an aircraft asset management team and integrated partnership with an aero engine asset management team.
This collection of specialists, allied to the asset and market research capability, ensures that the Bank remains a consistent and intelligent arranger, manager and supplier of commercial debt and equity capital, as well as a provider of good advice and tailored solutions to its client base, in all market conditions.

66
DVB Bank SE | Group Annual Report 2012
Aviation Finance
A prerequisite for DVB’s success is co-operation amongst a team of professionals with a multi-disciplined background. As well as staff experienced in banking and structured finance, Aviation Finance employs individuals with very specific aviation industry expertise gathered from a prior background with airlines, manufacturers, aircraft/engine lessors and asset managers. Our geographic franchise comprises all of the world’s significant aviation finance markets: London, New York, Singapore, Tokyo and Frankfurt/Main.
The biggest differentiator between DVB and its competitors is the fact that Aviation Finance offers far more than the traditional range of banking services. We provide the best choice of structures and services “at the crossroads of money and metal”, supported by a strong research team. Our aim is to ensure that these distinctive features are fully recognised and valued by our clients and prospects. So far we have been doing this success-fully which is why, in April 2012, DVB was awarded “North America Deal of the Year 2011”, “Pre-Delivery Payment Deal of the Year 2011” and “Sale/Lease-Back Deal of the Year 2011” by the renowned transport magazine Air Finance Journal.
Into 2013, and indeed beyond, DVB now is to and will further optimise its resources and relentlessly continue to monitor its risk positions. It has available capital for new business, as well as a platform and staff skill sets to which others aspire. Aviation Finance has consistently demonstrated the achievement of its goal of a cycle-neutral business model: one which will enable DVB to be equally active (and therefore profitable) in a market downturn as in an upturn. What Aviation Finance now strives for is to further increase efficiency across the board, for the mutual benefit of the Bank and its clients, and thus to stay ahead of its competitors.
Our Aviation Finance clients can today readily draw upon the following range of expertise, in order to fulfil their differing requirements:
• StructuredAssetFinancing,comprisingrecourseandnon-recourse lending and arranging, plus structured finance activ-ities (including tax and non-tax-based leases);
• AdvisoryServices,includingfundraising/financingstrategy,optimal capital structure and sale-and-lease-back transactions;
• AviationAssetManagement,providingthird-partyaircraftremarketing, lease management as well as technical and general consultancy services;
• AeroEngineFinancingandEngineAssetManagement,including the services of TES Aviation Group, 40.0% owned by DVB Bank SE and an integrated and reliable component of the platform;
• Asset&MarketResearchasthebasisoftheone-stopshopconcept, with a core focus on the equipment market;
• PrivateEquitySourcingandInvestments,viatheAviationInvestment Management team, managing the Deucalion Aviation Funds (aircraft, aero engines, airline equity, asset-backed bonds, etc.).

67
DVB Bank SE | Group Annual Report 2012
T HE C OMPA N Y F IN A NCI A L A ND EqUI T Y M A RK E T S GROUP M A N AGE M E N T R E P OR T C ONSOL IDAT E D F IN A NCI A L S TAT E MEN T S
Aviation Finance
Aviation Finance – Products
Through its “one-stop shop” business model, our Aviation Finance division offers a wide range of value-added products and services.
Structured Asset Financing
The Structured Asset Financing activity of the Aviation Finance division is at the heart of its client offering. With a loan portfolio of €6.9 billion and a new business final-take of €1.6 billion in 2012, DVB is a market leader in commercial and asset-based financing for aircraft and related equipment. The Aviation Finance teams actively seek out new business, both in isolation and in conjunction with the arranging and structured financing activities. Some of the Bank’s competitors are more than keen to pursue such structured activities (including tax- and non-tax-based leases); however, unlike DVB, they are unwilling to apply their balance sheets in support of these initiatives. DVB does not provide export credit loans, as they are not deemed to offer the proper risk-reward balance for our business.
A team of 21 Aviation Finance relationship managers is located in London, New York, Singapore and Tokyo, with the objective of covering all three key economic regions for aviation. The core lending business comprises both recourse and non-recourse finance. In this latter category, DVB routinely takes residual risk on the sales proceeds of aircraft upon maturity, an activity which requires the formulation of an own-expert opinion of residual values. Here, the specialist research activities of Aviation Research are a necessary and crucial differentiator.
Advisory Services
DVB acts as adviser to its aviation clients via the Aviation Financial Consultancy (AFC) unit. The team is based in London and Singapore, and includes professionals with extensive bank-ing, leasing and aviation backgrounds. Providing its clients with an unbiased view and opinion, they add valuable and innovative perspectives to a client’s project or, more generally, to the client’s balance sheet. AFC specialises in providing advice to airlines, lessors and investors: its range of advisory services includes financing advice (commercial, export credit, pre-delivery payment), lease-versus-buy analysis, aircraft procurement advice, advice in relation to (and the execution of) sale-and-lease-back trans-actions, business plan and development strategy reviews and restructuring advice.
Aviation Asset Management
The Aviation Asset Management (AAM) team, comprising eleven professionals located in London, New York and Singapore, pro-vides the full range of aircraft management services – this being third-party aircraft remarketing, lease management, and technical and general consultancy services – to airlines, lessors, investors, bondholders and financial institutions. It is backed in this activity by extensive market knowledge and established industry relation-ships and reputation.
Aviation Finance – “one-stop shop” business model
Structured Asset Financing Advisory Services Aviation Asset Management Aero Engine Financing and Engine Asset Management Private Equity Sourcing and Investments Risk Distribution Asset & Market Research Aviation Relationship & Lending
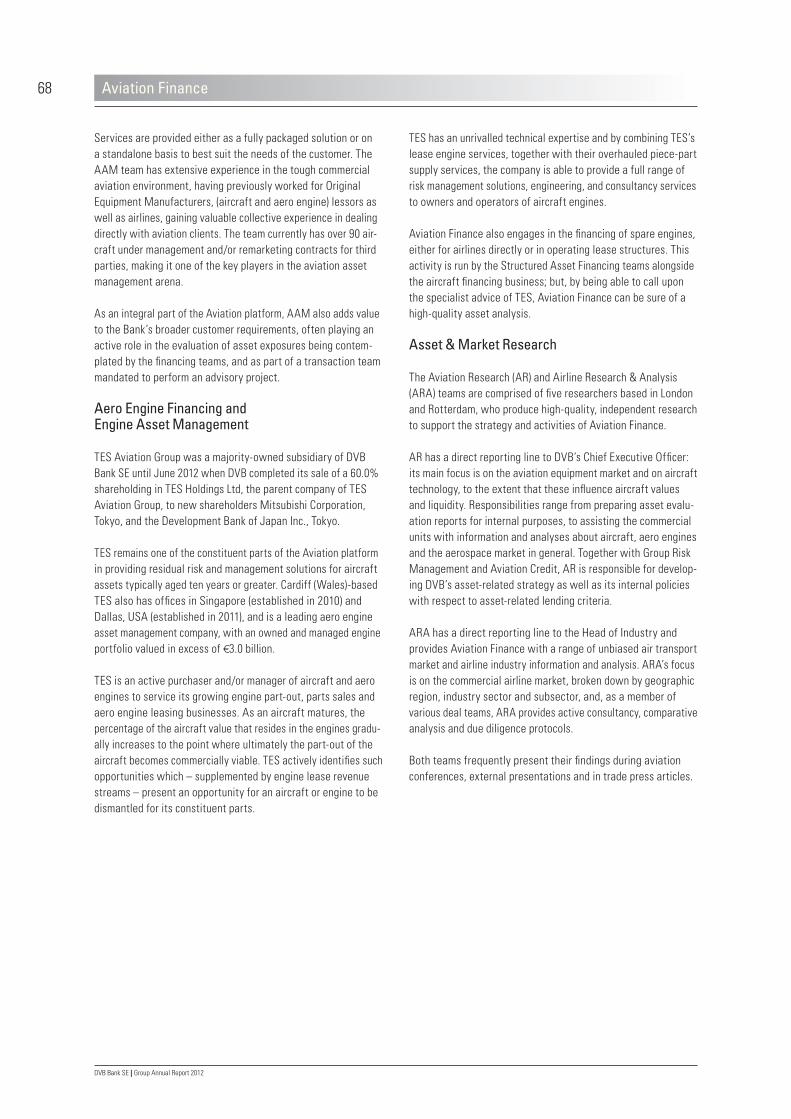
68
DVB Bank SE | Group Annual Report 2012
TES has an unrivalled technical expertise and by combining TES’s lease engine services, together with their overhauled piece-part supply services, the company is able to provide a full range of risk management solutions, engineering, and consultancy services to owners and operators of aircraft engines.
Aviation Finance also engages in the financing of spare engines, either for airlines directly or in operating lease structures. This activity is run by the Structured Asset Financing teams alongside the aircraft financing business; but, by being able to call upon the specialist advice of TES, Aviation Finance can be sure of a high-quality asset analysis.
Asset & Market Research
The Aviation Research (AR) and Airline Research & Analysis (ARA) teams are comprised of five researchers based in London and Rotterdam, who produce high-quality, independent research to support the strategy and activities of Aviation Finance.
AR has a direct reporting line to DVB’s Chief Executive Officer: its main focus is on the aviation equipment market and on aircraft technology, to the extent that these influence aircraft values and liquidity. Responsibilities range from preparing asset evalu-ation reports for internal purposes, to assisting the commercial units with information and analyses about aircraft, aero engines and the aerospace market in general. Together with Group Risk Management and Aviation Credit, AR is responsible for develop-ing DVB’s asset-related strategy as well as its internal policies with respect to asset-related lending criteria.
ARA has a direct reporting line to the Head of Industry and provides Aviation Finance with a range of unbiased air transport market and airline industry information and analysis. ARA’s focus is on the commercial airline market, broken down by geographic region, industry sector and subsector, and, as a member of various deal teams, ARA provides active consultancy, comparative analysis and due diligence protocols.
Both teams frequently present their findings during aviation conferences, external presentations and in trade press articles.
Services are provided either as a fully packaged solution or on a standalone basis to best suit the needs of the customer. The AAM team has extensive experience in the tough commercial aviation environment, having previously worked for Original Equipment Manufacturers, (aircraft and aero engine) lessors as well as airlines, gaining valuable collective experience in dealing directly with aviation clients. The team currently has over 90 air-craft under management and/or remarketing contracts for third parties, making it one of the key players in the aviation asset management arena.
As an integral part of the Aviation platform, AAM also adds value to the Bank’s broader customer requirements, often playing an active role in the evaluation of asset exposures being contem-plated by the financing teams, and as part of a transaction team mandated to perform an advisory project.
Aero Engine Financing and Engine Asset Management
TES Aviation Group was a majority-owned subsidiary of DVB Bank SE until June 2012 when DVB completed its sale of a 60.0% shareholding in TES Holdings Ltd, the parent company of TES Aviation Group, to new shareholders Mitsubishi Corporation, Tokyo, and the Development Bank of Japan Inc., Tokyo.
TES remains one of the constituent parts of the Aviation platform in providing residual risk and management solutions for aircraft assets typically aged ten years or greater. Cardiff (Wales)-based TES also has offices in Singapore (established in 2010) and Dallas, USA (established in 2011), and is a leading aero engine asset management company, with an owned and managed engine portfolio valued in excess of €3.0 billion.
TES is an active purchaser and/or manager of aircraft and aero engines to service its growing engine part-out, parts sales and aero engine leasing businesses. As an aircraft matures, the percentage of the aircraft value that resides in the engines gradu-ally increases to the point where ultimately the part-out of the aircraft becomes commercially viable. TES actively identifies such opportunities which – supplemented by engine lease revenue streams – present an opportunity for an aircraft or engine to be dismantled for its constituent parts.
Aviation Finance

69
DVB Bank SE | Group Annual Report 2012
T HE C OMPA N Y F IN A NCI A L A ND EqUI T Y M A RK E T S GROUP M A N AGE M E N T R E P OR T C ONSOL IDAT E D F IN A NCI A L S TAT E MEN T S
Aviation Finance – Portfolio analysis
DVB is renowned as a leading arranger, underwriter and provider of asset-based capital in aviation finance. It was one of the few financial institutions which remained active during the last down-turn, and thereby proved – once again – a reliable partner to its clients in difficult times.
An integrated platform approach, across a global footprint
Aviation Finance has a strong network of relationships with clients and industry partners, who perceive DVB as a bank that understands their business and which possesses the expertise to provide value-added financial solutions. Such relationships are maintained by remaining in close and constant touch with its clients, achieved through the coverage provided by its relation-ship management teams in London, New York, Singapore and Tokyo. The client activities of these teams are supported by the Aviation Financial Consultancy (based in London and Singapore) and Aviation Asset Management (based in London, New York and Singapore) teams. The platform is further complemented by close co-operation with TES Aviation Group, a leading engine asset management company, based in Cardiff (Wales), United Kingdom, in which DVB has a 40.0% shareholding. Aviation Finance’s scope of products and services is positioned to offer a “cradle to grave” solution for aircraft and related equipment, ranging from, at one end of the life spectrum, providing pre-delivery finance for aircraft still to be delivered, to a tear-down solution for aircraft and spare engines, at the other end. Within this spectrum DVB provides a range of structured asset finance, advisory and asset management services, following the life cycle of aero equipment.
Our market leadership
During 2012 DVB was again a leader in an air finance market still relatively starved of commercial banking liquidity. The financing of new equipment was not an area of significant stress, given the availability of export credit agency (ECA; guarantee) support and the appetite of the leasing companies for such assets. For non-ECA supported transactions, the stellar credits among the airline and leasing companies were able to secure funding; however for the rest, it remained hard work to secure their aircraft financing/refinancing needs, in particular for used equipment, or to raise financing for pre-delivery payments (PDP). Since DVB’s Aviation Finance does not target low-risk, low-margin
ECA-supported business, each dollar of the €1.6 billion we loaned during 2012 was “in demand” commercial finance. Across our Structured Asset Financing activity, we continued to support the needs of our core clients, but also added new clients to our portfolio. As the year came to a close, we had completed a satisfying mix of new and used aircraft financings for a diversified group of clients in terms of geographic location and credit standing.
Structured Asset Financing – Loan portfolio and income
During 2012 Aviation Finance realised 50 new transactions with aviation clients, representing a new final-take volume of €1.6 billion (2011: 78 new transactions with a final-take volume of €2.7 billion). The increased interest margin of 380 basis points (2011: 325 basis points) was risk adequate and compensated for the generally rising cost of liquidity during the year. This resulted in net interest income remaining approximately on the previous year’s level of €73.4 million (2011: €74.0 million). Allowance for credit losses was released in an amount of €4.2 million (2011: addition of €5.7 million). Total allowance for credit losses in Aviation Finance stood at €37.5 million in 2012, compared to €48.0 million at the end of 2011. We believe that this level of provisioning provides a necessary and adequate cushion against possible losses. This resulted in income and net segment income before taxes rising by 11.4% and 14.7%, respectively.
Aviation Finance
Extract from Aviation Finance’s segment report
€ mn 2012 2011 %
Net interest income 73.4 74.0 –0.8
Allowance for credit losses 4.2 –5.7 –
Net interest income after
allowance for credit losses 77.6 68.3 13.6
Net fee and
commission income 36.8 34.5 6.7
Income
(excluding the IAS 39 result) 114.5 102.8 11.4
General
administrative expenses1) –16.7 –17.4 –4.0
Net segment income
before taxes 98.1 85.5 14.7
1) Only those costs are allocated to DVB’s operating business divisions for which they are directly responsible. General costs of operations, overheads or, for example, IT costs are not allocated to the operating business divisions.

70
DVB Bank SE | Group Annual Report 2012
Aviation Finance
• Arranger/Underwriter of a variety of limited recourse financings to support DVB’s lessor clients. These included: for AWAS, one new A320-200 on lease to LAN Chile, as well as four used B737-800s on lease to Virgin Australia, El Al and KLM respec-tively; and for Dubai Aerospace Enterprise, one B777-300ER on lease to EVA.
• Consistent with DVB’s market leadership in the used equipment market, the Bank arranged a variety of bilateral term loan refinancing transactions, including: for Thomas Cook, two 1999-vintage A330-200 aircraft; and for Guggenheim Aviation Partners, two 2009-vintage A330-200 aircraft on lease to US Airways.
• Arranger/AgentofaPDPfinancingforTUITravelinrespectoften B737-800 aircraft delivering in 2013 and 2014. Other PDP financings/refinancings were concluded for Norwegian Air Shuttle (two B737-800’s) and Hainan Airlines (two B787-8s).
At the end of 2012 the Aviation Finance portfolio stood at €6.9 billion (2011: €6.9 billion). The portfolio was, however, 98.4% US-dollar-denominated: currency movements during the year produced a 1.1% growth rate in US dollar terms, rising to US$9.1 billion (2011: US$9.0 billion). The collaterialised portfolio represented 99.8% of the total volume.
Focusing on the manufacturers, our portfolio shows a slight bias towards the financing of Boeing-manufactured equipment, at 52.5% (2011: 47.9%) of the portfolio, with Airbus aircraft stand-ing at 40.6% (2011: 44.7%), while other mainly Embraer-manu-factured equipment amounts to 6.0% (2011: 7.4%).
New business was concluded with established customers such as AerCap, AWAS, Avolon, Norwegian and US Airways. In addition, DVB attracted eight new clients, including MASKargo, Turkish Airlines and Volga Dnepr. DVB acted as arranger and/or agent bank (i.e. leading role) in all of its newly acquired business trans-actions. New financings in 2012 were well diversified by client and obligor, as well as by aircraft type. Of interest is that 75.8% of new business was for the financing of Boeing equipment (new and used aircraft). In a typical year the split between Boeing and Airbus is more even, and this is to be expected for the future.
Some of the 2012 transaction highlights were:
• Arranger and sole lender of a US$136 million portfolio financing for BOC Aviation, comprised of two E195s, five A320-200s, one A321-200 and one B737-700. This was a first bilateral facility with this target customer for a decade, and an attrac-tive addition to the portfolio, with BOC Aviation (100% owned by the Bank of China) being one of the world’s top operating lessors.
• ArrangerofaUS$65millionJapaneseOperatingLease(JOL)facility for Turkish Airlines, used to finance the acquisition of two Boeing 737-800 aircraft. This was a rare opportunity for DVB to complete its first direct transaction with Turkish Airlines, as well as a first joint-deal with Yamasa who acted as lessor in the JOL structure.

71
DVB Bank SE | Group Annual Report 2012
T HE C OMPA N Y F IN A NCI A L A ND EqUI T Y M A RK E T S GROUP M A N AGE M E N T R E P OR T C ONSOL IDAT E D F IN A NCI A L S TAT E MEN T S
Aviation Finance
Narrowbody aircraft remain the dominant aircraft class at 54.8% (2011: 55.2%), continuing our strategy of favouring narrowbody aircraft as they represent the most liquid aircraft type from a security perspective (i.e. ease of remarketing to other operators). The portfolio breakdown by asset type saw the share of financed widebody aircraft and regional jets remain stable at 29.6% and 6.9% respectively, whilst the share of freighter aircraft increased slightly to 8.7% (2011: 7.9%).
In terms of the vintage of aircraft financed, 35.1% of the portfolio is three years old or less and 60.3% of the portfolio is less than six years old. Whilst Aviation Finance is experienced in financing aircraft across the full age spectrum, and indeed this is often a competitive edge, generally younger aircraft (as well as narrow-body aircraft) are more readily sold or leased in case of need (i.e. a client default). So this age profile of the portfolio represents a very solid base.
To be built 4.2%
Up to 1 year old 8.4%
1 to 3 years old 22.5%
4 to 6 years old 25.2%
7 to 10 years old 16.9%
11 to 15 years old 18.0%
16 to 20 years old 3.6%
21 to 25 years old 1.2%
Aviation Finance portfolio by vintage
Narrowbody pax 54.8%
thereof:
28.5% Boeing
26.3% Airbus
Widebody pax 29.6%
thereof:
16.1% Boeing
13.5% Airbus
Freighter 8.7%
thereof:
7.9% Boeing
0.8% Airbus
Regional jets 6.9%
thereof:
6.0% Embraer
0.9% Bombardier
Aviation Finance portfolio by aircraft type

72
DVB Bank SE | Group Annual Report 2012
Aviation Finance
The engine financing portfolio (run by the Structured Asset Financ-ing teams alongside the aircraft financing activities) has shrunk to just €56.4 million (55 engines financed), from €83.1 million (60 engines financed) in 2011, a reflection of the limited volume of transactions seen in the market for this niche asset class.
The Aviation Finance portfolio is also well diversified by client, with 52.2% being operating lessors, 43.8% airlines and 4.0% logistics companies. A total of 165 aviation clients equates to an average lending exposure of €41.8 million per client. The largest individual client exposure for Aviation Finance currently stands at €171.8 million, and there are 46 clients for whom our committed exposure is in excess of €50.0 million.
Risk is also geographically well diversified, with a healthy balance between the Americas, at 36.9% of the portfolio, and Europe, the Middle East and Africa, at 37.6%. Client exposure in Asia and Australia/Oceania has remained relatively stable at 20.4%, which is acceptable given the competitiveness of this market, but our desire is still to grow further in this region.
North America 35.1%
Europe 33.5%
Asia 19.4%
Offshore 5.1%
Middle East/Africa 4.1%
South America 1.8%
Australia / Oceania 1.0%
Aviation Finance portfolio by country risk

73
DVB Bank SE | Group Annual Report 2012
T HE C OMPA N Y F IN A NCI A L A ND EqUI T Y M A RK E T S GROUP M A N AGE M E N T R E P OR T C ONSOL IDAT E D F IN A NCI A L S TAT E MEN T S
Aviation Finance
Structured Asset Financing – Deal of the Year 2012
Some of the transaction highlights of 2012 are included in the “loan portfolio and income” discussion above. We have, how-ever, selected a financial advisory mandate from LOT Polish Airlines as the most important Aviation Finance deal concluded in the year: DVB was appointed as Financial Advisor to LOT Polish Airlines, for the financing of its first five deliveries of the Boeing 787-8 aircraft. We were able to provide the full resources of our Aviation Finance platform to our client, in order to optimise our client’s half-billion dollar investment in a new technology aircraft for its fleet renewal; the order represents LOT’s largest capex commitment in its recent history. We were proud to be entrusted with this important mandate, on the back of the strength of our client relationship and past dealings with the airline. DVB provided LOT with a full analysis of the alternatives available in the market, including financing covered by the Export-Import Bank of the United States (US Ex-Im Bank) guarantee and sale-and-lease-back options, looking at the short-term and long-term consequences for balance sheet, cash flow and profit and
loss statements. Our Aviation Research team provided back-ground and substance to the value of this new technology aircraft as an investment: reviewing the impact of engine packages, and aircraft line numbers. Our Aviation Asset Management team facilitated the cost analysis and negotiation of the lease options, and assumptions for maintenance reserves, return conditions and other lease terms. Finally, our Financial Institutions team helped ensure a broad market coverage for LOT. The airline was able to source a wide array of financing proposals from among the largest aviation players, comprising lessors and both commer-cial and investment banks. The first two aircraft were delivered in 2012, financed through debt backed with the guarantee of the US Ex-Im Bank. LOT retains the option to convert the debt into a US Ex-Im bond, to be further considered in early 2013.
Aviation Finance – Deal of the year 2012

74
DVB Bank SE | Group Annual Report 2012
Aviation Finance
During 2012, we had a small number of transactions requiring restructuring or remedial action. However, under the leadership of Aviation Special Projects, we have been able to conclude loan amendments and restructurings, successfully mitigating losses otherwise anticipated for future years.
In general, we believe that our proactive approach to risk man-agement gives us excellent visibility over potential trouble spots within the loan portfolio, and we remain alert to opportunities to conclude “defensive” new financings – where we can simulta-neously improve our risk position on existing exposure to a client, through cross-collateralisation for example. In all cases, Aviation Finance will continue to take whatever steps necessary to safe-guard its position as a secured lender.
Aviation services
In 2012, the success of Aviation Finance contained strong con-tributions from the pure aviation services activities. The AAM, AFC and the Tokyo-based Structured Asset Financing teams have continued to enhance the reputation of DVB’s aviation business as the “leading aviation merchant bank”. These teams were engaged in a wide range of mandates, each leading to healthy “non-risk” fee earnings. Some of the highlights were:
• AFCwasappointedbyalow-costcarriertoreviewand analyse its financing options for a coming new order.
• AFCwasappointedasFinancialAdviserintwoequityraiseprojects, one on the buy-side, one on the sell-side, which are currently underway.
• AAMclosed20aircrafttransactionsin2012,including:thelease of four and the subsequent sale of two B747-400 freighter aircraft; the releasing of used A320 and A330 air-craft in Europe; and the sourcing of narrowbody aircraft for a US carrier.
• AAM has increased its activity in Asia and has been appointed by two industry- leading Asian airlines to market, respectively, a fleet of Airbus narrowbody aircraft and a fleet of widebody freighter aircraft. AAM has also been retained by a major Asian lessor to act as its technical manager.
Structured Asset Financing – Risk management
A lot of hard work to build a profitable loan portfolio can be undone as a result of loan losses in the business. With this factor in mind, Aviation Finance has built a strong risk culture over many years, which starts with our client-facing relationship managers and continues through each stage (including Aviation Credit, Aviation Research and Credit Committee) until a new commit-ment is granted, and continues thereafter throughout the term of the relevant exposure. At the heart of our consideration for each new exposure is the Deal Committee, which meets to discuss – at an early stage – possible new transactions, with a view to spotting risk and structural deficiencies, finally arriving at a consensus – be it positive or negative. The committee comprises all teams of Aviation Finance, and includes the Member of the Board of Managing Directors responsible for Aviation Finance, the Head of Industry, the Heads of Aviation Credit, Aviation Research and Aviation Asset Management, and each Regional Head of Aviation Finance. Only those transactions authorised by the Deal Com-mittee will move to the next stage, and subsequently be pre-sented to DVB’s Credit Committee. As a tribute to its efficiency, the failure (or decline) rate at the Deal Committee is significant, a tribute to our culture of risk selectivity and consensus-building.
Once a transaction is booked, it will be monitored for any required action on an ongoing basis by the respective relationship manager and credit officer, and through the review and stress test pro-cesses. If appropriate, an exposure will be taken on to the Early Warning, Closely Monitored, or Watch List reporting. The ongoing management of risk is aided by a rigid Call Report discipline and through a regular full portfolio review by Aviation Finance senior management, to proactively identify concrete actions to be taken.
The Aviation platform has been built in such a manner as to be optimally prepared for a downturn and to deal with any stress scenarios in the loan portfolio, including restructurings and air-craft repossessions. The management quality of such “stressed” transactions is clearly enhanced by our dedicated Aviation Special Projects team, which will take responsibility, working alongside Aviation Credit, for relevant work-out cases. The team may also be supported by AAM and/or TES as aircraft/engine asset managers.

75
DVB Bank SE | Group Annual Report 2012
T HE C OMPA N Y F IN A NCI A L A ND EqUI T Y M A RK E T S GROUP M A N AGE M E N T R E P OR T C ONSOL IDAT E D F IN A NCI A L S TAT E MEN T S
Aviation Finance
AAM finished 2012 with a managed portfolio of 94 aircraft (2011: 65 aircraft) under management/remarketing contracts for third parties, and continues to be one of the key players in today’s industry for asset management services.
DVB, spearheaded by its Tokyo team, has been focusing on developing its franchise and range of activities in the important Japanese aviation market. This focus, and our local presence, has paid dividends in recent years, and 2012 was no different. Across the Aviation platform, over the last twelve months, in addition to the already mentioned Turkish Airlines’ Japanese Operating Lease, we have leveraged JOL financings involving such desirable names as British Airways, KLM and Ryanair. Most importantly, however, the Tokyo team played a key role in the introduction of our two new shareholding partners in TES, the Development Bank of Japan, Inc. and Mitsubishi Corporation, with whom we are excited to be developing long-standing rela-tionships.
The commitment by DVB to develop its service capability and dedicated resources is expected to yield further rewards in the coming period, as a key component to DVB’s cycle-neutral business approach.
Aviation Finance – Outlook 2013 for the key aviation segments
With some signs that the global economy may be in for a slight improvement, the commercial aviation industry is set to continue on the growth path it followed in 2012. As always, commercial aviation remains sensitive to any – often unforeseeable – major negative events in the world. In recent history, airline results were depressed by the consequences of unforeseeable events such as natural disasters, economic shocks, (threat of) diseases, political unrest and acts of terrorism. Different local circum-stances will determine the results of airlines in the various regions of the world, and consequently, for example, the Middle East seems more positive compared to the prospects for Western Europe. IATA expects a slight increase in global traffic in RTK from 3.2% growth in 2012 to 3.7% in 2013. The traffic growth might therefore slightly exceed the 3.4% capacity growth. The Middle East airlines will once more be the growth champions with a 12.3% RTK increase, almost double the expected increase in Latin American traffic, the number two region. Asia/Pacific and Africa are forecast to grow by 4.4% and 6.2%. Europe will only achieve a 2.2% increase, while North America remains stagnant at 0.4%.
In terms of net results, the global airline result is expected to grow from US$6.7 billion in 2012 to US$8.4 billion in 2013. North America might outperform all other regions, with a 2013 collective profit of US$3.4 billion, closely followed by Asia/Pacific’s US$3.2 billion. The Middle East and Latin America are projected to show a US$1.1 billion and US$0.7 billion, respec-tively. Europe and Africa should be satisfied with break-even results. Fuel price development will be a major determinant for airlines’ financial results. Over the last two years jet fuel was relatively expensive, but it seems airlines are more capable of dealing with this than in the past. One of their ways of coping with high fuel prices is by maximising the load factor of each flight and it appears that airlines are increasingly successful in achieving this.

76
DVB Bank SE | Group Annual Report 2012
Aviation Finance
The Boeing 777-300ER will remain unchallenged in the long-haul segment below the A380 and Boeing 747. While the launch of a “simple stretch” Boeing 787-10X seems close as an answer to the A330-300, the Boeing 777X may stay under wraps for some time to protect sales of the 777-300ER. For both the Airbus A380 and the Boeing 747-8 it is questionable if they can achieve any substantial sales volume in 2013.
For Bombardier, 2013 will be an exciting year as its “make-or-break” aircraft, the CSeries, is scheduled to make its first flight. While the type has already achieved a respectable sales volume, it still needs a few breakthrough orders. After a promising start to 2013, Embraer’s main challenge will be to continue selling the “old” E-Jets as customers may shift focus on to the second-generation E-Jets, scheduled to enter service in 2018.
Despite optimistic sounds from some leasing companies, DVB believes that the market for used aircraft will remain challenging. The “last-off-the-line” effect may become noticeable for various aircraft types, resulting in the steepening of value curves. Only with the entry into service of the new generation aircraft do we expect a “reset” of this. Under influence of the high fuel price, smaller aircraft such as the Boeing 737-700 and Airbus A319 may struggle to find new operators and demand shifts to the larger 737-800 and -900ER as well as the A320 and A321, respectively.
For (nearly) new aircraft, funding seems to be becoming less of a problem, although for some carriers the increased cost of ECA facilities, resulting from the new Aircraft Sector Understanding, may become painful. The capital markets are expected to offer some innovative products and should gain market share for selected carriers. Equity investors seem to have discovered aircraft leasing as an attractive investment target and no short-age of lessor-funding is anticipated, at least for the established leasing companies. The used equipment market is likely to continue to struggle for debt funding, which in itself already has a negative influence of values and lease rates.
More and more airlines apply other yield optimisation techniques as well. There seems to be a further split in business models. On the one hand short-haul carriers increasingly apply lessons learned from the low-cost carriers (LCC), such as the unbundling of services. Price elasticity for ticket prices is high, but passen-gers seem relatively insensitive to surcharges for luggage or in-flight services, for example. On the other side of the spectrum, especially the Middle East carriers gain market share by offering a long-haul premium product. There is a risk that traditional (European) flag carriers will be caught in the middle between LCCs on the short-haul and the Middle Eastern carriers on the long-haul.
It is difficult to be optimistic for the air cargo market, with no tangible signs of improvement. The problems may only be partially cyclical: unfortunately, some may be structural.
We expect the market for commercial jets to remain strong, although – given the already high backlog – a slowdown in ordering may materialise. In the single-aisle segment, the current generation of Airbus A320 and Boeing 737 aircraft are almost sold out although both manufacturers will need to continue to manage their “delivery skylines” should airlines defer deliveries or cancel orders. The order backlog for the Airbus A320neo and Boeing 737 MAX is also substantial: production lines are fully booked for many years, although for strategic orders open slots can almost always be found. With first flights for either plane not expected in 2013, the industry will have to wait to see if the promised efficiency gains and equipment reliability in terms of maintenance cost will be realised. While the technological risk remains, the market risks for both new aircraft seem to be low.
In the widebody market, much will depend on Boeing’s ability to turn the Dreamliner into a reliable trouble-free production tool for the airlines. In the unlikely scenario that present problems persist for a prolonged period, the A330 will probably be the main beneficiary. The interesting situation has arisen that Airbus can now offer a very capable and mature A330-300 to the airlines as an alternative to the advanced but troubled 787. In addition it may well be expected that Airbus will consider offering its mature product for a very competitive price, while the Boeing 787 – because of significant cost overruns – can only be proposed as a premium product. Airbus’ own “Dreamliner”, the A350XWB, is scheduled to make its first flight in 2013 and it will be a major achievement if this equally complex aircraft can remain on its current schedule.

77
DVB Bank SE | Group Annual Report 2012
T HE C OMPA N Y F IN A NCI A L A ND EqUI T Y M A RK E T S GROUP M A N AGE M E N T R E P OR T C ONSOL IDAT E D F IN A NCI A L S TAT E MEN T S
Aviation Finance
Aviation Finance – Portfolio outlook 2013
DVB remains among one of the few consistently active players in global air finance. Many European banks continue to be challenged by the consequences of the economic and financial crises, as well as US dollar liquidity pressure: as a result, many of our traditional competitors have withdrawn from the market or are no longer playing a leading role. Against this, we have seen a growing interest in aircraft financing from some new, less experienced institutions, in particular from a number of Japanese banks, and some Asian and Australian banks, lured to aircraft finance by the expectation of a more favourable “risk-versus-reward” balance. The tendency of such new entrants will, however, be a “flight-to-quality”, and as such, competitive pressure on pricing and other terms will be limited to certain client/equipment combinations only, most of them away from DVB’s core franchise. The result is that in some segments of our Structured Asset Financing activity, competition will remain limited.
In general, we do not expect there to be any shortage of liquidity to finance the new aircraft delivery requirements, though we will see more of a level playing field given a very significant increase in the cost of export credit agency-supported debt, which should drive more borrowers to consider what is on offer in the commercial banking market. More specifically, liquidity should remain rather abundant for the US airlines and the “public lessors”, in view of a sustained interest from the US capital markets. We do, however, expect there to be continuing funding challenges in the used/second-hand equipment market, all the more so given the now evident current oversupply situation in the narrowbody market, which is manifesting itself in “soft” value and lease rents for used aircraft. In general, we view this as an opportunity for DVB, given that the used equipment market (and the assessment thereof) is a core activity and strength of Aviation Finance.
DVB continues to experience a healthy level of demand for its risk capital and services. The need to carefully select how Aviation Finance will deploy its resources will be a continuing theme in the year ahead. Making the right decisions, particularly on where and how to deploy risk-weighted assets, will be the key to achieving another profitable period. Aviation Finance has assembled a team that boasts a wealth of experience and multi-disciplined backgrounds; in short, a team which is more than capable of ensuring that good decisions will be made and deliv-ering on a promise of performance.
We have long maintained that a market of uncertainty is a market of opportunity for a specialised institution such as ours, with the excellent results that we have achieved in the last years being proof of this. In view of our highly asset-focused approach, we believe that we are better positioned than most of our competitors to support our aviation client base. The Bank will be open for business throughout 2013 and beyond, but will use its deep knowledge of the underlying assets to avoid hidden risks often seen in transactions. Our cycle-neutral approach, allied to a discipline that balances commercial pressure with the requirement to maintain a quality portfolio, will be the key ingredients to ensure that Aviation Finance enjoys continued success.
As mentioned, current demand for the Bank’s capital and services is good. We relish, not fear, competition: based on its broad market coverage, strength of client relationships and track record, DVB is confident in its ability to maintain the momentum which has seen the Aviation Finance portfolio more than double in size over the last seven years. In its Structured Asset Financing activity for 2013, Aviation Finance expects to continue to grow its portfolio, whilst maintaining the quality of loan assets, and without compromising the risk-reward ratio. The average loan margin of such business may stabilise, possibly reduce somewhat, based on the expectation that recent cost of liquidity improve-ments will be maintained. At the same time, we are confident of an increasing level of demand for our aviation services, most notably advisory and asset management. Our strong reputation in these activities is evenly distributed over all segments of our core market: airlines, lessors and investors alike.
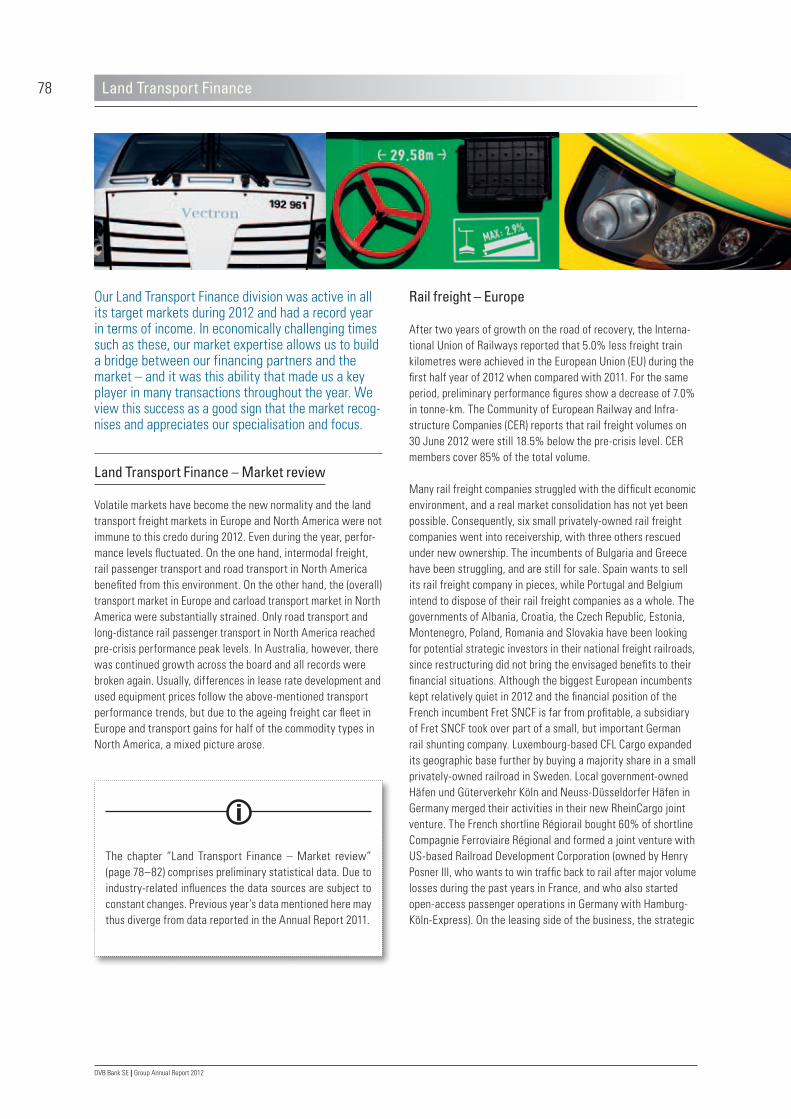
78
DVB Bank SE | Group Annual Report 2012
Land Transport Finance
Rail freight – Europe
After two years of growth on the road of recovery, the Interna-tional Union of Railways reported that 5.0% less freight train kilometres were achieved in the European Union (EU) during the first half year of 2012 when compared with 2011. For the same period, preliminary performance figures show a decrease of 7.0% in tonne-km. The Community of European Railway and Infra-structure Companies (CER) reports that rail freight volumes on 30 June 2012 were still 18.5% below the pre-crisis level. CER members cover 85% of the total volume.
Many rail freight companies struggled with the difficult economic environment, and a real market consolidation has not yet been possible. Consequently, six small privately-owned rail freight companies went into receivership, with three others rescued under new ownership. The incumbents of Bulgaria and Greece have been struggling, and are still for sale. Spain wants to sell its rail freight company in pieces, while Portugal and Belgium intend to dispose of their rail freight companies as a whole. The governments of Albania, Croatia, the Czech Republic, Estonia, Montenegro, Poland, Romania and Slovakia have been looking for potential strategic investors in their national freight railroads, since restructuring did not bring the envisaged benefits to their financial situations. Although the biggest European incumbents kept relatively quiet in 2012 and the financial position of the French incumbent Fret SNCF is far from profitable, a subsidiary of Fret SNCF took over part of a small, but important German rail shunting company. Luxembourg-based CFL Cargo expanded its geographic base further by buying a majority share in a small privately-owned railroad in Sweden. Local government-owned Häfen und Güterverkehr Köln and Neuss-Düsseldorfer Häfen in Germany merged their activities in their new RheinCargo joint venture. The French shortline Régiorail bought 60% of shortline Compagnie Ferroviaire Régional and formed a joint venture with US-based Railroad Development Corporation (owned by Henry Posner III, who wants to win traffic back to rail after major volume losses during the past years in France, and who also started open-access passenger operations in Germany with Hamburg-Köln-Express). On the leasing side of the business, the strategic
Our Land Transport Finance division was active in all its target markets during 2012 and had a record year in terms of income. In economically challenging times such as these, our market expertise allows us to build a bridge between our financing partners and the market – and it was this ability that made us a key player in many transactions throughout the year. We view this success as a good sign that the market recog-nises and appreciates our specialisation and focus.
Land Transport Finance – Market review
Volatile markets have become the new normality and the land transport freight markets in Europe and North America were not immune to this credo during 2012. Even during the year, perfor-mance levels fluctuated. On the one hand, intermodal freight, rail passenger transport and road transport in North America benefited from this environment. On the other hand, the (overall) transport market in Europe and carload transport market in North America were substantially strained. Only road transport and long-distance rail passenger transport in North America reached pre-crisis performance peak levels. In Australia, however, there was continued growth across the board and all records were broken again. Usually, differences in lease rate development and used equipment prices follow the above-mentioned transport performance trends, but due to the ageing freight car fleet in Europe and transport gains for half of the commodity types in North America, a mixed picture arose.
The chapter “Land Transport Finance – Market review” (page 78–82) comprises preliminary statistical data. Due to industry-related influences the data sources are subject to constant changes. Previous year’s data mentioned here may thus diverge from data reported in the Annual Report 2011.

79
DVB Bank SE | Group Annual Report 2012
T HE C OMPA N Y F IN A NCI A L A ND EqUI T Y M A RK E T S GROUP M A N AGE M E N T R E P OR T C ONSOL IDAT E D F IN A NCI A L S TAT E MEN T S
Land Transport Finance
investor Macquarie European Rail Ltd, a subsidiary of Macquarie Bank Ltd, agreed to acquire the European rolling stock leasing business of Lloyd’s Banking Group. The relatively small Germany-based freight car lessor ODIN Logistics AG as well as locomotive lessor and manufacturer Gmeinder Lokomotivenfabrik GmbH became insolvent. So far only the latter was able to start anew – as Gmeinder Lokomotiven GmbH – under the ownership of another rail equipment manufacturer. Four new, (and still small) loco-motive leasing companies were established during 2012. Also on the manufacturing side, Astra Rail Industries SRL, a company belonging to German private investor Thomas Manns, bought the Romvag, Astra Vagoane Marfa and Meva (all Romania-based) freight car manufacturing facilities from the insolvent Interna-tional Railway Systems, formerly the largest freight car manu-facturer in Europe. Russian government-owned OAO Uralvagon-zavod expressed interest in purchasing the two French-based ABRF Industries freight car factories. Indian freight car manu-facturer Titagarh Wagons Ltd acquired full control over France’s AFR Titagarh after obtaining the remaining 10% of the shares. With regard to locomotive manufacturing, the two largest diesel locomotive builders in Europe (Vossloh and Voith) are for sale.
The recession in Europe and the declining rail freight volumes were reason enough for a sustained and healthy aversion to placing (speculative) orders. Planned standard gauge freight car deliveries decreased by 10.9% to 4,866 units, still down 60.4% from 2008’s record year and down 68.7% from replacement needs based on an average economic lifetime of 40 years. New loco-motive deliveries also lagged behind, with 318 in 2012 (28.9% less than in 2011 and 56.3% less than 2009’s record level). Only 35 of them were destined for leasing companies.
Rail freight – North America
Carloads declined due to fewer shipments of coal and grain, but intermodal transport was thriving – that describes US rail traffic in 2012. The Association of American Railroads (AAR) reported that combined North American rail volume for 2012
on 13 reporting US, Canadian and Mexican railroads totalled 19,440,940 carloads (down 1.9% from 2011), and 14,459,909 trailers and containers (up 4.2% from 2011). Measured in tonne-miles, the US rail freight performance decreased by 1.5% to about 1,703 billion, which is 4.2% below the 2008 all-time peak level. In the US, total carloads decreased by 3.1% and were still down 14.7% from the 2006 record level. For every month in 2012, year-on-year US rail carloads would have increased if coal carloadings had not decreased by 10.8% (and only accounted for 41% of US rail carloads), due to mild weather and the trend towards natural gas-powered energy plants. However, the booming exploration of natural gas from shale fracking in the US and the expanding oil sands drainage in Canada bring plenty of new business opportunities in the form of sand, chemicals, gas, oil and pipe transport by rail.
Although total US intermodal volume (containers and trailers) fell short of the record year 2006 by just under 0.1% in 2012, container volume on US railroads easily set a new annual record in 2012. The average US rail system velocity increased, while terminal dwell time decreased – hinting at less freight cars being needed. And indeed, the AAR reports that the number of freight cars in storage increased from 273,390 on 1 January 2012 to 317,223 (equalling 20.7% of the North American freight car fleet) on 1 January 2013.
According to Rail Theory Forecasts, 58,904 new freight cars were delivered in 2012 (up 24.1%). 835 locomotives were built for the North American market in 2012, 5.6% more than in 2011. 48 of them went to leasing companies. Five shortline railroad conglomerates were on shopping tour again, buying a total of eight shortlines in the US. Conglomerate Genesee & Wyoming Inc. acquired its peer RailAmerica Inc. with its 45 railroads and infrastructure. Only three railroads had to restructure; two of them ended up with a new owner. Regarding rolling stock manu-facturers, locomotive maker Electro-Motive Diesel (EMD) entered the market for passenger locomotives again. GE Transportation and Progress Rail Services produced, according to them, the

80
DVB Bank SE | Group Annual Report 2012
Land Transport Finance
towards offshore manufacturing. All future locomotives for the Australian market are to be manufactured by the company’s long-standing partner EMD at one of its new low-cost overseas facilities.
On 1 July 2012 the Federal Government’s carbon tax came into play: it provides the trucking industry with a two-year moratorium, but might cost Australian railroads AUD110 million annually according to ARA. CBH Group officially launched the first dedi-cated grain rolling stock fleet in Western Australia in over 30 years. In response, the Western Australian Government announced that the state’s Tier 3 grain railway lines that were due to close at 31 October 2012 would remain open for another year.
In a world premiere, Rio Tinto announced it will invest US$518 million for an automated long-distance rail network in the Pilbara region, with the first driverless train to be launched in 2014. Rio Tinto’s trains are amongst the longest and heaviest trains in the world.
Passenger rail – Europe
The International Union of Railways reported 1.7% less passenger train-km in the EU for the first half year of 2012 compared with 2011. For the same period, preliminary performance figures show a decrease of 0.9% in passenger-km. Again, some more open-access operators entered the market, but two German railroads were left without any operations after their franchises expired. One Italian open-access operator and one German
first Tier 4 main line diesel locomotives, with more deliveries planned by other manufacturers. However, the real adherence to the Tier 4 norm still has to be certified. The stricter Tier 4 particle emission requirements will apply to newbuild locomotives as from 2015.
Rail freight – Australia
In the financial year 2011/2012 (ending on 30 June 2012), Australia’s largest infrastructure manager Australian Rail Track Corporation (ARTC) reported a year-on-year increase of 13% to 62.3 billion gross tonne-kilometres on the interstate network. Grain volumes were up by 31% and steel was up 5.2%. On ARTC’s Hunter Valley coal network in New South Wales, 11% more coal was transported to the port of Newcastle.
On the freight car side, 5,808 units were built in 2012 (11.9% less than during the record year 2011), most of them to transport coal or iron ore. Also, a record number of 217 locomotives were built, an increase of 64.4% on 2011. US-based National Railway Equipment Co. introduced two new locomotive models to the Australian market. SCT Logistics officially took possession of ten diesel locomotives manufactured by China Southern Rail (CSR), the first non-American engine powered heavy-haul locomotives to enter the Australian rail market. Subsequently, freight car manufacturer Bradken took delivery of two CSR-built locomotives for its new leasing business, with another two under construction. Downer EDI Ltd announced that it would cease building loco-motives in Australia. This is certainly indicative of the rising trend
100,000
80,000
60,000
40,000
20,000
0
46,292
2004
67,202
2005
77,000
2006
63,156
2007
60,000
2008
21,150
2009
16,600
2010
47,465
2011
58,904
2012
42,000
2013f*
US freight car deliveries
Units
* 2013 figures forecasted Source: Rail Theory Forecasts (January 2013)

81
DVB Bank SE | Group Annual Report 2012
T HE C OMPA N Y F IN A NCI A L A ND EqUI T Y M A RK E T S GROUP M A N AGE M E N T R E P OR T C ONSOL IDAT E D F IN A NCI A L S TAT E MEN T S
Land Transport Finance
Passenger rail – North America
For the second year in a row, the American Public Transportation Association recorded a ridership increase across the board in the US. Between January and September 2012, subway ridership was up 3.6%; for light rail (streetcars and trolleys) it was up 4.2% and for commuter rail up 2.4% over the same period in 2011. Amtrak carried 31.2 million passengers (+3.5%) in its 2012 fiscal year that ended 30 September 2012, the most the railroad has ever carried since its creation in 1971. In 2012, a recent record of 852 trainset cars and coaches (subways included) were deliv-ered in North America, 59.3% more than in 2011.
Road freight – Europe
According to the International Road Transport Union, road freight volumes declined by 0.5% to 13,478.1 million tonnes in the European Union in 2012, a level still 21.4% below the pre-crisis peak of 2007. The European Automobile Manufacturers’ Associ-ation (ACEA) reported that demand for new trucks decreased by an overall 9.1%, to 285,809 commercial heavier and longer heavy goods vehicles (HGV) in the EU. Regarding new heavy trailers, consulting group CLEAR expected the Western European market to fall slightly in 2012, while it forecasts a demand decrease of 11% for Eastern Europe after last year’s 58% growth. On the leasing side of the business, Ryder Europe, a subsidiary of the US-based Ryder System Inc., expanded again by taking over British lessor Euroway Group Ltd and its 1,400 HGVs. On the manufacturing side, many truckmakers have announced neces-sary restructurings to counter falling demand.
operator were successfully restructured under new ownership. A small Czech railroad had to cease operations, but some of its activities were taken on by a new company. The Dutch govern-ment had to bail out the Dutch high-speed line concession holder High Speed Alliance B.V. (95% NS Highspeed and 5% KLM) before even one of its troubled high-speed trains could run. Due to mistakes made by the British Department for Transport the tender process for the West Coast Main Line franchise failed, and all ongoing tenders were halted. French national incumbent SNCF was able to increase its share in internationally active Keolis to 70%. Keolis, in turn, took full control of Syntus, which was set back by lost franchises in the Netherlands. Veolia Envi-ronnement in France sold 10% of its 50% shareholding in Veolia Transdev to the other shareholder, Caisse des Dépôts.
Late rolling stock deliveries resulting from painstaking certifica-tion processes still plagued the whole manufacturing industry. That is the main reason why during 2012, only 721 standard gauge, non-high-speed trainsets were delivered as opposed to 829 in 2011 (–13.0%). Of all ordered trainset cars in 2012, a remarkable 40.0% was destined for non-incumbents such as leasing companies, public transport authorities who tender out for competition, and privately-owned railroads. A total of 478 standard gauge coaches (up 32.0%) were delivered, but hardly any of them were destined for non-incumbents.
New commercial vehicle registration in the EU (>3.5 tonnes) Units
500,000
400,000
300,000
200,000
100,000
0
2003 2004 2005 2006 2007 2008 2009 2010 2011 2012*
Western Europe New EU members Source: ACEA (January 2012)*2012 figures provisional
18,410
349,970
26,300
371,010
26,300
360,490
41,211
403,268
56,367
410,532
66,728
409,783
25,219
257,205
29,932
249,246
46,830
299,252
44,699
273,191

82
DVB Bank SE | Group Annual Report 2012
Land Transport Finance
Land Transport Finance – Strategy
Our internationally unique Land Transport Finance platform forms a solid base for our leading market position. Our business model encompasses research, advisory and financing activities on the international transport markets, specifically Europe, North America and Australia. Our Land Transport Finance team is a competent and flexible player in these regions. Once again, in 2012 we were one of the few financiers that consistently supported market participants. This strategy has proven very positive for our clients and for the Bank.
Our Transport Finance franchise has a clearly-defined strategic position. We focus on our strengths, relying on material asset-finance principles as matter of course. The following aspects are derived from our business model and represent key success factors, both individually and in combination with each other:
Against this background, thanks to the close co-operation and persistent dialogue with our clients and the continuous closing of optimal financing structures, Land Transport Finance again received an international award in 2012, from Global Transport Finance magazine, as “Rail Finance Innovator”.
Road freight – North America
The American Trucking Associations’ advance seasonally adjusted For-Hire Truck Tonnage Index, indicating the transport performance carried out by trucks run by its member companies, increased in 2012 with an average monthly growth of 2.4% to about 5.5% above record year 2006. According to automotive data and marketing provider R. L. Polk & Co., 407,904 commercial new self-propelled vehicles were registered for Gross Vehicle Weight (GVW) Class 3–8 in the US during the first nine months of 2012. This is an increase of 18.6% over 2011. Companies involved in the rental/leasing of vehicles formed 21.0% of the buyers, against 17.6% year-on-year. In Canada, new registrations of the same truck categories showed an increase of 16.0%. At the end of the first half of 2012, new registrations were the best of any six-month-period in Canadian history. Between December 2011 and September 2012, the total US commercial vehicle population grew slightly by 0.7%, and in Canada by 6.8%, according to R. L. Polk & Co. In the first nine months of 2012, a total of 489,415 commercial vehicles changed ownership in the US – i.e. 24.7% less than during the record year 2011 – thereby reflecting a shortage of clean used commercial vehicles. Used truck prices were able to hang onto positive territory, according to ACT Research. This company also stated that 2012 ended with about 232,664 GVW Class 8 truck orders (up 23.9% year-on-year), which is a record since 2007, except for 2011. New com-mercial trailer (24 feet or longer) registrations were up 11.4% to 162,277 units in the first nine months of 2012, according to R. L. Polk & Co. The divestment of chassis fleets by shipping lines to leasing companies continued in 2012.
Internal factors Market factors
• theflathierarchywithinDVB,
which allows for short and direct
decision-making processes;
• theflexibilityandabilitytoquickly
act on the markets we cover;
• theconservativeriskapproach,
which benefits us considerably
for credit assessment and in
managing our exposures;
• thedetailedandprofound
knowledge of markets, financed
assets, clients, trends and current
and expected transport asset
value developments;
• theconsistent,reliable
responsibility taken by the
Land Transport Finance team
for each transaction;
• ourcommitmentandcreativity
in structuring transactions for
clients;
• thecostdisciplineandcareful
consideration given to the
relationship of risk and returns.
• thecloseco-operationwith
DVB Corporate Finance and
Advisory, to optimise the range
of products and services we offer
to our clients.

83
DVB Bank SE | Group Annual Report 2012
T HE C OMPA N Y F IN A NCI A L A ND EqUI T Y M A RK E T S GROUP M A N AGE M E N T R E P OR T C ONSOL IDAT E D F IN A NCI A L S TAT E MEN T S
Land Transport Finance
We fully appreciate the increasing maturity of our markets. We recognise the growing cyclicality of the sector segments, and thanks to our research we are able to ascertain where opportu-nities lie therein. Our clearly defined asset finance set-up, and our cycle-neutral strategy, have yielded good results over the past years. The continuity of our market approach has paid off.
We see good opportunities in the markets we cover, which have their own particular challenges. We feel well-prepared for the future, which we will master with flexibility and broad-based know-how. Against this background, we are confident that we will continue to command a prominent position in the Land Transport Finance markets – to the benefit of our clients as well as our business potential, the diversification of our portfolio and our risk exposure, and ultimately, for our profitability.
Extending our business coverage to Australia also turned out to be a successful move. We are thus active on three mature markets globally – a setup which we want to adhere to over the years to come, since the sometimes-diverging momentum in these regions further helps to diversify our portfolio.
Our relationship managers in Frankfurt and New York success-fully pursued new business opportunities, and supported clients throughout the year. Our clients and financing partners continued to appreciate our specialist focus on asset finance and related services, such as M&A advisory services, research, or raising finance on the capital markets. In doing so, our focus on primary and secondary debt markets once again paid off. Our clients value the commitment of all team members in the markets we are active in, which translates into a real competitive advantage for us. Close communication with our clients is the key to winning business – not just big tickets, but also smaller-sized transactions which are by no means less relevant. Our Land Transport Research supports each lending and risk decision both strategically and operationally, a backing that has been important to the success of transactions, time and again. In the context of key projects, our Research unit also contributes market analyses directly to clients.
The co-operation with DVB’s in-house service providers – partic-ularly DVB Corporate Finance – is a success factor that is growing in importance. We are evaluating how we can leverage advisory services to further expand the scope of our product range and client coverage in all core regions, in line with our strategy. Having explored new approaches to our business throughout the year under review, we took on board several very promising projects that will serve as examples for originating new business in the years ahead. Going forward, we will maintain our basic structure comprising two Land Transport Finance teams located in Frankfurt and New York.
The underlying principle for any decision is to follow our clients in their existing business, and to support them in exploring new areas of business. We will continue to adhere to the key principles of asset finance. Unlike some of our competitors, we do not indulge in erratic strategy changes – an approach that allowed the team to achieve a particularly successful year. When compet-ing against other banks or financial institutions, we regularly won business through pure competence, as opposed to competing on pricing.
Land Transport Finance – Mission Statement
We value our client relationships highly. The goal is to increase our client franchise as the leading rail asset financing partner in our core regions. Based on our
• uniqueunderstandingofthemarket,• focus,• continuouscapacitytoexecutetransactions,and• flexibility,
we offer added value by
• advisingonintelligentassetfinancesolutions;and• takingonappropriateriskpositionsthatcapitaliseonthe
cyclical nature of the underlying sectors.

84
DVB Bank SE | Group Annual Report 2012
Land Transport Finance
market use of the assets we finance. Through asset collaterali-sation, we endeavour to minimise exposure to political risks in our transactions; against the background of the persistent sovereign debt crises in Europe and the US, this is a strategic element of our work.
During 2012, Land Transport Finance generated business in the respective regions from our well-established core client base, as well as from new target clients. Bank partners appreciated our sector expertise and risk evaluation competence for large-volume fleet financings; in several instances, our contribution was the only way to conclude large-sized loans. We were active in selecting and involving partner banks for large-volume trans-actions – together with our Financial Institutions team – and in assuming agent roles. Whilst we focused particularly on the primary market, we were able to acquire a loan from another bank on the secondary market.
Advisory Services
Advisory services were a key element of our success during 2012, especially given strategic opportunities for acquisitions which arose in the market segments we cover. Some clients saw the combination of lending and capital markets placements as an attractive combination. Clients sought our expert advice, espe-cially for debt raising, restructurings, balance sheet optimisation, sale-and-lease-back structures, and mergers & acquisitions. Our key clients invited us to take part in their decision-making processes. In this context, we submitted several concrete pro-posals for purchase or disinvestment of asset fleets, as well as on strategic expansion plans through potential acquisition of either corporate targets or rolling stock fleets. This enabled us to win a mandate for an M&A transaction.
We closely co-operated with the expert teams at DVB Capital Markets and DVB Corporate Finance – a collaboration that truly is offering excellent prospects. Accordingly, a very successful capital markets issue was placed during the course of the year, and we discussed additional proposals for similar transactions with clients. We expect to generate more business through this co-operation in the future.
Land Transport Finance – Products
Without doubt, asset-based financing plays the most important role in our Land Transport Finance business, as part of our core Structured Asset Financing product. In this context, advisory services are becoming ever more important, a trend that was clearly visible during the year under review. Our two teams, based in Frankfurt and New York, advised important clients
• on structuring or optimising the financings of their investments;
• as well as, in co-operation with our colleagues from Advisory/ DVB Corporate Finance,
– on M&A transactions for the purpose of regional expansion, or for strategic acquisition of fleets or target companies; and
– on capital market placements.
As always, Land Transport Research also offered detailed market assessments within the Bank, and to external parties in 2012.
Structured Asset Financing
The key element in our asset-based financing business is lending, collateralised by rolling stock assets that are evaluated at market prices. Our activities in the Land Transport Finance markets in Europe, North America and Australia span the freight and pas-senger sectors in rail markets. In this area we offer a variety of financing structures, be it of a shorter nature (such as bridging facilities) or complex, structured mid- to long-term asset financing solutions – all collateralised by the underlying fleet. In order to devise the optimal credit process for individual needs, we show flexibility in choosing specific structural elements, in co-operating with reliable partners contributing beneficially to the transaction’s economics or individual risk elements, and in incorporating alternative approaches to make transactions happen in the best possible way. In many instances, we are approached regarding the assumption of residual value risks, for which we are delighted to make quotations. Various financings are concluded as non-recourse transactions (i.e. with no recourse to a sponsor). The pivotal aspect of all our considerations is the potential secondary-

85
DVB Bank SE | Group Annual Report 2012
T HE C OMPA N Y F IN A NCI A L A ND EqUI T Y M A RK E T S GROUP M A N AGE M E N T R E P OR T C ONSOL IDAT E D F IN A NCI A L S TAT E MEN T S
Land Transport Finance
Asset & Market Research
Land Transport Research is a crucial contributor to the Bank’s transport asset finance activities, as well as to internal decision-making processes. Land Transport Research provides consistently high-quality and independent research. It reports directly to the Chief Executive Officer and Chairman of the Board of Managing Directors. This makes DVB unique in its business model and market position, and is a core element of our asset financing strategy.
The main focus of Land Transport Research is the assessment of all rail and road asset markets and technology, on valuations for the transport assets involved, as well as the analysis of underlying trends and regulatory requirements, to the extent that these have an influence on the valuation and liquidity of the transport assets we finance.
Land Transport Research prepares fundamental risk assessments, analyses of market segments, valuations, forecasts, and market opinions for internal use within the Bank. Furthermore, research results are incorporated into the Bank’s risk strategy, through asset valuations and risk data for the rail and road transport markets.
Externally, Land Transport Research regularly supports our core clients with market analyses which play an important role, pro-viding the basis for their strategic corporate decisions. We have a strong reputation for our market expertise amongst market players. During the year under review, the Head of Research contributed articles to relevant trade publications (for example, in the March 2012 edition of “Privatbahnmagazin”, a trade magazine focusing on private railway companies).
Land Transport Finance – Portfolio analysis
Our Land Transport Finance business developed very favourably indeed in 2012. During the year under review, Land Transport Finance was able to close twelve new transactions with a total volume of €519.6 million (2011: 13 transactions with a volume of €373.7 million) in Europe, North America and Australia. Oppor-tunities arose due to the need to refinance loans for rolling stock, and thanks to increased propensity to invest, especially in the North American and Australian rail markets. In addition, fleet owners had to continuously renew their rolling stock through replacement investments. Accordingly, our new business volume exceeded pre-crisis levels.
During 2012, new rolling stock investments were still below the levels seen prior to the ongoing economic crisis, particularly in Europe. The US, however, saw a marked recovery in new orders for freight cars, whilst in Australia, investment in locomotives continued. In this environment, fleet operators showed little readiness to sell portfolios, both for strategic reasons and in order to avoid selling at a discount. On this basis, we once again con-centrated on deals in the primary as well as secondary markets.
As in the previous year, the lending transactions we closed successfully were all secured by first-ranking collateral. This included bilateral loans and larger-sized credit facilities we arranged and participated in within the scope of club deals. We also entered into non-recourse transactions with special purpose entities and successfully structured solutions for operating leases. Within the scope of non-recourse transactions, we also took implied risk positions in the funded rolling stock ourselves. We co-operated with our colleagues at DVB Corporate Finance whenever possible: in this way we facilitated an M&A mandate

86
DVB Bank SE | Group Annual Report 2012
Land Transport Finance
Key Land Transport Finance deals during 2012 included the following:
• JointLeadArranger,StructuringBankandSecurityAgentfora €225.4 million facility to finance the purchase of 28 state-of-the-art passenger trainsets to be used in a regional pas-senger rail transport network in north-west Germany. The transaction was entered into with the leading European lessor of passenger trainsets and locomotives, within the framework of a non-recourse club deal. To our client, this transaction provided the opportunity to once again demonstrate its lead-ing position in the market.
• JointLeadArrangerofabankclubdealforEurope’sleadinglessor of standard railcars, as part of a €305.0 million long-term credit facility financing a diversified portfolio comprising approximately 9,900 freight cars of various types. The loan allowed the client to refinance a material part of its fleet, shifting the financing to a long-term structure.
and a capital markets placement. We worked closely with Land Transport Research regarding all transactions, jointly assessing the expected future value of the relevant transport assets, the specific features of the asset type, the current supply and demand situation, future market movements and external trends. These analyses also incorporated regulatory aspects and expected technical changes, since they also determine the potential for remarketing on the secondary market, as well as future lease rates.
Structured Asset Financing – Loan portfolio and income
Land Transport Finance was active in all our target markets throughout the entire business year. With respect to several transactions, our involvement was crucially important to clients as well as to financing partners, since our sector expertise enabled us to bridge the gap between financing providers and the market during times of economic uncertainty. To us, this was yet another signal that our specialisation and focus is being recognised and appreciated by the market. As in previous years, this helped us to maintain a special position towards our clients – more so, since several of our competitors were still looking to identify strategic concepts, endeavouring to find a sensible way to structure their client relationships.
Land Transport Finance had a record year again in terms of income. Income rose by a total of 20.9%, to €22.6 million. Net interest income after allowance for credit losses increased by 19.8%, to €15.1 million. The fact that no allowance for credit losses needed to be recognised for Land Transport Finance was particularly positive and noteworthy. Given the relatively low market cyclicality of rail assets, transactions in Land Transport Finance are generally exposed to lower risks than financings in the maritime shipping or aviation industries. Total allowance for credit losses in Land Transport Finance as at 31 December 2012 therefore amounted to a minimal €1.7 million. Moreover, net fee and commission income rose from €6.1 million to a new record level of €7.5 million. The segment result before taxes amounted to €19.4 million, a 25.2% increase on the 2011 result of €15.5 million.
Extract from Land Transport Finance’s segment report
€ mn 2012 2011 %
Net interest income 15.1 12.6 19.8
Allowance for credit losses 0.0 0.0 0.0
Net interest income after
allowance for credit losses 15.1 12.6 19.8
Net fee and
commission income 7.5 6.1 23.0
Income (before IAS 39) 22.6 18.7 20.9
General
administrative expenses1) –3.2 –3.2 0.0
Segment result before taxes 19.4 15.5 25.2
1) Only those costs are allocated to DVB’s operating business divisions for which they are directly responsible. General costs of operations, overheads or, for example, IT costs are not allocated to the operating business divisions.

87
DVB Bank SE | Group Annual Report 2012
T HE C OMPA N Y F IN A NCI A L A ND EqUI T Y M A RK E T S GROUP M A N AGE M E N T R E P OR T C ONSOL IDAT E D F IN A NCI A L S TAT E MEN T S
Land Transport Finance
• JointLeadArranger,JointBookrunnerandSyndicationAgentfor a US$700.0 million financing, comprising an amortising loan and a standby facility for a US freight car lessor. The transaction was used to refinance, optimise and expand an existing facility, and also permitted the merging of several freight car fleets within the group.
• Sole lender in a bilateral bank loan financing all 2012 deliveries of new diesel freight locomotives, worth €18.5 million, for one of the biggest private freight railway operators in Western Europe. The loan allowed this new client to sensibly expand its existing financing structure, independently of the client’s parent entity.
• US$200.0millionlimited-recoursecreditfacilityforawell-positioned US freight car manufacturer and lessor, to refinance 2,670 new tank and bulk freight cars. We were the biggest lender within this transaction.
Besides rail transactions, we were particularly successful with respect to intermodal container chassis, a segment that is very closely related to the international sea container trade. Growth in this market sector contributed well to further diversifying the Land Transport Finance portfolio, which is structured by transport asset type, region, borrower, manufacturer, etc. 69.1% of new deals closed accounted for financings of new or used freight cars. As in previous years, these are the backbone of the rail transport sector, which – in line with our strategy – continued to account for the lion’s share of the Land Transport Finance portfolio. 16.7% of the new transactions related to financing container chassis. Overall, the share of road transport financings in DVB’s portfolio declined due to higher repayments compared to new business originated. 7.2% of new business volume related to passenger trainsets, directly reflecting the rising importance and momentum of this growing European rail transport segment. The remaining new business consisted of financings for loco-motives, which provide a material contribution to a modern, forward-oriented and efficient rail market.
The European rail portfolio accounted for 54.9% of new business, followed by 45.1% for North American clients. Thanks to intensive market coverage, we were able to get another Australian rail-related financing ready for signing, for an existing client. The markedly higher share of loans granted outside Europe reflects the shift in global economic dynamics: despite the fact that it is not yet running at full steam again, the North American rail market was able to resume higher rolling stock investments – returning to pre-crisis levels – than European market segments. The Australian economy was once again relatively unaffected by the turbulence and uncertainty that beset the western markets during 2012, even though it was slowed by lower economic momentum in China.
The total volume of loans disbursed rose by €41.8 million, to a total of €1.7 billion (2011: €1.6 billion). Naturally, the regional shifts in new business originated also impacted on the portfolio overall. Loans to clients domiciled in North America accounted for 39.8% (up 1.7 percentage points year-on-year), whilst 55.8% of the lending exposure was to European clients (down 1.3 percent-age points year-on-year). Australia accounted for 2.7% of the portfolio – slightly lower year-on-year but still ahead of the slightly lower 1.7% share (down 0.3 percentage points) attribut-able to Latin American clients.
Europe 55.8%
North America 39.8%
Australia/Oceania 2.7%
South America 1.7%
Land Transport Finance portfolio by country risk

88
DVB Bank SE | Group Annual Report 2012
Land Transport Finance
In respect of the overall portfolio, 87.4% of the transactions (previous year: 86.5%) related to rail assets. 59.5% of the rail portfolio was attributable to the freight car (previous year: 59.6%). Not only is this high percentage unproblematic, it is in fact desired. Thanks to their granularity, freight cars are an asset class with an excellent risk profile and diversified in many ways: by borrower, lessee, rail car type, region and age profile. While being a rather “low-tech” vehicle without own propulsion or signalling equipment on board, the freight car as equipment and collateral has the extra benefit of operational and technical efficiency. This makes the asset class attractive, even under potential repossession or remarketing/redeployment perspec-tives, in the event of security enforcement. The portfolio share of regional passenger trainsets rose slightly, to 13.2% (previous year: 12.0%), whilst the share of locomotives remained unchanged at 12.9%. Although the market for road assets is still saturated in many segments by existing fleets, we succeeded in closing attractive deals in the chassis segment. Still, due to amortisations and repayments, the share of the road asset portfolio declined to 11.6% (previous year: 11.9%).
Due to some larger-sized transactions during 2012, the average lending exposure per client moved up to €33.1 million (previous year: €28.8 million). The addition of four new borrowers improved the diversification of the portfolio. The largest single exposure amounted to €125.6 million (previous year: €118.4 million), with ten clients (unchanged from 2011) having exposures in excess of €50 million. This raises no concerns in terms of elevated cluster risk.
On rail 87.4%
thereof:
59.5% Freight cars
13.2% Regional passenger trainsets
12.9% Locomotives
1.4% Passenger coaches
0.4% City/commuter traffic
On road 11.6%
thereof:
11.0% Road tractors and trailers
0.6% Tank containers
No longer in line with the Bank’s strategy 1.0%
thereof:
1.0% Terminals/logistics property
Land Transport Finance portfolio by asset type

89
DVB Bank SE | Group Annual Report 2012
T HE C OMPA N Y F IN A NCI A L A ND EqUI T Y M A RK E T S GROUP M A N AGE M E N T R E P OR T C ONSOL IDAT E D F IN A NCI A L S TAT E MEN T S
Land Transport Finance
On 9 August 2012, we closed a five year US$725.0 million senior secured loan for TRAC. With a commitment of US$125.0 million, DVB is the largest lender within the senior lender group and shares a Joint Bookrunner and Joint Lead Arranger role with JP Morgan, Merrill Lynch, Deutsche Bank and Wells Fargo. We are senior secured by a first priority lien in substantially all owned assets of TRAC including the well-diversified fleet of intermodal and domestic chassis. The LTV based on the chassis fleet collat-eral is reasonable and decreases over loan life.
TRAC was highly appreciative of our relationship and strong lending support in recent years and welcomed the capital markets advice provided together with DVB Corporate Finance. As a result and given our prominent role and commitment in the senior loan facility, we were able to secure a Joint Book-Running Manager role for DVB Corporate Finance/DVB Capital Markets LLC by means of a US$300.0 million high-yield bond, which was suc-cessfully placed before the closing of the senior secured loan. The seven-year bond is junior secured to the senior loan facility.
Structured Asset Financing – Deal of the Year 2012
TRAC Intermodal (TRAC) is the world’s largest provider of marine and domestic chassis operating throughout the United States (with a market share of 53%), Canada and Mexico. The company’s operations include long-term leasing, short-term rentals through extensive chassis pool programmes and pool/fleet management. At closing, TRAC’s active fleet consisted of approximately 185,000 marine and 63,000 domestic chassis. With 545 marine and 135 domestic rental terminals in the US (located at or close to railroad hubs), the company is well posi-tioned to leverage the trend towards chassis pooling and short-term per diem leasing.
Land Transport Finance – Deal of the year 2012

90
DVB Bank SE | Group Annual Report 2012
Structured Asset Financing – Risk management
98.9% of the Land Transport Finance portfolio is collateralised by assets; other collateral accounts for merely 0.2% of the total volume (previous year: 1.5%), while unsecured business was unchanged year-on-year, at 0.9%. There was little change to the risk situation in our target markets of Europe, Australia and North America in 2012.
Being acutely aware of risks is a material element of our work when entering into a transaction, as well as when monitoring existing loans. Our credit approval process, which may include up to three levels, includes an extensive analysis of each new exposure regarding the risk factors it may be exposed to. All potential new transactions are first discussed in weekly Deal Committee meetings, attended by the responsible member of the Board of Managing Directors, the entire Land Transport Finance team as well as Land Transport Credit and Land Trans-port Research. Transactions that are given the “green light” in these meetings are then finalised in negotiations with the client, and submitted to the entire Board of Managing Directors for approval. Where required by the Land Transport Finance policies and procedures, new transactions also need to be approved by the Supervisory Board’s Credit Committee. Decisions on new loans always require an independent opinion from Land Trans-port Research.
Furthermore, once a new transaction has been booked, the portfolio is constantly reviewed and categorised by risk class. In stages of increased risk relevance, the entire portfolio is run through the early warning system (with finance projects tagged green, amber, and red), with higher risk deals added to the Closely Monitored List, and ultimately – where and when required for critical transactions – put on the Watch List.
The risk levels within our portfolio – owing to the intrinsic stability of the land transport markets – are comparatively low; this was evident in 2012, too:
• Thanks to the tight and pre-emptive internal risk control management, the improved market environment and due to our well-considered appetite for risk, only a few clients were allocated to our higher risk categories.
• Onceagain,noallowanceforcreditlosseswasnecessaryforLand Transport Finance exposures as at year-end 2012.
• One small restructured deal was progressing well and improv-ing compared to the situation at the end of the previous year. This was due to the better leasing situation of the financed assets.
There were signs of a plateau forming in the rail transport seg-ment as a whole, with value increases in some asset sectors roughly offsetting losses in others. On average, the renewal lease rates for rolling stock leasing were only slightly lower than those for maturing transactions. Fleet utilisation rose again, providing grounds for hope that the market might have put the worst behind it. The situation concerning long-haul road transport generally stabilised, whereby the short-haul segment showed an oversupply of vehicles in some cases.
Land Transport Finance

91
DVB Bank SE | Group Annual Report 2012
T HE C OMPA N Y F IN A NCI A L A ND EqUI T Y M A RK E T S GROUP M A N AGE M E N T R E P OR T C ONSOL IDAT E D F IN A NCI A L S TAT E MEN T S
Land Transport Finance
Land Transport Finance – Outlook 2013 for the key land transport segments
2013 is likely to be a bridge year: a bridge to a faster-growing future. In the short term, however, the reality is sustained global economic weakness, and the question remains as to how long the bridge will be in the end. Hardly any transport price increases can be expected, except for North American and Australian rail-roads. Railroading will still be a lossmaking business for most of the railway companies in Europe. The largest of them will be able to offset their losses through passenger and/or logistics businesses. On a brighter note, Germany-based rail consultant SCI Verkehr expects the European rail market (which is still the largest in the world) to annually grow by 3.0% between 2012 and 2016, North American by 5.0% and Australian by 1.1%. About a quarter of the respective rail market investments will be in new rolling stock.
Rail freight – Europe
The governments of Belgium and the Netherlands expect conti-nental traffic to grow by up to 75% until 2025, and maritime traffic all along the North Sea port range by 130%, provided that expansion investments will be made in Europe’s rail and port infrastructures. Also the International Union of combined Road-Rail transport companies is convinced that the long-term growth rate of combined transport can return to an annual level of 6%–7%. The certification of a new type of brake blocks is expected to take place mid-2013. Therefore, as at 1 June 2013, the German infrastructure manager, DB Netze, plans to introduce a penalty for trains equipped with noisier cast iron brake blocks, with which most of the freight cars in Europe are equipped. The national infrastructure managers in Germany, Switzerland and the Netherlands will introduce bonus schemes for quieter freight trains.
The equipment manufacturers have to focus more on the rail passenger market as the planned deliveries of locomotives (2012: down 28.9% to 318; 2013: 210) and standard gauge freight cars (2012: down 10.9% to 4,866; 2013: 3,451 fixed ordered) will require even less of their production capacity in 2013. Of course, rolling stock refurbishers will profit from this situation.
Rail freight – North America
Provided the US Environmental Protection Agency (EPA) regula-tions do not change to the disadvantage of the coal plants again, and if there is not another record drought, an uneventful rise (at or near gross domestic product growth rate) can be expected for the rail freight performance. We forecast more traffic between Mexico and the US, due to the recent shift of outsourcing from Asia to countries which are less far away. So far only 456 new locomotives have been planned for delivery in 2013 (down 45.4% on 2012), but further orders can still be placed for delivery in 2013. However, there is a trend towards refurbishment and rebuilding of old locomotives, since it saves half the costs of a new locomotive. The prices of new locomotives rise every time new EPA emission regulations come into force (the next one – Tier 4 – is foreseen for 2015). Rail Theory Forecasts expects about 42,000 new freight car deliveries for 2013 (down 28.7% on 2012). The total backlog reported by manufacturers in January 2013 was about 60,000 freight cars.
Rail freight – Australia
As of January 2013, in a planned two-year transition period, the accreditation of railroads will gradually shift from the individual states to the newly-established National Rail Safety Regulator, which will make it easier for new railroads to enter the market – and for existing ones to be operational across the country. The Australian government expects the country’s rail freight to increase by 90% between now and 2030. In January 2013, IBIS-World projected a doubling of the rail freight performance as early as 2020, with revenue growth of 5.0% to AUD8.87 billion in 2012/2013. Due to infrastructure upgrades, it can be expected that rail’s poor market share of 20% on the Melbourne – Sydney – Brisbane corridor will significantly increase. Australian Rail Track Corporation expects coal performance on its Hunter Valley network to grow at least by 54% between now and the end of 2014. 56.2% fewer locomotives (for a total of 95 units) are planned to be built in 2013 after a record 2012, with a continued increase in the number produced by foreign manufacturers, especially from the US. On the freight car side, 2,216 units are already scheduled for delivery in 2013 (down 61.8% on 2012).

92
DVB Bank SE | Group Annual Report 2012
Road freight – Europe
Because of a modest expected gross domestic product growth of 0.6% in the EU for 2013, the International Road Transport Union expects a 0.7% increase in the road freight performance as well as 0.7% more new truck registrations. More hybrid and electric propelled vehicles will be used as light commercial vehicles for local and regional duties, but a definitive introduction of this technology into the heavy-haul business is not to be expected anytime soon.
Road freight – North America
The American Trucking Association predicted that freight tonnage will grow by 21% until 2023, with revenue rising by as much as 59%. It expects intermodal tonnage to rise by 6.2% per year between 2012 and 2017. Most, if not all, of the 15 shipping lines are likely to sell their intermodal chassis fleets. ACT Research expects used truck prices to remain strong, although to expect growth will be a stretch. Canada will probably adopt the green-house gas emissions standards for heavy-duty trucks that the US published last year and which Canadian officials had pro-posed originally. The Mexican government will probably tighten inspections, and lower maximum allowed weights.
Passenger rail – Europe
The rail passenger performance will depend primarily upon the development of employment in Europe, since a significant pro-portion of the population uses trains both for commuting and for leisure purposes. In that sense, we expect a fairly stable market. It will be interesting to see whether Spain’s state-owned railway company Renfe will indeed make an allocated fleet of 26 high-speed trains available for lease to new operators. In Germany, bus companies are now allowed to compete with railway com-panies on distances over 50 km. British passenger transport company National Express has reportedly bid on four franchise tenders in Germany for the first time, and other international companies have shown interest to bid for the operations of the commuter rail network in Berlin. The number of standard gauge, non-high speed trainsets scheduled for delivery is 828 (up 14.8%) in 2013, and at least 779 in 2014.
Passenger rail – North America
The use of passenger rail is closely linked to the development of fuel prices. A flat year can be assumed. After the discontinuation of luxurious and/or tourist long-distance trains just before and during the latest recession, six companies have been working on new initiatives in these segments. 735 trainset cars and coaches (13.7% less than 2012) have been planned for delivery in 2013, and 559 in 2014.
Land Transport Finance

93
DVB Bank SE | Group Annual Report 2012
T HE C OMPA N Y F IN A NCI A L A ND EqUI T Y M A RK E T S GROUP M A N AGE M E N T R E P OR T C ONSOL IDAT E D F IN A NCI A L S TAT E MEN T S
Land Transport Finance – Portfolio outlook 2013
Land Transport Finance has started the new year with a diversi-fied and promising transaction pipeline in all our core markets. On the basis of new business already identified, we anticipate attractive financing volumes for 2013, even though the propensity to invest in new rolling stock on the land transport markets remains cautious. Nonetheless, some strategically important transactions are on the horizon for the years to come. Structured Asset Financing will continue to be our core business. We also see good opportunities for advisory mandates, and for further capital market transactions.
According to our outlook for the land transport markets in 2013, we expect European asset finance demand to again emanate predominantly from anticipated orders for passenger trainsets, whilst the focus in North America is likely to be on refinancing larger freight car portfolios. Demand in Australia is primarily related to new traction stock as well as modern locomotives and efficient rail car fleets, especially for transporting natural resource materials.
We are generally optimistic with regard to the development of our high-quality portfolio, with rail assets set to remain the Division’s strongest pillar in 2013.
In spite of the persistent economic weakness in some of our markets, we do not anticipate any significant risks for our port-folio. Whilst income generated in the markets we cover is also under pressure, our business is supported by the inherent long-term stability of the land transport sector. Numerous operating lessors in North America and Europe were able to use slight recovery trends during 2012 to enhance their income, but land transport markets remain dependent upon global economic trends. Portfolio management remains a top priority in our busi-ness. We will continue with our policy of maintaining tight risk analysis, to avoid hidden risks in our business that may come to the surface as a consequence of the now clearly higher cycli-cality in our land transport markets. We expect the composition of the portfolio – regions, clients, market segments – to remain largely consistent at current diversification levels during 2013. Given the better economic outlook for North America and Australia, relative to Europe, it is fair to expect stronger economic momentum in these regions. We are thus confident that further increasing the portfolio shares in Australia and North America is both attractive and adequate.
Our long-term client relationships have proven to be very sustain-able in our business. Demand for lending and services provided within the scope of our Land Transport Finance platform will remain intact during the forecast period. We are in a favourable position; we enjoy an excellent market reputation, a good track record, and continue to retain a clear focus on our core business – factors which remain crucially important especially during challenging times. Therefore, we are convinced that we will be able to preserve our leading position in the market during 2013.
Land Transport Finance

94
DVB Bank SE | Group Annual Report 2012
Important deals 20121)
AAE Wagon Finance€305 mn Term Loan Facility for a diversified fleet of approx. 9,900 railcars of various types€80 mnJoint Lead Arranger in a Club Deal
DVB’s Aviation Asset Management21 commercial aircraft sold/leased,97 aircraft under managementin 2012
DVB’sAviation AssetManagement
AerCapSenior Debt4 x B737-800Co-Arranger & Co-ordinator
DVB’s Aviation Investment ManagementInvestment Advisor to equity funds owning 70 commercial aircraft,125 engines and 2 airline equity investments
DVB’s Aviation
InvestmentManagement
Alpha Trains€207 mn Senior Secured Term Loan for 28 Stadler EMUs €36 mnMandated Lead Arranger, Structuring Bank & Security Agent
DynacomSecured Term LoanUS$80 mn
DynacomTankers Management Ltd.
AvolonSenior Debt 1 x B777-300ERArranger
Epic Pantheon International Gas Shipping LtdMerger of Epic Shipping Holdings Ltd and Pantheon Inc.US$228 mn Recapitalisation Exclusive Financial Advisor & Lead Debt Arranger
AWASSenior Debt1 x A320-2004 x B737-800Arranger
Flagship Rail Services LLCUS$700 mn Senior Secured Term Loan/ Warehouse FinancingUS$152.8 mnJoint Lead Arranger, Joint Bookrunner, Mandated Lead Arranger & Syndication Agent
BOC Aviation Portfolio Financing 9 x new and used aircraft Arranger
Greenship Bulk/Jaccar HoldingSenior Secured Term Loan Facility4 x 63,200 dwt supramax bulkersUS$73.2 mnBilateral Lender
B u l k
Bourbon Offshore/OceanteamUS$147mn Facility2 x offshore construction vesselsUS$58.5 mnCo-Lead
Guggenheim Aviation PartnersOperating Lease Financing 11 x B757-300 Co-Arranger & Security Trustee
CDB Leasing/China Shipping Container LinesSale and Lease-Back FinancingFleet of 210,000 TEU maritime containersUS$358.6 mnArranger
Hawaiian AirlinesFinance Lease1 x A330-200 Arranger
DOF/Norskan & Brazil BNDESGuarantee/Top-up Facility1 x AHTS US$55 mnAgent, Sole Lender & Guarantor
Hurtigruten ASACorporate RecapitalisationNOK2.6 bn Senior Debt NOK500 mn Unsecured Norwegian BondJoint Lead Bond Arranger & Lead Debt Arranger
1) Unaudited information (not included in audit opinion)

95
DVB Bank SE | Group Annual Report 2012
T HE C OMPA N y F IN A NCI A L A ND EqUI T y M A RK E T S GROuP M A N AGE M E N T R E P OR T C ONSOL IDAT E D F IN A NCI A L S TAT E MEN T S
Important deals 20121)
Jackson Square AviationOperating Lease Financing1 x B737-800Arranger
Teekay Voyageur Post-Delivery Senior Secured Term Loan US$31.8 mn Mandated Lead Arranger
LOTFinancial Advisorywith respect to financing the first B787-8 delivery in Europe
ThenamarisPost-Delivery Financing2 x new building MR product tankersBilateral Lender
MASkargo Finance Lease 1 x A330-200F Arranger
Trac IntermodalSenior Secured Warehouse Facility &11.0% Senior Notes due 2019 US$1.025 bn Total Recapitalisation Joint Bookrunner & Joint Lead Arranger/ Joint Bookrunning Manager
Navigator Gas LLC/Navigator Holdings LtdUS$180 mn Fleet Financing 20-22,000 cbm semi-ref LPG tankersUS$60 mnCo-Arranger
Turkish AirlinesJapanese Operating Lease Co-Financing2 x B737-800Arranger
Seaborne Intermodal/ Lindsay Goldberg LLCUS$300 mn Senior Facility for the acquisition of a US$430 mn container box portfolio managed by Florens
uS AirwaysMixed-Market Financing2 x A321-200Arranger
Sovcomflot OAOSecured Term LoanUS$100 mnMandated Lead Arranger
Vega Offshore Equity Raise & Senior Debt Facility2 x PSVs and 2 x OSRVsUS$38.2 mn Exclusive Financial Advisor, Mandated Lead Debt Arranger, Agent & Lender
Stena LineSenior Secured Term Loan 4 x RoPax ferries€105.0 mnBilateral Lender
Vision Drilling Loan Facility US$67.5 mn Mandated Lead Arranger
TAMSynthetic Operating Lease2 x A320-200Arranger
Volga DneprFinance Lease3 x B747-8FArranger
Polish Steamship2 separate Senior Loan Facilitieseach for 4 x 17,000 dwt bulkers US$44 mn and US$43 mnBilateral Lender
TuI Travel plcPre-Delivery Financing10 x B737-800Arranger
1) Unaudited information (not included in audit opinion)

96
DVB Bank SE | Group Annual Report 2012
Due to these preconditions, global syndicated loan volume decreased by 16.1% to €2.6 trillion in 2012 (previous year: €3.1 trillion). By region, the syndicated loan volume in Europe/Middle East/Africa declined the most – by 33.3% to €0.6 trillion (previous year: €0.9 trillion). In North and South America, the volume dropped to €1.4 trillion (previous year: €1.6 trillion). Only the Asia/Pacific region was able to keep its level at a constant €0.6 trillion as at year-end 2012.
Bank debt liquidity also remained comparatively limited for specialised markets, non-recourse transactions, or borrowers outside the top-tier segment: this restricted downward pressure on pricing. The underwriting and syndication market continued to be very selective during 2012 for the top-tier corporate borrowers, whilst other borrowers could only tap the club deal or bilateral loan market. The bond market remained an alternative to the bank debt market – total bond issuance reached €2.5 trillion, an increase of 19.0% over 2011.
The syndicated deal volume in transportation finance – including shipping, aviation and rail asset finance – decreased by 26.2% to €38.1 billion in 2012, compared to €51.6 billion in 2011. Overall, liquidity for the ship finance market was tight in 2012, with a number of key banks announcing exit strategies or a reduction in their lending volumes. This development was a continuation of the trend in reducing bank capacity for shipping deals which had been witnessed in the second half of 2011, where lending volumes slumped due to the combined impact of liquidity and funding issues for banks. As a result, banks were more active in secondary trading during 2012, using other banks’ exit strategies as an opportunity to improve returns on their books by buying debt for top names at a discount – or as a launch pad for increas-ing their shipping books with solid deals.
DVB’s skills and expertise as an arranger and syndicate member mean that customers have the comfort of certainty with regard to funding their projects. 2012 was a year where most banks continued to face the impact of the European sovereign debt crisis on their lending capacity. Despite this tight market environment, DVB’s Financial Institutions team successfully raised bank debt for a number of transactions during 2012.
Financial Institutions – Market review
2012 was a year characterised by the continuation of the sover-eign debt crisis, the need for a number of European banks to strengthen their capital ratios by end-June 2012, Moody’s down-grading of the ratings for 15 global banks in June 2012 after reviewing their credit metrics, and a number of European juris-dictions creating national “gold plating” to enhance domestic capital levels. Against this backdrop, lending volumes also dropped during 2012 resulting from lower financing requirements due to reduced general economic activity, and banks continuing to be very selective in the use of their balance sheets for lending pur-poses. Only as the impact of the above events began to be seen as the new market normality did US dollar interbank lending improve, helping to reduce US dollar funding costs for a number of banks during the later part of 2012. However, this cost of funds reduction was not always passed on to borrowers as bank capital usage continued to be restricted.
Financial Institutions
4.0
3.0
2.0
1.0
0.0
0.8
0.4
0.9
2008
0.4
0.4
0.5
2009
0.7
0.5
1.0
2010
0.9
0.6
1.6
2011
0.6
0.6
1.4
2012
North and South America Asia/Pacific Europe/Middle East/Africa Source: Dealogic, December 2012
Global syndicated loan volume
€ trillion

97
DVB Bank SE | Group Annual Report 2012
T HE C OMPA N Y F IN A NCI A L A ND EqUI T Y M A RK E T S GROUP M A N AGE M E N T R E P OR T C ONSOL IDAT E D F IN A NCI A L S TAT E MEN T S
During 2012, banks still active in the market largely continued to target the same top-tier clients creating downward pressure on pricing for these names, albeit at historically high levels. As with 2011, the trend to finance the offshore market continued on the back of this sector’s better prospects. Banks still able to use balance sheet capacity to lend preferred well-structured offshore deals. We also witnessed an increased preference for LNG trans-actions with good-quality long-term oil major charters and/or strong off-takers in place, which were viewed as industrial ship-ping. Some of those banks no longer active in ship finance or in the process of exiting were still able to consider such transactions from their corporate/project finance divisions.
Underwriting capacity was very limited in 2012, with banks holding large volumes for top-tier names and looking to sell down deals on an opportunistic basis. The focus in 2012 has been on true club deals: the trend for conservative lending structures and higher pricing prevailed, albeit with downward pricing pressure for top names. Dealogic data also reveals that approximately €18 billion of the 2012 loan volume went into new projects, with 39.3% being lent to new offshore projects. Unreported bilateral lending and smaller club transactions were also prevalent in the shipping finance market during 2012. Govern-ment lending and guarantees via export finance houses continued to support the ship finance market, most notably in a significant volume of offshore transactions.
Despite the continued difficult situation in the global financial markets and potential impact of this on the aviation finance market, 2012 was an active year, albeit challenging. The first part of the year was somewhat slower, when many banks were still dealing with various liquidity constraints and funding issues following on from 2011. Moving into the second quarter of 2012 and onwards, the activity generally improved. In general, no sig-nificant new banks appeared in the market apart from a few in the Middle East, US and Asia with a regional focus. The commer-cial debt deals concluded in 2012 were closed by a small number of active aviation banks. In addition to commercial debt, aircraft finance also came from sources such as the export credit agencies and the bond/capital markets. A select number of new non-bank institutions came into some aviation transactions. The remaining banks could afford to be selective, and therefore stayed focused on perceived top-tier airlines. New aircraft financing showed conservative structures that were corporate in style rather than asset-based. The shortage of liquidity and high cost of US dollar
funding caused margins to increase during 2011, especially in Europe and the Middle East. Compared to that, 2012 saw slightly more availability of liquidity from active banks, with margins generally reducing. In addition, pricing in North America remained constant due to tight liquidity. Asian banks remained largely immune to the lack of liquidity situation, especially in Japan where an increase in appetite for the aviation sector was seen. Generally, many banks with liquidity preferred local deals rather than international transactions since these could be closed with local currency – particularly in the Middle East and parts of Asia. As in the preceding years, only a handful of banks were able to look at older aircraft (mid- to end-of-life) and/or to take pure asset risk.
In the rail industry, liquidity remained tight as a number of banks continued to reduce their lending to the rail (and transportation) sector, which they regarded as non-core. At the same time the year saw a few new institutions looking at the sector, and certain of these duly came into some rail deals.
Financial Institutions – Strategy
During 2012, the Financial Institutions team supported DVB’s core business activities in Shipping Finance, Aviation Finance and Land Transport Finance – and their customers’ needs – by ensuring that sufficient third-party bank debt liquidity was iden-tified in order to adequately transfer risk from DVB’s lending book. Introducing third-party bank debt into its transactions enables DVB to diversify the credit risk it keeps on its lending book, and to subsequently avoid concentration risk. The ability to arrange and syndicate means that customers have the comfort of cer-tainty with regard to funding their projects. Therefore, a good track record in successful syndications increases the likelihood that DVB will be mandated by customers for larger financing projects.
As lead arranger and book runner, competent execution of DVB’s tasks is crucial to success. Participant institutions may be less familiar with the customer or project involved, so strong reliance is placed on the skills, experience, capability and information provided by the Financial Institutions team. A careful and clear presentation of a particular project by its team, in the form of an information memorandum, is essential – and reduces the diffi-culties that may arise in the syndication process.
Financial Institutions

98
DVB Bank SE | Group Annual Report 2012
DVB does not take over the liquidity and placement risk from the customer. There is no difference in the actual execution of the syndication exercise, whether this is done on an underwritten or a book-building basis. In both scenarios, the Financial Institutions team uses the same information memorandum template and invitation letters – and also in both scenarios, the team benefits from the expertise present in the various DVB business divisions (including, but not limited to, credit and research functions) to maximise the liquidity raised in the market. Since mid-2008 we have seen a shift in the bank market from syndication on an underwritten basis to raising bank debt on a club or book-building basis. In line with the general market, DVB’s syndication activities have also moved more towards club and book-building exercises. This general trend was prevalent during 2012, but with some selective underwriting of transactions taking place.
The vast majority of the transactions being syndicated by the Financial Institutions team are new (“primary”) transactions, rather than transactions closed at an earlier stage (often referred to as “secondary”). DVB’s Financial Institutions team is not an active participant in the secondary debt trading market. The partners that the team links with in a transaction are generally commercial banks or export credit agencies.
The Financial Institutions team also acts as a central co-ordinator of relationships with financial institutions, by
• providingprivateequityandmezzaninefacilities,inordertoattract these institutions’ appetites across the transportation sectors;
• findingvaluefromcross-platformsynergieswithinDVB;and
• buildingnewrelationshipsinordertoassistclientsinfindingdifferent capital sources for their transactions, in conjunction with the Investment Management and Advisory teams.
The Financial Institutions team is instrumental in identifying the appropriate partners for varying capital requirements for cus-tomers’ transactions. However, executions of such transactions are conducted by the Investment Management and/or Advisory teams.
During 2012 the Financial Institutions team continued the process of co-ordinating private equity and mezzanine facilities across the organisation, and introduced a number of new equity and mezzanine investors to the Investment Management and Advisory teams in order to assist their clients in making asset and/or company purchases.
The key drivers that Financial Institutions has used to formulate its successful strategy are the following:
• Maintainingandexpandingrelationshipswithfinancial institutions;
• Basedontheserelationships,developingandmaintainingagood understanding of each financial institution’s risk appetite and requirements, especially in a dynamic environment where those institutions have been changing their strategies for lending and investment;
• Close co-operation with DVB’s global transport finance network, research and advisory teams; competitive pricing structures based on up-to-date information, access to global networks and ad-hoc analysis;
• Effectivemanagementandmonitoringofthesyndication process; personalised, tailor-made approach towards the participant partners;
• Anunderstandingofthewidereconomicconditionsandhowthey affect transportation financing; adapting to changing market conditions.
Financial Institutions – Products
The Financial Institutions team offers two key services: firstly, risk distribution, which is the ability to syndicate debt to other lenders, and secondly, assistance in raising capital in the form of private equity and mezzanine facilities from financial institu-tions.
Risk distribution can be conducted on an underwritten basis, or on a book-building basis. A syndication on an underwritten basis means that the customer has certainty of funds, and that the liquidity and placement risk (as to whether or not sufficient bank debt liquidity can be identified for a certain transaction) is taken over by DVB. A syndication on a book-building basis means that
Financial Institutions

99
DVB Bank SE | Group Annual Report 2012
T HE C OMPA N Y F IN A NCI A L A ND EqUI T Y M A RK E T S GROUP M A N AGE M E N T R E P OR T C ONSOL IDAT E D F IN A NCI A L S TAT E MEN T S
Financial Institutions – Portfolio analysis
The Financial Institutions team was able to sell down an overall volume of €268.8 million in 2012. Financial institutions themselves have been taking longer to commit to transactions as bank internal decision-making processes have become more lengthy.
On the aviation side, Financial Institutions concluded the syndi-cation of a number of both operating lessor and direct airline transactions throughout the course of 2012. These deals were club transactions and post-closing sell-downs to assist in expo-sure management, for which the team introduced new partners after having spent significant time nurturing these new financial institution relationships. Financial Institutions concluded debt raising and/or debt sell-down for a total of seven aviation trans-actions, i.e. 69.7% of DVB’s total sell-down volume in 2012.
On the shipping side, our Financial Institutions team was able to successfully sell shipping and offshore transactions for key Shipping Finance clients helping to refinance existing assets and/or new tonnage additions – a total of four transactions which accounted for 30.3% of Financial Institution’s total sell-down volume. Financial Institutions were able to bring together a stable international group of banks with experience and knowledge in shipping and/or offshore, in addition to new financial institution relationships.
Financial Institutions – Market and portfolio outlook 2013
The critical driver of lending volumes in the primary markets during 2013 will be the extent to which European banks will start repaying money borrowed from the ECB. It is estimated that €200 billion of loans are scheduled for repayment in the first quarter of 2013, with French, Spanish and Italian banks potentially returning a total of €150–160 billion. The first day for early repayment for approximately 523 banks that borrowed €489 billion during the first Long-Term Refinancing Operations (LTRO) is 30 January 2013. For the 800-odd banks which bor-rowed €529 billion during the second LTRO, the exit option can be exercised on 27 February 2013. However, repayment during 2013 is less likely, as the banks will probably look to refinance the debt – as a result of the highly flexible policies of the ECB to maintain this liquidity, and low economic activity in the European region.
As a result, a number of European banks that were the mainstay of international transport finance will continue to keep a tight grip on their lending capacity during 2013. DVB expects this trend of highly selective international cross-border lending to continue during 2013. Pressure on US dollar liquidity costs is likely to prevail: pricing and terms will therefore remain reflective of such conditions for transportation deals overall – with the majority of financial institutions continuing to focus on credit quality and deal terms. The regionalisation of the lending market will continue as well, with a number of regionally focused finan-cial institutions financing borrowers in their home markets and thus supporting local economies. For example, pricing for deals in the Asia/Pacific region is expected to fall as liquidity in this market will improve due to central bank economic stimulus packages in the major regional economies. We do not believe any new significant alternative financial institution lenders will enter the transport finance market in 2013, but instead there will be a very small number of new entrants with a limited lending scope. Macroeconomic issues and the performance of the trans-portation industry will impact lending levels overall and our syndication business 2013 – making this coming year a challeng-ing one. The most prevalent deals will be bilateral and club transactions.
Financial Institutions
Aviation Finance 69.7%
Shipping Finance 30.3%
Total sell-down volume by business division

100
DVB Bank SE | Group Annual Report 2012
It is still to be seen what level of impact the increasing premiums for export credit transactions will have and whether more trans-actions will be financed in the commercial debt market as a result of this change. There are no signs indicating that further new banks will enter the commercial debt market compared to 2012, but a large amount of financing opportunities will be avail-able. DVB expects 2013 to produce a similar level of competition (from a small number of active commercial banks) to 2012 – with liquidity still being sourced and obtained from diverse financing sources such as the export credit agencies, the capital markets and some opportunistic lenders. In addition, 2013 will see pockets of liquidity coming from a limited number of alternative investors and institutions in the form of senior debt being deployed selectively. The number of lenders able to finance older assets will also remain small, and the significant funding gap seen in 2012 will continue, because most active lenders will continue to focus on financing the new equipment needs of top-tier companies.
On a regional basis, the trend of local banks being more region-ally focused (particularly in Asia/Pacific and the Middle East) is expected to continue. However, a small number of institutions may be able to look at international deals for better credit quality counterparts, as they did in 2012. In 2013 we expect some down-ward pressure on pricing in the Middle Eastern/African and Asian regions as these markets are less impacted than other areas, whilst potentially some upward pressure may occur in Europe and North America due to sustained financial market volatility in these regions.
DVB expects further opportunities for rail transactions in 2013. Some institutions view rail as a fairly stable sector and there-fore could increase their exposure as a means of diversifying their existing asset class and overall portfolio. With capacity in the bank debt market somewhat uncertain, liquidity will be selective. It will concentrate on transactions involving younger assets, strong lessors, and – in some cases – a stronger focus on domestic home markets.
In 2012 the shipping market continued to see a large funding gap, further aggravated by the exit of a large number of traditional ship finance banks from the market. Although shipowners have continued to bridge this gap by providing additional equity for projects, a falling shipping market in some sectors has reduced their ability to do so. As a result, this large funding gap will con-tinue in 2013. Bank and investor appetite was further aggravated by a series of high-profile shipping bankruptcies during 2012, a result of the weak shipping market. This has had an adverse impact on the capital markets’ appetite for investments in ship-ping: only established companies with long proven track records will be able to raise funds in the capital markets in 2013. Private investors and funds (particularly those possessing industry-specific knowledge) have also been selective in their financing strategies, largely focusing on distressed opportunities and sec-tors where they can see improved returns, such as the offshore market. For most investors, shipping is still a specialised industry with returns comparing unfavourably with other investments. These themes will be prevalent in 2013.
In 2013 we will still see regional disparities in lending, with Asian banks able to offer competitively priced deals for local owners but with very limited appetite for more international transactions, as was the case in 2012. Also in 2012 a number of US banks increased their market share in shipping lending, either via the acquisition of stakes in the shipping portfolios of banks exiting the market or via direct lending at more competitive pricing for stronger shipping names. In 2013, strong corporate groups will find it easier to raise finance: liquidity will still be more abundant for these names, especially where banks (US names in particular) can see significant cross-sell opportunities.
The aviation market in 2013 may not be much different from 2012 – in the fields of funding new deliveries, supporting the deliveries of the many leasing companies or refinancing a number of existing transactions. In 2013 airlines and leasing companies will continue to use multiple sources of funding where appropri-ate, in order to diversify funding sources and mitigate any funding risk. The development of the capital markets will be interesting.
Financial Institutions

101
DVB Bank SE | Group Annual Report 2012
T HE C OMPA N Y F IN A NCI A L A ND EqUI T Y M A RK E T S GROUP M A N AGE M E N T R E P OR T C ONSOL IDAT E D F IN A NCI A L S TAT E MEN T S
DVB’s Investment Management division is active as a fund initiator, investment adviser and asset manager for closed-end funds in the international transport sector. The funds initiated by DVB are geared towards professional investors.
The closed-end fund market is a further option for financing assets. Transport companies frequently operate (but no longer own) the transport assets to be financed, such as aircraft, vessels, container boxes, and rolling stock. Operators are more willing to contemplate alternative financing structures: closed-end funds in particular are increasingly being considered as an alternative to traditional sale-and-lease-back finance, thanks to the increased availability of investment capital for such funds. Moreover, funds can also provide transport companies with direct equity investments in a diverse range of forms. Likewise, participation in a closed-end fund has evolved into an alternative for professional investors who wish to benefit from long-term cash flows and returns whilst diversifying their risks.
At the outset of the Investment Management division in 2001, DVB predominantly committed own equity when providing equity finance. During the second stage, DVB acquired the first partners for investment funds. At present DVB is in the third stage, where the main task will be to assume a management function on behalf of third parties – but with a material equity risk exposure to be assumed by DVB. Above all, DVB sees strong demand from institutional investors for joint investment management projects, such as joint ventures. This means that DVB will be able to provide its clients with equity finance at an even higher level – for example, in the form of sale-and-lease-back trans-actions. DVB’s motto thus remains unchanged: we are able and willing to assume risks – provided that they are adequately priced.
DVB’s market and asset expertise – gained through extensive research and the resultant business intelligence – gives us a competitive edge. We are thus an ideal partner for clients requiring equity capital and investors seeking suitable invest-ment projects in the relevant transport sectors. Accordingly, DVB’s Investment Management division comprises two teams of experts:
• TheShipping&IntermodalInvestmentManagement(SIIM)team unites the Bank’s Investment Management activities in the shipping, intermodal transport and rail transport sectors.
• TheAviationInvestmentManagement(AIM)teammanagesthe aircraft investments of the Deucalion Aviation Funds.
The aggregate investment volume of funds initiated by DVB amounted to €724.4 million as at 31 December 2012, with AIM accounting for €456.0 million (62.9%) and SIIM for €268.4 million (37.1%).
Investment Management
AIM 62.9%
SIIM 37.1%
thereof:
27.7% NFC Shipping Funds
3.5% Stephenson Capital
3.1% Cruise/Ferry Funds
2.8% Container Funds
Breakdown of the investment volume by fund

102
DVB Bank SE | Group Annual Report 2012
Investment Management
On the other hand, continuing a trend already visible in the last few years, smaller-size and specialised shipping segments have fared better in 2012, with stable or improving freight markets (for example the offshore support market and the LPG carrier market). This development is in line with SIIM’s analysis and investment policy, focusing on smaller-size and specialised assets in these segments.
It is also noteworthy that more and more private equity firms are making first moves into the shipping markets, looking for partners with in-depth industry knowledge. In parallel, the ship finance market continues to be very difficult and virtually non-existent for typical non-recourse project financing.
For container boxes, operating leases are seeing declining running yields on account of strong residual values. Also in this space, there are only a few banks active in leveraging containers due to the general weakness in the shipping market.
SIIM – Strategy
The SIIM management activities combine to offer a sophisticated business approach, an experienced management team and a wealth of market knowledge. This is further leveraged by DVB’s in-house market and asset research capabilities, and deep knowledge of the respective assets. The product inventory of all SIIM funds includes (among others) equity, equity bridge loans, preferred equity, sale-and-lease-/manage-back structures to the shipping, offshore and intermodal sectors, with the actual product offering at any given time being proactively attuned to SIIM’s view of the prevailing and expected future market conditions for any individual asset class/market segment.
Shipping & Intermodal Investment Management
Since 2009, Shipping & Intermodal Investment Management has comprised all of DVB’s shipping, intermodal, cruise and rail funds. In total, SIIM has had more than €3.0 billion in assets under management, across a wide range of assets. The shipping investment management activity has been operating since 1999, and was previously known as NFC Shipping Funds. The inter-modal investment management was set up by DVB at the end of 2006, and consists now of one fund, which acts as the investment vehicle through which DVB and private investors jointly invest in intermodal equipment. The cruise investment management activity started in November 2007 when DVB, along with Buss Capital (a German specialist for “KG” financings), set up an investment fund targeted at the passenger shipping sector. The rail investment management activity has been active since 2007 with the establishment of Stephenson Capital Funds. It is set up as a joint venture with a leasing company which invests in railcars managed by our joint venture partner.
SIIM – Market review
Asset values in the main shipping market segments continued to deteriorate during 2012, following relatively poor freight markets, due to a combination of oversupply, demand factors and high fuel expenses. These circumstances resulted in several corporate bankruptcies and defaults in the charter market. While several of the main segments seem to have reached the trough of the value-cycle by year-end 2012, we see certain others exposed to further decline before bottoming-out and commencing the upswing to follow. Newbuilding order books dropped considerably over the year 2012 because of many new vessels having been delivered and very few newbuildings having been ordered at the same time. But, consequently, utilisation and freight rates in various sectors have been negatively affected by the new tonnage added to the fleet.

103
DVB Bank SE | Group Annual Report 2012
T HE C OMPA N Y F IN A NCI A L A ND EqUI T Y M A RK E T S GROUP M A N AGE M E N T R E P OR T C ONSOL IDAT E D F IN A NCI A L S TAT E MEN T S
Investment Management
On the shipping side, the focus continues to be on the develop-ment and holding of a diversified portfolio of shipping and off-shore investments – mainly in the form of bareboat (i.e. financial lease) transactions – generating stable, quality cash flows, with upside potential, and dynamically targeting selected market segments/asset classes based on the view of current and pro-jected future market prospects. Significant effort has been put into the various joint venture platforms. This, for example, resulted in one of the platforms being merged with another shipping company in the same (LPG) sector, concurrent with a sizeable new equity commitment by a leading maritime invest-ment company.
During 2012, SIIM developed successful exits for two of the four investments in the cruise and ferry fund and laid the groundwork for consolidating the two remaining investments into one, which is expected to take place during the first quarter of 2013. The strategy for these investments is to continue to develop the investee company and build the value of the consolidated invest-ment through active participation at Board level, until it is likely to extract maximum possible value with the current equity base through an appropriate exit in the medium term.
On the intermodal side, we want to use the existing container investments and our track record in this segment to further grow our container portfolio. With a combination of available equity and cash flow generated by the existing investments, we invest directly in operational and finance lease investments.
In the rail fund we have decided not to seek new investments, given limited capital and lack of near-term profitable opportunities.
SIIM – Products and portfolio analysis
As at year-end 2012, the equity invested across all SIIM managed funds totalled €268.4 million. At the end of the year the shipping portfolio had 33 investments totalling €200.7 million and con-tained about 87 vessels (a number of which in co-ownership with other investors). It was mainly invested in LPG, chemical and product tankers (31.3%), and offshore vessels (30.0%).
The cruise and ferry fund had two investments: firstly, a junior loan with substantial ownership potential and with active (majority) Board representation; and secondly, a majority stake in a private equity transaction. These are in the process of being combined within the first quarter of 2013. As of 31 December 2012, SIIM had invested €22.0 million in this fund.
Tankers 31.3%
thereof:
11.2% LPG tankers
10.7% Chemical tankers
9.4% Product tankers
Offshore vessels 30.0%
Container ships 20.2%
Bulkers 16.1%
Other investments 2.4%
Shipping portfolio by asset type

104
DVB Bank SE | Group Annual Report 2012
Investment Management
SIIM – Market and portfolio outlook 2013
For 2013, we expect the market outlook for the main shipping segments to remain clouded – values are at or near bottom, and we do not foresee further huge corrections, with a potential recovery postponed until at least 2014. Thus, our focus for 2013 continues to be on the niche segments such as product tankers or the LPG market where a combination of factors such as a low order book or high entry barriers help underpin good performance. Phasing-in of capital adequacy requirements by various regula-tory authorities will also contribute to restricting the availability of capital from traditional sources.
For our intermodal investments, due to the fact that liner com-panies continue to have limited capital to acquire containers, we expect continued strong demand for leasing containers – and that our remaining container portfolio will show an ongoing good operational and cash flow performance.
For 2013, while always maintaining the focus and discipline necessary to closely monitor and manage the existing portfolio, SIIM will aim to build up and further strengthen a non-consoli-dated portfolio of investments in bareboat transactions with attractive risk-weighted target yield, pursuing a dynamic approach based on the position of the individual segments in their respec-tive value/earnings-cycles at any time, and where the overriding investment criterion is that the economics of the lease must be supported by the individual asset’s actual earnings capacity in the prevailing market.
On the intermodal side, during the second half of 2012 we sold a part of an operational lease portfolio, releasing equity and generating a substantial profit. Furthermore, we have taken advantage of market conditions, investing in finance leases at attractive terms. As at year-end, intermodal funds had eight investments amounting to €20.5 million. The fund invests in standard marine containers, employed in both operational and finance lease portfolios. SIIM is positive on the offshore market, and has identified a profitable niche market in offshore containers supporting the offshore exploration and drilling industry.
The rail fund consists of a joint venture and currently owns several hundred railcars. The investment volume of the rail fund totals €25.2 million.
SIIM’s risk management in the portfolio is devoted to continuously monitoring the health and performance of our investments. It profits from the invaluable knowledge, industry insight, and technical expertise that we derive from our Shipping Research as well as from our commercial activity, holding frequent and proactive meetings with our counterparties. Each investment is routinely subject to quarterly checks and valuations, such as the monitoring of value maintenance clauses and other debt covenants, the request for updated valuation from a preselected list of reputable brokers, detailed investor reporting, and quarterly budget forecasts. On a semi-annual basis, we run asset impair-ment tests and discounted cash flow analyses. On an annual basis, our funds and special purpose companies are independently audited. All our vessels are inspected at least once a year (or more frequently if required) by our independent technical adviser. A number of those procedures are escalated further, with thorough monthly checks for investments classified as Early Warning, Closely Monitored or Watch List cases. Against the backdrop of challenging market conditions, SIIM’s allowance for credit losses amounted to €–4.7 million in 2012 (2011: €–11.1 million).

105
DVB Bank SE | Group Annual Report 2012
T HE C OMPA N Y F IN A NCI A L A ND EqUI T Y M A RK E T S GROUP M A N AGE M E N T R E P OR T C ONSOL IDAT E D F IN A NCI A L S TAT E MEN T S
Investment Management
Aviation Investment Management
Established in 2001, DVB’s Aviation Investment Management acts as the investment adviser to the Deucalion Aviation Funds, which consist of a series of actively managed closed-end funds. These funds act as the investment vehicles through which institutional investors and DVB together invest equity in aviation assets. As advisers to the funds, AIM’s senior investment managers (based in London, New York and Singapore) are respon-sible for sourcing and managing aviation investments and assets. Each of the funds has an independent board of directors. DVB is not represented on any of these boards, and does not control any of the funds.
AIM – Market review
The macroeconomic environment remained weak during 2012. The US economy did not recover as fast as expected but showed more positive momentum through the fourth quarter of 2012. Europe’s economy was very weak and continued to be entrenched in a sovereign debt crisis, significantly impacting the economic strength of the region. Asia/Pacific remained the only significant region in growth mode, but with weakened export markets also subject to uncertainties. With this backdrop and in an environ-ment of still relatively high oil prices, airlines showed very good discipline in controlling capacity and matching seats to demand, as well as good cost control. Asset utilisation rates remained high. The cargo markets, a leading indicator for the passenger sector and indeed trade flows generally, continued to show fundamental weakness throughout 2012, with material capacity being withdrawn from the market.
The aircraft equipment market performed strongly in 2012 and aircraft manufacturer production backlogs stayed close to record highs. Appetite to finance this new equipment remained strong from banks, lessors and export credit agencies and there was increased interest in the asset class from longer-term institutional money in the form of pension funds and insurance companies seeking hard assets with attractive yields in a low interest rate environment. This latter diversification of funding sources will be important in offsetting lower appetite from banks whose hands are tied by their need to further deleverage balance sheets to comply with Basel III.
In the aircraft operating leasing market, in which the Deucalion funds are very active, 2012 was characterised by continued aggressiveness of leasing companies, both new and old, and by newly established investment vehicles set up for the purpose of acquiring predominantly vintage assets, typically aircraft of ten years of age and older. Fuelled largely by equity from institutional private equity, improved access to the capital markets and support from the export credit agencies, competition has been intense for new aircraft finance. Good news for the borrower (i.e. the airlines) – but resulting in continued upward pressure on aircraft prices and further downward pressure on lease rates. In the opinion of AIM, this lowered the risk-reward ratio and presented investment scenarios for new aircraft that in general cannot be justified given the return criteria of the Deucalion funds. This focus of lessors and banks on the financing of newer equipment has been an ongoing theme since 2010/2011, and clearly at the expense of used equipment prices where we have seen continued downward pressure. Airlines showed a prefer-ence for new, fuel-efficient aircraft, and very few commercial banks demonstrated a willingness to leverage used aircraft transactions. As a consequence, more lessors and even some airlines took material permanent impairment charges on the book values of older aircraft which are considered to be exceeding market values, a practice that in turn raises questions over the appropriateness of widely accepted depreciation policies and the economic life of various aircraft assets. There has been some debate on this in 2012 and we expect this to continue to be a hot topic, particularly amongst aircraft operating lessors.
AIM – Strategy
DVB’s focus and expertise in transport finance are both unique and unparalleled. AIM uses this competitive advantage to structure investment opportunities for the funds that will con-servatively generate returns within a target range of 12%–15% by investing across the aviation sector, with an emphasis on the acquisition of physical aircraft and engine assets subject to long-term operating leases. The funds are generally opportunity-driven, not volume-driven, and focus on a short- to medium-term trading strategy that optimises returns throughout an asset’s economic cycle.

106
DVB Bank SE | Group Annual Report 2012
As at year-end 2012, the equity invested across all Deucalion funds totaled €456.0 million and was provided by five sophisti-cated institutional investors located in Europe, North America and Asia. The asset portfolio performed as contracted, with no arrears or defaults for the year. The return on equity on all realised investments in 2012 remained good. All new asset investments in 2012 have been structured in the expectation of achieving returns significantly above the target range of 12%–15%. At year-end 2012, all of the operating assets within the funds were employed on long-term leases and the portfolio remains well diversified by lease maturity, aircraft/asset type, geography and counterparty. The aggregate portfolio across all funds consists of Boeing aircraft (52.7%), Airbus aircraft (38.7%) and other investments (8.6%). The greatest share of the funds’ aircraft portfolio is made up of passenger narrowbodies (36.9%), freighter widebodies (25.9%), passenger widebodies (19.3%) and engines (14.4%).
AIM – Products and portfolio analysis
The funds have a primary focus on ownership of aircraft assets through direct equity investments, chiefly via operating lease and sale-and-lease-back transactions, but also in the acquisition of “end-of-life” aircraft and engines with a view to immediate or near-term disassembly. The funds also invest in aero engines, airline equities and passenger-to-cargo conversions – and from time to time, secured aircraft bonds and mezzanine loan invest-ments.
Compared to 2011, fund activity remained strong in 2012. During the year, the funds acquired or entered into binding Letters of Intent to acquire 23 commercial jet aircraft (2011: 22) and 15 separate commercial aero engines for a total transaction value of approximately US$0.5 billion. The aircraft types acquired were B747-8F, B747-400, B767-300, B737-700 and -800, A330-300, A310-300, A300-600 and A320, all manufactured between 1989 and 2012, but with the majority of the operating lease aircraft being of mid-life vintage. The funds also sold three commercial jet aircraft and five commercial aero engines, originally acquired by the funds between 2006 and 2011. All of these transactions are excellent examples of the opportunistic investment and trad-ing strategy of the funds. Included within the disposals were two B747 passenger aircraft acquired in 2011 which were con-verted to full freighters, placed on long-term leases and sold with the attached lease contracts. Included in the acquisitions were nine B747, two B767, three A330, one A310, four A300 and one A320 and 15 aero engines, all acquired specifically for immediate or near-term disassembly (i.e. subject to short-term lease). In these disassembly transactions, the funds entered into contracts to consign the airframes to a US company and consign the mixture of CF6-80C2, CFM56 and PW4000 engines to TES, DVB’s affiliate engine management company, for the purposes of disassembly, repair and sale of serviceable engine parts. These disassembly investments follow the acquisition of four B747, two B767 and one A310 passenger aircraft in 2011, with the same strategy in mind. All projects have been perform-ing well.
One of the Deucalion funds remained a shareholder in Malaysian low-cost airline operator AirAsia, an equity investment made in 2003 prior to the initial public offering in 2004. The majority of the fund’s shareholding in AirAsia was sold in 2006 and 2007, and the holding is now very modest. The weighted average share price when the shares were launched in the November 2004 initial public offering was 1.23 Malaysian ringgit (€0.25); they closed 2012 at 2.74 Malaysian ringgit (€0.68).
Investment Management
Passenger narrowbody 36.9%
Freighter widebody 25.9%
Passenger widebody 19.3%
Engines 14.4%
Other 3.5%
Portfolio by asset type

107
DVB Bank SE | Group Annual Report 2012
T HE C OMPA N Y F IN A NCI A L A ND EqUI T Y M A RK E T S GROUP M A N AGE M E N T R E P OR T C ONSOL IDAT E D F IN A NCI A L S TAT E MEN T S
Risk management is a key daily focus for AIM. DVB’s expertise in aviation ensures direct access to specialists that provide macro- and micro-views, analyses and tools to comprehensively monitor aircraft technical issues, aircraft values and trends, as well as airline and counterparty credit risk. Each investment is subject to at least monthly compliance checks, quarterly valua-tions and detailed investor reporting, semi-annual impairment tests, annual independent auditing of all funds and regular proactive meetings with lessees or the ultimate risk counter-parties. In addition, all funds have an independent board of directors – with each board led by a director possessing signifi-cant aircraft and aviation industry experience. Where relevant, an asset may be taken to an Early Warning, Closely Monitored or Watch List, depending upon the nature of the risk, actual or perceived, which implies more regular monitoring and typically involves the implementation of key action plans. As at year-end 2012, only one investment was on the Watch List – and there were none on either of the Early Warning or Closely Monitored Lists. For 2012, AIM reported no asset impairments or allow-ances for credit losses for DVB’s investment in the funds (2011: reversal of €3.1 million).
AIM – Market and portfolio outlook 2013
The Deucalion funds are currently invested in a portfolio that is performing well. The funds are well positioned to take advantage of the investment environment emerging in this phase of the economic cycle, be those sale-and-lease-back or airframe and engine disassembly opportunities. The funds have sufficient access to capital to take advantage of the current and expected opportunity, and – importantly – premised upon the investment philosophy that has served the Deucalion funds so well since 2001, namely:
• toleveragetheextensiveaviationassetexpertise,assetresearch capability and airline relationships within DVB; and
• toopportunisticallyinvestinandmanageaviationassets,with disciplined and rigorous attention not only to the risks today, but – just as importantly – structuring investments with an eye on the future.
AIM expects to see a strong increase in Deucalion’s volume of funds under management during 2013, principally through increased ownership of aircraft and aero engines on operating lease, but also in the expectation of additional investment into further aircraft disassembly opportunities. Although investor appetite – and therefore competition – for the funds will not likely lessen in 2013, DVB’s knowledge of the industry, the strength of its aviation platform, and its asset-based approach provide the funds with a truly unique asset-focused platform to take advantage of the current market conditions with a well-informed and researched view of the future. Whilst aviation remains a volatile and cyclical industry, in its capacity as invest-ment adviser to the funds AIM will remain focused and disciplined, sourcing the best risk/reward opportunities by making full use of its unique combination of money and metal expertise – and also by taking the opportunity of selling existing portfolio assets at a profit.
Investment Management

108
DVB Bank SE | Group Annual Report 2012
ITF International Transport Finance Suisse AG
Shipping Finance, Aviation Finance and Land Transport Finance. The subsidiary is committed to conducting a professional business, with swift and reliable decisions – in particular, through the combination of a restrictive, yet transparent lending policy and short reporting lines. Since the terms and conditions of exposures considered by ITF Suisse are already fully negotiated, it has no need for time-consuming structuring processes: this also facilitates fast decision-making.
This is also made possible by having an experienced team, and being integrated within DVB. Thanks to its streamlined and cost-efficient organisational structure, ITF Suisse is in a position to accept the lower earnings contributions that are customary in this type of business. The company is now well-established in the market. The business model has proved to be successful and sustainable, and so will be pursued.
ITF Suisse – Products
ITF Suisse exclusively engages in subparticipations in transport finance deals (in the maritime shipping, aviation and land trans-port segments) syndicated in the international interbank market. Hence, the company’s clients consist solely of banks looking for syndication partners. DVB thus leverages its independent ITF Suisse brand to be active in an important market segment. The transactions must fulfil defined risk criteria, with senior collateralisation being provided in principle by the financed transport asset.
ITF Suisse is active in the global interbank market, underwriting subparticipations in syndicated transport finance deals. The subsidiary was once again profitable in the 2012 business year.
ITF Suisse – Market review
Established in May 2007, ITF Suisse opened for business in August of the same year. It is a zurich-based wholly-owned sub-sidiary of DVB Bank SE. Immediately following establishment, ITF Suisse’s target market for syndicated transport finance loans was burdened by the subprime crisis, and by the subsequent drying-up of the international interbank market. The conse-quences of this situation were strongly reduced transport volumes, distorted lending margins, as well as falling vessel values, and accordingly clearly lower freight rates.
In 2008, financial market participants had initially assumed that the market environment would quickly recover. In fact, a recovery was limited to a few segments only. The difficult market environ-ment in maritime shipping did not change materially in 2012, as market participants had to face liquidity shortages. This led to re-negotiations of loan agreements, but also initiated necessary restructurings.
The international transport finance syndication market showed some signs of a recovery during 2012. Transaction volumes of €38.1 billion (2011: €51.6 billion) fell to levels seen in 2010. None-theless, some market participants endeavoured to reduce their portfolios, leading to numerous offers on the secondary market. ITF Suisse received offers for a total of 73 transactions (2011: 66 transactions). We rejected the majority of these invitations – either because they did not fulfil our risk profile requirements or due to insufficient margins being offered. Secondary market transactions often suffered from a lack of market participants’ willingness to accept discounts, reflecting the changed funding costs and required margins.
ITF Suisse – Strategy
DVB Bank SE’s strategy regarding ITF Suisse is to participate in international transport finance transactions that are attractive with respect to their risk/return profile, but which are unavailable to the Bank in the primary market. ITF Suisse is looking for loan subparticipations in the maritime shipping, aviation and land transport markets, through its global network of partner banks. In this context, ITF Suisse leverages DVB’s research expertise in
Syndicated transport finance volumes
90
75
60
45
30
15
0
82.8
59.5
2008
25.1
17.4
2009
49.2
36.9
2010
66.8
51.6
2011
50.3
38.1
2012
US$ bn € bn Source: Dealogic, December 2012

109
DVB Bank SE | Group Annual Report 2012
T HE C OMPA N Y F IN A NCI A L A ND EqUI T Y M A RK E T S GROUP M A N AGE M E N T R E P OR T C ONSOL IDAT E D F IN A NCI A L S TAT E MEN T S
ITF International Transport Finance Suisse AG
ITF Suisse – Portfolio analysis
In 2012, ITF Suisse was presented with 73 financing opportunities with a total volume of €1.6 billion (2011: 66 financings with a total volume of €1.4 billion). After being evaluated, eight of these transactions with an aggregate volume of €152.9 million were realised during the year under review (2011: eight transactions with an aggregate volume of €252.6 million). New business originated continued to be subject to critical risk analyses. The low-risk profile of new business affirmed ITF Suisse’s positioning and interest agreements covered the still-high funding costs.
ITF Suisse’s customer lending amounted to €927.5 million as at 31 December 2012, comprising aggregate financings of €853.2 million, disbursed during 2012, and irrevocable loan commitments of €74.3 million. 77.5% (or €719.1 million) of cus-tomer lending was composed of exposures collateralised by ship mortgages, with the remaining 22.5% (€208.4 million) in collateralised aircraft financings. The entire portfolio is collater-alised by first-ranking liens on the financed assets.
Five of the maritime shipping finance exposures, with an aggregate volume of €137.1 million, were on the Watch List as at 31 December 2012 (2011: nine exposures, €202.7 million). For one of these exposures (amounting to €9 million), the vessels had already been sold via an auction. Expected realisation pro-ceeds cover the outstanding loan amount in full. Restructuring has been completed for two further transactions, with negotiations ongoing for the remaining two exposures. ITF Suisse emphasises so-called “pay-as-you-earn” concepts for any restructuring, whereby repayment schedules are brought into line with forecast charter rates. In this way, the shortfalls in repayments expected to be incurred until a full market recovery can be offset by special redemptions at a later stage during the term of the loan. For all exposures, full loan repayment is ensured within the vessels’ normal economic lifetime.
ITF Suisse – Market and portfolio outlook 2013
ITF Suisse has established itself in the market as a syndication partner for banks for the financing of transport assets. Since the syndication market itself is still clearly burdened by the financial markets crisis, which has been ongoing for more than four years, no sustained recovery is expected for 2013 either. Sovereign debt crises, excess capacity in various maritime shipping sectors, and strong regional divergence in air transport developments – these factors do not yet point towards a return to normality. On the other hand, various market participants are no longer willing or able to provide financing to the transport industry. This reduced supply of financings provides ITF Suisse with opportunities for attractive new business. Hence, ITF Suisse will use existing and new contacts in order to originate new business in excess of US$400 million during 2013. In this context, ITF Suisse continues to emphasise the importance of risk analyses and assessments, in order to keep risk exposure from new business at a low level – in line with its restrictive lending policy. Monitoring and closely managing existing exposures is also a top priority. To date, ITF Suisse has been able to successfully restructure all its problem loans, also drawing on the support of DVB’s experts. This close co-operation will also be available – and realised when needed – during 2013.
The interbank market is expected to trend sideways during 2013, with no signs of any normalisation or return to pre-2008 condi-tions. We expect differentiated development to persist amongst individual sectors of international maritime shipping. In the con-tainer, crude oil tanker and dry bulk shipping sectors, oversupply is set to prevail throughout 2013, given that capacity on offer is expected to once again outgrow demand. New aircraft orders expected during the forecast period are also likely to increase excess supply. For a more detailed assessment of developments on the international transport markets during the forecast period 2013, please refer to pages 155–156 of this report.
ITF Suisse aims to generate moderate growth during 2013, as in the previous year. Continuous, timely risk monitoring will be essential for this purpose, observing the relevant markets, as will maintaining regular contact and exchange with syndication lead managers and with DVB’s experts.
Shipping finance 77.5%
Aviation finance 22.5%
Aggregate financing volume by transport sector

110
DVB Bank SE | Group Annual Report 2012
• Allowanceforcreditlossesroseby19.4%,from€59.2millionin2011to€70.7million.Specificallowanceforcredit losseswasrecognisedintheamountof€61.6million(2011:€54.7million);portfolio-basedallowanceforcreditlosseswasrecognisedintheamountof€9.4million(2011: €4.3million);and€0.3millioninprovisionswasreleased(2011:€0.2millionrecognised).Accordingly,netinterestincomeafterallowanceforcreditlossesdeclinedby20.0%,to €159.3million(2011:€199.1million).
• Netfeeandcommissionincome,whichprimarilyincludesfeesandcommissionsfromthelendingbusiness,aswell asassetmanagementandadvisoryfees,grewtoanewrecordlevelof€130.7million,up12.5%year-on-year(2011:€116.2million).
• Netotheroperatingincome/expensesincreasedfrom €17.3millionto€42.7million.Otheroperatingincomeof€73.0million(2011:€26.4million)alsoincludedincomefromthedeconsolidationofDVB’sshareholdinginTESHoldingsLtd,theBritishaeroenginespecialist.
• Burdenedbystill-volatilenetresultfromfinancialinstru-mentsinaccordancewithIAS39(downfrom€4.4million to €–15.8million),consolidatednetincomebeforetaxesdecreasedby4.3%to€141.4million(2011:€147.7million).
• ThekeystrategicindicatorsthatDVBGroupusestomanageitsbusinessreflectedthesuccessfuldevelopmentofbusi-ness:thereturnonequitybeforetaxeswas12.9%(2011:14.0%),andthecost/incomeratiostoodat46.5%(2011:47.8%).
• At€25.1billion,thevolumeofbusinessin2012wasup5.0%onthepreviousyear(2011:€23.9billion).Besidestotalassetsof€23.8billion(2011:€22.0billion),thefigurealsoincludesirrevocableloancommitmentsof€1.3billion(2011:€1.9billion).
DVBpostedverygoodresultsfor2012,generating€157.2millioninconsolidatednetincomebeforeIAS39 andtaxes,up9.7%year-on-year(2011:€143.3million). Totalincomeincreasedby2.6%,from€332.7millionto €341.2million.
AgainstthebackgroundoftheongoingEuropeansovereigndebtcrisisandthecontinueddifficultbusinessenvironmentinsomeinternationalmaritimeshippingsegments,DVB’sbusinessmodel onceagainproveditselftoberesilientandprofitable.Incontrast, numerouscompetitorswithdrewfromthefinancingmarket.ThesewereDVB’skeysuccessfactorsin2012:
• aconsistentstrategicfocusonfinancingtransportassets;• ahighlydiversifiedcreditportfolio;• DVB’scoreriskmanagementskillsprovidingthebasisforthe
Bank’slendingbusiness;• matched-maturityfunding;• astrongcapitalbaseinaccordancewithBaselII,which
alreadycomplieswiththefutureBaselIIIregime(totheextentthattherespectiverulesareknowntoday);and
• experiencedstaff.
Financial assessment of business performance in 2012
Thefollowingfinancialdetailsareworthnotingwhenassessingthispositivebusinessperformance:
• InShippingFinance,AviationFinanceandLandTransportFinance158newtransactionswithanaggregatevolumeof€4.6billionwereconcluded(2011:184newdealsrepresenting avolumeof€5.6billion).Basedonagenerallycycle-neutrallendingpolicy,DVBcontinuedtosuccessfullyimplementitstried-and-testedstrategyofpricingexposuresinlinewiththerisksinvolved.Itachievedanaveragemarginof352basispointsonnewTransportFinancebusiness(2011:313basispoints).
Financial position and performance

111
DVB Bank SE | Group Annual Report 2012
T HE C OMPA N Y F IN A NCI A L A ND EqUI T Y M A RK E T S GROUP M A N AGE M E N T R E P OR T C ONSOL IDAT E D F IN A NCI A L S TAT E MEN T S
Business framework in 2012
Regional differences in transport markets
In 2012, economic developments varied significantly across different regions. Whilst Europe saw controversial discussions concerning the continuation of financial aid to Greece, the US was threatened by the fiscal cliff at the end of the year. The tax increases and government spending cuts discussed might have triggered renewed recessionary trends. The parties to this budget dispute only reached agreement on 2 January 2013. Emerging markets once again benefited from above-average economic growth. In contrast, the US only posted limited growth, whilst economies across much of Europe stagnated. Thanks to its prevailing strength in exports outside Europe, Germany held its position at the top of the European economic ranking. Driven by economic development, regional transport submarkets also showed a diverging trend: where transport demand grew, this positive trend was partially superimposed and compensated by stronger growth in supply.
Developments in the key shipping markets
Sections of maritime shipping continued to be characterised by excess capacity during 2012. This mainly affected container carriers, crude oil tankers and dry bulk carriers – measured in terms of transport volumes and services, these are the three most important segments in maritime shipping. The persistent excess capacity was caused by the fact that rising demand was countered by even stronger supply growth, due to new tonnage pushing onto the market. In fact, global deliveries of new ships hit a historical high of approximately 3,300 units in 2012. Hence, charter and freight rates – as well as asset values – remained under pressure.
• Globalseacontainertransportvolumesincreasedbyapproxi-mately 5% during the year under review (2011: approximately 7%). Line operators continued to adopt a cautious stance when chartering tonnage in 2012, which is reflected in the development of time charter rates. The Clarksons time charter rate index for container carriers, which has been calculated since 1993, remained between 40 and 45 index points on a monthly basis throughout the year. In December 2012, it stood at 42 index points (December 2011: 46 index points). The business environment for container shipping deteriorated significantly during the four crisis years spanning 2008–2012: The container vessel time charter index still averaged 92 index points during 2008 – but, triggered by the collapse of Lehman Brothers in September 2008, it tumbled to an average of just 35 index points for 2009. Having recovered to an average of 51 index points for 2010 and 63 index points for 2011 respec-tively, the index value fell back to an annual average of 43 index points for 2012.
• According to the International Energy Agency’s December report, global demand for crude oil grew by one per cent year-on-year on average. Whilst the increase in demand from emerging markets was clearly higher, energy demand declined in Europe and stagnated in the US. The generally positive development in demand for tanker shipping was also met with significant expansion of capacity in this segment. The continued excess supply led to unchanged high pressure on freight and charter rates.
• TheperformanceoftheBalticExchangeDryIndex(BDI)–thefreight rate index for the transportation of dry bulk goods – mirrored this persistent market weakness: after a level of 1,738 points on 23 December 2011 the BDI closed out the year on 24 December 2012, the last day of index quotation for the year, at 699 points. The BDI hit its yearly low of 647 index points on 3 February 2012. The market deterioration of the last four crisis years is illustrated by a comparison of yearly BDI averages: after an average of 6,413 index points for 2008, the BDI fell to an average of just 2,617 index points in 2009. An average level of 2,758 index points for 2010 was followed by further decreases in 2011 (1,549 index points) and 2012 (920 index points). Once again, this significant decline was due to a supply expansion – despite dry bulk shipping demand increasing during 2012 by close to 5%.
Thus, vessel values once again failed to recover. The prices for both newbuilds and second-hand vessels remained at 2010 levels, or – depending on the vessel size – even slightly below. Given the importance of these three market segments for world trans-portation volumes, the fact that container, crude oil and bulk carriers represented 40.7% of DVB Group’s broadly-diversified Shipping Finance portfolio (2011: 41.3%) made the exposure quite balanced.
Financial position and performance
We have discussed in detail the business framework deter-mining DVB’s financial position and performance, and its consolidated financial statements (including the notes) in the market analyses of Shipping Finance (pages 44–47), Aviation Finance (pages 60–65), Land Transport Finance (pages 78–82), Financial Institutions (pages 96–97), Investment Management (pages 102 and 105), and ITF Suisse (page 108). Reference is made in full to these observations.
Anhang112
DVB Bank SE | Group Annual Report 2012
Effects of the US dollar/euro exchange rate
The year 2012 was a turbulent one for the euro, once again overshadowed by the European sovereign debt crisis. Whilst the euro still posted gains compared to the US dollar during the first quarter of 2012, with the exchange rate rising to above US$1.34 by the end of February, the currency lost ground until the summer, against the background of growing concerns about the continued existence of the European single currency. The euro thus fell to its yearly low of US$1.21 at the end of July 2012. However, the euro largely recovered during the second half of the year: thanks to the ECB’s crisis management, the single currency visibly stabilised during September. This was supported by a decision from the German Constitutional Court which gave the ESM and the fiscal pact the “green light” for in September 2012. Toward the end of the year, the euro benefited additionally from the pro-gress made with the OMT bond repurchasing programme, as well as from the release of further aid for Greece. Given these conflicting factors, the €/US$ exchange rate closed the year 2012 at a rate of US$1.32, up three cents from the previous year-end (US$1.29).
Due to the currency fluctuations described above, nominal con-solidated customer lending volume showed greater increases on a euro basis (+2.3% to €22.2 billion) than in dollar terms (+3.9% to US$29.2 billion). 88.6% of the overall volume of Transport Finance customer lending was denominated in US dollars, repre-senting 89.3% of the lending business in Shipping Finance and 98.4% in Aviation Finance. The euro/US dollar exchange rate also had a considerable bearing on the net interest and net fee and commission income generated in these two largest Transport Finance segments. In contrast, only 42.1% of the lending volume in the Land Transport Finance division is denominated in US dollars, so that the income generated in this segment was less susceptible to exchange rate movements.
Earnings that were mostly US-dollar-denominated were offset by costs that were mainly incurred in euro. DVB uses derivatives for the respective plan year in order to hedge the net US dollar income: accordingly, these revenues remain largely unaffected by fluctuations in the exchange rate during the course of the year.
Development of crude oil prices
Crude oil prices remained at elevated levels throughout 2012. The spot price for the key European Brent (London) grade reached US$110.80 per barrel on 31 December 2012, up from US$108.09 per barrel the year before. In contrast, the spot price for the US-traded key West Texas Intermediate grade declined to US$91.83 per barrel until 31 December 2012 (year-end 2011: US$98.83 per barrel), reflecting increased oil production in the US. On a yearly average, however, prices for this grade were in line with the previous year’s level.
Development of equity markets, the DVB share, and DVB’s ratings
Following a brief uptrend at the beginning of the year, European equity markets suffered massive losses during the first months of 2012. A gloomy global economic outlook and revived fears about the continued existence of the euro zone influenced investor behaviour – and thus equity market levels. At times, the German blue-chip index DAX index fell below 6,000 index points, stabi-lising around 6,500 points at the mid-year point. Against this background, the DAX closed the year 2012 at 7,612 points, up 29.1% (31 Dec 2011: 5,898 points). Other European and overseas equity markets also posted significant year-on-year gains.
Although bank shares fell under pressure throughout 2012, DVB’s share price proved to be satisfactorily robust under the described market conditions. Over the course of 2012, the volatility of DVB shares was moderate on subdued trading. The highest price for the year of €25.50 was touched on 10 April 2012. The lowest price of €22.05 was recorded on 2 July 2012. The year-end share price was €24.26. Accordingly, the Bank’s market capitalisation at the close of 2012 was €1.1 billion. The comparatively stable share performance is attributable to the ongoing and similarly stable development of the Bank’s business, and also to the narrow market in which the shares trade, due to the low free float.
Since December 2011, DVB Bank SE has been rated A+/A-1/stable by ratings agency S&P. These ratings remained unchanged in 2012. In early 2012, DVB Bank SE was rated A1/P-1/D+/negative by Moody’s. In the course of a pan-European rating review of banks which commenced in February 2012, Moody’s changed the ratings grades of several German banks and their subsidiaries in June. In this context, DVB’s ratings were also downgraded significantly, by up to three notches, in several rating categories. This resulted in a significant divergence from the Bank’s S&P ratings, as well as vis-à-vis the A+/F1+ rating assigned by Fitch within the framework of the German Cooperative Financial Services Network. Due to this divergence, the Bank terminated its rating agreements with Moody’s in July, with effect from November 2012.
Financial position and performance

Anhang 113
DVB Bank SE | Group Annual Report 2012
T hE c ompA n y f in A nci A l A nD Equi T y m A Rk E T S group m a n age m e n t r e p or t c onSol iDAT E D f in A nci A l S TAT E mEn T S
Financial performance
Income
DVB’s income rose by 2.6% in 2012, from €332.7 million to €341.2 million.
Net interest income after allowance for credit losses
net interest income after allowance for credit losses declined by 20.0%, from €199.1 million to €159.3 million. net interest income was down 11.0%, from €258.3 million to €230.0 million, whereby higher interest expenses more than offset higher interest income. The detailed breakdown is as follows:
The aggregate of interest income and current income increased by 10.3%, from €895.9 million to €987.8 million, and was com-posed of the following items:
• €734.6 million (+15.8% year-on-year; 2011: €634.6 million) generated almost exclusively from loans to international transport clients;
• €40.1 million (+17.6%; 2011: €34.1 million) from finance leases;
• €13.5 million (+5.5%; 2011: €12.8 million) from bonds and other fixed-income securities;
• €198.8 million (–6.5%; 2011: €212.6 million) in current income from operating leases, derived largely from those funds managed by the investment management division included in consolidation;
• €0.8 million (–55.6%; 2011: €1.8 million) in current income from equity investments and other investment securities (such as joint ventures).
The marked increase in interest income from the lending business was due to average interest margins generated on new business originated during 2012; these margins were adequate relative to the risk exposures assumed:
interest expenses rose from €637.6 million to €757.8 million (up 18.9%), comprising:
• €594.1 million (+21.7% year-on-year; 2011: €488.1 million) in refinancing costs for the Transport finance lending business;
• €148.0 million (+12.9%; 2011: €131.1 million) in expenses for operating leases;
• €15.7 million (–14.7 %; 2011: €18.4 million) in expenses for subordinated capital.
Financial position and performance
Financial performance (€ mn)
2012
2011
%
interest income 788.2 681.5 15.7
current income 199.6 214.4 –6.9
interest and similar income 987.8 895.9 10.3
interest expenses –757.8 –637.6 18.9
net interest income 230.0 258.3 –11.0
Allowance for credit losses –70.7 –59.2 19.4
net interest income after allowance for credit losses 159.3 199.1 –20.0
fee and commission income 139.0 122.8 13.2
fee and commission expenses –8.3 –6.6 25.8
net fee and commission income 130.7 116.2 12.5
results from investments in companies accounted for using the equity method 8.5 0.1 −
net other operating income/expenses 42.7 17.3 −
Income 341.2 332.7 2.6
Basis points 2012 2011 2010 2009 2008
Shipping finance 349 304 331 333 180
Aviation finance 380 325 338 375 214
land Transport finance 281 280 218 363 179
iTf Suisse 308 283 292 244 115

Anhang114
DVB Bank SE | Group Annual Report 2012
Allowance for credit losses by business division 2011 (€ mn)
Additions
Reversals
Direct write-offs
Recoveries on loans and
advances previously written off
Total
Shipping Finance –57.1 21.7 –0.3 1.6 –34.1
Aviation Finance –16.2 10.8 – 1.0 –4.4
Land Transport Finance –0.1 0.1 – – 0.0
Investment Management –14.5 4.4 – 1.8 –8.3
Business no longer in line with DVB’s strategy –9.0 0.9 –0.1 0.4 –7.8
Other 0.0 0.1 –0.2 0.0 –0.1
Total specific allowance for credit losses –96.9 38.0 –0.6 4.8 –54.7
Shipping Finance –2.6 0.4 – – –2.2
Aviation Finance –3.1 2.0 – – –1.1
Land Transport Finance –0.1 0.1 – – 0.0
Investment Management – – – – –
Business no longer in line with DVB’s strategy –0.5 0.1 – – –0.4
Other –1.2 0.6 – – –0.6
Total portfolio-based allowance for credit losses –7.5 3.2 – – –4.3
Aviation Finance –0.2 – – – –0.2
Total provisions –0.2 – – – –0.2
Total –104.6 41.2 –0.6 4.8 –59.2
Allowance for credit losses comprised specific as well as portfolio-based allowance for credit losses, and provisions. Specific allowance for credit losses (2012: €61.6 million; 2011: €54.7 million) and portfolio-based allowance for credit losses (2012: €9.4 million; 2011: €4.3 million) recognised in the income statement were above the previous year’s level. Provisions were released in the amount of €0.3 million.
The following two tables show the development, broken down by business division, for 2011 and 2012:
Net allowance for credit losses increased by 19.4%, from €59.2 million to €70.7 million.
Financial position and performance
€ mn 2012 2011 %
Additions –149.7 –104.6 43.1
Reversals 82.1 41.2 99.3
Direct write-offs –7.3 –0.6 −
Recoveries on loans and
advances previously written off 4.2 4.8 –12.5
Net allowance
for credit losses –70.7 –59.2 19.4

Anhang 115
DVB Bank SE | Group Annual Report 2012
T HE C OMPA N Y F IN A NCI A L A ND EqUI T Y M A RK E T S GROUP M A N AGE M E N T R E P OR T C ONSOL IDAT E D F IN A NCI A L S TAT E MEN T S
The following developments were recorded for the individual portfolios in 2012:
• ShippingFinance €70.7 million allowance for credit losses in total, comprising: €115.0 million added (specific and portfolio-based allowance
for credit losses) or directly written off, €44.3 million released or recovered on written-off loans
and advances.
• AviationFinance €4.6 million allowance for credit losses was released in
total, comprising: €22.5 million added (specific and portfolio-based allowance
for credit losses), €27.1 million released (comprising specific and portfolio-
based allowance for credit losses, and provisions).
• InvestmentManagement €4.6 million allowance for credit losses in total, comprising: €8.8 million added through specific allowance for credit
losses, €4.2 million released or recovered on written-off loans
and advances.
• BusinessnolongerinlinewithDVB’sstrategy €2.7 million allowance for credit losses was released in
total, comprising: €1.2 million added in form of specific allowance for credit
losses, €3.9 million released or recovered on written-off loans
and advances.
Financial position and performance
Allowance for credit losses by business division 2012 (€ mn)
Additions
Reversals
Direct write-offs
Recoveries on loans and
advances previously written off
Total
Shipping Finance –80.8 26.7 –7.1 0.5 –60.7
Aviation Finance –16.5 21.2 − − 4.7
Land Transport Finance –0.2 0.2 − − 0.0
Investment Management –8.8 1.3 0.0 2.9 –4.6
ITF Suisse –1.7 − − − –1.7
Business no longer in line with DVB’s strategy − 0.1 − 0.7 0.8
Other − 0.0 –0.2 0.1 –0.1
Total specific allowance for credit losses –108.0 49.5 –7.3 4.2 –61.6
Shipping Finance –27.1 17.1 − − –10.0
Aviation Finance –6.0 5.6 − − –0.4
Land Transport Finance –0.3 0.3 − − 0.0
Investment Management − − − − −
ITF Suisse –7.1 5.1 − − –2.0
Business no longer in line with DVB’s strategy –1.2 3.1 − − 1.9
Other − 1.1 − − 1.1
Total portfolio-based allowance for credit losses –41.7 32.3 − 0.0 –9.4
Aviation Finance − 0.3 − − 0.3
Business no longer in line with DVB’s strategy − 0.0 − − 0.0
Total provisions − 0.3 − − 0.3
Total –149.7 82.1 –7.3 4.2 –70.7

116
DVB Bank SE | Group Annual Report 2012
Financial position and performance
Net fee and commission income
Consolidated net fee and commission income, which primarily includes fees and commissions from lending business, and increasingly asset management and advisory fees, reached a record level of €130.7 million (2011: €116.2 million, up 12.5%).
Net fee and commission income rose across all divisions: • to€62.4 million in Shipping Finance (up 1.6%);• to€36.8 million in Aviation Finance (up 6.7%);• to€7.5 million in Land Transport Finance (up 23.0%); and• to €4.4 million in Investment Management (2011: €–3.6 million).
Fee and commission income in total amounted to €139.0 million (+13.2%). A notable 12.9% increase was seen in fee and commis-sion income generated in the lending business – to €113.0 million, as a result of higher commitment commissions achievable on the market during the course of the year.
The figure was offset by fee and commission expenses of €8.3 million – including, in particular, expenses for the issuance of two bearer bonds, expenses incurred in the lending business (€0.8 million), and for guarantees and indemnities (€0.7 million).
Results from investments accounted for using the equity method
Results from investments in companies accounted for using the equity method grew from €0.1 million to €8.5 million.
Net other operating income/expenses
Net other operating income/expenses rose from €17.3 million to €42.7 million.
Other operating income grew from €26.4 million to €73.0 million. This figure includes €43.9 million for the deconsolidation of companies held in the Investment Management division and DVB’s subsidiary TES Holdings Ltd, Bridgend, Wales. On 14 June 2012, the Bank sold a 60% stake in this British aero engine specialist to two renowned Japanese investors. The two new partners – Mitsubishi Corporation, and Development Bank of Japan, Inc. – acquired 35% and 25%, respectively. DVB Holding GmbH, a subsidiary of DVB Bank SE, remains the largest share-holder, with a share of 40%. Miscellaneous other operating expenses amounted to €30.3 million (2011: €9.1 million).
Total allowance for credit losses (composed of specific and portfolio-based allowance for credit losses, and provisions) declined by 0.3% as at 31 December 2012, from €149.0 million to €149.5 million. The following items make up the majority of the figure:
€85.1 million for the Shipping Finance portfolio €37.5 million for the Aviation Finance portfolio €9.7 million for the Investment Management portfolio €9.3 million for business that is no longer in line with DVB’s
strategy €6.1 million for the ITF Suisse portfolio €1.7 million for the Land Transport portfolio
As in the previous year, no country risk provisions were required. The Structured Asset Financing’s credit exposures of DVB’s Shipping Finance, Aviation Finance and Land Transport Finance business divisions are almost exclusively collateralised by the transport assets we finance; thus, at only 0.7% (2011: 0.5%) in terms of net risk exposure, the share of commitments that involve a high degree of country risk was once again very low.
For details on the development of allowance for credit losses please see the report on opportunities and risks (page 146–148). It portrays the changes by business division and region, among other things.

117
DVB Bank SE | Group Annual Report 2012
T HE C OMPA N Y F IN A NCI A L A ND EqUI T Y M A RK E T S GROUP M A N AGE M E N T R E P OR T C ONSOL IDAT E D F IN A NCI A L S TAT E MEN T S
Financial position and performance
Consolidated net income before IAS 39 and taxes
Consolidated net income before IAS 39 and taxes rose by 9.7%, from €143.3 million to €157.2 million. General administrative expenses, deducted from income, were down 2.9%, to €184.0 million, mainly reflecting the deconsolidation of the TES Holdings Ltd subsidiary.
Staff expenses
Staff expenses of €101.5 million were down 6.9% year-on-year (2011: €109.0 million). This was attributable to lower wages and salaries (down 8.3%, to €88.0 million), due to the deconsolidation of TES mentioned above; in addition, the provisions recognised for variable remuneration were lower than in the previous year.
Staffing levels developed as follows:
The number of employees rose by ten (+1.8%), to 558 persons at the 2012 year-end. With 305 employees, staff levels in our core Transport Finance and Investment Management business divisions during 2012 were 0.3% below the previous year’s level (2011: 306 employees). With 199 employees, staffing levels in the products and service units rose by ten staff members (+5.3% compared to the year-end 2011). The number of employees at DVB’s subsidiary DVB LogPay GmbH rose by 1.9% to 54 staff members (year-end 2011: 53 employees).
Non-staff expenses
At €77.9 million, non-staff expenses were up 3.0% on the previous year (2011: €75.6 million). The key factors behind this increase were:
• advisoryexpensesof€28.6 million (2011: €25.7 million), which break down as follows:
– €13.5 million for legal and audit expenses (including €2.2 million for the audit of the financial statements and other advisory services); as well as
– €15.1 million for other advisory services (including IT consultancy expenses);
• ancillarylabourcostsof€17.7 million (2011: €16.8 million);
• occupancyexpensesof€6.7 million (2011: €9.5 million); as well as
• contributions and fees of €11.7 million (up 42.7%; 2011: €8.2 million), particularly for the bank levy and the deposit insurance scheme of the National Association of German Cooperative Banks (BVR).
Depreciation, amortisation, impairment and write-ups
Depreciation, amortisation, impairment and write-ups decreased by 4.2%, from €4.8 million to €4.6 million.
€ mn 2012 2011 %
Income 341.2 332.7 2.6
Staff expenses –101.5 –109.0 –6.9
Non-staff expenses –77.9 –75.6 3.0
Depreciation, amortisation,
impairment and write-ups –4.6 –4.8 –4.2
General
administrative expenses –184.0 –189.4 –2.9
Consolidated net income
before IAS 39 and taxes 157.2 143.3 9.7

Anhang118
DVB Bank SE | Group Annual Report 2012
Development of consolidated net income
Consolidated net income rose by 13.1%, from €110.4 million to €124.9 million.
Consolidated net income before taxes (€141.4 million) was subject to an income tax burden of €16.5 million, including current taxes in the amount of €22.1 million and income related to deferred taxes of €5.6 million. Consolidated net income thus amounted to €124.9 million. Consolidated net income attributable to non-controlling interests changed to €–1.7 million (2011: €3.3 million). This reflects the share of results economically attributable to non-controlling shareholders in consolidated entities. Consoli-dated net income attributable to shareholders of DVB rose by 18.2%, from €107.1 million to €126.6 million.
Distributable profit and appropriation of profits
Distributable profit remained stable at €27.9 million. €98.7 million (+24.6% year-on-year from €79.5 million) was transferred from current operations to retained earnings.
We will propose to DVB Bank SE’s Annual General Meeting, which will be held on 13 June 2013, to pay a dividend of €0.60 per notional no-par value share for the 2012 business year, to be paid from DVB Bank SE’s net retained profit. This represents a dividend yield of 2.47%, based on the year-end share price of €24.26.
Consolidated net income before taxes
Consolidated net income before taxes declined by 4.3%, from €147.7 million to €141.4 million.
Net result from financial instruments in accordance with IAS 39 deteriorated from €4.4 million to €–15.8 million. Strong volatility in the interest rate and foreign exchange markets throughout 2012 was reflected in the following items:
• The trading result amounted to €2.0 million (2011: €–0.6 million), including standalone derivatives in the trading portfolio.
• Ontheotherhand,thehedgeresult(hedgeaccounting)wasdown to €0.7 million (2011: €10.7 million); this figure comprises underlying transactions and derivatives with effective hedge relationships.
• Theresultfromtheapplicationofthefairvalueoptioninaccordance with IAS 39 amounted to €0.0 million (2011: €–0.4 million), and included the previous year’s designated hedged items and associated derivatives.
• Theresultfromderivativesenteredintowithoutintentiontotrade declined from €–3.9 million to €–21.1 million.
• The result from investment securities improved from €–1.4 million to €2.6 million.
Financial position and performance
€ mn 2012 2011 %
Consolidated net income 124.9 110.4 13.1
Profit carried forward 0.0 0.0 −
Consolidated
net income attributable
to non-controlling interests 1.7 –3.3 −
Transfer to retained earnings –98.7 –79.2 24.6
Distributable profit 27.9 27.9 0.0
€ mn 2012 2011 %
Consolidated net income
before taxes 141.4 147.7 –4.3
Income taxes –16.5 –37.3 –55.8
Consolidated net income 124.9 110.4 13.1
thereof: consolidated
net income attributable to
non-controlling interests –1.7 3.3 −
thereof: consolidated
net income attributable
to shareholders of DVB 126.6 107.1 18.2
€ mn 2012 2011 %
Consolidated net income
before IAS 39 and taxes 157.2 143.3 9.7
Trading result 2.0 –0.6 −
Hedge result 0.7 10.7 –93.5
Result from the application of
the fair value option 0.0 –0.4 −
Result from derivatives entered
into without intention to trade –21.1 –3.9 −
Result from
investment securities 2.6 –1.4 −
Net result from financial
instruments in accordance
with IAS 39 –15.8 4.4 −
Consolidated net income
before taxes 141.4 147.7 –4.3

Anhang 119
DVB Bank SE | Group Annual Report 2012
T HE C OMPA N Y F IN A NCI A L A ND EqUI T Y M A RK E T S GROUP M A N AGE M E N T R E P OR T C ONSOL IDAT E D F IN A NCI A L S TAT E MEN T S
Financial position
DVB’s total assets increased by a total of 8.2%, to €23.8 billion (2011: €22.0 billion).
Liabilities on the statement of financial position
Deposits from other banks were down 7.7%, from €5.2 billion to €4.8 billion. Deposits from customers increased by 15.6%, from €4.5 billion to €5.2 billion. Securitised liabilities were up by 16.3% as at the reporting date, from €9.8 billion to €11.4 billion, whilst subordinated liabilities were unchanged, at €0.4 billion.
Development of own funds
Own funds as defined by the German Banking Act (KWG) totalled €1,437.1 million, a 10.2% increase over the previous year (2011: €1,304.4 million).
Total tier 1 capital in accordance with section 10 (2a) of the KWG
Total tier 1 capital as defined by the KWG increased by 4.9% during 2012, to €1,236.0 million (2011: €1,178.8 million). Reserves increased by a total of 9.1%, from €1,039.0 million to €1,133.1 million.
Tier 2 capital in accordance with section 10 (2b) of the KWG, and eligible tier 3 capital in accordance with section 10 (2c) of the KWG
Tier 2 capital increased by 60.1%, to €201.1 million (2011: €125.6 million). Eligible subordinated liabilities rose by €100.0 million (or 67.1%) to €249.1 million. The regulatory capital requirements under Basel II were fulfilled at all times during the year under review. To ensure compliance with the Basel I floor rule pursuant to section 339 (5a) of the German Solvency Regulation (SolvV), which was once again extended, DVB raised an additional US$80 million in subordinated funds (as defined in section 10 (5a) of the KWG) in January 2012, until the profit to be retained for 2011 has been confirmed and recognised.
Capital ratios (KWG)
Since 2008, DVB has reported capital ratios determined in accord-ance with the provisions of the Basel II regime (Advanced Approach). On this basis, the tier 1 ratio was 20.3% (+0.6 percent-age points) and the total capital ratio was 23.6% (+1.8 percentage points), each calculated including the appropriation of profits.
Financial position and performance
Own funds as defined by the KWG (€ mn)
2012
2011
%
Issued and fully paid ordinary shares 111.9 112.4 –0.4
Capital reserve plus other reserves eligible for inclusion 292.1 272.7 7.1
Special items for general banking risks (section 340g of the HGB) 841.0 766.3 9.7
Other components of tier 1 capital 43.4 54.8 –20.8
Items deducted from tier 1 capital (section 10 (2a) sentence 2 of the KWG) –4.4 –3.9 12.8
Items deducted from tier 1 capital (sections 10 (6 and 6a) of the KWG) –48.0 –23.5 –
Total tier 1 capital 1,236.0 1,178.8 4.9
Total tier 2 capital before deductions and eligible tier 3 capital 249.1 149.1 67.1
Items deducted from tier 2 capital –48.0 –23.5 –
Tier 2 capital and eligible tier 3 capital 201.1 125.6 60.1
Net adjusted available capital plus total tier 3 capital1) 1,437.1 1,304.4 10.2
1) Taking into account reserves and transfer to reserves from consolidated net income
Capital ratios (Basel II)
% 2012 2011 Change
Tier 1 ratio 20.3 19.7 0.6 pp
Total capital ratio 23.6 21.8 1.8 pp

Anhang120
DVB Bank SE | Group Annual Report 2012
Refinancing
The Frankfurt-based Group Treasury is responsible for securing refinancing throughout the Group. The team also manages DVB’s trading activities at a centralised level, and hedges the market risk exposure of direct and indirect subsidiaries, thus indemnifying these entities against market risks. DVB conducts trading activities in risk management products for its own positions and on behalf of its clients. It does so in order to hedge against market risk exposure from the customer lending business, and to hedge profit contributions – which are predominantly generated in currencies other than the euro – against exchange rate fluctuations. With a diversified range of funding products, Group Treasury targets a broad spectrum of domestic and international investors. The product range represents an attractive offer to existing and new investors.
Funding activities – DVB established its euro-denominated benchmark curve, broadening the investor base
DVB continued to consistently implement its business model, which focuses on financing, structuring, and advisory services in the international Transport Finance business, throughout 2012. The Bank chose not to expose itself to the so-called credit surro-gate business, and was therefore protected against any direct negative impact from the markets crisis. Reflecting the general recovery of international financial markets, the rise in our funding costs has slowed down. We also once again succeeded in strengthening our investor base. As one of the milestones in our funding activities, we established a euro-denominated benchmark curve, achieving notable success with the public placement of two €500 million public euro-denominated bonds. The three- and five-year issues were both oversubscribed several times. More-over, we again placed €295 million and US$50 million in ship covered bonds. With a public 100 million Swiss franc bond issue,
we also successfully expanded our investor base outside Ger-many. Newly-originated promissory note loans placed with institutional investors also developed favourably, exceeding the one billion euro threshold for the first time in 2012.
Refinancing volume – currency breakdown
Given that our lending business in international Transport Finance is predominately US-dollar-based, it is very important for us to hedge our currency exposure; both by concluding derivatives and, to the extent possible, by matching the currency of assets and liabilities (natural hedges). We diligently pursued this objective in 2012: commercially, €4.7 billion (+4.4%) of our aggregate fund-ing was denominated in euro, whilst €15.0 billion (+7.9%) was denominated in US dollars and €0.2 billion in other currencies.
Financial position and performance
Liquidity profile
€ bn6
5
4
3
2
1
0
2013
2014
2015
2016
2017
2018
2019
2020
2021
2022
2023
> 2023
2099
Assets Liabilities
Currency breakdown of interest-bearing liabilities (economic assessment)
€ bn15.0
12.5
10.0
7.5
5.0
2.5
0,0
+4.4%
4.5 4.7
Euro
+7.9%
15.0
13.9
US dollar
2011 2012

Anhang 121
DVB Bank SE | Group Annual Report 2012
T HE C OMPA N Y F IN A NCI A L A ND EqUI T Y M A RK E T S GROUP M A N AGE M E N T R E P OR T C ONSOL IDAT E D F IN A NCI A L S TAT E MEN T S
Refinancing volume – maturity breakdown
As in the previous years, we adhered to our principle of matched-maturity funding in 2012. Thanks to this conservative approach, we already comply with future structural liquidity requirements under the Basel III regime which are currently being discussed (Liquidity Coverage Ratio and Net Stable Funding Ratio).
At year-end, the funding base included 97.5% long-term funds (2011: 97.4%). The liquidity profile with long-term maturities is shown below:
• 52.8% unsecuredbearerbonds (2011: 50.5%);
• 38.7% promissory note loans/long-term deposits (2011: 42.0%);
• 4.5% shipcoveredbonds (2011: 3.1%);
• 1.5% interest-bearingequityasdefinedbytheKWG (2011: 1.8%).
Short-term funding only accounts for 2.5% (2011: 2.6%); this funding volume mainly comprises short-term deposits from clients. In addition, DVB holds short-term bank deposits which are exclu-sively used for fine-tuning purposes.
Refinancing volume – structure of refinancing vehicles
A structural comparison of the individual refinancing vehicles shows the following trends: unsecured bearer bonds (long-term bond issues under the medium-term note programme) rose by 12.9% to €10.5 billion (2011: €9.3 billion). Long-term promissory
note loans were unchanged, at €7.7 billion. The volume of out-standing ship covered bonds rose to €0.9 billion (2011: €0.6 billion). Short-term deposits from other banks and customers decreased to €0.5 billion.
Return on equity and cost/income ratio
During 2012, DVB continued to use the return on equity (ROE) and the cost/income ratio (CIR) to manage its business – amongst other parameters. The ROE (before taxes) calculated in accord-ance with International Financial Reporting Standards (IFRS) declined by 1.1 percentage points, from 14.0% to 12.9%. The ROE was calculated as follows: consolidated net income before taxes (excluding consolidated net income attributable to non-controlling interests) of €143.1 million was divided by the total of the weighted capital (comprising the issued share capital, capital reserve and retained earnings – before consolidated net income for the period, and excluding existing actuarial gains and losses, the fund for general banking risks and non-controlling interests) of €1,109.9 million. The parameter was thus within the target range for 2012.
The CIR calculated in accordance with IFRS was reduced from 47.8% to 46.5%. The CIR is calculated in accordance with IFRS as follows: the general administrative expenses figure of €184.0 million was divided by €396.1 million (the total of net interest income (before allowance for credit losses), net fee and commission income, net result from financial instruments in accordance with IAS 39, results from investments accounting for using the equity method and net other operating income/expenses). The parameter was thus within the target range for 2012.
Financial position and performance
Structure of refinancing vehicles
€ bn12
10
8
6
4
2
0
0.0%
0.3 0.3
Interest-bearing equity
as defined by the KWG
–16.7%
0.6 0.5
Short-term deposits
from other banks/clients
+80.0%
0.9
0.5
Ship covered bonds
0.0%
7.7 7.7
Promissory note loans/
long-term deposits
+12.9%
10.5
9.3
Medium-term
note programme
2011 2012

Anhang122
DVB Bank SE | Group Annual Report 2012
Nominal volume of customer lending by business division
DVB’s nominal volume of customer lending (comprising loans and advances to customers, guarantees and indemnities, irrevo-cable loan commitments and derivatives) includes structured asset finance in Transport Finance, the fund management activi-ties in Investment Management, the activities on the interbank market of our subsidiary ITF Suisse and the exposures no longer in line with DVB’s strategy held by Transport Infrastructure and D-Marketing. New business in Shipping Finance, Aviation Finance, Land Transport Finance, Investment Management, and ITF Suisse increased customer lending by 2.3%, to €22.2 billion (2011: €21.7 billion). This was distributed across the business divisions as follows:
Net assets
Business volume
At €25.1 billion, the volume of business in 2012 was 5.0% higher than the previous year (2011: €23.9 billion). Besides total assets of €23.8 billion, the figure also includes contingent liabilities from irrevocable loan commitments of €1.3 billion.
Lending volume over time
Lending volume of €23.5 billion was up 5.4% on the previous year.
At €0.5 billion, loans and advances to banks were unchanged year-on-year. Loans and advances to customers rose by 6.4%, to €19.9 billion (previous year: €18.7 billion). The volume of securities (including equity investments) rose from €0.6 billion to €0.7 billion. Financial guarantee contracts from guarantees were unchanged year-on-year, at €0.2 billion. Contingent liabilities from irrevocable loan commitments declined to €1.3 billion (2011: €1.9 billion). As in previous years, DVB employed derivative instruments for internal hedging purposes, offering them (to a limited extent) to its clients as well. The volume of these derivatives held rose from €0.4 billion to €0.9 billion.
Financial position and performance
€ bn 2012 2011 %
Loans and advances to banks 0.5 0.5 0.0
Loans and advances
to customers 19.9 18.7 6.4
Securities
(including equity investments) 0.7 0.6 16.7
Financial guarantee
contracts from guarantees 0.2 0.2 0.0
Contingent liabilities from
irrevocable loan commitments 1.3 1.9 –31.6
Derivatives 0.9 0.4 –
Lending volume 23.5 22.3 5.4
Shipping Finance 53.6% (+1.5 pp)
Aviation Finance 31.1% (–0.7 pp)
Land Transport Finance 7.7% (+0.3 pp)
ITF Suisse 4.0% (–0.1 pp)
Investment Management 2.7% (–0.5 pp)
Business no longer in line with DVB’s strategy 0.9% (–0.5 pp)
Customer lending by business division (%)

Anhang 123
DVB Bank SE | Group Annual Report 2012
T HE C OMPA N Y F IN A NCI A L A ND EqUI T Y M A RK E T S GROUP M A N AGE M E N T R E P OR T C ONSOL IDAT E D F IN A NCI A L S TAT E MEN T S
grew by 1.1% in US dollar terms, to US$9.1 billion (2011: US$9.0 billion). In euro terms, it remained unchanged year-on-year, at €6.9 billion.
Earnings contributions
Earnings were analysed by comparing the development of the Transport Finance portfolios in the years 2011 and 2012. The portfolio is broken down into total and new exposures, with key ratios and indicators calculated for the respective items.
Financial position and performance
Portfolio analysis
Volume trends
In order to detail the effects of the exchange rate on the port-folios, we have analysed the development of lending volume by segment over a five-year period, both in euro and US dollar terms. The Shipping Finance portfolio grew by 7.5% in US dollar terms, to US$15.7 billion (2011: US$14.6 billion). Due to currency effects, the increase was lower in euro terms, namely 5.3% to €11.9 billion (2011: €11.3 billion). The Aviation Finance portfolio
Lending volume over time 2008 – 2012
2012 2011 2010 2009 2008€ bn % % % % %
Shipping Finance 11.9 53.6 11.3 52.1 10.3 53.6 9.1 52.6 10.5 56.8
Aviation Finance 6.9 31.1 6.9 31.8 5.6 29.2 5.2 30.1 4.9 26.5
Land Transport Finance 1.7 7.7 1.6 7.4 1.5 7.8 1.4 8.0 1.5 8.1
Investment Management 0.6 2.7 0.7 3.2 0.8 4.2 0.6 3.5 0.6 3.2
ITF Suisse 0.9 4.0 0.9 4.1 0.7 3.6 0.6 3.5 0.5 2.7
Business no longer in
line with DVB’s strategy 0.2 0.9 0.3 1.4 0.3 1.6 0.4 2.3 0.5 2.7
Total 22.2 100.0 21.7 100.0 19.2 100.0 17.3 100.0 18.5 100.0
2012 2011 2010 2009 2008US$ bn % % % % %
Shipping Finance 15.7 53.8 14.6 52.0 13.7 53.5 13.1 52.6 14.6 56.4
Aviation Finance 9.1 31.2 9.0 32.0 7.5 29.3 7.4 29.7 6.9 26.6
Land Transport Finance 2.2 7.5 2.1 7.5 2.0 7.8 2.0 8.1 2.1 8.1
Investment Management 0.8 2.7 0.9 3.2 1.0 3.9 0.9 3.6 0.9 3.5
ITF Suisse 1.1 3.8 1.1 3.9 0.9 3.5 0.8 3.2 0.7 2.7
Business no longer in
line with DVB’s strategy 0.3 1.0 0.4 1.4 0.5 2.0 0.7 2.8 0.7 2.7
Total 29.2 100.0 28.1 100.0 25.6 100.0 24.9 100.0 25.9 100.0
€/US$ reference rate
published by the ECB
(31 Dec)
1.2939
1.3362
1.441
1.39171.3194

Anhang124
DVB Bank SE | Group Annual Report 2012
New business
In Transport Finance 158 new transactions with an aggregate volume (final take) of €4.6 billion were originated (2011: 184 new deals with a volume of €5.6 billion). At €2.5 billion, the volume of new business in Shipping Finance was in line with the previous year, whilst in Aviation Finance it declined from €2.7 billion to €1.6 billion. In Land Transport Finance, it grew from €0.4 billion to €0.5 billion. DVB played a leading role in 85.1% of the new deals in the three Transport Finance divisions, up from 74.2% the year before. At 352 basis points, the average interest margin for the new Transport Finance business increased year-on-year (2011: 313 basis points).
Taking into account the total volume of DVB’s new business, including Investment Management and the business activities of ITF Suisse, 179 new transactions with an aggregate volume of €4.8 billion (2011: 210 new deals with an aggregate volume of €6.0 billion) were concluded, achieving an average margin of 348 basis points (2011: 309 basis points).
Total portfolio
The average LTV ratio of the individual Transport Finance seg-ments reflects the relation between loans granted and the market value of the financed transport assets. The ratio deteriorated slightly, rising by 3.9 percentage points in the total portfolio, to 75.6% (2011: 71.7%). This key parameter showed a mixed development across the Transport Finance portfolios. In Aviation Finance and Land Transport Finance, the LTV ratio declined by 0.5 and 1.8 percentage points, to 72.5% and 76.3%, respectively. Shipping Finance, however, saw a marked increase in the LTV ratio, from 69.9% to 76.2%.
The CIR decreased in all three Transport Finance segments: by 1.5 percentage points in Shipping Finance to 24.3%, by 0.9 per-centage points in Aviation Finance to 15.1% and by 2.8 percent-age points in Land Transport Finance to 14.1%. Again, the ROE development showed a mixed picture: in Shipping Finance, it was down 8.9 percentage points to 15.3%, whilst it increased by 9.4 percentage points in Aviation Finance (to 50.1%) and by 20.5 percentage points in Land Transport Finance (to 64.0%). The ROE in Investment Management rose by as much as 23.3 percent-age points, to 16.9%. It should be noted that the ROE and CIR indicators are determined excluding overheads; hence, they are not comparable to the ratios for the entire Bank.
Financial position and performance
Earnings contributions (€ mn)
Shipping Finance
Aviation Finance
Land Transport Finance
Investment Management
ITF Suisse Total
2012 2011 2012 2011 2012 2011 2012 2011 2012 2011 2012 2011 %
Total portfolio
Customer lending 11,865.0 11,287.1 6,901.5 6,917.6 1,655.7 1,613.9 601.1 702.7 852.6 882.8 21,875.9 21,404.1 2.2
Loans and advances
to customers 11,082.1 10,155.0 6,617.4 6,208.9 1,472.6 1,486.4 538.4 631.3 778.4 780.7 20,488.9 19,262.3 6.4
Loan commitments,
guarantees
and indemnities 782.9 1,132.1 284.1 708.7 183.1 127.5 62.7 71.4 74.2 102.1 1,387.0 2,141.8 –35.2
Number of customers
(primary obligor groups) 327 342 165 171 50 56 17 19 41 43 600 631 –4.9
Leading role (%) 81.8 78.1 84.0 77.6 65.2 60.4 95.7 84.3 3.2 5.5 78.6 73.8 4.8 pp
Average LTV ratio (%) 76.2 69.9 72.5 73.0 76.3 78.1 n/a n/a 90.2 73.1 75.6 71.7 3.9 pp
CIR (%)1) 24.3 25.8 15.1 16.0 14.1 16.9 25.0 140.0 23.3 20.7 46.5 47.8 –1.3 pp
ROE (%)2) 15.3 24.2 50.1 40.7 64.0 43.5 16.9 –6.4 6.7 15.0 12.9 14.0 –1.1 pp
New business
Number of
new transactions 96 93 50 78 12 13 13 18 8 8 179 210 –14.8
Underwritten 2,590.5 2,662.4 1,618.6 2,864.0 519.6 373.7 84.6 165.7 152.9 252.6 4,966.2 6,318.4 –21.4
Syndicated 47.4 139.2 72.6 183.3 − − − − − − 120.0 322.5 –62.8
Final take 2,543.1 2,523.2 1,546.0 2,680.7 519.6 373.7 84.6 165.7 152.9 252.6 4,846.2 5,995.9 –19.2
Leading role (%) 82.4 79.6 90.5 72.2 81.4 46.0 40.6 41.0 − − 81.7 69.9 11.8 pp
Average margin (bp) 349 304 380 325 281 280 200 200 308 283 348 309 39
1) Determined in accordance with IFRS – excluding the allocation of overhead expenses and before allowance for credit losses 2) Determined in accordance with IFRS – excluding the allocation of overhead expenses, after allowance for credit losses, and before taxes

Anhang 125
DVB Bank SE | Group Annual Report 2012
T HE C OMPA N Y F IN A NCI A L A ND EqUI T Y M A RK E T S GROUP M A N AGE M E N T R E P OR T C ONSOL IDAT E D F IN A NCI A L S TAT E MEN T S
Remuneration report
From its twelve office locations, the Bank offers customised products and advisory services to its clients in the shipping, aviation and land transport sectors. The structures of these financing solutions are often sophisticated and complex, span-ning multiple jurisdictions, and they are generally collateralised by the transport assets being financed.
DVB’s international lending business involves risk positions that are managed in accordance with the following regulations: lend-ing decisions are governed by the relevant lending authorities and lending policies. In accordance with the lending authorities, DVB’s lending decisions are taken on three levels:
• bytheShippingFinance,AviationFinanceandLandTransportFinance business divisions (specifically, by the responsible member of the Board of Managing Directors together with the Head of Credit);
• subject to approval by the entire Board of Managing Directors; and
• in certain circumstances, with the approval of the Supervisory Board’s Credit Committee.
Depending on the specific risk parameters that have been set, lending decisions below a certain limit can be made by the busi-ness divisions, together with the responsible member of the Board of Managing Directors, provided the extension of credit meets the criteria laid out in the lending policies. These lending policies stipulate guidelines regarding the type of financing, collateralisation by the financed asset, the term of the loan, the loan-to-value ratio, etc. Lending decisions require approval by the entire Board of Managing Directors where the exposure concerned exceeds the business divisions’ lending authorities, or is outside the scope of the lending policies. If a certain exposure limit is exceeded, approval must also be obtained from the Supervisory Board’s Credit Committee.
Regulatory requirements for remuneration systems
With the German Ordinance Regarding the Regulatory Require-ments for Remuneration Systems of Institutions (referred to in this section as the “Ordinance”) which came into effect on 13 October 2010, the German Federal Ministry of Finance has detailed the requirements for remuneration systems implemented by financial institutions, in the context of the German Banking Act. The Ordinance applies to all employees of DVB, at all locations.
Not a “material institution”
A distinction is made between (and different requirements applied to) “material institutions” and those which are not considered material for the purposes of the Ordinance. Banks such as DVB whose total assets amounted to not less than €10 billion but not more than €40 billion on the reporting dates of the last three financial years must determine, based on an internal risk analysis, whether they are “material institutions” or not. On the basis of a comprehensive analysis and self-assessment in December 2010, the Board of Managing Directors of DVB Bank SE reached the conclusion that DVB is not considered a material institution. Accordingly, the Bank only needs to comply with the general requirements set out in the Ordinance.
The result of the analysis can be summarised as follows: DVB’s business model is characterised by a moderate risk affinity. Risks assumed are transparent and manageable. Loans are only extended on the basis of strict lending policies, and following in-depth market and asset research carried out by DVB’s in-house research teams. Once DVB has assumed credit risks, it applies a sophisticated risk management system to continuously handle and monitor the exposure. In this way, the Bank ensures that financed assets can be realised if need be, for example, via secondary markets. Besides this traditional lending business, DVB does not offer any particularly risk-prone services such as investment banking or securities business.
“Risk takers”
Section 5 of the Ordinance sets out additional requirements for employees who exert a material influence on the Bank’s risk profile (so-called risk takers). Every institution is required to carry out a self-assessment in order to review and determine which individuals are considered risk takers. Having already carried out this self-assessment in December 2009 (with an update in December 2010), the Board of Managing Directors has determined that the Bank’s only risk takers are the three members of the Board of Managing Directors themselves. This decision is based on the following risk analysis underlying the self-assessment:
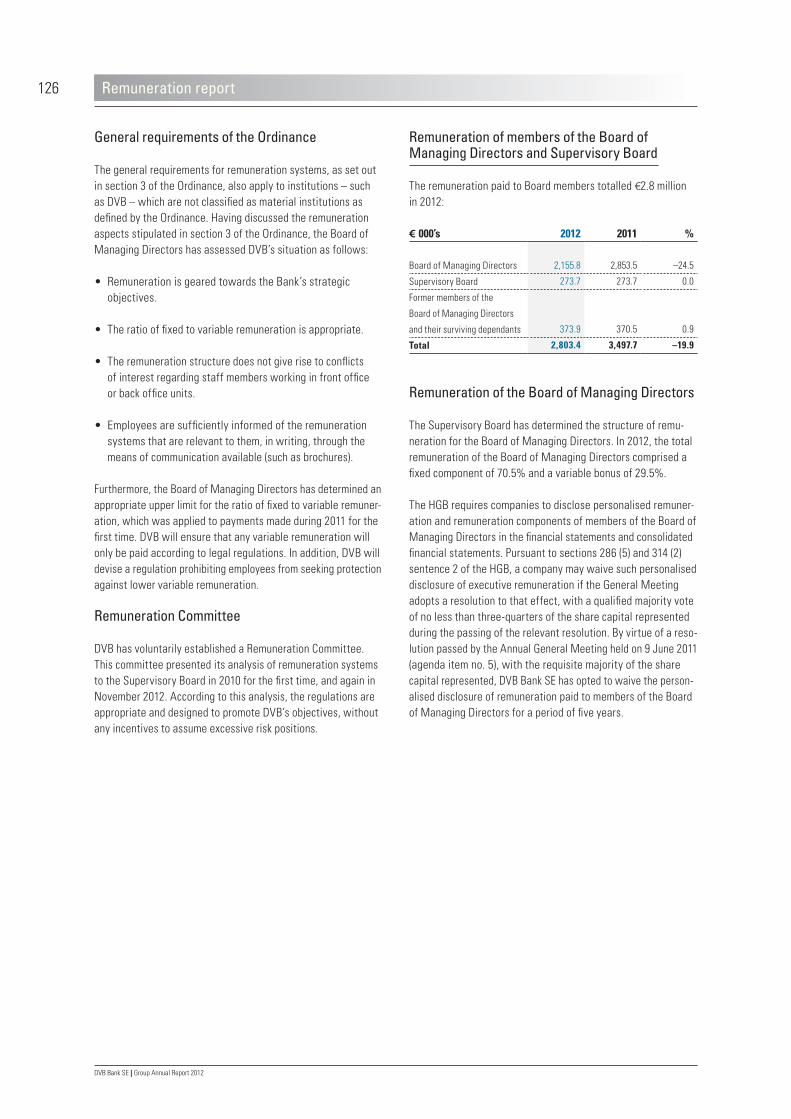
Anhang126
DVB Bank SE | Group Annual Report 2012
General requirements of the Ordinance
The general requirements for remuneration systems, as set out in section 3 of the Ordinance, also apply to institutions – such as DVB – which are not classified as material institutions as defined by the Ordinance. Having discussed the remuneration aspects stipulated in section 3 of the Ordinance, the Board of Managing Directors has assessed DVB’s situation as follows:
• Remuneration is geared towards the Bank’s strategic objectives.
• Theratiooffixedtovariableremunerationisappropriate.
• Theremunerationstructuredoesnotgiverisetoconflicts of interest regarding staff members working in front office or back office units.
• Employees are sufficiently informed of the remuneration systems that are relevant to them, in writing, through the means of communication available (such as brochures).
Furthermore, the Board of Managing Directors has determined an appropriate upper limit for the ratio of fixed to variable remuner-ation, which was applied to payments made during 2011 for the first time. DVB will ensure that any variable remuneration will only be paid according to legal regulations. In addition, DVB will devise a regulation prohibiting employees from seeking protection against lower variable remuneration.
Remuneration Committee
DVB has voluntarily established a Remuneration Committee. This committee presented its analysis of remuneration systems to the Supervisory Board in 2010 for the first time, and again in November 2012. According to this analysis, the regulations are appropriate and designed to promote DVB’s objectives, without any incentives to assume excessive risk positions.
Remuneration of members of the Board of Managing Directors and Supervisory Board
The remuneration paid to Board members totalled €2.8 million in 2012:
Remuneration of the Board of Managing Directors
The Supervisory Board has determined the structure of remu-neration for the Board of Managing Directors. In 2012, the total remuneration of the Board of Managing Directors comprised a fixed component of 70.5% and a variable bonus of 29.5%.
The HGB requires companies to disclose personalised remuner-ation and remuneration components of members of the Board of Managing Directors in the financial statements and consolidated financial statements. Pursuant to sections 286 (5) and 314 (2) sentence 2 of the HGB, a company may waive such personalised disclosure of executive remuneration if the General Meeting adopts a resolution to that effect, with a qualified majority vote of no less than three-quarters of the share capital represented during the passing of the relevant resolution. By virtue of a reso-lution passed by the Annual General Meeting held on 9 June 2011 (agenda item no. 5), with the requisite majority of the share capital represented, DVB Bank SE has opted to waive the person-alised disclosure of remuneration paid to members of the Board of Managing Directors for a period of five years.
Remuneration report
€ 000’s 2012 2011 %
Board of Managing Directors 2,155.8 2,853.5 –24.5
Supervisory Board 273.7 273.7 0.0
Former members of the
Board of Managing Directors
and their surviving dependants 373.9 370.5 0.9
Total 2,803.4 3,497.7 –19.9

Anhang 127
DVB Bank SE | Group Annual Report 2012
T HE C OMPA N Y F IN A NCI A L A ND EqUI T Y M A RK E T S GROUP M A N AGE M E N T R E P OR T C ONSOL IDAT E D F IN A NCI A L S TAT E MEN T S
Remuneration report
The cash bonus payments paid to members of the Board of Managing Directors are determined on the basis of agreements on operational targets. These objectives, which are agreed upon between the Supervisory Board and the respective member of the Board of Managing Directors for each business year, are related to objective criteria for the relevant business year (refer-ring to financial indicators such as economic value added and consolidated net income before taxes) as well as to the personal performance of each individual member of the Board of Managing Directors. The amount of the bonus depends on the measurable extent to which the targets were achieved.
As a prerequisite for the payout, no notice of termination may have been given with regard to the contract of the respective member of the Board of Managing Directors as at the time of payment, unless a member of the Board of Managing Directors retires from office for reasons of age, or due to non-renewal of a contract.
The cash bonus for the business year 2012 will be awarded in four tranches: 50% during 2013, and three tranches of 16.66% each, awarded during the following business years 2014 to 2016. Payment of these future tranches is conditional upon allowance for credit losses not exceeding a certain threshold during the year prior to disbursement. Moreover, all four bonus tranches are restricted to the effect that 50% of each tranche is subject to an additional one-year retention period. This means that these parts will not be disbursed immediately. During the retention period, the value of the retained amounts will be replaced by a remuneration instrument linked to the Bank’s performance.
Fixed remuneration component
The fixed remuneration component of DVB Bank SE’s Board of Managing Directors comprises monetary remuneration compo-nents, pension commitments and special benefits; in 2012 it totalled €1,520,585.10 (2011: €1,508,474.79).
Variable remuneration component
The variable remuneration component of DVB Bank SE’s Board of Managing Directors comprises a cash bonus, and potentially a bonus under DVB’s Long-Term Incentive Plan (LTI). The Board of Managing Directors received variable remuneration amounts totalling €635,199.00 during the 2012 business year, comprising cash bonus payments for the business years 2010 and 2011, plus a bonus under the LTI 2009 (for comparison: variable remuneration paid during the 2011 business year for the business years 2009 and 2010, and under the LTI 2008, totalled €1,345,000.00).
Details explaining the variable remuneration components:Target bonuses under the LTI 2009 were allocated under the scheme in 2009; these bonuses were conditional upon the budgeted business performance being achieved during the target year 2011. This performance goal is measured on the basis of a pre-defined economic value-added figure and the consolidated net income before taxes. In the event of the actual business performance exceeding the target, the Supervisory Board has discretion to increase the bonus to be paid, over and above the target amount.
Remuneration of the Board of Managing Directors – fixed remuneration component (€)
2012 2011 %
Monetary remuneration components 995,000.00 971,666.67 2.4
Pension commitments including contributions to pension provisions 334,842.26 320,003.79 4.6
Special benefits 190,742.84 216,804.33 –12.0
thereof: allowances for company car or monetary equivalent 56,152.26 56,116.22 0.1
thereof: rent subsidies 38,804.58 29,849.68 30.0
thereof: insurance cover and employer contributions to foreign social security schemes 95,786.00 130,838.43 –26.8
Fixed remuneration component 1,520,585.10 1,508,474.79 0.8

128
DVB Bank SE | Group Annual Report 2012
Remuneration report
Total remuneration expenses paid in 2012 by DVB Bank SE for members of the supervisory bodies amounted to €273,700.00. Taxes amounting to €35,455.00 were transferred directly to the tax authorities on behalf of Supervisory Board members resident outside Germany. Therefore, the members of the Supervisory Board received remuneration of €238,245.00 for their actions as Supervisory Board and Credit Committee members.
Shareholdings of the Board of Managing Directors and the Supervisory Board
As at 31 December 2012, the Board of Managing Directors and the Supervisory Board did not hold, in aggregate, more than 1% of the shares issued by DVB Bank SE.
Remuneration of the Supervisory Board
The annual remuneration of Supervisory Board members is governed in Article 19 (1) and (2) of DVB Bank SE’s Memorandum and Articles of Association: the members of the Supervisory Board receive €20,000.00, the Chairman of the Supervisory Board receives €30,000.00, and the members of the Credit Committee receive an additional €10,000.00 each. The remuneration is paid on the 1 July of each year. Where said remuneration is subject to value-added tax, this tax shall be paid in addition to the remu-neration (Article 19 (3) of the Memorandum and Articles of Association). Further details, such as the reimbursement of travelling expenses and other cash expenses, daily allowances and similar issues, are governed by Article 19 (4) of the Memo-randum and Articles of Association.
Remuneration of the Supervisory Board 2012 (€)
Supervisory
Board
remuneration
Credit
Committee
remuneration
Value
added tax
19%
Total
Shareholder representatives:
Frank Westhoff, Chairman 30,000.00 10,000.00 7,600.00 47,600.00
Dr Peter Klaus, Deputy Chairman 20,000.00 10,000.00 5,700.00 35,700.00
Professor Dr h.c. Stephan Götzl 20,000.00 – 3,800.00 23,800.00
Flemming Robert Jacobs, resident in the UK 20,000.00 10,000.00 5,700.00 35,700.00
Wolfgang Köhler 20,000.00 – 3,800.00 23,800.00
Dr Klaus Nittinger 20,000.00 – 3,800.00 23,800.00
Employee representatives:
Masahide Kubo, resident in the United Kingdom 20,000.00 – 3,800.00 23,800.00
Dorinus Legters, resident in the Netherlands 20,000.00 – 3,800.00 23,800.00
Martin Wolfert 20,000.00 10,000.00 5,700.00 35,700.00
Total remuneration 190,000.00 40,000.00 43,700.00 273,700.00
Tax deduction for Supervisory Board members residing outside Germany
(paid directly to the responsible tax office):
VAT 19% 13,300.00
Taxes for membership in a supervisory board 30% 21,000.00
Solidarity surcharge 5.5% 1,155.00
Total tax deductions 35,455.00
Remuneration excluding tax deductions for
Supervisory Board members residing outside Germany 238,245.00

129
DVB Bank SE | Group Annual Report 2012
T HE C OMPA N Y F IN A NCI A L A ND EqUI T Y M A RK E T S GROUP M A N AGE M E N T R E P OR T C ONSOL IDAT E D F IN A NCI A L S TAT E MEN T S
Non-financial performance indicators
Employees
At the end of 2011, the number of DVB staff members in active employment was 548; by the end of 2012, the number had risen to 558, up 1.8%. This figure does not reflect nine staff members with inactive employment relationships, such as those in the non-working phase of their semi-retirement, or those on maternity or parental leave. The staffing numbers shown here also include employees of the DVB LogPay GmbH subsidiary, but they no longer include the employees of the TES Aviation Group.
The number of staff members in active employment in Trans-port Finance/Investment Management decreased by one, to 305 persons (–0.3%). Reflecting the increase in regulatory requirements stipulated by lawmakers and banking supervisory
authorities over the past few years, the number of staff employed in the product and service areas kept growing – to 199, up 5.3% (2011: 189 persons).
DVB’s business model is international in every respect. Once again, this was evident in the structure of our team: DVB Group’s employees hailed from a total of 40 different countries in 2012, and there are 31 different nationalities represented within our core Transport Finance business. 318 staff members (2011: 315) in active employment worked in our various international locations in 2012; in other words, they are active in those international transport markets where the Bank’s clients are located. At 240, the number of staff in active employment at DVB’s German offices in Frankfurt/Main and Hamburg showed an increase over the previous year (2011: 233).
Distribution of staff by business division
2012 2011Number % Number %
Transport Finance/Investment Management 305 53.8 306 55.1
Product/service areas 199 35.1 189 34.1
DVB LogPay 54 9.5 53 9.5
Staff members in an active employment relationship 558 98.4 548 98.7
Staff members in an inactive employment relationship 9 1.6 7 1.3
Total 567 100.0 555 100.0
Distribution of staff members in active employment by location
Group Transport Finance/Investment Management2012 2011 % 2012 2011 %
Frankfurt/Main 234 225 4.0 33 32 3.1
London 85 82 3.7 67 65 3.1
Rotterdam 58 55 5.5 47 45 4.4
Bergen 19 18 5.6 17 16 6.3
Athens 12 13 –7.7 11 12 –8.3
zurich 11 11 0.0 8 8 0.0
Hamburg 6 8 –25.0 5 7 –28.6
Oslo 5 8 –37.5 5 8 –37.5
Europe 430 420 2.4 193 193 0.0
New York 35 30 16.7 31 27 14.8
Curaçao 30 33 –9.1 26 29 –10.3
North and South America 65 63 3.2 57 56 1.8
Singapore 59 61 –3.3 51 53 –3.8
Tokyo 4 4 0.0 4 4 0.0
Asia 63 65 –3.1 55 57 –3.5
Total 558 548 1.8 305 306 –0.3

Anhang130
DVB Bank SE | Group Annual Report 2012
The age structure of DVB staff was as follows during the year under review:
• 9.1% werelessthan30yearsold;• 34.9% wereagedbetween30and40years;• 34.6% wereagedbetween40to50years;and• 21.4% weremorethan50yearsold.
Experience in Transport Finance – or in the global transport industry in general – is one of the key indicators that reflects the vast expertise of our employees. In DVB’s core business (Shipping Finance, Aviation Finance, Land Transport Finance, Investment Management and ITF Suisse) our employees had an average of 13.0 years relevant sector-specific experience during the year under review. Of these employees, 38.3% had more than 15, and 19.2% had more than 20 years relevant experience.
Staff fluctuation due to voluntary resignations was 2.4% in 2012 (2011: 5.0%).
Award-winning transactions
Our commitment to Transport Finance and to a number of trans-actions was once again awarded by renowned trade journals during 2012:
Non-financial performance indicators
Awards 2012
Shipping Financier of the year 2012
Lloyd’s List – December 2012
Rail Finance Innovator of the year 2011
Global Transport Finance – November 2012
Bank of the year – International Transport Markets
DealMakers Monthly – September 2012
Sale/Leaseback Deal of the year 2011
Airfinance Journal – April 2012
Pre-Delivery Payment Deal of the year 2011
Airfinance Journal – April 2012
North America Deal of the year 2011
Airfinance Journal – April 2012
Leasing (East) Deal of the year 2011
Marine Money – March 2012
Securitisation Deal of the year 2011
Marine Money – March 2012

Anhang 131
DVB Bank SE | Group Annual Report 2012
T HE C OMPA N Y F IN A NCI A L A ND EqUI T Y M A RK E T S GROUP M A N AGE M E N T R E P OR T C ONSOL IDAT E D F IN A NCI A L S TAT E MEN T S
Report on material events after the reporting date
DVB made significant changes to its Shipping Finance business with effect from 1 January 2013.
• TheBankseparateditsexistingoffshorefinancingactivities(comprising the Offshore Drilling and Production Group as well as the Offshore Support Group) from the Shipping Finance division, to establish a fourth division alongside its existing financing activities in shipping, aviation and land transport. This structural change further lends visibility to the breadth and variety of DVB’s financing activities. Based on Group customer lending volumes as at 31 December 2012, the new portfolio breakdown would look as follows:
• FollowingtheseparationofOffshoreFinance,DVB’sShippingFinance division has four sector teams covering the respective market sectors:
– Container, Car Carrier, Intermodal & Ferry Group – Crude Oil & LNG Tanker Group – Chemical, LPG & Product Tanker Group – Dry Bulk Group
The Bank’s Cruise Finance portfolio will be phased out, with a view to reducing exposure over the medium term.
• DVBhasestablishedaStrategicManagementandRestruc-turing Team, entrusted with the intensive management and significant stabilisation of any “unusual” exposures in the maritime shipping portfolio.
• Inaddition,the“Unity”projecthasbeenlaunched,designedto enhance the future performance of the Shipping Finance division. The scope of the project will mainly comprise process improvements, structural adjustments in line with other business areas, and efficiency enhancements. The project will be prepared in 2013, and will be largely implemented during 2014.
Mr Masahide Kubo resigned from his office as an employee representative to the Supervisory Board with effect from 16 January 2013. Mr Adnan Mohammed was appointed as a new employee representative to the Supervisory Board, with effect from 15 February 2013.
The Board of Managing Directors and Supervisory Board will propose to DVB Bank SE’s Ordinary Annual General Meeting held on 13 June 2013 a dividend of €0.60 per notional no-par value share.
There were no other issues of material importance to the assessment of the financial position and financial performance of DVB Bank SE and the DVB Group after the end of the 2012 business year. Statements made in the report on expected devel-opments have been confirmed by the development of business during the first months of the 2013 business year.
Shipping Finance 42.3%
Aviation Finance 31.1%
Offshore Finance 11.3%
Land Transport Finance 7.7%
ITF Suisse 4.0%
Investment Management 2.7%
Business no longer in line with DVB’s strategy 0.9%
New structure of DVB Group’s customer lending volume (€22.2 billion)

Anhang132
DVB Bank SE | Group Annual Report 2012
The report on opportunities and risks presented below pro-vides a breakdown of our Transport Finance subportfolios by collateralisation structure and loan-to-value (LTV) range under “Portfolio management and control”, on pages 140–142. Due to the fact that all material subsidiaries of the DVB Group are integrated into DVB’s divisional risk management system which incorporates the lending activities of affiliated enterprises, the portfolio values analysed reflect nominal values of the DVB Group portfolio, in accordance with regu-latory rules.
are appropriate for managing DVB’s business. Despite due care taken in developing models, and regular reviews, however, there may be scenarios where actual losses or liquidity needs exceed the values forecasted by risk models and stress scenarios.
Organisation of the risk management process
Structural organisation
DVB operates a Group-wide risk management system, which complies with all statutory and regulatory requirements. This risk management system comprises adequate provisions and measures with respect to risk strategy, risk-bearing capacity, risk management, and risk monitoring, plus a multi-level frame-work for the early detection of risks. In addition to the structural
Assuming risks in a targeted and controlled manner – achieving target returns that are commensurate with the risks taken – is a key part of DVB’s management strategy.
Principles of risk management
In general, we define risks as unfavourable future developments which may have a detrimental effect on the Bank’s financial position, financial performance, or liquidity. In this context, we differentiate between counterparty credit risk, operational risk, market price risk, business risk, as well as liquidity and equity investment risk. DVB’s business model requires the ability to identify, measure, assess, manage, monitor and communicate risks. As a guiding principle for all of its business activities, the Bank assumes risk only to the extent required to achieve the objectives of its business policy.
Against this background, the Bank’s Board of Managing Direc-tors – as the responsible body – has established an adequate and viable risk management system that fulfils the Bank’s own commercial needs and complies with legal requirements. With the methods, models, organisational rules and IT systems imple-mented, DVB is able to recognise material risks at an early stage, and to respond appropriately by taking suitable measures. The suitability and effectiveness of DVB’s risk management system are regularly reviewed by internal and external auditors.
Notwithstanding the fundamental suitability of the risk manage-ment system, circumstances are conceivable where risks are not identified in good time, or an adequate, comprehensive response is not possible. The methods and models used to measure risks
Report on opportunities and risks
Risk management principles
Shipping Finance
Aviation Finance
Land Transport Finance
Investment Mangement
ITF Suisse
Treasury
Counterparty credit risk
Operational risk
Market price risk
Business risk
Equity investment risk
Liquidity risk
Internal Audit
Financial Controlling
Group Risk Management
Deal Control
Compliance Office
Risk management and risk controlling Strategic level
Board of Managing Directors
Risk Committee
Group Credit Committee Watch List Committee Asset Liability Committee Audit Committee OpRisk Committee Steering Committees New Product Circle
Operational level
Risk management Types of risk Risk controlling

Anhang 133
DVB Bank SE | Group Annual Report 2012
T HE C OMPA N Y F IN A NCI A L A ND EqUI T Y M A RK E T S GROUP M A N AGE M E N T R E P OR T C ONSOL IDAT E D F IN A NCI A L S TAT E MEN T S
and procedural organisation, these measures also apply to the processes for identifying, assessing, managing, monitoring and communicating the risks. The chart below illustrates the func-tional separation of DVB’s risk management (in the narrower sense) and risk control processes:
DVB’s narrowly-defined risk management system distinguishes between operative and strategic risk management. Operative risk management is defined as the implementation of the risk strategy by the various business divisions, as prescribed by the Board of Managing Directors. In addition to defining risk policy guidelines, strategic risk management also coordinates and sup-ports operative risk management processes by cross-divisional committees.
The risk control function – which is independent from risk man-agement in the narrower sense – comprises the identification, quantification, limitation and monitoring of risks, plus risk reporting. Our differentiated and detailed quarterly DVB Group Risk Report, which is submitted to the entire Board of Managing Directors, executive staff and the Supervisory Board, provides a detailed view of the Bank’s risk situation. Furthermore, we have implemented reporting systems for all relevant types of risk. This ensures that the risks are transparent at all times to the authorised persons with responsibility for those risks.
Accounting/financial reporting
DVB’s accounting department ensures that the Bank’s accounting and financial reporting comply with applicable rules, particularly with German commercial law. For this reason, the Bank has established a risk management system that manages, monitors and controls the accounting function. This internal control system is designed to counter operational risks by ensuring that employees’ actions, the technologies deployed, and the design of workflows are geared towards compliance with applicable legal rules. Based on legal rules for consolidated financial reporting, and taking into account the regulations set out in the Group Accounting Manual, DVB has implemented Group-wide processes that provide for efficient risk management and effec-tive control of Group accounting and financial reporting. These processes access common data processing and database systems. Within the scope of its audit function, Internal Audit is actively involved in these processes.
Accounting and financial reporting comprises qualitative and quantitative details regarding DVB Group entities and subgroups: these details are not only required for preparing statutory reports, but also provide the basis for the internal management of DVB Group’s operating divisions. For this reason, binding procedures have been established for the recording and controlling of data. To make sure that the financial reporting systems are commer-cially viable, data is processed in an automated manner, using adequate IT systems. We have implemented extensive control mechanisms to ensure the quality of processing, and thus to reduce operational risks. For instance, input and output data used within accounting systems are subject to numerous manual and automatic checks. Moreover, accounting and consolidation entries are duly recorded and checked. We ascertain the availa-bility of human and technical resources required for accounting and financial reporting processes through adequate business continuity concepts, which are continuously refined and regularly verified using appropriate tests. A Group Accounting Manual, continuously updated, documents the uniform application of accounting policies in writing. External audit firms examine the contents of this manual, and the related compliance of DVB staff involved in accounting and financial reporting processes, within the scope of statutory audits.
We use external appraisers to assist in determining the amount of pension provisions, as well as the collateral values of vessels and aircraft. The Bank’s operational guidelines contain a list of eligible appraisers. We continuously review newly-introduced processes regarding their suitability, and with respect to the impact of new products or facts, or regulatory changes. To safe-guard the high quality of DVB’s accounting systems, we properly train those staff members entrusted with financial reporting duties, in line with their individual needs, regarding the legal framework and the IT systems used. When implementing legal changes, external consultants and auditors are involved at an early stage, to enhance the quality and efficiency of financial reporting.
Report on opportunities and risks

Anhang134
DVB Bank SE | Group Annual Report 2012
Capacity to carry and sustain risk/risk capital
To determine DVB’s economic capital adequacy, we analyse the Bank’s risk-bearing capacity by comparing aggregate risk cover (less a capital buffer) to the risk capital requirement. Taking aggregate risk cover as a basis, and being aware of the capital buffer, the Board of Managing Directors sets maximum loss thresholds for the business year, at the end of the preceding year. These thresholds constitute limits for risk capital require-ments. The aggregate risk cover comprises the Bank’s equity and quasi-equity items; it is fully reviewed and updated each month. For this reason, aggregate risk cover is subject to fluctu-ations throughout the year.
The purpose of the capital buffer is to account for imprecision in measuring risks, and to cover those risks that are not measured within the framework of risk capital requirements, and which are thus not managed via risk limits (maximum loss thresholds). We use expert opinion, scenario analysis or models to quantify the various components of the capital buffer. As at 31 December 2012, the capital buffer amounted to €263 million.
The development of DVB’s aggregate risk cover and risk capital over recent years is shown below:
The significant decline in aggregate risk cover during 2012 was due to the deduction of a capital buffer, and to the non-inclusion of subordinated liabilities due within 13 months; this was neces-sary from June 2012 onwards in order to comply with changed regulatory requirements.
Risk inventory and suitability check
At the end of each business year DVB regularly prepares a risk inventory, in order to ensure that all types of risk that are relevant to the Bank are duly identified and assessed regarding their materiality. Where required due to specific events, we also perform a risk inventory during the course of a business year, to be able to recognise any material changes to the Bank’s risk profile where necessary.
As part of this risk inventory process, we examine the materiality of all types of risk which may occur in principle, given DVB’s business activities.
We also conduct a suitability check, examining the suitability of all risk measurement methods for all risk types classified as material, with a particular focus on risk concentrations. Where required, we take appropriate measures (including capital buffers) to adapt the management toolbox.
Risk inventories and suitability checks are harmonised in terms of content and timing. The results of the regular risk inventory and suitability check provide the basis for managing risks during the subsequent business year. If the results of an event-driven risk inventory indicate that risk management systems need to be adjusted immediately, we implement such changes during the current business year.
Report on opportunities and risks
€ mn2,000
1,600
1,200
800
400
0
1,603
536
2008
1,821
28.7
523
2009
1,697
33.9
575
2010
1,408
42.6
600
2011
1,308 48.2
631
q1 2012
61.8
1,133
700
q2 2012
1,124
705
q3 2012
63.6
1,109
705
q4 2012
72.5
1,336
969
2013
%75
60
45
30
15
0
Risk-bearing capacity (aggregate risk cover) Risk capital Risk capital/risk-bearing capacity (%)
Development of risk-bearing potential
33.4
62.7

Anhang 135
DVB Bank SE | Group Annual Report 2012
T HE C OMPA N Y F IN A NCI A L A ND EqUI T Y M A RK E T S GROUP M A N AGE M E N T R E P OR T C ONSOL IDAT E D F IN A NCI A L S TAT E MEN T S
The Board of Managing Directors set the maximum risk threshold (risk capital) for 2013 at €969 million (2012: €631 million), taking into account correlation effects. Risk capital is distributed across individual types of risk as follows:
During the course of 2012, risk capital limits were re-distributed among the various types of risk. Specifically, the risk capital limit for equity investment risk had to be raised from €40 million to €106 million, due to the growing number of fund investments in Shipping Finance and Aviation Finance which were no longer consolidated. The overall risk limit was also raised, from €631 million to €705 million, effective 31 July 2012. When determining the level of risk capital, we considered correlation effects deduced from empirical market data, taking into account correlations among the various types of risk.
Amongst other changes, the risk capital limit for 2013 has been increased by the €227 million credit risk capital buffer set aside in the previous year, reflecting the fact that we now use the new credit portfolio model to calculate concentration and migration risks in the credit portfolios, with effect from 1 January 2013. In turn, the additional credit risk capital buffer is no longer included in calculating aggregate risk cover.
Monitoring the Bank’s risk-bearing capacity, we also considered additional stress tests, to safeguard DVB’s continued existence even in an extremely unfavourable market environment. The historical stress scenario we used involved applying increased haircuts to collateral values, higher default rates observed for each rating grade, as well as a change in the euro/US dollar exchange rate that was derived using data during the financial markets crisis (30 September 2008 to 30 September 2009). In a second hypothetical stress scenario (the “adverse” scenario), we simulated a serious crisis hitting the global transport sector, with a collapse in asset values, deteriorating borrower credit quality, very unfavourable development of the euro/US dollar exchange rate, etc. DVB’s aggregate risk cover fully covered expected and unexpected losses under both stress scenarios.
We use internal models to measure counterparty credit risks and market price risks. Loss exposure associated with opera-tional risk is measured using the Basic Indicator Approach under Basel II. We use a value-at-risk (VaR) approach to measure business risk and equity investment risk. Although liquidity risk is also monitored and checked continuously, it is not managed through risk capital, but by means of plans for liquidity flows, cash flow forecasts, and stress scenarios.
Report on opportunities and risks
Risk capital (€ mn)
2013 2012 Risk capital
limit
Risk capital
limit
Amount utilised
at year-end
Average
utilisation
Counterparty credit risk 806 540 411 423
Market price risk 60 56 19 31
Operational risk 60 56 56 56
Business risk 40 31 21 25
Equity investment risk 150 106 94 77
Correlation effects –147 –85 –70 –71
Total 969 705 530 540
Aggregate risk cover (€ mn)
historical
stress scenario
hypothetical
stress scenario
Additional expected loss in stress scenarios 106 111
Unexpected loss 693 683
Total 799 794
Aggregate risk cover 2012 1,109 1,109

Anhang136
DVB Bank SE | Group Annual Report 2012
To ensure model adequacy, we conduct an annual review of the IRM to validate the risk parameters PD and LGD both quantita-tively and qualitatively. Due to the prevailing high volatility that was evident on international transport markets, we decided to maintain the more frequent update of the asset valuation model’s market data (introduced in 2009) during 2012, and will continue to do so until international transport markets have stabilised.
In addition to determining regulatory capital adequacy, we also use IRM results as an integral instrument for management of the entire Bank. For example, the results of the ratings will be taken into consideration in regulating responsibilities; unexpected and expected loss are included in the integrated risk limiting system via the concept for managing the Bank’s capability to carry and sustain risk; and the standard risk costs, which are also calculated using the model, are an integral part of the estimate with respect to individual transactions for calculating the minimum margin.
Portfolio management and control
DVB has organised its portfolio management and control pro-cesses on two levels. Group Risk Management is responsible for developing and implementing portfolio management tools and methodology, and for preparing various analyses of the of the Group’s overall portfolio (reporting pursuant to the requirements of MaRisk). On a divisional level, each Transport Finance division is responsible for analysing and managing their respective portfolios within the framework set by the Board of Managing Directors, and with a view to mitigating risk by way of diversifi-cation. In doing so, they rely on the support provided by our in-house research teams.
The proprietary database application OASIS (Object Finance Administration and Security Information System) is a state-of-the-art management information system used for the analysis and management of our loan portfolios. In addition to compiling all quantitative and qualitative data covering every Transport Finance exposure, OASIS also captures the legal and economic risk structure details: it thus provides all the data required to manage the portfolio. Moreover, the database represents the core source of information for the IRM. Data entry is subject to the principle of dual control throughout the system. Because it is integrated into the loan approval and administration processes, OASIS significantly helps to minimise operational risks. The Bank continuously develops the OASIS system, to keep it in line with constantly growing requirements.
Types of risk
Counterparty credit risk
With respect to individual transactions and clients, counterparty credit risk is managed and limited by setting corresponding limits, on the basis of cautious lending principles and sector-specific lending policies. These specify in particular that each transaction must be collateralised by valuable assets (aircraft, ships etc.). At a portfolio level, we allocate the volume of risk capital approved by the Board of Managing Directors to the various business divisions. Determining and managing country risks is relevant, given the international emphasis of our transport asset lending business. Hence we plan and limit country risks within the scope of the overall management of the Bank, and in accordance with the annual country limit planning system of Dz BANK Group.
Internal rating model
Given the dominant position of credit risk in DVB’s business, we have developed an internal statistical and mathematical rating model (IRM) for our Transport Finance portfolios. The model complies with the Advanced Approach requirements under Basel II. In addition to the probability of default (PD) associated with a given client, we determine the expected loss given default (LGD) for the unsecured portion of a loan and the anticipated extent of the claim at the time of default (exposure at default, EAD). The use of the Advanced Approach means that all types of collateral (such as aircraft and ship mortgages, indemnities) are eligible to reduce exposures. For this purpose, we are in a position to provide evidence for expected realisation proceeds on the basis of proprietary time series.
The counterparty rating is based on a multi-level statistical system, developed from a pool of externally-rated companies for which all relevant financial reporting data was available. Assigning the internal rating to the external rating classes enables us to use external default probabilities. The assessment of the future collateral value of financed assets is fundamental to determining the potentially impaired proportion of a specific lending exposure (the LGD) in our collateralised lending business. The method used for this purpose determines the future collateral value of an asset on the basis of simulation calculations. In addition to external valuations (expert opinions) and market data, we also utilise the expertise of our market specialists in assessing specific collateral.
Report on opportunities and risks

Anhang 137
DVB Bank SE | Group Annual Report 2012
T HE C OMPA N Y F IN A NCI A L A ND EqUI T Y M A RK E T S GROUP M A N AGE M E N T R E P OR T C ONSOL IDAT E D F IN A NCI A L S TAT E MEN T S
Structural analysis of the credit portfolio
The lending volume is calculated in line with DVB’s internal port-folio management criteria. Lending volumes are broken down by nature of instruments exposed to credit risk: traditional credit risk, securities business, as well as derivatives and money market business. The quantitative credit portfolio details disclosed below for the overall credit portfolio show DVB’s maximum credit risk exposure. The risk exposure is disclosed on the basis of gross lending volumes, i.e. without taking into account credit-risk mitigation techniques and also excluding allowance for credit losses. The volumes included correspond to the nominal amount of loans, banking book investment securities, and undrawn
commitments, and to market values of derivatives. The maximum credit risk amount also includes all irrevocable loan commitments and financial guarantees.
The following diagram maps gross lending volume – used for Group-internal management purposes – to individual items of the statement of financial position. Any divergence between data used for internal management purposes and figures shown in external financial reporting is largely attributable to differences in the scope of consolidation, different definitions of lending volume, as well as differences in the amounts recognised and/or carried.
Report on opportunities and risks
Gross lending volumes 2012 (€ mn)
31 Dec 2012Lending volume
for internal reporting purposes
Consolidation
Recognition/measurement
Other
IFRS Group
Traditional lending business (loans, commitments
and other non-derivative off-balance sheet assets) 22,929.2 194.0 494.4 74.5 23,692.1
Securities 554.0 –91.4 – – 462.6
Derivative financial instruments 931.0 –22.6 –2.3 – 906.1
Total 24,414.2 80.0 492.1 74.5 25,060.8
Gross lending volumes 2011 (€ mn)
31 Dec 2011Lending volume
for internal reporting purposes
Consolidation
Recognition/measurement
Other
IFRS Group
Traditional lending business (loans, commitments
and other non-derivative off-balance sheet assets) 21,684.5 467.6 539.9 76.8 22,768.8
Securities 535.8 –73.4 8.4 – 470.8
Derivative financial instruments 644.8 –12.3 – – 632.5
Total 22,865.1 381.9 548.3 76.8 23,872.1

138
DVB Bank SE | Group Annual Report 2012
Report on opportunities and risks
The lending volume, as shown in the internal reporting systems and reconciled to consolidated financial statements in accord-ance with IFRS, is reported in the following items of the state-ment of financial position:
Gross lending volumes (IFRS Group – € mn)
31 Dec 2012 31 Dec 2011 %
Cash and balances with the central bank; loans and advances to banks 1,339.2 572.7 –
Loans and advances to customers; leases 20,802.3 19,949.9 4.3
thereof: loans and advances to customers carried at cost 19,908.3 18,735.6 6.3
thereof: loans and advances to customers measured at fair value 0.0 3.4 –
thereof: leases 894.0 1,210.9 –26.2
Non-derivative trading assets – 130.3 –
Financial guarantee contracts, contingent liabilities and other commitments 1,550.6 2,115.9 –26.7
thereof: financial guarantee contracts from guarantees 237.5 227.1 4.6
thereof: contingent liabilities from irrevocable loan commitments 1,313.1 1,888.8 –30.5
Traditional lending business
(loans, commitments and other non-derivative off-balance sheet assets) 23.692.1 22,768.8 4.1
Equities and other non-fixed-income securities; bonds 462.6 470.8 –1.7
thereof: measured at fair value 436.4 442.9 –1.5
thereof: at cost 26.2 27.9 –6.1
Securities 462.6 470.8 –1.7
Derivative financial instruments with positive fair values 906.1 632.5 43.3
thereof: trading assets 195.1 157.5 23.9
thereof: hedging instruments 711.0 475.0 49.7
Derivative financial instruments 906.1 632.5 43.3
Total 25,060.8 23,872.1 5.0

139
DVB Bank SE | Group Annual Report 2012
T HE C OMPA N Y F IN A NCI A L A ND EqUI T Y M A RK E T S GROUP M A N AGE M E N T R E P OR T C ONSOL IDAT E D F IN A NCI A L S TAT E MEN T S
Report on opportunities and risks
The following three tables provide an overview of credit risk concentration and maximum credit risk exposure, broken down by DVB’s business divisions , geographical regions and residual terms . The “Other” row aggregates Group Treasury and business that is no longer in line with DVB’s strategy.
Nominal lending volume (80.6% of which is denominated in US dollars), was up by 6.8%. Adjusted for exchange rate effects, it rose by 8.5%. The increase in lending volume was largely attributable to the investment of excess liquidity with Deutsche Bundesbank.
Credit risk concentration and maximum credit risk exposure by business division (lending volume – € mn)
Loans, commitments
and other non-derivative
off-balance sheet assets
Securities
Derivative
financial instruments
2012 2011 2012 2011 2012 2011
Shipping Finance 11,644.8 11,069.2 120.0 110.9 100.2 107.0
Aviation Finance 6,893.5 6,893.2 – – 8.0 24.4
Land Transport Finance 1,655.0 1,611.9 – – 0.6 2.0
Investment Management 587.0 699.0 – – 14.1 3.7
ITF Suisse 852.6 882.8 – – 0.0 –
Other 1,296.3 528.4 434.0 424.9 808.1 507.7
Total 22,929.2 21,684.5 554.0 535.8 931.0 644.8
Credit risk concentration and maximum credit risk exposure by region (€ mn)
Loans, commitments
and other non-derivative
off-balance sheet assets
Securities
Derivative
financial instruments
2012 2011 2012 2011 2012 2011
Europe 10,513.7 9,052.9 453.4 425.0 871.5 553.8
North America 5,812.8 5,820.1 – 25.6 21.2 42.9
Asia 4,156.2 3,990.9 100.6 85.2 23.0 21.7
Middle East/Africa 738.5 1,032.6 – – 1.9 2.1
South America 856.0 856.6 – – 12.9 15.5
Offshore 681.2 756.8 – – 0.5 8.8
Australia/New zealand 170.8 174.6 – – 0.0 –
Total 22,929.2 21,684.5 554.0 535.8 931.0 644.8
Credit risk concentration and maximum credit risk exposure by residual term (€ mn)
Loans, commitments
and other non-derivative
off-balance sheet assets
Securities
Derivative
financial instruments
2012 2011 2012 2011 2012 2011
≤ 1 year 3,031.2 2,328.7 104.5 25.0 33.6 22.1
> 1 year ≤ 5 years 10,930.1 9,296.5 449.5 508.1 407.0 221.5
> 5 years 8,967.9 10,059.3 0.0 2.7 490.4 401.2
Total 22,929.2 21,684.5 554.0 535.8 931.0 644.8

Anhang140
DVB Bank SE | Group Annual Report 2012
99.8% of the portfolio (€11,844.8 million) is secured by mortgages on ships; only €19.5 million is secured by other forms of collateral. As in the previous year, there were no uncollateralised exposures at the reporting date.
The overview breaks down the volume of collateral for the total portfolio by collateral type, and by the type of instrument exposed to credit risk. Collateral for traditional lending, securities business, and for derivatives and money-market business is shown excluding netting agreements. Collateralisation details are based on market values, with a 40% haircut having been applied.
The following section provides an overview of the structure of our loan portfolios, together with collateralisation developments.
Our Shipping Finance portfolio, which is largely denominated in US dollars (89.3%), grew 5.3% to €11.9 billion. The euro showed strength in a volatile development, appreciating 2.0% against the US dollar during the course of the year. Adjusting for exchange rate movements, the portfolio growth rate was 6.9%. The chart provides a breakdown of exposures secured by mort-gages, by LTV range (where loan amounts have been allocated to LTV classes proportionally), as well as exposures covered by other forms of collateral and unsecured exposures:
Report on opportunities and risks
Collateral values for the entire portfolio by collateral type (€ mn)
Traditional lending business Securities business Derivatives and
money market business
2012 2011 2012 2011 2012 2011
Land charges, mortgages,
registered liens 17,314.0 16,985.8 111.6 97.2 81.5 87.4
Transfers of ownership,
assignments, pledges of receivables 299.8 283.9 – – – –
Financial collateral – – – – 639.6 352.1
Total 17,613.8 17,269.7 111.6 97.2 721.1 439.5
The collateral values shown were included up to the amount of the corresponding lending volume (taking into account a 40% haircut on the market value), except for financial collateral, which was included without deduction.
84.7% (–1.8 pp) in LTV ≤ 60%
9.2% (+0.2 pp) in LTV > 60 ≤ 80%
2.5% (+0.2 pp) in LTV > 80 ≤ 100%
3.5% (+1.3 pp) in LTV > 100%
0.1% (0.0 pp) Other collateral
0.0% (0.0 pp) Uncollateralised
Shipping Finance portfolio – LTV classes

Anhang 141
DVB Bank SE | Group Annual Report 2012
T HE C OMPA N Y F IN A NCI A L A ND EqUI T Y M A RK E T S GROUP M A N AGE M E N T R E P OR T C ONSOL IDAT E D F IN A NCI A L S TAT E MEN T S
At the end of 2012, the overall Aviation Finance portfolio stood at €6.9 billion (end-2011: €6.9 billion). This portfolio is also pre-dominantly denominated in US dollars (98.4%). Adjusting for exchange rate movements, the portfolio growth rate was 1.8%.
The Aviation Finance portfolio also reflects the strict enforcement of our lending standards characterised by conservative collater-alisation structures, as shown in the following graph:
99.8% of the lending volume (€6,890.6 million) is secured by mortgages on aircraft. Lending volume of €5,731.9 million has an LTV ratio not exceeding 60%. Uncollateralised exposures account for merely €11.0 million.
Our Land Transport Finance portfolio, 42.1% of which is denomi-nated in US dollars, 54.6% in euros, grew by 6.3% year-on-year, from €1.6 billion to €1.7 billion. Adjusting for exchange rate fluc-tuations, the portfolio size increased by 3.4%. The LTV breakdown of our Land Transport Finance portfolio developed as follows:
99.1% of the lending volume (€1,640.9 million) is secured by mortgages, with €1,328.9 million having an LTV ratio not exceed-ing 60%. Only €3.1 million of the portfolio is secured by other forms of collateral, and exposures of €14.8 million are uncollat-eralised.
Report on opportunities and risks
83.1% (+0.4 pp) in LTV ≤ 60%
14.4% (–0.7 pp) in LTV > 60 ≤ 80%
1.7% (+0.4 pp) in LTV > 80 ≤ 100%
0.6% (0.0 pp) in LTV > 100%
0.0% (–0.1 pp) Other collateral
0.2% (0.0 pp) Uncollateralised
Aviation Finance portfolio – LTV classes
80.3% (+3.0 pp) in LTV ≤ 60%
14.5% (–0.3 pp) in LTV > 60 ≤ 80%
2.6% (–1.2 pp) in LTV > 80 ≤ 100%
1.5% (–0.2 pp) in LTV > 100%
0.2% (–1.3 pp) Other collateral
0.9% (0.0 pp) Uncollateralised
Land Transport Finance portfolio – LTV classes

Anhang142
DVB Bank SE | Group Annual Report 2012
country risk exposure to countries subject to higher default risks (including Greece, Cyprus, Angola, Vietnam and Jamaica) only amounts to 0.7% of the customer lending volume (2011: 0.5%).
Continued reduction of loan exposures that are no longer in line with the Bank’s strategy
In accordance with the strategic decision taken by the Board of Managing Directors, the Transport Infrastructure portfolio – which is no longer in line with the Bank’s strategy – was reduced by a further 10.2% during the business year under review, to €253.1 million. Collateral for all of our infrastructure finance projects included an assignment of operating concessions. Allowance for credit losses for this portfolio was increased by a net €1.9 million in 2012; at year-end it amounted to €4.9 million (2011: €3.8 million).
Lending exposures bundled in the so-called D-Marketing unit, which also no longer meet DVB’s strategic requirements, were reduced by a further 13.5%, from €20.8 million to €18.0 million at the end of 2012. Aggregate allowance for credit losses for this portfolio amounted to €4.3 million as at 31 December 2012 (end-2011: €8.3 million), due to charge-offs (€0.6 million) and reversals (€3.2 million). We continue to expect the total allowance for credit losses for this part of our portfolio to be adequate.
DVB integrated Loan Participations as a new product into its busi-ness model in mid-2007, establishing ITF Suisse, based in zurich, for this purpose. Since then, ITF Suisse has been participating in non-complex transactions fulfilling strict lending policy require-ments. The volume of this segment declined to €852.5 million in 2012 (down €30.3 million year-on-year). The average LTV ratio increased during 2012, especially due to the persistent troubles in some maritime shipping sectors. Hence, the share of financings having an LTV ratio not exceeding 60% fell by 8.1 percentage points, to 73.5%, or by 13.0% to €626.6 million.
Country risk exposure within customer lending
The Bank mitigates more serious country risk exposure by apply-ing a commensurate transaction structure (for example, by a combination of measures such as collateralisation, use of offshore accounts, maintaining cash flows in fully-convertible currencies, political risk insurance cover, etc.). We determine country risks on the basis of primary obligor groups.
The breakdown of country risks in DVB’s portfolio was largely unchanged compared to 2011. DVB’s Transport Finance exposure continues to be concentrated in Europe, North America and Asia. Country risks are managed, and related limits defined, on the basis of net country risk exposure, with a 60% haircut applied to the market values of eligible financed assets. Net country risk exposure was virtually unchanged from the previous year. The net
Report on opportunities and risks
73.5% (–8.1 pp) in LTV ≤ 60%
11.4% (–0.1 pp) in LTV > 60 ≤ 80%
5.2% (+1.5 pp) in LTV > 80 ≤ 100%
8.8% (+7.1 pp) in LTV > 100%
1.1% (–0.4 pp) Other collateral
0.0% (+0.0 pp) Uncollateralised
ITF Suisse portfolio – LTV classes Europa 43.5% (+2.3 pp)
North America 26.0% (–0.7 pp)
Asia 19.3% (+0.5 pp)
South America 3.9% (–0.1 pp)
Middle East/Africa 3.4% (–1.4 pp)
Offshore 3.1% (–0.5 pp)
Australia/New Zealand 0.8% (0.0 pp)
Country risks in the customer lending volume

Anhang 143
DVB Bank SE | Group Annual Report 2012
T HE C OMPA N Y F IN A NCI A L A ND EqUI T Y M A RK E T S GROUP M A N AGE M E N T R E P OR T C ONSOL IDAT E D F IN A NCI A L S TAT E MEN T S
Early warning system, problem loans, allowance for credit losses
We use a diversified set of tools for the early recognition, moni-toring and management of subperforming or non-performing loans. Our multi-level early identification procedure ensures that these loans are identified at an early stage, and that such exposure is included in monitoring lists, for intensified handling. During regular meetings of the Watch List Committees, chaired by the member of the Board of Managing Directors responsible for risk management, decisions are taken regarding risk mitigation strategies and measures, as well as concerning any write-downs required.
We conduct stress tests at an overall portfolio level (based on stress scenarios designed to ascertain a sufficient level of capital, and to verify the Bank’s risk-bearing capacity), as well as for the Shipping Finance, Aviation Finance and Land Transport Finance subportfolios. Within the scope of these tests, all individual
exposures are subjected to dramatic changes of multi-dimen-sional parameters (such as LTV ratio and rating class) as part of diverse stress scenarios. The purpose of these tests is to assess which exposures might be susceptible to impairment in the event of certain negative developments implied by the stress scenarios. Any such individual exposures are classified as “early warning” cases, and monitored closely.
Non-performing loans (NPL) that are more than 90 days overdue amounted to a consolidated nominal value of €289.9 million at the end of 2012 (2011: €276.4 million). This equates to an NPL ratio of 1.3% (2011: 1.2%) in relation to total customer lending. The volume of NPLs is offset by collateral with a market value of €250.9 million (2011: €268.9 million), and covered by adequate value adjustments.
The following tables indicate the non-impaired, non-overdue lending volume as a portion of the overall portfolio, broken down by division and geographical region.
Report on opportunities and risks
Non-impaired, non-overdue lending volume by business division (€ mn)
Total portfolio Non-impaired,
non-overdue portfolio
2012 2011 2012 2011
Shipping Finance 11,865.0 11,287.1 11,072.0 10,592.5
Aviation Finance 6,901.5 6,917.6 6,768.4 6,674.3
Land Transport Finance 1,655.6 1,613.9 1,646.9 1,603.8
Investment Management 601.1 702.7 584.5 684.6
ITF Suisse 852.6 882.7 821.7 862.2
Other 2,538.4 1,461.1 2,510.6 1,445.7
Total 24,414.2 22,865.1 23,404.1 21,863.1
Non-impaired, non-overdue lending volume by region (€ mn)
Total portfolio Non-impaired,
non-overdue portfolio
2012 2011 2012 2011
Europe 11,838.6 10,031.7 11,223.3 9,452.8
North America 5,834.0 5,888.6 5,705.0 5,707.1
Asia 4,279.8 4,097.8 4,080.3 3,912.3
Middle East/Africa 740.4 1,034.7 697.5 1,015.8
South America 868.9 872.1 868.9 872.1
Offshore 681.7 765.6 660.3 753.7
Australia/New zealand 170.8 174.6 168.8 149.3
Total 24,414.2 22,865.1 23,404.1 21,863.1

144
DVB Bank SE | Group Annual Report 2012
Overdue exposures for which no specific allowance for credit losses has been recognised, together with the value of related collateral by business division (€ mn)
30 days or
less past due
Over 30,
up to 60 days
past due
Over 60,
up to 90 days
past due
More than
90 days past due
Fair value
of collateral
(60% of market value)
2012 2011 2012 2011 2012 2011 2012 2011 2012 2011
Shipping Finance 149.5 167.8 7.6 9.6 26.9 21.0 250.2 81.6 292.7 194.1
Aviation Finance – 98.8 – 1.1 30.7 – – – 19.3 76.3
Land Transport Finance – – – – – – – – – –
Investment Management – – – – – – – – – –
ITF Suisse – 20.6 – – – – – – – 11.3
Other 13.3 – – – – – – – – –
Total 162.8 287.2 7.6 10.7 57.6 21.0 250.2 81.6 311.9 281.7
for credit losses has been recognised, together with the value of related collateral, by division.
The following table indicates overdue exposures for which no specific allowance for credit losses has been recognised, together with the value of related collateral, by region.
Lending volume that is neither impaired nor past due continues to account for the dominant share of the portfolio, at 95.9% (2011: 95.6%). The collateralisation details disclosed below are based on market values, with a 40% haircut having been applied. The following table indicates overdue exposures for which no specific allowance
Report on opportunities and risks
Overdue exposures for which no specific allowance for credit losses has been recognised, together with the value of related collateral by region (€ mn)
30 days or
less past due
Over 30,
up to 60 days
past due
Over 60,
up to 90 days
past due
More than
90 days past due
Fair value
of collateral
(60% of market value)
2012 2011 2012 2011 2012 2011 2012 2011 2012 2011
Europe 85.3 129.2 7.6 – – – 82.6 42.4 107.9 116.2
Asia 77.5 84.0 – 1.1 19.0 11.5 83.5 10.8 134.7 74.1
Middle East/Africa – – – 9.6 – – 42.9 – 32.4 7.5
South America – – – – – – – – – –
North America – 62.1 – – 26.9 9.5 41.2 28.4 29.6 77.1
Australia/New zealand – – – – – – – – – –
Offshore – 11.9 – – 11.7 – – – 7.3 6.8
Total 162.8 287.2 7.6 10.7 57.6 21.0 250.2 81.6 311.9 281.7

145
DVB Bank SE | Group Annual Report 2012
T HE C OMPA N Y F IN A NCI A L A ND EqUI T Y M A RK E T S GROUP M A N AGE M E N T R E P OR T C ONSOL IDAT E D F IN A NCI A L S TAT E MEN T S
The volume of renegotiated exposures (defined as assets that would otherwise be past due or impaired, but whose terms have been renegotiated) amounted to €388.9 million for the business year under review (2011: €471.6 million); these were related exclusively to DVB’s shipping finance exposures (2011: 97.3%).
The following two tables indicate the lending volume for which specific allowance for credit losses has been recognised, together with related collateral, by division and region, respectively.
Taking into account the fair value of collateral (60% of market value), 66.8% (2011: 81.0%) of the impaired portfolio (based on the amount after specific allowance for credit losses) is duly collateralised.
On the reporting date, DVB held €167.0 million (2011: €156.2 million) in property and equipment as a result of restruc-turing measures. The Bank intends to sell or lease these assets, taking into consideration the relevant market situation and lever-aging the know-how of DVB’s asset management teams.
Report on opportunities and risks
Lending volume for which specific allowance for credit losses has been recognised and related collateral by business division (€ mn)
Amount before
specific allowance
Specific
allowance
Amount after
specific allowance
Fair value of collateral
(60% of market value)
2012 2011 2012 2011 2012 2011 2012 2011
Shipping Finance 358.8 414.6 –57.6 –61.7 301.2 352.9 196.4 293.2
Aviation Finance 102.4 143.3 –26.2 –36.8 76.2 106.5 70.8 95.6
Land Transport Finance 8.8 10.1 –1.2 –1.2 7.6 8.9 4.6 5.1
Investment Management 16.6 18.0 –9.7 –4.6 6.9 13.4 0.0 –
ITF Suisse 30.9 – –1.7 – 29.2 – 11.8 –
Other 14.4 15.4 –6.8 –7.5 7.6 7.9 2.9 2.7
Total 531.9 601.4 –103.2 –111.8 428.7 489.6 286.5 396.6
Lending volume for which specific allowance for credit losses has been recognised and related collateral by region (€ mn)
Amount before
specific allowance
Specific
allowance
Amount after
specific allowance
Fair value of collateral
(60% of market value)
2012 2011 2012 2011 2012 2011 2012 2011
Europe 439.7 407.1 –69.7 –47.5 370.0 359.6 248.2 278.2
North America 60.9 81.5 –18.1 –36.3 42.8 45.2 23.0 38.8
Asia 19.6 78.2 –7.2 –21.4 12.4 56.8 11.2 54.6
South America 0.0 – 0.0 – 0.0 – 0.0 –
Australia/New zealand 2.0 25.3 –0.5 –4.9 1.5 20.4 2.0 22.2
Offshore 9.7 – –7.7 – 2.0 – 2.1 –
Middle East/Africa 0.0 9.3 0.0 –1.7 0.0 7.6 0.0 2.8
Total 531.9 601.4 –103.2 –111.8 428.7 489.6 286.5 396.6

146
DVB Bank SE | Group Annual Report 2012
In the breakdown by business division, the “Other” item contains allowance for credit losses in the portfolios which are no longer in line with the Bank’s strategy.
The following four tables illustrate the development of the allowance for credit losses for the business years 2011 and 2012, by division and geographical region. For this purpose, allowance for credit losses – which is determined in accordance with IFRS – is broken down into specific allowance for credit losses, port-folio-based allowance for credit losses, and provisions.
Report on opportunities and risks
Allowance for credit losses by business division – 2012 (€ mn)
1 Jan 2012
Additions
Utilisation
Reversals
Changes
resulting from
exchange rate
fluctuations,
and other
adjustments
Net amount
as at
31 Dec 2012
Direct
write-offs
Recoveries
on loans and
advances
previously
written off
Shipping Finance 61.7 80.8 –55.7 –26.7 –2.4 57.7 7.1 0.4
Aviation Finance 36.8 16.5 –5.6 –21.2 –0.3 26.2 0.0 0.0
Land Transport Finance 1.2 0.2 – –0.2 0.0 1.1 0.0 0.0
Investment Management 4.6 8.9 –2.5 –1.3 0.0 9.7 0.0 2.9
ITF Suisse – 1.7 – – 0.0 1.7 0.0 0.0
Other 7.5 – –0.6 –0.1 – 6.8 0.2 0.8
Total specific allowance
for credit losses 111.8 108.0 –64.4 –49.5 –2.7 103.2 7.3 4.2
Shipping Finance 17.7 27.1 – –17.2 0.0 27.6 – –
Aviation Finance 10.6 6.0 – –5.5 – 11.1 – –
Land Transport Finance 0.4 0.3 – –0.3 – 0.4 – –
ITF Suisse 2.3 7.2 – –5.1 – 4.4 – –
Other 5.6 1.1 – –4.2 – 2.5 – –
Total portfolio allowance
for credit losses 36.6 41.7 – –32.3 0.0 46.0 – –
Total impairments and allowances 148.4 149.7 –64.4 –81.8 –2.7 149.2 – –
Shipping Finance – – – – – – – –
Aviation Finance 0.4 – – –0.3 – 0.1 – –
Other 0.2 – 0.0 0.0 – 0.1 – –
Total provisions 0.5 0.0 0.0 –0.3 0.0 0.2 – –
Total allowance for credit losses 148.9 149.7 –64.4 –82.1 –2.7 149.4 – –

147
DVB Bank SE | Group Annual Report 2012
T HE C OMPA N Y F IN A NCI A L A ND EqUI T Y M A RK E T S GROUP M A N AGE M E N T R E P OR T C ONSOL IDAT E D F IN A NCI A L S TAT E MEN T S
Report on opportunities and risks
Allowance for credit losses by business division – 2011 (€ mn)
1 Jan 2011
Additions
Utilisation
Reversals
Changes
resulting from
exchange rate
fluctuations,
and other
adjustments
Net amount
as at
31 Dec 2011
Direct
write-offs
Recoveries
on loans and
advances
previously
written off
Shipping Finance 88.3 57.1 –64.8 –21.7 2.8 61.7 0.3 1.6
Aviation Finance 31.4 16.2 –1.3 –10.8 1.3 36.8 – 1.0
Land Transport Finance 1.2 0.1 – –0.1 0.0 1.2 – –
Investment Management 9.8 14.5 –16.3 –4.4 1.0 4.6 – 1.8
ITF Suisse – – – – – – – –
Other 19.5 9.0 –18.6 –1.0 –1.4 7.5 0.3 0.4
Total specific allowance
for credit losses 150.2 96.9 –101.0 –38.0 3.7 111.8 0.6 4.8
Shipping Finance 15.5 2.6 – –0.4 0.0 17.7 – –
Aviation Finance 9.5 3.1 – –2.0 – 10.6 – –
Land Transport Finance 0.4 0.1 – –0.1 – 0.4 – –
ITF Suisse 1.1 1.2 – – – 2.3 – –
Other 5.8 0.5 – –0.7 – 5.6 – –
Total portfolio allowance
for credit losses 32.3 7.5 – –3.2 0.0 36.6 – –
Total allowance for credit losses 182.5 104.4 –101.0 –41.2 3.7 148.4 – –
Shipping Finance – – – – – – – –
Aviation Finance 0.2 0.2 – – –0.1 0.3 – –
Other 0.2 – – – – 0.2 – –
Total provisions 0.4 0.2 – – –0.1 0.5 – –
Total allowance for credit losses 182.9 104.6 –101.0 –41.2 3.6 148.9 – –

148
DVB Bank SE | Group Annual Report 2012
Report on opportunities and risks
The following two tables illustrate the development of allowance for credit losses by region. No regional breakdown is provided for portfolio-based allowance for credit losses and provisions
since the amounts involved were not material for the overall Group during 2011 and 2012.
Allowance for credit losses by region – 2012 (€ mn)
1 Jan 2012
Additions
Utilisation
Reversals
Changes
resulting from
exchange rate
fluctuations,
and other
adjustments
Net amount
as at
31 Dec 2012
Direct
write-offs
Recoveries
on loans and
advances
previously
written off
Europe 47.5 78.3 –34.7 –19.1 –2.3 69.7 3.3 0.8
North America 36.3 14.9 –22.1 –11.6 0.6 18.1 4.0 0.5
Asia 21.4 5.6 –7.6 –12.4 0.2 7.2 0.0 2.9
South America – – – – – – – –
Australia/New zealand 4.9 1.4 0.0 –6.0 0.2 0.5 – –
Middle East/Africa 1.7 0.0 0.0 –0.4 –1.3 0.0 – –
Offshore 0.0 7.8 0.0 0.0 –0.1 7.7 – –
Total specific allowance
for credit losses 111.8 108.0 –64.4 –49.5 –2.7 103.2 7.3 4.2
Total portfolio allowance
for credit risks 36.6 41.7 – –32.3 0.0 46.0 – –
Total impairments and allowances 148.4 149.7 –64.4 –81.8 –2.7 149.2 – –
Total provisions 0.5 – 0.0 –0.3 – 0.2 – –
Total allowance for credit losses 148.9 149.7 –64.4 –82.1 –2.7 149.4 – –
Allowance for credit losses by region – 2011 (€ mn)
1 Jan 2011
Additions
Utilisation
Reversals
Changes
resulting from
exchange rate
fluctuations,
and other
adjustments
Net amount
as at
31 Dec 2011
Direct
write-offs
Recoveries
on loans and
advances
previously
written off
Europe 92.3 51.4 –77.0 –20.3 1.1 47.5 0.5 4.1
North America 26.7 30.4 –16.9 –8.4 4.5 36.3 0.1 0.7
Asia 18.3 11.1 –7.1 –3.1 2.2 21.4 – –
South America 10.1 0.3 – –6.0 –4.4 0.0 – –
Australia/New zealand 2.6 2.1 – –0.1 0.3 4.9 – –
Middle East/Africa 0.2 1.6 – –0.1 – 1.7 – –
Offshore – – – – – – – –
Total specific allowance
for credit losses 150.2 96.9 –101.0 –38.0 3.7 111.8 0.6 4.8
Total portfolio allowance
for credit risks 32.3 7.5 – –3.2 0.0 36.6 – –
Total impairments and allowances 182.5 104.4 –101.0 –41.2 3.7 148.4 – –
Total provisions 0.4 0.2 – – –0.1 0.5 – –
Total allowance for credit losses 182.9 104.6 –101.0 –41.2 3.6 148.9 – –

149
DVB Bank SE | Group Annual Report 2012
T HE C OMPA N Y F IN A NCI A L A ND EqUI T Y M A RK E T S GROUP M A N AGE M E N T R E P OR T C ONSOL IDAT E D F IN A NCI A L S TAT E MEN T S
Operational risk
Monitoring and managing operational risks largely comprises the development of a methodology for identifying, quantifying and managing risk, and maintaining an adequate risk reporting system. In view of DVB’s moderately complex – yet highly trans-parent – processes, we consider the so-called Basic Indicator Approach set out by Basel II as appropriate. For this purpose, we have established a central OpRisk Committee, as well as appoint-ing an OpRisk Manager for each of DVB’s worldwide locations.
The tools we have implemented to manage operational risk are self-assessments carried out at least once a year in respect of each location, on a divisional or departmental level, plus the loss database – where losses incurred due to operational risks are recorded. Within the specifications of Dz BANK Group, we also apply risk indicators that conform to the requirements of the standard approach within the scope of Dz BANK Group proce-dures. quarterly reports containing the results are submitted to the Board of Managing Directors and the OpRisk Committee; where appropriate, this is supported by ad-hoc reporting.
We recorded a total of three (2011: 14) loss cases with aggregate net damages of approximately €13,000 (2011: €1.3 million) during the year under review. The Board of Managing Directors sets the maximum threshold for operational risk.
We have devised and implemented business continuity plans to minimise such operational risks which may be caused by external disruptions to business processes, and to our services in partic-ular. These plans are “risk-oriented”; they provide for numerous measures designed to restore key workflows and services within a reasonable amount of time, and with appropriate quality. We regularly review the viability of business continuity plans.
Report on opportunities and risks

150
DVB Bank SE | Group Annual Report 2012
In principle, DVB neutralises interest rate risks through interest rate swaps, which are used to transform assets and liabilities with fixed interest rates into variable-rate positions. We endeavour to maintain a neutral currency position, and hence use foreign exchange swaps to hedge against foreign exchange risks. There-fore, DVB’s market price risk exposure tends to be insignificant.
During the first quarter of 2012, a back-testing outlier initially triggered another increase in market risk parameters. Subse-quently, the market situation calmed down somewhat – as a result, no further outliers were recorded and the parameter increase effected in the previous year was gradually reduced. Value adjustments recognised were another influencing factor, as these reduced the present-value currency position in US dollars, and hence market risk exposure. Moreover, DVB’s interest rate risk exposure decreased significantly during the course of the year, primarily due to a reduction of business in the Investment Management division and a shift from longer to shorter invest-ment terms in that division.
Market price risk
Group Treasury is responsible for managing market price risks in both the banking and the trading books. The Asset and Liability Committee (ALCO) meets on a monthly basis, to review the market risk exposure for the entire Bank and to reach fundamental agreements on risk orientation. We use a consistent value at risk (VaR) method for calculating the market price risk exposure in our banking and trading books. Using this VaR method, the maximum loss that may arise due to market price risks during a holding period of one day is quantified at a confidence level of 99.0% on the basis of a historical simulation. The effectiveness of the VaR method is assured by means of a back-testing procedure. During this back-testing procedure, the gains and losses of the items included in the trading book and the banking book are cal-culated on a daily basis, using actually-occurred market price changes, and are compared with the values determined by the VaR method. In addition, we carry out an annual adequacy check which includes an in-depth review of the risk model. Further-more, we analyse whether and which risks are material within the scope of an annual risk inventory.
Report on opportunities and risks
VaR in the banking business (€ 000’s)
Currency risk Interest
rate risk
Equity risk Offseting
effect1)
Total
30 Dec 2011 1,000.4 873.0 422.5 –694.1 1,601.8
Average 1,116.4 831.2 439.8 –723.2 1,664.2
Minimum 218.4 394.1 361.5 –447.5 526.5
Maximum 1,800.2 1,420.6 509.0 –1,024.4 2,705.4
30 Dec 2012 831.6 460.5 417.4 –650.4 1,059.1
1) Compensating effects offsetting currency, interest rate and equity risks
4.0
3.0
2.0
1.0
0.0
Jan 2012
Feb 2012
Mar 2012
Apr 2012
May 2012
Jun 2012
Jul 2012
Aug 2012
Sep 2012
Oct 2012
Nov 2012
Dec 2012
VaR total VaR Equity (equity risk) VaR IR (interest rate risk) VaR FX (currency risk) VaR limit
Daily VaR (2012, € mn)

151
DVB Bank SE | Group Annual Report 2012
T HE C OMPA N Y F IN A NCI A L A ND EqUI T Y M A RK E T S GROUP M A N AGE M E N T R E P OR T C ONSOL IDAT E D F IN A NCI A L S TAT E MEN T S
Risk controlling, which is responsible for monitoring market price risks, has direct access to the trading and settlement systems, allowing it to observe whether limits are being adhered to. The market price risks incurred are therefore subject to constant measurement and limit monitoring through Risk controlling, which reports to the Board of Managing Directors on a daily basis. The risk positions are managed on the basis of limits approved by the Board of Managing Directors, which are in turn derived from the risk capital approved by the Board. Besides daily VaR (based on a one-day holding period and a 99.00% confidence interval), we also determine VaR based on a one-year holding period and a confidence interval of 99.90%; the results are compared to risk capital and taken into account when determining usage of aggregate risk capital. Note that the confidence interval was adjusted from 99.95% to 99.90%, effective 1 August 2012, within the framework of changed parameters for calculating total risk capital throughout the Dz BANK Group.
In addition, we determine market price risks using a monthly stress test, based on an entire interest rate cycle. We regularly discuss the calculations applied to such stress tests in the ALCO. This is designed to ensure a timely reaction to developments. We also used the results of monthly stress testing as a parameter when determining market price risk limits for 2013. In addition to two stress scenarios based on a historical simulation using a ten-year observation period and a ten-day holding period, a separate scenario we use specifically maps market price devel-opments during the most recent financial markets crisis. Moreover, we developed an additional hypothetical scenario. This is based on an extensive analysis of long-term market parameters, where we considered both potential changes in market parameters and DVB’s specific exposures. The scenario derived in this manner does not incorporate any risk-offsetting effects; it thus represents a worst-case scenario.
Business risk
DVB’s business policy is defined by the entire Board of Managing Directors, within the scope of closed-door strategy meetings. The policy is then discussed and agreed upon with the Super-visory Board, in accordance with the Memorandum and Articles of Association and the respective internal regulations. DVB has allocated risk capital for business risk since 2011, measuring risk exposure using a VaR approach with a 99.90% confidence interval, based on the volatility of monthly profits.
Equity investment risk
We include DVB Bank SE’s material subsidiaries, whose business activities are fully integrated in DVB Group’s risk management process, in the consolidated financial statements. Equity invest-ments not included in consolidation are shown under equity investment risk. Potential losses from such investments are esti-mated using a VaR approach with a 99.90% confidence interval, whereby value fluctuations of assets financed through the invest-ments are used as risk drivers for the volatility of carrying amounts.
Liquidity risk
Our liquidity risks are centrally analysed and managed on the basis of Group Treasury guidelines laid down by the Board of Managing Directors. Group Treasury, which reports to both the ALCO and the entire Board of Managing Directors, assumes responsibility for this process. Decisions on major refinancing projects are made by the ALCO. Anticipated cash flows are cal-culated, aggregated and offset by transactions on the money and capital markets, on the basis of continuously updated plans for liquidity flows and cash flow forecasts. These are prepared using SAP data and state-of-the-art asset/liability management software. The position limit system, designed to match the ratio set out in the Liquidity Principle in accordance with the German Banking Act, ensures that timely and appropriate corrective measures can be taken. The latest software generation provides us with a state-of-the-art tool that fully complies with all require-ments for a modern liquidity risk measurement environment. This application’s functionality fulfils both the requirements under the MaRisk and the Bank’s internal needs for managing and reporting on liquidity risks.
Risk controlling is responsible for monitoring liquidity risk; for this purpose, it carries out analyses independently from Group Treasury. In addition to multiple base cases, the analyses include various stress scenarios and a worst-case scenario. All cash flows from the Bank’s existing business are taken into account, plus simulated cash flows from pending loan commitments and the Bank’s budgeted new business. The results of these daily analyses are aggregated in a report, which is included in the daily reporting package to the entire Board of Managing Directors. The stress tests applied include specific stress factors which have a negative effect upon the Bank’s liquidity. Specifically, we simulate a short-term increase in liquidity needs resulting from an early drawdown of credit lines, as well as a reduction in cash
Report on opportunities and risks

152
DVB Bank SE | Group Annual Report 2012
liquidity reserves for a one-month “survival period”, even under stress conditions. If the liquidity run-off profile indicates a shortage of liquidity reserves, countermeasures to improve liquidity must be taken without delay. We have implemented an escalation procedure for this purpose which is monitored by Risk Controlling on a daily basis. In compliance with these require-ments, we maintain a liquidity reserve comprising €400 million in highly liquid securities.
Besides conducting its own stress tests, DVB is integrated into Dz BANK’s liquidity risk measurement process. DVB obtains stress test results determined by Dz BANK on a daily basis; these results are counted towards the liquidity limit set by Dz BANK. Any shortfall below the minimum limit will trigger an escalation process designed to remedy such transgression in a prompt manner.
We carry out an annual adequacy check for liquidity risks, which includes an in-depth review of the risk model. We also analyse whether and which risks are material within the scope of an annual risk inventory.
DVB consistently adhered to regulatory liquidity principles throughout 2012. Its liquidity indicator – the ratio of available cash and cash equivalents to payment obligations due – aver-aged 1.78 (2011: 1.82) during the year, and was once again clearly above the minimum regulatory level of 1.00.
inflows, due to borrower defaults or lower repayments. In addition, we simulate market-induced changes such as interest rate or exchange rate fluctuations. We regularly review the underlying assumptions for the scenarios used, adjusting them if appropriate. In the event of an anticipated liquidity shortage, Risk controlling triggers a defined escalation procedure, in co-ordination with Group Treasury. Should the measures taken by Group Treasury within the scope of the initial escalation level prove insufficient, the Risk Committee is informed in a second escalation level, in order to take appropriate countermeasures.
Against this background, DVB’s integration into the German Cooperative Financial Services Network once again proved to be a key factor during 2012, as the highly liquid German cooperative banking sector permitted us to cover our funding requirements with our partners, at prevailing market terms, at all times. This enables us to maintain a comfortable funding basis in the stress of a crisis.
We have reflected this situation in our stress scenarios, having devised new stress tests during 2011 which more strongly reflect the integration into the German Cooperative Financial Services Network. These new stress replaced existing ones with effect from 1 March 2012. In this context, existing stress factors have been retained, and were incorporated into the new stress tests which were defined in accordance with new regulatory require-ments. Assuming a going concern, these require sufficient
Report on opportunities and risks
4
3
2
1
0
Jan 2012
Feb 2012
Mar 2012
Apr 2012
May 2012
Jun 2012
Jul 2012
Aug 2012
Sep 2012
Oct 2012
Nov 2012
Dec 2012
Development of the liquidity indicator Regulatory minimum ratio
Liquidity ordinance 2012

153
DVB Bank SE | Group Annual Report 2012
T HE C OMPA N Y F IN A NCI A L A ND EqUI T Y M A RK E T S GROUP M A N AGE M E N T R E P OR T C ONSOL IDAT E D F IN A NCI A L S TAT E MEN T S
Opportunities available to DVB
DVB has a unique and clearly focused business model: to arrange and provide structured finance, advisory services and investment management services to our clients who are active in the inter-national transport markets. Notwithstanding the cyclicality of these markets, the transport business overall is benefiting from a long-term growth trend. Thanks to its profile as a renowned specialist for financing and advisory services to the international transport industry, there are manifold opportunities available to DVB, even in the still challenging market environment, which the Bank intends to use.
• To diversify our risk exposure, we pursued a balanced structure in our Transport Finance portfolios at an early stage. Exposures are diversified by multiple criteria and diverse categories, including asset type, vintage, manufacturer, region, borrower, user and asset employment. Leveraging our broadly diversified and well-collateralised portfolios, we are generally in a position to seize profitable opportunities, even during down-turn phases.
• Againstthebackgroundoftightrefinancingandarestrictedcapital base, in conjunction with higher refinancing risks, competitors have adopted a clearly more restrictive lending policy; some have stopped lending altogether. In particular, this applies to banks and investors who exposed themselves to the transport finance business opportunistically, in a positive market environment.
• In contrast, the strategy we have adopted is cycle-neutral: this is why the Bank has remained a reliable partner to its clients, continuing to provide financing and advice even during a per-sistently difficult environment. This will further intensify our client relationships, bolstering long-term trust, and will also attract new clients. In the prevailing market environment, this sustainable strategy provides DVB with a substantial com-petitive edge.
• DVBhastheopportunitytofurtherexpandtheadvisoryandother services it offers, and to increasingly offer them to clients, banks, and investors. This provides the opportunity of exploring potential sources of income which are not linked to credit, and which are virtually risk-neutral.
• WedecidedtodevelopandimplementanInternalRatingModel covering all three Transport Finance divisions which complies with the requirements of the Advanced Approach under Basel II. This provides DVB with an advantage over various competitors, as it enables the Bank to manage its financing volume on a selective and risk-aware basis.
Applying the structure of a SWOT analysis, DVB Group’s strengths, weaknesses, opportunities, and threats are summa-rised as follows:
Report on opportunities and risks

154
DVB Bank SE | Group Annual Report 2012
Report on opportunities and risks
was able to deal with the impact of the financial markets and sovereign debt crises on its liquidity situation in an adequate manner.
From today’s perspective, we believe that:
• DVBwillcontinuetohaveaccesstosufficientliquiditythroughout the 2013 business year;
• theBankwillcomplywithregulatorysolvencyrequirements;and
• theBank’sriskprofilewillremaininlinewithitseconomicrisk-bearing capacity.
Hence, there are no indications for any threats to DVB’s continued existence.
Conclusion
DVB has organised its risk management functions in a manner that complies with legal and regulatory requirements. Its risk management system is appropriately designed to efficiently monitor and manage all risks that the Bank is exposed to, allow-ing it to consciously take on and control risks, and to exploit opportunities available.
DVB’s business remained within the Bank’s economic risk-bear-ing capacity throughout 2012. The overall risk capital limit was adhered to at all times during the business year under review. Regulatory risk management requirements were fulfilled at all times. The Bank’s ability to meet its payment obligations was never compromised during the period under review, despite prevailing market distortions. Given DVB’s existing organisa-tional rules for managing liquidity risk, and its membership of the German Cooperative Financial Services Network, the Bank
SWOT analysis
Strenghts
Unique business model with a clear focus
Highly qualified, experienced staff
Extensive market and asset expertise
Flat hierarchies, high degree of flexibility, lean decision-making
Customised products and services
Cycle-neutral business approach, ensuring the Bank
remains a reliable partner even during times of crisis
Global presence in all key transport markets
High level of client service
Close contacts to manufacturers and leasing companies
Advanced risk management and pricing systems
Access to the extensive liquidity offered by the
German Cooperative Financial Services Network
Opportunities
Growth potential thanks to diminishing competition
Realisation of margins in line with risks taken
Expansion of anti-cyclical Investment Management activities
Building new client relationships
Funding available through the
German Cooperative Financial Services Network
Expanding the advisory and other services offered to clients,
banks, and investors
Boosting our reputation as a reliable partner
to the international transport industry
Weaknesses
Relatively high sector exposure
Global presence requires high staff resources
High staff costs due to high levels of employee qualification
in terms of academic expertise and experience
No material client deposits
Dependence on the money and capital markets, in particular
on the German Cooperative Financial Services Network
Exposure to the euro/US dollar exchange rate,
with an impact on growth and results
Threats
Distortions on the money and capital markets, in the broadest sense
Above-average decline in transport asset values,
in various market segments
Prevailing global financial markets crisis, sovereign debt crisis in Europe,
increasing US debt levels, slowdown in the world economy, recession
affecting various regions, deflationary trends
Unanticipated rise of the US dollar against the euro
Further government support for our bank competitors
Spikes in crude oil prices

155
DVB Bank SE | Group Annual Report 2012
T HE C OMPA N Y F IN A NCI A L A ND EqUI T Y M A RK E T S GROUP M A N AGE M E N T R E P OR T C ONSOL IDAT E D F IN A NCI A L S TAT E MEN T S
The report on expected developments contains forward-looking statements, including statements concerning the future development of the DVB Group for the year 2013. In designing the group management report, we have strived to provide a comprehensive yet clearly-structured and easy to read over-view. Hence, for each division we have first outlined business developments during 2012, directly followed by a detailed forecast of market and portfolio developments in the year 2013.
The following parts of the texts therefore constitute an integral part of the report on expected developments:
– Shipping Finance outlook (pages 57–59)– Aviation Finance outlook (pages 75–77)– Land Transport Finance outlook (pages 91–93)– Financial Institutions outlook (pages 99–100)– Investment Management outlook (pages 104 and 107)– ITF Suisse outlook (page 109)
As usual, any assessments and forecasts contained herein will always be subject to the risk of erroneous perception or judgement errors, and may thus turn out to be incorrect. By their very nature, any deliberations regarding developments or events in the future are based on conjecture rather than precise predictions. Actual future developments may there-fore diverge from expectations, not least as a result of fluc-tuations in capital market prices, exchange rates or interest rates, or similar causes of uncertainty; or due to fundamental changes in the economic environment. Although we believe the forward-looking statements to be realistic, DVB cannot accept any responsibility that they will actually materialise, for the reasons outlined above. We do not intend to update any of the forward-looking statements made in this report.
Report on expected developments for 2013
DVB’s business model weathered the persistent sovereign debt crisis. In particular, our close client relationships and deep understanding of the transport assets we finance continued to prove their worth. We therefore presume that our business model for the 2013 forecast period will continue to prove stable and resilient.
Macroeconomic framework in 2013
We expect economic developments to remain challenging for all market participants during 2013. As in the last two years, developments will be characterised by the following parameters, some of which are cross-dependant:
• thesovereigndebtcrisisintheeurozone,togetherwithpolitical and regulatory responses and decisions;
• thehighlevelofUSdebt;• thedevelopmentoftheChineseeconomy;• developmentsofunemploymentandconsumerspending–
and the related government revenue; and• oilpricedevelopments.
It is fair to expect Europe to remain significantly influenced by the sovereign debt crisis in 2013. Greece, Portugal, Spain and Italy have already embarked upon radical cuts in government spend-ing, which will lead to structural changes in their economies – with falling economic growth and high unemployment being the short-term fallout. The ECB has signalled its readiness for monetary policy interventions, to avoid higher government bond yields eating into the savings achieved. At the periphery of the euro zone, the still sluggish lending activity by commercial banks in Spain and Portugal might burden growth, even though financing terms might in fact improve during 2013. Thanks to its competi-tiveness in exports, Germany, the largest economy in the EU, is in a comparatively stable situation. So far, the German public has largely ignored Germany’s own high level of public debt. Overall, there is a possibility for the EU economy to reach the trough during 2013, and to start a modest recovery.
In the USA, although the re-election of Barack Obama has provided political clarity, it left the balance of political power unchanged: a Democratic majority in the Senate keeps facing a Republican majority in the House of Representatives. In a last-minute agreement reached on 2 January 2013, US politicians managed to avoid going over the so-called fiscal cliff. However, the US hardly made any progress at all during 2012 in sustainably reducing the country’s government debt. A failure by politicians to reach the necessary compromise in 2013 might trigger a ratings downgrade for the US, which would have unforeseeable conse-quences for the economy and the financial markets.

156
DVB Bank SE | Group Annual Report 2012
Inflation rates are expected to remain at the previous year’s levels during 2013. The annual inflation rate in the euro zone was 2.2% in December 2012, compared with a rate of 1.7% in the US. Significantly higher energy costs were the main driver of price increases; central banks’ monetary policy was thus not to blame at all for inflationary pressures. Whilst the liquidity that has flooded the financial markets has created a sustained low interest rate environment, so far it has failed to trigger rising demand for credit.
Persistent high crude oil prices might slow economic momentum during the course of 2013. Rising demand in emerging markets will be crucial and will more than compensate for the stagnation of demand in industrialised nations, caused by economic devel-opments there. Further factors which may influence developments include speculative transactions, as well as political factors such as the tensions vis-à-vis Iran, or a potential destabilisation in the Middle East in the event of the civil war in Syria escalating. Whilst the exploration of shale oil deposits, and of deepwater and ultra-deepwater oil fields has increased in the United States, these are unlikely to trigger any dramatic price cuts, given the high exploration costs involved. Persistently high crude oil prices will continue to burden the performance of transport operators across all segments, since higher fuel costs are a key cost driver. Hence, those operators that already have particularly fuel-efficient transport assets will continue to have an edge.
Economic growth in the People’s Republic of China slowed down in 2012, from an annualised growth rate of 8.1% at the beginning of the year to 7.6% in the second and 7.4% in the third quarter. Even though GDP growth recovered slightly, to 7.9% in the fourth quarter, the full-year reading of 7.8% was the lowest economic growth rate since 1999. Compared with the United States and Europe, these figures are of course remarkable – but China needs stronger growth in order to provide the next generation with new training opportunities and jobs for new entrants to the labour market. The country’s new leaders, elected by the 18th National Congress of China’s Communist Party, are confident that the Chinese economy will fare better during 2013 than in 2012. The government now plans to increase its efforts to stimulate domestic demand, and to push ahead with urbanisation. A recovery in China’s macroeconomic figures will indeed be impor-tant, since China – as a major importer of raw materials – will increasingly influence economic developments in commodity-exporting countries such as Brazil, Australia, India and South Africa. Given the growing interconnectedness of production and transport networks, the entire Asian economic region will pre-sumably remain dependent upon developments in China. At the same time, China at present is the most important sales market for countries exporting industrial goods – such as Germany. In turn, Chinese growth depends upon the country’s exports of consumer goods to the US and Europe. These interdependencies are set to prevail throughout 2013.
We will have to expect a high level of unemployment to persist in numerous industrial countries in 2013. The unemployment rate in the European Union stood at 10.7% in December 2012 – in the euro zone it was even higher, at 11.7%. Unemployment in the US reached a rate of 7.8% in December 2012 – a slight recovery from the level of 8.3% seen at the beginning of the year, but no clear turnaround on the labour market. The recovery is expected to make further slow progress in the course of 2013; the United States might thus have a stabilising effect on the world economy. Yet the threat of an economic setback will remain, due to the high level of US government debt.
Report on expected developments for 2013

157
DVB Bank SE | Group Annual Report 2012
T HE C OMPA N Y F IN A NCI A L A ND EqUI T Y M A RK E T S GROUP M A N AGE M E N T R E P OR T C ONSOL IDAT E D F IN A NCI A L S TAT E MEN T S
Report on expected developments for 2013
Financial position
We expect to maintain a comfortable funding basis throughout the forecast period. DVB’s integration in the German Cooperative Financial Services Network will remain an important factor during 2013: the liquid German cooperative banking sector will allow us to cover our funding requirements, at prevailing market terms, at all times. We also aim to broaden our investor base, for example, through further issues of ship covered bonds and other debt securities outside the Cooperative Financial Services Network. Moreover, we plan a debut aircraft covered bond issue during the forecast period.
Trend outlook and summary
DVB is striving for controlled growth again in 2013, with steady new business opportunities and interest rate margins that appropriately price the risks involved. We have also prepared ourselves for an ongoing higher level of allowance for credit losses. DVB has defined a target ROE (before taxes) of between 12% and 15% for 2013; the target CIR is set to remain below 50%.
In summary, we believe that transport and financial market developments are subject to a plethora of unpredictable factors that are beyond the control of market participants. Therefore, DVB is not in a position to make any concrete forecasts regarding its profitability or other key financial data beyond this trend indication.
Financial outlook for DVB
DVB’s business model has proven to be relatively stress-resistant and resilient during cyclical downturn phases. What sets DVB’s approach to business apart from others is the Bank’s cycle-neutral lending policy, which is based on the value and re-marketability of the financed transport assets. This concept also paid off dur-ing the global economic crisis of recent years, which dominated all cyclical developments. Especially in the economic environment outlined above, we continue placing great emphasis on offering our clients the focused range of financing solutions, advisory and other services – in a diligent and risk-aware manner. This provides us with the opportunity of maintaining our market share, or further increasing it in a selective manner, and to further strengthen DVB’s reputation amongst clients and business partners.
Financial performance
DVB aims to exploit the macro-economic environment, which is set to remain challenging during the forecast period 2013, as an opportunity to further expand its range of financing solutions, advisory and other services tailored to transport assets in mari-time shipping, aviation, and land transport. We will continue to support our Transport Finance clients. Looking at new business in 2013, we again expect interest margins priced to reflect the high refinancing costs and thus will continue to provide an appropriate risk/return profile.
Given the prevailing difficulties on the maritime shipping markets, the Shipping Finance portfolio in particular may be subject to burdens during 2013. In DVB’s view, it will be quite some time before the persistent excess capacity will be subside and supply and demand on the transport markets return to a state of equi-librium. Thanks to our risk management skills, together with our proprietary research and expertise in executing transactions, in 2013 we expect to be affected by distortions on the shipping markets to a lesser extent than other banks.

158
DVB Bank SE | Group Annual Report 2012
Explanatory disclosures under takeover law
Disclosures pursuant to section 315 (4) no. 6 of the HGB
Please refer to sections 84 and 85 of the AktG and Article 7 (3) of the Bank’s Memorandum and Articles of Association regarding the appointment and removal of Members of the Board of Managing Directors. Pursuant to sections 133 and 179 of the AktG, amendments to the Memorandum and Articles of Associ-ation of DVB Bank SE are resolved by the General Meeting.
Disclosures pursuant to section 315 (4) no. 7 of the HGB
Pursuant to Article 4 (2) of the Memorandum and Articles of Association (“Authorised Capital 2010”), the Board of Managing Directors is authorised to increase the share capital by up to €50 million. This authority will expire on 8 June 2015. Further-more, pursuant to Article 4 (3) of the Memorandum and Articles of Association (“Conditional Capital 2010”), the share capital is subject to a conditional capital increase not exceeding €25 million through the issuance of convertible bonds and bonds cum warrants. The Board of Managing Directors is authorised to determine the details of the conditional capital increase.
In accordance with section 71 (1) no. 7 of the AktG and by virtue of a resolution passed by the Annual General Meeting on 9 June 2010, DVB Bank SE is authorised to purchase and sell its own shares (treasury shares) for the purpose of securities trading. This authorisation will expire on 8 June 2015.
Additional information pursuant to section 315 (4) of the HGB
Information regarding the provisions of sections 315 (4) nos. 1 and 3 of the HGB are available in the Notes, on page 197. The provisions of sections 315 (2) no. 3 and (4) nos. 2, 4, 5, 8 and 9 of the HGB are not applicable to DVB Bank SE in 2012.

159
DVB Bank SE | Group Annual Report 2012
T HE C OMPA N Y F IN A NCI A L A ND EqUI T Y M A RK E T S GROUP M A N AGE M E N T R E P OR T C ONSOL IDAT E D F IN A NCI A L S TAT E MEN T S
Report of the Board of Managing Directors on relations with affiliated companies
Pursuant to sections 15 and 18 of the AktG, DVB Bank SE is affiliated to Dz BANK AG Deutsche zentral-Genossenschaftsbank, Frankfurt/Main, and its Group companies. As at 31 December 2012, DVB Bank SE has been included in the consolidated financial statements of Dz BANK Deutsche zentral-Genossenschaftsbank, Frankfurt/Main.
In accordance with section 312 (3) of the AktG, the Board of Managing Directors has separately disclosed to the Supervisory Board the extent of the relationship with affiliated companies, declaring: “With respect to transactions and actions identified in the report on business relationships with affiliated enterprises, adequate consideration was received by our Company in respect of any transaction, and the Company did not suffer any disadvan-tage as a result of actions taken or omitted, in line with circum-stances prevailing at the time such transactions were entered into, of which we were aware at the time.”

Notes160
DVB Bank SE | Group Annual Report 2012
Consolidated financial statements
161 Income statement
161 Appropriation of profits1)
162 Statement of comprehensive income
163 Statement of financial position
164 Statement of changes in equity
165 Cash flow statement
166 Segment report1)
167 – 216 Notes
1) These tables are part of the Notes.
€ mn210
180
150
120
90
60
30
0
0.60
100.2
77.0
27.9
2008
0.60
86.6
46.7
27.9
2009
0.60
131.1
77.3
27.9
2010
0.60
147.7
79.2
27.9
2011
0.60
141.4
98.7
27.9
2012
€
0.70
0.60
0.50
0.40
0.30
0.20
0.10
0.00
Consolidated net income before taxes Transfer to retained earnings Distributable profit of DVB Bank SE Dividend per share
Appropriation of profits 2008–2012

161
T HE C OMPA N Y F IN A NCI A L A ND EqUI T Y M A RK E T S GROUP M A N AGE MEN T RE P OR T C ONSOL IDAT E D F IN A NC I A L S TAT E M E N T S
DVB Bank SE | Group Annual Report 2012
Income statement
€ mn
Note
1 Jan 2012 – 31 Dec 2012
1 Jan 2011 – 31 Dec 2011
%
Income statement
Interest income 987.8 895.9 10.3
Interest expenses –757.8 –637.6 18.9
Net interest income (15) 230.0 258.3 –11.0
Allowance for credit losses (16) –70.7 –59.2 19.4
Net interest income after allowance for credit losses 159.3 199.1 –20.0
Fee and commission income 139.0 122.8 13.2
Fee and commission expenses –8.3 –6.6 25.8
Net fee and commission income (17) 130.7 116.2 12.5
Result from investments in companies
accounted for using the equity method
(18)
8.5
0.1
–
General administrative expenses (19) –184.0 –189.4 –2.9
Net other operating income/expenses (20) 42.7 17.3 –
Consolidated net income before IAS 39 and taxes 157.2 143.3 9.7
Trading result (21.1) 2.0 –0.6 –
Hedge result (21.2) 0.7 10.7 –93.5
Result from the application of the fair value option (21.3) 0.0 –0.4 –
Result from derivatives entered into without intention to trade (21.4) –21.1 –3.9 –
Result from investment securities (21.5) 2.6 –1.4 –
Net result from financial instruments in accordance with IAS 39 (21) –15.8 4.4 –
Consolidated net income before taxes 141.4 147.7 –4.3
Income taxes (22) –16.5 –37.3 –55.8
Consolidated net income 124.9 110.4 13.1
thereof: consolidated net income attributable to non-controlling interests –1.7 3.3 –
thereof: consolidated net income attributable to shareholders of DVB Bank SE 126.6 107.1 18.2
Earnings per share
Average number of ordinary shares issued 46,107,418 46,145,504 –0.1
Basic earnings per share (€) 2.75 2.32 18.5
Diluted earnings per share (€) 2.75 2.32 18.5
Appropriation of profits
€ mn
1 Jan 2012 – 31 Dec 2012
1 Jan 2011 – 31 Dec 2011
%
Consolidated net income (after taxes) 124.9 110.4 13.1
Consolidated net income attributable to non-controlling interests 1.7 –3.3 –
Transfer to retained earnings –98.7 –79.2 24.6
Distributable profit 27.9 27.9 0.0

162
DVB Bank SE | Group Annual Report 2012
Statement of comprehensive income
€ mn
Note
1 Jan 2012 – 31 Dec 2012
1 Jan 2011 – 31 Dec 2011
%
Consolidated net income 124.9 110.4 13.1
Revaluation of AfS financial instruments 5.4 –2.0 –
thereof: changes in fair value 7.0 –6.3 –
thereof: reclassifications to the income statement –1.6 4.3 –
Cash flow hedges 25.6 –20.1 –
thereof: changes in fair value 10.2 –9.5 –
thereof: reclassifications to the income statement 15.4 –10.6 –
Net investment hedges –1.7 – –
thereof: changes in fair value –1.9 – –
thereof: reclassifications to the income statement 0.2 – –
Currency translation 6.4 0.5 –
thereof: changes from currency translation 6.4 0.5 –
thereof: reclassification to the income statement – – –
Actuarial gains and losses –5.5 0.4 –
Deferred taxes on other comprehensive income (22) –7.5 6.4 –
Other comprehensive income 22.7 –14.8 –
Total comprehensive income 147.6 95.6 54.4
thereof: total comprehensive income attributable to non-controlling interests –1.7 3.3 –
thereof: total comprehensive income attributable to shareholders of DVB Bank SE 149.3 92.3 61.8

163
T HE C OMPA N Y F IN A NCI A L A ND EqUI T Y M A RK E T S GROUP M A N AGE MEN T RE P OR T C ONSOL IDAT E D F IN A NC I A L S TAT E M E N T S
DVB Bank SE | Group Annual Report 2012
Statement of financial position
Assets (€ mn) Note 31 Dec 2012 31 Dec 2011 %
Cash and balances with the central bank (24) 869.6 80.9 –
Loans and advances to banks (25) 469.6 491.8 –4.5
Loans and advances to customers (26) 19,908.3 18,739.0 6.2
Allowance for credit losses (27) –149.3 –148.4 0.6
Positive fair values of derivative hedging instruments (28) 711.0 475.0 49.7
Trading assets (29) 195.1 287.8 –32.2
Investment securities (30) 476.5 484.7 –1.7
Investments in companies accounted for using the equity method (31) 191.2 103.7 84.4
Intangible assets (32) 100.0 107.9 –7.3
Property and equipment (33) 929.1 1,244.6 –25.3
Income tax assets (35) 71.6 77.5 –7.6
Other assets (36) 32.1 86.5 –62.9
Total 23,804.8 22,031.0 8.1
Equity and liabilities (€ mn) Note 31 Dec 2012 31 Dec 2011 %
Deposits from other banks (37) 4,785.6 5,190.4 –7.8
Deposits from customers (38) 5,172.9 4,460.3 16.0
Securitised liabilities (39) 11,391.4 9,830.1 15.9
Negative fair values of derivative hedging instruments (40) 297.1 296.3 0.3
Trading liabilities (41) 218.5 373.4 –41.5
Provisions (42) 59.3 59.7 –0.7
Income tax liabilities (43) 61.3 73.7 –16.8
Other liabilities (44) 78.0 136.5 –42.9
Subordinated liabilities (45) 411.8 400.6 2.8
Equity (46) 1,328.9 1,210.0 9.8
Issued share capital (46.1) 117.9 117.9 0.0
Capital reserve (46.2) 331.3 331.7 –0.1
Retained earnings (46.4) 836.1 740.8 12.9
thereof: fund for general banking risks 82.4 82.4 0.0
Revaluation reserve (46.5) 3.8 0.1 –
Reserve from cash flow hedges (46.6) 6.3 –11.1 –
Reserve from net investment hedges (46.7) –1.2 – –
Currency translation reserve (46.8) 4.7 –1.7 –
Distributable profit 27.9 27.9 0.0
Non-controlling interests (46.9) 2.1 4.4 –52.3
Total 23,804.8 22,031.0 8.1

164
DVB Bank SE | Group Annual Report 2012
Statement of changes in equity
€ mn
Issued share capital
Capital reserve
Retained earnings
Revaluation reserve
Reserve from
cash flow hedges
Reserve from net
investment hedges
Currency translation
reserve
Distributable profit/
accumulated loss
Equity before non-controlling
interests
Non-controlling
interests
Equity
Equity
as at 31 Dec 2010 118.0 332.5 661.3 1.9 2.7 – -2.2 27.9 1,142.1 1.2 1,143.3
Consolidated net
income attributable
to shareholders of
DVB Bank SE – – – – – – – 107.1 107.1 3.3 110.4
Transfer to
retained earnings – – 79.2 – – – – –79.2 – – –
Other
comprehensive
income – – 0.31) –1.8 –13.8 – 0.5 – –14.8 – –14.8
Dividend payment – – – – – – – –27.9 –27.9 – –27.9
Changes in
treasury shares –0.1 –0.8 – – – – – – –0.9 – –0.9
Changes in
consolidated group
and other changes – – – – – – – – – –0.1 –0.1
Equity
as at 31 Dec 2011 117.9 331.7 740.8 0.1 –11.1 – –1.7 27.9 1,205.6 4.4 1,210.0
Consolidated net
income attributable
to shareholders of
DVB Bank SE – – – – – – – 126.6 126.6 –1.7 124.9
Transfer to
retained earnings – – 98.7 – – – – –98.7 0.0 – 0.0
Other
comprehensive
income – – –3.61)2) 3.72) 17.42) –1.2 6.42) – 22.7 – 22.7
Dividend payment – – 0.2 – – – – –27.9 –27.7 – –27.7
Changes in
treasury shares 0.0 –0.4 – – – – – – –0.4 – –0.4
Changes in
consolidated group
and other changes – – – – – – – – – –0.6 –0.6
Equity
as at 31 Dec 2012 117.9 331.3 836.1 3.8 6.3 –1.2 4.7 27.9 1,326.8 2.1 1,328.9
1) This relates to actuarial gains and losses recognised in other comprehensive income in accordance with IAS 19.2) Taking into account deferred taxes

165
T HE C OMPA N Y F IN A NCI A L A ND EqUI T Y M A RK E T S GROUP M A N AGE MEN T RE P OR T C ONSOL IDAT E D F IN A NC I A L S TAT E M E N T S
DVB Bank SE | Group Annual Report 2012
Cash flow statement
Cash and cash equivalents correspond to the item “Cash and balances with the central bank“ included in the statement of financial position. The changes in cash and cash equivalents are presented in the cash flow statement. Cash and balances with the central bank do not include financial investments with a remaining maturity of more than three months as at the date of acquisition.
The changes in the balance of cash and cash equivalents are presented in the cash flow statement, separately for operating,
investing and financing activities. Cash flows from operating activities include cash flows resulting from revenue-generating activities of the Group and from other activities that cannot be allocated to investing or financing activities. Cash inflows and outflows in connection with the acquisition and the disposal of non-current assets are attributed to investing activities. Cash flows from financing activities include cash flows from trans-actions with equity holders as well as from other borrowings to finance the Bank’s business operations.
€ mn 31 Dec 2012 31 Dec 2011
Consolidated net income before taxes 141.4 147.7
Non-cash items included in the profit for the period and
reconciliation to cash flow from operating activities
Depreciation, impairment and write-ups of loans and advances, property and equipment, and investment securities 37.9 140.9
Increase/decrease in provisions –11.7 –30.9
Other non-cash expenses/income
thereof: hedge accounting –23.0 8.7
thereof: other changes from the fair value measurement of financial instruments –203.4 264.2
Gains/losses on disposal of investment securities, and property and equipment –2.7 1.1
Other adjustments –241.3 –323.4
Subtotal –302.8 208.3
Changes in assets and liabilities from operating activities
Loans and advances to banks 20.0 –82.9
Loans and advances to customers –1,210.7 –2,293.7
Leased assets 49.2 329.8
Other assets from operating activities 142.5 66.3
Deposits from other banks –305.4 –2,020.1
Deposits from customers 492.7 –27.1
Securitised liabilities 1,546.2 4,510.2
Other liabilities from operating activities –41.8 47.0
Interest and dividends received 987.7 895.9
Interest paid –754.9 –572.5
Income taxes paid –22.1 –46.5
Cash flow from operating activities 600.6 1,014.7
Cash proceeds from the disposal of property and equipment 141.3 –
Cash payments for additions to property and equipment – –450.2
Cash payments for additions to investment securities –36.8 –444.2
Effects of changes in consolidated group
thereof: cash proceeds from the disposal of consolidated companies 35.1 –
Net change resulting from other investing activities 5.9 1.8
Cash flow from investing activities 145.5 –892.6
Cash proceeds from additions to equity (capital increases, sale of treasury shares, etc.) –0.5 –0.7
Cash payments to owners and non-controlling shareholders (dividends) –27.7 –27.9
Net change resulting from other financing activities 70.8 –126.9
Cash flow from financing activities 42.6 –155.5
Net change in cash and cash equivalents (total of the three cash flow items) 788.7 –33.4
Cash and cash equivalents at beginning of period 80.9 114.3
Cash and cash equivalents at end of period 869.6 80.9

166
DVB Bank SE | Group Annual Report 2012
Segment report
Group
Shipping Finance
Aviation Finance
Land
Transport Finance
Investment
Management
Treasury
Other
segments
Reconcili- ation/con- solidation
€ mn 2012 2011 2012 2011 2012 2011 2012 2011 2012 2011 2012 2011 2012 2011 2012 2011
Net interest income 230.0 258.3 94.4 91.4 73.4 74.0 15.1 12.6 42.3 35.5 6.0 28.9 12.0 9.6 –13.2 6.4
Allowance
for credit losses –70.7 –59.2 –67.1 –35.2 4.2 –5.7 0.0 0.0 –4.6 –8.0 1.1 0.6 –1.0 –9.4 –3.4 –1.4
Net interest income
after allowance
for credit losses 159.3 199.1 27.3 56.2 77.6 68.3 15.1 12.6 37.7 27.5 7.1 29.5 11.0 0.2 –16.6 5.0
Net fee and
commission income 130.7 116.2 62.4 61.4 36.8 34.5 7.5 6.1 4.4 –3.6 –0.1 0.3 12.6 17.0 7.2 0.6
Result from
investments in
companies
accounted for using
the equity method 8.5 0.1 – – – – – – 8.6 –0.2 – – – – –0.1 0.3
Net other operating
income/expenses 42.7 17.3 –3.9 0.1 0.1 0.0 0.0 0.0 –4.1 8.8 0.0 0.0 43.4 11.3 7.2 –2.8
Income 341.2 332.7 85.8 117.7 114.5 102.8 22.6 18.7 46.6 32.5 7.0 29.8 67.0 28.5 –2.3 3.1
Staff expenses –101.5 –109.0 –29.8 –32.4 –12.6 –13.8 –2.6 –2.7 –9.5 –9.7 –1.3 –1.3 –36.6 –38.2 –9.1 –10.9
Non-staff expenses –77.9 –75.6 –7.8 –7.9 –3.6 –3.6 –0.6 –0.5 –6.8 –9.3 –0.7 –0.6 –28.9 –31.3 –29.5 –22.6
Depreciation,
amortisation,
impairment
and write-ups –4.6 –4.8 –0.1 –0.1 –0.5 0.0 0.0 0.0 0.0 0.0 0.0 0.0 –4.1 –4.2 0.1 –0.5
General
administrative
expenses –184.0 –189.4 –37.7 –40.4 –16.7 –17.4 –3.2 –3.2 –16.3 –19.0 –2.0 –1.9 –69.6 –73.6 –38.5 –34.0
Consolidated net
income before
IAS 39 and taxes 157.2 143.3 48.1 77.3 97.8 85.4 19.4 15.5 30.3 13.5 5.0 27.9 –2.6 –45.2 –40.8 –30.9
Net result
from financial
instruments
in accordance
with IAS 39 –15.8 4.4 2.6 3.9 0.3 0.1 0.0 0.0 13.8 –26.9 –33.0 28.4 0.0 0.0 0.5 –1.2
Consolidated
net income
before taxes 141.4 147.7 50.7 81.2 98.1 85.5 19.4 15.5 44.1 –13.4 –28.0 56.3 –2.6 –45.2 –40.3 –32.1
Cost/income
ratio1) (%) 46.5 47.8 24.3 25.8 15.1 16.0 14.1 16.9 25.0 140.0 – – – – – –
Return
on equity2) (%) 12.9 14.0 15.3 24.2 50.1 40.7 64.0 43.5 16.9 –6.4 – – – – – –
Risk-weighted
assets in
accordance
with Basel I
(average) 19,807.8 18,975.5 10,113.5 9,795.8 6,041.0 5,610.9 1,473.6 1,409.7 567.0 667.3 545.3 341.0 1,043.7 986.4 23.8 164.4
1) Excluding allowance for credit losses 2) Before taxes

167
T HE C OMPA N Y F IN A NCI A L A ND EqUI T Y M A RK E T S GROUP M A N AGE MEN T RE P OR T C ONSOL IDAT E D F IN A NC I A L S TAT E M E N T S
DVB Bank SE | Group Annual Report 2012
Contents of the Notes
Basis of accounting 168
Notes to accounting policies applied 168 – 181
168 1 General accounting policies
178 2 Cash and balances with the central bank
178 3 Loans and advances to banks and customers;
allowance for credit losses
179 4 Trading assets and trading liabilities
179 5 Investment securities
179 6 Investments in companies accounted for using the equity method
179 7 Intangible assets
180 8 Property and equipment
181 9 Current and deferred taxes
181 10 Deposits from customers and other banks
181 11 Securitised liabilities
181 12 Provisions
181 13 Subordinated liabilities
181 14 Equity
Notes to the consolidated income statement 182 – 188
182 15 Net interest income
182 16 Allowance for credit losses
183 17 Net fee and commission income
183 18 Result from investments in companies
accounted for using the equity method
183 19 General administrative expenses
184 20 Net other operating income/expenses
184 21 Net result from financial instruments in accordance with IAS 39
186 22 Income taxes
187 23 Segment reporting
Notes to the statement of financial position 189 – 198
189 24 Cash and balances with the central bank
189 25 Loans and advances to banks
189 26 Loans and advances to customers
190 27 Allowance for credit losses
190 28 Positive fair values of derivative hedging instruments
190 29 Trading assets
190 30 Investment securities
191 31 Investments in companies accounted for using the equity method
191 32 Intangible assets
191 33 Property and equipment
192 34 Statement of changes in non-current assets
193 35 Income tax assets
193 36 Other assets
193 37 Deposits from other banks
194 38 Deposits from customers
194 39 Securitised liabilities
194 40 Negative fair values of derivative hedging instruments
194 41 Trading liabilities
194 42 Provisions
196 43 Income tax liabilities
197 44 Other liabilities
197 45 Subordinated liabilities
197 46 Equity
Notes to financial instruments 199 – 204
199 47 Classes and categories of financial instruments
201 48 Determination of fair values of financial instruments
201 49 Unrecognised differences upon initial recognition
202 50 Earnings contributions of financial instruments
by measurement categories
203 51 Allowance for credit losses by classes
203 52 Risks arising from the use of financial instruments
203 53 Maturity groupings of derivative financial instruments
204 54 Maturity groupings of non-derivative financial instruments
Other disclosures 205 – 216
205 55 Equity capital management
205 56 Subordinated assets
206 57 Disclosures on the ship covered bonds pursuant to section 28
of the Pfandbrief Act (PfandBG)
208 58 List of shareholdings
213 59 Financial guarantee contracts, contingent liabilities
and other commitments
213 60 Average number of employees
214 61 Related party disclosures
216 62 Declaration of Compliance pursuant to section 161
of the German Public Limited Companies Act (AktG) and
publication pursuant to section 10 of the German Securities
Prospectus Act (WpPG)
216 63 Financial statements of DVB Bank SE
Responsibility statement 216

Notes168
DVB Bank SE | Group Annual Report 2012
Basis of accounting
For the business year 2012, the consolidated financial statements of DVB Bank SE were prepared in accordance with International Financial Reporting Standards (IFRS) and the additional require-ments of German commercial law under section 315a (1) of the German Commercial Code (HGB), pursuant to Regulation (EC) No. 1606/2002 of the European Parliament and of the Council of 19 July 2002. IFRS encompasses the individual standards called IFRS, as well as the International Accounting Standards (IAS) and the interpretations of the International Financial Reporting Interpretations Committee (IFRIC) and the Standing Interpreta-tions Committee (SIC). The standards relevant to the consolidated financial statements are those published by the International Accounting Standards Board (IASB) and adopted by the European Union until 31 December 2012.
The business year corresponds to the calendar year. One Group company which was deconsolidated in the year under review is included in the comparative figures of the previous year’s consolidated financial statements based on financial statements for that company’s business year which runs from 1 November to 31 October. Unless otherwise indicated, all amounts are stated in millions of euros (€ mn or € million). Figures are rounded pursuant to standard business principles. This may result in slight differ-ences when aggregating figures and calculating percentages.
These consolidated financial statements were signed by the Board of Managing Directors on 6 March 2013 and released to be submitted to the Supervisory Board.
Notes to accounting policies applied
For the companies included in the IFRS consolidated financial statements, the following accounting policies were applied on a consistent and uniform basis, with the exceptions outlined below.
Even though DVB hedges its interest rate and foreign exchange risks to the greatest extent possible, it is exposed to significant volatilities regarding measurements in accordance with IAS 39. In order to enhance the meaningfulness of its financial state-ments, DVB has thus inserted a new subitem: consolidated net income before IAS 39 and taxes. The purpose of this subitem is to provide users with transparent information concerning results, without the influence of measurements in accordance with IAS 39. This subitem merely constitutes supplementary information; the respective accruals and measurement methods have not been amended.
1 General accounting policies
1.1 Accounting standards applied for the first time in the reporting period
The consolidated financial statements of DVB take into account for the first time the following revised versions and amendments to accounting standards, the following new interpretation as well as the following improvements to IFRSs:
• AmendmenttoIFRS7–TransfersofFinancialAssets• AmendmenttoIFRS1–SevereHyperinflationandRemoval
of Fixed Dates for First-time Adopters • Amendment to IAS 12 – Deferred Tax: Recovery of Underlying
Assets
In the context of the “Amendments to IFRS 7 – Transfers of Financial Assets”, IFRS 7.42A to 42H, which replace IFRS 7.13, lead to enhanced disclosures with regard to the derecognition of financial assets. The disclosures on transferred financial assets that are not fully derecognised are expanded by an overview of the fair value of assets and the associated liabilities as well as by additional qualitative disclosures related to the transactions. In addition, the “Amendments to IFRS 7” now require qualitative and quantitative disclosures on financial assets that have been derecognised in their entirety but in which the entity continues to have some involvement.
The application of the amended accounting standards and of the new interpretations does not have any material consequences for DVB Bank SE’s consolidated financial statements.
To the extent that estimates are necessary for recognition and measurement, these are made in accordance with the relevant standards. The basis for these estimates is continuously reviewed and adjusted, if necessary, taking into account historical experi-ence as well as changed expectations with regard to future developments.

Notes 169
T HE C OMPA N Y F IN A NCI A L A ND EqUI T Y M A RK E T S GROUP M A N AGE MEN T RE P OR T C ONSOL IDAT E D F IN A NC I A L S TAT E M E N T S
DVB Bank SE | Group Annual Report 2012
1.2 Endorsed amendments to IFRS not yet applied
We elected not to apply early, as permitted, the following revised and amended standards, as well as new or revised interpretations and improvements to IFRS, which have been endorsed by the EU:
• IFRS10–ConsolidatedFinancialStatements• IFRS11–JointArrangements• IFRS12–DisclosureofInterestsinOtherEntities• IFRS13–FairValueMeasurement• IAS27–SeparateFinancialStatements• IAS28–InvestmentsinAssociatesandJointVentures• AmendmentstoIFRS7–OffsettingFinancialAssetsand
Financial Liabilities• AmendmenttoIAS19–EmployeeBenefits• AmendmentstoIFRS32–OffsettingFinancialAssetsand
Financial Liabilities • AmendmentstoIAS1–PresentationofItemsofOther
Comprehensive Income
IFRS 10, IFRS 11 and IFRS 12 replace the previous rules set out in IAS 27, IAS 31 and SIC-12 related to the determination of the basis of consolidation in IFRS consolidated financial statements. In this context, IFRS 10 is the central standard replacing the cor-responding rules included in IAS 27 in conjunction with SIC-12. This creates a uniform concept of control which has to be applied to all companies, including special purpose entities. In future, IAS 27 will only include guidance on separate financial statements prepared under IFRS. IFRS 11 relates to the inclusion of joint ventures in the consolidated financial statements and replaces the rules set out in IAS 31 in conjunction with SIC-13. The previ-ous option to include joint ventures by way of proportionate consolidation is revoked. In future, joint ventures will be included in the consolidated financial statements using the equity method only. IFRS 12 summarises all disclosures to be made in the Notes with respect to subsidiaries, joint ventures, associates and unconsolidated structured entities. The amended standards will be applied for the first time in the business year 2014. The major effects will concern primarily the disclosures in the Notes. The change regarding the consolidation of joint ventures does not have any impact as these are already accounted for using the equity method.
In future, IFRS 13 will govern the determination of the fair value for all IFRSs on a uniform basis. Pursuant to IFRS 13, “fair value” is defined as the price that would be received to sell an asset or paid to transfer a liability in an orderly transaction between market participants at the measurement date. The standard also includes extensive qualitative and quantitative disclosure requirements and will be applied prospectively as from business year 2013.
The “Amendments to IFRS 7” result in additional disclosures of gross amounts, amounts not subject to offsetting as well as net amounts related to financial instruments based on master netting arrangements or similar agreements. The existing funda-mental requirements related to offsetting financial instruments remain unchanged. The Group will apply the amendments retro-spectively from the business year 2013.
The “Amendments to IAS 19” result in numerous changes in the accounting for obligations from defined benefit pension plans. The amendments, above all, eliminate the options for recognising actuarial gains and losses and prescribe that these remeasure-ment amounts be recognised immediately in other comprehen-sive income. In addition to the service cost, the net interest income or expense on the net defined benefit asset or the net defined benefit liability has to be recognised in the income statement as well. Moreover, the extent of required disclosures will be expanded significantly. The Group will apply the amend-ments from the business year 2013.
The “Amendments to IAS 32” substantiate the existing rules for offsetting financial instruments. Above all, the definition of the legal right is clarified. The Group will apply the amendments retrospectively from the business year 2014.
The application of the other revised or amended standards and the new interpretations does not have any material conse-quences for DVB’s consolidated financial statements.

Notes170
DVB Bank SE | Group Annual Report 2012
The “Amendments to IFRS 10, IFRS 11 and IFRS 12 – Transition Guidance” clarify and simplify the transitional provisions of IFRS 10. The amendments are required to be applied for business years beginning on or after 1 January 2013.
The application of the other standards and amendments set out above does not have any material consequences for DVB’s consolidated financial statements. The application of the listed standards is subject to EU endorsement.
1.4 Group of consolidated companies and consolidation methods
1.4.1 Group of consolidated companies
The group of consolidated companies of DVB Bank SE com-prises all subsidiaries which the Company directly or indirectly controls within the meaning of IAS 27. This currently includes DVB Holding GmbH, Frankfurt/Main, DVB LogPay GmbH, Eschborn, DVB Holding (US) Inc., New York, DVB Transport Finance Ltd, London, DVB Group Merchant Bank (Asia) Ltd, Singapore, DVB Bank America N.V., Curaçao, ITF International Transport Finance Suisse AG, zurich, as well as these companies’ own subsidiaries. DVB Bank SE’s share in these subsidiaries’ capital amounts to 100% each.
Subsidiaries are initially consolidated on the date on which the Group acquires control over the subsidiary within the meaning of IAS 27; they are deconsolidated on the date on which the Group relinquishes controls of the subsidiary.
In the year under review, twelve subsidiaries were included in the group of consolidated companies for the first time, while 17 sub-sidiaries as well as the equity investments in TES Holdings Ltd, Bridgend, Wales, United Kingdom, and its affiliated companies were deconsolidated. DVB still holds an interest in one of the deconsolidated companies as well as in TES Holdings Ltd, Bridgend, Wales, United Kingdom, through its associates; both companies are accounted for in the consolidated financial state-ments using the equity method. Another entity was merged with a company consolidated in accordance with SIC-12.
1.3 Amendments to IFRS not yet endorsed
The EU has not yet endorsed the following new and revised accounting standards, amendments to accounting standards and interpretations as issued by the IASB:
• IFRS9–FinancialInstruments• AmendmentstoIFRS9andIFRS7–MandatoryEffective
Date and Transition Disclosures• Amendments to IFRS 10, IFRS 11, IFRS 12 – Transition Guidance• AmendmentstoIFRS1–GovernmentLoans• AmendmentstoIFRS10,IFRS12andIAS27–Investment
Entities
The issue and publication of “IFRS 9 – Financial Instruments” on 28 October 2010, which includes additions related to the account-ing for financial liabilities, the IASB completed the first phase of its project to entirely replace “IAS 39 Financial Instruments: Recognition and Measurement”. In its current version, IFRS 9 includes rules for the recognition of any matters within the scope of IAS 39. When implementing IFRS 9, financial assets are reclassified, which necessitates an assessment of the business models of the portfolios as well as of the contractual cash flow characteristics of the individual financial assets. In accordance with IFRS 9, deviating from IAS 39, any changes in the fair value of financial liabilities accounted for under the fair value option resulting from changes in credit risk generally have to be recog-nised in other comprehensive income. DVB is currently investigat-ing the impact of IFRS 9 on future consolidated financial state-ments. A final assessment is only possible after the rules for “Amortised Cost and Impairment of Financial Assets“ (Phase II) and “Hedge Accounting” (Phase III) are published.
The transitional provisions of IFRS 9 were changed by “Amend-ments to IFRS 9 and IFRS 7 – Mandatory Effective Date and Transition Disclosures”. In accordance with the amendment, first-time application is shifted from business years beginning on or after 1 January 2013 to business years beginning on or after 1 January 2015. Earlier application is permitted. Generally, the standard has to be applied retrospectively. In addition, the requirement to present adjusted previous year’s figures has been eliminated. DVB had not fixed the date of first-time application of IFRS 9 by the time the 2012 consolidated financial statements were published.

Notes 171
T HE C OMPA N Y F IN A NCI A L A ND EqUI T Y M A RK E T S GROUP M A N AGE MEN T RE P OR T C ONSOL IDAT E D F IN A NC I A L S TAT E M E N T S
DVB Bank SE | Group Annual Report 2012
• AerCapPartnersILtd,Shannon,Ireland• AerCapPartnersIILtd,Shannon,Ireland• BoveyOffshoreLtd,Singapore• D8ProductTankersILtd,Singapore• DeucalionMCEngineLeasingLtd,Dublin,Ireland• FourthBDFeedershipsShippingLtd,St.John’s,
Antigua/Barbuda• Herakleitos3050LLC,Majuro,MarshallIslands• IntermodalInvestmentFundIILLC,Majuro,MarshallIslands• IntermodalInvestmentFundIVLLC,Majuro,MarshallIslands• IntermodalInvestmentFundVLLC,Majuro,MarshallIslands• MDAviationCapitalPteLtd,Singapore• MountFaberKS,Oslo,Norway• SecondBDFeedershipsShippingLtd,St.John’s,
Antigua/Barbuda• ThirdBDFeedershipsShippingLtd,St.John’s,
Antigua/Barbuda • UllswaterSubseaDIS,Oslo,Norway
The assets and liabilities of a company included in the consoli-dated financial statements with a functional currency other than the euro are translated to euro using the closing rate on the balance sheet date, while such company’s equity is trans-lated at the historical exchange rate. The translation of expenses and income is based on average exchange rates. Differences resulting from the translation of the functional currency into the reporting currency (euro) are recognised in the currency translation reserve.
Apart from the above-mentioned companies, the following com-panies accounted for using the equity method have a functional currency other than the Group currency:
• 8FLeasingS.A.,Contern,Luxembourg• A330PartsLtd,Newark,USA• EpicPantheonInternationalGasShippingLtd,Tortola,
British Virgin Islands• GlobalOffshoreServicesB.V.,Amsterdam,theNetherlands• IntermodalInvestmentFundVIILLC,Majuro,MarshallIslands• ModexEnergyRentalsLLC,Majuro,MarshallIslands• MONA300LeasingLtd,GeorgeTown,CaymanIslands• TESHoldingsLtd,Bridgend,Wales,UnitedKingdom
Under IFRS, monetary assets and liabilities denominated in a foreign currency, as well as non-monetary items measured at fair value and denominated in a foreign currency, are translated at the spot exchange rate on the balance sheet date. Forward currency contracts are measured using the current forward rate. Any differences arising from the translation of monetary assets and liabilities are recognised in profit or loss. Non-monetary assets and liabilities measured at amortised cost are translated at the transaction rate.
In addition, seven newly-established companies were included in the group of consolidated companies using the equity method:
DVB Holding GmbH sold some of its shares held in TES Holdings Ltd, Bridgend, Wales, United Kingdom, resulting in the loss of the majority stake. The remaining interest of 40% is accounted for in the consolidated financial statements using the equity method. There were no other material transactions. Income and expenses from the sale of the company shares were recorded in net other operating income/expenses.
Pursuant to section 264 (3) of the HGB, DVB LogPay GmbH, Eschborn, which is included in the consolidated financial state-ments, as well as Euro Toll Service GmbH, Eschborn, elect not to publish annual financial statements as at 31 December 2012 in accordance with section 325 HGB.
1.4.2 Consolidation methods
Consolidation is based on IFRS 3 in conjunction with IAS 27 by offsetting the Company’s share in net assets acquired (measured initially at fair value) and the cost of the business combination. Any excess of the cost of the business combination over the Group’s share in net assets acquired is capitalised as goodwill and tested for impairment annually, or earlier if there are indica-tions that an impairment might have occurred. Goodwill may not be amortised over its expected useful life under IFRS. Any receivables and liabilities, as well as expenses and revenue occurring between Group companies, are eliminated. Intragroup profits are offset.
In accordance with IAS 31 and IAS 28, interests in joint ventures and investments in associates are generally included in the con-solidated financial statements at the relevant share in equity (using the equity method).
The financial statements of companies accounted for using the equity method were prepared as at the reporting date of DVB, with nine exceptions.
1.5 Currency translation
The functional currency of the companies of the DVB Group is largely the euro, with the exception of TES Holdings Ltd, Bridgend, Wales, United Kingdom, where the functional currency is pound sterling. At the DVB Group, the functional currency is the cur-rency in which profit or loss from operating activities is usually retained, and in which performance is monitored and managed with respect to currency risks.
The functional currency of the following companies accounted for using the equity method was changed from euro to US dollar in the business year under review:

Notes172
DVB Bank SE | Group Annual Report 2012
The change in the fair value of assets designated as at fair value through profit or loss attributable to changes in credit risk is determined in accordance with the method described in IFRS 7.9(c)(i). For this purpose, changes in value on the basis of the full fair value are compared with the changes in value in the case of constant credit spreads. The difference corresponds to the change in the fair value attributable to the change in credit risk.
During the two previous business years, the Bank did not enter into any derivatives to hedge credit risks resulting from financial assets designated as at fair value through profit or loss. The maximum credit risk exposure corresponds to the carrying amount.
1.6.2 Held-to-maturity investments
The category “Held-to-maturity investments” is currently not used by DVB.
1.6.3 Loans and receivables
Generally, all non-derivative financial assets with fixed or deter-minable payments that are not quoted in an active market, should are allocated to the category “Loans and receivables”. At DVB, the category “Loans and receivables” includes loans granted to debtors and receivables acquired on the secondary market. Items of this category are measured at amortised cost using the effective interest method. Accordingly, premiums and discounts are amortised over the term of the assets. Commitment fees received are recognised as deferred liabilities until disbursement of the loans, and subsequently amortised in the same way as premiums and discounts. Amortised premiums, discounts and commitment fees are recognised by DVB as interest income.
1.6.4 Available-for-sale financial assets
All financial assets that cannot be allocated to one of the above-mentioned financial asset categories have to be classified as “Available-for-sale financial assets”. They are measured at fair value. Changes in the fair value occurring between two balance sheet dates have to be recognised in a revaluation reserve directly in equity until the relevant assets are realised. To the extent that revaluation reserve is negative as at the balance sheet date, an impairment test is performed to determine whether impairment has occurred. If this is the case, the accu-mulated negative revaluation reserve is derecognised and trans-ferred to the income statement.
1.6 Financial instruments in accordance with IAS 39
Financial instruments within the scope of IAS 39 must be allocated upon initial recognition to one of the measurement categories stipulated in IAS 39 according to their specific characteristics and, if appropriate, their intended use.
The following categories are used in the consolidated financial statements:
1.6.1 Financial assets at fair value through profit or loss
This category is divided into the two subcategories “Financial assets held for trading” and “Financial assets designated as at fair value through profit or loss”.
1.6.1.1 Financial assets held for trading
All non-derivative assets acquired primarily for the purpose of short-term resale are allocated to this category upon initial recognition. In addition, all derivative financial instruments with positive fair values that are not part of a designated and effective hedging relationship are also classified as “held for trading”. Changes in the fair value occurring between two balance sheet dates are recognised in the trading result.
1.6.1.2 Financial assets designated as at fair value through profit or loss
In line with the fair value option, as modified by the IASB in 2005, all financial assets whose measurement would otherwise result in accounting mismatches, that are measured at fair value, or which include an embedded derivative which would be required to be separated, may be allocated to this category. In the con-solidated financial statements, this category was exclusively used to eliminate accounting mismatches resulting from interest rate risks and to avoid hedge accounting. Changes in the fair value of financial assets designated as at fair value through profit or loss occurring between two balance sheet dates are recog-nised in the result from the application of the fair value option. Financial assets designated as at fair value through profit or loss are reported in the item of the statement of financial position to which they would have been allocated if the fair value option had not been applied.

Notes 173
T HE C OMPA N Y F IN A NCI A L A ND EqUI T Y M A RK E T S GROUP M A N AGE MEN T RE P OR T C ONSOL IDAT E D F IN A NC I A L S TAT E M E N T S
DVB Bank SE | Group Annual Report 2012
1.6.6 Other liabilities
All financial liabilities within the scope of IAS 39 that cannot be allocated to one of the above-mentioned financial liability cate-gories have to be classified as other liabilities. Other liabilities are measured at amortised cost using the effective interest method. Accordingly, premiums and discounts are amortised over the term of the assets and recognised as interest expense.
Other liabilities also comprise financial guarantee contracts. They are measured upon initial recognition at fair value which generally corresponds to the present value of the guarantee commission received. Liabilities from financial guarantee con-tracts are subsequently measured at the higher of the provision recorded in accordance with IAS 37 or the fair value at the date of initial recognition, less any subsequently recognised amorti-sation in accordance with IAS 18. Financial guarantee contracts are presented on a net basis, with the recognised liability netted against the receivable from the guarantee commissions.
1.6.7 Classes of financial instruments
In order to comply with the disclosure requirements of IFRS 7, which clarifies the significance of financial instruments for the an entity’s financial position and performance, DVB classifies financial instruments as follows:
1.6.7.1 Classes of financial assets
– Financial assets measured at fair value
The class of financial assets measured at fair value includes financial assets of the following IAS 39 categories:
• Financialinstrumentsatfairvaluethroughprofitorlosswiththe subcategories “Financial assets held for trading” and “Financial assets designated as at fair value through profit or loss”
• Available-for-salefinancialassets
Financial assets of the category “Available-for-sale financial assets” whose fair value cannot be reliably determined are not included in that class. Therefore, they are measured at cost and are allocated to the class of “Financial assets measured at amortised cost”.
1.6.5 Financial liabilities at fair value through profit or loss
This category is divided into the two subcategories “Financial liabilities held for trading” and “Financial liabilities designated as at fair value through profit or loss”.
1.6.5.1 Financial liabilities held for trading
All non-derivative liabilities entered into primarily for the pur-pose of discharging them through short-term repurchase are irrevocably allocated to this category upon initial recognition. As at the balance sheet date, DVB did not have any non-derivative financial liabilities held for trading. In addition, all derivative finan-cial instruments with negative fair values that are not part of a designated and effective hedging relationship are also classified as “held for trading”. Changes in the fair value occurring between two balance sheet dates are recognised in the trading result.
1.6.5.2 Financial liabilities designated as at fair value through profit or loss
All financial liabilities whose measurement would otherwise result in accounting mismatches, that are measured at fair value or that include an embedded derivative which would be required to be separated, may be allocated to this category. In the con-solidated financial statements, this category was exclusively used to eliminate accounting mismatches resulting from interest rate risks and to avoid hedge accounting. Changes in the fair value of financial liabilities designated as at fair value through profit or loss occurring between two balance sheet dates are recognised in the result from the application of the fair value option. Financial liabilities designated as at fair value through profit or loss are reported in the item of the statement of financial position to which they would have been allocated, had the fair value option not been applied.
The change in the fair value of liabilities designated as at fair value through profit or loss attributable to changes with respect to DVB’s credit risk is determined in accordance with the method described in IFRS 7.9(c)(i). For this purpose, changes in value on the basis of the full fair value are compared with the changes in value in the case of constant credit spreads. The difference corresponds to the change in the fair value attributable to the change in credit risk.

Notes174
DVB Bank SE | Group Annual Report 2012
Apart from the financial assets of the categories mentioned, this class also comprises the positive fair values of derivative hedging instruments, which are accounted for as assets and also measured at fair value.
– Financial assets measured at amortised cost
The class of “Financial assets measured at amortised cost” includes financial assets of the category “Loans and receivables” as well as available-for-sale financial assets whose fair value cannot be determined reliably.
– Other financial assets
The class of “Other financial assets” exclusively consists of receivables from finance leases where DVB is the lessor.
1.6.7.2 Classes of financial liabilities
– Financial liabilities measured at fair value
The class of “Financial liabilities measured at fair value” includes financial liabilities of the following IAS 39 category: Financial instruments measured at fair value through profit or loss with the subcategories “Financial liabilities held for trading” and “Financial instruments designated as at fair value through profit or loss”.
Apart from the financial liabilities of the category mentioned, this class also comprises the negative fair values of derivative hedging instruments, which are accounted for as liabilities.
– Financial liabilities measured at amortised cost
The class of “Financial liabilities measured at amortised cost” comprises the other financial liabilities within the scope of IAS 39.
– Other financial liabilities
The class of “Other financial liabilities” consists of liabilities from finance leases where DVB is the lessee, liabilities from irrevocable loan commitments and liabilities from financial guarantee contracts.
1.6.8 Recognition and derecognition of financial instruments
Derivative financial instruments are recognised on the trade date. Non-derivative financial instruments are recognised on the settlement date. Changes in the fair value occurring between the trade date and the settlement date are recognised in accord-ance with the classification of the financial instruments.
All financial instruments are measured at fair value upon initial recognition. Differences between transaction prices and fair values (day 1 profit) are recognised through profit or loss upon first-time recognition, to the extent that the valuation tech-niques used to determine the fair value are primarily based on observable inputs. If, upon initial recognition, the fair value is derived from transaction prices and is also used as a measure-ment reference in subsequent periods, the fair value changes are only recognised in profit or loss when these changes are attributable to changes of observable market data. Upon initial recognition, any unrecognised differences that can be attributed to changes of unobservable market data are amortised and recognised as income over the term of the relevant financial instruments.
Financial assets and financial liabilities are derecognised when there are no longer any rights to receive payments in future, or when such rights have been transferred to third parties and DVB does not retain any substantial risks and rewards with regard to the financial assets and financial liabilities.
1.6.9 Impairment, and reversals of impairment losses of financial instruments
If there were objective indications for an impairment of financial assets on the balance sheet date, an impairment test was per-formed in accordance with the provisions set out in IAS 39. Among others, the following factors are used as objective indi-cations for an impairment of debt instruments: delinquency in interest or principal payments, payment defaults, breaches of material contractual terms in connection with the provision of collateral, certain restructuring measures by customers, impend-ing insolvency, a deterioration of the credit rating within a report-ing period by more than two grades or below a defined level, as well as other factors. Objective indications for an impairment of equity instruments are, among others, a sustainable decrease in the financial performance or losses incurred on a prolonged basis as well as the diminution of equity that may reflect the significant or permanent impairment of the fair value.

Notes 175
T HE C OMPA N Y F IN A NCI A L A ND EqUI T Y M A RK E T S GROUP M A N AGE MEN T RE P OR T C ONSOL IDAT E D F IN A NC I A L S TAT E M E N T S
DVB Bank SE | Group Annual Report 2012
In order to determine the actual amount of the impairment of financial instruments of the category “Loans and receivables” and of receivables from finance leases, the carrying amount as at the balance sheet date is compared with the present value of expected future cash flows. The original effective interest rate of the corresponding asset has to be used as the discount rate. The original effective interest rate is the rate that exactly discounts originally expected future cash payments or receipts over the expected life of the financial instrument or, when appro-priate, a shorter period to the carrying amount of the financial asset or financial liability.
If individual financial instruments are insignificant when consid-ered separately, or if no impairment as at the balance sheet date could be determined on an individual basis, such assets are tested for impairment on a portfolio basis together with other similarly insignificant assets or assets not individually subject to impairment.
Uncollectable loans and advances for which no specific valuation allowances are recognised are written off directly. Recoveries on loans and advances previously written off are recognised through profit or loss. If a default is certain for an impaired finan-cial asset, any allowance recognised for this asset is derecognised against the relevant financial asset and reported as utilisation.
Financial instruments of the category “Available-for-sale financial assets”, which are measured at fair value, have to be tested for objective evidence of impairment as at the balance sheet date if the cumulative revaluation reserve is negative. In case of impairment, the negative revaluation reserve for the financial instrument concerned must be fully derecognised from equity, and recognised in profit or loss. Impairment losses of equity instruments measured at cost are deducted directly from the carrying amount of the financial assets concerned and recog-nised in the income statement.
If it is established during an impairment test that the reasons for an impairment previously recognised in profit or loss no longer exist, the relevant impairment loss is reversed. For assets meas-ured at amortised cost, this reversal is limited to such amortised cost which would have resulted had no impairment occurred. Reversals of impairment losses recognised in profit or loss are not permitted for equity instruments.
1.7 Embedded derivatives
In accordance with IAS 39, derivative financial instruments embedded in non-derivative financial instruments (embedded derivatives) have to be separated from the host contract, accounted for and measured separately (i) when their economic characteristics and risks are not closely related to the economic characteristics and risks of the host contract; (ii) when a separate instrument with the same terms would meet the definition of a derivative; and (iii) when the entire instrument is not measured at fair value through profit or loss. If these requirements for the separation of the embedded derivative are not met, the embedded derivative may not be separated from the host contract. At DVB, there are currently no embedded derivatives which are required to be separated.
1.8 Hedge accounting
Within the framework of DVB’s risk management strategy, the Company enters into various derivatives for the purpose of hedging against interest rate and foreign currency risks. IAS 39 contains specific regulations on the accounting for such economic hedging relationships in financial statements. The aim of these provisions is to eliminate accounting mismatches between the hedged items and the derivative hedging instruments used. In accordance with IAS 39, there are three different types of hedg-ing relationships: fair value hedges, cash flow hedges and hedges of a net investment in a foreign operation. The designation of these hedging relationships depends on meeting the strict require-ments defined in IAS 39.
1.8.1 Fair value hedges
The purpose of fair value hedges is to balance changes in the value of the hedged item with offsetting changes in the fair value of the hedging instrument. Both the changes in the fair value of the hedged item attributable to the hedged item itself and the offsetting changes in the fair value of the hedging instrument are recognised in the income statement. Hedged items of the category “Loans and receivables” are measured at amortised cost in line with the general measurement principles of this category. The amortised cost is adjusted subsequently by the fair value change attributable to the hedged risk. Hedged items of the category “Available-for-sale financial instruments” are measured at fair value. Only the fair value changes that deviate from the amount of the hedged change in the market value are recognised directly in equity in the revaluation reserve.

Notes176
DVB Bank SE | Group Annual Report 2012
Changes in the fair value of hedging instruments used in cash flow hedges are recognised directly in equity, to the extent such changes relate to the effective portion of the hedging relationship, or in the hedge result, to the extent that such changes relate to the ineffective portion of the hedge.
At DVB, cash flow hedge relationships are designated to hedge foreign currency risk from interest and fee and commission payments as well as from committed staff and administrative expenses denominated in foreign currencies. Each of the hedged cash flows is expected to occur in the following business year. Hedging instruments exclusively are forward currency contracts.
1.8.3 Net investment hedges
The translation exposure from equity investments with a foreign functional currency is hedged using net investment hedges. Any gains and losses of the hedging instruments that relate to the effective portion of the hedging relationship are reported as a separate component of equity until the sale or disposal of the equity investment. The ineffective portion is recognised in the income statement in the hedge result.
1.8.4 Effectiveness test
Within the scope of the prospective effectiveness test required under IAS 39, a sensitivity analysis is performed on the basis of the so-called basis point value method. The test of retrospective effectiveness is performed using the so-called dollar-offset method which compares the cumulative changes in the fair value of the hedged items attributable to the hedged risk with the changes in the fair value of the hedging instruments. If the changes in the fair values of the hedging instruments and the hedged items compensate each other within the range of 80% to 125%, as defined in IAS 39, the hedging relationship is regarded as effective.
In fully effective hedging relationships, the fair value changes recognised in the income statement offset each other completely during the term of the hedging relationship. The changes in the fair value recognised in the carrying amount of the hedged items have to be amortised through profit or loss until not later than the termination of the hedging relationship. To the extent that the hedging relationship is terminated by means of selling the hedged item, the cumulative results from remeasurement attrib-utable to the hedged risk are recognised in profit or loss.
DVB designates hedging relationships in order to hedge the fair value of fixed-rate loans and advances to customers, loan commitments, fixed-income securities, fixed-rate liabilities from refinancing activities as well as foreign currency risks related to financial assets and liabilities. Hedging instruments primarily are interest rate swaps. Interest expenses and interest income from both hedged items and hedging instruments are recognised in net interest income.
1.8.2 Cash flow hedges
The changes of uncertain future cash flows from hedged items are hedged by means of offsetting changes in cash flows from hedging instruments (cash flow hedges).
Within the scope of accounting for cash flow hedges, the hedging instruments are measured at fair value. Changes in the fair value attributable to the effective portion of the hedging relationship have to be recognised directly in equity in the hedging reserve for cash flow hedges. Changes in the fair value attributable to the ineffective portion of the hedging relationship have to be recognised in the trading result. Changes in the fair value or the cash flows of the hedged items have to be recognised in accord-ance with the general principles of the relevant measurement category. After the termination of a cash flow hedge relationship, the changes in value that were previously recognised directly in equity are recognised in profit or loss simultaneously when the previously hedged items affect profit or loss.

Notes 177
T HE C OMPA N Y F IN A NCI A L A ND EqUI T Y M A RK E T S GROUP M A N AGE MEN T RE P OR T C ONSOL IDAT E D F IN A NC I A L S TAT E M E N T S
DVB Bank SE | Group Annual Report 2012
1.9 Accounting estimates
The presentation of the financial position and performance in the consolidated financial statements depends on recognition and measurement methods and on assumptions and estimates which are the basis for prepararing the consolidated financial statements. If recognition and measurement under IAS/IFRS required the use of assumptions and estimates, these were made in accordance with the relevant standards.
The following critical assumptions and estimates, as well as uncertainties inherent in the accounting policies, are essential to understand the underlying financial reporting risks and the effects that these estimates, assumptions and uncertainties may have on the consolidated financial statements. They are based on historical experience, together with other factors such as projections as well as expectations and forecasts of future events considered likely in view of the current circumstances.
1.9.1 Fair value of financial assets and financial liabilities
The determination of fair values of financial assets and financial liabilities is subject to estimation uncertainties if no prices on active markets are available for the relevant financial instruments. Estimation uncertainties occur above all when the fair values are determined using valuation techniques which are based on significant unobservable measurement parameters. The assump-tions and valuation techniques used to determine values when no market values are available are set out in Note 48.
1.9.2 Property and equipment, and intangible assets
The recognition of items of property and equipment, intangible assets and goodwill is subject to the use of estimates for deter-mining the fair value at the acquisition date, especially in the case of assets acquired in a business combination. In addition, the expected useful life of these assets has to be estimated. The determination of the fair values of assets and liabilities is based on management judgements, which were made using all existing information in accordance with IFRS.
In order to determine impairments of property and equipment and of intangible assets, estimates are made which relate, among other things, to the reason, timing, and amount of the impairment. The identification of impairment indicators, the estimation of future cash flows and the determination of fair values for assets (or groups of assets) require management to make significant judgements concerning the identification and validation of impair-ment indicators, expected cash flows, applicable discount rates, relevant useful lives and residual values.
Impairment is based on many factors. We typically consider changes in current competitive conditions, expectations of growth, increased cost of capital, changes in the future availa-bility of financing, technological obsolescence, discontinuance of services, current replacement costs and other changes in circum-stances that indicate the existence of an impairment. The relevant recoverable amount and the fair value are typically determined using a discounted cash flow method which incorporates reason-able market participant assumptions.
1.9.3 Allowance for credit losses and loan loss provisions (risk provisioning)
Uncertainties related to the evaluation of risks in the lending business primarily result, in terms of amount and reason, from assumptions and estimates made by decision-makers. Assump-tions and estimates made relate, among other things, to the current and future macroeconomic development as well as the financial performance of individual borrowers. Assumptions and estimates also relate to the historical and current development of the proceeds from the realisation of collateral, assumed reali-sation periods, as well as final credit default losses, taking into account the structure and quality of the Bank’s loan portfolios.
1.9.4 Income tax assets and income tax liabilities
The determination of deferred income tax assets and liabilities are based on estimates of future taxable profit of the taxable entities. These estimates above all impact the assessment of the realisability of deferred tax assets. In addition, judgements have to be made with regard to income-tax-related facts in the context of calculating current income tax assets and liabilities as at the date of preparing the financial statements under com-mercial law.

Notes178
DVB Bank SE | Group Annual Report 2012
1.9.6 Non-current assets held for sale
These assets are measured at the lower of carrying amount and fair value less costs to sell and are classified as “non-current assets held for sale”. They are no longer subject to amortisation. In general, impairment losses are recognised only when the fair value less costs to sell is below the carrying amount. In case of a subsequent increase in the fair value less costs to sell, the impairment loss previously recognised has to be reversed. The reversal of impairment losses is restricted to the impairment losses previously recognised for the assets concerned.
2 Cash and balances with the central bank
This item includes cash on hand and the balances held at the central bank. Measurement is based on nominal values.
3 Loans and advances to banks and customers; allowance for credit losses
Loans and advances to customers and banks mainly include advances and loans granted to customers and banks, as well as money market assets. Loans and advances are generally measured at amortised cost. Individual loans and advances to customers are measured at fair value under the fair value option. Changes in the fair value are reported in the result from the application of the fair value option. If the loans and advances were designated as hedged items in effective fair value hedges, the carrying amount includes fair value changes attributable to the hedged risk.
The allowance for credit losses related to loans and advances to banks and to customers is deducted from the relevant assets’ carrying amount and reported as a separate line item in the statement of financial position. Additions to and reversals of allowances for credit losses related to loans and advances to banks and to customers are recorded in the income statement under the item “Allowance for credit losses”.
DVB’s risk provisioning measures also comprise changes in provisions for loan commitments, other provisions for the lending business and liabilities from financial guarantee contracts. Additions to and reversals of these items are also recognised in the income statement in the item “Allowance for credit losses”.
1.9.5 Provisions and contingent liabilities
Provisions are recognised if the Group has a present obligation from a past event which is likely to result in an outflow of eco-nomic resources that can be reliably estimated. This present obligation is a liability of uncertain timing and amount. Provisions are determined on the basis of best estimates. Non-current provisions are subject to discounting.
Recognition and measurement of provisions and the amount of contingent liabilities related to pending litigation involve, to a considerable extent, judgements made by the Group. Judgement is necessary in assessing the likelihood that a pending claim will succeed, or a liability will arise, and to quantify the possible range of the final settlement. We record provisions for liabilities when a loss contingency is considered to exist, and when a loss is considered probable and can be reasonably estimated. Because of the inherent uncertainties in this evaluation process, actual losses may be different from the originally estimated amount of the provision. Significant estimates are also involved in the determination of provisions related to taxes and legal risks.
The measurement of pension provisions is based on the projected unit credit method for defined benefit plans, as defined in IAS 19. The measurement of the benefit obligation is based on various estimates and assumptions, in particular assumptions with regard to the long-term salary and pension trend as well as the average life expectancy. The assumptions related to salary and pension trends rely on the development observed in the past, and take into account labour market trends. The bases for the estimate of the average life expectancy are recognised biometric calculation parameters (mortality tables by Prof Dr Klaus Heubeck).
The interest rate used to discount the future payment obligations is the market rate for risk-free, long-term deposits with a similar term. The expected long-term performance of the current plan assets is determined depending on the fund structure, taking historical experience into account.

Notes 179
T HE C OMPA N Y F IN A NCI A L A ND EqUI T Y M A RK E T S GROUP M A N AGE MEN T RE P OR T C ONSOL IDAT E D F IN A NC I A L S TAT E M E N T S
DVB Bank SE | Group Annual Report 2012
4 Trading assets and trading liabilities
Trading assets and trading liabilities mainly include interest and currency derivatives with positive and negative fair values which are not used as derivative hedging instruments under hedge accounting. Trading assets and trading liabilities are measured at fair value. Changes in the fair value are recognised in the trading result.
If a quoted market price was available for derivative financial instruments listed in an active market, such market price was used as the basis for the determination of the fair value. For derivative financial instruments not quoted in an active market, the fair value is determined using generally accepted measure-ment methods. Financial instruments without option character-istics were exclusively measured in accordance with the so-called discounted cash flow (DCF) method. Under the DCF method, the expected future cash flows are discounted using the market interest rate applicable at the measurement date. Derivative financial instruments with an option feature are measured on the basis of the Black-Scholes model.
5 Investment securities
Investment securities include bonds and other fixed-income securities, equities and other non-fixed-income securities, as well as other shareholdings not accounted for using the equity method.
Investment securities are measured in accordance with the relevant measurement category. Investment securities of the category “Financial assets available for sale” are measured at fair value. The fair value of financial instruments which are listed on an active market is determined on the basis of quoted market prices. If such a quoted market price is not available, the instru-ments are measured using measurement methods, such as the discounted cash flow method. Fair value changes of instruments included in this category are generally recognised directly in equity in the revaluation reserve. If the fair value of individual equity instruments cannot be determined, they are measured at cost.
Investment securities of the category “Loans and receivables” – especially small quantities of bearer bonds not listed in an active market – are measured at amortised cost.
Impairment losses on financial assets are calculated based on the provisions of IAS 39 applicable to the relevant financial assets category or based on the accounting standards relevant for the financial assets concerned and are directly deducted from the carrying amount of the related financial assets.
6 Investments in companies accounted for using the equity method
Investments in associates and interests in joint ventures are recognised in the consolidated statement of financial position at cost when the significant influence arises, or upon formation. In subsequent years, the carrying amount is adjusted by taking into account the pro-rata changes in equity of the company concerned. The pro-rata share in net profit of the company concerned is recognised in the income statement in the result from investments in companies accounted for using the equity method.
If there are indications of an impairment of the interests held in a company accounted for using the equity method, an impairment test is performed and, if necessary, the carrying amount of the interests is written down. Impairment losses are reversed if the underlying reasons for an impairment loss cease to exist, up to the amount of the original carrying amount. Impairment losses and reversals of impairment losses are recognised in the income statement item “Result from investments in companies accounted for using the equity method”.
7 Intangible assets
Intangible assets mainly comprise goodwill. In addition, purchased and internally generated intangible assets are capitalised if the recognition criteria set out in IAS 38 are met. In accordance with IFRS 3 in connection with IAS 38, goodwill is not subject to amortisation, but is tested for impairment at least annually pursuant to IAS 36. Other intangible assets are amortised on a straight-line basis over the expected economic life, which ranges from three to eight years.

Notes180
DVB Bank SE | Group Annual Report 2012
If almost all risks and rewards incidental to ownership of the leased asset are transferred to the lessee (finance lease), DVB recognises a receivable due from the lessee. This receivable is measured at the amount of the net investment in the lease at the time the lease is concluded. Received lease payments are divided into an interest portion, which is recognised in profit or loss, and a capital portion. Income is recognised on an accrual basis as interest income.
8.1.2 The Group as lessee
The main areas where DVB is the lessee within the context of operating leases is the use of office buildings and cars. The lease payments under operating leases are recognised in general administrative expenses. The expense is determined by analogy with a lease payment on a systematic basis which is represent-ative of the time pattern of the user’s benefit.
Until June 2012, the Group was the lessee within the context of finance leases in a small number of cases. These transactions were conducted within the framework of sale-and-lease-back transactions in order to use the leased asset for subleases. Net income from subleases is recognised as interest income, while expenses arising from subleases are reported as interest expenses.
8.2 Impairment of intangible assets, and property and equipment, and reversals of impairment losses
Intangible assets, and property and equipment, are tested for impairment at least annually. Opinions prepared by external experts are predominantly used as a basis to determine the value of property and equipment. If the recoverable amount determined on this basis has fallen below amortised cost, or below cost less any accumulated depreciation and any accumulated impairment losses, as the case may be, as at the balance sheet date, a write-down for impairment is made.
If it is established during an impairment test that the reasons for an impairment previously recognised in profit or loss no longer exists, the relevant impairment loss is reversed, except if good-will is concerned.
8 Property and equipment
Property and equipment includes land and buildings, assets held under operating leases (especially ships, aircraft, aircraft engines and maritime container boxes), leasehold improvements as well as operating and office equipment. Items of property and equip-ment are initially recognised at cost. The cost includes the purchase price as well as transaction costs in the form of fees/commissions paid and capitalised borrowing costs in accordance with IAS 23. Subsequent measurement of items of property and equipment is based on their cost less any accumulated depreci-ation and any accumulated impairment losses, according to the cost model mentioned in IAS 16. The useful lives of items of property and equipment are as follows.
8.1 Leasing
In accordance with IAS 17, a lease is classified as an operating lease if it does not transfer to the lessee substantially all the risks and rewards incidental to ownership. In contrast, a lease is classified as a finance lease if it transfers substantially all risks and rewards to the lessee.
8.1.1 The Group as lessor
If beneficial ownership of the leased asset remains with DVB, the lease is classified as an operating lease. The leased assets are carried at cost less any depreciation accumulated over the useful life. If there is a guaranteed residual value for the leased asset at the end of the lease term, the asset is depreciated on a straight-line basis over the term of the lease down to the guar-anteed residual value.
Revenue generated from leases is recognised on a straight-line basis over the lease term and reported in net interest income, unless another amortisation procedure is appropriate.
Asset category Useful life Depreciation method
Land and buildings 50 years straight-line depreciation
Operating and
office equipment
3 to 15 years
straight-line depreciation
Leased assets 0.5 to 25 years straight-line depreciation
Leasehold improvements 2 to 10 years straight-line depreciation

Notes 181
T HE C OMPA N Y F IN A NCI A L A ND EqUI T Y M A RK E T S GROUP M A N AGE MEN T RE P OR T C ONSOL IDAT E D F IN A NC I A L S TAT E M E N T S
DVB Bank SE | Group Annual Report 2012
9 Current and deferred taxes
Current and deferred taxes are accounted for pursuant to the provisions of “IAS 12 – Income Taxes”. Accordingly, deferred taxes have to be recognised for differences in the carrying amounts of assets and liabilities in the IFRS statement of financial position and the tax base, to the extent that such differences will reverse in future. Deferred income tax assets on tax loss carryforwards are recognised when the timing and the amount of their recover-ability in the future can be reliably determined.
10 Deposits from customers and other banks
Deposits from customers mainly comprise customer deposits and promissory note loans held by customers. Deposits from other banks include borrowings from other banks, money market place-ments and promissory note loans held by banks.
The deposits are predominantly measured at amortised cost on the basis of the original effective interest rate. Individual de -posits from customers and other banks are measured at fair value under the fair value option in order to eliminate accounting mismatches. Changes in the fair value are reported in the result from the application of the fair value option.
11 Securitised liabilities
The item “Securitised liabilities” includes in particular commercial papers, bearer bonds and covered bonds (Pfandbriefe) issued by DVB Bank SE. Items of this category are generally measured at amortised cost, which was determined using the effective interest method.
12 Provisions
This item includes defined benefit pension obligations, provisions for early retirement, partial retirement and jubilee payments, as well as other provisions.
DVB Bank SE offers its employees defined benefit obligations for post-employment benefits. The amount of the retirement benefit obligations is based on the remuneration and the length of service of the relevant employee in the Group. A portion of the pension obligations is covered by reinsurance policies.
Pension obligations differ in terms of the base amount, which is granted for a number of years of service, and the top-up amount, which applies when the period of service exceeds 25 years. They additionally include a commitment for benefits to surviving dependants (widow(er)s and orphans) as well as for benefits in the case of invalidity.
The defined benefit obligations are measured in accordance with IAS 19, taking into account expected salary and pension increases using the projected unit credit method. Actuarial gains and losses are recognised directly in equity when they occur.
The other provisions are measured in accordance with IAS 37, using the best estimate of the expected future expenses required to settle the obligation.
13 Subordinated liabilities
The item “Subordinated liabilities” includes subordinated loans from banks, subordinated bearer bonds issued by DVB Bank SE, profit-participation rights and silent partnership contributions. The liabilities are measured at amortised cost using the effective interest method.
14 Equity
Equity represents the residual interest in the assets of a company after deducting all of its liabilities. At the DVB Group, it comprises issued share capital, capital reserve and retained earnings as well as specific reserves resulting from the application of IAS 39 in order to temporarily recognise certain gains or losses from remeasurement. This mainly includes the revaluation reserve for available-for-sale financial instruments as well as the hedging reserve for cash flow hedges. The individual components of the treasury shares held by DVB Bank SE are deducted from equity using the so-called “par value method”. Gains and losses arising from transactions with treasury shares are recognised directly in equity.

Notes182
DVB Bank SE | Group Annual Report 2012
The transfer of the hedging reserve for cash flow hedges to the income statement due to the receipt of hedged interest pay-ments denominated in foreign currency resulted in an expense of €18.0 million (2011: income of €10.6 million), which is reported in the item “Interest income from lending and money market transactions”. This compares with a correspondingly higher interest income from US dollar loans.
In the business year under review, interest income from financial instruments not measured at fair value through profit or loss amounted to €693.9 million (2011: €576.9 million), and interest expense amounted to €530.6 million (2011: €470.9 million). Net interest income includes interest income in the amount of €24.5 million attributable to impaired loans and advances (2011: €31.4 million).
16 Allowance for credit losses
The allowance for credit losses changed as follows:
The distribution of the allowance for credit losses by business division is outlined in the discussion of financial position and performance (see pages 114 – 115).
Notes to the consolidated income statement
15 Net interest income
Net interest income can be broken down as follows in the year under review:
€ mn 2012 2011 %
Interest income
from lending and
money market transactions 734.6 634.6 15.8
from bonds and other
fixed-income securities 13.5 12.8 5.5
from finance leases 40.1 34.1 17.6
Current income
from operating leases 198.8 212.6 –6.5
from equity investments and
other investment securities 0.8 1.8 –55.6
Interest income 987.8 895.9 10.3
Interest expenses
for deposits –311.6 –334.0 –6.7
for securitised liabilities –282.5 –154.1 83.3
for subordinated liabilities –15.7 –18.4 –14.7
from operating leases –148.0 –131.1 12.9
Interest expenses –757.8 –637.6 18.9
Net interest income 230.0 258.3 –11.0
€ mn 2012 2011 %
Additions –149.7 –104.6 43.1
Reversals 82.1 41.2 99.3
Direct write-offs –7.3 –0.6 –
Recoveries on loans and
advances previously written off 4.2 4.8 –12.5
Total –70.7 –59.2 19.4

Notes 183
T HE C OMPA N Y F IN A NCI A L A ND EqUI T Y M A RK E T S GROUP M A N AGE MEN T RE P OR T C ONSOL IDAT E D F IN A NC I A L S TAT E M E N T S
DVB Bank SE | Group Annual Report 2012
17 Net fee and commission income
Net fee and commission income can be broken down as follows in the year under review:
To the extent that interest for irrevocable loan commitments was received, such interest was deferred on the liability side over the term of the loan commitment and recognised as interest income over the term of the underlying loan, using the effective interest method. Interest on commitments for roll-over loans with interest rates fixed over a short period of time was recognised at the date of payment, and shown as fee and commission income from lending business.
Fee and commission income from financial instruments not meas-ured at fair value through profit or loss amounts to €113.0 million (2011: €100.1 million); fee and commission expenses amount to €0.8 million (2011: €1.0 million).
18 Result from investments in companies accounted for using the equity method
The result from investments accounted for using the equity method can be broken down as follows in the year under review:
19 General administrative expenses
General administrative expenses were as follows in the year under review:
€ mn 2012 2011 %
Result from joint ventures
accounted for using the
equity method 3.9 –5.8 –
Results from associates
accounted for using the
equity method 4.6 5.9 –22.0
Total 8.5 0.1 –
€ mn 2012 2011 %
Wages and salaries –88.0 –96.0 –8.3
Social security contributions –7.2 –6.7 7.5
Expenses for pensions and
other employee benefits –6.3 –6.3 –
Staff expenses –101.5 –109.0 –6.9
Expenses for temporary staff –1.5 –1.5 –
Contributions and fees –11.7 –8.2 42.7
Legal and auditing fees –13.5 –13.3 1.5
Other advisory services
(including IT advisory) –15.1 –12.4 21.8
IT costs –5.0 –4.3 16.3
Occupancy expenses –6.7 –9.5 –29.5
Procurement of information –1.4 –1.4 –
Public relations –1.0 –1.2 –16.7
Ancillary labour costs –17.7 –16.8 5.4
Other non-staff expenses –4.3 –7.0 –38.6
Non-staff expenses –77.9 –75.6 3.0
Property and equipment,
and investment property –2.7 –2.6 3.8
Intangible assets –1.9 –2.2 –13.6
Total depreciation,
amortisation, impairment
and write-ups –4.6 –4.8 –4.2
Total general
administrative expenses –184.0 –189.4 –2.9
€ mn 2012 2011 %
Fee and commission income
from payment transactions 1.1 1.1 0.0
from guarantees
and indemnities 4.4 3.2 37.5
from the lending business 113.0 100.1 12.9
Other fee
and commission income 20.5 18.4 11.4
Fee and commission income 139.0 122.8 13.2
Fee and commission expenses
from the securities business 0.0 0.0 0.0
from payment transactions –0.7 –0.6 16.7
from guarantees
and indemnities –0.1 –0.2 –50.0
from the lending business –0.8 –1.0 –20.0
Other fee and
commission expenses –6.7 –4.8 –39.6
Fee and
commission expenses –8.3 –6.6 25.8
Net fee and
commission income 130.7 116.2 12.5

Notes184
DVB Bank SE | Group Annual Report 2012
21 Net result from financial instruments in accordance with IAS 39
The result from financial instruments in accordance with IAS 39 is divided into the trading result, the hedge result, the result from the application of the fair value option, the result from derivatives entered into without intention to trade, and the result from investment securities.
21.1 Trading result
The trading result can be broken down as follows in the year under review:
A result from remeasurement reported in the trading result amounting to €0.0 million (2011: €–1.4 million) was determined on the basis of measurement models.
The transfer of the reserve from cash flow hedges to the income statement due to the payment of hedged expenses denominated in foreign currency resulted in an income of €2.6 million (2011: €0.0 million), €2.0 million of which resulted from the hedge of staff expenses and €0.6 million from the hedge of other admin-istrative expenses.
In the year under review, minimum lease payments under oper-ating leases in the amount of €4.9 million (2011: €7.4 million) were recognised as expenses. There were no contingent rents and sublease payments.
Legal and auditing fees included fees for auditors in the amount of €2.2 million (2011: €1.4 million). These fees were comprised of the following individual items:
20 Net other operating income/expenses
Net other operating income/expenses were as follows:
€ mn 2012 2011 %
Auditing fees 1.4 1.0 40.0
Other advisory services 0.7 0.2 –
Other services 0.1 0.2 –50.0
Total fees 2.2 1.4 57.1
€ mn 2012 2011 %
Income
from the disposal of
property and equipment 0.1 0.4 –75.0
from rents 0.5 0.4 25.0
from deconsolidation 43.9 4.0 –
from the reversal of provisions 1.6 1.3 23.1
from the recovery of taxes
not related to income 0.8 0.1 –
from revenues of
TES Holdings Ltd 5.7 9.8 –41.8
from miscellaneous
other income 20.4 10.4 96.2
Other operating income 73.0 26.4 –
Expenses from deconsolidation –11.9 –4.2 –
Additions to provisions 0.0 0.0 –
Expenses for taxes
not related to income –0.2 0.0 –
Losses from the disposal of
property and equipment –3.5 0.0 –
Miscellaneous other expenses –14.7 –4.9 –
Other operating expenses –30.3 –9.1 –
Net other operating
income/expenses 42.7 17.3 –
€ mn 2012 2011 %
Trading result 2.0 –0.6 –
Hedge result 0.7 10.7 –93.5
Result from the application
of the fair value option 0.0 –0.4 –
Result from derivatives entered
into without intention to trade –21.1 –3.9 –
Result from
investment securities 2.6 –1.4 –
Total –15.8 4.4 –
€ mn 2012 2011 %
Trading result
from derivatives –3.4 –1.2 –
from foreign
currency transactions –1.0 –4.1 –75.6
from interest and
dividend payments 3.0 4.9 –38.8
Other 3.4 –0.2 –
Total 2.0 –0.6 –

Notes 185
T HE C OMPA N Y F IN A NCI A L A ND EqUI T Y M A RK E T S GROUP M A N AGE MEN T RE P OR T C ONSOL IDAT E D F IN A NC I A L S TAT E M E N T S
DVB Bank SE | Group Annual Report 2012
21.2 Hedge result (hedge accounting)
The hedge result can be broken down as follows in the year under review:
The aggregate result from remeasurement of hedging relation-ships, amounting to €0.7 million (2011: €10.7 million), was deter-mined on the basis of valuation models.
21.3 Result from the application of the fair value option
The result from the application of the fair value option includes changes in the fair value of those non-derivative financial instru-ments that have to be accounted for and measured at fair value through profit or loss due to the exercise of the underlying option. To the extent that these non-derivative financial instruments are not part of an economic hedging relationship with derivative financial instruments, the gains or losses from remeasurement of the derivative financial instruments are also included in this item.
The aggregate remeasurement result from the application of the fair value option, amounting to €0.0 million (2011: €–0.4 million), was determined on the basis of valuation models.
Financial assets or financial liabilities accounted for using the fair value option have matured as planned. There were no material effects from changes in credit quality. The accumulated changes in the fair value of financial assets and financial liabilities as a result of credit quality changes amounted to €0.0 million each in the previous year.
21.4 Result from derivatives entered into without intention to trade
The result from derivatives entered into without intention to trade includes results from remeasurement of economic hedging derivatives which are not part of an effective hedging relationship with regard to transactions in the banking book in accordance with IAS 39.
The aggregate result from remeasurement of derivatives entered into without intention to trade, amounting to €–21.1 million (2011: €–3.9 million), was determined on the basis of valuation models.
21.5 Result from investment securities
The result from investment securities can be broken down as follows in the year under review:
The result from investment securities included income from the application of valuation models in the amount of €1.0 million (2011: €0.0 million). The result from investment securities avail-able for sale includes valuation allowances in the amount of €0.8 million (2011: €5.2 million).
€ mn 2012 2011 %
Result from derivative
hedging instruments 172.5 80.7 –
Result from hedged items –171.9 –70.0 –
Result from remeasurement 0.6 10.7 –94.4
Ineffectiveness of
cash flow hedges 0.1 0.0 –
Total 0.7 10.7 –93.5
€ mn 2012 2011 %
Loans and advances to
customers designated as at
fair value through profit or loss 0.0 0.0 –
Deposits from customers and
other banks designated as at
fair value through profit or loss 0.0 0.1 –
Economic derivative
hedging instruments 0.0 –0.5 –
Total 0.0 –0.4 –
€ mn 2012 2011 %
Interest-rate derivatives –21.1 –3.9 –
Total –21.1 –3.9 –
€ mn 2012 2011 %
Result from investment
securities measured at
amortised cost 0.0 – –
Result from investment
securities available for sale 2.6 –1.4 –
Total 2.6 –1.4 –

Notes186
DVB Bank SE | Group Annual Report 2012
The following reconciliation shows the relationship between the expected tax expense and the actual tax expense:
The expected tax rate for the Group was composed of the corpo-rate income tax rate of 15.0%, which is currently applicable in Germany, plus a solidarity surcharge of 5.5%, as well as an aver-age trade tax multiplier of 460% applicable for Frankfurt/Main. The expected Group tax rate, based on these rates, was 31.9%.
Deferred tax income of €0.2 million is attributable to the recog-nition or reversal of temporary differences (2011: €10.4 million).
22 Income taxes
Income taxes were as follows in the year under review:
The expenses from current taxes on income includes €2.1 million of prior-period income (2011: income of €2.6 million).
Components of other comprehensive income included the following tax effects:
Tax effects (€ mn)
2012 2011
Amount
before taxes
Income
taxes
Amount
after taxes
Amount
before taxes
Income
taxes
Amount
after taxes
Other comprehensive income
from the revaluation of AfS financial instruments 5.4 –1.7 3.7 –2.0 0.2 –1.8
from cash flow hedges 25.6 –8.2 17.4 –20.1 6.3 –13.8
from net investment hedges –1.7 0.5 –1.2 – – –
from currency translation 6.4 – 6.4 0.5 – 0.5
from actuarial gains and losses –5.5 1.9 –3.6 0.4 –0.1 0.3
Other comprehensive income 30.2 –7.5 22.7 –21.2 6.4 –14.8
€ mn 2012 2011 %
Consolidated net income
before taxes 141.4 147.7 –4.3
Tax rate in the Group (%) 31.9 31.9 0.0
Expected taxes on income –45.2 –47.1 –4.0
Tax rate differences with
regard to earnings components
that are subject to taxation
in other countries 17.2 12.5 37.6
Tax decreases due
to tax-exempt income 12.5 – –
Current tax amounts
relating to the prior period 2.1 – –
Additional taxes due
to non-deductible expenses –3.1 –2.7 14.8
Tax effects 28.7 9.8 –
Current taxes –22.1 –46.5 –52.5
Deferred taxes 5.6 9.2 –39.1
Reported income taxes –16.5 –37.3 –58.5
€ mn 2012 2011 %
Current taxes on income –22.1 –46.5 –52.5
Deferred income taxes
from temporary differences 0.2 10.4 –98.1
from tax loss carryforwards 5.4 –1.2 –
Income taxes –16.5 –37.3 –55.8

Notes 187
T HE C OMPA N Y F IN A NCI A L A ND EqUI T Y M A RK E T S GROUP M A N AGE MEN T RE P OR T C ONSOL IDAT E D F IN A NC I A L S TAT E M E N T S
DVB Bank SE | Group Annual Report 2012
23 Segment reporting
23.1 General information on segment reporting
The segment report illustrates how the individual business divisions contribute to the DVB Group’s earnings. The segment report is based on the internal management reporting system and accordingly complies with the requirements of “IFRS 8 – Operating Segments”. IFRS 8 requires that segment information be presented on the basis of internal management reporting as regularly used by the “chief operating decision-maker” to make decisions on the allocation of resources to the segments and to assess performance. At DVB, the Board of Managing Directors acts as chief operating decision-maker.
23.2 Segmentation, reconciliation and consolidation
DVB focuses on its core segments Shipping Finance, Aviation Finance, Land Transport Finance and Investment Management. The active Group Treasury segment is additionally reported. The other segments which are not individually reportable segments as well as the internal Service Centre segment are summarised under “Other segments”. Amounts from consolidation adjustments as well as reconciliation items for Group reporting purposes are reported under “Reconciliation/Consolidation”.
The segments Shipping Finance, Aviation Finance and Land Transport Finance include the business with traditionally collat-eralised loans and customised structured financings (Structured Asset Financing) as well as advisory services (Advisory Services). Each segment has its own research, risk management and settlement functions. The Investment Management segment comprises all fund management activities as well as transactions in which the Group holds a stake in the equity capital of com-panies. The Group Treasury segment shows income and expenses from liquidity, interest and capital structure management.
The other, less extensive activities of the Group, such as the subsidiary ITF Suisse as well as the D-Marketing portfolio and the Transport Infrastructure Finance portfolio (which are no longer in line with our strategy), are summarised in the column “Other segments”. In addition, this segment includes those investments that are not allocated to the operating segments. Moreover, this segment includes the central support and man-agement functions as well as significant overheads which the Bank does not allocate to the operating entities. We believe that these overheads cannot be directly influenced by the respective management and therefore no direct control factor can be identified.
The “Reconciliation/consolidation” segment comprises income and expenses that cannot be allocated to an active segment or that are necessary to reconcile financial indicators used for internal management accounting, which are shown in the segment
report of the operating business units, to the corresponding data for external financial reporting, as well as the amounts from consolidation adjustments.
23.3 Methodology of presentation and measurement principles
Income and expenses are generally reported at market prices, and allocated to the responsible business division. Interest income and expenses are allocated to the relevant segments using market interest rates. Costs are only allocated to the operating business divisions of DVB for which they are directly responsible. General costs of operations, overheads or, for example, IT costs are not allocated to the operating business divisions. Fixed exchange rates are used for currency translation in the operating segments. These are determined in the context of annual planning. DVB’s internal management reporting does not take into account taxes on income.
Income or costs from trading activities and exchange rate hedging (hedge accounting) are not allocated to the segments as central functions are responsible for such transactions. Only in exceptional cases do business divisions initiate such trans-actions (Investment Management).
Intersegment, intragroup transactions are only undertaken to an insignificant degree and are entered into on an arm’s length basis.
The interest result of the segments is determined on a net basis, primarily on the basis of market interest rates (i.e. offsetting interest income and interest expenses).
DVB’s segment assets exclusively comprise the relevant segment’s loan portfolios, represented by the risk-weighted assets in accordance with Principle I of the German Banking Act (Basel I).
23.4 Performance measurement
The success of DVB and of each segment is measured on the basis of consolidated net income before taxes as well as the indicators return on equity and cost/income ratio. The return on equity represents the ratio of consolidated net income before taxes attributable to shareholders of DVB to investor capital on average for the year attributable to shareholders of DVB (issued share capital, capital reserve, retained earnings excluding fund for general banking risks and excluding additions to retained earn-ings and adjusted for non-controlling interests). The allocation of the average capital to the segments is made in proportion to the segments’ economic risks, represented by the average utili-sation of economic risk capital. The cost/income ratio is defined as the ratio of administrative expenses and net revenues, excluding the allowance for credit losses.

Notes188
DVB Bank SE | Group Annual Report 2012
23.6 Disclosures on company level
DVB manages its business activities exclusively by business division. Each business division operates on a global scale. There-fore, the Bank does not follow regional management approaches and does not present segment results by region due to the minor relevance and the disproportionately high effort to collect data.
23.5 Reconciliation/consolidation
The “Reconciliation/consolidation” column includes consolidation and reconciliation items to reconcile from the segment result as reported under internal management reporting to the consoli-dated financial statements. These include, among others:
• Income and expenses that cannot or should not be attributable to any other segment, such as costs for deposit protection schemes or transactions affecting more than one period;
• Itemsresultingfromdifferentapproachesusedininternaland external financial reporting;
• Differencesarisingduetotheapplicationoffixedexchangerates in the operating segments; and
• Otherconsolidationeffects.
For information on products and services, please refer to the information regarding the business segments provided in the group management report.
Consolidation effects (€ mn)
Reconciliation/consolidation Reconciliation Consolidation2012 2011 2012 2011 2012 2011
Net interest income –13.2 6.4 –15.9 21.2 2.7 –14.8
Allowance for credit losses –3.4 –1.4 0.0 0.0 –3.4 –1.4
Net interest income
after allowance for credit losses –16.6 5.0 –15.9 21.2 –0.7 –16.2
Net fee and commission income 7.2 0.6 –5.9 –2.0 13.1 2.6
Result from investments in companies
accounted for using the equity method –0.1 0.3 0.0 0.0 –0.1 0.3
Net other operating income/expenses 7.2 –2.8 2.1 3.3 5.1 –6.1
Income –2.3 3.1 –19.7 22.5 17.4 –19.5
Staff expenses –9.1 –10.9 –6.7 –12.7 –2.3 1.8
Non-staff expenses –29.5 –22.6 –21.2 –17.1 –8.3 –5.4
Depreciation, amortisation,
impairment and write-ups 0.1 –0.5 –0.1 –0.1 0.2 –0.4
General administrative expenses –38.5 –34.0 –28.0 –30.0 –10.4 –4.0
Consolidated net income
before IAS 39 and taxes –40.8 –30.9 –47.7 –7.5 7.0 –23.5
Net result from financial instruments
in accordance with IAS 39 0.5 –1.2 0.5 –1.2 0.0 0.0
Consolidated net income before taxes –40.3 –32.1 –47.2 –8.6 7.0 –23.5
Risk-weighted assets
in accordance with Basel I (average) 23.8 164.4 23.8 164.4 0.0 –

Notes 189
T HE C OMPA N Y F IN A NCI A L A ND EqUI T Y M A RK E T S GROUP M A N AGE MEN T RE P OR T C ONSOL IDAT E D F IN A NC I A L S TAT E M E N T S
DVB Bank SE | Group Annual Report 2012
Notes to the statement of financial position
24 Cash and balances with the central bank
This item includes a minimum reserve requirement in the amount of €5.6 million (2011: €8.4 million).
25 Loans and advances to banks
26 Loans and advances to customers
Loans and advances do not include items which are measured at fair value through profit or loss under the fair value option (2011: €3.4 million).
In April 2012, DVB reclassified loan agreements from the category “Financial assets held for trading” to the category “Loans and receivables”. Taking into account the differences recognised in income upon first-time recognition, the carrying amount of reclassified transactions amounted to €117.5 million (with a nominal volume of €111.0 million). The cumulative effect in profit or loss from the measurement of the financial instruments at fair value amounted to €0.4 million as at the date of reclassification, of which €0.2 million related to prior periods. The agreements were reclassified after the Credit Committee of DVB’s Supervisory Board lifted the syndication obligation for the affected loans in April 2012. DVB intends and is able to hold the reclassified loans until maturity. The effective interest rates of the reclassified financial instruments range from 2.2% to 5.8%. The expected future cash flows amounted to €137.2 million as at the date of reclassification. The carrying amount of the reclassified trans-actions was €107.8 million as at the balance sheet date. If the financial instruments had not been reclassified, the additional measurement losses would have amounted to €–1.0 million. The result recognised in profit or loss for the reporting period (consisting of interest income and measurement results) totalled €5.5 million, the fair value recognised as at the balance sheet date amounted to €118.0 million.
As at 31 December 2012, the Company had finance leases for ships, maritime container boxes, aircraft and aircraft engines with a total lease term of between five and 14 years. These leases are reported under loans and advances with a limited term, in an amount of €518.8 million (2011: €445.1 million).
€ mn 2012 2011 %
Cash on hand 0.0 18.4 –
Balances with the central bank 869.6 62.5 –
Total 869.6 80.9 –
€ mn 2012 2011 %
Loans and advances 467.6 455.3 2.7
thereof: payable on demand 457.5 453.9 0.8
thereof: with a limited term 10.1 1.4 –
Money market transactions 1.9 36.4 –94.8
thereof: payable on demand – – –
thereof: with a limited term 1.9 36.4 –94.8
Other loans
and advances to banks 0.1 0.1 0.0
Total 469.6 491.8 –4.5
German banks 25.1 83.8 –70.0
Foreign banks 444.5 408.0 8.9
Total 469.6 491.8 –4.5
€ mn 2012 2011 %
Total lease payments 531.4 495.9 7.2
Guaranteed residual value 99.0 71.1 39.2
Gross investment value 630.4 567.0 11.2
thereof: within one year 96.0 110.4 –13.0
thereof: within one to five years 327.1 285.5 14.6
thereof:
after more than five years 207.3 171.1 21.2
€ mn 2012 2011 %
Total gross investment 630.4 567.0 11.2
Less unearned finance income 111.6 121.9 –8.4
Total net investment 518.8 445.1 16.6
thereof: within one year 79.0 86.7 –8.9
thereof: within one to five years 269.2 224.1 20.1
thereof:
after more than five years 170.6 134.3 27.0
€ mn 2012 2011 %
Loans and advances 19,887.3 18,708.4 6.3
thereof: payable on demand 41.7 206.0 –79.8
thereof: with a limited term 19,845.6 18,502.4 7.3
Other loans
and advances to customers 21.0 30.6 –31.4
Total 19,908.3 18,739.0 6.2
German customers 928.4 1,036.5 –10.4
Foreign customers 18,979.9 17,702.5 7.2
Total 19,908.3 18,739.0 6.2

Notes190
DVB Bank SE | Group Annual Report 2012
30 Investment securities
Equity investments and equities and other non-fixed-income securities also include equity instruments measured at cost with a total carrying amount of €13.9 million (2011: €13.9 million) and €8.7 million (2011: €8.7 million), respectively. It was not possible to identify market prices for these instruments on an active market, nor could fair values be reliably estimated for them.
Gains from the disposal of equity instruments measured at cost were recognised in profit or loss in the amount of €0.0 million (2011: €0.1 million).
27 Allowance for credit losses
The allowance for credit losses (i.e. not including provisions) is based on rules applied consistently throughout the Group, and covers all risks known as at the reporting date. For losses incurred, but not yet identified, a portfolio-based allowance for credit losses (portfolio impairment) is recognised on the basis of historical experience.
The specific allowance for credit losses of €103.3 million (2011: €111.8 million) exclusively relates to loans and advances to customers.
The changes in the allowance for credit losses by business division and region is described in the report on opportunities and risks (see pages 146 – 148).
28 Positive fair values of derivative hedging instruments
29 Trading assets
Allowance for credit losses (€ mn)
Specific allowance for credit losses
Portfolio-based allowance for credit losses
Total
2012 2011 2012 2011 2012 2011
Allowance for credit losses as at 1 Jan 111.8 150.2 36.6 32.3 148.4 182.5
Additions 108.0 96.9 41.7 7.5 149.7 104.4
Utilisation –64.3 –101.0 – – –64.3 –101.0
Reversals –49.5 –38.0 –32.3 –3.2 –81.8 –41.2
Changes resulting
from exchange rate fluctuations –2.7 3.7 0.0 0.0 –2.7 3.7
Balance as at 31 Dec 103.3 111.8 46.0 36.6 149.3 148.4
€ mn 2012 2011 %
Interest rate products 700.4 473.7 47.9
Currency-related products 10.6 1.3 –
Total 711.0 475.0 49.7
€ mn 2012 2011 %
Derivative financial instruments
with positive fair values 195.1 147.6 32.2
thereof: interest rate products 103.5 133.2 –22.3
thereof:
currency-related products 91.6 14.4 –
Non-derivative
financial instruments – 140.2 –
thereof: syndicated loans – 140.2 –
Total 195.1 287.8 –32.2
€ mn 2012 2011 %
Bonds and other
fixed-income securities 451.4 458.7 –1.6
thereof: bonds and notes 451.4 458.7 –1.6
Equities and other
non-fixed-income securities 11.2 12.1 –7.4
Equity investments 13.9 13.9 –
Total 476.5 484.7 –1.7

Notes 191
T HE C OMPA N Y F IN A NCI A L A ND EqUI T Y M A RK E T S GROUP M A N AGE MEN T RE P OR T C ONSOL IDAT E D F IN A NC I A L S TAT E M E N T S
DVB Bank SE | Group Annual Report 2012
31 Investments in companies accounted for using the equity method
Investments in associates, as well as interests in joint ventures, primarily relate to equity investments held by the Investment Management division.
The financial data of associates accounted for using the equity method are as follows, regardless of the respective interest held by DVB:
The financial data of joint ventures accounted for using the equity method are as follows, based on the respective interest held by DVB:
32 Intangible assets
33 Property and equipment
Property and equipment in the amount of €28.2 million were derecognised in connection with the deconsolidation of TES Holdings Ltd, Bridgend, Wales, United Kingdom. Of that amount, €19.1 million is attributable to assets held under operating leases, €7.1 million to land and buildings, and €2.0 million to other property and equipment.
As at 31 December 2012, Group companies were lessors for ships, aircraft, aircraft engines and railcars provided under oper-ating leases. The lease term was one to ten years for ships, four to ten years for aircraft, six months to seven years for aircraft engines, and one to six years for railcars.
During the year under review, borrowing costs for qualifying assets in operating leases in accordance with IAS 23 were capitalised in the amount of €7.3 million (2011: €0.4 million). This corresponds to an average capitalisation rate of 1.5%.
Total future minimum lease payments as at 31 December 2012 were as follows:
€ mn 2012 2011 %
Assets 581.2 251.7 –
Liabilities 442.5 182.8 –
Income 199.1 35.3 –
Profit or loss for the period 13.6 2.8 –
€ mn 2012 2011 %
Assets 458.7 372.7 23.1
Liabilities 366.4 314.9 16.4
Income 50.3 27.4 83.6
Expenses 46.2 25.2 83.3
€ mn 2012 2011 %
Goodwill 95.0 102.9 –7.7
Other intangible assets 5.0 5.0 0.0
Total 100.0 107.9 –7.3
€ mn 2012 2011 %
Land and buildings 5.3 12.5 –57.6
Operating and office equipment 5.3 6.0 –11.7
Assets held
under operating leases 505.7 778.5 –35.0
Other property and equipment 412.8 447.6 –7.8
Total 929.1 1,244.6 –25.3
€ mn 2012 2011 %
Future minimum
lease payments
due within one year 88.6 149.8 –40.9
due within one to five years 380.7 385.3 –1.2
due after more than five years 192.9 240.3 –19.7
Total 662.2 775.4 –14.6
€ mn 2012 2011 %
Investments in associates 90.7 13.0 –
Interests in joint ventures 100.5 90.7 10.8
Total 191.2 103.7 84.4

Notes192
DVB Bank SE | Group Annual Report 2012
The change in goodwill was attributable to the deconsolidation of TES Holdings Ltd.
The impairment tests performed as at the balance sheet date on the basis of the value in use did not result in any write-downs for impairment to be recognised. The value in use is determined on the basis of a medium-term, five-year projection for all material income and expense components. A constant earnings situation is assumed for periods longer than five years. The discount rates used are determined on the basis of the Capital Asset Pricing Model, which includes a risk-free interest rate, a market risk premium as well as a factor for the systematic risk (beta factor). The values for the risk-free interest rate, the market risk premium and the beta factors are determined using external sources. Business-specific beta factors are based on a corresponding group of peer companies. Fluctuations in the above-mentioned components may affect the calculation of the discount rates. The discount rates used in the business year 2012 for the cash-generating units range between 14.9% and 17.1% (2011: 13.5% and 16.0%).
Intangible assets included internally-generated assets with a residual carrying amount of €2.3 million (2011: €1.9 million).
34 Statement of changes in non-current assets
Depreciation, amortisation, and impairment of land and buildings, operating and office equipment, software and other intangible assets are recognised in the item “Depreciation, amortisation, impairment and write-ups”, which is included in general admin-istrative expenses.
Goodwill is not amortised on a systematic basis. An impairment loss has to be recognised when the recoverable amount of a cash-generating unit to which goodwill has been allocated is less than its carrying amount.
In the business year under review, goodwill was allocated to the following cash-generating units, which correspond to the respective operating segments:
€ mn 2012 2011 %
Shipping Finance 74.7 74.7 0.0
Aviation Finance – 8.0 –
Investment Management 20.3 20.2 0.5
Total 95.0 102.9 –7.7
Statement of changes in non-current assets (€ mn)
Land and
buildings
Operating
and office
equipment
Leased
assets
Other
property and
equipment
Intangible
assets
(excluding
goodwill)
Goodwill
Total
Cost as at 1 Jan 2012 16.6 18.4 918.3 481.0 17.9 102.9 1,555.1
Additions at cost 0.1 2.7 75.1 141.1 0.4 – 219.4
Disposals at cost – –3.5 –207.9 –143.5 – –7.4 –362.3
Reclassifications – 3.5 – –2.1 2.1 – 3.5
Changes in the group of consolidated companies –7.7 –2.5 –129.7 –2.3 – –0.5 –142.7
Exchange rate changes 0.2 0.1 –8.9 –11.8 –0.6 – –21.0
Cost as at 31 Dec 2012 9.2 18.7 646.9 462.4 19.8 95.0 1,252.0
Write-ups – – 6.7 12.6 – – 19.3
Depreciation and amortisation –0.4 –2.1 –39.5 –24.7 –1.9 – –68.6
Impairment – – – –33.5 – – –33.5
Depreciation, amortisation and impairment
(previous years) –4.1 –12.4 –139.8 –33.4 –12.9 – –202.6
Depreciation, amortisation and impairment (disposals) – 3.4 8.7 24.5 – – 36.6
Changes in the group of consolidated companies 0.6 –2.3 19.9 1.1 – – 19.3
Exchange rate changes – – 2.8 3.8 – – 6.6
Cumulative depreciation, amortisation,
impairment and write-ups –3.9 –13.4 –141.2 –49.6 –14.8 – –222.9
Carrying amount as at 31 Dec 2012 5.3 5.3 505.7 412.8 5.0 95.0 1,029.1
Carrying amount as at 31 Dec 2011 12.5 6.0 778.5 447.6 5.0 102.9 1,352.5

Notes 193
T HE C OMPA N Y F IN A NCI A L A ND EqUI T Y M A RK E T S GROUP M A N AGE MEN T RE P OR T C ONSOL IDAT E D F IN A NC I A L S TAT E M E N T S
DVB Bank SE | Group Annual Report 2012
Other non-current assets include transport assets held for short-term rental (€261.3 million), maritime container boxes (€33.0 million) and assets under construction (€118.5 million).
35 Income tax assets
Based on a tax forecast, income tax assets of €5.4 million were capitalised for tax loss carryforwards of €16.7 million (2011: €0.0 million). No income tax assets were capitalised for tax loss carryforwards in the amount of €12.1 million (2011: €10.2 million) since the prerequisites for capitalisation pursuant to IAS 12.34 et seq. were not fulfilled.
Deferred income tax assets were recognised for the following items of the statement of financial position:
Deferred tax assets in the amount of €2.6 million (2011: €6.0 million) were recognised directly in equity.
36 Other assets
37 Deposits from other banks
In the business year 2011, deposits from other banks also included such loans and advances with a total carrying amount of €5.3 million, which are measured at fair value through profit or loss under the fair value option. The difference between the carrying amount and the repayment amount was €0.3 million as at the balance sheet date 2011. These loans and advances matured as scheduled during the 2012 business year.
€ mn 2012 2011 %
Current income tax assets
Germany 1.4 0.4 –
Foreign countries 1.2 2.8 –57.1
Deferred income tax assets
Temporary differences 63.6 74.3 –14.4
Loss carryforward 5.4 – –
Total 71.6 77.5 –7.6
€ mn 2012 2011 %
Trading assets 5.4 0.7 –
Provisions 5.0 5.1 –2.0
Deposits from customers
and other banks 33.1 54.5 –39.3
Other items 16.2 7.7 –
Loans and advances to banks
and customers, including
allowance for credit losses 3.9 6.3 –38.1
Total 63.6 74.3 –14.4
€ mn 2012 2011 %
Receivables from taxes
not related to income 1.7 3.0 –43.3
Advance payments
and prepaid expenses 1.7 1.7 0.0
Miscellaneous other assets 28.7 81.8 –64.9
Total 32.1 86.5 –62.9
€ mn 2012 2011 %
Loans and advances 4,630.0 4,998.1 –7.4
thereof: payable on demand 654.4 394.3 66.0
thereof: with a limited term 3,975.6 4,603.8 –13.6
Money market transactions 155.6 192.3 –19.1
thereof: payable on demand – – –
thereof: with a limited term 155.6 192.3 –19.1
Total 4,785.6 5,190.4 –7.8
German banks 4,440.5 4,761.5 –6.7
Foreign banks 345.1 428.9 –19.5
Total 4,785.6 5,190.4 –7.8

Notes194
DVB Bank SE | Group Annual Report 2012
42 Provisions
The pension obligations changed during the year under review as follows:
The interest expense of €1.6 million (2011: €1.6 million) was recorded under staff expenses. The actual return on plan assets amounted to €6.0 million (2011: €1.1 million).
38 Deposits from customers
39 Securitised liabilities
40 Negative fair values of derivative hedging instruments
41 Trading liabilities
€ mn 2012 2011 %
Loans and advances 5,025.7 4,344.2 15.7
thereof: payable on demand 189.2 158.4 19.4
thereof: with a limited term 4,836.5 4,185.8 15.5
Money market transactions 132.5 79.9 65.8
thereof: with a limited term 132.5 79.9 65.8
Other deposits from customers 14.7 36.2 –59.4
Total 5,172.9 4,460.3 16.0
German customers 4,888.6 4,161.7 17.5
Foreign customers 284.3 298.6 –4.8
Total 5,172.9 4,460.3 16.0
€ mn 2012 2011 %
Ship covered bonds 879.0 546.9 60.7
Bearer bonds 10,512.4 9,283.2 13.2
Total 11,391.4 9,830.1 15.9
€ mn 2012 2011 %
Interest rate products 295.4 278.0 6.3
Currency-related products 1.7 18.3 –90.7
Total 297.1 296.3 0.3
€ mn 2012 2011 %
Derivative financial instruments
with negative fair values
thereof: interest rate products 175.3 209.0 –16.1
thereof:
currency-related products 43.2 164.4 –73.7
Total 218.5 373.4 –41.5
€ mn 2012 2011 %
Provisions for
pension obligations 19.7 14.5 35.9
Provisions for
early and partial retirement 0.5 0.6 –16.7
Other provisions 39.1 44.6 –12.3
Total 59.3 59.7 –0.7
€ mn 2012 2011 %
Present value of the
pension obligations as at 1 Jan
(defined benefit obligation) 32.7 32.0 2.2
Plan assets –18.2 –17.1 6.4
Carrying amount of
pension provisions
as at 1 Jan 14.5 14.9 –2.7
Change in the
year under review
Service cost 0.6 0.6 0.0
Interest cost 1.6 1.6 0.0
Expected return on plan assets –0.7 –0.7 0.0
Actuarial gains and losses 5.5 –0.4 –
Benefits paid –1.8 –1.5 20.0
Carrying amount of
pension provisions
as at 31 Dec 19.7 14.5 35.9
Present value of the
pension obligations
as at 31 Dec
(defined benefit obligation) 43.9 32.7 34.3
Plan assets –24.2 –18.2 33.0
Carrying amount of
pension provisions
as at 31 Dec 19.7 14.5 35.9

Notes 195
T HE C OMPA N Y F IN A NCI A L A ND EqUI T Y M A RK E T S GROUP M A N AGE MEN T RE P OR T C ONSOL IDAT E D F IN A NC I A L S TAT E M E N T S
DVB Bank SE | Group Annual Report 2012
The funded status of the pension obligations was as follows:
The following experience adjustments were made in the business year under review:
The calculation of the present value of the pension obligations is based on the following actuarial assumptions:
In the business year 2012, the Company used the mortality tables called “Richttafeln 2005 G”, by Prof Dr Klaus Heubeck, the mortality tables published by the Norwegian Financial Service Association (FNH), as well as the Dutch mortality tables (Dutch table – AG Prognosetafel 2012–2062) for measuring of the pension provisions for the employees of DVB Bank SE.
The plan assets attributable to active members as at the reporting date consisted of the following types of investments:
We expect additions to plan assets for the business year 2013 in the amount of €0.6 million (2012: €0.4 million).
Other provisions in the Group were as follows:
The provisions for bonuses mainly refer to bonus payments to employees of DVB, and are likely to result in an outflow of cash in the following business year.
€ mn 2012 2011 %
Asset retirement obligations 1.0 1.0 0.0
Lending business 0.2 0.5 –60.0
Bonuses 27.8 35.0 –20.6
Litigation 0.0 0.0 0.0
Miscellaneous other provisions 10.1 8.1 24.7
Total 39.1 44.6 –12.3
Funded status of pension obligations (€ mn)
2012 2011 2010 2009 2008
Present value of pension obligations 43.9 32.7 32.0 29.1 29.1
Plan assets –24.2 –18.2 –17.1 –14.1 –14.7
Total 19.7 14.5 14.9 15.0 14.4
Mio € 2012 2011 %
Experience adjustments
of pension obligations –0.9 –0.4 –
Experience adjustments
of plan assets 5.3 – –
% 2012 2011
Discount rate 3.25 5.00
Expected salary increase 2.25 2.50
Pension increase 2.00 2.00
Expected return on plan assets 3.25 5.00
% 2012 2011
Equities 0.7 0.4
Fixed-income financial instruments 5.5 6.8
Property 1.2 1.5
Other pension plan sponsors 92.6 91.3
Total 100.0 100.0

Notes196
DVB Bank SE | Group Annual Report 2012
Deferred income tax liabilities were recognised for the following items of the statement of financial position:
Deferred tax liabilities in the amount of €4,1 million (2011: €0.0 million) were recognised directly in equity.
The provisions changed during the year under review as follows:
In the previous year, provisions changed as follows:
The changes in the loan loss provisions by business division and region is described in the report on opportunities and risks (see pages 146 – 148).
43 Income tax liabilities
Provisions 2012 (€ mn)
Balance as at 1 Jan 2012
Additions Reversal Utilisation Reclassifi- cation
Exchange rate change
Balance as at 31 Dec 2012
Asset retirement
obligations 1.0 – – – – – 1.0
Lending business 0.5 – –0.3 – – – 0.2
Bonuses 35.0 33.8 – –41.2 – 0.2 27.8
Litigation 0.0 0.0 – 0.0 – – 0.0
Miscellaneous
other provisions 8.1 11.1 –0.9 –8.0 – –0.2 10.1
Total 44.6 44.9 –1.2 –49.2 – 0.0 39.1
€ mn 2012 2011 %
Current income tax liabilities 28.1 35.4 –20.6
Deferred income tax liabilities 33.2 38.3 –13.3
Total 61.3 73.7 –16.8
Provisions 2011 (€ mn)
Balance as at 1 Jan 2011
Additions Reversal Utilisation Reclassifi- cation
Exchange rate change
Balance as at 31 Dec 2011
Asset retirement
obligations 1.0 – – – – – 1.0
Lending business 0.4 0.2 – – – –0.1 0.5
Bonuses 31.4 41.4 –5.0 –32.7 – –0.1 35.0
Litigation 0.1 0.0 – –0.1 – – 0.0
Miscellaneous
other provisions 10.0 7.6 –1.3 –5.9 –2.3 0.0 8.1
Total 42.9 49.2 –6.3 –38.7 –2.3 –0.2 44.6
€ mn 2012 2011 %
Loans and advances to banks
and customers, including
allowance for credit losses 18.6 14.0 32.9
Trading assets
and hedging instruments – 12.5 –
Investment securities 3.0 1.7 76.5
Property and equipment 0.8 2.8 –71.4
Provisions – 3.0 –
Other items 10.8 4.3 –
Total 33.2 38.3 –13.3

Notes 197
T HE C OMPA N Y F IN A NCI A L A ND EqUI T Y M A RK E T S GROUP M A N AGE MEN T RE P OR T C ONSOL IDAT E D F IN A NC I A L S TAT E M E N T S
DVB Bank SE | Group Annual Report 2012
44 Other liabilities
45 Subordinated liabilities
Other subordinated liabilities include non-controlling interests in subsidiaries controlled by DVB which have to be reported as liabilities due to written put options in accordance with IAS 32.
46 Equity
Equity can be broken down as follows:
46.1 Issued share capital
As at the balance sheet date, the fully paid issued share capital of DVB Bank SE amounted to €118,791,945.12, pursuant to Article 4 (1) of the Articles of Association, and consisted of 46,467,370 no-par value shares. These shares exclusively con-sisted of ordinary bearer shares. Please refer to sections 54 et. seq. of the AktG regarding the rights and duties attaching to such shares. Dz BANK held a direct share of 95.45% in the share capital of DVB Bank SE. The remaining shares (4.55%) were in free float.
Pursuant to Article 4 (2) of the Memorandum and Articles of Association (“Authorised Capital 2010”), the Board of Managing Directors is authorised to increase the share capital by up to €50 million; this authority will expire on 8 June 2015. Based on an assumed imputed value per no-par value share of €2.55645940598, the maximum number of new no-par value shares issued from “Authorised Capital 2010” would be 19,558,300.
Furthermore, pursuant to Article 4 (3) of the Memorandum and Articles of Association (“Conditional Capital 2010”), the share capital is subject to a conditional capital increase until 8 June 2015 not exceeding €25 million through the issuance of 9,779,149 new no-par value bearer shares to be issued from con-vertible bonds and bonds cum warrants. The Board of Managing Directors is authorised to determine the details of the conditional capital increase.
€ mn 2012 2011 %
Other tax liabilities 0.7 0.3 –
Miscellaneous other liabilities 77.3 136.2 –43.3
Total 78.0 136.5 –42.9
€ mn 2012 2011 %
Subordinated
promissory note loans 274.0 400.6 –31.6
Subordinated bearer bonds 137.8 – –
Total 411.8 400.6 2.8
€ mn 2012 2011 %
Issued share capital 117.9 117.9 0.0
Capital reserve 331.3 331.7 –0.1
Retained earnings 836.1 740.8 12.9
Revaluation reserve 3.8 0.1 –
Reserve from cash flow hedges 6.3 –11.1 –
Reserve from
net investment hedges –1,2 – –
Currency translation reserve 4.7 –1.7 –
Distributable profit 27.9 27.9 0.0
Equity before
non-controlling interests 1,326.8 1,205.6 10.1
Non-controlling interests 2.1 4.4 –52.3
Equity 1,328.9 1,210.0 9.8

Notes198
DVB Bank SE | Group Annual Report 2012
46.5 Revaluation reserve
The revaluation reserve includes the changes in the fair value of financial assets available for sale, taking into account deferred taxes.
46.6 Reserve from cash flow hedges
The reserve from cash flow hedges includes measurement gains or losses from hedging instruments attributable to the effective portion of the hedging relationship, taking into account deferred taxes. The cash flows hedged through the hedging relationship will mainly be received by the Company in the following business year.
46.7 Reserve from net investment hedges
DVB uses foreign exchange forwards to hedge the currency translation risk from net investments in foreign operations with a different functional currency. The reserve from net investment hedges includes measurement gains or losses from hedging instruments attributable to the effective portion of the hedging relationship, taking into account deferred taxes.
46.8 Currency translation reserve
Currency translation differences resulting from the translation of financial statements of Group companies denominated in a foreign currency into euro (the Group currency) are recognised in the currency translation reserve.
46.9 Non-controlling interests
Non-controlling interests include the interest in equity of subsidiaries not attributable to DVB.
46.2 Capital reserve
The capital reserve includes the premium from the issuance of shares, incl. subscription rights, exceeding the nominal value or the imputed value.
46.3 Treasury shares
As at 31 December 2012, DVB Bank SE held a total of 370,751 treasury shares at a carrying amount of €9,449,307.94, which are deducted from equity using the par value method. For this purpose, the treasury shares are divided into the components “Issued share capital” and “Capital reserve”. Gains or losses arising from transactions with treasury shares are offset against retained earnings.
46.4 Retained earnings
Retained earnings include the legal reserve, other retained earnings, as well as the fund for general banking risks.
The legal reserve amounted to €1.3 million (2011: €1.3 million) and was subject to restrictions with regard to distribution to shareholders.
Other retained earnings comprise the undistributed profits of the Group, including the cumulative amounts resulting from con-solidation adjustments recognised in profit or loss. Of the other retained earnings, an amount of €11.1 million (2011: €8.4 million) was not distributable pursuant to section 268 (8) sentence 2 of the HGB.
In addition, retained earnings also include the fund for general banking risks totalling €82.4 million (2011: €82.4 million).

Notes 199
T HE C OMPA N Y F IN A NCI A L A ND EqUI T Y M A RK E T S GROUP M A N AGE MEN T RE P OR T C ONSOL IDAT E D F IN A NC I A L S TAT E M E N T S
DVB Bank SE | Group Annual Report 2012
Notes to financial instruments
47 Classes and categories of financial instruments
The carrying amounts and fair values of financial assets and financial liabilities were allocated to the classes and categories (or subcategories) of financial instruments as indicated in the tables below:
2012 2011 € mn
Carrying amount
Fair value Carrying amount
Fair value
Financial assets held for trading 195.1 195.1 287.8 287.8
thereof: trading assets 195.1 195.1 287.8 287.8
Financial assets designated as at fair value through profit or loss – – 3.4 3.4
thereof: loans and advances to banks – – – –
thereof: loans and advances to customers – – 3.4 3.4
thereof: investment securities – – – –
Derivative hedging instruments 711.0 711.0 475.0 475.0
thereof: positive fair values of derivative hedging instruments 711.0 711.0 475.0 475.0
Financial assets available for sale 436.4 436.4 442.9 442.9
thereof: investment securities 436.4 436.4 442.9 442.9
Financial assets measured at fair value 1,342.5 1,342.5 1,209.1 1,209.1
Loans and receivables 20,597.0 21,179.1 18,715.6 19,088.8
thereof: cash and balances with the central bank 869.6 869.6 62.5 62.5
thereof: loans and advances to banks 469.6 470.0 491.8 491.8
thereof: loans and advances to customers 19,240.3 19,820.4 18,142.1 18,510.0
thereof: investment securities 17.5 19.1 19.2 24.5
Financial assets available for sale 22.6 22.6 22.6 22.6
thereof: investment securities 22.6 22.6 22.6 22.6
Other assets 22.3 22.3 – –
Financial assets measured at amortised cost 20,641.9 21,224.0 18,738.2 19,111.4
Finance leases 518.7 511.4 445.1 442.3
thereof: loans and advances to customers 518.7 511.4 445.1 442.3
Other financial assets 518.7 511.4 445.1 442.3

Notes200
DVB Bank SE | Group Annual Report 2012
As at year-end, financial collateral was provided in the amount of €324.8 million.
2012 2011 Mio €
Carrying amount
Fair value Carrying amount
Fair value
Financial liabilities held for trading 218.5 218.5 373.4 373.4
thereof: trading liabilities 218.5 218.5 373.4 373.4
thereof: other liabilities – – – –
Fair value option – – 5.3 5.3
thereof: deposits from other banks – – 5.3 5.3
thereof: deposits from customers – – – –
thereof: securitised liabilities – – – –
thereof: subordinated liabilities – – – –
Derivative hedging instruments 297.1 297.1 296.3 296.3
thereof: negative fair values of derivative hedging instruments 297.1 297.1 296.3 296.3
Financial liabilities measured at fair value 515.6 515.6 675.0 675.0
Deposits from other banks 4,785.6 4,734.0 5,185.1 4,990.1
Deposits from customers 5,172.9 5,085.9 4,448.9 4,136.4
Securitised liabilities 11,391.4 11,664.7 9,830.1 9,684.8
Other liabilities 27.3 27.3 136.2 136.2
Subordinated liabilities 411.8 438.8 400.6 384.2
Financial liabilities measured at amortised cost 21,789.0 21,950.7 20,000.9 19,331.7
Finance leases – – 11.4 11.7
thereof: deposits from customers – – 11.4 11.7
Other financial liabilities – – 11.4 11.7

Notes 201
T HE C OMPA N Y F IN A NCI A L A ND EqUI T Y M A RK E T S GROUP M A N AGE MEN T RE P OR T C ONSOL IDAT E D F IN A NC I A L S TAT E M E N T S
DVB Bank SE | Group Annual Report 2012
48 Determination of fair values of financial instruments
The fair value is the amount for which an asset could be exchanged or a liability settled between knowledgeable, willing parties in an arm’s length transaction.
The fair value of financial instruments which are listed on an active market is determined on the basis of market prices. The fair value of shares in funds is determined using the redemption price as published by the investment company. The fair values of these financial instruments are allocated to Level 1.
The fair value of financial instruments which are not listed on an active market is determined on the basis of accepted valuation models used uniformly throughout all classes and allocated to Level 2. Non-derivative financial instruments as well as derivative financial instruments with no option components are measured using the DCF method. The derived discount rate is based on currency-specific swap curves. Derivative financial instruments with option components are measured using accepted option pricing models (Black-Scholes/Black-76 model). The valuation models use parameters that largely can be observed on the market.
Since November 2012, the fair value of Level 2 financial instru-ments has been determined using forward curves with consistent tenors. The forward curves are structured based on homogeneous time bands. Moreover, Level 2 derivative financial instruments which form part of existing hedges are discounted on the basis
of overnight index swap rates. Where the currency of the hedge differs from the transaction currency, the cross-currency basis spread is taken into account additionally for the purpose of determining fair value. The measurement adjustment is applied prospectively and corresponds to an adjustment to the current market standard. The valuation effect in the amount of €2.9 million is recognised in profit or loss.
To the extent that the measurement models use inputs that are largely not observable on the market, the resulting fair values are allocated to Level 3.
In the year under review, there were no reclassifications between the individual levels.
The fair values of the financial instruments were determined in accordance with the following methods, to the extent that these instruments were included in measurement as at the balance sheet date:
49 Unrecognised differences upon initial recognition
Unrecognised gains upon initial recognition in the business year 2011 result from the purchase of financial assets. The related amortisation amounts were €1.3 million (2011: €0.2 million) in the reporting year. Taking currency translation effects of €–0.2 million (2011: €0.6 million) into account, the closing balance was €8.4 million (2011: €9.9 million).
Determination of fair values of financial instruments (€ mn)
Level 1 Level 2 Level 32012 2011 2012 2011 2012 2011
Loans and advances to banks – – – – – –
Loans and advances to customers – – – 3.4 – –
Trading assets – – 195.1 287.8 – –
Positive fair values of
derivative hedging instruments – – 711.0 475.0 – –
Investment securities 432.6 437.5 3.8 5.4 – –
Financial assets measured at fair value 432.6 437.5 909.9 771.6 – –
Deposits from other banks – – – 5.3 – –
Deposits from customers – – – – – –
Trading liabilities – – 218.5 373.4 –
Negative fair values of
derivative hedging instruments – – 297.1 296.3 – –
Subordinated liabilities – – – – – –
Financial liabilities measured at fair value – – 515.6 675.0 – –

Notes202
DVB Bank SE | Group Annual Report 2012
50 Earnings contributions of financial instruments by measurement categories
1 Jan 2012 – 31 Dec 2012 (€ mn)
Recognition in the income statement
Recognition in
equity
Total
Interest result
Allowance for
credit losses
Net fee and
commission
income1)
Net result
from financial
instruments
in accordance
with IAS 39
Measurement
result
Financial assets and liabilities designated
as at fair value through profit or loss –0.1 – – 0.0 – –0.1
Financial assets and liabilities held for trading –33.3 – – –19.1 – –52.4
Loans and receivables 680.4 –71.0 112.2 –171.9 – 549.7
Financial assets available for sale 13.5 – – 2.6 7.0 23.1
Other liabilities –530.6 – – – – –530.6
Positive and negative fair values
of derivative hedging instruments 8.4 – – 172.6 8.3 189.3
Total 138.3 –71.0 112.2 –15.8 15.3 179.0
1 Jan 2011 – 31 Dec 2011 (€ mn)
Recognition in the income statement
Recognition in
equity
Total
Interest result
Allowance for
credit losses
Net fee and
commission
income1)
Net result
from financial
instruments
in accordance
with IAS 39
Measurement
result
Financial assets and liabilities designated
as at fair value through profit or loss 0.3 – – 0.1 – 0.4
Financial assets and liabilities held for trading 17.8 – – –5.0 – 12.8
Loans and receivables 566.9 –59.0 99,1 –70.0 – 537.0
Financial assets available for sale 10.0 – – –1.4 3.7 12.3
Other liabilities –470.9 – – – – –470.9
Positive and negative fair values
of derivative hedging instruments 16.8 – – 80.7 –9.5 88.0
Total 140.9 –59.0 99.1 4.4 –5.8 179.6
1) Breakdown of net fee and commission income adjusted in comparison with the previous year

Notes 203
T HE C OMPA N Y F IN A NCI A L A ND EqUI T Y M A RK E T S GROUP M A N AGE MEN T RE P OR T C ONSOL IDAT E D F IN A NC I A L S TAT E M E N T S
DVB Bank SE | Group Annual Report 2012
52 Risks arising from the use of financial instruments
The disclosures as to the nature and extent of risks arising from the use of financial instruments are included in the report on opportunities and risks (pages 150 – 151) in accordance with the provisions of IFRS 7. This does not apply to the contractual maturity analysis, which is shown below.
53 Maturity groupings of derivative financial instruments
The amounts reported for the individual time bands reflect the contractual undiscounted and future cash flows.
Allowance for credit losses (€ mn)
Financial assets measured at amortised cost
Other financial assets Total
2012 2011 2012 2011 2012 2011
Allowance for credit losses as at 1 Jan 136.6 172.3 11.8 10.2 148.4 182.5
Additions 139.1 89.0 10.6 15.4 149.7 104.4
Utilisation –58.7 –87.7 –5.6 –13.3 –64.3 –101.0
Reversals –73.3 –39.2 –8.5 –2.0 –81.8 –41.2
Changes resulting from
exchange rate fluctuations –2.8 2.2 0.1 1.5 –2.7 3.7
Balance as at 31 Dec 140.9 136.6 8.4 11.8 149.3 148.4
Maturity groupings and fair values (€ mn)
Terms to maturity
up to
one year
one to
five years
more than
five years
Total
31 Dec 2012
Total
31 Dec 2011
Interest-rate derivatives with positive fair values
thereof: interest rate swaps 14.2 351.8 440.3 806.3 634.1
thereof: interest rate options – 0.0 0.2 0.2 –
Interest-rate derivatives with negative fair values
thereof: interest rate swaps –8.4 –194.0 –237.6 –440.0 –480.2
thereof: interest rate options 0.0 –1.6 –29.1 –30.7 –
Total interest rate derivatives 5.8 156.2 173.8 335.8 153.9
Currency-related derivatives with positive fair values
thereof: forward currency contracts 45.8 – – 45.8 1.6
thereof: cross-currency swaps 0.4 45.6 10.5 56.5 12.9
Currency-related derivatives with negative fair values
thereof: forward currency contracts –5.3 – – –5.3 –127.5
thereof: cross-currency swaps 0.0 –39.2 –0.6 –39.8 –75.6
Total currency-related derivatives 40.9 6.4 9.9 57.2 –188.6
Total 46.7 162.6 183.7 393.0 –34.7
51 Allowance for credit losses by classes
The allowance for credit losses (i.e. not including provisions) was distributed across the classes of financial assets as follows:

Notes204
DVB Bank SE | Group Annual Report 2012
54 Maturity groupings of non-derivative financial instruments
The amounts reported for the individual time bands reflect the contractual, undiscounted and future cash flows (interest and capital payments).
31 Dec 2012 (€ mn)
Payable on demand
Terms to maturity
Total
up to three
months
from
three months
to one year
from
one year to
five years
more than
five years
indefinite
term
Loans and advances to banks 457.5 2.5 2.1 7.1 – – 469.2
Loans and advances to customers 774.2 751.8 2,843.8 13,479.7 4,663.8 – 22,513.3
Investment securities 7.5 0.6 7.6 436.0 – 25.1 476.8
Other assets 22.3 – – – – – 22.3
Total assets 1,261.5 754.9 2,853.5 13,922.8 4,663.8 25.1 23,481.6
Deposits from other banks 654.4 187.3 990.8 2,071.3 1,099.3 – 5,003.1
Deposits from customers 189.2 280.5 271.4 2,234.4 3,047.5 – 6,023.0
Securitised liabilities – 64.5 1,372.8 9,362.9 1,541.0 – 12,341.2
Subordinated liabilities – 37.1 84.0 305.0 39.7 – 465.8
Other liabilities 27.3 – – – – – 27.3
Total liabilities 870.9 569.4 2,719.0 13,973.6 5,727.5 – 23,860.4
Financial guarantee contracts 1.2 0.0 20.2 77.7 109.0 29.4 237.5
Loan commitments 8.3 42.8 25.2 302.0 934.8 – 1,313.1
31 Dec 2011 (€ mn)
Payable on demand
Terms to maturity
Total
up to three
months
from
three months
to one year
from
one year to
five years
more than
five years
indefinite
term
Loans and advances to banks 453.9 42.2 0.9 0.5 – – 497.5
Loans and advances to customers 229.6 1,360.5 880.4 1,685.2 11,814.4 5,152.0 21,122.1
Investment securities 5.4 5.6 14.8 457.4 – 25.9 509.1
Total assets 688.9 1,408.3 896.1 2,143.1 11,814.4 5,177.9 22,128.7
Deposits from other banks 394.4 627.2 802.1 3,034.3 864.5 – 5,722.5
Deposits from customers 158.4 322.2 270.4 1,822.4 2,755.5 – 5,328.9
Securitised liabilities – 290.1 1,571.5 6,823.9 2,008.1 – 10,693.6
Subordinated liabilities – 8.2 121.4 249.5 35.9 2.0 417.0
Other liabilities 136.2 – – – – – 136.2
Total liabilities 689.0 1,247.7 2,765.4 11,930.1 5,664.0 2.0 22,298.2
Financial guarantee contracts 1.2 20.0 2.5 63.3 120.7 19.4 227.1
Loan commitments 5.0 1.5 105.0 580.4 1,196.9 – 1,888.8

Notes 205
T HE C OMPA N Y F IN A NCI A L A ND EqUI T Y M A RK E T S GROUP M A N AGE MEN T RE P OR T C ONSOL IDAT E D F IN A NC I A L S TAT E M E N T S
DVB Bank SE | Group Annual Report 2012
financial position, which is determined in accordance with the provisions of IFRS, regulatory equity capital also includes sub-ordinated liabilities. In addition, certain components of equity as reported in the statement of financial position (revaluation reserve from the measurement of securities of the “available for sale” category, reserves from cash flow hedges and cumulative actuarial gains and losses) are not included in the calculation of regulatory capital.
The regulatory capital requirements pursuant to Basel II were fulfilled at all times in the year under review. In January 2012, DVB raised additional subordinated funds within the meaning of section 10 (5a) of the KWG in the amount of US$80 million until approval and inclusion of its undistributed profits for 2011, to ensure compliance with the further extended Basel I Floor rules pursuant to section 339 (5a) of the SolvV.
The analysis of the components of regulatory capital pursuant to section 10 (1 to 6a) of the German Banking Act (KWG) is pre-sented in the following table:
56 Subordinated assets
During the year under review, the Company did not hold subordi-nated assets to any considerable extent.
Other disclosures
55 Equity capital management
The target figure for DVB’s equity capital management is the capital as determined pursuant to the provisions of the German Banking Act (KWG). The objective of equity capital management is to exploit profitable growth potential in international transport finance by means of strengthening liable capital and to fulfil at all times the regulatory requirements with respect to the amount of equity.
DVB’s regulatory capital is determined pursuant to the provisions of the German Banking Act. In accordance with sections 10 and 10a of the KWG, the Group is obliged to ensure an appropriate amount of equity capital in order to fulfil its obligations to cus-tomers. In addition, financial institutions are required, on the basis of the solvency principle (Grundsatz I), to quantify their counterparty credit risks as well as their market risks and to ensure that these risk exposures are backed by equity capital.
The calculation of equity capital is based on the separate financial statements of the Group companies in accordance with local accounting principles. The Bank’s regulatory capital comprises liable capital, which consists of tier I and tier II capital, plus tier III capital. Compared to equity as reported in the statement of
Components of regulatory capital (€ mn)
2012 2011 %
Issued and fully paid ordinary shares 111.9 112.4 –0.4
Capital reserve plus other reserves eligible for inclusion 292.1 272.7 7.1
Special items for general banking risks pursuant to section 340g of the HGB 841.0 766.3 9.7
Other components of tier 1 capital 43.4 54.8 –20.8
Items deducted from tier 1 capital pursuant to section 10 (2a) sentence 2 of the KWG –4.4 –3.9 12.8
Items deducted from tier 1 capital pursuant to section 10 (6 and 6a) of the KWG –48.0 –23.5 –
Total tier 1 capital 1,236.0 1,178.8 4.9
Total tier 2 capital before deductions and eligible tier 3 capital 249.1 149.1 67.1
Items deducted from tier 2 capital –48.0 –23.5 –
Total tier 2 and eligible tier 3 capital 201.1 125.6 60.1
Net adjusted available capital plus eligible tier 3 capital1) 1,437.1 1,304.4 10.2
1) Taking into account transfer to reserves from consolidated net income

Notes206
DVB Bank SE | Group Annual Report 2012
57 Disclosures on the ship covered bonds pursuant to section 28 of the Pfandbrief Act (PfandBG)
Disclosures pursuant to section 28 (1) nos. 1, 3 and 4 of the PfandBG (€ mn)
31 Dec 2012 31 Dec 2011 Nominal
amountPresent
valueRisk-adjusted
present value1)
Nominal amount
Present value
Risk-adjusted present value1)
Liabilities to be covered 876.9 895.7 877.8 546.8 559.1 540.4
thereof: covered bonds in issue 876.9 895.7 877.8 546.8 559.1 540.4
thereof: derivatives
(section 26 (1) no. 5 of the PfandBG)– – – – – –
Cover assets 1,237.9 1,358.0 1,207.2 1,112.7 1,212.6 1,029.2
thereof: cover loans 1,217.9 1,336.7 1,185.7 1,097.7 1,196.8 1,013.0
thereof: additional cover assets
(section 26 (1) nos. 3 and 4 of the PfandBG)20.0 21.3 21.5 15.0 15.8 16.3
thereof: derivatives
(section 26 (1) no. 5 of the PfandBG)– – – – – –
Excess cover/cover shortfall 361.0 462.3 329.4 565.8 653.5 488.9
1) Risk-adjusted present values were determined using the so-called dynamic method.
Maturity structure of the covered bonds in issue (section 28 (1) no. 2 of the PfandBG)
Nominal values (€ mn) 31 Dec 2012 31 Dec 2011 %
Up to one year 250.0 – –
One to two years 294.0 250.0 17.6
Two to three years 200.0 296.8 –32.6
Three to four years 62.9 – –
Four to five years 20.0 – –
Five to ten years 50.0 – –
More than ten years – – –
Total 876.9 546.8 60.4
Fixed-interest periods of the cover assets (section 28 (1) no. 2 of the PfandBG)1)
Nominal values (€ mn) 31 Dec 2012 31 Dec 2011 %
Up to one year 16.3 41.0 –60.2
One to two years 87.2 13.3 –
Two to three years 149.2 120.7 23.6
Three to four years 299.4 302.4 –1.0
Four to five years 210.0 255.7 –17.9
Five to ten years 459.2 332.3 38.2
More than ten years 16.6 47.4 –65.0
Total 1,237.9 1,112.7 11.3
1) Floating-rate loans are allocated to the time bands based on their respective fixed-interest periods, pursuant to a recommendation by the Association of German Pfandbrief Banks (Ver-band deutscher Pfandbriefbanken e. V., vdp).

Notes 207
T HE C OMPA N Y F IN A NCI A L A ND EqUI T Y M A RK E T S GROUP M A N AGE MEN T RE P OR T C ONSOL IDAT E D F IN A NC I A L S TAT E M E N T S
DVB Bank SE | Group Annual Report 2012
No takeovers had been carried out by the Bank and no fore-closures were pending or had been carried out as at the relevant reporting dates.
There were no arrears on interest payable at either reporting date.
There were no inland waterway vessels or ships under construc-tion pledged at the reporting dates.
Foreclosures and takeovers by the Bank (section 28 (4) no. 2a and 2b of the PfandBG)
Number 31 Dec 2012 31 Dec 2011 %
Foreclosures – – –
Taken over by the Bank – – –
Arrears on the interest payable by borrowers (section 28 (4) no. 2c of the PfandBG)
€ mn 31 Dec 2012 31 Dec 2011 %
Due and unpaid interest – – –
Country in which the pledged sea-going vessels are registered (section 28 (4) no. 1b of the PfandBG)
Nominal values (€ mn) 31 Dec 2012 31 Dec 2011 %
Belgium – 8.0 –
Germany 37.2 81.0 –54.1
Gibraltar 16.5 – –
Greece 16.7 18.1 –7.7
United Kingdom 104.1 71.2 46.2
Hong Kong – 14.1 –
Italy 5.2 9.2 –43.5
Croatia 26.3 10.5 –
Liberia 177.1 211.0 –16.1
Malta 217.0 193.9 11.9
Marshall Islands 412.3 339.6 21.4
Norway 159.2 94.0 69.4
Cyprus 46.1 47.0 –1.9
Total 1,217.9 1,097.7 11.0
Size categories of the cover assets (section 28 (4) no. 1a of the PfandBG)
Nominal values (€ mn) 31 Dec 2012 31 Dec 2011 %
Up to €500 thousand – – –
More than €500 thousand
and up to €5 million 52.2 46.6 12.0
More than €5 million 1,185.7 1,066.1 11.2
Total 1,237.9 1,112.7 11.3

Notes208
DVB Bank SE | Group Annual Report 2012
Pursuant to section 313 (2) of the hGB as at 31 December 2012 (€)
Shareholding (%) Net income/loss for the year
Equity capital
DVB Bank SE, Frankfurt/Main 0.0 – –
I. Subsidiaries
DVB Bank America N.V.1), Willemstad, Curaçao 100 16,965,762 126,103,254
American Flirtation N.V., Willemstad, Curaçao 100 – –
DVB Container Finance America LLC, Majuro, Marshall Islands 100 –5,730 3,142,122
DVB Investment Management N.V., Willemstad, Curaçao 100 –2,642,298 –31,822
Shipping Capital Antilles N.V., Willemstad, Curaçao 100 590,180 19,229,659
AER Holding N.V., Willemstad, Curaçao 100 194 17,763
Netherlands Shipmortgage Corporation Ltd, Hamilton, Bermuda 100 0 0
TEU Management Company N.V., Willemstad, Curaçao 100 147 4,637
DVB Group Merchant Bank (Asia) Ltd1), Singapore 100 40,759,719 360,161,527
DVB Aviation Finance Asia Pte Ltd, Singapore 100 5,509,988 –10,879,295
DVB Container Finance Asia Pte Ltd, Singapore 100 93,848 6,445
Ibon Leasing Ltd, George Town, Cayman Islands 100 0 1
Lexi Ltd, George Town, Cayman Islands 100 191 701
Longspur Ltd, George Town, Cayman Islands 100 1 0
Tubbataha Aviation Ltd, George Town, Cayman Islands 100 – 2
DVB Holding GmbH2)3), Frankfurt/Main, Germany 100 0 13,000,000
DVB Objektgesellschaft Geschäftsführungs GmbH, Frankfurt/Main 100 – 4)
DVB Holding (US) Inc., New York, USA 100 66,917 2,139,590
DVB Capital Markets LLC, New York, USA 100 –1,045,904 513,377
DVB Service (US) LLC, New York, USA 100 –15,641 –544,481
DVB Transport (US) LLC, New York, USA 100 –427,610 3,673,001
DVB Invest (Suisse) AG, zurich, Switzerland 100 – 4)
DVB LogPay GmbH2)3), Eschborn, Germany 100 0 3,000,000
Euro Toll Fuel S.L., Barcelona, Spain 100 – 4)
Euro Toll Service GmbH, Eschborn, Germany 75 – 4)
DVB Transport Finance Ltd, London, United Kingdom 100 –1,984,697 6,057,655
Hollandse Scheepshypotheekbank N.V., Rotterdam, the Netherlands 100 0 710,961
ITF International Transport Finance Suisse AG, zurich, Switzerland 100 2,594,009 35,183,007
Nedship Shipping B.V., Rotterdam, the Netherlands 100 87,932 3,220,174
Nedship Scheepvaarthuis B.V., Rotterdam, the Netherlands 100 –52,697 –535,334
Shipping Capital B.V., Rotterdam, the Netherlands 100 120,596 6,857,145
Infifion XI B.V., Rotterdam, the Netherlands 100 – 26,135
Nedship Participation (Norway) B.V., Rotterdam, the Netherlands 100 198,213 2,241,067
58 List of shareholdings

Notes 209
T HE C OMPA N Y F IN A NCI A L A ND EqUI T Y M A RK E T S GROUP M A N AGE MEN T RE P OR T C ONSOL IDAT E D F IN A NC I A L S TAT E M E N T S
DVB Bank SE | Group Annual Report 2012
Pursuant to section 313 (2) of the hGB as at 31 December 2012 (€)
Share in risks/
opportunities (%)
Net income/loss
for the year
Equity
capital
In addition, the following companies were also included in the group of consolidated
companies of DVB Bank SE because DVB Bank SE may exercise control over such companies
within the meaning of SIC-12:
Adger Ocean II, Oslo, Norway 100 – 4)
Adger Ocean III, Oslo, Norway 100 – 4)
Adger Ocean KS (I), Oslo, Norway 100 – 4)
Aquila Aircraft Leasing Ltd, Dublin, Ireland 100 – 4)
Autobahn 2003 Holdings LLC, Wilmington, USA 100 – 4)
Braveheart Shipping Holdco LLC, Majuro, Marshall Islands 100 – 4)
Braveheart Shipping Opco LLC, Majuro, Marshall Islands 100 – 4)
Container Investment Fund I, Majuro, Marshall Islands 100 –295,669 –2,336,789
Capital Lease Ltd, Hong Kong, China 100 17,353 102,040,816
France Maritim LLC, Majuro, Marshall Islands 100 – 5)
Green Eagle Investments N.V., Willemstad, Curaçao >50 9,326,068 10,993,121
Intermodal Investment Fund VI LLC, Majuro, Marshall Islands 100 –137,999 2
Mediterra LLC, Majuro, Marshall Islands 84 – 5)
Terra Marris I LLC, Majuro, Marshall Islands 100 5,356,674 29,042,430
Container Investment Fund II, Majuro, Marshall Islands >50 – 3,335,294
TEU Asset Company N.V., Willemstad, Curaçao 100 – 5)
Dalian Deepwater Developer Ltd, St. Helier, Jersey 100 – 5)
Deucalion Capital I (UK) Ltd, London, United Kingdom 100 1,209,348 2,090,518
Deucalion Engine Leasing (France) Ltd, Paris, France 90 – 5)
Deucalion Engine Leasing (Ireland) Ltd, Dublin, Ireland 90 – 5)
Deucalion Capital II (UK) Ltd, London, United Kingdom 100 –2,716,899 443,940
Shark Aircraft Leasing (Ireland) Ltd, Dublin, Ireland 100 – 5)
Tigers Aircraft Leasing (UK) Ltd, London, United Kingdom 100 – 5)
Deucalion Capital II Ltd, George Town, Cayman Islands 100 1,346,455 –1,123,690
Bluebell Aircraft Leasing Ltd, Floriana, Malta 100 – 5)
Buzzard Aircraft Leasing Ltd, Dublin, Ireland 100 – 5)
Deucalion Capital II (Malta) Ltd, Valetta, Malta 60 – 5)
Falcon Aircraft Leasing Ltd, Dublin, Ireland 100 – 5)
Wasps Aircraft Leasing Ltd, George Town, Cayman Islands 100 – 5)
Deucalion Capital V Ltd, Majuro, Marshall Islands 100 –4,806,806 –1.063.525
Deucalion Capital VI Ltd, George Town, Cayman Islands 100 –875,628 1,702,682
Bonham Aircraft Leasing Ltd, George Town, Cayman Islands 100 – 5)
Eagle Aircraft Leasing Ltd, George Town, Cayman Islands 100 – 5)
Finch Aircraft Leasing Ltd, Dublin, Ireland 100 – 5)
Hawk Aircraft Leasing Ltd, Dublin, Ireland 100 – 5)
Hibiscus Aircraft Leasing Ltd, Floriana, Malta 100 – 5)
Puffin Aircraft Leasing Ltd, Dublin, Ireland 100 – 5)
Sinaloa Aircraft Leasing Ltd, Floriana, Malta 100 – 5)
Deucalion Capital VII Ltd, George Town, Cayman Islands 100 –11,190,414 4,293,163
Bulls Aircraft Leasing (Malta) Ltd, Floriana, Malta 100 – 5)
Chiefs Aircraft Holding (Malta) Ltd, Floriana, Malta 100 – 5)
Highlanders Aircraft Leasing (IRL) Ltd, Dublin, Ireland 100 – 5)
Nomac Aircraft Leasing (Ireland) Ltd, Dublin, Ireland 100 – 5)
Stormers Aircraft Leasing (Malta) Ltd, Floriana, Malta 100 – 5)
Wasps Aircraft Leasing (Ireland) Ltd, Dublin, Ireland 100 – 5)
Deucalion Capital VIII Ltd, George Town, Cayman Islands 100 7,992,910 16,051,688
Lantana Aircraft Leasing Ltd, Floriana, Malta 100 – 5)
Deucalion Capital XI Ltd, George Town, Cayman Islands 100 895,824 –18,049,236
Deucalion Ltd, George Town, Cayman Islands 100 4,973,577 8,650,222

Notes210
DVB Bank SE | Group Annual Report 2012
Pursuant to section 313 (2) of the hGB as at 31 December 2012 (€)
Share in risks/
opportunities (%)
Net income/loss
for the year
Equity
capital
Glencoe Shipping Holdco LLC, Majuro, Marshall Islands 100 – –
Glen Aros Opco LLC, Majuro, Marshall Islands 100 – 5)
Glen Campbell Opco LLC, Majuro, Marshall Islands 100 – 5)
Glen Etive Opco LLC, Majuro, Marshall Islands 100 – 5)
Glen Lyon Opco LLC, Majuro, Marshall Islands 100 – 5)
Glen Nevis Opco LLC, Majuro, Marshall Islands 100 – 5)
Glen Tress Opco LLC, Majuro, Marshall Islands 100 – 5)
Maple Leaf Shipping Holdco LLC, Majuro, Marshall Islands 100 – 4)
Adirondack Shipping LLC, Majuro, Marshall Islands 100 – 5)
Bathgate Trading Opco LLC, Majuro, Marshall Islands 100 – 5)
Maple Leaf Cement Holdco LLC, Majuro, Marshall Islands 100 – 5)
Maple Leaf Trading Opco LLC, Majuro, Marshall Islands 100 – 5)
Philip Trading Opco LLC, Majuro, Marshall Islands 100 – 5)
Rushmore Shipping LLC, Majuro, Marshall Islands 100 – 5)
Shamrock Trading Opco LLC, Majuro, Marshall Islands 100 – 5)
Stani Trading Opco LLC, Majuro, Marshall Islands 100 – 5)
TBS I Trading Opco LLC, Majuro, Marshall Islands 100 – 5)
MS “Mumbai Trader” GmbH & Co. KG, Bremen, Germany 100 – 4)
NFC Shipping Fund II LLC, Majuro, Marshall Islands 80 –25,667 128,0986)
Gandari Shipping Pte Ltd, Singapore 100 – 5)
NFC Shipping Fund V LLC, Majuro, Marshall Islands 75 14,682 –1,419,7916)
NFC Shipping Fund VI LLC, Majuro, Marshall Islands 100 –4,475,952 –27,915,7096)
Kerkis I LLC, Majuro, Marshall Islands 100 – 5)
Kerkis II LLC, Majuro, Marshall Islands 100 – 5)
Kerkis III LLC, Majuro, Marshall Islands 100 – 5)
Kerkis IV LLC, Majuro, Marshall Islands 100 – 5)
Mount Abu Offshore Pte Ltd, Singapore 100 – 5)
Mount Benom Ltd, Labuan, Malaysia 100 – 5)
Mount Bubu LLC, Majuro, Marshall Islands 100 – 5)
Mount Erskine Shipping Pte Ltd, Singapore 100 – 5)
Mount Mulu LLC, Majuro, Marshall Islands 100 – 5)
Mount Pleasant Shipping Pte Ltd, Singapore 100 – 5)
Taigetos I LLC, Majuro, Marshall Islands 100 – 5)
Taigetos II LLC, Majuro, Marshall Islands 100 – 5)
Teide LLC, Majuro, Marshall Islands 100 – 5)
Ullswater Offshore LLC, Majuro, Marshall Islands 100 – 5)
Wadi Woraya I LLC, Majuro, Marshall Islands 100 – 5)
Wadi Woraya III LLC, Majuro, Marshall Islands 100 – 5)
NFC Shipping Fund VII LLC, Majuro, Marshall Islands 100 –13,271,940 –14,547,873
Mount Kaba Shipping LLC, Majuro, Marshall Islands 100 – 5)
NFC Shipping Fund B LLC, Majuro, Marshall Islands 100 1,491,162 –8,109,5976)
Bukit Merah Shipping Pte Ltd, Singapore 100 – 5)
Mount Bintang LLC, Majuro, Marshall Islands 100 – 5)
Mount Kinabalu LLC, Majuro, Marshall Islands 100 – 5)
Mount Lawu LLC, Majuro, Marshall Islands 100 – 5)
Mount Rinjani Shipping Pte Ltd, Singapore 100 – 5)
Mount Santubong Ltd, Majuro, Marshall Islands 100 – 5)
NFC Labuan Shipleasing I Ltd, Labuan, Malaysia 100 – 5)
Riga Maritim LLC, Majuro, Marshall Islands 100 – 5)
Taigetos III LLC, Majuro, Marshall Islands 100 – 5)

Notes 211
T HE C OMPA N Y F IN A NCI A L A ND EqUI T Y M A RK E T S GROUP M A N AGE MEN T RE P OR T C ONSOL IDAT E D F IN A NC I A L S TAT E M E N T S
DVB Bank SE | Group Annual Report 2012
Pursuant to section 313 (2) of the hGB as at 31 December 2012 (€)
Share in risks/
opportunities (%)
Net income/loss
for the year
Equity
capital
NFC Shipping Fund C LLC, Majuro, Marshall Islands 100 –250,996 1,609,6516)
Mount Lyderhorn LLC, Majuro, Marshall Islands 75 – 5)
Taigetos Funding LLC, Majuro, Marshall Islands 100 – 5)
Wadi Funding LLC, Majuro, Marshall Islands 100 – 5)
Ocean Container II, Oslo, Norway 100 – 4)
SIIM Fund I (Shipping and Intermodal Investment Management Fund) LLC, Majuro, Marshall Islands 100 –11,613,277 –20,668,062
Al Rubban NFC Shipping Fund IV LLC, Majuro, Marshall Islands 100 – 5)
Blue Moon Shipping Ltd, St. John’s, Antigua/Barbuda 100 – 5)
Bukit Timah Chartering Pte Ltd, Singapore 100 – 5)
Bukit Timah Shipping LLC, Majuro, Marshall Islands 100 – 5)
Bukit Timah Shipping Pte Ltd, Singapore 100 – 5)
Calidris Shipping LLC, Majuro, Marshall Islands 100 – 5)
Green Mountain Shipping Ltd, Willemstad, Curaçao 100 – 5)
S1 Offshore Pte Ltd, Singapore 100 – 5)
Scheepvaarmaatschappij Ewout B.V., Rotterdam, the Netherlands 100 – 5)
Yellow Moon Shipping Ltd, St. John’s, Antigua/Barbuda 100 – 5)
Stephenson Capital Ltd, George Town, Cayman Islands 100 –922,210 673,367
DUNAVAGON s.r.o., Dunajska Streda, Slovakia 100 – 5)
DV01 Szarazfoldi Jarmukolcsonzo rt, Aporka, Hungary 100 – 5)
SRF I Ltd, Floriana, Malta 100 – 5)
SRF II Ltd, Floriana, Malta 100 – 5)
SRF III Ltd, Floriana, Malta 100 – 5)
Pursuant to section 313 (2) of the hGB as at 31 December 2012 (€)
Shareholding (%) Net income/loss for the year
Equity capital
II. Joint ventures accounted for using the equity method
AerCap Partners I Ltd, Shannon, Ireland 50 1,543,396 2,837,932
AerCap Partners II Ltd, Shannon, Ireland 50 –633,743 –1,282,170
Bella Aircraft Leasing 1 Ltd, Shannon, Ireland 50 – 4)
Capital Equipment Management Holding GmbH, Hamburg, Germany 50 – 4)
Cinclus Aviation Investments Ltd, Floriana, Malta 50 – 4)
D8 Product Tankers Ltd, Singapore 50 690,855 773,824
Deucalion MC Engine Leasing Ltd, Dublin, Ireland 50 680,113 10,622,150
First BD Feederships Shipping Ltd, St. John’s, Antigua/Barbuda 50 – 4)
Fourth BD Feederships Shipping Ltd, St. John’s, Antigua/Barbuda 50 – 4)
Herakleitos 3050 LLC, Majuro, Marshall Islands 50 – 4)
Intermodal Investment Fund II LLC, Majuro, Marshall Islands 50 275,022 6,389,730
Intermodal Investment Fund IV LLC, Majuro, Marshall Islands 50 89,597 3,380,682
Intermodal Investment Fund VII LLC, Majuro, Marshall Islands 50 – 4)
MD Aviation Capital Pte Ltd, Singapore 50 337,262 69,895,960
Modex Energy Rentals LLC, Majuro, Marshall Islands 50 – 4)
Second BD Feederships Shipping Ltd, St. John’s, Antigua/Barbuda 50 – 4)
TAG ASSET Management LLC, Majuro, Marshall Islands 50 5,905 5,725,002
Third BD Feederships Shipping Ltd, St. John’s, Antigua/Barbuda 50 – 4)
Second BD Feederships Shipping Ltd, St. John’s, Antigua/Barbuda 50 – 4)
TAG ASSET Management LLC, Majuro, Marshallinseln 50 5.905 5.725.002
Third BD Feederships Shipping Ltd, St. John’s, Antigua/Barbuda 50 – 4)

Notes212
DVB Bank SE | Group Annual Report 2012
Pursuant to section 313 (2) of the hGB as at 31 December 2012 (€)
Shareholding (%) Net income/loss for the year
Equity capital
III. Associates accounted for using the equity method
8F Leasing S.A., Contern, Luxembourg 20 – 4)
Aer Lucht Ltd, Dublin, Ireland 47 – 4)
A330 Parts Ltd, Newark, USA 20 – 4)
Bovey Offshore Ltd, Singapore 30 5,691,865 13,506,252
Epic Pantheon International Gas Shipping Ltd, Tortola, British Virgin Islands 21 – 4)
Global Offshore Services B.V., Amsterdam, the Netherlands 31 – 4)
Intermodal Investment Fund V LLC, Majuro, Marshall Islands 22 – 4)
MON A300 Leasing Ltd, George Town, Cayman Islands 20 – 4)
Mount Faber KS, Oslo, Norway 49 322,328 4,121,681
MSN 223 Leasing Ltd, George Town, Cayman Islands 35 – 4)
SRF Railcar Leasing Ltd, Nenagh, Ireland 49 – 4)
Rapid Aircraft Leasing Ltd, George Town, Cayman Islands 25 10,090,527 10,449,731
TES Holdings Ltd, Bridgend, Wales, United Kingdom 40 107,746 22,711,601
Ullswater Subsea DIS, Oslo, Norway 40 846,177 12,034,757
West Supply III K/S, Haugesund, Norway 20 –303,728 3,725,534
IV. Associates not accounted for using the equity method
Aviateur Capital Ltd, Dublin, Ireland 20 – 4)
DVL Deutsche Verkehrs-Leasing GmbH, Eschborn, Germany 39 – 4)
West Supply III A/S, Haugesund, Norway 22 – 4)
1) Net income was distributed to DVB Bank SE in the same period.2) There is a profit and loss transfer agreement with DVB Bank SE.3) The company applied the exemption provisions of section 264 (3) of the HGB.4) Not disclosed due to lack of materiality (IAS 8.8)5) Net income/loss is included in the higher-level subgroup.6) The figures correspond to the amounts reported in the previous year.

Notes 213
T HE C OMPA N Y F IN A NCI A L A ND EqUI T Y M A RK E T S GROUP M A N AGE MEN T RE P OR T C ONSOL IDAT E D F IN A NC I A L S TAT E M E N T S
DVB Bank SE | Group Annual Report 2012
For this purpose, Dalian Deepwater Developer also entered into an advisory agreement with an international technical project manager in July 2010. The advisor’s duty is to monitor the con-struction of “Dalian Deepwater”. In addition, marketing activities for the ship are being intensified for the period after ship delivery. At the time of preparing its financial statements, DVB did not anticipate any losses from this transaction, nor were there any indications that Dalian Deepwater Developer will be unable to fulfil its contractual obligations.
60 Average number of employees
The average number of employees changed during the year under review as follows:
The average number of employees includes employees on parental leave and temporary staff, but does not include trainees and employees in the passive phase of partial retirement.
Due to its deconsolidation, employees of TES Holdings Ltd, Bridgend, Wales, United Kingdom and its affiliated enterprises are no longer included in the average staff numbers. The previous year’s figures (a total of 651 employees) were adjusted accord-ingly, to facilitate comparison.
59 Financial guarantee contracts, contingent liabilities and other commitments
Financial guarantee contracts are disclosed at their nominal value. Other commitments include future minimum lease payments from non-cancellable operating leases.
In July 2010, DVB provided a US$175 million pre-delivery loan for the construction of “Dalian Deepwater”, a sixth-generation drillship, to Dalian Deepwater Developer Ltd, St Helier, Jersey, Channel Islands, a newly-established special purpose vehicle. In December 2012, an additional amount of US$25 million was provided. The said company has been included in DVB’s 2012 consolidated financial statements in accordance with SIC-12.
In July 2010, Dalian Deepwater Developer entered into a purchase agreement with a group of shipyards for delivery of a turnkey drillship. The group is building this sixth-generation drillship in its shipyard in Dalian, China. The vessel is scheduled for delivery in the second quarter of 2013 or early in the third quarter of 2013. In accordance with contractual provisions, Dalian Deepwater Developer made a pre-delivery payment in July 2010, which is collateralised by a repayment guarantee issued by the Bank of China for the event that the drillship cannot be delivered. The remainder of the contractual sum (for which DVB did not provide any loan) is due upon delivery. There is no right of recourse to DVB for this amount.
Employees 2012 2011 %
Women 214 207 3.4
Men 346 331 4.5
Total 560 538 4.1
€ mn 2012 2011 %
Financial guarantee contracts
from guarantees 237.5 227.1 4.6
Contingent liabilities from
irrevocable loan commitments 1,313.1 1,888.8 –30.5
Other commitments 19.9 21.6 –7.9
thereof: within one year 5.0 5.0 0.0
thereof: within one to five years 11.9 14.0 –15.0
thereof:
after more than five years 3.0 2.6 15.4
Total 1,570.5 2,137.5 –26.5

Notes214
DVB Bank SE | Group Annual Report 2012
61 Related party disclosures
61.1 Remuneration and shareholdings of Board members
The remuneration paid to Board members during 2012 was as follows:
With regard to the variable remuneration components:
In the business year 2012, the Board of Managing Directors received payments of variable remuneration in the amount of €635,199.00. This figure included bonus payments for the business years 2010/2011 and an award from the DVB Long-Term Incentive Plan 2009.
The bonus payments paid to members of the Board of Managing Directors are determined on the basis of agreements on opera-tional targets. These objectives, which are agreed upon between the Supervisory Board and the respective member of the Board of Managing Directors, are related to objective criteria for the relevant business year (referring to financial indicators such as Economic Value Added and consolidated net income before taxes) as well as to the personal performance of each individual member of the Board of Managing Directors. The amount of the bonus depends on the (measurable) extent to which the targets were achieved. As a prerequisite for the payout, no notice of termination has been given with regard to the contract with the respective member of the Board of Manageing Directors as at the time of payment. The sole exception is where a member of the Board of Managing Directors retires from office for reasons of age, or due to non-renewal of a contract.
The cash bonus for the business year 2012 will be awarded in four tranches: accordingly, 50% will be paid out in 2013 and 16.66% in each of the three following business years (2014 to 2016). The payment of these three future tranches requires that the allowance for credit losses does not exceed a certain threshold in the year prior to disbursement. In addition, for all award tranches, 50% of each tranche is subject to an additional one-
year holding period, i.e. it is not paid out directly. During this holding period, the value of the retained tranche is replaced by a share-based payment instrument linked to the share price development of the Bank. In this context, the amount of the retained tranche is initially converted into notional DVB shares (so-called phantom shares). The tranche to be paid out is calcu-lated at the end of the following year by multiplying the number of the allocated notional shares by the closing price of the DVB share quoted at the Frankfurt Stock Exchange on the last trading day of the relevant calendar year, plus the dividend paid during the year. Accordingly, the calculation of the award value does not result in the issue of “real” shares, but only notional owner-ship interests for calculation purposes.
61.2 Share-based payments
In the year under review, an amount of €0.6 million was provi-sioned in the current staff expenses in relation to share-based payments.
In the reporting period, 18,171.19 phantom shares were granted at a payout amount which is based on the price of the DVB share. The grant-date fair value amounted to €0.4 million, with refer-ence to the share price on 31 December 2011 (€23.95). The fair value as at the current balance sheet date amounted to €0.4 million, with reference to the share price on 31 December 2012 (€24.26). The phantom shares granted are to be fully paid out in 2013.
61.3 Pension liabilities to former members of the Board of Managing Directors
The defined benefit obligation (DBO) for pension liabilities to former members of the Board of Managing Directors and their surviving dependants amounts to €4.0 million (2011: €3.5 million).
€ 000’s 2012 2011 %
Board of Managing Directors 2,155.8 2,853.5 –24.5
Supervisory Board 273.7 273.7 0.0
Former members of the Board
of Managing Directors and
their surviving dependants 373.9 370.5 0.9
Total 2,803.4 3,497.7 –19.9
A detailed overview of the remuneration for members of the Board of Managing Directors and the Supervisory Board is included in the remuneration report, which is part of our group management report (pages 125 – 128) and our Corporate Governance Report 2012 published on our website (www.dvbbank.com > Investor Relations > Corporate Governance > Reports).

Notes 215
T HE C OMPA N Y F IN A NCI A L A ND EqUI T Y M A RK E T S GROUP M A N AGE MEN T RE P OR T C ONSOL IDAT E D F IN A NC I A L S TAT E M E N T S
DVB Bank SE | Group Annual Report 2012
The following table shows the transactions carried out by DVB Bank SE with its subsidiaries, joint ventures and associates.
61.4 Related party disclosures
DVB Bank SE, as the parent company, prepares a report on relationships with affiliated companies (dependent company report) in accordance with section 312 of the AktG, which is audited pursuant to section 313 of the AktG. The dependent company report includes a discussion on the relationships of DVB Bank SE with Dz BANK and its affiliated companies. Related party transactions are carried out on an arm’s length basis. Therefore, the auditors issued an unqualified audit opinion on the dependent company report.
DVB Bank SE carries out a number of banking transactions with Dz BANK, including short-term borrowings, deposits, as well as foreign currency transactions. The business relationship between DVB Bank SE and Dz BANK AG, including other affiliated com-panies of the Dz BANK Group, is particularly close with regard to the refinancing business. The range of transactions also includes transactions with derivatives such as interest rate options, interest rate swaps or foreign exchange forwards.
The following table shows the transactions carried out with Dz BANK AG and other affiliated companies in the Dz BANK Group.
€ mn 2012 2011 %
Loans and advances to banks 0.9 15.9 –94.3
Loans and advances
to customers 1.0 1.0 0.0
Trading assets 0.1 4.0 –97.5
Positive fair values
of derivative hedging
instruments 133.2 69.6 91.4
Total assets 135.2 90.5 49.4
Deposits from other banks 2,778.3 3,441.1 –19.3
Deposits from customers – 29.5 –
Securitised liabilities 9,647.0 9,436.1 2.2
Trading liabilities 9.2 19.2 –52.1
Negative fair values
of derivative hedging
instruments 11.2 12.1 –7.4
Subordinated liabilities 321.0 295.2 8.7
Total liabilities 12,766.7 13,233.2 –3.5
€ mn 2012 2011 %
Loans and advances
to banks 5,730.4 5,193.3 10.3
Subsidiaries 5,730.4 5,193.3 10.3
Loans and advances
to customers 850.4 787.7 8.0
Subsidiaries 840.0 715.9 17.3
Joint ventures 7.6 50.4 –84.9
Associates 2.8 21.4 –86.9
Trading assets 32.3 30.4 6.3
Subsidiaries 29.3 22.7 29.1
Joint ventures 3.0 3.2 –6.3
Associates – 4.5 –
Positive fair values
of derivative hedging
instruments – 0.4 –
Subsidiaries – 0.4 –
Total assets 6,613.1 6,011.8 10.0
€ mn 2012 2011 %
Deposits from other banks 151.2 152.9 –1.1
Subsidiaries 151.2 152.9 –1.1
Deposits from customers 81.5 45.5 79.1
Subsidiaries 81.5 44.6 82.7
Joint ventures – 0.9 –
Trading liabilities 3.1 0.0 –
Subsidiaries 3.1 0.0 –
Total liabilities 235.8 198.4 18.9

Notes216
DVB Bank SE | Group Annual Report 2012
Responsibility statement
To the best of our knowledge, and in accordance with the appli-cable reporting principles, the consolidated financial statements give a true and fair view of the assets, liabilities, financial position and profit or loss of the Group, and the management report of the DVB Group includes a fair review of the develop-ment and performance of the business and the position of the DVB Group, together with a description of the principal opportu-nities and risks associated with the expected development of the DVB Group.
Frankfurt/Main, 6 March 2013DVB Bank SE
The Board of Managing Directors
Wolfgang F. DrieseCEO & Chairman of the Board of Managing Directors
Bertrand GrabowskiMember of the Board of Managing Directors
Dagfinn Lunde Member of the Board of Managing Directors
62 Declaration of Compliance pursuant to section 161 of the German Public Limited Companies Act (AktG) and publication pursuant to section 10 of the German Securities Prospectus Act (WpPG)
Section 161 of the AktG requires the boards of managing directors and supervisory boards of listed companies to issue a declaration of compliance with the German Corporate Governance Code on an annual basis. They declare, by means of such a declaration, that the recommendations of the Code have been and are being complied with, and also comment upon exceptions.
DVB Bank SE’s Board of Managing Directors and Supervisory Board published their Declaration of Compliance in accordance with section 161 of the AktG on 7 December 2012 in the elec-tronic German Federal Gazette and simultaneously made the text permanently available to the public on the Bank’s website.
On 8 March 2012, DVB Bank SE also published its annual docu-ment in accordance with section 10 of the German Securities Prospectus Act (WpPG) on its website. This annual document summarises any information that is relevant to shareholders and that was published or made available to the public by DVB pursuant to the provisions of section 10 of the WpPG in the period between 1 January and 31 December 2011.
All declarations of compliance of DVB are available for download at the following website: www.dvbbank.com
> Investor Relations > Corporate Governance > Declarations of Compliance.
63 Financial statements of DVB Bank SE
DVB Bank SE is a parent company and, at the same time, a sub-sidiary of Dz BANK AG Deutsche zentral-Genossenschaftsbank, Frankfurt/Main, Germany.
Dz BANK AG Deutsche zentral-Genossenschaftsbank, Frankfurt/Main, Germany, prepared consolidated financial statements and a group management report as at 31 December 2012, which were submitted to the Local Court of Frankfurt/Main and which include DVB Bank SE.

217
T HE C OMPA N Y F IN A NCI A L A ND EqUI T Y M A RK E T S GROUP M A N AGE MEN T RE P OR T C ONSOL IDAT E D F IN A NC I A L S TAT E M E N T S
DVB Bank SE | Group Annual Report 2012
Audit opinion
We issued the following opinion on the consolidated financial statements and the group management report:
“We have audited the consolidated financial statements prepared by DVB Bank SE, Frankfurt/Main, comprising the income state-ment, the statement of comprehensive income and expense, the statement of financial position, the statement of changes in equity, the cash flow statement and the notes to the consolidated financial statements, together with the group management report for the business year from 1 January 2012 to 31 December 2012. The preparation of the consolidated financial statements and the group management report in accordance with IFRS as adopted by the EU, and the additional requirements of German commercial law pursuant to section 315a (1) HGB are the responsibility of the Company’s management. Our responsibility is to express an opinion on the consolidated financial statements and the group management report based on our audit.
We conducted our audit of the consolidated financial statements in accordance with section 317 HGB and German generally accepted standards for the audit of financial statements promul-gated by the Institut der Wirtschaftsprüfer (Institute of Public Auditors in Germany). Those standards require that we plan and perform the audit such that misstatements materially affecting the presentation of the net assets, financial position and results of operations in the consolidated financial statements in accord-ance with the applicable financial reporting framework and in the group management report are detected with reasonable assurance. Knowledge of the business activities and the economic and legal environment of the Group and expectations as to pos-sible misstatements are taken into account in the determination of audit procedures. The effectiveness of the accounting-related internal control system and the evidence supporting the disclosures in the consolidated financial statements and the group management report are examined primarily on a test basis within the framework of the audit. The audit includes assessing the annual financial statements of those entities included in consolidation, the determination of entities to be included in consolidation, the accounting and consolidation principles used and significant estimates made by management, as well as evaluating the overall presentation of the consolidated financial statements and the group management report. We believe that our audit provides a reasonable basis for our opinion.
Our audit has not led to any reservations.
In our opinion, based on the findings of our audit, the consoli-dated financial statements comply with IFRS as adopted by the EU and the additional requirements of German commercial law pursuant to section 315a (1) HGB and give a true and fair view of the net assets, financial position and results of operations of the Group in accordance with these requirements. The group management report is consistent with the consolidated financial statements and as a whole provides a suitable view of the Group’s position and suitably presents the opportunities and risks of future development.”
Eschborn, Frankfurt/Main, 6 March 2013Ernst & Young GmbHWirtschaftsprüfungsgesellschaft
signedLöskenWirtschaftsprüfer(German Public Auditor)
signedStapelWirtschaftsprüfer(German Public Auditor)

DVB Bank SE | Group Annual Report 2012
DVB worldwide
Shipping Finance
Aviation Finance
Land Transport Finance
Singapore
Tokyo
Piräus
Curaçao
EUROPEAMERICA ASIA / PACIFIC
New York
Frankfurt /Main
Zurich
HamburgRotterdamLondon
Athens
BergenOslo
Further information
218 DVB worldwide
220 Key words
222 Glossary
226 Abbreviations
228 Imprint

219
DVB Bank SE | Group Annual Report 2012
Further information
head office Frankfurt/MainDVB Bank SEPlatz der Republik 6 60325 Frankfurt/Main, GermanyPhone +49 69 9750 40, Fax +49 69 9750 4444 Europe AthensDVB Bank SERepresentative Office Greece3, Moraitini Street & 1, Palea Leof. Posidonos, Bldg. K4Delta Paleo Faliro, 175 61 Athens, GreecePhone +30 210 4557 400, Fax +30 210 4557 420
BergenDVB Bank SENordic Branch, Strandgaten 18, 5013 Bergen, NorwayPhone +47 5 5309 400, Fax +47 5 5309 450
HamburgDVB Bank SEShipping Department, Ballindamm 6, 20095 Hamburg, GermanyPhone +49 40 3080 040, Fax +49 40 3080 0412
LondonDVB Bank SE London Branch, Park House, 6th Floor16–18 Finsbury Circus, London, EC2M 7EB, UKPhone +44 20 7256 4300, Fax +44 20 7256 4450
OsloDVB Bank SENordic Branch, Haakon VII’s gate 1, 0161 Oslo, NorwayPhone +47 2 3012 200, Fax +47 2 3012 250
Rotterdam DVB Bank SERotterdam Branch, Parklaan 2, 3016 BB RotterdamThe NetherlandsPhone +31 10 2067 900, Fax +31 10 4362 574
ZurichITF International Transport Finance Suisse AGWasserwerkstrasse 12, 8006 zurich, SwitzerlandPhone +41 44 3656 100, Fax +41 44 3656 200
The Americas
CuraçaoDVB Bank America N.V.zeelandia Office Park, Kaya W.F.G. Mensing 14Willemstad, CuraçaoPhone +599 9 4318 700, Fax +599 9 4652 366
New York DVB Transport (US) LLC Representative Office of DVB Bank SE609 Fifth Avenue, New York, NY 10017-1021, USAPhone +1 212 588 8864, Fax +1 212 588 8936
DVB Capital Markets LLC 609 Fifth Avenue, New York, NY 10017-1021, USAPhone +1 212 858 2624, Fax +1 212 588 0424 Asia
SingaporeDVB Group Merchant Bank (Asia) Ltd77 Robinson Road # 30-02, Singapore 068896Phone +65 6511 3433, Fax +65 6511 0700
Tokyo DVB Transport Finance LtdTokyo Branch, The Imperial Hotel Tower, 14th Floor (A-2)1-1, Uchisaiwaicho 1-chome, Chiyoda-kuTokyo 100-0011, JapanPhone +81 3 3593 7700, Fax +81 3 3593 7860 www.dvbbank.com E-mail: [email protected]

220
DVB Bank SE | Group Annual Report 2012
Further information
E Earnings per share 37, 161Employees 26–33, 117, 129–130Equity 163, 164, 197–198, 205Expenses Fee and commission expenses 116, 161, 183 General administrative expenses 117, 161, 166, 183 Interest expenses 113, 161, 182 Non-staff expenses 117, 166, 183 Staff expenses 117, 166, 183 FFee and commission expenses 116, 161, 183Fee and commission income 116, 161, 183Funding 35, 120–121, 151–152, 157 GGeneral administrative expenses 117, 161, 166, 183General Meeting 18, 21, 38, 39, 126, 131 IIncome Fee and commission income 116, 161, 183 Interest income 113, 161, 182Interest expenses 113, 161, 182 income 113, 161, 182 margin 113, 124, 157Investment Management 41, 101–107, 114–116, 122–124, 146–147, 166ITF International Transport Finance 42, 108–109, 114–116, Suisse AG (ITF Suisse) 122–124, 146–147
Key words
AAllowance for credit losses 114–116, 146–148, 157, 161, 163, 166, 182, 190, 203Aviation Finance 4–5, 41, 42, 60–77, 114–116, 122–124, 141, 143–147, 166Aviation Investment Management 41, 66, 101, 105–107 (AIM) B Board of Managing Directors 8–11, 12–15, 18–19, 126–128, 197Business (new) 51, 69, 85, 124, 157 CCapital Share capital 158, 163, 197 Tier 1 119, 205 Tier 2 119, 205Capital ratios Tier 1 ratio 119 Total capital ratio 119Consolidated net income 117–118, 121, 160, 161, 166 (before IAS 39 and taxes, before and after taxes)Corporate Governance 16, 18–25Cost/income ratio (CIR) 121, 124, 166Customer lending volume 122–124 DDeclaration of Compliance 39, 216Distributable profit 118, 161, 163, 197Distribution of responsibilities 11Dividend 37, 118, 131, 160

221
DVB Bank SE | Group Annual Report 2012
Further information
LLand Transport Finance 6–7, 41, 42, 78–93, 114–116, 122–124, 141, 143–147, 166Lending volume 122, 137–142 NNet fee and commission income 113, 116, 161, 166, 183Net interest income 113, 161, 166, 182 (before and after allowance for credit losses)Net other operating income/expenses 116, 161, 166, 184 OOffshore Finance 131Opportunities 153–154Own funds in accordance with 119, 205 the German Banking Act (KWG) PPortfolio development 122–124Products Advisory Services 41, 50, 67, 74–75, 84 Asset Management 41, 49, 67–68 Asset & Market Research 42, 51, 68, 85 Loan Participations 42, 108–109 Private Equity Sourcing and Investments 41, 101–107 Public Debt and Equity 42, 50 Risk Distribution 42, 96–100 Structured Asset Financing 41, 50, 51–56, 67, 69–74, 84, 86–90ProfitAppropriation of profits 118, 160, 161Distributable profit 118, 161, 163, 197
RRating 35, 112Remuneration 14–15, 21, 32–33, 125–128, 214Result from financial instruments 118, 161, 166, 184–185 in accordance with IAS 39 from investments in companies 116, 161, 166, 183 accounted for using the equity methodRetained earnings 118, 161, 163, 164, 197, 198Return on equity (ROE) 121, 124, 166Risk management 24, 56, 74, 90, 132–134Risks 132, 136–152, 154 SSegment reporting 166, 187–188Share 36–37, 112Share capital 158, 163, 197Shipping & Intermodal Investment 41, 101, 102–104 Management (SIIM)Shipping Finance 2–3, 41, 42, 44–59, 114–116, 122–124, 140, 143–147, 166Supervisory Board 12–17, 19–20, 126, 128Sustainability 26–33, 43SWOT analysis 154

222
DVB Bank SE | Group Annual Report 2012
Baltic Exchange Dry Index (BDI) This price index tracks the costs for the maritime shipping of commodities. The index is used as a leading indicator for global economic developments: a rising BDI index indicates a growing level of global trade activity, whereas a falling BDI index reflects shrinking worldwide commerce. Basel II In 2004, the Basel Committee on Banking Supervision issued the Basel II Framework containing international standards for risk-adjusted capital adequacy of banks and financial services providers. Basel II replaced the capital adequacy rules of its predecessor, Basel I. Book building Type of syndication where the arranger does not assume the liquidity and placement risks associated with placing the syndi-cated loan Business risk Threat of losses from earnings fluctuations which may occur with-out any change in business strategy, and which are due to changed external circumstances (such as the general economic business climate, the product environment, client behaviour, and the com-petitive environment) Business volume Financial indicator measuring a company’s business performance. The business volume of a bank comprises its total assets plus contingent liabilities from irrevocable loan commitments. Cash flow Cash and cash equivalents paid and received during a given accounting period Club deal A transaction underwritten by a group of banks (usually a minimum of three and a maximum of 20–30 institutions) without the intention to subsequently reduce their exposure by way of syndication Corporate Governance Code The German Corporate Governance Code (the “Code”) provides rules designed to safeguard the efficiency and transparency of corporate governance and control, and to ensure that they are geared towards the long-term growth of enterprise value. The Government commission “German Corporate Governance Code” reviews the Code once a year, against the background of ongoing national and international developments, and amends the wording if necessary.
Glossary
Advanced (Internal Ratings Based) Approach Method to determine a borrower’s counterparty credit risk. Instead of relying on external ratings (as prescribed by the standardised approach), the Advanced Approach permits a bank to determine the risk on the basis of its in-house rating system – provided that this system fulfils the requirements defined by banking regulators for internal rating systems (also refer to “Internal Rating Model”). Advisory Services Product description denoting a range of advisory services DVB provides to Shipping Finance, Aviation Finance and Land Transport Finance clients, covering consultancy related to corporate acquisi-tions and divestments, strategic decision-making on finance and capital structure, loan restructuring, and the funding of acquisi-tions Agent A person (either a natural person or a legal entity) acting on behalf of a third party (the principal). In the context of a syndicated loan, the agent acts on behalf of all lenders in the syndicate. The agent is responsible for loan administration and assumes the function of central payment agent. Anchor handling Tug and Supply Vessel (AhTS) Vessel used for offshore operations and primarily aimed at supporting offshore platforms during towage to destination and anchoring operations Arranger Bank or financial institution that is responsible for originating and syndicating a transaction. Arrangers always have a leading role in the syndicate and often also assume the agent function. Asset Specifically, a transport asset to be financed Asset & Market Research Product description for generating in-depth analyses of transport assets and markets – DVB’s Asset & Market Research provides the fundamental basis for the activities of the Bank’s business divisions.
Further information

223
DVB Bank SE | Group Annual Report 2012
Cost/income ratio Financial indicator used for the purposes of a company’s cost efficiency management; the cost/income ratio expresses the ratio of operating expenses to operating income. Counterparty credit risk Potential losses arising from an unexpected default, or a deterio-ration in our counterparties’ credit quality. Comprising lending, issuer, counterparty default and country risks, it represents DVB’s most significant individual risk exposure – this reflects the Bank’s business profile. Country risk Country risk is defined as the risk of loan losses or other monetary losses in a particular country, as a result of social/political and/or macro-economic developments or events. This comprises risk traditionally associated with the concept of country risk (conversion and transfer risk, payment freeze or moratorium), plus political and economic policy risks. DVB determines country risks on the basis of primary obligor groups. Customer lending volume (nominal) The aggregate of loans and advances to customers, guarantees and indemnities, irrevocable loan commitments, and derivatives. This figure is determined by way of consolidation in line with regulatory rules. DZ BANK Dz BANK Group is part of the German Cooperative Financial Services Network which comprises approximately 1,100 individual cooperative banks. Within the Network, Dz BANK acts as the central institution, and as a commercial bank in its own right. Export credit agency (ECA) Organised in a similar way to insurance companies, export credit agencies provide cover for specific export transactions – usually on a statutory basis – and extend loans. Final take The portion of a transaction allocated to a specific bank, which it retains on its own books. In the event of oversubscription, the final take may be lower than that bank’s commitment.
Freighter/cargo aircraft Purpose-built or converted passenger planes for the transport of air cargo. Examples include the long-haul Boeing 777-200LRF and the short-haul Boeing 737-300SF. Incumbent The largest, dominating railway company in a specific market or geographic area Internal Rating Model (IRM) Statistical model used to estimate the probability of default asso-ciated with a given client, the expected loss given default for the unsecured portion of a loan, and the anticipated extent of the claim at the time of default – the exposure at default International Financial Reporting Standards (IFRS)/ International Accounting Standards (IAS) International accounting standards published by the International Accounting Standards Board (IASB). The purpose of IFRS is to provide investors with relevant information about an enterprise – on the net assets, financial position, and results of operations – to make investment decisions. Moreover, IFRS enhance transparency and improve the comparability of financial statements on an international level. Lead Arranger Also referred to as “Mandated Lead Arranger and Bookrunner” – a bank with the mandate for originating, syndicating and execut-ing a transaction. The mandate may also include underwriting the transaction. Lending Policies DVB’s lending standards Liquidity risk The threat that current and future payment obligations may not be met within the specified time, or to the specified extent Loan Participations Denotes the business activities of DVB’s subsidiary ITF International Transport Finance Suisse AG, which is actively participating in international senior asset-based lending Loan-to-value ratio (LTV) Ratio of the loan amount to the market value of the financed asset, expressed as a percentage. The lower the LTV ratio, the lower the potential risk exposure for the lender in the event of the borrower’s default (in which case the lender would need to realise collateral).
Further information
224
DVB Bank SE | Group Annual Report 2012
Passenger-km Measure for the transport performance an operator provides to passengers Passenger train-km The number of kilometres travelled by passenger trains Platform Supply Vessel (PSV) Vessel used for offshore operations and dedicated to the transport of goods and personnel to offshore platforms Political risk insurance Insurance cover to protect against political risks Private Equity Sourcing and Investments Product description for funds initiated and managed by DVB’s Investment Management division providing the Bank’s clients with equity products to finance their investment projects Regional aircraft Smaller aircraft with between 50 and 110 seats, used on shorter routes with less demand or for off-peak services. Examples include the Bombardier CRJ200 or the Embraer E170. Return on equity (ROE) Calculated as the ratio of consolidated net income before taxes to weighted capital, return on equity expresses the return achieved by the owners (shareholders) on their capital invested during a given accounting period Risk Distribution Partial syndication of large-sized loans on the international inter-bank market, for the purposes of transferring risks and raising liquidity Sale-and-lease-back transaction Special form of leasing, where an asset (for example, a transport asset) is sold and immediately leased back for continued use
MaRisk Abbreviation of Minimum Requirements for Risk Management in Banks – a set of rules and regulations issued by the German Federal Financial Supervisory Authority (BaFin) to define the requirements for the risk management systems of German financial institutions Market price risk The potential loss that the Bank might incur on its positions through price fluctuations in the equity, foreign exchange and interest rate markets (including associated derivatives) Medium-term notes (MTN) Listed medium-term debt securities Narrowbody/single-aisle aircraft Short- to medium-haul aircraft with between 130 and 200 seats, used on routes such as Frankfurt–Amsterdam. It is the most popular category in terms of fleet size. Typical examples are the Airbus A320 and the Boeing 737. OASIS Object Finance Administration and Security Information System: DVB’s proprietary database application for analysing and managing credit portfolios Offshore Usually refers to crude oil production using maritime drilling platforms. At the beginning of 2013, DVB established a separate Offshore Finance division. Operating lease A lease where the lessor retains all the material risks and rewards incidental to ownership of the leased assets Operational risk (OpRisk) In accordance with the German Solvency Regulation, DVB defines operational risk as the risk of losses resulting from inadequate or failed internal processes or systems, from human error, or from external events.
Further information

225
DVB Bank SE | Group Annual Report 2012
Further information
Semi-submersible vessel An offshore platform equipped with a drilling rig which is partly submerged in order to gain in stability Ship covered bond Debt security under German law which is backed by long-term lending exposures collateralised by ship mortgages Shortline A small or mid-sized railroad company that operates over a relatively short distance relative to larger, national railroad networks Stress test Banks use stress tests to analyse potential losses which may arise in a crisis environment, in order to take adequate counter-measures in good time. Structured Asset Financing Product description, comprising traditional asset finance, as well as tailor-made structured and tax-optimised solutions for complex financing projects in the Shipping Finance, Aviation Finance and Land Transport Finance divisions Tonne-km The transport of one tonne of goods over a distance of one kilometre.
Transport Finance Generic term for DVB’s Shipping Finance, Aviation Finance and Land Transport Finance divisions Underwriter A lender giving a firm commitment – prior to drawdown – to under-write a portion of the aggregate loan facility, with the intention to place a part of the underwritten portion with one or several third-party banks, by way of syndication Value at risk Measure indicating the maximum potential loss which may arise within a given time period, with a given probability (the confidence interval or confidence level) Value maintenance clause (VMC) A standard clause included in loan agreements, which comes into effect if the value of collateral falls below a certain share of the outstanding loan amount, thus exceeding the maximum permitted loan-to-value ratio. In these cases, the Bank can request the bor-rower to make an early repayment of a part of the loan principal, or to furnish additional collateral. Widebody/twin-aisle aircraft Larger aircraft with between 250 and 450 seats, often used on longer flights such as Frankfurt–Hong Kong. Typical examples are the Airbus A330, the Boeing 747, the new Boeing 787 and Airbus A380.

226
DVB Bank SE | Group Annual Report 2012
Further information
Abbreviations
AAM Aviation Asset Management AFC Aviation Financial Consultancy AfS financial instruments Financial instruments available for sale AIM Aviation Investment Management AktG Aktiengesetz (German Public Limited Companies Act) bp Basis points DCF Discounted Cash Flow dwt Dead weight tonnes ECA Export Credit Agency ECB European Central Bank E&P (Capex) Exploration and production (capital expenditure) Fed US Federal Reserve
EEDI Energy Efficient Design Index ESM European Stability Mechanism FPSO Floating Production Storage and Offloading FPU Floating Production Unit FSO Floating Production Solutions FTK Freight tonne kilometre hGB Handelsgesetzbuch (German Commercial Code) IATA International Air Transport Association JOL Japanese Operating Lease KWG Kreditwesengesetz (German Banking Act) LNG Liquefied Natural Gas LPG Liquefied Petroleum Gas M&A Mergers & Acquisitions

227
DVB Bank SE | Group Annual Report 2012
SIC Standing Interpretations Committee SIIM Shipping & Intermodal Investment Management SMRT Strategic Management and Restructuring Team VaR Value at risk VAT Value added tax VMC Value Maintenance Clause WpPG Wertpapierprospektgesetz (German Securities Prospectus Act)
OMT Outright Monetary Transactions pp Percentage points PDP Pre-delivery payments RAM Restructuring Asset Management RPK Revenue passenger kilometre RTK Revenue Tonne Kilometres SE Societas Europaea (European public limited-liability company)
Further information

228
DVB Bank SE | Group Annual Report 2012
Further information
PhotosBoard of Managing Directors of DVB Bank SE (page 8 – 9) andSupervisory Board of DVB Bank SE (page 13) and René Spalek, Offenbach, Germany
Key events (inner cover page): DVB Bank SE
Employees and sustainability (page 26 – 27, from left to right)Mingli zhu, Petro zyuber, Brigitte Ploeg, Tomasz Pietraszkiewicz,Susan Groenfelt, Ottavio Garofalo; all are employees of DVB Bank SE, Rotterdam, The NetherlandsPhotos by Linda Slingerland, DVB Bank SE, Rotterdam, The Netherlands
Shipping FinanceFront cover, page 2 and pages 44 – 45:Linda Slingerland, DVB Bank SE, Rotterdam, The NetherlandsShipping Finance Deal of the Year 2012 (page 55):Vega Offshore Management AS, Oslo, Norway
Aviation FinanceFront cover, page 4 and 60 – 61: Bert van Leeuwen, DVB Bank SE, Rotterdam, The Netherlands Aviation Finance Deal of the Year 2012 (page 73): LOT Polish Airlines, Warsaw, Poland
Land Transport FinanceFront cover, page 6 and 78 – 79: Wouter Radstake, DVB Bank SE, Frankfurt/Main, Germany Land Transport Finance Deal of the Year 2012 (page 89):Trac Intermodal, Princeton, New Jersey, USA
DVB Bank SEPlatz der Republik 660325 Frankfurt/Main, Germany
Investor RelationsElisabeth WinterSenior Vice PresidentPhone +49 69 9750 4329
Sabine SchliebenVice PresidentPhone +49 69 9750 4449
Design concept and realisationGolinHarris B&L GmbH, Frankfurt/Main, Germany
The Annual Report 2012 is published in English and German.It is available as PDF file on our webpage www.dvbbank.comand as HTML report on www.dvbbank-annualreport.com.
After scanning this qR code with your smartphone,you will have direct access to our website.
Imprint


DVB Bank SE | Group Annual Report 2012