annual report 2012 · 1. decision-making: highest ethical standards and sense of legal...
TRANSCRIPT

Annual Report 2012April 1, 2011 — March 31, 2012
JGC
CO
RP
OR
ATIO
N A
nnual Rep
ort 2012
Program Management Contractor & Investment Partner

ProfileJGC Corporation was founded in 1928, and has since completed over 20,000 projects in approximately 70 countries, making it one of the world’s top engineering contractors.The Company has developed proprietary engineering technology and displayed unsurpassed project management capabilities in the fields of petroleum refining and gas processing, LNG, petrochemicals and other hydrocarbons, as well as those involving non-ferrous metals, nuclear power, pharmaceuticals, hospitals, laboratories and numerous other sectors.In order to respond to the diverse needs of its clients, JGC has moved beyond its role as an engineering contractor to expand its investment business into domains such as power generation and desalination, water, the environment, renewable energy and resource development. At the same time, JGC provides planning and management services in the urban development domain.JGC recently launched its medium-term management plan, “New Horizon 2015,” under which it has charted a course to become a “Program Management Contractor & Investment Partner.”

01 JGC Corporationannual report 2012
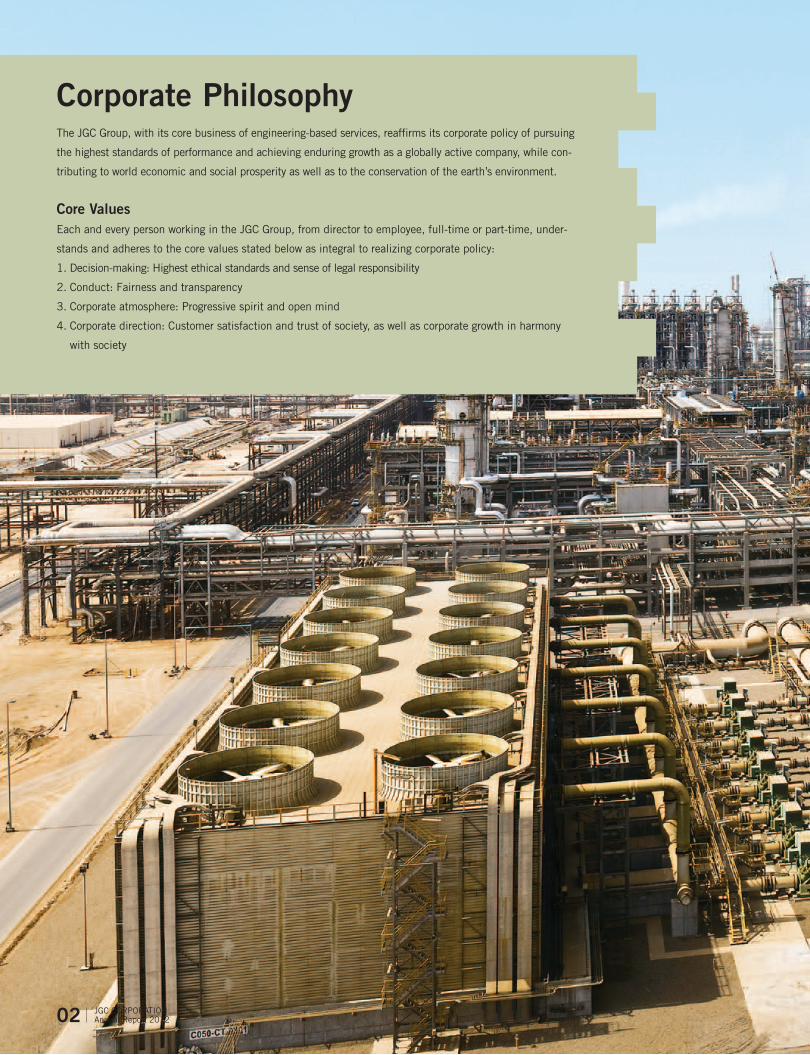
Corporate Philosophythe JGC Group, with its core business of engineering-based services, reaffirms its corporate policy of pursuing
the highest standards of performance and achieving enduring growth as a globally active company, while con-
tributing to world economic and social prosperity as well as to the conservation of the earth’s environment.
Core ValuesEach and every person working in the JGC Group, from director to employee, full-time or part-time, under-
stands and adheres to the core values stated below as integral to realizing corporate policy:
1. Decision-making: Highest ethical standards and sense of legal responsibility
2. Conduct: Fairness and transparency
3. Corporate atmosphere: progressive spirit and open mind
4. Corporate direction: Customer satisfaction and trust of society, as well as corporate growth in harmony
with society
02 JGC Corporationannual report 2012

Management PoliciesSharing these core values, the JGC Group seeks to continuously provide services and products based on the
highest standards of technology and in compliance with the following management policies:
1. Secure profit and realize continuous growth
2. Strengthen power of JGC Group technologies and establish innovative technologies, as well as develop
lines of business with vertical and horizontal diversification
3. accumulate and utilize capital and resources with provision for the future
4. Maintain fair personnel policy and develop capabilities as well as vitality of individuals
Responsibilitiesas a globally active entity with engineering-based services as its core business, JGC Group makes the maxi-
mum effort to enhance its corporate values and, in doing so, realize its corporate policy, with the fullest level
of recognition given to social responsibilities:
1. Conservation of the earth’s environment and engagement in corporate activities beneficial to society
2. accountability and integrity
3. Fair trade and fostering mutually beneficial relationships
4. Shareholders’ confidence
03 JGC Corporationannual report 2012

Principles of Business ConductFor the long-term stability of the JGC Group and for its further growth, each person working, from director to employee,
full-time or part-time, is required to keep in mind clear principles of business conduct and perform his or her daily
activities in compliance with such principles. through continued stable operations, JGC Group achieves its Corporate
philosophy by maintaining and honoring the following principles derived from the previously stated “Core Values”:
1. Decision-making: Highest ethical standards and sense of legal responsibility(1) Behave in accordance with the highest ethical standards, and in a socially acceptable manner.
(2) Understand the requirements, and observe the laws, regulations and rules of the business conducted.
2. Conduct: Fairness and transparency(1) Be fair, honest and transparent at all times in conducting business.
(2) Maintain integrity in all the relationships that constitute the business being conducted.
3. Corporate atmosphere: Progressive spirit and open mind(1) Maintain a progressive spirit not restricted merely to established business practices, and behave at all times with a sense of
innovation and improvement not limited to traditional practices.
(2) Based on a will to achieve objectives, devote oneself to the maximum extent possible as an individual and to the team.
(3) through free and aggressive exchanges, strive to enhance the intelligence of the organization.
4. Corporate direction: Customer satisfaction and trust of society, as well as corporate growth in harmony with society
(1) Gain the trust of clients and shareholders by performing faithfully and by providing an adequate level of information.
(2) Direct efforts at providing reliable services and products that satisfy the client’s needs.
(3) Seek corporate growth together with the development of society, in the knowledge that without prosperity of society the JGC
Group will not grow.
04 JGC Corporationannual report 2012
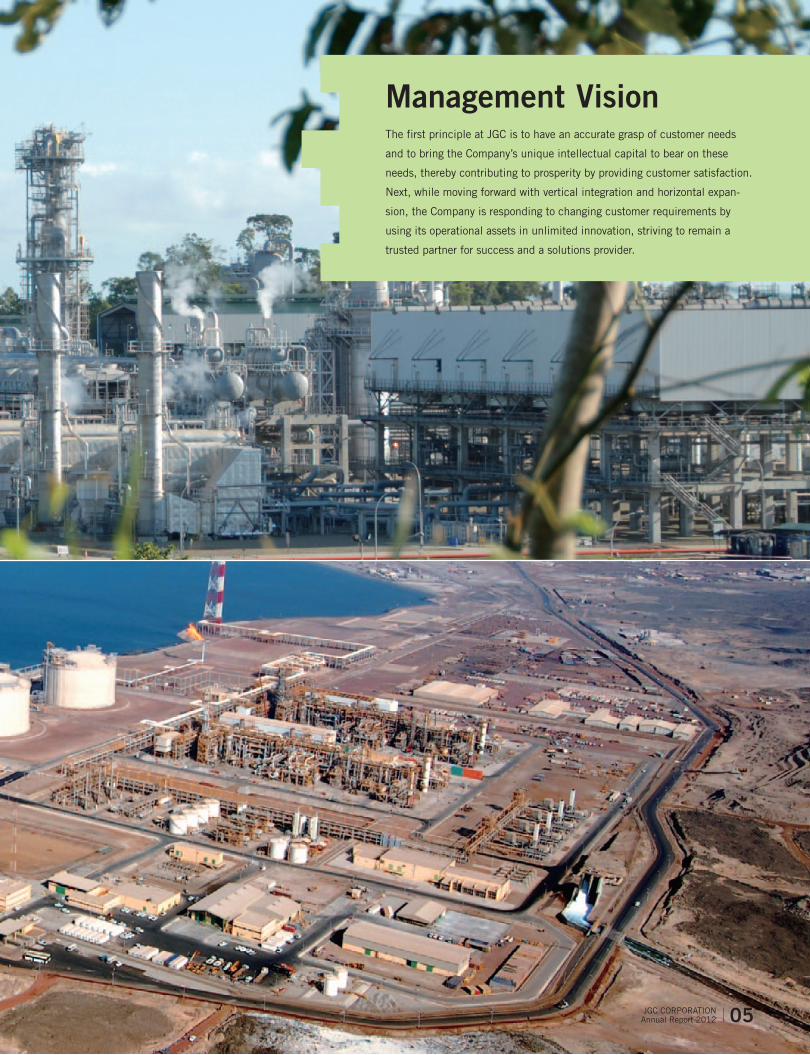
Management Visionthe first principle at JGC is to have an accurate grasp of customer needs
and to bring the Company’s unique intellectual capital to bear on these
needs, thereby contributing to prosperity by providing customer satisfaction.
next, while moving forward with vertical integration and horizontal expan-
sion, the Company is responding to changing customer requirements by
using its operational assets in unlimited innovation, striving to remain a
trusted partner for success and a solutions provider.
05 JGC Corporationannual report 2012

07 Financial Highlights08 To Our Shareholders11 Special Feature
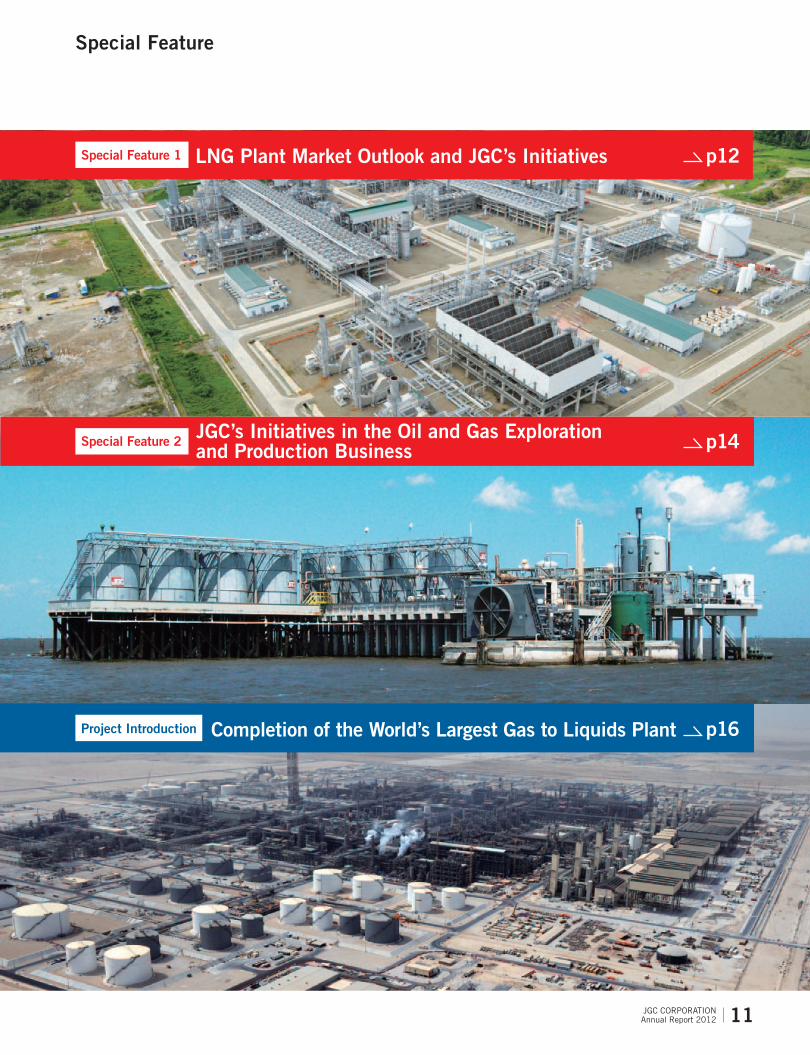
12 Special Feature 1LNG Plant Market Outlook and JGC’s Initiatives
14 Special Feature 2JGC’s Initiatives in the Oil and Gas Exploration and Production Business
16 Project IntroductionCompletion of the World’s Largest Gas to Liquids Plant
18 Review of Operations24 Performance Highlights by Business Sector25 Performance Highlights by Region26 Major Projects27 Major Contracts Awarded28 Environmental Activities and Contribution to Society31 Corporate Governance34 JGC’s Top Management Board of Directors, Auditors and Executive Officers35 Financial Section79 JGC Group80 Outline of JGC
Contents
Caution Regarding Forward-Looking StatementsThis annual report contains information about forward-looking statements related to such matters as the plans, strategies, and business results of JGC and the JGC Group. These forward-looking statements represent judgments made by the Company based on information available at present and are inherently subject to a variety of risks (see page 41) and uncertainties. The Company’s actual activities and business results could differ significantly due to factors including, but not limited to, changes in the economic environment, business environment, demand, and exchange rates.
JGC Corporationannual report 201206

02008 2009 2010 20122011
150
300
450
600
556.9551.0
460.1450.9
349.9
414.2
317.5
447.2
359.5
451.7
0
10
20
30
50
40 39.1
30.0
21.3
31.530.2
27.1
21.2
25.4
22.8
34.3
2008 2009 2010 20122011
600
300
0
900
793.2
402.3
348.7
506.1
440.5
733.5
675.5
618.2
569.1
342.9
2008 2009 2010 201220110
500
1,500
1,000
632.8607.3
671.3641.7
982.5953.5
1,163.2
1,441.6
1,114.1
1,005.4
2008 2009 2010 20122011
Financial HighlightsFor the years ended March 31. Yen amounts are in millions except per share data.
Net Sales(Billions of yen)
Net Income(Billions of yen)
New Contracts(Billions of yen)
Outstanding Contracts(Billions of yen)
Millions of yen Thousands of
U.S. dollars
Consolidated 2012 2011 2010 2012
Net Sales ¥ 556,967 ¥ 447,223 ¥414,258 $ 6,776,579
Operating Income 67,054 63,559 41,919 815,841
Income Before Taxes on Income and Minority Interests
in Earnings of Consolidated Subsidiaries 71,479 52,771 37,850 869,680
Net Income 39,111 25,478 27,112 475,861
Net Income per Share (in yen and U.S. dollars) 154.90 100.83 107.25 1.88
New Contracts 793,278 618,203 733,549 9,651,758
Outstanding Contracts 1,441,612 1,163,256 982,594 17,539,992
Millions of yen Thousands of
U.S. dollars
Non-Consolidated 2012 2011 2010 2012
Net Sales ¥ 451,724 ¥ 359,561 ¥317,597 $ 5,496,094
Operating Income 54,218 51,918 32,145 659,667
Income Before Taxes on Income 60,708 45,205 27,934 738,630
Net Income 34,304 22,853 21,271 417,374
Net Income per Share (in yen and U.S. dollars) 135.86 90.44 84.15 1.65
New Contracts 342,983 569,128 675,505 4,173,050
Outstanding Contracts 1,005,441 1,114,182 953,511 12,233,131
Notes: 1. U.S. dollar amounts represent translations of Japanese yen, for convenience only, at the rate of ¥82.19=$1.00, the prevailing rate of exchange at March 31, 2012. 2. Net income per share is computed based upon the average number of shares of common stock outstanding during the period.
■ Consolidated■ Non-consolidated
■ Consolidated■ Non-consolidated
■ Consolidated■ Non-consolidated
■ Consolidated■ Non-consolidated
07 JGC Corporationannual report 2012

Program Management Contractor & Investment Partner
To Our Shareholders
(left)Keisuke TakeuchiChairman and Representative Director
(right)Koichi KawanaPresident and Representative Director
08 JGC Corporationannual report 2012

Record Earnings at All Levels in Fiscal 2011In fiscal 2011 (the fiscal year ended March 31, 2012), JGC achieved consolidated net sales of ¥556.9 billion. We
achieved this with the support of our shareholders and clients, coupled with the earnest efforts of all those working for
the JGC Group. In terms of earnings, we recorded a gross profit of ¥86.7 billion, operating income of ¥67.0 billion, and
net income of ¥39.1 billion. All earnings figures were records for JGC. We paid a full-year dividend of ¥38.5 per share,
as planned. Consolidated contracts received reached ¥793.2 billion as we received orders for large-scale LNG projects
as well as other projects, despite the highly competitive market.
Our forecasts for fiscal 2012 are for consolidated net sales of ¥600.0 billion, gross profit of ¥88.0 billion, operating
income of ¥67.5 billion, and net income of ¥44.0 billion. Furthermore, we plan to pay a dividend of ¥43.5 per share
applicable to the fiscal year. We have set a target for consolidated orders of ¥600.0 billion, and will do our best to
achieve this target.
Fiscal 2011 was a year filled with uncertainty, as the European sovereign debt crisis triggered by the situation in
Greece weighed heavily on the global economy. It was also a period that saw the WTI price of crude oil rise from
US $80 to US $100 per barrel through the year, driven higher by population growth in emerging markets, increasing
demand for energy, and a growing trend toward urbanization. Against this backdrop, many capital investment plans
were implemented in connection with oil and natural gas development, as well as for oil refineries and petrochemical
facilities, notably in the Middle East, North Africa and Oceania.
JGC prevailed in fiscal 2011 in the face of fierce EPC business competition. In addition to winning contracts for
projects in Japan, we were also successful in gaining orders overseas for a crude oil processing facility in Algeria, an oil
refinery expansion project in Venezuela, a project to renovate cooling water facilities at a power plant in Iraq, and Front
End Engineering and Design (FEED) work for an LNG plant expansion project in Malaysia. In addition, we were
awarded a contract for the Ichthys LNG project, a mega-project being promoted by INPEX Corporation and Total.
These achievements helped our contracts received reach ¥793.2 billion on a consolidated basis, which significantly
exceeded our ¥550.0 billion target.
Meanwhile, in our investment business, we made considerable progress in fiscal 2011 in the resource development
field in particular. We decided to invest in shale oil production and development businesses in the U.S., and a shale
gas development and production business in Canada. Production also commenced at a gas field in the U.S. in which
we own a working interest. Furthermore, we made the decision to invest in a Japan-China fund to promote energy
saving and environmental conservation. The fund will invest in Chinese venture firms operating in these sectors.
In another major move, since the beginning of fiscal 2012 full-scale trial operations have begun at a demonstration
plant for the production of slurry-form fuel made from unused low-rank coal deposits in Indonesia. This coal fuel can
be used as a substitute for heavy fuel oil.
As we look back, fiscal 2011, the first year of our new medium-term management plan “New Horizon 2015,” saw
us deliver the results we expected.
Client Investment Plans in Fiscal 2012 in a Wide Range of Fields, Upstream to Downstream, Mainly in the Middle East and North AfricaFor the engineering and construction market in fiscal 2012, we expect to see commitment of capital investments on a
level above that of fiscal 2011, with further EPC opportunities emerging for us. These capital investments will mainly
center on the Middle East and North Africa. Oil majors, national oil companies, and other companies will be investing
in a wide range of areas, from upstream to downstream.
In the Middle East and North Africa, we will see the continued development of oil and natural gas. At the same
time, capital investments are planned in the oil refinery and petrochemical fields with the aim of adding value to these
09 JGC Corporationannual report 2012

resources. In East Africa, LNG project plans are taking shape. In Asia and Oceania, we expect to see plans implemented
for the construction or expansion of LNG projects in response to growing LNG demand within Asia. In Japan, we antici-
pate continued capital investment in expanding and upgrading power supply facilities, and in the pharmaceutical industry.
Focus on Strengthening Cost Competitiveness, Developing New Markets, and Enhancing Technological CapabilitiesGiven this market situation for the EPC business, in fiscal 2012 we will focus again on strengthening our cost competitive-
ness across the EPC spectrum. In tandem, we will work to maintain our solid position in the highly competitive LNG field.
Furthermore, in the Middle East and Africa, we will concentrate our efforts on developing new markets. We also
plan to strengthen our technological capabilities, as an important element in order to be competitive in the EPC busi-
ness. With an increasing number of projects expected to adopt a modular construction approach, we will endeavor to
further enhance our project execution capabilities, and at the same time bolster our technological capabilities in new
areas of endeavor including floating LNG plants.
Plants have become larger in recent years and clients today expect contractors to possess advanced capabilities
not only with respect to technologies, but also the associated elements including health, safety and the environment
(HSE). We are keenly aware that these demands on contractors will only grow and become more exacting in terms of
quality and scope. Our firm intention is to respond positively to these demands by improving related technologies and
developing new capabilities.
In the investment business in fiscal 2012, we plan to continue with our strict selection of prime investment projects.
We will focus on infrastructure-related businesses such as power and water; resource development businesses, includ-
ing conventional and unconventional resources; solar power generation; and our new energy business for the effective
utilization of low-rank coal. We will also target the urban development business, with a focus on Asia.
It is without doubt that the energy market is witnessing dynamic changes, due to shale gas developments in North
America and other factors. These changes are spawning new markets that present us with major opportunities for
growth as an engineering contractor. It can be expected that we will target changing fields, as we make the maximum
possible efforts to achieve our consolidated targets for contracts awarded and our operating result forecasts, over the
coming year.
We ask our shareholders for their continued support and guidance as we continue to implement “New Horizon
2015” to drive further growth.
July 2012
Keisuke TakeuchiChairman and Representative Director
Koichi KawanaPresident and Representative Director
10 JGC Corporationannual report 2012
Special Feature
p14
p16
p12Special Feature 1 LNG Plant Market Outlook and JGC’s Initiatives
Special Feature 2 JGC’s Initiatives in the Oil and Gas Exploration and Production Business
Project Introduction Completion of the World’s Largest Gas to Liquids Plant
JGC Corporationannual report 2012 11
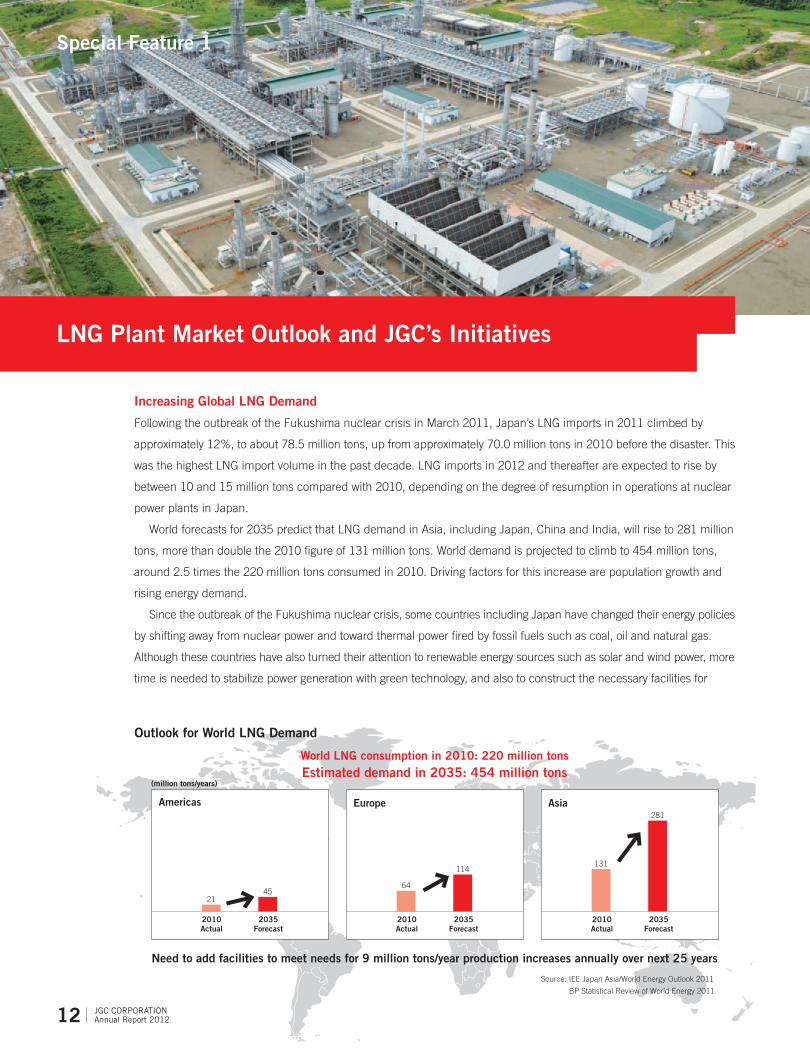
Outlook for World LNG Demand
World LNG consumption in 2010: 220 million tonsEstimated demand in 2035: 454 million tons
Need to add facilities to meet needs for 9 million tons/year production increases annually over next 25 years
Source: IEE Japan Asia/World Energy Outlook 2011
BP Statistical Review of World Energy 2011
Americas Europe Asia
2010Actual
2035Forecast
2010Actual
2035Forecast
2010Actual
2035Forecast
131
281
64
114
2145
Increasing Global LNG Demand
Following the outbreak of the Fukushima nuclear crisis in March 2011, Japan’s LNG imports in 2011 climbed by
approximately 12%, to about 78.5 million tons, up from approximately 70.0 million tons in 2010 before the disaster. This
was the highest LNG import volume in the past decade. LNG imports in 2012 and thereafter are expected to rise by
between 10 and 15 million tons compared with 2010, depending on the degree of resumption in operations at nuclear
power plants in Japan.
World forecasts for 2035 predict that LNG demand in Asia, including Japan, China and India, will rise to 281 million
tons, more than double the 2010 figure of 131 million tons. World demand is projected to climb to 454 million tons,
around 2.5 times the 220 million tons consumed in 2010. Driving factors for this increase are population growth and
rising energy demand.
Since the outbreak of the Fukushima nuclear crisis, some countries including Japan have changed their energy policies
by shifting away from nuclear power and toward thermal power fired by fossil fuels such as coal, oil and natural gas.
Although these countries have also turned their attention to renewable energy sources such as solar and wind power, more
time is needed to stabilize power generation with green technology, and also to construct the necessary facilities for
Special Feature 1
LNG Plant Market Outlook and JGC’s Initiatives
(million tons/years)
12 JGC Corporationannual report 2012

generating green power. Given these circumstances, demand is expected to grow for LNG, which is seen as a bridge energy
source toward a low-carbon society, due to its relatively low carbon dioxide emissions when compared with coal and oil.
LNG Projects Increase Worldwide in Step With Higher Demand
Many LNG plant construction or expansion projects are planned at present in Southeast Asia, East Africa, Australia,
Russia, and elsewhere based on this projected LNG demand growth. These projects are being developed by oil majors,
state-run oil and gas companies, and Japan’s general trading companies. In 2012, multiple planned LNG projects will
advance to the Front End Engineering and Design (FEED) stage, and in 2013 we expect international tenders to be
conducted for engineering, procurement and construction (EPC) for these projects.
Another dynamic that is shaping the market is the rapid
development of shale gas in recent years in the U.S. due
to advances in drilling and other technology; up until a few
years ago the U.S. was expected to import large volumes
of LNG. Many plans are taking shape to produce LNG from
the abundant and low-cost shale gas reserves for export to
Japan and other Asian countries. With shale gas
development also taking place in Canada, LNG projects
are being evaluated with the aim of selling LNG to Asia.
The Top Contractor for LNG Plants
JGC has constructed approximately 30% of the world’s currently operating LNG plants. At present, we are executing three
LNG plant construction projects in Indonesia, Australia and Papua New Guinea, respectively, and in January 2012, we
received an EPC contract for an LNG plants for the Ichthys LNG Project in Australia being promoted by INPEX
Corporation. Therefore, JGC is now involved in four LNG plant projects. When these four projects are completed, they will
produce approximately 32 million tons of LNG per year, contributing significantly to the stability of energy supplies in
Japan and elsewhere in the world. In March 2012, JGC was also awarded a contract from Malaysia’s state-owned oil
company for the FEED services and Engineering, Procurement, Construction and Commissioning (EPCC) early work for
the PETRONAS LNG Train 9 Project.
Furthermore, planned LNG projects in the U.S. and Canada present JGC with an opportunity to make inroads in the
plant EPC business field in a region where it has had little opportunity to do so until now. JGC is therefore actively
promoting business in this region. JGC also plans to target
floating LNG projects for the development of offshore gas
fields, as well as establish the concept of modular LNG
plants for small to medium-sized gas fields.
As a top global engineering contractor for LNG
plants, JGC will continue to respond to market and client
needs, and contribute to the development of clean
sources of energy like LNG, thereby helping in the
preservation of the global environment.Artist’s impression of the LNG plant for the Ichthys LNG Project in Australia
JGC constructed this LNG plant at the Tangguh LNG project in Indonesia
13 JGC Corporationannual report 2012

Special Feature 2
Chalking Up Results in the E&P Business
Under “Scenario 2010,” the five-year medium-term plan begun in fiscal 2006, JGC declared our intention to enter the
enterprise investment business. Since then JGC has steadily made a number of investments. Now, under “New Horizon
2015,” JGC’s current five-year medium-term management plan launched in April 2011, JGC aims to expand the
enterprise investment business further. JGC sees the Oil and Gas Exploration and Production Business (E&P business)
as a key field in this context, and we have already chalked up several achievements in this sector.
JGC Energy Development (USA) Inc. (JEDI)
[Canada Shale Gas Project] Farm-in: August 2012 Area: 1,200 km2 (gross) in Horn
River, Cordova and Liard area
Interest: Nexen (operator) 60% INPEX Gas British
Columbia* 40%* INPEX & JGC joint venture
[Cuervito and Fronterizo Gas Fields] Multi-service contract with Pemex Project started in 2004 JGC holds 10% share of project com-pany through joint venture with INPEX
[Eagle Ford Shale Oil Field] Farm-in: August 2011 Area: 300 km2 (gross) in oil window Interest: Chesapeake (Operator) 50%
Stonegate 40%JGC 10%
[Little Lake Oil & Gas Field] JGC holds 60–100% working Interest. Since 2007, JEDI has been operate of production from its deep-horizon development on this previously unde-veloped gas field.
[Vermilion natural gas exploration business, U.S.]
Exploration well drilled from March 2011 to August 2011
Discovered 248 ft gas column in July 2011
Started production in September 2012 JGC share: 8.5%
Drilling Pad in Horn River Area
Completion Rig in Eagle Ford
Cuervito Gas Field Gas Production Facilities
La Posada Well #1 Production Test
Little Lake Field Production Facilities
JGC’s Initiatives in the Oil and Gas Exploration and Production Business
14 JGC Corporationannual report 2012
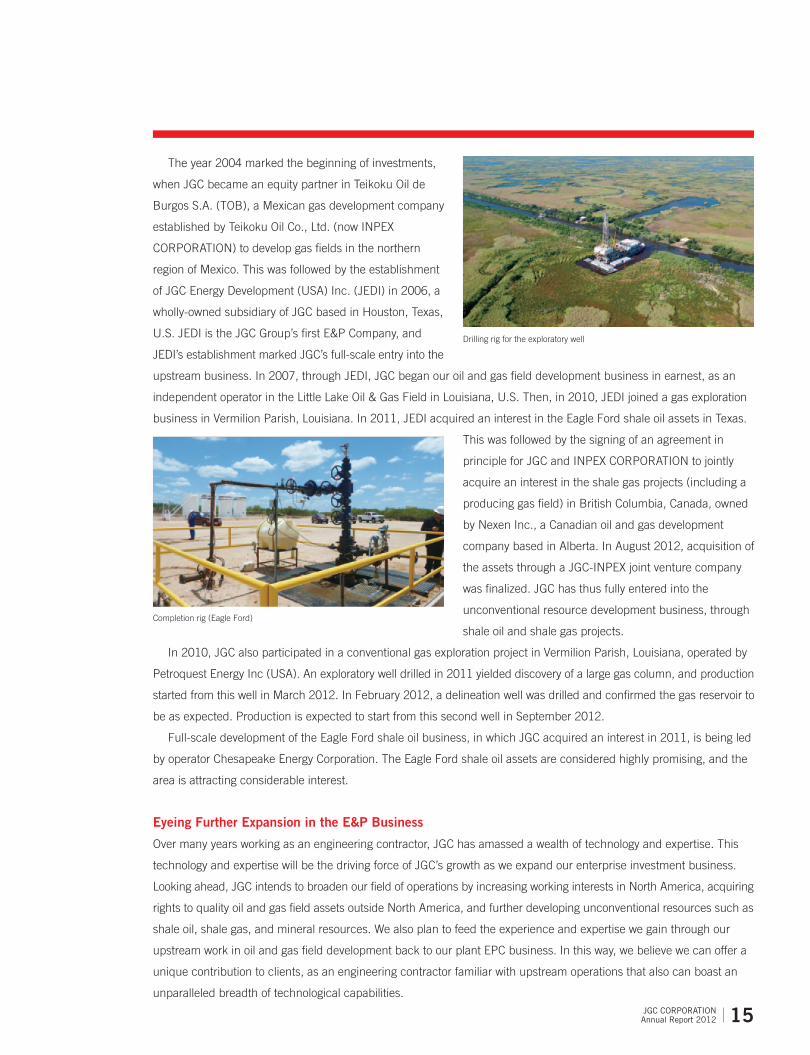
The year 2004 marked the beginning of investments,
when JGC became an equity partner in Teikoku Oil de
Burgos S.A. (TOB), a Mexican gas development company
established by Teikoku Oil Co., Ltd. (now INPEX
CORPORATION) to develop gas fields in the northern
region of Mexico. This was followed by the establishment
of JGC Energy Development (USA) Inc. (JEDI) in 2006, a
wholly-owned subsidiary of JGC based in Houston, Texas,
U.S. JEDI is the JGC Group’s first E&P Company, and
JEDI’s establishment marked JGC’s full-scale entry into the
upstream business. In 2007, through JEDI, JGC began our oil and gas field development business in earnest, as an
independent operator in the Little Lake Oil & Gas Field in Louisiana, U.S. Then, in 2010, JEDI joined a gas exploration
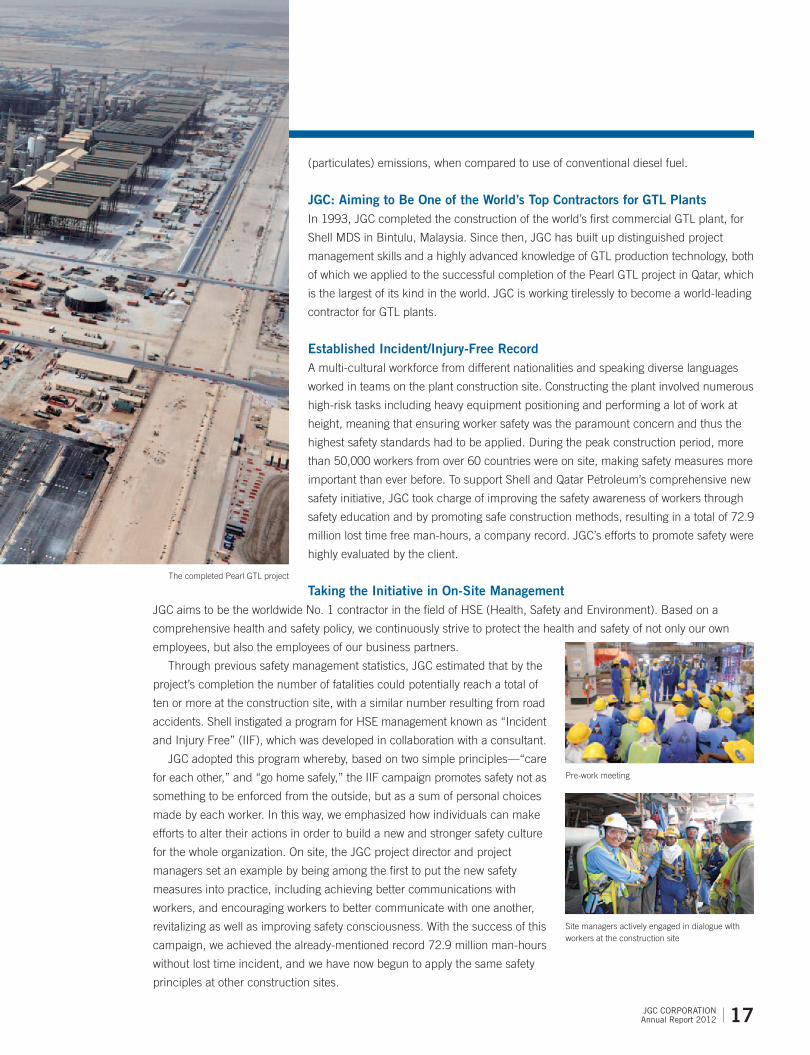
business in Vermilion Parish, Louisiana. In 2011, JEDI acquired an interest in the Eagle Ford shale oil assets in Texas.
This was followed by the signing of an agreement in
principle for JGC and INPEX CORPORATION to jointly
acquire an interest in the shale gas projects (including a
producing gas field) in British Columbia, Canada, owned
by Nexen Inc., a Canadian oil and gas development
company based in Alberta. In August 2012, acquisition of
the assets through a JGC-INPEX joint venture company
was finalized. JGC has thus fully entered into the
unconventional resource development business, through
shale oil and shale gas projects.
In 2010, JGC also participated in a conventional gas exploration project in Vermilion Parish, Louisiana, operated by
Petroquest Energy Inc (USA). An exploratory well drilled in 2011 yielded discovery of a large gas column, and production
started from this well in March 2012. In February 2012, a delineation well was drilled and confirmed the gas reservoir to
be as expected. Production is expected to start from this second well in September 2012.
Full-scale development of the Eagle Ford shale oil business, in which JGC acquired an interest in 2011, is being led
by operator Chesapeake Energy Corporation. The Eagle Ford shale oil assets are considered highly promising, and the
area is attracting considerable interest.
Eyeing Further Expansion in the E&P Business
Over many years working as an engineering contractor, JGC has amassed a wealth of technology and expertise. This
technology and expertise will be the driving force of JGC’s growth as we expand our enterprise investment business.
Looking ahead, JGC intends to broaden our field of operations by increasing working interests in North America, acquiring
rights to quality oil and gas field assets outside North America, and further developing unconventional resources such as
shale oil, shale gas, and mineral resources. We also plan to feed the experience and expertise we gain through our
upstream work in oil and gas field development back to our plant EPC business. In this way, we believe we can offer a
unique contribution to clients, as an engineering contractor familiar with upstream operations that also can boast an
unparalleled breadth of technological capabilities.
Drilling rig for the exploratory well
Completion rig (Eagle Ford)
15 JGC Corporationannual report 2012

In Qatar, the largest gas producer in the Middle East, the Pearl GTL (Gas to Liquids) Project—jointly developed by Qatar Petroleum and Shell—was officially inaugurated in November 2011. JGC’s involvement in the Project started from the FEED (Front-End Engineering and Design) stage. The Project involved the construction of a plant with a design capacity of producing 140,000 b/d of GTL products and 120,000 b/d of upstream products (LPG, ethane, condensate) when operating at full production. JGC was responsible for the construction of the GTL production unit, one of the plant’s core facilities. In addition, JGC, in collaboration with KBR, was responsible for the overall management of the Project execution, contributing to a successful delivery of this world-class facility.
Pearl GTL demonstrates that GTL technology can be applied in a world-scale project to form the foundation for a safe, reliable and economically attractive business. This is particularly important given that supply of easy-to-access oil is decreasing while the world’s reserves of gas provide for hundreds of years of continued production.
Growing Demand for GTLGTL products represent a pioneering innovation to increase the supply of highly-demanded liquid hydrocarbons. On full
production, Pearl GTL will be the world’s largest source of high-quality GTL products. The product slate includes GTL
gasoil (diesel-type fuel), GTL kerosene for aviation, GTL base oil for lubricants and GTL Naphtha and Normal Paraffins
as chemical feedstock. Pearl GTL products are virtually sulphur free and have practically no contaminants such as heavy
metals or aromatics. Their paraffinic chemical nature ensures that they are highly biodegradable and almost odourless.
When GTL Gasoil is used in automotive applications such as buses, it can help improve local air quality, such as soot
Project Introduction
Completion of the World’s Largest Gas to Liquids Plant
16 JGC Corporationannual report 2012
(particulates) emissions, when compared to use of conventional diesel fuel.
JGC: Aiming to Be One of the World’s Top Contractors for GTL PlantsIn 1993, JGC completed the construction of the world’s first commercial GTL plant, for
Shell MDS in Bintulu, Malaysia. Since then, JGC has built up distinguished project
management skills and a highly advanced knowledge of GTL production technology, both
of which we applied to the successful completion of the Pearl GTL project in Qatar, which
is the largest of its kind in the world. JGC is working tirelessly to become a world-leading
contractor for GTL plants.
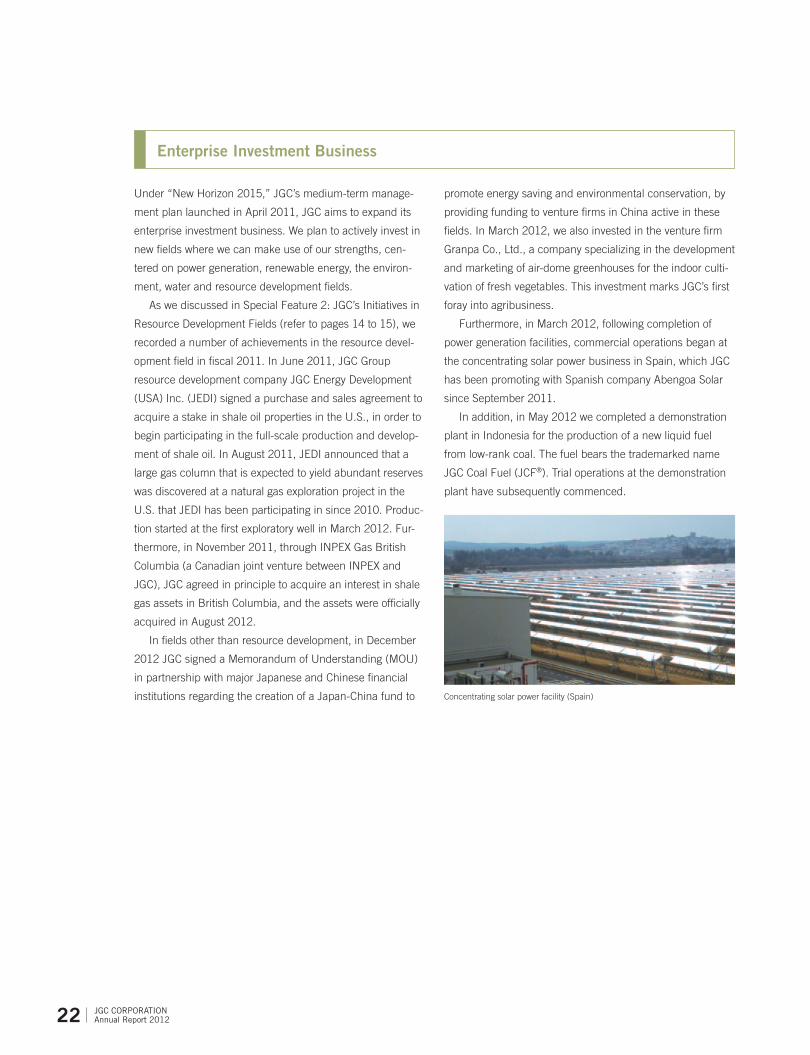
Established Incident/Injury-Free RecordA multi-cultural workforce from different nationalities and speaking diverse languages
worked in teams on the plant construction site. Constructing the plant involved numerous
high-risk tasks including heavy equipment positioning and performing a lot of work at
height, meaning that ensuring worker safety was the paramount concern and thus the
highest safety standards had to be applied. During the peak construction period, more
than 50,000 workers from over 60 countries were on site, making safety measures more
important than ever before. To support Shell and Qatar Petroleum’s comprehensive new
safety initiative, JGC took charge of improving the safety awareness of workers through
safety education and by promoting safe construction methods, resulting in a total of 72.9
million lost time free man-hours, a company record. JGC’s efforts to promote safety were
highly evaluated by the client.
Taking the Initiative in On-Site ManagementJGC aims to be the worldwide No. 1 contractor in the field of HSE (Health, Safety and Environment). Based on a
comprehensive health and safety policy, we continuously strive to protect the health and safety of not only our own
employees, but also the employees of our business partners.
Through previous safety management statistics, JGC estimated that by the
project’s completion the number of fatalities could potentially reach a total of
ten or more at the construction site, with a similar number resulting from road
accidents. Shell instigated a program for HSE management known as “Incident
and Injury Free” (IIF), which was developed in collaboration with a consultant.
JGC adopted this program whereby, based on two simple principles—“care
for each other,” and “go home safely,” the IIF campaign promotes safety not as
something to be enforced from the outside, but as a sum of personal choices
made by each worker. In this way, we emphasized how individuals can make
efforts to alter their actions in order to build a new and stronger safety culture
for the whole organization. On site, the JGC project director and project
managers set an example by being among the first to put the new safety
measures into practice, including achieving better communications with
workers, and encouraging workers to better communicate with one another,
revitalizing as well as improving safety consciousness. With the success of this
campaign, we achieved the already-mentioned record 72.9 million man-hours
without lost time incident, and we have now begun to apply the same safety
principles at other construction sites.
Pre-work meeting
Site managers actively engaged in dialogue with workers at the construction site
The completed Pearl GTL project
17 JGC Corporationannual report 2012

In the field of oil and gas development, capital investment
remained at a high level, due to investment by oil majors and
major state-run oil companies, notably in the Middle East
and North Africa.
In the North Africa region, August 2011 saw JGC win an
EPC order for the construction of a crude oil processing
facility in Algeria as part of the Bir Seba Field Development
Project from Groupement Bir Seba, which is made up of
Algerian state-owned oil and gas company Sonatrach, and
other parties. This project is scheduled for completion in the
first half of 2014. Also in Algeria, JGC is engaged in a project
to construct a gas boosting compressor station in the In
Amenas region for Sonatrach. In addition, also for Sonatrach,
JGC is constructing a large gas processing facility in the
Gassi Touil field, which is scheduled for completion in 2013.
In the Middle East, JGC is constructing a large-scale gas
processing plant in Qatar that is being promoted by the
state-run oil company and ExxonMobil. Meanwhile, in the
Emirate of Abu Dhabi, United Arab Emirates (UAE), JGC is
constructing large-scale gas processing facilities for Abu
Dhabi Gas Industries Ltd. in the Habshan field. This project
is scheduled for completion in 2013. In Saudi Arabia, JGC is
executing an EPC services contract for the state-owned oil
company Saudi Aramco involving off-site facilities (including
a water-injection system used in oil fields, crude oil storage
tanks and shipping equipment) for a large-scale crude oil
processing facility in the Manifa region. This project is also
scheduled for completion in 2013. Meanwhile, in September
2011, JGC Gulf International Co. Ltd., a Saudi Arabian sub-
sidiary of JGC, was awarded a project to construct a gas
compressor station in Bahrain by Bahrain’s state-run gas
company Banagas.
Review of Operations
The market for the JGC Group’s total engineering business in fiscal 2011 saw the continuation of brisk capital investment in
oil and gas-related projects, particularly in oil and gas producing countries in the Middle East and North Africa. This capital
investment was prompted by rising energy demand due to population and economic growth in emerging countries, and
consistently high oil prices. At the same time, many LNG projects advanced steadily in China and India, Japan, South Korea
and Taiwan, as well as elsewhere in the Asia and Oceania region, due to a projected increase in demand for LNG as fuel for
power generation.
Under these circumstances, the JGC Group continued to draw on its strengths to bolster its cost competitiveness in all
phases of its engineering, procurement, and construction (EPC) business. In projects currently underway, close attention was
paid to a variety of risks to ensure successful project execution.
Oil and Gas Development Projects
TOTAL ENGINEERING BUSINESS
Signing ceremony for a crude oil processing facility for Groupement Bir Seba (Algeria)
18 JGC Corporationannual report 2012

In the LNG field, demand is increasing in countries that have
long been importers of LNG, including Japan, South Korea
and Taiwan. In addition, LNG demand is expected to increase
steadily over the medium and long term in China, India and
emerging countries in Southeast Asia. Against this backdrop
of robust demand for LNG, we expect to see LNG plants
constructed or expanded in Southeast Asia, Oceania, Russia,
and South Africa. Furthermore, the ongoing development of
shale gas in North America should prompt the construction of
LNG plants using shale gas as a feedstock in the U.S.
In January 2012, JGC was awarded a contract by Ichthys
LNG Pty Ltd to construct an onshore LNG plant in Australia
(Ichthys LNG Pty Ltd is a joint venture between INPEX
Corporation and other shareholders). This LNG project is
scheduled to begin production at the end of December 2016.
Seventy percent of the LNG produced by the project will be
exported to Japan, making this an important project in the
context of Japan’s energy security. JGC is also constructing an
LNG plant for the Chevron-operated Gorgon LNG joint venture
on Barrow Island in northwestern Australia. In Malaysia, JGC
won a FEED contract in March 2012 for an LNG plant
expansion project from PETRONAS, Malaysia’s state-owned
oil company.
In Indonesia, JGC is constructing an LNG plant in
Sulawesi for Sulawesi LNG Development, which is partially
owned by Mitsubishi Corporation. This project is scheduled
for completion in 2014. Meanwhile, in Papua New Guinea,
JGC is constructing an LNG plant for Esso Highlands Limited,
which is owned by ExxonMobil and others.
In Japan, JGC is constructing an LNG receiving terminal
in Hachinohe, Aomori Prefecture, for JX Nippon Oil &
Energy Corporation.
In the petroleum refining field, oil companies, led by the oil
majors, continued to shrink and separate downstream divi-
sions in response to soft market conditions, including closing
ageing refining facilities with high maintenance costs in
developed countries. At the same time, they are concentrat-
ing business resources on upstream operations, especially
the development and production of crude oil and natural
gas, as they aim to bolster their earning power. Meanwhile,
in China, India, and developing countries in South America
and Southeast Asia, plans exist to construct and increase the
capacity of petroleum refineries on the back of impressive
economic growth.
In Venezuela, JGC was awarded a contract in December
2011 for an oil refinery expansion project by PDVSA Petroleo,
S.A. (PDVSA), the country’s state-run oil company. This
contract calls for the construction of heavy crude oil upgrad-
ing facilities that will employ the HDH Plus® heavy crude oil
cracking process technology, which was developed
independently by PDVSA, in an existing oil refinery. The
refinery will be the first in the world to commercially employ
this process.
In Singapore, JGC is constructing a diesel hydrotreater for
ExxonMobil Asia Pacific Pte. Ltd. This project has a target
completion date of 2014.
In addition, we are currently engaged in revamping refin-
ing facilities for oil companies in Japan.
LNG Projects
Petroleum Refining Projects
Signing ceremony for an oil refinery expansion project for PDVSA (Venezuela)
Signing ceremony for an LNG plant for Ichthys LNG Pty Ltd (Australia)
19 JGC Corporationannual report 2012

In the petrochemical and chemical products field, manufac-
turing bases for basic petrochemical products such as ethyl-
ene and propylene are being shifted from Japan and other
developed countries to oil and gas producing countries in
the Middle East, as well as to China, India and other emerg-
ing nations. In the Middle East in particular, we expect to see
new projects led by various governments go ahead based on
the competitively priced feedstock available in the region
and their greater use of the capital, technology, and project
management expertise of foreign companies, in order to add
value to their resources and to diversify their industrial base.
We believe that these moves will apply also to “specialty
products.” As such, the Middle East is likely to become a
major export base for petrochemical products going forward.
In Saudi Arabia, JGC conducted project management
services for a feasibility study on the development of the
Rabigh Phase II project (Rabigh II Project), which is being
promoted by Sumitomo Chemical Co., Ltd. and the state-
owned oil company Saudi Aramco. Also in Saudi Arabia,
production began in fiscal 2011 at a large-scale ethylene
plant that JGC constructed for Saudi Polymers Company.
In Japan, we are revamping petrochemical and chemical
product manufacturing facilities for a chemical company.
Chemical Projects
Looking at the new energy field in fiscal 2011, JGC was
active in the area of gas to liquids (GTL) as well as other
projects. GTL refers to diesel, kerosene and other petroleum
products produced from natural gas feedstock. GTL prod-
ucts are attracting attention as a next-generation environ-
mentally friendly energy source as they contain no sulfur
oxide or other substances of concern (SOC). In the U.S.,
where natural gas prices are falling due to the development
of shale gas and rising crude oil prices, GTL production
plants are expected to be constructed in the near future.
In Qatar, JGC successfully completed a GTL project for
Qatar Shell GTL Limited, a subsidiary of Royal Dutch Shell plc,
in November 2011. JGC managed the entire project as well as
conducting EPC&M activities for the GTL synthesis facility, the
core facility of what is the world’s largest GTL project.
In the power generation field, in Iraq, JGC won a contract
from the Ministry of Electricity of Iraq for a project to reno-
vate cooling water facilities at a thermal power plant in
Nassiriyah. This is the first post-Iraq War lump-sum contract
for EPC services awarded to a Japanese company. The
project is scheduled for completion in the first half of 2013.
In addition, in Japan, JGC safely and quickly completed
construction of emergency power supply facilities for a
power company as requested.
Power Generation, Nuclear Power and New Energy Projects
GTL plant for Qatar Shell GTL Limited (Qatar)
20 JGC Corporationannual report 2012

In the field of pharmaceuticals, major pharmaceutical com-
panies continued to invest in facilities for manufacturing
antibodies and other substances. Investment in such facili-
ties is expected to continue.
In fiscal 2011, JGC won orders for and constructed phar-
maceutical manufacturing facilities for several major domes-
tic pharmaceutical companies. In addition, we won an order
from Toyama Chemical Co., Ltd. to construct a plant for
manufacturing injectables.
In the field of non-ferrous metal refining, JGC is involved
in a project to construct a nickel refining plant that is being
promoted by Sumitomo Metal Mining Co., Ltd. in the Taganito
district on the island of Mindanao in the Philippines. The
project is slated to begin production in 2013.
Living and General Production Projects
In the field of medical facilities, JGC has constructed high-
quality medical facilities throughout Japan and provided
project management services. Both types of services have
received favorable evaluations from many clients. The medi-
cal facilities-related business continues to see the develop-
ment of projects utilizing the Private Finance Initiative (PFI)
method for tapping private-sector capital and expertise for
constructing and managing public infrastructure. We intend
to be actively involved in this area, taking advantage of our
expertise based on our long history of working on projects in
the medical field.
In fiscal 2011, we won a number of orders, including a
project to develop a medical facility on the former site of a
company housing facility in Onazuka for Japan Freight Railway
Company in Tokyo; a project to refurbish the Kano Hospital in
Fukuoka Prefecture for Houshikai; and a project in Kanagawa
Prefecture to rebuild the Ushioda Clinic for the Yokohama
Labor Welfare Association. Also in fiscal 2011, we completed
a contract to rebuild Kido Hospital for the Niigata Medicalcare
Cooperative in Niigata Prefecture, as well as a renovation of
the Morita Hospital in Kanagawa Prefecture for the Yushinkai
Foundation, and have also been constructing a new head-
quarters building for the Ibaraki Resident Co-operative Union
in Ibaraki Prefecture. Since the beginning of fiscal 2012, we
have also completed construction work of residences for the
elderly for nursing business company I.P.C Ltd. in Ibaraki
Prefecture. In addition, in the engineering business in Japan,
JGC became the first domestic engineering contractor to be
selected as a hospital PFI operator, following construction of a
new hospital wing for the Tokyo Metropolitan Matsuzawa
Hospital. An agreement has been reached under which JGC
will maintain, manage, operate, and carry out procurement of
supplies for the whole hospital for 15 years.
Environmental Protection, Social Development and IT Projects
Hospital for Niigata Medicalcare Cooperative (Niigata Prefecture)
21 JGC Corporationannual report 2012
Under “New Horizon 2015,” JGC’s medium-term manage-
ment plan launched in April 2011, JGC aims to expand its
enterprise investment business. We plan to actively invest in
new fields where we can make use of our strengths, cen-
tered on power generation, renewable energy, the environ-
ment, water and resource development fields.
As we discussed in Special Feature 2: JGC’s Initiatives in
Resource Development Fields (refer to pages 14 to 15), we
recorded a number of achievements in the resource devel-
opment field in fiscal 2011. In June 2011, JGC Group
resource development company JGC Energy Development
(USA) Inc. (JEDI) signed a purchase and sales agreement to
acquire a stake in shale oil properties in the U.S., in order to
begin participating in the full-scale production and develop-
ment of shale oil. In August 2011, JEDI announced that a
large gas column that is expected to yield abundant reserves
was discovered at a natural gas exploration project in the
U.S. that JEDI has been participating in since 2010. Produc-
tion started at the first exploratory well in March 2012. Fur-
thermore, in November 2011, through INPEX Gas British
Columbia (a Canadian joint venture between INPEX and
JGC), JGC agreed in principle to acquire an interest in shale
gas assets in British Columbia, and the assets were officially
acquired in August 2012.
In fields other than resource development, in December
2012 JGC signed a Memorandum of Understanding (MOU)
in partnership with major Japanese and Chinese financial
institutions regarding the creation of a Japan-China fund to
promote energy saving and environmental conservation, by
providing funding to venture firms in China active in these
fields. In March 2012, we also invested in the venture firm
Granpa Co., Ltd., a company specializing in the development
and marketing of air-dome greenhouses for the indoor culti-
vation of fresh vegetables. This investment marks JGC’s first
foray into agribusiness.
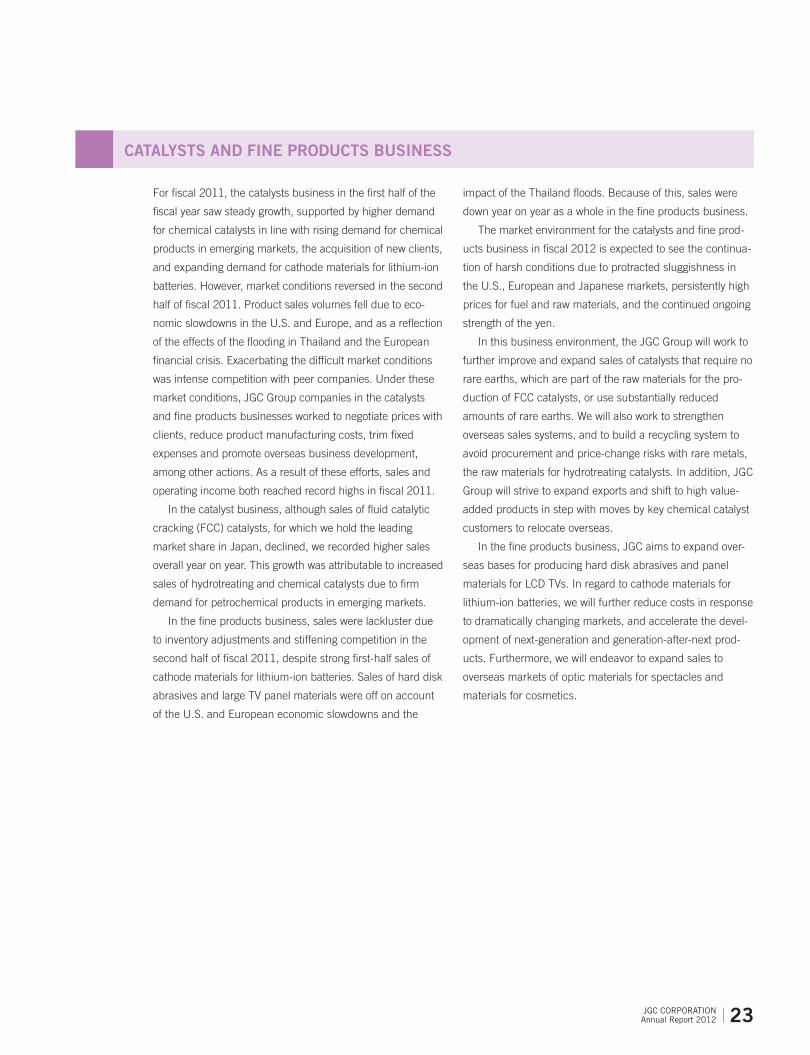
Furthermore, in March 2012, following completion of
power generation facilities, commercial operations began at
the concentrating solar power business in Spain, which JGC
has been promoting with Spanish company Abengoa Solar
since September 2011.
In addition, in May 2012 we completed a demonstration
plant in Indonesia for the production of a new liquid fuel
from low-rank coal. The fuel bears the trademarked name
JGC Coal Fuel (JCF®). Trial operations at the demonstration
plant have subsequently commenced.
Enterprise Investment Business
Concentrating solar power facility (Spain)
22 JGC Corporationannual report 2012
For fiscal 2011, the catalysts business in the first half of the
fiscal year saw steady growth, supported by higher demand
for chemical catalysts in line with rising demand for chemical
products in emerging markets, the acquisition of new clients,
and expanding demand for cathode materials for lithium-ion
batteries. However, market conditions reversed in the second
half of fiscal 2011. Product sales volumes fell due to eco-
nomic slowdowns in the U.S. and Europe, and as a reflection
of the effects of the flooding in Thailand and the European
financial crisis. Exacerbating the difficult market conditions
was intense competition with peer companies. Under these
market conditions, JGC Group companies in the catalysts
and fine products businesses worked to negotiate prices with
clients, reduce product manufacturing costs, trim fixed
expenses and promote overseas business development,
among other actions. As a result of these efforts, sales and
operating income both reached record highs in fiscal 2011.
In the catalyst business, although sales of fluid catalytic
cracking (FCC) catalysts, for which we hold the leading
market share in Japan, declined, we recorded higher sales
overall year on year. This growth was attributable to increased
sales of hydrotreating and chemical catalysts due to firm
demand for petrochemical products in emerging markets.
In the fine products business, sales were lackluster due
to inventory adjustments and stiffening competition in the
second half of fiscal 2011, despite strong first-half sales of
cathode materials for lithium-ion batteries. Sales of hard disk
abrasives and large TV panel materials were off on account
of the U.S. and European economic slowdowns and the
impact of the Thailand floods. Because of this, sales were
down year on year as a whole in the fine products business.
The market environment for the catalysts and fine prod-
ucts business in fiscal 2012 is expected to see the continua-
tion of harsh conditions due to protracted sluggishness in
the U.S., European and Japanese markets, persistently high
prices for fuel and raw materials, and the continued ongoing
strength of the yen.
In this business environment, the JGC Group will work to
further improve and expand sales of catalysts that require no
rare earths, which are part of the raw materials for the pro-
duction of FCC catalysts, or use substantially reduced
amounts of rare earths. We will also work to strengthen
overseas sales systems, and to build a recycling system to
avoid procurement and price-change risks with rare metals,
the raw materials for hydrotreating catalysts. In addition, JGC
Group will strive to expand exports and shift to high value-
added products in step with moves by key chemical catalyst
customers to relocate overseas.
In the fine products business, JGC aims to expand over-
seas bases for producing hard disk abrasives and panel
materials for LCD TVs. In regard to cathode materials for
lithium-ion batteries, we will further reduce costs in response
to dramatically changing markets, and accelerate the devel-
opment of next-generation and generation-after-next prod-
ucts. Furthermore, we will endeavor to expand sales to
overseas markets of optic materials for spectacles and
materials for cosmetics.
CATALySTS AND FINE PRODUCTS BUSINESS
23 JGC Corporationannual report 2012
0
2008 2009
200
400
600(Billions of yen)
2010 20122011
0
300
600
900
2008 2009 2010 20122011
(Billions of yen)
0
300
600
900
1,200
1,500(Billions of yen)
2008 2009 2010 20122011
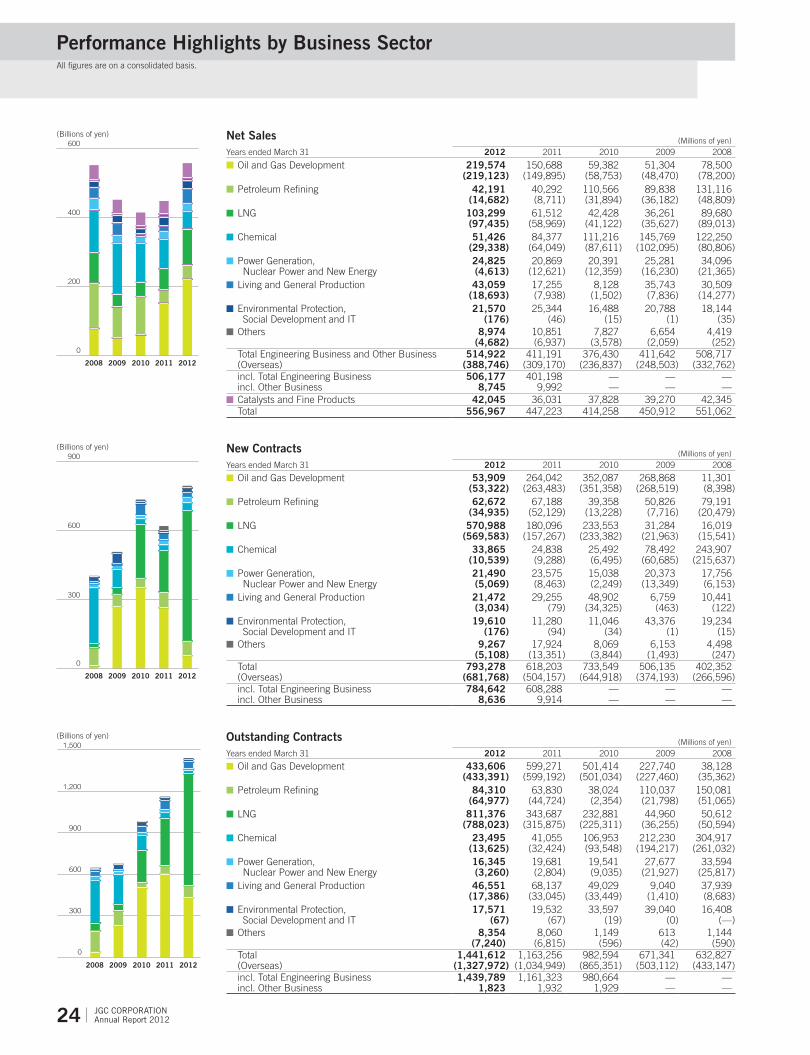
Performance Highlights by Business Sector All figures are on a consolidated basis.
Net Sales (Millions of yen)Years ended March 31 2012 2011 2010 2009 2008
■ Oil and Gas Development 219,574 (219,123)
150,688(149,895)
59,382(58,753)
51,304(48,470)
78,500(78,200)
■ Petroleum Refining 42,191(14,682)
40,292(8,711)
110,566(31,894)
89,838(36,182)
131,116(48,809)
■ LNG 103,299(97,435)
61,512(58,969)
42,428(41,122)
36,261(35,627)
89,680(89,013)
■ Chemical 51,426(29,338)
84,377(64,049)
111,216(87,611)
145,769(102,095)
122,250(80,806)
■ Power Generation, Nuclear Power and New Energy
24,825(4,613)
20,869(12,621)
20,391(12,359)
25,281(16,230)
34,096(21,365)
■ Living and General Production 43,059 (18,693)
17,255(7,938)
8,128(1,502)
35,743(7,836)
30,509(14,277)
■ Environmental Protection, Social Development and IT
21,570 (176)
25,344(46)
16,488(15)
20,788(1)
18,144(35)
■ Others 8,974 (4,682)
10,851(6,937)
7,827(3,578)
6,654(2,059)
4,419(252)
Total Engineering Business and Other Business (Overseas)
514,922 (388,746)
411,191(309,170)
376,430(236,837)
411,642(248,503)
508,717(332,762)
incl. Total Engineering Business incl. Other Business
506,1778,745
401,1989,992
——
——
——
■ Catalysts and Fine Products 42,045 36,031 37,828 39,270 42,345 Total 556,967 447,223 414,258 450,912 551,062
New Contracts (Millions of yen)Years ended March 31 2012 2011 2010 2009 2008
■ Oil and Gas Development 53,909 (53,322)
264,042(263,483)
352,087(351,358)
268,868(268,519)
11,301(8,398)
■ Petroleum Refining 62,672 (34,935)
67,188(52,129)
39,358(13,228)
50,826(7,716)
79,191(20,479)
■ LNG 570,988 (569,583)
180,096(157,267)
233,553(233,382)
31,284(21,963)
16,019(15,541)
■ Chemical 33,865 (10,539)
24,838(9,288)
25,492(6,495)
78,492(60,685)
243,907(215,637)
■ Power Generation, Nuclear Power and New Energy
21,490 (5,069)
23,575(8,463)
15,038(2,249)
20,373(13,349)
17,756(6,153)
■ Living and General Production 21,472 (3,034)
29,255(79)
48,902(34,325)
6,759(463)
10,441(122)
■ Environmental Protection, Social Development and IT
19,610 (176)
11,280(94)
11,046(34)
43,376(1)
19,234(15)
■ Others 9,267 (5,108)
17,924(13,351)
8,069(3,844)
6,153(1,493)
4,498(247)
Total (Overseas)
793,278 (681,768)
618,203(504,157)
733,549(644,918)
506,135(374,193)
402,352(266,596)
incl. Total Engineering Business incl. Other Business
784,642 8,636
608,2889,914
——
——
——
Outstanding Contracts (Millions of yen)Years ended March 31 2012 2011 2010 2009 2008
■ Oil and Gas Development 433,606 (433,391)
599,271 (599,192)
501,414(501,034)
227,740(227,460)
38,128(35,362)
■ Petroleum Refining 84,310 (64,977)
63,830 (44,724)
38,024(2,354)
110,037(21,798)
150,081(51,065)
■ LNG 811,376 (788,023)
343,687 (315,875)
232,881(225,311)
44,960(36,255)
50,612(50,594)
■ Chemical 23,495(13,625)
41,055 (32,424)
106,953(93,548)
212,230(194,217)
304,917(261,032)
■ Power Generation, Nuclear Power and New Energy
16,345 (3,260)
19,681 (2,804)
19,541(9,035)
27,677(21,927)
33,594(25,817)
■ Living and General Production 46,551 (17,386)
68,137 (33,045)
49,029(33,449)
9,040(1,410)
37,939(8,683)
■ Environmental Protection, Social Development and IT
17,571 (67)
19,532 (67)
33,597(19)
39,040(0)
16,408(—)
■ Others 8,354 (7,240)
8,060 (6,815)
1,149(596)
613(42)
1,144(590)
Total (Overseas)
1,441,612(1,327,972)
1,163,256 (1,034,949)
982,594(865,351)
671,341(503,112)
632,827(433,147)
incl. Total Engineering Business incl. Other Business
1,439,789 1,823
1,161,323 1,932
980,6641,929
——
——
24 JGC Corporationannual report 2012
0
300
600
900
2008 2009 2010 20122011
(Billions of yen)
0
300
600
900
1,200
1,500(Billions of yen)
2008 2009 2010 20122011
0
200
400
600
2008 2009 2010 20122011
(Billions of yen)
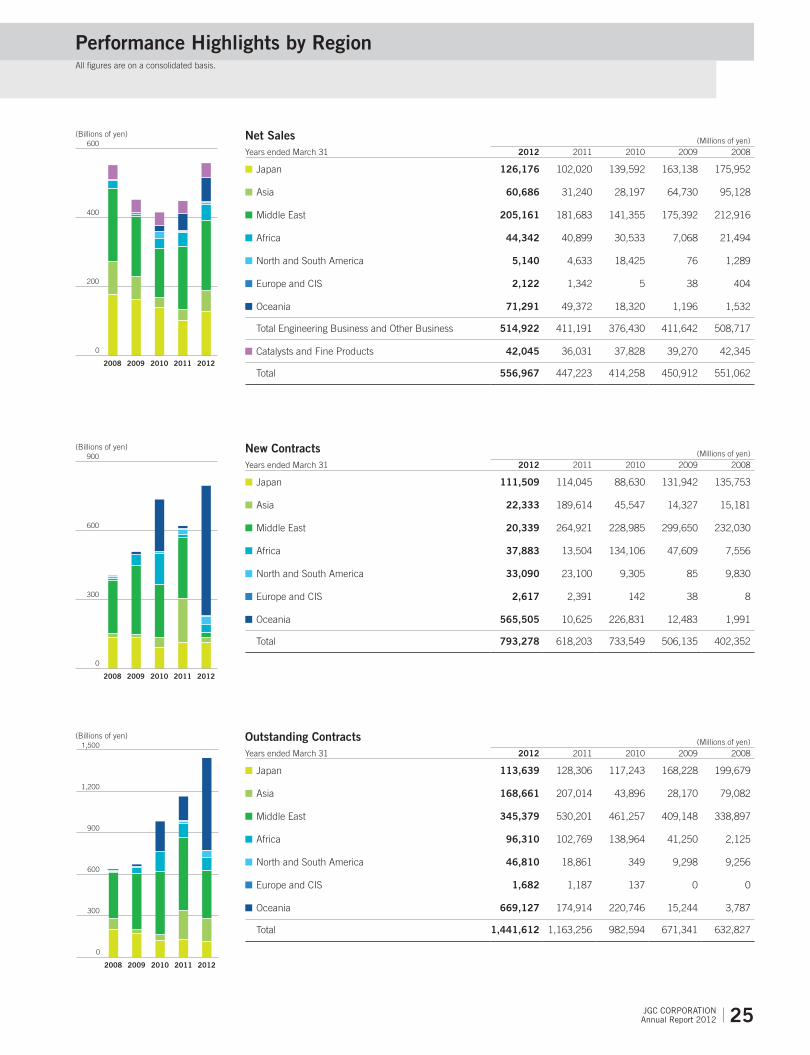
Performance Highlights by Region All figures are on a consolidated basis.
Net Sales (Millions of yen)Years ended March 31 2012 2011 2010 2009 2008
■Japan 126,176 102,020 139,592 163,138 175,952
■Asia 60,686 31,240 28,197 64,730 95,128
■Middle East 205,161 181,683 141,355 175,392 212,916
■Africa 44,342 40,899 30,533 7,068 21,494
■North and South America 5,140 4,633 18,425 76 1,289
■Europe and CIS 2,122 1,342 5 38 404
■Oceania 71,291 49,372 18,320 1,196 1,532
Total Engineering Business and Other Business 514,922 411,191 376,430 411,642 508,717
■Catalysts and Fine Products 42,045 36,031 37,828 39,270 42,345
Total 556,967 447,223 414,258 450,912 551,062
New Contracts (Millions of yen)Years ended March 31 2012 2011 2010 2009 2008
■Japan 111,509 114,045 88,630 131,942 135,753
■Asia 22,333 189,614 45,547 14,327 15,181
■Middle East 20,339 264,921 228,985 299,650 232,030
■Africa 37,883 13,504 134,106 47,609 7,556
■North and South America 33,090 23,100 9,305 85 9,830
■Europe and CIS 2,617 2,391 142 38 8
■Oceania 565,505 10,625 226,831 12,483 1,991
Total 793,278 618,203 733,549 506,135 402,352
Outstanding Contracts (Millions of yen)Years ended March 31 2012 2011 2010 2009 2008
■Japan 113,639 128,306 117,243 168,228 199,679
■Asia 168,661 207,014 43,896 28,170 79,082
■Middle East 345,379 530,201 461,257 409,148 338,897
■Africa 96,310 102,769 138,964 41,250 2,125
■North and South America 46,810 18,861 349 9,298 9,256
■Europe and CIS 1,682 1,187 137 0 0
■Oceania 669,127 174,914 220,746 15,244 3,787
Total 1,441,612 1,163,256 982,594 671,341 632,827
25 JGC Corporationannual report 2012

Major Projects
Business Sector Client Project Location
Contracts Awarded
Oil and Gas Development Projects Groupement Bir Seba Crude Oil Processing Facilities Bir Seba/Algeria
Petroleum Refining Projects PDVSA Petroleo, S.A. (PDVSA) Heavy Crude Oil Upgrading Facilities Puerto La Cruz/Venezuela
LNG Projects Ichthys LNG PTY LTD LNG Plant Darwin/Australia
PETROLIAM NASIONAL BHD. (Petronas) FEED Service for LNG Plant Bintulu/Malaysia
Power Generation, Nuclear Power and New
Energy Projects
General Directorate of Electric Energy
Production In Nassiriyah
Cooling Water Facility Nassiriyah/Iraq
Japan Nuclear Fuel Limited Vitrification Facility Aomori/Japan
Living and General Production Projects TOYAMA CHEMICAL CO., LTD. Pharmaceutical-related Facilities Toyama/Japan
Environmental Protection, Social Development
and IT Projects
Japan Freight Railway Company Hospital Tokyo/Japan
Houshikai Foundation Hospital Fukuoka/Japan
Contracts Underway
Oil and Gas Development Projects Ras Gas Company Limited Gas Processing Plant Ras Laffan/Qatar
Abu Dhabi Gas Industries Ltd. Gas Processing Plant Habshan/Abu Dhabi
Sonatrach Gas Processing Plant Gassi Touil/Algeria
Sonatrach Gas & Oil Separation Facilities Rhourde Nouss/Algeria
Saudi Arabian Oil Co. (Saudi Aramco) Utilities, Storage and Shipping Facilities for
the Central Processing Facilities
Manifa/Saudi Arabia
Petroleum Refining Projects ExxonMobil Asia Pacific Pte. Ltd. Petroleum Refining-related Plant Jurong/Singapore
LNG Projects Sulawesi LNG Development LNG Plant Luwuk/Indonesia
JX Nippon Oil & Energy Corporation LNG Receiving Terminal Aomori/Japan
Chevron Australia Pty Ltd LNG Plant Barrow Island/Australia
Esso Highlands Limited LNG Plant Port Moresby/Papua New Guinea
Chemical Projects Saudi Polymers Company Petrochemical Plant Al Jubail/Saudi Arabia
Living and General Production Projects DENKA SEIKEN Co., Ltd. Pharmaceutical-related Facilities Niigata/Japan
Environmental Protection, Social Development
and IT Projects
Ibaraki Resident Co-operative Union Headquarters Building Ibaraki/Japan
Medical Co. LTA. Hospital Kumamoto/Japan
Hokuyokai Foundation Hospital Hokkaido/Japan
Medical Management Matsuzawa Co., Ltd. Hospital Tokyo/Japan
I. P. C Ltd. Senior Citizen Complex Ibaraki/Japan
Contracts Completed
Power Generation, Nuclear Power and New
Energy Projects
Qatar Shell GTL Ltd. GTL Plant Ras Laffan/Qatar
Environmental Protection, Social Development
and IT Projects
Niigata Medicalcare Cooperative Hospital Niigata/Japan
Yushinkai Foundation Hospital Kanagawa/Japan
26 JGC Corporationannual report 2012
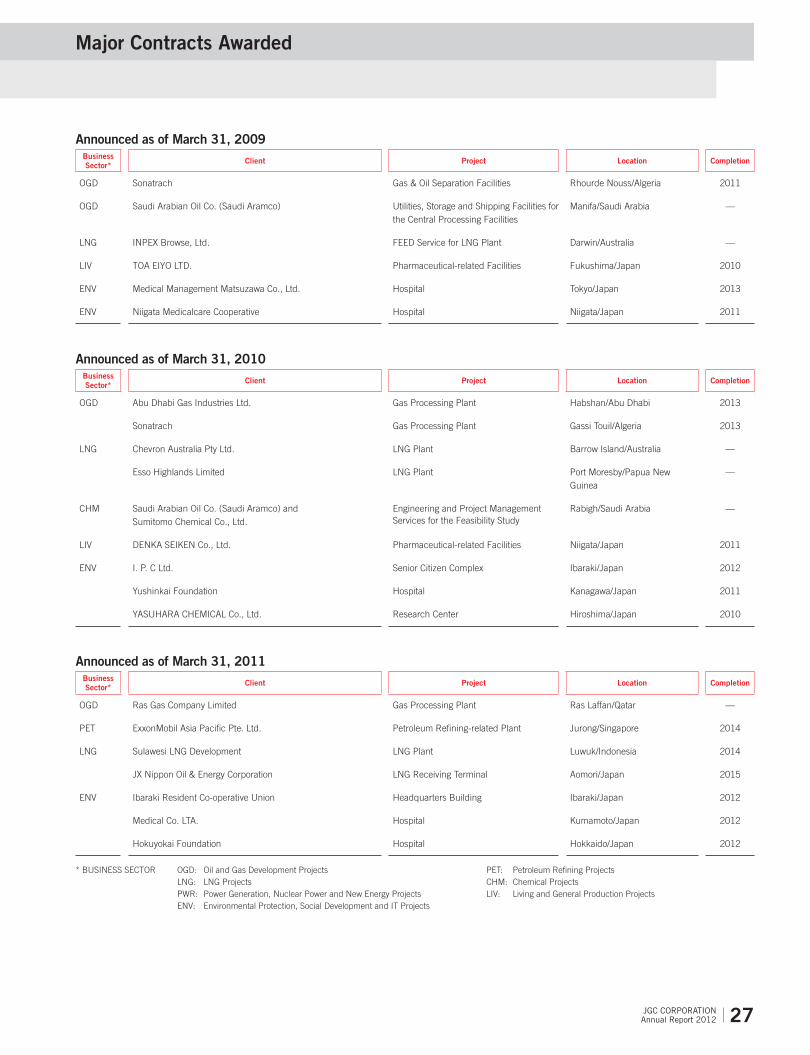
Major Contracts Awarded
Announced as of March 31, 2009Business Sector* Client Project Location Completion
OGD Sonatrach Gas & Oil Separation Facilities Rhourde Nouss/Algeria 2011
OGD Saudi Arabian Oil Co. (Saudi Aramco) Utilities, Storage and Shipping Facilities for the Central Processing Facilities
Manifa/Saudi Arabia —
LNG INPEX Browse, Ltd. FEED Service for LNG Plant Darwin/Australia —
LIV TOA EIYO LTD. Pharmaceutical-related Facilities Fukushima/Japan 2010
ENV Medical Management Matsuzawa Co., Ltd. Hospital Tokyo/Japan 2013
ENV Niigata Medicalcare Cooperative Hospital Niigata/Japan 2011
Announced as of March 31, 2010Business Sector* Client Project Location Completion
OGD Abu Dhabi Gas Industries Ltd. Gas Processing Plant Habshan/Abu Dhabi 2013
Sonatrach Gas Processing Plant Gassi Touil/Algeria 2013
LNG Chevron Australia Pty Ltd. LNG Plant Barrow Island/Australia —
Esso Highlands Limited LNG Plant Port Moresby/Papua New Guinea
—
CHM Saudi Arabian Oil Co. (Saudi Aramco) and Sumitomo Chemical Co., Ltd.
Engineering and Project Management Services for the Feasibility Study
Rabigh/Saudi Arabia —
LIV DENKA SEIKEN Co., Ltd. Pharmaceutical-related Facilities Niigata/Japan 2011
ENV I. P. C Ltd. Senior Citizen Complex Ibaraki/Japan 2012
Yushinkai Foundation Hospital Kanagawa/Japan 2011
YASUHARA CHEMICAL Co., Ltd. Research Center Hiroshima/Japan 2010
Announced as of March 31, 2011Business Sector* Client Project Location Completion
OGD Ras Gas Company Limited Gas Processing Plant Ras Laffan/Qatar —
PET ExxonMobil Asia Pacific Pte. Ltd. Petroleum Refining-related Plant Jurong/Singapore 2014
LNG Sulawesi LNG Development LNG Plant Luwuk/Indonesia 2014
JX Nippon Oil & Energy Corporation LNG Receiving Terminal Aomori/Japan 2015
ENV Ibaraki Resident Co-operative Union Headquarters Building Ibaraki/Japan 2012
Medical Co. LTA. Hospital Kumamoto/Japan 2012
Hokuyokai Foundation Hospital Hokkaido/Japan 2012
* BUSINESS SECTOR OGD: Oil and Gas Development Projects PET: Petroleum Refining Projects LNG: LNG Projects CHM: Chemical Projects PWR: Power Generation, Nuclear Power and New Energy Projects LIV: Living and General Production Projects ENV: Environmental Protection, Social Development and IT Projects
27 JGC Corporationannual report 2012

In accordance with the JGC CSR Basic Policy, the JGC Group will continue to involve itself in activities that contribute to the
well-being and prosperity of society.
Environmental Activities and Contribution to Society
JGC CSR (Corporate Social Responsibility) Basic PolicyJGC is committed to fulfilling its role as a member of society (Corporate
Citizenship). We recognize that the foundation of our business is
strengthened by contributing to the prosperity of the world economy
and society; to the healthy preservation of the global environment; and
to sustainable development of society in harmony with nature.
To meet this commitment, JGC hereby establishes the following
principles, which shall be applied, throughout its operations.
1. We shall conduct our business with a full understanding of the importance of quality, safety, and the environment.
2. We shall make contributions to society that draw on the unique strengths of the JGC Group.
3. We shall comply with all legal requirements both within Japan and internationally, and conduct our business in a fair and trans-parent manner under a proper corporate governance system.
4. We shall disclose necessary information to our stakeholders in a timely and appropriate manner.
5. We shall endeavor to maintain and further improve fair human resource management, to develop the abilities of our personnel based on mutual trust and responsibility.
6. We shall promote CSr awareness and further develop our CSr contributions, reflecting input from stakeholders.
Environmental ActivitiesJGC’s Engineering & Construction (E&C) business, which provides
engineering, procurement and construction (EPC) services for energy-
related plants such as those for oil and natural gas, is closely related to
environmental protection in and of itself.
Since the 1960s, JGC has worked on environmental issues as an
engineering contractor, striving to develop cleaner petroleum products,
make its plants more energy-efficient, and eliminate the production of
hazardous waste. Through to today, our understanding that our
business activities can themselves contribute to environmental
protection has not changed, and is symbolically expressed in our
corporate philosophy.
Furthermore, we are expanding our environmental protection activi-
ties into a wider range of fields outside of our EPC business, including
our new clean development mechanism (CDM) business, which we
are developing as part of our enterprise investment initiatives.
Working to provide our clients with plants that place a minimum
burden on the environment is also an important part of JGC’s environ-
mental management approach. We engage in testing various tech-
niques and improvements at each stage of our EPC business, and our
methods have been evaluated highly by our clients.
Measures taken to lessen the environmental impact of operations
at both our head office and the construction sites of our EPC projects
constitute the foundation of JGC’s environmental management
efforts. We have been improving our records every year for CO2
reductions at the head office and reduction/recycling of waste prod-
ucts at construction sites.
Considering HSE in Business ActivitiesThe JGC Group executes projects around the world, in sectors rang-
ing from resource development, oil, natural gas, and petrochemicals,
to the environment, catalysts and fine chemicals, pharmaceuticals,
water resources, and new energy. Through all these projects, the JGC
Group always strives to fully account for factors concerning health,
safety, and the environment (HSE). HSE aspects must of course be
considered in EPC services, but they must also be considered in
marketing and at all project stages, from feasibility studies to mainte-
nance and plant decommissioning, as well as our investment and
services businesses. The JGC Group has added HSE factors to its
engineering and management capabilities, as it aims to help create a
sustainable society.
In this section, we look at some examples of how the JGC Group
considers the environment at the construction planning and construc-
tion stages of project execution.
<Construction Planning Stage>Meticulous concern for sustainability at plant construction sites is
essential. In many countries, construction of new plants requires
submission of an environmental impact assessment (EIA) report for
the purpose of minimizing environmental impacts wherever possible.
The EIA report describes in detail the impacts that construction work
will have on the air, water, soil, flora, fauna, and marine life. JGC
applies environmental management systems to construction work to
ensure that we demonstrate consideration for the environment in
compliance with EIA reports, emphasizing the following points:
➊ We practice strict legal compliance and environmental risk
management by identifying environmental laws and regulations
and environmental considerations that have a bearing on
construction work.
➋ We endeavor to increase customer satisfaction and reinforce
communication with stakeholders.
➌We manage environmental risks and endeavor to minimize the
possibility of incidents that may have a negative impact on the
environment by anticipating, preparing for, and speedily
responding to emergencies.
28 JGC Corporationannual report 2012

Before starting construction work, we consider the above matters
and unfailingly perform the following preliminary work:
➊ identifying environmental impacts of the construction work
➋ Setting environmental objectives and targets for the construc-
tion work
➌preparing an environmental management plan for construction work
➍providing new workers with environmental education and training
We incorporate the Zero Emissions Initiative 2015, a JGC Group
independent environmental conservation initiative, into this preliminary
work, and thoroughly confirm environmental conservation measures
before starting construction.
<Construction>Construction work by JGC is preceded by thorough consideration of
possible effects on the environment at the planning stage.
Matters decided in the Construction Environmental Management
Plan include the project environmental policy, which organizations and
persons will be responsible for environment-related work, what environ-
mental protection measures will be put in place, guidelines for environ-
mental performance monitoring and measurement, emergency
prevention and mitigation procedures, environmental monitoring, and
monthly reporting. Following the start of construction, a review of the
environmental aspects of the project (the relationship between
construction work and the environment) is conducted to confirm
whether the construction work differs from the plan. If any deviations
are found, the plan is revised to ensure that there are no omissions in
the environmental considerations included in the environmental
management framework.
Continuous Improvement of Environmental Management SystemsIn December 2003, JGC obtained international standard ISO 14001
certification for its environmental management systems from Lloyd’s
Register Quality Assurance (LRQA).
After two renewals, JGC completed the fiscal 2011 maintenance
examination in September 2011, which included overseas sites.
Making Environmental Improvement Activities More Applicable to Core BusinessIn the past, environmental improvement activities at JGC’s headquarters
have tended to center on the reduction of waste, paper, and electricity
consumption. For this reason, the challenge for JGC has been to shift
focus to environmental improvement activities more related to our core
business. In order to address this challenge, all department heads took
part in discussions about how to identify opportunities for environmental
conservation in their primary work and review target-setting procedures.
These discussions established the following shared awareness:
· It is important to strive for the development of a sustainable society by
addressing environmental problems through our core business, and to
link this with the creation of corporate value and greater competitiveness.
· Amid rising global concern over environmental problems, JGC has
been helping to address environmental issues directly and indirectly
through its core business activities. JGC recognizes that its pursuit of
sustainability must be undertaken in its core business.
· JGC is mindful of the following points for achieving continuous
development.
➊ Maintaining and managing operations so as not to cause envi-
ronmental problems.
➋ Making continuous improvements so as to raise earnings, while
taking environmental concerns into consideration.
Based on this shared understanding, JGC has continued to explore
the significance of environmental targets and goals, and has promoted
environmental management activities along the following lines:
· Environmental management activities based on environmental
targets and goals are business operations in themselves, rather than
separate activities.
· The operating policies of divisions and departments are set with the
aim of raising the actual performance of the organization and busi-
ness operations.
· The operating policies themselves are quality targets.
· The environmental targets of departments with an indirect environ-
mental impact are to be considered as quality targets.
In this way, JGC’s environmental management system is loosely
linked to the quality management system, and JGC promotes environ-
mental improvement activities that are applicable to its core businesses.
Construction Waste RecyclingJGC aims to minimize final waste through rigorous implementation of
the Zero Emissions Initiative 2015. In fiscal 2011, the final disposal
rate for construction work in Japan was 4.4%. Each site uses industrial
waste management survey forms prescribed by JGC to confirm the
recycling rate with companies taking charge of intermediate waste
disposal before contracting with them. Because there is a large differ-
ence among waste disposal companies in terms of the disposal
method for construction sludge and the recycling rate in particular, an
extensive comparative analysis of each company is conducted regard-
ing the disposal methods and disposal costs. Furthermore, appropriate
plans for separating waste are drawn up before the commencement of
construction based on the nature of the waste generated. During
construction, efforts are made to improve the recycling rate by rigidly
enforcing waste separation in accordance with the plan.
29 JGC Corporationannual report 2012
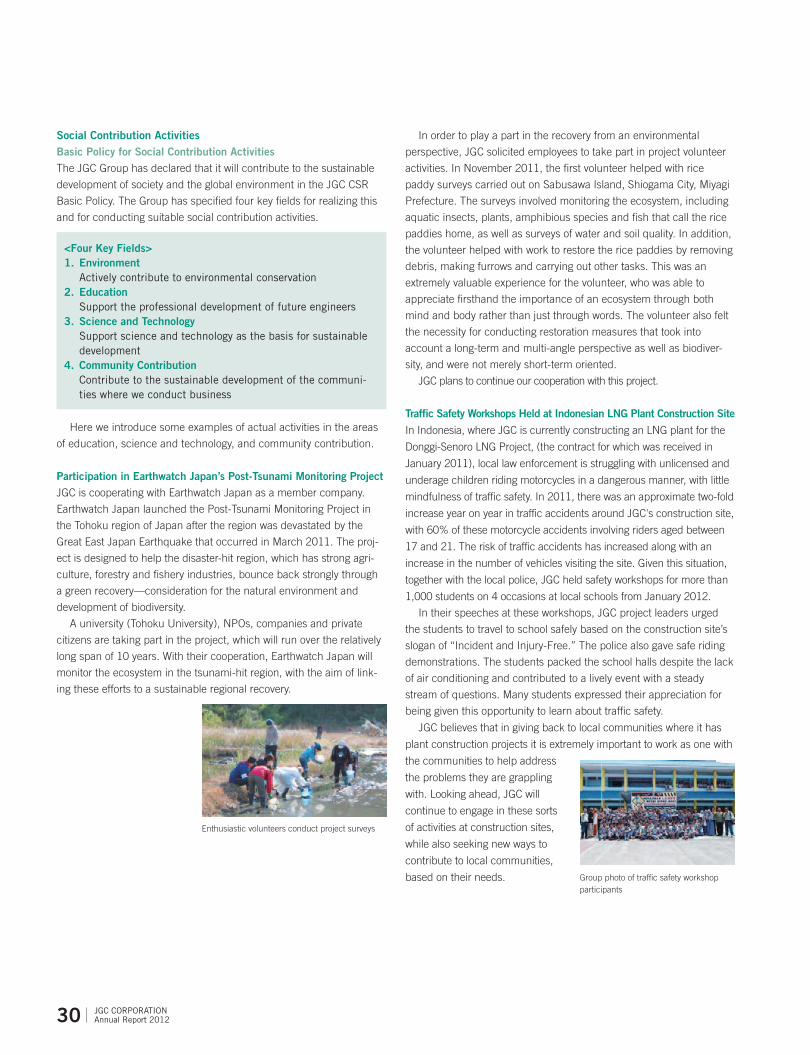
Enthusiastic volunteers conduct project surveys
Group photo of traffic safety workshop participants
In order to play a part in the recovery from an environmental
perspective, JGC solicited employees to take part in project volunteer
activities. In November 2011, the first volunteer helped with rice
paddy surveys carried out on Sabusawa Island, Shiogama City, Miyagi
Prefecture. The surveys involved monitoring the ecosystem, including
aquatic insects, plants, amphibious species and fish that call the rice
paddies home, as well as surveys of water and soil quality. In addition,
the volunteer helped with work to restore the rice paddies by removing
debris, making furrows and carrying out other tasks. This was an
extremely valuable experience for the volunteer, who was able to
appreciate firsthand the importance of an ecosystem through both
mind and body rather than just through words. The volunteer also felt
the necessity for conducting restoration measures that took into
account a long-term and multi-angle perspective as well as biodiver-
sity, and were not merely short-term oriented.
JGC plans to continue our cooperation with this project.
Traffic Safety Workshops Held at Indonesian LNG Plant Construction SiteIn Indonesia, where JGC is currently constructing an LNG plant for the
Donggi-Senoro LNG Project, (the contract for which was received in
January 2011), local law enforcement is struggling with unlicensed and
underage children riding motorcycles in a dangerous manner, with little
mindfulness of traffic safety. In 2011, there was an approximate two-fold
increase year on year in traffic accidents around JGC's construction site,
with 60% of these motorcycle accidents involving riders aged between
17 and 21. The risk of traffic accidents has increased along with an
increase in the number of vehicles visiting the site. Given this situation,
together with the local police, JGC held safety workshops for more than
1,000 students on 4 occasions at local schools from January 2012.
In their speeches at these workshops, JGC project leaders urged
the students to travel to school safely based on the construction site’s
slogan of “Incident and Injury-Free.” The police also gave safe riding
demonstrations. The students packed the school halls despite the lack
of air conditioning and contributed to a lively event with a steady
stream of questions. Many students expressed their appreciation for
being given this opportunity to learn about traffic safety.
JGC believes that in giving back to local communities where it has
plant construction projects it is extremely important to work as one with
the communities to help address
the problems they are grappling
with. Looking ahead, JGC will
continue to engage in these sorts
of activities at construction sites,
while also seeking new ways to
contribute to local communities,
based on their needs.
Social Contribution ActivitiesBasic Policy for Social Contribution ActivitiesThe JGC Group has declared that it will contribute to the sustainable
development of society and the global environment in the JGC CSR
Basic Policy. The Group has specified four key fields for realizing this
and for conducting suitable social contribution activities.
<Four Key Fields>1. Environment actively contribute to environmental conservation2. Education Support the professional development of future engineers3. Science and Technology Support science and technology as the basis for sustainable
development4. Community Contribution Contribute to the sustainable development of the communi-
ties where we conduct business
Here we introduce some examples of actual activities in the areas
of education, science and technology, and community contribution.
Participation in Earthwatch Japan’s Post-Tsunami Monitoring ProjectJGC is cooperating with Earthwatch Japan as a member company.
Earthwatch Japan launched the Post-Tsunami Monitoring Project in
the Tohoku region of Japan after the region was devastated by the
Great East Japan Earthquake that occurred in March 2011. The proj-
ect is designed to help the disaster-hit region, which has strong agri-
culture, forestry and fishery industries, bounce back strongly through
a green recovery—consideration for the natural environment and
development of biodiversity.
A university (Tohoku University), NPOs, companies and private
citizens are taking part in the project, which will run over the relatively
long span of 10 years. With their cooperation, Earthwatch Japan will
monitor the ecosystem in the tsunami-hit region, with the aim of link-
ing these efforts to a sustainable regional recovery.
30 JGC Corporationannual report 2012

Corporate Governance FrameworkExecutive Officer SystemJGC has introduced an executive officer system, which clarifies the
division of management decision-making and oversight functions from
executive functions. This has further enhanced management efficiency
and strengthened our executive accountability system.
Board of DirectorsThe Board of Directors, headed by the Chairman of the Board of
Directors, has 15 members and meets twice a month in principle.
JGC also has five corporate auditors (including three outside audi-
tors) who regularly attend board meetings.
JGC recognizes the importance of mainly appointing directors
with a high degree of EPC business knowledge and who are well-
versed in a wide range of business markets. As a result, at present
the Board of Directors comprises only internal directors with abun-
dant experience. However, JGC will continue to consider the appoint-
ment of outside directors in the future based on the availability of
suitable candidates.
Meetings for the Execution of Business OperationsJGC has a Director and Executive Officer Committee, which meets
once a month in principle for the purposes of sharing information
regarding the status of management policies, and reporting/confirm-
ing the status of operations. The Chairman of the Board of Directors
heads this committee, which is composed of directors, executive
officers, and corporate auditors.
The Management Strategy Committee meets once a week in
principle to examine important matters for JGC and the JGC Group
relating to management strategy. The Chairman Emeritus of the JGC
Group heads this committee, which is comprised of directors,
corporate auditors, and other members.
JGC has also established the Operations Steering Committee to
consult and make decisions related to the execution of operations of
JGC Corporation and the JGC Group. Chaired by the President, this
committee includes corporate auditors and other individuals selected
by the President. The committee meets twice a month in principle.
In addition, a Nominating Committee and an Assessment
Committee have been established to enhance fairness and transpar-
ency in the selection of executive personnel and in the determination
of compensation issues. The Nominating Committee and the Assess-
ment Committee each meet once a year in principle.
Board of AuditorsJGC has adopted the “company with internal auditors” model to
preserve the effectiveness of corporate governance by strengthening
the framework of conducting audits by corporate auditors. At pres-
ent, the Board of Auditors has five corporate auditors, including
three outside appointments. In collaboration with the Internal Audit
department and the accounting auditor, corporate auditors attend
meetings of the Board of Directors and other important meetings,
offer necessary comments when appropriate, and further improve
corporate governance through hearings regarding the business
execution of the Company’s divisions and through surveys of domes-
tic and overseas offices and plants.
Independent AuditorThe certified public accountants who audit JGC’s accounts are
Kazutoshi Isogai and Yoshihisa Uchida of KPMG AZSA LLC. Four
other CPAs and nine other individuals assist in carrying out these
audits.
Status of the Internal Control SystemInternal Control SystemJGC has established an Internal Auditing Office to monitor, evaluate
and improve the effectiveness of the internal control systems of JGC
and of the Group as a whole, as well as to carry out individual audits
where necessary. Additionally, JGC has created management author-
ity regulations that specify the authority and responsibilities of all
management personnel, thereby clarifying the system of account-
ability for corporate management and executive functions. JGC has
also established Group management regulations for each Group
member firm.
Improving Our Corporate Value by Fulfilling Our Social ResponsibilitiesJGC is keenly aware of the importance of proper corporate governance. Recognizing the need to foster that awareness in our
corporate culture and climate, we have formulated the JGC Corporate Philosophy. Through awareness-raising, education and train-
ing, we will work to win the public’s trust and maintain harmony with society in our corporate activities.
Under the JGC Corporate Philosophy, we are working to increase corporate value and realize the principles set out in this philoso-
phy while keeping corporate social responsibility in mind. At the same time, we make it a rule to strive for fairness and transpar-
ency in our corporate activities, in accordance with our Code of Conduct.
Corporate Governance
31 JGC Corporationannual report 2012
ComplianceIn order to conduct sustainable business development as a member
of the international community, JGC believes that it is essential for
each and every employee to conduct business in conformity with
corporate ethical standards, as well as to observe local laws and
regulations not only in Japan but also overseas. To this end, JGC has
formulated a Corporate Philosophy for the entire JGC Group, a docu-
ment on Principles of Business Conduct, and a Code of Conduct
manual. JGC also educates and trains employees on various laws
and regulations, as part of its efforts to raise employees’ compliance
awareness.
JGC recognizes that the bar is being raised in terms of the
compliance level expected of global corporations. In order to respond
to the demands of international society, JGC is strengthening its
internal compliance system by expanding its specialist departments
responsible for compliance.
Based on recognition of the importance of building a compliance
framework that also encompasses JGC Group companies in Japan
and overseas, JGC fosters close contact with compliance officers at
each company, and endeavors to establish various regulations and
share information so as to put in place and operate an effective
system for the entire JGC Group.
Corporate Information DisclosureJGC discloses information in accordance with the statutory disclo-
sure system based on the Japanese Financial Instruments and
Exchange Act. In addition, in accordance with the timely disclosure
system at Japanese financial instruments exchanges, JGC promptly
discloses important company information through its Public Rela-
tions & Investor Relations Dept. JGC also proactively discloses corpo-
rate information falling outside the scope of such regulations and
system through news organizations and other media, in cases where
it determines that disclosure is desirable.
Status of the Risk Management System<Corporate Risk Management>
JGC has established a Risk Management Committee as part of a
comprehensive risk management system designed to systematically
identify risks throughout the Group, particularly company risk such
as risks related to management, disasters, incidents and society. The
Risk Management Committee meets as necessary.
<Project Risk Management>
Project risk management is conducted in three broad stages: 1) the
project selection stage, 2) the estimate and bidding stage, and 3) the
execution stage.
1) Project Selection StageThe Global Marketing Division is constantly gathering a wide range of
project information based on various factors such as region, client,
and technical field, and activities to obtain orders are conducted
based on the study and evaluation of the following points:
· Project size (value)
· Technical expertise and experience required
· Country risk
· Allocation of engineers
· Competitive environment, etc.
The results of these studies and evaluations are used in determining
JGC’s level of interest in the respective projects.
2) Estimate and Bidding StageA Project Risk Review Meeting analyzes project-specific risks. The
main risk management items are as follows:
· Clarity of the project plan and scope of responsibility
· Client’s project funding plan and project execution policy
· Level of technology required and degree of difficulty
· Price and supply-demand trends for materials, machinery and labor
· Degree of difficulty in meeting deadlines
· Existence of excessive contractual obligations
· Competitiveness of bidding environment
· Appropriateness of the project execution plan
A detailed estimate policy is drawn up and an estimate is created
based on this risk analysis.
3) Execution StageProblems and other matters affecting the budget and timing that
occur during execution of the project are reported in a timely
manner, and problem areas are analyzed.
If improvement is needed, quick and smooth project manage-
ment is supported through instructions and assistance designed to
bring about appropriate improvements.
<Crisis Management>
Regarding crisis management, JGC has established a Security
Management Section to gather and process information related to
risk management, conduct risk management training, and respond
to any urgent issues that arise.
<Handling of Personal Information>
The JGC Group has established a Personal Information Protection
Policy and Personal Information Protection Regulations to build a
system for managing personal information centered on those
employees with duties that involve the handling of this information.
32 JGC Corporationannual report 2012
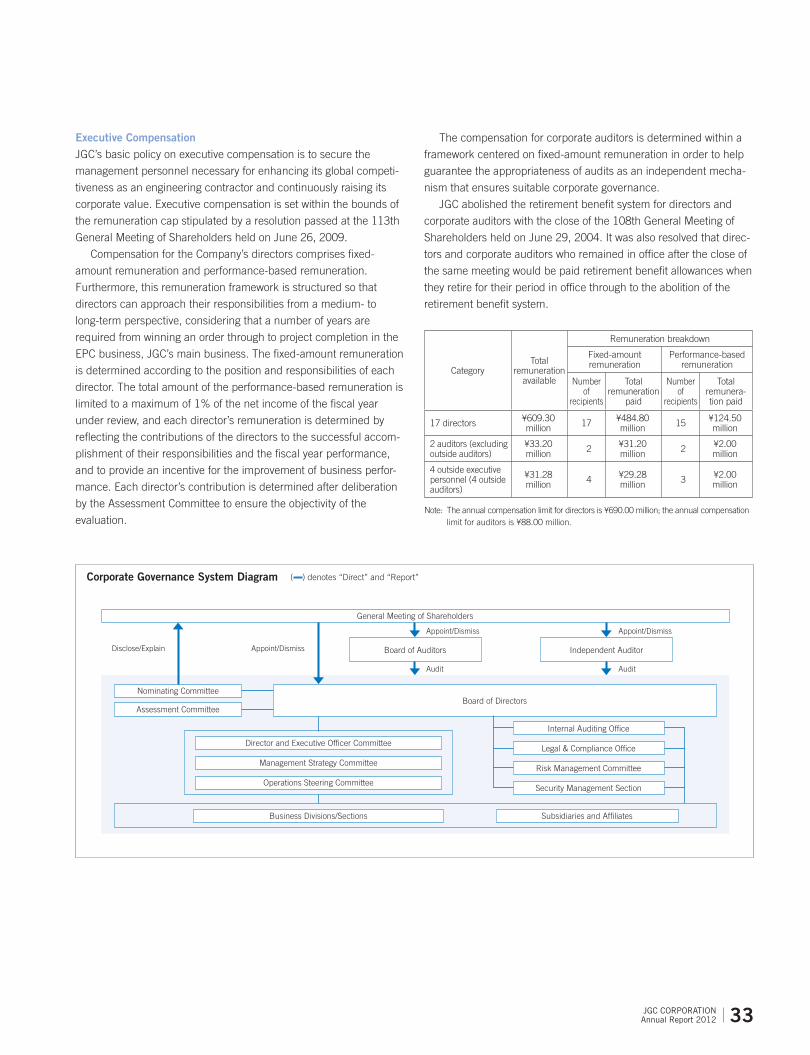
General Meeting of Shareholders
Board of Auditors Independent Auditor
Appoint/Dismiss
Appoint/Dismiss
Audit
Appoint/Dismiss
Audit
Board of DirectorsNominating Committee
Assessment Committee
Internal Auditing Office
Legal & Compliance Office
Risk Management Committee
Security Management Section
Director and Executive Officer Committee
Management Strategy Committee
Operations Steering Committee
Disclose/Explain
Business Divisions/Sections Subsidiaries and Affiliates
Corporate Governance System Diagram ( ) denotes “Direct” and “Report”
Executive CompensationJGC’s basic policy on executive compensation is to secure the
management personnel necessary for enhancing its global competi-
tiveness as an engineering contractor and continuously raising its
corporate value. Executive compensation is set within the bounds of
the remuneration cap stipulated by a resolution passed at the 113th
General Meeting of Shareholders held on June 26, 2009.
Compensation for the Company’s directors comprises fixed-
amount remuneration and performance-based remuneration.
Furthermore, this remuneration framework is structured so that
directors can approach their responsibilities from a medium- to
long-term perspective, considering that a number of years are
required from winning an order through to project completion in the
EPC business, JGC’s main business. The fixed-amount remuneration
is determined according to the position and responsibilities of each
director. The total amount of the performance-based remuneration is
limited to a maximum of 1% of the net income of the fiscal year
under review, and each director’s remuneration is determined by
reflecting the contributions of the directors to the successful accom-
plishment of their responsibilities and the fiscal year performance,
and to provide an incentive for the improvement of business perfor-
mance. Each director’s contribution is determined after deliberation
by the Assessment Committee to ensure the objectivity of the
evaluation.
The compensation for corporate auditors is determined within a
framework centered on fixed-amount remuneration in order to help
guarantee the appropriateness of audits as an independent mecha-
nism that ensures suitable corporate governance.
JGC abolished the retirement benefit system for directors and
corporate auditors with the close of the 108th General Meeting of
Shareholders held on June 29, 2004. It was also resolved that direc-
tors and corporate auditors who remained in office after the close of
the same meeting would be paid retirement benefit allowances when
they retire for their period in office through to the abolition of the
retirement benefit system.
CategoryTotal
remuneration available
Remuneration breakdown
Fixed-amount remuneration
Performance-based remuneration
Number of
recipients
Total remuneration
paid
Number of
recipients
Total remunera-tion paid
17 directors ¥609.30 million 17 ¥484.80
million 15 ¥124.50 million
2 auditors (excluding outside auditors)
¥33.20 million 2 ¥31.20
million 2 ¥2.00 million
4 outside executive personnel (4 outside auditors)
¥31.28 million 4 ¥29.28
million 3 ¥2.00 million
Note: The annual compensation limit for directors is ¥690.00 million; the annual compensation limit for auditors is ¥88.00 million.
33 JGC Corporationannual report 2012
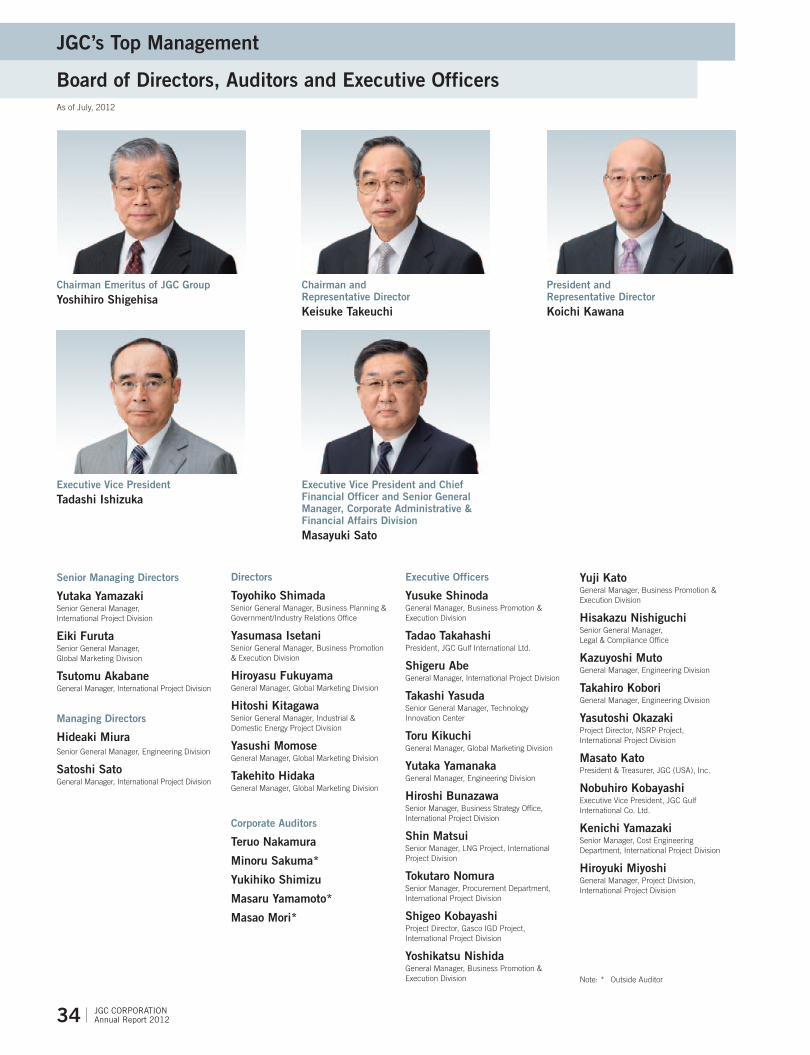
Chairman Emeritus of JGC Groupyoshihiro Shigehisa
Chairman and Representative DirectorKeisuke Takeuchi
Executive Vice PresidentTadashi Ishizuka
Executive Vice President and Chief Financial Officer and Senior General Manager, Corporate Administrative & Financial Affairs DivisionMasayuki Sato
President and Representative DirectorKoichi Kawana
Senior Managing Directors
yutaka yamazakiSenior General Manager, International Project Division
Eiki FurutaSenior General Manager, Global Marketing Division
Tsutomu AkabaneGeneral Manager, International Project Division
Managing Directors
Hideaki MiuraSenior General Manager, Engineering Division
Satoshi SatoGeneral Manager, International Project Division
Directors
Toyohiko ShimadaSenior General Manager, Business Planning & Government/Industry Relations Office
yasumasa IsetaniSenior General Manager, Business Promotion & Execution Division
Hiroyasu FukuyamaGeneral Manager, Global Marketing Division
Hitoshi KitagawaSenior General Manager, Industrial & Domestic Energy Project Division
yasushi MomoseGeneral Manager, Global Marketing Division
Takehito HidakaGeneral Manager, Global Marketing Division
Corporate Auditors
Teruo Nakamura
Minoru Sakuma*
yukihiko Shimizu
Masaru yamamoto*
Masao Mori*
Executive Officers
yusuke ShinodaGeneral Manager, Business Promotion & Execution Division
Tadao Takahashi President, JGC Gulf International Ltd.
Shigeru AbeGeneral Manager, International Project Division
Takashi yasudaSenior General Manager, Technology Innovation Center
Toru KikuchiGeneral Manager, Global Marketing Division
yutaka yamanakaGeneral Manager, Engineering Division
Hiroshi BunazawaSenior Manager, Business Strategy Office, International Project Division
Shin MatsuiSenior Manager, LNG Project, International Project Division
Tokutaro NomuraSenior Manager, Procurement Department, International Project Division
Shigeo KobayashiProject Director, Gasco IGD Project, International Project Division
yoshikatsu NishidaGeneral Manager, Business Promotion & Execution Division
yuji KatoGeneral Manager, Business Promotion & Execution Division
Hisakazu NishiguchiSenior General Manager, Legal & Compliance Office
Kazuyoshi MutoGeneral Manager, Engineering Division
Takahiro KoboriGeneral Manager, Engineering Division
yasutoshi OkazakiProject Director, NSRP Project, International Project Division
Masato KatoPresident & Treasurer, JGC (USA), Inc.
Nobuhiro KobayashiExecutive Vice President, JGC Gulf International Co. Ltd.
Kenichi yamazakiSenior Manager, Cost Engineering Department, International Project Division
Hiroyuki Miyoshi General Manager, Project Division, International Project Division
Note: * Outside Auditor
JGC’s Top Management
Board of Directors, Auditors and Executive OfficersAs of July, 2012
34 JGC Corporationannual report 2012

Financial Section
Contents
36 Six-Year Summary—Consolidated
37 Analysis of Performance and Financial Position
41 Risks Impacting Operations
42 Consolidated Balance Sheets
44 Consolidated Statements of Income
45 Consolidated Statements of Comprehensive Income
46 Consolidated Statements of Changes in Net Assets
47 Consolidated Statements of Cash Flows
48 Notes to Consolidated Financial Statements
65 Internal Control Report
66 Independent Auditor’s Report
67 Six-Year Summary—Non-Consolidated
68 Non-Consolidated Balance Sheets
70 Non-Consolidated Statements of Income
71 Non-Consolidated Statements of Changes in Net Assets
72 Notes to Non-Consolidated Financial Statements
78 Independent Auditor’s Report
35 JGC Corporationannual report 2012

Six-Year Summary—ConsolidatedFor the six years ended March 31. Yen amounts are in millions except per share data.
2012 2011 2010 2009 2008 2007
Net Sales ¥ 556,967 ¥ 447,223 ¥414,258 ¥450,912 ¥551,062 ¥608,530
Operating Income 67,054 63,559 41,919 52,003 44,896 26,413
Net Income 39,111 25,478 27,112 31,543 30,020 20,187
Total Current Assets 376,173 319,464 283,538 335,220 324,617 327,333
Total Current Liabilities 205,772 174,293 137,728 208,023 217,339 237,586
Working Capital 170,401 145,171 145,810 127,197 107,278 89,747
Current Ratio 182.8% 183.3% 205.9% 161.1% 149.4% 137.8%
Net Property and Equipment 64,887 64,634 66,058 66,509 68,450 67,220
Total Assets 526,169 468,503 430,176 480,279 466,773 470,286
Long-Term Debt, Less Current Maturities 7,591 6,624 21,926 23,255 17,300 17,799
Total Net Assets 291,042 264,483 246,141 224,488 207,537 189,239
New Contracts 793,278 618,203 733,549 506,135 402,352 301,347
Outstanding Contracts 1,441,612 1,163,256 982,594 671,341 632,827 744,679
Net Income per Share (in yen) 154.90 100.83 107.25 124.76 118.33 79.52
Cash Dividends per Share (in yen) 38.50 30.0 21.0 30.0 21.0 15.0
Number of Employees 6,524 5,826 5,795 5,739 4,723 4,531
36 JGC Corporationannual report 2012

Our View of the Operating EnvironmentThe global economy remained uncertain during the fiscal year under review primarily because of the continued risk of a downturn in business conditions, mainly due to the negative impact in financial terms of the governmental debt crises in some countries in Europe. Japan’s economy showed signs of picking up after the Great East Japan Earthquake, but the high yen and the slowdown in the overseas economy meant the situation with the Japanese economy remained challenging.
In oil and gas producing countries, which have the greatest impact on the JGC Group’s total engineering business, invest-ment continued in oil and gas resources, and oil refining, gas chemicals and other projects were planned with the aim of adding value to oil and gas. These developments were due to increasing energy demand against the backdrop of a growing global population and economic growth in emerging countries. In Asia and Oceania, it is expected that there will be increasing LNG demand even in countries like China and India, as well as Japan, South Korea and Taiwan. As a result, many LNG pro-jects are in the planning phase.
Under these conditions, in the fiscal year under review, the Group’s total engineering business won orders that included the two projects of construction of an LNG plant in Australia and construction of a crude oil processing facility in Algeria. As a result, orders received were higher than the Group’s initial target. Paying close attention to the various risks involved, the Group worked to steadily implement projects, including those currently being carried out.
Results of OperationsConsolidated net sales for the Group in the year ended March 31, 2012 were ¥556,967 million, up 24.5% year on year. Con-solidated operating income rose 5.5% to ¥67,054 million. Consolidated net income increased 53.5% to ¥39,111 million.
Net SalesReflecting steady progress in projects accounted for on a percentage of completion basis, consolidated net sales increased ¥109,744 million year on year to ¥556,967 million.
Cost of Sales and Selling, General and Administrative ExpensesCost of sales was ¥470,227 million, increasing ¥104,403 million year on year in line with higher net sales. Selling, general and administrative expenses increased ¥1,846 million to ¥19,686 million.
Operating IncomeOperating income increased ¥3,495 million to ¥67,054 million in line with higher net sales. The operating income ratio was 12.0%, compared with 14.2% in the previous fiscal year.
Other Income (Expenses)Other expenses, net increased ¥15,213 million to ¥4,425 million, compared with a loss of ¥10,788 million in the previous fiscal year. The main reasons for the increase were the settlement expenses that were generated in the previous fiscal year. As a result, income before taxes on income and minority interests in earnings of consolidated subsidiaries rose ¥18,708 million year on year to ¥71,479 million.
Taxes on IncomeIncome tax and other taxes increased ¥1,912 million to ¥25,405 million. This increase reflected an increase in income before taxes on income and minority interests in earnings of consolidated subsidiaries. Deferred taxes on income were ¥6,483 mil-lion, meaning tax expenses (net) came to ¥31,888 million.
Analysis of Performance and Financial Position
37 JGC Corporationannual report 2012

Minority Interest in Earnings (Losses) of Consolidated SubsidiariesMinority interests, primarily consisting of earnings allocated to minority shareholders of consolidated subsidiary JGC-ITC Rabigh Utility Co., Ltd., were ¥480 million, an improvement of ¥200 million year on year.
Net IncomeAs a result of the above, net income increased by ¥13,633 million to ¥39,111 million.
Segment InformationReporting SegmentNet sales in the total engineering business rose ¥104,978 million to ¥506,177 million, the result of steady progress with pro-jects accounted for on a percentage of completion basis. Segment income was ¥59,420 million, due to the higher net sales.
Net sales in the catalysts and fine products business increased ¥6,014 million, to ¥42,045 million. The increase reflected rising demand for chemical catalysts, the acquisition of new customers, and expanded demand for cathode materials for lithium-ion batteries. Segment income rose ¥1,858 million, to ¥6,847 million, reflecting the increased sales and reduced fixed expenses. The total engineering business accounted for 91% of net sales and 89% of operating income.
Financial PositionConsolidated total assets at March 31, 2012 totaled ¥526,169 million, a year-on-year increase of ¥57,666 million.
Total liabilities increased ¥31,107 million to ¥235,127 million.Total net assets were ¥291,042 million, up ¥26,559 million year on year.The shareholders’ equity ratio was 55.2%.Balance sheet indicators for the Group were as follows:
Mar. 2010 Mar. 2011 Mar. 2012
Current ratio (%) 206 183 183Fixed asset ratio (%) 60 56 52
Notes: Current ratio: Current assets/current liabilities Fixed asset ratio: Net property and equipment + total other assets/total net assets
*All indicators are calculated using consolidated financial figures.
■ Total Engineering Business■ Catalysts and Fine Products Business
Net Sales by Reporting Segment(Billions of yen)
0
100
200
300
400
500
600
364.8
411.6
508.7
401.1
39.2 37.842.3 36.0
20102008 2009 2011 2012
506.1
42.0
Effective from the year ended March 31, 2011, the Company adopted “Accounting Standard for Disclosures about Segments of an Enterprise and Related Information” and “Guidance on Accounting Standard for Disclosures about Segments of an Enterprise and Related Information.” Figures for the fiscal year ended March 31, 2010 have been retroactively restated.
38 JGC Corporationannual report 2012

Cash FlowCash and cash equivalents on a consolidated basis increased ¥57,124 million to ¥222,556 million.
Net cash provided by operating activities was ¥97,848 million, mainly reflecting ¥71,479 million in income before taxes on income and minority interests in earnings of consolidated subsidiaries, income from an increase in advances received on uncompleted contracts related to projects in hand, the steady collection of accounts receivable, and income taxes paid.
Investing activities used net cash of ¥18,746 million, mainly due to investments in new fields.Financing activities used net cash of ¥20,536 million, mainly for the repayments of long-term bank loans and cash divi-
dends paid.Cash flow indicators for the Group are as follows:
Mar. 2010 Mar. 2011 Mar. 2012
Shareholders’ equity ratio (%) 57.1 56.3 55.2Shareholders’ equity ratio (market basis, %) 98.0 104.9 123.1Years to redemption of liabilities (years) — 0.4 0.1Interest coverage ratio (times) — 86.2 145.3
Notes: Shareholders’ equity ratio: (Total net assets–minority interests)/total assets Shareholders’ equity ratio (market basis): Total market value of shares/total assets Years to redemption of liabilities: Interest-bearing liabilities/net operating cash flow Interest coverage ratio: Net operating cash flow/interest expenses
*All indicators are calculated using consolidated financial figures. * Interest-bearing liabilities include all liabilities posted on the Consolidated Balance Sheets on which interest was paid. Net operating cash flow is
taken from the cash flow provided by operating activities, as reported in the Consolidated Statements of Cash Flows. Interest paid is taken from the amount of interest paid as reported in the Consolidated Statements of Cash Flows.
*Years to redemption of liabilities and interest coverage ratio are not shown for fiscal years in which net cash is negative.
Analysis of New ContractsNew contracts on a consolidated basis totaled ¥793,278 million. This figure exceeded our initial forecast of ¥550,000 million.
A breakdown of new contracts by business sector and region is as follows:
New Contracts by Business Sector(Billions of yen)
Mar. 2011 Mar. 2012
Mar. 2012 Percentage of new contracts
Oil and gas development projects 264.0 53.9 6.8%Petroleum refining projects 67.1 62.6 7.9%LNG projects 180.0 570.9 72.0%Chemical projects 24.8 33.8 4.3%Other projects 82.0 71.8 9.0%
■ Shareholders’ Equity Shareholders’ Equity Ratio
Shareholders’ Equity and Shareholders’ Equity Ratio(Billions of yen/%)
Free Cash Flows(Billions of yen)
2008
10.1
–45.0
13.8
–60
–20
–40
0
20
40
60
80
2009 2010
48.3
2011
79.1
20120
10
20
30
40
60
50
2008
44.446.6
0
50
100
150
250
200
300
2009 2010
223.8
245.8
57.1
207.2
263.9
56.3
2011 2012
55.2
290.4
39 JGC Corporationannual report 2012

Percentage of Region(Billions of yen)
Mar. 2011 Mar. 2012
Mar. 2012 Percentage of new contracts
Japan 114.0 111.5 14.0%Asia 189.6 22.3 2.8%Africa 13.5 37.8 4.8%Middle East 264.9 20.3 2.6%Oceania and Others 36.1 601.2 75.8%
Future OutlookIn the total engineering business, we expect our customers to continue robust capital investment in plant facilities in the Group’s key markets centered on the Middle East, Southeast Asia and Africa, due to increasing energy demand against a backdrop of increasing populations in emerging countries and economic growth. However, the competitive environment is expected to remain severe because of escalating competition to win orders on the part of newly emerging contractors cen-tered on Asia and Europe. Amid these conditions, fiscal 2012, the year ending March 31, 2013, the Group will continue its Company-wide initiatives to strengthen its cost competitiveness in all processes of the EPC business. At the same time, the Group will maintain a solid competitive position in fields where it has a highly competitive edge such as LNG, develop new markets, and steadily execute sophisticated projects such as those that apply modular construction.
In addition, the Group will make business investments in new fields such as urban infrastructure development as well as in electricity generation, new energy fields, the environment and water sectors, and natural resource development.
In the catalysts and fine products business, the business environment is greatly changing, including the prolonged low growth in Europe, the U.S. and Japan, the continued high prices of raw materials and fuel, and the firm establishment of the appreciation of the yen.
In the catalysts business, the JGC Group will work to further improve and expand sales of catalysts that either require no rare earths, which are part of the raw materials of FCC catalysts, or use substantially reduced amounts of rare earths, to strengthen overseas sales systems, and to build a recycling system to avoid procurement and price-change risks with rare earths, the raw materials for our hydrotreating catalysts. In addition, the Group will strive to expand exports and shift to high value-added products in step with the moving overseas of the production bases of chemical catalysts for key customers.
In the fine products business, the Group will work to further reduce costs for cathode (positive-electrode) materials for lithium-ion rechargeable batteries in response to drastically changing markets, and will accelerate the development of next-generation and generation-after-next products. The Group will also aggressively strive to expand sales to overseas markets for optic materials for spectacles and materials for cosmetics, and to expand the Taiwan production bases for abrasives for hard disks and other applications.
40 JGC Corporationannual report 2012

The following matters regarding risks associated with the businesses of the JGC Group could potentially have an effect on the judgments and decisions of investors.
Forward-looking statements are based on the best information available and give consideration to the overall activities of the JGC Group as of March 31, 2012.
1. Risks With Overseas CausesOverseas businesses generate about 70% of the JGC Group’s total net sales. Such businesses are subject to country risks— economic, political and social. These include political unrest, wars, revolutions, civil strife, changes in economic policy, default on foreign debts and changes in exchange and taxation systems. To minimize the effects on its businesses arising from these risks, the JGC Group continuously reviews and reinforces its risk management system, carries trade insurance, recovers receivables as early in a project as possible, forms joint ventures, and takes various other steps. However, when changes in the business environment are more radical than anticipated, and projects are canceled, suspended or delayed, the possibility of a negative impact on JGC’s performance arises.
2. Risks Affecting Project ExecutionAlmost all contracts for projects in which the JGC Group participates are lump sum, full-turnkey contracts. However, to enable hedging of some of the risks in these contracts, the Group uses cost-plus-fee contracts and contracts based on the cost dis-closure estimate method, depending on the project. The Group draws fully upon its past experience to anticipate and incorpo-rate into each contract provisions for dealing with the risks that threaten to arise during its execution. When confronted with unforeseen impediments to the execution of a project, including sudden steep rises in the costs of materials, equipment, machinery and labor, outbreaks of disease, natural disasters, or if the JGC Group’s actions or a problem during project execu-tion should cause a major accident, the economics of a project can be adversely affected, which can have a negative impact on the JGC Group’s performance.
3. Risks Affecting Investing ActivitiesThe JGC Group invests in resource development businesses including oil, gas, and new fuels, as well as water and power generation businesses, and the global warming gas-emissions credits business. In making these decisions, new investments and reinvestments are conducted and existing businesses are monitored to ensure the execution of appropriate risk manage-ment. However, unanticipated dramatic changes in the investing environment, such as sudden price fluctuations in oil, gas or other energy resources and changes in estimated reserves, can have a negative impact on the JGC Group’s performance.
4. Risks of Changes in Exchange RatesAlmost all of the income from JGC Group sales generated by overseas business is paid in foreign currencies. To hedge the associated exchange rate risk, we have introduced countermeasures including signing project contracts denominated in multiple currencies, conducting overseas procurement, ordering in overseas currencies, and entering into foreign exchange contracts. However, sudden exchange rate fluctuations could negatively affect the JGC Group’s performance.
Risks Impacting Operations
41 JGC Corporationannual report 2012

Millions of yen
Thousands of U.S. dollars
(Note 1)
Assets 2012 2011 2012
Current Assets:
Cash and deposits (Notes 13 & 18) ¥195,056 ¥131,894 $2,373,233
Marketable securities (Notes 9, 13 & 18) 27,500 30,000 334,591
Notes and accounts receivable (Notes 2, 15 & 18) 87,248 108,810 1,061,540
Inventories (Note 4) 36,862 24,348 448,497
Deferred tax assets (Note 12) 11,516 10,240 140,114
Other current assets (Notes 2, 10 & 18) 18,097 14,273 220,185
Allowance for doubtful accounts (Note 1 (v)) (106) (101) (1,289)
Total Current Assets 376,173 319,464 4,576,871
Property and Equipment (Note 3):
Land (Notes 14 , 17 & 19 ) 25,998 26,459 316,316
Buildings and structures (Note 17) 58,516 58,785 711,960
Machinery and equipment 51,052 47,205 621,146
Construction in progress 2,430 821 29,566
Other (Note 19) 1,655 1,494 20,136
139,651 134,764 1,699,124
Less accumulated depreciation (74,764) (70,130) (909,648)
Net Property and Equipment 64,887 64,634 789,476
Other Assets:Investments in unconsolidated subsidiaries and affiliates (Note 9) 36,920 36,147 449,203
Marketable and investment securities (Notes 9 & 18) 29,952 29,967 364,424
Long-term loans receivable (Notes 2 & 18) 1,598 1,780 19,443
Deferred tax assets (Note 12) 4,486 10,304 54,581
Other (Note 19) 12,153 6,207 147,864
Total Other Assets 85,109 84,405 1,035,515
Total Assets ¥526,169 ¥468,503 $6,401,862
The accompanying notes are an integral part of these statements.
Consolidated Balance SheetsJGC CORPORATION March 31, 2012 and 2011
42 JGC Corporationannual report 2012

Millions of yen
Thousands of U.S. dollars
(Note 1)
Liabilities and Net Assets 2012 2011 2012
Current Liabilities:
Short-term loans and current maturities of long-term debt (Note 3) ¥ 1,498 ¥ 14,439 $ 18,226
Notes and accounts payable (Notes 2 & 18) 82,376 70,762 1,002,263
Advances received on uncompleted contracts 66,035 25,819 803,443
Reserve for job warranty costs 2,176 312 26,475
Reserve for losses on contracts 5,089 526 61,918
Income taxes payable 14,662 18,710 178,392
Other current liabilities (Notes 2, 10 & 18) 33,936 43,725 412,897
Total Current Liabilities 205,772 174,293 2,503,614
Long-Term Debt, Less Current Maturities (Notes 3 & 18) 7,591 6,624 92,359
Retirement and Severance Benefits (Note 6) 13,695 14,623 166,626
Deferred Tax Liabilities for Land Revaluation (Notes 12 & 14) 3,692 3,783 44,920
Other Non-Current Liabilities (Notes 2 & 12) 4,377 4,697 53,255
Total Liabilities 235,127 204,020 2,860,774
Contingencies (Note 7)
Net Assets (Note 8):
Shareholders’ Equity
Common stock
Authorized — 600,000,000 shares,
Issued — 259,052,929 shares in 2012 and 2011 23,511 23,511 286,057
Capital surplus 25,603 25,603 311,510
Retained earnings 255,323 224,347 3,106,497
Treasury stock, at cost (6,257) (6,169) (76,129)
Total Shareholders’ Equity 298,180 267,292 3,627,935
Accumulated Other Comprehensive Income (Loss)
Net unrealized holding gains on securities (Notes 9 & 18) 2,319 3,338 28,215
Deferred gains on hedges (Note 10) 39 2,519 475
Land revaluation, net of deferred tax portion (Note 14) (6,542) (6,553) (79,596)
Foreign currency translation adjustments (3,581) (2,613) (43,570)
Total Accumulated Other Comprehensive Income (Loss) (7,765) (3,309) (94,476)
Minority Interests 627 500 7,629
Total Net Assets 291,042 264,483 3,541,088
Total Liabilities and Net Assets ¥526,169 ¥468,503 $6,401,862
43 JGC Corporationannual report 2012

Consolidated Statements of IncomeJGC CORPORATION Years ended March 31, 2012, 2011 and 2010
Millions of yen
Thousands of U.S. dollars
(Note 1)
2012 2011 2010 2012
Net Sales (Note11) ¥556,967 ¥447,223 ¥414,258 $6,776,579
Cost of Sales 470,227 365,824 353,906 5,721,219
Gross profit 86,740 81,399 60,352 1,055,360
Selling, General and Administrative Expenses 19,686 17,840 18,433 239,519
Operating income 67,054 63,559 41,919 815,841
Other Income (Expenses):
Interest and dividend income 4,681 2,672 1,814 56,953
Interest expense (502) (659) (684) (6,108)
Loss on sales and disposal of property and equipment (688) (109) (98) (8,371)
Loss on impairment of fixed assets (Note19) (420) — (3,649) (5,110)
Loss on devaluation of marketable and investment securities — (197) — —
Exchange loss, net (Note 1 (v)) (686) (4,707) (3,615) (8,347)
Equity in earnings of affiliates 1,177 2,153 2,556 14,320
Gain on sales of marketable and investment securities 16 10,593 518 195
Gain on revision of pension plan — — 426 —
Provision for doubtful accounts (Note 1 (v)) — 44 (1,496) —
Provision for retirement and severance benefits — — (138) —
Other, net 847 (20,578) 297 10,307
4,425 (10,788) (4,069) 53,839
Income before taxes on income and minority interests in earnings of
consolidated subsidiaries 71,479 52,771 37,850 869,680
Taxes on Income (Note 12):
Current 25,405 23,493 12,431 309,101
Deferred 6,483 3,520 (1,576) 78,878
Income before minority interests 39,591 25,758 26,995 481,701
Minority Interests in (Earnings) Losses of Consolidated Subsidiaries (480) (280) 117 (5,840)
Net Income ¥ 39,111 ¥ 25,478 ¥ 27,112 $ 475,861
YenU.S. dollars
(Note 1)
Amounts Per Share of Common Stock
Net income ¥ 154.90 ¥ 100.83 ¥ 107.25 $ 1.88
Cash dividends applicable to the year ¥ 38.50 ¥ 30.00 ¥ 21.00 $ 0.47
The accompanying notes are an integral part of these statements.
44 JGC Corporationannual report 2012

Consolidated Statements of Comprehensive IncomeJGC CORPORATION Years ended March 31, 2012, 2011 and 2010
Millions of yen
Thousands of U.S. dollars
(Note 1)
2012 2011 2010 2012
Income Before Minority Interests ¥39,591 ¥25,758 ¥26,995 $481,701
Other Comprehensive Income (Loss) (Note 20)
Net unrealized holding gains on securities (Notes 9 & 18) (1,019) (1,750) 2,606 (12,398)
Deferred gains (losses) on hedges (Note 10) (2,480) (193) 3,739 (30,174)
Land revaluation (Note 14) 63 — — 767
Translation adjustments (968) (862) (274) (11,778)
Equity for equity method affiliates (1) 1,230 253 (12)
Total Other Comprehensive Income (Loss) ¥ (4,405) ¥ (1,575) ¥ 6,324 $ (53,595)
Total Comprehensive Income ¥35,186 ¥24,183 ¥33,319 $428,106
Comprehensive Income attributable to JGC corporation ¥34,706 ¥23,903 ¥33,434 $422,266
Comprehensive Income (loss) attributable to minority interest ¥ 480 ¥ 280 ¥ (115) $ 5,840
The accompanying notes are an integral part of these statements.
Effective from the year ended March 31, 2011, the new accounting standards for presentation of comprehensive income (ASBJ Statement No. 25) have been adopted and certain prior year amounts have been reclassified to conform to the current year presentation.
45 JGC Corporationannual report 2012

Consolidated Statements of Changes in Net AssetsJGC CORPORATION Years ended March 31, 2012, 2011 and 2010
Thousands of shares Millions of yen
Common stock
Capital surplus
Retained earnings
Treasury stock, at cost
Net unrealized holding gains
(losses) on securities
(Notes 9 & 18)
Deferred gains
(losses) on hedges
(Note 10)
Land revaluation,
net of deferred tax portion
(Note 14)
Foreign currency
translation adjustments
Minority interestsShares Amount
Balance at April 1, 2009 259,053 ¥ 23,511 ¥ 25,599 ¥ 188,547 ¥ (5,671) ¥ 2,481 ¥ (1,027) ¥ (6,590) ¥ (2,962) ¥ 600Net income for the year 27,112Effect of change in scope of consolidation (3,861) (518)Cash dividends (7,584)Gain on retirement of treasury stock 2 2Land revaluation, net of deferred tax portion (37) 37Net unrealized holding gains on securities 2,606Net deferred gains on hedges 3,739Foreign currency translation adjustments 500Increase of treasury stock (66)Net changes during the year (279)
Balance at March 31 and April 1, 2010 259,053 ¥ 23,511 ¥ 25,601 ¥ 204,177 ¥ (5,735) ¥ 5,087 ¥ 2,712 ¥ (6,553) ¥ (2,980) ¥ 321Net income for the year 25,478Effect of change in scope of consolidation 1,229Cash dividends (5,308)Gain on retirement of treasury stock 2 2Land revaluation, net of deferred tax portionNet unrealized holding losses on securities (1,749)Net deferred losses on hedges (193)Foreign currency translation adjustments (862)Increase of treasury stock (436)Net changes during the year 179
Balance at March 31 and April 1, 2011 259,053 ¥ 23,511 ¥ 25,603 ¥ 224,347 ¥ (6,169) ¥ 3,338 ¥ 2,519 ¥ (6,553) ¥ (2,613) ¥ 500Net income for the year 39,111Effect of change in scope of consolidation (611) (322)Cash dividends (7,576)Gain on retirement of treasury stock 0 0Land revaluation, net of deferred tax portion 52 11Net unrealized holding losses on securities (1,019)Net deferred losses on hedges (2,480)Foreign currency translation adjustments (646)Increase of treasury stock (88)Net changes during the year 127
Balance at March 31, 2012 259,053 ¥23,511 ¥25,603 ¥255,323 ¥(6,257) ¥ 2,319 ¥ 39 ¥(6,542) ¥(3,581) ¥ 627
Thousands of U.S. dollars (Note 1)
Common stock
Capital surplus
Retained earnings
Treasury stock, at cost
Net unrealized holding gains
(losses) on securities
(Notes 9 & 18)
Deferred gains
(losses) on hedges
(Note 10)
Land revaluation,
net of deferred tax portion
(Note 14)
Foreign currency
translation adjustments
Minority interests
Balance at April 1, 2011 $ 286,057 $ 311,510 $ 2,729,614 $ (75,058) $ 40,613 $ 30,648 $ (79,730) $ (31,792) $ 6,083Net income for the year 475,861Effect of change in scope of consolidation (7,434) (3,918)Cash dividends (92,177)Gain on retirement of treasury stock 0 0Land revaluation, net of deferred tax portion 633 134Net unrealized holding losses on securities (12,398)Net deferred losses on hedges (30,173)Foreign currency translation adjustments (7,860)Increase of treasury stock (1,071)Net changes during the year 1,546
Balance at March 31, 2012 $286,057 $311,510 $3,106,497 $(76,129) $ 28,215 $ 475 $(79,596) $(43,570) $7,629
The accompanying notes are an integral part of these statements.
46 JGC Corporationannual report 2012

Consolidated Statements of Cash FlowsJGC CORPORATION Years ended March 31, 2012, 2011 and 2010
Millions of yen
Thousands of U.S. dollars
(Note 1)2012 2011 2010 2012
Cash Flows from Operating Activities:Income before taxes on income and minority interests in earnings of consolidated subsidiaries ¥ 71,479 ¥ 52,771 ¥ 37,850 $ 869,680
Adjustments to reconcile income before taxes on income and minority interests in earnings of consolidated subsidiaries to net cash provided by operating activities:Depreciation and amortization 7,795 7,517 9,134 94,841Amortization of goodwill 0 (6) 391 0Increase (decrease) in allowance for doubtful accounts (Note 1 (v)) (208) (2,271) 780 (2,531)Increase (decrease) in reserve for losses on contracts 4,572 380 (1,689) 55,627Decrease in retirement and severance benefits (954) (1,056) (375) (11,607)Interest and dividend income (4,681) (2,672) (1,814) (56,953)Interest expense 502 659 684 6,108Exchange (gain) loss (Note 1 (v)) 1,211 3,788 (15) 14,734Equity in earnings of affiliates (1,177) (2,153) (2,556) (14,320)Gain on sales of marketable and investment securities (16) (10,593) (518) (195)Loss on devaluation of marketable and investment securities — 197 — —Loss on sales and disposal of property and equipment 689 109 98 8,383Loss on impairment of fixed assets (Note 19) 420 — 3,649 5,110Decrease (increase) in notes and accounts receivable 22,433 (21,343) (14,973) 272,941Decrease (increase) in inventories (12,158) 12,451 25,377 (147,926)Decrease (increase) in other assets (6,425) 4,474 (5,560) (78,173)Increase (decrease) in notes and accounts payable 9,678 11,450 (22,014) 117,752Increase (decrease) in advances received on uncompleted contracts 38,408 (20,948) (34,735) 467,307Other (9,096) 21,633 (3,404) (110,670)
Subtotal 122,472 54,387 (9,690) 1,490,108Interest and dividends received 5,537 6,783 4,854 67,368Interest paid (673) (559) (925) (8,188)Income taxes paid (29,488) (12,396) (19,419) (358,778)
Net Cash Provided by (Used in) Operating Activities 97,848 48,215 (25,180) 1,190,510
Cash Flows from Investing Activities:Payments for purchases of property and equipment (8,055) (3,252) (4,766) (98,005)Proceeds from sales of property and equipment 732 57 121 8,906Payments for purchase of intangible fixed assets (7,695) (1,179) (2,540) (93,625)Payments for purchase of marketable and investment securities (3,989) (8,652) (12,494) (48,534)Proceeds from sales of marketable and investment securities 443 13,740 942 5,390Decrease in short-term loans receivable 30 72 28 365Payments for long-term loans receivable — (802) (528) —Proceeds from long-term loans receivable — 56 171 —Other (212) 76 (758) (2,578)
Net Cash Provided by (Used in) Investing Activities (18,746) 116 (19,824) (228,081)
Cash Flows from Financing Activities:Increase in short-term loans 541 — — 6,582Proceeds from long-term bank loans 1,600 — — 19,467Repayments of long-term bank loans (14,414) (1,339) (737) (175,374)Repayments of finance lease obligation (250) (234) (59) (3,042)Payments for purchase of treasury stock (88) (432) (62) (1,070)Cash dividends paid (7,572) (5,296) (7,579) (92,128)Cash dividends paid to minority shareholders (353) (16) (20) (4,295)Other — — (437) —
Net Cash Provided by (Used in) Financing Activities (20,536) (7,317) (8,894) (249,860)
Effect of Exchange Rate Changes on Cash and Cash Equivalents (1,442) (2,928) 2,290 (17,545)Net Increase (Decrease) in Cash and Cash Equivalents 57,124 38,086 (51,608) 695,024Cash and Cash Equivalents at Beginning of Year 161,894 123,808 174,282 1,969,753Increase in Cash and Cash Equivalents from Newly Consolidated Subsidiaries 3,538 — 1,134 43,047Cash and Cash Equivalents at End of Year (Note 13) ¥222,556 ¥161,894 ¥123,808 $2,707,824
The accompanying notes are an integral part of these statements.
47 JGC Corporationannual report 2012

Notes to Consolidated Financial Statements
Note 1 — Summary of Accounting Policies(a) Basis of Presenting Consolidated Financial StatementsThe accompanying consolidated financial statements of JGC Corporation (Nikki
Kabushiki Kaisha, the Company) and its consolidated subsidiaries have been
prepared in accordance with the provisions set forth in the Japanese Financial
Instruments and Exchange Law and its related accounting regulations, and in
conformity with accounting principles generally accepted in Japan (“Japanese
GAAP”), which are different in certain respects as to application and disclosure
requirements from International Financial Reporting Standards.
Prior to the year ended March 31, 2009, the accounts of consolidated
overseas subsidiaries were based on their accounting records maintained in
conformity with generally accepted accounting principles prevailing in the
respective countries of domicile. As discussed in Note 1 (e), the accounts of
consolidated overseas subsidiaries for the year ended March 31, 2010 were
prepared in accordance with either International Financial Reporting Stan-
dards or U.S. generally accepted accounting principles, with adjustments for
the specified six items as applicable. The accompanying consolidated financial
statements have been restructured and translated into English (with some
expanded descriptions) from the consolidated financial statements of the
Company prepared in accordance with Japanese GAAP and filed with the
appropriate Local Finance Bureau of the Ministry of Finance as required by
the Japanese Financial Instruments and Exchange Law. Certain supplemen-
tary information included in the statutory Japanese language consolidated
financial statements, but not required for fair presentation, is not presented in
the accompanying consolidated financial statements.
The translation of the Japanese yen amounts into U.S. dollars is included
solely for the convenience of readers outside Japan, using the prevailing
exchange rate at March 31, 2012, which was ¥82.19 to U.S.$1 The conve-
nience translations should not be construed as representations that the
Japanese yen amounts have been, could have been, or could in the future be,
converted into U.S. dollars at this or any other rate of exchange.
(b) Reporting EntityThe consolidated financial statements include the accounts of the Company
and its significant subsidiaries that include less than 50% owned affiliates
controlled through substantial ownership of majority voting rights or existence
of substantial control. All significant inter-company transactions and account
balances are eliminated in consolidation.
Investments in non-consolidated subsidiaries and affiliates over which the
Company has the ability to exercise significant influence over operating and
financial policies of the investees are accounted for by the equity method.
The number of consolidated subsidiaries and affiliates accounted for
using the equity method at March 31, 2012, 2011 and 2010, was as follows:
2012 2011 2010
Consolidated subsidiaries 16 14 14
Affiliates under the equity method 2 2 3
Investments in non-consolidated subsidiaries and affiliates not accounted
for by the equity method are carried at cost, adjusted for any substantial and
non-recoverable decline in value. The effect on net income (loss) and
retained earnings from those investments not accounted for under the equity
method is immaterial.
At the year ended March 31, 2012, three of subsidiaries, JGC Gulf Interna-
tional Co. Ltd., JGC Exploration Eagle Ford LLC, and JGC OCEANIA PTY LTD
were included in the scope of consolidation because their effect on the consoli-
dated financial statement became significant and Nikki Construction Co., Ltd.
was excluded from the scope of consolidation because the company merged
into JGC Project Services Co., Ltd. (The company name after the merger : JGC
PLANT SOLUTIONS., LTD.) and liquidated during the period.
At the year ended March 31, 2011, one of affiliates, M. W. Kellogg Limited
was excluded from the scope of equity method because the Company sold out
all securities.
However, equity in earnings of M. W. Kellogg Limited before selling date
was included in consolidated statements of income for the year ended March
31, 2011.
On March 10, 2008, the Accounting Standards Board of Japan issued
ASBJ Statement No. 16 “Accounting Standard for Equity Method of Account-
ing for Investments’’ and PITF No. 24 “Practical Solution on Unification of
Accounting Policies Applied to Associates Accounted for Using the Equity
Method.” This standard is effective from the year ended March 31, 2011.
There were no effects of this change on the consolidated financial statements
for the year ended March 31, 2011.
(c) Consolidated Statements of Cash FlowsIn preparing the consolidated statements of cash flows, cash on hand, readily
available deposits and short-term highly liquid investments with negligible risk
of changes in value, and maturities not exceeding three months at the time of
purchase are considered to be cash and cash equivalents.
(d) Conversion of Foreign Currencies and Translation of Statements
Receivables and payables denominated in foreign currencies are translated
into Japanese yen at the year-end rates.
Balance sheets of consolidated overseas subsidiaries are translated into
Japanese yen at the year-end rates except for net assets accounts, which are
translated at the historical rates. Income statements of consolidated overseas
subsidiaries are translated at average rates except for transactions with the
Company, which are translated at the rates used by the Company.
(e) Unification of Accounting Policies Applied to Foreign Subsidiaries for Consolidated Financial Statements
On March 17, 2006, the Accounting Standards Board of Japan issued ASBJ
Practical Issues Task Force No. 18 “Practical Solution on Unification of
Accounting Policies Applied to Foreign Subsidiaries for Consolidated Financial
Statements” (“PITF No. 18”). PITF No. 18 requires that accounting policies
and procedures applied by a parent company and its subsidiaries to similar
48 JGC Corporationannual report 2012

transactions and events under similar circumstances should, in principle, be
unified for the preparation of the consolidated financial statements. PITF No.
18, however, as a tentative measure, allows a parent company to prepare
consolidated financial statements using foreign subsidiaries’ financial state-
ments prepared in accordance with either International Financial Reporting
Standards or U.S. generally accepted accounting principles. In this case,
adjustments for the following five items are required in the consolidation
process so that their impacts on net income are accounted for in accordance
with Japanese GAAP unless the impact is not material.
(1) Goodwill not subjected to amortization
(2) Actuarial gains and losses of defined benefit plans recognized outside
profit or loss
(3) Capitalized expenditures for research and development activities
(4) Fair value measurement of investment properties, and revaluation of
property, plant and equipment, and intangible assets
(5) Accounting for net income attributable to minority interests
There were no material effects from adopting PITF No. 18 on the consoli-
dated financial statements for the year ended March 31, 2012.
(f) Allowance for Doubtful AccountsNotes and accounts receivable, including loans and other receivable, are
valued by providing individually estimated uncollectible amounts plus the
amounts for probable losses calculated by applying a percentage based on
collection experience to the remaining accounts.
(g) Marketable Securities, Investments in Unconsolidated Subsidiaries and Affiliates, and Marketable and Investment Securities
The companies are required to examine the intent of holding each security and
classify those securities as (1) securities held for trading purposes, (2) debt
securities intended to be held to maturities, (3) equity securities issued by
subsidiaries and affiliates, and (4) all other securities that are not classified in
any of the above categories (hereafter, “available-for-sale securities”). The
Company and its domestic consolidated subsidiaries did not have the securities
defined as (1) and (2) above in the years ended March 31, 2012 and 2011.
Available-for-sale securities with available fair market values are stated at
fair market value. Unrealized gains and losses on these securities are reported,
net of applicable income taxes, as a separate component of net assets. Real-
ized gains and losses on the sale of such securities are computed using the
moving-average method. Other securities with no available fair market value
are stated at moving-average cost. Equity securities issued by subsidiaries and
affiliates, which are not consolidated or accounted for using the equity
method, are stated at moving-average cost.
If the market value of available-for-sale securities declines significantly,
such securities are restated at fair market value and the difference between
fair market value and the carrying amount is recognized as loss in the period
of decline (See Note 9). For equity securities with no available fair market
value, if the net asset value of the investee declines significantly, such securi-
ties are required to be written down to the net asset value with the
corresponding losses in the period of decline. In these cases, such fair market
value or the net asset value will be the carrying amount of the securities at the
beginning of the next year.
(h) Recognition of Sales, Contract Works in Progress and Advances Received on Uncompleted Contracts
On December 27, 2007, the Accounting Standards Board of Japan issued
ASBJ Statement No. 15, “Accounting Standard for Construction Contracts”
and ASBJ Guidance No. 18, “Guidance on Accounting Standard for Construc-
tion Contracts.” The new accounting standards require that if the construction
activity deemed certain during the course of the activity, the percentage-of-
completion method shall be applied (the percentage of the cost incurred to the
estimated total cost), otherwise the completed-contract method shall be
applied. This standard is effective from the year ended March 31, 2010.
As a result, Net Sales increased by ¥2,407 million and Gross Profit,
Operating Income, and Income before taxes on income and minority interests
in earnings of consolidated subsidiaries increased by ¥318 million, respec-
tively for the year ended March 31, 2010.
Prior to the year ended March 31, 2010, the Company recognized sales
on contracts using the completed-contract method except for long term con-
tract. Under this method, costs and advances received on uncompleted
contracts are accumulated during the period of construction. These costs and
advances received on uncompleted contracts are not offset and are shown as
contract works in progress and advances received on uncompleted contracts
in the accompanying consolidated balance sheets. Accordingly, no profits or
losses are recorded before the contract is completed.
Sales on other contracts for relatively large projects, which require long
periods for completion and which generally include engineering, procurement
(components, parts, etc.) and construction on a full-turnkey basis, are recog-
nized on the percentage-of-completion method, primarily based on contract
costs incurred to date compared with total estimated costs for contract com-
pletion. The percentage-of-completion method is adopted for large jobs for
which the construction period exceeds 24 months and the contract amount
exceeds ¥5,000 million (including jobs whose construction period exceeds 36
months and the contract amount exceeds ¥3,000 million). Revisions in con-
tract revenue and cost estimates are recognized in the period in which they
are determined.
Contract works in progress are stated at cost determined by a specific
identification method and comprised of direct materials, components and
parts, direct labor, subcontractors’ fees and other items directly attributable to
the contract, and job-related overheads. Selling, general and administrative
expenses are charged to operations as incurred and are not allocated to
contract job work costs.
The Company normally receives payments from customers on a progress
basis in accordance with the terms of the respective construction contracts.
49 JGC Corporationannual report 2012

(i) InventoriesPrior to April 1, 2008, Inventories of the Company and its consolidated subsid-
iaries were stated at cost determined using the moving-average method except
for contract works in progress as stated Note 1(h).
(j) Operating CycleAssets and liabilities related to long-term contract jobs are included in current
assets and current liabilities in the accompanying consolidated balance
sheets, as they will be liquidated in the normal course of contract completion,
although it may require more than one year.
(k) Property and Equipment, Depreciation and Finance Leases
Property and equipment are stated at cost, except for certain revalued land as
explained in Note 14. Depreciation of property and equipment is calculated
primarily using the straight-line method for buildings used for business opera-
tion, and the declining-balance method for other property and equipment
over the estimated useful lives of the assets based on the Corporate Tax Code
of Japan.
On March 31, 2008, the Accounting Standards Board of Japan issued
ASBJ Statement No. 18, “Accounting Standard for Asset Retirement Obliga-
tions” and ASBJ Guidance No. 21, “Guidance on Accounting Standard for
Asset Retirement Obligations”. The new accounting standards require compa-
nies to recognize an asset retirement obligation as a liability and include the
asset retirement cost corresponding to it in the cost of a tangible fixed asset.
This standard is effective from the year ended March 31, 2011.
As a result, Operating income decreased by ¥29 million, income before
taxes on income and minority interests in earnings of consolidated subsidiaries
decreased by ¥50 million, respectively for the year ended March 31, 2011.
And the effect of adopting this accounting standard for asset retirement obliga-
tion was ¥80 million.
All finance leasing transactions were capitalized except for finance leases
which commenced prior to April 1, 2008 and have been accounted for as
operating leases, continue to be accounted for as operating leases with disclo-
sure of “as if capitalized” information.
Expenditures for new facilities and those that substantially increase the
useful lives of existing property and equipment are capitalized. Maintenance,
repair and minor renewals are charged to expenses as incurred.
The cost and accumulated depreciation applicable to assets retired or
otherwise disposed of are eliminated from the related accounts and the gain or
loss on disposal is credited or charged to income.
(l) Imparment of Fixed AssetsThe Company and its consolidated subsidiaries review their long-lived assets
for impairment whenever events or changes in circumstances indicate the
carrying amount of an asset or asset group may not be recoverable. An impair-
ment loss would be recognized if the carrying amount of an asset or asset
group exceeds the sum of the undiscounted future cash flows expected to
result from the continued use and eventual disposition of the asset or asset
group. The impairment loss would be measured as the amount by which the
carrying amount of the asset exceeds its recoverable amount, which is the
higher of the discounted cash flows from the continued use and eventual
disposition of the asset or the net selling price at disposition.
(m) Retirement and Severance Benefits and Pension Costs(1) Employees’ severance and retirement benefits
The Company and its consolidated subsidiaries provide two types of post-
employment benefit plans, unfunded lump-sum payment plans and
funded non-contributory pension plans, under which all eligible employees
are entitled to benefits based on the level of wages and salaries at the time
of retirement or termination, length of service and certain other factors.
Some consolidated subsidiaries also have a defined contribution
pension plan, which was transferred from a portion of defined benefit
pension plan.
The Company and its consolidated subsidiaries provided allowance for
employees’ severance and retirement benefits at March 31, 2012 and
2011, based on the estimated amounts of projected benefit obligation,
actuarially calculated using certain assumptions and the fair value of the
plan assets at that date.
The estimated amount of all retirement benefits to be paid at the
future retirement date is allocated equally to each service year using the
estimated number of total service years.
The Company and its consolidated subsidiaries recognize prior service
costs as expenses in equal amounts over the average of the estimated
remaining service lives of the employees, and actuarial gains and losses as
expenses using the declining-balance method over the average of the
estimated remaining service lives commencing in the following period.
However, some consolidated subsidiaries recognized, prior service
costs, and actuarial differences as expenses in the period incurred.
Effective from the year ended March 31, 2010, the Company and
consolidated domestic subsidiaries adopted the “Partial Amendments to
Accounting Standard for Retirement Benefits (Part 3)” (Accounting Stan-
dards Board of Japan (“ASBJ”) Statement No. 19 issued on July 31,
2008). The new accounting standard requires domestic companies to use
the rate of return on long-term government or gilt-edged bonds as of the
end of the fiscal year for calculating the projected benefit obligation of a
defined-benefit plan. Previously, domestic companies were allowed to use
a discount rate determined taking into consideration fluctuations in the
yield of long-term government and gilt-edged bonds over a certain period.
This change had no material impact on the consolidated financial state-
ments for the year ended March 31, 2010.
From the year ended March 31, 2010 one consolidated domestic
subsidiary changed the calculation method about allowance for employees’
severance and retirement benefit from accounting for 100% of the lump-
sum retirement benefits to actuarially calculation.
As a result, income before income taxes on income and minority
interests in earnings of consolidated subsidiaries decreased by ¥138
50 JGC Corporationannual report 2012

million for the year ended March 31, 2010.
On July1, 2009, one consolidated domestic subsidiary unified its
employees’ severance and retirement benefits to the defined benefit pen-
sion plan. The transfer is accounted for in accordance with the “Guidance
on Accounting Standard for Transfer between Retirement Benefit Plans”
(Accounting Standards Board of Japan Guidance No. 1).
On April 1, 2011, one consolidated domestic subsidiary transferred its
employees’ severance and retirement benefits to the defined benefit pen-
sion plan. And one consolidated domestic subsidiary terminated its defined
benefit pension plan due to the merger. These transfers are accounted for
in accordance with the “Guidance on Accounting Standard for Transfer
between Retirement Benefit Plans” (Accounting Standards Board of Japan
Guidance No. 1).
(2) Officers’ severance and retirement benefits
Domestic consolidated subsidiaries provide for liabilities in respect of
lump-sum severance and retirement benefits to directors and corporate
statutory auditors computed on the assumption that all officers retired at a
year-end.
(n) Research and Development CostsResearch and development costs for the improvement of existing skills and
technologies or the development of new skills and technologies, including
basic research and fundamental development costs, are charged to operations
in the period incurred. The total amount of research and development
expenses, included in Cost of Sales and Selling, General and Administrative
expenses, was ¥5,042 million ($61,346 thousand), ¥4,998 million, and
¥5,009 million, respectively, in 2012, 2011 and 2010.
(o) Taxes on IncomeThe Company and its consolidated subsidiaries provide tax effects of temporary
differences between the carrying amounts and the tax basis of assets and liabili-
ties. The asset and liability approach is used to recognize deferred tax assets and
liabilities for the expected future tax consequences of temporary differences.
(p) Reserve For Job Warranty CostsA reserve for the estimated cost of warranty obligations is provided for the
Company’s engineering, procurement and construction work at the time the
related sales on contracts are recorded.
(q) Reserve for Losses on ContractsA reserve for losses on contracts is provided for an estimated amount of prob-
able losses to be incurred in future years in respect of construction projects
in progress.
(r) Per Share InformationCash dividends per share have been presented on an accrual basis and
include dividends to be approved after the balance sheet date but applicable
to the year then ended.
(s) Amortization of GoodwillGoodwill is amortized over five years on a straight-line basis, and either debited
to the Selling, General and Administrative Expenses, or credited to other income.
(t) Derivatives and Hedge AccountingThe accounting standard for financial instruments requires companies to state
derivative financial instruments at fair value and to recognize changes in the
fair value as gains or losses unless the derivative financial instruments are
used for hedging purposes.
If derivative financial instruments are used as hedges and meet certain
hedging criteria, the Company and its domestic consolidated subsidiaries defer
recognition of gains or losses resulting from changes in fair value of derivative
financial instruments until the related losses or gains on the hedged items
are recognized.
However, in cases where forward foreign exchange contracts are used as
hedges and meet certain hedging criteria, forward foreign exchange contracts
and hedged items are accounted for in the following manner (Allocation Method):
(1) If a forward foreign exchange contract is executed to hedge an existing
foreign currency receivable or payable,
(i) The difference, if any, between the Japanese yen amount of the hedged
foreign currency receivable or payable translated using the spot rate at
the inception date of the contract and the book value of the receivable
or payable is recognized in the statement of income in the period which
includes the inception date, and
(ii) The discount or premium on the contract (that is, the difference between
the Japanese yen amount of the contract translated using the contracted
forward rate and that translated using the spot rate at the inception date
of the contract) is recognized over the term of the contract.
(2) If a forward foreign exchange contract is executed to hedge a future trans-
action denominated in a foreign currency, the future transaction will be
recorded using the contracted forward rate, and no gains or losses on the
forward foreign exchange contract are recognized.
Also, where interest rate swap contracts are used as hedges and meet
certain hedging criteria, the net amount to be paid or received under the
interest rate swap contract is added to or deducted from the interest on the
assets or liabilities for which the swap contract was executed (Special method
for interest rate swap).
(u) Accrued Bonuses to Directors and Corporate AuditorsThe company and consolidated subsidiaries recognize director’s and corporate
auditor’s bonuses as expenses when incurred.
(v) Reclassification and RestatementCertain prior year amounts have been reclassified to conform to the current
year presentation except for the reclassification between provision for doubtful
accounts and exchange gain or loss described below.
51 JGC Corporationannual report 2012

The Company changed the recognition of exchange differences about foreign
currencies’ doubtful accounts from provision for doubtful accounts to exchange
gain or loss from the year ended March 31, 2011, due to proper presentation of
provision for doubtful accounts without the effect of exchange fluctuation.
These reclassifications had no impact on previously reported results of
operations or retained earnings.
(w) Accounting Changes and Error CorrectionsOn December 4, 2009, the Accounting Standards Board of Japan issued
ASBJ Statement No. 24, “Accounting Standard for Accounting Changes and
Error Corrections” and ASBJ Guidance No. 24, “Guidance on Accounting
Standard for Accounting Changes and Error Corrections.” Accounting treat-
ments under the new accounting standard are as follows:
(1) Change in Accounting Policies
When a new accounting policy is applied with revision of accounting
standards, the new policy is applied retrospectively unless revised account-
ing standards include specific transitional provisions. When revised
accounting standards include specific transitional provisions, an entity
shall comply with the specific transitional provisions.
(2) Changes in Presentations
When the presentation of financial statements is changed, prior period finan-
cial statements are reclassified in accordance with the new presentation.
(3) Changes in Accounting Estimates
A change in an accounting estimate is accounted for in the period of the
change if the change affects that period only, and is accounted for prospec-
tively if the change affects both the period of the change and future periods.
(4) Corrections of Prior Period Errors
When an error in prior period financial statements is discovered, those
statements are restated.
This accounting standard and the guidance are applied to accounting
changes and corrections of prior period errors which are made from the begin-
ning of the fiscal year that begins on or after April 1, 2011.
Note 2 — Receivables From and Payables to Unconsolidated Subsidiaries and Affiliates
Significant receivables from and payables to unconsolidated subsidiaries and
affiliates at March 31, 2012 and 2011, were as follows:
Millions of yen
Thousands of U.S. dollars
(Note 1)
March 31, 2012 2011 2012
Notes and accounts receivable ¥7,039 ¥7,875 $85,643Other current assets 2,731 2,234 33,228Long-term loans receivable 1,400 1,550 17,034Notes and accounts payable 940 3,254 11,437Other current liabilities 796 119 9,685Other non-current liabilities 11 3 134
Note 3 — Borrowings and Assets Pledged as CollateralShort-term loans consisted mainly of unsecured notes and bank overdrafts
and bore interest at the annual rates of 0.80% and 0.95% at March 31, 2012
and 2011, respectively. Such loans are generally renewable at maturity.
Long-term debt consisted of the following:
Millions of yen
Thousands of U.S. dollars
(Note 1)
March 31, 2012 2011 2012
Secured Loans0.55% – 1.75% loans from a governmental institution due serially through 2014 ¥ 402 ¥ 951 $ 4,891
Unsecured Debt0.74% – 3.00% loans from banks and insurance companies due serially through 2016 8,176 20,086 99,477
8,578 21,037 104,368Less current maturities (987) (14,413) (12,009)
Long-term debt due after one year ¥7,591 ¥ 6,624 $ 92,359
Assets pledged as collateral for long-term debt and other non-current
liabilities at March 31, 2012 and 2011, were as follows:
Millions of yen
Thousands of U.S. dollars
(Note 1)
March 31, 2012 2011 2012
Land ¥ 5,071 ¥ 5,071 $ 61,699Buildings and structures, at net book value 3,248 3,427 39,518
Machinery and equipment, at net book value 2,522 2,896 30,685
Total ¥10,841 ¥11,394 $131,902
The annual maturities of long-term debt outstanding at March 31, 2012,
were as follows:
Amount
Year ending March 31, Millions of yen
Thousands of U.S. dollars
(Note 1)
2013 ¥ 987 $ 12,009
2014 5,726 69,668
2015 283 3,443
2016 82 998
2017 and thereafter 1,500 18,250
Total ¥8,578 $104,368
52 JGC Corporationannual report 2012

Note 4 — InventoriesInventories at March 31, 2012 and 2011, were summarized as follows:
Millions of yen
Thousands of U.S. dollars
(Note 1)
March 31, 2012 2011 2012
Inventories:
Contract works in progress ¥25,705 ¥14,616 $312,751Finished goods and merchandise 5,630 5,279 68,500Works in process 1,991 1,614 24,224Raw materials and others 3,536 2,839 43,022
Total ¥36,862 ¥24,348 $448,497
Note 5 — Lease TransactionsA. Lessee Leases(a) Finance Lease Transactions Without
Ownership Transfer to LesseeFinance leases commenced prior to April 1, 2008 which do not transfer own-
ership of leased assets to lessees are accounted for as operating leases.
Assumed amounts of acquisition cost and accumulated depreciation at
March 31, 2012 and 2011 were as follows:
(1) Purchase price equivalents, accumulated depreciation equivalents, and
book value equivalents
Millions of yen
Thousands of U.S. dollars
(Note 1)
March 31, 2012 2011 2012
Machinery and equipment and others:
Purchase price equivalents ¥ 527 ¥ 688 $ 6,412Accumulated depreciation equivalents (332) (411) (4,039)
Book value equivalents ¥ 195 ¥ 277 $ 2,373
Purchase price equivalents are calculated using the inclusive-of-
interest method.
(2) Lease commitments
Millions of yen
Thousands of U.S. dollars
(Note 1)
March 31, 2012 2011 2012
Due within one year ¥ 58 ¥ 82 $ 706Due after one year 137 195 1,667
Total ¥195 ¥277 $2,373
Lease commitments as lessee are calculated using the inclusive-of-
interest method.
(3) Lease payments and depreciation equivalents
Millions of yen
Thousands of U.S. dollars
(Note 1)
Year ended March 31, 2012 2011 2010 2012
Lease payments ¥81 ¥151 ¥243 $986Depreciation equivalents 81 151 243 986
(4) Calculation method of depreciation equivalents
Depreciation equivalents are computed by the straight-line method over the
lease period without considering residual value.
(b) Operating Lease TransactionsLease commitments under non-cancelable operating leases:
Millions of yen
Thousands of U.S. dollars
(Note 1)
March 31, 2012 2011 2012
Due within one year ¥594 ¥ 613 $ 7,227Due after one year 364 463 4,429
Total ¥958 ¥1,076 $11,656
B. Lessor Leases(a) Finance Lease Transactions Without
Ownership Transfer to Lessee, Whose Transaction Date Was After April 1, 2008.
(1) Details of Investment in Leased assets
Millions of yen
Thousands of U.S. dollars
(Note 1)
March 31, 2012 2011 2012
Lease payment receivable ¥80 ¥86 $973Estimated residual value — — —Interest Income — — —
Book value ¥80 ¥86 $973
(2) As at March 31, 2012, the investment in leased assets due in each of the
next five years was as follows:
Amount
Year ending March 31, Millions of yen
Thousands of U.S. dollars
(Note 1)
2013 ¥28 $341
2014 26 316
2015 16 195
2016 9 109
2017 1 12
Total ¥80 $973
(b) Finance Lease Transactions Without Ownership Transfer to Lessee, Whose Transaction Date Was Before March 31, 2008.
Finance leases commenced prior to April 1, 2008 which do not transfer own-
ership of leased assets to lessees are accounted for as operating leases.
Assumed amounts of acquisition cost and accumulated depreciation at
March 31, 2012 and 2011 were as follows:
53 JGC Corporationannual report 2012

(1) Purchase price, accumulated depreciation and book value
Millions of yen
Thousands of U.S. dollars
(Note 1)
March 31, 2012 2011 2012
Machinery and equipment and others:
Purchase price ¥ 4 ¥ 15 $ 49Accumulated depreciation (3) (13) (37)
Book value ¥ 1 ¥ 2 $ 12
(2) Lease commitments
Millions of yen
Thousands of U.S. dollars
(Note 1)
March 31, 2012 2011 2012
Due within one year ¥1 ¥2 $12Due after one year — 0 —
Total ¥1 ¥2 $12
Lease commitments as lessor were calculated using the inclusive-of-
interest method.
(3) Rental income and depreciation
Millions of yen
Thousands of U.S. dollars
(Note 1)
Year ended March 31, 2012 2011 2010 2012
Rental income ¥2 ¥14 ¥38 $24Depreciation 2 9 30 24
Note 6 — Retirement and Severance BenefitsThe liabilities for employees’ severance and retirement benefits included in
retirement and severance benefits in the liability section of the consolidated
balance sheets as of March 31, 2012 and 2011 consisted of the following:
Millions of yen
Thousands of U.S. dollars
(Note 1)
March 31, 2012 2011 2012
Projected benefit obligation ¥ 44,500 ¥ 44,946 $ 541,428Less fair value of pension assets (27,555) (26,509) (335,259)
Unfunded projected benefit obligation 16,945 18,437 206,169
Less unrecognized net transition obligation (13) (13) (158)
Unrecognized actuarial differences (4,664) (5,490) (56,747)Unrecognized prior service costs 1,093 1,350 13,298
Net liability for employees’ severance and retirement benefits 13,361 14,284 162,562
Allowance for officers’ lump-sum severance benefits 334 339 4,064
Retirement and severance benefits ¥ 13,695 ¥ 14,623 $ 166,626
Included in the consolidated statements of income for the years ended
March 31, 2012 and 2011, were severance and retirement benefit expenses
comprising the following:
Millions of yen
Thousands of U.S. dollars
(Note 1)
March 31, 2012 2011 2012
Service costs — benefits earned during the year ¥1,667 ¥1,690 $20,282
Interest cost on projected benefit obligation 691 705 8,407
Expected return on plan assets (384) (389) (4,672)Amortization of net transition obligation 3 3 37
Amortization of actuarial differences 936 1,020 11,388Amortization of prior service costs (217) (211) (2,640)Contribution for defined contribution pension plan 141 107 1,716
Severance and retirement benefit expenses ¥2,837 ¥2,925 $34,518
The discount rate used by the Company and its domestic consolidated
subsidiaries was 1.5%–2.0% at March 31, 2012 and 2011. However, one
overseas consolidated subsidiary used the rate of 6.5% and 8.5 % at March 31,
2012 and 2011 respectively. The rate of expected return on plan assets used by
the Company and its domestic consolidated subsidiaries was 1.5% for March
31, 2012 and 2011. However, some overseas consolidated subsidiaries used
the rate of 7.0% at March 31, 2012 and 2011. Actuarial differences are recog-
nized in consolidated statements of income using the declining-balance method
over 12 years to 15 years and 12 years to 16 years for the years ended March
31, 2012 and 2011, respectively, beginning the following fiscal year of recogni-
tion. Prior service costs are recognized using the straight line method over 12
years or 15 years for the years ended March 31, 2012 and 2011, from the fiscal
year incurred. Net transition obligation is amortized over 15years.
Note 7 — Contingencies(1) It is a business practice in Japan for a company to guarantee the indebted-
ness of certain of its trading agents, suppliers, subcontractors and certain
subsidiaries and affiliates. The aggregate amount of such guarantees were
¥15,520 million ($188,831 thousand) and ¥18,446 million at March 31,
2012 and 2011, respectively.
(2) The Company and one consolidated subsidiary have guaranteed employees’
housing loans and others from banks in the amount of ¥5 million ($61
thousand) and ¥11 million at March 31, 2012 and 2011, respectively.
Note 8 — Net AssetsUnder the Japanese Corporation Law (“the Law”) and regulations, the entire
amount paid for new shares is required to be designated as common stock.
However, a company may, by a resolution of the Board of Directors, designate
an amount not exceeding one-half of the price of the new shares as additional
paid-in capital, which is included in capital surplus.
54 JGC Corporationannual report 2012

In cases where dividend distribution of surplus is made, the smaller of an
amount equal to 10% of the dividend or the excess, if any, of 25% of common
stock over the total of additional paid-in capital and legal earnings reserve
must be set aside as additional paid-in capital or legal earnings reserve.
Legal earnings reserve is included in retained earnings in the accompany-
ing consolidated balance sheets.
Additional paid-in capital and legal earnings reserve may not be distrib-
uted as dividends. However, all additional paid-in capital and all legal earnings
reserve may be transferred to other capital surplus and retained earnings,
respectively, which are potentially available for dividends.
The maximum amount that the Company can distribute as dividends is
calculated based on the non-consolidated financial statements of the Company
in accordance with the Law.
At the annual shareholders’ meeting of the Company held on June 28,
2012, the shareholders approved cash dividends amounting to ¥9,720 million
($118,263 thousand). Such appropriations have not been accrued in the
consolidated financial statements as of March 31, 2012. Such appropriations
are recognized in the period in which they are approved by the shareholders.
Note 9 — Information on SecuritiesA. The following tables summarize acquisition costs and book values stated at
the fair value of securities with available fair values as of March 31, 2012
and 2011.
Available-for-Sale Securities With Available Fair Values:(1) Securities with book values exceeding acquisition costs:
Millions of yen
March 31, 2012 Acquisition cost Book value Difference
Equity securities ¥9,490 ¥15,087 ¥5,597
Millions of yen
March 31, 2011 Acquisition cost Book value Difference
Equity securities ¥9,121 ¥15,971 ¥6,850
Thousands of U.S. dollars (Note 1)
March 31, 2012 Acquisition cost Book value Difference
Equity securities $115,464 $183,563 $68,099
(2) Securities with book values not exceeding acquisition costs:
Millions of yen
March 31, 2012 Acquisition cost Book value Difference
Equity securities ¥4,032 ¥3,168 ¥(864)
Millions of yen
March 31, 2011 Acquisition cost Book value Difference
Equity securities ¥4,405 ¥3,911 ¥(494)
Thousands of U.S. dollars (Note 1)
March 31, 2012 Acquisition cost Book value Difference
Equity securities $49,057 $38,545 $(10,512)
B. The following tables summarize book values of securities with no available
fair values or securities not valued by fair market prices as of March 31,
2012 and 2011.
(a) Available-for-Sale Securities:
Millions of yen
Thousands of U.S. dollars
(Note 1)
March 31, 2012 2011 2012
Non-listed equity securities ¥11,659 ¥10,046 $141,854Subscription certificate 38 39 462
Negotiable certificate of deposit 27,500 30,000 334,591
Total ¥39,197 ¥40,085 $476,907
(b) Unconsolidated Subsidiaries and Affiliates:
Millions of yen
Thousands of U.S. dollars
(Note 1)
March 31, 2012 2011 2012
Securities of unconsolidated subsidiaries ¥ 5,886 ¥ 6,940 $ 71,615
Securities of affiliates 31,034 29,207 377,588
Total ¥36,920 ¥36,147 $449,203
C. Available-for-sale securities with maturities are as follows:
Millions of yen
March 31, 2012 Within
one year
Over one year
but within five years
Over five years but within ten years
Over ten years Total
Negotiable certificate of deposit ¥27,500 ¥— ¥— ¥— ¥27,500
Millions of yen
March 31, 2011 Within
one year
Over one year
but within five years
Over five years but within ten years
Over ten years Total
Negotiable certificate of deposit ¥30,000 ¥— ¥— ¥— ¥30,000
Thousands of U.S. dollars (Note 1)
March 31, 2012 Within
one year
Over one year
but within five years
Over five years but within ten years
Over ten years Total
Negotiable certificate of deposit $334,591 $— $— $— $334,591
The Company and its domestic consolidated subsidiaries follow a policy of
devaluation of available-for-sale securities. The policy of devaluation for the
Company and its domestic consolidated subsidiaries is that if the available fair
value of the securities declines by 50% or more, compared with acquisition
cost, all the corresponding securities are devalued as such decline considered
to be substantial and non-recoverable decline in value. In addition, in the case
whereby the available fair value of the securities declines by more than 30%
but by less than 50%, the Company and its domestic consolidated subsidiar-
ies examine the recoverability of the fair value of the securities and devaluate if
those securities are considered to be non-recoverable.
55 JGC Corporationannual report 2012

Note 10 — Derivative Transactions and Hedge AccountingAs explained in Note 1 (t), the accounting standard for financial instruments
requires companies to state derivative financial instruments at fair value and to
recognize changes in the fair value as gains or losses unless derivative finan-
cial instruments are used for hedging purposes.
The Company utilizes foreign currency forward contracts and interest rate
swap contracts as derivative financial instruments only for the purpose of miti-
gating future risks of fluctuation of foreign currency exchange rates with respect
to foreign currency receivable and payable and mitigating future risks of interest
rate increases and lowering the financing costs with respect to borrowings.
Foreign currency forward contracts and interest rate swap contracts
are subject to risks of foreign exchange rate changes and interest rate
changes, respectively.
The derivative transactions are executed and managed in accordance
with the established policies and within the specified limit on the amounts of
derivative transactions allowed.
The following summarizes hedging derivative financial instruments used
by the Company and hedged items:
Hedging instruments: Hedged items:
Foreign currency forward
contracts
Foreign currency trade receivable,
payable and future transactions
denominated in a foreign currency
Foreign currency deposit Foreign currency trade receivable,
payable and future transactions
denominated in a foreign currency
Interest rate swap contracts Interest on loans payable
The Company evaluates hedge effectiveness semi-annually by comparing
the cumulative changes in cash flows from or the changes in fair value of
hedged items and the corresponding changes in the hedging derivative instru-
ments. However, where the principal conditions underlying the hedging instru-
ments and the hedged assets or liabilities are similar, the evaluation of hedge
effectiveness is not performed.
The Company’s financial instrument counter-parties were all prime banks
operating domestically in Japan, and the Company does not expect non-
performance by the counter-parties.
(a) Fair Value of Undesignated Derivative Financial Instruments
Fair value of undesignated derivative financial instruments as of March 31,
2012 and 2011 is summarized as follows:
Millions of yen
Contract amounts
March 31, 2012Due within
one yearDue after one year Total Fair value
Profit or loss evaluation
Forward exchange contracts
Sell U.S. dollars ¥23,539 ¥297 ¥23,836 ¥(30) ¥(30)
Millions of yen
Contract amounts
March 31, 2011Due within
one yearDue after one year Total Fair value
Profit or loss evaluation
Forward exchange contracts
Buy Euro ¥72 ¥— ¥72 ¥(4) ¥(4)
Thousands of U.S. dollars (Note 1)
Contract amounts
March 31, 2012Due within
one yearDue after one year Total Fair value
Profit or loss evaluation
Forward exchange contracts
Sell U.S. dollars $286,397 $3,614 $290,011 $(365) $(365)
Fair value of forward exchange contracts is stated based on the quoted
price from banks.
56 JGC Corporationannual report 2012

(b) Fair Value of Derivative Financial Instruments Designated as Hedging Instruments
Fair value of derivative financial instruments designated as hedging instru-
ments as of March 31, 2012 and 2011 is summarized as follows:
Millions of yen
March 31, 2012 Contract amounts
Accounting method
Hedged instruments
Hedged item
Contract amount
Portion over one year Fair value
Allocation method (Note 1 (t))
Forward exchange contracts
Sell U.S. dollars
Accounts receivable ¥13,400 ¥ — ¥(246)
Sell Euro Accounts receivable ¥ 1,643 ¥ — ¥(154)
Buy Euro Accounts payable ¥23,975 ¥9,112 ¥ 463
Special method for interest rate swap (Note 1 (t))
Interest rate swap contracts
Receive variable rate and Pay fixed rate swap
Long-term debt ¥ 822 ¥ 411 *
Millions of yen
March 31, 2011 Contract amounts
Accounting method
Hedged instruments
Hedged item
Contract amount
Portion over one year Fair value
Allocation method (Note 1 (t))
Forward exchange contracts
Sell U.S. dollars
Accounts receivable ¥37,305 ¥ 5,677 ¥3,351
Buy Euro Accounts payable ¥16,082 ¥10,807 ¥ 793
Buy British pound
Accounts payable ¥ 127 ¥ — ¥ 2
Special method for interest rate swap (Note 1 (t))
Interest rate swap contracts
Receive variable rate and Pay fixed rate swap
Long-term debt ¥11,696 ¥ 831 *
Thousands of U.S. dollars (Note 1)
March 31, 2012 Contract amounts
Accounting method
Hedged instruments
Hedged item
Contract amount
Portion over one year Fair value
Allocation method (Note 1 (t))
Forward exchange contracts
Sell U.S. dollars
Accounts receivable $163,037 $ — $(2,993)
Sell Euro Accounts receivable $ 19,990 $ — $(1,874)
Buy Euro Accounts payable $291,702 $110,865 $ 5,633
Special method for interest rate swap (Note 1 (t))
Interest rate swap contracts
Receive floating and Pay fixed rate swap
Long-term debt $ 10,001 $ 5,001 *
Fair value of forward exchange contracts is stated based on the quoted price from banks.* The fair value of the interest rate swap was included in the long term debt.
Note 11 — Segment InformationEffective from the fiscal year ended March 31, 2011, the Company adopted the
“Accounting Standard for Disclosures about Segments of an Enterprise and
Related Information” (Accounting Standards Board of Japan (“ASBJ”) State-
ment No. 17 on March 27, 2009) and the “Guidance on Accounting Standard
for Disclosures about Segments of an Enterprise and Related Information”
(ASBJ Guidance No. 20, issued on March 21, 2008). Certain prior year
amounts have been reclassified to conform to the current year presentation.
(a) Overview of Reported SegmentsThe reported segments of the Company are those units for which separate
financial statements can be obtained among the constituent units of the
Company and regularly examined by Chief Executive Officer (CEO) for deci-
sions on the allocation of management resources and for assessing business
performance. The operations of the Company and its consolidated subsidiaries
are classified into two reportable segments: the total engineering business and
the catalysts and fine products business.
Major activities included in the total engineering business are design,
procurement, construction and performance test services of machinery and
plants for petroleum, petroleum refining, petrochemicals, gas, chemicals,
nuclear energy, metal refining, biochemical, food, pharmaceuticals, medical,
logistics, information technology, environment conservation and pollution
control. Major activities in the catalysts and fine products business include
manufacturing and distribution of chemical and catalyst products (FCC cata-
lysts, hydrotreating catalysts, deNOx catalysts, petrochemical catalysts, etc),
and new functional material products (colloidal silica, coating materials for
surface treatment on cathode ray tubes, material for semiconductors, cathode
materials and cosmetic products, etc.).
57 JGC Corporationannual report 2012

The following was information about sales and profit or loss by reported segment for the years ended March 31, 2012, 2011 and 2010:
Millions of yen
Reported Segment
Year ended March 31, 2012Total
engineeringCatalysts and fine products Subtotal Others Total Adjustment Consolidated
Net sales:
External customers ¥506,177 ¥42,045 ¥548,222 ¥ 8,745 ¥556,967 ¥ — ¥556,967Inter-segment 60 232 292 5,064 5,356 (5,356) —
Total ¥506,237 ¥42,277 ¥548,514 ¥13,809 ¥562,323 ¥ (5,356) ¥556,967
Segment profit ¥ 59,420 ¥ 6,847 ¥ 66,267 ¥ 694 ¥ 66,961 ¥ 93 ¥ 67,054
Segment assets ¥469,453 ¥40,769 ¥510,222 ¥35,828 ¥546,050 ¥(19,881) ¥526,169
Depreciation and amortization ¥ 4,134 ¥ 2,572 ¥ 6,706 ¥ 1,077 ¥ 7,783 ¥ 12 ¥ 7,795
Capital expenditures ¥ 3,600 ¥ 2,919 ¥ 6,519 ¥ 7,274 ¥ 13,793 ¥ — ¥ 13,793
Millions of yen
Reported Segment
Year ended March 31, 2011Total
engineeringCatalysts and fine products Subtotal Others Total Adjustment Consolidated
Net sales:
External customers ¥401,199 ¥36,031 ¥437,230 ¥ 9,993 ¥447,223 ¥ — ¥447,223
Inter-segment 24 13 37 5,097 5,134 (5,134) —
Total ¥401,223 ¥36,044 ¥437,267 ¥15,090 ¥452,357 ¥ (5,134) ¥447,223
Segment profit ¥ 57,688 ¥ 4,989 ¥ 62,677 ¥ 784 ¥ 63,461 ¥ 98 ¥ 63,559
Segment assets ¥421,190 ¥37,135 ¥458,325 ¥28,709 ¥487,034 ¥(18,531) ¥468,503
Depreciation and amortization ¥ 3,660 ¥ 2,480 ¥ 6,140 ¥ 1,368 ¥ 7,508 ¥ 9 ¥ 7,517
Capital expenditures ¥ 4,598 ¥ 1,769 ¥ 6,367 ¥ 358 ¥ 6,725 ¥ (164) ¥ 6,561
Millions of yen
Reported Segment
Year ended March 31, 2010Total
engineeringCatalysts and fine products Subtotal Others Total Adjustment Consolidated
Net sales:
External customers ¥364,830 ¥37,828 ¥402,658 ¥11,600 ¥414,258 ¥ — ¥414,258
Inter-segment 20 13 33 5,062 5,095 (5,095) —
Total ¥364,850 ¥37,841 ¥402,691 ¥16,662 ¥419,353 ¥ (5,095) ¥414,258
Segment profit ¥ 39,310 ¥ 2,583 ¥ 41,893 ¥ (70) ¥ 41,823 ¥ 96 ¥ 41,919
Segment assets ¥382,371 ¥33,601 ¥415,972 ¥32,339 ¥448,311 ¥(18,135) ¥430,176
Depreciation and amortization ¥ 3,617 ¥ 2,840 ¥ 6,457 ¥ 2,708 ¥ 9,165 ¥ (31) ¥ 9,134
Capital expenditures ¥ 4,086 ¥ 720 ¥ 4,806 ¥ 2,272 ¥ 7,078 ¥ (16) ¥ 7,062
Thousands of U.S. dollars (Note 1)
Reported Segment
Year ended March 31, 2012Total
engineeringCatalysts and fine products Subtotal Others Total Adjustment Consolidated
Net sales:
External customers $6,158,620 $511,559 $6,670,179 $106,400 $6,776,579 $ — $6,776,579
Inter-segment 730 2,823 3,553 61,613 65,166 (65,166) —
Total $6,159,350 $514,382 $6,673,732 $168,013 $6,841,745 $ (65,166) $6,776,579
Segment profit $ 722,959 $ 83,307 $ 806,266 $ 8,444 $ 814,710 $ 1,132 $ 815,842
Segment assets $5,711,802 $496,033 $6,207,835 $435,917 $6,643,752 $(241,890) $6,401,862
Depreciation and amortization $ 50,298 $ 31,293 $ 81,591 $ 13,104 $ 94,695 $ 146 $ 94,841
Capital expenditures $ 43,801 $ 35,515 $ 79,316 $ 88,502 $ 167,818 $ — $ 167,818
58 JGC Corporationannual report 2012

(b) Related InformationI. Information by Geography(1) Net Sales
Millions of yen
Thousands of U.S. dollars
(Note 1)
Year ended March 31, 2012 2011 2010 2012
Japan ¥155,501 ¥130,975 ¥168,315 $1,891,970East and Southeast Asia 61,533 32,533 33,911 748,668Middle East 205,429 181,683 141,467 2,499,440Africa 44,343 40,900 30,534 539,518Oceania 72,057 49,901 18,607 876,713Other 18,104 11,231 21,424 220,270
Total sales ¥556,967 ¥447,223 ¥414,258 $6,776,579
*1. Net sales are classified by the place of customers’ address.*2. Middle East includes Saudi Arabia ¥81,067 million ($986,337 thousand), ¥113,595 million, and
¥104,995 million and United Arab Emirates ¥74,329million ($904,356 thousand) , ¥51,281 million, and ¥6,208 million for the years ended March 31, 2012, 2011, and 2010, respectively.
(1) Property and equipment
Property and equipment information is not disclosed, as the Company and its
consolidated subsidiaries operate mainly within Japan.
II. Information by Major Customers
Year ended March 31, 2012 Millions of yen
Thousands of U.S. dollars
(Note 1) Related segments
Abu Dhabi Gas Industries Ltd. 74,281 903,772 Total engineering
III. Information on Impairment LossNot Applicable for the years ended March 31, 2011.
The following is information on impairment loss by reported segments for
the year ended March 31, 2012 and 2010:
Millions of yen
Reported Segment
Year ended March 31, 2012Total
engineering
Catalysts and fine products Subtotal Others Total Adjustment Consolidated
Impairment loss ¥420 ¥— ¥420 ¥— ¥420 ¥— ¥420
Thousands of U.S. dollars (Note 1)
Reported Segment
Year ended March 31, 2012Total
engineering
Catalysts and fine products Subtotal Others Total Adjustment Consolidated
Impairment loss $5,110 $— $5,110 $— $5,110 $— $5,110
Millions of yen
Reported Segment
Year ended March 31, 2010Total
engineering
Catalysts and fine products Subtotal Others Total Adjustment Consolidated
Impairment loss ¥3,603 ¥— ¥3,603 ¥— ¥3,603 ¥— ¥3,603
IV. Information on Amotization of Goodwill and Amotized Balance
This information is not disclosed, as this is immaterial for the years ended
March 31, 2012, 2011 and 2010.
V. Information on Gain on Negative GoodwillNot Applicable for the years ended March 31, 2012, 2011 and 2010.
Note 12 — Taxes on IncomeThe statutory tax rate for 2012 was 40.7%, and for 2011 and 2010 were 36.2%.
(1) The following table summarizes the significant differences between the
statutory tax rate and the Company’s and its consolidated subsidiaries’
effective tax rate for financial statement purposes for the years ended
March 31, 2012, 2011 and 2010:
2012 2011 2010
Statutory tax rate 40.7% 36.2% 36.2%
Non-deductible expenses 0.7 0.2 0.3
Non-taxable dividend income (1.5) (3.0) (3.0)
Tax credit utilized (0.5) (0.7) (1.9)
Other 5.2 18.5 (2.9)
Effective tax rate 44.6% 51.2% 28.7%
(2) Significant components of the Company’s and its consolidated subsidiar-
ies’ deferred tax assets and liabilities as of March 31, 2012 and 2011,
were as follows:
Millions of yen
Thousands of U.S. dollars
(Note 1)
March 31, 2012 2011 2012
Current deferred taxes
Deferred tax assets:
Excess accrued employees’ bonuses ¥ 2,599 ¥ 2,538 $ 31,622
Excess reserve for job warranty costs 812 102 9,880
Excess reserve for losses on contracts 1,801 194 21,913
Other 6,539 9,091 79,558
Total current deferred tax assets 11,751 11,925 142,973
Deferred tax liabilities:
Retained earnings of foreign subsidiaries (44) (164) (535)
Other (191) (1,521) (2,324)
Total current deferred tax liabilities (235) (1,685) (2,859)
Net current deferred tax assets ¥11,516 ¥10,240 $140,114
For the year ended March 31, 2012 and 2011, there was no valuation
allowance.
59 JGC Corporationannual report 2012

Millions of yen
Thousands of U.S. dollars
(Note 1)
March 31, 2012 2011 2012
Non-current deferred taxes
Deferred tax assets:
Employee’s retirement and severance benefits ¥ 4,877 ¥ 5,216 $ 59,338
Depreciation 363 382 4,417Other 751 6,772 9,137
Total non-current deferred tax assets 5,991 12,370 72,892
Deferred tax liabilities:
Net unrealized gains on securities (1,283) (1,895) (15,610)
Other (222) (171) (2,701)
Total non-current deferred tax liabilities (1,505) (2,066) (18,311)
Net non-current deferred tax assets ¥ 4,486 ¥10,304 $ 54,581
Deferred tax liabilities for land revaluation ¥ 3,692 ¥ 3,783 $ 44,920
Deferred tax liabilities for full revaluation of the consolidated subsidiary ¥ 178 ¥ 245 $ 2,166
Others 26 5 316
Non-current deferred tax liabilities ¥ 204 ¥ 250 $ 2,482
For the years ended March 31, 2012 and 2011, the valuation allowances
of ¥6,166 million ($75,021thousand) and ¥225 million have been deducted
from the gross amount of the non-current deferred tax assets, respectively.
(3) Adjustment of deferred tax assets and liabilities for enacted changes in tax
laws and rates
On December 2, 2011, amendments to the Japanese tax regulations were
enacted into law. As a result of these amendments, net Deferred tax assets
and Net unrealized holding gains on securities increased by ¥261 million
($3,176 thousand) and ¥21 million ($256 thousand) as of March 31, 2012 .
And Deferred income tax expense recognized for the year ended March 31,
2012 and Deferred gains on hedges as of March 31, 2012 decreased by ¥241
million ($2,932 thousand) and ¥1 million ($12 thousand).
Note 13 — Notes to the Consolidated Statements of Cash FlowsReconciliation of cash in the consolidated balance sheets and cash and cash
equivalents in the consolidated statements of cash flows was as follows:
Millions of yen
Thousands of U.S. dollars
(Note 1)
March 31, 2012 2011 2010 2012
Cash and deposits ¥195,056 ¥131,894 ¥ 83,308 $2,373,233Marketable securities 27,500 30,000 40,500 334,591
Cash and cash equivalents ¥222,556 ¥161,894 ¥123,808 $2,707,824
Note 14 — Land RevaluationPursuant to Article 2 of the Enforcement Ordinance for the Law Concerning
Land Revaluation (the “Law”) effective March 31, 1998, the Company recorded
its owned land used for business at the fair value as of March 31, 2002, and the
related revaluation difference, net of income taxes, was debited to “Land revalu-
ation, net of deferred tax portion” in the net assets section. The applicable
income tax portion was reported as Deferred Tax Liabilities for Land Revaluation
in the consolidated balance sheet at March 31, 2012 and 2011. When such
land is sold, land revaluation is reversed and debited to retained earnings.
Fair value of the revalued land as of March 31, 2012 was ¥2,919 million
($35,515 thousand) less than the book value as of March 31, 2012, which
amounts include ¥1,227 million ($14,929 thousand) relevant to rental property.
Note 15 — Related Party TransactionsSignificant transactions with related parties for the years ended March 31,
2012, 2011 and 2010 were as follows:
Millions of yen
Thousands of U.S. dollars
(Note 1)
Year ended March 31, 2012 2011 2010 2012
Medical Management Matsuzawa Co. Ltd.,
— Support management and accept order for construction service ¥7,653 ¥8,533 ¥— $93,114
Solacor Electricidad Uno S.A. (affiliated company)
— guarantee obligation ¥5,382 ¥5,763 ¥— $65,482
Solacor Electricidad Dos S.A. (affiliated company)
— guarantee obligation ¥5,321 ¥5,698 ¥— $64,740
The balances of the Company due to related parties as of March 31,
2012, 2011 and 2010 were as follows:
Millions of yen
Thousands of U.S. dollars
(Note 1)
March 31, 2012 2011 2010 2012
Medical Management Matsuzawa Co. Ltd.,
— Accounts receivable ¥6,764 ¥7,837 ¥— $82,297
The Company doesn’t receive a guarantee charge from Solacor Electricidad
Uno S.A. and Solacor Electricidad Dos S.A.
The supporting management fee, the construction service fee and the
interest rate for the long-term loan receivable were reasonably determined,
considering the market interest rate. No pledged assets were furnished.
Note 16 — Business CombinationsTransactions under common control during the year ended March 31, 2012:
(a) Outline of the Transactions(1) Name and business of combined entity
Merging company: JGC Project Services Co., Ltd, total engineering
Merged company: Nikki Construction Co., Ltd, total engineering
60 JGC Corporationannual report 2012

(2) Form of business combinations
Transactions under common control
(3) Name of the entity after the reorganization
JGC PLANT SOLUTIONS CO., LTD.
(4) Outline and purpose of the transaction
JGC Project Services Co., Ltd, a consolidated subsidiary of the Company
merged with Nikki Construction Co., Ltd, a consolidated subsidiary of the
Company as on April 1, 2011. The purpose of this merger was to reinforce
the following:
[1] Increase cost competitiveness
[2] Increase depth and breadth of business operations
[3] Expand overseas
(b) Accounting MethodThese transactions were accounted for as a business combination among
entities under common control.
(c) Amounts of Assets and Liabilities Received and Incurred on the Date of Business Combination
Total assets ¥7,461 million
Total liabilities ¥2,845 million
Transactions under common control during the year ended March 31, 2010:
(a) Outline of the Transactions(1) Name and business of combined entity
Merging company: JGC INFORMATION SYSTEMS COMPANY LIMITED
(“J-SYS”), IT business
Merged company: J-SYS Software Co., Ltd. (“J-SYS SOFT”), software sales
(2) Form of business combinations
Transactions under common control (Merger with companies which
develop information systems, and produce and sell software)
(3) Name of the entity after the reorganization
JGC Information System Co., Ltd.
(4) Outline and purpose of the transaction
J-SYS, a consolidated subsidiary of the Company merged with J-SYS SOFT,
a consolidated subsidiary of the Company as on April 1, 2009. The pur-
pose of this merger was to reinforce the following:
[1] Restructuring sales transaction and improvement of sales force
[2] Reinforcement of employees and human resources
[3] Combine and develop customers’ information system and sales channel.
(b) Accounting MethodThese transactions were accounted for as a business combination among
entities under common control.
(c) Amounts of Assets and Liabilities Received and Incurred on the Date of Business Combination
Total assets ¥173 million
Total liabilities ¥166 million
Note 17 — Rental PropertyEffective from the year ended March 31, 2010, the Company and its consoli-
dated subsidiaries adopted the “Accounting Standard for Disclosures about Fair
Value of Investment and Rental Property” (Accounting Standards Board of
Japan (“ASBJ”) Statement No.20 issued on November 28, 2008) and “Guid-
ance on Accounting Standard for Disclosures about Fair Value of Investment
and Rental Property” (ASBJ Guidance No.23 issued on November 28, 2008) for
the years ending on or after March 31, 2010. Pursuant to the new requirements,
information about fair value of investment and rental property on the consoli-
dated financial statements at March 31, 2012, and 2011, were as follows:
Book value (net of depreciation) Fair value
March 31, 2010 Decrease
March 31, 2011
March 31, 2011
Millions of Yen ¥8,097 ¥(124) ¥7,973 ¥6,201
March 31, 2010 Decrease
March 31, 2012
March 31, 2012
Millions of Yen ¥ 7,973 ¥ (122) ¥ 7,851 ¥ 6,201Thousands of U.S dollars (Note 1) $97,007 $(1,484) $95,523 $75,447
Rental real estate assets are presented on the consolidated balance
sheets net of accumulated depreciation and accumulated impairment loss.
The reason of the decrease was mainly due to the depreciation of the assets.
The fair value was calculated by the Company based on “the guidance for
apprising real estate.”
The Company has rental commercial properties (included land) at
Kanagawa prefecture. The rental incomes in the Other income were ¥404
million ($4,915 thousand) and ¥407 million for the years ended March 31,
2012 and 2011, respectively.
Note 18 — Financial InstrumentsEffective from the year ended March 31, 2010, the Company adopted the
revised Accounting Standard, “Accounting Standard for Financial Instru-
ments” (Accounting Standards Board of Japan (“ASBJ”) Statement No. 10
revised on March 10, 2008) and the “Guidance on Disclosures about Fair
Value of Financial Instruments” (ASBJ Guidance No. 19 revised on March 10,
2008). Information on financial instruments for the year ended March 31,
2010 required pursuant to the revised accounting standards is as follows.
A. Qualitative Information on Financial Instruments(a) Policies for Using Financial InstrumentsThe Company manages surplus capital using financial instruments that are
short-term and carry little or no risk. The Company uses derivatives to mitigate
the risks that are described below, and as a matter of policy does not use
derivatives for speculative transactions.
61 JGC Corporationannual report 2012

(b) Financial Instruments, Associated Risks and The Risk Management System
Notes and accounts receivable expose the Company to customer credit risk.
Marketable securities are mainly negotiable certificate of deposit. Investment
securities are mainly related to the business and capital alliance companies
and expose the Company to the changes in market prices. Long-term loans
receivable are mainly related to subsidiaries and affiliates.
Most notes and accounts payable are due within one year. Some of
accounts payable associated with purchasing machines and construction
contracts are denominated in foreign currencies, which exposes the Company
to the risks of exchange rate fluctuations. The Company generally procures
capital required under its business plan through bank loans. Some of bank
loans expose the Company to the risks of interest rate fluctuations, which the
Company uses interest rate swaps to hedge.
The Company uses derivatives transactions including forward foreign
exchange contracts to hedge the risk of exchange rate fluctuations associated
with receivable and payable denominated in foreign currencies and interest
rate swaps to hedge the risk of interest rate fluctuations associated with loans.
‘Derivative Transactions and Hedge Accounting’ in Note 1 (t) and Note 10
presented earlier explain hedge accounting issues including methods, hedging
policies, hedged items and recognition of gain or loss on hedged positions.
(c) Risk Management System for Financial Instruments(1) Credit risk management (counterparty risk)
The Company has established internal procedures for receivables under
which the related divisions are primarily responsible for periodically moni-
toring counterparty status. The department manages amounts and settle-
ment dates by counterparty and works to quickly identify and mitigate
payment risk that may result from situations including deterioration of the
financial condition of counterparties. Consolidated subsidiaries are subject
to the same risk management rules.
In using derivatives transactions, the Company mitigates counterparty
risk by conducting transactions with highly creditworthy financial institutions.
(2) Market risk management (risk of exchange rate and interest rate fluctuations)
The Company monitors the balance of the foreign currency receivable and
payable by each currency and every month and utilizes foreign currency
forward contracts and foreign currency deposit to hedge the risk of fluctua-
tions. The Company uses interest rate swaps to mitigate the risk of interest
rate fluctuations associated with loans.
Regarding marketable securities and investment securities, the Company
periodically examines fair value and the financial condition of the issuing
entities and revises its portfolio based on its relationships with issuing entities.
The derivative transactions are executed and managed in accordance
with the established policies and within the specified limit on the amounts
of derivative transactions allowed. The Company handles the transactions
and periodically provides administrative reports on the results to the finan-
cial director and treasurer.
(3) Management of liquidity risk associated with capital procurement (payment
default risk)
The Company manages liquidity risk by creating and updating a capital
deployment plan based on reports from each division.
(d) Supplemental Information on the Fair Value of Financial Instruments
The fair value of financial instruments is based on market prices, or a reason-
able estimate of fair value for instruments for which market prices are not
available. Estimates of fair value are subject to fluctuation because they
employ variable factors and assumptions.
In addition, the contractual amounts of the derivatives transactions dis-
cussed in B (a) below are not an indicator of the market risk associated with
derivatives transactions.
B. Fair Values of Financial Information(a) Fair Values of Financial InstrumentsFair values of financial instruments as of March 31, 2012 and 2011 were
summarized as follows:
The financial instruments, whose fair value were difficult to measure, were
not included in the table below and were summarized in B (b).
Millions of yen
March 31, 2012Carrying amount
Estimated fair value Difference
Cash and deposits ¥195,056 ¥195,056 —
Marketable securities 27,500 27,500 —Notes and accounts receivable 87,248 87,248 —Other receivable 13,745 13,745Marketable and investment securities 18,255 18,255 —Long-term loans receivable, net* 1,598 1,659 ¥61
Total Assets ¥343,402 ¥343,463 ¥61
Notes and accounts payable ¥ 82,376 ¥ 82,376 —Long-term Debt 7,591 7,675 ¥84
Total Liabilities ¥ 89,967 ¥ 90,051 ¥84
Derivative financial instruments, net ¥ 33 ¥ 33 —
Millions of yen
March 31, 2011Carrying amount
Estimated fair value Difference
Cash and deposits ¥131,894 ¥131,894 —
Marketable securities 30,000 30,000 —
Notes and accounts receivable 108,810 108,810 —
Other receivable 7,235 7,235
Marketable and investment securities 19,882 19,882 —
Long-term loans receivable, net* 1,780 1,836 ¥ 56
Total Assets ¥299,601 ¥299,657 ¥ 56
Notes and accounts payable ¥ 70,762 ¥ 70,762 —
Long-term Debt 6,624 6,763 ¥139
Total Liabilities ¥ 77,386 ¥ 77,525 ¥139
Derivative financial instruments, net ¥ 4,142 ¥ 4,142 —
62 JGC Corporationannual report 2012

Thousand of U.S. dollars (Note 1)
March 31, 2012Carryingamount
Estimated fair value Difference
Cash and deposits $2,373,233 $2,373,233 —Marketable securities 334,591 334,591 —Notes and accounts receivable 1,061,540 1,061,540 —Other receivable 167,234 167,234Marketable and investment securities 222,107 222,107 —Long-term loans receivable, net* 19,443 20,185 $ 742
Total Assets $4,178,148 $4,178,890 $ 742
Notes and accounts payable $1,002,263 $1,002,263 —Long-term Debt 92,359 93,381 $1,022
Total Liabilities $1,094,622 $1,095,644 $1,022
Derivative financial instruments, net $ 402 $ 402 —
* The amounts for probable losses calculated by applying a percentage based on collection experience to the remaining accounts are deducted.
The following methods and assumptions were used to estimate the fair
value of the financial instruments.
Cash and deposits, and Marketable securities
All deposits and negotiable certificate of deposit are short-term. Therefore,
carrying amount is used for the fair value of these items because these
amounts are essentially the same.
Notes and accounts receivable
Notes and accounts receivable are short-term. Therefore, carrying amount
is used for the fair value of short-term receivable because these amounts
are essentially the same.
Other receivable
Other receivable are short-term. Therefore, carrying amount is used for
the fair value of short-term receivable because these amounts are essen-
tially the same.
Marketable and investment securities
Marketable and investment securities are the price listed on securities
exchanges for equities. In addition, Note 9 provides information on mar-
ketable securities by holding intent.
Long-term loans receivable
Fair value of long-term loans receivable are estimated as discounted
present value of total principal and interest using assumed interest rates
for equivalent new loans.
Notes and accounts payable
Notes and accounts payable are short-term. Therefore, carrying amount is
used for the fair value of short-term payable because these amounts are
essentially the same.
Long-Term Debt
Fair value of long-term debt is estimated as discounted present value of
total principal and interest using assumed interest rates for equivalent
new loans. Interest rate swaps subject to special method are used for
long-term floating-rate loans. Principal and interest of the loans in which
these interest rate swaps are embedded are discounted using a reason-
able estimate of the interest rate on the loan at the time of issue.
Derivative financial instruments
Please refer to ‘DERIVATIVE TRANSACTIONS AND HEDGE ACCOUNT-
ING’ in Note 1 (t) and Note 10.
(b) Financial Instruments, Whose Fair Value Were Difficult to Measure
The financial instruments, whose fair value were difficult to measure, as of
March 31, 2012 and 2011, were summarized as follows:
March 31,
Millions of yen
Thousands of U.S. dollars
(Note 1)
2012 2011 2012
Unconsolidated subsidiaries and affiliates ¥36,920 ¥36,147 $449,203Non-listed equity securities 11,659 10,046 141,854Subscription certificate 38 39 462
It is difficult to measure the fair value of these financial instruments
because there is no market price available and it is not efficient to calculate
future cash flow. Therefore, these financial instruments were not included in
the Marketable and investment securities described in B (a).
(c) Maturities of Financial InstrumentsThe maturities of the financial instruments at March 31, 2012 were as follows:
Millions of yen
Year ending March 31, 2013 2014–2017 2018–20222023 and thereafter
Cash and deposits ¥195,056 — — —
Marketable securities 27,500 — — —
Notes and accounts receivable 87,248 — — —
Other receivable 13,745
Long-term loans receivable, net — ¥1,094 ¥383 ¥121
Total Assets ¥323,549 ¥1,094 ¥383 ¥121
Thousand of U.S. dollars (Note 1)
Year ending March 31, 2013 2014–2017 2018–20222023 and thereafter
Cash and deposits $2,373,233 — — —
Marketable securities 334,591 — — —
Notes and accounts receivable 1,061,540 — — —
Other receivable 167,234 — — —
Long-term loans receivable, net — $13,311 $4,660 $1,472
Total Assets $3,936,598 $13,311 $4,660 $1,472
Please see Note 3 for the maturities of Long term-debt.
63 JGC Corporationannual report 2012

Note 19 — Impairment of Fixed AssetsAs discussed in Note 1 (l), the Company and its consolidated subsidiaries
have applied the accounting standard for impairment of fixed assets.
The Company and its consolidated subsidiaries have grouped their fixed
assets principally based on their business segment, while considering mutual
supplementation of the cash flows.
Loss on impairment of fixed assets for the year ended March 31, 2012
consisted of the following:
Location Use Type of assets
Sendai (Japan) Rental Property Land
Carrying amount of certain assets were devalued to their recoverable
amounts, since the land’s market value have significantly declined. As a result,
The Company recognized loss on impairment in the amount of ¥420 million
($5,110 thousand). The recoverable amounts are calculated according to
estimated net sales value, which are real-estate appraisal.
Loss on impairment of fixed assets for the year ended March 31, 2010
consisted of the following:
Location Use Type of assets
Houston (U.S.A) The concession for a mining area
Other— PROPERTY AND EQUIPMENTOther—OTHER ASSETS
Carrying amount of certain assets were devalued to their recoverable
amounts, since the oil and gas reserves added by additional drilling have fallen
short of the originally expected reserves. As a result, The Company and one
consolidated overseas subsidiary recognized loss on impairment in the amount
of ¥3,603 million, which consisted of other assets ¥2,716 million and property
and equipment ¥887 million.
The overseas subsidiary used the value in use which was calculated by
discounting future cash flows at the interest rates of 10% based on U.S. GAAP.
Note 20 — Other Comprehensive IncomeReclassification adjustments of the Company’s and its consolidated subsidiar-
ies’ other comprehensive income as of March 31, 2012 were as follows:
March 31, 2012 Millions of yen
Thousands of U.S. dollars
(Note 1)
Net unrealized holding gains on securities
Unrealized holding gains arising during the year ¥(1,641) $(19,966)Reclassification adjustment for gains realized in net income 10 122
Net unrealized holding gains on securities (1,631) (19,844)Deferred gains (losses) on hedges
Deferred gains (losses) on hedges arising during the year (3,885) (47,268)
Net deferred gains (losses) on hedges (3,885) (47,268)Translation adjustments
Translation adjustments arising during the year (968) (11,778)Net translation adjustments (968) (11,778)
Equity for equity method affiliates
Equity for equity method affiliates arising during the year (1) (12)
Net equity for equity method affiliates (1) (12)Before —tax amount (6,485) (78,902)Tax Benefit 2,080 25,307
Other comprehensive income ¥(4,405) $(53,595)
Tax effects allocated to each component of other comprehensive income
as of March 31, 2012 were as follows:
Millions of yen
Year ended March 31, 2012Before-tax
amountTax benefit (expense)
Net-of-tax amount
Net unrealized holding gains on securities ¥(1,631) ¥ 612 ¥(1,019)
Deferred gains (losses) on hedges (3,885) 1,405 (2,480)Land revaluation — 63 63Translation adjustments (968) — (968)Equity for equity method affiliates (1) — (1)
Other comprehensive income ¥(6,485) ¥2,080 ¥(4,405)
Thousands of U.S. dollars (Note 1)
Year ended March 31, 2012Before-tax
amountTax benefit (expense)
Net-of-tax amount
Net unrealized holding gains on securities $(19,844) $ 7,446 $(12,398)
Deferred gains (losses) on hedges (47,268) 17,094 (30,174)Land revaluation — 767 767Translation adjustments (11,778) — (11,778)Equity for equity method affiliates (12) — (12)
Other comprehensive income $(78,902) $25,307 $(53,595)
Note 21 — Subsequent EventAt the Company’s board of directors held on June 18, 2012, the board of
directors decided the Company’s wholly owned subsidiary JGC Corporation
Europe B.V., which is a hub of procurement of equipment, will liquidate before
the end of 2012. The effect on operations from the liquidation is immaterial.
64 JGC Corporationannual report 2012

1 Framework of Internal Control Over Financial ReportingKeisuke Takeuchi, Chief Executive Officer, Koichi Kawana, Chief
Operating Officer, and Masayuki Sato, Chief Financial Officer of
JGC Corporation (“the Company”) are responsible for establishing
and maintaining adequate internal control over financial reporting
(as defined in the rule “On the Setting of the Standards and Prac-
tice Standards for Management Assessment and Audit concerning
Internal Control Over Financial Reporting”).
Because of its inherent limitations, internal control over finan-
cial reporting may not completely prevent or detect misstatements.
2 Assessment Scope, Timing and ProceduresBasis of Presenting Internal Control ReportThe report on internal control over financial reporting of the con-
solidated financial statements of the Company (“Internal Control
Report”) is prepared on the basis of generally accepted assess-
ment standards of internal control over financial reporting in
Japan (“Assessment Standards”) and is compiled from the Inter-
nal Control Report prepared by the Company as required by the
Financial Instruments and Exchange Law of Japan (“the Law”).
The Assessment Standards require management to assess the
internal control over financial reporting (“ICOFR”), which consists
of the internal control over the consolidated/parent only financial
statements included in the Annual Securities Report filed under
the Law and the internal control over disclosure information and
others included in the Annual Securities Report that materially
affects the reliability of the financial statements.
The scope of management’s assessment of ICOFR in this
annual report is different from the scope required by the Assess-
ment Standards. Management assessment of ICOFR for this
annual report covers the ICOFR with respect to the accompanying
consolidated financial statements only. In addition, as explained in
Note 1 on the basis of presenting consolidated financial state-
ments, the accompanying consolidated financial statements are
reclassified and modified from the consolidated financial state-
ments prepared for the purpose of the Law. Supplementary infor-
mation is also added to the consolidated financial statements. The
process of making reclassifications and modifications and the
addition of certain information is for the convenience of readers
outside Japan. Management voluntarily includes the process in its
assessment of ICOFR, even though it is outside the scope of the
Assessment Standards.
Scope of AssessmentWe have assessed our ICOFR as of March 31, 2012 in accordance
with the Assessment Standards.
We assessed the design and operation of our company-level
control and based on this assessment, we analyzed business
processes within the scope of the internal control to be assessed,
identified a key control that would have a material impact on the
reliability of financial reporting and assessed whether the basic
components of internal control are operating with regard to the
key control.
We assessed the effectiveness of ICOFR of the Company, con-
solidated subsidiaries and affiliates to the extent necessary in light
of their degree of impact on the reliability of financial reporting.
In assessing the effectiveness of internal control, we decided
on reasonable scope of assessment for the important business
processes in light of their degree of quantitative and qualitative
impact on financial reporting based on the assessment of the
company-level control.
Locations and business units that did not have a material effect
on financial reporting were excluded from the scope of assessments.
In assessing the period-end financial reporting process, we
decided on reasonable scope of assessment in light of its degree
of quantitative and qualitative impact on financial reporting in a
similar manner as company-level control.
In assessing the business processes other than described
above, based on the assessment of the company-level controls,
we assessed the significant business locations based on the their
sales levels until their combined sales amounts reaches approxi-
mately two-thirds on a consolidated basis and the business pro-
cesses which impact the accounts (sales, accounts receivable and
inventory) that were closely associated with the significant busi-
ness locations’ business objectives.
3 Results of assessmentBased on the above assessments, the Company’s management
has concluded that, as of March 31, 2012, the Company’s internal
control over financial reporting was effective.
4 Supplementary informationNot applicable.
5 OtherNot applicable.
Keisuke TakeuchiChairman and Representative Director
June 28, 2012
Internal Control Report
65 JGC Corporationannual report 2012

To the Board of Directors of JGC Corporation
Report on the Consolidated Financial Statements
We have audited the accompanying consolidated financial state-ments of JGC Corporation and its consolidated subsidiaries, which comprise the consolidated balance sheets as of March 31, 2012 and 2011, and the consolidated income statements, statements of com-prehensive income, consolidated statements of changes in net assets and consolidated statements of cash flows for each of the years in the three-year period ended March 31, 2012, and a summary of significant accounting policies and other explanatory information.
Management’s Responsibility for the Consolidated Financial StatementsManagement is responsible for the preparation and fair presenta-tion of these consolidated financial statements in accordance with accounting principles generally accepted in Japan, and for such internal control as management determines is necessary to enable the preparation of consolidated financial statements that are free from material misstatements, whether due to fraud or error.
Auditor’s ResponsibilityOur responsibility is to express an opinion on these consolidated financial statements based on our audits. We conducted our audits in accordance with auditing standards generally accepted in Japan. Those standards require that we comply with ethical requirements and plan and perform the audit to obtain reasonable assurance about whether the consolidated financial statements are free from material misstatement.
An audit involves performing procedures to obtain audit evidence about the amounts and disclosures in the consolidated financial statements. The procedures selected depend on our judgement, including the assessment of the risks of material misstatement of the consolidated financial statements, whether due to fraud or error. In making those risk assessments, we consider internal control relevant to the entity’s preparation and fair presentation of the consolidated financial statements in order to design audit procedures that are appropriate in the circumstances, while the objective of the financial statement audit is not for the purpose of expressing an opinion on the effectiveness of the entity’s internal control. An audit also includes evaluating the appropriateness of accounting policies used and the reasonableness of accounting estimates made by management, as well as evaluating the overall presentation of the consolidated financial statements.
We believe that the audit evidence we have obtained is sufficient and appropriate to provide a basis for our audit opinion.
OpinionIn our opinion, the consolidated financial statements present fairly, in all material respects, the financial position of JGC Corporation and its consolidated subsidiaries as of March 31, 2012 and 2011, and their financial performance and cash flows for each of the years in the three-year period ended March 31, 2012 in accor-dance with accounting principles generally accepted in Japan.
Convenience TranslationThe U.S. dollar amounts in the accompanying consolidated finan-cial statements with respect to the year ended March 31, 2012 are presented solely for convenience. Our audit also included the translation of yen amounts into U.S. dollar amounts and, in our opinion, such translation has been made on the basis described in Note 1 to the consolidated financial statements.
Report on the Internal Control Report
We also have audited the accompanying report on internal control over financial reporting of the consolidated financial statements of JGC Corporation as of March 31, 2012 (“Internal Control Report”).
Management’s Responsibility for the Internal Control ReportManagement is responsible for the design and operation of internal control over financial reporting and the preparation and fair presen-tation of the Internal Control Report in conformity with assessment standards for internal control over financial reporting generally accepted in Japan. Internal control over financial reporting may not completely prevent or detect financial statement misstatements.
Auditor’s ResponsibilityOur responsibility is to independently express an opinion on the Internal Control Report based on our internal control audit. We conducted our internal control audit in accordance with auditing standards for internal control over financial reporting generally accepted in Japan. Those standards require that we comply with ethical requirements and plan and perform the audit to obtain reasonable assurance about whether the Internal Control Report is free from material misstatement.
An internal control audit involves performing procedures to obtain audit evidence about the assessment of internal control over financial reporting in the Internal Control Report. The procedures selected depend on the auditor’s judgement, including significance of effect on the reliability of financial reporting. Also, an internal control audit includes evaluating the appropriateness of the scope, procedures and result of the assessment determined and presented by management, and the overall internal control report presenta-tion. We believe that the audit evidence we have obtained is suf-ficient and appropriate to provide a basis for our opinion.
OpinionIn our opinion, the Internal Control Report, in which JGC Corporation states that internal control over financial reporting was effective as of March 31, 2012, presents fairly, in all material respects, the assessment of internal control over financial reporting in confor-mity with assessment standards for internal control over financial reporting generally accepted in Japan.
(KPMG AZSA LLC)Tokyo, JapanJune 28, 2012
Independent Auditor’s ReportJGC CORPORATION
66 JGC Corporationannual report 2012

2012 2011 2010 2009 2008 2007
Net Sales ¥ 451,724 ¥ 359,561 ¥317,597 ¥349,925 ¥460,161 ¥528,794
Operating Income 54,218 51,918 32,145 41,356 30,550 14,432
Income before Taxes on Income 60,708 45,205 27,934 44,578 32,832 21,538
Net Income 34,304 22,853 21,271 30,214 21,312 15,183
Total Current Assets 299,329 272,339 232,540 276,325 270,646 278,627
Total Current Liabilities 173,793 167,621 126,240 184,205 194,470 216,473
Working Capital 125,536 104,718 106,300 92,120 76,176 62,154
Current Ratio 172.2% 162.5% 184.2% 150.0% 139.2% 128.7%
Net Property and Equipment 49,961 49,956 50,364 49,414 51,115 53,081
Total Assets 444,659 415,737 374,549 412,893 404,424 418,285
Long-Term Debt, Less Current Maturities 2,486 1,663 16,104 16,757 15,519 16,382
Total Net Assets 251,006 227,794 212,619 192,655 174,795 165,191
New Contracts 342,983 569,128 675,505 440,548 348,755 255,015
Outstanding Contracts 1,005,441 1,114,182 953,511 641,781 607,378 728,168
Net Income per Share (in yen) 135.86 90.44 84.15 119.50 84.01 59.81
Cash Dividends per Share (in yen) 38.50 30.0 21.0 30.0 21.0 15.0
Number of Employees 2,155 2,137 2,107 2,069 2,014 1,953
Six-Year Summary—Non-ConsolidatedFor the six years ended March 31. Yen amounts are in millions except per share data.
67 JGC Corporationannual report 2012

Millions of yen
Thousands of U.S. dollars
(Note 1)
Assets 2012 2011 2012
Current Assets:
Cash and deposits ¥169,426 ¥123,530 $2,061,394
Marketable securities 27,500 30,000 334,591
Notes and accounts receivable (Note 2) 51,683 83,747 628,823
Contract works in progress 22,424 13,956 272,831
Deferred tax assets (Note 7) 9,751 8,363 118,640
Other current assets (Note 2) 18,616 12,840 226,500
Allowance for doubtful accounts (Note 1(r)) (71) (97) (864)
Total Current Assets 299,329 272,339 3,641,915
Property and Equipment (Note 3):
Land (Notes 8 & 9) 21,931 22,391 266,833
Buildings and structures 48,363 48,831 588,429
Machinery and equipment 9,921 8,867 120,708
Construction in progress 2,172 438 26,427
82,387 80,527 1,002,397
Less accumulated depreciation (32,426) (30,571) (394,525)
Net Property and Equipment 49,961 49,956 607,872
Other Assets:
Investments in subsidiaries and affiliates (Note 1(e)) 48,505 40,269 590,157
Marketable and investment securities 29,845 29,854 363,122
Long-term loans receivable (Note 2) 9,698 10,414 117,995
Deferred tax assets (Note 7) 4,137 9,163 50,335
Other 3,184 3,742 38,739
Total Other Assets 95,369 93,442 1,160,348
Total Assets ¥444,659 ¥415,737 $5,410,135
The accompanying notes are an integral part of these statements.
Non-Consolidated Balance SheetsJGC CORPORATION March 31, 2012 and 2011
68 JGC Corporationannual report 2012

Millions of yen
Thousands of U.S. dollars
(Note 1)
Liabilities and Net Assets 2012 2011 2012
Current Liabilities:
Short-term loans (Notes 2 & 3) ¥ 13,833 ¥ 32,652 $ 168,305
Notes and accounts payable (Note 2) 57,252 56,371 696,581
Advances received on uncompleted contracts (Note 2) 58,389 25,720 710,415
Reserve for job warranty costs 2,051 207 24,954
Reserve for losses on contracts 4,107 119 49,970
Income taxes payable 11,658 15,819 141,842
Other current liabilities (Note 2) 26,503 36,733 322,460
Total Current Liabilities 173,793 167,621 2,114,527
Long-Term Debt, Less Current Maturities (Note 3) 2,486 1,663 30,247
Retirement and Severance Benefits 10,026 10,966 121,986
Deferred Tax Liabilities for Land Revaluation (Notes 7 & 8) 3,692 3,783 44,920
Other Non-Current Liabilities (Note 2) 3,656 3,910 44,482
Total Liabilities 193,653 187,943 2,356,162
Contingencies (Note 5)
Net Assets (Note 6):
Common stock
Authorized — 600,000,000 shares,
Issued — 259,052,929 shares in 2012 and 2011 23,511 23,511 286,057
Capital surplus 25,603 25,603 311,510
Legal earnings reserve 2,693 2,693 32,765
Retained earnings 209,758 182,978 2,552,111
Treasury stock, at cost (6,375) (6,287) (77,564)
Net unrealized holding gains on securities 2,319 3,330 28,215
Deferred gains on hedges 39 2,519 475
Land revaluation, net of deferred tax portion (Note 8) (6,542) (6,553) (79,596)
Total Net Assets 251,006 227,794 3,053,973
Total Liabilities and Net Assets ¥444,659 ¥415,737 $5,410,135
69 JGC Corporationannual report 2012

Non-Consolidated Statements of IncomeJGC CORPORATION Years ended March 31, 2012, 2011 and 2010
Millions of yen
Thousands of U.S. dollars
(Note 1)
2012 2011 2010 2012
Net Sales ¥451,724 ¥359,561 ¥317,597 $5,496,094
Cost of Sales 386,555 297,622 275,446 4,703,187
Gross profit 65,169 61,939 42,151 792,907
Selling, General and Administrative Expenses 10,951 10,021 10,006 133,240
Operating income 54,218 51,918 32,145 659,667
Other Income (Expenses):
Interest and dividend income 9,181 8,642 8,569 111,705
Interest expense (372) (518) (530) (4,526)
Loss on sales and disposal of property and equipment (722) (32) (73) (8,785)
Gain on sales of marketable and investment securities 16 — 516 195
Gain (loss) on sales of an affiliate security (45) 9,665 — (548)
Loss on devaluation of marketable and investment securities — (197) — —
Loss on devaluation of investment in subsidiaries — — (6,364) —
Loss on allowance for investment (Note 1(e)) (1,318) — — (16,036)
Exchange loss, net (Note 1(r)) (617) (4,293) (3,481) (7,507)
Provision for doubtful accounts (Note 1(r)) — — (3,293) —
Loss on impairment of fixed assets (Note 9) (420) — — (5,110)
Other, net 787 (19,980) 445 9,575
6,490 (6,713) (4,211) 78,963
Income before taxes on income 60,708 45,205 27,934 738,630
Taxes on Income (Note 7):
Current 20,781 19,175 8,200 252,841
Deferred 5,623 3,177 (1,537) 68,415
Net Income ¥ 34,304 ¥ 22,853 ¥ 21,271 $ 417,374
YenU.S. dollars
(Note 1)
Amounts Per Share of Common Stock
Net income ¥ 135.86 ¥ 90.44 ¥ 84.15 $ 1.65
Cash dividends applicable to the year ¥ 38.50 ¥ 30.00 ¥ 21.00 $ 0.47
The accompanying notes are an integral part of these statements.
70 JGC Corporationannual report 2012

Non-Consolidated Statements of Changes in Net AssetsJGC CORPORATION Years ended March 31, 2012, 2011 and 2010
Thousands of shares Millions of yen
Common stock
Capital surplus
Legal reserve
Retained earnings
Treasury stock, at cost
Net unrealized holding gains
(losses) on securities
Deferred gains
(losses) on hedges
(Note 1)
Land revaluation,
net of deferred tax portion
(Note 8)Shares Amount
Balance at April 1, 2009 259,053 ¥ 23,511 ¥ 25,599 ¥ 2,693 ¥ 151,784 ¥ (5,790) ¥ 2,475 ¥ (1,027) ¥ (6,590)
Net income for the year 21,271
Cash dividends (7,584)
Land revaluation, net of deferred tax portion (37) 37
Gain on retirement of treasury stock 2 2
Net unrealized holding gains on securities 2,600
Net deferred gains on hedges 3,739
Increase of treasury stock (66)
Balance at March 31 and April 1, 2010 259,053 ¥ 23,511 ¥ 25,601 ¥ 2,693 ¥ 165,434 ¥ (5,854) ¥ 5,075 ¥ 2,712 ¥ (6,553)
Net income for the year 22,853
Cash dividends (5,309)
Land revaluation, net of deferred tax portion
Gain on retirement of treasury stock 2 2
Net unrealized holding losses on securities (1,745)
Net deferred losses on hedges (193)
Increase of treasury stock (435)
Balance at March 31 and April 1, 2011 259,053 ¥ 23,511 ¥ 25,603 ¥ 2,693 ¥ 182,978 ¥ (6,287) ¥ 3,330 ¥ 2,519 ¥ (6,553)
Net income for the year 34,304
Cash dividends (7,576)
Land revaluation, net of deferred tax portion 52 11
Gain on retirement of treasury stock 0 0
Net unrealized holding losses on securities (1,011)
Net deferred losses on hedges ¥(2,480)
Increase of treasury stock (88)
Balance at March 31, 2012 259,053 ¥23,511 ¥25,603 ¥2,693 ¥209,758 ¥(6,375) ¥ 2,319 ¥ 39 ¥(6,542)
Thousands of U.S. dollars (Note 1)
Common stock
Capital surplus
Legal reserve
Retained earnings
Treasury stock, at cost
Net unrealized holding gains
(losses) on securities
Deferred gains
(losses) on hedges
(Note 1)
Land revaluation,
net of deferred tax portion
(Note 8)
Balance at April 1, 2011 $ 286,057 $ 311,510 $ 32,765 $ 2,226,281 $ (76,493) $ 40,516 $ 30,648 $ (79,730)
Net income for the year 417,374
Cash dividends (92,177)
Land revaluation, net of deferred tax portion 633 134
Gain on retirement of treasury stock 0 0
Net unrealized holding losses on securities (12,301)
Net deferred losses on hedges (30,173)
Increase of treasury stock (1,071)
Balance at March 31, 2012 $286,057 $311,510 $32,765 $2,552,111 $(77,564) $ 28,215 $ 475 $(79,596)
The accompanying notes are an integral part of these statements.
71 JGC Corporationannual report 2012

Notes to Non-Consolidated Financial Statements
Note 1 — Summary of Accounting Policies(a) Basis of Presenting Non-Consolidated Financial
StatementsThe accompanying non-consolidated financial statements of JGC Corporation
(Nikki Kabushiki Kaisha, the “Company”) have been prepared in accordance
with the provisions set forth in the Japanese Financial Instruments and
Exchange Law and its related accounting regulations, and in conformity with
accounting principles generally accepted in Japan (“Japanese GAAP”), which
are different in certain respects as to application and disclosure requirements
of International Financial Reporting Standards.
The accompanying non-consolidated financial statements have been
restructured and translated into English (with some expanded descriptions)
from the non-consolidated financial statements of the Company prepared in
accordance with Japanese GAAP and filed with the appropriate Local Finance
Bureau of the Ministry of Finance as required by the Japanese Financial
Instruments and Exchange Law. Certain supplementary information included
in the statutory Japanese language non-consolidated financial statements, but
not required for fair presentation, is not presented in the accompanying non-
consolidated financial statements.
The translation of the Japanese yen amounts into U.S. dollars is included
solely for the convenience of readers outside Japan, using the prevailing
exchange rate at March 31, 2012, which was ¥82.19 to U.S. $1. The conve-
nience translations should not be construed as representations that the Japa-
nese yen amounts have been, could have been, or could in the future be,
converted into U.S. dollars at this or any other rate of exchange.
(b) Conversion of Foreign CurrenciesReceivables and payables denominated in foreign currencies are translated
into Japanese yen at the year-end rates.
(c) Allowance for Doubtful AccountsNotes and accounts receivables, including loans and other receivables, are
valued by providing individually estimated uncollectible amounts plus the
amounts for probable losses calculated by applying a percentage based on
collection experience to the remaining accounts.
(d) Marketable Securities, Investments in Subsidiaries and Affiliates, and Marketable and Investment Securities
The companies are required to examine the intent of holding each security
and classify those securities as (1) securities held for trading purposes, (2)
debt securities intended to be held to maturities, (3) equity securities issued
by subsidiaries and affiliates, and (4) all other securities that are not classified
in any of the above categories (hereafter, “available-for-sale securities”). The
Company did not have the securities defined as (1) and (2) above in the years
ended March 31, 2012 and 2011.
Available-for-sale securities with available fair market values are stated at
fair market value. Unrealized gains and losses on these securities are reported,
net of applicable income taxes, as a separate component of net assets. Real-
ized gains and losses on the sale of such securities are computed using the
moving-average method. Other securities with no available fair market value
are stated at moving-average cost. Equity securities issued by subsidiaries and
affiliates, which are not consolidated or accounted for using the equity
method, are stated at moving-average cost.
If the market value of available-for-sale securities declines significantly,
such securities are restated at fair market value and the difference between
fair market value and the carrying amount is recognized as loss in the period
of decline. For equity securities with no available fair market value, if the net
asset value of the investee declines significantly, such securities are required
to be written down to the net asset value with the corresponding losses in the
period of decline. In these cases, such fair market value or the net asset value
will be the carrying amount of the securities at the beginning of the next year.
(e) Allowance for Losses on InvestmentPrepare for estimated losses to be incurred in the future, allowance for losses
on investment is stated in amounts considered to be appropriate based on
financial condition of investments.
(f) Recognition of Sales, Contract Works in Progress and Advances Received on Uncompleted Contracts
On December 27, 2007, the Accounting Standards Board of Japan issued
ASBJ Statement No. 15, “Accounting Standard for Construction Contracts”
and ASBJ Guidance No. 18, “Guidance on Accounting Standard for Construc-
tion Contracts.” The new accounting standards require that if the construction
activity deemed certain during the course of the activity, the percentage-of-
completion method shall be applied (the percentage of the cost incurred to the
estimated total cost), otherwise the completed-contract method shall be
applied. This standard is effective from the year ended March 31, 2010.
As a result, Net Sales increased by ¥1,580 million and Gross Profit,
Operating Income, and Income before taxes on income increased by ¥207
million, respectively for the year ended March 31, 2010.
Prior to the year ended March 31, 2010, the Company recognized sales
on contracts using the completed-contract method except for long term con-
tract. Under this method, costs and advances received on uncompleted
contracts are accumulated during the period of construction. These costs and
advances received on uncompleted contracts are not offset and are shown as
contract works in progress and advances received on uncompleted contracts
in the accompanying non-consolidated balance sheets. Accordingly, no profits
or losses are recorded before the contract is completed.
Sales on other contracts for relatively large projects which require long
periods for completion and which generally include engineering, procurement
(components, parts, etc.) and construction on a full-turnkey basis, are recog-
nized on the percentage-of-completion method, primarily based on contract
costs incurred to date compared with total estimated costs for contract com-
pletion. The percentage-of-completion method is adopted for large jobs for
72 JGC Corporationannual report 2012

which the construction period exceeds 24 months and the contract amount
exceeds ¥5,000 million (including jobs whose construction period exceeds 36
months and the contract amount exceeds ¥3,000 million). Revisions in con-
tract revenue and cost estimates are recognized in the period in which they
are determined.
Contract works in progress are stated at cost determined by a specific
identification method and comprised of direct materials, components and
parts, direct labor, subcontractors’ fees and other items directly attributable to
the contract, and job-related overheads. Selling, general and administrative
expenses are charged to operations as incurred and are not allocated to
contract job work costs.
The Company normally receives payments from customers on a progress
basis in accordance with the terms of the respective construction contracts.
(g) Operating CycleAssets and liabilities related to long-term contract jobs are included in current
assets and current liabilities in the accompanying non-consolidated balance
sheets, as they will be liquidated in the normal course of contract completion,
although it may require more than one year.
(h) Property and Equipment, Depreciation and Finance LeasesProperty and equipment are stated at cost, except for certain revalued land as
explained in Note 8. Depreciation on property and equipment is calculated
using the straight-line method for buildings used for business operation, and
the declining-balance method for other property and equipment over the
estimated useful lives of the assets based on the Corporate Tax Code of Japan.
All finance leasing transactions were capitalized except for finance leases
which commenced prior to April 1, 2008 and have been accounted for as
operating leases, continue to be accounted for as operating leases with disclo-
sure of “as if capitalized” information.
Expenditures for new facilities and those that substantially increase the
useful lives of existing property and equipment are capitalized. Maintenance,
repair and minor renewals are charged to expenses as incurred.
The cost and accumulated depreciation applicable to assets retired or
otherwise disposed of are eliminated from the related accounts and the gain or
loss on disposal is credited or charged to income.
(i) Impairment of Fixed AssetsThe Company reviews its long-lived assets for impairment whenever events or
changes in circumstances indicate the carrying amount of an asset or asset
group may not be recoverable. An impairment loss would be recognized if the
carrying amount of an asset or asset group exceeds the sum of the undiscounted
future cash flows expected to result from the continued use and eventual disposi-
tion of the asset or asset group. The impairment loss would be measured as the
amount by which the carrying amount of the asset exceeds its recoverable
amount, which is the higher of the discounted cash flows from the continued use
and eventual disposition of the asset or the net selling price at disposition.
(j) Retirement and Severance Benefits and Pension CostsThe Company provides two types of post-employment benefit plans, unfunded
lump-sum payment plans and funded non-contributory pension plans, under
which all eligible employees are entitled to benefits based on the level of wages
and salaries at the time of retirement or termination, length of service and
certain other factors.
The Company provided allowance for employees’ severance and retire-
ment benefits at March 31, 2012 and 2011, based on the estimated amounts
of projected benefit obligation, actuarially calculated using certain assumptions
and the fair value of the plan assets at that date.
Prior service costs are recognized as expenses in equal amounts over the
average of the estimated remaining service lives of the employees (12 years),
and actuarial gains and losses are recognized as expenses using the declining-
balance method over the average of the estimated remaining service lives (12
years) commencing in the following period.
Effective from the year ended March 31, 2010, the Company adopted the
“Partial Amendments to Accounting Standard for Retirement Benefits (Part 3)”
(Accounting Standards Board of Japan (“ASBJ”) Statement No. 19 issued on
July 31, 2008). The new accounting standard requires domestic companies to
use the rate of return on long-term government or gilt-edged bonds as of the end
of the fiscal year for calculating the projected benefit obligation of a defined-
benefit plan. Previously, domestic companies were allowed to use a discount
rate determined taking into consideration fluctuations in the yield of long-term
government and gilt-edged bonds over a certain period. This change had no
material impact on the financial statements for the year ended March 31, 2010.
(k) Research and Development CostsResearch and development costs for the improvement of existing skills and
technologies or the development of new skills and technologies, including
basic research and fundamental development costs, are charged to operations
in the period incurred.
(l) Taxes on IncomeThe Company provides tax effects of temporary differences between the
carrying amounts and the tax basis of assets and liabilities. The asset and
liability approach is used to recognize deferred tax assets and liabilities for the
expected future tax consequences of temporary differences.
(m) Reserve for Job Warranty CostsA reserve for the estimated cost of warranty obligations is provided for the
Company’s engineering, procurement and construction work at the time the
related sales on contracts are recorded.
(n) Reserve for Losses on ContractsA reserve for losses on contracts is provided for an estimated amount of probable
losses to be incurred in future years in respect of construction projects in progress.
73 JGC Corporationannual report 2012

(o) Per Share InformationCash dividends per share have been presented on an accrual basis and
include dividends to be approved after the balance sheet date but applicable
to the year then ended.
(p) Derivatives and Hedge AccountingThe accounting standard for financial instruments requires companies to state
derivative financial instruments at fair value and to recognize changes in the
fair value as gains or losses unless the derivative financial instruments are
used for hedging purposes.
If derivative financial instruments are used as hedges and meet certain
hedging criteria, the Company defers recognition of gains or losses resulting
from changes in fair value of derivative financial instruments until the related
losses or gains of the hedged items are recognized.
However, in cases where forward foreign exchange contracts are used as
hedges and meet certain hedging criteria, forward foreign exchange contracts
and hedged items are accounted for in the following manner:
(1) If a forward foreign exchange contract is executed to hedge an existing
foreign currency receivable or payable,
(i) The difference, if any, between the Japanese yen amount of the hedged
foreign currency receivable or payable translated using the spot rate at
the inception date of the contract and the book value of the receivable
or payable is recognized in the statement of income in the period which
includes the inception date, and
(ii) The discount or premium on the contract (that is, the difference between
the Japanese yen amount of the contract translated using the contracted
forward rate and that translated using the spot rate at the inception date
of the contract) is recognized over the term of the contract.
(2) If a forward foreign exchange contract is executed to hedge a future trans-
action denominated in a foreign currency, the future transaction will be
recorded using the contracted forward rate, and no gains or losses on the
forward foreign exchange are recognized.
Also, where interest rate swap contracts are used as hedges and meet
certain hedging criteria, the net amount to be paid or received under the
interest rate swap contract is added to or deducted from the interest on the
assets or liabilities for which the swap contract was executed.
(q) Accrued Bonuses to Directors and Corporate AuditorsThe Company recognizes director’s and corporate auditor’s bonuses as
expenses when incurred.
(r) Reclassification and RestatementCertain prior year amounts have been reclassified to conform to the current
year presentation except for the reclassification between provision for doubtful
accounts and exchange gain or loss described below.
The Company changed the recognition of exchange differences about foreign
currencies’ doubtful accounts from provision for doubtful accounts to exchange
gain or loss from the year ended March 31, 2011, due to properly presentation of
provision for doubtful accounts without the effect of exchange fluctuation.
These reclassifications had no impact on previously reported results of
operations or retained earnings.
(s) Accounting Changes and Error CorrectionsOn December 4, 2009, the Accounting Standards Board of Japan issued
ASBJ Statement No. 24, “Accounting Standard for Accounting Changes and
Error Corrections” and ASBJ Guidance No. 24, “Guidance on Accounting
Standard for Accounting Changes and Error Corrections.” Accounting treat-
ments under the new accounting standard are as follows:
(1) Change in Accounting Policies
When a new accounting policy is applied with revision of accounting
standards, the new policy is applied retrospectively unless revised account-
ing standards include specific transitional provisions. When revised
accounting standards include specific transitional provisions, an entity
shall comply with the specific transitional provisions.
(2) Changes in Presentations
When the presentation of financial statements is changed, prior period finan-
cial statements are reclassified in accordance with the new presentation.
(3) Changes in Accounting Estimates
A change in an accounting estimate is accounted for in the period of the
change if the change affects that period only, and is accounted for prospec-
tively if the change affects both the period of the change and future periods.
(4) Corrections of Prior Period Errors
When an error in prior period financial statements is discovered, those
statements are restated.
This accounting standard and the guidance are applied to accounting
changes and corrections of prior period errors which are made from the begin-
ning of the fiscal year that begins on or after April 1, 2011.
Note 2 — Receivables from and Payables to Subsidiaries and Affiliates
Significant receivables from and payables to subsidiaries and affiliates at
March 31, 2012 and 2011 were as follows:
Millions of yen
Thousands of U.S. dollars
(Note 1)
March 31, 2012 2011 2012
Notes and accounts receivable ¥ 7,128 ¥ 8,335 $ 86,726
Other current assets 8,369 4,423 101,825
Long-term loans receivable 9,688 10,377 117,873
Notes and accounts payable 11,093 9,375 134,968
Short-term loans 13,175 18,787 160,299Advances received on uncompleted contracts 221 151 2,689
Other current liabilities 1,509 573 18,360
Other non-current liabilities 184 176 2,239
74 JGC Corporationannual report 2012

Note 3 — Borrowings and Assets Pledged as CollateralAt March 31, 2012 and 2011, short-term loans consisted of unsecured debt
from subsidiaries and bore interest at TIBOR.
Long-term debt consisted of the following:
Millions of yen
Thousands of U.S. dollars
(Note 1)
March 31, 2012 2011 2012
Unsecured Debt0.74%–1.25% loans from banks and insurance companies, due serially through 2016 ¥3,144 ¥ 15,528 $38,253
Less current maturities (658) (13,865) (8,006)
Long-term debt due after one year ¥2,486 ¥ 1,663 $30,247
Assets pledged as collateral for other non-current liabilities at March 31,
2012 and 2011, were as follows:
Millions of yen
Thousands of U.S. dollars
(Note 1)
March 31, 2012 2011 2012
Land ¥4,280 ¥4,280 $52,074Buildings and structures, at net book value 2,196 2,317 26,719
Machinery and equipment, at net book value 2 3 24
Total ¥6,478 ¥6,600 $78,817
The annual maturities of long-term debt outstanding at March 31, 2012,
are as follows:
Amount
Year ending March 31, Millions of yen
Thousands of U.S. dollars
(Note 1)
2013 ¥ 658 $ 8,006
2014 658 8,006
2015 246 2,993
2016 82 998
2017 and thereafter 1,500 18,250
Total ¥3,144 $38,253
Note 4 — Lease Transactions(a) Finance Lease Transactions Without Ownership
Transfer to LesseeFinance leases commenced prior to April 1, 2008 which do not transfer own-
ership of leased assets to lessees are accounted for as operating leases.
Assumed amounts of acquisition cost and accumulated depreciation at
March 31, 2012 and 2011 are as follows:
(1) Purchase price equivalents, accumulated depreciation equivalents, and
book value equivalents:
Millions of yen
March 31, 2012 2011
Machinery and equipment:
Purchase price equivalents ¥ 138 ¥ 147
Accumulated depreciation equivalents (62) (54)
Book value equivalents ¥ 76 ¥ 93
Thousands of U.S. dollars
(Note 1)
March 31, 2012
Machinery and equipment:
Purchase price equivalents $1,679Accumulated depreciation equivalents (754)
Book value equivalents $ 925
Purchase price equivalents are calculated using the inclusive-of-interest
method.
(2) Lease commitments
Millions of yen
Thousands of U.S. dollars
(Note 1)
March 31, 2012 2011 2012
Due within one year ¥15 ¥17 $183Due after one year 61 76 742
Total ¥76 ¥93 $925
Lease commitments are calculated using the inclusive-of-interest method.
(3) Lease payments and depreciation equivalents
Millions of yen
Thousands of U.S. dollars
(Note 1)
Year ended March 31, 2012 2011 2010 2012
Lease payments ¥17 ¥18 ¥35 $207Depreciation equivalents 17 18 35 207
(4) Calculation method of depreciation equivalents
Depreciation equivalents are computed by the straight-line method over the
lease period without considering residual value.
(b) Operating Lease TransactionsLease commitments under non-cancelable operating leases:
Millions of yen
Thousands of U.S. dollars
(Note 1)
March 31, 2012 2011 2012
Due within one year ¥542 ¥532 $ 6,594Due after one year 359 399 4,368
Total ¥901 ¥931 $10,962
75 JGC Corporationannual report 2012

Note 5 — Contingencies(1) It is a business practice in Japan for a company to guarantee the indebted-
ness of certain of its trading agents, suppliers, subcontractors and certain
subsidiaries and affiliates. The aggregate amount of such guarantees was
¥20,191 million ($245,662 thousand) and ¥18,498 million at March 31,
2012 and 2011, respectively.
(2) The Company has guaranteed employees’ housing loans and others from
banks in the amount of ¥5million ($61 thousand) and ¥11 million at March
31, 2012 and 2011, respectively.
Note 6 — Net AssetsUnder the Japanese Corporation Law (“the Law”) and regulations, the entire
amount paid for new shares is required to be designated as common stock.
However, a company may, by a resolution of the Board of Directors, designate
an amount not exceeding one-half of the prices of the new shares as additional
paid-in capital, which is included in capital surplus.
In cases where dividend distribution of surplus is made, the smaller of an
amount equal to 10% of the dividend or the excess, if any, of 25% of common
stock over the total of additional paid-in capital and legal earnings reserve
must be set aside as additional paid-in capital or legal earnings reserve.
Additional paid-in capital and legal earnings reserve may not be distrib-
uted as dividends. However, all additional paid-in capital and all legal earnings
reserve may be transferred to other capital surplus and retained earnings,
respectively, which are potentially available for dividends.
Note 7 — Taxes on IncomeThe statutory tax rates for 2012 was 40.7%, and for 2011 and 2010 was 36.2%.
(1) The following table summarizes the significant differences between the
statutory tax rate and the Company’s effective tax rate for financial state-
ment purposes for the years ended March 31, 2012, 2011 and 2010:
2012 2011 2010
Statutory tax rate 40.7% 36.2% 36.2%
Non-deductible expenses 0.4 0.3 0.5
Non-taxable dividend income (4.8) (5.5) (9.0)
Tax credits utilized (0.2) (0.4) (1.3)
Other 7.4 18.9 (2.5)
Effective tax rate 43.5% 49.5% 23.9%
Significant components of the Company’s deferred tax assets and liabili-
ties as of March 31, 2012 and 2011, were as follows:
Millions of yen
Thousands of U.S. dollars
(Note 1)
March 31, 2012 2011 2012
Current deferred taxes
Deferred tax assets:
Excess accrued employees’ bonuses ¥1,781 ¥ 1,660 $ 21,669
Excess reserve for job warranty costs 779 75 9,478
Excess reserve for losses on contracts 1,561 43 18,993
Other 5,806 8,086 70,641
Total current deferred tax assets 9,927 9,864 120,781
Deferred tax liabilities:
Forward exchange contract hedge (176) ¥ (1,501) (2,141)
Net current deferred tax assets ¥9,751 ¥ 8,363 $118,640
For the years ended March 31, 2012 and 2011, there is no valuation
allowance.
Millions of yen
Thousands of U.S. dollars
(Note 1)
March 31, 2012 2011 2012
Non-current deferred taxes
Deferred tax assets:
Loss recognized on percentage-of-completion method not deductible for income tax purposes ¥ 205 ¥ 196 $ 2,494
Employee’s Retirement and Severance benefits 3,795 3,970 46,173
Excess bad debt expenses 633 6,295 7,702Other 919 726 11,181
Total non-current deferred tax assets 5,552 11,187 67,551
Deferred tax liabilities:
Net unrealized holding gains on securities (1,282) (1,890) (15,598)
Other (133) (134) (1,618)
Total deferred tax liabilities (1,417) (2,024) (17,216)
Net non-current deferred tax assets ¥ 4,136 ¥ 9,163 $ 50,322
Deferred tax liabilities for land revaluation ¥ 3,692 ¥ 3,783 $ 44,920
For the years ended March 31, 2012 and 2011, the valuation allowances
of ¥6,132 million ($74,608 thousand) and ¥145 million have been deducted
from the gross amount of the non-current deferred tax assets, respectively.
76 JGC Corporationannual report 2012

(2) Adjustment of deferred tax assets and liabilities for enacted changes in tax
laws and rates
On December 2, 2011, amendments to the Japanese tax regulations were
enacted into law. As a result of these amendments, net Deferred tax assets
and Net unrealized holding gains on securities increased by ¥526 million
($6,400 thousand) and ¥21 million ($256 thousand) as of March 31, 2012 .
And Deferred income tax expense recognized for the year ended March 31,
2012 and Deferred gains on hedges as of March 31, 2012 decreased by ¥506
million ($6,156 thousand) and ¥1 million ($12 thousand).
Note 8 — Land RevaluationPursuant to Article 2 of the Enforcement Ordinance for the Law Concerning
Land Revaluation (the “Law”) effective March 31, 1998, the Company
recorded its owned land used for business at the fair value as of March 31,
2002, and the related revaluation difference, net of income taxes, was debited
to “land revaluation, net of deferred tax portion” in the net assets section. The
applicable income tax portion was reported as DEFERRED TAX LIABILITIES
FOR LAND REVALUATION in the non-consolidated balance sheet at March
31, 2012 and 2011. When such land is sold, land revaluation is reversed and
debited to retained earnings.
Fair value of revalued land as of March 31, 2012 was ¥2,919 million
($35,515 thousand) less than the book value as of March 31, 2012.
Note 9 — Impairment of Fixed assetsAs discussed in Note 1 (i), the Company have applied the accounting standard
for impairment of fixed assets.
The Company have grouped their fixed assets principally based on their
business segment, while considering mutual supplementation of the cash flows.
Loss on impairment of fixed assets for the year ended March 31, 2012
consisted of the following:
Location Use Type of assets
Sendai (Japan) Rental Property Land
Carrying amount of certain assets were devalued to their recoverable
amounts, since the land’s market value have significantly declined. As a result,
The Company recognized loss on impairment in the amount of ¥420 million
($5,110 thousand). The recoverable amounts are calculated according to
estimated net sales value, which are real-estate appraisal.
Note 10 — Subsequent EventAt the Company’s board of directors held on June 18, 2012, the board of
directors decided the Company’s wholly owned subsidiary JGC Corporation
Europe B.V., which is a hub of procurement of equipment, will liquidate before
the end of 2012. The effect on operations from the liquidation is immaterial.
77 JGC Corporationannual report 2012

To the Board of Directors of JGC Corporation
We have audited the accompanying non-consolidated financial statements of JGC Corporation which comprise the non-consolidated
balance sheets as of March 31, 2012 and 2011, and non-consolidated statements of income and non-consolidated statements of
changes in net assets for each of the years in the three-year period ended March 31, 2012, and a summary of significant accounting
policies and other explanatory information.
Management’s Responsibility for the Financial StatementsManagement is responsible for the preparation and fair presentation of these financial statements in accordance with accounting prin-
ciples generally accepted in Japan, and for such internal control as management determines is necessary to enable the preparation of
financial statements that are free from material misstatements, whether due to fraud or error.
Auditor’s ResponsibilityOur responsibility is to express an opinion on these financial statements based on our audits. We conducted our audits in accordance
with auditing standards generally accepted in Japan. Those standards require that we comply with ethical requirements and plan and
perform the audit to obtain reasonable assurance about whether the financial statements are free from material misstatement.
An audit involves performing procedures to obtain audit evidence about the amounts and disclosures in the financial statements. The
procedures selected depend on the our judgement, including the assessment of the risks of material misstatement of the financial
statements, whether due to fraud or error. In making those risk assessments, we consider internal control relevant to the entity’s prepa-
ration and fair presentation of the financial statements in order to design audit procedures that are appropriate in the circumstances,
while the objective of the financial statement audit is not for the purpose of expressing an opinion on the effectiveness of the entity’s
internal control. An audit also includes evaluating the appropriateness of accounting policies used and the reasonableness of account-
ing estimates made by management, as well as evaluating the overall presentation of the financial statements.
We believe that the audit evidence we have obtained is sufficient and appropriate to provide a basis for our audit opinion.
OpinionIn our opinion, the non-consolidated financial statements present fairly, in all material respects, the financial position of JGC Corporation
as of March 31, 2012 and 2011, and their financial performance for each of the years in the three-year period ended March 31, 2012
in accordance with accounting principles generally accepted in Japan.
Convenience TranslationThe U.S. dollar amounts in the accompanying non-consolidated financial statements with respect to the year ended March 31, 2012
are presented solely for convenience. Our audit also included the translation of yen amounts into U.S. dollar amounts and, in our opin-
ion, such translation has been made on the basis described in Note 1 to the financial statements.
(KPMG AZSA LLC)
Tokyo, Japan
June 28, 2012
Independent Auditor’s ReportJGC CORPORATION
78 JGC Corporationannual report 2012

System Solution Services JGC Information Systems Co., Ltd.
Equipment Procurement JGC Trading and Services Co., Ltd. JGC Corporation Europe B.V. JGC (USA), Inc.
Specialized Consulting Services Japan NUS Co., Ltd.
Office Support Services Nikki Business Services Co., Ltd.
Water & Power Generation Business JGC-ITC Rabigh Utility Co., Ltd.
Oil & Gas Production and Sales Business JGC Energy Development (USA) Inc.
JGC Exploration Eagle Ford LLC
Catalysts and fine productsTotal engineeringOthers
JGC Catalysts & Chemicals Ltd.
Japan Fine Ceramics Co., Ltd.
Nikki-Universal Co., Ltd.
JGC Plant Solutions Co., Ltd.
JGC PLANTECH Co., Ltd.
JGC PLANTECH AOMORI Co., Ltd.
Nikki-Universal Co., Ltd.
JMD Greenhouse-Gas Reduction Co., Ltd.
JGC SINGAPORE PTE LTD
JGC PHILIPPINES, INC.
PT. JGC INDONESIA
JGC Gulf International Co., Ltd.
JGC OCEANIA PTY LTD
Consolidated subsidiary Non-consolidated, non-equity-method subsidiary
Equity-method subsidiary or affiliate Non-equity-method subsidiary or affiliate
Total engineering
Business Company Country Capital Capital Share Other
Engineering & Construction Services
JGC Plant Solutions Co., Ltd. Japan ¥695,000,000 100%
JGC SINGAPORE PTE LTD Singapore S$2,100,000 100%
JGC PHILIPPINES, INC. Philippines P340,000,000 100%
PT. JGC INDONESIA Indonesia US$1,600,000 100% * JGC 70%* JGC Plant Solutions 30%
JGC Gulf International Co. Ltd. Saudi Arabia SAR187,500,00 100% * JGC 92%
* JGC SINGAPORE 8%
JGC OCEANIA PTY LTD Australia A$1,000,000 100%
Maintenance Services JGC PLANTECH Co., Ltd. Japan ¥135,000,000 100%
JGC PLANTECH AOMORI Co., Ltd. Japan ¥50,000,000 100% * JGC PLANTECH 100%
Process Licensing Services Nikki-Universal Co., Ltd. Japan ¥1,000,000,000 50%
Global Warming Gas- Emissions Credits Business
JMD Greenhouse-Gas Reduction Co., Ltd. Japan ¥30,000,000 47%
Catalysts and fine products
Company Country Capital Capital Share Other
JGC Catalysts & Chemicals Ltd. Japan ¥1,800,000,000 100%
Japan Fine Ceramics Co., Ltd. Japan ¥300,000,000 100%
Nikki-Universal Co., Ltd. Japan ¥1,000,000,000 50%
Others
Business Company Country Capital Capital Share Other
System Solution Services JGC Information Systems Co., Ltd. Japan ¥400,000,000 100%
Equipment Procurement JGC Trading and Services Co., Ltd. Japan ¥40,000,000 24.50%
JGC Corporation Europe B.V. The Netherlands €2,768,000 100%
JGC (USA) Inc. U.S.A. US$100,000 100%
Specialized Consulting Services Japan NUS Co., Ltd. Japan ¥50,000,000 80%
Office Support Services Nikki Business Services Co., Ltd. Japan ¥1,455,000,000 100%
Water & Power Generation Business
JGC-ITC Rabigh Utility Co., Ltd. Japan ¥319,533,500 55.43%
Oil & Gas Production and Sales Business
JGC Energy Development (USA) Inc. U.S.A. US$123,000,000 100%
JGC Exploration Eagle Ford LLC U.S.A. US$65,000,000 100%
JGC CORPORATION
Provision of products and services
JGC GroupAs of March 31, 2012
79 JGC Corporationannual report 2012

Established October 25, 1928
Capital ¥23,511,189,612
Number of Employees 2,155 (Consolidated: 6,524)
Major Shareholders Number of shares (thousands)
Percentage of total (%)
Japan Trustee Services Bank, Ltd. (Trust Account) 19,648 7.58
The Master Trust Bank of Japan, Ltd. (Trust Account) 17,036 6.57
JGC Trading and Services Co., Ltd. 12,112 4.67
Sumitomo Mitsui Banking Corp. 11,000 4.24
JGC-S SCHOLARSHIP FOUNDATION 8,433 3.25
Mizuho Corporate Bank, Ltd. 5,700 2.20
SSBT OD05 OMNIBUS ACCOUNT - TREATY CLIENTS 3,942 1.52
Mellon Bank, N.A. as Agent for its Client Mellon Omnibus US Pension 3,636 1.40
State Street Bank and Trust Company 505223 3,421 1.32
State Street Bank and Trust Company 3,328 1.28
JGC’s treasury stock holdings total 6,572 thousands shares, approximately 2.53% of total shares issued.
Authorized Shares 600,000,000
Issued and Outstanding Shares 259,052,929
Number of Shareholders 9,001
Administrator of the Shareholders’ Register
Mitsubishi UFJ Trust and Banking Corp. 4-5, Marunouchi 1-chome, Chiyoda-ku, Tokyo 100-8212, Japan
Distribution of Shareholders (%)
Stock Price
Banks 7.71
Foreign investors 38.95
Treasury stock 2.53
Other domestic corporations 12.87
Life and non-life insurance corporations 4.01
Trust banks (including trust accounts) 22.03
Financial instruments firms 4.22
Individuals and others 7.68
0
20,000
40,000
60,000
80,000
1 2 3 4 5 6 7 8 9 10 11 12 1 2 3 4 5 6 7 8 9 10 11 12 1 2 3 4 5 6 7 8 9 10 11 12 12009 2010 2011
2 3 4 5 62012
0
1,000
2,000
3,000
0
15,000
30,000
45,000
Volume (Thousands of shares)
JGC Stock Price (Yen) Nikkei Stock Average (Yen)
Nikkei Stock Average
JGC Stock Price
Outline of JGCAs of March 31, 2012
80 JGC Corporationannual report 2012
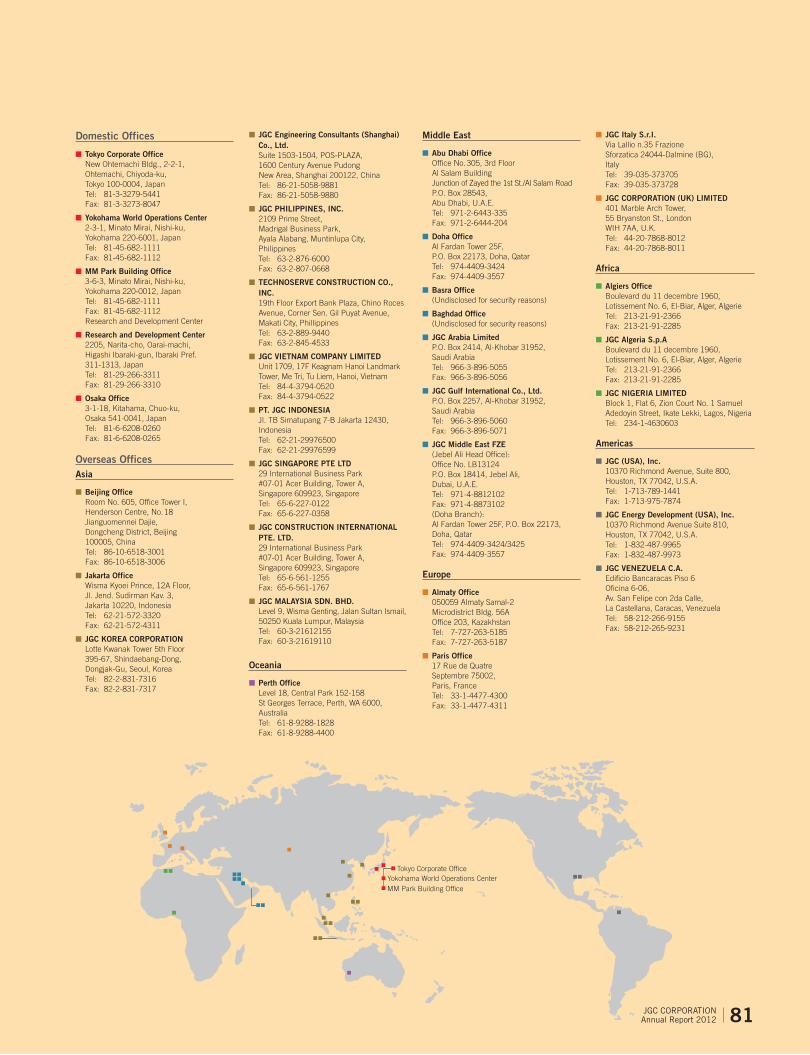
Domestic Offices
Tokyo Corporate OfficeNew Ohtemachi Bldg., 2-2-1, Ohtemachi, Chiyoda-ku,Tokyo 100-0004, JapanTel: 81-3-3279-5441Fax: 81-3-3273-8047
Yokohama World Operations Center2-3-1, Minato Mirai, Nishi-ku,Yokohama 220-6001, JapanTel: 81-45-682-1111Fax: 81-45-682-1112
MM Park Building Office3-6-3, Minato Mirai, Nishi-ku,Yokohama 220-0012, JapanTel: 81-45-682-1111Fax: 81-45-682-1112Research and Development Center
Research and Development Center2205, Narita-cho, Oarai-machi, Higashi Ibaraki-gun, Ibaraki Pref.311-1313, JapanTel: 81-29-266-3311Fax: 81-29-266-3310
Osaka Office3-1-18, Kitahama, Chuo-ku,Osaka 541-0041, JapanTel: 81-6-6208-0260Fax: 81-6-6208-0265
Overseas OfficesAsia
Beijing OfficeRoom No. 605, Office Tower I,Henderson Centre, No. 18Jianguomennei Dajie,Dongcheng District, Beijing100005, ChinaTel: 86-10-6518-3001Fax: 86-10-6518-3006
Jakarta OfficeWisma Kyoei Prince, 12A Floor,Jl. Jend. Sudirman Kav. 3,Jakarta 10220, IndonesiaTel: 62-21-572-3320Fax: 62-21-572-4311
JGC KOREA CORPORATIONLotte Kwanak Tower 5th Floor395-67, Shindaebang-Dong,Dongjak-Gu, Seoul, KoreaTel: 82-2-831-7316Fax: 82-2-831-7317
JGC Engineering Consultants (Shanghai) Co., Ltd.Suite 1503-1504, POS-PLAZA,1600 Century Avenue PudongNew Area, Shanghai 200122, ChinaTel: 86-21-5058-9881Fax: 86-21-5058-9880
JGC PHILIPPINES, INC.2109 Prime Street,Madrigal Business Park,Ayala Alabang, Muntinlupa City,PhilippinesTel: 63-2-876-6000Fax: 63-2-807-0668
TECHNOSERVE CONSTRUCTION CO., INC.19th Floor Export Bank Plaza, Chino Roces Avenue, Corner Sen. Gil Puyat Avenue, Makati City, PhillippinesTel: 63-2-889-9440Fax: 63-2-845-4533
JGC VIETNAM COMPANY LIMITEDUnit 1709, 17F Keagnam Hanoi Landmark Tower, Me Tri, Tu Liem, Hanoi, VietnamTel: 84-4-3794-0520Fax: 84-4-3794-0522
PT. JGC INDONESIAJl. TB Simatupang 7-B Jakarta 12430, IndonesiaTel: 62-21-29976500Fax: 62-21-29976599
JGC SINGAPORE PTE LTD29 International Business Park#07-01 Acer Building, Tower A,Singapore 609923, SingaporeTel: 65-6-227-0122Fax: 65-6-227-0358
JGC CONSTRUCTION INTERNATIONAL PTE. LTD.29 International Business Park#07-01 Acer Building, Tower A,Singapore 609923, SingaporeTel: 65-6-561-1255Fax: 65-6-561-1767
JGC MALAYSIA SDN. BHD.Level 9, Wisma Genting, Jalan Sultan Ismail, 50250 Kuala Lumpur, MalaysiaTel: 60-3-21612155Fax: 60-3-21619110
Oceania
Perth OfficeLevel 18, Central Park 152-158 St Georges Terrace, Perth, WA 6000, AustraliaTel: 61-8-9288-1828Fax: 61-8-9288-4400
Middle East
Abu Dhabi OfficeOffice No. 305, 3rd FloorAl Salam BuildingJunction of Zayed the 1st St./Al Salam RoadP.O. Box 28543, Abu Dhabi, U.A.E. Tel: 971-2-6443-335 Fax: 971-2-6444-204
Doha OfficeAl Fardan Tower 25F,P.O. Box 22173, Doha, Qatar Tel: 974-4409-3424 Fax: 974-4409-3557
Basra Office(Undisclosed for security reasons)
Baghdad Office(Undisclosed for security reasons)
JGC Arabia LimitedP.O. Box 2414, Al-Khobar 31952,Saudi ArabiaTel: 966-3-896-5055Fax: 966-3-896-5056
JGC Gulf International Co., Ltd.P.O. Box 2257, Al-Khobar 31952, Saudi ArabiaTel: 966-3-896-5060Fax: 966-3-896-5071
JGC Middle East FZE(Jebel Ali Head Office):Office No. LB13124P.O. Box 18414, Jebel Ali, Dubai, U.A.E.Tel: 971-4-8812102Fax: 971-4-8873102(Doha Branch):Al Fardan Tower 25F, P.O. Box 22173, Doha, QatarTel: 974-4409-3424/3425Fax: 974-4409-3557
Europe
Almaty Office050059 Almaty Samal-2 Microdistrict Bldg. 56A Office 203, KazakhstanTel: 7-727-263-5185Fax: 7-727-263-5187
Paris Office17 Rue de QuatreSeptembre 75002,Paris, FranceTel: 33-1-4477-4300Fax: 33-1-4477-4311
JGC Italy S.r.I.Via Lallio n.35 Frazione Sforzatica 24044-Dalmine (BG), ItalyTel: 39-035-373705Fax: 39-035-373728
JGC CORPORATION (UK) LIMITED401 Marble Arch Tower, 55 Bryanston St., LondonWIH 7AA, U.K.Tel: 44-20-7868-8012Fax: 44-20-7868-8011
Africa
Algiers OfficeBoulevard du 11 decembre 1960, Lotissement No. 6, El-Biar, Alger, AlgerieTel: 213-21-91-2366Fax: 213-21-91-2285
JGC Algeria S.p.ABoulevard du 11 decembre 1960, Lotissement No. 6, El-Biar, Alger, AlgerieTel: 213-21-91-2366Fax: 213-21-91-2285
JGC NIGERIA LIMITEDBlock 1, Flat 6, Zion Court No. 1 Samuel Adedoyin Street, Ikate Lekki, Lagos, NigeriaTel: 234-1-4630603
Americas
JGC (USA), Inc.10370 Richmond Avenue, Suite 800, Houston, TX 77042, U.S.A.Tel: 1-713-789-1441Fax: 1-713-975-7874
JGC Energy Development (USA), Inc.10370 Richmond Avenue Suite 810, Houston, TX 77042, U.S.A.Tel: 1-832-487-9965Fax: 1-832-487-9973
JGC VENEZUELA C.A.Edificio Bancaracas Piso 6Oficina 6-06,Av. San Felipe con 2da Calle,La Castellana, Caracas, VenezuelaTel: 58-212-266-9155Fax: 58-212-265-9231
Tokyo Corporate OfficeYokohama World Operations CenterMM Park Building Office
81JGC CorporATioNAnnual report 2012

JGC
CO
RP
OR
ATIO
N A
nnual Rep
ort 2012
2-3-1, Minato Mirai, Nishi-ku, Yokohama 220-6001, JapanTEL. 81-45-682-1111 FAX. 81-45-682-1112www.jgc.co.jp
Printed in Japan