annual report 2011/2012 - amazon web...
TRANSCRIPT
1
“Sustaining the Source and flow of life forever”
(nat.) (056) 515 0200
(intl.) (+2756) 515 0200
(nat.) (056) 515 0369
(intl.) (+2756) 515 0369
(nat.) (056) 515 0200
(intl.) (+2756) 515 0200
(nat.) (056) 515 0369
(intl.) (+2756) 515 0369
PRESENTATION TO THE PORTFOLIO COMMITTEE (Water and Environmental Affairs)
17 – 18 APRIL 2013
ANNUAL REPORT
2011/2012
2
Table of Contents
• Introduction
• Overview of Sedibeng Water
• Corporate Governance
• Feedback on issues raised by Portfolio Committee in 2012
• Strategic Objectives Outcomes 2011/12
• Progress on Strategic Objectives 2012/13
• Alignment of Strategic Objectives with Government Outcomes 2013/14
• Achievements
• Challenges
• Implementation of PAIA / PAJA
• Annual report 2011/12
• Capex 2011/12
• Budget Analysis
17 APRIL 2013
3
Introduction
• The business performance of the organisation is supported by medium and long-term
strategies.
• The annual report provides progress on all strategic imperatives.
• On-going strategic reviews are aligned to performance management system.
• Business reviews are conducted to focus on key priorities.
• This presentation is based on strategic plan, performance reviews and audited
financial statements.
17 APRIL 2013

4
Overview (Area of Supply and Operation)
• Sedibeng Water services an operational area spanning more than 86 000 square
kilometers across three provinces: Free State; North West and Northern Cape.
• Sedibeng Water operates 9 water treatment plants and 3 waste water treatment plants
• Provide portable water and sanitation treatment to more than 2.5 million people.
• Provide retail water supply on behalf of WSA’s in North West Region
17 APRIL 2013
5 5
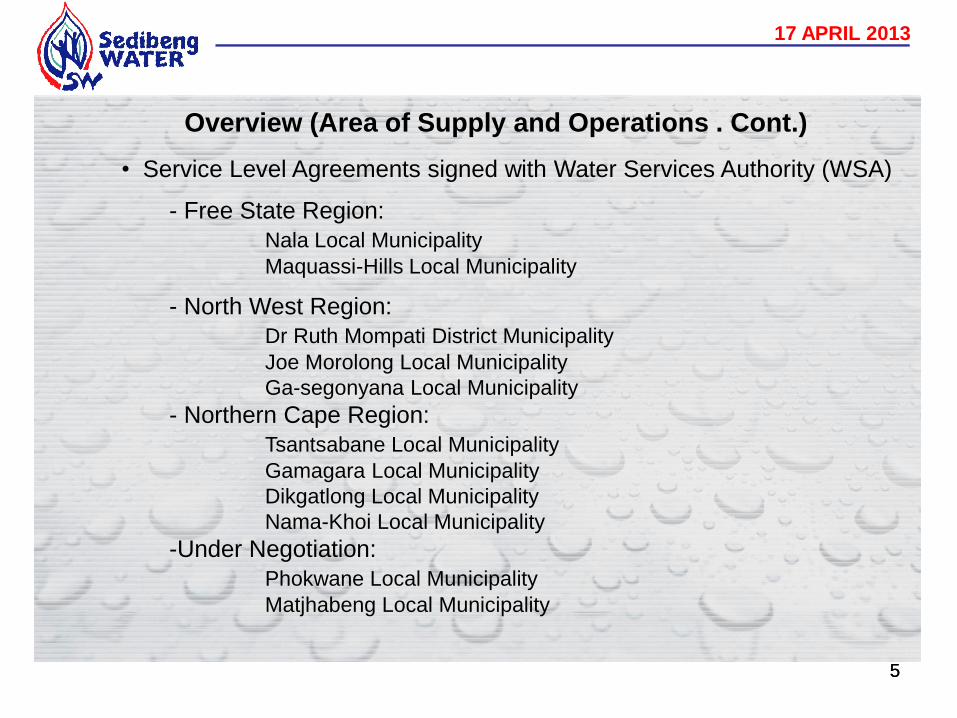
Overview (Area of Supply and Operations . Cont.)
• Service Level Agreements signed with Water Services Authority (WSA)
- Free State Region:
Nala Local Municipality
Maquassi-Hills Local Municipality
- North West Region:
Dr Ruth Mompati District Municipality
Joe Morolong Local Municipality
Ga-segonyana Local Municipality
- Northern Cape Region:
Tsantsabane Local Municipality
Gamagara Local Municipality
Dikgatlong Local Municipality
Nama-Khoi Local Municipality
-Under Negotiation:
Phokwane Local Municipality
Matjhabeng Local Municipality
17 APRIL 2013

6
Overview (Area of Supply and Operation . cont.)
17 APRIL 2013
7
Corporate Governance
Committees:
• Board:
- Executive
- Finance Committee,
- Audit Committee
- Human Capital Committee
17 APRIL 2013
8
Feedback on issues raised by Portfolio Committee in 2012
Board Appointment
• Sedibeng Water has submitted a shortlist of candidates to the Minister of Water and
Environmental Affairs for the appointment of the Board
Outstanding Debts
• Matjhabeng LM declared a dispute on their accounts and took the matter to court.
The court ruled that the municipality must pay the current account less the disputed
portion of the account until the Arbitration is settled.
• Sedibeng Water has requested the Minister to appoint the Arbitrator in line with the
court ruling.
• Sedibeng Water has entered into debt settlement agreements with the municipalities
that are owing. Where the municipalities are failing to pay their accounts, water
restrictions are applied in accordance with the Water Services Act.
17 APRIL 2013

9
17 APRIL 2013
SEDIBENG WATER – AGE ANALYSIS
SECTOR 30 June 2011 30 June 2012 31 March 2013 30 June 2013
Projected
Municipality / WSA 413,070,890.66 620,592,042.22 682,626,306.69 706,023,805.05
TOTAL 413,070,890.66 620,592,042.22 682,626,306.69 706,023,805.05
% Movement 0% 50% 10% 13%
10
17 APRIL 2013
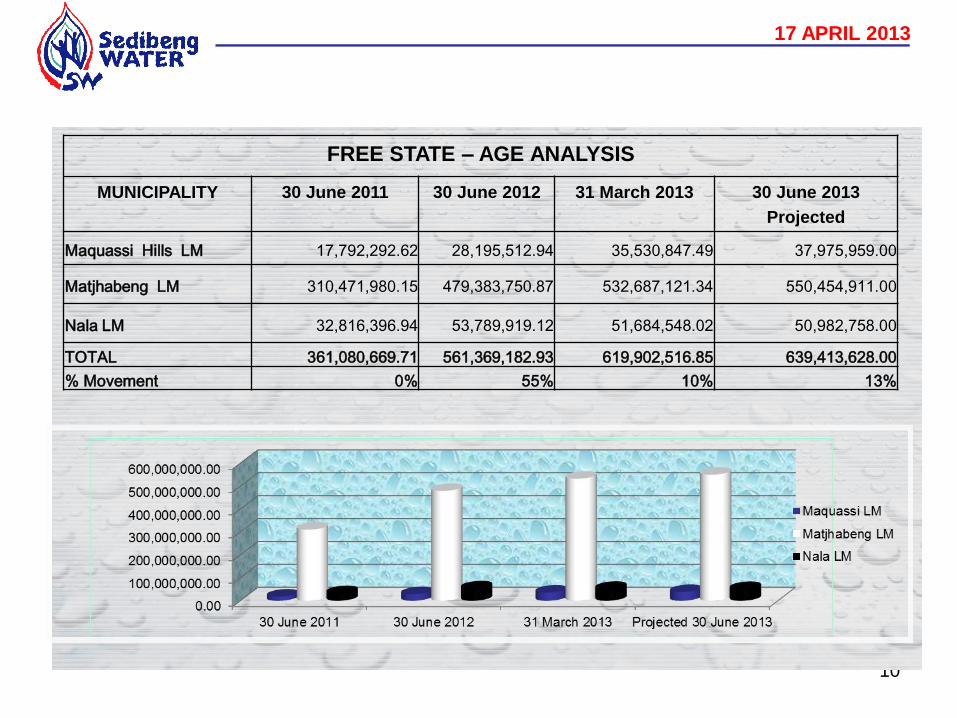
FREE STATE – AGE ANALYSIS
MUNICIPALITY 30 June 2011 30 June 2012 31 March 2013 30 June 2013
Projected
Maquassi Hills LM 17,792,292.62 28,195,512.94 35,530,847.49 37,975,959.00
Matjhabeng LM 310,471,980.15 479,383,750.87 532,687,121.34 550,454,911.00
Nala LM 32,816,396.94 53,789,919.12 51,684,548.02 50,982,758.00
TOTAL 361,080,669.71 561,369,182.93 619,902,516.85 639,413,628.00
% Movement 0% 55% 10% 13%
11
Investments
17 APRIL 2013
Institution 2012
(R’000)
2011
(R’000)
Sanlam 37 149 32 707
Investec 59 922 52 697
ABSA Bank 26 690 43 353
First Corp Investment 9 121 8 174
Total 132 882 136 931
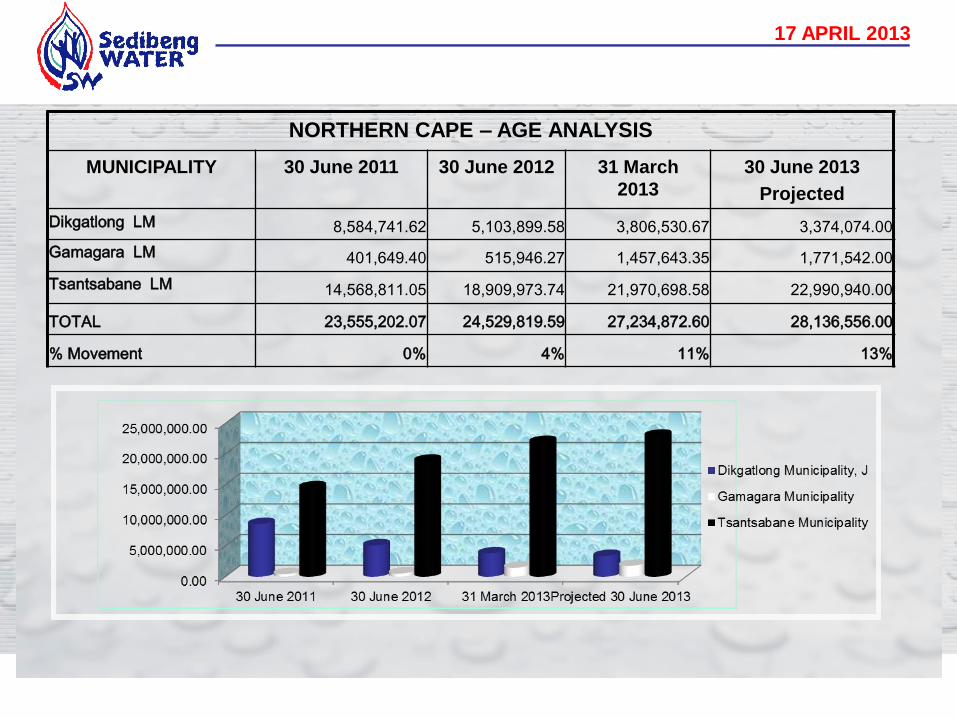
NORTHERN CAPE – AGE ANALYSIS
MUNICIPALITY 30 June 2011 30 June 2012 31 March
2013
30 June 2013
Projected
Dikgatlong LM 8,584,741.62 5,103,899.58 3,806,530.67 3,374,074.00
Gamagara LM 401,649.40 515,946.27 1,457,643.35 1,771,542.00
Tsantsabane LM 14,568,811.05 18,909,973.74 21,970,698.58 22,990,940.00
TOTAL 23,555,202.07 24,529,819.59 27,234,872.60 28,136,556.00
% Movement 0% 4% 11% 13%
12
17 APRIL 2013
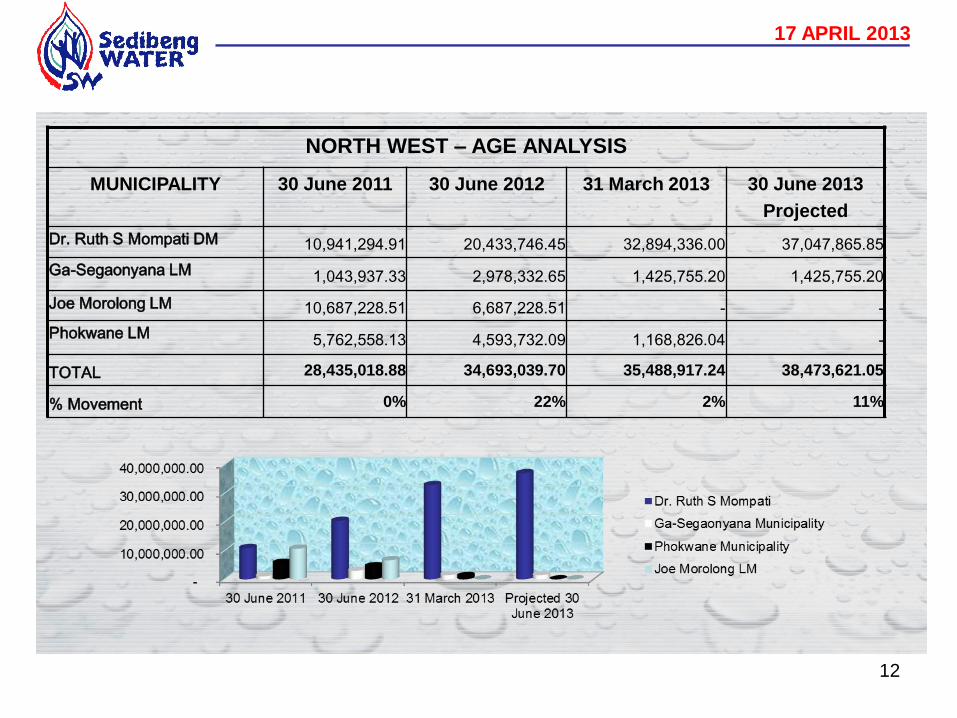
NORTH WEST – AGE ANALYSIS
MUNICIPALITY 30 June 2011 30 June 2012 31 March 2013 30 June 2013
Projected
Dr. Ruth S Mompati DM 10,941,294.91 20,433,746.45 32,894,336.00 37,047,865.85
Ga-Segaonyana LM 1,043,937.33 2,978,332.65 1,425,755.20 1,425,755.20
Joe Morolong LM 10,687,228.51 6,687,228.51 - -
Phokwane LM 5,762,558.13 4,593,732.09 1,168,826.04 -
TOTAL 28,435,018.88 34,693,039.70 35,488,917.24 38,473,621.05
% Movement 0% 22% 2% 11%
13
Feedback on issues raised by Portfolio Committee in 2012 (Cont.)
Disciplinary Action
• The mediation hearing took place on the 06 December 2012. The matter was
resolved amicably. The Director’s contract of employment has been terminated.
17 APRIL 2013

14 14
17 APRIL 2013
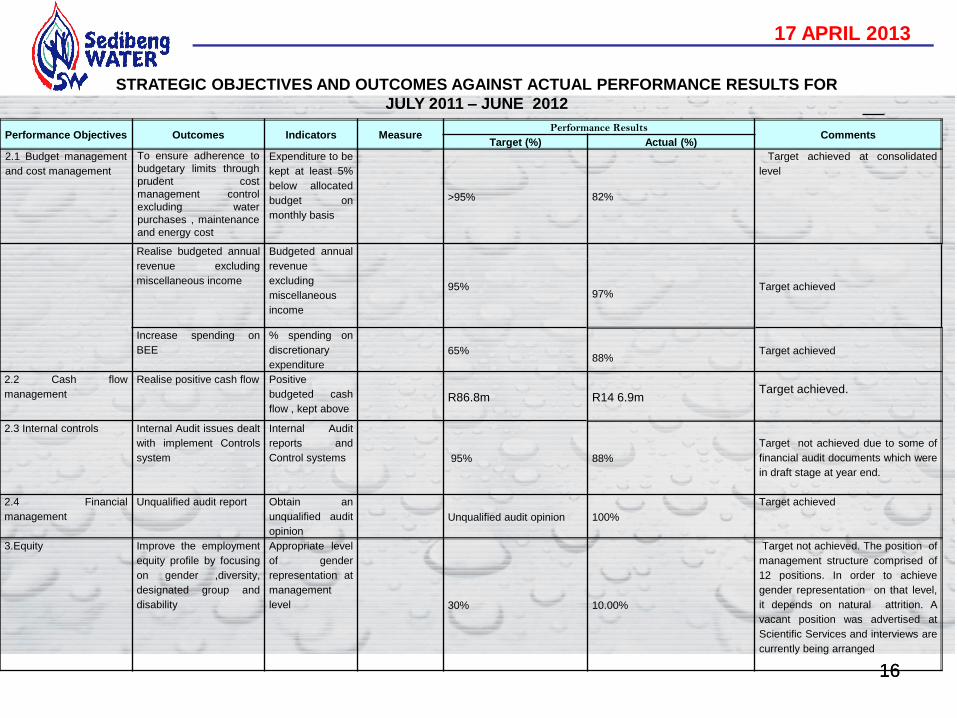
STRATEGIC OBJECTIVES AND OUTCOMES AGAINST ACTUAL PERFORMANCE RESULTS FOR
JULY 2011 – JUNE 2012
Performance Objectives Outcomes Indicators Measure Performance Results
Comments Target (%) Actual (%)
1.1 Security of supply and
reliability of services
Improved plant
reliability
Mean time to
repair (hours)
Free State (FS):
Target achieved.
Target achieved.
Target achieved.
24 hours = 0
Northern Cape (NC):
VGG = 0
Namakwa = 0
North West (NW):
= 0
1.2 Treatment processes Meet customer
demand in terms of
quality
Test Results,
SANS or Blue
Drop. Class 1:
Chemistry
% 95
Free State (FS): Target achieved.
Target achieved.
Target achieved.
Chemical failures were as a result of
turbidity due to Bogosing Plant
inefficiencies.
Nitrates were also not meeting
specification on a number of
boreholes samples.
Class 1
- Bacteriological = 99.7%
- Chemical = 99.6%
Northern Cape VGG
Class 1
- Bacteriological = 98.7%
- Chemical = 98.6%
Namakwa
Class 1
- Bacteriological = 99.9%
- Chemical = 99.9%
North West (NW):
Class 1
- Bacteriological = 96.4%
- Chemical = 88.8%
1.3 Adequate infrastructure
Improved and build
capacity on
infrastructure
% compliance to
capital plan
95%
Target achieved.
129%

15 15
17 APRIL 2013
Performance Objectives Outcomes Indicators Measure Performance Results
Comments Target (%) Actual (%)
1.4 Resource protection
Reduce water losses
in the production and
distribution system
% acceptable water
losses
10% Free State:
Total water losses =
5.8%
Northern Cape VGG:
Total water losses =
21.53%
Northern Cape
Namakwa:
None
Target achieved
The meter at Beeshoek pump
station is wrongly calibrated. It
shows Sedibeng Water pumping
more water than what is
purchased from Kolomele mine
with over readings of 15.72%. All
the meters were calibrated to
correct the issue.
Meter was installed at the
Orange River pump station in
June 2012
2. Debt collection and cost
recovery
Effective debt
collection and cost
recovery
Collection service delivery
fees in the NW Region
65% 93% Target achieved
Collect bulk water
revenue from
municipalities in the FS
and NC Regions
75% 46% Target not achieved due to
municipalities that are failing to
pay their current account when
due as a result of high
outstanding debt. The main
contributor is Matjhabeng LM
with a debt of R483
Collect bulk water
revenue from business
accounts in the FS and
NC Regions
103%
Target achieved. 100%
STRATEGIC OBJECTIVES AND OUTCOMES AGAINST ACTUAL PERFORMANCE RESULTS FOR
JULY 2011 – JUNE 2012
16 16
17 APRIL 2013
Performance Objectives Outcomes Indicators Measure Performance Results
Comments Target (%) Actual (%)
2.1 Budget management
and cost management
To ensure adherence to
budgetary limits through
prudent cost
management control
excluding water
purchases , maintenance
and energy cost
Expenditure to be
kept at least 5%
below allocated
budget on
monthly basis
>95% 82%
Target achieved at consolidated
level
Realise budgeted annual
revenue excluding
miscellaneous income
Budgeted annual
revenue
excluding
miscellaneous
income
95% Target achieved 97%
Increase spending on
BEE
% spending on
discretionary
expenditure
65% Target achieved 88%
2.2 Cash flow
management
Realise positive cash flow Positive
budgeted cash
flow , kept above R86.8m R14 6.9m
Target achieved.
2.3 Internal controls Internal Audit issues dealt
with implement Controls
system
Internal Audit
reports and
Control systems 95% 88%
Target not achieved due to some of
financial audit documents which were
in draft stage at year end.
2.4 Financial
management
Unqualified audit report Obtain an
unqualified audit
opinion
Unqualified audit opinion 100%
Target achieved
3.Equity Improve the employment
equity profile by focusing
on gender ,diversity,
designated group and
disability
Appropriate level
of gender
representation at
management
level 30% 10.00%
Target not achieved. The position of
management structure comprised of
12 positions. In order to achieve
gender representation on that level,
it depends on natural attrition. A
vacant position was advertised at
Scientific Services and interviews are
currently being arranged
STRATEGIC OBJECTIVES AND OUTCOMES AGAINST ACTUAL PERFORMANCE RESULTS FOR
JULY 2011 – JUNE 2012
17 APRIL 2013
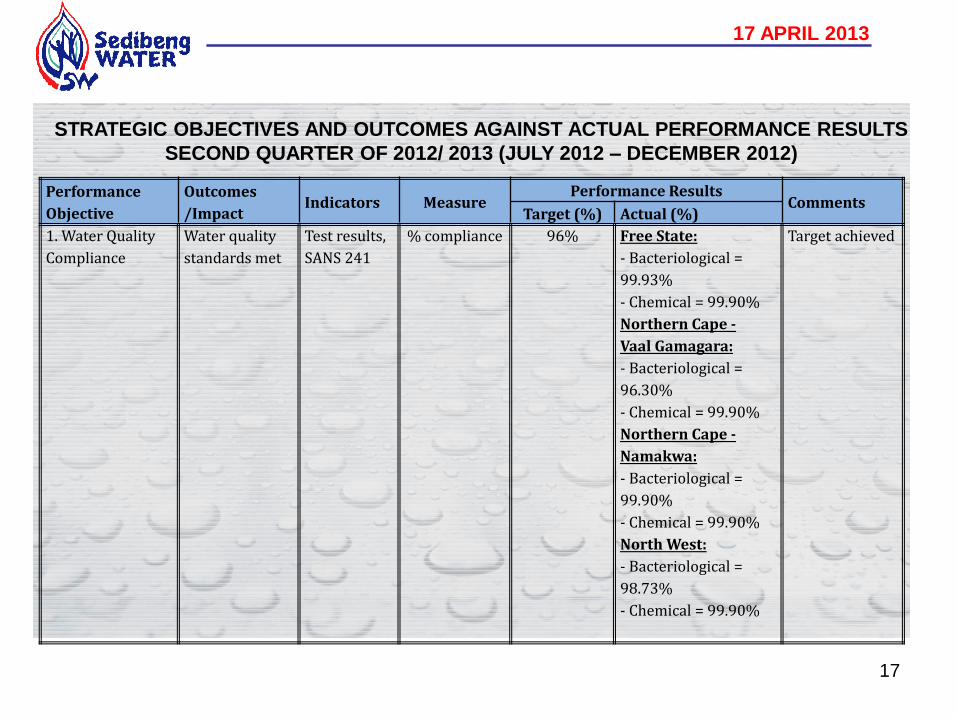
STRATEGIC OBJECTIVES AND OUTCOMES AGAINST ACTUAL PERFORMANCE RESULTS
SECOND QUARTER OF 2012/ 2013 (JULY 2012 – DECEMBER 2012)
17
Performance
Objective
Outcomes
/Impact Indicators Measure
Performance Results Comments
Target (%) Actual (%)
1. Water Quality
Compliance
Water quality
standards met
Test results,
SANS 241
% compliance 96% Free State:
- Bacteriological =
99.93%
- Chemical = 99.90%
Northern Cape -
Vaal Gamagara:
- Bacteriological =
96.30%
- Chemical = 99.90%
Northern Cape -
Namakwa:
- Bacteriological =
99.90%
- Chemical = 99.90%
North West:
- Bacteriological =
98.73%
- Chemical = 99.90%
Target achieved
17 APRIL 2013
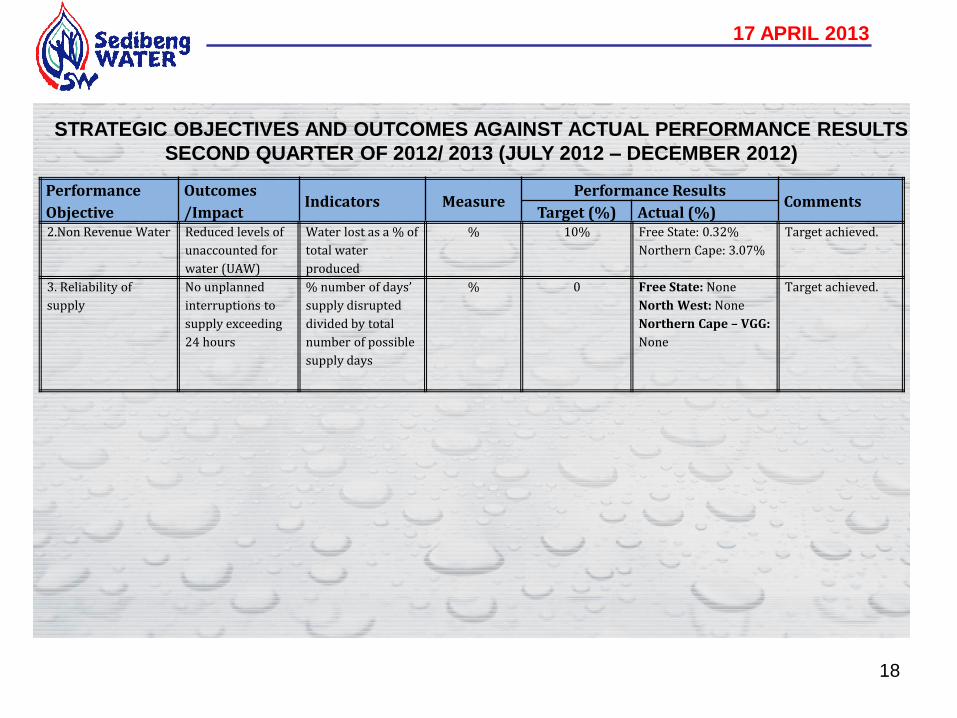
STRATEGIC OBJECTIVES AND OUTCOMES AGAINST ACTUAL PERFORMANCE RESULTS
SECOND QUARTER OF 2012/ 2013 (JULY 2012 – DECEMBER 2012)
18
Performance
Objective
Outcomes
/Impact Indicators Measure
Performance Results Comments
Target (%) Actual (%) 2.Non Revenue Water Reduced levels of
unaccounted for
water (UAW)
Water lost as a % of
total water
produced
% 10% Free State: 0.32%
Northern Cape: 3.07%
Target achieved.
3. Reliability of
supply
No unplanned
interruptions to
supply exceeding
24 hours
% number of days’
supply disrupted
divided by total
number of possible
supply days
% 0 Free State: None
North West: None
Northern Cape – VGG:
None
Target achieved.

17 APRIL 2013
STRATEGIC OBJECTIVES AND OUTCOMES AGAINST ACTUAL PERFORMANCE RESULTS
SECOND QUARTER OF 2012/ 2013 (JULY 2012 – DECEMBER 2012)
)
19
Performance
Objective
Outcomes
/Impact Indicators Measure
Performance Results Comments
Target (%) Actual (%) 3. Reliability of
supply (continued)
No unplanned
interruptions to
supply exceeding
24 hours
% number of days’
supply disrupted
divided by total
number of possible
supply days
% 0 Northern Cape –
Namakwa: Yes
Target achieved.
4. Financial Reporting
Compliance
Unqualified audit
report
Annual external
audit
Qualified /
Unqualified
Unqualified
Report
Annual Target achieved.
No financial
systems break-
down was
experienced which
may lead to
qualified audit
report.
5. Staff Turnover Optimal staff
retention
% staff leaving % 8% 0.80% Target achieved.
17 APRIL 2013
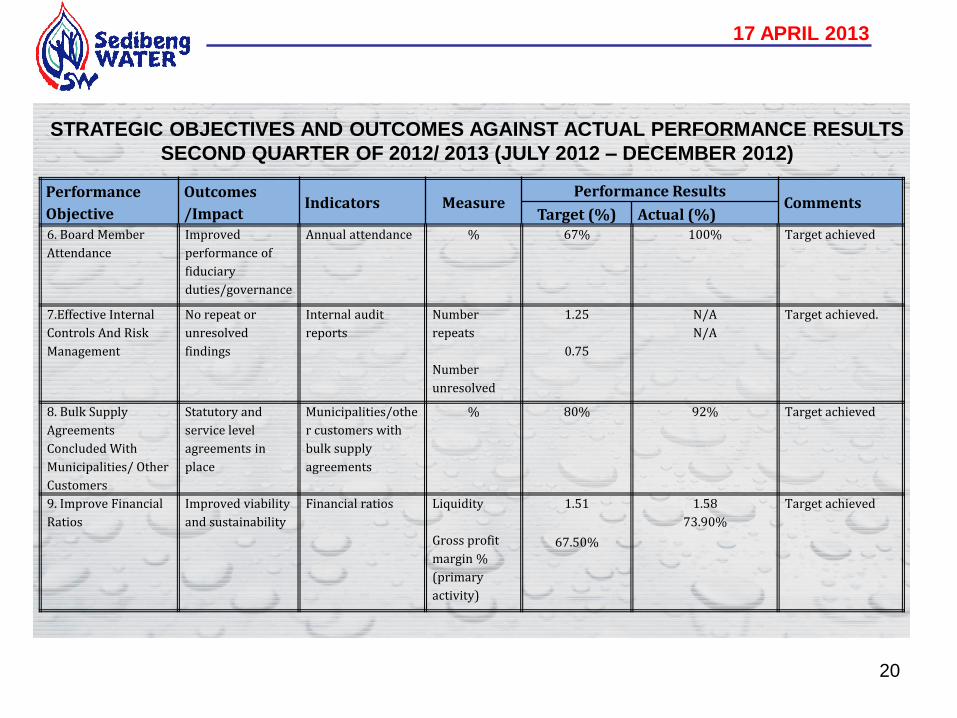
STRATEGIC OBJECTIVES AND OUTCOMES AGAINST ACTUAL PERFORMANCE RESULTS
SECOND QUARTER OF 2012/ 2013 (JULY 2012 – DECEMBER 2012)
20
Performance
Objective
Outcomes
/Impact Indicators Measure
Performance Results Comments
Target (%) Actual (%) 6. Board Member
Attendance
Improved
performance of
fiduciary
duties/governance
Annual attendance % 67% 100% Target achieved
7.Effective Internal
Controls And Risk
Management
No repeat or
unresolved
findings
Internal audit
reports
Number
repeats
Number
unresolved
1.25
0.75
N/A
N/A
Target achieved.
8. Bulk Supply
Agreements
Concluded With
Municipalities/ Other
Customers
Statutory and
service level
agreements in
place
Municipalities/othe
r customers with
bulk supply
agreements
% 80% 92% Target achieved
9. Improve Financial
Ratios
Improved viability
and sustainability
Financial ratios Liquidity
Gross profit
margin %
(primary
activity)
1.51
67.50%
1.58
73.90%
Target achieved

17 APRIL 2013
STRATEGIC OBJECTIVES AND OUTCOMES AGAINST ACTUAL PERFORMANCE RESULTS
SECOND QUARTER OF 2012/ 2013 (JULY 2012 – DECEMBER 2012)
21
Performance
Objective
Outcomes
/Impact Indicators Measure
Performance Results Comments
Target (%) Actual (%) 9. Improve Financial
Ratios (continued)
Improved viability
and sustainability
Financial ratios Gross profit
margin %
(secondary
activity)
Net profit
margin %
(primary
activity)
Net profit
margin %
(secondary
activity)
Debt/ Equity
ratio
Return on
assets %
Debtors days #
78.60%
4.91%
5.32%
0.09
0.06
166.79
76.85%
11.56%
21.56%
0.08
0.19
255.39
Target achieved except for
gross profit margin on
secondary activities and
debtors days.
Matjhabeng LM continues to
pay the current account but
no payment is made on the
outstanding debt.

17 APRIL 2013
STRATEGIC OBJECTIVES AND OUTCOMES AGAINST ACTUAL PERFORMANCE RESULTS
SECOND QUARTER OF 2012/ 2013 (JULY 2012 – DECEMBER 2012)
22
Performance
Objective
Outcomes
/Impact Indicators Measure
Performance Results Comments
Target (%) Actual (%) 10. Increase BBBEE
Spend
Spend increased
and increased new
entrants
% of spend
increased and #
of increased
new entrants
% increase
# new entrants
5%
12
Free State
1.08% and there
were no new
entrants.
North West
0.28% and there
were no new
entrants.
Northern Cape
3.86% and no
new entrants
Target not achieved for all
the regions.
The BBBEE spending is
currently at 98.5% for Free
State, 93.15% for North
West and 93.43% for
Northern Cape.
11. Capital
Expenditure
Infrastructure
available to meet
demands
Overall project
expenditure
within R target
% variance
95% 38.4%
38.4% of the total project
budget has been spent to
date
12. Increased Access
to Services
Contribution to
national objectives
CAPEX spend
/projects
CAPEX spend
or number of
expansion
projects
R88.8 Million R34.1 Million
R34.1 Million of the total
project budget has been
spent to date
17 APRIL 2013
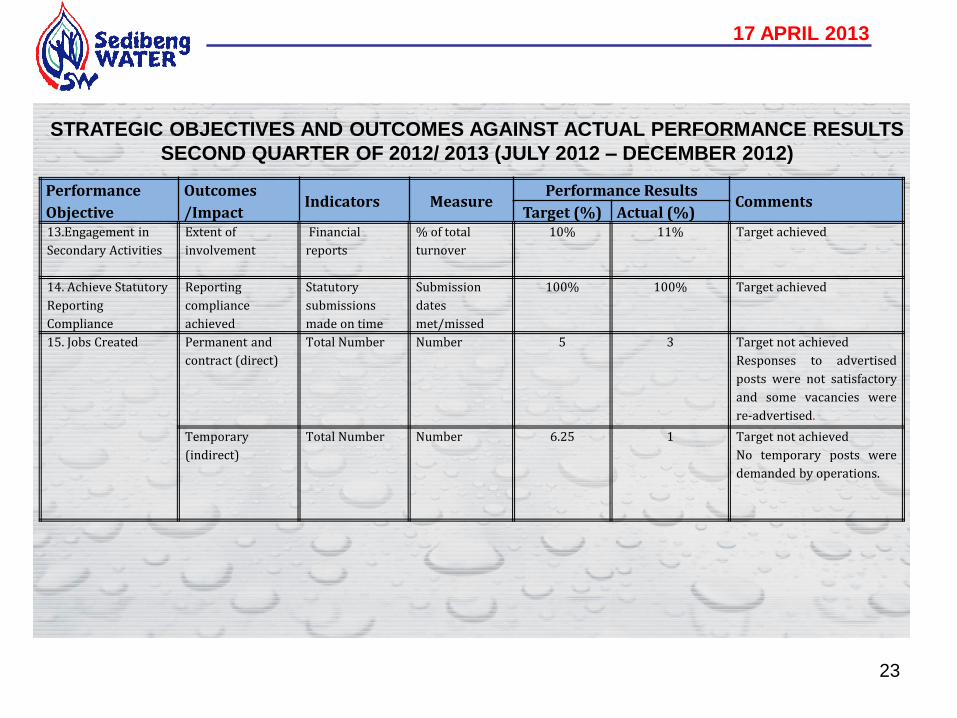
STRATEGIC OBJECTIVES AND OUTCOMES AGAINST ACTUAL PERFORMANCE RESULTS
SECOND QUARTER OF 2012/ 2013 (JULY 2012 – DECEMBER 2012)
23
Performance
Objective
Outcomes
/Impact Indicators Measure
Performance Results Comments
Target (%) Actual (%) 13.Engagement in
Secondary Activities
Extent of
involvement
Financial
reports
% of total
turnover
10% 11% Target achieved
14. Achieve Statutory
Reporting
Compliance
Reporting
compliance
achieved
Statutory
submissions
made on time
Submission
dates
met/missed
100% 100% Target achieved
15. Jobs Created Permanent and
contract (direct)
Total Number Number 5 3 Target not achieved
Responses to advertised
posts were not satisfactory
and some vacancies were
re-advertised.
Temporary
(indirect)
Total Number Number 6.25 1 Target not achieved
No temporary posts were
demanded by operations.
17 APRIL 2013
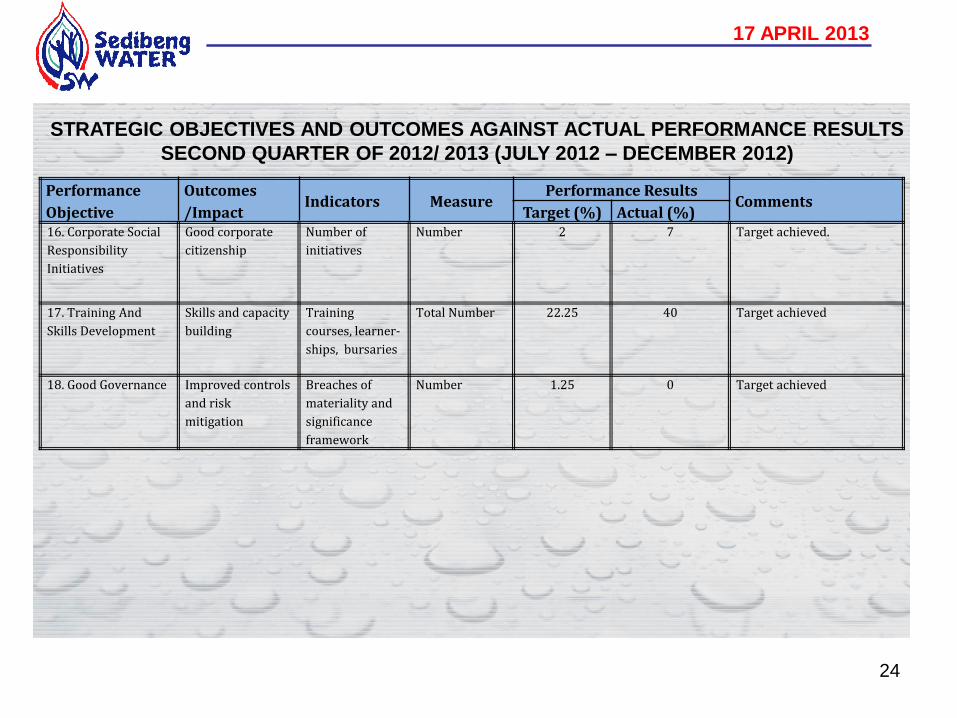
STRATEGIC OBJECTIVES AND OUTCOMES AGAINST ACTUAL PERFORMANCE RESULTS
SECOND QUARTER OF 2012/ 2013 (JULY 2012 – DECEMBER 2012)
24
Performance
Objective
Outcomes
/Impact Indicators Measure
Performance Results Comments
Target (%) Actual (%) 16. Corporate Social
Responsibility
Initiatives
Good corporate
citizenship
Number of
initiatives
Number 2 7 Target achieved.
17. Training And
Skills Development
Skills and capacity
building
Training
courses, learner-
ships, bursaries
Total Number 22.25 40 Target achieved
18. Good Governance Improved controls
and risk
mitigation
Breaches of
materiality and
significance
framework
Number 1.25 0 Target achieved
25 25
Alignment of Strategic Objectives
Sedibeng Water’s strategic plan is informed by the twelve (12) outcomes that are set out in
the National Government MTSF (Medium Term Strategic Framework (2009-2014).
The six (6) MTSF outcomes that are specifically relevant to the Minister of Water and
Environmental Affairs.
The five (5) Strategic Performance Outcomes that constitute the basic of agreement between the Minister
and the President of South Africa.
The five (5) specific Ministerial Outcomes are set out below:
Enhanced Quality and Quantity of water resources;
Improve access to basic services;
Maintenance and supply of bulk water infrastructure (to ensure water security);
Effective institutions to address government outcomes; and
Co-operative governance mechanisms designed to achieve government outcomes.
17 APRIL 2013

26 26 26
Strategic Objectives 2013/2014
17 APRIL 2013
Sedibeng Water Strategic Objectives and priorities are as follows:
Appropriate treatment of waste water and supply of potable water;
Ensure viability and sustainability;
Create an environment that is conducive to the growth and retention of skills;
Effective and efficient communications; and
Ensure compliance to all legislations, policies, standards and norms.

27
17 APRIL 2013
Key Performance Indicators (KPI): 2013/14 – 2017/18
Strategic Objective 1: Appropriate treatment of wastewater and supply of potable water
Performance
Objective
Outcomes
/Impact
Alignment with
MTF
Outcomes
affecting the
Minister
Indicators and/ or Measure
Target
2013/14
Target
2014/15
Target
2015/16
Target
2016/17
Target
2017/18
Security of supply and
reliability of services
Improve plant
reliability
2; 3 & 4
Mean Time To Repair
(hours)
24 hrs
24 hrs
24 hrs
24 hrs
24 hrs
Comply to
maintenance plan
2; 3 & 4
% compliance to maintenance
plan.
95%
90%
90%
90%
90%
Treatment processes
Reduce water losses in
production units
1; 2; & 3
% allowance water losses in
production units.
6%
6%
6%
6%
6%
Meet customer
demand in terms of
quality.
1; 2; 3 & 4
Test Results, SANS or Blue
Drop. Class 1: Chemistry
95%
95%
95%
95%
95%
Adequate infrastructure
Improve and build
capacity on
infrastructure
1; 2; 3 & 4
% compliance to capital plan.
95%
90%
90%
90%
90%
Resource protection
Reduce water losses in
the distribution
system
1; 2; & 3
% acceptable water losses
10%
10%
10%
10%
10%
28
17 APRIL 2013
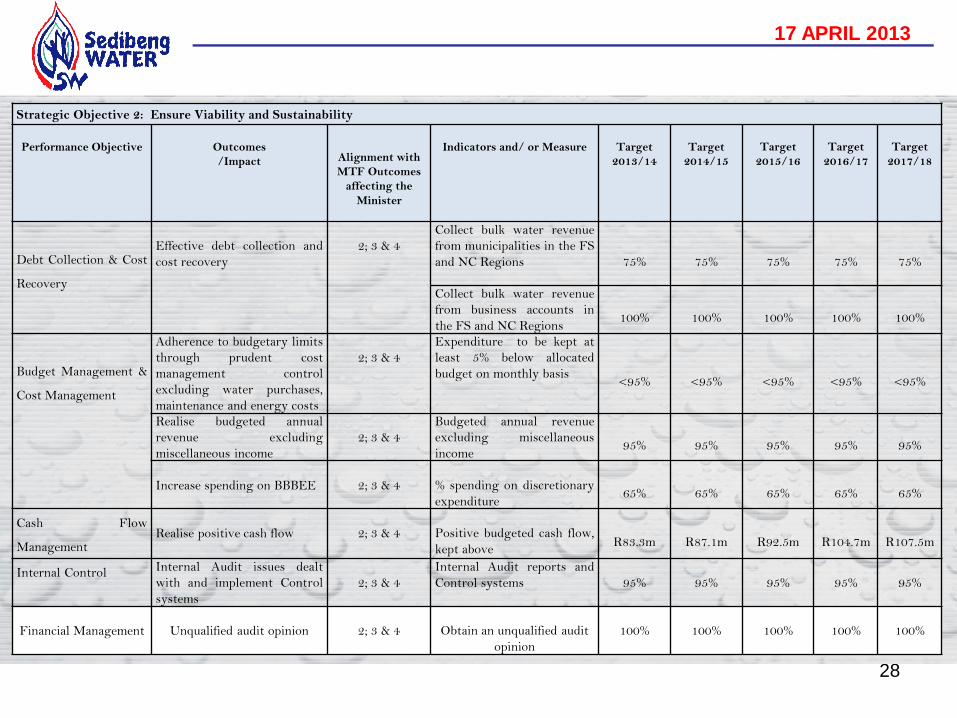
Strategic Objective 2: Ensure Viability and Sustainability
Performance Objective
Outcomes
/Impact
Alignment with
MTF Outcomes
affecting the
Minister
Indicators and/ or Measure
Target
2013/14
Target
2014/15
Target
2015/16
Target
2016/17
Target
2017/18
Debt Collection & Cost
Recovery
Effective debt collection and
cost recovery
2; 3 & 4
Collect bulk water revenue
from municipalities in the FS
and NC Regions
75%
75%
75%
75%
75%
Collect bulk water revenue
from business accounts in
the FS and NC Regions
100%
100%
100%
100%
100%
Budget Management &
Cost Management
Adherence to budgetary limits
through prudent cost
management control
excluding water purchases,
maintenance and energy costs
2; 3 & 4
Expenditure to be kept at
least 5% below allocated
budget on monthly basis
<95%
<95%
<95%
<95%
<95%
Realise budgeted annual
revenue excluding
miscellaneous income
2; 3 & 4
Budgeted annual revenue
excluding miscellaneous
income
95%
95%
95%
95%
95%
Increase spending on BBBEE
2; 3 & 4
% spending on discretionary
expenditure
65%
65%
65%
65%
65%
Cash Flow
Management
Realise positive cash flow
2; 3 & 4
Positive budgeted cash flow,
kept above
R83.3m
R87.1m
R92.5m
R104.7m
R107.5m
Internal Control Internal Audit issues dealt
with and implement Control
systems
2; 3 & 4
Internal Audit reports and
Control systems 95% 95% 95% 95% 95%
Financial Management
Unqualified audit opinion
2; 3 & 4
Obtain an unqualified audit
opinion
100%
100%
100%
100%
100%
29
17 APRIL 2013
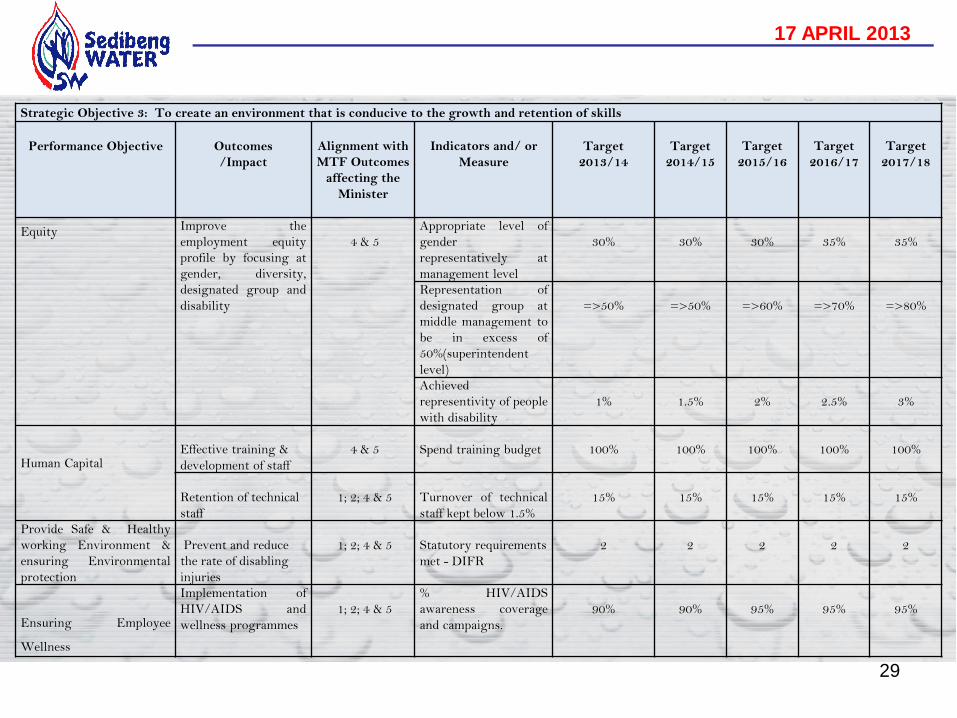
Strategic Objective 3: To create an environment that is conducive to the growth and retention of skills
Performance Objective
Outcomes
/Impact
Alignment with
MTF Outcomes
affecting the
Minister
Indicators and/ or
Measure
Target
2013/14
Target
2014/15
Target
2015/16
Target
2016/17
Target
2017/18
Equity Improve the
employment equity
profile by focusing at
gender, diversity,
designated group and
disability
4 & 5
Appropriate level of
gender
representatively at
management level
30%
30%
30%
35%
35%
Representation of
designated group at
middle management to
be in excess of
50%(superintendent
level)
=>50%
=>50%
=>60%
=>70%
=>80%
Achieved
representivity of people
with disability
1%
1.5%
2%
2.5%
3%
Human Capital
Effective training &
development of staff
4 & 5
Spend training budget
100%
100%
100%
100%
100%
Retention of technical
staff
1; 2; 4 & 5
Turnover of technical
staff kept below 1.5%
15%
15%
15%
15%
15%
Provide Safe & Healthy
working Environment &
ensuring Environmental
protection
Prevent and reduce
the rate of disabling
injuries
1; 2; 4 & 5
Statutory requirements
met - DIFR
2
2
2
2
2
Ensuring Employee
Wellness
Implementation of
HIV/AIDS and
wellness programmes
1; 2; 4 & 5
% HIV/AIDS
awareness coverage
and campaigns.
90%
90%
95%
95%
95%

30
17 APRIL 2013
Strategic Objective 4: Effective and Efficient communications
Performance Objective
Outcomes
/Impact
Alignment with
MTF Outcomes
affecting the
Minister
Indicators and/ or
Measure
Target
2013/14
Target
2014/15
Target
2015/16
Target
2016/17
Target
2017/18
Foster Corporate Social
Responsibility
Ensure that SW plays a
pivotal role in making a
difference in the quality of
life of the communities it
serves
1; 2 & 5
Implement corporate social
responsibility as per budget
95%
95%
95%
95%
95%
Water Value Chain
Awareness through
Public Engagement
Improvement of level of
customer satisfaction
through customer
interaction
1; 2; 3 & 5
Monthly coordinating
meeting with the WSA,
municipalities, at least 18
times per year
80% of
meetings
per SLA
80% of
meetings
per SLA
80% of
meetings
per SLA
80% of
meetings
per SLA
80% of
meetings
per SLA
Respond to breakdown
reports from customers as
per SLA
2; 3; 4 & 5
Adherence to breakdown
response time as per SLA
4 Hours
4 Hours
4 Hours
4 Hours
4 Hours
Encourage Partnership
Initiatives
Involvement and
participation by service level
agreements
1; 2; 3; 4 & 5
% municipalities with
agreements in place,
80%
80%
80%
80%
80%
Institutionalised
Internal Participation
Participate in all
stakeholders forums and
functions
1; 2; 3; 4 & 5
Attendance of internal
stakeholder’s forums and
functions at least 16 times
per year.
75%
75%
75%
75%
75%
31
17 APRIL 2013
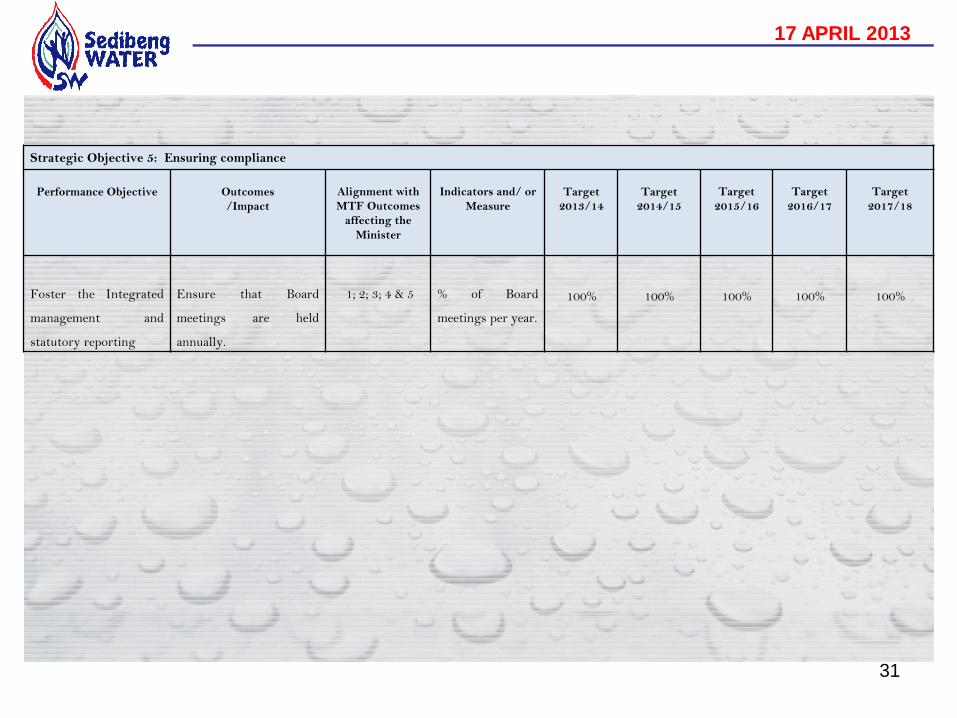
Strategic Objective 5: Ensuring compliance
Performance Objective
Outcomes
/Impact
Alignment with
MTF Outcomes
affecting the
Minister
Indicators and/ or
Measure
Target
2013/14
Target
2014/15
Target
2015/16
Target
2016/17
Target
2017/18
Foster the Integrated
management and
statutory reporting
Ensure that Board
meetings are held
annually.
1; 2; 3; 4 & 5
% of Board
meetings per year.
100%
100%
100%
100%
100%

32
17 APRIL 2013
Section 8 OVERVIEW OF ALIGNMENT WITH GOVERNMENT MTSF AND MINISTERIAL PERFORMANCE OUTCOMES

33
Achievements 2011/2012
Financial Viability and Sustainability
• Costs were prudently managed within budgetary limits
• Organisation is financially sound and viable at consolidated level
• Revenue and surplus targets were exceeded in the Free State and
Northern Cape regions
Operational Process Efficiency
• Total production and distribution water losses of 5.68% in the Free State
and Northern Cape Regions
• Water quality met Class 1 and or 2 requirements
• Average expenditure on BBBEE of over 88%
17 APRIL 2013
34
Recruitment and development of employees
• Financial assistance (34 bursary holders).
• ABET (13 employees).
• Water and Wastewater Process Operation Learnership NQF 3 with the
ESETA (Completed and awaiting external verification).
• Experiential training (10 students).
• Training was conducted according to the Works Skills Development
Plan.
• Retention of technical staff was kept below 1.5%.
• WSP/ATR approved by EWSETA
Achievements 2011/2012 (Cont.)
17 APRIL 2013
35
HIV/AIDS Programme
• Awareness campaigns were undertook throughout the whole organisation.
• Voluntary counseling and testing was made available to employees
QUALITY CONTROL LABORATORY
• The laboratory maintained its accredited status after being audited by SANAS
(South African National Accreditation Standards) and an international auditor from
ILAC (International Laboratory Accreditation Co- operation)
Achievements 2011/2012 (Cont.)
17 APRIL 2013

36
Financial Viability and Sustainability
Cost Recovery
• The organisation continues to experience challenges in cost recovery from the
WSAs (some Municipalities do not pay timeously for services rendered).
Contractual agreement
• Lack of willingness by WSA to enter into long-term contractual obligations with WSP
Inadequate budget allocation in the North West Region
•Insufficient funding hampering service delivery
Challenges
17 APRIL 2013
37
Operational Process Efficiency
Costs of Maintenance/ Chemical
• The high costs of maintenance/ chemicals impact on the high expenditure
for the organisation, which result in higher water tariff.
Raw Water Quality
• The quality of raw water from the Vaal River is very poor, resulting in
high purification cost.
Blue/ Green Drop Status
• Lack of commitment from some municipalities in the programme. This result
in water boards failing to achieve the required status.
Challenges (Cont)
17 APRIL 2013

38
• Sedibeng Water enforce transparency and accountability through
stakeholders interaction, coordinating meetings with Water Service
Authority.
• Promote information by providing audited annual reports, news letters
magazine on water quality and supply of water, which is accessible to the
public.
• Sedibeng Water provide regular and updated information to ensure that
the company provide its current state of affairs.
• Water quality and water problems are communicated well in advance to
the Water Service Authorities and public. The information on water related
matters is shared with all stakeholders continuously.
Implementation of PAIA
17 APRIL 2013
39
• Sedibeng Water has entered into a service level agreements with Water
Service Authorities/ mines to ensure provision of reliable water supply
with an intention to perform its constitutional obligations.
• Sedibeng Water is using the media to inform water users of their rights
and educate consumers on how to preserve water resources.
• Water related problems are communicated and explained to stakeholders
and public where the provision of water cannot be guaranteed.
• Water related diseases are shared with the public to ensure that the
public (water users) is not unfairly disadvantaged.
Implementation of PAJA
17 APRIL 2013

40
FINANCIAL STATEMENTS 2011/12
17 APRIL 2013

41
ANNUAL REPORT
2011/12
• Another Unqualified Audit Report
17 APRIL 2013
42
17 APRIL 2013
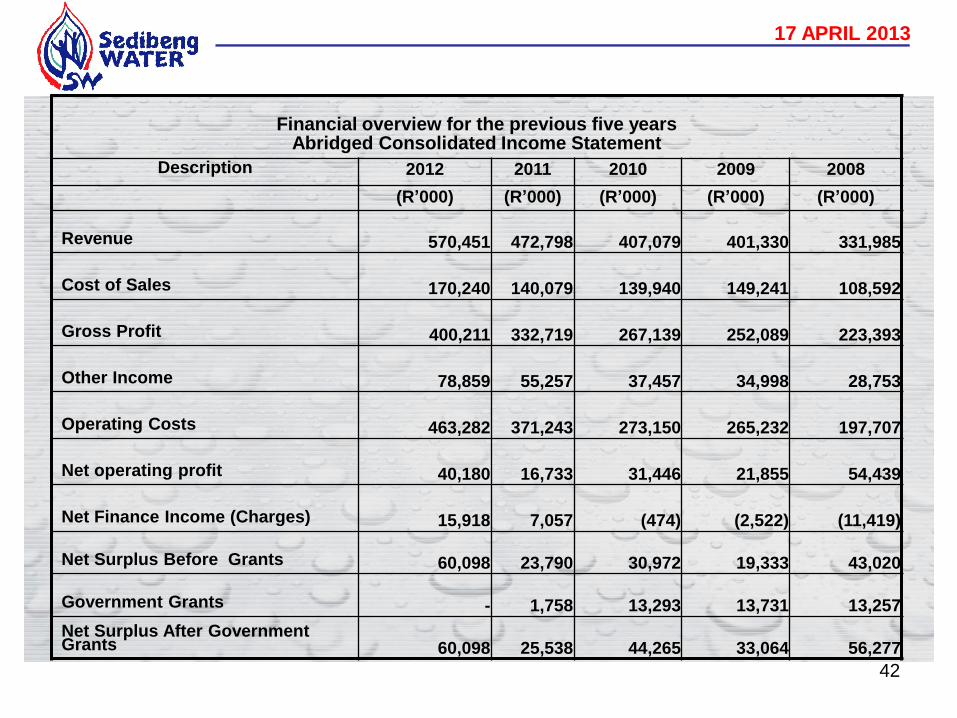
Financial overview for the previous five years
Abridged Consolidated Income Statement
Description 2012 2011 2010 2009 2008
(R’000) (R’000) (R’000) (R’000) (R’000)
Revenue 570,451
472,798
407,079 401,330
331,985
Cost of Sales 170,240
140,079
139,940 149,241
108,592
Gross Profit 400,211
332,719
267,139 252,089
223,393
Other Income 78,859
55,257
37,457 34,998
28,753
Operating Costs 463,282
371,243
273,150 265,232
197,707
Net operating profit 40,180
16,733
31,446 21,855
54,439
Net Finance Income (Charges)
15,918
7,057
(474)
(2,522)
(11,419)
Net Surplus Before Grants 60,098
23,790
30,972 19,333
43,020
Government Grants -
1,758
13,293 13,731
13,257
Net Surplus After Government Grants 60,098
25,538
44,265 33,064
56,277
43
17 APRIL 2013
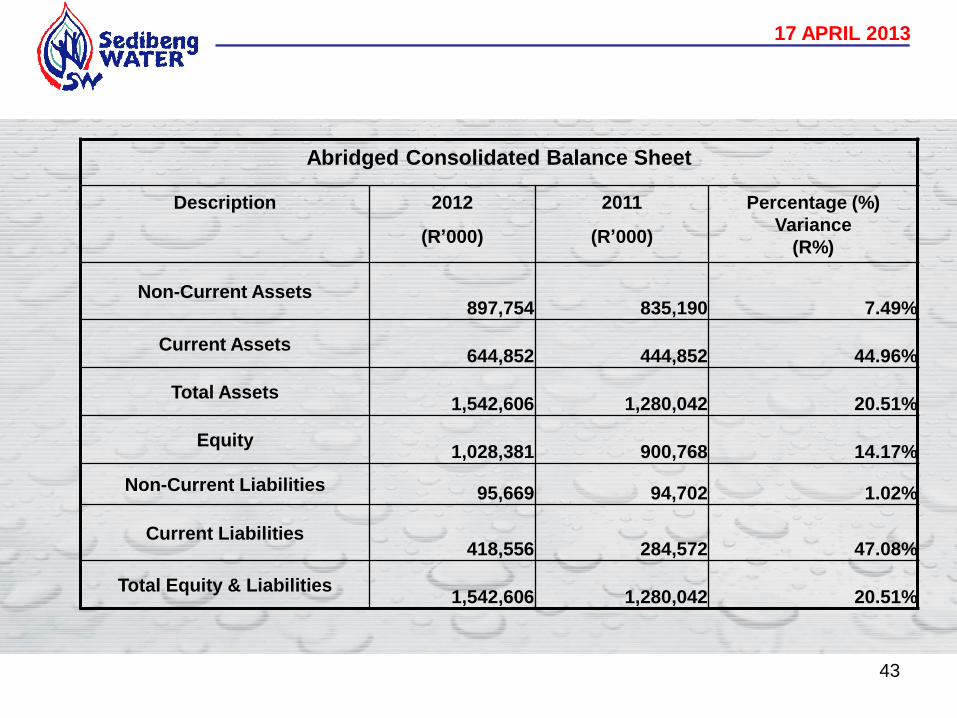
Abridged Consolidated Balance Sheet
Description 2012
(R’000)
2011
(R’000)
Percentage (%)
Variance
(R%)
Non-Current Assets 897,754 835,190 7.49%
Current Assets 644,852 444,852 44.96%
Total Assets 1,542,606 1,280,042 20.51%
Equity
1,028,381 900,768 14.17%
Non-Current Liabilities 95,669 94,702 1.02%
Current Liabilities 418,556 284,572 47.08%
Total Equity & Liabilities 1,542,606 1,280,042 20.51%
44
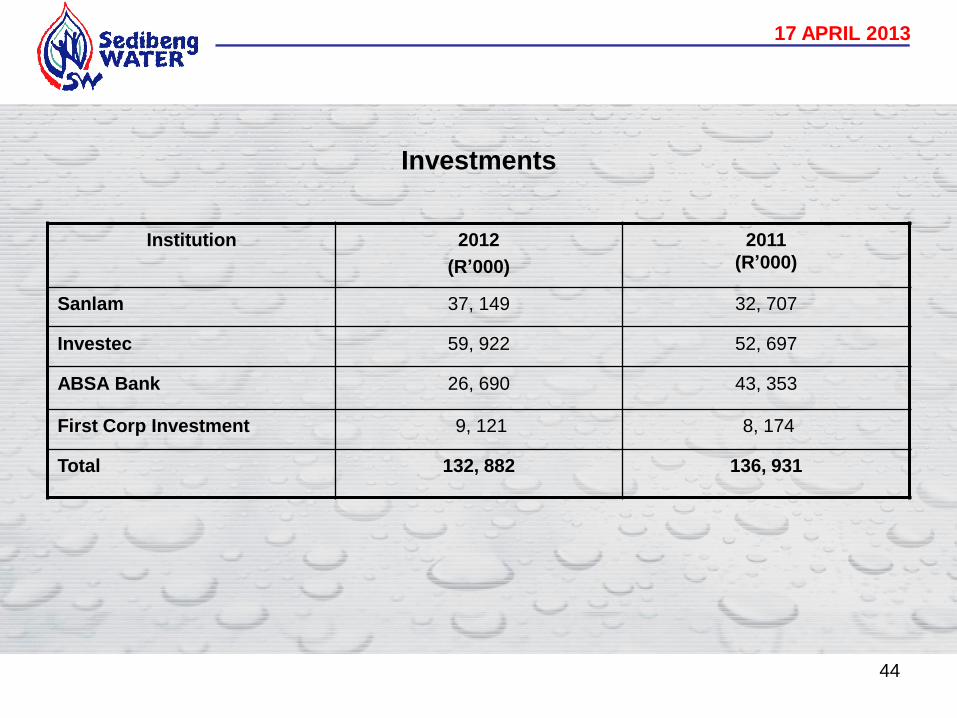
Investments
17 APRIL 2013
Institution 2012
(R’000)
2011
(R’000)
Sanlam 37, 149 32, 707
Investec 59, 922 52, 697
ABSA Bank 26, 690 43, 353
First Corp Investment 9, 121 8, 174
Total 132, 882 136, 931

45
Financial Ratio Analysis
17 APRIL 2013
Profitability 2012 2011 2010 2009 2008
Gross profit margin 70.16% 70.40% 65.62% 62.81% 67.29%
Rate of return on assets
4% 2% 3% 3% 6%
Assets turnover ratio
0.37 0.38 0.30 0.38 0.35
Debtors collection period in
days 462.17 370.50 294.71 201.68 134.51
Short-Term Liquidity
Current ratio
1.54 1.56 1.22 1.56 1.72
Long Term Solvency
Long term debt ratio
0.06 0.07 0.07 0.25 0.26
Debt Equity ratio
0.09 0.11 0.10 0.43 0.44

46 46
CAPEX 2011/2012
17 APRIL 2013
REGIONS BUDGET
R’000
ACTUAL
R’000
% Achieved COMMENTS
FREE STATE 24,700 18,968 77% Saving realised on the projects
NORTHERN CAPE 12,150 11,156 92% Saving realised on the projects
NORTH WEST 2,450 5,812 237% Target Exceeded
NAMAKWA 18,800 28,463 151% Target Exceeded
TOTAL R 58,100 R 64,399 111% Capital expenditure Achieved

47
17 APRIL 2013
EXECUTIVE MANAGEMENT
Director: Corporate
Services (Acting Chief
Executive
Salary Bonuses Performance
Payments
Expense
Claims
Other Total
R.T Takalani 1,305,423 83,344 317,600 133,552 270,286 2,110,205
Director: Operations
K.E Sempe 1,219,225 79,040 - - - 1,298,265
Senior Management
N.D Basson 724,842 - 237,010 128,490 307,132 1,397,474
G.M Dippenaar 945,420 51,738 216,345 135,606 - 1,349,109
I.M Hasenjager 1,004,785 - 232,644 281,775 - 1,519,204
R.M Mpe 698,678 82,290 161,780 81,117 55,856 1,080,721
M.I Motsamai 828,170 39,084 190,508 136,445 181,163 1,375,370
T.N Molobye 1,017,808 54,890 235,401 222,143 76,054 1,606,296
N.A Theys 811,477 39,891 193,280 194,858 44,502 1,284,008
N.Makhakhe 807,204 45,897 194,250 63,244 120,344 1,230,939
N.E Ratshitanga 933,242 48,314 210,188 141,192 - 1,332,936
M.Lebitso 585,937 45,248 155,804 138,689 81,058 1,006,736
TOTAL 10,882,211 569,736 2,344,810 1,657,111 1,136,395 16,590,263

48
BUDGET ANALYSIS
17 APRIL 2013

49 49
17 APRIL 2013
The 2013/14 Tariff Increase
Sedibeng Water’s tariff increase is 8.5%.
• All stakeholders were consulted as required by Section 42 of the MFMA (Act 56 of 2003).
• Eskom and Sedibeng Water signed an agreement on demand and energy saving
programmes which resulted in 5% energy saving. The 5% efficiency saving was built into
the electricity tariff.
• The impact will result in reduced operating shortfall and not an increase in surplus.

50
Budget Analysis 2012/2013 and 2013/2014
17 APRIL 2013
Budgeted Budgeted Difference Difference
2013/2014 2012/2013
R'000 R'000 R'000 %
Volume of treated water sold (in Kl'000) 96,712 95,773 939 0.98%
REVENUE 692,958 633,032 59,926 9.47%
Cost of sales (Raw water purchased) 223,594 207,497 16,096 7.76%
Gross Profit 469,365 425,535 43,829 10.30%
Other operating income 25,648 24,075 1,573 6.53%
Operating & administrative expenses 486,548 429,125 53,414 12.45%
Salaries & wages 176,440 163,270 13,170 8.07%
Electricity 113,859 99,008 14,851 15.00%
Maintenance 31,722 27,882 3,839 13.77%
Purification 32,850 29,864 2,986 9.9%
Depreciation and Amortisation 51,282 31,743 19,540 61.56%
Other administrative expenses 80,395 77,358 3,038 3.93%
Operating profit before interest 8,465 20,486 (8,012) -39%
Net Finance charges 12,520 18,883 (6,364) -34%
Net profit after interest and grants 20,985 39,369 (14,376) -37%

17 APRIL 2013
CAPEX – FREE STATE REGION
51
Year ending 30 June 2013/2014 2014/2015 2015/2016 2016/2017 2017/2018 Total
DESCRIPTION Year 1 Year 2 Year 3 Year 4 Year 5
Doubling of 11,3 km Buisfontein-Pipe line - 4,000,000 4,000,000 4,000,000 4,000,000
16,000,000
Refurbish 650 mm diameter Welkom
ringline 1,500,000 1,500,000 - - -
3,000,000
Enlarge Koppie Alleen-Brabant pipe line 15,000,000 15,000,000 8,000,000 - -
38,000,000
New booster pump station on Welkom-
Wesselsbron pipe line 1,500,000 2,000,000 - - -
3,500,000
Airvalves - Pipelines
1,600,000
1,600,000
1,600,000 - -
4,800,000
Electric Fence - Installations
500,000
500,000
500,000 - -
1,500,000
Replace Rotork Actuators
1,000,000 - - -
1,000,000
Replace Roof De Erf Pump
station/Balkfontein
2,000,000 - - - -
2,000,000
Replace PLC Equipment
2,000,000
2,000,000
1,000,000
1,000,000
1,000,000
7,000,000
Replace Lawnmowers - -
200,000 - -
200,000
Replace LDV's and Vehicles
1,500,000
1,500,000
1,600,000
1,600,000
1,600,000
7,800,000

17 APRIL 2013
CAPEX – FREE STATE REGION (Cont.)
52
Year ending 30 June 2013/2014 2014/2015 2015/2016 2016/2017 2017/2018 Total
DESCRIPTION Year 1 Year 2 Year 3 Year 4 Year 5
Replace Heavy Machinery and Equipment
2,500,000 -
2,000,000
2,500,000
2,500,000
9,500,000
Refurbish pump stations 12,550,000 -
2,000,000
2,500,000
2,500,000
7,000,000
Refurbish Telemetry System
500,000
500,000
200,000 - -
1,200,000
Replace Technical equipment
2,100,000
1,800,000
200,000
400,000
400,000
3,100,000
Refurbish Electrical switchgear
1,000,000 - -
200,000
200,000
1,400,000
Civil refurbishment projects
6,750,000
2,500,000
2,500,000 - -
7,500,000
Mechanical Refurbishment Projects
1,500,000
2,500,000
1,000,000
3,000,000
3,000,000
11,000,000
Furniture / Computers/ IT projects /
other
3,064,000
2,450,000
2,540,000 - -
6,040,000
Total
57,819,000 40,900,000
29,840,000
15,200,000
15,200,000
158,959,000

17 APRIL 2013
CAPEX – NORTHERN CAPE (VAAL GAMAGARA)
53
DESCRIPTION 2013/2014 2014/2015 2015/2016 2016/2017 2017/2018 Total
Year 1 Year 2 Year 3 Year 4 Year 5
Metsi- mantle road (re-tar) 6,000,000 - - - - 6,000,000
Cathodic Protection 7,000,000 - - - - 74,950,500
Pumpstations / Extention 18,550,000 56,400,500 5,600,000 - - 46,606,350
Flow Meters / Pumps 12,024,350 34,582,000
3,200,000
150,000
150,000 5,900,000
Regional Laboratory 10,500,650 - - - - 13,700,650
Vehicles 2,550,000 550,000 - - - 3,100,000
Furniture / Computers/ Other 600,000 1,487,500 200,000 200,000 200,000 2,687,500
Total 57,225,000 93,020,000 9,000,000 350,650 350,000 159,945,000
17 APRIL 2013
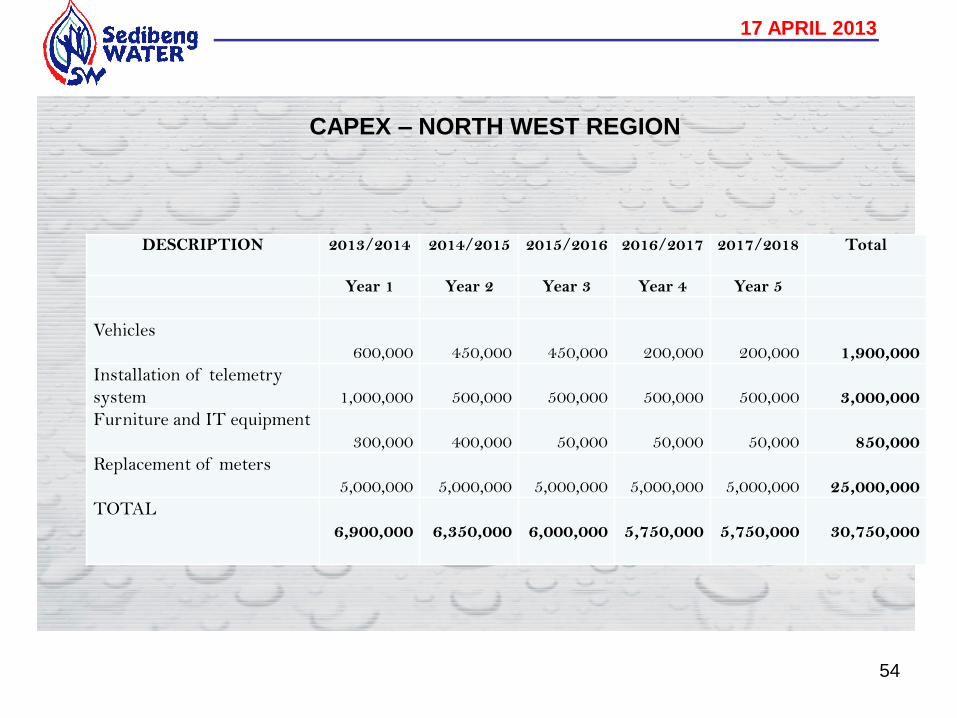
CAPEX – NORTH WEST REGION
54
DESCRIPTION 2013/2014 2014/2015 2015/2016 2016/2017 2017/2018 Total
Year 1 Year 2 Year 3 Year 4 Year 5
Vehicles
600,000
450,000
450,000
200,000
200,000
1,900,000
Installation of telemetry
system
1,000,000
500,000
500,000
500,000
500,000
3,000,000
Furniture and IT equipment
300,000
400,000
50,000
50,000
50,000
850,000
Replacement of meters
5,000,000
5,000,000
5,000,000
5,000,000
5,000,000
25,000,000
TOTAL
6,900,000
6,350,000
6,000,000
5,750,000
5,750,000
30,750,000
17 APRIL 2013
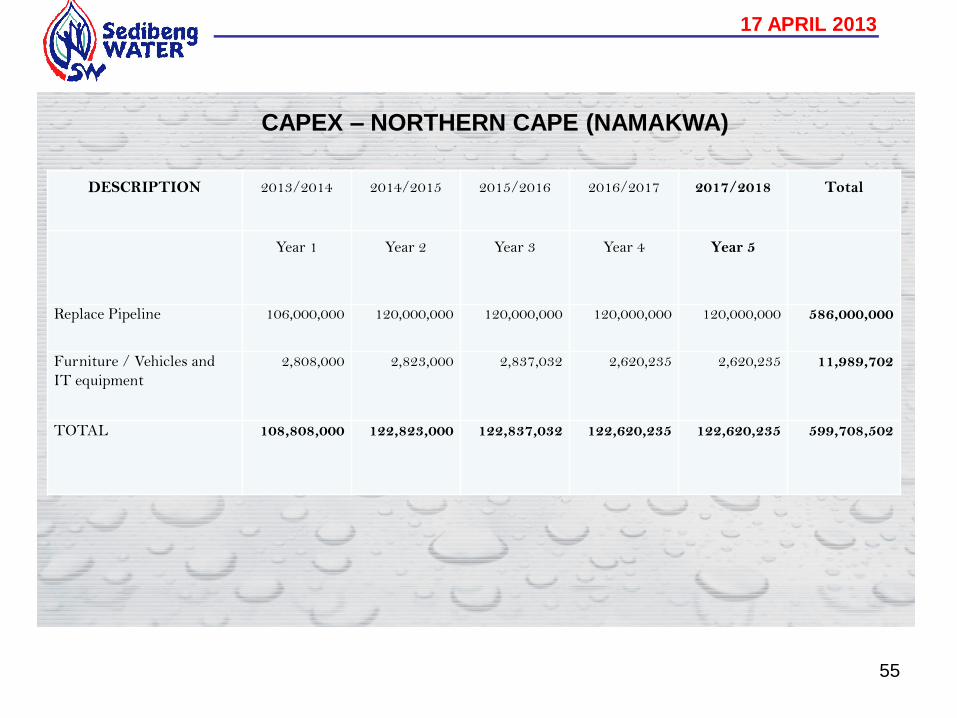
CAPEX – NORTHERN CAPE (NAMAKWA)
55
DESCRIPTION 2013/2014 2014/2015 2015/2016 2016/2017 2017/2018 Total
Year 1 Year 2 Year 3 Year 4 Year 5
Replace Pipeline 106,000,000 120,000,000 120,000,000 120,000,000 120,000,000 586,000,000
Furniture / Vehicles and
IT equipment
2,808,000 2,823,000 2,837,032 2,620,235 2,620,235 11,989,702
TOTAL 108,808,000 122,823,000 122,837,032 122,620,235 122,620,235 599,708,502
56
THANK YOU
Rtt/jk 17 April 2013 Annual Report 2011/12
17 APRIL 2013