annual report 2011 - sharedata online - south …€¢ in respect of the annual fi nancial...
TRANSCRIPT

ANNUAL REPORT 2011

Scope of report
This report covers the Illovo group’s fi nancial and non-fi nancial performance for the year ended 31 March 2011. It incorporates the ongoing business activities of the cane, sugar and downstream operations of its subsidiaries located across six African countries: Malawi, Zambia, South Africa, Tanzania, Swaziland and Mozambique.
Information describing Illovo’s agricultural, manufacturing and marketing activities has been provided on the basis of promoting understanding of the group’s primary processes among its key stakeholders: shareholders; investors and investment analysts; employees; trade unions; regulators including the JSE Limited; customers, raw material suppliers, most notably providers of sugar cane; other suppliers and service providers; governments; and communities and civic society.
In compiling the report, Illovo has considered –
• both the Companies Act, 1973, as amended, and the Companies Act, 2008, as amended;
• the Listings Requirements of the JSE Limited;
• the King Report on Governance for South Africa 2009 and, in particular, the principles contained in the King Code of Governance for South Africa 2009; and
• in respect of the annual fi nancial statements, International Financial Reporting Standards.

ILLOVO SUGAR LIMITED • Annual Report 2011 1
BU
SINESS O
VER
VIEW
Scope of report inside front coverGroup profi le 2Vision 2Forward-looking statement 2Group features 3Group key production and market statistics 4Group key performance indicators 5Group structure 6Group locations 7Strategic Intent 8Goals and objectives 8Group strategy 9Strategic and operational accountability 10Directorate 12Executive Committee 14
CO
MM
ENTA
RIES
Chairman’s Statement 16A tribute to Robbie Williams 21Managing Director’s Review 22Financial Director’s Review 26Operational Reviews 32Market Review 46World of Sugar 48
SUSTA
INA
BILITY
FINA
NC
IAL STA
TEMEN
TS
Contents
Corporate Governance 56Remuneration Report 64Risk Management Report 68Stakeholder Engagement 69Economic Impact 70Value Added Statement 70Five Year Review 71Social Impact 76Environmental Impact 84
Annual fi nancial statements 90Independent Auditors’ Report 92
Analysis of shareholders 145Shareholders’ diary 146Notice of annual general meeting 147Form of proxy 151Corporate information inside back cover
SHA
REHO
LDER IN
FORM
ATION

2 Annual Report 2011 • ILLOVO SUGAR LIMITED
1891 Reynolds Brothers Limited is listed as a public company and Charles George Smith appointed as its agent in Durban;
1893 CG Smith, entrepreneur and sugar agent, becomes a shareholder in Reynolds Brothers;
1904 CG Smith and associates buy the Umzimkulu mill and estates;
OUR HISTORY
Group profi le
Illovo is a leading sugar producer and a signifi cant manufacturer of downstream products. The group is Africa’s biggest sugar producer and has extensive agricultural and manufacturing operations in six African countries. The group produces raw and refi ned sugar for local, regional, European Union (EU), United States of America (USA) and world markets from sugar cane supplied by its own agricultural operations and independent outgrowers who supply cane to Illovo’s factories. High-value products manufactured downstream of the sugar production process are sold internationally into niche markets. Installed electricity generating capacity, fuelled by renewable resources, provides around 89% of the group’s energy requirements. Illovo is listed on the JSE Limited and is a subsidiary of Associated British Foods plc which holds 51% of the issued share capital.
The base business of Illovo is well positioned for the future. Recent cane and factory expansions have increased the group’s sugar production capacity with potential projects currently being evaluated to further increase output over the medium-term. The commissioning of the Ubombo factory expansion and co-generation project in Swaziland in April of this year was an important milestone for the group. In addition to the economic and production benefi ts of the project itself, signifi cantly it provides Illovo with its own fully-integrated model for cane sugar development in Africa which, involving the ability to generate and export surplus power to national grids on a commercial basis, can be applied in other existing or new countries of operation. Illovo’s planned greenfi eld project in Mali, to produce 200 000 tons of sugar and supply surplus electricity into the national grid, will take this integrated model one step further with the annual production of around 15 000 kilolitres of ethanol to be used for fuel blending requirements in that country.
The African continent has a defi cit sugar market and Illovo’s increasing sugar availability provides excellent opportunities to satisfy this strong demand in the countries of operation where it has proven marketing and distribution expertise, and in the surrounding regions where the group has become the supplier of choice. These opportunities are further augmented by access to the USA on preferential terms and increasing access to the EU on a duty-free/quota-free basis. The downstream business, comprising furfural and its derivatives, together with ethanol, remains a solid contributor to operating profi t with considerable opportunities to penetrate signifi cant new markets. The registration in the USA last year of MultiGuard Protect is the fi rst of its kind in that country, allowing the use of furfural as a nematicide on golf courses and turf farms and thereby signifi cant access for the group into this potentially lucrative market.
Illovo has made good progress in identifying key sustainability indicators across governance, economic, environmental and social parameters in a comprehensive sustainability study undertaken by independent consultants which will be completed later in the current year, and will be used for reporting purposes contained in the company’s 2012 annual report. It is anticipated that this study will enhance Illovo’s focus on continuous improvement, providing key data for the formulation of new strategies to support the group’s long-term sustainability.
Forward-looking statement
Vision
The vision of the group is to be a world-class, low-cost and highly effi cient organisation, operating on the African continent, adding value to its core products of fi bre, sugar and molasses. We seek to enhance shareholder wealth and optimise growth, achieving a sustainable, balanced and integrated economic, social and environmental performance, whilst taking cognisance of the interests of our stakeholders.

ILLOVO SUGAR LIMITED • Annual Report 2011 3
BU
SINESS O
VER
VIEW
Group features
1915 Reynolds Brothers opens the Sezela mill; and The Natal Cane By-Products Limited (now Illovo Merebank) is listed as a public company;
1952 Reynolds Brothers moves the Esperanza mill to Pongola;
1975 The sugar-related assets of CG Smith & Company, together with the Gledhow Sugar Company, are amalgamated with Reynolds Brothers into a single new entity under the name of CG Smith Sugar Limited;
RECORD CANE PRODUCTION 6.3 million tons 3%SUGAR PRODUCTION 1.6 million tons 3%FURFURAL PRODUCTION 15 900 tons 15%RECORD ETHANOL PRODUCTION 55 500 kilolitres 6%INTERNAL ELECTRICITY CO-GENERATION
provides 89% of total group energy requirements from bio-renewable resources
DOMESTIC SUGAR MARKET SALES 1.051 million tons 2%REVENUE R8 107.9 million 4%OPERATING PROFIT R1 029.3 million 31%HEADLINE EARNINGS 112.2 cents per share 35%TOTAL DIVIDEND 56.0 cents per share 35%CASH GENERATION R1 279.2 million 3%
➜➜
➜
➜➜
➜➜
➜➜
➜

4 Annual Report 2011 • ILLOVO SUGAR LIMITED
COMMUNITY COMPACT
• Illovo operates in predominantly rural environments with limited infrastructure and signifi cant development needs. Being welcomed in the locations in which it operates requires extending the group’s support for its own employees beyond normal boundaries and into nearby communities. In addition to providing accommodation, health care, educational assistance and basic services to employees, the group also provides medical care to communities where no other facilities exist, assists in education delivery, provides municipal and civic services and access to water and sanitation, and participates in community outreach programmes;
• Considerable training and other support is provided to local indigenous growers in order to promote sustainable agriculture and economic development activities;
• Total cane supplies from these growers, including community-based co-operative schemes, amounts to 2 million tons annually, generating revenue of approximately R618 million in these communities;
• Particular attention is given to preferential procurement to promote enterprise development of small and medium-sized businesses. These entities supply goods and services to the group, to other cane growers and neighbouring communities. In the verifi cation of Illovo’s broad-based black economic empowerment (B-BBEE) credentials in South Africa for 2009/10, the element of “Enterprise Development” obtained a 100% score.
OUR HISTORY continued
Group key production and market statisticsfor the year ended 31 March 2011
CANE PRODUCTION (tons ‘000)
Malawi Zambia South Africa
Tanzania Swaziland Mozambique
SUGAR PRODUCTION (tons ‘000)
GROUP SOCIAL INVESTMENT SPEND (Rm)
Accommodation
Health care
Education
Community
Environmental initiatives
GROUP SUGAR MARKETS (%)
Domestic EU and USA preferential
Regional World
SHARE OF INDUSTRY SUGAR PRODUCTION (%)
DOWNSTREAM PRODUCTION (SOUTH AFRICA ONLY)
Furfural tons 15 900
Furfuryl alcohol tons 9 000
Diacetyl kilograms 115 000
Lactulose tons 7 300
Ethanol kilolitres 55 500
Syrup tons 5 200
Agriguard kilolitres 450
Malawi Zambia South Africa
Tanzania Swaziland Mozambique
Malawi Zambia South Africa
Tanzania Swaziland Mozambique
1977 CG Smith Sugar acquires the Illovo and Noodsberg sugar mills and estates from Tate & Lyle;
1991 The company celebrates its Centenary year;
1992 CG Smith Sugar is listed on the Johannesburg Stock Exchange, and the company acquires the Umfolozi sugar mill;
2 133
1 974
267
708
724454
578
385
282198
127
69
6518
125
64
41
20
117
Total 6 260 tons Total 1 639 tons
10093
3041
3425

BU
SINESS O
VER
VIEW
ILLOVO SUGAR LIMITED • Annual Report 2011 5
Group key performance indicatorsfor the year ended 31 March 2011
• Increased domestic and preferential market sugar sales
• Strong international demand for downstream products at improved prices
• Increasing rand strength against major currencies depresses export earnings and conversion of foreign subsidiaries’ profi ts
• Reduction in net fi nancing costs – 2011: R95.5 million (2010: R139.0 million)
• Strong cash operating profi t remains a key fi nancial strength
• Dividend policy of two-times covered maintained in tough trading conditions – 2011: 56.0 cents per share (2010: 86.0 cents per share)
FINANCIAL
• Record group cane production of 6.3 million tons against a background of severe drought in South Africa and abnormally wet conditions in other geographies
• Reduced total sugar production of 1.639 million tons (2010: 1.685 million tons) impacted primarily by decreased cane supplies from drought-affected independent growers in South Africa
• Record levels of cane and sugar production in post-expansion Zambia
• R1.2 billion Ubombo factory expansion and co-generation project successfully commissioned in April 2011
• Factory expansion at Maragra completed to increase annual sugar production capacity to 150 000 tons whilst Illovo’s shareholding in the company increases from 74% to 90%
• Broad-based black economic empowerment (B-BBEE) rating (South Africa) – Level 5 Contributor
• Fourth consecutive year of inclusion in the JSE’s Socially Responsible Investment (SRI) Index
• Positive reduction in 12-month rolling Disabling Injury Frequency Rate – 0.44 as at March 2011
NON-FINANCIAL
REVENUE (Rm)
2009
8 602 8 468
2010 2011
8 108
OPERATING PROFIT (Rm)
2009 2010 2011
1 029
1 3861 499
WEIGHTED AVERAGE SHARES IN ISSUE (‘000)
2009 2010 2011
350 514410 279
459 787
HEADLINE EARNINGS (cents per share)
AVERAGE EXCHANGE RATE (R/$1.00)
212171
112
2009 2010 2011
2009 2010 2011
8.837.81
7.19
YEAR-END MARKET PRICE (cents per share)
2009 2010 2011
2 849 2 9702 685
CANE PRODUCTION (million tons)
2009 2010 2011
5.054
6.108 6.260
SUGAR PRODUCTION (million tons)
2009 2010 2011
1.578 1.685 1.63912 457
2009 2010 2011
12 031 12 159
TRAINING AND EMPLOYEE DEVELOPMENT SPEND (Rm)
2009 2010 2011
32 31
57
TOTAL NUMBER OF PERMANENT EMPLOYEES

OUR HISTORY continued
Group structure
TANZANIAKILOMBERO SUGAR
55%
SWAZILANDUBOMBO SUGAR
60%
ZAMBIAZAMBIA SUGAR
82%
MALAWIILLOVO SUGAR
76%
MOZAMBIQUEMARAGRA AÇÚCAR
90%
AB Sugar, previously named the British Sugar
Group, as a division of Associated British
Foods plc (ABF), represents ABF in respect
of all its sugar interests, including Illovo.51.5%
ASSOCIATEDBRITISH
FOODS plc
SOUTH AFRICAILLOVO SUGAR SA
100%
1994 The company name is changed to Illovo Sugar Limited to identify with the Illovo brand of sugars and syrups;
1995 As a purely South African sugar company with fi ve agricultural estates and seven factories, Illovo cultivates around one million tons of sugar cane and produces an equal amount of sugar. Turnover amounts to R1.6 billion and the share price trades at R6.70 (year-end);
6 Annual Report 2011 • ILLOVO SUGAR LIMITED

* Managed operation
Group locationsCane supply regions and manufacturing plants
CANE GROWING MANUFACTURING
IrrigatedRainfed/coastal
Rainfed/inland
Sugar manufacturing
Sugar refi ning
Speciality sugar/syrup
Down-stream
production
Internal electricity generation
Electricity exports
South Africa
Noodsberg
Eston
Sezela
Umzimkulu
Merebank
Glendale
Gledhow*
Malawi
Nchalo
Dwangwa
Zambia
Nakambala
Swaziland
Ubombo
Tanzania
Kilombero
Mozambique
Maragra
1996 Illovo acquires an interest in Maragra Açúcar SA;
1997 Illovo acquires Lonrho Sugar Corporation Limited, with sugar assets in Malawi, Swaziland, Mauritius and South Africa;
1998 Illovo acquires a 55% stake in Kilombero Sugar Company in Tanzania;
1999 The company acquires Monitor Sugar Company in the United States;
BU
SINESS O
VER
VIEW
ILLOVO SUGAR LIMITED • Annual Report 2011 7

8 Annual Report 2011 • ILLOVO SUGAR LIMITED
Strategic Intent
TO:• be the leading sugar and downstream products operation in Africa, an increasing global player and a world-class
organisation.
• be the lowest-cost producer in every country in which it operates and among the lowest-cost producers in the world.
• optimise the return on every stick of cane by adding value to its core commodity products – fi bre, sugar and molasses. It will focus on its core business and develop material niche operations which add value.
• be the market leader, meeting and proactively anticipating customer needs.
• increase profi ts in real terms on a sustainable basis and maximise the return on capital employed through cost leadership, the use of innovative technology and the participation of all of its employees.
• be a moral performance focused organisation that people are proud to work for, where they are challenged to ‘go the extra mile’, feel they can make a difference and know that good performance is recognised.
• be welcomed in the communities in which it operates because of what it does, how well it does it and be accepted as a progressive company by all communities; aligning strategies to meet changing circumstances in the various countries in which the group operates.
• be cognisant of the rural locations of the group’s operations and the impact that it has on job creation and poverty alleviation in such areas.
Goals and objectivesPRIMARY OBJECTIVE
• To enhance the wealth of shareholders by optimising the long-term returns and growth of the business.• To be a world-class organisation and amongst the most effi cient and lowest-cost producers in the world.• To achieve a sustainable, balanced and integrated economic, social and environmental performance.• To provide all employees with a working environment that is safe and without risk to their health.
GROWTH
• To expand the group’s sugar and cane production.• To consolidate and improve the profi tability of downstream products and further develop new applications where
appropriate.• To maximise usage of bagasse and biomass to generate electricity for own operations and to supply power into national
grids.• To seek new opportunities for sugar and downstream products nationally and internationally..
PROFITABILITY
• To achieve a competitive rate of return on shareholders’ funds and increase profi ts on an ongoing basis in real terms.• To maintain a dividend cover of at least two-times.
ASSET MANAGEMENT
• To manage investments in fi xed assets and working capital so as to achieve the most effi cient usage of funds employed, with the objective of not exceeding gearing of 40% over the long term and achieving an interest cover of not less than fi ve times.
PRODUCT DEVELOPMENT
• To be proactive in identifying the needs of customers.• To consistently deliver quality products and services to customers.• To undertake research and development to improve returns, and develop new products and applications, from its core
commodity products using every stick of cane.
HUMAN RESOURCES
• To promote the ongoing development of all employees in order that they reach their maximum level of competence and participate fully in achieving the group’s primary objective.
• To offer equal opportunity to all employees.
CORPORATE GOVERNANCE
• To ensure that the company is managed in an effi cient, accountable, responsible, transparent and moral manner.• To be socially responsible, and maintain and develop appropriate ethical, environmental and risk management standards
as an integral part of the business.• To take cognisance of all stakeholders’ interests in the group’s business.
ILLOVO SUGAR LIMITED • Annual Report 2011 9
BU
SINESS O
VER
VIEW
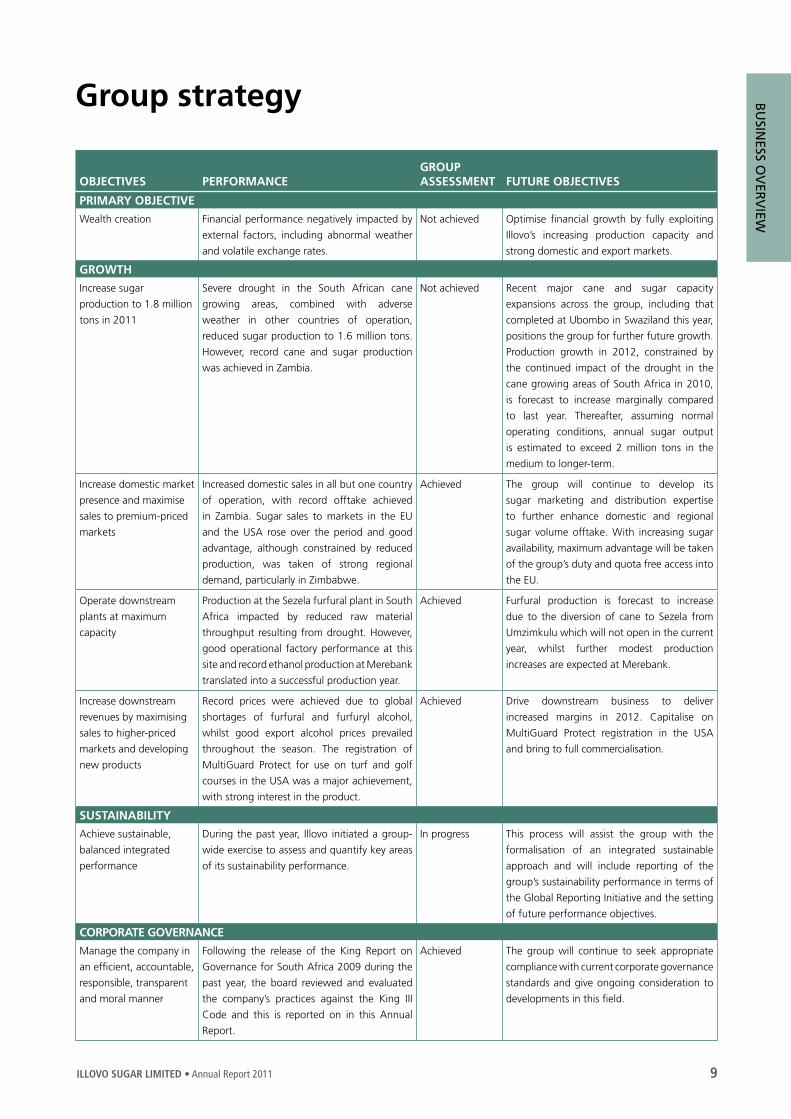
Group strategy
OBJECTIVES PERFORMANCEGROUP ASSESSMENT FUTURE OBJECTIVES
PRIMARY OBJECTIVE
Wealth creation Financial performance negatively impacted by
external factors, including abnormal weather
and volatile exchange rates.
Not achieved Optimise fi nancial growth by fully exploiting
Illovo’s increasing production capacity and
strong domestic and export markets.
GROWTH
Increase sugar
production to 1.8 million
tons in 2011
Severe drought in the South African cane
growing areas, combined with adverse
weather in other countries of operation,
reduced sugar production to 1.6 million tons.
However, record cane and sugar production
was achieved in Zambia.
Not achieved Recent major cane and sugar capacity
expansions across the group, including that
completed at Ubombo in Swaziland this year,
positions the group for further future growth.
Production growth in 2012, constrained by
the continued impact of the drought in the
cane growing areas of South Africa in 2010,
is forecast to increase marginally compared
to last year. Thereafter, assuming normal
operating conditions, annual sugar output
is estimated to exceed 2 million tons in the
medium to longer-term.
Increase domestic market
presence and maximise
sales to premium-priced
markets
Increased domestic sales in all but one country
of operation, with record offtake achieved
in Zambia. Sugar sales to markets in the EU
and the USA rose over the period and good
advantage, although constrained by reduced
production, was taken of strong regional
demand, particularly in Zimbabwe.
Achieved The group will continue to develop its
sugar marketing and distribution expertise
to further enhance domestic and regional
sugar volume offtake. With increasing sugar
availability, maximum advantage will be taken
of the group’s duty and quota free access into
the EU.
Operate downstream
plants at maximum
capacity
Production at the Sezela furfural plant in South
Africa impacted by reduced raw material
throughput resulting from drought. However,
good operational factory performance at this
site and record ethanol production at Merebank
translated into a successful production year.
Achieved Furfural production is forecast to increase
due to the diversion of cane to Sezela from
Umzimkulu which will not open in the current
year, whilst further modest production
increases are expected at Merebank.
Increase downstream
revenues by maximising
sales to higher-priced
markets and developing
new products
Record prices were achieved due to global
shortages of furfural and furfuryl alcohol,
whilst good export alcohol prices prevailed
throughout the season. The registration of
MultiGuard Protect for use on turf and golf
courses in the USA was a major achievement,
with strong interest in the product.
Achieved Drive downstream business to deliver
increased margins in 2012. Capitalise on
MultiGuard Protect registration in the USA
and bring to full commercialisation.
SUSTAINABILITY
Achieve sustainable,
balanced integrated
performance
During the past year, Illovo initiated a group-
wide exercise to assess and quantify key areas
of its sustainability performance.
In progress This process will assist the group with the
formalisation of an integrated sustainable
approach and will include reporting of the
group’s sustainability performance in terms of
the Global Reporting Initiative and the setting
of future performance objectives.
CORPORATE GOVERNANCE
Manage the company in
an effi cient, accountable,
responsible, transparent
and moral manner
Following the release of the King Report on
Governance for South Africa 2009 during the
past year, the board reviewed and evaluated
the company’s practices against the King III
Code and this is reported on in this Annual
Report.
Achieved The group will continue to seek appropriate
compliance with current corporate governance
standards and give ongoing consideration to
developments in this fi eld.

10 Annual Report 2011 • ILLOVO SUGAR LIMITED
Strategic and operational accountability
OUR HISTORY continued
Business profi le• Three agricultural estates, four sugar factories, one sugar
refi nery, three downstream plants. 30% investment in another sugar factory and refi nery
• Produces raw and refi ned sugar, syrup, and downstream products
• 2 000 permanent employees • 2 100 seasonal agricultural workers
Normal season production• Own cane: 360 000 tons• Total throughput: 5.6 million tons cane,
including private growers • Sugar: 670 000 tons • Furfural 20 500 tons; Furfuryl alcohol 11 500 tons;
Diacetyl 150 000 kgs; 2.3-Pentanedione 8 500 kgs; Agriguard products 900 kℓs; Ethanol 55 500 kℓs; Lactulose 9 000 tons; Syrup 6 200 tons; Treacle 1 800 tons
Areas of operation• KwaZulu-Natal• Group head offi ce
Objectives 2011• Increase cane supply• Sugar production: 670 000 tons• Progress Noodsberg refi nery expansion• Expand Agriguard business/MultiGuard Protect registration• Progress land claim issues
Performance• Sugar production of 578 000 tons and furfural operations
impacted by severe drought• Record ethanol production of 55 500 kilolitres• Noodsberg refi nery expansion project completed• MultiGuard Protect achieves US registration• Further initiatives implemented to increase cane supply,
particularly among small-scale grower sector • Settlement of land issues unresolved due to lack of
regulatory capacity• Average cane yield: 52 tons cane per hectare (2010: 70 tons)• Average factory capacity utilisation: 70%
Risk areas• Cane supply due to drought/land issues –
Umzimkulu closed for 2011/12 season• Rand strength/currency movements• World sugar price• Industry discussions with government on sugar industry
review• Duty-paid imports in SACU region
Objectives 2012• Maximise use of installed capacity at operating mills• Improve cane quality/maximise factory effi ciencies and
increase cane supplies despite drought impact• Progress downstream business opportunities
SOUTH AFRICA
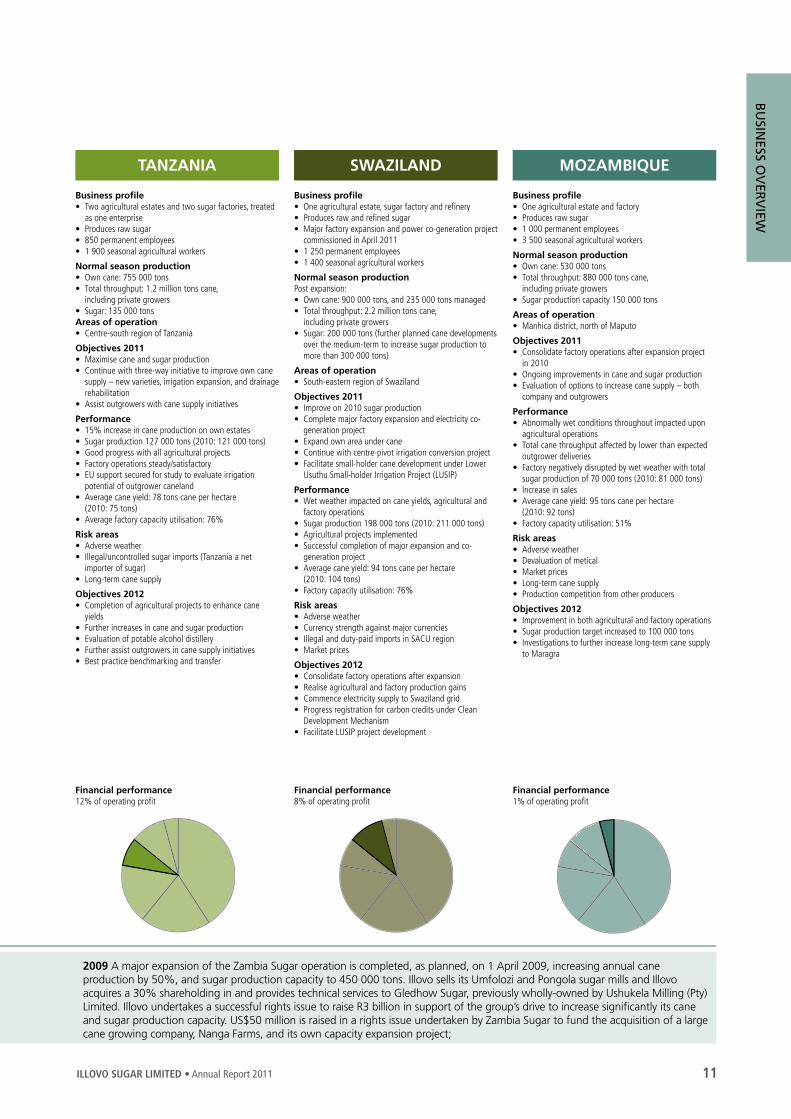
Financial performance14% of operating profi t
ZAMBIA
Financial performance24% of operating profi t
Business profi le• Zambia Sugar Plc listed on Lusaka Stock Exchange• One agricultural estate, largest capacity factory in Illovo
group, one sugar refi nery• Produces raw and refi ned sugar, syrup and speciality
sugars• 1 600 permanent employees• 3 500 seasonal agricultural workers
Normal season production• Own cane: 2.0 million tons• Total throughput: 3.4 million tons cane,
including private growers• Sugar: 450 000 tons
Areas of operation• Nakambala – South-western region of Zambia
Objectives 2011• Consolidate operations after major expansion• Sugar production: 400 000 tons• Expand all market sectors
Performance• Early and late season rains impacted upon operations• New production records: Cane 2.0 million tons
(2010: 1.7 million tons); Sugar 385 000 tons (2010: 315 000 tons)
• Factory achieves design milling capacity • 10% growth in domestic market sales; together with
increased sales to EU and region• Average cane yield: 127 tons cane per hectare
(2010: 129 tons)• Factory capacity utilisation: 81%
Risk areas• Adverse weather• Currency movements – impact on realisations and costs• World price – impact on regional prices• Transport costs to market/logistics• Imports
Objectives 2012• Further build on improving operational performance• Increase sugar production to more than 400 000 tons• Investigation of long-term opportunity to produce
ethanol for blending• Best practice benchmarking and transfer
MALAWI
Financial performance41% of operating profi t
Business profi le• Illovo Sugar (Malawi) Limited listed on Malawi Stock
Exchange• Two agricultural estates, two factories and one refi nery• Produces raw and refi ned sugar and speciality sugars• 5 400 permanent employees • 4 500 seasonal agricultural workers
Normal season production• Own cane: 2.3 million tons• Total throughput: 2.5 million tons cane,
including private growers• Sugar: 330 000 tons
Areas of operation• Corporate offi ce – Limbe • Dwangwa – Mid-central region• Nchalo – Southern region
Objectives 2011• Sugar production: 320 000 tons• Progress outgrower land expansions• Further evaluation of major capacity expansion
opportunities• Capitalise on established domestic and regional
marketing arrangements
Performance• Operational conditions negatively impacted by
unseasonable wet weather• Sugar production: 282 000 tons (2010: 295 000 tons)• New cane developments at both estates to secure
long-term cane supply• Domestic market depressed but good regional sales,
including Zimbabwe, at attractive prices• EU export realisations impacted by lower EU prices and
Euro weakness• Average cane yield: 109 tons cane per hectare
(2010: 110 tons)• Average factory capacity utilisation: 73%
Risk areas• Weather conditions• Currency movements – impact on realisations and costs• World price – impact on regional prices• Transport costs to market – increased oil price• Forex shortages
Objectives 2012• Consolidate operational performance• Increase sugar production to more than 300 000 tons• Further evaluation of expansion opportunities• Consideration of ethanol investment opportunities• Best practice benchmarking and transfer
2001 Illovo sells its Mauritian interests and acquires a controlling interest in Zambia Sugar Plc;
2004 The Gledhow sugar mill and estates are sold to a Black economic empowerment company; and the company sells its interests in Monitor Sugar Company;
2006 Associated British Foods plc, a company listed on the London Stock Exchange, acquires a 51% controlling stake in Illovo;
ILLOVO SUGAR LIMITED • Annual Report 2011 11
BU
SINESS O
VER
VIEW
SWAZILAND
Business profi le• One agricultural estate, sugar factory and refi nery• Produces raw and refi ned sugar• Major factory expansion and power co-generation project
commissioned in April 2011• 1 250 permanent employees• 1 400 seasonal agricultural workers
Normal season productionPost expansion:• Own cane: 900 000 tons, and 235 000 tons managed• Total throughput: 2.2 million tons cane,
including private growers• Sugar: 200 000 tons (further planned cane developments
over the medium-term to increase sugar production to more than 300 000 tons)
Areas of operation• South-eastern region of Swaziland
Objectives 2011• Improve on 2010 sugar production• Complete major factory expansion and electricity co-
generation project• Expand own area under cane• Continue with centre-pivot irrigation conversion project• Facilitate small-holder cane development under Lower
Usuthu Small-holder Irrigation Project (LUSIP)
Performance• Wet weather impacted on cane yields, agricultural and
factory operations• Sugar production 198 000 tons (2010: 211 000 tons)• Agricultural projects implemented• Successful completion of major expansion and co-
generation project• Average cane yield: 94 tons cane per hectare
(2010: 104 tons)• Factory capacity utilisation: 76%
Risk areas• Adverse weather• Currency strength against major currencies• Illegal and duty-paid imports in SACU region• Market prices
Objectives 2012• Consolidate factory operations after expansion• Realise agricultural and factory production gains• Commence electricity supply to Swaziland grid• Progress registration for carbon credits under Clean
Development Mechanism• Facilitate LUSIP project development
Financial performance8% of operating profi t
MOZAMBIQUE
Business profi le• One agricultural estate and factory• Produces raw sugar• 1 000 permanent employees• 3 500 seasonal agricultural workers
Normal season production• Own cane: 530 000 tons• Total throughput: 880 000 tons cane,
including private growers• Sugar production capacity 150 000 tons
Areas of operation• Manhica district, north of Maputo
Objectives 2011• Consolidate factory operations after expansion project
in 2010• Ongoing improvements in cane and sugar production• Evaluation of options to increase cane supply – both
company and outgrowers
Performance• Abnormally wet conditions throughout impacted upon
agricultural operations• Total cane throughput affected by lower than expected
outgrower deliveries • Factory negatively disrupted by wet weather with total
sugar production of 70 000 tons (2010: 81 000 tons)• Increase in sales• Average cane yield: 95 tons cane per hectare
(2010: 92 tons)• Factory capacity utilisation: 51%
Risk areas• Adverse weather• Devaluation of metical• Market prices• Long-term cane supply• Production competition from other producers
Objectives 2012• Improvement in both agricultural and factory operations• Sugar production target increased to 100 000 tons• Investigations to further increase long-term cane supply
to Maragra
Financial performance1% of operating profi t
TANZANIA
Financial performance12% of operating profi t
Business profi le• Two agricultural estates and two sugar factories, treated
as one enterprise• Produces raw sugar• 850 permanent employees• 1 900 seasonal agricultural workers
Normal season production• Own cane: 755 000 tons• Total throughput: 1.2 million tons cane,
including private growers• Sugar: 135 000 tonsAreas of operation• Centre-south region of Tanzania
Objectives 2011• Maximise cane and sugar production• Continue with three-way initiative to improve own cane
supply – new varieties, irrigation expansion, and drainage rehabilitation
• Assist outgrowers with cane supply initiatives
Performance• 15% increase in cane production on own estates• Sugar production 127 000 tons (2010: 121 000 tons)• Good progress with all agricultural projects• Factory operations steady/satisfactory• EU support secured for study to evaluate irrigation
potential of outgrower caneland• Average cane yield: 78 tons cane per hectare
(2010: 75 tons)• Average factory capacity utilisation: 76%
Risk areas• Adverse weather• Illegal/uncontrolled sugar imports (Tanzania a net
importer of sugar)• Long-term cane supply
Objectives 2012• Completion of agricultural projects to enhance cane
yields• Further increases in cane and sugar production • Evaluation of potable alcohol distillery• Further assist outgrowers in cane supply initiatives• Best practice benchmarking and transfer
2009 A major expansion of the Zambia Sugar operation is completed, as planned, on 1 April 2009, increasing annual cane production by 50%, and sugar production capacity to 450 000 tons. Illovo sells its Umfolozi and Pongola sugar mills and Illovo acquires a 30% shareholding in and provides technical services to Gledhow Sugar, previously wholly-owned by Ushukela Milling (Pty) Limited. Illovo undertakes a successful rights issue to raise R3 billion in support of the group’s drive to increase signifi cantly its cane and sugar production capacity. US$50 million is raised in a rights issue undertaken by Zambia Sugar to fund the acquisition of a large cane growing company, Nanga Farms, and its own capacity expansion project;

Directorate
Non-executive, independent Chairman
Robbie Williams (70) BA, LLB * # Chairman of Nomination Committee
Appointed to the board in 1985 and as Chairman in 1997. Qualifi ed at the University of Cape Town and joined Barlows Manufacturing Company where he became the managing director in 1979. He is past chairman of C G Smith Foods Limited and Tiger Brands Limited. He is also a non-executive director of Pescanova SA in Spain.
Non-executive deputy Chairman
Don MacLeod (64) BCom, AMP (Oxford) # ^ Chairman of Risk Management Committee
Joined the South African sugar industry in 1971 and became part of the Illovo group in 1973. He spent 10 years in various management positions before being appointed to the board in 1983. Mr MacLeod was previously fi nance director, was appointed managing director in 1992, became chief executive in 1995, and upon retirement in 2009, became deputy chairman. He is a past chairman of the South African Sugar Association and the South African Sugar Millers’ Association.
Non-executive, independent directors
Mike Hankinson (62) BCom, CA(SA) * # ^ Chairman of Remuneration Committee
Appointed as a non-executive, independent director in 2008. After qualifying as a chartered accountant, he joined the Romatex group in 1976 where he managed a number of subsidiaries and was appointed group chief executive in 1994. He was president of the Textile Federation and a member of the SA Wool Board. He joined Dunlop in 1997 as chief executive offi cer, and during his tenure presided over the sale of the business to a private consortium, its delisting from the JSE Limited, and its sale to Apollo Tyres Limited, an Indian-based listed company. In 2007, he was appointed as a non-executive director of Apollo Tyres and relinquished his position at Dunlop. He is Chairman of The SPAR Group Limited and Brandcorp Holdings (Pty) Limited, and a non-executive director of Grindrod Limited.
Phinda Madi (47) BProc, EDP #
Appointed as a non-executive, independent director in November 2002. Obtained his law degree from the University of Zululand in 1987. Joined the French Bank of South Africa in 1987 as corporate banking and legal offi cer, and from 1992 to 1994 acted as an in-house consultant on employment equity for the Standard Bank group. He is a founder of several consulting and publishing companies and author of three books on business strategy and transformation. In 2001, he was appointed visiting professor of business leadership studies at Rhodes University and currently is deputy chairman of one of South Africa’s major medical aid companies, Allcare Medical Aid Administrators. He is also a non-executive director of other listed companies, Nampak Limited, Sovereign Food Investments Limited and The SPAR Group Limited.
Dr Len Konar (57) CA(SA), MAS (Illinois), DCom * Chairman of Audit Committee
Appointed as a non-executive, independent director in 1995 and as chairman of the Audit Committee in 1997. He is a chartered accountant who acts as a professional director of companies. He was previously executive director of the Independent Development Trust where he was, amongst other activities, responsible for the internal audit and investments portfolios. Prior to that, he was professor and head of the Department of Accountancy at the University of Durban-Westville. He is a member of the King Committee on Corporate Governance, the Securities Regulation Panel and the Institute of Directors. He is also Chairman of Steinhoff International Holdings Limited, Exxaro Resources Limited and Mustek Limited, and a non-executive director of Alexander Forbes Equity Holdings (Pty) Limited, the South African Reserve Bank, J D Group Limited, Sappi Limited and Lonmin plc. He chairs or serves on the audit committees of these and other organisations. He is also the co-chairman of the Oversight Panel of the World Bank and a current member of the Safeguards Panel and past chairman and member of the external audit committee of the International Monetary Fund in Washington.
Ami Mpungwe (Tanzanian) (60) BA (Hons) ^
Appointed as a non-executive, independent director, with effect from 1 September 2009. He is a past Tanzanian High Commissioner to South Africa, having retired after 25 years’ service in the Tanzanian diplomatic service. He is a non-executive director of three of Illovo’s operating subsidiaries; Illovo Sugar (Malawi) Limited which is listed on the Malawi Stock Exchange, Zambia Sugar Plc which is listed on the Lusaka Stock Exchange, and Kilombero Sugar Company Limited in Tanzania. He is also a director of a number of other companies in Tanzania, and was previously a director of Illovo Sugar Limited from 2001 to 2006. He has a wealth of commercial experience in operating on the African continent
Trevor Munday (61) BCom * # ^
Appointed as a non-executive, independent director, with effect from 9 March 2010. He spent his formative years from 1971 in a wide-ranging number of roles in fi nancial and commercial management positions both in southern Africa and Europe. In the late 1980s, he was appointed fi nance and commercial director of AECI Explosives and Chemicals Limited. In 1990, he was appointed managing director of Dulux Paints and in the period 1996 to 2000, managing director of Polifi n Limited. In 2001, he was appointed executive director and chief fi nancial offi cer of Sasol Limited with responsibility also for corporate affairs and various other portfolios. Two years later, he assumed global responsibility for Sasol’s chemical businesses. In 2005 and 2006, he was deputy chief executive of Sasol Limited. At the end of 2006, he retired from executive roles and in 2007 became a non-executive director of various companies. He currently serves as Chairman of Reunert Limited and as a director of Absa Group Limited, Absa Bank Limited, Life Healthcare Group Holdings Limited, Sasol Synfuels International (Pty) Limited, Sasol Petroleum International (Pty) Limited, and Sasol Polymers – trading as a division of Sasol Chemical Industries (Pty) Limited.
Nosipho Molope (46) BSc (Medical Sciences), BCompt (Hons), CA(SA) *
Appointed as a non-executive, independent director in 2008. After qualifying as a chartered accountant in 1999, she was appointed fi nance executive of Akulalwa Corporate Advisors. In 2001, she joined Wipcapital as manager: specialised funds management, and later that year was appointed group fi nancial executive of Viamax, a subsidiary of Transnet Limited. In 2004, she joined Zungu Investments Company as fi nancial director, and in 2005 was appointed as chief fi nancial offi cer of the Financial Services Board. She resigned from this position with effect from December 2008 to give focus to her role as a professional non-executive director of companies. She is also a director of Hudaco Industries Limited, and its subsidiary Hudaco Trading (Pty) Limited, Nampak Limited, MTN SA, MTN Business Solutions (Pty) Limited, and six other MTN group subsidiaries in West and East Africa.
12 Annual Report 2011 • ILLOVO SUGAR LIMITED

Executive directors
Graham Clark (Australian) (55) BAcct (Hons), FCA (Australia) ^ +
Managing Director
Appointed to the board in 1997 and as Managing Director on 1 April 2009. Qualifi ed with an honours degree in accounting and is a fellow of the Institute of Chartered Accountants in Australia. He joined the sugar industry in Malawi in 1980 and occupied several fi nancial and management positions, as part of which he obtained extensive sugar industry experience throughout Africa and internationally. Participation in the 2005/06 reform of the EU sugar regime resulted in him occupying a leadership role representing the interests of sugar producers in Least Developed Countries.
Larry Riddle (51) BCom, CA(SA) +
Commercial Director
Appointed to the board on 1 April 2009 as Commercial Director. After qualifying as a chartered accountant, he joined Illovo Sugar in 1986. He held a number of senior management positions within the company prior to his appointment as a director. He is a past chairman of the South African Sugar Millers’ Association and the Ethanol Producers’ Association of South Africa.
Karin Zarnack (38) BCom, CA(SA) ^ +
Financial Director
Appointed to the board as fi nancial director in October 2005. Obtained her degree from the University of Natal, Durban in 1994. After completing her training contract with Deloitte & Touche, she was appointed a manager of its audit services division where she was responsible for the audits of both listed and private companies mainly in the manufacturing sector, including Illovo Sugar Limited. In 2004, she was admitted as an audit partner. Her international experience includes secondments to Miami, USA and Manila in the Philippines.
Barry Stuart (63) BCom, Dip Sugar Tech, SEP ^ +
Operations Director
Joined the Illovo group in 1973 and spent 13 years in various production management positions before being appointed as general manager of the Umzimkulu mill and later general manager of the Sezela mill. He was appointed to the board as cane procurement director in 1994, became operations director responsible for operations in South Africa in 1995, was appointed technical director in 2006, and Operations Director in 2008. He is a past chairman of the South African Sugar Millers’ Association.
Richard Pike (British) (41) LLB, ACA, ATII, AMCT ^
Financial Director: AB Sugar
Appointed as a non-executive director, with effect from 28 January 2010. He joined the AB Sugar Group in January 2010. Immediately prior to that, he was the group operations and fi nance director of Bridgemere UK plc, and previously held senior positions in Manchester AirportGroup plc, Scapa Group plc and Pilkington plc.
Non-executive directors
Dr Mark Carr (British) (48) BSc, PhD, MBA, CEng, MIMechE #
Chief Executive Offi cer: AB Sugar
Appointed to the board in 2006, as a nominee of the holding company. Appointed Chief Executive of AB Sugar in April 2004, Dr Carr has since lead the development of Associated British Food’s sugar activities across the world. He has also served on the Executive of the World Sugar Research Organisation and the European Confederation of Sugar Producers. Prior to his joining the sugar industry, Dr Carr held a variety of senior positions within Corus Group plc, formerly British Steel plc, including assignments in the USA and Europe. He gained a doctorate in mechanical engineering at Swansea University and an MBA from Warwick University.
Paul Lister (British) (47) LLB
Director of Legal Services and Company Secretary: Associated British Foods
Appointed to the board in 2006, as a nominee of the holding company. He is currently Director of Legal Services and Company Secretary of Associated British Foods plc, having joined the ABF group in that role in January 2001. Mr Lister was formerly associate general counsel of Diageo plc. He holds a law degree from University College London and is a qualifi ed solicitor in England and Wales.
Key
BU
SINESS O
VER
VIEW
ILLOVO SUGAR LIMITED • Annual Report 2011 13
* Member of Audit Committee
# Member of Remuneration/Nomination Committee
^ Member of Risk Management Committee
+ Member of Executive Committee

14 Annual Report 2011 • ILLOVO SUGAR LIMITED
Executive Committee
Nigel Hawley (54)
BCom(Hons)
Human resources
Responsible for group and corporate human resources, medical services, staff compensation and benefi ts, training and development, retirement funding and talent management
Joined the sugar industry 1978
Joined the group 1978
Gordon Knox (62) ^
BCom
Corporate affairs and Company Secretary
Responsible for company secretarial functions and corporate affairs, group insurance, legal services, internal audit, sustainability and corporate citizenship
Joined the sugar industry 1973
Joined the group 1984
Gavin Dalgleish (45)
MScChemEng
Continuous improvement
Responsible for group performance optimisation and continuous improvement
Joined the sugar industry 1988
Joined the group 1988*
Graham Clark (Australian) (55) ^
BAcct(Hons), FCA(Aust)
Managing Director
Responsible to the Illovo board and shareholders for the delivery of the group’s strategic goals and objectives, providing leadership across operations
Joined the sugar industry 1980
Joined the group 1997
OUR HISTORY continued
2010 The South African business is restructured and its relevant assets transferred into a wholly-owned subsidiary, Illovo Sugar (South Africa) Limited; Illovo increases to 90% its shareholding in Maragra Açúcar SA in Mozambique;
2011 A major factory expansion and co-generation project is commissioned at Ubombo in Swaziland;
From left to right: Graham Clark; Gavin Dalgleish; Gordon Knox and Nigel Hawley

ILLOVO SUGAR LIMITED • Annual Report 2011 15
BU
SINESS O
VER
VIEW
Larry Riddle (51)
BCom, CA(SA)
Commercial
Responsible for group commercial operations relating to sugar and downstream activities, export marketing, group procurement and industrial affairs
Joined the sugar industry 1986
Joined the group 1986
Karin Zarnack (38) ^
BCom, CA(SA)
Finance
Responsible for group fi nancial and corporate fi nance functions, information technology and performance analysis (operational and fi nancial)
Joined the sugar industry 2005
Joined the group 2005
Barry Stuart (63) ^
BCom, DipSugarTech, SEP
Operations
Responsible for group operational performance relating to all agricultural and manufacturing operations, technical services and risk and safety management
Joined the sugar industry 1968
Joined the group 1971
Key
^ Member of Risk Management Committee
* Includes periods of broken service
Today, Illovo is Africa’s largest sugar producer and has extensive agricultural and manufacturing assets in six Southern African countries, producing more than six million tons of cane with milling capacity to produce two million tons of sugar per annum. Revenue amounts to R8.1 billion and the share price traded at R26.85 (year-end).
From left to right: Larry Riddle; Barry Stuart and Karin Zarnack

16 Annual Report 2011 • ILLOVO SUGAR LIMITED
However, with its strong cash generation and a healthy balance sheet, the group is well positioned to continue with its growth path of increased sugar and cane production in Africa. Our focus on Africa and the way we have organised and deployed resources over the past few years to attain our business objectives on the continent position us uniquely to participate in the considerable growth opportunities that Africa offers. In addition, the group is focused on continuing to be the lowest-cost producer in every country in which it operates and amongst the lowest-cost producers in the world, optimising the return on every stick of cane by adding value to its core commodity products of fi bre, sugar and molasses. This strategy is both robust and sustainable.
SUGAR CAPACITY EXPANSIONSThe commissioning of the major factory expansion and power co-generation project at Ubombo in Swaziland in April of this year will, over the longer-term, add an additional 100 000 tons of sugar to Illovo’s current production capacity. In addition to providing suffi cient electricity to cover all of Ubombo’s power requirements, surplus electricity will also be exported to the national grid in terms of a commercial agreement with the Swaziland Electricity Company. The project is linked to the Lower Usuthu Small-holder Irrigation Project which, already in its initial phases of development has created almost 1 500 jobs and is ultimately expected to provide economic benefi ts to 28 000 people.
The benefi ts of the substantial capital investment in our sugar operations at Nakambala in Zambia started to fl ow through during the past year. This successful major expansion, which has increased annual sugar production capacity from around 200 000 tons to 450 000 tons, saw all previous production and sales records being exceeded. This was a milestone achievement for Zambia Sugar. The confi dence level is high at Nakambala, leading to the expectation of further milestones in the 2011/12 sugar milling season.
Following the completion of the two-year factory capacity expansion at Maragra in Mozambique, and in order to fulfi l its increased production objectives, the focus of attention is on increasing its current cane supply. Ultimately, in steady-state, Maragra will have the ability to produce around 150 000 tons of sugar annually, compared to approximately 80 000 tons before the expansion commenced.
In South Africa, a major expansion of the Noodsberg refi nery was completed which will result in its offcrop refi ning capacity increasing by 60 000 tons of refi ned sugar above the previous annual capacity of 290 000 tons. Smaller factory and agricultural expansions have also been undertaken in Malawi whilst in Tanzania, ongoing agricultural projects to increase cane yields at Kilombero have shown meaningful results.
Chairman’s Statement
OVERVIEW The past year was disappointing for the group. Despite the signifi cantly enhanced production capability of the business, the fi nancial results were adversely affected by a number of external factors. Key amongst these were abnormal weather conditions which hampered group production and volatile exchange rates.
Group sugar production was marginally below last year and this, together with unfavourable exchange rates, impacted negatively on group revenues and margins resulting in operating profi t of R1 029 million being 31% below that of the previous year. In addition, the operating margin declined from 18% to 13%. Headline earnings of R516 million declined by 27%, whilst headline earnings per share fell by 35% to 112.2 cents.
Robbie Williams

ILLOVO SUGAR LIMITED • Annual Report 2011 17
CO
MM
ENTA
RIES
The commissioning of the major factory expansion and power co-generation project at Ubombo in Swaziland in April of this year will, over the longer-term, add an additional 100 000 tons of sugar to Illovo’s current production capacity.

18 Annual Report 2011 • ILLOVO SUGAR LIMITED
CHAIRMAN’S STATEMENT continued
Progress on the capital investment opportunity in Mali is ongoing, with the remaining hurdle being project funding for the development. This greenfi eld project continues to receive high priority support from the government of Mali and would represent a major economic milestone in the industrial transformation of that country. Once commissioned and in steady-state, the project will produce 200 000 tons of sugar, 15 000 kilolitres of fuel-blend ethanol and suffi cient electrical power to be self-suffi cient plus export a small surplus to the national grid. It is anticipated that, subject to funding being secured in terms of current timelines, the project will commence towards the end of 2011, with fi rst sugar production likely in early 2014/15.
DOWNSTREAMIllovo’s downstream business is constantly seeking value-added niche opportunities and recently Agriguard’s products gained access to potentially signifi cant new markets. The conversion of furfural, derived from sugar cane, to a natural environmentally-friendly agricultural chemical to combat plant root nematodes recently achieved registration for use in the United States of America (USA) on golf courses and turf. Granted by that country’s Environmental Protection Agency, one of the world’s most stringent regulatory bodies, this is the fi rst registration of furfural as a nematicide in the USA and allows access to a sizeable market that will be used as a springboard to achieve further registrations and to expand into other international markets. Further production enhancements at the Merebank ethanol plant resulted in increased production and record output being achieved in 2010/11.
MARKETSA strength of the Illovo business lies in its established strong presence in the domestic markets in the countries in which it operates. In addition, it has access to markets in the European Union (EU) and the USA whilst in Africa, defi cit sugar markets in close proximity to the group’s operations remain a strong focus. It is signifi cant that of total sugar sales of 1.64 million tons in 2010/11, 65% was sold to local consumers and industrial users. Illovo’s proven sugar distribution into some of southern Africa’s most remote and rural areas further enhanced sales. Only 5% of total group sales was exported to the world raw sugar market through the South African Sugar Association. The mix of downstream product sales is predominantly export orientated, where prices which were strong in the past year are governed by international market forces. Domestic sales of downstream products continue to provide positive returns on the basis of quality and availability.
OPPORTUNITIESThe cane sugar industry holds a major competitive advantage in that the residual fi bre from the cane extraction process, bagasse, is used primarily as a bio-renewable fuel feedstock for factory boilers to produce electricity to power its own operations. A further enhancement to this internal electricity production model, is Illovo’s development of the process to utilise biomass left in cane fi elds after harvesting. Blended with bagasse this increases boiler fuel feedstock and, with additional installed co-generation capacity, further increases electricity production. Power shortages are a growing issue across Africa with considerable negative consequences for economic development and growth in many African countries. In addition to Illovo’s stated objective to become self-suffi cient in its own power requirements, there exists signifi cant potential to supply surplus power into national electricity grids from existing and new operations, provided that there is a stable regulatory environment within which to work. Against this background and with considerable in-house experience, the commissioning of the Ubombo expansion this year provides a sustainable sugar/power co-generation production model which can be used in existing operations or new sugar projects.
Molasses, as a by-product of the sugar manufacturing process, is already used in South Africa to produce high-quality grades of potable and denatured ethanol. In most other countries in which Illovo operates, there are several opportunities which would expand the group’s involvement in this area of operation. In the medium-term, these include potential projects in Tanzania to produce potable alcohol at the Kilombero operation, and in Malawi, Zambia and Mali to produce ethanol for fuel blending programmes.
It is signifi cant that of total sugar sales of 1.64 million tons, 65% was sold to local consumers and industrial users.

ILLOVO SUGAR LIMITED • Annual Report 2011 19
CO
MM
ENTA
RIES
CORPORATE GOVERNANCEThe directors and employees of Illovo strive to ensure that the company is managed in an effi cient, accountable, responsible and moral manner and to this end, endorsed fully its compliance with the Code of Corporate Practices and Conduct contained in the King Report on Corporate Governance for South Africa 2002, known as King II. With the release of the King Report on Governance for 2009 (King III), Illovo committed in its 2010 Annual Report to compliance with the new standards incorporated in the King III Code and during the past year, the board has reviewed and evaluated corporate governance practice within the group, presenting its fi rst report relative to this Code on pages 62 and 63. We have established a system to apply the principles of the Code, except for those instances where the board decides that certain principles are not appropriate, in which case reasons for this are provided. For the year ahead, Illovo will also comply with the new South African Companies Act, 2008, as amended, effective 1 May 2011.
Sustainability is a critical component of corporate governance and the group aims to ensure that sustainable development principles underpin all business activities and that it operates in a socially responsible manner towards its stakeholders in delivering positive social, economic and environmental benefi ts. During the past year, Illovo initiated a reporting process aligned to global reporting standards across all operations to assess and quantify key areas of its sustainability performance. This process, when completed later in the current year, will assist the group with the formalisation of an integrated sustainable approach, and include reporting of the group’s sustainability performance and the setting of future performance objectives.
Illovo’s progress towards these objectives has been assisted by its ongoing involvement with the JSE’s Socially Responsible Investment (SRI) Index, to which it has been admitted for the past four years. On the ground, and cognisant of the development needs of the diverse and rural environments in which Illovo operates, the group has a long-standing track record of social investment delivery extending from the provision of basic services to direct fi nancial investment to improve education delivery. In the past year, the group spent R143 million on both employee-related and community development programmes.
PROSPECTSOverall, the strength of the group’s base business and continued efforts to mitigate the impacts of Illovo’s business risk factors, should result in Illovo increasing its sugar production to more than two million tons over the next fi ve years. Equally, further developments of the group’s downstream business will see this segment’s profi ts increase over the same period.
There are several opportunities to expand Illovo’s current involvement in the production of ethanol from molasses in South Africa to most of the group’s other countries of operation. Pictured here are the molasses storage tanks at Merebank which produces high quality grades of potable and denatured ethanol.

20 Annual Report 2011 • ILLOVO SUGAR LIMITED
CHAIRMAN’S REPORT continued
In this coming year, an increase in group sugar production is anticipated. However, the strength of local currencies will continue to impact upon revenue realisations for both sugar and downstream exports and the conversion of profi ts.
DIRECTORATEKarin Zarnack, the Financial Director, has resigned and will be leaving at the end of May 2011 to pursue other business interests. I would like to thank her for her contribution over the years and wish her well in her future endeavours.
APPRECIATIONI would like to thank the members of the board for the wise counsel and strategic value they bring to the group. On behalf of the board, I would like to also thank Illovo’s people across its operations for the considerable effort they have put into their work in what has been a most challenging year. Their contributions and efforts are much appreciated.
The upcoming annual general meeting brings to an end my tenure as Chairman of Illovo.
It has been a privilege to have been on the board and to have played a part in the company’s growth and development over the years.
I leave confi dent that the company is well positioned for the future.
Illovo has a highly competent and motivated management team well led by Graham Clark. It has a strong and experienced board and in addition receives valuable strategic input from its association with controlling shareholder, Associated British Foods plc and its subsidiary AB Sugar.
I am very pleased that Don MacLeod has been appointed to succeed me as Chairman. Don not only has a great depth of knowledge and wealth of experience in the industry, but also has a shared vision of growth for the future.
I wish him, my colleagues on the board and the company much success.
R A WilliamsChairman
Mount Edgecombe27 May 2011
Record cane production of 1.97 million tons was achieved by the agricultural operations at Zambia Sugar. Combined with outgrower deliveries, 385 000 tons of sugar was produced in 2010/11, the most produced by a single factory in the Illovo group.

ILLOVO SUGAR LIMITED • Annual Report 2011 21
CO
MM
ENTA
RIES
A TRIBUTE TO ROBBIE WILLIAMS
Robbie Williams will be retiring from Illovo at the forthcoming annual general meeting having reached the compulsory retirement age of 70, after 14 years as Chairman of the board and 26 years as a director.
He was born in the United Kingdom, went to Northlea High School in Bulawayo and is a law graduate of the University of Cape Town. He practised as a prosecutor before entering the world of business in Zimbabwe in 1964, then Rhodesia, and joined the Barlow Rand Group in 1967. He held a number of senior positions and was a director of the Barlow Rand Group which was the ultimate holding company of Illovo from 1980 until the unbundling of that company in 1993. He was Chairman of C G Smith Foods Limited, the then holding company of Illovo, from 1985.
He has served on a number of other listed company boards. He was the National President of the Institute of Marketing Management and in 1986 was South Africa’s Marketing Man of the Year.
His association with Illovo goes back to 1985 when he was Chairman of C G Smith Foods and he has seen and been part of all major changes that have taken place in the group since that date. In the early years, Illovo was only a South African-based business focused on being the major player in that country, but in the year that he became Chairman, the group profi le changed with the acquisition of Lonrho Sugar and Illovo became a truly African business with operations in Malawi, Swaziland and Mauritius. Since then, further acquisitions have taken place in Zambia and Tanzania with the re-development and expansion of the Mozambique business, following the catastrophic fl ood in 2000, also undertaken.
A number of expansions and rationalisations of the business have occurred over the last 14 years under the guiding hand of Robbie. He has played an integral role in all major strategic decisions taken during his involvement with the company, both as Chairman and whilst a director and Chairman of the holding company.
Figures only tell part of the story of the changes which have occurred in the group whilst Robbie has been involved. However, when he became Chairman, Illovo’s sugar production was just over 800 000 tons, now having grown to 1.6 million tons in 2011, whilst earnings amounted to R81 million and now stand at R516 million. Equally, the employees numbered 5 200 permanents and 4 100 seasonals, which now compare with the current numbers of 12 169 and 17 000 respectively. Thus it is a very different group today compared to when he started as Chairman.
During his tenure as Chairman, he has visited the operations on a regular basis and understood the drivers and risks of the business which enabled him to pose critical questions to management whilst giving support and guidance. His knowledge of Illovo and its people has equipped him well in chairing the board particularly as the group has expanded its production base across the continent.
Illovo, its management and staff, and other stakeholders are highly appreciative of the role Robbie has played in guiding the group through a defi nitive period in its history, and we wish him well in his fully-retired years.
D G MacLeod Deputy Chairman

22 Annual Report 2011 • ILLOVO SUGAR LIMITED
CANE SUPPLYIllovo’s drive to increase the supply of cane to the group’s sugar factories made good progress, with various developments in each country of operation. Total cane production of 6.3 million tons was a new record for the group, and compared to the 6.1 million tons produced in 2010, despite severe drought in South Africa and unseasonable wet weather in other countries. Notwithstanding a rain-interrupted season in Zambia, record cane production was achieved following the recent major expansion at Nakambala and this, together with increased output in Tanzania, more than offset signifi cant cane supply losses in South Africa due to the drought, and to a lesser extent, weather-affected production in Malawi, Swaziland and Mozambique.
The coming year should see the results of several ongoing initiatives to further increase cane production across the group, notably in Swaziland where an additional area of land was planted to irrigated cane and good progress was made with a centre-pivot irrigation conversion project to increase cane yields. Further marginal land development took place in Malawi, whilst in Tanzania, a three-pronged initiative involving the planting of new cane varieties, an irrigation conversion and up-grading programme, and the rehabilitation of the estate drainage system saw a meaningful increase in cane yields in the year under review. A programme to optimise the disposition of new cane varieties, linked to irrigation up-grades, also improved cane yields in Mozambique. In South Africa, the initiative to increase cane supply from the small-scale farming sector progressed with the launch of an innovative, externally-funded cane rehabilitation and development programme over 4 000 hectares of land, which is being co-ordinated jointly by the company and its partners; the grower community, the provincial government of KwaZulu-Natal and The Standard Bank of South Africa Limited. In Zambia, further increases in cane supply are anticipated arising out of the completion of the outgrower component of the recent expansion in that country. The coming year should see the results of several initiatives to increase cane production by 300 000 tons across the group with an increase of 200 000 tons expected to be delivered by the group’s growers.
SUGAR PRODUCTIONGroup sugar production in 2010/11 of 1.639 million tons was marginally below last year’s tonnage of 1.685 million tons. The loss of tonnage arising from the drought in South Africa was almost fully offset by increased production in other group operations, highlighting the strategic benefi t of Illovo’s geographic spread of operations. The severity of the drought in South Africa during 2010, affecting both company and outgrower cane production, was to remove more than 100 000 tons of sugar from forecast targets. There were also smaller sugar production decreases in Malawi, Swaziland and Mozambique due to unseasonably wet weather both at the beginning and end of the season. However, record sugar production
Managing Director’s Review
OVERVIEWThe impact of adverse weather and currency movements combined to depress group fi nancial performance during the past year. Although sugar production was only marginally below the previous year, the strength of the rand and strong local currencies in Malawi and Zambia, together with a period of euro weakness, collectively impacted negatively on export earnings and the conversion of foreign subsidiary profi ts into rand. Group operating profi t fell by R469 million from the previous year to R1 029 million, whilst headline earnings reduced by 27% to R516 million. Cash generation at R1 279 million was however strong, further strengthening the group balance sheet, notwithstanding the signifi cant capital investments made by the group in the past fi ve years.
Graham Clark

ILLOVO SUGAR LIMITED • Annual Report 2011 23
CO
MM
ENTA
RIES
Total cane production of 6.3 million tons was a new record for the group, and compared to the 6.1 million tons produced in 2010, despite severe drought in South Africa and unseasonable wet weather in other countries.

24 Annual Report 2011 • ILLOVO SUGAR LIMITED
MANAGING DIRECTOR’S REVIEW continued
in Zambia of 385 000 tons, despite weather-related disruptions during the year, and increased output in Tanzania, mitigated the down-side.
Overall, despite disruptions caused by erratic cane supplies and reduced cane quality due to the impact of the adverse weather, factory performance was generally good, with meaningful improvements in operational and mechanical effi ciencies being achieved in many of the group’s sugar factories. It is signifi cant that the Nakambala factory in Zambia reached and exceeded its design cane throughput capacity and achieved an average factory capacity utilisation of more than 80%, the highest in the group.
The major factory expansion and co-generation project at Ubombo in Swaziland was commissioned, within budget and on time in April 2011 and, in its fi rst year of operation, with increased company and outgrower cane supplies, is forecast to raise production by around 20% compared to last year. In South Africa, an expansion project to increase Noodsberg’s total refi ning capacity to 350 000 tons of sugar was completed and will contribute towards the group’s refi ned sugar needs into the future. Ongoing minor capacity enhancements continue throughout the group.
SUGAR MARKETSThe group’s domestic sugar markets are of major importance and in a year impacted generally by restricted sugar availability, it was encouraging to note that record offtake was achieved in the Zambian local market, increasing by 10% compared to 2010/11, whilst domestic sales in South Africa performed strongly and those in Tanzania showed a smaller improvement. Export sales were negatively affected by sugar availability. Sales to the EU and the USA showed a slight increase over last year, whereas regional sales volumes declined by 11%. EU and regional market prices fi rmed in line with the higher world price and tight sugar supplies. With the focus on domestic sales and EU and regional markets, less than 90 000 tons of sugar produced by Illovo was exported out of South Africa to the world raw sugar market. World raw sugar prices began 2010/11 on a downward trend following a period of sustained growth during 2009/10. This reversed as production expectations deteriorated in Brazil and India, and prices returned to the highs of the previous year. World sugar availability was extremely limited throughout the year as stocks in major consumer countries were replenished, whilst at the same time the increasing demand pipeline was supplied. A high level of speculative activity also supported world sugar prices. Towards the end of the 2010/11 season, news of improving production prospects began to soften demand and sugar future prices came under pressure. Predictions of a record crop in Thailand also drove sentiment. Against this background, the South African sugar industry exported 340 000 tons of sugar and realised an average price of US17.70 cents/lb compared to US16.53 cents/lb in the previous year.
DOWNSTREAM PRODUCTSDrought in South Africa and its negative impact on cane supply reduced the raw material throughput of Sezela’s furfural plant, resulting in production levels of furfural and furfuryl alcohol falling to around 15 900 tons and 9 000 tons respectively, representing a reduction of nearly 15% compared to the previous year. A good increase in diacetyl production to 115 000 kilograms was achieved, whilst Agriguard production for use as a nematicide almost doubled to more than 450 kilolitres. Good performance following plant modifi cations undertaken last year resulted in record production of ethanol at Merebank which, together with that produced by the Glendale distillery, amounted to more than 55 500 kilolitres. Lactulose and syrup production were similar to last year’s levels.
Shortages of furfural and furfuryl alcohol in all major world markets resulted in strong export prices, rising to record levels for furfuryl alcohol. As much advantage as possible was taken of this strong demand but marketing activity was restricted by limited supply. Following the registration for the use of MultiGuard Protect, a furfural-based nematicide developed by Illovo, on turf and golf courses in the USA, the product was launched at the USA Golf and Turf Show in Florida in February 2011 during which the product received good exposure converting to a growing order book. Ethanol sales volumes remained steady with fi rmer export prices prevailing throughout the season.
PROSPECTSThe group’s prospects for 2011/12 are driven off an anticipated increase in group sugar production compared to the past year. This is constrained by South African sugar output which is forecast to be sharply lower than in 2010/11 following the extreme knock-on impact of the drought experienced in KwaZulu-Natal. In this context, the Umzimkulu factory will not open for the 2011/12 season and the sugar cane from this area will be diverted to Sezela and Eston to better utilise plant capacity. Assuming normal weather conditions elsewhere, the fall in South African sugar production is expected to be offset by increased sugar production in the group’s other operations. This follows the recent major production expansions, and a focus on performance optimisation to increase Illovo’s sugar production effi ciency. Downstream production of furfural will increase due to the diversion of cane to Sezela, and similar levels of ethanol production are estimated for the coming year. Sugar markets will be primarily domestic-market driven, but with increased sales to the EU where sugar prices have improved during the fi rst half of 2011. Ongoing advantage will be taken of downstream prices which remain at good levels. However, the strength of local currencies will continue to have a negative impact upon revenue realisations for both sugar and downstream exports and the conversion of foreign subsidiary profi ts. Overall, operating profi t is anticipated to improve, but increased fi nancing costs, following the completion of the Swaziland expansion project, are expected to be sharply higher.
G J ClarkManaging Director

ILLOVO SUGAR LIMITED • Annual Report 2011 25
CO
MM
ENTA
RIES
STRATEGIC REVIEW The group’s goals and objectives continue unchanged, with primary objectives being to remain a world-class, low-cost and highly effi cient organisation seeking to enhance shareholder wealth and optimise growth, whilst at the same time achieving a sustainable, balanced and integrated economic, social and environmental performance.
High standards of corporate governance are demanded from all group operations and compliance is regularly reviewed. The group strives to achieve and surpass its goals and objectives on an ongoing basis, guided by the principles incorporated within the group Strategic Intent. All entities within the group are aligned to Illovo’s common goals and objectives. Annual strategic plans and budgets are prepared with these aspects in mind.
Growth philosophyInvestments in the group’s operations will continue to be undertaken in areas that display positive and stable social, political and economic fundamentals, have adequate water and land resources, favourable climatic and agronomic conditions, strong local sugar markets and good export potential and returns.
STRATEGIC UP-DATEMalawi• At Nchalo and Dwangwa, new areas of land have been developed to cane which will make full use of Malawi’s installed
milling capacity.
• As reported previously, evaluation of options for further signifi cant cane and sugar expansion is ongoing, involving both company and outgrower land expansions, and the potential for power co-generation.
• Illovo is also exploring opportunities for ethanol production utilising molasses as the fermentation raw material.
Zambia• The focus of attention at Nakambala over the medium-term will be to realise the full potential of the signifi cant
production capacity expansion from a previous level of 200 000 tons to 450 000 tons of sugar per annum. In addition, an investigation is underway to evaluate the construction of an ethanol plant to provide alcohol for fuel blending in Zambia, using the factory’s molasses as fermentation feedstock.
South Africa• The group’s South African sugar production potential rests on several initiatives currently underway to increase
independent grower cane supplies, to improve the quality of cane delivered by Illovo’s own agricultural operations and to ensure the continued effi cient operation of its factories and downstream plants. Subject to the success of the various support programmes involving small-scale growers and a good recovery from the drought, these initiatives are forecast to result in sugar production increasing from around the current annual capacity of 670 000 tons to approximately 700 000 tons over the medium term. It is expected that the downstream segment will benefi t from the further commercialisation of the Agriguard business, together with ongoing stable performance from the Merebank and Glendale distilleries.
Tanzania• Various projects over the past three years to increase cane yields on the Kilombero estate will be completed in the
current season, with an already encouraging improvement of 3% in yields achieved in the past year. Further potential to increase cane supplies from Kilombero’s outgrowers exists, with plans to convert existing outgrower cane fi elds from dry-land to irrigated production. An external feasibility study, facilitated by Illovo, has recently been commissioned to evaluate this opportunity.
• A further feasibility study, to evaluate the possibility of establishing an ethanol distillery at Kilombero, is presently being fi nalised.
Swaziland• Following the completion of the factory expansion and co-generation project at Ubombo, the short-term focus
will be on increasing annual sugar production in 2011/12 to 240 000 tons, with a further increase to around 300 000 tons over the next three years as cane supplies from the Lower Usuthu Small-holder Irrigation Project increase.
Mozambique• The project to double annual sugar production capacity at the Maragra factory to 150 000 tons of sugar per annum was
commissioned during the 2010/11 season. Unseasonable wet weather throughout the year disrupted cane supplies and factory operations, and ultimately sugar production. In the short-term, assuming normal weather conditions, objectives are in place to increase sugar production at the operation to more than 100 000 tons and, over the medium-term, to focus on increasing cane supplies to the factory in order that it reaches its annual design capacity.
Mali• As mentioned elsewhere in this report, work towards commencing the group’s greenfi eld project in Mali continues.
Once commissioned and in steady state, the project will produce 200 000 tons of sugar, 15 000 kilolitres of fuel-blend ethanol and suffi cient electrical power to be self-suffi cient plus export any surplus to the national grid.

PURPOSEThe purpose of this review is to provide further insight into the fi nancial performance and fi nancial position of the group and should be read in conjunction with the consolidated annual fi nancial statements presented on pages 93 to 144.
KEY FINANCIAL RISKSExchange ratesOf the group’s operating profi t, 78% is derived from non-rand based countries, which exposes the group to fl uctuations of the rand against those currencies. In particular, the fl uctuation of the rand has a signifi cant impact on the translation of local profi ts into rands which are converted at the average exchange rate for the year. During the fi nancial year, the average rand/US dollar exchange rate strengthened by 8% following 12% in the previous year.
In the normal course of business, the group enters into transactions denominated in foreign currencies and as a result is subject to transaction and translation exposure from fl uctuating foreign currency exchange rates. In order to protect the business from the effects of exchange rate volatility, forward exchange contracts are utilised, enabling more effective management of the group’s cash fl ows and debt.
Financial Director’s Review
HIGHLIGHTS
• Net fi nancing costs declined by 31%
• The effective tax rate reduced by 3.6% to 26.6%
• Strong cash fl ow generated from operating activities
• Total distribution of 56.0 cents per share
• Strong balance sheet to fund growth
• Capital projects remain on track
TOTAL NET BORROWINGS/(CASH) (Rm)
2007 2008 2009 2010 2011
2 411
1 168
272(213)
AVERAGE RAND/US DOLLAR RATE
2007 2008 2009 2010 2011
8.837.157.05
7.81 7.19
OPERATING PROFIT (Rm)
2007 2008 2009 2010 2011
1 386
1 0651 034
1 499
1 029
512
REVENUE (Rm)
Karin Zarnack
2007 2008 2009 2010 2011
8 6026 7946 264
8 468 8 108
HEADLINE EARNINGS AND DISTRIBUTION/DIVIDEND PER SHARE (cents)
2007 2008 2009 2010 2011
149.1
75.0 85.5106.0
86.056.0
171.6211.6
171.2
112.2
HEPS Distribution/dividend per share
2007 2008 2009 2010 2011
10.9
32.0 29.9 28.6
14.810.1
28.5
41.2
(3.5)7.9
Gearing Return on average shareholders’ equity
GEARING AND RETURN ON SHAREHOLDERS’ EQUITY (%)
26 Annual Report 2011 • ILLOVO SUGAR LIMITED

CO
MM
ENTA
RIES
ILLOVO SUGAR LIMITED • Annual Report 2011 27
The downstream furfural plant operated well during the season but production was impacted by reduced raw material throughput as a result of the severe South African drought.

28 Annual Report 2011 • ILLOVO SUGAR LIMITED
FINANCIAL DIRECTOR’S REVIEW continued
World sugar pricesThe South African business is the only operation that exports excess sugar into the world market. These sales, together with the related hedging activities, are undertaken on behalf of the sugar milling companies by the South African Sugar Association (SASA). The company participates in all decisions made by SASA relative to its pricing and hedging activities.
The group’s regional sales prices are also indirectly exposed to the world market price through import parity pricing. In order to minimise the group’s exposure to the world market price, sales into domestic markets are maximised and better sales premiums are sought in the EU and USA markets. The quantities of sugar sold into the various markets are managed so as to ensure that the group realises the best possible return.
The impact of infl ation and cost containmentIt is a group imperative to ensure that local market price increases are aligned with country specifi c infl ation. Generally, infl ation in most countries in which the group operates has been relatively stable, however, global demand for certain input materials has resulted in higher operating costs in recent years.
To mitigate these effects, the group has continued to maintain strict cost disciplines through a combination of effi ciency and productivity improvements as well as economies of scale.
Interest rate risk managementThe group is exposed to interest rate risk in respect of variable rate loans and short-term cash investments. Interest rate swap contracts which exchange fl oating interest rates for fi xed interest rates are entered into in order to reduce the group’s exposure to variable interest rate borrowings.
If interest rates applicable to existing borrowings increase by 50 basis points, the group’s profi t before tax would reduce by R5.7 million.
CHANGES IN ACCOUNTING PRINCIPLESDuring the current fi nancial year, the group adopted a number of new accounting principles as set out in the accounting policies in the notes to the annual fi nancial statements, none of which have had a signifi cant impact on the fi nancial performance or position.
FINANCIAL PERFORMANCEThe fi nancial performance of the group is measured in terms of various key fi nancial ratios which include the operating margin, headline earnings growth, gearing and cash fl ow generation, as set out below.
2007 2008 2009 2010 2011
Operating margin (%) 17 16 16 18 13Headline earnings (Rm) 515 600 742 703 516Gearing (%) 11 29 41 (4) 8Cash generated from operations (Rm) 981 1 080 1 536 1 237 1 279
ACQUISITIONS AND DISPOSALSEffective 1 April 2010, the group increased its shareholding in Maragra Açúcar SA from 74.0% to 80.2% by converting a R238 million loan into equity. Following the debt to equity conversion, the group acquired a further 9.8% for a consideration of R99 million, increasing its shareholding to 90.0%.
Also on 1 April 2010, net assets of the company’s South African operations totalling R1 076 million were transferred from the company to Illovo Sugar (South Africa) Limited, a wholly-owned subsidiary of the company.
On 31 May 2010, Illovo Sugar (South Africa) Limited disposed of its investment in Castaneous Trading 38 (Pty) Limited, a property holding company, for a consideration of R131 million and realised a profi t of R20 million.

ILLOVO SUGAR LIMITED • Annual Report 2011 29
CO
MM
ENTA
RIES
OPERATING PROFIT 2011
OPERATING PROFIT 2010
OPERATING PERFORMANCE Group revenue decreased by 4%, operating profi t declined by 31% and headline earnings reduced by 27% for the year. The reduction in operating profi t resulted primarily from abnormal weather conditions negatively impacting on sugar production, and the strength of the rand against all currencies.
During the year under review, the group continued to focus on enhancing operational effi ciencies while maintaining strict cost reduction initiatives. These initiatives realised savings of over R180 million. Cost containment strategies continue to be a signifi cant focus area for the group.
Operating profi t before accounting for the foreign currency translation movements declined by 14%, which is a refl ection of the impact of the abnormal weather upon production. However, once the effects of the foreign currency translation movements are included, operating profi t declined by 31%. The operating margin was 13% in the year under review (2010: 18%).
The decrease in operating profi t over the previous year is graphically depicted as follows:
Although the average group debt was higher than in 2010, net fi nancing costs were lower than those of the previous year, due to the group’s concerted focus on managing its debt level and working capital as well as negotiating lower commercial interest rates. Interest of R26 million (2010: R14 million) was capitalised to expansion projects in the year under review.
In addition, the effective tax rate decreased from 30.2% to 26.6% as a result of the expansion-related tax allowances granted to the Swaziland operations. Included in the tax charge for the year are withholding taxes paid on cross-border transactions which contributed 6.2% (2010: 2.3%) to the overall tax rate.
Headline earnings declined by 27% to R516 million (2010: R703 million). The weighted average number of shares in issue has also increased by 49.5 million shares to 459.8 million shares due to the full year’s impact of the rights issue completed in September 2009. The reduced profi t after taxation and the dilutive effect of the rights issue shares resulted in headline earnings per share decreasing by 35% from 171.2 cents to 112.2 cents.
CASH FLOW ANALYSIS
REVENUE 2011
REVENUE 2010
2010 Improved sugar produc-tion (Zambia and Tanzania)
Reduced sugar production
(SA, Malawi, Swaziland,
Mozambique)
Exchange rates
Pricing/revenue
Fair value adjustments
Other 2011
(251)192 (210)
1 49962 (214)
(49) 1 029
OPERATING PROFIT
Malawi Zambia South Africa
Tanzania Swaziland Mozambique
Malawi Zambia South Africa
Tanzania Swaziland Mozambique
CASH FLOW ANALYSIS 2011
Cash from operations
Working capital
movements
Deferred and dividend
income
Net fi nancing
costs
Taxation paid
Cash outfl ows from investing
activities
Distributions paid
Cash outfl ows before
fi nancing activities
(96)146 421 133 (186)
(1 422)
(456) (839)
40%
24%
18%
41%
7%
14%
17%
8%
9%
12%
11%
10%
3%
8%
8%
4%
18%
1%
4%
20%
23%
41%
42%
17%

30 Annual Report 2011 • ILLOVO SUGAR LIMITED
During the year under review, the group continued to focus on cash fl ows generated from operations which ensured that the groups’ operating profi t was all cash. To maximise cash fl ow generation across the group, management continued to focus on revenue enhancements and cost reductions, as well as optimising working capital requirements and minimising fi nancing costs and taxation.
In the year under review each of the operations generated cash from its operations with the group’s cash operating profi t increasing from R1 237 million to R1 279 million. The group’s working capital requirements declined during 2011 due to the continued focus on working capital management. R282 million was spent on taxation and net fi nancing costs. The group also invested R1 263 million in expansion capital projects which primarily relates to the factory expansion and co-generation project in Swaziland. R200 million was also spent on replacement capital. R456 million in distributions was paid to shareholders. Additional borrowings of R263 million were raised. The overall result is a decrease in cash of R602 million.
BORROWINGSNet borrowings/(cash) is made up as follows:
2011 2010Rm Rm
Long-term borrowings 235 432Short-term borrowings 934 612Bank overdraft 61 88
Total borrowings 1 230 1 132Less: Cash and cash equivalents (718) (1 345)
Net borrowings/(cash) 512 (213)
Increase/(decrease) in funding 263 (1 427)
All capital projects of the group are funded by each of the businesses, primarily in the same currency as the underlying project costs. Any residual funding is fi nanced through group treasury which in turn is fi nanced by the local debt markets. The group’s borrowings profi le is long-term in nature which refl ects both the capital investment programme and the cash generated by the operations. Capital expansion projects are fi nanced by a combination of fl oating and fi xed rate long-term debt and are repaid from project cash fl ows.
The borrowings exposure at 31 March is analysed by currency:
2011 2010Rm % Rm %
Rand 405 33 75 7US dollar 390 32 130 11Euro 20 2 33 3Zambian kwacha 327 26 816 72Tanzanian shillings 80 6 42 4Malawian kwacha 8 1 36 3
Total borrowings 1 230 100 1 132 100
During the year, group borrowings increased primarily due to fi nancing of the Swaziland factory expansion and co-generation project. Gearing increased to 8% which is within the group’s objective limit of 40%. The low level of gearing is expected to be maintained in the short-term, however, over the medium to long-term, in anticipation of large capital expansion projects, this gearing level is expected to reach the objective limit.
At year-end, the group had total committed bank facilities amounting to R1 922 million of which R811 million was drawn-down. The group also has access to uncommitted facilities of R1 495 million. Cash-on-hand at year-end totalled R718 million, resulting in a net debt position of R512 million.
SHAREHOLDING AND RETURNTrading activity by volume of shares traded on the JSE has declined by 27% year-on-year. The share price declined by 10% from 2 970 cents to 2 685 cents at year-end.
FINANCIAL DIRECTOR’S REVIEW continued
DEBT TO EBITDA
2007 2008 2009 2010 2011
3 5003 0002 5002 0001 5001 000
5000
250
200
150
100
50
0
Debt EBITDA %
Rm %
106
192 192
65101

ILLOVO SUGAR LIMITED • Annual Report 2011 31
CO
MM
ENTA
RIES
The group has maintained its policy to pay a distribution to shareholders twice a year (interim and fi nal), in aggregate twice covered by headline earnings. The board believes that this distribution cover ratio is appropriate given the group’s current and forecast cash generation, planned capital expenditure and gearing levels.
An interim capital distribution in lieu of dividend of 22.0 cents was paid and a fi nal capital distribution in lieu of dividend of 34.0 cents has been approved. The distributions for the year decreased by 35% to 56.0 cents per share, compared to 86.0 cents in 2010. In accordance with International Financial Reporting Standards, no liability has been raised for the fi nal distribution. The source of the distribution is the capital reduction out of share premium and therefore the cost of the fi nal distribution of R156 million has been transferred from share premium to a separate distribution reserve.
RETURN ON NET ASSETSThe return on net assets for the group of 14% (2010: 22%) refl ects the impact of the substantial investment in agricultural and factory expansion projects which are not yet fully utilised. A currency loss of R402 million arose on the translation of the group’s foreign currency denominated net assets into rands.
CAPITAL EXPENDITURE AND COMMITMENTSA summary of the group’s capital expenditure and approved capital expenditure as at 31 March is set out below:
Capital Approved capital Totalexpenditure expenditure capital
2011 2012 commit- Rm Expansion Ongoing Expansion Ongoing ments
South Africa 57 78 64 93 157Malawi 7 52 – 64 64Zambia – 26 – 46 46Swaziland 1 120 16 70 32 102Tanzania 49 13 64 23 87Mozambique 30 15 – 28 28Mali – – 2 068 – 2 068Group – – – 54 54
Total 1 263 200 2 266 340 2 606
The group continued to apply the following hurdle rates to new capital projects:
Internal rate of return > 20%EBIT/capital at steady state > 20%Payback < 7 years
These hurdles ensure that capital is applied to projects that give the best return on investment, but do not apply to ongoing capital expenditure on existing operations and in particular environmental capital in respect of which it is not always possible to demonstrate economic viability. Equity injections into the operating subsidiaries are considered from time-to-time as may be appropriate, in order to maximise shareholders’ returns.
FINANCIAL CONTROLSThe internal control systems are designed to provide reasonable assurance against material losses and misstatement of fi nancial results, and are intended to manage all signifi cant risks. The safeguarding and prevention of misuse of assets is an important aspect of internal control. During the year under review in line with King III, the internal fi nancial control framework was further developed to improve the identifi cation of fi nancial reporting risks and to provide additional assurance that controls are adequate to address the risk of material misstatements of fi nancial results.
GOING-CONCERN ASSERTIONThe board has formally considered the going-concern assertion for the Illovo group and is of the opinion that it is appropriate for the forthcoming year.
K Zarnack Financial Director

32 Annual Report 2011 • ILLOVO SUGAR LIMITED
Operational reviewsMALAWI
Illovo Sugar (Malawi) Limited is listed on the Malawi Stock Exchange with the Illovo group holding 76% of the issued share capital. Old Mutual Life Assurance Company (Malawi) Limited holds 9%, whilst the balance of the shares are held by the public and various other institutional investors. The operations at Nchalo in the south of Malawi and Dwangwa in the mid-central region produce sugar cane, raw and refi ned sugar and speciality sugars at Nchalo. More than 60% of total sugar sales are sold to domestic consumer and industrial markets, with the balance exported to preferential markets in the EU and the USA, and the surrounding region.
In Malawi, and in Illovo’s other countries of operation outside South Africa, the agricultural operations are signifi cantly enhanced by a number of factors, including access to secure water sources for irrigation, excellent soils and ideal climatic conditions to promote optimum cane growth. Combined, these attributes result in high-yielding sugar cane crops which are harvested annually.
AgricultureCane yields of around 109 tons of cane per hectare at both estates were similar to the previous season, with total cane throughput in Malawi of 2.4 million tons assisted by a welcome yield increase in cane cultivated by Malawian smallholder farmers. However, unseasonable wet weather conditions during the year resulted in lower than estimated sucrose content in cane, negatively impacting upon sugar production.
Ongoing small-holder cane developments at Kasinthula, adjacent to Nchalo, in addition to smaller estate cane expansions at Dwangwa, are being undertaken to further consolidate cane supply to the Malawian operation.
A “green cane” harvesting trial was commissioned at the Nchalo estate, with the objective of providing the sugar mill with additional renewable boiler fuel, in the form of cane trash. During the year under review, 11 500 tons of cane trash were harvested and fed into the boilers.
Sugar productionTotal sugar production of 282 000 tons was around 4% lower than in 2009/10, representing a satisfactory performance against a background of poor operating conditions caused by unseasonal rains during the season. Approximately 70 000 tons of cane was carried over to the current season for processing, following a rigorous offcrop maintenance programme designed to improve operational effi ciencies at both factories.
Ian Parrott (44) Country HeadBCom, CIAJoined the group in 1997
SUGAR PRODUCTION (tons ‘000) MARKETS (tons ‘000)CANE PRODUCTION (million tons)
2009 2009 2009
2.121 3042002.136
295194
2010 2010 20102011 2011 2011
2.133282 175
Domestic Preferential Regional
4360
445857 49

ILLOVO SUGAR LIMITED • Annual Report 2011 33
CO
MM
ENTA
RIES
Total sugar production of 282 000 tons in Malawi was around 4% lower than in 2009/10, impacted negatively by unseasonable rains during the season.
Blended with bagasse, biomass collected in cane fi elds at Nchalo in Malawi and at Ubombo in Swaziland, is used to increase boiler fuel feedstock, thereby augmenting electricity production within the factory power plant.
Cane yields of around 109 tons of cane per hectare at both estates were similar to the previous season, with total cane throughput in Malawi of 2.4 million tons assisted by a welcome yield increase in cane cultivated by Malawian smallholder farmers.
Molasses, produced at Nchalo and Dwangwa, is currently sold as a fermentation raw material to the Ethanol Company Limited and Presscane Limited respectively, which are both fuel alcohol distilleries in Malawi.
Good rains were received at Dwangwa during the fi rst three months of the year, whilst the cane crop at Nchalo was irrigated to offset the generally drier conditions experienced in the south of the country. Overall, sugar production is forecast to increase by more than 10% compared to that produced in the previous season, resulting in additional sugar availability to satisfy Malawi’s primary markets.
MarketingIllovo branded pre-packed refi ned and brown sugar is sold to Malawian consumers through an established marketing and distribution network of depots strategically positioned to reach all parts of the country. Together with sales to industrial manufacturers of sugar containing products, total local off-take amounts to around two-thirds of production with the balance exported into long-standing markets in the EU and USA, and also regionally into markets in neighbouring African countries.
Compared to 2009/10, demand for sugar within the local market was depressed due to local economic conditions and decreased by about 12%. However, regional market sales at good prices, particularly into the Zimbabwean market, supported the achievement of overall sales targets. Sales into the USA and the EU under the Least Developed Countries (LDC) and African, Caribbean and Pacifi c (ACP) duty-free and quota-free supply arrangements, were shipped against agreed contract arrangements but were impacted by lower EU prices and the weaker Euro. However, more recently, market prices in the EU have increased strongly and will be of future benefi t to LDC/ACP sugar suppliers to the EU.
EnvironmentalIn support of the Malawian Government Reforestation Initiative, aimed at rehabilitating the Shire Valley through the cultivation of indigenous trees and woodlots, Nchalo planted approximately 6 000 trees during 2010/11. The cultivation of Eucalypt woodlots is promoted in an effort to reduce the harvesting of indigenous trees for fi rewood and charcoal production, a serious threat to Malawi’s natural environment.
SocialMaize was again grown by Illovo to assist with initiatives aimed at achieving food security within the country. Continued support was also provided to various child feeding schemes as part of the governmental social and economic development programme as well as to local community education facilities, charity organisations, and sporting bodies amongst others.
In response to an outbreak of measles in Malawi during the year, Nchalo implemented a measles education, counselling, treatment and immunisation programme, in which approximately 12 000 children were immunised.

34 Annual Report 2011 • ILLOVO SUGAR LIMITED
Operational reviewsZAMBIA
Zambia Sugar Plc is the group’s second largest sugar producer after South Africa following a major agricultural and factory expansion project completed in 2009, which increased total annual sugar production capacity from around 200 000 tons to 450 000 tons. The company is listed on the Lusaka Stock Exchange with 82% of shares held by the Illovo group and the balance by institutional and private investors. As the country’s leading sugar producer, located in the south-western region of the country alongside the Kafue River, it cultivates sugar cane and manufactures Vitamin A-enriched raw and refi ned sugar under the Whitespoon brand name for local consumer markets and industrial customers, comprising around 38% of total sales. With increased sugar availability following the expansion project, sales to preferential markets in the EU and into surrounding African countries have risen signifi cantly, comprising around 29% and 33% of total sales respectively. The company also produces speciality sugars for export to the EU and syrup for local consumer markets.
AgricultureThe agricultural operations produced a record 1.97 million tons of cane in the 2010/11 season, representing a 16% increase compared to last year. Wet weather in the early and latter parts of the season affected cane harvesting operations resulting in cane being carried over for processing in the current season. Combined with deliveries from Zambia Sugar’s supplying outgrowers, total cane throughput amounted to 3.1 million tons, representing a 19% increase compared to the previous year.
Sugar productionMilling operations were consolidated during the season, with the factory achieving its design milling capacity and improving on factory performance compared to last year. Sugar production increased to 385 000 tons from 315 000 tons last season, representing a new sugar production record for Zambia Sugar and the most produced by a single factory in the Illovo group. However, it was unfortunate that unseasonable rains hampered the crush rate and impacted negatively upon an otherwise good performance. Factory time effi ciencies and the recovery of sugar from cane showed considerable improvement compared to the previous season.
Good rains were received during December and January, and increased radiation levels combined with early irrigation of the crop provided ideal conditions for good growth. As more sugar cane arising out of the expansion project becomes available
Steven Langton (50) Country HeadPrEng, BScEngJoined the group in 1996
Domestic Preferential Regional
SUGAR PRODUCTION (tons ‘000) MARKETS (tons ‘000)CANE PRODUCTION (million tons)
2009 2009 2009
0.722194
1281.705314
130
2010 2010 20102011 2011 2011
1.974 385152
3839
88 10888
125

ILLOVO SUGAR LIMITED • Annual Report 2011 35
CO
MM
ENTA
RIES
Sugar production increased to 385 000 tons from 315 000 tons last season, representing a new sugar production record for Zambia Sugar.
for crushing, so sugar production levels are expected to increase with, given normal weather conditions, a 7% rise in output forecast for the current season.
MarketingDomestic sales in Zambia of 143 000 tons in the 2010/11 season increased by 10% compared to the previous year. The year was characterised by strong domestic economic fundamentals, a stable exchange rate and strong regional demand which supported higher prices and inhibited illegal imports from entering the country. Zambia Sugar again benefi ted from its well-established sugar marketing and distribution systems to reach all of its markets across the country.
The increased tonnage of duty-free, quota-free sugar exports to EU markets on the back of the recent production expansion partially offset lower prices and the impact of the weaker euro on revenue realisations. However, more recently, market prices in the EU have increased strongly and will be of benefi t to the Zambian operation going forward. Regional market sales also increased signifi cantly and benefi ted from higher prices, infl uenced largely by the major rise in world raw sugar prices in 2010, and in the fi rst fi ve months of 2011.
EnvironmentalZambia Sugar initiated the development of a Waste Management Strategy during the year under review, with the objective of reducing operational waste at the production level, along with improving overall waste, effl uent and emission management. In the interim, measures were employed for the relocation of the hazardous waste disposal site to a more suitable location. Once completed, the hazardous waste landfi ll will be managed according to improved operational standards to mitigate environmental impacts.
SocialA number of social responsibility projects were supported during the year including the building of classrooms for the Mazabuka High School and provision of potable water and other essential services for the St Edmunds and Rusanga Mission High Schools. Monetary donations to local welfare organisations and sporting and recreation clubs were also made.
The company continues to fortify all sugar intended for local consumption with Vitamin A in support of the government of Zambia initiative to decrease mortality and morbidity in children as a result of Vitamin A defi ciencies.
TOP: The Nakambala factory achieved its design milling capacity producing a record 385 000 tons of sugar.
RIGHT: The agricultural operations produced a record 1.97 million tons of cane in the 2010/11 season in Zambia, representing a 16% increase compared to last year.

36 Annual Report 2011 • ILLOVO SUGAR LIMITED
The operations of Illovo Sugar (South Africa) Limited (Illovo SA), a wholly-owned subsidiary of the Illovo group, include the cultivation of sugar cane and production of raw and refi ned sugar, syrup, the downstream products of furfural, furfuryl alcohol, Agriguard, diacetyl, 2.3-pentanedione and ethanol, together with lactulose. Illovo’s sugar markets are largely domestic, with around 15% of South African production exported on to the world raw sugar market, representing approximately 5% of total group sales, whilst downstream products are primarily export-focused. There are six sugar producers in South Africa with combined production of around 1.9 million tons in 2010/11, with sales into domestic, regional and world markets.
AgricultureIn KwaZulu-Natal, Illovo’s own agricultural operations and those of its independent cane suppliers, rely on rainfall to sustain their cane crops. Long-term average cane yields for the South African sugar industry in the province are approximately 65 tons of cane per hectare, in a normal season. The warmer sub-tropical climate of the coastal cane growing region results in the crop being harvested every 18 months whilst cane grown in the higher and colder midlands regions matures every two years. To optimise opportunities, and as a risk mitigating strategy, Illovo operates two sugar mills on the south coast at Sezela and Port Shepstone, and two mills in the south and north midlands regions, at Eston and Noodsberg respectively.
Operational reviewsSOUTH AFRICA
Dave Howells (47) Country HeadBCom, CA(SA)Joined the group in 1997
Illovo’s fi rst presence in South Africa is traced back to KwaZulu-Natal in 1891 when Sir Charles George Smith set in motion a series of events that would result in the formation in 1975 of C G Smith Sugar Limited, and which would be transformed into Africa’s biggest sugar producer, under the name of Illovo Sugar Limited. Listed on the JSE Limited in 1992, Durban remains the corporate centre of Illovo, providing strategic, fi nancial, operational, technical, commercial, human resources and corporate support to its extensive operations across six African countries.
MARKETS (tons ‘000)
2009
587
326
9 7 11
430
226
86
2010 2011
481
Domestic Preferential World
CANE PRODUCTION (million tons)
2009
0.463
0.361
2010 2011
0.267
SUGAR PRODUCTION (tons ‘000)
2009
922*
663
2010 2011
578
* Includes production from Pongola, Umfolozi and Gledhow – now sold

ILLOVO SUGAR LIMITED • Annual Report 2011 37
CO
MM
ENTA
RIES
Cane production in Illovo’s cane supply regions in 2010/11 was impacted signifi cantly by a severe drought in 2010 with rainfall for the period January 2010 to September 2010 well below the long-term mean, and its lowest for the past 15 years. As a result, average company cane yields, which are generally higher than the industry average, decreased from last year and resulted in production falling from 361 000 tons of cane last season to 267 000 tons in 2010/11. Increased sucrose in cane partly offset these yield losses.
The drought also impacted negatively on the production of Illovo’s independent cane growing community with total deliveries from small, medium and large-scale growers decreasing from last season by around one million tons to 4.3 million tons in the year under review.
Cane supply remains a signifi cant concern in the South African sugar industry, with 43% of the total land area supplying cane to Illovo mills being the subject of long-standing land claims in terms of the Restitution of Land Rights Act, 1994. Thus far, of the areas claimed, just over 11% has been transferred to claimants. While the protracted process of settling land claims continues, independent cane growers affected by the process are reluctant to re-invest in their crops, thereby impacting further on cane yields. However, the company is working with these growers, the claimants and the relevant government authorities to ensure that farms transferred in terms of the restitution process continue to be cultivated productively. Land reform committees are active in all mill areas and Illovo is playing a leading role in sugar industry land reform initiatives.
Signifi cantly, as part of ongoing initiatives co-ordinated by Illovo and local cane growing bodies to increase cane supply from the small-scale grower sector, a R60 million development fi nance loan was approved by the Agricultural Division of The Standard Bank Group Limited to fund the rehabilitation of approximately 2 000 hectares of existing land under cane and at the same time, to develop an additional 2 000 hectares of new land to sugar cane. Entitled ‘Sizanayo’, the initiative is forecast to increase cane supply to Illovo’s Sezela sugar mill by 180 000 tons in the medium-term, benefi ting around 4 000 small-scale farmers in the region and creating 750 permanent employment opportunities.
In a season of normal rainfall, sugar cane cultivated in South Africa fl ourishes to achieve yields of more than 70 tons of cane per hectare. However, in 2010, severe drought conditions, the worst since that experienced in 1992/93, wreaked considerable damage on the crop, reducing yields on Illovo cane lands to an average of 52 tons of cane per hectare.

38 Annual Report 2011 • ILLOVO SUGAR LIMITED
OPERATIONAL REVIEWS: SOUTH AFRICA continued
Sugar productionThe performance of Illovo’s three raw sugar mills was generally good with excellent factory effi ciencies being achieved, against the backdrop of the severe drought conditions which impacted negatively on cane quality and in turn, on general factory operations. At Noodsberg, factory and refi nery performance continued to improve with the production of 261 000 tons of refi ned sugar. Good progress was achieved with the expansion project to increase Noodsberg’s offcrop refi ning capacity by an additional 60 000 tons of refi ned sugar. Total company sugar production of 578 000 tons ended well below normal levels, however, Illovo’s share of industry production, which was also impacted by the drought, remained at 30%.
In an effort to improve broad-scale operational effi ciencies and reduce the consumption of purchased electricity and coal, performance optimisation studies were undertaken at the three raw sugar mills. These studies resulted in the proposition of various site-specifi c projects, focusing largely on optimising production effi ciencies during the sugar production process.
The Gledhow sugar factory, in which Illovo has a 30% share, performed well in diffi cult drought conditions to produce 96 000 tons of raw sugar. Together with raw sugar supplies supplied by other sugar mills, Gledhow produced 154 000 tons of refi ned sugar.
The drought in 2010 severely affected cane production, particularly across the lower south coast cane supply region, and it is anticipated that cane production in 2011/12 will be lower than that of last season. The associated reduction in cane supply has resulted in the Umzimkulu mill not opening for the 2011/12 season and all cane that would normally be delivered to this mill is being diverted for crushing at the Sezela mill. Illovo facilitated the full re-deployment and/or relocation of all affected employees to alternative mills within the group. This prevented retrenchment of employees and ensured retention of skills in anticipation of the re-opening of the mill after the 2011/12 season.
DownstreamThe furfural plant at Sezela operated consistently throughout the season although production was lower than in 2009/10 due to signifi cantly reduced cane supplies. The Merebank and Glendale distilleries continued to perform well and maintained consistent product quality and good throughput levels throughout the year, with both plants combining to achieve record production of 55 500 kilolitres of ethanol. Lactulose production was similar to that of last year.
MarketingIllovo sells raw, brown and refi ned sugar, speciality brown sugars, syrup, furfural and its derivatives, potable and denatured ethanol, and lactulose into local and international markets. Illovo’s domestic market sugar sales performance in 2010/11, particularly in the brown sugar sector, was pleasing. The group remains the major supplier of sugar to the South African industrial market. Regional market sales into the South African Customs Union (SACU), which has traditionally been supplied from Zimbabwe, were again boosted this year due to that country’s current sugar production diffi culties.
Illovo’s share of raw sugar exports to the world market, undertaken by the South African Sugar Association (SASA), amounted to 86 000 tons for the year. The average price realised by the industry, including hedging activities undertaken by SASA, was US17.70 cents/lb, representing an increase of US1.17 cents/lb compared to the previous year, due to the higher average world market price in 2010/11. South African sugar industry production in 2011/12 is again expected to be impacted negatively by the effects of the severe drought in 2010 resulting in uncertainty about export availability. Around 34 000 tons of sugar have been priced to date on behalf of the industry by SASA, at an increased average price of US25.5 cents/lb. Futures prices currently are around US22.5 cents/lb.
In the downstream arena, international furfural and furfuryl alcohol prices climbed to record highs as world demand exceeded supply last year when China, the world’s largest furfural producer, cut back its exports. A number of factors, including the
Downstream Furfural Ethanolproduction tons kilolitres
2009 20 000 52 0002010 18 700 52 500
2011 15 900 55 500
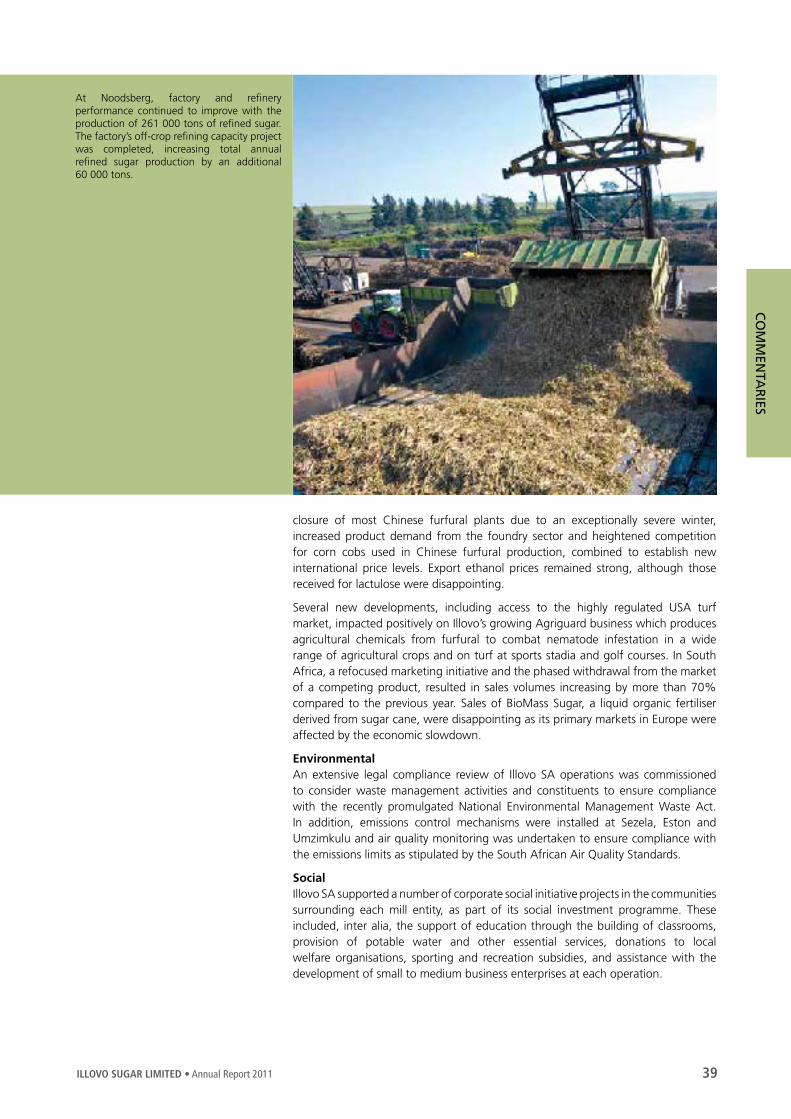
ILLOVO SUGAR LIMITED • Annual Report 2011 39
CO
MM
ENTA
RIES
closure of most Chinese furfural plants due to an exceptionally severe winter, increased product demand from the foundry sector and heightened competition for corn cobs used in Chinese furfural production, combined to establish new international price levels. Export ethanol prices remained strong, although those received for lactulose were disappointing.
Several new developments, including access to the highly regulated USA turf market, impacted positively on Illovo’s growing Agriguard business which produces agricultural chemicals from furfural to combat nematode infestation in a wide range of agricultural crops and on turf at sports stadia and golf courses. In South Africa, a refocused marketing initiative and the phased withdrawal from the market of a competing product, resulted in sales volumes increasing by more than 70% compared to the previous year. Sales of BioMass Sugar, a liquid organic fertiliser derived from sugar cane, were disappointing as its primary markets in Europe were affected by the economic slowdown.
EnvironmentalAn extensive legal compliance review of Illovo SA operations was commissioned to consider waste management activities and constituents to ensure compliance with the recently promulgated National Environmental Management Waste Act. In addition, emissions control mechanisms were installed at Sezela, Eston and Umzimkulu and air quality monitoring was undertaken to ensure compliance with the emissions limits as stipulated by the South African Air Quality Standards.
SocialIllovo SA supported a number of corporate social initiative projects in the communities surrounding each mill entity, as part of its social investment programme. These included, inter alia, the support of education through the building of classrooms, provision of potable water and other essential services, donations to local welfare organisations, sporting and recreation subsidies, and assistance with the development of small to medium business enterprises at each operation.
At Noodsberg, factory and refi nery performance continued to improve with the production of 261 000 tons of refi ned sugar. The factory’s off-crop refi ning capacity project was completed, increasing total annual refi ned sugar production by an additional 60 000 tons.

40 Annual Report 2011 • ILLOVO SUGAR LIMITED
Operational reviewsTANZANIA
Illovo holds 55% of the issued share capital in Kilombero Sugar Company Limited, with 20% held by ED&F Man, the London-based commodities group, and 25% by the government of Tanzania. Kilombero is situated in the Morogoro region in the centre/south of the country and comprises two adjacent agricultural estates and sugar factories, Msolwa and Ruembe, on either side of the Great Ruaha River, linked by a low-level bridge. It produces direct consumption brown sugar under the ‘Bwana Sukari’ brand-name, almost all of which is marketed and distributed by the company. Kilombero is one of four sugar producers in Tanzania which, at current production levels of just over 300 000 tons of sugar, is a net importer of sugar. A small portion of sugar is sold to regional markets.
AgricultureGood summer rains and growing conditions resulted in the estate harvesting an increased cane crop of 708 000 tons, which was approximately 100 000 tons more than harvested in 2009/10. Cane yield improvements of 4% were attributed to newly-introduced cane varieties, which now make up 72% of the crop. Increases in the area under irrigation and the overall irrigation effi ciencies helped sustain and maintain yields towards year-end when conditions became very dry. Outgrower cane production, which is rain-fed, benefi ted from the good pre-season rains and an improved crop of 493 000 tons was harvested. Heavy rains from December onwards disrupted harvesting and resulted in the season extending to early March 2011.
Following on from the previous year’s increase in cane areas under expansion, a further project was undertaken to convert around 1 000 hectares of land to permanent linear irrigation, which is particularly cost effective for use on exceptionally fl at land. In addition, further work was completed on improving the drainage and water management within the estate, which will further improve cane yields.
In a separate initiative and under the EU Accompanying Measures programme, the EU has commissioned a feasibility study to determine the irrigation potential within Kilombero’s outgrower sector. The study also includes the design of a pilot irrigation
Don Carter-Brown (61) Country HeadBScAgricEngJoined the group in 1978
SUGAR PRODUCTION (tons ‘000)CANE PRODUCTION (million tons)
2009 2009
0.555118
0.614123
2010 20102011 2011
0.708 127
MARKETS (tons ‘000)
2009
120 124
2010 2011
125
Domestic Regional
0 0 3

ILLOVO SUGAR LIMITED • Annual Report 2011 41
CO
MM
ENTA
RIES
Cane yield improvements of 4% were attributed to newly-introduced cane varieties which now make up 72% of the crop.
scheme which, when established, will be used to test the sustainability of a grower operated, sugar cane irrigation scheme.
Sugar productionSugar production in 2010/11 amounted to just under 127 000 tons, a 5% increase over the previous year. Both factories operated satisfactorily up until mid-October after which a number of factors, including excessive rainfall, impacted upon factory performance.
Another extraction mill is to be added to the Msolwa milling train this coming offcrop maintenance period to increase extraction and sustain throughput at 110 tons of cane per hour.
The continuation of Kilombero’s irrigation expansion and drainage rehabilitation projects are expected to bring about meaningful improvements in average cane yields on the estate, with increased sugar production continuing over the medium-term.
MarketingCurrent domestic requirements remain at just over 400 000 tons with the balance provided by duty-paid imports from the world sugar market. Domestic market demand and prices remained strong throughout the season. A small tonnage of sugar was exported into the region.
Environmental Emissions monitoring was undertaken at both the factories during 2010/11 to establish an emissions baseline. Moving grates were installed in the Ruembe mill boilers to decrease particulate matter emissions and increase boiler effi ciency.
SocialSponsored by the Kilombero Trust, which is partly fi nanced by the Kilombero Sugar Company, and by the company itself, the construction of a new government hospital, situated within the Kilombero community, has commenced. Once completed, the hospital will provide full operating and maternity facilities, a children’s ward and a modern mortuary.
TOP: Sugar production in 2010/11 amounted to 127 000, a 5% increase over the previous year.
RIGHT: In Tanzania, around 1 000 hectares of land was converted to permanent linear irrigation which is particularly cost effective for use on exceptionally fl at land, such as that at Kilombero.

42 Annual Report 2011 • ILLOVO SUGAR LIMITED
Ubombo’s future long-term sustainability has been further consolidated with the successful commissioning of a major factory expansion and co-generation project which has increased milling capacity from around 220 000 tons to more than 300 000 tons of sugar. The project has also allowed Ubombo to become self-suffi cient in all of its own power requirements, utilising biomass from cane as supplementary fuel for the factory boilers, and a commercial agreement has been concluded with the Swaziland Electricity Company to supply electricity to the Swaziland national grid. This is the single largest commercial investment in Swaziland in recent years and one which will also benefi t many indigenous small-holder farmers who, as part of the Lower Usuthu Small-holder Irrigation Project, have already commenced large-scale cane development projects, the produce of which will be delivered for processing by the Ubombo factory.
The operation is pursuing registration for carbon credits under the Clean Development Mechanism, derived from the replacement of fossil fuels and the generation of renewable energy. The validation of the project is presently being undertaken on behalf of the United Nations Framework Convention on Climate Change (UNFCCC) by an appointed Designated Operating Entity.
AgricultureOwn cane production at Ubombo in 2010/11 amounted to just under 724 000 tons, representing a 9% decline in production compared to last year.
Operational reviewsSWAZILAND
The group has a 60% share in Ubombo Sugar Limited, with the balance of shares held on behalf of the Swazi nation by Tibiyo Taka Ngwane (Tibiyo). Ubombo, situated adjacent to the Usuthu River in the south east of the country, is one of three sugar producers in Swaziland whose combined total sugar output of more than 580 000 tons is marketed and distributed by the Swaziland Sugar Association (SSA). Around 40% of Ubombo’s current sugar production is refi ned and sold into the SACU region, whilst more than 40% is exported to preferential markets in the EU and the USA, and the balance sold to regional markets.
Simon Cleasby (52) Country HeadBScEng(Chem), MBAJoined the group in 2009
CANE PRODUCTION (million tons)
2009
0.7410.804
2010 2011
0.724
SUGAR PRODUCTION (tons ‘000)
2009
210 211
2010 2011
198
MARKETS (tons ‘000)
2009
105 105
2010 2011
100
Domestic Preferential Regional
35
69
10
8896
10
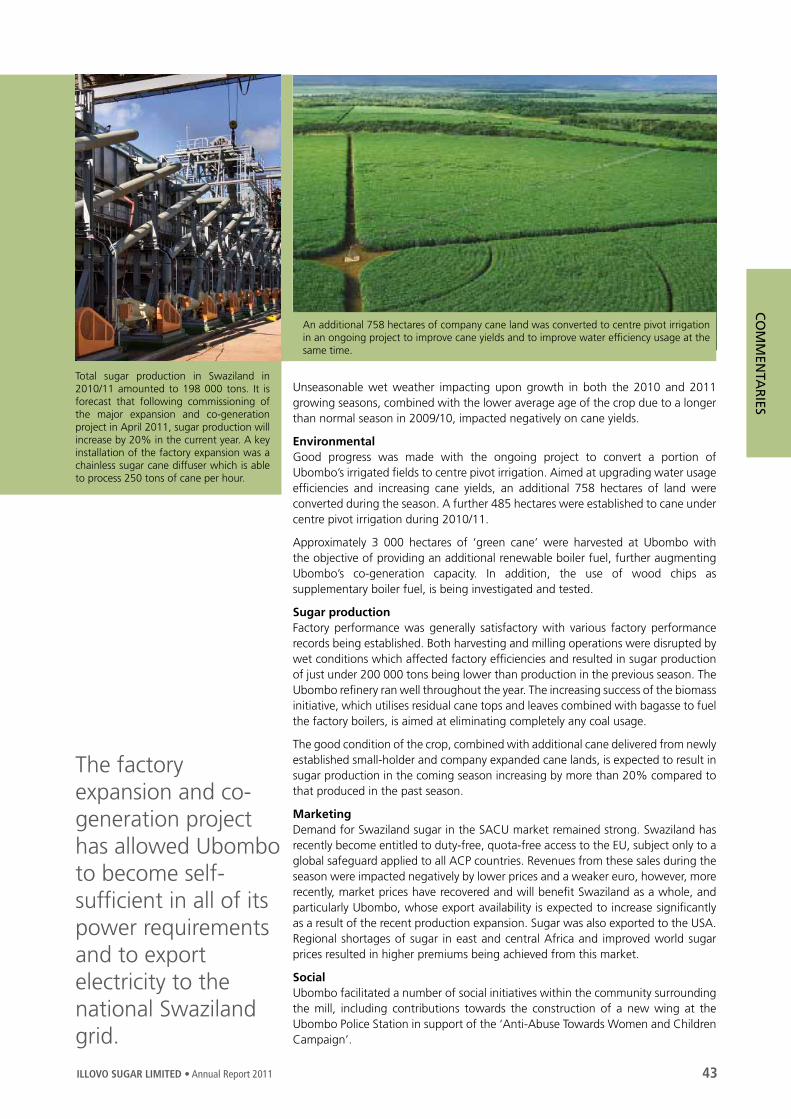
ILLOVO SUGAR LIMITED • Annual Report 2011 43
CO
MM
ENTA
RIES
Total sugar production in Swaziland in 2010/11 amounted to 198 000 tons. It is forecast that following commissioning of the major expansion and co-generation project in April 2011, sugar production will increase by 20% in the current year. A key installation of the factory expansion was a chainless sugar cane diffuser which is able to process 250 tons of cane per hour.
Unseasonable wet weather impacting upon growth in both the 2010 and 2011 growing seasons, combined with the lower average age of the crop due to a longer than normal season in 2009/10, impacted negatively on cane yields.
EnvironmentalGood progress was made with the ongoing project to convert a portion of Ubombo’s irrigated fi elds to centre pivot irrigation. Aimed at upgrading water usage effi ciencies and increasing cane yields, an additional 758 hectares of land were converted during the season. A further 485 hectares were established to cane under centre pivot irrigation during 2010/11.
Approximately 3 000 hectares of ‘green cane’ were harvested at Ubombo with the objective of providing an additional renewable boiler fuel, further augmenting Ubombo’s co-generation capacity. In addition, the use of wood chips as supplementary boiler fuel, is being investigated and tested.
Sugar productionFactory performance was generally satisfactory with various factory performance records being established. Both harvesting and milling operations were disrupted by wet conditions which affected factory effi ciencies and resulted in sugar production of just under 200 000 tons being lower than production in the previous season. The Ubombo refi nery ran well throughout the year. The increasing success of the biomass initiative, which utilises residual cane tops and leaves combined with bagasse to fuel the factory boilers, is aimed at eliminating completely any coal usage.
The good condition of the crop, combined with additional cane delivered from newly established small-holder and company expanded cane lands, is expected to result in sugar production in the coming season increasing by more than 20% compared to that produced in the past season.
MarketingDemand for Swaziland sugar in the SACU market remained strong. Swaziland has recently become entitled to duty-free, quota-free access to the EU, subject only to a global safeguard applied to all ACP countries. Revenues from these sales during the season were impacted negatively by lower prices and a weaker euro, however, more recently, market prices have recovered and will benefi t Swaziland as a whole, and particularly Ubombo, whose export availability is expected to increase signifi cantly as a result of the recent production expansion. Sugar was also exported to the USA. Regional shortages of sugar in east and central Africa and improved world sugar prices resulted in higher premiums being achieved from this market.
SocialUbombo facilitated a number of social initiatives within the community surrounding the mill, including contributions towards the construction of a new wing at the Ubombo Police Station in support of the ‘Anti-Abuse Towards Women and Children Campaign’.
The factory expansion and co-generation project has allowed Ubombo to become self- suffi cient in all of its power requirements and to export electricity to the national Swaziland grid.
An additional 758 hectares of company cane land was converted to centre pivot irrigation in an ongoing project to improve cane yields and to improve water effi ciency usage at the same time.

44 Annual Report 2011 • ILLOVO SUGAR LIMITED
Operational reviewsMOZAMBIQUE
Illovo’s shareholding in Maragra Açúcar SA increased from 74% to 90% in 2010/11 as a result of Illovo purchasing shares from the minority shareholder, together with the conversion of long-term debt to equity. Maragra is situated adjacent to the coastline of Mozambique, approximately 80 kilometres north of Maputo. There are four sugar producers in the country with combined production capacity of more than 380 000 tons of sugar per annum. Around 60% of the production is sold to local consumer and industrial markets and the balance exported to preferential markets in the EU.
AgricultureCane yields on the Maragra estate showed an encouraging improvement but overall, total cane production of 454 000 tons in 2010/11 reduced by 7% compared to last season, due primarily to abnormally wet conditions with average rainfall received over the season measuring 24% more than the long-term average. Combined with late summer rains which delayed the commencement of the season, ongoing loading and haulage operations were hampered by the wet weather conditions throughout the season resulting in intermittent supplies of cane to the factory. This resulted in both estate and outgrower cane being carried-over for processing in the current season.
Sugar productionThe successful completion of the two-year expansion project to increase the milling capacity of the Maragra factory to 150 000 tons of sugar per annum was a highlight in a year troubled by wet weather throughout the season which also impacted negatively on cane quality and the smooth running of the factory. Combined with reduced cane supplies from Maragra’s outgrowers, total sugar production amounted to 69 000 tons, compared to 81 000 tons produced in 2009/10.
SUGAR PRODUCTION (tons ‘000)CANE PRODUCTION (million tons)
2009 2009
0.450 760.488
81
2010 20102011 2011
0.45470
MARKETS (tons ‘000)
2009
43
52
2010 2011
43
Domestic Preferential
3329 27
Mike Buchanan (61) Country HeadBTechMkt, SEPJoined the group in 1981

ILLOVO SUGAR LIMITED • Annual Report 2011 45
CO
MM
ENTA
RIES
Good rainfall in December and January and the subsequent drier weather conditions in the early part of the year have provided a strong platform for the current season’s cane crop, with sugar production of 100 000 tons expected in 2011/12.
With the 2010/11 milling season prematurely closed, good rainfall in December and January and the subsequent drier weather conditions in the early part of the year have provided a strong platform for the current season’s cane crop, with sugar production of 100 000 tons expected in 2011/12.
MarketingWhilst the overall Mozambique domestic offtake increased by 3.4%, reduced sugar production at Maragra resulted in its domestic sales volumes in 2010/11 being lower than those in the previous season. Sales were also negatively impacted by the devaluation of the Mozambique metical. Whilst the country’s export opportunities were optimised to the fullest extent, revenue realisations were affected by the reduction in the EU prices compared to the previous season. Sugar was also exported to the USA market in terms of Mozambique’s quota access.
EnvironmentalMaragra undertook an internal waste survey and developed a Waste Management Plan in order to manage waste generated by the operation more effectively.
SocialMaragra contributed towards the construction of a new estate clinic during 2010/11 which provides 24-hour facilities for patients and an ambulance service.
Maragra’s factory capacity expansion to 150 000 tons of sugar per annum was successfully commissioned in 2010.
Cane yields on the Maragra estate showed an encouraging improvement but overall, total cane production of 454 000 tons was 7% below that of the previous year due primarily to abnormally wet conditions.
46 Annual Report 2011 • ILLOVO SUGAR LIMITED
Market Review
The group produces and sells a range of sugar, syrup and downstream products into domestic, regional and world markets.
Maximising sales to higher-priced and stable domestic markets form the basis of Illovo’s primary marketing strategy. Sugar surplus to local markets is sold into preferential markets in the EU and the USA, and regional markets in Africa, whilst in South Africa, bulk raw exports to the world market are sold on behalf of Illovo through the South African Sugar Association (SASA). Combined, sales to these markets, comprised 25 countries. Downstream products developed mainly from molasses and bagasse are produced and sold into niche markets in 81 countries to complement this strategy. Export sales in 2010/11 contributed 31% of total revenue.
Unseasonable weather in a number of the group’s operations resulted in lower sugar volumes being produced. This constrained Illovo’s ability to take full advantage of the higher world price, attractive regional markets and improved EU prices in the second half of the year.
Group revenues were underpinned by strong domestic sugar sales in all countries of operation. Regional exports benefi ted from higher market prices in line with the higher world price and tight sugar supplies. This was offset by lower sugar availability, the relatively low EU export prices, the continued strength of the rand and the weak euro.
DOMESTIC MARKETSSugarIllovo continues to benefi t from strong market shares in each of the domestic sugar markets in which it operates and, in the year under review, domestic market sales represented 65% of total sugar sales volumes.
The SACU sugar market showed modest growth of 2% compared to the previous year registering sales of marginally under two million tons. The major suppliers into this market are the South African and Swaziland sugar industries. No imports from SADC sugar producing countries were sold into SACU this season. Higher world sugar market prices resulted in duty-paid imports decreasing to 85 000 tons compared to around 100 000 tons the previous season. The prolonged drought conditions in KwaZulu-Natal had a negative impact on Illovo’s South African production which presented challenges in keeping the market supplied. Notwithstanding these diffi culties, domestic sugar sales were ahead of expectations. In South Africa, 83% of total production was sold into the SACU market. Illovo is Malawi’s sole sugar producer and in the 2010/11 season, domestic sales comprised approximately 62% of total sales. Zambia Sugar experienced strong demand in its domestic market with sales increasing by 10% during the year. In Swaziland, Ubombo Sugar accounted for about 34% of industry sales. Swaziland’s domestic sales in 2010/11, undertaken by the Swaziland Sugar Association into the SACU market, represented approximately 51% of total sales. In Tanzania, almost all of Kilombero’s total production was sold into the domestic market which benefi ted from improved returns due to higher regional prices. Whilst Maragra’s local sales were affected by reduced production, industry sugar sales in Mozambique refl ected annual growth of 3.4%, with most of the growth coming in the raw sugar consumer and refi ned sugar industrial markets.
Syrup is produced in South Africa and Zambia with the product being a brand leader in each of the respective domestic markets. Speciality sugars made in South Africa are for domestic consumption, whilst in Malawi and Zambia they are produced for preferential markets in the EU and in the case of Malawi, also in the USA.
In South Africa and Malawi, sugar is marketed under the Illovo brand name, and in Zambia and Tanzania, under the Whitespoon and Bwana Sukari brand names respectively. All sugar produced in Swaziland is marketed by the Swaziland Sugar Association and by Distribuidora Nacional de Açúcar (DNA) in Mozambique.

ILLOVO SUGAR LIMITED • Annual Report 2011 47
CO
MM
ENTA
RIES
DownstreamWhilst the group’s range of downstream products is primarily aimed at export markets, the Merebank and Glendale distilleries remain important suppliers of ethanol to the South African beverage, pharmaceutical and industrial chemical industries. Relatively small volumes of furfural and its derivatives, including Crop Guard, a furfural-based agricultural nematicide under the Agriguard range of products, as well as lactulose, are sold in the local South African market.
EXPORT MARKETSSugarThe unseasonable weather in a number of the group’s operations impacted negatively on production and constrained Illovo’s ability to take full advantage of the higher world sugar price, attractive regional prices and EU markets.
Preferential marketsThe EU sugar market underwent a major transformation towards the end of the year with prices reaching record highs in response to a sugar shortage arising from a lower beet harvest and less sugar imports than anticipated. In an attempt to alleviate the shortage, the EU Commission dropped the €98 per ton duty on imports, re-allocated 500 000 tons of out-of-quota sugar into the domestic market and opened a duty-free sugar import quota (TRQ) allocation of 300 000 tons in April. This was 55 times over-subscribed resulting in importers receiving less than 6 000 tons per application. EU prices may ease from the record highs seen in recent months, but are expected to settle at a level much higher than a year ago.
During the year, the group’s preferential exports to the EU and the USA from Malawi, Swaziland, Mozambique and Zambia amounted to approximately 292 000 tons.
Regional marketsThe higher average world market sugar price and the tight supply conditions had a positive impact on regional market prices. Illovo was able to take advantage of this opportunity by selling into the regional markets in Southern Africa.
World marketMore than 100 countries produce sugar around the world either from sugar beet or sugar cane. Approximately 81% of total production is made from sugar cane grown primarily in the tropical and sub-tropical zones of the southern hemisphere, and the balance from sugar beet which is grown mainly in the temperate zones of the northern hemisphere. Generally, the costs of producing sugar from sugar cane are lower than those in respect of processing sugar beets. Currently, 72% of the world’s sugar is consumed in the countries of origin, whilst the balance is traded on world markets.
The world market sugar price lived up to its reputation as being one of the most volatile commodities, trading to record highs of US32 cents/lb early in the fi rst quarter of 2011, before correcting to levels of around US23 cents/lb towards the end of May 2011. An improving supply position out of Thailand and India, combined with an expectation of a reasonable Brazilian crop has resulted in market sentiment turning around very quickly to a more bearish outlook.
The SASA export allocation of 326 000 tons for bulk sugar was signifi cantly down on the previous year due to the drought, representing 17% of total industry production for the 2010/11 season. SASA achieved an average price of US17.70 cents/lb compared to US16.53 cents/lb in the previous season, and realised approximately R1.1 billion in export proceeds.
DownstreamThe group is a material player in most of the world markets in which it participates and exports furfural, furfuryl alcohol, diacetyl, 2.3-pentanedione, ethanol and lactulose to 81 countries. In addition, BioMass Sugar, a liquid organic fertiliser derived from sugar cane is being sold to a growing number of international markets. MultiGuard Protect, a furfural-based agricultural nematicide derived from sugar cane has been successfully registered with the Environmental Protection Agency in the USA and the product was offi cially launched at the Golf and Turf Show held in Florida in February 2011. Initial orders are encouraging.
The stronger rand impacted negatively on downstream export revenues, which during the year under review, contributed R595 million (2010: R785 million) to group revenue.
Illovo continues to benefi t from strong market shares in each of the countries in which it operates and, in the year under review, domestic market sales represented 65% of total sugar sales volumes.

48 Annual Report 2011 • ILLOVO SUGAR LIMITED
SUSTAINABILITYThe global sugar industry is one of the world’s oldest agriculturally-based industries, which is estimated to produce around 167 million tons of sugar in the 2010/11 international sugar season. Whilst many forces continually impact upon annual global production, a major sustainability feature of this industry is its historic and ongoing sugar consumption growth, which on average, increases by around 1.8% per annum. Africa, with its favourable agronomic conditions, has signifi cant potential to contribute towards the production needed to meet this growing demand. Illovo, as a world-class, low-cost, highly effi cient sugar producer, operating in Africa, is well-placed to participate in this ongoing growth opportunity. The following tables, graphs and data are intended to promote a broader understanding of the dynamic international circumstances in which the Illovo group operates.
OVERVIEWMore than 100 countries produce sugar, about 81% of which is made from sugar cane grown primarily in the tropical and sub-tropical zones of the southern hemisphere, and the balance from sugar beet which is grown mainly in the temperate zones of the northern hemisphere. Generally, the costs of producing sugar from sugar cane are lower than those in respect of processing sugar beets. Currently, 72% of the world’s sugar is consumed in the countries of origin, whilst the balance is traded on world markets. (Source: Czarnikow Sugar 2010/11, Oct/Sep basis.)
Productionmillion tons
Exports million tons
Populationmillions
Per capitaconsumption
Brazil 40.502 26.300 1 197 62
India 25.728 2.837 3 1 214 19
EU 15.446 0.707 9 499 35
China 11.815 – – 1 362 11
Thailand 10.230 6.827 2 69 40
United States of America 7.113 – – 321 40
Mexico 5.682 1.027 8 112 39
SADC 5.233 2.004 5 256 13
Australia 4.083 2.483 4 22 49
Pakistan 3.913 – – 189 21
World of sugarINTERNATIONAL STATISTICS THE WORLD SUGAR YEAR RUNS FROM OCTOBER TO SEPTEMBER

CO
MM
ENTA
RIES
ILLOVO SUGAR LIMITED • Annual Report 2011 49
WORLD SUGAR PRODUCTION (million tons)
WORLD SUGAR CONSUMPTION (million tons)
TOP SUGAR PRODUCERS 2010/11 est. (million tons)(South Africa is a member of the SADC)
TOP SUGAR EXPORTERS 2010/11 est. (million tons)(South Africa is a member of the SADC)
60 65 70 75 80 85 90 95 00 05 11 est.
60 65 70 75 80 85 90 95 00 05 11est.
0 5 10 15 20 25 30 35 40 45
0 5 10 15 20 25 30
200
150
100
50
0
200
150
100
50
0
Brazil
India
EU
China
Thailand
US
Mexico
SADC
Australia
Pakistan
Brazil
Thailand
India
Australia
SADC
Guatemala
Dubai
Mexico
EU
Belarus
years
years
Global sugar production in 2010/11 is forecast at 167 million tons, representing an almost 10% increase compared to that of last year.
Global sugar consumption growth during the current year is expected to be constrained to marginally above 1% as a result of reduced sugar availability and increased world sugar market prices.
The rise in global sugar production expected in 2010/11 is primarily attributed to increased production in Brazil, India and Thailand. The top ten producers account for around 78% to global production.
Around 71% of sugar production is expected to be consumed in the countries of origin, with the balance traded on world markets. The top fi ve sugar exporters account for around 90% of total world exports.

50 Annual Report 2011 • ILLOVO SUGAR LIMITED
WORLD OF SUGAR continued
WORLD RAW SUGAR PRICE (US cents per pound)
PREFERENTIAL PRICES (FREE ON BOARD) (US cents per pound)
PER CAPITA CONSUMPTION 2010/11 est.
DOMESTIC RETAIL SUGAR PRICES 2010/11 est.
04/05 05/06 06/07 07/08 08/09 09/10 10/11 est.
Apr-05
Oct-05
Apr-06
Oct-06
Apr-07
Oct-07
Apr-08
Oct-08
Apr-09
Oct-09
Apr-10
Oct-10
Apr-11
Oct-11
40
35
30
25
20
15
10
5
38
33
28
23
18
13
8
BrazilAustraliaThailand
EUSwaziland
South AfricaUSAIndia
MalawiZambia
ChinaMozambique
Tanzania
JapanFrance
United KingdomUSA
ArgentinaMalawi
South AfricaAustralia
BrazilSwaziland
India
0 10 20 30 40 50 60 70
0 20 40 60 80 100 120 140
EU USA World
Kilograms per annum
US cents per pound
During 2010, extremely limited sugar availability precipitated increased and sustained higher world sugar prices which rose above US30 cents/lb. More recently, improving production prospects, including predictions of a record crop in Thailand, have softened demand resulting in the price falling to around US23 cents/lb in May 2011.
Reduced EU sugar prices in the early part of the season, combined with a weaker euro, is expected to result in the average price for EU exports in 2010/11 ending the year at a considerable discount to the average world sugar price, which itself traded at much higher levels over the same period.
The potential for consumption growth in southern African countries over the longer-term remains promising.
Sugar prices in the SADC remain substantially below those of some developed nations.

ILLOVO SUGAR LIMITED • Annual Report 2011 51
CO
MM
ENTA
RIES
SOUTHERN AFRICAN DEVELOPMENT COMMUNITY – MEMBER COUNTRIES
SUGAR PRODUCTION BY COUNTRY (million tons)
AngolaBotswana
D R CongoLesotho
MadagascarMalawi
MauritiusMozambique
NamibiaSeychelles
South AfricaSwazilandTanzania
ZambiaZimbabwe
6
5
4
3
2
1
0
South Africa Swaziland Mauritius
Zimbabwe Zambia Mozambique
Tanzania Malawi
LOCAL CONSUMPTION (million tons)
EXPORT MARKETS (million tons)
04/05 05/06 06/07 07/08 08/09 09/10 10/11 est.
04/05 05/06 06/07 07/08 08/09 09/10 10/11 est.
04/05 05/06 06/07 07/08 08/09 09/10 10/11 est.
2.5
2.0
1.5
1.0
0.5
0
4.0
3.5
3.0
2.5
2.0
1.5
1.0
0.5
0
South Africa Swaziland Tanzania
Malawi Zimbabwe Mozambique
Zambia Others
Europe USA World
SOUTHERN AFRICAN DEVELOPMENT COMMUNITY STATISTICSTHE SADC SUGAR SEASON RUNS FROM APRIL TO MARCH
Reduced sugar production in several SADC countries, most notably South Africa following a severe localised drought, is expected in aggregate to fall to around fi ve million tons in the 2010/11 season.
The EU and USA preferential markets are very important to SADC sugar producers with around 70% of sugar production expected to be exported to these regions during the current season.
Annual sugar consumption across the SADC region in the current season is expected to remain similar to that of 2009/10, at approximately 3.8 million tons.

52 Annual Report 2011 • ILLOVO SUGAR LIMITED
WORLD OF SUGAR continued
THE SOUTHERN AFRICAN SUGAR SEASON RUNS FROM APRIL TO MARCH
CANE PRODUCTION (million tons)
SUGAR PRODUCTION AND MARKETS (million tons)
04/05 05/06 06/07 07/08 08/09 09/10 10/11
04/05 05/06 06/07 07/08 08/09 09/10 10/11
30
25
20
15
10
5
0
3.5
3.0
2.5
2.0
1.5
1.0
0.5
0
Local: South Africa Local: Swaziland
Export: South Africa Export: Swaziland
South Africa Swaziland
SOUTH AFRICAN CUSTOMS UNION STATISTICS
Total cane production in the region was negatively impacted by a severe drought in the KwaZulu-Natal cane growing region in South Africa.
Drought in South Africa and increased demand for sugar within the SACU region resulted in export availability falling by around 250 000 tons compared to the previous season.

ILLOVO SUGAR LIMITED • Annual Report 2011 53
CO
MM
ENTA
RIES
SUGAR PRODUCTION AND MARKETS (million tons)
INDUSTRIAL MARKET SALES (000 tons)
CANE PRODUCTION (million tons)
CONSUMER MARKET SALES (000 tons)
04/05 05/06 06/07 07/08 08/09 09/10 10/11
04/05 05/06 06/07 07/08 08/09 09/10 10/11
04/05 05/06 06/07 07/08 08/09 09/10 10/11
04/05 05/06 06/07 07/08 08/09 09/10 10/11
2.5
2.0
1.5
1.0
0.5
0
1 000
800
600
400
200
0
800
700
600
500
400
300
200
100
0
30
25
20
15
10
5
0
Minerals Bakers/food processors
Sweets Other
Wholesale Chain stores Other
Local Export
Large-scale growers
Small-scale growers
Millingcompanies
SOUTH AFRICAN STATISTICS
All cane growing sectors in the KwaZulu-Natal province were impacted by severe drought conditions with total production falling from 18.5 million tons of cane in 2009/10 to 16.0 million tons of cane in 2010/11.
Sugar production in 2010/11 fell below two million tons for the fi rst time since the 1995/96 season, following one of the worst recorded droughts in history.
Consumer market sales benefi ted from increased demand in the South African market.
Industrial sales continue to show good growth year-on-year.

54 Annual Report 2011 • ILLOVO SUGAR LIMITED
WORLD OF SUGAR continued
RAW MATERIAL THROUGHPUT (million tons)(including private growers)
ILLOVO GROUP STATISTICS
SUGAR PRODUCTION (000 tons)
GROUP MARKETS (000 tons)
04/05 05/06 06/07 07/08 08/09 09/10 10/11
04/05 05/06 06/07 07/08 08/09 09/10 10/11
04/05 05/06 06/07 07/08 08/09 09/10 10/11
04/05 05/06 06/07 07/08 08/09 09/10 10/11
20
15
10
5
0
2 000
1 500
1 000
500
0
2 000
1 500
1 000
500
0
7
6
5
4
3
2
1
0
Irrigated Rainfed
Malawi Zambia Swaziland
Tanzania Mozambique South Africa
Domestic Preferential
Regional World
CANE PRODUCTION (million tons)
South Africa Zambia Malawi
Swaziland Tanzania Mozambique
Total cane production of 6.3 million tons was a new record for the group, despite severe drought in South Africa and unseasonable wet weather in other countries of operation.
Around 64% of cane throughput supplied by the group’s own agricultural operations and by private growers is cultivated under irrigation.
It is signifi cant that of total sugar sales of 1.64 million tons in 2010/11, 65% was sold to local consumers and industrial users.
Record cane and sugar production in Zambia following its recent signifi cant production expansion, combined with increased sugar output in Tanzania, almost fully offset the loss of tonnage arising from drought in South Africa and from unseasonable wet weather in other countries of operation. Total production in 2010/11 amounted to 1.64 million tons.

ILLOVO SUGAR LIMITED • Annual Report 2011 55
CO
MM
ENTA
RIES
REFINED SUGAR PRODUCTION (000 tons)
ILLOVO SHARE OF INDUSTRY PRODUCTION (%)
0 10 20 30 40 50 60 70 80 90 100
04/05 05/06 06/07 07/08 08/09 09/10 10/11
Malawi
Zambia
Tanzania
Swaziland
South Africa
Mozambique
South Africa Swaziland
Malawi Zambia
Tanzania
Illovo
Industry
800
700
600
500
400
300
200
100
0
ILLOVO GROUP STATISTICS
Group refi ned sugar production was impacted primarily by reduced raw sugar feedstock arising out of the severe drought in South Africa.
Consistent with its Strategic Intent, Illovo commands a signifi cant share of production in each of the countries in which it operates.

56 Annual Report 2011 • ILLOVO SUGAR LIMITED
Corporate Governance
Sustainability
INTRODUCTIONIllovo subscribes to the principles of sustainable development and in this regard continues to build on the cane sugar sustainability model which is fully explained on pages 84 to 88 of this report. In particular, this model shows that presently, 89% of the group’s energy requirements is produced from renewable energy sources.
Equally important, given the rural locations of its operations, the group provides much-needed employment and supply opportunities in regions of Africa which would otherwise be impoverished. By way of illustration, for the year under review, the group provided social benefi ts to its employees valued at R129 million, this being over and above the normal costs of production which would typically be found in the more developed sugar producing countries. In addition, from cane supplied to Illovo’s factories, small-scale farmers across the group earned revenue aggregating R618 million, benefi ting these growers directly and leading to signifi cant multiplier effects within the associated communities.
This section of the Annual Report provides considerable information related to sustainability matters within Illovo. To enhance the group’s commitment to and reporting on sustainability matters, during the year under review, the company commissioned external consultants to undertake a comprehensive investigation of all Illovo’s sustainability practices and to report thereon to management. It is anticipated that this process will enable –
• management to better measure, monitor and manage key non-fi nancial sustainability metrics;
• the company to further develop its sustainability reporting, it being the intention to report against the Global Reporting Initiative’s (GRI) G3 Guidelines in the 2012 Annual Report;
• the use of the services of an independent verifi cation agency to provide assurance in respect of the sustainability report.
Illovo qualifi ed for inclusion in the JSE’s Socially Responsible Investment (SRI) Index in 2010, for the fourth consecutive year.
IntroductionThe directors and employees of Illovo strive to ensure that the company is managed in an effi cient, accountable, responsible and moral manner. In this respect, the board of directors (the board) and executive management given ongoing consideration to developments in the fi eld of corporate governance and ensure implementation within the group to the extent determined as appropriate.
The board subscribes to the principles comprising the King Code of Governance for South Africa 2009 (the King III Code) and the requisite apply or explain approach has been initiated in this report. A compliance assessment is included on pages 62 and 63 of this report, incorporating relevant explanations where applicable.
The company complies with all the requirements concerning corporate governance contained in the Listings Requirements of the JSE Limited.
Whereas, for the fi nancial year under review, ended 31 March 2011, the Companies Act, 1973, as amended, was applicable, this Act was replaced with the Companies

SUSTA
INA
BILITY
ILLOVO SUGAR LIMITED • Annual Report 2011 57
58 Annual Report 2011 • ILLOVO SUGAR LIMITED
Act, 2008, as amended, with effect from 1 May 2011. Consequently, forward-looking matters, such as those to be submitted to the shareholders at the forthcoming annual general meeting, are considered in terms of the new Act.
The BoardThe company has a unitary board of directors which comprises a majority of non-executive directors. Similarly, the majority of the non-executive directors are independent. The present composition of the board is shown in the table below:
Non-executive directors are chosen for their business acumen and skills pertinent to the business of the group, and meet the criteria of the King Report on Governance for South Africa 2009 (the King III Report). Brief curricula vitae of all the directors are included on pages 12 and 13 of this report.
The independence of the non-executive, independent directors is assessed on an annual basis by the Remuneration/Nomination Committee, which provides an appropriate report-back to the board.
The board is ultimately responsible for ensuring that the business is a going concern, and to this end effectively controls the group and its management and is involved in all decisions that are material for this purpose. The board functions in terms of a formal Board Charter which, in particular prescribes that the board takes responsibility for:
• exercising leadership, enterprise, integrity and judgement in directing the company so as to achieve its Strategic Intent, and goals and objectives;
• acting as a focal point for and custodian of corporate governance;
• approving the strategic direction, and the goals and objectives of the company; always appreciating that strategy, risk, performance and sustainability are inseparable;
• ensuring that the business is a going concern, and being involved in all discussions which are material for this purpose;
• considering and approving annually the company’s strategic plan and its operating and capital budgets;
• considering and approving all material investments, and acquisitions and disposals of business activities;
• defi ning and monitoring levels of materiality, reserving specifi c powers to itself and delegating other appropriate matters to the relevant board committees and/or management;
• determining the terms of reference of the board committees, and appointing or recommending the appointment of, as the case may be, the members of such committees;
• being satisfi ed that appropriate policies, procedures and practices are in place and are duly observed;
• identifying and monitoring the non-fi nancial sustainability issues relevant to the business of the company;
• ensuring that the company maintains and develops good corporate governance standards;
• the governance of risk; identifying and monitoring the company’s key risks and key performance indicators;
• being satisfi ed that:
– there is due compliance with all risk-related policies, procedures and standards; and
– internal controls are effectively maintained and, where necessary, reviewed;
• ensuring that the company has an effective internal audit function;
• information technology governance; being satisfi ed that the technology and systems used in the company are appropriate to its business needs;
• ensuring that the evaluation of the board, its committees and individual directors is undertaken on an annual basis;
• endeavouring to ensure that the company complies with all relevant laws, regulations and codes of business practice;
• overseeing the preparation of and approving the company’s annual fi nancial statements, and ensuring that disclosures in the Annual Report, particularly those pertaining to sustainability matters, are adequate and meet regulatory requirements;
• approving the company’s interim and fi nal results announcements, and determining distributions to shareholders;
• ensuring that:
– succession planning is undertaken;
– the remuneration strategy of the company is appropriate to the business; and
– remuneration levels of directors and senior management are appropriate;
CORPORATE GOVERNANCE continued
Directors
Non-executive, independent 7Non-executive 4*Executive 4
Total 15
* Three of the non-executive directors are appointed by the holding company
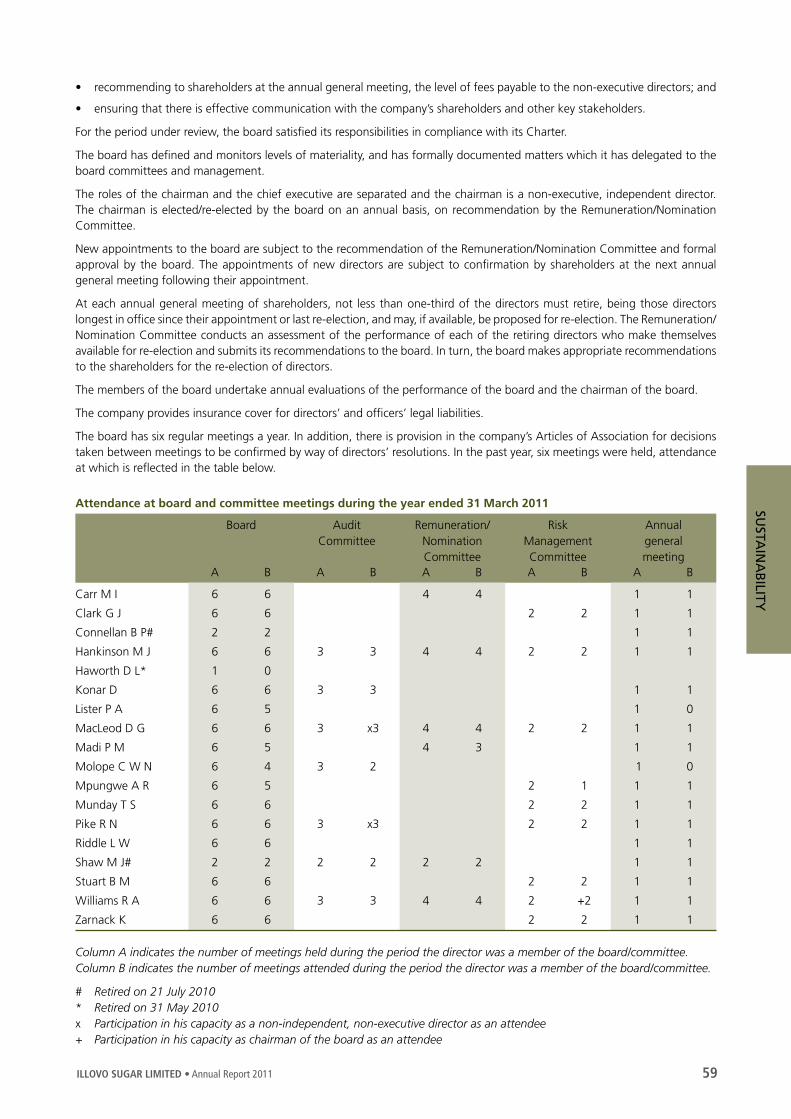
ILLOVO SUGAR LIMITED • Annual Report 2011 59
SUSTA
INA
BILITY
Attendance at board and committee meetings during the year ended 31 March 2011
Board AuditCommittee
Remuneration/NominationCommittee
RiskManagementCommittee
Annual generalmeeting
A B A B A B A B A B
Carr M I 6 6 4 4 1 1
Clark G J 6 6 2 2 1 1
Connellan B P# 2 2 1 1
Hankinson M J 6 6 3 3 4 4 2 2 1 1
Haworth D L* 1 0
Konar D 6 6 3 3 1 1
Lister P A 6 5 1 0
MacLeod D G 6 6 3 x3 4 4 2 2 1 1
Madi P M 6 5 4 3 1 1
Molope C W N 6 4 3 2 1 0
Mpungwe A R 6 5 2 1 1 1
Munday T S 6 6 2 2 1 1
Pike R N 6 6 3 x3 2 2 1 1
Riddle L W 6 6 1 1
Shaw M J# 2 2 2 2 2 2 1 1
Stuart B M 6 6 2 2 1 1
Williams R A 6 6 3 3 4 4 2 +2 1 1
Zarnack K 6 6 2 2 1 1
Column A indicates the number of meetings held during the period the director was a member of the board/committee.Column B indicates the number of meetings attended during the period the director was a member of the board/committee.
# Retired on 21 July 2010* Retired on 31 May 2010x Participation in his capacity as a non-independent, non-executive director as an attendee+ Participation in his capacity as chairman of the board as an attendee
• recommending to shareholders at the annual general meeting, the level of fees payable to the non-executive directors; and
• ensuring that there is effective communication with the company’s shareholders and other key stakeholders.
For the period under review, the board satisfi ed its responsibilities in compliance with its Charter.
The board has defi ned and monitors levels of materiality, and has formally documented matters which it has delegated to the board committees and management.
The roles of the chairman and the chief executive are separated and the chairman is a non-executive, independent director. The chairman is elected/re-elected by the board on an annual basis, on recommendation by the Remuneration/Nomination Committee.
New appointments to the board are subject to the recommendation of the Remuneration/Nomination Committee and formal approval by the board. The appointments of new directors are subject to confi rmation by shareholders at the next annual general meeting following their appointment.
At each annual general meeting of shareholders, not less than one-third of the directors must retire, being those directors longest in offi ce since their appointment or last re-election, and may, if available, be proposed for re-election. The Remuneration/Nomination Committee conducts an assessment of the performance of each of the retiring directors who make themselves available for re-election and submits its recommendations to the board. In turn, the board makes appropriate recommendations to the shareholders for the re-election of directors.
The members of the board undertake annual evaluations of the performance of the board and the chairman of the board.
The company provides insurance cover for directors’ and offi cers’ legal liabilities.
The board has six regular meetings a year. In addition, there is provision in the company’s Articles of Association for decisions taken between meetings to be confi rmed by way of directors’ resolutions. In the past year, six meetings were held, attendance at which is refl ected in the table below.

60 Annual Report 2011 • ILLOVO SUGAR LIMITED
The relevant interests of directors are considered at each meeting of directors, and individual directors declare their specifi c interests in any discussions in respect of which the director concerned might have a confl ict of interest.
In addition to having access to the advice of the company secretary, members of the board may, in appropriate circumstances, take independent professional advice at the company’s expense.
Board committeesFor logistical reasons, meetings of the various committees, as identifi ed below, take place immediately prior to board meetings. Consequently, the chairmen of the committees provide verbal report-backs to the relevant following meetings of the board. The members of the committees undertake annual evaluations of the performance of the respective committees.
Audit CommitteeThe responsibilities and activities of the group Audit Committee are covered in the Audit Committee Report on pages 98 and 99 of this report.
Audit committees are also established and operational at each of the operating subsidiaries.
Remuneration/Nomination CommitteeThe responsibilities and activities of the Remuneration/Nomination Committee are covered in the Remuneration Report on pages 64 and 65 of this report.
Risk Management CommitteeThe company’s Risk Management Committee presently comprises fi ve non-executive directors, three of whom are independent and one of whom is the chairman of the committee, three of the executive directors and fi ve members of senior management. The directors and Executive Committee members of the Committee are indicated on pages 12 to 15 of this report. The Committee is presently chaired by Mr D G MacLeod, and upon his appointment as chairman of the board in July 2011 will be chaired by Mr R N Pike.
The Committee has formal terms of reference approved by the board. The Committee is responsible for reviewing the company’s risk philosophy, strategy and policies, and ensuring compliance with such policies; reviewing the adequacy and overall effectiveness of the company’s risk management function; ensuring the implementation of an ongoing process for risk identifi cation, mitigation and management; ensuring the establishment of a comprehensive system of controls; pursuing measures for increasing risk awareness throughout the company; reviewing any signifi cant legal matters; and reviewing the adequacy of insurance coverage. The Committee gives particular focus to operational risks, including health and safety and compliance with the legislative and regulatory requirements in each country of operation.
The Committee meets at least twice a year. In respect of the past year, two meetings were held, attendance at which by the director members is refl ected in a table on page 59 of this report. For the period under review, the Committee satisfi ed its responsibilities in compliance with its terms of reference.
Executive CommitteeThe executive directors along with the executives responsible for human resources, corporate affairs and continuous improvement constitute the Executive Committee which meets on a weekly basis to review operational performance, capital programmes and other relevant issues. In addition, consideration is given to major investment and capital expenditure proposals as well as issues of strategic importance to the group, for recommendation to the board. Furthermore, the daily involvement of the members of the Executive Committee with operational and functional executives ensures the interactive nature of the overall management reporting structure. The members of this Committee are indicated on pages 14 and 15 of this report.
Company secretaryThe board considers the company secretary to be qualifi ed to perform his duties in accordance with applicable legislation and to be fi t and proper for the position. All directors have access to the advice and services of the company secretary.
JSE SponsorJ P Morgan Equities Limited acts as the company’s Sponsor in compliance with the JSE Listings Requirements.
Management reportingThe group has established comprehensive management reporting disciplines which include the preparation of annual strategic plans and budgets by all operating entities. Results and the fi nancial status of operating entities are reported monthly against approved budgets and compared to the prior year. Profi t and cash fl ow projections are reviewed regularly, whilst working capital and borrowing levels are monitored on an ongoing basis.
Financial statementsThe company’s directors are responsible for overseeing the preparation of the fi nancial statements and other information presented in reports to shareholders in a manner that fairly presents the state of affairs and results of the group’s business operations. The independent auditors are responsible for carrying out an independent examination of the fi nancial statements in accordance with International Standards on Auditing and reporting their fi ndings.
The annual fi nancial statements are prepared in accordance with International Financial Reporting Standards (IFRS) and the Companies Act, 1973, as amended. They are based on appropriate accounting policies which have been consistently applied, except when otherwise stated, in which case full disclosure is made.
CORPORATE GOVERNANCE continued
ILLOVO SUGAR LIMITED • Annual Report 2011 61
SUSTA
INA
BILITY
Going concernThe directors believe that the business will be a going concern in the year ahead. The auditors concur with the opinion of the directors.
Internal controlThe group maintains internal controls and systems designed to provide reasonable assurance as to the integrity and reliability of the fi nancial statements and to adequately safeguard, verify and maintain accountability for its assets. Such controls and systems are based on established policies and procedures and are implemented by trained personnel with an appropriate segregation of duties. The effectiveness of these internal controls and systems is monitored in a number of ways, as set out below, dependent upon the particular circumstances:
• the aid of internal control checklists;
• the establishment of defalcation reporting procedures;
• the functions of the internal audit department; and
• adherence to performance standards.
The purpose, authority and responsibility of the internal audit department are defi ned in a formal charter approved by the Audit Committee and the board. The department functions as an independent appraisal activity established to conduct reviews of operations and procedures, and to report fi ndings and recommendations to company management, the Audit Committee or the board as may be appropriate. The head of the department reports functionally to the chairman of the Audit Committee and administratively to the corporate affairs director, and also has unrestricted access to the chief executive, the Audit Committee, and the chairman of the board.
The independent auditors, through the audit work they perform, confi rm that the abovementioned monitoring procedures have been implemented.
Nothing has come to the attention of the directors or the independent auditors to indicate that any material breakdown in the functioning of the abovementioned internal controls and systems has occurred during the year under review.
Information Technology (IT)The board has assigned the responsibility of monitoring IT governance to the Audit Committee.
The introduction of King III has a number of implications for the management of IT. Management has conducted an analysis of the implications of the relevant chapter of King III relative to its IT management philosophy, and is currently engaged in appropriately enhancing its governance framework and processes.
EthicsIt is a fundamental policy of the company, embracing all group operations, to conduct its business with honesty and integrity and in accordance with the highest legal and ethical standards. The company has established a Code of Conduct and Business Practices, determining the minimum standards required of all staff, which is disseminated throughout the group and reviewed annually by the Executive Committee. The Code prescribes, inter alia, that the company shall not make political contributions. All managers are required to give written agreement to this Code. In any instance where ethical standards are called into question, the circumstances are investigated and resolved by the appropriate executive.
“Crimeline” facilities, inviting people from within and outside the company to anonymously report any wrong-doings are operated by independent forensic accountants, and all matters arising are then appropriately investigated and reported upon.
ComplianceThe board endeavours to ensure that the company and its subsidiaries comply with all relevant laws, regulations and codes of business practice. To this end, the heads of each operational subsidiary, in the six countries in which the group operates, are required to provide written confi rmation on an annual basis to the Risk Management Committee, that such subsidiaries and their employees have complied with all relevant laws, regulations and codes of business practice during the period under review.
To further bolster this aspect of the business, a new position of Group Compliance Manager has recently been established to give specifi c focus to the various requirements across the group.
INSIDER TRADINGThe company has a code of conduct for dealing in securities issued by any of the group’s listed companies. Directors and offi cers of the group who have access to unpublished, price-sensitive information in respect of any of these companies are prohibited from dealing in the shares of such companies during defi ned restricted periods, including those periods immediately prior to the announcement of interim and fi nal fi nancial results and periods during which cautionary announcements are operative. Directors and the company secretaries of both Illovo Sugar Limited and its major subsidiaries are required to obtain clearance from either the group chairman or chief executive before dealing in company shares.
ACCESS TO INFORMATIONThe company has complied with the requirements of the Promotion of Access to Information Act, 2000. The relevant manual is available on the company’s website: www.illovosugar.com.
No requests for access to records were received during the year under review.

62 Annual Report 2011 • ILLOVO SUGAR LIMITED
KING III CODE COMPLIANCE ASSESSMENT
Key: ✔ Compliant # Partially compliant * Under review ø Not applicable
PRINCIPLES
Chapter 1 – Ethical leadership and corporate citizenshipThe board should provide effective leadership based on an ethical foundation ✔
The board should ensure that the company is and is seen to be a responsible corporate citizen ✔
The board should ensure that the company’s ethics are managed effectively ✔
Chapter 2 – Board and directorsThe board should act as the focal point for and custodian of corporate governance ✔
The board should appreciate that strategy, risk, performance and sustainability are inseparable ✔
The board and its directors should act in the best interests of the company ✔The board should consider business rescue proceedings or other turnaround mechanisms as soon as the company is fi nancially distressed as defi ned in the Companies Act, 2008, as amended (note 1) øThe board should elect a chairman of the board who is an independent non-executive director. The CEO of the company should not also fulfi l the role of chairman of the board (note 2) ✔
The board should appoint the chief executive offi cer and establish a framework for the delegation of authority ✔The board should comprise a balance of power, with a majority of non-executive directors. The majority of non-executive directors should be independent ✔
Directors should be appointed through a formal process ✔
The induction of and ongoing training and development of directors should be conducted through formal processes (note 3) #The board should be assisted by a competent, suitably qualifi ed and experienced company secretary ✔
The evaluation of the board, its committees and the individual directors should be performed every year ✔
The board should delegate certain functions to well-structured committees but without abdicating its own responsibilities ✔
A governance framework should be agreed between the group and its subsidiary boards (note 4) #Companies should remunerate directors and executives fairly and responsibly (note 5) #Companies should disclose the remuneration of each individual director and certain senior executives (Note 6) #Shareholders should approve the company’s remuneration policy ✔
Chapter 3 – Audit CommitteesThe board should ensure that the company has an effective and independent audit committee ✔
Audit committee members should be suitably skilled and experienced independent non-executive directors (note 7) #The audit committee should be chaired by an independent non-executive director ✔
The audit committee should oversee integrated reporting (note 8) #The audit committee should ensure that a combined assurance model is applied to provide a coordinated approach to all assurance activities (note 8) #The audit committee should satisfy itself of the expertise, resources and experience of the company’s fi nance function ✔
The audit committee should be responsible for overseeing of internal audit ✔
The audit committee should be an integral component of the risk management process ✔The audit committee is responsible for recommending the appointment of the external auditor and overseeing the external audit process ✔
The audit committee should report to the board and shareholders on how it has discharged its duties ✔
Chapter 4 – The governance of riskThe board should be responsible for the governance of risk ✔
The board should determine the levels of risk tolerance ✔
The risk committee or audit committee should assist the board in carrying out its risk responsibilities ✔
The board should delegate to management the responsibility to design, implement and monitor the risk management plan ✔
The board should ensure that risk assessments are performed on a continual basis ✔The board should ensure that frameworks and methodologies are implemented to increase the probability of anticipating unpredictable risks ✔
The board should ensure that management considers and implements appropriate risk responses ✔
The board should ensure continual risk monitoring by management ✔
The board should receive assurance regarding the effectiveness of the risk management process ✔The board should ensure that there are processes in place enabling complete, timely, relevant, accurate and accessible risk disclosure to stakeholders ✔
Chapter 5 – The governance of information technologyThe board should be responsible for information technology (IT) governance (note 9) *IT should be aligned with the performance and sustainability objectives of the company (note 9) *The board should delegate to management the responsibility for the implementation of an IT governance framework (note 9) *The board should monitor and evaluate signifi cant IT investments and expenditure ✔
IT should form an integral part of the company’s risk management ✔
The board should ensure that information assets are managed effectively (note 9) *A risk committee and audit committee should assist the board in carrying out its IT responsibilities (note 10) #
CORPORATE GOVERNANCE continued

ILLOVO SUGAR LIMITED • Annual Report 2011 63
SUSTA
INA
BILITY
Notes1. It has not been necessary to consider business rescue proceedings.
2. Whilst the current chairman is independent, the next chairman, by defi nition, will not be independent at the time of his appointment and consequently a lead independent director will be appointed.
3. Given the experience of the members of the board, mentorship and professional development programmes have not been considered necessary.
4. As fi ve of the company’s six operating subsidiaries are registered in countries outside South Africa, these subsidiaries are guided by local reporting requirements, and the integrated reporting of subsidiary companies as contemplated by King III is not applicable.
5. Given the generally high-level of attendance at meetings, the board does not consider it appropriate for non-executive directors’ fees to comprise a meeting attendance fee as well as a base fee. Fees are determined with due regard to relevant market surveys.
6. Whilst the remuneration of each individual director is disclosed, the board does not consider it appropriate to disclose the individual salaries of the three most highly-paid employees who are not directors. The aggregate salaries of these three individuals is disclosed in the Remuneration Report.
7. The current chairman of the board, who is an independent director, is a member but not the chairman of the Audit Committee. This is deemed to be appropriate so as to provide him with a full understanding of the matters considered by this Committee.
8. Whilst the Audit Committee reviews all disclosures in the annual report, responsibility for non-fi nancial sustainability matters falls to the Risk Management Committee.
9. As one of the responsibilities of the Audit Committee, the present IT governance framework and processes are currently being enhanced to ensure further alignment with King III.
10. The Audit Committee, not the Risk Management Committee, has responsibility relative to IT risks.
11. Whilst the internal audit function does follow a risk-based approach to its plan, relative to the sub-principles dealing with the realisation of strategic goals, assurance in this regard is not included in the internal audit mandate. This is the responsibility of executive management.
12. The reporting on and the provision of assurance over non-fi nancial sustainability issues is the responsibility of the Risk Management Committee. The independent assurance in respect of sustainability reporting and disclosures will be procured for the 2012 Annual Report.
PRINCIPLES
Chapter 6 – Compliance with laws, rules, codes and standardsThe board should ensure that the company complies with applicable laws and considers adherence to non-binding rules, codes and standards ✔
The board and each individual director should have a working understanding of the effect of the applicable laws, rules, codes and standards on the company and its business ✔
Compliance risk should form an integral part of the company’s risk management process ✔
The board should delegate to management the implementation of an effective compliance framework and processes ✔
Chapter 7 – Internal AuditThe board should ensure that there is an effective risk based internal audit ✔
Internal audit should follow a risk based approach to its plan (note 11) #Internal audit should provide a written assessment of the effectiveness of the company’s system of internal controls and risk management ✔
The audit committee should be responsible for overseeing internal audit ✔
Internal audit should be strategically positioned to achieve its objectives ✔
Chapter 8 – Governing stakeholder relationshipsThe board should appreciate that stakeholders’ perceptions affect a company’s reputation ✔
The board should delegate to management to proactively deal with stakeholder relationships ✔
The board should strive to achieve the appropriate balance between its various stakeholder groupings, in the best interests of the company ✔
Companies should ensure the equitable treatment of shareholders ✔
Transparent and effective communication with stakeholders is essential for building and maintaining their trust and confi dence ✔
The board should ensure that disputes are resolved as effectively, effi ciently and expeditiously as possible ✔
Chapter 9 – Integrated reporting and disclosureThe board should ensure the integrity of the company’s integrated report ✔
Sustainability reporting and disclosure should be integrated with the company’s fi nancial reporting ✔
Sustainability reporting and disclosures should be independently assured (note 12) #

64 Annual Report 2011 • ILLOVO SUGAR LIMITED
Remuneration Report
REMUNERATION PHILOSOPHY AND POLICY
The principles of the remuneration policy are designed:
• not only to attract, retain and motivate employees but also to reward them for their contribution to the group’s operating and fi nancial performance;
• to take to account market conditions at both industry and country levels; and
• to cater, apart from fi xed remuneration, for an element of variable remuneration in the form of short and longer-term incentive schemes that are used to reward employees for the achievement and out-performance of specifi ed targets and objectives, as well as assisting in attracting and retaining key personnel.
REMUNERATION/NOMINATION COMMITTEEFor the year under review, the company’s Remuneration/Nomination Committee comprised six non-executive directors, four of whom were independent, reducing to fi ve and three respectively upon the retirement of Mr M J Shaw with effect from 21 July 2010. The members of the Committee are indicated on pages 12 and 13 of this report. When dealing with remuneration matters, the Committee was chaired by Mr M J Shaw until his retirement and thereafter by Mr M J Hankinson, whilst when considering nomination matters, the Committee was chaired by Mr R A Williams as chairman of the board.
At the meeting of the board held on 27 May 2011, Mr T S Munday was appointed as an additional member of the Committee.
The Committee has formal terms of reference approved by the board. It is responsible for the assessment and approval of a broad remuneration strategy for the group, and for the development and determination of the company’s general policy on executive and senior management remuneration. It is also responsible for making recommendations to the board on the fees payable to the company’s non-executive directors.
The Committee also gives consideration to the composition of the board and makes appropriate recommendations in this regard to the board. It also plays an integral part in succession planning relative to senior executives.
The Committee meets at least three times a year at which meetings appropriate members of executive management are in attendance. In the past year, four meetings were held, attendance at which is refl ected on a table on page 59 of this report. For the year under review, the Committee satisfi ed its responsibilities in compliance with its terms of reference.
EXECUTIVE AND SENIOR MANAGEMENT REMUNERATIONThe group aims to adhere to the broad guidelines of executive remuneration as anticipated by King III, in respect of remuneration packages of the company’s executive directors and senior management levels, ensuring that:
• the positioning of the remuneration packages are aligned between the market median and upper quartile of local and international industry benchmarks. To this end, external consultants are used to ensure that these levels are conducive to the attraction and retention of these key skills;
• there is an appropriate balance between fi xed and variable remuneration which is modelled to achieve superior performance; and
• incentives in respect of short-term and long-term driven targets are implemented which contribute towards the achievement of company objectives and which are aligned to the delivery of sustained shareholder value.

ILLOVO SUGAR LIMITED • Annual Report 2011 65
SUSTA
INA
BILITY
For the short term, all employees participate in a performance related bonus scheme designed and implemented on a fi nancial year basis, i.e. paid out against pre-set performance criteria at the end to the group’s fi nancial year. The targets set are both of a fi nancial and ‘line-of-sight’ operational nature, directly relevant to the performance expectations for each operation in the ensuing year. In respect of the latter, the targets are readily measured and progress towards achievement thereof is communicated on an ongoing basis.
Longer-term incentives include share purchase schemes and a performance-related phantom share scheme, the latter being extended to key senior staff members, which are aligned to the company’s share performance and incorporate a performance hurdle. These schemes are more fully described under the Directors’ Report on pages 93 to 95 of this report.
COMPENSATION OF DIRECTORSThe remuneration of executive directors for the year ended 31 March 2011 was as follows:
Salary Bonus Retirement and medical
contributions
Other benefi ts
Option gains
Total
R000 R000 R000 R000 R000 R000
Clark G J 3 616 752 437 206 5 584 10 595Haworth D L# 276 – 41 1 329 776 2 422Riddle L W 1 657 364 232 251 261 2 765Stuart B M 2 761 501 149 448 – 3 859Zarnack K 2 086 334 245 185 2 176 5 026
Total 10 396 1 951 1 104 2 419 8 797 24 667
# Retired on 31 May 2010
The remuneration of executive directors for the year ended 31 March 2010 was as follows:
Salary Bonus Retirement and medical
contributions
Other benefi ts
Option gains
Total
R000 R000 R000 R000 R000 R000
Clark G J 3 000 465 367 123 – 3 955Haworth D L 1 431 150 173 182 – 1 936Riddle L W 1 432 222 188 204 662 2 708Stuart B M 2 289 286 277 192 19 3 063Zarnack K 1 826 237 214 154 868 3 299
Total 9 978 1 360 1 219 855 1 549 14 961
For the year under review, the salaries of the three most highly-paid employees who are not directors aggregated R4.432 million.

66 Annual Report 2011 • ILLOVO SUGAR LIMITED
The fees paid to non-executive directors were as follows:
2011 2010R000 R000
Connellan B P # 58 180Hankinson M J 444 403Konar D 335 315MacLeod D G 1 275 1 200Madi P M 270 258Molope C W N 270 258Mpungwe A R * 260 106Munday T S x 260 13Norton R A ø – 143Shaw M J # 146 441Williams R A 1 930 1 820Carr M I + – –Lister P A + – –Pike R N + – –
Total 5 248 5 137
# Retired 21 July 2010* Appointed 1 September 2009x Appointed 9 March 2010ø Retired 14 July 2009+ These directors, nominated by the holding company, have each elected not to receive the payment of the fees due to them
as non-executive members of the board and the board committees upon which they serve
Post-retirement medical aid contributions paid on behalf of past directors amounted to R54 166 for the year (2010: R46 940).
SHARE OPTIONS
Illovo Sugar 1992 Share Option SchemeThis option scheme is covered under the Directors’ Report on pages 93 and 94 of this report.
The table below refl ects options previously granted to directors, any options exercised during the year under review, and options unexpired and unexercised as at 31 March 2011.
Options as at31 March
2010
Optionprice
(cents)
Optionsexercised
duringthe year
Exerciseprice
(cents)
Options as at31 March
2011
Expiry date
Clark G J 48 824 805 48 824 2 710 – 20.05.201268 500 680 68 500 2 710 – 20.05.201346 000 770 46 000 2 710 – 01.06.2014
163 324 –
Riddle L W 3 600 770 3 600 2 805 – 01.06.2014
3 600 –
Stuart B M 45 700 680 – – 45 700 20.05.201346 000 770 – – 46 000 01.06.2014
91 700 91 700
258 624 166 924 91 700
REMUNERATION REPORT continued

ILLOVO SUGAR LIMITED • Annual Report 2011 67
SUSTA
INA
BILITY
Illovo Sugar Phantom Share SchemeThis share scheme is covered under the Directors’ Report on pages 94 and 95 of this report. Given that options in terms of this scheme are “cash settled” rather than “equity settled”, the scheme does not fall to be classifi ed as a share incentive scheme in terms of the JSE’s Listings Requirements.
The table below refl ects options previously granted to directors, options granted during the year under review, any options exercised during the year under review, and options unexpired and unexercised as at 31 March 2011.
Options as at31 March
2010
Optionprice
(cents)
Optionsgrantedduring
the year
Optionsexercised
duringthe year
Exercise price
(cents)
Options as at31 March
2011
Expiry date
Clark G J 92 500 829 61 600 2 96730 900 2 729 – 12.07.2015
50 000 1 634 16 600 2 96716 700 2 729 16 700 29.10.2016
90 000 2 364 30 000 2 729 60 000 23.07.201770 000 2 867 – 70 000 09.07.2018
240 000 2 808 – 240 000 13.07.20192 856 172 500 – 172 500 20.07.2020
542 500 172 500 155 800 559 200
MacLeod D G* 100 000 2 364 – 100 000 23.07.2017140 000 2 867 – 140 000 09.07.2018
240 000 240 000
Riddle L W 26 800 829 10 800 2 59316 000 2 770 – 12.07.2015
20 000 1 634 – 20 000 29.10.201633 500 2 364 – 33 500 23.07.201725 000 2 867 – 25 000 09.07.201860 000 2 808 – 60 000 13.07.2019
2 856 56 000 – 56 000 20.07.2020
165 300 56 000 26 800 194 500
Stuart B M 92 500 829 – 92 500 12.07.201545 000 1 634 – 45 000 29.10.201642 500 2 364 – 42 500 23.07.201751 500 2 867 – 51 500 09.07.201892 000 2 808 – 92 000 13.07.2019
2 856 75 000 – 75 000 20.07.2020
323 500 75 000 – 398 500
Zarnack K 85 000 829 85 000 2 700 – 12.07.201570 000 1 634 46 600 2 700 23 400 29.10.201680 000 2 364 26 600 2 700 53 400 23.07.201734 500 2 867 – 34 500 09.07.201860 000 2 808 – 60 000 13.07.2019
2 856 64 000 – 64 000 20.07.2020
329 500 64 000 158 200 235 300
1 600 800 367 500 340 800 1 627 500
* Options granted to Mr MacLeod whilst an executive director

68 Annual Report 2011 • ILLOVO SUGAR LIMITED
Risk Management Report
Risk management is an integral part of Illovo’s business management. The safety, security and preservation of its people and property are essential for the group’s sustainable growth.
The focus of risk management in Illovo is on identifying, assessing, mitigating, managing and monitoring all known forms of risk across the group. Management is involved in a continuous process of developing and enhancing its comprehensive systems for risk identifi cation and management.
The major risks and their relevant mitigating and management strategies are the subject of the ongoing attention of the board and are given particular consideration in the annual strategic plan which is approved by the board.
KEY RISK MATRIXThe key risks identifi ed in the year under review are set out in the table below. The risks identifi ed, both internal and external in nature, were those considered to have potentially the most material impact upon the group if realised. Each risk is identifi ed in terms of its potential likelihood and impact without mitigating controls, and those after mitigating controls. For internal purposes, quantifi cation of each risk is made in monetary terms, together with the allocation of its responsibility.
Description of risk Without mitigating controls
With mitigatingcontrols
Likelihood Impact Likelihood Impact
Exchange rate movements High High High High
Abnormal weather conditions Medium High Low High
Profi t exposure due to world sugar price movement High High High Medium
Local market revenue Medium High Low Medium
Access to preferential sugar markets (access and price) Medium High Medium Medium
Regional market revenue – exposure to world sugar price Medium High Medium Medium
Factory performance High Medium Medium Medium
Asset protection/maintenance Medium Medium Low Low
Projects/expansions (delays, costs, returns) High High Medium Medium
Agricultural development Medium Medium Low Low
Environmental issues (compliance, product safety) Medium Medium Low Low
Finance/liquidity Medium Medium Low Low
Political issues Medium High Medium Medium
Health care High Low Medium Low
Skills retention Medium High Low Medium
Illovo brand and culture Medium Medium Low Low
Legal compliance Medium Medium Low Low
Industrial relations Medium Medium Low Low
Fraud High Low Medium Low
Business continuity plans for all sites have been developed through a process of considering and assessing all possible major risks which may impact the business.
The management of fi nancial risk is covered under note 41 to the fi nancial statements on pages 140 to 143.
The management of operational risk is a line function, conducted in compliance with a comprehensive set of group policies and standards to cover all aspects of operational risk control. In order to strengthen risk management within the group, Illovo has recently re-structured resources and appointed senior risk control managers in each country of operation. Reporting systems and formats have been standardised; performance is measured on a regular basis by means of both self-assessments and audits by independent consultants. In addition, the group promotes ongoing commitment to the management and control of risk by participating in externally organised risk management and safety systems. Further information in this regard is provided under Social Impact on page 79 of this report.
Insurance cover on assets is based upon current replacement values. Consistent with the high standard of risk management, a substantial portion of risk is self-insured, at costs well below market premiums. All risks are adequately covered, except where the premium cost is excessive in relation to the probability and extent of loss.

ILLOVO SUGAR LIMITED • Annual Report 2011 69
SUSTA
INA
BILITY
Illovo is cognisant that its long-term sustainability objectives are supported through engaging with its relevant stakeholders to address matters of mutual interest, and is aware that its corporate reputation is based on how well it performs compared with the legitimate interests and expectations of stakeholders, and that their support or lack thereof, may infl uence the group’s performance. The type of stakeholders with which the group interacts and the nature of the interaction are products of the operating environment and consequently vary from country-to-country. However, the group’s stakeholder engagement is underscored by management’s responsibility to maintain its visibility to and accessibility by its stakeholders, with clear commitment not to profi t at the expense of the environments and communities in which it operates.
The table below sets out the key stakeholders which have generally been identifi ed across the group, and includes a brief explanation of the relevant interactions.
KEY STAKEHOLDER TYPE OF INTERACTION
Employees An array of internal communication channels are used to reach employees across the group regarding ongoing business-related information and strategy, through to training and personal development, including group-wide staff magazines, intranet, a customised Illovo business understanding programme, MD briefs, notice boards, etc.
Trade unions Approximately 84% of all Illovo employees are unionised and the group interacts across a range of labour forums, e.g. regular union meetings, collective bargaining forums, etc., to ensure sound employee relations and compliance with internationally recognised labour practices.
Shareholders; investors; analysts
Investor/analyst presentations; one-on-one meetings; site visits; regular operational and fi nancial communications; annual general meetings.
Media Regular interaction with all forms of media to communicate developments, successes, strategy, fi nancial results and to deal with issues which are reported in the public domain. Interaction includes one-on-one interviews, site visits, media statements and general contact to promote understanding.
Regulators: The JSE Limited; Lusaka Stock Exchange; Malawi Stock Exchange and other regulators
The company and its subsidiaries comply with the various regulatory requirements in the countries in which they operate, including regular contact and interaction with these regulators and relevant government departments.
Customers Trade market: Ongoing interaction with supermarket chains and wholesalers; promotion of sugar distribution and depot system amongst existing/potential entrepreneurs; direct consumer stakeholder contact; involvement in community-based initiatives; support of annually sponsored sporting events.
Industrial market: Customer interaction in respect of both sugar and downstream products; focus on specifi c technical and operational requirements of the customer with ongoing liaison through various channels.
Raw material suppliers: providers of sugar cane
Ongoing communication at both industry and local level with grower associations and member groups; operational discussions of mutual concern; contact through industry structures, e.g. SA Sugar Association, Tanzania Sugar Producers’ Association, etc.
Suppliers and service providers
Support of local industry suppliers; development programmes to identify and maintain strategic group suppliers; annual recognition of top performing suppliers via awards programmes; business and operational up-date meetings; negotiation of service level agreements.
Governments Ongoing discussion at industry and company level with government departments and industry bodies relating to sugar cane growing and milling, together with other departments dealing with land reform, rural development, etc; regular contact to up-date government representatives on state of ongoing business, strategy, capacity expansions, etc.
Communities; traditional and civic society
Strong identifi cation and communication with communities surrounding operations relating to cane development, community/company projects of mutual interest; support of community-based social investment requirements; provision of community infrastructure and advocacy of community issues.
The company participates in relevant public policy development through sugar industry structures, tripartite business, labour and government public policy development structures, and other business associations. Its involvement in the facilitation of broader national strategic objectives continues through participation in organisations such as the National Business Initiative and the Business Trust in South Africa, along with its membership across the group of other private and public forums to promote and facilitate the economic business landscape in the various countries of operation.
In its employment practices, the group remains committed to human rights and fair treatment of its employees in line with International Labour Organisation Conventions on employment, which in most countries of operation are also enshrined in the employment-related legislation. The group’s employment policies are explicit in their commitment to equity ensuring that forced and child labour do not take place at any of its operations.
As a consequence of this commitment to human rights and fair employment practices, for the year under review, the group did not incur any fi nes for non-compliance with relevant legislation in any of the countries in which it operates.
Stakeholder Engagement
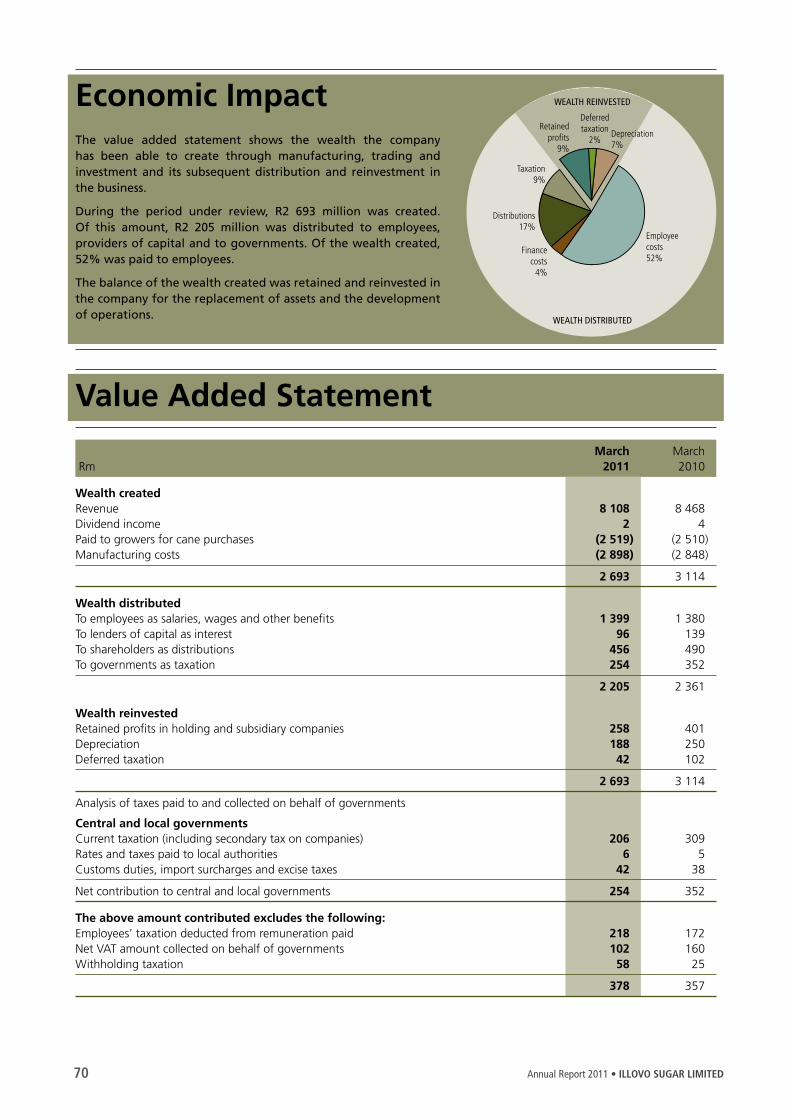
70 Annual Report 2011 • ILLOVO SUGAR LIMITED
Economic ImpactThe value added statement shows the wealth the company has been able to create through manufacturing, trading and investment and its subsequent distribution and reinvestment in the business.
During the period under review, R2 693 million was created. Of this amount, R2 205 million was distributed to employees, providers of capital and to governments. Of the wealth created, 52% was paid to employees.
The balance of the wealth created was retained and reinvested in the company for the replacement of assets and the development of operations.
March March Rm 2011 2010
Wealth createdRevenue 8 108 8 468 Dividend income 2 4 Paid to growers for cane purchases (2 519) (2 510)Manufacturing costs (2 898) (2 848)
2 693 3 114
Wealth distributedTo employees as salaries, wages and other benefi ts 1 399 1 380 To lenders of capital as interest 96 139 To shareholders as distributions 456 490 To governments as taxation 254 352
2 205 2 361
Wealth reinvestedRetained profi ts in holding and subsidiary companies 258 401 Depreciation 188 250 Deferred taxation 42 102
2 693 3 114
Analysis of taxes paid to and collected on behalf of governments
Central and local governmentsCurrent taxation (including secondary tax on companies) 206 309 Rates and taxes paid to local authorities 6 5 Customs duties, import surcharges and excise taxes 42 38
Net contribution to central and local governments 254 352
The above amount contributed excludes the following:Employees’ taxation deducted from remuneration paid 218 172 Net VAT amount collected on behalf of governments 102 160 Withholding taxation 58 25
378 357
Employeecosts52%
Financecosts
4%
Distributions17%
Taxation9%
Retainedprofi ts
9%
Deferredtaxation
2%Depreciation7%
WEALTH REINVESTED
WEALTH DISTRIBUTED
Value Added Statement

ILLOVO SUGAR LIMITED • Annual Report 2011 71
SUSTA
INA
BILITY
Rm * 2011 2010 2009 2008 2007
Consolidated income statementRevenue 6 8 107.9 8 467.9 8 601.7 6 794.1 6 263.6
Operating profi t 6 1 029.3 1 498.6 1 386.2 1 064.5 1 034.3 Net fi nancing costs 95.5 139.0 185.4 171.7 97.8 Profi t before taxation and non-trading items 935.9 1 363.5 1 202.5 894.1 937.9Profi t attributable to ordinary shareholders 546.2 662.0 739.1 599.8 516.5Headline earnings 9 516.1 702.5 741.8 599.6 515.3
Reconciliation of headline earningsProfi t attributable to ordinary shareholders 546.2 662.0 739.1 599.8 516.5Adjusted for: (Profi t)/loss on disposal of property, plant and equipment (10.3) (1.7) 2.7 (0.2) (1.2) (Profi t)/loss on disposal of business (19.8) 27.9 – – – Impairment of investment in agricultural joint venture – 14.3 – – –
Headline earnings 516.1 702.5 741.8 599.6 515.3
Consolidated statement of fi nancial positionProperty, plant and equipment 4 984.5 4 262.7 4 025.9 2 968.1 1 806.3 Intangibles assets 174.0 179.1 61.8 46.4 34.7 Cane roots 1 087.9 1 100.2 1 132.3 821.7 661.6 Investments and loans 163.0 180.8 150.2 90.3 74.2 Current assets 2 678.5 2 579.7 2 894.2 2 336.3 1 891.4 Cash and cash equivalents 717.8 1 345.4 655.6 1 157.9 973.7
Total assets 9 805.7 9 647.9 8 920.0 7 420.7 5 441.9
Equity attributable to shareholders of Illovo Sugar 5 191.2 5 502.6 2 773.8 2 373.3 1 771.7Non-controlling interest 784.1 812.1 671.2 555.6 456.6
Total equity 5 975.3 6 314.7 3 445.0 2 928.9 2 228.3Deferred taxation 687.6 685.8 701.1 639.0 574.3Borrowings 1 230.0 1 132.2 3 066.7 2 326.2 1 245.4Interest-free liabilities 1 912.8 1 515.2 1 707.2 1 526.6 1 393.9
Total equity and liabilities 9 805.7 9 647.9 8 920.0 7 420.7 5 441.9
* Ten-year compound annual growth % 2001 to 2010
Five Year Review

72 Annual Report 2011 • ILLOVO SUGAR LIMITED
ECONOMIC IMPACT continued
Rm Notes 2011 2010 2009 2008 2007
Consolidated statement of cash fl owsOperating profi t before working capital movements 1 132.9 1 419.9 1 173.0 1 034.2 1 041.5Working capital movements 146.3 (183.2) 362.8 46.2 (61.0)
Cash generated from operations 1 279.2 1 236.7 1 535.8 1 080.4 980.5Net fi nancing costs (95.5) (139.0) (185.4) (171.7) (85.2)Taxation paid (186.4) (304.2) (230.3) (151.6) (190.4)Dividend and deferred income 42.1 3.9 1.7 1.3 1.4Distributions/dividends paid (455.9) (490.2) (449.2) (386.9) (334.2)
Net cash infl ows from operating activities 583.5 307.2 672.6 371.5 372.1Investment in future operations (1 274.5) (897.6) (1 711.9) (848.7) (96.0)Replacement of property, plant and equipment (199.8) (181.1) (169.5) (154.9) (124.7)Acquisition of business – (249.9) – – –Proceeds on disposal of businesses 130.9 118.7 120.0 – –Other movements (78.6) (82.6) (38.4) (13.1) 30.4
Net cash outfl ows from investing activities (1 422.0) (1 292.5) (1 799.8) (1 016.7) (190.3)
Net cash (outfl ows)/infl ows before fi nancing activities (838.5) (985.3) (1 127.2) (645.2) 181.8Long-term borrowings (repaid)/raised (366.9) (200.0) 170.6 796.4 (16.4)Short-term borrowings raised/(repaid) 629.9 (1 226.6) 482.0 (64.5) 130.2 (Repurchase)/issue of share capital net of associated costs (26.7) 2 956.7 6.5 6.5 56.1Other fi nancing activities – 255.8 – (0.6) (0.8)
Net cash infl ows from fi nancing activities 236.3 1 785.9 659.1 737.8 169.1
Net (decrease)/increase in cash and cash equivalents (602.2) 800.6 (468.1) 92.6 350.9
Earnings and distribution/dividend per shareEarnings 1 cents 118.8 161.4 210.9 171.7 149.5 Headline earnings 2 cents 112.2 171.2 211.6 171.6 149.1 Distribution/dividend (interim: paid; fi nal: declared) 3 cents 56.0 86.0 106.0 85.5 75.0Distribution/dividend cover on headline earnings 4 times 2.0 2.0 2.0 2.0 2.0
FIVE YEAR REVIEW continued

ILLOVO SUGAR LIMITED • Annual Report 2011 73
SUSTA
INA
BILITY
FIVE YEAR REVIEW continued
Notes 2011 2010 2009 2008 2007
Profi tability and asset managementOperating margin % 12.7 17.7 16.1 15.7 16.5Return on average shareholders’ equity 5 % 10.1 14.8 28.6 29.9 32.0Return on net assets 6 % 13.8 21.9 22.0 24.1 28.5
Return on total assets 7 % 11.1 16.8 17.1 18.6 21.3Working capital per rand of revenue 8 cents 9.8 12.6 11.7 11.8 9.4
Liquidity and borrowings
Net debt : equity ratio 9 8.6 (3.4) 70.0 39.9 12.2 Gearing 10 % 7.9 (3.5) 41.2 28.5 10.9 Total liabilities to total equity 11 % 64.6 53.2 160.5 154.2 144.6 Current ratio 12 times 1.2 1.8 1.0 1.3 1.2 Interest cover 13 times 10.8 10.8 7.5 6.2 10.7
Employee statisticsTotal number of employees at year-end 14 12 159 12 031 12 457 12 266 12 617 Average number of employees 12 189 12 338 12 362 12 441 12 752 Revenue per average number of industrial employees R000 1 275.0 1 251.8 1 249.6 991.9 894.9Net assets per average number of employees R000 490.2 511.8 278.7 235.4 174.7Headline earnings per average number of employees R000 42.3 56.9 60.0 48.2 40.4
JSE Limited statisticsOrdinary shares in issue ‘000 459 763 460 160 350 924 349 859 348 868 Weighted average number of shares ‘000 459 787 410 279 350 514 349 424 345 545 Net asset value per share 15 cents 1 299.6 1 372.3 981.7 837.2 638.7 Total volume of shares traded ‘000 86 462 119 117 79 492 80 160 379 040 Total value of shares traded Rm 2 347.2 3 650.4 2 126.9 1 970.2 7 503.5 Ratio of shares traded to issued shares times 18.8 25.9 22.7 22.9 108.6 Headline earnings yield at year-end 16 % 4.2 5.8 7.4 5.8 7.8 Distribution/dividend yield at year-end 17 % 2.1 2.9 3.7 2.9 3.9 Price: headline earnings ratio at year-end 18 times 23.9 17.3 13.5 17.3 12.7 Market price per share– year-end cents 2 685 2 970 2 849 2 964 1 900 – highest cents 3 270 3 700 3 500 3 115 2 100 – lowest cents 2 420 2 499 1 710 1 850 1 531
Note: Agricultural employees are excluded from the calculation of revenue per average number of employees.
74 Annual Report 2011 • ILLOVO SUGAR LIMITED
ECONOMIC IMPACT continued
1. Earnings per share
Profi t attributable to ordinary shareholders divided by the weighted average number of ordinary shares in issue.
2. Headline earnings per share
Headline earnings divided by the weighted average number of ordinary shares in issue.
3. Distribution/dividend per share
The 2010 and 2011 distribution/dividend per share includes capital distributions out of share premium. For all other years presented, the distributions have been declared and paid out of distributable reserves.
4. Distribution/dividend cover on headline earnings
Headline earnings per share divided by distribution/dividend per share (interim: paid; fi nal: declared).
5. Return on average shareholders’ equity
Profi t attributable to ordinary shareholders expressed as a percentage of average shareholders’ equity.
6. Return on net assets
Operating profi t expressed as a percentage of average net operating assets.
7. Return on total assets
Operating profi t expressed as a percentage of total average assets excluding cash and cash equivalents.
8. Working capital per rand of revenue
Average of inventories and trade and other receivables less trade and other payables, divided by revenue.
9. Net debt:equity ratio
Interest-bearing liabilities (net of cash and cash equivalents) divided by total equity. A negative net debt:equity ratio indicates that the group is in a net cash position.
10. Gearing
Interest-bearing liabilities (net of cash and cash equivalents) expressed as a percentage of total equity and interest-bearing liabilities (net of cash and cash equivalents). A negative gearing ratio indicates that the group is in a net cash position.
11. Total liabilities to total equity
Interest-bearing liabilities and other liabilities expressed as a percentage of total equity.
12. Current ratio
Current assets divided by current liabilities.
13. Interest cover
Operating profi t divided by net fi nancing costs.
14. Total number of employees at year-end
The total number of employees excludes those employed by associate companies.
15. Net asset value per share
Total assets less total liabilities divided by the number of shares in issue.
16. Headline earnings yield at year-end
Headline earnings per share as a percentage of year-end market price.
17. Distribution/dividend yield at year-end
Distribution/dividend per share (interim: paid; fi nal: declared) as a percentage of year-end market price.
18. Price:headline earnings ratio at year-end
Year-end market price divided by headline earnings per share.
19. Change in accounting policy
Where a change of accounting policy is implemented with retrospective application, the previous year is restated but all other years are not restated in the fi ve year review.
Notes to the Five Year Review

ILLOVO SUGAR LIMITED • Annual Report 2011 75
SUSTA
INA
BILITY
LOCAL ECONOMIESIn line with Illovo’s Strategic Intent to be cognisant of the rural locations of its operations and its corporate governance objective of being socially responsible, the group strives to support the advancement of all the communities where its operations are located. Sustainable community development is achieved inter alia through the group’s substantial employment, procurement and supply chain development.
EmploymentIllovo provides considerable employment within the six countries in which it operates, with the group’s aggregate permanent manpower complement as at 31 March 2011 standing at 12 159. This was marginally up on the previous year (2010: 12 031) refl ecting good productivity improvement given the signifi cant expansion projects undertaken in Zambia and Swaziland over the past two years. Vacancies are generally advertised in the country of operation fi rst to ensure precedence to local candidates. External secondees are considered only if sourcing of local candidates proves unsuccessful.
Over and above the permanent complement and given that the group’s operations function largely on a seasonal basis, some additional 17 000 employees are employed in various activities over these periods.
South AfricaDrought conditions in KwaZulu-Natal during the 2010/11 season lead to signifi cantly reduced sugar cane supplies resulting in a decision to temporarily close the Umzimkulu mill for the season. Through consultation with labour unions and management, the group facilitated the placement of all 252 staff employed at the mill within suitable positions, either at Umzimkulu itself, or at alternative Illovo operations. These counter-measures not only prevented retrenchment of employees, but also ensured the retention of quality skills within the group.
ProcurementIllovo actively supports procurement from previously disadvantaged suppliers in South Africa. Spend against these preferential suppliers is registered and reported on an annual basis. Preference is given to those suppliers whose product quality and price meet the procurement and technical requirements of Illovo. In the countries of operation outside South Africa, preference is given to local suppliers, where price and quality meet Illovo’s requirements. In addition, where possible, Illovo is assisting to develop local suppliers. Where local suppliers are not available, through its central purchasing offi ce in South Africa, the group further supports preferential suppliers in South Africa by sourcing products for its operations outside South Africa.
Private grower development and revenueDevelopment programmes for small-scale and medium-scale growers are encouraged by the group, as revenue generated by these growers promotes direct economic development and provides opportunities for further enterprise development within the communities concerned. This assists in poverty alleviation in rural areas and reduces the fi nancial risk of such communities.
In South Africa, several investment grants were allocated to Illovo by the government for small-scale grower development schemes within the group’s cane supply regions. These included the establishment of small-scale grower farms, seed-cane nurseries and the provision of assistance with the procurement of key inputs such as fertiliser and ripeners. In a separate initiative, funding of R60 million from The Standard Bank of South Africa Limited was secured for the ‘Sizanayo’ project which, co-ordinated and implemented by Illovo, local grower bodies and the provincial KwaZulu-Natal government, will assist in the rehabilitation of 2 000 hectares of small-scale grower land and the development of a further 2 000 hectares to sugar cane in the Sezela cane supply region.
Outside South Africa, Illovo initiated various community development farm projects, focused on utilising the value chain to provide opportunities for sustainable development within the communities surrounding Illovo’s operations. The projects aim to develop profi table community-owned cane farms, which in supplying cane to Illovo mills will generate suffi cient income to fi nance necessary community development initiatives. To date, successful community farms have been initiated in Malawi and Zambia. In Swaziland, Illovo is assisting the government of Swaziland with the Lower Usuthu Smallholder Irrigation Project, which is ultimately intended to facilitate the development of 8 000 hectares under cane for small-scale growers. Already in its initial phases of development, the project has created almost 1 500 jobs and is ultimately expected to provide economic benefi ts to 28 000 people.
PERMANENT COMPLEMENT 2011 PERMANENT COMPLEMENT 2010
5 383
1 650
2 012
848
1 017
1 249
5 264
1 695
2 083
717
996
1 276
Malawi Zambia South Africa
Tanzania Swaziland Mozambique
12 159 people 12 031 people

76 Annual Report 2011 • ILLOVO SUGAR LIMITED
Social Impact
HUMAN CAPITALThe group recognises the importance of people in the delivery of its stated goals and objectives. Human resource policies and operational strategies are informed by the business needs of the group’s operating entities with direction from the corporate offi ce. They appropriately include an understanding of national imperatives and relevant legislation in each country of operation and alignment is achieved through the group’s Strategic Intent.
Under-pinning this strategy, and to ensure that the operational strategies are met, is a work ethic of continuous improvement which encourages focused, skilled employees to realise their full potential and to ‘make a difference’ in their areas of operation.
Key areas of human resource focus include workplace safety; best practice benchmarking; targeted manpower succession planning; talent and performance management; the maintenance of collaborative industrial relations; human resource development and business understanding; black economic empowerment (BEE)-linked employment equity and localisation programmes; and the health and welfare of employees and their dependants.
People highlights• 12 159 permanent and some 17 000 seasonal employees, adding value in six
countries of operation
• Safety indicators improved, with a reduction in the group 12-month rolling average Disabling Injury Frequency Rate from 0.57 in 2010 to 0.44 in 2011
• R57 million invested in employee training and development
• Strong focus maintained on talent management and career reviews
• Organisation effectiveness enhanced through right-sized and relevant manpower structures
• Retention of South Africa’s Level 5 Contributor status in terms of the BEE Codes
Labour relationsFor the company, as a multi-national organisation, employee communication is considered an important criterion towards the building of employees’ understanding of the prevailing business context within Illovo. To this end, a group-facilitated Business Understanding Programme is presented to all employees, on an annual basis, promoting an understanding of the prevailing business climate at both the group and operational levels. In 2010/11, approximately 29 200 employees were exposed to this programme.
With diverse and widespread senior management teams operating in several countries, regular communication forums and executive-led site visits are also undertaken. At group and country management team level, formal management forums are held, aimed both at reviewing operational performance and engagement in strategic planning processes.
Illovo complies with internationally recognised labour practices as legislated in the various countries of operation, ensuring that sound employee relations prevail. Freedom of association is acknowledged and where employees have adequate representation, recognition agreements are put into place. Collective bargaining forums, which determine the levels of wage rates and other substantive employment conditions via negotiated collective agreements, are established and supported by existing legislation in all countries of operation. The management of collaborative relationships with unions, along with open communication forums, allow for internal issues to be dealt with effectively. Trade union involvement is a normal part of this process and approximately 84% of permanent employees are unionised.
During the year under review, industrial action was undertaken by seasonal employees at the group’s Maragra operation in Mozambique to protest against a 3% wage deduction for the Mozambique Social Security System, a legal requirement in Mozambique. Management facilitated discussions between the Maputo Provincial Labour Directorate, the Labour Inspectorate, the Manhica District Government, the Labour union, Sindicato Nacionale Des Trabalhadores Da Industria Do Açúcar E Afris SINTIA and the cane cutters. A resolution was reached after three days.

ILLOVO SUGAR LIMITED • Annual Report 2011 77
SUSTA
INA
BILITY
Human resources development and trainingTraining is an important pillar for harnessing the group’s human resource talent and potential. Activities are aimed at satisfying both the current and future business needs in terms of skills supply, whilst also supporting employment equity and localisation initiatives. The group invested approximately R57 million in this area over the period under review, representing 4.6% of group payroll.
Examples of the type of programmes include:
• the implementation of internationally accepted safe working practices and health care programmes;
• the continued development, refi nement and implementation of performance management systems, along with ongoing technical competency training, which are linked to ISO standards, along with individual career-pathing and operational excellence;
• the delivery of group-based management development programmes, aimed at both fi rst-line and upper management; 218 managers having completed these programmes during the reporting period;
• the provision of Illovo bursaries to 31 students, mainly from the engineering discipline, to further their tertiary education in preparation for inclusion into the Management Trainee Programme upon successful completion of their studies. In 2010/11, at any given time, there were 61 graduates progressing through this programme;
• structured formal technical apprenticeships, with 85 employees presently enrolled in such programmes across the group;
• training-related exchange arrangements between Illovo and AB Sugar for Engineer-in-Training students. During 2010/11, four students benefi ted from exposure to sugar operations and training practices in the United Kingdom;
• the leveraging of operational best practice across the group;
• accredited arrangements in South Africa for graduate accountants to continue their chartered accountant studies whilst in full-time employment with the company, through the Training Outside Public Practice programme;
• the encouragement of employees to further their study in fi elds relevant to their positions through a study assistance scheme which is available to all permanent employees; and
• Adult Basic Education and Training (ABET) for employees in need in order to enhance their opportunities to improve personal job competencies and facilitate future career development. This programme in South Africa is aligned with the National Qualifi cation Framework to assist in building formal education qualifi cations.
Organisational effectiveness and talent managementThe staffi ng of all operations within effective organisational structures, with competent personnel, both from an operational and managerial perspective, remains a priority to ensure that the group’s goals and objectives are achieved.
The group continues to focus on talent management and manpower succession planning to develop and retain managerial and technical skills, especially within the group’s identifi ed key disciplines and positions. A structured approach to career reviews informs individual career and performance plans, contributing to both the succession and retention of key personnel, i.e. being an employer of choice.
Remuneration packages are merit-based and market-competitive in all countries of operation and are constantly reviewed. Similarly, incentives such as performance-related bonuses, share purchase and phantom share schemes are utilised and are continually reviewed and up-dated when necessary to cater for targeted outcomes.
Employee turnover has been stable over the past two years, as refl ected in the adjacent chart.
Technical training
Management trainee programmes
Safety and health awareness
Business alignment workshops
Education-type training, e.g. adult basic education programmes
DEVELOPMENT AND TRAINING INVESTMENT – %
R57 million
6022
96 3
Mal
awi
Zam
bia
Sout
h Af
rica
Tanz
ania
Swaz
iland
Moz
ambi
que
7.4
4.23.2
4.35.44.9
6.1
7.3
5.74.6
5.45.6
2011 2010
% EMPLOYEE TURNOVER

78 Annual Report 2011 • ILLOVO SUGAR LIMITED
SOCIAL IMPACT continued
Diversity and equal opportunityIllovo actively promotes equal opportunity and fair treatment in employment through the elimination of unfair discrimination. The group encourages inclusiveness with regard to human resource practices, irrespective of race, gender, nationality or religious affi liation in an effort to promote global diversity in the workforce.
In South Africa, Illovo is committed to contributing to and promoting social transformation, most notably through the continued advancement of broad-based black economic empowerment (B-BBEE) issues. The group submitted the annual Employment Equity and Income Differential reports to the Department of Labour and the Employment Equity Commissioner, which detail progress made with respect to the company’s Employment Equity Plan, a key pillar of its B-BBEE programme. Progress on employment equity continued to be monitored through a group central co-ordinating forum which includes representation from local consultative forums which operate at the various operations.
Relevant statistics in respect of designated employees, as defi ned in South African legislation, are shown in the table below. They generally refl ect a good performance, particularly in the areas of representation in management ranks where designated groups now total 71% (2010: 62%) and internal promotions where these rose to 89% (2010: 71%).
Representative areas % designated2011 2010
Management level 71 62Skilled level 90 90Promotions (management/skilled) 89 71External recruitments (management/skilled) 75 66Promotions (all levels) 95 90External recruitments (all levels) 91 87Combined recruitments and promotions (all levels) 93 88Combined recruitments and promotions (management/ skilled) 82 69Skills development initiatives (permanent employees) 85 88Management trainees 70 75
Overall focus continues to be given to designated appointments in the more senior levels of management.
Relative to the Codes of Good Practice on Black Economic Empowerment (the Codes), issued in terms of the Broad-Based Black Economic Empowerment Act, 2003, for the year ended 31 March 2010, the company was audited by an accredited external verifi cation agency and its rating was re-confi rmed as a Level 5 Contributor, having attained an aggregate score of 60.71% (2009: 59.14%), comprising the component scores as refl ected in the table below:
Element Score (%) Maximumpossible score
2010 2009 (%)
Ownership equity 4.69 6.88 20Management control 2.67 1.72 10Employment equity 8.51 7.26 10Skills development 6.27 5.24 20Preferential procurement 18.57 18.04 20Enterprise development 15.00 15.00 15Socio-economic development 5.00 5.00 5
Aggregate 60.71 59.14 100
This rating earned Illovo a ranking of 87th place overall and 6th place in the Food Sector in the recent Financial Mail/Empowerdex Top Empowerment Companies report in South Africa.
In 2010/11, designated representation in management ranks increased to 71% and to 89% in internal promotions.
The group invested approximatelyR57 million in human resources development and training over the period under review, representing 4.6% of group payroll.

ILLOVO SUGAR LIMITED • Annual Report 2011 79
SUSTA
INA
BILITY
Occupational safetySafety remains a core priority for the group and Illovo is striving to achieve an increasingly safer workplace and cultivate a culture of safety among employees whereby injuries are reduced and safety rules are understood and upheld. The group’s safety policy aims to provide a safe and healthy working environment for all its employees in accordance with the relevant statutory requirements in each country of operation.
The NOSA Integrated Five-Star System covering safety, health and environmental management is implemented at all the cane growing and factory operations. During the year under review, all operations were graded on the NOSA platinum star system, and were accredited with four-star ratings. Two agricultural operations obtained NOSA Platinum fi ve-star ratings.
The Disabling Injury Frequency Rate (DIFR) measurement of safety performance is used at all the group’s operations and is included as one of the ‘line-of-sight’ targets for the group’s performance related bonus scheme. The DIFR for the year under review, on a 12-month rolling average basis, was 0.44, an improvement from the 0.57 achieved last year, and within the group’s objective of being less than 0.8. The Total Injury Frequency Rate (TIFR) was recorded for the fi rst time this year; the group achieving an overall rate of 3.76 against an internal target of less than 5.0.
Disabling Injury Frequency Rate per country of operation
Operation DIFR
Malawi 0.40Zambia 0.48South Africa 0.62Swaziland 0.21Tanzania 0.45Mozambique 0.40
Regrettably, three employees were fatally injured in work-related incidents during the past year. These unfortunate incidents were the subject of thorough executive investigation and appropriate remedial actions were taken.
All the factory operations and the cane growing operations have been certifi cated under the ISO 9001:2008 quality management system. In addition, the Swaziland factory operation, together with the Merebank distillery, attained the environmental management ISO 14001:2004 accreditation, whilst the Merebank and Glendale distilleries each achieved OHSAS 18001:2007 certifi cation for health and safety.
In terms of food safety, the Umzimkulu factory, Noodsberg refi nery and Eston syrup plant in South Africa, and the Nchalo factory in Malawi have been certifi ed under the Hazard Analysis and Critical Control Point (HACCP) food safety system. A number of other factory operations are making progress towards this accreditation. The group also recently embarked on implementation of the all-encompassing ISO 22000 requirements for Illovo’s food safety management plans, and accreditation is anticipated during the course of the current year.
During the year under review, there were no signifi cant health, safety or environmental penalties imposed on any of the group’s operations.
Disabling Injury Frequency Rate
• A disabling injury is one where an employee is booked off-duty for at least one full shift following the shift in which the injury occurred
• The Total Injury Frequency Rate (TIFR) is a measure of the frequency of injuries, regardless of whether the person was able to continue duties or not
For 2010/11, the group Disabling Injury Frequency Rate improved to 0.44 from 0.57 achieved in 2009/10, below Illovo’s objective of less than 0.8.
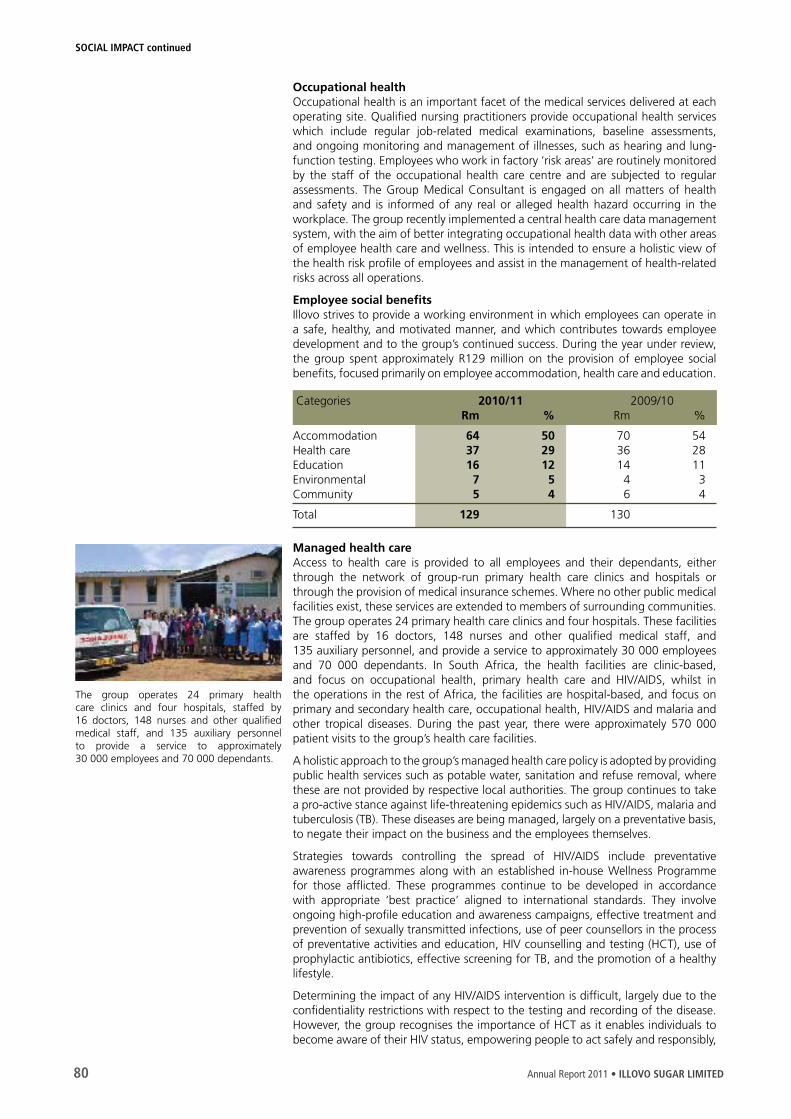
80 Annual Report 2011 • ILLOVO SUGAR LIMITED
Occupational healthOccupational health is an important facet of the medical services delivered at each operating site. Qualifi ed nursing practitioners provide occupational health services which include regular job-related medical examinations, baseline assessments, and ongoing monitoring and management of illnesses, such as hearing and lung-function testing. Employees who work in factory ‘risk areas’ are routinely monitored by the staff of the occupational health care centre and are subjected to regular assessments. The Group Medical Consultant is engaged on all matters of health and safety and is informed of any real or alleged health hazard occurring in the workplace. The group recently implemented a central health care data management system, with the aim of better integrating occupational health data with other areas of employee health care and wellness. This is intended to ensure a holistic view of the health risk profi le of employees and assist in the management of health-related risks across all operations.
Employee social benefi tsIllovo strives to provide a working environment in which employees can operate in a safe, healthy, and motivated manner, and which contributes towards employee development and to the group’s continued success. During the year under review, the group spent approximately R129 million on the provision of employee social benefi ts, focused primarily on employee accommodation, health care and education.
Categories 2010/11 2009/10Rm % Rm %
Accommodation 64 50 70 54Health care 37 29 36 28Education 16 12 14 11 Environmental 7 5 4 3Community 5 4 6 4
Total 129 130
Managed health careAccess to health care is provided to all employees and their dependants, either through the network of group-run primary health care clinics and hospitals or through the provision of medical insurance schemes. Where no other public medical facilities exist, these services are extended to members of surrounding communities. The group operates 24 primary health care clinics and four hospitals. These facilities are staffed by 16 doctors, 148 nurses and other qualifi ed medical staff, and 135 auxiliary personnel, and provide a service to approximately 30 000 employees and 70 000 dependants. In South Africa, the health facilities are clinic-based, and focus on occupational health, primary health care and HIV/AIDS, whilst in the operations in the rest of Africa, the facilities are hospital-based, and focus on primary and secondary health care, occupational health, HIV/AIDS and malaria and other tropical diseases. During the past year, there were approximately 570 000 patient visits to the group’s health care facilities.
A holistic approach to the group’s managed health care policy is adopted by providing public health services such as potable water, sanitation and refuse removal, where these are not provided by respective local authorities. The group continues to take a pro-active stance against life-threatening epidemics such as HIV/AIDS, malaria and tuberculosis (TB). These diseases are being managed, largely on a preventative basis, to negate their impact on the business and the employees themselves.
Strategies towards controlling the spread of HIV/AIDS include preventative awareness programmes along with an established in-house Wellness Programme for those affl icted. These programmes continue to be developed in accordance with appropriate ‘best practice’ aligned to international standards. They involve ongoing high-profi le education and awareness campaigns, effective treatment and prevention of sexually transmitted infections, use of peer counsellors in the process of preventative activities and education, HIV counselling and testing (HCT), use of prophylactic antibiotics, effective screening for TB, and the promotion of a healthy lifestyle.
Determining the impact of any HIV/AIDS intervention is diffi cult, largely due to the confi dentiality restrictions with respect to the testing and recording of the disease. However, the group recognises the importance of HCT as it enables individuals to become aware of their HIV status, empowering people to act safely and responsibly,
SOCIAL IMPACT continued
The group operates 24 primary health care clinics and four hospitals, staffed by 16 doctors, 148 nurses and other qualifi ed medical staff, and 135 auxiliary personnel to provide a service to approximately 30 000 employees and 70 000 dependants.

ILLOVO SUGAR LIMITED • Annual Report 2011 81
SUSTA
INA
BILITY
and is therefore key to controlling the spread of the disease. To this end, the group continues to campaign for employees and their dependants to ‘get to know their status’ and in this regard, has set a target to test 50% of all employees annually. A further target has been set to ensure that at least 50% of HIV positive employees join the Wellness Programme. During the year under review, some 5 748 employees underwent HCT. Excluding those who have been previously tested and identifi ed as HIV positive, this represents 62% of the permanent complement. Of the employees who have tested positive, many have joined the group’s Wellness Programme.
Government interventions relative to the provision of anti-retroviral treatment (ART) are closely monitored in all countries of operation. Where the group is requested to assist in the process, it is particularly important to ascertain the long-term sustainability of intended programmes and the role that the government medical facilities are expected to play:
• in South Africa, formal facilitation partnerships have been developed with those local government hospitals designated as HIV-ART centres, to allow employees and dependants on the Wellness Programme to be bridged into the government ART programme as and when their status for this treatment is medically necessitated; and
• in Malawi, Zambia and Swaziland, the group assists in implementing the government-funded ART programmes at its mill-based medical facilities. Affected employees and dependants in Tanzania and Mozambique are presently being referred to government facilities.
Disease outbreaks are managed proactively by the group in the interest of maintaining both the health and welfare of employees and their dependents.
The group subscribes to the African continent’s recognised ‘Roll Back’ malaria programme, with mosquito control spray programmes and the distribution of insecticide-treated bed nets, being undertaken in the areas affected. This, together with established laboratory testing facilities, enables early detection and prompt commencement of effective treatment. Close liaison is maintained with national malaria control units and in some cases the group’s health centres are recognised sentinel sites for the collation of malaria statistics and research. During 2010/11, Illovo implemented an education/training, counselling, treatment and immunisation programme, in which approximately 12 000 children were immunised in response to an outbreak of measles in Malawi. In the case of TB, the group works closely with national programmes, and assists with the diagnosis, treatment and follow-up of TB cases where appropriate.
AccommodationAccommodation is provided to permanent employees, mostly at the larger estates outside of South Africa, depending on local circumstance and availability. Accommodation varies between hostel dwellings for fi xed-term contract employees, informal villages and formal staff housing. Where accommodation is provided, Illovo supplies all amenities, including potable water and electricity, together with basic maintenance. During 2010/11, R64 million was spent on employee accommodation including the associated amenities.
Educational assistanceAs part of Illovo’s ongoing commitment towards social empowerment, a social investment scheme assists employees with costs associated with dependants’ education. Assistance further includes the allocation of bursaries, grants and loan funding for higher/further education. During the year, R16 million was allocated to education.
Retirement funding schemes In addition to legislated national retirement funds provided in the countries of operation, the group offers membership of a number of provident and defi ned contribution pension funds. Elected employee trustees represent the interests of members and assist with the prudent management of the various funds. The benefi ts associated with the group’s retirement schemes include, inter alia, retirement, death, disability, funeral, critical illness and life insurance provisions and are stipulated within the group’s relevant conditions of employment.
Mosquito control spray programmes and the distribution of insecticide-treated bed nets continue throughout the group in malaria affected areas. During 2010/11, Illovo implemented an education/training, counselling, treatment and immunisation programme in which approximately 12 000 children were immunised in response to a measles outbreak in Malawi.

82 Annual Report 2011 • ILLOVO SUGAR LIMITED
Employee share purchase schemesShare purchase schemes are offered to employees in certain countries where the operating subsidiary company is listed. The share purchase scheme provides employees with the opportunity to share directly in the continued profi tability and growth of the business.
PUBLIC POLICYIn South Africa, uncertainty around land tenure as a result of the delayed land restitution process has discouraged grower reinvestment. Reduced reinvestment has been evident in delayed replant in some areas and reductions in key inputs such as fertiliser, which has contributed to declining cane yields and overall cane supply. 43% of the total area of land supplying cane to Illovo mills is subject to unsettled land claims in terms of the Restitution of Land Rights Act, 1994. To mitigate this potential impact on cane supply, Illovo has a well-established strategy for working with affected growers, land claimants and the government to ensure that farms are transferred in accordance with the terms of the restitution process. Illovo assists industry and government in developing best practice regarding the submission, control and implementation of grant and loan funding for agricultural development under the umbrella of land reform. This is undertaken in close collaboration with the South African Sugar Association, via broad consultation with both millers and growers to expedite grower development with the purpose of ensuring future growth and sustainability of cane supply from claimed properties.
SOCIAL INVESTMENTThe group operates in diverse environments, many of which are predominantly rural, with limited infrastructure and signifi cant development needs. These challenges are most evident in the countries of operation outside South Africa, four of which are classifi ed by the United Nations as Least Developed Countries. In line with the group’s Strategic Intent, as a long-term investor and a major economic partner in these countries, over and above the considerable contribution towards employee social benefi ts, active social investment programmes are in place at each of the operations which aim to promote people-centred, needs-driven activities. The majority of social investments are directed primarily towards education, job creation, health and wellbeing, culture and sports development, and limited once-off grants and donations.
All community projects are considered on the basis that they are motivated by members of the communities and designated company representatives. To gain company support, projects must be shown to be meaningful and sustainable, with signifi cant community reach and participation. Initiatives are managed both at a group and business unit level, depending on the circumstance.
During the year under review, the group contributed R14.4 million towards socio-economic development projects, mostly for the benefi t of the communities within the immediate vicinity of the operations. Initiatives supported during the past year included fi nancing the development of a government-run hospital within the Kilombero community in Tanzania and contributions towards the construction of a new building at the Ubombo Police Station in Swaziland. Other ongoing social investment activity includes:
• upgrading of schools and administration assistance at schools across the group; 27 schools in fi ve countries benefi ting from this support;
• ongoing support of government and corporate education-related campaigns, including national literacy programmes, teacher support initiatives and provision of equipment;
• support of community-based welfare and fund-raising organisations across the group, involving national health initiatives, feeding schemes, upgrading of public facilities and self-help programmes; and
• continued support of local indigenous growers to develop agricultural technical, fi nancial and administrative competence to grow their own businesses, together with assistance to access grant and other funding for agricultural projects, such as irrigation schemes. Total cane supplies from smallholder farmers across the group amounted to about two million tons, generating revenue of R618 million.
Categories Rm
2010/11 2009/10
Health care 3.9 3.5Education 3.3 3.0Donations 1.0 0.7Community 6.2 6.9
TOTAL 14.4 14.1
Social investment spend
SOCIAL IMPACT continued
During the year under review, the group contributed R14.4 million towards socio-economic development initiatives, mostly for the benefi t of the communities within the immediate vicinity of operations, including classroom building projects.

ILLOVO SUGAR LIMITED • Annual Report 2011 83
SUSTA
INA
BILITY
PRODUCT RESPONSIBILITYCustomer health and safetyIllovo complies with all relevant safety, health, environmental and quality legislation in each of the countries of operation as well as striving for implementation of industry best practice. The group’s production facilities have been certifi ed under the ISO 9001:2008 quality management system. Additionally, in South Africa, Illovo has adopted the Hazard Analysis and Critical Control Point (HACCP) SANS 10330:2007 food safety system at its pre-packed sugar and syrup packing facilities. Other operations in South Africa, Malawi and Zambia are currently making progress towards HACCP and ISO 22000 accreditation, with the Nchalo mill in Malawi having achieved HACCP accreditation. In addition, the operations in Malawi and Zambia are registered with the Supplier Ethical Data Exchange (SEDEX), a membership organisation for businesses committed to continuous improvement of the ethical performance of their supply chains.
The group ensures that its products do not pose unintended hazards to health and safety. Certain downstream products require specifi c handling and storage as some products may be considered hazardous. All products are supported with Material Safety Data Sheet (MSDS) documentation, together with certifi cates of analysis. These documents certify quality, in addition to recommended procedures relating to health, safety, storage and handling.
Product and service labellingIllovo ensures that appropriate information is provided to the group’s customers. All products carry product labels describing pertinent information about the product, in compliance with the respective country legislation and labelling regulations. In addition, downstream products supplied to the pharmaceutical industry are required to meet the Food and Drugs Act standards. The requirements of any amendments to food labelling and advertising legislation are promptly addressed, as evidenced by the group’s rapid response to the new food labelling and advertising legislation promulgated in South Africa in March 2010 under the Consumer Protection Act, 2008.
Market communicationsThe group ensures that its marketing communication activities are conducted in a responsible manner and in accordance with the relevant legislation and in-country requirements. Illovo, together with its advertising agencies, subscribe to good marketing practices and the code of responsible advertising, including the communication rules and guidelines as prescribed by the Advertising Association of South Africa. There were no incident reports relating to marketing and communications during the year under review.
Customer support and complaintsIllovo operates a formal customer complaints process in the form of a sugar customer care line facility in South Africa, Malawi and Zambia, details of which are refl ected on all domestic sugar packaging and syrup pre-packs. This affords customers the opportunity to contact Illovo directly to address any issues relating to product and/or service. Customer complaint procedures are implemented in accordance with the guidelines of the HACCP procedural document, which stipulates the manner in which customer complaints are required to be handled and resolved. Industrial customer support is provided by a specialised department, providing valuable assistance to the group’s industrial customers across all countries of operation in respect of quality and technical support. Additional support is supplied through factory visits, presentations and educational workshops. Regular supplier and customer audits are undertaken while customer feedback mechanisms guarantee open communication between Illovo and customers following complaints and investigations. Outside of South Africa, customer complaints are handled directly by the respective marketing departments and distribution companies which distribute sugar within the countries of operation. All customer queries and complaints are investigated and rectifi ed where appropriate.
Illovo complies with all relevant safety, health, environmental and quality legislation in each of the countries of operation, striving for implementation of industry best practice.
84 Annual Report 2011 • ILLOVO SUGAR LIMITED
Environmental Impact
The underlying philosophy of Illovo’s environmental management approach is to continually investigate means to reduce the environmental impact of the group’s operations. This is achieved through both the effi cient use of natural resources and committing the group to continuous improvement.
Illovo complies with country-specifi c environmental legislation and regulations and adheres to international best practice standards, as well as internal operational environmental policies. Environmental management at the operations is carried out in line with the NOSA Integrated Five-Star System, which incorporates environmental management. When considering new business ventures and expansions, due diligence and environmental impact assessments are undertaken to ensure that potential negative environmental impacts are identifi ed and mitigation or management plans implemented.
TECHNOLOGY, RESEARCH AND DEVELOPMENT
In order to optimise the return from existing installed capacity, the group has well-established in-house resources which provide technical expertise in agricultural production and sugar and downstream product manufacture to all operations. A centralised core of expertise exists to ensure technical standards are optimised and maintained for both existing equipment and new agricultural and factory installations, and to keep abreast with technical innovations. This in-house function is also involved in investigating opportunities to expand the group’s operations, and in the planning and implementation of approved projects.
Collaboration with regard to the application of new technology and energy and process performance optimisation between the group’s technical team and AB Sugar is ongoing. This collaboration is expected to benefi t the group in the longer-term.
Benchmarking to improve productivity and reduce unit costs is a major area of attention at all operations, resources having been allocated to enhance operational performance and benchmarking across the group. Illovo is also participating in operational performance benchmarking and best operating practices within the AB Sugar group.
The group benefi ts on an ongoing basis from research and development undertaken by the South African Sugar Milling Research Institute and the South African Sugarcane Research Institute. These organisations are funded by the member sugar industries which are represented on the respective boards of the institutes.
Illovo also has a dedicated team which pursues opportunities for the development and commercialisation of downstream products and new applications. In addition to its own resources, there is ongoing collaboration with both local and international research organisations, and contract work is outsourced when appropriate.
OPERATIONAL ASPECTS
Agriculture In respect of its agricultural operations, the group adopts farming practices based on fi eld conservation guidelines as advocated by the South African Sugarcane Research Institute, so as to ensure agricultural production on a sustainable basis with minimum impact on the environment. This includes the implementation of land use plans when developing new and re-establishing existing cane fi elds; the optimal placement of fi eld and access roads; the most suitable method of fi eld establishment so as to conserve soil and water; the protection of existing environmental features such as rivers, wetlands, catchment areas; and the removal of alien vegetation.
In addition, sugar cane, upon harvesting, immediately recommences another growing cycle from its existing roots. This process called ratooning recurs until the

ILLOVO SUGAR LIMITED • Annual Report 2011 85
SUSTA
INA
BILITY
cane yield of the plant reduces below a predetermined level, whereafter replanting is undertaken. This generally takes place every seven to ten years. The environmental benefi t of this ratooning and replanting process is the signifi cant reduction in the frequency of soil disturbance and the exposure to soil erosion.
Agricultural operations in South Africa are rain-fed, thereby minimising the impact on subterranean water supplies, whilst in the group’s other countries of operation, water for irrigation is supplied from secure water resources such as major rivers, lakes and dams.
The conventional practice of cane burning immediately prior to harvesting is conducted in terms of industry guidelines. The adoption of “green cane harvesting” practices, without burning, takes place where feasible. This has the benefi t of the leaves and the tops of the cane plant being left behind in the harvesting process, providing for moisture retention and nutrients for the soil, and offering potential as a renewable energy source as a feedstock for the sugar factory boilers. The use of the cane leaves and tops as biomass feedstock for the boilers, as a supplement for bagasse, has been successfully integrated into the sugar factory operations in Swaziland and Malawi.
Sugar manufacture The process used for manufacturing sugar from sugar cane provides a unique sustainable advantage with minimal environmental impact. The fi brous residue remaining after the extraction of sucrose from sugar cane, bagasse, may be used as a bio-renewable energy source in sugar factory boilers to generate electricity. This electricity is capable of not only meeting the power requirements of the sugar factory, but may also be used for operating the irrigation systems used for cane growing, and for supplying administrative and domestic users and national grids.
Bagasse is used as a boiler fuel at all Illovo’s sugar factories, and under normal operating conditions, the factories are self-suffi cient in terms of electrical requirements, save that the downstream plant at Sezela relies on power from the national grid. Whilst the factories outside South Africa also supply power for cane irrigation, supplementary electricity supplies are required from external sources, particularly during the factory offcrop maintenance periods. Fortunately, these periods coincide with the rainy seasons, when there is a limited need for irrigation. The recent completion of Ubombo’s major factory expansion and co-generation project in Swaziland has enabled this operation to also export power into Swaziland national grid.
The unique process of utilising bagasse and biomass as an energy source also results in the group having minimal reliance on fossil fuels, such as coal, for its energy requirements. Coal usage within the Illovo group comprises only approximately 4% of total energy usage.
During the year under review, the group’s sources of energy comprised:
Type 2011 2010GWh % GWh %
Bagasse 8 855 88 9 370 88Coal 435 4 520 5Electricity 430 4 360 3Imported steam 168 2 160 2Gas/oil/diesel 152 1 120 1Biomass 68 1 108 1Other sources 1 – 32 –
Total 10 109 10 670
In total, the group used 10.109 GWh of energy for production during the year under review. It is signifi cant that 89% of the group’s energy requirements is produced from renewable energy sources.
In South Africa, Illovo is presently monitoring its compliance with the recently promulgated Air Quality Act and, where necessary, the phased implementation of any new requirements will be undertaken.
(continued on page 88)
The unique process of utilising bagasse and biomass as an energy source also results in the group having minimal reliance on fossil fuels, such as coal, for its energy requirements. Coal usage within the group comprises only approximately 4% of total energy usage.

86 Annual Report 2011 • ILLOVO SUGAR LIMITED
Cane sugar sustainability model
Sugar cane• Sugar cane is a large grass variety which
grows well in tropical and sub-tropical climates across the globe
• Harvesting takes place in the southern hemisphere between April and December when the cane is 12 to 24 months old
• Once harvested, the cane commences a new growing cycle from its existing roots; this re-growth is called a “ratoon”. Replanting takes place only every 7 to 10 years, minimising soil disturbance and exposure to wind and water erosion
• Rainfed cane in South Africa, with industry yields of around 65 tons of cane per hectare, minimises the impact on subterranean water supplies, whilst in other countries of operation, where yields are approximately 100 tons of cane per hectare, water for irrigation is sourced from secure water resources such as large rivers, lakes and dams
Maximum usageThe sugar cane manufacturing cycle makes maximum usage of all its input materials with very few waste products.
• Sugar cane contains between 13% to 15% sucrose which is used in sugar factories to produce granulated brown and refi ned sugar
• Cane fi bre or bagasse, the fi brous residue following the extraction process, is used as a bio-renewable fuel source by the factory boilers to produce steam for processing requirements and to generate electricity to power the factory and other operations:
– at the Sezela downstream plant in South Africa, plant material in the bagasse is extracted to produce low-volume/high-value downstream products. Once processed, the bagasse is routed to the boilers for electricity operations;
– at Illovo’s operations in Swaziland and Malawi, cane trash is blended with bagasse to increase the volume of fuel feedstock for the boilers, thereby providing for increased electricity generation; and
– Illovo’s objective is to be self-suffi cient in its own electricity requirements and, where feasible, to export surplus power into the national grids of the countries in which it operates. In 2010/11, 89% of the group’s power requirements were produced by the group’s own installed electricity generating capacity from renewable resources;
• Water contained in sugar cane amounts to between 68% and 72% of total content. During the extraction process, this water is released and recycled for use within the factory, reducing reliance on external water resources;
• A by-product of the manufacturing process is molasses which is used by Illovo to produce potable and denatured alcohols for use in the cane-based liquor, pharmaceutical, cosmetic and printing industries; and
• Organic and non-organic impurities captured in the form of ‘fi ltercake’ during the manufacturing process are returned to the fi elds for use as a fertiliser.
ENVIRONMENTAL IMPACT continued

ILLOVO SUGAR LIMITED • Annual Report 2011 87
SUSTA
INA
BILITY
Downstream productsDownstream product manufacture is a core activity of Illovo, fulfi lling the group’s Strategic Intent to optimise the return on every stick of cane by adding value to its core commodity products: fi bre, sugar and molasses. The group, out of its downstream production plants in South Africa, is a material player in most of the world markets in which it participates, and exports furfural, furfuryl alcohol, diacetyl, 2.3-pentanedione, natural methanol, ethanol and lactulose to 81 countries. The group has also developed and is commercialising a range of agricultural products derived from furfural. Crop Guard® and MultiGuard Protect® are nematicides. Protect® is a nematicide and fungicide whilst BioMass Sugar® is classifi ed as an organic fertiliser, phytofortifi er or soil improver dependent upon the country-specifi c regulations where it is sold.
Sezela downstream
PRODUCT PRODUCED USES
Furfural Mainly for the production of furfuryl alcohol and in lube oil refi neries as an extractive solvent in the purifi cation of base oils. It is also used for specialist applications such as the manufacture of grinding wheels, friction pellets for brake pads, crucible manufacture, and to a small extent as a fl avour ingredient.
Furfuryl Alcohol Used to produce a resin used in the foundry industry as a polymeric binder for foundry sands. It is also used for wood treatment, to produce acid resistant coatings and certain pharmaceuticals, and as a fl avour ingredient.
Crop Guard®
MultiGuard Protect®
Protect®
Used as an agricultural contact nematicide, at plant and within the growing season.(Developed and marketed by Illovo’s “Agriguard” business as an agricultural chemical under the trade names Crop Guard® in South Africa and MultiGuard Protect® in the USA.)Used prior to plant, as a nematicide and fungicide
BioMass Sugar® Used as phytofortifi ers/soil improvers or as a liquid organic fertiliser
Diacetyl Used as an ingredient in butter fl avourings.
2.3-pentanedione Used as an ingredient in butter fl avourings and as an intermediate in the manufacture of pyrazines.
Natural Methanol Used in the manufacture of natural fl avour ingredients.
* Potable Extra Neutral Alcohol is also produced at the Glendale Distillery on the KwaZulu-Natal north coast** Lactulose, a mild, natural laxative, is produced at Merebank utilising Illovo’s signifi cant fermentation technology expertise
Merebank
PRODUCT PRODUCED USES
EthanolPotable Extra Neutral Alcohol (ENA) – 96.4%*
A very high quality potable alcohol used by liquor industries for the production of branded alcoholic drinks (e.g. canes, vodkas, gins, rums, liqueurs and aperitifs).
Anhydrous Alcohol – 99.9% Used in the pharmaceutical industry to produce pharmaceutical intermediaries and products (e.g. in cough mixtures, alcohol is used to dissolve ingredients not able to be dissolved by water). Also used in surgical spirits, medical disinfectants, and in the production of solvents for use in the printing ink and fl exible packaging industries.
Rectifi ed Extra Neutral Alcohol (REN) – 96.4%
Also has pharmaceutical applications but used mainly in the personal care industry to produce cosmetics, hair care products, toiletries, fragrances and perfumes. In the food industry, it is used to produce fl avours and spirit vinegar which is used in various pickling processes and in the production of condiments (e.g. tomato sauce, chutney, mayonnaise and salad dressings).
Industrial Alcohol – 95% Used in the production of methylated spirits, solvents and thinners.
Lactulose ** Mild, natural laxative.

88 Annual Report 2011 • ILLOVO SUGAR LIMITED
Water comprises approximately 70% of the content of sugar cane. This water is released in the extraction process and recycled for use within the factory operations, thereby minimising the dependence of the factories on external water resources. The water which leaves the factory, representing less than 10% of the original volume, is tested in terms of its quality to ensure that it falls within the group’s waste-water quality parameters, which are themselves adopted from national regulatory standards.
During the year under review, 9 447 tons (2010: 72 500 tons) of non-hazardous waste and 413 tons (2010: 537 tons) of hazardous waste were generated from the group’s operations. Non-hazardous waste generally is released into registered landfi ll facilities, whilst hazardous waste that cannot be recycled is designated for collection by registered waste removal companies for safe disposal.
Downstream As the major by-product of the sugar manufacturing process, molasses is used in several value-added downstream applications. In South Africa generally, the majority of molasses is used as a constituent of animal feeds and by the fermentation industry for the manufacture of ethanol. Illovo utilises a signifi cant portion of its molasses output in the production of ethanol at its Merebank plant in Durban and its Glendale distillery on the KwaZulu-Natal north coast.
At the Sezela complex on the KwaZulu-Natal south coast, various compounds in the bagasse are extracted to produce value-added downstream products, comprising furfural and its derivatives. The residual bagasse from this process is then routed back to the sugar factory boilers for steam and electricity generation.
The fi nal waste water stream from the downstream plant takes the form of dilute acetic acid. A process for treating this waste water stream has been developed and currently treats around 25% of this fi nal stream. The balance is currently discharged under permit from the Department of Water Affairs through an off-shore pipeline.
RENEWABLE ENERGYIllovo proactively monitors and manages energy consumption throughout the group’s operations. During the year under review, around 89% of the energy consumed within the operations was supplied from renewable resources.
Co-generationDry, fi brous bagasse, remaining after the extraction of juice from the crushed stalks of sugar cane, provides Illovo with a substantial renewable energy opportunity. Co-generation utilising bagasse substantially reduces the group’s reliance on electricity from the national grids as well as greenhouse gas emissions. In addition to the use of bagasse, the operations in Swaziland and Malawi augment co-generation capacity by utilising green cane biomass as a boiler feedstock. During 2010/11, the two operations supplemented boiler fuel-feedstock by approximately 33 000 tons of biomass. The group is currently assessing opportunities to increase the co-generation capabilities of all its operations to further decrease the group’s externally-sourced electricity requirements and consequently Illovo’s cost base.
In addition to the environmental and cost benefi ts, co-generation provides a potential source of additional revenue through the export of energy into the national grid. During the year under review, the operation in Swaziland exported 16.5 GWh to the Swaziland national grid, whilst following the commissioning of the new co-generation plant, it is planned to export 55 GWh to the grid over a 48-week period in the current year.
BioethanolAn additional renewable energy opportunity provided by sugar processing is the fermentation of molasses to produce bioethanol. Illovo is currently considering entering the bioethanol market at a number of its operations. The group’s move into the market will depend on commercial viability and on the implementation of facilitatory mechanisms within the various countries of operation. In preparation for such a move, the following steps were undertaken during the year under review:
• the operation in Zambia initiated a feasibility study for the development of biofuel on the estate; and
ENVIRONMENTAL IMPACT continued
Water released in the extraction process is recycled for use within the factory operations, thereby minimising the dependence of the factories on external water sources

ILLOVO SUGAR LIMITED • Annual Report 2011 89
SUSTA
INA
BILITY
• progress on the capital investment in Mali continues, where a greenfi eld cane sugar project would annually produce 200 000 tons of sugar and 15 000 kilolitres of fuel-blend ethanol, while producing suffi cient energy for the agricultural and factory operations, with additional capacity to export power into the national grid.
The production of bioethanol will provide Illovo with the opportunity to further decrease its fossil fuel usage and greenhouse gas emissions, as well as provide an additional revenue stream.
NON-RENEWABLE ENERGYThe largest consumers of coal within the group are the operations in South Africa. During the year under review, approximately 45 000 tons of coal was consumed by these operations, representing around 75% of the group’s coal usage. A broad-scale Performance Optimisation Plan (POP) has been employed to improve energy effi ciencies at an operational level within the South African factories, with the aim of reducing the consumption of purchased electricity and coal.
Specifi c initiatives within the POP undertaken at Illovo’s South African operations during the year under review included:
• the operation of only one of two boilers at the Glendale distillery during the summer season in an attempt to reduce coal consumption;
• the manufacture and use of polyfuel, a heavy hydrocarbon derived from a blend of methanol, ethanol, diacetyl, water, furfural, furyl methyle ketone, 5-methyl furfural and acetic acid, as a supplementary fuel in Sezela’s boilers;
• energy mass balance assessments of the Sezela and Noodsberg mills in order to maximise factory modifi cation and monitor energy reduction equipment performance; and
• the installation of a thermal compressor at Noodsberg; initial mass balance calculations refl ecting savings of around six tons of high pressure steam per hour, equating to a coal saving of 0.82 tons per hour.
AGRICULTURE AND BIODIVERSITYThe management of the natural areas surrounding and within the group’s operations is extremely important due to the high conservation status of such areas at a number of Illovo’s operations. Illovo is cognisant of the group’s potential impacts on these areas and supports a number of initiatives to preserve ecosystem integrity. Nature conservation areas supported by the group, either fi nancially, managerially or through the donation of land, include:
• Mhlongsinga Nature Reserve at Ubombo in Swaziland: Illovo manages the 1 000 hectare game reserve which forms part of a greater 10 000 hectare conservancy combining national, private and community-owned reserves;
• Nyala Park at Nchalo Estate in Malawi: Situated on the border of Nchalo Estate, the Illovo-owned private game reserve, Nyala Park, is 300 km² in extent and is rated as being one of the best managed protected areas in Malawi;
• Mwanachingwala Conservation Area at Nakambala in Zambia: This conservation area is situated on the border of the Nakambala Estate, within the Kafue Flats. Illovo donated land towards the establishment of the area to ensure the protection of the RAMSAR-listed Kafue Flats; and
• Magombera Forest at Kilombero in Tanzania: Magombera Forest is an area of low-lying tropical forest with signifi cant biodiversity value on the southern boundary of the Kilombero Estate. Illovo withdrew expansion plans originally intended for the area in light of the forest’s biodiversity value and is attempting to negotiate with the Tanzanian authorities to lease the Magombera Forest land for conservation management.
Additionally, the group supports the Malawian Government Reforestation Initiative aimed at rehabilitating the Shire Valley through the cultivation of indigenous trees and woodlots. The cultivation of Eucalypt woodlots is promoted in an effort to reduce the harvesting of indigenous trees for fi rewood and charcoal production, a serious threat to Malawi’s natural environment. Approximately 6 000 trees are planted annually by Illovo. Indigenous tree seedlings were also donated by the company to individuals and conservation organisations for planting.

90 Annual Report 2011 • ILLOVO SUGAR LIMITED
Annual fi nancial statementsfor the year ended 31 March 2011
Approval of annual fi nancial statements 91
Lodgement of returns with the Registrar of Companies 91
Independent Auditors’ Report 92
Directors’ Report 93
Audit Committee Report 98
Income statements 100
Statements of fi nancial position 101
Statements of cash fl ows 102
Statements of comprehensive income 105
Statements of changes in equity 106
Notes to the fi nancial statements 108

ILLOVO SUGAR LIMITED • Annual Report 2011 91
FINA
NC
IAL STA
TEMEN
TS
Approval of annual fi nancial statements
The directors of Illovo Sugar Limited are responsible for overseeing the preparation and the integrity of the annual fi nancial statements of the group and the company and the objectivity of other information presented in this report.
In order to fulfi l this responsibility, the group maintains internal accounting and administrative control systems designed to provide assurance that assets are safeguarded and that transactions are executed and recorded in accordance with the group’s policies and procedures.
The annual fi nancial statements, prepared in terms of International Financial Reporting Standards and the Companies Act, 1973, as amended, are examined by independent auditors in conformity with International Standards on Auditing.
An audit committee of the board of directors, chaired by a non-executive, independent director, meets periodically with the auditors and management to discuss internal accounting controls and auditing and fi nancial reporting matters. The auditors have unrestricted access to the Audit Committee.
The annual fi nancial statements of the group and the company which were prepared on the going concern basis, including the Directors’ Report and the Audit Committee Report, and which appear on pages 93 to 144, were approved by the board of directors on 27 May 2011 and are signed on its behalf by:
R A Williams G J ClarkChairman Managing Director
Lodgement of returnswith the Registrar of Companies
I hereby certify that for the year ended 31 March 2011, the company has lodged with the Registrar of Companies all such returns as are required of a public company in terms of the Companies Act, 1973, as amended, and that all such returns are true, correct and up-to-date.
G D KnoxCompany Secretary
Mount Edgecombe27 May 2011

92 Annual Report 2011 • ILLOVO SUGAR LIMITED
Report on the fi nancial statementsWe have audited the annual fi nancial statements and group annual fi nancial statements of Illovo Sugar Limited, which comprise the Directors’ Report, the Audit Committee Report, the income statement and consolidated income statement, the statement of fi nancial position and consolidated statement of fi nancial position at 31 March 2011, the statement of cash fl ows and consolidated statement of cash fl ows, the statement of changes in equity and consolidated statement of changes in equity for the year then ended, and a summary of signifi cant accounting policies and other explanatory notes, as set out on pages 93 to 144.
Directors’ responsibility for the fi nancial statementsThe directors are responsible for the preparation and fair presentation of these fi nancial statements in accordance with International Financial Reporting Standards and in the manner required by the Companies Act, 1973, as amended, and for such internal control as the directors determine is necessary to enable the preparation of fi nancial statements that are free from material misstatement, whether due to fraud or error.
Auditors’ responsibilityOur responsibility is to express an opinion on these fi nancial statements based on our audit. We conducted our audit in accordance with International Standards on Auditing. Those standards require that we comply with ethical requirements and plan and perform the audit to obtain reasonable assurance whether the fi nancial statements are free from material misstatement.
An audit involves performing procedures to obtain audit evidence about the amounts and disclosures in the fi nancial statements. The procedures selected depend on the auditors’ judgement, including the assessment of the risks of material misstatement of the fi nancial statements, whether due to fraud or error. In making those risk assessments, the auditors consider internal control relevant to the entity’s preparation and fair presentation of the fi nancial statements in order to design audit procedures that are appropriate in the circumstances, but not for the purpose of expressing an opinion on the effectiveness of the entity’s internal control. An audit also includes evaluating the appropriateness of accounting policies used and the reasonableness of accounting estimates made by the directors, as well as evaluating the overall presentation of the fi nancial statements.
We believe that the audit evidence we have obtained is suffi cient and appropriate to provide a basis for our audit opinion.
OpinionIn our opinion, the fi nancial statements present fairly, in all material respects, the fi nancial position of the company and the group at 31 March 2011, and their fi nancial performance and their cash fl ows for the year then ended in accordance with International Financial Reporting Standards, and in the manner required by the Companies Act, 1973, as amended.
Deloitte & ToucheRegistered Auditors
Per C A SagarPartner
Mount Edgecombe27 May 2011
2 Pencarrow Crescent, Pencarrow Park, La Lucia Ridge Offi ce Estate, La Lucia
National Executive: GG Gelink (Chief Executive); AE Swiegers (Chief Operating Offi cer); GM Pinnock (Audit); DL Kennedy (Risk Advisory); NB Kader (Tax & Legal Services); L Geeringh (Consulting); L Bam (Corporate Finance); JK Mazzacco (Human Resources); CR Beukman (Finance); TJ Brown (Clients), NT Mtoba (Chairman of the Board); MJ Comber (Deputy Chairman of the Board).
Regional Leader: GC Brazier
Independent Auditors’ Reportto the members of Illovo Sugar Limited

FINA
NC
IAL STA
TEMEN
TS
ILLOVO SUGAR LIMITED • Annual Report 2011 93
The directors have pleasure in presenting their report which forms part of the annual fi nancial statements of the company and the group, for the year ended 31 March 2011.
Nature of businessThe nature of business of the company and its subsidiaries is fully described under the Business Overview section of this report; pages 2 to 11.
Review of operationsDetailed commentary is given under the Commentaries section of this report; pages 22 to 47.
Acquisitions and disposalsDuring the year under review:
• with effect from 1 April 2010, the company’s South African business was transferred, as a going concern, to a wholly-owned subsidiary, Illovo Sugar (South Africa) Limited (Illovo SA);
• the group increased its shareholding in Maragra Açúcar SA, in Mozambique, from 74.1% to 90.0%; and
• Illovo SA disposed of its investment in Castaneous Trading 38 (Pty) Limited, a property-holding company, with agricultural land holdings on the north coast of KwaZulu-Natal.
Share capitalFull details of the current authorised and issued share capital are set out in note 24 to the fi nancial statements on page 129.
During the year under review, the issued ordinary share capital of the company decreased by 396 281 shares to 459 763 357 shares as a result of:
• the company purchasing 968 105 shares from shareholders in terms of odd-lot and specifi c offers made to the relevant shareholders on 22 June 2010; and
• options being exercised in respect of 571 824 shares in terms of the Illovo Sugar 1992 Share Option Scheme.
ShareholdersAn analysis of shareholders and their shareholdings is given on page 145.
Pursuant to the provisions of Section 140A of the Companies Act, 1973, as amended, an analysis of the relevant disclosures by nominee shareholders as at 31 March 2011 revealed three benefi cial shareholdings equal to or exceeding 5% of the issued ordinary share capital. Details are given on page 145.
Illovo Sugar 1992 Share Option SchemeDuring the fi nancial year ended 31 March 2006, the introduction of the Illovo Sugar Phantom Share Scheme, which is more fully explained on pages 94 and 95, replaced the further granting of share options in terms of the Illovo Sugar 1992 Share Option Scheme (the option scheme). The option scheme, however, although closed, continues to operate relative to share options previously granted.
The Remuneration/Nomination Committee previously approved the granting of all share options in terms of the option scheme. Vesting periods for the share options are one-third after three years, two-thirds after four years, and the full allocation after fi ve years, with the maximum period for the exercising of options being ten years. In terms of the rules of the option scheme, all share options were granted at the closing market price of the shares on the JSE Limited on the trading day immediately preceding the day on which the relevant options were granted.
As approved at the annual general meeting of shareholders held on 17 July 2002, a total of 33 000 000 ordinary shares were reserved and placed under the control of the directors for the purpose of the option scheme.
Options granted to executive directors and senior managers as at 31 March 2011 comprise:
Number of shares
Options granted and unexpired as at 1 April 2010 27 805 900Less: Options forfeited during the year under review (68 900)
Options granted and unexpired as at 31 March 2011 27 737 000
Directors’ Report
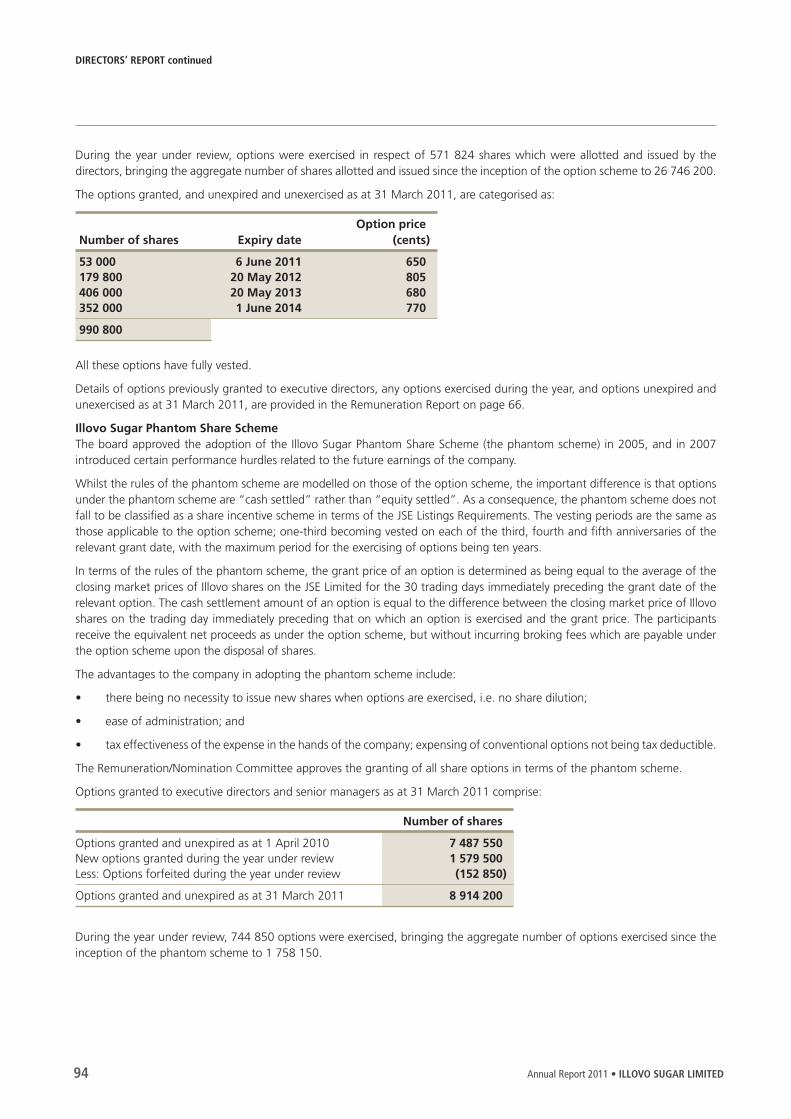
94 Annual Report 2011 • ILLOVO SUGAR LIMITED
DIRECTORS’ REPORT continued
During the year under review, options were exercised in respect of 571 824 shares which were allotted and issued by the directors, bringing the aggregate number of shares allotted and issued since the inception of the option scheme to 26 746 200.
The options granted, and unexpired and unexercised as at 31 March 2011, are categorised as:
Number of shares Expiry dateOption price
(cents)
53 000 6 June 2011 650179 800 20 May 2012 805406 000 20 May 2013 680352 000 1 June 2014 770
990 800
All these options have fully vested.
Details of options previously granted to executive directors, any options exercised during the year, and options unexpired and unexercised as at 31 March 2011, are provided in the Remuneration Report on page 66.
Illovo Sugar Phantom Share SchemeThe board approved the adoption of the Illovo Sugar Phantom Share Scheme (the phantom scheme) in 2005, and in 2007 introduced certain performance hurdles related to the future earnings of the company.
Whilst the rules of the phantom scheme are modelled on those of the option scheme, the important difference is that options under the phantom scheme are “cash settled” rather than “equity settled”. As a consequence, the phantom scheme does not fall to be classifi ed as a share incentive scheme in terms of the JSE Listings Requirements. The vesting periods are the same as those applicable to the option scheme; one-third becoming vested on each of the third, fourth and fi fth anniversaries of the relevant grant date, with the maximum period for the exercising of options being ten years.
In terms of the rules of the phantom scheme, the grant price of an option is determined as being equal to the average of the closing market prices of Illovo shares on the JSE Limited for the 30 trading days immediately preceding the grant date of the relevant option. The cash settlement amount of an option is equal to the difference between the closing market price of Illovo shares on the trading day immediately preceding that on which an option is exercised and the grant price. The participants receive the equivalent net proceeds as under the option scheme, but without incurring broking fees which are payable under the option scheme upon the disposal of shares.
The advantages to the company in adopting the phantom scheme include:
• there being no necessity to issue new shares when options are exercised, i.e. no share dilution;
• ease of administration; and
• tax effectiveness of the expense in the hands of the company; expensing of conventional options not being tax deductible.
The Remuneration/Nomination Committee approves the granting of all share options in terms of the phantom scheme.
Options granted to executive directors and senior managers as at 31 March 2011 comprise:
Number of shares
Options granted and unexpired as at 1 April 2010 7 487 550New options granted during the year under review 1 579 500Less: Options forfeited during the year under review (152 850)
Options granted and unexpired as at 31 March 2011 8 914 200
During the year under review, 744 850 options were exercised, bringing the aggregate number of options exercised since the inception of the phantom scheme to 1 758 150.

ILLOVO SUGAR LIMITED • Annual Report 2011 95
FINA
NC
IAL STA
TEMEN
TS
The options granted, and unexpired and unexercised as at 31 March 2011 are categorised as:
Number of shares Expiry dateOption price
(cents)
627 950 12 July 2015 829578 200 29 October 2016 1 634961 400 23 July 2017 2 3641 316 000 9 July 2018 2 8672 128 000 13 July 2019 2 8081 544 500 20 July 2020 2 856
7 156 050
Details of options granted to executive directors, any options exercised during the year, and options unexpired and unexercised as at 31 March 2011, are provided in the Remuneration Report on page 67.
Illovo Sugar Employees’ Share Purchase SchemeThe Illovo Sugar Employees’ Share Purchase Scheme (the purchase scheme) was established in 1996 to give employees the opportunity of sharing directly in the profi tability and growth of the company by assisting them to acquire shares in the company. Subject to exchange control regulations, the purchase scheme is available to all permanent employees, except directors and those employees who are participants in the option scheme or the phantom scheme.
Any contribution made by an employee for the purchase of shares is enhanced by a 10% company contribution, and the company pays for any trading costs. Either by means of regular salary deductions or once-off payments, employees may acquire up to 5 000 shares in the aggregate and 1 000 shares in a continuous 12-month period.
The purchase scheme is administered by a trust, the trustees of which are appointed by the board.
During the year under review, the trustees of the purchase scheme undertook net purchases of 19 256 shares in the company, thereby increasing the total number of shares held to 160 466. Of these shares, which are all registered in the name of the trustees, 160 431 are held on behalf of 470 participants. All such shares have been fully paid for by the participants.
A similar purchase scheme is operated in Malawi in respect of shares in Illovo Sugar (Malawi) Limited.
Capital distributionsAn interim capital distribution (Number 38) of 22.0 cents per share was declared on 17 November 2010, and a fi nal capital distribution (Number 39) of 34.0 cents per share was declared on 27 May 2011, making the total distribution for the year 56.0 cents per share.
In respect of the fi nal capital distribution declared on 27 May 2011, and pursuant to the requirements of Section 46 of the Companies Act, 2008, as amended, after due consideration, the board concluded that the company would satisfy the relevant solvency and liquidity test immediately after completing the proposed distribution.
The interim capital distribution was paid on 10 January 2011 and the fi nal capital distribution will be paid on 11 July 2011.
Subsidiary companiesThe names and fi nancial information concerning the subsidiaries of the company are set out in note 14 to the fi nancial statements on pages 124 and 125.
Directorate and secretaryThe names of the directors in offi ce at the date of this report are set out on pages 12 and 13 of this report, whilst the name of the company secretary along with the company’s business and postal addresses are set out on the inside of the back cover.
Messrs B P Connellan and M J Shaw retired as directors at the annual general meeting held on 21 July 2010.
Ms K Zarnack has resigned as Financial Director with effect from 31 May 2011, and she will be succeeded by Mr M Abdool-Samad, effective 1 September 2011.
Mr R A Williams, having attained the age of 70, will retire as a director and Chairman of the company at the forthcoming annual general meeting, from which date Mr D G MacLeod, who is currently Deputy Chairman, will succeed Mr Williams as Chairman of the company.
As Mr MacLeod retired as chief executive of the Illovo group on 1 April 2009, and therefore a period of three years will not have elapsed prior to his appointment as Chairman, in compliance with the JSE Listings Requirements and in accordance with the King Code of Governance for South Africa 2009 (the King III Code), Mr M J Hankinson will be appointed lead independent director of the company from the date of the annual general meeting.

96 Annual Report 2011 • ILLOVO SUGAR LIMITED
DIRECTORS’ REPORT continued
As a consequence of and at the same time of Mr MacLeod’s appointment as Chairman of the company, Mr R N Pike will replace Mr MacLeod as chairman of the Risk Management Committee.
In terms of the company’s articles of association, Dr M I Carr and Messrs G J Clark, P A Lister, L W Riddle and B M Stuart retire by rotation at the forthcoming annual general meeting. All these directors are eligible and offer themselves for re-election.
The Remuneration/Nomination Committee having conducted an assessment of and being satisfi ed with the performance of each of the retiring directors, the board, having accepted the recommendation of this Committee, recommends the re-election of these directors to shareholders.
The executive directors, including those proposed for re-election, are employed in terms of appointment letters, with notice periods of not more than three months.
The benefi cial interests of the directors holding offi ce at the end of the year under review in the issued ordinary share capital of the company as at 31 March 2011 were as follows:
2011 2010Direct Indirect Direct Indirect
Clark G J 100 000 100 000Hankinson M J 3 925 3 925MacLeod D G 450 000 450 000Stuart B M 80 000 80 000Williams R A 18 223 3 479 18 223 3 479
652 148 3 479 652 148 3 479
Total 655 627 655 627
No non-benefi cial interests were held by any of the directors.
There have been no changes in the above interests since the end of the year under review.
The register of interests of directors in the shares of the company is available for inspection at the registered offi ce.
Directors’ remunerationAt the forthcoming annual general meeting:
• with due regard to the King III Code, shareholders will be requested to pass a non-binding advisory vote, approving the company’s remuneration policy; and
• pursuant to the requirements of Section 66(9) of the Companies Act, 2008, as amended, shareholders will be requested to pass a special resolution to approve increases in the fees payable to non-executive directors with effect from 1 April 2011 as follows:
Rands per annumCurrent Proposed
BoardChairman* 1 930 000 2 065 000Deputy Chairman*# 1 275 000 1 365 000Other members 190 000 205 000
Audit CommitteeChairman 145 000 175 000Other members 80 000 85 000
Remuneration/Nomination CommitteeChairman 115 000 125 000Other members 80 000 85 000
Risk Management CommitteeChairman‡ 90 000 100 000Other members 70 000 75 000
* Fees inclusive of committee membership fees and payable monthly in arrears. All other fees are paid quarterly in arrears.# This position will fall away upon Mr D G MacLeod succeeding Mr R A Williams as Chairman of the company.‡ This fee has not been paid to the current chairman of the Risk Management Committee, Mr D G MacLeod, due to the inclusive nature of his Deputy
Chairman’s fee.
ILLOVO SUGAR LIMITED • Annual Report 2011 97
FINA
NC
IAL STA
TEMEN
TSFIN
AN
CIA
L STATEM
ENTS
Given the generally high level of attendance at meetings, the board does not consider it appropriate for non-executive directors’ fees to comprise a meeting attendance fee as well as a base fee.
Having taken appropriate advice, the directors are of the view that Section 66(9) does not apply to the remuneration of the executive directors.
Audit CommitteeAt the forthcoming annual general meeting, pursuant to the requirements of Section 94(2) of the Companies Act, 2008, as amended, shareholders will be requested to pass on ordinary resolution appointing the members of the Audit Committee, as indicated on page 12 of this report, but excluding Mr R A Williams who will retire at that meeting, until the next annual general meeting.
Financial assistance to related or inter-related companies or other legal entitiesAt the forthcoming annual general meeting, pursuant to the requirements of Section 45 of the Companies Act, 2008, as amended, shareholders will be requested to pass a special resolution authorising the directors, by way of a general authority, to allow the company to provide direct or indirect fi nancial assistance to any company or other legal entity which is related or inter-related to the company, subject to the relevant provisions of Section 45.
Holding companyABF Overseas Limited is the holding company of Illovo Sugar Limited with a 51.5% interest in its issued share capital. ABF Overseas Limited is a wholly-owned subsidiary of Associated British Foods plc which is therefore the ultimate holding company of Illovo Sugar Limited. Associated British Foods plc is listed on the London Stock Exchange.
AuditorsAt the forthcoming annual general meeting, pursuant to the requirements of Section 90(1), read with Section 61(8)(c) of the Companies Act, 2008, as amended, shareholders will be requested to pass an ordinary resolution re-appointing Deloitte & Touche as the company’s independent registered auditors for the fi nancial year ending 31 March 2012.
Special resolutions passed by subsidiary companiesNo special resolutions were passed by any subsidiary companies during the year under review.
Subsequent eventsThere have been no material changes in the affairs or fi nancial position of the company and its subsidiaries since the end of the period under review.

98 Annual Report 2011 • ILLOVO SUGAR LIMITED
Audit Committee Report
This report incorporates the requirements of the statutory responsibilities of audit committees, as contained in Section 270A of the Companies Act, 1973, as amended (the 1973 Act), which was applicable as at the fi nancial year-end of the company, and, to the extent relevant, such responsibilities as contained in Section 94 of the Companies Act, 2008, as amended (the 2008 Act), which came into effect on 1 May 2011.
Composition of the CommitteeIn terms of its terms of reference, the group Audit Committee comprises at least three non-executive, independent directors, who are required to have the necessary fi nancial expertise in order to properly assist and advise the Committee in the execution of its duties.
For the year under review, the Committee initially comprised fi ve non-executive, independent directors, reducing to four upon the retirement of Mr M J Shaw on 21 July 2010. The members of the Committee, appointed by the board for the year ending 31 March 2012 in terms of Section 269A(1) of the 1973 Act, are indicated on page 12 of this report.
In terms of Section 94 of the 2008 Act, which requires that a public company must elect an audit committee at each annual general meeting, it is proposed in the notice of meeting for the forthcoming annual general meeting of the company, that Dr D Konar, Messrs M J Hankinson and T S Munday, and Mrs C W N Molope be appointed as members of the Audit Committee, until the next annual general meeting.
In addition, Mr D G MacLeod and one of the non-executive directors nominated by the holding company, Mr R N Pike, being precluded from membership in terms of the Section 269A of the 1973 Act and Section 94(4) of the 2008 Act, attend the meetings of the Committee on a regular basis.
The Committee is chaired by Dr D Konar.
The chairman of the Committee is available at annual general meetings.
MeetingsThe Committee has three regular meetings a year which are also attended by the independent and internal auditors, the two non-executive directors identifi ed above, and appropriate members of executive and senior management. In the past year, three meetings were held, attendance at which is refl ected in a table on page 59 of this report.
Terms of referenceThe Committee has formal terms of reference approved by the board. The main objectives of the Committee, as incorporated in the terms of reference and applicable for the year ended 31 March 2011, include:
• promoting the overall effectiveness of corporate governance within the Illovo group;
• acting as an effective means of communication between the board, and the independent auditors and the internal auditors;
• satisfying the board that adequate internal and fi nancial controls are in place, and that material fi nancial risks have been identifi ed and are being effectively managed and monitored; and
• assessing the impact of the general control environment on the statutory audit, and reporting to management any areas of perceived control weaknesses.
Pursuant to satisfying these objectives, the Committee’s responsibilities, as also incorporated in the terms of reference, include:
• the review and approval of the scope of independent and internal audits;
• the review of the level of effectiveness of both the independent and internal auditors;
• the review and approval of the internal audit charter;
• in conjunction with executive management, the consideration of the appointment of the group internal audit manager;
• being satisfi ed with the performance of the internal audit function;
• recommending the appointment of the independent auditors to the board for approval by the shareholders, and approving their remuneration;
• establishing a policy in respect of and approving the extent of non-audit services undertaken by the independent auditors;
• the review of reports from both the independent and internal auditors, including management’s responses thereto;
• assessing the effectiveness of internal policies and procedures;
• ensuring that all material fi nancial risks are identifi ed, assessed, monitored and managed;

ILLOVO SUGAR LIMITED • Annual Report 2011 99
FINA
NC
IAL STA
TEMEN
TS
• being satisfi ed that no material breakdown in internal controls occurs;
• considering the company’s accounting policies and reviewing their compliance with International Financial Reporting Standards and other relevant regulatory requirements;
• the review of and recording going concern assumptions;
• the review of the company’s interim reports, results announcements, and annual reports;
• being satisfi ed that management suitably addresses information technology risks and information security;
• being satisfi ed that the company complies with the JSE’s Listings Requirements; and
• receiving and dealing with any complaints relating to accounting practices, independent and internal audits, and the content or auditing of fi nancial statements or any related matter.
For the year under review, the Committee satisfi ed its responsibilities in compliance with its terms of reference.
AccessThe independent and internal auditors have unrestricted access to the Committee and the chairman of the Committee.
Statutory dutiesPursuant to the requirements of Section 270(A) of the 1973 Act, for the year under review, the Committee:
• confi rmed the appointment of both Deloitte & Touche as the independent auditors and Mr C A Sagar as the registered auditor responsible for the audit;
• satisfi ed itself that the independent auditors were independent of the company;
• agreed the terms of engagement of and determined the fees payable to the independent auditors;
• ensured that the appointment of the independent auditors and the registered auditor complied with the provisions of the 1973 Act;
• pre-approved the non-audit services provided by the independent auditors, in terms of a policy in this regard previously adopted by the Committee;
• noted that it had not received any complaints, either from within or outside the company, relating either to the accounting practices, the independent and internal audits of the company, or to the content or auditing of its fi nancial statements or any related matter; and
• performed its other functions as determined by the board in terms of its terms of reference.
Pursuant to the requirements of Section 61 of the 2008 Act, requiring that shareholders approve the appointment of the independent auditors on an annual basis, the Committee has recommended to the board, which in turn has recommended to the shareholders, for consideration at the forthcoming annual general meeting, that Deloitte & Touche be appointed as the company’s independent registered auditors for the year ending 31 March 2012.
Regulatory requirementsPursuant to the provisions of the JSE’s Listings Requirements, the Committee:
• confi rmed that it had previously adopted a policy with regard to non-audit services provided by the independent auditors;
• satisfi ed itself of the appropriateness of the expertise and experience of the Financial Director, Ms K Zarnack; and
• satisfi ed itself that the appointed independent auditors and registered auditor were duly accredited as such on the JSE’s list of auditors.
Corporate Governance requirementsPursuant to the King Code of Governance for South Africa 2009, and based on specifi c procedures performed by the independent auditors, the Committee satisfi ed itself with the expertise, resources and experience of the company’s fi nance function.
Annual fi nancial statementsHaving reviewed the audited annual fi nancial statements included in the annual report, particularly to ensure that disclosure was adequate and fair presentation had been achieved, the Committee has recommended the approval of the annual fi nancial statements by the board.
On behalf of the Audit Committee
Dr D KonarAudit Committee Chairman
27 May 2011

100 Annual Report 2011 • ILLOVO SUGAR LIMITED
Income statements for the year ended 31 March 2011
Group Company
Notes
March2011
Rm
March2010
Rm
March2011
Rm
March2010
Rm
Revenue 4 8 107.9 8 467.9 5.6 3 355.5 Cost of sales 5 312.9 5 313.9 10.6 2 769.5
Gross profi t 2 795.0 3 154.0 (5.0) 586.0Distribution expenses 631.4 596.7 – 196.3Administrative expenses 829.6 787.1 77.3 235.7 Other operating expenses/(income) 304.7 271.6 (9.1) (27.9)
Operating profi t 5 1 029.3 1 498.6 (73.2) 181.9Dividend income 2.1 3.9 139.7 209.0 Net fi nancing costs/(income) 6 95.5 139.0 (87.7) 49.0
Interest paid 117.9 293.4 32.0 87.7 Interest received (25.0) (30.5) (114.6) (46.3) Foreign exchange losses/(gains) 2.6 (123.9) (5.1) 7.6
Profi t before taxation and non-trading items 935.9 1 363.5 154.2 341.9Share of loss from associates 16 (3.6) (8.4)Material items 7 30.2 (52.4) 0.1 (40.0)
Profi t before taxation 962.5 1 302.7 154.3 301.9 Taxation 8 248.6 411.5 2.5 62.9
Profi t for the year 713.9 891.2 151.8 239.0
Attributable to:Shareholders of Illovo Sugar Limited 546.2 662.0 151.8 239.0Non-controlling interest 167.7 229.2
713.9 891.2 151.8 239.0
Earnings per share (cents)*Basic 118.8 161.4 Diluted 118.6 160.9
* See note 10 for headline earnings per share

ILLOVO SUGAR LIMITED • Annual Report 2011 101
FINA
NC
IAL STA
TEMEN
TS
Statements of fi nancial positionat 31 March 2011
Group Company
Notes
March2011
Rm
March2010
Rm
March2011
Rm
March2010
Rm
ASSETS Non-current assets 6 440.3 5 750.9 2 764.9 2 930.1
Property, plant and equipment 11 4 984.5 4 262.7 18.3 544.2 Cane roots 12 1 087.9 1 100.2 – 103.1 Intangible assets 13 174.0 179.1 76.3 72.9 Investment in subsidiaries 14 2 631.3 2 131.8 Investment in joint ventures 15 – 0.6 Investment in associates 16 34.8 38.3 – 45.0 Investments 17 6.9 8.0 1.6 1.6 Loans 18 121.3 134.5 13.1 30.9 Deferred taxation asset 30 30.9 28.1 24.3 –
Current assets 3 396.3 3 925.1 1 736.4 2 035.2
Inventories 19 525.0 457.4 10.7 107.3 Growing cane 20 1 155.8 1 260.7 – 114.2 Trade and other receivables 21 768.5 639.0 61.6 383.4 Factory overhaul costs 22 214.1 221.7 – 82.0 Derivative fi nancial instruments 23 15.1 0.9 12.7 –Amounts due by subsidiaries 14 1 406.3 471.8 Cash and cash equivalents 717.8 1 345.4 245.1 876.5
Total assets 9 836.6 9 676.0 4 501.3 4 965.3
EQUITY AND LIABILITIESEquity attributable to shareholders of Illovo Sugar Limited 5 191.2 5 502.6 3 683.1 3 897.1
Share capital and premium 24 2 791.5 3 075.7 2 791.5 3 075.7 Share-based payment reserve 25 13.1 13.1 13.1 13.1 Non-distributable reserves 26 154.0 224.7 325.2 317.4 Distribution reserve 27 156.3 248.5 156.3 248.5 Retained earnings 28 2 076.3 1 940.6 397.0 242.4
Non-controlling interest 784.1 812.1
Total equity 5 975.3 6 314.7 3 683.1 3 897.1
Non-current liabilities 991.1 1 146.0 – 104.0
Long-term borrowings 29 235.3 432.1 – – Deferred taxation liability 30 718.5 713.9 – 104.0 Deferred income 31 37.3 – – –
Current liabilities 2 870.2 2 215.3 818.2 964.2
Short-term borrowings 32 933.9 612.2 405.0 –Trade and other payables 33 1 556.0 1 168.4 256.6 581.9 Bank overdraft 60.8 87.9 – –Taxation 97.1 68.6 – – Provisions 34 218.4 276.4 125.5 182.3 Amounts due to subsidiaries 14 30.2 199.9 Derivative fi nancial instruments 23 4.0 1.8 0.9 0.1
Total liabilities 3 861.3 3 361.3 818.2 1 068.2
Total equity and liabilities 9 836.6 9 676.0 4 501.3 4 965.3

102 Annual Report 2011 • ILLOVO SUGAR LIMITED
Statements of cash fl owsfor the year ended 31 March 2011
Group Company
Notes
March2011
Rm
March2010
Rm
March2011
Rm
March2010
Rm
Cash fl ows from operating activitiesOperating profi t before working capital movements a 1 132.9 1 419.9 (68.6) 197.6 Working capital movements b 146.3 (183.2) (791.3) (175.5)
Cash generated from operations 1 279.2 1 236.7 (859.9) 22.1 Net fi nancing (costs)/income (95.5) (139.0) 87.7 (49.0)Taxation paid c (186.4) (304.2) (12.3) (68.8)Dividend income 2.1 3.9 139.7 209.0 Deferred income 40.0 – – –Distributions/dividends paid d (455.9) (490.2) (349.7) (373.7)
Net cash infl ows/(outfl ows) from operating activities 583.5 307.2 (994.5) (260.4)
Cash fl ows from investing activitiesReplacement of property, plant and equipment (199.8) (181.1) (4.6) (52.2)Expansion capital expenditure (1 262.9) (845.6) – (31.2)Net expansion of area under cane (8.2) (40.9) – –Capitalisation of product registrations (3.4) (11.1) (3.4) (11.1)Proceeds on disposal of plant and equipment 6.4 19.5 1.0 0.7 Proceeds on disposal of property 13.3 0.1 0.1 0.1 Additional investment in subsidiary – – – (966.7)Acquisition of non-controlling interest (99.2) (17.4) – –Acquisition of business e – (249.9) – –Proceeds on disposal of businesses f 130.9 118.7 – 118.7 Net movement on investments and loans 0.9 (84.8) (6.8) (51.8)
Net cash outfl ows from investing activities (1 422.0) (1 292.5) (13.7) (993.5)
Net cash outfl ows before fi nancing activities (838.5) (985.3) (1 008.2) (1 253.9)
Cash fl ows from fi nancing activitiesLong-term borrowings repaid (366.9) (200.0) – –Short-term borrowings raised/(repaid) 629.9 (1 226.6) 403.5 (977.2)Rights issue proceeds from Zambian non-controlling shareholders – 255.8 – –(Repurchase)/issue of share capital net of associated costs g (26.7) 2 956.7 (26.7) 2 956.7
Net cash infl ows from fi nancing activities 236.3 1 785.9 376.8 1 979.5
Net (decrease)/increase in cash and cash equivalents (602.2) 800.6 (631.4) 725.6 Cash and cash equivalents– at beginning of year h 1 320.0 544.8 876.5 150.9
– at end of year 717.8 1 345.4 245.1 876.5

ILLOVO SUGAR LIMITED • Annual Report 2011 103
FINA
NC
IAL STA
TEMEN
TS
Group CompanyMarch
2011Rm
March2010
Rm
March2011
Rm
March2010
Rm
a. Operating profi t movements are calculated as follows:Operating profi t 1 029.3 1 498.6 (73.2) 181.9 Material items 30.2 (52.4) 0.1 (40.0)
Total income 1 059.5 1 446.2 (73.1) 141.9 Add back:
(Profi t)/loss on disposal of business (19.8) 37.3 – 37.3Impairment of investment in agricultural joint venture – 15.0 – 2.6Depreciation 188.1 250.4 5.5 45.3 Change in fair value of cane roots (84.1) (109.9) – (6.5)Change in fair value of growing cane 0.5 (216.3) – (24.0)(Profi t)/loss on disposal of property (10.4) 0.1 (0.1) 0.1(Profi t)/loss on disposal of plant and equipment (0.9) (2.9) (0.9) 0.9
Operating profi t before working capital movements 1 132.9 1 419.9 (68.6) 197.6
b. Working capital movements comprise the following:Inventories (99.1) (49.8) (6.9) 7.5Trade and other receivables (141.4) 23.7 (373.6) (214.6)Factory overhaul costs (1.2) (46.1) – (11.0)Trade and other payables 388.0 (111.0) (410.8) 42.6
Working capital movements 146.3 (183.2) (791.3) (175.5)
c. Taxation paid is reconciled to the amountsdisclosed in the income statements as follows:Amounts (unpaid)/overpaid at beginning of year (63.0) (85.3) 3.8 17.0 Exchange rate translation 6.3 27.5 Per income statements (excluding deferred taxation) (206.2) (309.4) (0.1) (82.0)Amounts unpaid/(overpaid) at end of year 76.5 63.0 (16.0) (3.8)
Total taxation paid (186.4) (304.2) (12.3) (68.8)
d. Distributions/dividends paid are reconciled as follows:Distributions/dividends paid to shareholders of Illovo Sugar Limited (refer to note 9 of the
fi nancial statements) (349.7) (373.7) (349.7) (373.7)Distributions/dividends paid to non-controlling shareholders of subsidiaries (106.2) (116.5)
Total distributions/dividends paid (455.9) (490.2) (349.7) (373.7)
Notes to the statements of cash fl ows

104 Annual Report 2011 • ILLOVO SUGAR LIMITED
Group CompanyMarch
2011Rm
March2010
Rm
March2011
Rm
March2010
Rm
e. Acquisition of businessThe fair value of the assets acquired and liabilitiesassumed of the business acquired was as follows:Property, plant and equipment – 167.3 – –Cane roots – 59.5 – –Intangible asset – 109.8 – –Inventories – 7.8 – –Growing cane – 49.0 – –Trade and other receivables – 11.6 – –Long-term borrowings – (37.9) – –Deferred taxation – (52.3) – –Bank overdraft – (13.0) – –Trade and other payables – (10.0) – –
Net asset value acquired – 291.8 – –Non-controlling interest’s share of net asset value – (41.9) – –
Cash cost of acquisition – 249.9 – –
f. Proceeds on disposal of businessesThe fair value of the assets and liabilities of thebusinesses disposed of was as follows:Property, plant and equipment 149.4 165.7 524.9 165.7 Cane roots 22.2 – 103.1 –Investment in subsidiaries – – 21.5 –Investment in joint ventures – – 0.6 –Investment in associates – – 45.0 –Loans – – 24.6 –Inventories – 22.4 103.5 22.4Growing cane 15.1 – 114.2 –Trade and other receivables – 7.0 327.7 7.0Factory overhaul costs – 23.8 82.0 23.8Deferred taxation – – (134.7) –Short-term borrowings (75.6) – – –Trade and other payables – (57.5) (100.8) (57.5)Provisions – (5.4) (36.0) (5.4)
Net asset value disposed of 111.1 156.0 1 075.6 156.0Equity investment in Illovo Sugar (South Africa) Limited – – (521.0) –Loan to Illovo Sugar (South Africa) Limited – – (554.6) –Profi t/(loss) on disposal of businesses 19.8 (37.3) – (37.3)
Proceeds on disposal of businesses 130.9 118.7 – 118.7
NOTES TO THE STATEMENTS OF CASH FLOWS continued

ILLOVO SUGAR LIMITED • Annual Report 2011 105
FINA
NC
IAL STA
TEMEN
TS
Statements of comprehensive incomefor the year ended 31 March 2011
Group CompanyMarch
2011Rm
March2010
Rm
March2011
Rm
March2010
Rm
Profi t for the year 713.9 891.2 151.8 239.0
Other comprehensive incomeAdjustments in respect of cash fl ow hedges 13.1 (23.6) 10.4 (17.0)Tax effect of cash fl ow hedges (3.0) 6.4 (2.8) 6.4 Actuarial gains/(losses) on post-retirement obligations 4.6 (3.7) 4.2 (3.7)Tax effect of actuarial (gains)/losses on post-retirement obligations (1.4) 1.0 (1.2) 1.0 Hedge of net investment in foreign subsidiary (2.1) –Foreign currency translation differences (482.7) (748.4)
Total comprehensive income for the year 242.4 122.9 162.4 225.7
Attributable to:Shareholders of Illovo Sugar Limited 155.0 24.6 162.4 225.7Non-controlling interest 87.4 98.3
242.4 122.9 162.4 225.7
Group CompanyMarch
2011Rm
March2010
Rm
March2011
Rm
March2010
Rm
g. (Repurchase)/issue of share capital net of associated costsIn terms of the share option scheme, the company issued 571 824 (2010: 893 374) new shares 3.8 6.2 3.8 6.2In terms of the odd-lot and specifi c offers, the company repurchased 968 105 shares (30.5) – (30.5) –In terms of the rights issue, the company issued 108 342 362 new shares – 2 950.5 – 2 950.5
(26.7) 2 956.7 (26.7) 2 956.7
h. Cash and cash equivalents at beginning of yearCash and cash equivalents consist of cash on hand and balances with banks and investments in money market instruments.Cash and cash equivalents at beginning of year Per the statements of fi nancial position 1 345.4 655.6 876.5 150.9 Exchange rate translation (25.4) (110.8)
Per the statements of cash fl ows 1 320.0 544.8 876.5 150.9

106 Annual Report 2011 • ILLOVO SUGAR LIMITED
Statements of changes in equityat 31 March 2011
Share Share-basedcapital and payment
premiumRm
reserveRm
GROUPBalance at 31 March 2009 367.5 13.1 Total comprehensive income for the year: – –
Profi t for the year Actuarial losses on post-retirement obligations Cash fl ow hedges Foreign currency translation
Issue of share capital 2 956.7 Acquisition of businessChange in non-controlling shareholdingRealised loss on disposal of propertyDistributions/dividends paidTransfer to distribution reserve (248.5)Transfer of debit foreign currency translation reserve to retained earnings
Balance at 31 March 2010 3 075.7 13.1 Total comprehensive income for the year: – –
Profi t for the year Actuarial gains on post-retirement obligations Cash fl ow hedges Hedge of net investment in foreign subsidiary Foreign currency translation
Issue of share capital 3.8 Repurchase of share capital (30.5)Change in non-controlling shareholdingRealised profi t on disposal of propertyDistributions/dividends paidTransfer to distribution reserve (257.5)Transfer of debit foreign currency translation reserve to retained earnings
Balance at 31 March 2011 2 791.5 13.1
COMPANYBalance at 31 March 2009 367.5 13.1 Total comprehensive income for the year: – –
Profi t for the year Actuarial losses on post-retirement obligations Cash fl ow hedges
Issue of share capital 2 956.7 Realised loss on disposal of propertyDistributions/dividends paidTransfer to distribution reserve (248.5)
Balance at 31 March 2010 3 075.7 13.1 Total comprehensive income for the year: – –
Profi t for the year Actuarial gains on post-retirement obligations Cash fl ow hedges
Issue of share capital 3.8 Repurchase of share capital (30.5)Realised profi t on disposal of propertyDistributions/dividends paidTransfer to distribution reserve (257.5)
Balance at 31 March 2011 2 791.5 13.1

ILLOVO SUGAR LIMITED • Annual Report 2011 107
FINA
NC
IAL STA
TEMEN
TS
Attributableto the
Other non- shareholders Non-Translation distributable Distribution Retained of Illovo controlling
reserveRm
reservesRm
reserveRm
earningsRm
Sugar LimitedRm
interestRm
TotalRm
276.3 120.2 226.3 1 770.4 2 773.8 671.2 3 445.0 (618.1) (16.6) – 659.3 24.6 98.3 122.9
662.0 662.0 229.2 891.2 (2.7) (2.7) (2.7)
(16.6) (16.6) (0.6) (17.2)(618.1) (618.1) (130.3) (748.4)
2 956.7 2 956.7 – 41.9 41.9
121.2 121.2 117.2 238.4 (0.1) 0.1 – –
(373.7) (373.7) (116.5) (490.2) 395.9 (147.4) – –
341.8 (341.8) – –
– 224.7 248.5 1 940.6 5 502.6 812.1 6 314.7 (403.8) 9.4 – 549.4 155.0 87.4 242.4
546.2 546.2 167.7 713.93.2 3.2 3.2
9.4 9.4 0.7 10.1 (2.1) (2.1) (2.1)
(401.7) (401.7) (81.0) (482.7)
3.8 3.8 (30.5) (30.5)
(90.0) (90.0) (9.2) (99.2) 9.9 (9.9) – –
(349.7) (349.7) (106.2) (455.9)257.5 – –
403.8 (403.8) – –
– 154.0 156.3 2 076.3 5 191.2 784.1 5 975.3
– 328.1 226.3 153.4 1 088.4– (10.6) – 236.3 225.7
239.0 239.0 (2.7) (2.7)
(10.6) (10.6)
2 956.7 (0.1) 0.1 –
(373.7) (373.7)395.9 (147.4) –
– 317.4 248.5 242.4 3 897.1 – 7.6 – 154.8 162.4
151.8 151.8 3.0 3.0
7.6 7.6
3.8 (30.5)
0.2 (0.2) – (349.7) (349.7) 257.5 –
– 325.2 156.3 397.0 3 683.1

108 Annual Report 2011 • ILLOVO SUGAR LIMITED
Notes to the annual fi nancial statements
1. SIGNIFICANT ACCOUNTING POLICIES The fi nancial statements have been prepared in accordance with International Financial Reporting Standards (IFRS) on
a basis consistent with the prior year, except for the adoption of the revised accounting standards which have been described in note 2. The adoption of these standards has resulted in certain disclosure reclassifi cations but has had no other impact on the consolidated fi nancial statements.
The principal accounting policies adopted are set out below.
1.1 Basis of consolidation The consolidated fi nancial statements incorporate the fi nancial statements of the company and entities controlled by the
company. Control is achieved where the company has the power to govern the fi nancial and operating policies of an entity so as to obtain benefi ts from its activities.
The results of subsidiaries acquired or disposed of during the year are included in the consolidated income statement and consolidated statement of comprehensive income from the effective date of acquisition or up to the effective date of disposal, as appropriate.
Where necessary, adjustments are made to the fi nancial statements of subsidiaries to bring the accounting policies into line with those used by the group.
All material inter-company balances and transactions are eliminated.
Non-controlling interests in subsidiaries are identifi ed separately from the group’s equity therein. On acquisition, the non-controlling interests are entitled to a proportionate share of the entity’s identifi able net assets. Subsequent to acquisition, the non-controlling interest consists of the amount of those interests at acquisition plus the non-controlling interests’ share of changes in equity in the subsidiary. Non-controlling interests are allocated their proportionate share of total comprehensive income even if this results in the non-controlling interest having a defi cit, unless there is doubt as to the recoverability of the defi cit.
Changes in the group’s interest in a subsidiary that do not result in a loss of control are accounted for as equity transactions. The carrying amounts of the group’s interests and the non-controlling interests are adjusted to refl ect the changes in their relative interests in the subsidiary. Any difference between the amount by which the non-controlling interests are adjusted and the fair value of the consideration paid or received is recognised directly in equity and attributed to owners of the company.
1.2 Business combinations Acquisitions of businesses are accounted for using the acquisition method. The consideration transferred in a business
combination is measured at fair value, which is calculated as the sum of the acquisition date fair values of the assets transferred by the group, the liabilities incurred by the group to the former owners of the acquiree and the equity interests issued by the group in exchange for control of the acquiree. Acquisition related costs are generally recognised in profi t or loss as incurred.
At the acquisition date, the identifi able assets acquired and the liabilities assumed are recognised at their fair value at the acquisition date, except for: non-current assets (or disposal groups) that are classifi ed as held for sale in accordance with IFRS 5 Non-current Assets Held For Sale and Discontinued Operations; liabilities or equity instruments related to share-based payments that are accounted for in accordance with IFRS 2 Share-based Payments; deferred taxation assets or liabilities that are measured in accordance with IAS 12 Income Taxes; and assets or liabilities related to employee benefi t arrangements that are recognised and measured in accordance with IAS 19 Employee Benefi ts.
Goodwill represents the future economic benefi ts arising from assets that are not capable of being individually identifi ed and separately recognised in a business combination and is determined as the excess of the cost of acquisition over the group’s interest in the net fair value of the identifi able assets, liabilities and contingent liabilities of the entity. If, after reassessment, the group’s interest in the net fair value of the acquiree’s identifi able assets, liabilities and contingent liabilities exceeds the cost of the business combination, the excess is recognised immediately in profi t or loss.
Goodwill is initially recognised as an asset at cost and is subsequently measured at cost less any accumulated impairment losses.
For the purpose of impairment testing, goodwill is allocated to each of the group’s cash-generating units expected to benefi t from the synergies of the combination. Cash-generating units to which goodwill has been allocated are tested for impairment annually, or more frequently when there is an indication that the unit may be impaired. An impairment loss recognised for goodwill is not reversed in a subsequent period.

ILLOVO SUGAR LIMITED • Annual Report 2011 109
FINA
NC
IAL STA
TEMEN
TS
1. SIGNIFICANT ACCOUNTING POLICIES continued1.3 Interests in joint ventures A joint venture is a contractual arrangement whereby the group and other parties undertake an economic activity that is
subject to joint control: that is, when the strategic fi nancial and operating policy decisions relating to the activities require the unanimous consent of the parties sharing control.
The group reports its interests in jointly-controlled entities using proportionate consolidation, except when the investment is classifi ed as held for sale, in which case it is accounted for under IFRS 5 Non-current Assets Held for Sale and Discontinued Operations. The group’s share of the assets, liabilities, income and expenses of jointly controlled entities are combined with the equivalent items in the consolidated fi nancial statements on a line-by-line basis.
Where the group transacts with its jointly-controlled entities, unrealised profi ts and losses are eliminated to the extent of the group’s interest in the joint venture.
1.4 Investments in associates An associate is an entity over which the group has signifi cant infl uence and that is neither a subsidiary nor an interest
in a joint venture. Signifi cant infl uence is the power to participate in the fi nancial and operating policy decisions of the investee but is not control or joint control over those policies.
The results, assets and liabilities of associates are incorporated in these fi nancial statements using the equity method of accounting, except when the investment is classifi ed as held for sale, in which case it is accounted for under IFRS 5 Non-current Assets Held for Sale and Discontinued Operations. Under the equity method, investments in associates are initially recognised in the consolidated statement of fi nancial position at cost and adjusted thereafter to recognise the group’s share of the profi t or loss and other comprehensive income of the associate. Losses of an associate in excess of the group’s interest in that associate are not recognised unless there is a commitment or guarantee that requires further funding from the group.
Goodwill arising on the acquisition of the group’s interest in a jointly controlled entity is accounted for in accordance with the group’s accounting policy for goodwill on the acquisition of a subsidiary, as set out above, but is included in the carrying amount of the associate. Any excess of the group’s share of the net fair value of the identifi able assets, liabilities and contingent liabilities over the cost of acquisition, after reassessment, is recognised immediately in profi t or loss.
Where a group entity transacts with an associate of the group, profi ts and losses are eliminated to the extent of the group’s interest in the relevant associate.
1.5 Revenue recognition Revenue is measured at the fair value of the consideration received or receivable and represents amounts receivable for
goods and services provided in the normal course of business, net of discounts and sales related taxes.
Sales of goods are recognised when goods are delivered and title has passed.
Interest income is accrued on a time basis, by reference to the principal outstanding and at the effective interest rate applicable, which is the rate that exactly discounts estimated future cash receipts through the expected life of the fi nancial asset to that asset’s net carrying amount.
Dividend income from investments is recognised when the shareholders’ rights to receive payment have been established.
1.6 Material items Material items cover those amounts that are not considered to be of an operating or trading nature and generally include
impairments of goodwill; impairments of non-current assets; profi ts and losses on the disposal of properties; and profi ts and losses on the disposal of businesses.
1.7 Leases Leases are classifi ed as fi nance leases whenever the terms of the lease transfer substantially all the risks and rewards of
ownership to the lessee. All other leases are classifi ed as operating leases.
Assets held under fi nance leases are recognised as assets of the group at their fair value at the inception of the lease or, if lower, at the present value of the minimum lease payments. The corresponding liability to the lessor is included in the statement of fi nancial position as a fi nance lease obligation. Lease payments are apportioned between fi nance charges and reduction of the lease obligation so as to achieve a constant rate of interest on the remaining balance of the liability. Finance charges are charged to profi t or loss, unless they are directly attributable to qualifying assets, in which case they are capitalised in accordance with the group’s general policy on borrowing costs.
Rentals payable under operating leases are charged to profi t or loss on the straight-line basis over the term of the relevant lease.

110 Annual Report 2011 • ILLOVO SUGAR LIMITED
1. SIGNIFICANT ACCOUNTING POLICIES continued1.8 Foreign currencies The individual fi nancial statements of each group entity are presented in the currency of the primary economic environment
in which the entity operates (its functional currency). For the purpose of the consolidated fi nancial statements, the results and fi nancial position of each entity are expressed in South African rand, which is the functional currency of the company, and the presentation currency for the consolidated fi nancial statements.
The assets and liabilities of the group’s foreign operations are expressed in South African rand using exchange rates prevailing at the reporting date. Income and expense items are translated at the average exchange rates for the period, unless exchange rates fl uctuated signifi cantly during that period, in which case the exchange rates at the dates of the transactions are used. Exchange differences arising, if any, are recognised in other comprehensive income and transferred to the group’s foreign currency translation reserve. Such translation differences are recognised in profi t or loss in the period in which the foreign operation is disposed of.
Goodwill and fair value adjustments arising on the acquisition of a foreign operation are treated as assets and liabilities of the foreign operation and translated at the exchange rates prevailing at the reporting date.
In preparing the fi nancial statements of the individual entities, transactions in currencies other than the entity’s functional currency (foreign currencies) are recorded at the rates of exchange prevailing on the dates of the transactions. At the end of each reporting date, monetary items denominated in foreign currencies are retranslated at the rates prevailing on that date. Non-monetary items carried at fair value that are denominated in foreign currencies are retranslated at the rates prevailing on the date when the fair value was determined. Non-monetary items that are measured in terms of historical cost in a foreign currency are not retranslated.
Exchange differences arising on the settlement of monetary items, and on the retranslation of monetary items, are included in profi t or loss in the period they arise except for: exchange differences on foreign currency borrowings relating to assets under construction which are included in the cost of those assets in terms of the group’s borrowing costs policy; exchange differences on transactions entered into in order to hedge certain foreign currency risks to which the group’s hedge accounting policy applies; and exchange differences on monetary items receivable from or payable to a foreign operation for which settlement is neither planned nor likely to occur (therefore forming part of the net investment in the foreign operation) which are recognised initially in other comprehensive income and reclassifi ed from equity to profi t or loss on repayment of the monetary items.
1.9 Borrowing costs Borrowing costs directly attributable to the acquisition, construction or production of qualifying assets, which are assets
that necessarily take a substantial period of time to get ready for their intended use or sale, are added to the cost of those assets, until such time as the assets are substantially ready for their intended use or sale. Investment income earned on the temporary investment of specifi c borrowings, pending their expenditure on qualifying assets, is deducted from the borrowing costs eligible for capitalisation.
All other borrowing costs are recognised in profi t or loss in the period in which they are incurred.
1.10 Retirement benefi t costs The group provides retirement benefi ts for its employees through a number of defi ned contribution and defi ned benefi t
plans.
Contributions to defi ned contribution retirement benefi t plans are expensed as they fall due. Contributions made to state-managed retirement benefi t schemes are dealt with as payments to defi ned contribution plans where the group’s obligations under the plans are equivalent to those arising in a defi ned contribution retirement benefi t plan.
For defi ned benefi t retirement benefi t plans, the cost of providing benefi ts is determined using the projected unit credit method, with actuarial valuations being carried out every three years. Actuarial gains and losses are recognised immediately in other comprehensive income. Past service cost is recognised immediately to the extent that the benefi ts are already vested, and otherwise is amortised on the straight-line basis over the average period until the benefi ts become vested.
The retirement benefi t obligation recognised in the statement of fi nancial position represents the present value of the defi ned benefi t obligation as adjusted for unrecognised past service cost, and as reduced by the fair value of plan assets. Any asset resulting from this calculation is limited to unrecognised actuarial losses and past service cost, plus the present value of available refunds and reductions in future contributions to the plan. Surpluses on defi ned benefi t plans are recognised only to the extent that they are recoverable.
All plans are funded. Funding shortfalls arising in defi ned benefi t plans are met by group companies through lump sum payments or increased future contributions.
NOTES TO THE ANNUAL FINANCIAL STATEMENTS continued

ILLOVO SUGAR LIMITED • Annual Report 2011 111
FINA
NC
IAL STA
TEMEN
TS
1. SIGNIFICANT ACCOUNTING POLICIES continued1.10 Retirement benefi t costs continued Additional severance liabilities in terms of legislative regulations are assessed annually and provided for.
Historically, qualifying employees have been granted certain post-retirement medical benefi ts. Although the post-retirement medical benefi t option is now closed, a liability still exists in respect of current and retired employees to whom the benefi t was granted. These costs are provided on the accrual basis, determined actuarially.
1.11 Taxation Income tax expense represents the sum of the tax currently payable and deferred tax.
The tax currently payable is based on taxable profi t for the year. Taxable profi t differs from profi t as reported in the income statement because it excludes items of income or expense that are taxable or deductible in other years and it further excludes items that are never taxable or deductible. The group’s liability for current tax is calculated using tax rates that have been enacted or substantively enacted by the reporting date.
Deferred tax is recognised on differences between the carrying amounts of assets and liabilities in the fi nancial statements and the corresponding tax bases used in the computation of taxable profi t. Deferred tax liabilities are generally recognised for all taxable temporary differences. Deferred tax assets are generally recognised for all deductible temporary differences to the extent that it is probable that taxable profi ts will be available against which those deductible temporary differences can be utilised. Such deferred tax assets and liabilities are not recognised if the temporary difference arises from goodwill or from the initial recognition (other than in a business combination) of other assets and liabilities in a transaction that affects neither the taxable profi t nor the accounting profi t.
The carrying amount of deferred tax assets is reviewed at each reporting date and reduced to the extent that it is no longer probable that suffi cient taxable profi ts will be available to allow all or part of the asset to be recovered.
Deferred tax is measured at the tax rates that are expected to apply in the period when the liability is settled or the asset realised. Deferred tax is recognised in profi t or loss, except when it relates to items that are recognised in other comprehensive income or directly in equity, in which case the deferred tax is also recognised in other comprehensive income or directly in equity respectively.
Deferred tax assets and liabilities are offset when there is a legally enforceable right to set off current tax assets against current tax liabilities and when they relate to income taxes levied by the same taxation authority and the group intends to settle its current tax assets and liabilities on a net basis.
1.12 Property, plant and equipment Property, plant and equipment are stated at cost less accumulated depreciation and any accumulated impairment losses.
Cost includes professional fees and, for qualifying assets, borrowing costs capitalised in accordance with the group’s accounting policy.
Depreciation is charged so as to write off the cost of assets to their residual value over their estimated useful lives, using the straight-line method. Depreciation commences when the assets are ready for their intended use and is calculated at rates appropriate in terms of management’s current assessment of useful lives and residual values. Freehold land is not depreciated.
Management reviews the residual values annually, considering market conditions and projected disposal values. In the annual assessment of useful lives, maintenance programmes and technological innovations are considered.
Assets held under fi nance leases are depreciated over their expected useful lives on the same basis as owned assets or, where shorter, the term of the relevant lease.
The gain or loss arising on the disposal or retirement of an item of property, plant and equipment is determined as the difference between the sales proceeds and the carrying amount of the asset and is recognised in profi t or loss.
1.13 Factory overhaul costs Factory overhaul costs represent expenditure actually incurred on plant and equipment for the overhaul of the factory
in preparation for the new sugar season commencing after the year-end. This expenditure is written off in full over its expected useful life, being the duration of one sugar season.
1.14 Cane roots and growing cane Cane roots and growing cane are valued at fair value determined on the following basis:
Cane roots: the escalated average cost, using appropriate infl ation related indices, of each year of planting adjusted for the remaining expected life.
Growing cane: the estimated sucrose content at 31 March valued at the estimated sucrose price for the following season, less the estimated costs of harvesting and transport.

112 Annual Report 2011 • ILLOVO SUGAR LIMITED
1. SIGNIFICANT ACCOUNTING POLICIES continued1.15 Research and development expenditure Expenditure on research activities undertaken with the prospect of gaining new scientifi c or technical knowledge and
understanding, is recognised in the income statement as an expense as incurred.
Expenditure on development activities, whereby research fi ndings are applied to a plan or design for the production of new or substantially improved products and processes, is capitalised if the product or process is technically and commercially feasible and the group has suffi cient resources to complete development. The expenditure capitalised includes the costs of materials, direct labour and an appropriate proportion of overheads. Other development expenditure is recognised in the income statement as incurred. Capitalised development expenditure is stated at cost less accumulated amortisation and impairment charges.
1.16 Intangible assets Product registrations Expenditure incurred in obtaining the registration of a product to enable sales to be made in specifi c markets, is capitalised
and amortised over the expected useful life of the registration on the straight-line basis.
Subsequent expenditure, which increases the life of the registration or increases future economic benefi ts, is capitalised in the year in which it is incurred. Expenditure to maintain the registration is expensed in the year in which it is incurred.
Other intangible assets Intangible assets acquired separately are initially recognised at cost. If the intangible asset is acquired as part of a business
combination, it is recognised separately from goodwill at fair value on the acquisition date.
Intangible assets assessed as having an indefi nite useful life are not amortised but tested for impairment annually and impaired, if necessary. Intangible assets assessed as having a fi nite useful life are amortised over their useful lives using a straight-line basis and are tested for impairment if there is an indication that it may be impaired.
1.17 Impairment of tangible and intangible assets excluding goodwill At each reporting date, the group reviews the carrying amounts of its tangible and intangible assets to determine
whether there is any indication that those assets have suffered an impairment loss. If any such indication exists, the recoverable amount of the asset is estimated in order to determine the extent of the impairment loss (if any). Where it is not possible to estimate the recoverable amount of an individual asset, the group estimates the recoverable amount of the cash-generating unit to which the asset belongs.
Intangible assets with indefi nite useful lives and intangible assets not yet available for use are tested for impairment at least annually, and whenever there is an indication that the asset may be impaired.
Recoverable amount is the higher of fair value less costs to sell and value in use. In assessing value in use, the estimated future cash fl ows are discounted to their present value using a pre-tax discount rate that refl ects current market assessments of the time value of money and the risks specifi c to the asset.
If the recoverable amount of an asset (or cash-generating unit) is estimated to be less than its carrying amount, the carrying amount of the asset (cash-generating unit) is reduced to its recoverable amount. An impairment loss is recognised immediately in profi t or loss.
Where an impairment loss subsequently reverses, the carrying amount of the asset (cash-generating unit) is increased to the revised estimate of its recoverable amount, but so that the increased carrying amount does not exceed the carrying amount that would have been determined had no impairment loss been recognised for the asset (cash-generating unit) in prior years. A reversal of an impairment loss is recognised immediately in profi t or loss.
1.18 Inventories Inventories are stated at the lower of cost and net realisable value. Costs comprise direct materials and, where applicable,
direct labour costs and those overheads that have been incurred in bringing the inventories to their present location and condition. Cost is calculated using the weighted average method, except in the case of downstream products where the fi rst-in fi rst-out basis is used. Net realisable value represents the estimated selling price less all estimated costs of completion and costs to be incurred in marketing, selling and distribution.
Redundant and slow-moving inventories are identifi ed and written down to their net realisable values.
NOTES TO THE ANNUAL FINANCIAL STATEMENTS continued

ILLOVO SUGAR LIMITED • Annual Report 2011 113
FINA
NC
IAL STA
TEMEN
TS
1. SIGNIFICANT ACCOUNTING POLICIES continued1.19 Provisions Provisions are recognised when the group has a present obligation (legal or constructive) as a result of a past event, and
it is probable that the group will be required to settle that obligation.
The amount recognised as a provision is the best estimate of the consideration required to settle the present obligation at the reporting date, taking into account the risks and uncertainties surrounding the obligation. When a provision is measured using cash fl ows estimated to settle the present obligation, its carrying amount is the present value of those cash fl ows, where the effect of the time value of money is material.
1.20 Deferred income Deferred income is recognised in profi t or loss on a systematic basis over the periods in which the group recognises as
expenses the related costs for which the deferred income is intended to compensate.
1.21 Non-current assets held for sale Non-current assets or disposal groups are classifi ed as held for sale if the carrying amount will be recovered principally
through sale rather than through continuing use. This condition is regarded as met only when the sale is highly probable, the assets or disposal groups are available for immediate sale in their present condition and management is committed to the sale which should be expected to qualify for recognition as a completed sale within one year from the date of the classifi cation.
Immediately prior to being classifi ed as held for sale, the carrying amount of assets and liabilities are measured in accordance with the applicable standard. After classifi cation as held for sale, the assets or disposal groups are measured at the lower of the carrying amount and fair value less costs to sell. An impairment loss is recognised in profi t or loss for any initial and subsequent write-down of the assets or disposal groups to fair value less costs to sell. A gain for any subsequent increase in fair value less costs to sell is recognised in profi t or loss to the extent that it is not in excess of the cumulative impairment loss previously recognised. Non-current assets or disposal groups that are classifi ed as held for sale are not depreciated.
1.22 Financial instruments Financial assets and fi nancial liabilities are recognised on the group’s statement of fi nancial position when the group
becomes a party to the contractual provisions of the instrument.
Financial assets and fi nancial liabilities are offset and the net amount reported in the statement of fi nancial position when the company has a legally enforceable right to set off the recognised amounts and intends either to settle on a net basis or to realise the asset and settle the liability simultaneously.
Financial assets A fi nancial asset is cash, an equity instrument of another entity, a contractual right to receive cash or another fi nancial
asset from another entity, or to exchange fi nancial assets or fi nancial liabilities with another entity under conditions that are potentially favourable to the entity.
Financial assets are initially measured at fair value plus transaction costs. However, transaction costs in respect of fi nancial assets designated as held “at fair value through profi t or loss” are expensed.
Financial assets are accounted for “at fair value through profi t or loss” where the fi nancial asset is either held for trading or is designated as “at fair value through profi t or loss.”
Trade and other receivables are classifi ed as “loans and receivables” and are measured at amortised cost, using the effective interest rate method. Appropriate allowances for estimated irrecoverable amounts are recognised in profi t or loss when there is objective evidence that the asset is impaired.
Cash and cash equivalents comprise cash on hand and demand deposits, and other short-term highly liquid investments that are readily convertible to a known amount of cash and are subject to an insignifi cant risk of changes in value. Cash and cash equivalents are classifi ed as “loans and receivables” and measured at fair value.
Investments are classifi ed as “held to maturity” where the group has the expressed intention and ability to hold the investment to maturity. Held-to-maturity investments are measured at amortised cost using the effective interest rate method, less any impairment losses recognised to refl ect irrecoverable amounts. Other investments are classifi ed as “available for sale” and are measured at fair value with any gains or losses being recognised through other comprehensive income and accumulated in the investments’ revaluation reserve. Where the investment is disposed of, or is determined to be impaired, the cumulative gain or loss accumulated in equity is reclassifi ed to profi t or loss. Fair value, for this purpose, is market value if listed or a value arrived at by using appropriate valuation models if unlisted.

114 Annual Report 2011 • ILLOVO SUGAR LIMITED
1. SIGNIFICANT ACCOUNTING POLICIES continued1.22 Financial instruments continued Financial liabilities A fi nancial liability is a contractual obligation to deliver cash, or another fi nancial asset to another entity, or to exchange
fi nancial assets or fi nancial liabilities with another entity under conditions that are potentially unfavourable to the entity.
Financial liabilities are initially measured at fair value plus transaction costs. However, transaction costs in respect of fi nancial liabilities designated as held “at fair value through profi t or loss” are expensed.
Financial liabilities are accounted for “at fair value through profi t or loss” where the fi nancial asset is either held for trading or is designated as “at fair value through profi t or loss.”
Interest-bearing bank loans and overdrafts are measured at amortised cost using the effective interest rate method. Any difference between the proceeds (net of transaction costs) and the settlement or redemption of the borrowings is recognised over the term of the borrowings in accordance with the group’s accounting policy for borrowing costs.
Trade and other payables are initially measured at fair value, and are subsequently measured at amortised costs, using the effective interest rate method.
Equity Debt and equity instruments are classifi ed as either fi nancial liabilities or as equity based on the substance of the
contractual arrangement. An equity instrument is any contract that evidences a residual interest in the assets of the group after deducting all of its liabilities.
Equity instruments issued by the company are recorded at the value of the proceeds received, net of direct issue costs.
Derivative fi nancial instruments The group enters into derivative fi nancial instruments to manage its exposure to interest rate and foreign exchange rate
risks, including foreign exchange forward contracts, interest rate swaps and cross currency swaps.
The use of fi nancial derivatives is governed by the group’s policies, which provide written principles on the use of fi nancial derivatives consistent with the group’s risk management strategy. The group does not use derivative fi nancial instruments for speculative purposes.
Derivative fi nancial instruments are initially measured at fair value on the contract date, and are subsequently remeasured to fair value at each reporting date. The resulting gain or loss is recognised in profi t or loss immediately unless the derivative is designated and effective as a hedging instrument, in which event the timing of the recognition in profi t or loss depends on the nature of the hedge relationship.
Derivative fi nancial instruments embedded in non-derivative host contracts are treated as separate derivatives when their risks and characteristics are not closely related to those of the host contract and the host contract is not carried at fair value with unrealised gains or losses reported in profi t or loss.
Hedge accounting The group designates certain hedging instruments as either fair value hedges, cash fl ow hedges or hedges of net
investments in foreign operations.
Changes in the fair value of derivatives that are designated and qualify as fair value hedges are recognised in profi t or loss immediately, together with any changes in the fair value of the hedged asset or liability that are attributable to the hedged risk.
The effective portion of changes in the fair value of derivative fi nancial instruments that are designated and qualify as hedges of future cash fl ows is recognised directly in other comprehensive income and accumulated in equity. The gain or loss relating to the ineffective portion is recognised immediately in profi t or loss. A hedge of the foreign currency risk of a fi rm commitment is designated and accounted for as a cash fl ow hedge.
Gains or losses on the cash fl ow hedge of a forecast transaction or fi rm commitment, previously recognised in other comprehensive income and accumulated in equity, are reclassifi ed to profi t or loss in the periods when the hedged item is recognised in profi t or loss. However, if the cash fl ow hedge results in the recognition of a non-fi nancial asset or a non-fi nancial liability, then the associated gains or losses accumulated in equity are included in the initial measurement of that asset or liability.
Changes in the fair value of derivative fi nancial instruments that do not qualify for hedge accounting are recognised in profi t or loss as they arise.
NOTES TO THE ANNUAL FINANCIAL STATEMENTS continued

ILLOVO SUGAR LIMITED • Annual Report 2011 115
FINA
NC
IAL STA
TEMEN
TS
1. SIGNIFICANT ACCOUNTING POLICIES continued1.22 Financial instruments continued Hedge accounting is discontinued when the hedging instrument expires or is sold, terminated, or exercised, or no longer
qualifi es for hedge accounting. At that time, any gain or loss recognised in other comprehensive income and accumulated in equity remains in equity until the forecast transaction occurs. If the forecast transaction is no longer expected to occur, the gains or losses are recognised immediately in profi t or loss.
The effective portion of any gains or losses on hedging instruments designated as hedges of net investments in foreign operations is recognised in other comprehensive income and accumulated in the foreign currency translation reserve. The gains or losses relating to the ineffective portion are recognised immediately in profi t or loss. On disposal of the foreign operation, the gains or losses are reclassifi ed to profi t or loss.
1.23 Share-based payments The group issues equity-settled and cash-settled share-based payments to certain employees. Equity-settled share-based
payments are measured at fair value (excluding the effect of non-market-based vesting conditions) at the date of grant. The fair value determined at the grant date of the equity-settled share-based payments is expensed on the straight-line basis over the vesting period, based on the group’s estimate of the shares that will eventually vest and adjusted for the effect of non-market-based vesting conditions.
Fair value is measured using the Black-Scholes pricing model. The expected life used in the model has been adjusted, based on management’s best estimate, for the effects of non-transferability, exercise restrictions and behavioural considerations.
For cash-settled share-based payments, a liability equal to the portion of the goods or services received is recognised at the current fair value determined at each reporting date.
1.24 Segmental analysis Segment reporting is presented in respect of the group’s business and geographic segments. The primary format, business
segments, is based on the group’s management and internal reporting structure and combines businesses with common characteristics. Inter-segment pricing is determined on an arm’s length basis.
Segment results, assets and liabilities include items directly attributable to a segment as well as those that can be allocated on a reasonable basis. Segmental capital expenditure is the total costs incurred during the period to acquire segment assets that are expected to be used for more than one year.
The group is comprised of the following business segments:
• cane growing: the growing of sugar cane for use in the sugar production process;
• sugar production: the manufacture of sugar from sugar cane;
• downstream operations: the manufacture and sale of downstream products including syrup, furfural and alcohol; and
• co-generation: the supply of surplus electricity generated from the sugar production process.
The secondary format presents the revenues, profi ts and assets for the countries in which the group operates.
2. APPLICATION OF NEW AND REVISED INTERNATIONAL FINANCIAL REPORTING STANDARDS2.1 International Financial Reporting Standards adopted during the year The fi nancial statements have been prepared in accordance with International Financial Reporting Standards on a basis
consistent with the prior year, except for the adoption of the following revised accounting standards:
IFRS 2 Share-based Payments The amendment to this standard clarifi es the accounting for group cash-settled share-based payment transactions in the
separate fi nancial statements of an entity receiving the services when another group entity has the obligation to settle the award. The application of this amendment by the group has had no impact on the consolidated fi nancial statements.
IFRS 3 Business Combinations The signifi cant revisions to this standard relate to the treatment of acquisition costs (now to be expensed),
contingent consideration, goodwill where non-controlling shareholders are involved, step acquisitions and partial disposals. Consequential amendments were also made to IAS 27 Consolidated and Separate Financial Statements, IAS 28 Investments in Associates and IAS 31 Interests in Joint Ventures. Amendments to these standards have been applied prospectively and have had no impact on the consolidated fi nancial statements.

116 Annual Report 2011 • ILLOVO SUGAR LIMITED
2. APPLICATION OF NEW AND REVISED INTERNATIONAL FINANCIAL REPORTING STANDARDS continued2.1 International Financial Reporting Standards adopted during the year continued IAS 7 Statement of Cash Flows The amendment requires that only expenditure that results in a recognised asset in the statement of fi nancial position
is eligible for classifi cation as an investing activity. The application of this amendment by the group has resulted in a change in the disclosure of cash fl ows in respect of research and development costs that do not meet the criteria in IAS 38 Intangible Assets for capitalisation. This change has been applied retrospectively.
Specifi cally, research and development costs paid in the current year of R28.4 million are included in cash fl ows from operating activities in the consolidated statement of cash fl ows. Research and development costs paid in the prior year of R23.2 million have been reclassifi ed from investing activities to operating activities in the consolidated statements of cash fl ows for consistent presentation. There has been no other impact on the consolidated fi nancial statements.
IAS 17 Leases The amended standard requires that leases of land are classifi ed as either fi nance or operating using the general principles
of the standards. Previously, leases of land were considered to be operating leases. The application of this amendment by the group has had no impact on the consolidated fi nancial statements.
2.2 International Financial Reporting Standards in issue, but not yet effective At the date of approval of these fi nancial statements, the following relevant standards and interpretations were in issue,
but not yet effective:
IFRS 3 Business Combinations The amendments provide guidance on whether to measure non-controlling interests at fair value or at the proportionate
share of the net assets of the acquiree. The amendment to this standard is effective for the year ending 31 March 2012.
IFRS 7 Financial Instruments: Disclosures The amendments increase the disclosure requirements for transactions where a fi nancial asset is transferred but the
transferor retains some level of continuing exposure to the asset. The amendment to this standard is effective for the year ending 31 March 2013.
IFRS 9 Financial Instruments: Classifi cation and Measurement The standard introduces new requirements for classifying and measuring fi nancial instruments. Under the new
classifi cation requirements, all fi nancial assets will be recognised at either amortised cost or fair value as determined by the contractual cash fl ows of the assets. In terms of the new measurement requirements, changes in fair value of fi nancial liabilities measured “at fair value through profi t or loss” that are attributable to changes in credit risk of the liability will be recognised in other comprehensive income. The standard will be effective for the year ending 31 March 2014.
IAS 24 Related Party Disclosures The amendment to the standard has simplifi ed the defi nition of a related party, as well as eliminated some inconsistencies
that existed in the previous defi nition. The amendment to this standard is effective for the year ending 31 March 2012.
IFRIC 19 Extinguishing Financial Liabilities with Equity Instruments The interpretation provides guidance regarding the accounting for the extinguishment of a fi nancial liability through the
issue of equity instruments. The interpretation is effective for the year ending 31 March 2012.
The group is in the process of evaluating the effects of these standards and interpretations, and whilst they are not expected to have a signifi cant impact on the group’s results, additional disclosures may be required.
NOTES TO THE ANNUAL FINANCIAL STATEMENTS continued

ILLOVO SUGAR LIMITED • Annual Report 2011 117
FINA
NC
IAL STA
TEMEN
TS
3. CRITICAL ACCOUNTING JUDGEMENTS AND KEY SOURCES OF ESTIMATION UNCERTAINTY3.1 Critical accounting judgements made by management In the process of applying the group’s accounting policies, management has made the following judgement, apart from
those involving estimations, that affect the amounts recognised in the fi nancial statements and related disclosure:
Impairment of assets In making its judgement, management has assessed at each reporting date whether there is any indication that its
tangible and intangible assets may be impaired. If any such indication exists, the recoverable amount of the asset is assessed in order to determine the extent of the impairment loss, if any. The recoverable amount is the higher of fair value less costs to sell and value in use.
3.2 Key sources of estimation uncertainty In the process of applying the group’s accounting policies, management has made the following key assumptions
concerning the future and other key sources of estimation uncertainty at the reporting date:
Property, plant and equipment residual values and useful lives These assets are written down to their estimated residual values over their anticipated useful lives using the straight-line
basis. Management reviews the residual values annually considering market conditions and projected disposal values. In assessing useful lives, maintenance programmes and technological innovations are considered. The carrying value of property, plant and equipment is disclosed in note 11 to the fi nancial statements.
Cane roots valuation The escalated average costs of planting cane roots are adjusted for the remaining expected life. This requires an estimation
by management of the average number of ratoons expected from the crop. The key assumptions and carrying value of cane roots are disclosed in note 12 to the fi nancial statements.
Growing cane valuation Growing cane is valued at the estimated sucrose content valued at the estimated sucrose price for the following season,
less the estimated costs for harvesting and transport. The estimated sucrose content requires management to assess the expected cane and sucrose yields for the following season considering weather conditions and harvesting programmes. In assessing the estimated sucrose price, management is required to assess into which markets the forthcoming crop will be sold and assess domestic and export prices as well as the related foreign currency exchange rates. The key assumptions and carrying value of growing cane are disclosed in note 20 to the fi nancial statements.
There are no other key assumptions concerning the future, or key sources of estimation uncertainty at the reporting date, that management have assessed as having a signifi cant risk of causing a material adjustment to the carrying amounts of assets and liabilities within the next fi nancial year.
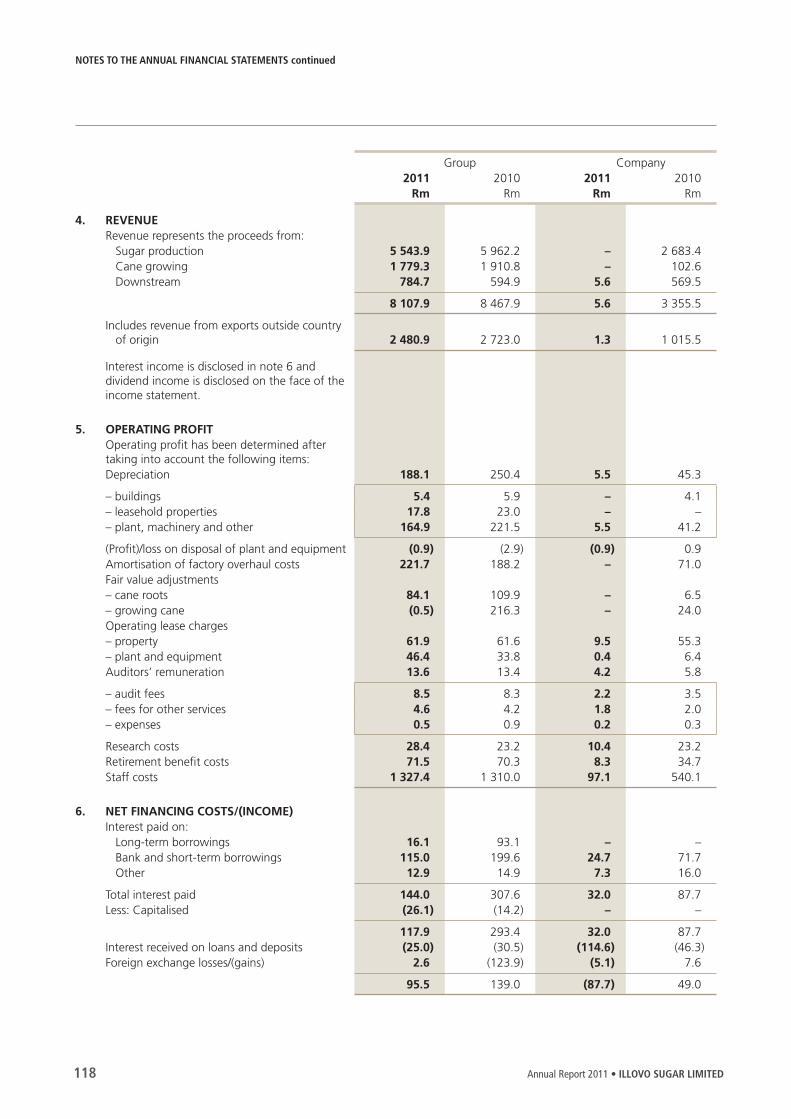
118 Annual Report 2011 • ILLOVO SUGAR LIMITED
Group Company2011 2010 2011 2010
Rm Rm Rm Rm
4. REVENUERevenue represents the proceeds from: Sugar production 5 543.9 5 962.2 – 2 683.4 Cane growing 1 779.3 1 910.8 – 102.6 Downstream 784.7 594.9 5.6 569.5
8 107.9 8 467.9 5.6 3 355.5
Includes revenue from exports outside country of origin 2 480.9 2 723.0 1.3 1 015.5
Interest income is disclosed in note 6 and dividend income is disclosed on the face of the income statement.
5. OPERATING PROFITOperating profi t has been determined after taking into account the following items:Depreciation 188.1 250.4 5.5 45.3
– buildings 5.4 5.9 – 4.1– leasehold properties 17.8 23.0 – –– plant, machinery and other 164.9 221.5 5.5 41.2
(Profi t)/loss on disposal of plant and equipment (0.9) (2.9) (0.9) 0.9Amortisation of factory overhaul costs 221.7 188.2 – 71.0Fair value adjustments– cane roots 84.1 109.9 – 6.5– growing cane (0.5) 216.3 – 24.0Operating lease charges– property 61.9 61.6 9.5 55.3– plant and equipment 46.4 33.8 0.4 6.4Auditors’ remuneration 13.6 13.4 4.2 5.8
– audit fees 8.5 8.3 2.2 3.5– fees for other services 4.6 4.2 1.8 2.0– expenses 0.5 0.9 0.2 0.3
Research costs 28.4 23.2 10.4 23.2Retirement benefi t costs 71.5 70.3 8.3 34.7Staff costs 1 327.4 1 310.0 97.1 540.1
6. NET FINANCING COSTS/(INCOME)Interest paid on: Long-term borrowings 16.1 93.1 – – Bank and short-term borrowings 115.0 199.6 24.7 71.7 Other 12.9 14.9 7.3 16.0
Total interest paid 144.0 307.6 32.0 87.7Less: Capitalised (26.1) (14.2) – –
117.9 293.4 32.0 87.7Interest received on loans and deposits (25.0) (30.5) (114.6) (46.3)Foreign exchange losses/(gains) 2.6 (123.9) (5.1) 7.6
95.5 139.0 (87.7) 49.0
NOTES TO THE ANNUAL FINANCIAL STATEMENTS continued

ILLOVO SUGAR LIMITED • Annual Report 2011 119
FINA
NC
IAL STA
TEMEN
TS
Group Company2011 2010 2011 2010
Rm Rm Rm Rm
7. MATERIAL ITEMSProfi t/(loss) arising on disposal of property 10.4 (0.1) 0.1 (0.1)Profi t/(loss) on disposal of businesses 19.8 (37.3) – (37.3)Impairment of investment in agricultural joint venture – (15.0) – (2.6)
Per income statement 30.2 (52.4) 0.1 (40.0)
Taxation (0.7) 10.2 – 10.2
29.5 (42.2) 0.1 (29.8)
8. TAXATIONSouth African normal taxationCurrent taxation– current year 24.1 50.8 2.0 44.9– prior year (0.8) 4.4 (1.9) (0.3)Deferred taxation– current year 11.1 (22.3) 2.4 (22.2)– prior year 0.1 3.1 – 3.1Secondary tax on companies – 37.4 – 37.4Foreign taxationCurrent taxation– current year 184.4 214.4– prior year (1.5) 2.4 Deferred taxation– current year 85.2 133.0 – prior year (14.0) 11.3– rate change (40.0) (23.0)
248.6 411.5 2.5 62.9
Reconciliation of rate of taxation % % % %South African normal rate of taxation 28.0 28.0 28.0 28.0 (Decrease)/increase in charge for year due to: (1.4) 2.2 (26.4) (9.6)
Adjustment from prior years (1.7) 1.6 (1.2) 0.8 Adjustment in respect of material items 0.1 (0.7) – (3.0) Exempt income (0.4) (2.3) (25.4) (17.1) Disallowable expenditure 0.8 3.5 0.6 1.6 Secondary tax on companies – 2.7 – 10.9 Withholding tax 6.2 2.3 – – Unprovided tax losses – 0.3 – – Taxation rate differentials: foreign subsidiaries (0.7) (2.1) – – Change of tax rate (4.3) (1.7) – – Other (1.4) (1.4) (0.4) (2.8)
Effective rate of taxation 26.6 30.2 1.6 18.4
Rm Rm Rm RmThe estimated tax losses at the end of the year aggregate 219.5 296.9 – –

120 Annual Report 2011 • ILLOVO SUGAR LIMITED
Group and Company2011 2010
Rm Rm
9. DISTRIBUTIONS/DIVIDENDS PAIDDividend number 35 of 64.5 cents per share (fi nal 2009) – paid 13 July 2009 226.5Dividend number 36 of 32.0 cents per share (interim 2010) – paid 11 January 2010 147.2Distribution number 37 of 54.0 cents per share (fi nal 2010)– paid 10 August 2010 248.6Distribution number 38 of 22.0 cents per share (interim 2011)– paid 10 January 2011 101.1
349.7 373.7
In respect of the year under review, the directors declared a fi nal capital distribution of 34.0 cents per share which will be paid to shareholders on 11 July 2011. The distribution will be regarded as a return of capital and shareholders will be liable for any potential capital gains tax consequences. No liability has been raised for this distribution in these fi nancial statements.
The total estimated distribution to be paid of R156.3 million has been transferred out of share premium to a separate distribution reserve (refer notes 24 and 27).
Group2011 2010
Rm Rm
10. EARNINGS AND HEADLINE EARNINGS PER SHAREEarningsEarnings for the purpose of basic earnings per share 546.2 662.0Dilutive effect of potential ordinary shares– share options 0.5 0.7
Earnings for the purpose of diluted earnings per share 546.7 662.7
Number of shares Shares SharesWeighted average number of ordinary shares for the purpose of basic earnings per share 459 787 328 410 278 716Dilutive effect of potential ordinary shares– share options 990 800 1 631 524
Weighted average number of ordinary shares for the purpose of diluted earnings per share 460 778 128 411 910 240
Reconciliation of headline earnings: Rm RmProfi t attributable to shareholders of Illovo Sugar Limited 546.2 662.0Adjusted for: (Profi t)/loss arising on disposal of property (10.4) 0.1 (Profi t)/loss on disposal of businesses (19.8) 37.3 Impairment of investment in agricultural joint venture – 15.0 Profi t on disposal of plant and equipment (0.9) (2.9)Total tax effect of adjustments 1.0 (10.0)Total non-controlling interest effect of adjustments – 1.0
Headline earnings 516.1 702.5
Headline earnings per share Cents CentsBasic 112.2 171.2Diluted 112.1 170.7
NOTES TO THE ANNUAL FINANCIAL STATEMENTS continued

ILLOVO SUGAR LIMITED • Annual Report 2011 121
FINA
NC
IAL STA
TEMEN
TS
2011 2010Accumulated Accumulated
Cost depreciation Cost depreciationRm Rm Rm Rm
11. PROPERTY, PLANT AND EQUIPMENTGroup Freehold land and buildings 446.7 107.1 539.1 78.6Leasehold properties 967.5 94.4 1 093.9 100.3Plant, machinery and other 5 300.2 1 528.4 4 381.8 1 573.2
6 714.4 1 729.9 6 014.8 1 752.1
Net book value 4 984.5 4 262.7
CompanyFreehold land and buildings 1.0 0.2 240.5 50.1Plant, machinery and other 65.7 48.2 930.7 576.9
66.7 48.4 1 171.2 627.0
Net book value 18.3 544.2
With the exception of land and motor vehicles, the group’s property, plant and equipment are insured at cost of replacement amounting to R18 079 million (2010: R18 966 million). Motor vehicles are insured at market value.
Certain of the group’s property, plant and equipment with a book value totalling R2 346 million (2010: R1 951 million) has been pledged by way of a mortgage debenture as security for the long-term borrowings referred to in note 29.
The group’s properties are wide-ranging, amounting to approximately 120 018 hectares (2010: 125 049 hectares) in extent, comprising largely the land on which the group’s sugar milling and cane growing activities are situated. As the number of individual properties is extensive, a list is not published with these statements, but registers of land and buildings are available for inspection at the relevant registered offi ces of the group by members of the company or their representatives.
Freehold Plant,land and Leasehold machinery 2011 2010buildings properties and other Total Total
Rm Rm Rm Rm Rm
GroupThe movement of the group’s property, plant and equipment comprises:Net book value at beginning of year 460.5 993.6 2 808.6 4 262.7 4 025.9Acquisition of business – – – – 167.3Additions 20.6 32.2 1 409.9 1 462.7 1 026.7 Disposal of business (149.4) – – (149.4) (165.7)Disposals (2.9) – (5.5) (8.4) (16.8)Reclassifi cations 22.1 2.1 (24.2) – –Exchange rate translation (5.9) (137.0) (252.1) (395.0) (524.3)
345.0 890.9 3 936.7 5 172.6 4 513.1Depreciation (5.4) (17.8) (164.9) (188.1) (250.4)
Net book value at end of year 339.6 873.1 3 771.8 4 984.5 4 262.7

122 Annual Report 2011 • ILLOVO SUGAR LIMITED
Freehold Plant,land and machinery Total Totalbuildings and other 2011 2010
Rm Rm Rm Rm
11. PROPERTY, PLANT AND EQUIPMENT continuedCompanyThe carrying amount of the company’s property, plant and equipment comprises:Net book value at beginning of year 190.4 353.8 544.2 673.6Additions – 4.6 4.6 83.4 Disposal of businesses (189.6) (335.3) (524.9) (165.7)Disposals – (0.1) (0.1) (1.8)
0.8 23.0 23.8 589.5Depreciation – (5.5) (5.5) (45.3)
Net book value at end of year 0.8 17.5 18.3 544.2
Group Company2011 2010 2011 2010
Rm Rm Rm Rm
12. CANE ROOTS The carrying value of cane roots comprises:Carrying value at beginning of year 1 100.2 1 132.3 103.1 96.6Change in fair value 84.1 109.9 – 6.5Expansion of area under cane 11.1 3.0 – –Acquisition of business – 59.5 – –Acquisition of farms – 22.5 – –Disposal of businesses (22.2) – (103.1) –Disposal of farms (1.7) – – –Exchange rate translation (83.6) (227.0)
Carrying value at end of year 1 087.9 1 100.2 – 103.1
Area under cane at 31 March (hectares):South Africa 7 980 12 681 – 9 665
Malawi 20 483 20 466Zambia 17 162 16 830Swaziland 8 657 8 175Tanzania 9 605 9 715Mozambique 5 570 5 572
69 457 73 439
The average remaining expected lives of cane roots, for both the current and the previous years, are 10 years inSouth Africa; 7 years in Zambia; and 8 years in each of the other countries of operation.
NOTES TO THE ANNUAL FINANCIAL STATEMENTS continued

ILLOVO SUGAR LIMITED • Annual Report 2011 123
FINA
NC
IAL STA
TEMEN
TS
Group Company2011 2010 2011 2010
Rm Rm Rm Rm
13. INTANGIBLE ASSETSIntangible assets comprise product registrations and a strategic cane supply arrangement.Product registrations 76.3 72.9 76.3 72.9Strategic cane supply arrangement 97.7 106.2 – –
174.0 179.1 76.3 72.9
The carrying value of intangible assets comprises:Balance at beginning of year 179.1 61.8 72.9 61.8Acquisition of business – 109.8 – –Disposal of businesses – – – –Current year expenditure 3.4 11.1 3.4 11.1Exchange rate translation (8.5) (3.6)
Balance at end of year 174.0 179.1 76.3 72.9
Product registrations represent the cost of registering the group’s exclusive right to sell MultiGuard Protect, a furfural-based nematicide developed by the group, in the United States of America. The product registrations will be amortised over their useful lives from the 2012 fi nancial year.
The strategic cane supply arrangement represents the security over the cane for Zambia Sugar Plc that arose from the acquisition of Nanga Farms PLC. The strategic cane supply arrangement is considered to have an indefi nite useful life and is tested for impairment annually.

124 Annual Report 2011 • ILLOVO SUGAR LIMITED
Effective Amounts AmountsIssued percentage Shares at due by due tocapital holding cost subsidiaries subsidiaries
Rm % Rm Rm Rm
14. INVESTMENT IN SUBSIDIARIESThe principal subsidiaries of Illovo Sugar Limited are as follows:2011
Direct investmentCGS Investments (Pty) Limited – 100 0.9 – (1.5)East African Supply (Pty) Limited – 100 – – (25.4)Illovo Group Holdings Limited – ordinary – 100 – 6.7 –Illovo Group Holdings Limited – preference 2 014.8 100 2 091.9 – –Illovo Project Services Limited – 100 – 0.5 –Illovo Sugar (South Africa) Limited 521.0 100 521.0 424.4 –Monitor Holdings Limited 250.0 100 17.5 2.9 –
Indirect investmentGlendale Sugar Limited 5.6 100 – – (3.3)Illovo Distributors (Pty) Limited – 100 – – – Illovo Group Marketing Services Limited – 100 – 40.8 –Illovo Sugar (Malawi) Limited 34.9 76 – 41.6 – Illovo Sugar Coöperatief U.A. – 100 – – – Illovo Sugar España, S.L. – 100 – 1.9 –Illovo Sugar Ireland – 100 – 3.0 –Illovo Tanzania Limited – 100 – – –Illprop (Pty) Limited 1.3 100 – – – Kilombero Sugar Company Limited 1.1 55 – 21.0 –Maragra Açúcar SA 367.5 90 – 13.0 –Palaa Consultores Marketing E Servicos Lda – 100 – 4.2 –Reynolds Brothers Limited – 100 – – –Sucoma Holdings Limited 426.2 100 – – –Ubombo Sugar Limited 49.5 60 – 810.0 –Zambia Sugar Plc 355.9 82 – 36.3 –
2 631.3 1 406.3 (30.2)
NOTES TO THE ANNUAL FINANCIAL STATEMENTS continued

ILLOVO SUGAR LIMITED • Annual Report 2011 125
FINA
NC
IAL STA
TEMEN
TS
Effective Amounts AmountsIssued percentage Shares at due by due tocapital holding cost subsidiaries subsidiaries
Rm % Rm Rm Rm
14. INVESTMENT IN SUBSIDIARIES continued2010
Direct investmentCastaneous Trading 38 (Pty) Limited – 100 – 127.3 –CGS Investments (Pty) Limited – 100 0.9 – (1.5)East African Supply (Pty) Limited – 100 – – (25.8)Glendale Sugar Limited 5.6 100 20.9 – (21.1)Illovo Distributors (Pty) Limited – 100 0.4 – (20.0)Illovo Group Holdings Limited – ordinary – 100 – 33.4 –Illovo Group Holdings Limited – preference 2 179.8 100 2 091.9 – –Illovo Project Services Limited – 100 – 1.9 –Illprop (Pty) Limited 1.3 100 0.2 – (0.1)Monitor Holdings Limited 250.0 100 17.5 1.8 –Reynolds Brothers Limited – 100 – 3.4 –
Indirect investmentIllovo Group Marketing Services Limited – 100 – 20.2 –Illovo Sugar (Malawi) Limited 37.9 76 – 29.3 (0.3)Illovo Sugar Coöperatief U.A. – 100 – – –Illovo Sugar España, S.L. – 100 – 1.7 –Illovo Sugar Ireland – 100 – 15.9 –Illovo Tanzania Limited – 100 – – –Kilombero Sugar Company Limited 1.3 55 – 21.0 –Maragra Açúcar SA 270.7 74 – 31.7 –Palaa Consultores Marketing E Servicos Lda – 100 – 4.0 –Sucoma Holdings Limited 461.1 100 – – –Ubombo Sugar Limited 49.5 60 – 150.9 (131.1)Zambia Sugar Plc 386.8 82 – 29.3 –
2 131.8 471.8 (199.9)
On 1 April 2010, net assets of the company’s South African operations totalling R1 075.6 million were transferred from the company to Illovo Sugar (South Africa) Limited, a wholly-owned subsidiary of the company. The assets transferred included investments in Castaneous Trading 38 (Pty) Limited, Glendale Sugar Limited, Illprop (Pty) Limited, Illovo Distributors (Pty) Limited and Reynolds Brothers Limited.
On 31 May 2010, Illovo Sugar (South Africa) Limited disposed of its investment in Castaneous Trading 38 (Pty) Limited, a property holding company, for a consideration of R130.9 million, recognising a profi t of R19.8 million.
All subsidiaries have a 31 March year-end. A full list of subsidiaries is available on request from the Company Secretary.

126 Annual Report 2011 • ILLOVO SUGAR LIMITED
15. INVESTMENT IN JOINT VENTURES
% HoldingPrincipal joint ventures of the group Year-end Nature of business 2011 2010
Glendale Distilling Company 31 March Alcohol distillers 50.0 50.0Lacsa (Pty) Limited 31 March Lactulose producer 50.0 50.0Relax Limited 31 March Lactulose agents 50.0 50.0
The assets, liabilities and profi ts of the above joint ventures are proportionately consolidated into the group’s fi nancial statements.
2011 2010Rm Rm
The joint ventures of the group had the following capital commitmentswhich have been included in note 37:– contracted 1.3 – – approved but not contracted 15.6 7.8
16.9 7.8
16. INVESTMENT IN ASSOCIATES
% HoldingPrincipal associates of the group Year-end Nature of business 2011 2010
Gledhow Sugar Company (Pty) Limited 31 March Sugar milling 30.0 30.0Mitra Sugar Limited 30 September Sugar export agents 49.0 49.0Kilombero Sugar Distributors Limited 30 September Distribution agents 20.0 20.0
Group Company2011 2010 2011 2010
Rm Rm Rm Rm
Investment in associate companiesBalance at beginning of year 38.3 – 45.0 – Acquisition of investment in associate – 47.7 – 45.0 Disposal of business – – (45.0) –Share of post acquisition loss (3.6) (8.4)Exchange rate translation 0.1 (1.0)
34.8 38.3 – 45.0
Included in the group fi nancial statements are the following items that represent the group’s share of the assets, liabilities and profi ts of associates:Non-current assets 47.3 45.8Current assets 81.1 27.2 Current liabilities (93.6) (34.7)
Net assets 34.8 38.3
Revenue 129.0 164.2
Net loss after taxation (3.6) (8.4)
Directors’ valuation of:Shares and loans in unlisted associate companies 46.6 46.7 – 45.0
With effect from 1 October 2009, an agency agreement has been concluded with Mitra Sugar Limited, a United Kingdom-based venture with fellow subsidiary, AB Sugar, which provides an effective route to the European Union market for the group’s export sugars.
NOTES TO THE ANNUAL FINANCIAL STATEMENTS continued

ILLOVO SUGAR LIMITED • Annual Report 2011 127
FINA
NC
IAL STA
TEMEN
TS
Group Company2011 2010 2011 2010
Rm Rm Rm Rm
17. INVESTMENTSInvestment in Mali project 5.3 5.7 – –Other investments 1.6 2.3 1.6 1.6
6.9 8.0 1.6 1.6
18. LOANS Long-term promissory note receivable 10.2 13.7 – –Loan to Mali project 60.6 51.7 – –Other loans 50.5 69.1 13.1 30.9
121.3 134.5 13.1 30.9
The long-term promissory note receivable is unsecured and is denominated in US dollars with the interest calculated at 6% per annum, payable monthly in arrears. The principal is payable in equal monthly instalments with the fi nal payment due on 1 October 2014.
The loan to the Mali project represents the underlying net assets of the project and will be converted to an equity contribution and the operation consolidated once the project has been completed.
The other loans bear interest at varying rates and have varying terms of repayment.
Group Company2011 2010 2011 2010
Rm Rm Rm Rm
19. INVENTORIESFinished goods 190.8 142.0 3.6 36.9Consumables and components 334.2 315.4 7.1 70.4
525.0 457.4 10.7 107.3
20. GROWING CANEThe carrying value of growing cane comprises:Carrying value at beginning of year 1 260.7 1 222.9 114.2 90.2Change in fair value (0.5) 216.3 – 24.0 Acquisition of business – 49.0 – –Acquisition of farms – 15.4 – –Disposal of businesses (15.1) – (114.2) –Disposal of farms (1.2) – – –Exchange rate translation (88.1) (242.9)
Carrying value at end of year 1 155.8 1 260.7 – 114.2

128 Annual Report 2011 • ILLOVO SUGAR LIMITED
20. GROWING CANE continuedThe following assumptions have been used in the determination of the estimated sucrose tonnage at 31 March:
South Africa Malawi Zambia Swaziland Tanzania Mozambique
2011Expected area to harvest (hectares) 4 572.0 20 240.0 16 896.0 8 095.0 9 386.0 5 476.0Estimated yield (tons cane/hectare) 53.5 109.6 118.4 103.0 80.4 96.7 Average maturity of cane at 31 March (%) 57.00 66.67 68.80 66.67 50.00 70.81
2010Expected area to harvest (hectares) 5 320.0 20 015.0 16 773.0 7 612.0 9 390.0 5 316.0Estimated yield (tons cane/hectare) 72.0 111.3 130.5 105.7 74.1 97.0Average maturity of cane at 31 March (%) 57.00 66.67 76.00 66.67 50.00 66.67
Group Company2011 2010 2011 2010
Rm Rm Rm Rm
21. TRADE AND OTHER RECEIVABLESTrade receivables 559.3 372.3 0.3 270.7Prepayments 32.0 34.6 0.2 16.1Taxation 20.6 5.6 16.0 3.8Other receivables 156.6 226.5 45.1 92.8
768.5 639.0 61.6 383.4
The directors consider that the carrying amount of trade and other receivables approximates their fair value. Additional disclosures concerning the management of credit risk have been provided in note 41.
An allowance has been made for impairment of receivables amounting to R3.0 million (2010: R5.4 million) in the group. No allowance for impairment of receivables has been provided for in the company (2010: 2.2 million).
Group Company2011 2010 2011 2010
Rm Rm Rm Rm
22. FACTORY OVERHAUL COSTSBalance at beginning of year 221.7 212.0 82.0 94.8Capitalised during the year 222.9 234.3 – 82.0 Amortised during the year (221.7) (188.2) – (71.0)Disposal of business – (23.8) (82.0) (23.8)Exchange rate translation (8.8) (12.6)
Balance at end of year 214.1 221.7 – 82.0
NOTES TO THE ANNUAL FINANCIAL STATEMENTS continued

ILLOVO SUGAR LIMITED • Annual Report 2011 129
FINA
NC
IAL STA
TEMEN
TS
Group Company2011 2010 2011 2010
Rm Rm Rm Rm
23. DERIVATIVE FINANCIAL INSTRUMENTSForward exchange contracts: recognised in profi t and loss 10.9 0.9 9.9 –Forward exchange contracts: designated as cash fl ow hedges 0.2 (1.8) 1.9 (0.1)
11.1 (0.9) 11.8 (0.1)
Comprising: Assets 15.1 0.9 12.7 – Liabilities (4.0) (1.8) (0.9) (0.1)
11.1 (0.9) 11.8 (0.1)
The fair value of derivative fi nancial instruments is determined by reference to quoted market prices in an active market for similar fi nancial instruments. Additional disclosures concerning the derivative fi nancial instruments used to manage currency risk have been provided in note 41.
Group and Company2011 2010
Rm Rm
24. SHARE CAPITAL AND PREMIUMAuthorised:900 000 000 (2010: 900 000 000) ordinary shares of 4 cents each 36.0 36.0
Issued and fully paid:459 763 357 (2010: 460 159 638) ordinary shares of 4 cents each 18.4 18.4Share premium 2 773.1 3 057.3
2 791.5 3 075.7
The movement for the year was as follows:Balance at beginning of year 3 075.7 367.5Rights issue net of share issue expenses – 2 950.5Repurchase of shares in issue (30.5) –Share options exercised 3.8 6.2Transfer to distribution reserve (refer note 27) (257.5) (248.5)
Balance at end of year 2 791.5 3 075.7
25. SHARE-BASED PAYMENT RESERVEBalance at beginning and end of year 13.1 13.1
All outstanding share options are fully vested and as a result, no further expense is required to be recognised in respect of the equity-settled share option scheme.

130 Annual Report 2011 • ILLOVO SUGAR LIMITED
Group Company2011 2010 2011 2010
Rm Rm Rm Rm
26. NON-DISTRIBUTABLE RESERVESComprises:Realised surpluses on sales of property and investments 77.8 67.9 282.5 282.3 Capital redemption reserve fund 37.1 37.1 35.6 35.6 Hedging reserve 7.9 (1.5) 7.1 (0.5)Transactions with non-controlling shareholders 31.2 121.2Foreign currency translation reserve – –
Total non-distributable reserves 154.0 224.7 325.2 317.4
Movement for the year:Balance at beginning of year 224.7 396.5 317.4 328.1Realised profi t/(loss) on disposal of property (refer note 28) 9.9 (0.1) 0.2 (0.1)Transfer of debit foreign currency translation reserve to retained earnings (refer note 28) 403.8 341.8Dilution of interest in Zambian Sugar Plc – 131.3Increase of interest in Maragra Açúcar SA (90.0) (10.1)Total comprehensive income for the year: Cash fl ow hedges 9.4 (16.6) 7.6 (10.6) Hedge of net investment in foreign subsidiary (2.1) Foreign currency translation (401.7) (618.1)
Balance at end of year 154.0 224.7 325.2 317.4
The foreign currency translation reserve comprises all foreign exchange differences arising from the translation of the fi nancial statements of foreign operations, as well as the gains and losses on instruments that hedge the group’s net investment in foreign subsidiaries.
On 1 April 2010, the group increased its shareholding in Maragra Açúcar SA from 74.0% to 80.2% by converting a R238.4 million loan into equity. As a result of this transaction, the group’s proportionate share of the carrying value of the net assets of Maragra Açúcar SA increased by R203.8 million, while the non-controlling interest’s share increased by R34.6 million without an additional equity contribution. An amount of R34.6 million, representing the increase in the non-controlling interest for no consideration, has been debited to non-distributable reserves.
Following the debt to equity conversion, the group acquired a further interest of 9.8% in Maragra Açúcar SA for a consideration of R99.2 million, increasing its shareholding to 90.0%. As a result of this transaction, the non-controlling interest’s proportionate share of the carrying value of the net assets of Maragra Açúcar SA decreased by R43.8 million. An amount of R55.4 million, representing the difference between the consideration paid and the decrease in the non-controlling interest, has been debited to non-distributable reserves.
Group Company2011 2010 2011 2010
Rm Rm Rm Rm
27. DISTRIBUTION RESERVEBalance at beginning of year 248.5 226.3 248.5 226.3 Transfer from retained earnings (refer note 28) – 147.4 – 147.4Transfer from share premium (refer note 24) 257.5 248.5 257.5 248.5Less distributions/dividends paid (refer note 9) (349.7) (373.7) (349.7) (373.7)
Balance at end of year 156.3 248.5 156.3 248.5
NOTES TO THE ANNUAL FINANCIAL STATEMENTS continued

ILLOVO SUGAR LIMITED • Annual Report 2011 131
FINA
NC
IAL STA
TEMEN
TS
Group Company2011 2010 2011 2010
Rm Rm Rm Rm
28. RETAINED EARNINGSBalance at beginning of year 1 940.6 1 770.4 242.4 153.4Total comprehensive income for the year: Profi t for the year 546.2 662.0 151.8 239.0 Actuarial gains/(losses) on post-retirement obligations 3.2 (2.7) 3.0 (2.7)Realised (profi t)/loss on disposal of property (refer note 26) (9.9) 0.1 (0.2) 0.1Transfer to distribution reserve (refer note 27) – (147.4) – (147.4)Transfer of debit foreign currency translation reserve from non-distributable reserves (refer note 26) (403.8) (341.8)
Balance at end of year 2 076.3 1 940.6 397.0 242.4
29. LONG-TERM BORROWINGSSouth African borrowings – – – –Foreign borrowings 540.5 969.2 – –
Total borrowings 540.5 969.2 – –Less: Current portion redeemable and repayable within one year (refer note 32) (305.2) (537.1) – –
235.3 432.1 – –
The above borrowings are due for repaymentin the following years ending 31 March:2011 537.1 –2012 305.2 305.4 – –2013 125.7 119.6 – –2014 39.0 4.2 – –2015 and thereafter 70.6 2.9 – –
540.5 969.2 – –
Foreign Interest Groupcurrency Years of rate 2011 2010
million repayment % Rm Rm
Foreign borrowingsUnsecured loans: Euro 4.6 2011-2015 3.0-7.1 19.9 33.1 US dollar 7.0 2011-2012 1.7 47.5 102.7 Secured loans: US dollar* 2.1 2011-2014 4.9 13.9 26.4 US dollar+ 15.0 2014-2016 5.4 101.7 – Zambian kwacha# 235 852.0 2011-2013 6.8-18.1 326.1 807.0 Tanzanian shilling^ 6 944.0 2011-2014 7.6 31.4 –
Total foreign borrowings 540.5 969.2
Total borrowings 540.5 969.2
* These loans are secured by property, plant and equipment of Nanga Farms PLC+ These loans are secured by property, plant and equipment of Maragra Açúcar SA# These loans are secured by property, plant and equipment of Zambia Sugar Plc^ These loans are secured by property, plant and equipment of Kilombero Sugar Company Limited

132 Annual Report 2011 • ILLOVO SUGAR LIMITED
Group Company2011 2010 2011 2010
Rm Rm Rm Rm
30. DEFERRED TAXATIONBalance at beginning of year 685.8 701.1 104.0 130.5Current year income statement charge/(relief) 96.3 110.7 2.4 (22.2)Prior year income statement (relief)/charge (13.9) 14.4 – 3.1Current year comprehensive income charge/(relief) 4.4 (7.4) 4.0 (7.4)Rate change adjustment (40.0) (23.0) – –Acquisition of business – 52.3 – –Disposal of business – – (134.7) –Exchange rate translation (45.0) (162.3)
Balance at end of year 687.6 685.8 (24.3) 104.0
Analysis of provision– property, plant and equipment 403.9 412.1 2.3 49.0– growing cane and cane roots 483.4 546.4 – 60.8– tax losses (218.8) (292.7) – – – other 19.1 20.0 (26.6) (5.8)
Balance at end of year 687.6 685.8 (24.3) 104.0
– asset (30.9) (28.1) (24.3) –– liability 718.5 713.9 – 104.0
31. DEFERRED INCOMECo-generation electricity supply 40.0 – – –Less: Portion to be recognised within one year (refer note 33) (2.7) – – –
37.3 – – –
Deferred income represents an amount received for the exclusive right to purchase all surplus electricity.
The deferred income will be amortised to profi t over the duration of the supply agreement.
Group Company2011 2010 2011 2010
Rm Rm Rm Rm
32. SHORT-TERM BORROWINGSAmounts due to bankers 628.7 75.1 405.0 –Current portion of long-term borrowings (refer note 29) 305.2 537.1 – –
933.9 612.2 405.0 –
The amounts due to bankers have no fi xed terms of repayment and bear interest at variable market related interest rates.
NOTES TO THE ANNUAL FINANCIAL STATEMENTS continued

ILLOVO SUGAR LIMITED • Annual Report 2011 133
FINA
NC
IAL STA
TEMEN
TS
Group Company2011 2010 2011 2010
Rm Rm Rm Rm
33. TRADE AND OTHER PAYABLESTrade payables 627.1 582.2 220.0 373.0Accruals and other accounts payable 875.1 586.2 29.9 208.9Leave pay (refer note 34) 51.1 – 6.7 –Deferred income (refer note 31) 2.7 – – –
1 556.0 1 168.4 256.6 581.9
Trade payables and accruals principally comprise amounts outstanding for trade purchases and ongoing costs.
The directors consider that the carrying amount of trade payables approximate their fair value.
Group Company2011 2010 2011 2010
Rm Rm Rm Rm
34. PROVISIONSLeave payBalance at beginning of year 53.0 53.1 27.5 30.3(Utilised)/raised during the year (0.4) 7.5 (0.2) 0.5Disposal of business – (3.3) (20.6) (3.3)Reallocation to other payables (refer note 33) (51.1) – (6.7) –Exchange rate translation (1.5) (4.3)
Balance at end of year – 53.0 – 27.5
Post-retirement benefi tsBalance at beginning of year 140.5 147.7 102.1 97.3Raised during the year 14.9 6.1 2.1 3.2Disposal of business – (2.1) (15.4) (2.1)Actuarial (gains)/losses (4.6) 3.7 (4.2) 3.7Reallocation from other provisions 30.2 – – –Exchange rate translation (3.5) (14.9)
Balance at end of year 177.5 140.5 84.6 102.1
OtherBalance at beginning of year 82.9 75.8 52.7 45.2(Utilised)/raised during the year (11.8) 7.1 (11.8) 7.5Reallocation to post-retirement benefi ts (30.2) – – –
Balance at end of year 40.9 82.9 40.9 52.7
Total provisionsBalance at beginning of year 276.4 276.6 182.3 172.8Raised/(utilised) during the year 2.7 20.7 (9.9) 11.2Disposal of business – (5.4) (36.0) (5.4)Actuarial (gains)/losses (4.6) 3.7 (4.2) 3.7Reallocation to other payables (refer note 33) (51.1) – (6.7) –Exchange rate translation (5.0) (19.2)
Balance at end of year 218.4 276.4 125.5 182.3

134 Annual Report 2011 • ILLOVO SUGAR LIMITED
35. RETIREMENT BENEFITS A total of three defi ned benefi t pension funds and a number of defi ned contribution funds cover the large majority of
employees, other than those covered by membership of various service-based retirement arrangements.
During the year, an amount of R4.1 million (2010: R5.2 million) was expensed in respect of defi ned benefi t plans, and R67.4 million (2010: R65.1 million) in respect of defi ned contribution plans and statutory retirement arrangements.
South Africa All South African plans are funded, with their assets held in administered trust funds which are governed by the Pension
Funds Act, 1956. Plan assets primarily consist of listed shares, fi xed income securities and investments in the money market.
Following the conversion in 1998, on a voluntary basis, of a large number of members from defi ned benefi t plans to defi ned contribution plans, the remaining defi ned benefi t plans operate as closed funds and cover 98 employees (2010: 109).
The defi ned benefi t plans are actuarially valued for statutory purposes at intervals of not more than three years. Any defi cits that are identifi ed are funded by the company by way of increased future contributions or by the payment of an actuarially determined lump sum.
The statutory actuarial valuations of the defi ned benefi t plans as at 1 January 2009 are complete and have been approved by the Financial Services Board (FSB). The independent consulting actuary found the plans to be in a sound fi nancial position. The statutory valuations indicate surpluses aggregating R48.6 million (2006: R124.7 million). The surplus apportionment schemes of the funds as at 1 January 2003 were approved by the FSB, and the administrators are in the process of making payments to the affected pensioners and former members. The distribution of the surplus arising from the Illovo Sugar Pension Fund valuation as at 1 January 2009 has been completed, and the administrator is in the process of making payments to pensioners and former members.
The accounting actuarial valuations of the defi ned benefi t plans were carried out as at 31 March 2011 in accordance with IAS 19. The combined fair value of the benefi t plan assets amounted to R998.9 million (2010: R951.5 million), whilst the present value of promised retirement benefi ts totalled R826.3 million (2010: R756.5 million). In arriving at these fi ndings, the actuary took into account a discount rate of 9.25% (2010: 9.00%), an expected rate of return on the assets of 9.25% (2010: 8.50%), an expected rate of salary increase of 7.00% (2010: 6.25%), an expected rate of pension increase of 5.40% (2010: 4.73%) and an expected rate of infl ation of 6.00% (2010: 5.25%). As at 31 March 2011, the company is not unconditionally entitled to the surplus in the plans and as a result the surplus has not been recognised as an asset.
The assumptions and methods used in the accounting valuations are consistent with the requirements of IAS 19, but not necessarily consistent with the assumptions and methods used in the statutory valuations used for assessing funding requirements. The statutory valuations also make allowance for solvency and contingency reserves which are not incorporated into the accounting valuations in terms of the accounting standards.
A total of R4.1 million (2010: R4.2 million) has been recognised as an expense in the fi nancial period relating to the two defi ned benefi t plans. The current year contribution to the three defi ned contribution plans totalled R31.9 million (2010: R30.5 million).
Malawi Pensions are provided for all senior employees through the Sucoma Group Defi ned Contribution Fund and the Sucoma
Non-contributory Defi ned Contribution Fund. The assets are held in independently administered funds. The pension cost of R3.5 million (2010: R4.0 million) is recognised in the year in which it is incurred.
Retirement benefi ts for other staff are provided for by the Employment Act regulations.
Zambia Zambia Sugar provides retirement benefi ts for its employees through a defi ned contribution pension scheme and statutory
severance pay schemes. Contributions to the defi ned contribution pension scheme are recognised in the year in which the related services are rendered by the employees. An amount of R10.2 million (2010: R9.4 million) was expensed during the year in respect of the defi ned contribution pension scheme.
Membership of the National Pension Authority is compulsory for all employees of Zambia Sugar and Nanga Farms with the exception of expatriate employees. Monthly contributions are made by both the employer and the employee, and in the current year the employer’s contribution totalled R9.1 million (2010: R9.4 million).
NOTES TO THE ANNUAL FINANCIAL STATEMENTS continued

ILLOVO SUGAR LIMITED • Annual Report 2011 135
FINA
NC
IAL STA
TEMEN
TS
35. RETIREMENT BENEFITS continued Swaziland The group provides retirement benefi ts for all its permanent employees through a defi ned contribution fund and a
provident fund. The company contributions of R4.1 million (2010: R 3.2 million) to these funds are treated as an expense in the fi nancial period.
A defi ned benefi t fund exists consisting of employees who retired prior to October 2004. The accounting actuarial valuation of the defi ned benefi t plan was carried out as at 31 March 2011 in accordance with IAS 19. The fair value of the benefi t plan assets amounted to R9.8 million (2010: R10.1 million) whilst the actuarial present value of promised retirement benefi ts totalled R10.8 million (2010: R11.1 million) resulting in a defi cit of R1.0 million (2010: R1.0 million). In arriving at the valuation, the actuary took into account a discount rate of 9.25% (2010: 9.25%), an expected rate of return of 9.75% (2010: 6.75%) and an expected rate of pension increase of 1.16% (2010: 1.16%). The group has raised a provision for the actuarial defi cit.
Tanzania and Mozambique There are no group retirement plans in Tanzania and Mozambique, however, employees are covered for retirement
purposes by statutory social security arrangements established by the respective governments. The group contributes a percentage of the payroll in terms of the statutory requirements, and in the current year R7.7 million (2010: R7.5 million) and R0.9 million (2010: R1.1 million) was expensed in respect of these arrangements in Tanzania and Mozambique respectively.
Service-based retirement arrangements The group has an obligation to provide severance pay to members of service-based retirement arrangements in Malawi,
Swaziland and Tanzania based on the length of permanent employment service. At 31 March 2011, the total provision amounted to R75.4 million (2010: R68.6 million).
Post-retirement medical benefi ts The obligation of the company to pay medical aid contributions after retirement is no longer part of the conditions of
employment for employees engaged after 1 December 1995. A number of pensioners and current employees, however, remain entitled to this benefi t. The entitlement to this benefi t for current employees is dependent upon the employees remaining in service until retirement age and completing a minimum service period.
The unfunded liability for post-retirement medical benefi ts is provided on the projected unit credit method, determined actuarially. At 31 March 2011, the total provision amounted to R101.1 million (2010: R102.1 million). During the current year, R3.6 million (2010: R3.2 million) was expensed to the income statement whilst actuarial gains of R4.6 million (2010: actuarial losses R3.7 of million) were recognised in full in other comprehensive income.
A valuation of this provision was performed as at 31 March 2011. In arriving at his fi nding, the actuary took into account a discount rate of 9.00% (2010: 9.75%), an expected rate of health care infl ation of 7.75% (2010: 9.00%) and an expected retirement age of 58 (2010: 58).

136 Annual Report 2011 • ILLOVO SUGAR LIMITED
36. SHARE-BASED PAYMENTS Equity-settled share option scheme The company has a share option scheme for certain employees of the group. Options are exercisable at a price equal to
the closing price of the company’s shares on the JSE Limited on the day preceding the date of grant. Vesting periods for the share options are one-third after three years, two-thirds after four years, and the full allocation after fi ve years.
Details of the share option movements during the year are as follows:
Company2011 2010
Weighted Weightedaverage average
Number of option Number of optionshare price share price
options Rand options Rand
Outstanding at beginning of year 1 631 524 2 544 098Forfeited (68 900) 7.11 (19 200) 6.56Exercised (571 824) 6.71 (893 374) 6.89
Outstanding at end of year 990 800 1 631 524
Exercisable at end of year 990 800 1 631 524
All outstanding share options are fully vested and as a result, no further expense is required to be recognised in respect of the equity-settled share option scheme.
The independent actuaries made use of the following assumptions in arriving at their valuation:
Grant date Vesting dateExpected
option lifetime Rolling volatility Dividend yield Risk-free rate
21/05/2003 21/05/2006 4 33.91 5.70 9.4221/05/2003 21/05/2007 5 33.14 5.70 9.4221/05/2003 21/05/2008 6 33.14 5.70 9.4402/06/2004 02/06/2007 4 33.91 5.94 9.8802/06/2004 02/06/2008 5 33.14 5.94 9.8802/06/2004 02/06/2009 6 33.14 5.94 9.91
Cash-settled equity instrument scheme During the year, the company issued cash-settled equity instruments to certain employees that require the company to
pay the intrinsic value of the cash-settled equity instrument at the date of exercise. The grant price of the instrument is based on the average of the closing market price of the company’s shares on the JSE Limited for the 30 trading days immediately preceding the date of grant.
At 31 March 2011, the fair value of the obligation in respect of the cash-settled equity instrument scheme was determined actuarially to be R40.9 million (2010: R52.7 million) and an amount of R11.8 million recognised as income (2010: R7.5 million recognised as an expense). The vesting periods for the scheme are the same as those applicable to the share equity-settled share options scheme.
NOTES TO THE ANNUAL FINANCIAL STATEMENTS continued

ILLOVO SUGAR LIMITED • Annual Report 2011 137
FINA
NC
IAL STA
TEMEN
TS
36. SHARE-BASED PAYMENTS continued The independent actuaries made use of the following assumptions in arriving at their valuation:
Company2011 2010
Share price (cents) 2 735 3 090Expected option lifetime– vesting period three (years) 3 3 – vesting period four (years) 4 4– vesting period fi ve (years) 5 5Expected rolling volatility– one-year expected option lifetime (%) 22.62 30.70– two-year expected option lifetime (%) 27.67 34.36– three-year expected option lifetime (%) 31.10 33.09 – four-year expected option lifetime (%) 30.96 31.18– fi ve-year expected option lifetime (%) 29.88 29.75Risk-free interest rate– one-year expected option lifetime (%) 6.62 7.08– two-year expected option lifetime (%) 6.82 7.41– three-year expected option lifetime (%) 7.14 7.80– four-year expected option lifetime (%) 7.39 8.09– fi ve-year expected option lifetime (%) 7.51 8.03Expected dividend yield (%) 3.22 3.39 Forfeiture rate per annum (%) 5.00 5.00
Illovo Sugar Employees’ Share Purchase Scheme Under the Illovo Sugar Employees’ Share Purchase Scheme, all employees, except directors and employees who are
participants in the equity-settled share option scheme and the cash-settled equity instrument scheme, may purchase the company’s shares. Contributions made by employees are enhanced by a 10% contribution from the company, and the company pays for the trading costs. Employees may acquire up to 5 000 shares in the aggregate and 1 000 shares in a continuous 12-month period.

138 Annual Report 2011 • ILLOVO SUGAR LIMITED
37. CAPITAL EXPENDITURE COMMITMENTSGroup
2011 2010Rm Rm
South Africa– contracted 22.5 5.2 – approved but not contracted 135.2 196.2 Malawi– contracted 2.1 4.5 – approved but not contracted 61.7 59.2 Zambia– contracted 1.7 10.7 – approved but not contracted 44.4 27.5 Swaziland– contracted 6.1 596.9 – approved but not contracted 95.6 853.9 Tanzania– contracted 17.2 1.9 – approved but not contracted 69.6 78.4 Mozambique– contracted 6.0 21.3 – approved but not contracted 21.7 75.7 Mali– contracted 7.6 –– approved but not contracted 2 060.8 1 439.9 Corporate– contracted – –– approved but not contracted 54.2 43.2
Contracted 63.2 640.5 Approved but not contracted 2 543.2 2 774.0
2 606.4 3 414.5
With the exception of Mali and Swaziland, the capital expenditure will be fi nanced from cash resources and facilities negotiated and not yet utilised. In respect of Mali and Swaziland, negotiations for fi nancing facilities are at an advanced stage.
38. CONTINGENT LIABILITIESGroup Company
2011 2010 2011 2010Rm Rm Rm Rm
Guarantees in respect of liabilities of third parties and claims against the group 175.0 48.7 – –Guarantees in respect of liabilities of subsidiary companies 289.2 271.7
175.0 48.7 289.2 271.7
The group has guaranteed certain obligations of its associate company, Gledhow Sugar Company (Pty) Limited, to the extent of R100 million. The group has arrangements to recover any outfl ows associated with this guarantee from the other shareholders of the associate in proportion to their shareholding.
NOTES TO THE ANNUAL FINANCIAL STATEMENTS continued

ILLOVO SUGAR LIMITED • Annual Report 2011 139
FINA
NC
IAL STA
TEMEN
TS
39. OPERATING LEASE COMMITMENTS The group’s commitments in respect of operating leases are as follows:
2012 2013 2014 2015 2016 onwards
2011 2010
Rm Rm Rm Rm Rm Rm Rm
Property 45.2 19.2 19.4 8.3 136.0 228.1 151.1Plant and equipment 25.2 20.1 12.9 9.3 4.7 72.2 90.1
Total lease commitments 70.4 39.3 32.3 17.6 140.7 300.3 241.2
40. RELATED PARTY TRANSACTIONS40.1 Compensation of key management personnel The remuneration of key management personnel for the year ended 31 March 2011 has been disclosed in the
Remuneration Report on page 65.
40.2 Subsidiaries, joint ventures and associates Details of investments in principal subsidiaries, joint ventures and associates are disclosed in notes 14, 15 and 16
respectively.
40.3 Shareholders Details of the major shareholders of the company and a summary of the categories of shareholders are disclosed on
page 145.
40.4 Interests of directors in contracts All directors of the company have confi rmed that they were not materially interested in any contract of signifi cance with
the company or any of its subsidiary companies which could have resulted in a confl ict of interest during the year.
40.5 Shareholders and related interests of directors and offi cers in share capital Details have been included in the Directors’ Report on page 96.
40.6 Recovery of management services Operational support fees are charged to all operating subsidiaries in order to recover the company’s management time
and effort.

140 Annual Report 2011 • ILLOVO SUGAR LIMITED
Group Company2011 2010 2011 2010
Rm Rm Rm Rm
41. FINANCIAL RISK MANAGEMENT Financial instruments consist primarily of cash deposits with banks, investments and loans, trade and other receivables and payables, derivative instruments and bank borrowings. Financial instruments are carried at fair value or amounts that approximate fair value.
Categories of fi nancial instrumentsFinancial assetsLoans and receivables 1 607.6 2 118.9 319.8 1 290.8Investments 6.9 8.0 1.6 1.6Derivative fi nancial instruments recognised in profi t and loss 2.8 0.9 1.9 –Derivative fi nancial instruments designated as cash fl ow hedges 12.3 – 10.8 –
Financial liabilitiesDerivative fi nancial instruments recognised in profi t and loss 2.6 – – –Derivative fi nancial instruments designated as cash fl ow hedges 1.4 1.8 0.9 0.1Financial liabilities measured at amortised cost 2 883.1 2 369.2 661.6 581.9
Reconciliation to the statement of fi nancial positionLoans 121.3 134.5 13.1 30.9Trade and other receivables 768.5 639.0 61.6 383.4Cash and cash equivalents 717.8 1 345.4 245.1 876.5
Loans and receivables 1 607.6 2 118.9 319.8 1 290.8
Trade and other payables 1 556.0 1 168.4 256.6 581.9Taxation payable 97.1 68.6 – –Long-term borrowings 235.3 432.1 – –Short-term borrowings 994.7 700.1 405.0 –
Financial liabilities measured at amortised cost 2 883.1 2 369.2 661.6 581.9
41.1 Treasury risk management A treasury risk management committee, consisting of senior executives in the group, meets periodically to analyse currency
and interest rate exposures and formulate treasury management strategies in light of prevailing market conditions and current economic forecasts. This committee operates within group policies approved by the board.
The derivative instruments used by the group, which are used solely for hedging purposes (i.e. to offset foreign exchange, price and interest rate risks), comprise interest rate swaps, cross currency interest rate swaps, and forward exchange contracts. Such derivative instruments are used to alter the risk profi le of an existing underlying exposure of the group, and forecast future transactions in line with the group’s risk management policies.
It is the policy of the group not to trade in derivative fi nancial instruments for speculative purposes.
NOTES TO THE ANNUAL FINANCIAL STATEMENTS continued

ILLOVO SUGAR LIMITED • Annual Report 2011 141
FINA
NC
IAL STA
TEMEN
TS
41. FINANCIAL RISK MANAGEMENT continued41.2 Interest rate risk management Taking cognisance of the seasonality of the group’s cash fl ow and long-term interest rate forecasts, the treasury risk
management committee positions the group’s interest rate exposures according to expected movements in interest rates internationally as well as in the countries in which the group operates.
The interest rate profi le at 31 March 2011 is as follows:
GroupFloating rate Fixed rate
Less than one year
Greater thanone year
Less thanone year
Greater than one year
Totalborrowings
Borrowings (Rm) 913.2 227.0 81.5 8.3 1 230.0Total borrowings (%) 74 18 7 1 100
Interest rate sensitivity The group is exposed to interest rate cash fl ow risk in respect of its variable rate loans, which can impact on the cash
fl ows of these instruments. The sensitivity analysis below has been determined based on the exposure to interest rates at the reporting date and the stipulated change taking place at the beginning of the fi nancial year.
Group2011 2010
Rm Rm
If interest rates had been 50 basis points higher/lower and all other variables held constant, the group’s profi t before tax for the year would decrease/increase by 5.7 3.7
41.3 Commodity price risk management Commodity price risk arises from the fl uctuations in the world sugar price and the impact this may have on current or
future earnings. In order to minimise this risk, management attempt to maximise the sale of sugar into each operating country’s domestic market as well as the regional, European and American markets where premiums are sought. The South African operation, however, does not have access to the preferential European markets and its excess sugar is sold on the world market. The sale of sugar on the world market, as well as the related hedging activities, is undertaken by the South African Sugar Association (SASA). The company partakes in all decisions made by SASA relative to its pricing and hedging activities.
The quantities of sugar sold into the various markets are managed so as to ensure that the group realises the best possible return.
41.4 Currency risk management In the normal course of business, the group enters into transactions denominated in foreign currencies. Hence, exposures
to exchange rate fl uctuations arise. Exchange rate exposures are managed within approved policy parameters utilising forward exchange contracts.
The carrying amount of the group’s unhedged and uncovered foreign currency denominated monetary assets and monetary liabilities at the reporting date is as follows:
GroupAssets Liabilities
2011 2010 2011 2010Rm Rm Rm Rm
US dollar 365.8 294.8 173.9 2.3Euro 191.3 16.9 0.6 0.2Other 2.4 0.5 9.4 3.2

142 Annual Report 2011 • ILLOVO SUGAR LIMITED
41. FINANCIAL RISK MANAGEMENT continued41.4 Currency risk management continued Unhedged and uncovered foreign currency monetary items which are repayable within twelve months comprise:
Group2011 2010
Foreign Amount Foreign Amountcurrency in currency in millions Rm millions Rm
AssetsUS dollar 52.9 358.5 40.2 294.8Euro 19.9 191.3 1.7 16.9Other 2.4 0.5
552.2 312.2
LiabilitiesUS dollar 10.2 68.9 0.3 2.3Euro 0.1 0.6 0.1 0.2Other 9.4 3.2
78.9 5.7
Foreign currency sensitivity The group’s exchange rate exposure relates mainly to the US dollar and the euro. The sensitivity analysis below indicates
the impact on the group’s profi t before tax resulting from the revaluation of unhedged and uncovered foreign currency denominated monetary items, outstanding on the reporting date, for an assumed 10% movement in the US dollar and the euro. A positive/(negative) number below indicates an increase/(decrease) in profi t before tax where the rand strengthens by 10% against the relevant currency. For a 10% weakening of the rand against the relevant currency, there would be an equal and opposite impact on profi t before tax.
Group
US dollar Euro
2011 2010 2011 2010Rm Rm Rm Rm
10% foreign currency sensitivity (19.2) (29.2) (19.1) (1.7)
The group has entered into certain forward exchange contracts which relate to specifi c items appearing on the statement of fi nancial position or were entered into to cover forecast foreign currency proceeds not yet receivable and foreign currency purchases not yet delivered.
The contracts will be utilised for purposes of trade during the 2012 fi nancial year.
Group2011 2010
Foreign Average Amount Foreign Average Amountcurrency rate in currency rate in
million million million Rm
Foreign currency soldUS dollar 36.5 7.21 263.3 – – –Euro 25.5 9.66 246.3 – – –
Foreign currency purchasedUS dollar 36.7 6.96 255.6 4.7 7.92 37.0Euro 1.3 9.15 11.9 2.0 9.46 18.7Other 0.7 5.1
NOTES TO THE ANNUAL FINANCIAL STATEMENTS continued

ILLOVO SUGAR LIMITED • Annual Report 2011 143
FINA
NC
IAL STA
TEMEN
TS
41. FINANCIAL RISK MANAGEMENT continued41.5 Credit risk management Credit risk consists mainly of short-term cash deposits and cash equivalent investments, trade receivables and loans. The
group only deposits short-term cash with major banks of high quality credit standing and limits the amount of credit exposure to any one counter-party. Trade receivables and loans comprise a widespread base, and group companies undertake ongoing credit evaluations of the fi nancial condition of the other parties. Where appropriate, credit guarantee insurance cover is purchased. At 31 March 2011, the group does not consider there to be any material credit risk that has not been insured or adequately provided for.
The group grants various credit terms to its customers. The analysis of trade receivables at reporting date is as follows:
Group Company2011 2010 2011 2010
Rm Rm Rm Rm
Not past due 521.3 340.4 0.3 253.0Past due by 30 days 16.1 23.0 – 17.6Past due by 60 days 4.0 5.4 – 1.7Past due by 90 days 2.8 2.5 – –Past due by 120 days and over 18.1 6.4 – 0.6
562.3 377.7 0.3 272.9Less: Allowance for doubtful debts (3.0) (5.4) – (2.2)
Trade receivables 559.3 372.3 0.3 270.7
No specifi c trade receivables have been placed under liquidation in either the current or the prior year.
Allowance for doubtful debtsSet out below is a summary of the movement in the allowance for doubtful debts for the year:
Balance at beginning of year 5.4 21.0 2.2 18.8Amounts written off during the year (3.4) (2.9) – –Amounts recovered during the year – (0.5) (0.1) –Increase/(decrease) in allowance 1.2 (11.5) 0.1 (16.6)Disposal of business – – (2.2) –Exchange rate translation (0.2) (0.7)
Balance at end of year 3.0 5.4 – 2.2
41.6 Liquidity risk management In terms of the company’s Articles of Association, the directors may from time to time, at their discretion, raise or borrow
for the purpose of the company as they think fi t.
The group treasury has access to the following local and foreign banking facilities at 31 March 2011:
Rm
Local, fi xed and fl exible term, general banking facilities 1 750.0Foreign, fi xed and fl exible term, general banking facilities 1 667.0
3 417.0
41.7 Capital risk management The group manages its capital to ensure that entities in the group will be able to continue as a going concern while
maximising the return to stakeholders through the optimisation of the debt and equity balance. The capital structure of
the group consists of equity and debt, which includes borrowings net of cash and cash equivalents.

144 Annual Report 2011 • ILLOVO SUGAR LIMITED
42. SEGMENTAL ANALYSISBusiness segments
Operating Total CapitalRevenue profi t assets expenditure Depreciation
Rm Rm Rm Rm Rm
Year to 31 March 2011Sugar production 5 543.9 742.8 4 595.7 864.7 125.1Cane growing 1 779.3 193.9 3 708.1 176.4 52.2Downstream 784.7 92.6 360.8 21.6 10.8Co-generation – – 408.2 408.2 –
8 107.9 1 029.3 9 072.8 1 470.9 188.1
Year to 31 March 2010Sugar production 5 962.2 890.3 4 037.9 698.0 176.3Cane growing 1 910.8 505.2 3 949.9 366.5 63.2Downstream 594.9 103.1 313.8 3.1 10.9
8 467.9 1 498.6 8 301.6 1 067.6 250.4
Geographical segmentsOperating Total Capital
Revenue profi t assets expenditureRm Rm Rm Rm
Year to 31 March 2011Malawi 1 447.8 430.1 1 456.9 59.2Zambia 1 829.9 242.4 2 925.7 26.4South Africa 3 219.2 148.0 1 672.7 130.8Tanzania 626.1 128.0 528.2 61.5Swaziland 738.0 78.2 1 922.3 1 147.5Mozambique 246.9 2.6 567.0 45.5
8 107.9 1 029.3 9 072.8 1 470.9
Year to 31 March 2010Malawi 1 711.3 637.5 1 388.1 103.4Zambia 1 468.1 264.3 3 207.2 257.0South Africa 3 447.0 255.3 1 804.4 271.3Tanzania 682.1 166.8 497.4 33.6Swaziland 799.5 119.7 732.4 194.2Mozambique 359.9 55.0 672.1 208.1
8 467.9 1 498.6 8 301.6 1 067.6
Note: Total assets exclude cash and cash equivalents, deferred tax and derivative fi nancial instruments.
NOTES TO THE ANNUAL FINANCIAL STATEMENTS continued

ILLOVO SUGAR LIMITED • Annual Report 2011 145
SHA
REHO
LDER IN
FORM
ATIO
N
Analysis of shareholders
Number of Percentage Numberordinary of shares of
shares held issued shareholders
An analysis of the register of members as at 31 March 2011 revealed the following categories of membership –
1 – 1 000 774 305 0.2 1 8551 001 – 10 000 4 697 842 1.0 1 39410 001 – 100 000 12 302 182 2.7 371100 001 – 1 000 000 64 882 087 14.1 198Over 1 000 000 377 106 941 82.0 42
459 763 357 100.0 3 860
Of the total number of shareholders, 3 381 held their shares in dematerialised form whilst 479 remained as certifi cated holders. Of the total number of shares in issue, 48.5% have been dematerialised. The holding company has elected to hold its shares in certifi cated form.
A further analysis of the register reveals the following categories of members:• Pension funds 80 686 175 17.5 170• Unit trusts 70 780 148 15.4 51• Banks 25 967 938 5.6 57• Insurance companies 11 378 614 2.5 28• Individuals 5 992 038 1.3 2 662• Other corporate bodies 264 958 444 57.7 892
459 763 357 100.0 3 860
Disclosures by nominee shareholders Pursuant to the provisions of Section 140A of the Companies Act, 1973, as amended, the following benefi cial shareholdings equal to or exceeding 5% of the total issued shares in the company have been determined from an analysis of the statutory disclosures submitted by nominee companies:• ABF Overseas Limited 236 569 232 51.5• Allan Gray Limited 97 080 256 21.1 • Public Investment Corporation 26 975 817 5.9
It should be noted that benefi cial shareholders which are investment managers, will hold shares on behalf of clients, and may or may not hold the relevant voting rights.
Shareholder spreadNon-public shareholders• Holding company 236 569 232 1• Directors 655 627 5• Employees and former employees holding shares in
terms of the Illovo Sugar 1992 Share Option Scheme 1 028 788 46• Trustees of the Illovo Sugar Employees’ Share Purchase
Trust 160 466 1
238 414 113 51.9 53Public shareholders 221 349 244 48.1 3 807
459 763 357 100.0 3 860

146 Annual Report 2011 • ILLOVO SUGAR LIMITED
Shareholders’ diary
Financial year-end March
Annual general meeting July
Reports and profi t statementsInterim report November
Audited group results May
Annual report and fi nancial statements June
DistributionsInterim distribution Declaration November
Payment January
Final distribution Declaration May
Payment July
Shareholders are reminded to notify the transfer secretaries of any change in address.

SHA
REHO
LDER IN
FORM
ATIO
N
ILLOVO SUGAR LIMITED • Annual Report 2011 147
Notice is hereby given that the 96th annual general meeting of the shareholders of the company will be held at the registered offi ce of the company, Illovo Sugar Park, 1 Montgomery Drive, Mount Edgecombe, KwaZulu-Natal on Tuesday, 19 July 2011 at 13:00 to transact the following business:
1. FINANCIAL STATEMENTS To receive and adopt the annual fi nancial statements for the year ended 31 March 2011, including the reports of the
directors and the Audit Committee.
A copy of the annual fi nancial statements appear at pages 93 to 144 of the annual report of which this notice of meeting forms a part.
2. ELECTION OF DIRECTORS2.1 To confi rm the appointment of Mr M Abdool-Samad who was appointed as a director since the previous annual general
meeting, at a meeting of the directors held on 27 May 2011, effective 1 September 2011. A brief curriculum vitae is provided at the foot of this notice.
2.2 To re-elect each of Dr M I Carr and Messrs G J Clark, P A Lister, L W Riddle and B M Stuart who retire by rotation, in terms of the articles of association, and who, being eligible, offer themselves for re-election.
The motions for re-election will be moved individually.
The curricula vitae of these directors are provided on pages 12 and 13 of the annual report.
3. SPECIAL BUSINESS3.1 Special resolutions To consider and, if deemed fi t, to pass the following special resolutions:
3.1.1 Special Resolution No 1: Financial assistance to related or inter-related companies or other legal entities “Resolved as a special resolution pursuant to Section 45(3) of the Companies Act, 2008, as amended (“the 2008 Act”),
that the directors of the company be and they are hereby authorised and empowered, as a general approval contemplated in Section 45(3) of the 2008 Act, to cause the company to provide any direct or indirect fi nancial assistance to any company or other legal entity which is related or inter-related to the company, subject to and in accordance with the provisions of Sections 45(3)(b) to 45(5).”
Explanation On a regular basis, and in the ordinary course of business, the company provides loan fi nancing, guarantees, and other
support to the related and inter-related companies/legal entities in the group from time to time.
Section 45(2) of the 2008 Act empowers the board of a company to provide direct or indirect fi nancial assistance to a related or inter-related company or corporation. However, Section 45(3) of the 2008 Act provides that the board of a company may only authorise any fi nancial assistance contemplated in Section 45(2) thereof pursuant to a special resolution of the shareholders of the company adopted within the previous two years.
The reason for and effect of Special Resolution No 1 is to grant the directors of the company the authority to cause the company to provide fi nancial assistance to any company or other legal entity which is related or inter-related to the company, subject to compliance with the relevant provisions of Section 45 of the 2008 Act.
3.1.2 Special Resolution No 2: Non-executive directors’ fees “Resolved as a special resolution that, unless otherwise determined by the company in general meeting, the annual fees
payable by the company to its non-executive directors, with effect from 1 April 2011, be approved as follows:
Rands per annumCurrent Proposed
BoardChairman* 1 930 000 2 065 000Deputy Chairman*# 1 275 000 1 365 000Other members 190 000 205 000Audit CommitteeChairman 145 000 175 000Other members 80 000 85 000Remuneration/Nomination CommitteeChairman 115 000 125 000Other members 80 000 85 000Risk Management CommitteeChairman 90 000 100 000Other members 70 000 75 000
* Fees inclusive of committee membership fees and payable monthly in arrears. All other fees are paid quarterly in arrears. # This position will fall away at the annual general meeting, when the current Chairman, Mr R A Williams, retires and
his place is taken by the current Deputy Chairman, Mr D G MacLeod.
Notice of annual general meeting
148 Annual Report 2011 • ILLOVO SUGAR LIMITED
Explanation Section 66(9) of the 2008 Act requires that a company may pay remuneration to its directors for their services as directors
only in accordance with a special resolution approved by the shareholders within the previous two years.
The reason for and effect of Special Resolution No 2 is to grant the company the authority to pay fees to its non-executive directors for their services as directors.
3.2 Ordinary resolutions To consider and, if deemed fi t, to pass with or without modifi cation the following ordinary resolutions:
3.2.1 Ordinary Resolution No 1: Appointment of the members of the Audit Committee “Resolved that, pursuant to the requirements of Section 94 of the Companies Act, 2008, as amended, the following non-
executive, independent directors of the company be and they are hereby appointed as members of the Audit Committee until the next annual general meeting:
• Dr D Konar (Chairman);
• Mr M J Hankinson;
• Mrs C W N Molope; and
• Mr T S Munday.”
It is noted that concurrently with his retirement as Chairman and a member of the board at the annual general meeting, Mr Williams’ membership of the Audit Committee will cease.
3.2.2 Ordinary Resolution No 2: Appointment of the independent registered auditors “Resolved that, pursuant to the requirements of Section 90(1), read with Section 61(8)(c) of the Companies Act, 2008, as
amended, and as nominated by the company’s Audit Committee, Deloitte & Touche be and it is hereby re-elected as the company’s independent registered auditors for the fi nancial year ending 31 March 2012.”
3.2.3 Ordinary Resolution No 3: Approval of the remuneration policy “Resolved, as a non-binding advisory vote, that, in accordance with the relevant recommendation contained in the King
Code of Governance for South Africa 2009 (King III), the company’s remuneration policy be and it is hereby approved.”
A copy of the company’s remuneration policy appears at pages 64 and 65 of the annual report.
4. OTHER BUSINESS To transact such other business as may be transacted at an annual general meeting of shareholders.
Brief curriculum vitae of Mr Mohammed Abdool-Samad Mr Abdool-Samad who is 40 years of age, holds a BCom and qualifi ed as a chartered accountant in 1996. From 1996
to 2000, he held various managerial positions at Deloitte & Touche Enterprise Risk Services, both in South Africa and internationally. From 2001 to 2005 he worked for Anglo American plc where he particularly had responsibilities in the risk management fi eld. He was appointed senior fi nance manager of Anglo Coal South Africa in 2005, chief fi nancial offi cer in 2006, and after a restructure, chief fi nancial offi cer of Anglo American Thermal Coal in 2009.
INFORMATION SCHEDULE
Record dateThe record date that has been set by the board for the purpose of determining which shareholders are entitled to receive notice of, participate in, and vote at, the annual general meeting is Thursday, 14 July 2011.
Proxies/representation at the meetingShareholders holding certifi cated shares and shareholders that have dematerialised their shares and have elected own name registration in the sub-register maintained by a Central Securities Depository Participant (CSDP), may attend, speak and vote at the annual general meeting or may appoint one or more proxies (who need not be shareholders of the company) to attend, speak and vote at the annual general meeting on behalf of the shareholder who appointed him.
A proxy form is included as page 151 of the annual report. Duly completed proxy forms must be returned to the transfer secretaries, Link Market Services South Africa (Pty) Limited (PO Box 4844, Johannesburg, 2000 or Rennie House, 13th Floor, 19 Ameshoff Street, Braamfontein, 2001) by no later than 13:00 on Friday, 15 July 2011.
NOTICE OF ANNUAL GENERAL MEETING continued

ILLOVO SUGAR LIMITED • Annual Report 2011 149
SHA
REHO
LDER IN
FORM
ATIO
N
Shareholders who have dematerialised their shares through a CSDP or a broker and who have not elected own name registration in the sub-register maintained by the CSDP and who wish to attend the annual general meeting, should instruct their CSDP/broker to issue them with the necessary authority to attend. Shareholders who are unable or do not intend to attend the meeting, but wish to be represented at the meeting, may provide their CSDP/broker with their voting instructions in terms of the custody agreement entered into between such shareholders and their CSDP/broker.
Identifi cationPursuant to the requirements of Section 62(3) of the Companies Act, 2008, as amended (the 2008 Act), notice is hereby given that in terms of Section 63(1) of the 2008 Act, shareholders and proxies who attend the annual general meeting will be required to provide satisfactory identifi cation.
Voting rightsThe percentage of voting rights that will be required for the adoption of each special resolution, is the support of at least 75% of the voting rights exercised on the resolution.
The percentage of voting rights that will be required for the adoption of each ordinary resolution, is the support of more than 50% of the voting rights exercised on the resolution.
Electronic communicationWith regard to Section 61(10) of the 2008 Act, any shareholder or proxy eligible to attend the annual general meeting but unable to do so, may make arrangements with the company to be connected to the meeting via a teleconference facility. Should any shareholder or proxy wish to use this facility, they should contact the company’s Secretarial and Assistant Legal Services Manager, Mr L M Smith, telephone +27 31 508 4303 by no later than 13:00 on Friday, 15 July 2011, so as to be advised of the relevant dial-in requirements.
By order of the board
G D KnoxCompany Secretary
Mount Edgecombe17 June 2011

150 Annual Report 2011 • ILLOVO SUGAR LIMITED

ILLOVO SUGAR LIMITED • Annual Report 2011 151
Registration number: 1906/000622/06Share code: ILV ISIN: ZAE000083846
For completion only by shareholders holding certifi cated shares, and shareholders that have dematerialised their shares and have elected own name registration.
I/We (name/s in block letters)
of (address)
being the shareholder of the abovenamed company and entitled to: Number of votes
1 share = 1 votedo hereby appoint
1. of or failing him/her
2. of or failing him/her
3. the chairman of the meeting
as my/our proxy to attend, speak and vote for me/us and on my/our behalf at the annual general meeting of the company to be held at the registered offi ce of the company, Illovo Sugar Park, 1 Montgomery Drive, Mount Edgecombe, KwaZulu-Natal on Tuesday, 19 July 2011 at 13:00 and at any adjournment thereof as follows:
Mark with X where applicable
Resolution No Agenda item For Against Abstain
1 Adoption of 2011 annual fi nancial statements
2 Election of directors
2.1 Confi rmation of appointment of director: M Abdool-Samad
2.2 Re-election of directors
2.2.1 M I Carr
2.2.2 G J Clark
2.2.3 P A Lister
2.2.4 L W Riddle
2.2.5 B M Stuart
3.1 Special resolutions
3.1.1 General authority to provide fi nancial assistance to related or inter-related companies/entities
3.1.2 Approval of non-executive directors’ fees
3.2 Ordinary resolutions
3.2.1 Appointment of the members of the Audit Committee
3.2.2 Appointment of the independent, registered auditors
3.2.3 Approval of remuneration policy
Signed at on this day of 2011
Signature
Assisted by me (where applicable) (see note 4)
Full name/s of signatory/ies if signing in a representative capacity (see note 5)
Form of proxyfor the 96th annual general meeting

152 Annual Report 2011 • ILLOVO SUGAR LIMITED
Notes to the Form of proxy
1. A shareholder entitled to attend and vote at the meeting is entitled to appoint one or more proxies to attend, speak and vote in his/her stead. A proxy need not be a member of the company.
2. This proxy form is not for completion by those shareholders who have dematerialised their shares (other than those whose shareholding is recorded in their own name in the sub-register maintained by their Central Securities Depository Participant (CSDP)). Such shareholders should provide their CSDP/broker with their voting instructions.
3. If this proxy form is returned without any indication as to how the proxy should vote, the proxy will be entitled to vote or abstain from voting as he/she thinks fi t.
4. A minor must be assisted by his/her guardian.
5. The authority of a person signing a proxy in a representative capacity must be attached to the proxy unless that authority has already been recorded by the company.
6. In order to be effective, proxy forms must reach the transfer secretaries, Link Market Services South Africa (Pty) Limited, (PO Box 4844, Johannesburg, 2000 or Rennie House, 13th Floor, 19 Ameshoff Street, Braamfontein, 2001) no later than 13:00 on Friday, 15 July 2011.
7. The delivery of the duly completed proxy form shall not preclude any shareholder or his/her duly authorised representative from attending the meeting, speaking and voting instead of such duly appointed proxy.
8. If two or more proxies attend the meeting, then that person attending the meeting whose name appears fi rst on the proxy form, and whose name is not deleted, shall be regarded as the validly appointed proxy.
9. Proxies attending the meeting will be required to provide satisfactory identifi cation.

Company Secretary G D Knox Business address and registered offi ce Illovo Sugar Park, 1 Montgomery Drive Mount Edgecombe, KwaZulu-Natal
Postal address PO Box 194, Durban, 4000 Telephone +27 31 508 4300 Telefax +27 31 508 4535 E-mail [email protected] Website www.illovosugar.com
Group Public Affairs Manager C Fitz-Gerald Telephone +27 31 508 4300 Telefax +27 31 508 4535 E-mail cfi [email protected]
Transfer secretaries Link Market Services South Africa (Pty) Limited Business address Rennie House, 13th Floor 19 Ameshoff Street, Braamfontein, 2001 Postal address PO Box 4844, Johannesburg, 2000 Telephone +27 11 834 2266 Telefax +27 11 834 4398 E-mail [email protected]
Auditors Deloitte & Touche
Attorneys Garlicke & Bousfi eld Incorporated
Principal bankers The Standard Bank Group Limited
Sponsor J P Morgan Equities Limited
Financial adviser The Standard Bank Group Limited
Company registration number 1906/000622/06
Share code ILV
International Security Identifi cation Number ZAE000083846
Corporate information
Principal photographer: Russell Cleaver
