annual report 2011 (pdf) - pfa pension
TRANSCRIPT

PFA Holding
A n n u a l Re p o r t 2011

P F A H o l d i n g A n n u a l R e p o r t 2 0 1 12
P F A H o l d i n g A n n u a l R e p o r t 2 0 1 1 3
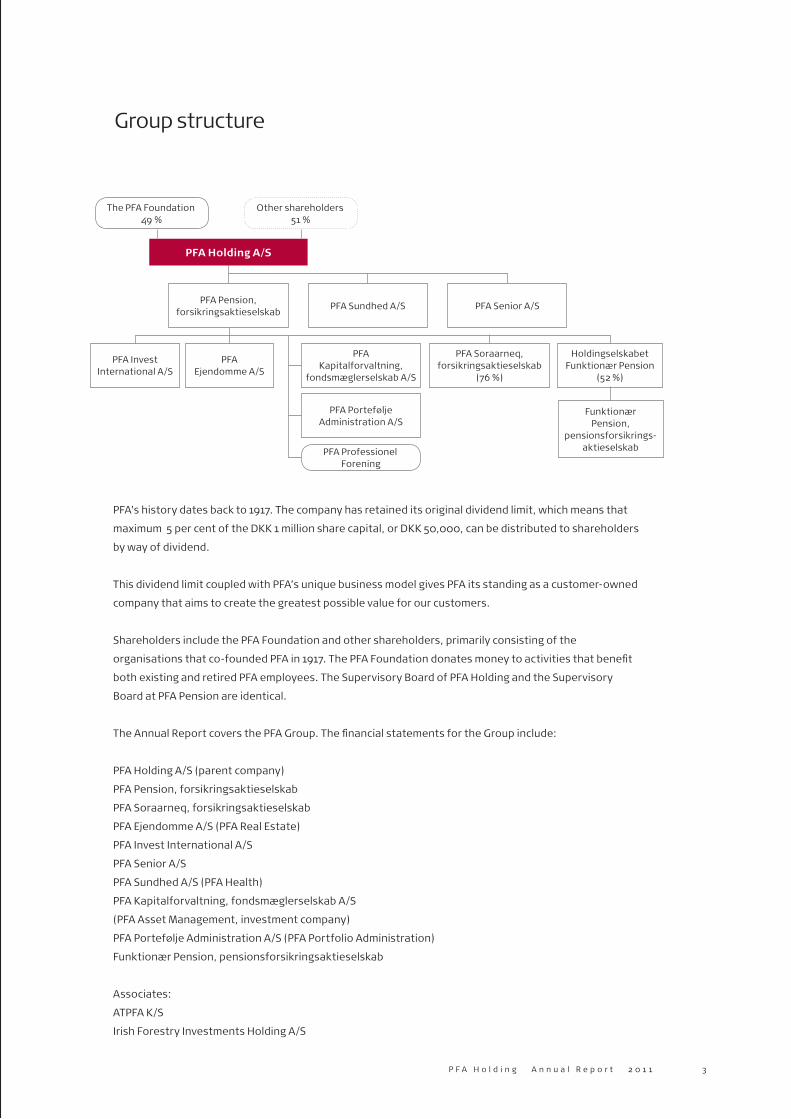
PFA’s history dates back to 1917. The company has retained its original dividend limit, which means that
maximum 5 per cent of the DKK 1 million share capital, or DKK 50,000, can be distributed to shareholders
by way of dividend.
This dividend limit coupled with PFA’s unique business model gives PFA its standing as a customer-owned
company that aims to create the greatest possible value for our customers.
Shareholders include the PFA Foundation and other shareholders, primarily consisting of the
organisations that co-founded PFA in 1917. The PFA Foundation donates money to activities that benefit
both existing and retired PFA employees. The Supervisory Board of PFA Holding and the Supervisory
Board at PFA Pension are identical.
The Annual Report covers the PFA Group. The financial statements for the Group include:
PFA Holding A/S (parent company)
PFA Pension, forsikringsaktieselskab
PFA Soraarneq, forsikringsaktieselskab
PFA Ejendomme A/S (PFA Real Estate)
PFA Invest International A/S
PFA Senior A/S
PFA Sundhed A/S (PFA Health)
PFA Kapitalforvaltning, fondsmæglerselskab A/S
(PFA Asset Management, investment company)
PFA Portefølje Administration A/S (PFA Portfolio Administration)
Funktionær Pension, pensionsforsikringsaktieselskab
Associates:
ATPFA K/S
Irish Forestry Investments Holding A/S
Group structure
PFA Holding A/S
PFA Pension, forsikringsaktie selskab
PFA Sundhed A/S PFA Senior A/S
PFA Invest International A/S
PFA Ejendomme A/S
PFA Soraarneq, forsikringsaktie selskab
(76 %)
PFA Kapitalforvaltning,
fondsmægler selskab A/S
PFA Portefølje Administration A/S
Holdingselskabet Funktionær Pension
(52 %)
Funktionær Pension,
pensionsforsikrings-aktieselskabPFA Professionel
Forening
The PFA Foundation 49 %
Other shareholders 51 %

Saving for your retirement is an important but also
complex undertaking. PFA’s extensive knowledge
and its market leadership are therefore strong
cards to have in your hand. We want to turn this
knowledge into actual value for our customers while
also creating financial value, consultancy value and
service value. In 2011, PFA launched a new market
position with vision, mission, values and a matching
corporate identity programme. Being well prepared,
turning knowledge into recommendations, showing
integrity and delivering a high degree of simplicity
are integral parts of PFA’s market position, which
we call a qualified recommendation. The related
media campaign was well received and won Aurora’s
audience prize in May.
The photographs in the Annual Report 2011 are from
our marketing material.
A qualified recommendation
Preface – a summary of 2011 6
Highlights of the year 8
Group annual review
Sales and advisory services 14
Health, preventive measures and customer services 20
Management and organisation 23
Investments – positive investment returns for 10 years in a row 27
Risk exposure and risk management 34
Development in reserves 38
Value generation 41
Profit or loss for the year 43
Subsidiaries 46
Outlook for 2012 54
Financial statements
5-year summary 56
Financial statements and reports 57
Income statement 60
Balance sheet 62
Statement of changes in equity and capital structure 64
Notes to the income statement and balance sheet 65
The Executive and Supervisory Boards’ directorships 85
TRANSLATION: In case of any discrepancy between the Danish
text and the English translation, the Danish text shall prevail.
Contents

P F A H o l d i n g A n n u a l R e p o r t 2 0 1 16
2011 was a difficult year for the global economy.
A number of events sparked fears of a new global
recession throughout the share markets.
These macroeconomic trends have deeply im-
pacted the financial sector, which also includes
the pension sector. Consequently, the fact that
the PFA Group obtained a return on investment
totalling DKK 27.2 billion, compared to DKK 20.2
billion the previous year, gives cause for great
satisfaction.
Thus, PFA has generated a positive investment
return every single year since 2001. This demon-
strates the company’s ability to navigate safely
through any economic waters.
In terms of customer business volume, payments
totalled DKK 17.7 billion in 2011. Provisions for
insurance contracts, etc., amounted to DKK 282.4
billion at end-2011.
In 2010, payments amounted to DKK 16.3 billion,
excluding DKK 2.2 billion in extraordinary single
payments from two pension funds that trans-
ferred their pension plans to PFA. At the end of
2010, the provisions for insurance contracts etc.
amounted to DKK 258.2 billion. Thus, business
volume went up 9.4 per cent.
PFA disbursed DKK 15.4 billion to customers, a
considerable increase on the DKK 12.9 billion the
previous year. This amount includes both pension
disbursements and disbursements related to vari-
ous insurance cover plans.
Total pension yield tax amounted to DKK 3.9 billion
and will be paid to the Danish Tax Authorities in
2012.
Net operating expenses amounted to DKK 0.8
billion – an increase of DKK 0.2 billion compared to
2010. However, a number of one-off items entail-
ing an extraordinarily low expense level had an
impact on 2010.
The Group’s total profit before tax amounted to
DKK 617 million compared to DKK 580 million the
previous year. Net profit for the year totalled DKK
460 million, which is viewed as satisfactory.
The Group’s balance sheet increased from DKK
299 billion at end-2010 to DKK 325 billion at end-
2011.
At the end of 2011, the Group’s equity amounted
to DKK 5.7 billion and CustomerCapital reached
DKK 15.5 billion. Capital adequacy at year-end
stood at 190 per cent.
2011 brought a series of innovations and the ad-
dition of some large new pension plans. The com-
pany also implemented new legislative initiatives
and continued to update its long-term strategy to
be the pension company of choice on the Danish
market.
Corporate social responsibility
In 2011, PFA formulated a policy concerning the
company’s corporate responsibilities and ethics.
The policy provides both the overall framework for
the company’s business practice and the guide-
lines for its general conduct.
As the largest commercial pension company in
Denmark, we are entrusted with the responsibil-
ity of managing many Danes’ pension funds. As a
customer-owned company, PFA has an ownership
structure that uniquely enables, but also obliges
PFA to create long-term value for our customers in
a responsible manner.
Preface – a summary of 2011

P F A H o l d i n g A n n u a l R e p o r t 2 0 1 1 7
In the course of the last 100 years, PFA has devel-
oped its corporate responsibility, which proves its
calibre in the company’s daily cooperation with
most of the largest companies and organisations
in Denmark.
PFA demonstrates its corporate responsibility by
entering into de facto partnerships aimed at gen-
erating financial value, service value and consul-
tancy value for our customers. These partnerships
are founded on the pension agreement between
PFA and the customer. To this should be added the
extra dimensions that the parties bring to the co-
operation by committing themselves to entering
into a binding partnership. For PFA these include:
• Trust – A partnership regarding pension is based
first and foremost on trust and then on a specific
agreement. Trust that the parties are able to meet
whatever challenges come their way to the sat-
isfaction of both parties. We are convinced that
the value we add to any partnership will ultimately
cement the long-term relationship between PFA
and the customer.
• Responsibility – A partnership with PFA extends
far beyond the words contained in the agreement.
It also embodies the spirit in which the agreement
was made, the bond that engenders effective
daily work together. In our approach to this co-
operation we aim to balance expectations, to set
up success criteria and to follow up regularly on
developments.
Fair and reasonable – Optimum efficiency is the
cornerstone of a daily cooperation.
We pledge this efficiency in the execution of our
pension tasks, including fixing the prices of terms
and insurance cover and settling disbursement
claims according to fair and reasonable principles.
We want the greatest possible openness between
the parties when it comes to terms.
• Goal-oriented – PFA’s business model as a cus-
tomer-owned company, its low level of expenses
and its high returns are central to the company’s
ability to create solutions that focus primarily on
creating value for customers. This constant focus
on value generation ensures that we achieve bet-
ter results - both in the short and long runs.
• Integrity – As a specialist, we bring the com-
pany’s core competencies within pension and life
insurance into play in the pension partnership. PFA
represents no other business areas or interests,
and we put all our energy into this partnership.
This creates integrity and focus.
The idea underlying PFA’s corporate responsibil-
ity and the ways we meet this responsibility is
explained in more detail in the company’s CSR
Report, which has been prepared according to the
guidelines from the UN’s Global Reporting Initia-
tive. The report will be made public at PFA.dk after
PFA’s Annual General Meeting of Shareholders on
25 April 2012.
Yours sincerely
Svend Askær Henrik Heideby
Chairman of the Group CEO and
Supervisory Board President

P F A H o l d i n g A n n u a l R e p o r t 2 0 1 18
Highlights of the year
J A N U A R Y 2 0 1 1
Analysis: PFA delivered
the best market rate
returns in the industry
The Morningstar market
research agency rated the pen-
sion companies with the best
unit linked products in 2010
and for the last three years.
The analysis covered the funds
where the pension companies
have selected the investments
according to the individual
customers’ risk appetite. Most
people who save at market rate
have placed their pension sav-
ings in these kinds of funds.
The analysis showed that PFA
Pension recorded the best re-
turns after expenses in 2010 ir-
respective of risk level. PFA also
topped the list on a three-year
basis. The analysis showed that
PFA had obtained high rates of
return, while individual custom-
ers were at low risk.
Dansk Supermarked
managers changed to PFA
On 1 January, all managers at
Dansk Supermarked moved to
a new pension plan with PFA.
As part of its advisory services,
PFA started using a new “flip
screen” function that allows
customers to use their own PCs
to follow the screen images
from which PFA was providing
its advice. Many managers also
received telephone consulta-
tions in the evening, as this
best suited their work situation.
Dansk Supermarked’s other
employees were already cus-
tomers with PFA.
Insurance price cuts of up to
30 per cent
PFA reduced the price of a
number of insurance plans from
the beginning of 2011. Custom-
ers thus experienced a price
reduction of up to 25 per cent
on cover against loss of occupa-
tional capacity and up to 30 per
cent on life insurance.
Customers with average
interest rate products
grouped according
to guarantees
According to new industry rules
from the Danish Financial Su-
pervisory Authority, PFA divided
customers with average interest
rate products into four interest
rate groups broken down by
technical rates as well as into
risk and expense groups as at 1
January. Investment assets were
distributed on individual groups,
each with its own investment
strategy aimed at optimising
every pension saver’s return.
M A R C H 2 0 1 1
PFA - best reputation among
customers
PFA has an outstanding reputa-
tion among pension companies.
The Infomedia market research
agency followed trends in how
customers assessed 500 brands
in the Nordic region. The devel-
opment in PFA’s reputation was
assessed each quarter, measur-
ing 9.0 in Q1 – up from 8.2 in Q1
of 2010.
The Infomedia/You Gov brand
score includes six parameters:
• General impression
of the brand
• Is the brand associated
with high quality?
• Pride in working for the
company
• Does the brand give value
for money?
• Customer satisfaction
• Willingness to recommend
the brand to others.
A P R I L 2 0 1 1
Extended reporting on
corporate responsibility
In the first six-month period, PFA
further developed its initiatives
for responsible investments
and improved its efforts within
active ownership. At the heart
of active ownership lies the
dialogue with the companies in
which PFA has invested, and we
introduced a new process for
submitting votes at the annual
general meetings of non-Danish
companies. This will better
enable PFA to vote along with
other investors.
PFA published its second CSR
report on 29 April in connection
with the company’s Annual Gen-
eral Meeting of Shareholders.
The report was more extensive
than last year’s and included a
description of PFA’s initiatives.
For the first time, the report
was published solely digitally,

P F A H o l d i n g A n n u a l R e p o r t 2 0 1 1 9
and is available in both Danish
and English on PFA’s website at
PFA.dk.
M A Y 2 0 1 1
PFA in new property
investment fund
Together with ATP, Industriens
Pension and Ejendomsselskabet
Norden A/S, PFA established
the Norden IV K/S development
company, which will invest in
business properties for a total
of DKK 1.8 billion. PFA owns 32
per cent of the fund, which is
managed by Ejendomsselskabet
Norden A/S.
The fund invests in Copenhagen
area properties where active
management can create added
value. The investment proper-
ties are often vacant or partially
vacant or have leases that do
not reflect current market con-
ditions. The fund’s first property
acquisition was the SCALA build-
ing at Axeltorv, Copenhagen.
Image improvement for PFA
among decision-makers
PFA advanced seven places to
a ranking as number 45 in the
annual image rating conducted
among Danish decision-makers
by Berlingske Nyhedsmagasin.
Thus, PFA continued the sub-
stantial improvement seen in
2009, when PFA advanced 30
places.
The improvement resulted
from a more favourable as-
sessment of PFA’s employees’
competencies and the quality
of PFA’s products and services.
The improvement was particu-
larly positive because pension
companies were generally rated
more poorly. This means that
PFA improved its market posi-
tion. The survey included 140
companies, assessed by 3,700
business executives using nine
image parameters.
PFA launched new market
position
PFA launched its new market po-
sition with a corporate concept
that formulates a vision, mission
and values as well as a related
corporate identity programme.
Being well prepared, turning
knowledge into recommenda-
tions, showing integrity and
delivering a high degree of sim-
plicity are integral parts of PFA’s
market position, which we call a
qualified recommendation. The
related media campaign was
well received, winning Aurora’s
audience prize in May. J U N E
J U N E 2 0 1 1
PFA invests in Carlsberg Byen
PFA undertook to acquire 19.99
per cent of the Carlsberg Byen
development project. The seller
is Carlsberg, which, like Re-
aldania, will continue to own 25
per cent of the property. PFA’s
participation is contingent upon
investors being found for the
remaining 30 per cent.
Carlsberg Byen is the former
brewery quarter in Valby, where
Carlsberg has had its head of-
fice since 1847. Carlsberg Byen
covers more than 567,000 sq.
metres of area with develop-
ment rights and is expected to
be developed in various phases
over a span of time of 20 years.
Reserves are brought along
when switching to PFA Plus
When individual customers
switch to PFA Plus and trans-
fer their savings from average
interest rate products, they can
bring along an undivided share
of the unallocated reserves.
Initially, PFA gave customers a
transfer allowance for a period
in June and again in Septem-
ber, when relevant customers
received a letter offering the
option. The size of the allow-
ance depended on the reserves
of the interest rate group and
tended to be larger for older
pension savings than for newer
ones.
From 1 November, PFA offered
the possibility of transferring
savings with reserves on an on-
going basis, and the allowance
was subsequently calculated
monthly.
PFA ready with half a
billion Danish kroner for
growth companies
PFA had DKK 520 million ready
to invest in growth companies
through Dansk Vækstkapital.
PFA was the first commercial
player to make a specific com-
mitment.
Earlier in the year, the pension
industry and the Danish govern-
ment agreed that the pension
companies as well as ATP and LD
were to contribute DKK 5 billion
to Dansk Vækstkapital, which
will make capital available for
entrepreneurs and small growth
companies. PFA thus contrib-
uted to Danish innovation

P F A H o l d i n g A n n u a l R e p o r t 2 0 1 11 0
and growth among small and
medium-sized enterprises.
PFA won real estate award
For the second year running,
PFA Ejendomme received inter-
national recognition when the
year’s European prizes were
awarded at the IPE Real Estate
Awards in Amsterdam. In 2010,
PFA received the award for
“Best Institutional Investor in
Nordic countries”, and in 2011
won in the “Best Core Invest-
ment” category. The jury gave
PFA the award for the following
reasons:
• PFA’s high returns in 2010
despite difficult market
conditions
• PFA’s focus on tenants and
contracts resulted in a
healthy income and a high
occupancy rate
• PFA’s regular market surveys,
which secured investments
in growth areas nationally
and internationally
J U LY 2 0 1 1
Expense calculator showed
low costs at PFA
PFA Plus customers realised sav-
ings because the pension solu-
tion has lower costs than similar
products on the market. This
was clear from the new web-
based expense calculators made
public by the pension companies
on 1 July. The calculators showed
both direct and indirect costs as
an annual percentage rate or as
an amount. Berlingske Tidende
compared pension companies
in its 2 July 2011 edition. In the
comparison annual expense
percentage rates in life cycle
products ranged from 0.70 to
1.11 per cent, with PFA Plus be-
ing the product with the lowest
expenses.
A U G U S T 2 0 1 1
DKK 220 million back to
customers
PFA returned some DKK 220 mil-
lion to individual customers as
there were fewer insurance dis-
bursements than expected. The
distribution involved pension
plans with a special agreement
on profit distribution. It was
gratifying to see how a stronger
focus on health and prevention
appeared to have good effect.
The better customers are at
taking care of themselves and
their health, the more money is
available for distribution.
S E P T E M B E R 2 0 1 1
PFA Plus – the preferred
product among C20
companies
PFA Plus is the preferred pen-
sion product among the largest
Danish companies – in the C20
index alone, nine companies had
selected PFA Plus for their em-
ployees. At the end of the year,
this figure had increased to 10.
O C T O B E R 2 0 1 1
The Danish Chamber of
Commerce (Dansk Erhverv)
was the first labour market
pension customer at PFA Plus
PFA concluded an agreement
with its first collective agree-
ment customer about a transfer
to PFA Plus. The framework
agreement with Dansk Erhverv
was renewed, following which
just under DKK 1 billion in annual
premiums can be converted into
market rate. All new members
of Dansk Erhverv will automati-
cally be offered PFA Plus. Dansk
Erhverv represents 20,000
companies and 100 industrial
organisations within trade,
consultancy and knowledge ser-
vices, leisure activities, welfare
and transport.
Federation of Retail Grocers
in Denmark a new customer
On 1 October, a new pension
agreement came into force be-
tween the Federation of Retail
Grocers in Denmark (DSK) and
PFA Pension. The agreement
was concluded on the basis
of DSK’s membership of the
Danish Chamber of Commerce
(Dansk Erhverv), which cooper-
ates with PFA through Dansk
Erhverv Pension. The agreement
offered the grocers and their
employees low costs and low
insurance prices in PFA’s market
interest product, PFA Plus. DSK’s
members account for almost
one third of nondurable goods
sales in Denmark. DSK has 1,500
members and employs more
than 22,000 shop assistants.
Facebook success generated
support for hospital clowns
The PFA Live Life Foundation
supports passionate individu-
als who help others live life. The
good cause of the year was
Danske Hospitalsklovne (Danish
Hospital Clowns), which will
receive DKK 125,000 as well
as help from PFA in attracting
attention to the worthy cause.
The money will go to training
new hospital clowns. The Foun-
dation also donated DKK 25,000
to TUBA – advisory services for
young people in families af-
fected by alcohol abuse.
P F A H o l d i n g A n n u a l R e p o r t 2 0 1 1 1 1
PFA established the Foundation
to give people deeply commit-
ted to good causes the oppor-
tunity to be heard and generate
attention and support to their
causes. To this end, in 2011 PFA
made Facebook a platform for
the Foundation and the setting
for the annual vote. Almost
24,000 people voted for one of
the just over 200 good causes
proposed. During the campaign,
the site was among the fastest-
growing Facebook pages in
Denmark.
Improved international
advisory services
PFA launched a new concept,
“PFA International Advisory
Services”, to give international
employees with a PFA Plus plan
better advisory services in
English. As part of launching the
new concept, PFA opened a full
version of PFA.dk in English.
N O V E M B E R 2 0 1 1
Danish Agricultural Advisory
Service (Dansk Landbrugs-
rådgivning) selected PFA
With effect from 1 January 2012,
PFA and the Danish Agricultural
Advisory Service concluded a
framework agreement for 32
counselling centres. Danish
farmers own the Agricultural
Advisory Service through local
associations and the Danish
Agriculture & Food Council.
As much as 90 per cent of all
Danish farmers are organised
through these organisations
and will now have PFA Plus, the
leading pension product. The
new framework agreement
marked a breakthrough for PFA
for this type of customer.
Danfoss selected PFA as
its pension partner
The Danfoss industrial group
chose to change pension part-
ners, switching to PFA at 1 Janu-
ary 2012. Later in 2012, Sauer
Danfoss will also switch to PFA.
The group will have PFA Plus.
The contract with PFA covers
approximately 6,000 employees
in Denmark. All employees will
also be covered by PFA Health
Insurance. Besides Danfoss,
Sauer Danfoss (approximately
600 employees) has also se-
lected PFA as its future partner.
New research and business
park in PFA property
Nokia Danmark A/S, Aalborg
University and PFA Real Estate
agreed that the present Nokia
development centre in Co-
penhagen will be relocated to
Aalborg University, starting
from January 2012. The Uni-
versity is thus planning one of
Denmark’s most innovative
private-public partnerships
on applied research in Danish
companies. Nokia also donated
research equipment from the
existing facilities to the coming
Copenhagen Innovation Centre,
where start-up companies,
growth companies, researchers
and students will work closely
together.
PFA morning brief for
top executives
PFA launched a new execu-
tive seminar series called “PFA
Morgen Brief” for executive em-
ployees in the Danish corporate
sector. PFA wanted to create a
forum for top executives where
they can share their knowledge
and experience in areas like
growth and innovation. Moreo-
ver, we wanted to strengthen
relations with existing custom-
ers and create new relations.
Between 50 and 70 executives
participated in each of the first
two events, where Mr Povl
Krogsgaard-Larsen, Chairman of
Carlsberg’s Board of Directors,
and Mr Per Mikael Jensen, CEO
of Metro International, respec-
tively, were guest speakers.
D E C E M B E R 2 0 1 1
Mediernes Pension selected PFA
Mediernes Pension selected PFA
as its supplier of the compulsory
group insurance plan covering
7,000 journalists and media ex-
ecutives, who can also choose
to put their savings in PFA Plus.
This regains PFA its position as
the main supplier for employees
in the media sector.
The new agreement strength-
ened cooperation between
PFA and a wide array of media
houses that already have pen-
sion agreements with PFA for
other professional groups. At
the same time, PFA cemented
its position as the preferred
pension partner for the large
organisations of salaried em-
ployees in Denmark.
Siemens Wind Power new
customer with PFA
Siemens Wind Power, which has
about 3,500 covered employ-
ees, selected PFA as its future
pension supplier. Siemens
Denmark has been a customer
with PFA for 25 years, and the
Siemens group wanted only one
pension partner for all its com-
panies in Denmark. The group’s
employees will now be offered
PFA Plus. The new plan also in-
cluded PFA Health Insurance for
just over 5,000 employees.


CliChé #6:Use a roCk star to make yoUr
prodUCt look sexy
In the Danish mass media, PFA blatantly caricatures classic
financial sector clichés. We call this “nonsense communication”.
We use celebrities who play themselves in anti-commercials and
communicate the message that advisory services are not about
eye-catchers and superficial statements. True advice requires
a meeting with PFA. This is the only way we can explain all the
details of a pension plan. And – above all – offer a qualified
recommendation.

P F A H o l d i n g A n n u a l R e p o r t 2 0 1 11 4
PFA turns knowledge into value for our customers.
And we create value on several levels – financial
value, consultancy value and service value.
PFA enjoyed an excellent year in 2011 when it
came to working with our customers. We saw a
fundamentally sound and controlled growth in
payments in a market characterised by economic
slowdown and political intervention.
PFA did not lose one single large account serviced
directly in 2011. What is more, PFA’s pension advis-
ers experienced a very busy year with sales to our
individual customers at unprecedented levels.
Pension plan sales to small and medium-sized
companies remained stable throughout the year,
which finished with a number of major companies
and organisations selecting PFA as their new
supplier.
An increase in customer satisfaction was seen
among decision-makers at large and small compa-
nies and organisations as well as individual cus-
tomers. Customers were highly satisfied with the
actual sales situation and the advisory services
provided in relation to the pension plan, but also
with the customer contact connected with the
disbursement of a pension or insurance plan. And
both decision-makers and customers generally
gave PFA’s reputation a higher rating during 2011.
Total payments
Total payments to the PFA Group amounted to
DKK 17.7 billion in 2011 compared to DKK 16.3 billion
the previous year, not including an extraordinary
single payment from two pension funds in 2010.
This corresponds to a strong total growth of 9
per cent. The growth is attributable to the influx
of new customers from other pension companies
and additional sales to existing customers.
Throughout the year, the sales organisation
focused on retaining existing large corporate and
organisational customers by maintaining close
relationships and offering customers the option
to switch to PFA Plus. This conversion is occurring
more quickly than expected, and a look at the
large accounts reveals that one third of premium
revenue went to PFA Plus at the end of the year.
Payments to market rate plans amounted to a
total of 47 per cent of the total payments com-
pared to 24 per cent in 2010. In 2009, the share of
payments that went to market rate plans was 12
per cent.
Small and medium-sized accounts were also given
the option to switch to PFA Plus. The effect of
new sales and the transition to PFA Plus meant
that 63,000 individual customers had PFA Plus at
end-year.
Sales and advisory services
Payments - the PFA Group
DKK million 2011 2010
Regular payments 12,571 12,509
Payments – group term life 904 871
Single payments and transfers 4,209 2,892*
Total payments 17,684 16,271
* Payments from 2010 do not include extraordinary single payments amounting to DKK 2.2 billion in connection with the transfer of pension plans from two pension funds to PFA.
2011 2010 20090
10
20
30
40
50
Payments to market rate plans in per cent of total payments
P F A H o l d i n g A n n u a l R e p o r t 2 0 1 1 1 5
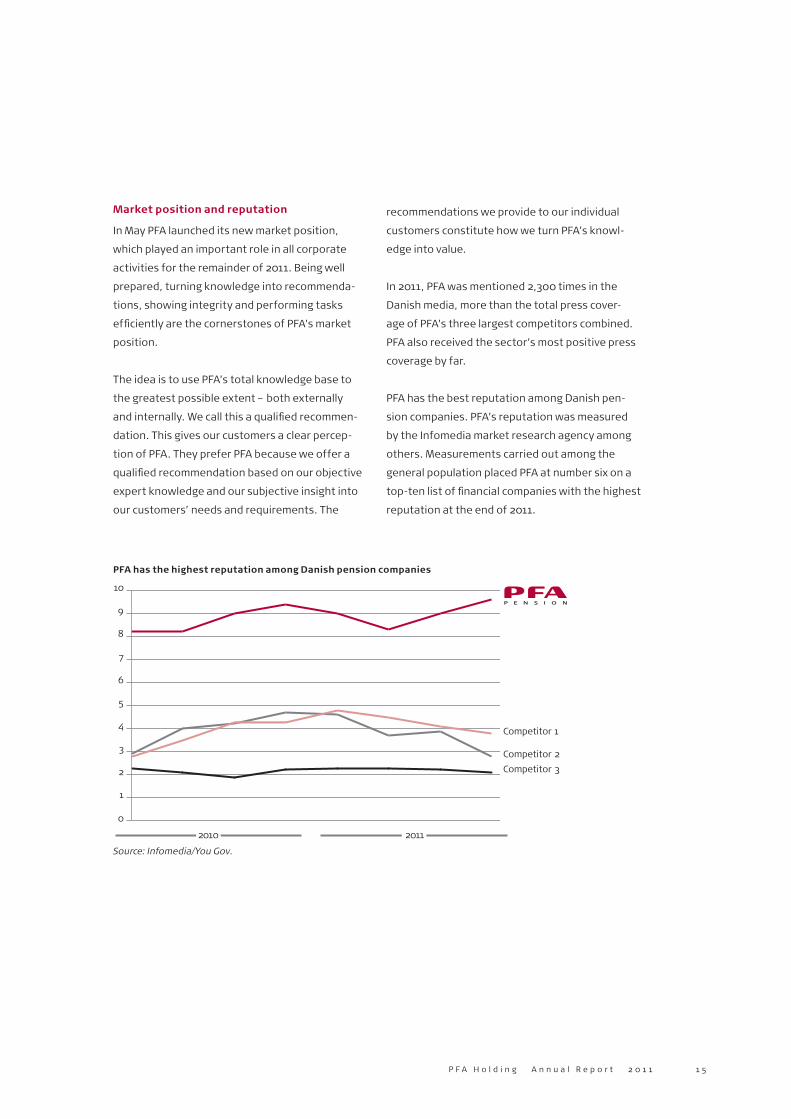
Market position and reputation
In May PFA launched its new market position,
which played an important role in all corporate
activities for the remainder of 2011. Being well
prepared, turning knowledge into recommenda-
tions, showing integrity and performing tasks
efficiently are the cornerstones of PFA’s market
position.
The idea is to use PFA’s total knowledge base to
the greatest possible extent – both externally
and internally. We call this a qualified recommen-
dation. This gives our customers a clear percep-
tion of PFA. They prefer PFA because we offer a
qualified recommendation based on our objective
expert knowledge and our subjective insight into
our customers’ needs and requirements. The
recommendations we provide to our individual
customers constitute how we turn PFA’s knowl-
edge into value.
In 2011, PFA was mentioned 2,300 times in the
Danish media, more than the total press cover-
age of PFA’s three largest competitors combined.
PFA also received the sector’s most positive press
coverage by far.
PFA has the best reputation among Danish pen-
sion companies. PFA’s reputation was measured
by the Infomedia market research agency among
others. Measurements carried out among the
general population placed PFA at number six on a
top-ten list of financial companies with the highest
reputation at the end of 2011.
Source: Infomedia/You Gov.
Competitor 1
10
9
8
7
6
5
4
3
2
1
0
Competitor 2
Competitor 3
2010 2011
PFA has the highest reputation among Danish pension companies

P F A H o l d i n g A n n u a l R e p o r t 2 0 1 11 6
Advisory services
When it comes to pension savings, advisory ser-
vices are more important than ever. New possibili-
ties and new products combined with a great deal
of new rules and relatively low consumer aware-
ness all mean that pension companies play a key
role in ensuring that individual savers are offered
the best terms and get the pension plan that best
suits their needs. For this reason, a personal pen-
sion consultation is essential.
PFA held 47,000 personal pension consultations
- approx. 2,000 more than in 2010, and 10,000
more than in 2009. Additional sales attributable
to the pension consultations amounted to DKK
3.3 billion. This is DKK 800 million higher than the
additional sales attributable to pension consulta-
tions in 2010 – a record at PFA. Customer satisfac-
tion with the consultation itself remained at a very
high level. The personal pension consultation is
immensely important, as this is when customers
can adjust the insurance cover and savings in their
plans to suit their needs.
The qualified recommendation and a strong cus-
tomer experience are of paramount importance in
the new market position, and PFA launched a se-
ries of initiatives to improve the overall customer
experience. PFA pension advisers were given train-
ing that included a focus on identifying needs, and
new technology made it easier to communicate
about the product. Apple’s iPad is now part of
pension advisers’ everyday work, and its interac-
tivity greatly enhances the pension consultation
experience. Pension advisers use the iPad to map
customers’ needs and to gather information about
the customer before the meeting is held.
To raise decision-makers’ awareness of PFA’s
services and offers, we defined 14 advisory service
concepts. This resulted in a uniform presentation
that introduced PFA’s products and services more
simply and clearly while also ensuring that they
met customers’ needs. The concepts represented
an improvement on existing offers and services
but also included new offers. In 2011, we intro-
duced PFA Optimator – an advisory service tool
that proactively improves the pension plan; PFA
International Advisory Services, a collection of
services offered in connection with pension and
tax issues arising from expatriate service; the C20-
package, a meeting concept that ensures a high–
quality, uniform presentation of PFA; and PFA
Morgen Brief, a series of 10 annual presentations
featuring executive employees from the Danish
business community.
Throughout 2011, PFA’s Advisory Services Centre
was easily accessible with short response times
both over the telephone and by e-mail. Customers
acknowledged this extremely high service level in
our ongoing satisfaction surveys.
The new Danish Finance Act from December
contained a range of tax changes that will make
saving for retirement less beneficial. These major
changes include a lower deduction for savings to
an instalment pension, down to DKK 50,000, and
a higher tax on pension yield. The changes in the
Finance Act and the parties’ political plans set in
the national election also meant that PFA had to
heighten its information activities at the end of
the year. This will also increase the need for advi-
sory services in 2012.
New Letpension
During 2011, all of PFA’s existing agreements with
financial institutions were collected in one overall
agreement and portfolio under Letpension, and
the products were incorporated into a new com-
mon line of products. These developments will
strengthen customer experience, increase com-
petitiveness and create greater transparency.
Together with Letpension and the financial institu-
tions, PFA is now ready to take on the new market
possibilities opened up by the changed tax rules in
the Finance Act 2012. Sales via Letpension came to

P F A H o l d i n g A n n u a l R e p o r t 2 0 1 1 1 7
30,000 risk insurance plans in 2011 and, together
with payments for annuities, exceeded the total
revenue of DKK 1 billion from this area.
Improved partnership with brokers
PFA intensified its cooperation with the pension
brokers during the year. Administrative processes
were streamlined, thus creating the basis for bet-
ter customer services as customer data was ex-
changed with brokers digitally. This new solution
was the result of broader industry cooperation.
The solution was introduced to two large pension
broker companies during H2 2011, meaning even
faster customer services and a more complete
customer experience in 2012.
On 1 July 2011, the new broker legislation put a
stop to commission agreements and paved the
way for a more transparent market. The role of
a pension broker is now more strongly based on
impartiality. This is great news for customers, as
competition now takes place on market terms.
Whether or not an adviser is involved in the pen-
sion supplier selection process – the final decision
rests with the customer.
PFA’s private economist –
pension on consumers’ agenda
After the summer, PFA set up a position for a
private economist. The objective was to increase
the quality of advisory services and communica-
tion and develop new initiatives.


CliChé #4:let an aCtress make yoUr message more appealing
The nonsense-communication we use in our ads starkly
contrasts our no-nonsense communication. We use this type
of communication when we talk to our customers directly.
Our presentations, brochures, website, correspondence and
much more contain no marketing gimmicks. We convey the
bone-dry facts in a straightforward manner. And we use photo-
graphs of PFA’s own employees, customers and properties.
We also launched an internal programme to improve PFA
employees’ ability to offer a qualified recommendation
– both externally and internally.
P F A H o l d i n g A n n u a l R e p o r t 2 0 1 12 0
A key part of a strong customer experience is the
competent service provided when customers
need to use their insurance cover. PFA gives great
priority to the service it offers in claims situations,
with the focus being on the customer’s access to
qualified and personal advice.
In 2011, we received well over 140,000 customer
inquiries related to claims. PFA’s Health Centre
handles all claim-related calls and is perceived as
readily accessible with short waiting times.
In 2011, the processing times for most claims met
or exceeded PFA’s service level goals. For instance,
customers asking whether their PFA Health Insur-
ance or PFA Critical Illness provided cover received
an answer in less than two days on average. The
majority of customers with a PFA Health Insurance
plan received an examination or treatment within
5-10 days.
PFA Health Insurance and PFA Preventive Care
In total, approx. 190,000 customers have a PFA
Health Insurance or PFA Preventive Care plan.
With the new sales in 2011, more than 15,000 new
customers will have an insurance plan in 2012, a
number that puts PFA among the largest provid-
ers on the Danish health insurance market. During
2011, 32,000 individual customers used their PFA
Health Insurance on one or more occasions.
In 2011, customers with PFA Health Insurance
could opt to receive their awards via e-Boks, and
at end-2011 the Health Centre’s electronic billing
system handled all bills. In most cases, PFA either
settled bills directly with treatment facilities or
reimbursed customers via their NemKonto Easy
Account.
We improved the insurance plans with new terms
and conditions that took effect on 1 January 2012.
Among other things, this meant shorter waiting
periods after surgery and new cover for reflex-
ology, doctor-prescribed transportation and
hazardous sports.
PFA Critical Illness
951 customers were awarded a disbursement from
PFA Critical Illness compared to 949 disburse-
ments the previous year. More than half of these
disbursements were cancer-related. Although
the number of awards increased only slightly, the
disbursements increased by DKK 6 million, as the
average disbursement was higher.
Active Claims Handling
During 2011, 3,200 customers applied for a dis-
bursement from their insurance against loss of
occupational capacity. PFA’s focus was on helping
customers that received disbursements back to
work. This is also Active Claims Handling. In 2011,
we assessed the situation of 1,252 customers.
These customers were all in contact with PFA in
connection with a disbursement from a disability
pension or their PFA Health Insurance.
Of these 1,252 customers, we offered 270 custom-
ers additional advice on how they could improve
the course of their illness and thus increase their
chances of returning to the labour market more
quickly. This also improves the individual’s quality
of life and reduces PFA’s disbursements, which
ultimately keeps prices down to the benefit of all
of our customers.
Efficient customer services
2011 saw a dramatic increase in the number of PFA
Plus plans, both due to new sales and the transfer
of existing plans and deposits. As more custom-
ers receive PFA Plus, processesing can be further
streamlined, as the processing times for many PFA
Plus tasks are significantly shorter than those for
the average interest rate product. At the end of
Health, preventive measures
and efficient customer services

P F A H o l d i n g A n n u a l R e p o r t 2 0 1 1 2 1
2011, a total of 154 company agreements had been
transferred to PFA Plus.
The use of IT to process cases additionally stream-
lined the handling of administrative tasks, and
working procedures were optimised and automat-
ed. In total, the efforts in the customer services
departments generated an efficiency gain of 10
per cent.
As part of the streamlining efforts, all customer
services tasks were gathered at PFA’s head of-
fice, and the local Aarhus department was closed
during the summer 2011. PFA’s sales office is still
located in Aarhus.
Simplified and modernised IT portfolio
In 2011, PFA continued to simplify, improve and
modernise the total IT portfolio. We worked with
the aim of supporting the greater number of PFA
Plus customers. The underlying programs were
examined and upgraded to ensure that our IT
systems have no capacity issues as the number of
customers increases. The IT focus was on large,
technical consolidation projects geared to simplify
the system landscape and reduce the number
of subcontractors. In 2011, several projects
that greatly impacted internal processes were
implemented, and several areas that had been
serviced manually became system supported. The
project portfolio included an increasing number of
projects launched to satisfy new legislation and
regulations.
Equal and improved handling of claims
In 2011, PFA’s complaints department received 215
complaints, which is effectively the same as last
year. The number of complaints was low in view
of the fact that PFA has over 1.2 million insurance
plans and receives more than 250,000 customer
telephone enquiries annually. 44 per cent of the
215 complaints were dismissed, 30 per cent were
handled with additional advisory services or extra
informational material, and 26 per cent of the
complaints were decided in favour or partial fa-
vour of the customer. Most complaints were about
communication or advisory services whereas 74
complaints were about disbursements and case
decisions. Of the latter 74 complaints, only four
were decided in favour of the customer
In 2010, PFA’s legal department was incorporated
into the complaints department. The integration
of legal expertise as needed increased quality and
gave all parties a greater sense of security. Four
complaints that were handled by the complaints
department in 2011 went on to the Insurance
Complaints Board, and PFA won the one case that
was settled in 2011.
PFA meets the upcoming EU consumer
protection initiative
In November, the European Supervisory Author-
ity (EIOPA) for insurance and pension companies
prepared draft guidelines for treating complaints
in insurance companies. The intent was to create
more equal consumer protection among the EU
member countries’ insurance companies.
The guidelines have not yet resulted in a new act,
but PFA expects the new legislative requirements
not to involve any changes, as PFA’s complaints
department’s control procedures, organisation
and service level already meet the proposed
requirements.
Customer representative – trust and openness
PFA’s Customer Representative, who acts as a
claims attendant, is a person for customers to
contact if they are unhappy with a decision con-
cerning a complaint. This allows closed complaints
to be reopened, and PFA offers special advisory
services to customers with questions regarding
the final decision.

P F A H o l d i n g A n n u a l R e p o r t 2 0 1 12 2

P F A H o l d i n g A n n u a l R e p o r t 2 0 1 1 2 3
Management and organisation
PFA’s corporate responsibility is based on almost
100 years’ experience, a unique position and PFA’s
special ownership structure. As a company owned
by its customers, PFA is entrusted with the great
responsibility that comes with administering the
Danes’ pension funds. At PFA we base our busi-
ness on our customers, employees and society’s
trust in us. The integrity of our company is at the
core of our business relations.
Trust and integrity primarily lies within the person-
al conduct of each PFA employee. We call this fair
and reasonable conduct. It means that PFA should
run its business fairly and reasonably in terms of
its employees, its customers and its surroundings.
PFA’s conduct is in keeping with Danish legislation,
industrial standards and the international princi-
ples regarding CSR and sustainability under which
PFA has decided to do business.
PFA’s actions stem from the company’s strategy,
its business needs as well as internal and external
values. They are founded in a number of policies
originating in the company’s approach to risk. Poli-
cies and guidelines are decided by the Supervisory
Board, and all PFA employees must know and
understand our policies, guidelines and rules of
conduct. In 2011, the Supervisory Board adopted a
policy on PFA’s corporate responsibility and ethics
that updated the existing CSR policy.
Annual General Meeting of Shareholders and
the Supervisory Board
PFA’s supreme authority is the Annual General
Meeting of Shareholders and the ordinary AGM is
held every year before the end of April.
The AGM elects the Supervisory Board, which is in
charge of the overall management of the com-
pany. The PFA Pension Supervisory Board and the
PFA Holding Supervisory Board are identical. The
Board has 14 members, of which five are employee
elected. The Board meets at least six times a
year and also holds a seminar where a number of
selected strategic issues can be examined more
closely.
The Supervisory Board’s duty is to oversee the
company’s business and ensure that the company
is run in a responsible manner that follows the rel-
evant rules and legislation. The Supervisory Board
hires and fires the company’s Executive Board,
Chief Actuary and Chief Internal Auditor. In consul-
tation with the Executive Board, the Supervisory
Board decides on the company’s daily manage-
ment and operations. At all meetings, the Super-
visory Board receives a report on the company’s
operations, financial statements, investments,
capital and risk structure and technical accounts.
The chairmanship consists of the Chairman and
the Vice-Chairman of the Supervisory Board, who,
together with the Executive Board, prepare the
Board’s meetings at the chairmanship meet-
ing. The Supervisory Board has set up an Audit
Committee and a Remuneration Committee. The
Supervisory Board is elected for four years at a
time and the members can be re-elected.
Audit committee
PFA’s Audit committee consists of the three
members of the Supervisory Board.
• Jørn Neergaard Larsen, Chairman
• Svend Askær
• Torben Dalby Larsen.
The Audit Committee’s responsibilities include
monitoring the financial reporting process and the
statutory audit of the financial statements and
overseeing the efficiency of the company’s inter-

P F A H o l d i n g A n n u a l R e p o r t 2 0 1 12 4
nal controls, internal audit and risk management
systems. Furthermore, the Audit Committee must
monitor and control auditors’ independence.
In 2011, PFA’s Audit Committee held five meetings.
At several meetings, both internal and external
auditors participated.
At least one member of the Audit Committee must
be independent of PFA and possess accounting or
auditing qualifications. This member is currently
Jørn Neergaard Larsen. He is independent of PFA,
and from 1982-1996 was employed as managing
director of DJØF, the Danish Association of Law-
yers and Economists, including the Lawyers’ and
Economists’ Pension Fund, and in this connection
was responsible for all finance and auditing func-
tions in these companies.
Remuneration committee
PFA has developed a business model that centres
on creating value for customers. To achieve this,
efforts are focused on obtaining the maximum
investment return and keeping direct and indirect
expenses to a minimum.
This business model means that the PFA Group’s
remuneration should be made according to fair
and reasonable principles. Remuneration should
be made in consideration of the Group’s objective
to create the greatest possible value for custom-
ers - both in the short and long runs.
This dictates that remuneration should not involve
incentives to take unnecessary risks.
At the same time, the PFA Group must ensure that
the company offers competitive remuneration
that matches the created value. Remuneration
should conform to the market and be fixed in con-
sideration of the PFA Group’s desire to be able to
attract and retain qualified employees at all times.
Together with other employment terms, remu-
neration should reflect the customers’ and the
company’s interests and promote the long-term
objective of creating value for customers as well
as foster sound and efficient risk management.
Members elected at the AGM Board meetings and seminars
8 meetings in 2011
Audit Committee meetings
5 meetings in 2011
Remuneration Committee meetings
3 meetings in 2011
Svend Askær (Chairman) 8 5 3
Jørn Neergaard Larsen (Vice-Chairman) 7 5
Hans Skov Christensen 7 3
Gita Grüning 5
Erik G. Hansen 7 3
Peter Ibsen 5
Per Jørgensen 8
Torben Dalby Larsen 7 5
Poul Erik Pedersen 4
Employee-elected members
Klavs Andreassen 8
Lars Christoffersen 8
Hanne Jensen 6
Thomas P. Jensen* 5
Mette Risom* 5
* Member since April 2011
Meeting attendance of the Supervisory Board

P F A H o l d i n g A n n u a l R e p o r t 2 0 1 1 2 5
PFA’s Remuneration Committee consists of the
three members of the Supervisory Board:
• Svend Askær, Chairman
• Hans Skov Christensen
• Erik G. Hansen.
On behalf of the Supervisory Board, the Remu-
neration Committee carries out the preliminary
work used in connection with salary policy for the
Supervisory Board, the Executive Board and other
major risk takers, including recommending the
salary policy for the Supervisory Board’s approval
and recommending the Executive Board’s remu-
neration to the Supervisory Board. During the
preliminary work, the Committee is attentive to
the company’s long-term interests. Furthermore,
the committee may attend to other responsibili-
ties relevant to the committee’s ability to assess
remuneration. The Remuneration Committee re-
ports on a regular basis to the Supervisory Board
and held three meetings in 2011.
The Executive Board
In PFA, the Group Management consists
of four persons:
• Henrik Heideby, Group CEO and President
• Anne Broeng, Group Executive Vice
President and CFO
• Lars Ellehave-Andersen, Group Executive
Vice President
• Jon Johnsen, Group Executive Vice President
Customer Board
At PFA, we have a Customer Board with up to 60
executive employees from our largest corporate
and organisational customers. Torben Dalby
Larsen is Chairman of the Board. The Customer
Board serves as a link between customers and the
PFA management and ensures close business rela-
tions. The Customer Board held four meetings in
2011, during which it discussed monetary policies
related to pension, new products and services and
received information about the company’s pro-
gress and new rules and terms related to pension.
Strategy
PFA has developed the PFA Scorecard and PFA
Transformation Plan to demonstrate the business’
key results to facilitate the implementation of
PFA’s strategy. The tools are also used to convey
the strategy internally.
PFA’s Transformation Plan includes strategic
development projects that are expressed using six
overall indicators – growth, life cycle product, sup-
plementary benefits, advisory services, efficiency
and dynamics. The PFA Scorecard sums up the
achieved results. Group Management reports the
status of the scorecard to the Supervisory Board
on a quarterly basis. Subsequently, the scorecard
is published on PFA’s intranet. Executive employ-
ees’ bonus depends on the score achieved in PFA’s
Scorecard.
Communication and executive training
PFA’s strategy is communicated through the
intranet, at manager’s meetings and at employee
meetings. On the intranet PFA has also devel-
oped an interactive strategy site that lays out
PFA’s goals and transformation plan using videos,
project descriptions and status as well as meeting
activities.
All managers and executive employees at PFA are
members of an internal micro-network. These
managerial sextets were confidential and cross-
functional discussion groups in which managers
addressed issues such as management devel-
opment using PFA’s management model and
obtained better business sense.
As an indirect consequence of developing dynamic
management the previous year, PFA strengthened
the basic elements of employee management by
providing training for executive employees with
less than two years’ managerial experience. The
objective was to reinforce the managerial role, to
increase personal drive and to set up a network
for new managers.

P F A H o l d i n g A n n u a l R e p o r t 2 0 1 12 6
High employee commitment
PFA’s employee commitment developed posi-
tively since our first survey back in 2005. In 2011,
employee loyalty remained stable while commit-
ment was better. On the other hand, employee
satisfaction decreased slightly. The level is higher
at PFA than on the Danish labour market in gen-
eral, with satisfaction and loyalty dropping across
the board.
Managers were given relatively high ratings com-
pared to managers in other companies. Employees
put 30 per cent of the managers in the category
“solid, well-rounded managers” possessing high
professionalism and strong managerial skills. The
general level of the Danish labour market was
25 per cent. An entire 20 per cent of PFA manag-
ers, compared to only 7 per cent in general, were
“management-oriented managers” with strong
managerial skills and less effective professional
skills. Whenever a workplace faces changes, it is
important that managers are well equipped to act
as leaders.
Decreasing sickness absence
and low employee turnover
PFA focused on limiting sickness absence, which
dropped from 3.6 per cent to 3.3 per cent on aver-
age in 2010. Sickness absence was lower than the
latest published average for the financial sector.
PFA’s employee turnover is relatively low. When
measured as a sliding average over a 12-month
period, employee turnover for all types of resigna-
tions was at 10.6 per cent compared to 11.7 per
cent in 2010. The number of employees personally
resigning averaged 4.3 per cent.
In total, PFA employed 124 new employees com-
pared to 144 in 2010. And 147 resigned compared
to 103 during the previous year. At the end of the
year, PFA had 1,152 full-time employees compared
to 1,165 in 2010.
New market position
The new market position was launched in May, and
during the year we worked to create internal com-
mitment within PFA. The objective was to ensure
that customers feel they have received a quali-
fied recommendation every time they come into
contact with PFA.
The new market position should increase PFA’s
effectiveness and the quality of its everyday
dealings, and should help set the agenda for work
aimed at realising PFA’s business strategy. The
internal process is embedded with the business
unit directors, who have prepared action plans to
ensure that the market position leads to actual
behavioural changes.
Environment and climate change
In 2011, PFA reduced its electricity and heating
consumption, and thereby its total CO2 emission,
by 10 per cent. The reduction was made within
the framework of a climate partnership concluded
with DONG Energy two years’ ago. In total, PFA
reduced its CO2 emissions by 421.5 tonnes in 2010
and 2011.

P F A H o l d i n g A n n u a l R e p o r t 2 0 1 1 2 7
Investments – positive investment returns for 10
years in a row
It is important for a pension company to gener-
ate value also during hard times, and in 2011 PFA
achieved a satisfactory return in a difficult market.
Return on investments for the Group amounted to
DKK 27.2 billion. The positive results came in spite
of major declines on the listed share markets,
mainly because investments were diversified ef-
ficiently and interest drops were hedged appro-
priately.
As the only pension company in Denmark, PFA has
delivered positive investment returns for 10 years
in a row, totalling more than DKK 142 billion in that
period.
A key element in PFA’s investment process is a high
degree of knowledge sharing across investment
types. Knowledge sharing coupled with highly mo-
tivated portfolio managers generated a dynamic
investment process.
Return on investments for the PFA Group amount-
ed to 11.4 per cent. In spite of negative returns on
shares, the total investment result was satisfacto-
ry, due in part to a low ratio of listed shares, which
amounted to less than 5 per cent of the portfolio
at end-year. Bonds in particular made a positive
contribution, with both Danish bonds and the US
and UK bond portfolios yielding highly satisfactory
results.
Interest hedging also impacted results favourably,
making a highly positive contribution to the return
due to declining interest rates. Sound returns on
alternative investments and PFA’s Midgard hedge
fund also played a role in improving the results.
2002
150
DKK (billion)
100
50
02003 2004 2005 2006 2007 2008 2009 2010 2011
Total return on investments (accumulated)

P F A H o l d i n g A n n u a l R e p o r t 2 0 1 12 8
Shares in the shadow of global recession fears
In 2011, a number of events adversely affected the
share markets. In particular, the political conten-
tions in the US fought between Democrats and
the Republicans over raising the US debt ceiling
had major repercussions. One ramification was the
downgrading of the US government’s credit rating.
In addition, at end-July, European politicians
adopted the framework of a rescue plan, but
failed to translate their decisions into action, put-
ting the price of Italian and Spanish government
bonds under pressure. The fear of a new global
recession hit the share markets all over the
world, driven by fiscal tightenings and high debt.
August was marked by substantial price drops, and
autumn 2011 was turbulent with large fluctuations
on the share markets.
In autumn, the central banks sought to curb the
turbulence by easing monetary policy. The Federal
Reserve completed another round of bond acqui-
sitions aimed at long bonds, the European Central
Bank lowered interest rates, and the Chinese
Central Bank eased its reserve requirements.
This did not, however, check the turbulence in
the eurozone and the fear of a sudden economic
slowdown in Europe.
25.0 %
20.0 %
15.0 %
10.0 %
5.0 %
0.0 %
December 08 December 09 December 10 December 11
Additional return
PFA generates additional return on Danish shares
Total return on customer funds 2011, the PFA Group
Return determined after expenses in PFA Professionel Forening (the ”Professional Association”)
Market value DKK billion Ratio Return
Listed Danish shares 2.6 1.0 % (16.3 %)
Listed foreign shares 7.8 2.9 % (6.7 %)
Alternative investments 7.4 2.7 % 16.4 %
Total shares 17.8 6.5 % (2.0 %)
Danish bonds 84.1 30.9 % 7.3 %
Index-linked bonds 22.7 8.3 % 12.8 %
Foreign government bonds 49.1 18.0 % 7.1 %
Credit bonds 43.3 15.9 % 7.0 %
Total bonds 199.2 73.1 % 7.8 %
Land and buildings 14.1 5.2 % 5.4 %
Other financial investment assets 41.3 15.2 % 48.4 %
Total assets 272.4 100.0 % 11.4 %

P F A H o l d i n g A n n u a l R e p o r t 2 0 1 1 2 9
In autumn 2011, growth in the US economy was
quite robust and only slightly affected by the
turmoil on the financial markets. Among the large
regions, US shares also performed best, with rates
of return of close to 3 per cent in DKK. Europe was
in the eye of the storm, and the government debt
crisis in Europe’s periphery impacted European
shares, which fell by 9 per cent in 2011. Shares
in emerging markets dropped by 16 per cent, as
shares in growth economies are more price-sen-
sitive. Furthermore, China tightened its economic
policy throughout most of 2011, which curbed
growth in the Chinese economy. PFA’s portfolio of
global shares generated a negative return of 6.7
per cent in DKK.
The Danish share market was also hard hit by the
downturn in the autumn. The pressure on the
financial sector affected bank shares negatively
and contributed to the falling market. The Danish
portfolio generated a negative return of 16.3 per
cent. Managing Danish shares is one of PFA’s core
competencies. Since end-December 2008, PFA’s
Danish share portfolio has generated an addi-
tional return compared to the benchmark. Total
additional return since end-December 2008 was
14.9 per cent.
Bonds – a stabilising factor
PFA’s large portfolio of bonds worked as a stabilis-
ing buffer in 2011 during the major turmoil on the
financial markets. Thus, bond yields in the tradi-
tionally stable economies fell significantly in H2.
The highest returns were generated in the Danish
segment of the bond portfolio, where government
bonds and index-linked bonds, in particular, gen-
erated healthy returns. The uncertainty about the
eurozone spurred investors to seek safer havens,
which led to rather sharp rises in bond prices in
the Danish market. With a large current account
surplus, growing foreign assets and government
finances that – compared with the rest of Europe
– were in relatively good shape, Denmark was
considered one of Europe’s strong economies, and
Danish bonds to be attractive papers.
Europe: 10-year government bonds in 2011
0 %
5 %
10 %
15 %
20 %
25 %
30 %
Denmark
Germany
Spain
Greece
35 %
Januar
y
Febru
ary
Mar
ch
Apri
l
May
June
July
Augu
st
Septe
mber
Oct
ober
Nove
mber
Dece
mber
Sources: PFA and Eco win

P F A H o l d i n g A n n u a l R e p o r t 2 0 1 13 0
Alternative investments generated return
of 16.4 per cent
In 2011, alternative investments generated
a handsome positive return of 16.4 per cent
exclusive of foreign currency hedging, based on
improvements in all asset classes. Midgard, PFA’s
internal hedge fund, had a strong year with a re-
turn of 22.5 per cent. Since its launch in September
2009, Midgard has generated a return of 53.8 per
cent. Private Equity and the infrastructure portfo-
lio also generated high positive returns of 17.6 per
cent and 11.3 per cent, respectively.
PFA decided in 2011 to invest DKK 520 million for
the benefit of growth in small and medium-sized
Corporate bonds compared to global shares (indexed)
Global shares
Corporate bonds (global investment grade)
Corporate bonds (US high yield)
0
80
60
40
20
100
140
120
160
180
January 08 January 09 January 10 January 11
Investors also had a large appetite for mortgage
credit bonds, which generated handsome returns
as the interest rate level fell. However, returns
were lower than on government bonds, since the
conversion opportunity put a damper on price
increases. PFA’s large portfolio of index-linked
bonds generated a return of 12.8 per cent at group
level.
In 2011, PFA regained a large and well-diversified
portfolio of credit bonds containing both high-
rated and low-rated corporate bonds as well as
emerging market bonds. All segments of credit
bonds contributed handsome returns, generating
7 per cent in total.
Since the start of the financial crisis in 2008,
corporate bonds have yielded significantly higher
returns than global equities. In terms of invest-
ments, PFA had low exposure to shares and high
exposure to credit bonds, which generated high,
stable returns during a turbulent period.

P F A H o l d i n g A n n u a l R e p o r t 2 0 1 1 3 1
Danish companies via a commitment to Dansk
Vækstkapital.
PFA allocates money for alternative investments
with due consideration for the coming Solvency
II EU rules. These will prompt an increase in the
stress on capital from unlisted investments, for
which reason the required rate of return for this
class of assets will increase correspondingly.
Properties
PFA’s property investments are made through
group enterprises and associates as well as prop-
erty funds. At the end of the year, the PFA Group’s
property investments amounted to DKK 14.9 bil-
lion. Property investments generated a return of
5.4 per cent in 2011.
In 2011, the weak economic development and ex-
tremely limited financial opportunities continued
to mark the business property market in Denmark.
Transaction activities were weak throughout the
year, resulting in a noticeable decline in demand
for business premises, falling rent levels and rising
vacancy rates. Nationwide, the vacancy rate for
office space was just under 9 per cent at the end
of the year.
For the Group’s Danish and foreign business prop-
erties, operations in 2011 developed as forecast.
The occupancy rate for Danish business proper-
ties, excluding properties under development,
was 94.3 per cent at year-end, against 97.6 per
cent in 2010. Thus, the vacancy rate in PFA’s prop-
erties was just under 6 per cent. Half of the vacant
premises were successfully leased at the end of
2011 for occupancy in early 2012. The occupancy
rate for the Group’s foreign directly owned prop-
erties was 97.1 per cent, up from 96.4 per cent the
year before.
PFA Ejendomme leased and renegotiated leases
comprising 105,000 sq metres, resulting in a con-
siderable extension of the lease terms.
PFA joined the Norden IV development company
and undertook to participate in the Carlsberg
Byen P/S development company with a total com-
mitment of DKK 650 million.
The year’s net investment in properties was DKK
447 million.
Market rate – a turbulent year on the markets
Again in 2011, PFA’s market rate products gener-
ated returns above the market average. Seen over
a five-year period, PFA’s market rate products
performed among the top, measured on both
return and risk. Compared with the recommended
life cycle profiles on the market, PFA Plus Profile C,
including CustomerCapital, generated the highest
returns on both short and long time horizons.
Turbulent share markets adversely affected
returns in PFA Plus in 2011. Generally, customers
with low risk and short time horizons received the
highest returns. PFA Plus profile A thus generated
positive returns of up to 6.1 per cent, backed by
solid returns on bonds. Customers with high risk
profiles and long time horizons received negative
returns – for instance, PFA Plus profile D gener-
ated negative returns down to 6.6 per cent.
In a difficult investment year, the fund platform on
PFA Plus did well compared to its competitors. The
Morningstar market research agency thus gave
PFA Plus top marks measured on average rate of
return in various categories.
Return PFA Plus 2011
Years until retirement
1 5 15 30
PFA Plus profile A 6.1 % 5.8 % 4.8 % 4.0 %
PFA Plus profile B 4.7 % 4.3 % 2.7 % 0.5 %
PFA Plus profile C 3.3 % 2.7 % 0.6 % (3.1 %)
PFA Plus profile D 1.9 % 1.2 % (1.5 %) (6.6 %)
Return including CustomerCapital.
P F A H o l d i n g A n n u a l R e p o r t 2 0 1 13 2
Responsible investments
As an investor, PFA wants to take social responsi-
bility and contribute to ensuring that the compa-
nies – in which it invests its customers’ funds –
create their value in a responsible manner. PFA has
a separate policy on responsible investments, our
RI policy, which contains the below:
1. PFA’s policy and guidelines on responsible
investments are put into practice in accordance
with recognised international conventions and
standards.
2. PFA is an active investor. PFA believes that
engagement and dialogue are the right way to
respond when a company violates an investor’s
CSR guidelines. PFA places heavy demands on
the companies in which it invests, requiring
them to abide by international conventions and
standards within:
• Human and employee rights
• Corporate governance
• Anti-corruption
• Environment and climate change.
3. PFA screens its portfolios and has defined
an active ownership process if the companies in
which PFA invests conflict with its guidelines. If
the dialogue with the company is unproductive,
the investment may be sold off.
4. PFA maintains a publicly available exclusion list
of companies in which it does not invest due to
the breach of norms.
5. PFA integrates knowledge about companies’
ability to handle environmental, climate, social
and governance issues into its investment
decisions.
In 2011, PFA screened 2,306 investments and
started a dialogue with approx. 250 companies
regarding 290 issues. Issues usually concern
climate and environment or human or employee
rights violations.
In 2011, PFA made its second report to UN PRI in a
self assessment survey. In spring 2011, UN PRI
audited the responses and subsequently approved
PFA’s report, which also demonstrated progress
from the middle quartile to the top quartile within
five of the six UN PRI principle areas.

P F A H o l d i n g A n n u a l R e p o r t 2 0 1 13 4
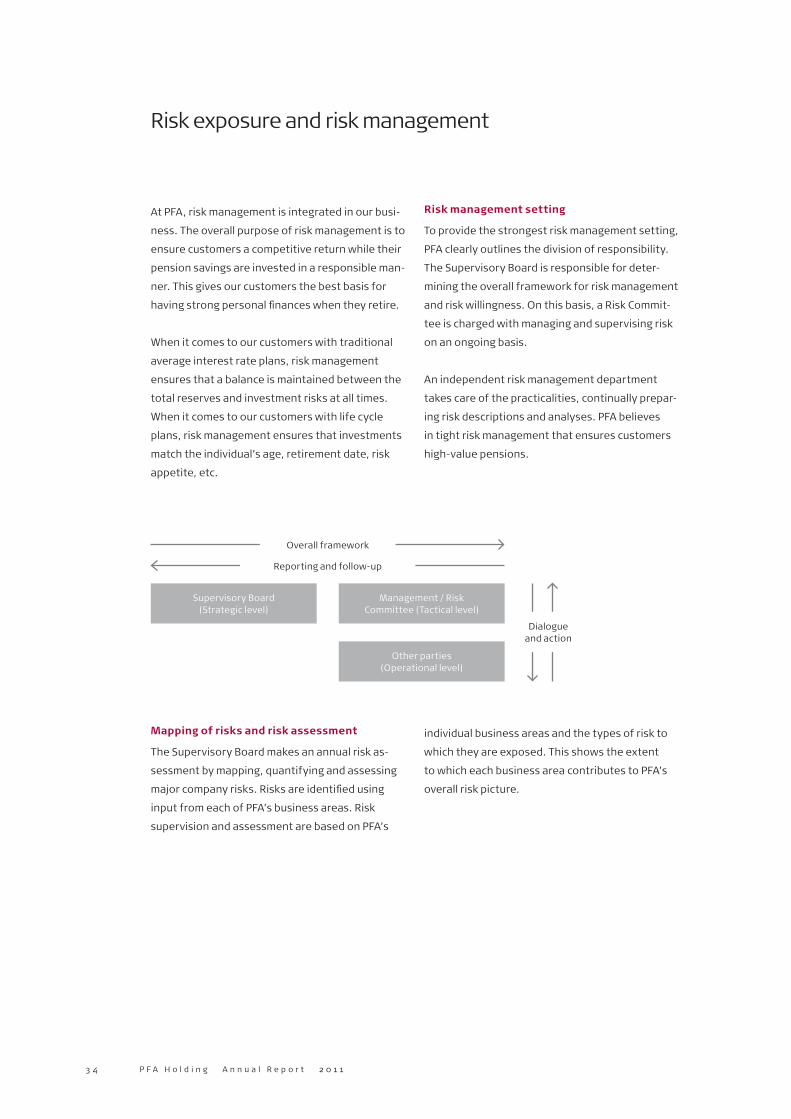
Risk exposure and risk management
Supervisory Board (Strategic level)
Management / Risk Committee (Tactical level)
Other parties (Operational level)
Overall framework
Reporting and follow-up
Dialogue and action
At PFA, risk management is integrated in our busi-
ness. The overall purpose of risk management is to
ensure customers a competitive return while their
pension savings are invested in a responsible man-
ner. This gives our customers the best basis for
having strong personal finances when they retire.
When it comes to our customers with traditional
average interest rate plans, risk management
ensures that a balance is maintained between the
total reserves and investment risks at all times.
When it comes to our customers with life cycle
plans, risk management ensures that investments
match the individual’s age, retirement date, risk
appetite, etc.
Risk management setting
To provide the strongest risk management setting,
PFA clearly outlines the division of responsibility.
The Supervisory Board is responsible for deter-
mining the overall framework for risk management
and risk willingness. On this basis, a Risk Commit-
tee is charged with managing and supervising risk
on an ongoing basis.
An independent risk management department
takes care of the practicalities, continually prepar-
ing risk descriptions and analyses. PFA believes
in tight risk management that ensures customers
high-value pensions.
Mapping of risks and risk assessment
The Supervisory Board makes an annual risk as-
sessment by mapping, quantifying and assessing
major company risks. Risks are identified using
input from each of PFA’s business areas. Risk
supervision and assessment are based on PFA’s
individual business areas and the types of risk to
which they are exposed. This shows the extent
to which each business area contributes to PFA’s
overall risk picture.

P F A H o l d i n g A n n u a l R e p o r t 2 0 1 1 3 5
Capital base risk
Own assets Market rate environment
Average interest rate environment
Health and accident insurance
Subsidiaries
Risk factor Description
Financial market risks Generally, these risks are related to financial market fluctuations that impact PFA’s results. PFA’s financial market risks primarily include risks related to interest rate levels, declines in share and property values, correlation risks and credit risks.
insurance risks The main insurance risks in this category involve assumptions about life expectancy and insurance cover at death and disability.
operational risks Operational risks primarily include risks related to errors, failures or breakdowns in internal processes, systems or procedures.
Commercial and other risks These risks primarily concern new or changed legislation that, among other things, may limit PFA’s commercial agility or market impact.
All business unit directors report the risks from
their business units to the executive staff. Group
Management assesses, processes and compiles
the information into a total risk assessment used
to determine PFA’s total risk based on probabilities
and outcomes.
Using the total risk assessment, the Supervisory
Board establishes the framework for risk and
asset allocation and assesses the need to adjust
PFA’s risk profile, operations and organisation. The
below table outlines the most significant risks for
the PFA Group.
ICAAP result
The Supervisory Board determines the ICAAP
result (the Internal Capital Adequacy Assess-
ment Process - the individual solvency need) on
the basis of a total risk assessment. This is the
capital requirement that reflects all major risks to
which the company is exposed. The ICAAP result
ensures that the probability that the company
will be unable to meet its customer obligations is
only slight. PFA has decided that the ICAAP result
should reflect a level of security that means the
company can withstand a loss that statistically
would only occur once every 200 years.
PFA’s ICAAP result is determined by using different
stress scenarios. The stress test includes risk fac-
tors that require capital and are important to the
company. The below figure illustrates the risk fac-
tors that are used to determine PFA’s ICAAP result.

P F A H o l d i n g A n n u a l R e p o r t 2 0 1 13 6
Each of PFA’s business areas is exposed to dif-
ferent types of risk to varying degrees. In the
determination of the ICAAP result, the risk on
the capital base consists of the own investment
risk of the capital base and of the risks existing in
individual business areas.
The ICAAP result sets the framework for the ongo-
ing composition of investments and is used in daily
risk monitoring. The PFA Group had a sufficient
capital base to cover its solvency needs through-
out 2011.
Other analysis tools
PFA applies different types of internal models to
supplement the ICAAP result. The models are used
in the ongoing monitoring and reporting. A long-
term ALM model is used to determine the interac-
tion between assets and liabilities.
Solvency II
The EU has adopted new rules regarding compa-
nies’ capital requirements, among other things
(Solvency II). Originally, the new rules were ex-
pected to come into force on 1 January 2013. How-
ever, these rules are now expected to come into
force on 1 January 2014. Solvency II is a European
set of rules that will determine future supervision
rules in the pension industry, including rules on
solvency requirements and corporate manage-
ment. The rules also include a change entailing
stricter requirements when it comes to the report-
ing to be made to the Danish Financial Supervisory
Authority and the public.
In 2011, PFA worked purposefully with Solvency II.
The Supervisory Board has approved a timeline for
implementing the new rules and stayed involved
to monitor the work implementing Solvency II.
Uncertainties remain as regards important ele-
ments of the rules, including how liabilities should
be calculated at the market values and the exact
requirements posed for the content of reports to
the Danish Financial Supervisory Authority and
the public. PFA followed the development and
actively participated in the committee work. PFA
also carried out internal test calculations.
PFA meets the requirements in the Section 71
guide on insurance companies’ organisation. PFA
already meets the requirements of the upcoming
Solvency II rules on companies’ organisation and
has the necessary functions in place, such as risk
management and compliance.
Efforts made in 2011 show that PFA is well-
prepared to meet the new rules when they take
effect.
New rules for average interest rate plans
from 2011
At PFA, the largest business area is pension plans
with an average interest rate and the right to bo-
nus. These plans are characterised by guaranteed
Market risks
Biometric risks
Other risks
• Interest rate risk
• Share risk
• Properties
• Currency
• Credit
• Counterparties
• Interest rate spread
• Volatility
• Mortality
• Disability
• Health and accident insurance
• Disaster scenarios
• Group risk
• Operational risks • Other risks
Stress test
The capital requirement to withstand the total stress scenario = the ICAAP result

P F A H o l d i n g A n n u a l R e p o r t 2 0 1 1 3 7
benefits granted over many years. The risk liability
from the average interest rate environment in
relation to the capital base greatly depends on the
size of customer reserves, guaranteed benefits
and customers’ lifetimes.
With effect from 1 January 2011, these pension
plans were divided into different groups accord-
ing to a new set of rules from the Danish Financial
Supervisory Authority. The new rules apply to all
Danish pension companies and describe in greater
detail how companies should distribute their prof-
its in a fair and reasonable manner for all. The new
contribution rules also implied that the groups
cannot cover each others’ risk.
All average interest rate plans were broken down
into interest rate groups according to the size of
the guaranteed benefits. Each interest rate group
has its own investment composition strategy.
Pension plans with high guaranteed benefits call
for a very conservative investment policy, whereas
pension plans with lower guarantees allow for a
more liberal investment policy.
All four interest rate groups had positive bonus
reserves in 2011.
PFA continues to live up to the guaranteed
benefits for all customers, and at PFA’s website
customers can see in which group their average
interest rate plan is placed.
Market rate pension plans
Since June 2011, PFA has offered its customers
a share of the reserves in the form of a transfer
allowance used when customers transfer their
plans from average interest rate to market rate.
This offer was also made to customers who had
already transferred their PFA pension savings from
average interest rate to PFA Plus at the product’s
launch in 2009.
During 2011, the customers transferred savings
worth DKK 3 billion from average interest rate
plans to market rate plans. Capital requirements
are less strict for market rate plans than for aver-
age interest rate plans.
Life insurance provisions
Life insurance provisions are determined at mar-
ket value by means of an interest rate based on
the yield curve published by the Danish Financial
Supervisory Authority. In December 2011, the
Danish Financial Supervisory Authority made a
technical adjustment of the yield curve, which
companies could opt to use if they preferred.
The yield curve consisted of the Euro swap inter-
est rate and a number of interest rate spreads.
After the adjustment, the country spread was
determined on a 12-month sliding average as op-
posed to the previous daily observed values. PFA
decided to determine the life insurance provisions
at the end of 2011 by using the country spread
adjusted yield curve.
The value adjustment of the life insurance provi-
sions increased on a net basis in 2011 and led
to additional provisions of DKK 15.6 billion. The
increase is primarily due to the drop in interest
rates in 2011 and PFA’s life expectancy adjustment
in keeping with the Danish Financial Supervisory
Authority’s benchmark. Both issues prompted the
Group to make larger provisions for future pension
disbursements. The increase in pension plan pay-
ments also contributed to the rise in provisions.
Life insurance provisions for average interest
plans amounted to DKK 237.4 billion at the turn
of the year, or DKK 16.8 billion more than the
previous year. Provisions for market rate plans
increased from DKK 14.4 billion in 2010 to DKK 21.3
billion at the end of 2011.
As the risk table in note 31 shows, an additional
decrease in mortality intensity of 10 per cent,
corresponding to a life expectancy increase of one
year, would reduce the collective bonus potential
by a maximum of DKK 1.2 billion.
An increase in disability intensity of 10 per cent
would reduce the collective bonus potential by a
maximum of DKK 105 million.

P F A H o l d i n g A n n u a l R e p o r t 2 0 1 13 8
Total reserves consist of excess capital base (capi-
tal base less solvency requirement) and collective
bonus potential.
The difficult markets and economic trends drove
up capital requirements. Nevertheless, excess
capital base increased by DKK 0.6 billion to DKK
8.4 billion in 2011, with the return on investments
and the operational risk charge increasing the
capital base by DKK 2.4 billion
The collective bonus potential dropped by DKK 7.0
billion to DKK 5.8 billion, as the decline in interest
rates and the increase in life expectancy com-
pelled PFA to make larger provisions to cover the
benefits guaranteed to customers.
Increase in excess capital base
The capital base of the PFA Group’s life insurance
companies totalled DKK 19.6 billion at the end of
the year. This is an increase of DKK 2.4 billion on
the previous year. CustomerCapital increased by
DKK 1.8 billion to DKK 15.5 billion in 2011. Equity
increased DKK 0.4 billion, reaching DKK 5.4 billion.
This gave the PFA Group a strong platform to meet
tomorrow’s capital requirements.
The traditional solvency requirement increased by
DKK 1.0 billion to DKK 10.4 billion. The capital base
must cover either the solvency requirement or the
ICAAP result, whichever is higher.
The ICAAP result for PFA Pension amounted to
DKK 10.7 billion at end-2011 and DKK 2.3 billion at
end-2010. Thus, the ICAAP result is equal to PFA
Pension’s capital requirement at the end of 2011.
The increase in the ICAAP result reflected the
higher risk due to difficulties on the financial
markets and overall economic trends. The new
contribution rules also served to increase capital
requirements, as the groups cannot cover each
other’s risk.
In total, the PFA Group’s reserves decreased by
DKK 0.6 billion to DKK 14.2 billion.
Development in reserves
Capital strength
Life insurance companies in the PFA Group (DKK billion) 2011 2010
Equity 5.4 5.0
CustomerCapital 15.5 13.7
Subordinate loan capital 1.2 1.2
Tax assets, etc. (2.5) (2.6)
Capital base 19.6 17.2
Solvency requirement *) (11.2) (9.4)
Excess capital base 8.4 7.8
Collective bonus potential 5.8 7.0
Total reserves 14.2 14.8
Bonus potential on paid-up policy benefits 5.4 14.5
*) For PFA Pension and Funktionær Pension, the ICAAP result for 2011 is used, and the traditional capital requirement is used for 2010.

P F A H o l d i n g A n n u a l R e p o r t 2 0 1 1 3 93 9
The bonus potential on paid-up policy benefits,
which can also be used to cover any losses for
customers, dropped from DKK 14.5 billion to DKK
5.4 billion, due to the larger provisions made for
customers’ guaranteed pension benefits.
CustomerCapital constituted the bulk of the
capital base
CustomerCapital amounted to DKK 15.5 billion and
therefore made up the bulk of the life insurance
companies’ total capital base of DKK 19.6 billion.
CustomerCapital was established in 2001 with
a transfer of DKK 4.8 billion from PFA Pension’s
equity to customers. This is what we call Collective
CustomerCapital.
The transfer was intended to demonstrate PFA
Pension’s status as a customer-owned company
and to encourage customers to accumulate their
own Individual CustomerCapital. PFA could do
the latter by allowing 5 per cent of customers’
premiums to go to Individual CustomerCapital.
Collective CustomerCapital acts as a safety net for
customers’ Individual CustomerCapital. The col-
lective CustomerCapital is further distributed over
several years as additional interest on customers’
Individual CustomerCapital.
The pre-tax investment return on CustomerCapital
amounted to 12.6 per cent – the same as in 2010.
Collective bonus potential
PFA obtained a strong investment return in 2011.
However, the return proved insufficient to cover
both the addition of interest on customers’
deposits and the increase in provisions triggered
by heavily declining interest rates and the rise in
life expectancy. In total, PFA distributed DKK 7.6
billion to customers by way of the deposit interest
rate and DKK 0.4 billion by way of interest on
Individual CustomerCapital. This led to a drop in
collective bonus potential of DKK 1.2 billion to DKK
5.8 billion.

P F A H o l d i n g A n n u a l R e p o r t 2 0 1 14 0

P F A H o l d i n g A n n u a l R e p o r t 2 0 1 1 4 1
PFA is owned by its customers. The values we cre-
ate in the PFA Group should first and foremost go
to our customers. PFA creates the greatest value
for customers by generating a high investment
return and keeping expenses down. Furthermore,
CustomerCapital ensures that customers receive
the greatest possible share of the value PFA cre-
ates.
Complete transparency of expenses
At a customer-owned pension company like PFA,
openness to customers is paramount. This is why
PFA paves the way when it comes to making both
direct and indirect expenses transparent.
Customers at PFA can access information about
their annual expenses in DKK and in per cent in
the annual survey. This applies to both customers
with market rate products and customers with
traditional pension savings in average interest
rate plans. As from 2011, PFA determines annual
expenses in DKK and in per cent broken down into
interest rate groups for customers with a tradi-
tional pension plan.
To ensure that pension companies calculate their
annual expenses in DKK and in per cent uniformly,
the pension industry urged companies to use an
audit model for annual expenses in DKK and in
per cent for the financial year 2011. As a result,
pension companies must publish a description
of their methods and an auditors’ statement.
Among other factors, the method description
must include the expense elements that go into
calculating the annual expenses in DKK. In addi-
tion to the above, the pension company’s actual
expenses must be reconciled with the sum of the
customers’ annual expenses in DKK. PFA’s method
description and auditors’ statement were made
public at the same time as customers could access
their survey of annual expenses in DKK and in per
cent for 2011.
PFA was one of the first Danish pension compa-
nies to introduce an online expense calculator at
PFA.dk, which allows customers to calculate their
expenses and compare prices on both average
interest rate and market rate pension plans. The
pension industry’s initiatives on transparency of
total expenses according to a joint set of rules
prompted a number of pension companies to
develop similar expense calculators in 2011. Impar-
tial comparisons of expenses using the expense
calculators demonstrated that PFA has the lowest
expenses.
Low level of expenses
PFA keeps expenses low to create the maximum
possible value for its customers. In 2010, net
insurance expenses were extraordinarily reduced
by DKK 111 million because PFA received a VAT
refund related to the period 1998-2009. Viewed
over a number of years, the expense ratio dropped
significantly from 6.7 per cent in 2009 to 4.6 per
cent in 2011.
At PFA Pension, customers do not pay expenses
for administration and insurance cover higher than
the amounts charged on their deposits. Any costs
and expenses in excess of the charged amounts
are covered by the capital base. By not charging
indirect expenses via unallocated reserves, PFA
increases customers’ net return and improves
transparency. This meets the new requirements
from the Danish Financial Supervisory Authority,
which took effect for all companies in 2011
In 2011, customers at PFA with average interest
rate plans paid 0.1 per cent of the investment re-
turn as an operational risk charge and 0.3 per cent
in expenses. The total expenses for customers
thus amounted to 0.4 per cent of the investment
return. Customers with market rate plans also paid
very low investment expenses compared to the
market – in 2011, expenses ranged from 0.4 to 0.7
per cent.
Value generation

P F A H o l d i n g A n n u a l R e p o r t 2 0 1 14 2
Traditional savings
At 94.5 per cent, the PFA Group’s investment
return on customer funds ranked among the
market’s highest over the last ten years. At the
same time, only 8.2 percentage points of the
investment return were used for expenses and the
operational risk charge. Net returns on customers’
funds in the PFA Group thus amounted to 86.3 per
cent. Over the last ten years, 91 per cent of the
investment return was passed on to customers.
Accordingly, PFA has created substantial value for
its customers.
High value generation
Value generation was likewise high in 2011. Cus-
tomers’ combined investment return amounted to
11.2 per cent, the net return being 10.8 per cent. In
2011, only 0.4 percentage point was used to cover
the operational risk charge and expenses.
The connection between market return
and deposit interest rate
PFA wants to create full transparency when it
comes to expenses and value generation. This is
why customers can view the connection between
PFA Pension’s total investment return, expenses
and the interest rate credited to customers’ pen-
sion deposits. The below table shows the connec-
tion between return and deposit interest rate for
customers in interest rate group 1. Miscellaneous
costs connected with investments and PFA’s op-
erations are deducted from the investment return.
Amounts are also deducted for the customers’
unallocated reserves. On the other hand, the
customers receive additional interest from Cus-
tomerCapital, i.e. 12.6 per cent on up to 5 per cent
of their payments. This means that the deposit
interest rate, including interest on CustomerCapi-
tal, totalled up to 3.96 per cent.
CustomerCapital yielded 12.6 per cent in 2011
CustomerCapital carries the same interest rate
as equity, for which reason customers receive a
share of the operational risk charge.
Approximately 75 per cent of the operational risk
charge is given back to customers by way of return
on CustomerCapital. Collective CustomerCapital
also ensures that customers’ Individual Custom-
erCapital receives a minimum interest rate of 10
per cent over a number of years. Customers who
accumulate Individual CustomerCapital in their
pension plans thus get an extra high interest rate.
The total pre-tax return on Individual Customer-
Capital amounted to 12.6 per cent in 2011.
Market rate plans with CustomerCapital
If the customers select “PFA Invests” as part of
the life cycle product PFA Plus, they have the
possibility of including CustomerCapital and thus
the chance of a higher return.
Customers’ deposits
Individual CustomerCapital
Return before investment expenses 8.5 % 6.9 %
Investment expenses (0.5 %) (0.4 %)
Investment return for customers 8.0 % 6.5 %
Collective pension yield tax (0.6 %) -
Operational risk charge on equity and CustomerCapital (0.5 %) 2.8 %
Balance on other activities - 3.3 %
Change in value adjustment of insurance liabilities (1.3 %) -
Transfer from customers’ unallocated bonus reserves/ from Collective CustomerCapital (2.2 %) 0.0 %
Deposit interest rate/Pre-tax return on Individual CustomerCapital 3.5 % 12.6 %
Deposit interest rate after tax, including 5 per cent CustomerCapital 3.96 %
The connection between return and deposit interest in PFA Pension
* PFA Plus was launched in mid-2009 and replaced PFA Sammensætter (PFA Selects) as the recommended life cycle pro-duct. The actual returns for PFA Sammensætter are stated for the years 2007-2009.
2011 2007-2011*
Years until retirement 1 5 15 30 5 15 30
PFA Plus profile C 3.3 % 2.7 % 0.6 % (3.1 %) 28.9 % 19.0 % 6.2 %
Investment return in per cent for PFA Plus medium risk profile including CustomerCapital

P F A H o l d i n g A n n u a l R e p o r t 2 0 1 1 4 3
Pre-tax profit for the year amounted to DKK 617
million compared to a profit of DKK 580 million in
2010. After tax and a deduction for the minority
interests’ share, profit for the year came to DKK
460 million compared to DKK 448 million the previ-
ous year. The year’s profit is viewed as satisfacto-
ry. The Supervisory Board recommends that DKK
50,000 be distributed as dividend in PFA Holding.
The balance sheet increased from DKK 25.5 bil-
lion to DKK 324.6 billion. The capital base for the
Group’s life insurance companies increased by 2.4
billion to DKK 19.6 billion.
CustomerCapital went up DKK 1.8 billion to
DKK 15.5 billion. Equity rose by DKK 0.5 billion
to DKK 5.7 billion.
Profit for the year


CliChé #32:Use a tailor to illUstrate
tailor-made solUtions
The entire essence of our new market position is our ability to turn
knowledge into value by way of a qualified recommendation.
This defines the way in which we run our business. This is what
we want people to know we stand for – and sets our course both
internally and externally over the next few years. Our new market
position should increase our effectiveness and the quality of our
everyday dealings as well as pave the way towards the realisation
of our business strategy. The internal process is embedded with the
business unit directors, who have prepared action plans to ensure
that the market position leads to actual behavioural changes.

P F A H o l d i n g A n n u a l R e p o r t 2 0 1 14 6
Subsidiaries
PFA Pension
PFA Pension was founded in 1917 as a non-profit
organisation by a number of employers’ and em-
ployees’ associations. The ambition was to ensure
financial security for employees and their families
in the event they became too old to work, lost their
working capacity or changed jobs.
The Supervisory Board of PFA Holding and the Su-
pervisory Board of PFA Pension are identical; see the
outline on page 85.
Premium income
The company’s premium income amounted to DKK
16.4 billion. In 2010, premium income came to DKK
15.1 billion excluding extraordinary single payments
of DKK 2.2 billion from two pension funds that trans-
ferred members’ pension savings to PFA Pension. As
a result, in 2011 PFA Pension saw an increase of 9 per
cent in ordinary premium income.
Payments for market rate plans totalled DKK 7.6 bil-
lion – more than double the DKK 3.3 billion recorded
in 2010. Payments to market rate plans came to 46
per cent of the total payments compared to 22 per
cent in 2010.
Investment return
PFA Pension realised a time weighted 11.3 per cent
return on customer funds in terms of average inter-
est rate after expenses in PFA Professionel Forening
(the “Professional Association”).
In market rate plans, investment returns ranged
from a loss of 6.6 per cent to a profit of 6.1 per cent,
depending on the risk profile selected. The high-
est return was obtained in profile A, which has the
largest share of bonds. Investment returns at market
rate were generally sound compared to similar prod-
ucts in the market and surpassed our competitors’
average.
The return ratio on customers’ funds (N1F), which is
based on a money-weighted calculation after invest-
ment expenses in proportion to customer net assets,
amounted to 10.8 per cent.
Return on customer funds 2011, PFA Pension
DKK billion
Listed Danish shares 2.5 1.0 % (16.3 %)
Listed foreign shares 7.3 3.0 % (6.9 %)
Alternative investments 7.3 3.0 % 16.4 %
Total shares 17.1 7.0 % (1.7 %)
Danish bonds 79.1 32.3 % 7.1 %
Index-linked bonds 21.9 8.9 % 12.7 %
Foreign government bonds 48.8 20.0 % 7.1 %
Credit bonds 40.7 16.6 % 7.2 %
Total bonds 190.6 77.9 % 7.8 %
Land and buildings 10.2 4.2 % 6.5 %
Other financial investment assets 26.9 11.0 % 74.5 %
Total customer funds 244.7 100 % 11.3 %
Market value Ratio Return
Return determined after expenses in PFA Professionel Forening (the “Professional Association”)
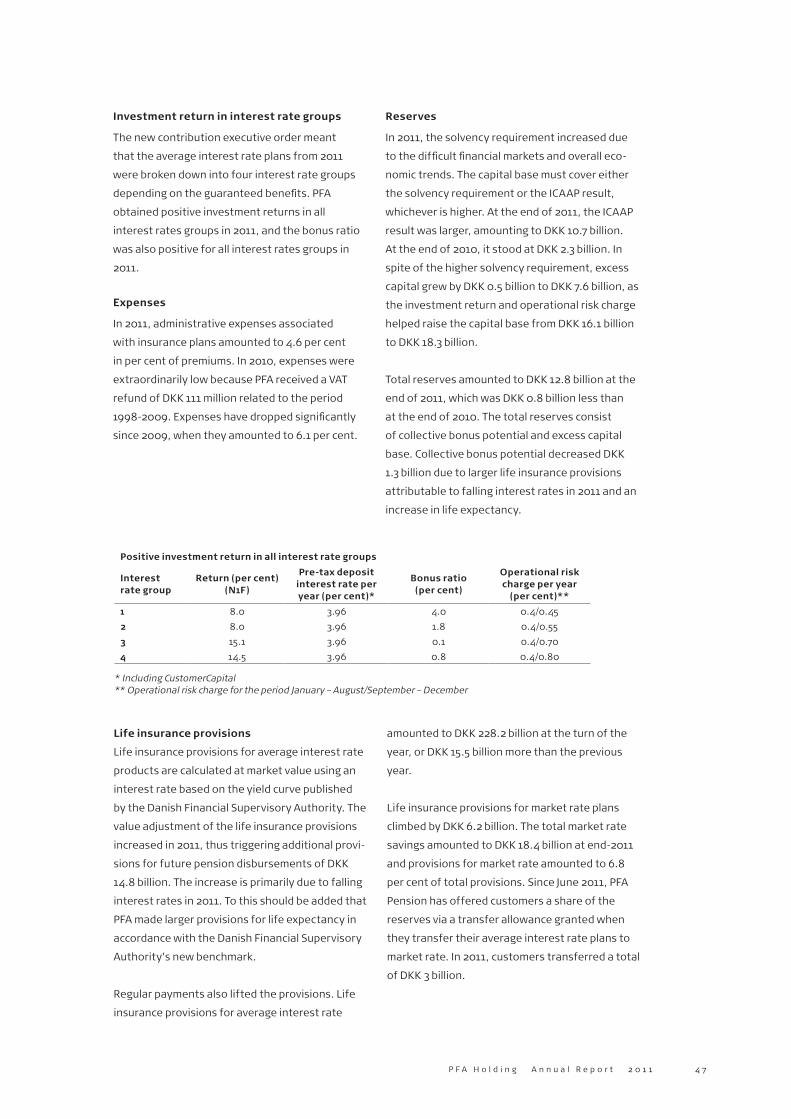
P F A H o l d i n g A n n u a l R e p o r t 2 0 1 1 4 7
Investment return in interest rate groups
The new contribution executive order meant
that the average interest rate plans from 2011
were broken down into four interest rate groups
depending on the guaranteed benefits. PFA
obtained positive investment returns in all
interest rates groups in 2011, and the bonus ratio
was also positive for all interest rates groups in
2011.
Expenses
In 2011, administrative expenses associated
with insurance plans amounted to 4.6 per cent
in per cent of premiums. In 2010, expenses were
extraordinarily low because PFA received a VAT
refund of DKK 111 million related to the period
1998-2009. Expenses have dropped significantly
since 2009, when they amounted to 6.1 per cent.
Reserves
In 2011, the solvency requirement increased due
to the difficult financial markets and overall eco-
nomic trends. The capital base must cover either
the solvency requirement or the ICAAP result,
whichever is higher. At the end of 2011, the ICAAP
result was larger, amounting to DKK 10.7 billion.
At the end of 2010, it stood at DKK 2.3 billion. In
spite of the higher solvency requirement, excess
capital grew by DKK 0.5 billion to DKK 7.6 billion, as
the investment return and operational risk charge
helped raise the capital base from DKK 16.1 billion
to DKK 18.3 billion.
Total reserves amounted to DKK 12.8 billion at the
end of 2011, which was DKK 0.8 billion less than
at the end of 2010. The total reserves consist
of collective bonus potential and excess capital
base. Collective bonus potential decreased DKK
1.3 billion due to larger life insurance provisions
attributable to falling interest rates in 2011 and an
increase in life expectancy.
Positive investment return in all interest rate groups
Interest rate group
Return (per cent) (N1F)
Pre-tax deposit interest rate per year (per cent)*
Bonus ratio (per cent)
Operational risk charge per year
(per cent)**
1 8.0 3.96 4.0 0.4/0.45
2 8.0 3.96 1.8 0.4/0.55
3 15.1 3.96 0.1 0.4/0.70
4 14.5 3.96 0.8 0.4/0.80
* Including CustomerCapital ** Operational risk charge for the period January – August/September – December
Life insurance provisions
Life insurance provisions for average interest rate
products are calculated at market value using an
interest rate based on the yield curve published
by the Danish Financial Supervisory Authority. The
value adjustment of the life insurance provisions
increased in 2011, thus triggering additional provi-
sions for future pension disbursements of DKK
14.8 billion. The increase is primarily due to falling
interest rates in 2011. To this should be added that
PFA made larger provisions for life expectancy in
accordance with the Danish Financial Supervisory
Authority’s new benchmark.
Regular payments also lifted the provisions. Life
insurance provisions for average interest rate
amounted to DKK 228.2 billion at the turn of the
year, or DKK 15.5 billion more than the previous
year.
Life insurance provisions for market rate plans
climbed by DKK 6.2 billion. The total market rate
savings amounted to DKK 18.4 billion at end-2011
and provisions for market rate amounted to 6.8
per cent of total provisions. Since June 2011, PFA
Pension has offered customers a share of the
reserves via a transfer allowance granted when
they transfer their average interest rate plans to
market rate. In 2011, customers transferred a total
of DKK 3 billion.

P F A H o l d i n g A n n u a l R e p o r t 2 0 1 14 8
Profit or loss
Pre-tax profit for the year amounted to DKK 585
million compared to a profit of DKK 540 million in
2010.
The realised results of two of the interest rate
groups were insufficient to cover the budgeted
operational risk charge to be added to the capital
base. The amount was placed in a shadow account
and can be transferred to the capital base at a
later point in time once the realised results are
positive again.
PFA Sundhed A/S (PFA Health)
PFA Sundhed A/S was founded on 1 April 2009. The
company offers health-promoting and preventive
concepts within job satisfaction and health as a
natural supplement to pension plans, which are
PFA’s core product.
Members of the Board: Lars Ellehave-Andersen
(Chairman), Carsten Bach, Jesper Bjerre,
Søren P. Espersen, Rasmus Ruby-Johansen.
Director: Jacob Erik Holmblad.
This allows the PFA Group to help reduce the hu-
man, societal and financial costs of illness caused
by occupational stress, lifestyle-induced illness
and disability. The concepts include advisory ser-
vices and the set-up of specific health-promoting
and preventive initiatives at companies.
In 2011, the company recorded a post-tax loss of
DKK 1.7 million. In 2010, the result was DKK 0.0 mil-
lion after tax. The negative result in 2011 is primar-
ily due to a large writedown relating to software.
PFA Senior A/S
PFA Senior A/S was founded on 1 April 2009. The
company aims to provide services to custom-
ers aged 55+ who are leaving or have just left
the labour market. The company’s core business
revolves around seminar and advisory service
activities offered to customers on retirement.
Members of the Board: Lars Ellehave-Andersen
(Chairman), Carsten Bach, Jesper Bjerre,
Jon Johnsen, Peter Rosenlind-Nissen.
Director: Jacob Erik Holmblad.
In 2011, the company recorded a post-tax profit of
DKK 0.6 million. In 2010, the profit after tax was
DKK 0.1 million.
PFA Kapitalforvaltning, fondsmæglerselskab
A/S (PFA Asset Management)
On 1 April 2009, PFA Pension acquired Nordic Asset
Management Fondsmæglerselskab A/S, the name
of which was changed to PFA Kapitalforvaltning,
fondsmæglerselskab A/S (PFA Asset Manage-
ment, investment company) during the acquisition
process.
Members of the Board: Anne Broeng (chairman),
Henrik Heideby, Henrik Henriksen.
Director: Jesper Langmack, Poul Kobberup.
PFA Asset Management is an investment company
under the supervision of the Danish Financial
Supervisory Authority. The company offers asset
management to external parties such as labour
market pension funds. PFA Pension and PFA
Professionel Forening (the “Professional Associa-
tion”) are the two largest single customers in the
company.
Assets under management amounted to DKK 260
billion at end-2011. Pre-tax profit amounted to DKK
56.2 million in 2011, compared to DKK 45.0 million
in 2010. The company’s capital adequacy stood at
224 per cent at the end of 2011.
Capital strength
PFA Pension (DKK billion) 2011 2010
Equity 5.4 4.9
CustomerCapital 14.6 13.0
Subordinate loan capital 0.9 0.9
Tax assets, etc. (2.6) (2.7)
Capital base 18.3 16.1
Solvency requirement (10.7) (9.0)
Excess capital base 7.6 7.1
Collective bonus potential 5.2 6.5
Total reserves 12.8 13.6
Bonus potential on paid-up benefits 4.7 13.9

P F A H o l d i n g A n n u a l R e p o r t 2 0 1 1 4 9
PFA Portefølje Administration A/S
(PFA Portfolio Administration)
PPFA Portefølje Administration A/S (PFA Portfolio
Administration) was founded in January 2010, and
in May 2010 was granted a licence by the Danish
Financial Supervisory Authority, authorising it to
conduct business as an investment administration
company. The company’s business activity is to
manage PFA Professionel Forening (the “Profes-
sional Association”). At the end of 2011, the com-
pany employed 17 people.
Members of the Board: Georg Lett (chairman),
Anne Broeng, Kim Andersen.
Director: Peter Ott.
In 2011, the company’s post-tax profit amounted
to 8.2 million compared to DKK 1.7 million in 2010.
This impressive advance should be viewed in light
of the fact that 2011 was its first full financial year.
At end-2011, the company managed assets worth
DKK 228.7 billion – an increase of DKK 28.1 billion,
or 14 per cent.
In 2012, the company will submit an application
to the Danish Financial Supervisory to expand its
authorisation and business foundation to include
investment management of ordinary investment
units, the reason being that PFA plans to launch
the investment unit PFA Invest in H2 2012.
PFA Professionel Forening
(the “Professional Association”)
PFA Professionel Forening was founded in May
2010. It is a professional association established
under the rules of the Investment Associations
and Special-Purpose Associations Consolidated
Act. It is registered with the Danish Financial Su-
pervisory Authority but is not under supervision.
The investment management company PFA Por-
tefølje Administration A/S (PFA Portfolio Admin-
istration A/S) takes care of administration, while
assets are managed by PFA Kapitalforvaltning (PFA
Asset Management) and four other asset manag-
ers outside of the PFA Group.
Members of the Board: Henrik Heideby (chairman),
Anne Broeng, Susanne Møller.
Director: Peter Ott.
The association’s objective is to invest in funds
in a manner that ensures the highest possible
return balanced against risk. The association’s
funds are placed in bonds, assets, cash and cash
equivalents, including currency, as well as in the
instruments mentioned in the Financial Business
Act (appendix 5) and in shares issued by other
professional associations. The association targets
professional investors, including pension com-
panies and other financial institutions under the
supervision of the Danish Financial Supervisory
Authority. All investors are subject to approval by
the association’s Supervisory Board. When invest-
ments are made in the association, the investor
has the possibility of making investments under
the same terms and obtaining the same return as
PFA Pension, not including strategic interest and
currency hedging.
At end-2011, the association had a total of 19
divisions, and total assets amounted to DKK
228.7 billion. This in an increase of DKK 28.1 billion
compared to end-2010. The 19 divisions all have
different asset compositions and strategies,
which allows investors to combine the optimal
investment strategy with a view to the desired
return and risk objectives. An entire 14 out of the
19 divisions generated a highly positive return in
2011. The divisions achieved better returns than
comparable investments, which is indeed positive
considering the turbulent financial markets. In
2012, new divisions are expected to be launched
concurrently with market-related and commercial
opportunities.
Funktionær Pension
In 2007, Funktionær Pension and PFA entered
into a strategic partnership, in which connection
PFA Pension acquired 52 per cent of the shares
in Funktionær Pension Holding on 1 July 2007.
Funktionær Pension is the labour market parties’
pension company for salaried employees on the
private labour market.
P F A H o l d i n g A n n u a l R e p o r t 2 0 1 15 0
Members of the Board: Jan Bonde (chairman),
Jørgen Hoppe, Lars Ellehave-Andersen.
Director: Jens Landerslev.
Funktionær Pension is included in PFA’s financial
statements, with a preliminary financial statement
for 2011. The year’s profit after tax amounted
to DKK 17.5 million compared to DKK 24.3 million
in 2010. Premium income amounted to DKK 1.25
billion against DKK 1.13 billion in 2010. At the end
of 2011, the balance-sheet total stood at DKK 13.8
billion, and the capital base at DKK 1.2 billion.
PFA Soraarneq
The company was founded on 29 May 2000 by
the association Soraarneq and PFA Pension.
Greenland stakeholders consisting of employees’
associations as well as employers and employ-
ers’ organisations in the Greenland private sector
founded the association. PFA Pension owns 76.3
per cent of the nominal share capital. The associa-
tion owns the remaining 23.7 per cent.
Members of the Board: Niels Nielsen (chairman),
Lars Ellehave-Andersen (vice-chairman),
Susanne Mørch, Henrik Sørensen.
Director: Lis Hasling.
The primary objective of the company is to
establish pension plans for salaried employees
in companies and organisations in Greenland.
The company also offers instalment pensions to
private individuals.
The year’s profit after tax amounted to DKK 4.9
million compared to DKK 4.7 million in 2010. The
company’s premium income increased by 20 per
cent to DKK 87.0 million, and the number of in-
sured persons came to 5,556 at the end of 2011.
In 2011, the company fixed the deposit interest
rate at 2.5 per cent. At end-2011, the company’s
balance- sheet total came to DKK 650.1 million,
and its capital base amounted to DKK 40.7 million.
PFA Ejendomme A/S (PFA Real Estate)
PFA Ejendomme’s primary objective is to acquire,
build and manage real estate in Europe and to un-
dertake other business activities deemed compat-
ible with this objective by the Supervisory Board.
The company’s real-estate activities commenced
on 1 January 2001.
Members of the Board: Henrik Heideby (chairman),
Anne Broeng, Susanne Møller.
Director: Michael Willumsen.
The company’s investment strategy was chosen
with a view to obtaining a long-term, stable return
with a low risk. With this in mind, investments
are primarily made in prime business properties
in Greater Copenhagen, Greater Aarhus and the
Triangle Region (Kolding, Vejle and Fredericia) with
long-term lease contracts and strong leasehold-
ers.
PFA Ejendomme primarily invests in business prop-
erties and projects built for the user, but tradi-
tional multiuse properties are also included in the
portfolio. At the end of the year, PFA Ejendomme’s
business portfolio consisted of 49 properties with
approximately 190 leases.
The company partially acquired the private
hospital Hamlet in Gladsaxe. The company also
launched two major projects in Gladsaxe and
Lyngby, respectively, to develop and expand
business property.
PFA Ejendomme has leased and renegotiated
leases comprising 105,000 sq. metres, resulting
in a considerable extension of the lease terms.
In 2011, the business property market in Denmark
remained marked by weak financial performance
and extremely limited financing opportunities.
Transaction activities were weak throughout the
year, resulting in a noticeable decline in demand
for business premises, falling rent levels and ris-
ing vacancy rates. In Denmark, office property
vacancy was approximately 9 per cent.
Nationwide, the vacancy rate for office space was
well over 8 per cent at the end of the year.

P F A H o l d i n g A n n u a l R e p o r t 2 0 1 1 5 1
Results for 2011 amounted to DKK 393 million
before and after taxes. The occupancy rate for
business properties, not including properties
under construction at the end of 2011, amounted
to 91.7 per cent compared to 96.6 per cent at end-
2010. The company was successful in leasing half
of the vacant space at end-2011 for occupancy in
early 2012. At end-2011, the market value of the
company’s properties came to DKK 10,211 million,
compared to DKK 9,716 million at the end of 2010.
PFA Invest International A/S
PFA Invest International A/S was founded on 1 July
1990. The objective of the company is to acquire
real estate outside Denmark, directly or indirectly,
by acquiring investments in other companies,
including property funds or similar companies. At
present, the company is the parent company of
five wholly-owned subsidiaries that own property
in the UK and Germany and participate in the part-
nership Grosvenor London Office Fund.
Members of the Board: Henrik Heideby (chairman),
Anne Broeng, Susanne Møller.
Director: Michael Willumsen.
During the year, the Group sold off the UK prop-
erty Abbey Gardens, situated in Reading. At the
same time, the companies Abbey Gardens Reading
A/S and Watling Court Estate London A/S were
wound up, no longer being active.
On the large European property markets, especial-
ly in the UK, the investment market for prime busi-
ness properties has developed at a stable rate.
For 2011, the Group’s pre-tax results amounted
to DKK 111 million, and DKK 107 million after tax.
The occupancy rate for the Group’s properties at
end-2011 amounted to 97.1 per cent, compared to
96.4 at the end of 2010. At end-2011, the market
value of the Group’s investments in properties and
property funds amounted to DKK 1,370 million,
compared to DKK 1,472 million at the end of 2010.


CliChé #19:the thiCker the tie knot,
the higher the professional qUalifiCations of the wearer
Knowledge is a basic prerequisite for being the leading actor on
a market with complex products such as pension and insurance.
The fundamental idea is to use PFA’s total knowledge base to the
greatest extent possible – both externally and internally – and to
convert it into value. In PFA, we must use our total knowledge and
experience more effectively to give our customers and colleagues
clearer and simpler recommendations – based on PFA’s vast
combined knowledge about and understanding of our customers’
needs. Knowledge and understanding that we have accumulated
with our focus on life insurance and pension through 94 years.

P F A H o l d i n g A n n u a l R e p o r t 2 0 1 15 4
Growth indicators suggest that the economic
downturn in 2011, amplified by more or less short-
lived aftershocks, is grinding to an end.
A turnaround in the industrial cycle is expected to
offset the negative effects on the global economy
brought about by the debt crisis in Euroland. The
net result is expected to be a revival of global
growth in 2012.
The Danish market is saturated, for which reason
it only offers limited growth possibilities. To this
must be added that the ongoing policy action by
the Danish government in connection with pen-
sion savings weakens the trust in the sustainabil-
ity of the system as such.
However, PFA’s strong business model rooted in
the CustomerCapital concept, had won a number
of very large tender pension plan rounds for the
Group at end-2011. Against this backdrop, we
expect to see an increase in pension plan pay-
ments in both 2012 and 2013. Thus, we expect to
see a growth of 8-10 per cent in 2012 compared to
2011.
The year’s results are expected to be in line with
those reported for 2011.
Outlook for 2012


P F A H o l d i n g A n n u a l R e p o r t 2 0 1 15 6
5-year summaryThe PFA Group
Key figures (DKK million) 2007 2008 2009 2010 2011
Income statement
Premiums 17,778 15,628 15,375 18,479 17,684
Insurance benefits (11,995) (12,860) (12,012) (13,114) (15,198)
Investment return 2,968 2,641 16,046 20,214 27,162
Total net operating expenses (1,145) (1,275) (1,033) (595) (814)
Profit/(loss) on ceded business 21 13 (37) (36) 36
Balance on the technical account 122 (98) 370 127 145
Profit/(loss) on health and accident insurance (175) (106) (144) 52 81
Profit/(loss) for the year (218) (22) 349 448 460
Balance sheet
Total provisions for insurance and investment contracts 216,791 221,095 236,475 258,209 282,390
Collective bonus potential 13,037 1,624 4,414 6,993 5,824
Total equity 4,535 4,236 4,596 5,222 5,673
CustomerCapital 11,576 10,527 12,079 13,726 15,540
Capital base 14,527 13,204 15,082 17,364 19,712
Total assets 251,894 228,768 252,908 299,168 324,630
Financial ratios 2007 2008 2009 2010 2011
Yield ratios
Yield before pension yield tax 1.2 % 2.0 % 6.6 % 8.0 % 11.1 %
Yield before pension yield tax on equity and CustomerCapital 1.2 % 2.1 % 7.1 % 7.4 % 7.0 %
Yield before pension yield tax on customer funds 1.2 % 2.1 % 6.6 % 8.0 % 11.2 %
Yield after pension yield tax 1.1 % 1.8 % 5.6 % 6.9 % 9.5 %
Customers' cost ratios 1)
Expense ratio on premiums 4.1 % 4.3 % 4.5 % 3.1 % 4.4 %
Expense ratio on provisions 0.36 % 0.35 % 0.34 % 0.27 % 0.35 %
Expenses per insured DKK 841 DKK 881 DKK 893 DKK 743 DKK 1.019
Balance on the cost account (0.08 %) (0.14 %) (0.05%) 0.01 % 0.00 %
Balance on the risk account (0,08 %) 0.23 % 0.12 % 0.12 % (0.06 %)
Company’s cost ratios
Expense ratio on premiums 6.4 % 8.1 % 6.7 % 3.2 % 4.6 %
Expense ratio on provisions 0.57 % 0.66 % 0.51 % 0.28 % 0.37 %
Expenses per insured DKK 1,325 DKK 1,670 DKK 1,340 DKK 767 DKK 1,052
Balance on the cost account (0.21 %) (0.30 %) (0.17 %) 0.05 % 0.00 %
Balance on the risk account (0.12 %) 0.22 % 0.11 % 0.11 % (0.10 %)
Consolidation ratios 2)
Bonus ratio 7.1 % 0.9 % 2.2 % 3.4 % 2.8 %
CustomerCapital ratio 5.7 % 5.5 % 6.1 % 6.7 % 7.6 %
Equity ratio 2.8 % 2.8 % 2.9 % 3.1 % 3.2 %
Excess solvency ratio 3.0 % 2.5 % 3.2 % 3.9 % 4.6 %
Solvency ratio 173 % 156 % 173 % 185 % 190 %
Return ratios
Return on equity before tax 0.3 % (2.8 %) 11.8 % 11.8 % 11.3 %
Return on equity after tax (4.7 %) (0.4 %) 7.9 % 9.1 % 8.6 %
Pre-tax return on customers' funds excl. CustomerCapital after expenses 0.6 % 1.7 % 5.5 % 7.3 % 10.7 %
Pre-tax return on subordinate loan capital 8.2 % 7.8 % 7.4 % 5.5 % 5.7 %
Pre-tax return on CustomerCapital 2.3 % (0.5 %) 13.4 % 12.6 % 12.6 %
Pre-tax return on customers’ funds incl. CustomerCapital after expenses 0.7 % 1.6 % 5.9 % 7.6 % 10.8 %
The Group’s key figures and financial ratios have been calculated inclusive of Lærernes Pension through 2007. 1) Customers’ cost ratios reflect the customers’ costs actually paid. 2) The consolidation ratios are determined as a weighted average of the Group’s total life insurance company ratios.

P F A H o l d i n g A n n u a l R e p o r t 2 0 1 1 5 7
Management’s Statement
We have today presented the Annual Report of PFA Holding A/S for the financial year 1 January – 31
December 2011. The Annual Report has been presented in accordance with the Danish Financial Business
Act.
We consider the Financial Statements to give a true and fair view of the Group’s and the Parent Com-
pany’s financial position and results. We also consider the Management’s Review to give a fair presenta-
tion of the development in the Group’s and Parent Company’s activities and financial position as well as
a description of the material risks and elements of uncertainty that may affect the Group and the Parent
Company, respectively.
We recommend that the Annual Report be approved by the Annual General Meeting of Shareholders.
Copenhagen, 10 February 2012
Executive Board:
Supervisory Board:
Svend Askær Jørn Neergaard Larsen
Chairman Vice-Chairman
Klavs Andreassen Hans Skov Christensen Lars Christoffersen Gita Grüning
Erik G. Hansen Peter Ibsen Hanne Sneholm Jensen Thomas P. Jensen
Per Jørgensen Torben Dalby Larsen Poul Erik Pedersen Mette Risom
Henrik Heideby
Group CEO and President
Anne Broeng
Group Executive Vice
President and CFO
Lars Ellehave-Andersen
Group Executive Vice
President
Jon Johnsen
Group Executive Vice
President

P F A H o l d i n g A n n u a l R e p o r t 2 0 1 15 8
Internal auditor’s report
Report on the Group’s and the Parent Com-
pany’s Financial Statements
I have audited the Group’s and the Parent Com-
pany’s Financial Statements of PFA Holding A/S
for the financial year 1 January – 31 December
2011, comprising the accounting policies, income
statement, statement of comprehensive income,
balance sheet, statement of changes in equity
and notes. The Group’s and the Parent Company’s
Financial Statements have been prepared in ac-
cordance with the Danish Financial Business Act.
Basis of opinion
The audit has been conducted in accordance
with the Executive Order of the Danish Finan-
cial Supervisory Authority on Auditing Financial
Undertakings etc. as well as Financial Groups and
this requires that I plan and perform the audit to
obtain reasonable assurance that the Group’s and
the Parent Company’s Financial Statements are
free from material misstatement.
The audit has been performed in accordance with
the division of work agreed with the external audi-
tors and has included an assessment of proce-
dures and internal controls established, including
the risk management organised by Management
relevant to the entity’s reporting processes and
significant business risks. Based on materiality
and risk, I have examined, on a test basis, the basis
of amounts and other disclosures in the Group’s
and the Parent Company’s Financial Statements.
Furthermore, the audit has included evaluating
the appropriateness of the accounting policies
applied by Management and the reasonableness
of the accounting estimates made by Manage-
ment, as well as evaluating the overall presenta-
tion of the Group’s and the Parent Company’s
Financial Statements.
I have participated in the audit of risk and other
material areas and believe that the audit evidence
I have obtained is sufficient and appropriate to
provide a basis for my audit opinion.
The audit did not result in any qualification.
Opinion
In my opinion, the procedures and internal con-
trols established, including the risk management
organised by Management relevant to the Group’s
and Parent Company’s reporting processes and
significant business risks, are working satisfacto-
rily.
Furthermore, in my opinion, the Group’s and the
Parent Company’s Financial Statements give a
true and fair view of the Group’s and the Parent
Company’s financial position as at 31 December
2011 and of the results of their operations for the
financial year 1 January – 31 December 2011 in ac-
cordance with the Danish Financial Business Act.
Statement regarding Management’s Review
In accordance with the Danish Financial Business
Act, I have read the Management’s Review. I did
not perform any additional procedures in connec-
tion with my audit of the Group’s and the Parent
Company’s Financial Statements.
On this basis, it is my opinion that the informa-
tion presented in the Management’s Review is in
accordance the Group’s and the Parent Company’s
Financial Statements.
Copenhagen, 10 February 2012
Jes P. Sørensen
Chief Internal Auditor
P F A H o l d i n g A n n u a l R e p o r t 2 0 1 1 5 9
To the shareholder of PFA Holding A/S
Report on the Group’s and the Parent
Company’s Financial Statements
We have audited the Group’s and the Parent
Company’s Financial Statements of PFA Holding
A/S for the financial year 1 January – 31 December
2011, comprising the accounting policies, income
statement, statement of comprehensive income,
balance sheet, statement of changes in equity
and notes. The Group’s and the Parent Company’s
Financial Statements have been prepared in ac-
cordance with the Danish Financial Business Act.
Management’s responsibility for the Group’s
and the Parent Company’s Financial
Statements
Management is responsible for the preparation
and presentation of the Group’s and the Parent
Company’s Financial Statements that give a true
and fair view in accordance with the Danish Finan-
cial Business Act. Management’s responsibility
also includes internal controls considered neces-
sary by it to prepare Group and Parent Company
Financial Statements that are free from material
misstatement, whether due to fraud or error.
Auditors’ responsibility
Our responsibility is to express an opinion on the
Group’s and the Parent Company’s Financial State-
ments based on our audit. We have conducted our
audit in accordance with International Standards
on Auditing and additional requirements under
Danish audit regulations. This requires that we
comply with ethical requirements and plan and
perform our audit to obtain reasonable assurance
whether the Group’s and the Parent Company’s
Financial Statements are free from material mis-
statement. An audit involves performing audit
procedures to obtain audit evidence about the
amounts and disclosures in the Group’s and the
Parent Company’s Financial Statements. The audit
procedures selected depend on the auditors’
judgement, including the assessment of the risks
of material misstatement of the Group’s and the
Parent Company’s Financial Statements, whether
due to fraud or error. In making those risk assess-
ments, the auditors consider internal controls
relevant to the entity’s preparation of Consoli-
dated Financial Statements and Parent Financial
Statement that give a true and fair view in order
to design audit procedures that are appropriate
in the circumstances, but not for the purpose of
expressing an opinion on the effectiveness of the
entity’s internal control. An audit also includes
evaluating the appropriateness of accounting poli-
cies used and the reasonableness of accounting
estimates made by Management, as well as evalu-
ating the overall presentation of the Group’s and
the Parent Company’s Financial Statements. We
believe that the audit evidence we have obtained
is sufficient and appropriate to provide a basis for
our audit opinion. The audit did not result in any
qualification.
Opinion
In our opinion, the Group’s and the Parent Compa-
ny’s Financial Statements give a true and fair view
of the Group’s and the Parent Company’s financial
position as at 31 December 2011 and of the results
of their operations for the financial year 1 January
– 31 December 2011 in accordance with the Danish
Financial Business Act.
Statement regarding Management’s Review
In accordance with the Danish Financial Business
Act, we have read the Management’s Review.
We did not perform any additional procedures
other than those performed during the audit of
the Group’s and the Parent Company’s Financial
Statements. On this basis, it is our opinion that
the information presented in the Management’s
Review is in accordance with the Group’s and the
Parent Company’s Financial Statements.
Copenhagen, 10 February 2012 · Deloitte
Statsautoriseret Revisionspartnerselskab
Anders O. Gjelstrup Jacques Peronard
State-Authorised State-Authorised
Public Accountant Public Accountant
The independent auditors’ report

P F A H o l d i n g A n n u a l R e p o r t 2 0 1 16 0
Income statement
Note (DKK million)
2011 2010 2011 2010
Premiums
1 Gross premiums 17,684 18,479 - -
Ceded reinsurance premiums (94) (137) - -
Total premiums, net of reinsurance 17,590 18,342 - -
Investment return
Income from group enterprises - - 468 455
Income from associates 81 11 - -
Income from investment properties 581 636 - -
2 Interest income, dividends etc. 9,578 8,608 0 0
3 Value adjustments 17,656 11,651 - -
Interest expenses (76) (99) 0 0
6 Administrative expenses of investment business (659) (593) 0 0
Total investment return 27,162 20,214 468 455
4 Pension yield tax (3,940) (2.826) - -
Investment return after pension yield tax 23,221 17,388 468 455
Insurance benefits
5 Benefits disbursed (15,414) (12,911) - -
Reinsurance cover received 131 101 - -
Change in provisions for claims 217 (203) - -
Total insurance benefits, net of reinsurance (15,067) (13,013) - -
22 Change in life insurance provisions (16,749) (12,470) - -
Bonus
24 Change in collective bonus potential 1,169 (2,579) - -
25 Change in CustomerCapital (1,815) (1,647) - -
Total bonus (646) (4,225) - -
26 Change in provisions for unit linked contracts (6,916) (4,849) - -
6 Net operating expenses
Acquisition costs (214) (217) - -
Administrative expenses (600) (378) (11) (10)
Total net operating expenses, net of reinsurance (814) (595) (11) (10)
7 Transferred investment return (475) (451) - -
Balance on the technical account 145 127 457 444
8 Profit/(loss) on health and accident insurance 81 52 - -
7 Investment return on equity 343 342 - -
9 Other income 70 136 - -
Other expenses (21) (77) - -
10 Pre-tax profit/(loss) 617 580 457 444
11 Tax (149) (118) 3 4
Net profit/(loss) for the year before minority interests 468 462 460 448
Minority interests’ share (8) (14) - -
Profit/(loss) for the year 460 448 460 448
Total comprehensive income for the year 460 448 460 448
Group PFA Holding

P F A H o l d i n g A n n u a l R e p o r t 2 0 1 1 6 1

P F A H o l d i n g A n n u a l R e p o r t 2 0 1 16 2
Balance sheet - Assets
Note (DKK million)
2011 2010 2011 2010
ASSETS
Intangible assets 541 486 - -
12 Equipment 46 51 - -
13 Owner-occupied properties 374 352 - -
Total property, plant and equipment 420 403 - -
Investment assets
13 Investment properties 12,935 12,553 - -
Investments in group enterprises and associates
14 Equity investments in group enterprises - - 5,413 4,957
15 Equity investments in associates 265 57 - -
Total investments in group enterprises and associates 265 57 5,413 4,957
Other financial investment assets
Equity investments 18,755 28,360 - -
Bonds 234,044 203,258 - -
16 Loans 141 216 - -
Derivative financial instruments 20,786 11,059 - -
Total other financial investment assets 273,727 242,894 - -
Total investment assets 286,926 255,504 5,413 4,957
17 Investment assets related to unit linked insurance contracts 21,000 14,371 - -
Total reinsurers' share of technical provisions 1 2 - -
Receivables
Receivables from policyholders 614 665 - -
Receivables from insurance companies 18 20 - -
Other receivables 140 24 0 0
Total receivables 773 708 0 0
Other assets
Current tax assets 139 123 3 3
11 Deferred tax assets 2,029 2,171 9 10
Cash and cash equivalents 9,397 22,061 31 31
Total other assets 11,565 24,356 43 43
Prepayments
Interest receivable and accumulated rent 2,973 2,849 0 0
Other prepayments 431 488 0 0
Total prepayments 3,404 3,338 0 0
Total assets 324,630 299,168 5,456 5,000
Group PFA Holding

P F A H o l d i n g A n n u a l R e p o r t 2 0 1 1 6 3
Balance sheet – Equity and liabilities
Note (DKK million)
2011 2010 2011 2010
EQUITY AND LIABILITIES
Equity
18 Share capital 1 1 1 1
Contingency fund 1,245 1,245 - -
19 Revaluation reserve, owner-occupied properties 0 0 - -
Total reserves 1,245 1,245 - -
20 Retained earnings 4,197 3,737 5,442 4,982
Proposed dividend - - 0 0
PFA Holding’s share 5,443 4,983 5,443 4,983
Minority interests’ share 229 239 - -
Total equity 5,673 5,222 5,443 4,983
21 Subordinate loan capital 1,150 1,150 - -
Provisions for insurance and investment contracts
Provisions for unearned premiums 86 71 - -
Life insurance provisions
Guaranteed benefits 214,559 176,657 - -
Bonus potential on future premiums 17,354 29,321 - -
Bonus potential on paid-up policies 5,438 14,534 - -
22 Total life insurance provisions 237,351 220,511 - -
23 Provisions for claims 2,306 2,493 - -
24 Collective bonus potential 5,824 6,993 - -
Provisions for bonus and rebates 2 4 - -
25 CustomerCapital 15,540 13,726 - -
26 Provisions for unit linked contracts 21,281 14,412 - -
Total provisions for insurance and investment contracts 282,390 258,209 - -
Provisions
Deferred tax liabilities 21 27 - -
Total provisions 21 27 - -
Liabilities other than provisions
Payables, direct insurance operations 54 100 - -
Payables, reinsurance 11 16 - -
21 Payables to credit institutions 668 850 0 0
Payables to group enterprises - - 13 17
Current tax liabilities 3,963 2,719 0 0
27 Other payables 29,949 30,219 0 0
Total liabilities other than provisions 34,646 33,903 13 17
Deferred income 751 656 0 0
Total equity and liabilities 324,630 299,168 5,456 5,000
28 Contingent liabilities
29 Breakdown of assets and returns 2011
30 Breakdown of equity investments on industries and regions
31 Risk information and sensitivity information
32 5-year summary (key figures and financial ratios) – see page 56
33 Directorships – see page 85
Group PFA Holding

P F A H o l d i n g A n n u a l R e p o r t 2 0 1 16 4
Statement of changes in equity and capital structure
Note (DKK million)
2011 2010 2011 2010
Statement of changes in equity
Share capital 1 1 1 1
Contingency fund 1,245 1,245 - -
Revaluation reserve, owner-occupied properties 0 0 - -
Retained earnings 3,737 3,289 4,982 4,534
Equity, beginning of year 4,983 4,535 4,983 4,535
Retained earnings for the year 460 448 460 448
Dividend from previous years - - 0 0
PFA Holding’s share, total 5,443 4,984 5,443 4,983
Minority interests’ share:
Transfer, beginning of year 239 61 - -
PFA Professionel Forening (the “Professional Association”) 0 165 - -
Minority interests’ share 239 225 - -
Minority interests’ share of the year’s comprehensive income (8) 14 - -
Minority interests’ share, total 231 239 - -
Equity, end of year 5,673 5,222 5,443 4,983
Capital base and solvency requirements
Equity 5,443 4,983
Core capital 5,443 4,983
Proposed dividend 0 0
Booked tax assets, net (9) (10)
Reduced core capital 5,434 4,973
Capital base 5,434 4,973
Solvency requirement (8 % of weighted assets) (435) (399)
Excess capital base 4,998 4,575
The capital base and solvency requirement for PFA Holding are determined in accordance with the rules applicable to financial holding companies.
Group PFA Holding

P F A H o l d i n g A n n u a l R e p o r t 2 0 1 1 6 5
Accounting policies
General
The Annual Report is presented in accordance with
the accounting principles described in the Execu-
tive Order on the financial reporting of insurance
companies and multi-employer pension funds is-
sued by the Danish Financial Supervisory Authority.
All amounts in the financial statements are
presented in whole million DKK. Every figure is
rounded off separately and for that reason, minor
differences between the stated totals and the sum
of underlying figures may occur.
Changes since 2010
As a result of the new Executive Order on the
financial reporting of insurance companies and
multi-employer pension funds, other comprehen-
sive income is disclosed separately in continuation
of the income statement. Furthermore, changes
from other comprehensive income are shown in
the statement of changes in equity. Other compre-
hensive income includes items that are recognised
directly in equity. Comparative figures have been
restated.
New Executive Order on contribution
On 1 January 2011, a new Executive Order on the
contribution principle became effective. Accord-
ing to the new rules, the total portfolio on average
interest rate insurance plans must be divided into
homogenous groups according to the follow-
ing accounting elements: interest rate, risk and
expenses. Each group has its own collective bonus
potential. PFA Pension has divided the customers
with average interest rate products into four inter-
est groups based on the technical interest and into
a number of risk and expense groups.
Accounting estimates and assessments
The preparation of the financial statements pre-
supposes that Management performs a number
of estimates and assessments concerning future
conditions that may have a significant impact on
the carrying amount of assets and liabilities. The
areas, in which the management’s estimates and
assessments have the most significant impact on
the financial statements, are:
• Liabilities concerning insurance contracts
• Fair value of financial instruments
• Fair value of properties.
Liabilities concerning insurance contracts
The determination of liabilities concerning insur-
ance contracts is based on a number of actuarial
calculations. These calculations include assump-
tions on a number of variables such as mortality
and disability etc. The assumptions are based on
empirical data from the existing insurance port-
folio and are updated on an ongoing basis.
The Danish Financial Supervisory Authority’s
benchmark for expected future improvements in
life expectancy and the observed present mortal-
ity rates were applied for measuring life insurance
provisions in 2011. In the determination of life
insurance provisions, the use of the benchmark
has involved an increase in life expectancy of 1.3
years for a 65-year-old male and 1.2 years for a
65-year-old female compared to observed life
expectancy today. A 65-year-old male is thus
expected to live an additional 19.5 years whereas a
65-year-old female is expected to live an additional
22.1 years. These assumptions led to an increase in
life insurance provisions of approx. DKK 2.4 billion
compared to the previously notified life expectancy
assumptions. The change reduces the realised
results but it does not have a direct impact on the
company’s capital base.
Insurance liabilities as at 31 December 2011 were
determined using the discount rate published
in the Danish Financial Supervisory Authority’s
announcement of 5 December 2011. With the
announcement, the Danish Financial Supervisory
Authority made a technical adjustment to mar-
ket conditions of the adjusted term-dependent
Notes to the income statement and balance sheet

P F A H o l d i n g A n n u a l R e p o r t 2 0 1 16 6
yield curve, which is the result of the agreement
on financial stability in the pension area that the
Danish Ministry of Economic and Business Affairs
entered into with the Danish Insurance Association
on 31 October 2008. The term-dependent yield
curve consists of a non-adjusted and an adjusted
element. The non-adjusted element is based on
the Euro swap yield curve plus a spread between
Danish and German government bonds. The
changed technical construction of the new yield
curve means that the country spread between
Danish and German interest rates is calculated as a
12-month sliding average with a lower limit of 0 bp.
The adjusted element of the yield curve includes
a fixed addition to the non-adjusted discount rate
curve from the 7-year point corresponding to 50
per cent of the difference between a constructed
mortgage credit interest rate and the non-adjusted
discount rate.
The technical adjustment of the yield curve on 5
December 2011 led to a reduction in life insurance
provisions of DKK 3.4 billion and an increase in the
ICAAP result (individual solvency need) to cover the
country spread risk of DKK 4 billion.
Insurance liabilities for health and accident insur-
ance are determined in consideration of expecta-
tions as to the number of future recoveries and
reopening of old cases. The expectations are
based on empirical data from the Group’s existing
insurance portfolio and are updated on an ongoing
basis.
Fair value of financial instruments
No significant estimates are involved in the valua-
tion of financial instruments with listed prices on
an active market or where the valuation is based on
accepted valuations with observable market data.
For financial instruments where the valuation
is based on observable market data to a lesser
extent, the valuation is affected by estimates. For
instance, this is the case for unlisted equity invest-
ments as well as certain bonds.
Fair value of properties
The fair value of properties is determined accord-
ing to the return method, according to which the
expected operating income on properties and
an individually determined return requirement
for each property are used in accordance with
Appendix 7 in the Executive Order on the financial
reporting of insurance companies.
Profit or loss for the year and contribution
The company notified the Danish Financial Su-
pervisory Authority of the principle used for the
distribution of the annual realised results in ac-
cordance with the Executive Order on the contribu-
tion principle.
The share of realised results before tax attribut-
able to equity and CustomerCapital for insurance
plans subject to contribution consists of invest-
ment returns on their separate assets after the
addition of an operational risk charge and after
the deduction of any losses. The remaining part of
the realised results is split among the contribution
groups as stated below (interest, risk and expense
groups).
CustomerCapital consists of special bonus provi-
sions, type B, in accordance with Section 32 of the
Danish Executive Order on capital base determi-
nation. CustomerCapital has the same ranking as
equity. CustomerCapital is divided into Collective
CustomerCapital and Individual CustomerCapital.
Health and accident insurance results, results
from unit linked contracts and other ordinary and
extraordinary income will be allocated proportion-
ately to equity and CustomerCapital.
The notified principle for the share of realised
results for the year attributable to equity may be
deviated from in any one year for the benefit of
CustomerCapital and/or collective bonus potential.
Interest rate groups
If the group’s realised results are positive, equity
and CustomerCapital receive an operational risk
charge. If the realised results are insufficient to
cover the targeted operational risk charge allo-
cable to equity and CustomerCapital, the out-
standing amount will be recorded as a receivable
outside the balance sheet. Any operational risk
charge receivable will appear from the statement

P F A H o l d i n g A n n u a l R e p o r t 2 0 1 1 6 7
of changes in equity. The annual review and the
note to pre-tax profit/(loss) give a detailed account
of the determination and distribution of realised
results for the year.
The balance of the realised results for the year
accrues to the policyholders in the form of bonus
etc., and any excess amount is transferred to the
group’s collective bonus potential.
If the remaining realised results are negative,
the amount will primarily be deducted from the
group’s collective bonus potential and subse-
quently from the policyholders’ total bonus po-
tential on paid-up policy benefits within the group.
If the bonus potential on paid-up policy benefits is
insufficient, the remaining amount will be covered
by equity and CustomerCapital on a pro-rata basis.
Risk and expense groups
In the risk and expense groups, the realised results
are first reduced by the amount that has been
allocated to customers in advance in the form of
bonus etc. If the group’s remaining realised result
is positive, it is reduced by the targeted operational
risk charge to equity and CustomerCapital. If the
remaining realised result is positive, it is trans-
ferred to the group’s collective bonus potential.
If the remaining realised result is negative, it is
covered by the group’s collective bonus potential.
If the group’s collective bonus potential remains
insufficient to cover the entire negative amount,
the negative balance will be covered by equity and
CustomerCapital on a pro-rata basis. Shadow ac-
counts are not kept for amounts covered by equity
and CustomerCapital.
Group structure and related parties
The consolidated financial statements include
companies in which the parent company, directly
or indirectly, owns 50 per cent or more of the
votes, or otherwise has a controlling interest. The
Group’s activities mainly relate to life and pension
insurance. The consolidated financial statements
are therefore prepared in accordance with the
rules applicable to life insurance companies.
Jointly controlled associates are consolidated on
a pro-rata basis.
Associates are companies in which the Group holds
equity investments and exerts a significant but not
controlling influence. The companies are basically
classified as associates, if PFA Holding – directly or
indirectly – holds between 20 and 50 per cent of
the voting rights.
No companies were bought or sold in 2010 and
2011.
Intercompany transactions
Intercompany transactions in the PFA Holding
Group are entered into on an arm’s length basis or
according to a cost recovery principle and following
a written agreement between the companies.
Foreign currency translation
Both the Group’s and the parent company’s
functional currency and presentation currency
are in DKK. Transactions in foreign currencies are
translated using the exchange rate at the date of
transaction. Balance sheet items in foreign curren-
cies are translated using the exchange rates from
the Bank of England (GMT1600) prevailing at the
balance-sheet date. Any exchange differences in
connection with foreign currency translations are
recognised in the income statement. The fair value
of forward exchange transactions is calculated by
discounting the value to the balance-sheet date
based on the relevant money market interest rate.
Insurance and investment contracts
Life insurance policies are broken down into
insurance and investment contracts. Insurance
contracts are contracts with significant insurance
risks or which entitle the policyholder to bonus.
Investment contracts are contracts with insignifi-
cant insurance risks and form part of unit linked
contracts where the policyholder carries the
investment risk.
General principles of recognition
and measurement
In the income statement, income is recognised as
it is earned, and all expenses - including insurance
benefits, changes in provisions and changes in
bonus – are recognised as they are settled.

P F A H o l d i n g A n n u a l R e p o r t 2 0 1 16 8
Assets are recognised in the balance sheet when
it is probable that future benefits will flow to the
company, and when the value of the assets can
be measured reliably. Liabilities are recognised in
the balance sheet, when it is probable that future
financial benefits will flow from the company, and
when the value of the liability can be measured
reliably.
Income statement
Premiums
Premiums, including single premiums, are recog-
nised in the income statement at the recorded due
date. Transfers between the company’s individual
insurance portfolios are not recognised in the
premium revenue, unless tax has been paid on the
transfer according to the Danish Pension Taxation
Act. Reinsurers’ shares of premiums are deducted.
Premiums from investment contracts are recog-
nised directly in the balance sheet.
Investment return
Income from group enterprises and associates in-
cludes the Group’s and the parent company’s share
of the relevant companies’ profit or loss after tax
inclusive of value adjustments.
Income from investment properties includes the
results of operation of business properties before
expenses for property management and before
mortgage interest .
Interest income, dividends etc. include interest
on securities and loans, indexation of index-linked
bonds and dividends from equity investments for
the year.
Value adjustments consist of the year’s value
adjustment of equity investments, investment
properties, owner-occupied properties, bonds and
loans as well as derivative financial instruments.
Interest expenses include interest payable on
subordinate loan capital and other payables.
Administrative expenses of investment activi-
ties include portfolio management fees payable to
asset managers, direct trade and deposit expenses
as well as own administrative expenses related to
investment assets.
Pension yield tax covers individual pension yield
tax that is calculated on the ongoing addition of
interest to customers and pension yield tax by
institute, which is calculated on the transfer to
collective bonus potential and to CustomerCapital.
Pension yield tax amounts to 15 per cent.
Insurance benefits
Insurance benefits, net of reinsurance, include
benefits disbursed for the year, following adjust-
ment for the year’s change in the provisions for
claims, and after the deduction of reinsurers’
shares. Insurance benefits concerning investment
contracts are recognised directly in the balance
sheet.
Change in life insurance provisions
The change in life insurance provisions, net of rein-
surance, covers the year’s change in life insurance
provisions. The change in life insurance provisions
is broken down in the balance sheet on guaranteed
benefits, bonus potential on future premiums and
bonus potential on paid-up policy benefits.
Change in provisions for unit linked contracts
The change in provisions for unit linked contracts
covers the year’s change in unit linked provisions,
except for premiums and benefits concerning
investment contracts.
Bonus
The change in collective bonus potential is the por-
tion of realised results accruing to the insurance
portfolio, in excess of the bonus already allocated.
Any transfers from equity are added to this. In
years in which the insurance portfolio’s realised re-
sults are negative after deduction of bonus already
allocated, the item includes the use of collective
bonus potential for which a provision was made in
prior years.
The change in CustomerCapital includes the
return on assets allocated to CustomerCapital, the
net amount contributed by customers during the
year, the year’s operational risk charge added, the
share of results of other activities and any trans-
fers from equity.
Net operating expenses
Acquisition costs include expenses associated with
the acquisition and renewal of the insurance

P F A H o l d i n g A n n u a l R e p o r t 2 0 1 1 6 9
portfolio. Administrative expenses include other
expenses concerning the insurance operations.
The distribution of indirectly attributable costs
between acquisitions and administration and
between life insurance and health and accident
insurance is made according to a cost allocation
method based on activities.
The Group’s contributions to the defined contribu-
tion pension plans for employees are recognised
in the income statement as the contributions are
earned by the employees.
Bonus to the employees is recognised in the
income statement in the year in which bonus is
earned.
A share of the total operating expenses, based
on direct and estimated resource consumption, is
recognised in the items Administrative expenses
of investment business, Net operating expenses
and Balance on the technical account, health and
accident insurance.
Transferred investment return includes the
share of investment return related to equity and
health and accident insurance. Investment return
on equity constitutes the return on investment as-
sets allocated to equity. The return on health and
accident insurance is calculated on the basis of the
average balance sheet figures at the beginning and
the end of the year.
Health and accident insurance
Earned premiums, net of reinsurance, are
recognised in the income statement on the due
date. Earned premiums, which are determined
after the deduction of claims independent rebates
etc. and ceded insurance premiums, are stated on
an accruals basis.
The technical interest, which is a calculated inter-
est yield of the mean technical provisions, net of
reinsurance, is transferred to the investment re-
turn. The amount is calculated using the term-de-
pendent discount rate fixed by the Danish Financial
Supervisory Authority. The part of the increase of
premium and claims provisions attributable to dis-
counting is transferred from the premiums/claims
incurred for set-off against the technical interest.
Value adjustments form part of investment return.
Claims incurred, net of reinsurance, include the
year’s disbursed claims following adjustment for
the year’s change in provisions for claims, including
profit or loss of previous years’ provisions (run-
off profit or loss). Furthermore, this item includes
expenses in connection with the assessment of
claims, claims control expenses and an estimate
of expected expenses in connection with the ad-
ministration and claims handling of the insurance
contracts entered into by the company. Reinsurers’
share is set off against the total gross claims.
Transferred investment return is calculated as
a proportionate share of the investment return
from a special asset portfolio that is equal to the
health and accident provisions as well as provisions
for other provisions of marginal size relative to the
company’s balance sheet total.
Other income includes income from the adminis-
tration of other companies as well as other income
not directly attributable to the company’s insur-
ance portfolio or investment assets.
Other expenses include costs in connection
with the administration of other companies as
well as other expenses not directly attributable to
the company’s insurance portfolio or investment
assets.
Tax
The PFA Group’s Danish subsidiaries and sister
companies are taxed jointly in accordance with
the applicable tax rules. PFA has opted not to
include the companies’ foreign properties and PFA
Soraarneq in the joint taxation regime.
The Danish taxable income of the Group’s property
companies forms part of the parent company’s
taxable income, provided that at least 90 per cent
of the individual property company’s assets con-
sists of real property. In that case, provisions for
both current and deferred taxes are made in the
parent company.
Current tax is distributed among profit-yielding
P F A H o l d i n g A n n u a l R e p o r t 2 0 1 17 0
jointly taxed companies, which also refund the tax
bases of any losses to the loss-making companies.
Deferred tax is recognised on the basis of the tem-
porary differences between the carrying amounts
and tax bases of the assets and liabilities at the
balance-sheet date.
Balance sheet
Assets
Intangible assets
Goodwill in connection with the acquisition of
equity investments in group enterprises is deter-
mined as the positive difference between the total
cost and the fair value of the net assets at the date
of acquisition. Annual impairment tests are made
and any write-downs are recognised in the income
statement.
Acquired and self-developed software is recog-
nised in the balance sheet at cost after the deduc-
tion of accumulated amortisation and accumulated
impairment losses. The cost of self-developed
software includes direct and internal project devel-
opment expenses. Amortisation is made according
to the straight-line method over the expected use-
ful life, which is between 0 and 8 years. Impairment
losses are estimated on the basis of impairment
tests. Expenses in connection with maintaining
intangible assets are expensed in the year they are
defrayed.
Property, plant and equipment
Equipment mainly consists of cars. Equipment
is recognised in the balance sheet at cost after
the deduction of accumulated depreciation and
accumulated impairment losses. Depreciation
is calculated on a straight-line basis over the
expected useful life, typically four years.
Owner-occupied properties are properties
which the Groups uses for administration etc.
Owner-occupied properties are measured at cost
on initial recognition. Subsequently, the owner-
occupied properties are measured at fair value.
The increase in the revalued amount is recognised
in other comprehensive income unless the increase
is equal to a decrease in value which was previously
recognised in the income statement. Decreases in
the revalued amount are recognised in the income
statement unless the decrease is equal to an in-
crease in value which was previously recognised in
other comprehensive income.
Depreciation on owner-occupied properties is
made on a straight-line basis based on the prop-
erty’s scrap value and an estimated useful life of
100 years.
Investment assets
Investment properties are properties that have
been acquired to obtain rental income and/or
capital gains. Investment properties are initially
recognised at cost. Subsequently, investment
properties are measured at fair value. The fair
value is calculated according to the return method
in accordance with the principles in the Executive
Order on the presentation of financial statements.
The method is based on the individual property’s
operating income and a return requirement related
to the property (required rate of return). Operat-
ing income is based on the future year’s expected
return adjusted for exceptional circumstances.
Properties that have been scheduled for sale have
been measured at the expected selling price in
consideration of the time frame.
Equity investments in group enterprises and
associates are recognised at the date of acquisi-
tion at cost and are subsequently measured at
the most recent equity value. The proportionate
ownership shares of the companies’ equity are
included in the items Equity investments in group
enterprises and Equity investments in associates,
and the proportionate shares of the individual
companies’ results after tax are included in the
item Profit/(loss) in the notes on equity invest-
ments in group enterprises and associates.
Other financial investment assets
Financial instruments are recognised in the bal-
ance sheet at cost at the trade date, not including
expenses in connection with the purchase, and are
measured at fair value after initial recognition.

P F A H o l d i n g A n n u a l R e p o r t 2 0 1 1 7 1
Unit trust certificates are included in the individual
items of the balance sheet on the basis of the
underlying assets.
The fair value of listed financial assets is calculated
on the basis of the closing price at the balance-
sheet date. In the event that there is no relevant
closing price at the balance-sheet date, another
relevant price at the balance-sheet date or the
most recently quoted price is used. In the event
that there is no other relevant price, the fair value
is estimated based on the official closing prices of
comparable financial instruments at the balance-
sheet date.
On the purchase and sale of financial assets, the
trade date is used as the recognition date. When
the trade date is used, a liability corresponding to
the agreed price is recognised at the same time
as the purchase of a financial asset. Correspond-
ingly, an asset corresponding to the agreed price
is recognised in connection with the sale of a
financial asset. The liability or asset ceases to be
recognised in the balance sheet at the settlement
date. As a consequence of using the trade date as
a recognition principle, coupons and drawings are
considered as cash from the time when informa-
tion about the transaction has been received.
Listed bonds that have been drawn are measured
at the present value of the amount drawn by dis-
counting them at a money market rate.
Unlisted unit trust certificates are measured at the
fair value of the underlying net assets.
The fair value of unlisted derivative financial instru-
ments is recognised on the basis of the fair value
determined by external parties, with the exception
of OTC derivatives. The fair value of other unlisted
securities and OTC derivatives is measured accord-
ing to recognised methods, including standards
determined by the European Private Equity and
Venture Capital Association (EVCA).
Investment assets related to unit linked insur-
ance contracts comprise assets on unit linked
contracts. Investment assets related to unit linked
contracts are measured using the same principles
as for other financial investment assets (see de-
scription above).
Receivables
Receivables are measured at amortised cost, which
usually corresponds to the nominal value less any
write-downs in consideration of expected losses.
Other assets
Deferred tax assets and deferred tax liabilities
are determined according to applicable tax law.
Tax assets relating to loss carryforwards are only
recognised in deferred tax if it is probable that they
can be utilised.
Equity and liabilities
Equity
The revaluation reserve relating to owner-occupied
properties covers the value adjustment of owner-
occupied properties to fair value after the deduc-
tion of accumulated depreciation. The part of the
value adjustment attributable to insurance and
investment contracts eligible for bonus is trans-
ferred to collective bonus potential.
Subordinate loan capital
Subordinate loan capital is subordinated debt. In
case of liquidation or bankruptcy, the subordinate
loan capital ranks after the ordinary unsecured
creditors’ clams. Subordinate loan capital is
measured at fair value.
Provisions for insurance and investment
contracts
Life insurance provisions, net of reinsurance,
are measured on every insurance plan by deter-
mining the market value of expected, future cash
flows. Market value is calculated by discounting
the individual payments at an interest rate based
on the Danish yield curve published by the Danish
Financial Supervisory Authority, reduced by pen-
sion yield tax for relevant policy parts. Expected,
future cash flows are calculated on the basis of
den present life expectancy, future life expectancy
improvements and disablement intensity on the
basis of own analyses of the Group’s insurance
portfolios.

P F A H o l d i n g A n n u a l R e p o r t 2 0 1 17 2
Life insurance provisions are determined in con-
sideration of an age-dependent probability that
the individual insured will surrender his/her policy.
The life insurance provisions include a market value
margin.
Guaranteed benefits represent the market value
of benefits guaranteed to the individual insured
with the addition of expected future administrative
expenses and less the agreed future premiums.
Guaranteed benefits include an estimated amount
to cover future insurance benefits pertaining to
insurance events that occurred during the financial
year, but had not been reported by the balance-
sheet date.
Bonus potential on future premiums consists
of commitments to pay bonus in future on agreed
premiums that have not yet fallen due. Bonus
potential on future premiums is determined as the
difference between the value of guaranteed paid-
up policy benefits and the value of guaranteed
benefits, if this difference is positive. Guaranteed
paid-up policy benefits are the present values of
the benefits guaranteed to the policyholder on
conversion to a paid-up policy less the present
value of expected future expenses to administer
the policy.
Bonus potential on paid-up policy benefits
comprises the value of liabilities to pay bonus
concerning premiums etc. already paid. Bonus
potential on paid-up policies is determined as the
difference between the value of retrospective
provisions and the value of guaranteed paid-up
policy benefits, if this difference is positive. Ret-
rospective provisions are paid premiums after the
deduction of disbursed benefits and expenses and
with the addition of added interest.
Provisions for claims
Provisions for claims are estimates of expected
disbursements and past due, but not paid, insur-
ance benefits. Provisions for claims concerning
health and accident insurance include provisions
for administrative expenses in connection with the
settlement of claims and are determined as the
present value of expected future payments, includ-
ing estimated expenses to settle claims incurred.
Collective bonus potential is the insurance
portfolio’s share of the realised results included in
collective provisions for bonus-eligible insurance
plans, in addition to life insurance provisions and
provisions for claims.
Provisions for bonus and premium rebates
are amounts accruing to the policyholders due
to favourable claims experience in the present or
previous years.
CustomerCapital forms part of the capital base
on a par with equity, but since it accrues to the
policyholders over time, it forms part of the techni-
cal provisions.
Provisions for unit linked insurance plans gen-
erally represent the market value of the underlying
assets. If the policies in question include a stipula-
tion that, at the time of maturity, benefits will be
calculated on the basis of a value that is higher
than the current market value of the assets, then
the provisions will be measured with due allowance
for this.
Payables and provisions
Payables and provisions are measured at amor-
tised cost, which usually corresponds to nominal
value.
Deferred tax liabilities are determined according
to applicable tax law.
Financial ratios
Return ratios in the 5-year summary are calculated
for all assets and liabilities according to a money-
weighted method, whereas return broken down
by asset type in the return table is calculated for
investment assets (i.e. excl. liabilities and various
assets) according to a time-weighted method.
Currency hedging is included in the return table.
Other financial investment assets. Interest
receivable is included in the value of the individual
bond classes in the return table.

P F A H o l d i n g A n n u a l R e p o r t 2 0 1 1 7 3
Notes to the Income Statement
Note (DKK million)
2011 2010 2011 2010
1 Gross premiums
Total indirect insurance 35 39 - -
Premiums, direct 12,537 12,470 - -
Group life premiums, direct 904 871 - -
Single premiums and transfers, direct 4,196 5,036 - -
Total direct insurance 17,637 18,377 - -
Premiums relating to insurance and investment contracts, total 17,671 18,415 - -
Transfer of premiums from investment contracts to the balance sheet (11) (19) - -
Intercompany transfers 23 83 - -
Premiums relating to investment contracts 13 64 - -
Total gross premiums 17,684 18,479 - -
Breakdown of direct insurance premiums:
Insurance taken out through employer 16,083 16,731 - -
Insurance taken out by individuals 663 839 - -
Group life insurance 904 871 - -
Total 17,649 18,440 - -
All premium income is from Danish direct insurance 17,649 18,440 - -
Insurance with bonus plans 9,323 14,521 - -
Insurance without bonus plans 17 18 - -
Unit linked contracts 8,309 3,902 - -
Total 17,649 18,440 - -
Number of insureds, direct insurance:
Insurance taken out through employer 671,917 663,063 - -
Insurance taken out by individuals 52,742 52,567 - -
Group life insurance 498,031 489,357 - -
2 Interest income, dividends etc.
Interest income 8,521 7,686 0 0
Indexation 423 353 0 0
Dividends 634 568 0 0
Total interest income, dividends etc. 9,578 8,608 0 0
3 Value adjustments
Investment properties 33 224 - -
Owner-occupied properties 22 15 - -
Equity investments (2,594) 5,512 - -
Bonds 10,599 7,287 - -
Loans (9) (10) - -
Derivative financial instruments 9,604 (1,377) - -
Total value adjustments 17,656 11,651 - -
4 Pension yield tax
Collective pension yield tax (2,873) (1,587) - -
Individual pension yield tax (1,026) (1,228) - -
Adjustment of pension yield tax for previous year(s) (41) (11) - -
Total pension yield tax (3,940) (2,826) - -
Group PFA Holding

P F A H o l d i n g A n n u a l R e p o r t 2 0 1 17 4
Salary and remuneration to the Executive Board
2011 Henrik Heideby
Anne Broeng
Lars Ellehave-Andersen
Jon Johnsen
Total
Salary 4.9 2.4 2.0 2.4 11.7
Value of company car etc. 0.2 0.2 0.2 0.2 0.7
5.0 2.6 2.2 2.6 12.4
Pension 1.0 0.5 0.4 0.5 2.4
Bonus 0.9 0.4 0.4 0.6 2.2
Total 6.9 3.4 3.0 3.7 16.9
2010
16.4Salary, value of company car etc., pension and bonus
Jon Johnsen’s bonus scheme was agreed upon in connection with his employment in 2009. As of 2011, the Remuneration Committee has decided that all group executive vice presidents should have uniform bonus schemes of up to 20 per cent of their fixed salary. The company can give notice of termination to the Group CEO at 24 months’ notice and 6 months’ notice to the group executive vice presidents with 6 months’ severance pay. All group executive vice presidents can terminate their employment at 6 months’ notice.
Note (DKK million)
2011 2010 2011 2010
5 Benefits disbursed
Insurance contracts, direct
Death benefits (783) (646) - -
Disability benefits (93) (83) - -
Benefits at maturity (2,214) (1,677) - -
Retirement and annuity benefits (5,935) (5,564) - -
Surrender (5,769) (4,316) - -
Bonuses disbursed in cash (570) (576) - -
Total insurance contracts, direct (15,364) (12,862) - -
Expenses, indirect insurance (90) (84) - -
Total benefits regarding insurance and investment contracts (15,455) (12,946) - -
Transfer of insurance benefits from investment contracts to the balance sheet
43 37 - -
Intercompany transfers (3) (2) - -
Benefits regarding investment contracts 40 35 - -
Total benefits disbursed (15,414) (12,911) - -
6 Total expenses include:
Salaries, employees (701) (652) - -
Pension contributions (126) (117) - -
Payroll tax etc. (77) (66) - -
Total payroll costs (904) (836) - -
(13) (14) - -
Commission for direct insurance business amounts to 2 0 - -
Write-down of intangible assets in subsidiaries
Group PFA Holding

P F A H o l d i n g A n n u a l R e p o r t 2 0 1 1 7 5
Salary and remuneration, including pension contributions, to employees whose activities have a significant impact on the company’s risk profile.
2011
2010
Fixed salary 15.5 -
Variable salary 2.6 -
Total salary and remuneration 18.1 11.5
Number of persons 9 9
Besides, we refer to www.PFA.dk
Group
(DKK million)
2011 2010 2011 2010
Fees to auditors elected by the Annual General Meeting of Shareholders:
Deloitte
Statutory audit of the Financial Statements (4) (3) - -
Remuneration, other assurance engagements 0 0 - -
Remuneration, non-audit services (3) (1) - -
Total auditors’ fees to Deloitte (7) (4) - -
Average number of employees (full-time) for the year
PFA Pension, including real estate department 1,095 1,088 - -
PFA Kapitalforvaltning (PFA Asset Management) 25 18 - -
PFA Portefølje Administration (PFA Portfolio Administration) 17 13 - -
Other and/or terminated business 19 34 - -
Total 1,156 1,154 - -
7 Transferred investment return
Transferred investment return concerning equity (343) (342) - -
Investment return transferred to non-life insurance (132) (110) - -
Total transferred investment return (475) (451) - -
Note (DKK million)
6 Total expenses include: (continued)
Remuneration, the Supervisory Board (DKK million)
Supervisory Board
Audit Committee
Remuneration Committee
2011 2010
Svend Askær 0.6 0.1 0.1 0.8 -
Jørn Neergaard Larsen 0.4 0.2 0.6 -
Hans Skov Christensen 0.2 0.1 0.3 -
Gita Grüning 0.2 0.2 -
Erik G. Hansen 0.2 0.1 0.3 -
Peter Ibsen 0.2 0.2 -
Per Jørgensen 0.2 0.2 -
Torben Dalby Larsen 0.2 0.1 0.3 -
Poul Erik Pedersen 0.2 0.2 -
Klavs Andreassen 0.2 0.2 -
Lars Christoffersen 0.2 0.2 -
Hanne Sneholm Jensen 0.2 0.2 -
Thomas P. Jensen (new member as at 1 May) 0.1 0.1 -
Mette Risom (new member as at 1 May) 0.1 0.1 -
Carsten Bach (retired on 30 April 2011) 0.1 0.1 -
Simone Le Madsen (retired on 30 April 2011) 0.1 0.1 -
Total remuneration 3.4 0.4 0.2 3.9 3
Group PFA Holding

P F A H o l d i n g A n n u a l R e p o r t 2 0 1 17 6
The run-off profit/(loss) reflects the profit/(loss) on the provisions for claims made in previous year(s).
Note (DKK million)
2011 2010 2011 2010
8 Profit/(loss) on health and accident insurance
Gross premiums 747 688 - -
Change in provisions for unearned premiums (18) (3) - -
Earned premiums, net of reinsurance 730 685 - -
Technical interest (34) (3) - -
Gross claims disbursed (512) (522) - -
Change in provisions for claims (127) (70) - -
Discounting - reduction in term 32 32 - -
Discounting - change in yield curve 36 19 - -
Claims incurred, net of reinsurance (570) (540) - -
Change in other technical provisions, net of reinsurance (3) (3) - -
Bonuses and rebates 1 (2) - -
Acquisition costs (70) (68) - -
Administrative expenses (69) (78) - -
Total net operating expenses, net of reinsurance (140) (146) - -
Investment return 132 110 - -
Return on technical provisions (34) (48) - -
Total profit/(loss) on health and accident insurance 81 52 - -
All premium income is from Danish insurance 747 688 - -
Claims, health and accident insurance
Number of policies 432,133 454,347 - -
Number of claims (units) 168,019 111,685 - -
Average compensation for claims incurred, in DKK 5,376 4,921 - -
Claims frequency 27.94 % 23.32 % - -
Gross run-off profit/(loss) 78 50 - -
Ceded run-off 0 1 - -
Run-off profit/(loss), net of reinsurance 78 52 - -
Group PFA Holding
Return on technical provisions 34 48 - -
Discounting - change in term (32) (32) - -
Discounting - change in yield curve (36) (19) - -
Technical interest, net of reinsurance, total (34) (3) - -
Health and accident insurance, key figures
2007 2008 2009 2010 2011
Gross claims ratio 127.1 % 90.1 % 107.4 % 79.7 % 78.5 %
Gross expense ratio 17.8 % 22.5 % 21.8 % 21.4 % 19.1 %
Combined ratio, net of reinsurance 144.9 % 112.5 % 129.2 % 101.1 % 97.6 %
Operating ratio 140.1 % 123.5 % 123.6 % 93.1 % 89.8 %
Comparative run-off profit/(loss) (5.5 %) 3.7 % (1.5 %) 3.2 % 4.3 %
2011 2010 2011 2010
9 Other income
Commissions from investment associations 60 55 0 0
Miscellaneous income 10 81 0 0
Total other income 70 136 0 0
Group PFA Holding

P F A H o l d i n g A n n u a l R e p o r t 2 0 1 1 7 7
Note (DKK million)
2011 2010 2011 2010
10 Pre-tax profit/(loss)
Realised results
Balance on the interest account before bonus from the income statement 21,061 13,179 - -
Adjustment at beginning of year, FunktionærPension 0 109 - -
Balance on the cost account before bonus 990 1.177 - -
Balance on the claims experience account before bonus 302 315 - -
Change in accumulated value adjustment (15,825) (5,438) - -
Total realised results 6,527 9,343 - -
Distribution to customers
Allocation to the deposits during the year 2,761 2,644 - -
Adjustment at beginning of year, FunktionærPension (288) 97 - -
Transfer to the customers’ reserves from the income statement 1,459 3,846 - -
Total distribution to customers 3,933 6,587 - -
Distribution to CustomerCapital
The customers’ contributions to CustomerCapital 679 523 - -
Adjustment at beginning of year, FunktionærPension (2) 12 -
The year’s return before pension yield tax 993 945 -
The year’s operational risk charge before pension yield tax, including risk and expenses 429 667 - -
Total distribution to CustomerCapital, note 25 2,099 2,148 - -
Total customers’ share 6,031 8,734 - -
Distribution to equity via the income statement
Return for the year before tax 343 358 - -
Operational risk charge for the year before tax, including risk and expenses 151 249 - -
Equity’s share of the realised results 494 607 - -
Health and accident insurance, unit linked contracts, rebates and other ordinary and extraordinary income
458 (107) - -
Of which pro-rata distribution to CustomerCapital (335) 77 - -
Share of other income statement items 0 3 457 444
Equity’s share of other activities 123 (27) 457 444
Pre-tax profit/(loss) from the income statement 617 580 457 444
Allocation to equity, direct
The year’s revaluation reserve, owner-occupied properties 0 0 - -
Pre-tax profit/(loss) after the year’s revaluation reserve 617 580 457 444
11 Tax
Current corporation tax on the year's income (7) (10) 3 3
Change in deferred tax concerning previous year(s) (1) (7) 0 1
Change in deferred tax concerning the year (141) (101) 0 0
Total tax (149) (118) 3 4
Pre-tax profit/(loss) 617 580 457 444
Tax adjustment in connection with merger 0 (169) - -
Basis of adjustment concerning deferred tax, previous year(s) 5 45 0 0
Income/expenses not subject to tax, and profit/(loss) from subsidiaries etc. (26) 16 (468) (455)
Calculated income 596 472 (11) (10)
Of which 25 % tax (149) (118) 3 3
Deferred tax assets
Tax adjustment in connection with merger 0 (169) - -
Tax loss 2,224 2,655 9 10
Intangible assets and property, plant and equipment (195) (315) - -
Deferred tax assets, end of year 2,029 2,171 9 10
Group PFA Holding
Other activities

P F A H o l d i n g A n n u a l R e p o r t 2 0 1 17 8
14 Equity investments in group enterprises
ActivityRegistered
officeOwnership
interestProfit/(loss) Equity
PFA Pension, forsikringsaktieselskab Life insurance company Copenhagen 100 % 470 5,391
PFA Sundhed A/S Advisory services Copenhagen 100 % (2) 11
PFA Senior A/SAdvisory services and
educationCopenhagen 100 % 1 11
Note (DKK million)
2011 2010 2011 2010
12 Equipment
Cost, beginning of year 199 180 - -
Cost adjustment, beginning of year 0 8 - -
Additions during the year 17 21 - -
Disposals during the year (21) (11) - -
Cost, end of year 195 199 - -
Impairment and depreciation, beginning of year (147) (122) - -
Correction of impairment and depreciation, previous year(s) 0 (8) - -
Depreciation during the year (19) (25) - -
Reversal of depreciation on disposals for the year 18 8 - -
Impairment and depreciation, end of year (149) (147) - -
Equipment, end of year 46 51 - -
13 Investment properties
Owner-occupied properties
Revaluation value, beginning of year 352 336 - -
Additions during the year, including improvements 4 5 - -
Disposals during the year 0 0 - -
Revaluation 0 0 - -
Depreciation (4) (4) - -
The year’s revaluation recognised directly in equity 0 0 - -
The year’s revaluation via the income statement 22 15 - -
Owner-occupied properties, end of year 374 352 - -
Investment properties
Fair value, beginning of year 12,553 12,447 - -
Additions during the year, including improvements 532 281 - -
Disposals during the year (203) (379) - -
Value adjustment to fair value for the year 53 204 - -
Investment properties, end of year 12,935 12,553 - -
Properties, end of year 13,309 12,905 - -
The weighted average rates of return that have been applied in determining the fair value of individual properties amount to:
- Office properties 5.4 % 5.4 % - -
- Foreign office properties 7.1 % 7.7 % - -
- Owner-occupied properties 5.4 % 5.4 % - -
- Other business properties 5.3 % 5.2 % - -
- Residential properties 3.1 % 2.8 % - -
For the purpose of measuring business properties in group enterprises, assessments have been obtained from external valuers. Other properties have been measured internally. Business properties in associates have been measured using the measurement made by the associate.
Notes to the Balance Sheet
Group PFA Holding

P F A H o l d i n g A n n u a l R e p o r t 2 0 1 1 7 9
Group PFA Holding
2011 2010 2011 2010
16 Loans
Secured loans 5 5 - -
Other loans 137 211 - -
Loans, end of year 141 216 - -
17 Investment assets related to unit linked contracts
Equity investments 11,271 8,691 - -
Bonds 9,729 5,680 - -
Investment assets related to unit linked contracts, end of year 21,000 14,371 - -
Breakdown of investment assets related to unit linked contracts:
Unit linked contracts without guarantee 14,524 8,273 - -
Unit linked contracts with guarantee 6,476 6,098 - -
18 Share capital
The company’s share capital consists of 90 shares in the denomination of DKK 5,000, 500 shares in the denomination of DKK 1,000, and 250 shares in the denomination of DKK 200.
PFA Fonden (the PFA Foundation), Sundkrogsgade 4, DK-2100 Copenhagen, and DA (the Confederation of Danish Employers), Vester Voldgade 113, DK-1552 Copenhagen V, own more than 5 per cent of PFA Holding’s share capital.
19 Revaluation reserve, owner-occupied properties
Revaluation reserve, beginning of year 6 5 - -
Reversed revaluations (6) 0 - -
Revaluation, previous year(s) 3 1 - -
3 6 - -
Distribution to customers, beginning of year (6) (5) - -
Reversed distribution to customers 6 0 - -
Distribution to customers, previous year(s) (3) (1) - -
(3) (6) - -
Revaluation reserve, owner-occupied properties, end of year 0 0 - -
20 Retained earnings
Retained earnings, beginning of year 3,737 3,289 4,982 4,534
Transfer from the income statement 460 448 460 448
Dividend 0 0 0 0
Retained earnings, end of year 4,197 3,737 5,442 4,982
Of which proposed dividend 0 0 0 0
21 Total payables falling due more than 5 years after the balance-sheet date
Subordinate loan capital 250 1,150 - -
Payables to credit institutions 400 394 - -
Total payables falling due more than 5 years afterthe balance-sheet date, end of year
650 1,544 - -
Subordinate loan capital
Interest concerning subordinate loan capital for the year 65 65 - -
The subordinate loan capital includes a loan of DKK 750 million and a loan of DKK 150 million subject to interest at CIBOR plus 4 %. The loans mature in 2015. The subordinate loan capital also includes a loan of DKK 250 million subject to interest at 5.42 %. The loan is non-cancellable.
Note (DKK million)
15 Equity investments in associates
Activity Registered office Ownership interest Profit/(loss) Equity
Ejendomsselskabet Norden I K/S Property company Copenhagen 22 % 54 471
Majorgården A/S Treatment facility AAlsgårde 50 % (5) 6
PF I A/S Holding company Copenhagen 40 % 263 1,257
Ejendomsselskabet Norden IV K/S Property company Copenhagen 32 % (7) 299
Jointly controlled enterprises consolidated on a pro-rata basis:
ATPFA K/S Property company Copenhagen 50 % 333 4,720
Irish Forestry Investments Holding A/S Property company Copenhagen 33 % 4 83
The stated profit/(loss) and equity are the figures reported in the companies’ latest published annual reports.

P F A H o l d i n g A n n u a l R e p o r t 2 0 1 18 0
Note (DKK million)
2011 2010 2011 2010
22 Life insurance provisions, net of reinsurance
Life insurance provisions, end of last year 220,511 208,008 - -
Adjustment of accumulated value adjustment, FunktionærPension (288) 0 - -
Life insurance provisions, beginning of year 220,224 208,008 - -
Accumulated value adjustment, end of last year (16,900) (11.457) - -
Adjustment of accumulated value adjustment, FunktionærPension 288 5 - -
Accumulated value adjustment, beginning of year (16,613) (11,452) - -
Retrospective provisions, beginning of year 203,611 196,556 - -
Transfer from claims provisions, FunktionærPension 94 0 - -
Transfer from/to unit linked provisions and claims provisions, FunktionærPension (3) 27 - -
Changes during the year due to:
Gross premiums 12,108 15,570 - -
Transfer to unit linked insurance contracts (2,733) (992) - -
Addition of interest etc. 7,596 7,236 - -
Individual pension yield tax (988) (947) - -
Insurance benefits (14,353) (12.756) - -
Expense loading after addition of cost bonus (683) (608) - -
Balance on the claims experience account after addition of risk bonus 287 (212) - -
Customers’ contributions to CustomerCapital, net (74) (263) - -
Other changes 3 0 - -
Total changes 1,163 7,028 - -
Retrospective provisions, end of year 204,865 203,611 - -
Accumulated value adjustment, end of year 32,486 16,900 - -
Life insurance provisions, net of reinsurance, end of year 237,351 220,511 - -
Of which:
Gross provision for indirect insurance, end of last year 891 846 - -
Adjustment, beginning of year 0 17 - -
Gross provision for indirect life insurance, beginning of year 891 863 - -
Change during the year 90 28 - -
Gross life insurance provision for indirect insurance, end of year 981 891 - -
Changes in gross life insurance provisions break down as follows:
Change in retrospective provisions 1,542 7,060 - -
Change due to reduction of bonus potential on paid-up policy benefits to cover the insureds’ losses
0 (19) - -
Change recognised directly in the balance sheet 3 (15) - -
Change in accumulated value adjustment 15,298 5,443 - -
Change in gross life insurance provisions 16,843 12,470 - -
Change in guaranteed benefits 37,902 23,999 - -
Change in bonus potential on future premiums (11,966) (6,880) - -
Change in bonus potential on paid-up policy benefits (9,096) (4,616) - -
Change due to reduction of bonus potential on paid-up policy benefits to cover the insureds’ losses
0 (19) - -
Change recognised directly in the balance sheet 3 (15) - -
Change in gross life insurance provisions 16,843 12,470 - -
Life insurance provisions without allowing for the possibility of surrender:
Guaranteed benefits 212,970 166,914 - -
Bonus potential on future premiums 19,391 35,646 - -
Bonus potential on paid-up policy benefits 6,639 18,394 - -
Life insurance provisions without allowing for the possibility of surrender, end of year 239,000 220,954
- -
The probability that the individual customers surrender or transfer their insurance agreement is estimated based on the company’s observations regarding individual customers with at least 10 years’ seniority.
Group PFA Holding

P F A H o l d i n g A n n u a l R e p o r t 2 0 1 1 8 1
Note (DKK million)
22Life insurance provisions, net of reinsurance, continued
Life insurance provisions, net of reinsurance, broken down by technical basis and interest rate as at the balance-sheet date
Group 2011 2010
Guaranteed benefits
Bonus poten-tial on future
premiums
Bonus poten-tial on paid-up policy benefits
Guaranteed benefits
Bonus poten-tial on future
premiums
Bonus poten-tial on paid-up policy benefits
G82 4.5 % 113,098 1,015 107 102,257 1,893 774
G82 2.51 % 25,646 1,981 1,490 22,665 3,374 3,108
L99 1.8 % 1,410 2 11 1,445 5 63
Uni98 1.8 % 43,290 11,928 2,725 25,152 20,404 7,984
G82 1.51 % 26,848 2,395 965 22,227 3,644 2,603
U 10 1 % 1,247 34 140 0 0 0
Miscellaneous 0 0 0 0 0 0
Other 3,020 0 2 2,910 0 2
214,559 17,354 5,438 176,657 29,321 14,534
Life insurance provisions, net of reinsurance, end of year
237,351 220,511
2011 2010 2011 2010
23 Provisions for claims, net of reinsurance
Gross, life insurance 527 840 - -
Gross, health and accident insurance 1,779 1,652 - -
Provisions for claims, net of reinsurance, end of year 2,306 2,493 - -
24 Collective bonus potential
Collective bonus potential, end of last year 6,993 4,414 - -
Adjustment at beginning of year of collective bonus potential,FunktionærPension
261 97 - -
Transfer for the year, cf. note 10 1,198 3,846 - -
Pension yield tax (2,628) (1,364) - -
Total transfer from the income statement (1,169) 2,579 - -
Collective bonus potential, end of year 5,824 6,993 - -
25 CustomerCapital
CustomerCapital, end of last year 13,726 12,079 - -
Adjustment at beginning of year of CustomerCapital, FunktionærPension (2) 12 - -
Distribution to CustomerCapital 2,101 2,135 - -
Disbursement of CustomerCapital (358) (197) - -
CustomerCapital’s share of other activities 335 (77) - -
Pension yield tax (261) (227) - -
Total transfer from the income statement 1,815 1,647 - -
CustomerCapital, end of year 15,540 13,726 - -
Group PFA Holding

P F A H o l d i n g A n n u a l R e p o r t 2 0 1 18 2
Unit linked investment contracts
Provisions for unit linked investment contracts, beginning of year 419 477 - -
Accumulated value adjustment, beginning of year 0 (1) - -
Retrospective provisions, beginning of year 419 477 - -
Changes during the year due to:
Premiums from investment contracts, direct transfer 11 19 - -
Intercompany transfers (23) (83) - -
Gross premiums (13) (64) - -
Addition of interest (1) 41 - -
Individual pension yield tax 0 (6) - -
Insurance benefits from investment contracts, direct transfer (43) (37) - -
Intercompany transfers 3 2 - -
Insurance benefits (40) (35) - -
Expense loading after addition of cost bonus (2) (3) - -
Balance on the claims experience account after addition of risk bonus (8) 9 - -
Other changes 0 0 - -
Total changes (64) (58) - -
Retrospective provisions, end of year 354 419 - -
Accumulated value adjustment, end of year 0 0 - -
Provisions for unit linked investment contracts, end of year 354 419 - -
Provisions for unit linked contracts, end of year 21,281 14,412 - -
Of which
Provisions for unit linked contracts without guarantee 7,446 1,757 - -
Provisions for unit linked contracts with guarantee 13,835 12,655 - -
Provisions for unit linked contracts, end of year 21,281 14,412 - -
Breakdown of provisions for unit linked contracts with guarantee:
Guaranteed benefits 10,495 7,907 - -
Bonus potential on future premiums 2,089 2,857 - -
Bonus potential on paid-up policy benefits 1,250 1,890 - -
Provisions for unit linked contracts with guarantee, end of year 13,835 12,655 - -
Note (DKK million)
2011 2010 2011 2010
26 Provisions for unit linked contracts
Unit linked insurance contracts
Provisions for unit linked insurance contracts, beginning of year 13,993 9,185 - -
Accumulated value adjustment, beginning of year (2) 0 - -
Opening adjustment, FunktionærPension 3 0 - -
Retrospective provisions, beginning of year 13,995 9,185 - -
Transfer to/from Life provisions, FunktionærPension 3 (2) - -
Change for the year due to:
Gross premiums 5,576 2,909 - -
Transfers from average interest rate 2,733 992 - -
Addition of interest (149) 1,644 - -
Individual pension yield tax 18 (204) - -
Insurance benefits (844) (358) - -
Expense loading after addition of cost bonus (118) (93) - -
Balance on the claims experience account after addition of risk bonus (50) (20) - -
Customers’ contributions to CustomerCapital, net (246) (63) - -
Other changes 0 2 - -
Total changes 6,920 4,808 - -
Retrospective provisions, end of year 20,918 13,991 - -
Accumulated value adjustment, end of year 9 2 - -
Provisions for unit linked insurance contracts, end of year 20,926 13,993 - -
Group PFA Holding

P F A H o l d i n g A n n u a l R e p o r t 2 0 1 1 8 3
29 Breakdown of assets and returns 2011
Market value
Group Beginning of year End of year Net investment
Yield in % p.a. before pension yield tax and
corporation tax
Land and buildings, directly owned 12,905 13,309 333 5.1 %
Property companies 1,395 1,558 114 8.1 %
Land and buildings 14,300 14,867 447 5.4 %
Associates 16 400 314 25.4 %
Listed Danish equity investments 2,972 3,042 469 (15.6 %)
Unlisted Danish equity investments 766 527 115 2.1 %
Listed foreign equity investments 18,842 8,723 (9,331) (7.3 %)
Unlisted foreign equity investments 4,506 6,539 (525) 17.5 %
Total other equity investments 27,086 18,831 (9,273) (3.0 %)
Government bonds (Zone A) 73,476 73,883 (2,514) 8.5 %
Mortgage credit bonds 69,752 75,034 2,484 6.0 %
Index-linked bonds 18,363 22,725 1,904 12.8 %
Investment grade credit bonds 20,100 23,770 2,654 7.3 %
Non-investment grade credit bonds 20,250 20,916 (359) 6.8 %
Other bonds 117 79 (21) 3.2 %
Total bonds 202,057 216,406 4,147 7.8 %
Secured loans 5 5 0 (7.0 %)
Other financial investment assets 23,030 23,327 297 -
Derivative financial instruments to hedge net change in assets and liabilities
10,307 19,603 - -
30 Percentage breakdown of equity investments by sectors and regions
Group Total
Energy 0.0 % 2.2 % 3.6 % 0.3 % 0.1 % 0.3 % 0.5 % 7.0 %
Materials 1.0 % 1.6 % 1.3 % 0.3 % 0.3 % 0.1 % 0.3 % 5.0 %
Industry 4.2 % 2.3 % 2.5 % 0.0 % 0.8 % 0.1 % 0.0 % 9.9 %
Durables 0.1 % 1.5 % 2.8 % 0.0 % 0.7 % 0.2 % 0.0 % 5.3 %
Consumer goods 1.2 % 2.3 % 2.7 % 0.2 % 0.2 % 0.1 % 0.1 % 6.9 %
Healthcare 6.4 % 1.9 % 3.2 % 0.0 % 0.2 % 0.0 % 0.1 % 11.8 %
Finance 2.4 % 6.5 % 4.0 % 0.4 % 0.6 % 0.8 % 0.6 % 15.3 %
IT 0.4 % 0.7 % 5.0 % 0.0 % 0.5 % 0.1 % 0.0 % 6.7 %
Telecommunications 0.9 % 1.3 % 1.2 % 0.0 % 0.2 % 0.2 % 0.0 % 3.9 %
Supply 0.0 % 0.9 % 1.0 % 0.1 % 0.1 % 0.0 % 0.0 % 2.2 %
Unallocated 2.1 % 13.9 % 3.2 % 0.0 % 0.0 % 0.0 % 6.9 % 26.1 %
Total 18.7 % 35.2 % 30.4 % 1.4 % 3.8 % 1.9 % 8.6 % 100.0 %
DenmarkThe rest of
EuropeNorth
AmericaSouth
America JapanThe rest of the Far East
Other countries
Note (DKK million)
2011 2010 2011 2010
27 Other payables
Breakdown of other payables:
Winding up of funds 29,262 29,448 - -
Payable costs, including staff liabilities 442 518 - -
Taxes and fees payable 13 10 - -
28 Contingent liabilities
As security for the insureds’ savings, assets were registered at year-end at a total carrying amount of
270,092 259,437 - -
Registered assets include both technical provisions, net of reinsurance, and provisions for unit linked insurance plans
Ceded security in connection with contracts for unlisted financial instruments
2,813 409 - -
Rent and operating commitments do not exceed 168 197 - -
The company has made commitments to invest in unlisted securities amounting to
3,525 4,075 - -
The company is jointly registered with the group enterprises in respect of settlement of payroll tax and VAT, and all entities are jointly and severally liable for such tax and VAT.
Group PFA Holding

P F A H o l d i n g A n n u a l R e p o r t 2 0 1 18 4
Risk information and sensitivity information as at 31 December 2011
The Supervisory Board is responsible for determining the overall framework for the PFA Group’s risk management and risk willing-ness, while the day-to-day management and PFA Pension’s Risk Committee regularly monitor and make sure that the framework is complied with and subject to controls.
PFA is exposed to a number of risks. These risks may generally be divided into financial risks, insurance risks, operational risks, com-mercial risks and other risks.
Financial risks include risks related to losses if the market value of total assets and liabilities changes due to interest rate move-ments, fluctuations in share prices, property prices and curren-cies. Likewise, risks related to losses on credits and counterpar-ties in the event of default of payment obligations are included under financial risks. Financial risks also include liquidity risks and concentration risks. These risks consist of the risk of loss where there is a need to free liquidity quickly to settle obligations, and losses due to a large concentration of investments in an individual issuer, an individual type of assets or a very limited number of industries. The greatest financial risks are the risk of losses in connection with interest rate changes on pension products at an average rate of interest. Financial risks are monitored on an ongo-ing basis and the impact on company reserves as well as the ICAAP result is reported to the Risk Committee, the day-to-day manage-ment and the Supervisory Board.
Insurance risks constitute the risks of losses in connection with changes in disability, life expectancy, critical illness and surren-der. For instance, an increase in average lifetimes means that the guaranteed pensions must be disbursed for more years. Changes in the number of deaths and absence rates lead to changes in the disbursement of death cover and disability pensions. The greatest insurance risk is changes in lifetime. The assumptions related to insurance risks are analysed on an ongoing basis and compared to the actual development, and provisions are adjusted annually in accordance with the observed actual development in lifetime.
Operational risks include risks related to IT system errors, legal disputes, human errors, fraud or errors due to outside events. Operational risks are to a high extent hedged by the PFA Group using controls, procedures, business routines, and the control environment is monitored continuously by the person responsible for compliance at PFA. PFA has no unresolved legal disputes of major significance.
Commercial and other risks primarily concern strategic risks and risks in connection with new or changed legislation and other external factors that may detract from PFA’s reputation or market position. PFA aspires to create openness and transparency in communications to customers, and the individual business areas actively take part in the ongoing supervision and handling of risks to reduce financial losses as a result of commercial risks.
We also refer to the description of risk exposure and risk manage-ment in the Annual Review pp. 34-37.
31
Group
Risk
Minimum impact on the capital base in
DKK million
Maximum impact on collective bonus potential in DKK
million
Maximum impact on bonus potential on
paid-up policy benefits before
change in applied bonus potential on
paid-up policy benefits in DKK
million
Maximum impact on applied bonus
potential on paid-up policy benefits in
DKK million
0.7 percentage point increase in the interest rate (521) (3,324) 7,356 (481)
0.7 percentage point decrease in the interest rate 514 928 (3,909) 0
12 per cent decrease in share prices (180) (1,830) 0 (24)
8 per cent decrease of property values (206) (732) 0 (24)
Change in the rate of exchange at a 0.5 per cent probability in ten days (121) (770) 0 (24)
8 per cent loss on counterparties (incl. credit risks) (1,505) (2,519) 0 (240)
10 per cent decrease in the mortality rate (2,130) (1,243) (294) (48)
10 per cent increase in the mortality rate 32 2,944 314 0
10 per cent increase in the disability rate 0 (105) (94) (15)
The calculations are made in accordance with the financial reporting rules based on market value. The consequences of the risks shown in the table are stated in DKK million and are calculated as the total impact on the capital base, collective bonus potential, bonus potential on paid-up policy benefits before any change in applied bonus potential on paid-up policy benefits and any applied bonus potential on paid-up policy benefits. The calculations are made using the reported rules on distribution of realised results. Furthermore, it is assumed that the risks will occur as immediate events, for which reason the effects are calculated using an all-things-being-equal scenario based on the balance sheet at the balance-sheet date.
Note (DKK million)

P F A H o l d i n g A n n u a l R e p o r t 2 0 1 1 8 5
The Executive and Supervisory Boards’ directorships
Svend Askær · Born 1952 · (Chairman) · Chairman, the Danish Association of Managers
and Executives
Joined the Supervisory Board in 1992
Is up for re-election in 2015
Chairman: The Danish Association of Managers and Executives (director and member of the board in
group enterprises) · PFA Brug Livet Fonden (PFA Live Life Foundation)
Member of the board: DVU Statsautoriseret Revisionsaktieselskab ·
LD – the Danish Employees’ Capital Pension Fund
Other offices: Member of the ATP Committee of Representatives · Vice President of CEC
Jørn Neergaard Larsen · Born 1949 · (Vice-Chairman) ·
Managing Director, the Confederation of Danish Employers (DA)
Joined the Supervisory Board in 1996
Is up for re-election in 2015
Chairman: Nordic Employers’ Mutual Insurance Association
Member of the board: ATP · LG - the Danish Employees’ Guarantee Fund
Other offices: Member of Business Europe’s Executive Committee · Member of ATP’s Executive
Committee · Member of the ATP Audit Committee · Member of the Danish Economic Council
Klavs Andreassen · Born 1959 · Legal adviser, PFA Pension
Elected by the employees since 1991
Is up for re-election in 2015
No other directorships
Hans Skov Christensen · Born 1945 · Director
Joined the Supervisory Board in 2009
Is up for re-election in 2013
Chairman: FIH Erhvervsbank A/S · Aktieselskabet Kristeligt Dagblad · Kristeligt Dagblads Forlag A/S ·
Kristeligt Dagblads Fond · Centre for Culture and Experience Economy
Vice-Chairman: The Danish Industry Foundation · The Foundation for Søren Kierkegaard’s Research
Centre · The Danish Church Abroad / Danish Seamen’s Church
Member of the board: Centre for European Policy Studies · Fonden af 28. maj 1948
Other offices: Member of the government’s strategy forum for growth in Denmark
Lars Christoffersen · Born 1972 · Representative of an employee organisation, PFA Pension
Elected by the employees since 2003
Is up for re-election in 2015
Member of: DFL’s General Council

P F A H o l d i n g A n n u a l R e p o r t 2 0 1 18 6
Gita Grüning · Born 1949 · Chairman, the Danish Association of Professional Technicians
Joined the Supervisory Board in 2008
Is up for re-election in 2014
Chairman: Teknik og Design A/S Freelance Agency
Member of the board: LD – the Danish Employees’ Capital Pension Fund · PFA Brug Livet Fonden
(PFA Live Life Foundation) · The Economic Council of the Labour Movement
Member of: LO’s General Council and daily management · CO Industri’s Executive Committee and
General Council · KTO · OAO
Other offices: Member of the ATP Committee of Representatives
Erik G. Hansen · Born 1952 · Director, Rigas Holding ApS and group enterprises
Joined the Supervisory Board in 2002
Is up for re-election in 2015
Director: Rigas Holding ApS and five related subsidiaries · EGH Private Equity ApS · Sirius Holding ApS
and a related subsidiary · Berco ApS
Chairman: DTU Symbion Innovation A/S · Polaris Management A/S · TTIT A/S and a related subsidiary ·
NPT A/S · A/S af 26. marts 2003 and a related subsidiary
Vice-Chairman: Bagger-Sørensen & Co A/S and two related subsidiaries
Member of the board: Bavarian Nordic A/S · OKONO A/S · Polaris Invest II ApS · Lesanco ApS Wide
Invest ApS · Aser Ltd.
Peter Ibsen · Born 1950 · Chairman the Central Organisationen of 2010 – CO10
Joined the Supervisory Board in 2008
Is up for re-election in 2013
Chairman: The Danish Police Union
Vice-Chairman: Lån og Spar Bank A/S
Member of the board: A/S Knudemosen · The Danish Cooperative Society of 1886
Member of: The Executive Committee of the Danish Officials’ Loan Association ·
The Executive Committee of FTF
Hanne Sneholm Jensen · Born 1958 · Team Leader, PFA Pension
Elected by the employees since 2007
Is up for re-election in 2015
No other directorships
Thomas P. Jensen · Born 1969 · Pension Assistant, PFA Pension
Elected by the employees since 2011
Is up for re-election in 2015
No other directorships

P F A H o l d i n g A n n u a l R e p o r t 2 0 1 1 8 7
Per Jørgensen · Born 1959 · Chairman, the Danish Engineers’ Association
Joined the Supervisory Board in 2004
Is up for re-election in 2012
Chairman: Fællesrepræsentationen - FR (Joint Representation) · FICT (Federation International des
Cadres des Transport)
Member of the board: EMUC (Europe’s Naval Development Centre) · Fredericia Engineers’ School ·
Seahealth Denmark · Association for Promotion of Danish Shipping · IAK
(Unemployment Insurance Fund for Engineers)
Member of: The Executive Committee, the Danish Maintenance Association
Judge: Expert judge of the Copenhagen Maritime and Commercial Court
Torben Dalby Larsen · Born 1949 · Chief Editor, Managing Director, Dagbladet/Frederiksborg
Amts Avis/Sjællandske
Joined the Supervisory Board in 1992
Is up for re-election in 2014
Managing Director: Sjællandske Medier A/S
Chairman: The Confederation of Danish Employers (DA) Sjællandske Medier’s wholly-owned
subsidiaries · Dagbladenes Bureau · A/S Vestsjællandske Distriktsblade
Member of the board: ATP · LG - the Danish Employees’ Guarantee Fund · DR - the Danish
Broadcasting Corporation · The Danish Newspaper Publishers’ Association · The Danish Media
Employers’ Association · Roskilde Mediecenter K/S and A/S · Sjællandske Avistryk A/S, Slagelse
Poul Erik Pedersen · Born 1947 · Director, Metro Cash & Carry Danmark ApS
Joined the Supervisory Board in 2003
Is up for re-election in 2012
Director: Metro Danmark Holding ApS and group enterprises
Chairman: Metro Danmark A/S
Mette Risom · Born 1969 · Head of PFA’s Advisory Services Centre, PFA Pension
Elected by the employees since 2011
Is up for re-election in 2015
No other directorships
The age limit for board members is 67.

P F A H o l d i n g A n n u a l R e p o r t 2 0 1 18 8
The Executive Board
Henrik Heideby · Group CEO and President
Chairman: FIH Holding A/S · PF I A/S · PFA Professionel Forening (the ”Professional Association”) ·
PFA Ejendomme A/S (PFA Real Estate) · PFA Invest International A/S and seven related subsidiaries
Vice-Chairman: IC Companys A/S · FIH Erhvervsbank A/S · The Danish Insurance Association (DIA)
Member of the board: C.P. Dyvig & Co. A/S · VP Securities A/S · Wesmanns Skandinaviske
Forsikringsfond · PFA Kapitalforvaltning, fondsmæglerselskab A/S (PFA Asset Management), PFA Brug
Livet Fonden (PFA Live Life Foundation)
Anne Broeng · Group Executive Vice President and CFO
Chairman: PFA Kapitalforvaltning, fondsmæglerselskab A/S (PFA Asset Management)
Member of the board: Bikubenfonden · Energinet.dk · PFA Portefølje Administration A/S
(PFA Portfolio Administration) · PFA Professionel Forening (the ”Professional Association”) ·
PFA Ejendomme A/S (PFA Real Estate) · PFA Invest International A/S and seven related subsidiaries
Lars Ellehave-Andersen · Group Executive Vice President
Chairman: PFA Senior A/S · PFA Sundhed A/S (PFA Health)
Vice-Chairman: PFA Soraarneq, forsikringsaktieselskab
Member of the board: Holdingaktieselskabet Funktionær Pension · Forsikringsakademiet A/S
Other offices: Member of the Committee of Representatives in Lån og Spar Bank
Jon Johnsen · Group Executive Vice President
Member of the board: Letpension A/S · Pensionsinfo · PFA Senior A/S

P F A H o l d i n g A n n u a l R e p o r t 2 0 1 1 8 9
Michael Biermann Director, IT
Jesper Bjerre Director, Market
Jørgen Bønsager Chief Actuary and Director, Actuarial Department
Søren P. Espersen Director, Corporate Communications & People Management
Morten Winther Hansen Director, Knowledge Centre
Jacob Erik Holmblad Director, PFA Sundhed (PFA Health) and PFA Senior
Poul Kobberup Director, PFA Kapitalforvaltning (PFA Asset Management)
Jesper Langmack Director, PFA Kapitalforvaltning (PFA Asset Management)
Charlotte Møller Director, Finance Department
Peter Ott Director, PFA Portefølje Administration (PFA Portfolio Administration)
Peter Rosenlind-Nissen Director, Sales, Advisory Services
Charlotte Fredberg Schmidt Director, Customer and Pension Services
Michael Willumsen Director, PFA Ejendomme A/S (PFA Real Estate)
Executive employees

P F A H o l d i n g A n n u a l R e p o r t 2 0 1 19 0
PFA Holding A/S
Sundkrogsgade 4
DKK-2100 Copenhagen
Tel. (+45) 39 17 50 00
Fax (+45) 39 17 59 50
www.PFA.dk
CVR no. 2 24 38 018
Design and production:
Umwelt A/S