annual report 2011 - argosy property limited · contents chairman’s report / p.02 financial...
TRANSCRIPT

ANNUALREPORT 2011

CONTENTSChairman’s report / p.02
Financial summary / p.04
Manager’s report / p.06
Board of Directors / p.08
Our people / p.10
Corporate governance / p.14
Strategy / p.18
Portfolio overview / p.20
Retail portfolio / p.24
Commercial portfolio / p.26
Industrial portfolio / p.28
Environmental statement / p.30
Financial statements / p.32
Auditor’s report / p.69
Directory / p.72
Cover: 12-32 Bell Avenue, Penrose, Auckland
This page: Citigroup, Customs Street, Auckland
This annual report has been prepared by Argosy Property Management Limited on behalf of Argosy Property Trust and is for information purposes only. Its content is intended to be of a general nature, does not take into account your fi nancial situation or goals and is not a personalised fi nancial adviser service under the Financial Advisers Act 2008. It is recommended you seek advice from a fi nancial adviser which takes into account your individual circumstances before you acquire a fi nancial product.
This annual report is not an off er or invitation for subscription or purchase of securities or other fi nancial products. Past performance is no indication of future performance.
01 / ARGOSY PROPERTY TRUST (FORMERLY ING PROPERTY TRUST)
HIGHLIGHTSBRAND
PORTFOLIO
WALT
DISTRIBUTION
OCCUPANCY
VALUE
NET PROPERTY INCOME
Argosy
$961 m
4.9 yrs
7.0 c
97 %
$12.8 m
$72.3 m
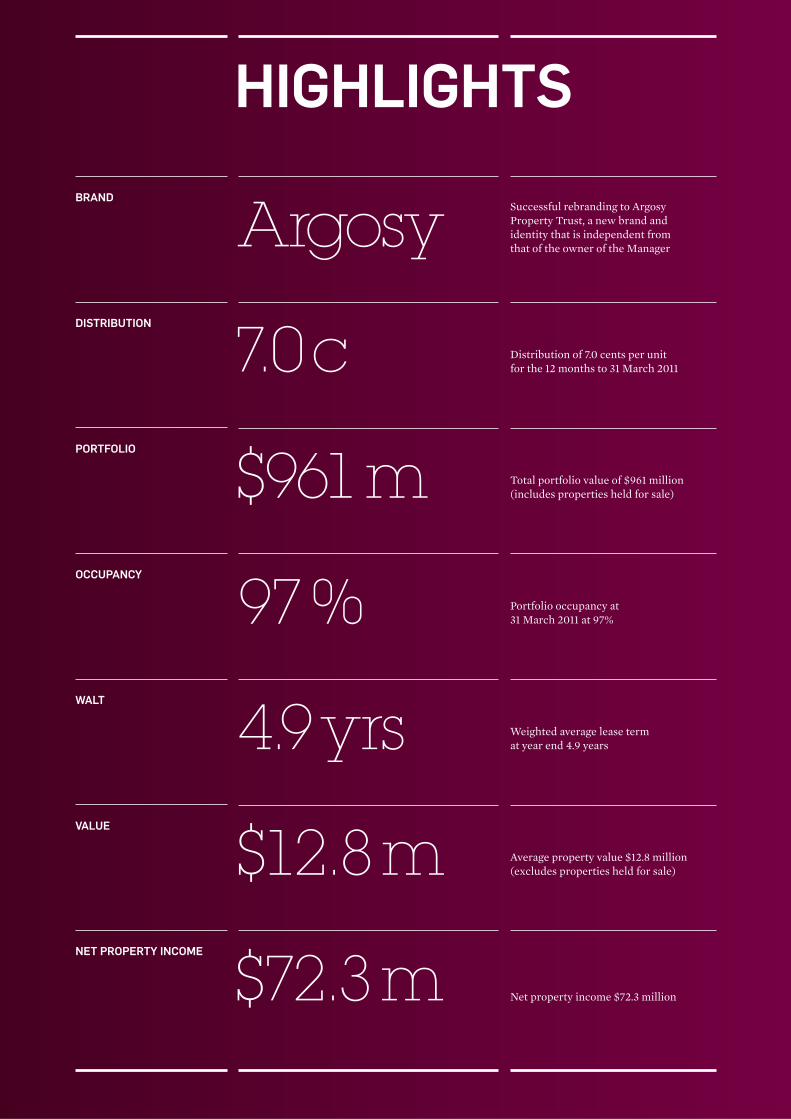
Successful rebranding to Argosy Property Trust, a new brand and identity that is independent from that of the owner of the Manager
Total portfolio value of $961 million (includes properties held for sale)
Weighted average lease term at year end 4.9 years
Distribution of 7.0 cents per unit for the 12 months to 31 March 2011
Portfolio occupancy at 31 March 2011 at 97%
Average property value $12.8 million (excludes properties held for sale)
Net property income $72.3 million

02 / ARGOSY PROPERTY TRUST (FORMERLY ING PROPERTY TRUST)
After a particularly challenging economic environment - as a consequence of a domestic recession, and the effects of the global fi nancial crisis - it is pleasing to be able to report more positive results for the Trust than we have been in a position to over the last three years.
In an announcement on 31 May 2011, Argosy Property Trust (the Trust) announced annual results for the year to 31 March 2011. The Trust achieved an audited profi t after tax attributable to unitholders of $26.3 million (2010: $59.0 million loss) for the year including an increase in property valuations of $2.1 million (2010: $82.8 million decrease).
The core operating profi t of the Trust before interest and other gains was $63.8 million which is 6.6% lower than the $68.2 million, reported in 2010 and primarily due to the reduction in rental income as a result of the sale of properties.
As at 31 March 2011 the Trust’s total assets were $975.2 million and the Trust’s debt (excluding capitalised borrowing costs), was $412.4 million giving a debt-to-total asset ratio of 42.3% which remains below the Trust deed limit of 50%.
The Trust has been able to demonstrate to investors the strengths of a well-diversifi ed and lower average value portfolio during a period of fi nancial and economic uncertainty. The Trust has managed debt levels throughout this time without the need to instigate expensive capital raising initiatives that would have been heavily dilutive to unitholders unable to participate. While we expect that there will continue to be challenges ahead, it is likely that the worst of the effects of the global fi nancial crisis are behind us.
DISTRIBUTION POLICY AND INTERNALISATION
The Board confi rmed the distribution for the full year to 31 March 2011 of 7.0 cents per unit, in line with guidance levels.
Unitholders are aware of the Independent Directors’ proposal to internalise the management of the Trust. Based on information available to date, and subject to an independent report, the Board unanimously supports the recommendation of the Independent Directors to proceed with internalisation, prior to any detailed consideration of opportunities involving any other investment vehicles.
If the successful internalisation of the management is completed, the Board expect to be able to announce a normalised annual dividend following internalisation of at least 6.0 cents per unit. This refl ects a revised distribution policy, based on operating earnings.
OPERATING ENVIRONMENT
During the year we have seen the domestic environment begin a path to a modest recovery, and operationally we have noticed a greater level of optimism from our tenants. The Trust’s portfolio is well positioned to meet the challenges of the market and to benefi t from any improvement in the economy.
The current key market factors include:
• the market for property under $20 million in value is solid.
• some of the pending over-supply in the commercial offi ce market in Auckland has been alleviated by the cancellation of new development projects, and this is a positive sign for that sector of the market.
• the industrial sector has shown solid demand and reduced vacancy levels. At this point there is little evidence of any corresponding growth in market rentals, however this is now possible in the months ahead.
• the retail sector has remained stable, and towards the end of the period, improved enquiry levels have become evident.
The Trust’s portfolio remains appropriate for the current economic environment through:
• the Trust’s diversifi ed portfolio of lower average value assets continues to afford fl exibility as the market for property in this price range remains liquid.
• the portfolio enjoys strong occupancy levels, good tenant retention rates and a solid weighted average lease term.
• the Trust has taken full ownership of the Manawatu Business Park project and is in the fi nal stages of subdivision
CHAIRMAN’SREPORT
03 / ARGOSY PROPERTY TRUST (FORMERLY ING PROPERTY TRUST)
benefi ted from properties with longer lease terms where property values have shown some modest growth, and has seen declines with property carrying shorter lease terms. By sector the industrial sector has shown some growth, offsetting marginal declines in both retail and commercial offi ces. The Trust’s portfolio following the revaluation, including vacant land not subject to sale agreements, shows a passing yield on values of 8.28% and a yield on the assessed market rentals of 8.18%.
LOOKING AHEAD
While the domestic economy appears to show more positive signs than evident at the time of last year’s report, it is clear that the recovery will be gradual and it is probable that there will continue to be challenges ahead.
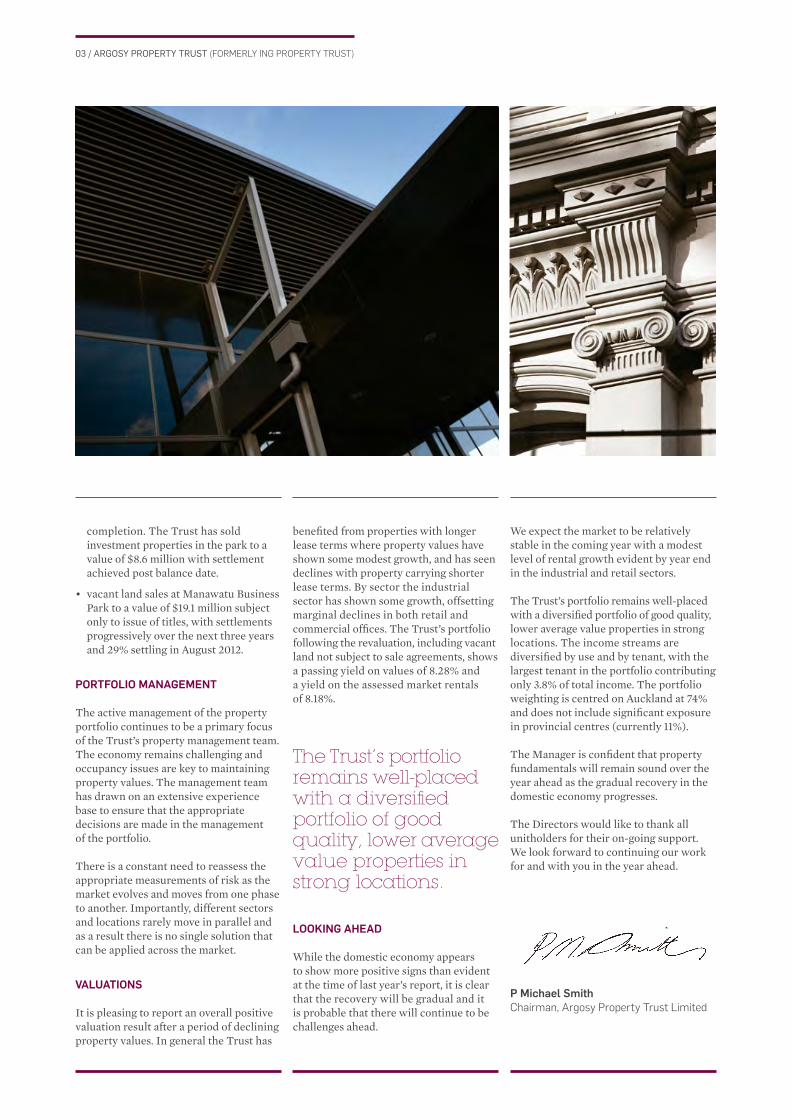
The Trust’s portfolio remains well-placed with a diversifi ed portfolio of good quality, lower average value properties in strong locations.
completion. The Trust has sold investment properties in the park to a value of $8.6 million with settlement achieved post balance date.
• vacant land sales at Manawatu Business Park to a value of $19.1 million subject only to issue of titles, with settlements progressively over the next three years and 29% settling in August 2012.
PORTFOLIO MANAGEMENT
The active management of the property portfolio continues to be a primary focus of the Trust’s property management team. The economy remains challenging and occupancy issues are key to maintaining property values. The management team has drawn on an extensive experience base to ensure that the appropriate decisions are made in the management of the portfolio.
There is a constant need to reassess the appropriate measurements of risk as the market evolves and moves from one phase to another. Importantly, different sectors and locations rarely move in parallel and as a result there is no single solution that can be applied across the market.
VALUATIONS
It is pleasing to report an overall positive valuation result after a period of declining property values. In general the Trust has
P Michael SmithChairman, Argosy Property Trust Limited
We expect the market to be relatively stable in the coming year with a modest level of rental growth evident by year end in the industrial and retail sectors.
The Trust’s portfolio remains well-placed with a diversifi ed portfolio of good quality, lower average value properties in strong locations. The income streams are diversifi ed by use and by tenant, with the largest tenant in the portfolio contributing only 3.8% of total income. The portfolio weighting is centred on Auckland at 74% and does not include signifi cant exposure in provincial centres (currently 11%).
The Manager is confi dent that property fundamentals will remain sound over the year ahead as the gradual recovery in the domestic economy progresses.
The Directors would like to thank all unitholders for their on-going support. We look forward to continuing our work for and with you in the year ahead.
04 / ARGOSY PROPERTY TRUST (FORMERLY ING PROPERTY TRUST)
FINANCIALSUMMARY
FINANCIAL SUMMARY2007
$000s2008
$000s
2009$000s
(RESTATED)
2010$000s
(RESTATED)2011
$000s
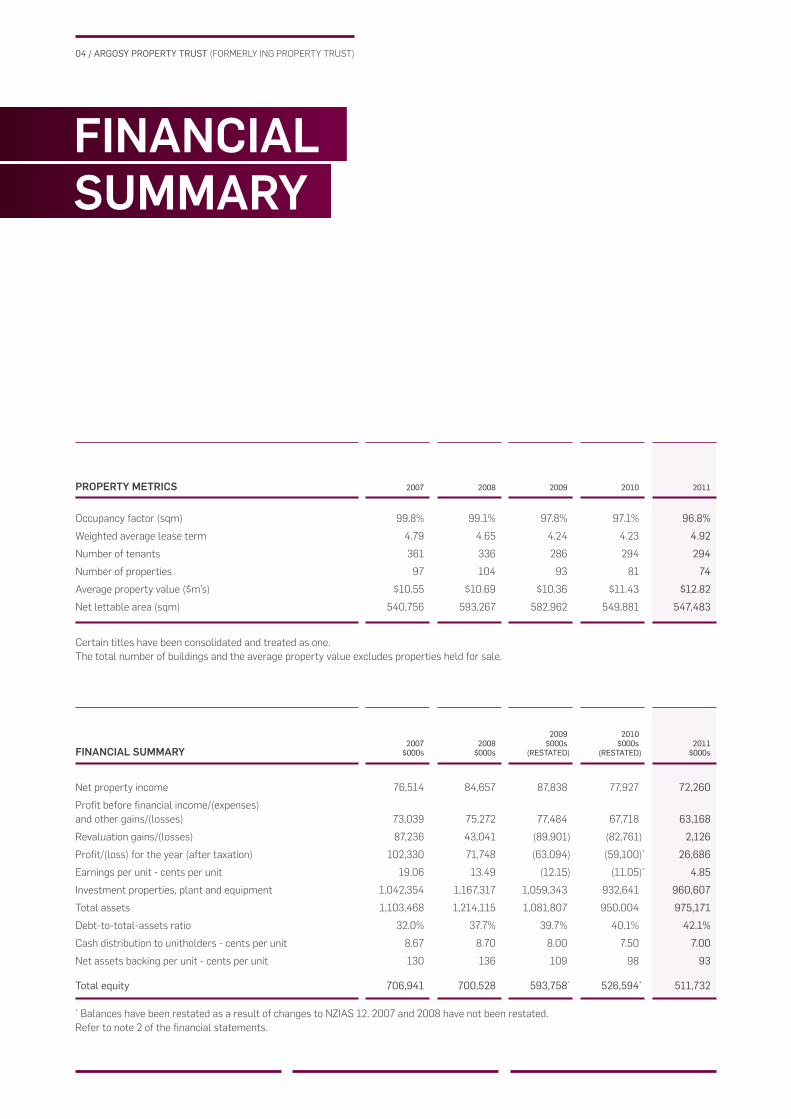
Net property income 76,514 84,657 87,838 77,927 72,260
Profi t before fi nancial income/(expenses)
and other gains/(losses) 73,039 75,272 77,484 67,718 63,168
Revaluation gains/(losses) 87,236 43,041 (89,901) (82,761) 2,126
Profi t/(loss) for the year (after taxation) 102,330 71,748 (63,094) (59,100)* 26,686
Earnings per unit - cents per unit 19.06 13.49 (12.15) (11.05)* 4.85
Investment properties, plant and equipment 1,042,354 1,167,317 1,059,343 932,641 960,607
Total assets 1,103,468 1,214,115 1,081,807 950,004 975,171
Debt-to-total-assets ratio 32.0% 37.7% 39.7% 40.1% 42.1%
Cash distribution to unitholders - cents per unit 8.67 8.70 8.00 7.50 7.00
Net assets backing per unit - cents per unit 130 136 109 98 93
Total equity 706,941 700,528 593,758* 526,594* 511,732 * Balances have been restated as a result of changes to NZIAS 12. 2007 and 2008 have not been restated.
Refer to note 2 of the fi nancial statements.
PROPERTY METRICS 2007 2008 2009 2010 2011
Occupancy factor (sqm) 99.8% 99.1% 97.8% 97.1% 96.8%
Weighted average lease term 4.79 4.65 4.24 4.23 4.92
Number of tenants 361 336 286 294 294
Number of properties 97 104 93 81 74
Average property value ($m’s) $10.55 $10.69 $10.36 $11.43 $12.82
Net lettable area (sqm) 540,756 593,267 582,962 549,881 547,483
Certain titles have been consolidated and treated as one.
The total number of buildings and the average property value excludes properties held for sale.
05 / ARGOSY PROPERTY TRUST (FORMERLY ING PROPERTY TRUST)
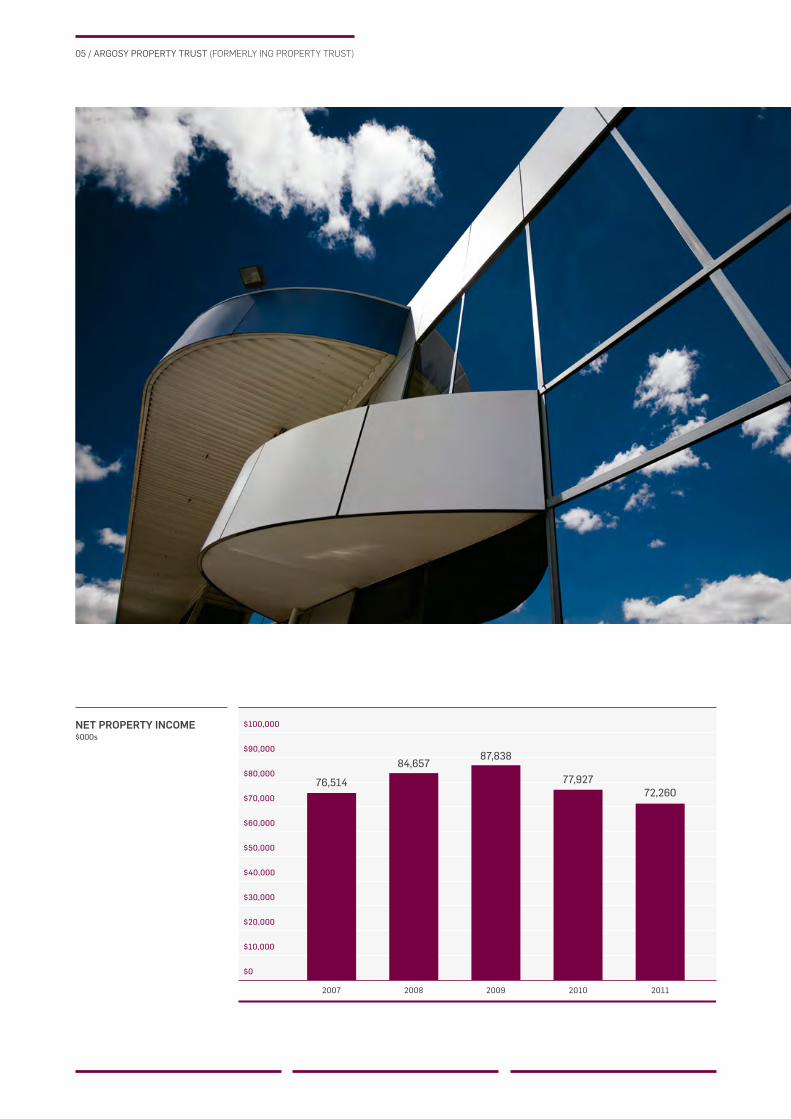
NET PROPERTY INCOME$000s
$100,000
$90,000
$80,000
$70,000
$60,000
$50,000
$40,000
$30,000
$20,000
$10,000
$0
76,514
84,65787,838
77,92772,260
2007 2008 2009 2010 2011

06 / ARGOSY PROPERTY TRUST (FORMERLY ING PROPERTY TRUST)
MANAGER’SREPORT
The Trust has maintained a high occupancy rate during the last three years through effective management of property assets and tenant relationships.
While we may feel with some justifi cation that the New Zealand property market has performed poorly over the last three years, the effects of the global fi nancial crisis were not exclusive to the property market.
Compared to most international property markets, the property market in New Zealand has performed relatively well. Observing the way the market has performed and the effective strategies for managing issues, key strategies have been effective at an operation management level across the market. While these can be separated into two areas, occupancy and liquidity, the overarching principle is that of risk management.
In order to effectively manage the risks in a downturn, there is an implicit requirement to understand the risks and the environment within which they lie, in order to effect appropriate action to address each risk.
Occupancy of the property portfolio is clearly important. At the simplest level we do not receive income from vacant properties. How occupancy is maintained, however, is not as obvious. It is undesirable to simply reduce rentals until your space is suffi cient of a bargain that any tenant in the market will consider it. While there is a need to understand the options that are available to occupiers in
the market and to refl ect those options in asking rentals, tenants have begun to appreciate that not all landlords are of equal quality and that a good quality landlord is an important factor when considering the future accommodation of their business.
From a property industry professional standpoint it is disappointing to observe that the last few years have left some examples of opportunist - and in a few cases unethical - landlord behaviour, together with poor quality or inept property management. To be able to offer a good service and have a reputation in the market for fair and ethical practices has been

07 / ARGOSY PROPERTY TRUST (FORMERLY ING PROPERTY TRUST)
an advantage when looking to secure continued occupancy from existing tenants or new tenants to the portfolio.
Naturally, times of economic challenge will mean that some tenants will struggle or go out of business. An effective and proactive landlord response may on the one hand allow a variation to current lease terms to enable the business to continue, and on the other allow an early opportunity to fi nd a replacement tenant to make the process of closing the business less stressful for all concerned. If the relationship with the tenant is suffi ciently close, there are more options available to both parties. The Trust has maintained a high occupancy rate during the last three years through effective management of property assets and tenant relationships.
Maintaining a portfolio with assets positioned at the lower average value and liquid part of the property market, has allowed the ability to manage debt levels appropriately and in the interests of unitholders. To have proposed raising capital at a time when there was uncertainty in the global and domestic market, and the unit price was trading at a signifi cant discount to the asset backing, would have been unduly disadvantageous to unitholders who were not able to participate.
The property portfolio risk profi le has been maintained at a low level throughout the last three years through active management of property assets and tenant relationships. With the largest tenant in the portfolio representing only 3.8% of total income, the returns to unitholders would not be profoundly affected by any single tenancy termination or failure. While this means that there are a large number of lease transactions to complete each year, the Trust has been able to report solid occupancy and tenant retention fi gures.
The year end results include the property revaluations as at 31 March 2011, and it is
In order to effectively manage the risks in a downturn, there is an implicit requirement to understand the risks
pleasing to observe positive revaluation results for the fi rst time since the Trust began to feel the investment market issues resulting from the global fi nancial crisis. While we cannot expect that property as an asset class can be insulated from the global and domestic economic malaise, a portfolio such as that owned by the Trust can continue to demonstrate its strengths as a result.
STRATEGY
The short term strategy has been and continues to be focused in three key areas:
• Risk mitigation
• Debt reduction (capital management)
• Portfolio structuring for the future.
The management team has delivered demonstrable results over the period
of the global fi nancial crisis in these three key areas and this success has improved opportunities for the future. Further information about the strategy can be found on pages 18-19 of this report.
THE YEAR AHEAD
It is probable that the year ahead will continue to be challenging, however as the economy improves, property as an investment class should show more positive signs. Activity and enquiry levels have improved and in some cases are beginning to surprise on the up side. The property portfolio is stronger and of better quality than it was three years ago and we believe the Trust is well positioned to move forward into a more positive year ahead.

08 / ARGOSY PROPERTY TRUST (FORMERLY ING PROPERTY TRUST)
BOARD OFDIRECTORS
09 / ARGOSY PROPERTY TRUST (FORMERLY ING PROPERTY TRUST)
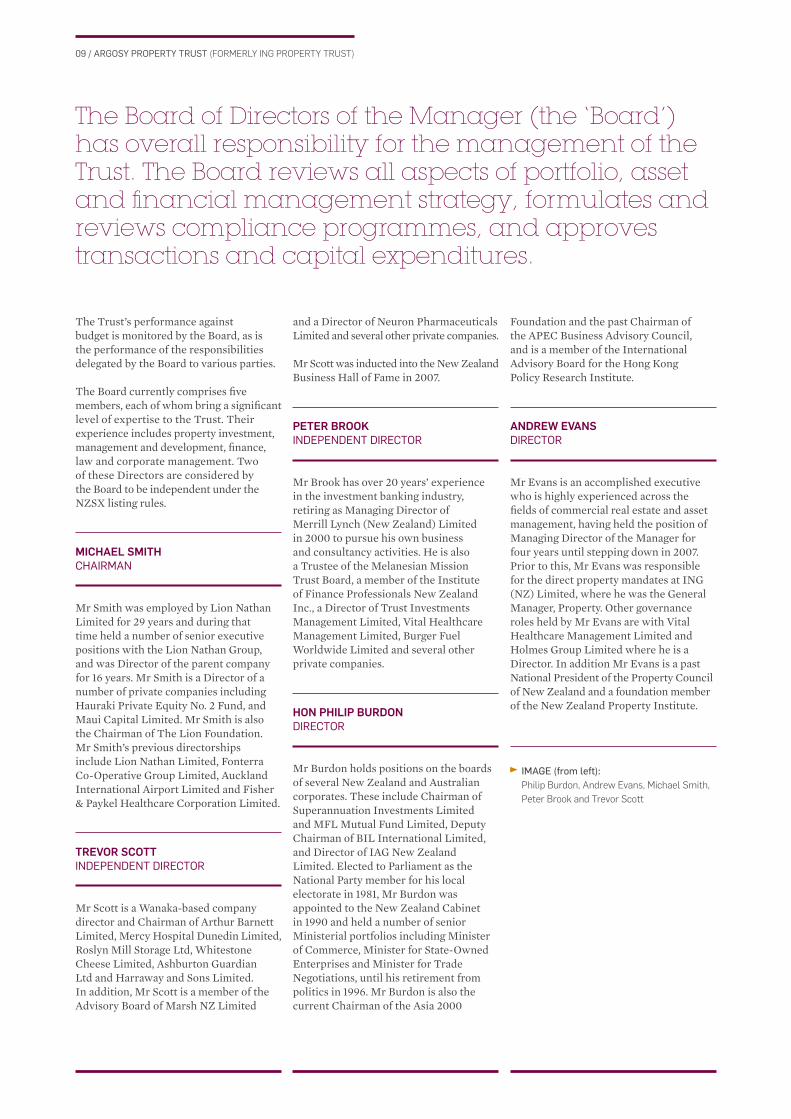
The Board of Directors of the Manager (the ‘Board’) has overall responsibility for the management of the Trust. The Board reviews all aspects of portfolio, asset and fi nancial management strategy, formulates and reviews compliance programmes, and approves transactions and capital expenditures.
The Trust’s performance against budget is monitored by the Board, as is the performance of the responsibilities delegated by the Board to various parties.
The Board currently comprises fi ve members, each of whom bring a signifi cant level of expertise to the Trust. Their experience includes property investment, management and development, fi nance, law and corporate management. Two of these Directors are considered by the Board to be independent under the NZSX listing rules.
MICHAEL SMITH CHAIRMAN
Mr Smith was employed by Lion Nathan Limited for 29 years and during that time held a number of senior executive positions with the Lion Nathan Group, and was Director of the parent company for 16 years. Mr Smith is a Director of a number of private companies including Hauraki Private Equity No. 2 Fund, and Maui Capital Limited. Mr Smith is also the Chairman of The Lion Foundation. Mr Smith’s previous directorships include Lion Nathan Limited, Fonterra Co-Operative Group Limited, Auckland International Airport Limited and Fisher & Paykel Healthcare Corporation Limited.
TREVOR SCOTT INDEPENDENT DIRECTOR
Mr Scott is a Wanaka-based company director and Chairman of Arthur Barnett Limited, Mercy Hospital Dunedin Limited, Roslyn Mill Storage Ltd, Whitestone Cheese Limited, Ashburton Guardian Ltd and Harraway and Sons Limited. In addition, Mr Scott is a member of the Advisory Board of Marsh NZ Limited
IMAGE (from left): Philip Burdon, Andrew Evans, Michael Smith,
Peter Brook and Trevor Scott
and a Director of Neuron Pharmaceuticals Limited and several other private companies.
Mr Scott was inducted into the New Zealand Business Hall of Fame in 2007.
PETER BROOK INDEPENDENT DIRECTOR
Mr Brook has over 20 years’ experience in the investment banking industry, retiring as Managing Director of Merrill Lynch (New Zealand) Limited in 2000 to pursue his own business and consultancy activities. He is also a Trustee of the Melanesian Mission Trust Board, a member of the Institute of Finance Professionals New Zealand Inc., a Director of Trust Investments Management Limited, Vital Healthcare Management Limited, Burger Fuel Worldwide Limited and several other private companies.
HON PHILIP BURDON DIRECTOR
Mr Burdon holds positions on the boards of several New Zealand and Australian corporates. These include Chairman of Superannuation Investments Limited and MFL Mutual Fund Limited, Deputy Chairman of BIL International Limited, and Director of IAG New Zealand Limited. Elected to Parliament as the National Party member for his local electorate in 1981, Mr Burdon was appointed to the New Zealand Cabinet in 1990 and held a number of senior Ministerial portfolios including Minister of Commerce, Minister for State-Owned Enterprises and Minister for Trade Negotiations, until his retirement from politics in 1996. Mr Burdon is also the current Chairman of the Asia 2000
Foundation and the past Chairman of the APEC Business Advisory Council, and is a member of the International Advisory Board for the Hong Kong Policy Research Institute.
ANDREW EVANS DIRECTOR
Mr Evans is an accomplished executive who is highly experienced across the fi elds of commercial real estate and asset management, having held the position of Managing Director of the Manager for four years until stepping down in 2007. Prior to this, Mr Evans was responsible for the direct property mandates at ING (NZ) Limited, where he was the General Manager, Property. Other governance roles held by Mr Evans are with Vital Healthcare Management Limited and Holmes Group Limited where he is a Director. In addition Mr Evans is a past National President of the Property Council of New Zealand and a foundation member of the New Zealand Property Institute.

10 / ARGOSY PROPERTY TRUST (FORMERLY ING PROPERTY TRUST)
OURPEOPLE

11 / ARGOSY PROPERTY TRUST (FORMERLY ING PROPERTY TRUST)
IMAGE (from far left):1 / Peter Mence
2 / Stuart Harrison
3 / Marilyn Storey
4 / Tony Frost
5 / Warren Cate
6 / Saatyesh Bhana
7 / Bridget Spraggon
8 / Lawrence Morgan
9 / Brett Plummer

12 / ARGOSY PROPERTY TRUST (FORMERLY ING PROPERTY TRUST)
PETER MENCE GENERAL MANAGER
Peter’s property career spans over 30 years working with fi rms like Progressive Enterprises, Challenge Properties, Green & McCahill and CB Richard Ellis. Peter joined the Manager (then Armstrong Jones) in 1994 and was appointed General Manager of Argosy Property Management in 2007. He has been an integral part of the management of Argosy Property Trust since the Manager commenced management of the Trust in 2003.
An engineer by background, Peter has responsibility for the activities and performance of the Trust.
STUART HARRISON CHIEF FINANCIAL OFFICER AND COMPANY SECRETARY
Stuart has been part of the Real Estate division of OnePath (NZ) Ltd since September 2008 and is responsible for overseeing the fi nancial and corporate functions of the Trust.
Along with a Bachelor of Commerce and Chartered Accountant qualifi cations, Stuart has 25 years of fi nancial reporting and management experience within the Chartered Accountancy, utilities and
hospitality/property industries. Most recently he was the Vice President-Finance for NZX listed Millennium and Copthorne Hotels New Zealand Ltd and subsidiaries, which also include CDL Investments New Zealand Ltd.
BRIDGET SPRAGGON MARKETING AND COMMUNICATIONS MANAGER
Joining the Real Estate team in January 2008, Bridget is responsible for all marketing and communications for all of OnePath (NZ) Limited’s real estate business.
Suitably qualifi ed with an MA and a Postgraduate Diploma in Business Administration (Marketing) from Auckland University, Bridget brings a broad range of experience from the publishing and wine industries. Bridget joined OnePath (NZ) Ltd in 2007, as a Communications Executive.
WARREN CATE ASSET MANAGER
Warren is responsible for a wide variety of properties in the Trust’s portfolio. In addition to strategic management and fi nancial performance accountabilities,
Warren’s extensive property industry experience is utilised to good effect in the investigation and analysis of many of the Trust’s property acquisition initiatives.
Graduating from Auckland University with a Bachelor of Engineering, Warren has held a wide variety of roles over 20 years in the industry including a general management position at DB Breweries, Property. Warren joined the Real Estate team at OnePath (NZ) Ltd in 1995, making him one of the longest serving members of the Argosy team.
TONY FROST ASSET MANAGER
Tony’s property career spans over 30 years and includes a wide variety of property and development management roles in both private and public sector entities. Many of the development projects he completed while working for previous employers are now assets held within the Trust’s portfolio.
Tony joined the Argosy team in 2007 and has responsibility for a varied portfolio of the Trust’s properties.
In addition to strategic management and fi nancial performance accountabilities Tony is particularly effective at investigating and analysing development projects,
OURPEOPLE
Our people are an integral part of our business. The Argosy Property Management Limited team is made up of 11 well-qualifi ed and experienced property professionals who perform at the highest level in the industry. They are supported by an equally committed administration and accounting staff of ten.

13 / ARGOSY PROPERTY TRUST (FORMERLY ING PROPERTY TRUST)
using his wealth of property industry experience to enhance many of the Trust’s portfolio initiatives.
MARILYN STOREY ASSET MANAGER
Marilyn joined the OnePath(NZ) Ltd Real Estate team in 2007 and carries the responsibility for the Trust’s Manawatu Business Park project. Marilyn is developing a new business plan for the project and is working to maximise the opportunities this exciting initiative offers.
Well qualifi ed with a Master of Business Administration and a Bachelor degree in both property and commerce, Marilyn joined OnePath (NZ) Ltd after operating her own property projects consulting business. Her work experience beyond her own business includes a period working in property, operational and change management for Babcocks at the Devonport Naval Dockyard in Auckland.
SAATYESH BHANA ASSET MANAGER
Saatyesh is responsible for the strategic management and fi nancial performance of a portfolio of properties predominantly located in the Wellington region.
He is also the Trust’s New Zealand Green Building Council Champion.
Saatyesh began his property career in his home town of Wellington 14 years ago, and has worked with a wide variety of private sector and listed property businesses. Joining Argosy in 2005 initially as cover for parental leave, he has been a valuable addition to the property team.
Saatyesh graduated from Massey University in 1996 with a Bachelor of Business Studies (Valuation and Property Management).
LAWRENCE MORGAN SENIOR PROPERTY MANAGER
Lawrence is responsible for the strategic management and fi nancial performance of a portfolio of properties. He also is responsible for two full-time Property Managers who administer the day-to-day requirements of the property portfolio and tenants.
Graduating from Auckland University with a Bachelor of Property in Valuations, Property Management and Building Technology in 1988, Lawrence’s career has included both public and private sector exposure. This has been dominated by a ten-year period with ASB Bank where he gained experience in all areas of building
and property management. Lawrence joined the team in 2007 as a Senior Property Manager.
BRETT PLUMMER SENIOR PROPERTY MANAGER
Brett has held various property management, development and investment management positions during his 19 years in the property industry, in New Zealand and in the United Kingdom. Brett is currently responsible for the strategic management and fi nancial performance of a portfolio of properties.
A graduate of Lincoln University with a Bachelor of Commerce in Valuation and Property Management, Brett gained valuable experience working in a variety of private and public sector organisations, including a brief period at ING Barings in London, before joining Argosy in 2007.

14 / ARGOSY PROPERTY TRUST (FORMERLY ING PROPERTY TRUST)
CORPORATEGOVERNANCETHE TRUST
Argosy Property Trust (previously ING Property Trust) is a unit trust established under the Unit Trusts Act 1960 by a Trust Deed dated 30 October 2002, as amended by Deeds of Variation and Restatement dated 30 September 2004, 17 October 2006, 17 December 2008, 27 May 2009 and 27 September 2010.
Argosy Property Trust units are listed on the New Zealand Stock Exchange (NZX code: ARG).
A consolidated copy of the Trust Deed containing all amendments is available from Argosy Property Management Limited (the “Manager”) on request or can be viewed at the Manager’s registered offi ce at Level 27, ASB Bank Centre, 135 Albert Street, Auckland, during normal business hours. A copy has also been fi led with the Companies Offi ce of the Ministry of Economic Development and may be viewed on the Companies Offi ce website at www.companies.govt.nz.
THE TRUSTEE
The Trustee of the Trust is The New Zealand Guardian Trust Company Limited (“Guardian Trust”). Guardian Trust is authorised to act as a trustee company under the Trustee Companies Act 1967, and acts as trustee for unit trusts under the Unit Trusts Act 1960.
The role of the Trustee is to supervise the administration and management of the Trust in accordance with the Trust Deed, and to ensure that the Manager complies with its duties and responsibilities under the Trust Deed. Where any approval of the Trustee is required under the Trust Deed, the Trustee is to have regard to the best interests of unitholders. The Trustee has the power to refuse to accept a proposal of the Manager if the Trustee believes the proposal is not in the interests of unitholders. The Trustee must also be satisfi ed that any proposal involves an investment of a type authorised under the Trust Deed and within the investment policies of the Trust.
The Trustee holds title to the assets of the Trust in trust for the unitholders, upon and subject to the terms and conditions of the Trust Deed. The Trustee also has certain discretions and powers to approve investment and divestment proposals recommended to it by the Manager.
The Trustee is entitled to receive fees in respect of its services not exceeding 0.075% per annum of the average of the Gross Value of the Trust Fund plus reasonable reimbursement for special attendances.
THE MANAGER
The Manager of the Trust is Argosy Property Management Limited, a company owned 100% by OnePath (NZ) Limited.
The Manager has responsibility for management of the Trust in accordance with the Trust Deed.

15 / ARGOSY PROPERTY TRUST (FORMERLY ING PROPERTY TRUST)
The Manager provides professional management expertise in selecting assets and managing them on behalf of unitholders. The Manager’s role and duties extend to the overall strategic direction of the Trust, portfolio management, selection and review, negotiation of acquisition and disposal of assets, treasury and funding management, property management, ensuring adherence to fi nancial and reporting requirements, and liaison with unitholders.
Day-to-day management of the properties in the portfolio is carried out for a fee by OnePath (NZ) Limited, which provides tenancy management, account management, building management, risk management and property investigation services in respect of the Trust’s properties pursuant to a Property Management Agreement with the Manager. This fee is paid in addition to the management fee referred to in the following paragraph, although a portion of the amount paid is recoverable by the Trust from tenants.
The Trust Deed sets out the basis on which the Manager is entitled to receive management fees and incentive fees. Management fees are charged at 0.6% per annum of the average of the Gross Value of the assets of the Trust Fund. The Incentive Fee is payable if outperformance
is achieved. The Incentive Fee is 10% per annum of the amount by which unitholder returns (calculated in accordance with the Trust Deed) are greater than the outperformance threshold specifi ed in the Trust Deed. When outperformance exceeds 15%, the excess is carried forward to the next quarter and when performance does not exceed the 10% threshold, a defi cit is carried forward to the next quarter. Excesses and defi cits can only be carried forward for up to 24 months. The remuneration of the general manager and management team is met from the management fees paid to the Manager.
CORPORATE GOVERNANCE PHILOSOPHY
Ultimate responsibility for corporate governance of the Trust resides with the Board of Directors of the Manager. The Board sees strong corporate governance and stewardship as fundamental to the strong performance of the Trust and, accordingly, the Board’s commitment is to the highest standards of business behaviour and accountability.
Outlined below are the main corporate governance practices in place throughout the year, which, in the Board’s opinion, comply with the NZX Corporate Governance Best Practice Code (NZX Code) and the Securities Commission’s
Principles of Corporate Governance and Guidelines, unless otherwise stated.
ETHICAL STANDARDS
The Board has adopted a Code of Ethics, which sets out the ethical and behavioural standards expected of the Manager’s Directors, offi cers and employees. The purpose of the Code of Ethics is to uphold the highest ethical standards, acting in good faith and in the best interests of unitholders at all times. The Code of Ethics outlines the Manager’s policies in respect of confl icts of interest, fair dealing, compliance with applicable laws and regulations, maintaining confi dentiality of information, dealing with Trust assets and use of Trust information.
Procedures for dealing with breaches of these policies are contained in the Code of Ethics, which forms part of every employee’s conditions of employment with the Manager.
COMPOSITION OF THE BOARD
The Manager is committed to having a Board whose members have the capacity to act independently and have the composite skills to optimise the fi nancial performance of the Trust and returns to unitholders. The Constitution of the Manager provides for there to be not more

16 / ARGOSY PROPERTY TRUST (FORMERLY ING PROPERTY TRUST)
than six Directors. All the members of the Board are Non-Executive Directors. The members of the Board are listed below and their brief resumés are included under “The Board of Directors” on page 9.
ATTENDANCE OF DIRECTORS
DIRECTOR MEETINGS ATTENDED
Michael Smith (Chair) 9 of 10
Andrew Evans 10 of 10
Hon. Philip Burdon 6 of 10
Peter Brook 10 of 10
Trevor Scott 10 of 10
The Board does not impose a restriction on the tenure of any Director as it considers that such a restriction may lead to the loss of experience and expertise from the Board.
INDEPENDENT DIRECTORS
The Manager recognises that Independent Directors are important in assuring unitholders that the Board is properly fulfi lling its role and is diligent in holding management accountable for its performance. The procedures in place for determining independence is whether the Director is independent of management and free of any business or other relationship that could materially interfere with, or could reasonably be perceived to materially interfere with, the exercise of their unfettered and independent judgement. As required under Rule 3.3.2, the Board has determined that Peter Brook and Trevor Scott are considered to be Independent Directors under the NZSX Listing Rules as neither has a Disqualifying Relationship with the Trust. Michael Smith, Andrew Evans and Hon Philip Burdon are considered not to be independent because they either have, or have recently had, a relationship with either OnePath (NZ) Limited, ANZ National Bank Limited or a substantial security holder in the Trust, such that they ought not to be considered independent.
In February 2006, the Manager announced a policy which provides unitholders with the opportunity to nominate the two Independent Directors of the Manager required by NZSX Listing Rule 3.3.1(c). This is a signifi cant innovation and was a fi rst for the listed property trust sector in New Zealand.
Unitholders are able to nominate and vote on one Independent Director of the Manager each year. The nominee receiving the most votes will be approved as a Director of the Manager by the Manager’s shareholders, and will hold the position for a two-year term.
BOARD AND DIRECTOR PERFORMANCE
The Board has a formal annual performance self-assessment, carried out under the direction of the Chairman. The self-assessment process involves reviewing the performance of the Board and its committees, together with setting forth the goals and objectives of the Trust for the upcoming year. Assessment of individual Directors’ performance is a process determined by the Chairman, taking into account attendance, contribution and experience of each individual Director concerned.
INSIDER TRADING AND RESTRICTED PERSONS TRADING
The Manager’s Directors, offi cers and employees, their families and related parties must comply with the Insider Trading policy and the Restricted Persons Trading policy. Amongst other requirements this identifi es two ‘black out periods’ where trading in the Trust’s units is prohibited, namely between 1 March until the day following the full year announcement date and from 31 August until the day following the half year announcement date each year. On-going fi xed trading by participation in the Distribution Reinvestment Plan (DRP) is available throughout the year.
At all other times trading requires that an application is made and approval obtained from any two Directors or a Director and the Chief Financial Offi cer in order to buy or sell units. The holdings of Directors of the Manager are disclosed in the section headed Holdings of the Directors of the Manager on page 71.
DIRECTORS AND OFFICERS INDEMNIFICATION AND INSURANCE
The Trust has arranged directors and offi cers liability insurance covering Directors, senior executives and employees for their personal liability arising out of duties as Directors and offi cers. The insurer reimburses the Trust where it has indemnifi ed the Directors.
BOARD COMMITTEES
Board committees assist with the execution of the Board’s responsibilities to unitholders. Each committee operates under a charter agreed by the Board, setting out its role, responsibilities, authority, relationship with the Board, reporting requirements, composition, structure and membership.
REMUNERATION COMMITTEEThe Board does not maintain a Remuneration Committee as the Manager pays the remuneration of the Directors and the senior executives, rather than the Trust. The Manager does have the right under the Trust Deed to be reimbursed for fees payable to Directors up to a specifi ed limit of $252,500 each year.
This limit can be increased with the approval of unitholders.
NOMINATIONS COMMITTEEThe Board does not maintain a Nomination Committee as Directors are appointed in accordance with the Manager’s constitution.
AUDIT COMMITTEEThe Board has established an Audit Committee, which is responsible for overseeing the fi nancial and accounting responsibilities of the Trust. The minimum number of members on the Audit Committee is three. All members must be Directors, the majority must be Independent Directors and at least one member must have an accounting or fi nancial background.
The members of the Audit Committee are Trevor Scott (Chairman), Michael Smith and Peter Brook.
The Audit Committee assists the Board in fulfi lling its corporate governance and disclosure responsibilities with particular reference to fi nancial matters, and internal and external audit, and is specifi cally responsible for:
• The appointment of the external auditor of the Trust;
• Supervising and monitoring external audit requirements;
• Reviewing annual and interim fi nancial statements prior to submission for Board approvals;
• Reviewing the performance and independence of the external auditor; and
17 / ARGOSY PROPERTY TRUST (FORMERLY ING PROPERTY TRUST)
• Monitoring compliance with the Unit Trusts Act 1960, Financial Reporting Act 1993, Companies Act 1993 and the NZSX Listing Rules.
ATTENDANCE AT AUDIT COMMITTEE
DIRECTOR MEETINGS ATTENDED
Trevor Scott (Chair) 4 of 4
Michael Smith 4 of 4
Peter Brook 4 of 4
EXTERNAL AUDIT FIRM GUIDELINES
In addition to the formal charter under which the Audit Committee operates, the Audit Committee has also developed a Charter of Audit Independence, which sets out the procedures that need to be followed to ensure the independence of the Trust’s external auditor.
The Audit Committee is responsible for recommending the appointment of the external auditor and maintaining procedures for the rotation of the external audit engagement partner.
Under the Audit Charter, the external audit engagement partner must be rotated every fi ve years.
The charter covers provision of non-audit services with the general principle being that the external auditor should not have any involvement in the production of fi nancial information or preparation of fi nancial statements such that they might be perceived as auditing their own work. It is however appropriate for the external auditor to provide services of due diligence on proposed transactions and accounting policy advice.
External Audit for Argosy Property Trust – the fi rm of Deloitte has been appointed as the Trust’s statutory and compliance auditor.
External Audit of the Manager – the fi rm of KPMG has been appointed as the auditor of the Manager – Argosy Property Management Limited.
UNITHOLDER RELATIONS
The Board aims to ensure that unitholders are informed of all information necessary to assess the Trust’s performance.
It does so through a communication strategy which includes:
• Periodic and continuous disclosure to NZX in accordance with the continuous disclosure requirements
• Information provided to analysts and media
• Annual and interim reports distributed to all unitholders
• The annual unitholders’ meeting and any other meetings called to obtain approval for Manager actions as appropriate
• Notices and explanatory memoranda for annual and special meetings
• Trust newsletters and investor roadshow
• The Trust’s website www.argosy.co.nz.
Unitholders may raise matters for discussion at annual and special meetings and have the opportunity to question Directors and the external auditor at such meetings.

18 / ARGOSY PROPERTY TRUST (FORMERLY ING PROPERTY TRUST)
STRATEGYThe Manager is focused on maintaining a low risk diversifi ed portfolio of quality properties with an average value of between $10 and $15 million. Operational strategy is focused on quality property management and tenant retention within the portfolio.
The strategy of the Manager has remained consistent for the past three years. It has proven to be successful in maintaining the stability of the portfolio over a diffi cult period globally. As such, there was little reason to change it for the 2011 or 2012 fi nancial years.
The core strategic focus remains on:
• Risk mitigation;
• Capital management; and
• Portfolio structuring
RISK MITIGATIONThis is always an important part of any investment portfolio and with property there is a benefi t of being able to infl uence the risk profi le of an asset by quality
investment and property management decisions. As is evident over the last four years, the ability to manage a portfolio can signifi cantly enhance returns to unitholders during an economic downturn. Discerning stock selection and active management of tenant relationships will translate directly into unitholder returns and reduced risk levels.
It is central to the Trust’s diversifi cation strategy to ensure that risk areas are varied and that income risks are not dominated by a particular tenant or part of the market. The largest tenant in the portfolio only represents approximately 3.8% of the total income of the portfolio, so the expiry of a lease or the failure of any tenant will not result in a profound reduction in rental income.
CAPITAL MANAGEMENT The benefi ts of the Trust’s portfolio comprising properties with a lower average value are apparent when observing the last three years of activity. For much of this time debt reduction has been a signifi cant theme for many businesses both domestically and globally in the face of reducing investment values. The Trust has managed capital by the sale of property supplemented by the continuation of the voluntary distribution reinvestment plan. This strategy has averted the need to raise expensive capital to the detriment of unitholders who could have found participation diffi cult or impossible. With stability in property values returning to the market it is expected that the Trust will be less active in property sales, however the

19 / ARGOSY PROPERTY TRUST (FORMERLY ING PROPERTY TRUST)
PORTFOLIO MANAGEMENT
ACTIVE MANAGEMENT PHILOSOPHYThe active management of the property portfolio continues to be a primary focus of the Trust’s property management team. The economy remains challenging and occupancy issues are key to maintaining property values. The management team has drawn on an extensive experience base to ensure that the appropriate decisions are made in the management of the portfolio.
The Manager actively manages the existing portfolio to ensure that the quality of the portfolio is maintained and, where possible, enhanced. Key facets of this philosophy are a divestment and acquisition programme, and actively managing and investing in existing assets to improve investment quality levels.
There is a constant need to reassess the appropriate measurements of risk as the market evolves and moves from one phase to another. Importantly, different sectors and locations rarely move in parallel and as a result there is no one answer that can be applied across the market.
It is essential to manage the tenancy relationship to ensure that tenants are treated appropriately and that any opportunities to add value or security to the income from a lease are acted on. In a diffi cult economic period this approach is unlikely to be solely focused on rental
intent is to reduce and maintain a bank debt-to-total assets ratio beneath 40% in the medium term.
PORTFOLIO STRUCTURING As we contemplate a return to a stable and hopefully growing market, it is important for the Trust’s portfolio to be structured for future growth in income and in capital value. The portfolio should be positioned to enable the Trust to deliver strong and reliable returns to unitholders from well-located and well managed property investments. It is also important that experience gained from the global fi nancial crisis is remembered, and that the strategic and governance procedures that have been adopted are maintained in the future.
Inevitably, as the economy moves into a growth phase, there will be new trends and technologies that may require changes to asset management strategies in order to meet the future needs of the market. It is essential for the Manager to research and understand any changes in tenant requirements to allow the properties within the portfolio to be altered to meet those needs or potentially sold and replaced if changes are uneconomic.
Environmentally sustainable design, the trend going into the global fi nancial crisis has partially changed focus with increased emphasis on building operation and effi ciency rather than the creation of new buildings with “green building” labels. This allows a whole of life approach to sustainability which recognises the substantial carbon footprint of complete demolition of a building and replacement with new construction. It could be considered environmentally irresponsible to consider buildings as a disposable commodity in the same manner that we have come to regard the automobile.
The long term investment strategy of the Trust remains unchanged however and of key importance is the degree to which individual assets meet the tenant requirements. One key aspect is the property location, and the relative attractiveness of one location over another continues to be a fundamental issue in the performance of a property asset in the current economic environment. We have seen the growth of accessibility, including the access to effi cient public transport, as a concern during recent years as the traffi c congestion and fuel costs of transport become prevalent issues.
income. The Trust’s unitholders in the recent past have been well served by an holistic approach to the income stream with other issues considered such as lease term, security of tenure and future rental growth potential.
DIVERSIFICATIONThe Manager will continue to develop a well balanced, diversifi ed portfolio by actively identifying types of property, tenant, or business that are either under or over represented in the portfolio, having regard for changes, or potential changes, and to risk weightings affected by the domestic and international economic environment.
VALUE RANGEThe Manager targets the acquisition of properties having a value between $10 million and $100 million, and will also consider larger portfolio and corporate acquisitions and properties that have strategic benefi t to the Trust.
It is considered appropriate to maintain a number of assets in the portfolio at the lower end of this range to ensure that the Trust continues to have the best chance of being able to transact in the area of the market that remains relatively liquid in an economic recession.
20 / ARGOSY PROPERTY TRUST (FORMERLY ING PROPERTY TRUST)
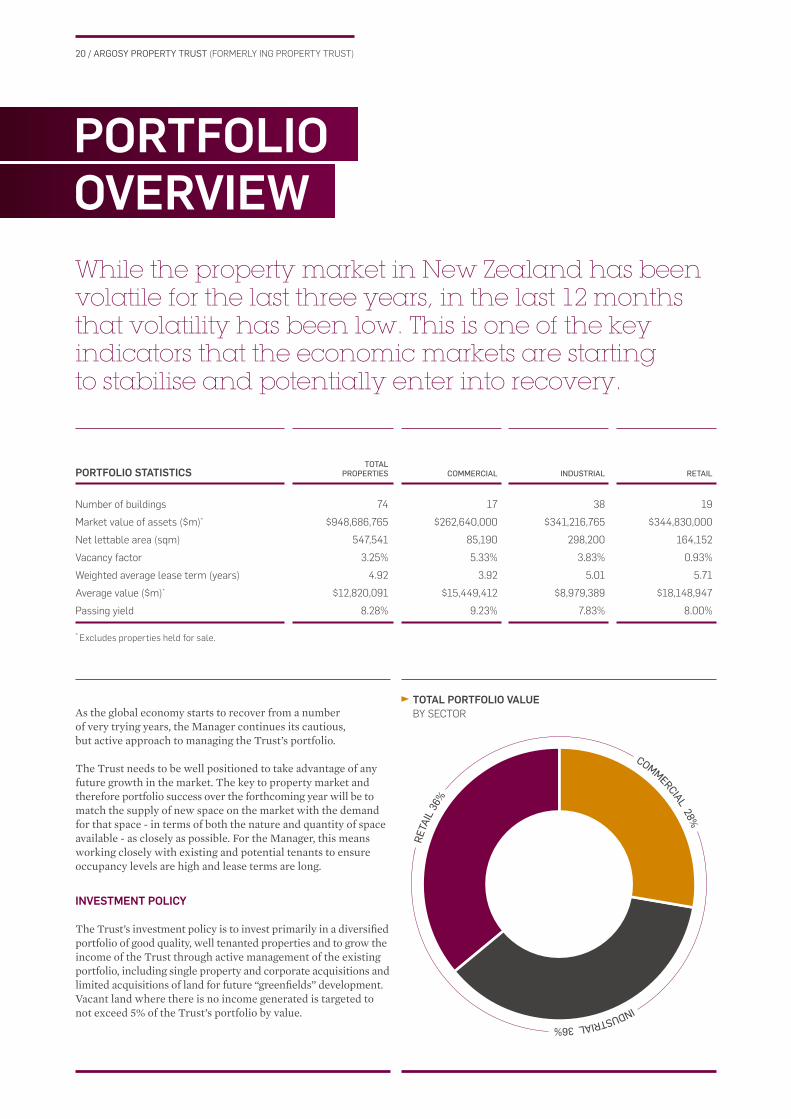
PORTFOLIOOVERVIEWWhile the property market in New Zealand has been volatile for the last three years, in the last 12 months that volatility has been low. This is one of the key indicators that the economic markets are starting to stabilise and potentially enter into recovery.
PORTFOLIO STATISTICSTOTAL
PROPERTIES COMMERCIAL INDUSTRIAL RETAIL
Number of buildings 74 17 38 19
Market value of assets ($m)* $948,686,765 $262,640,000 $341,216,765 $344,830,000
Net lettable area (sqm) 547,541 85,190 298,200 164,152
Vacancy factor 3.25% 5.33% 3.83% 0.93%
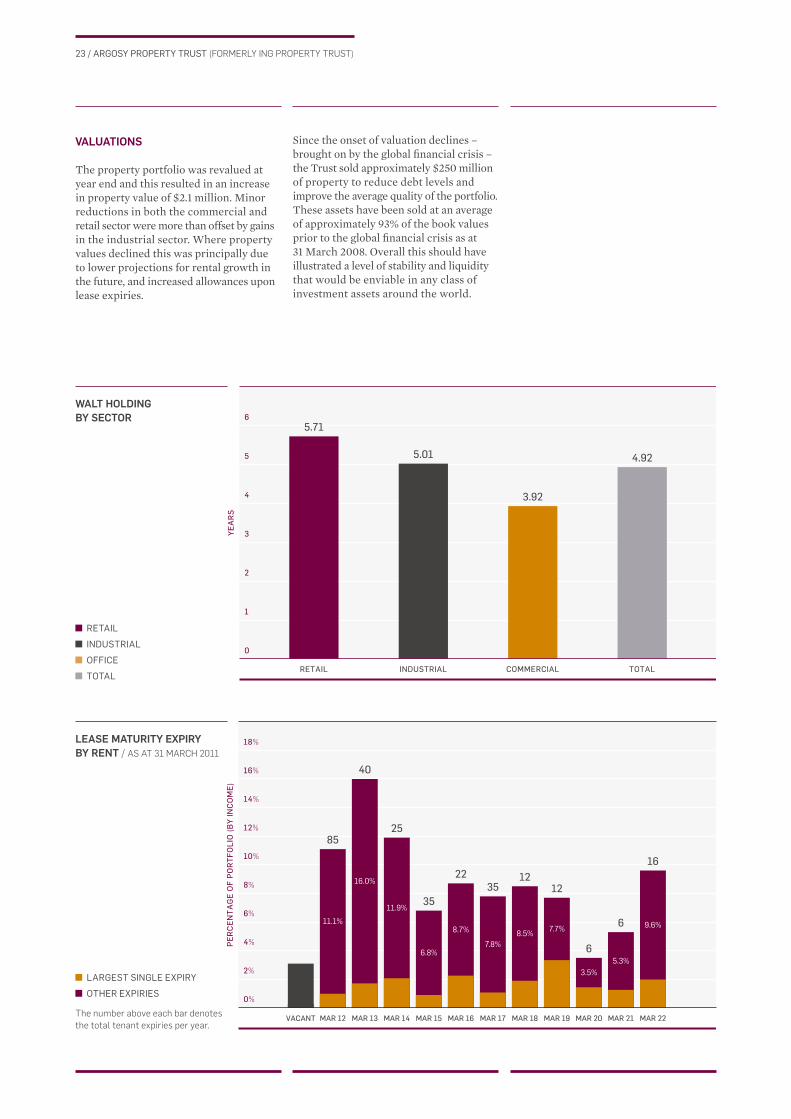
Weighted average lease term (years) 4.92 3.92 5.01 5.71
Average value ($m)* $12,820,091 $15,449,412 $8,979,389 $18,148,947
Passing yield 8.28% 9.23% 7.83% 8.00%
* Excludes properties held for sale.
TOTAL PORTFOLIO VALUEBY SECTORAs the global economy starts to recover from a number
of very trying years, the Manager continues its cautious, but active approach to managing the Trust’s portfolio.
The Trust needs to be well positioned to take advantage of any future growth in the market. The key to property market and therefore portfolio success over the forthcoming year will be to match the supply of new space on the market with the demand for that space - in terms of both the nature and quantity of space available - as closely as possible. For the Manager, this means working closely with existing and potential tenants to ensure occupancy levels are high and lease terms are long.
INVESTMENT POLICY
The Trust’s investment policy is to invest primarily in a diversifi ed portfolio of good quality, well tenanted properties and to grow the income of the Trust through active management of the existing portfolio, including single property and corporate acquisitions and limited acquisitions of land for future “greenfi elds” development. Vacant land where there is no income generated is targeted to not exceed 5% of the Trust’s portfolio by value.
COMMERCIAL 28%INDUSTRIAL 36%
RETA
IL 3
6%

21 / ARGOSY PROPERTY TRUST (FORMERLY ING PROPERTY TRUST)
TOTAL PORTFOLIOBY REGION
TOTAL AUCKLAND PORTFOLIOBY AREA
REGIONAL 13%
AUCKLAND 73%
WEL
LIN
GTON
14%
CEN
TRAL
40%
WEST 7%
SOUTH 21%
NORTH 32%
22 / ARGOSY PROPERTY TRUST (FORMERLY ING PROPERTY TRUST)
OCCUPANCY, LEASING AND WALT
Despite uncertain economic conditions, the portfolio continues to maintain a high capacity utilisation level with the occupancy level at year end of 97% and a weighted average lease term of 4.9 years. Over the coming year 11.1% of leases expire with negotiations on many of these already well advanced. Occupancy will always be a primary focus for the Manager as portfolio values are fundamentally affected by weighted average lease terms and projected incentive levels.
The weighted average lease term (WALT) is represented across the various portfolio sectors in the chart on the page opposite.
During the year 84 lease transactions were completed including 25 lease renewals or extensions, and 59 new leases. A total of 92 rental reviews have been completed resulting in an increased annual rental of $715,569. Rental reviews are critical to ensuring the Trust is well positioned to gain rental increases when they become available. The Trust achieved a tenant retention rate of 80% equating to 35 tenants occupying 29,800 sqm of space in the portfolio.
NEW LEASES AND LEASE EXTENSIONSBY SECTOR
FLOOR AREA(SQM)
AVERAGE LEASE TERM
(YEARS)
NEW LEASES AND LEASE EXTENSIONSBY TYPE
FLOOR AREA(SQM)
AVERAGE LEASE TERM
(YEARS)
RENT REVIEWS
NUMBEROF
REVIEWS
ANNUALISEDRENT
INCREASE
INCREASE OVER
CONTRACT
Commercial 28,406 4.76
Industrial 49,809 1.40
Retail 33,953 8.04
Total 112,168 5.18
New lease 57,700 6.36
Right of renewal 32,833 4.65
Extension 21,635 1.45
Total 112,168 5.18
Commercial 38 1.8% $219,537
Industrial 13 1.5% $148,593
Retail 41 3.2% $347,439
Total 92 2.2% $715,569
23 / ARGOSY PROPERTY TRUST (FORMERLY ING PROPERTY TRUST)
6
5
4
3
2
1
0
YEA
RS
RETAIL INDUSTRIAL COMMERCIAL TOTAL
5.71
5.01
3.92
4.92
VACANT MAR 12 MAR 13 MAR 14 MAR 15 MAR 16 MAR 17 MAR 18 MAR 19 MAR 20 MAR 21 MAR 22
PE
RC
EN
TAG
E O
F P
OR
TFO
LIO
(BY
INC
OM
E)
11.1%
16.0%
11.9%
6.8%
8.7%
7.8%8.5% 7.7% 9.6%
3.5%5.3%
85
40
25
35
2235
1212
6
6
16
18%
16%
14%
12%
10%
8%
6%
4%
2%
0%
VALUATIONS
The property portfolio was revalued at year end and this resulted in an increase in property value of $2.1 million. Minor reductions in both the commercial and retail sector were more than offset by gains in the industrial sector. Where property values declined this was principally due to lower projections for rental growth in the future, and increased allowances upon lease expiries.
Since the onset of valuation declines – brought on by the global fi nancial crisis – the Trust sold approximately $250 million of property to reduce debt levels and improve the average quality of the portfolio. These assets have been sold at an average of approximately 93% of the book values prior to the global fi nancial crisis as at 31 March 2008. Overall this should have illustrated a level of stability and liquidity that would be enviable in any class of investment assets around the world.
WALT HOLDINGBY SECTOR
LEASE MATURITY EXPIRYBY RENT / AS AT 31 MARCH 2011
RETAIL
INDUSTRIAL
OFFICE
TOTAL
LARGEST SINGLE EXPIRY
OTHER EXPIRIES
The number above each bar denotes
the total tenant expiries per year.
24 / ARGOSY PROPERTY TRUST (FORMERLY ING PROPERTY TRUST)
RETAILPORTFOLIO
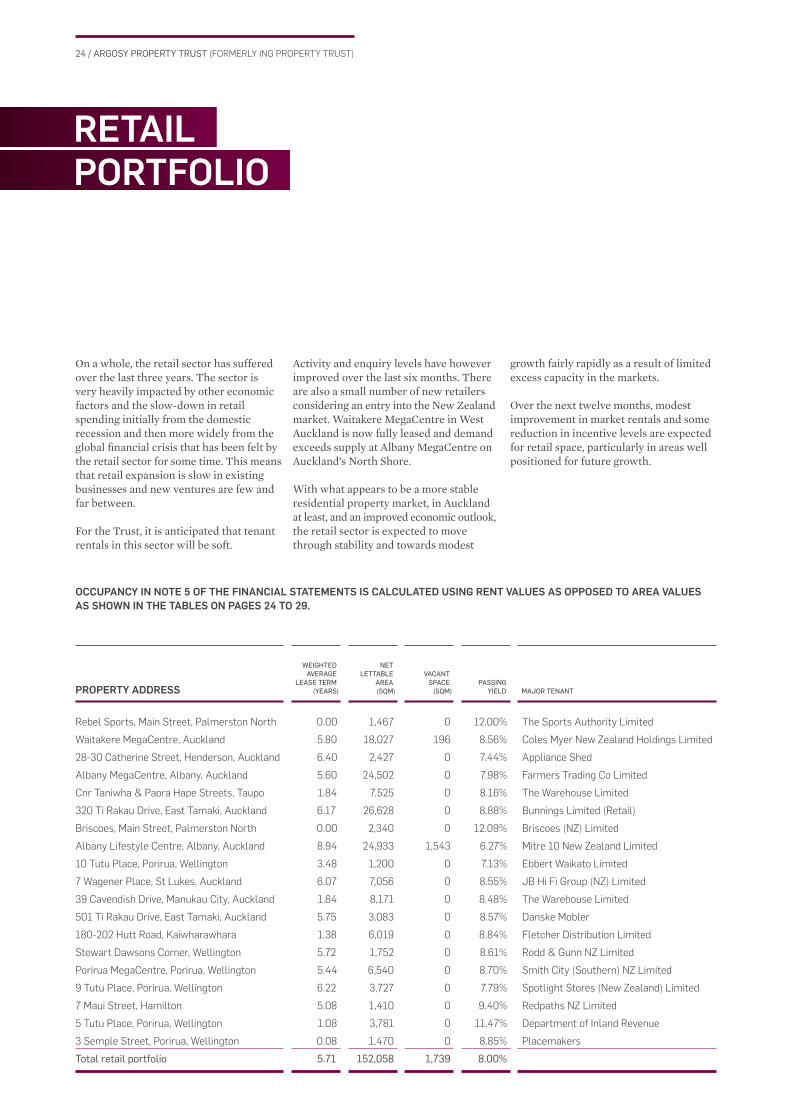
On a whole, the retail sector has suffered over the last three years. The sector is very heavily impacted by other economic factors and the slow-down in retail spending initially from the domestic recession and then more widely from the global fi nancial crisis that has been felt by the retail sector for some time. This means that retail expansion is slow in existing businesses and new ventures are few and far between.
For the Trust, it is anticipated that tenant rentals in this sector will be soft.
Activity and enquiry levels have however improved over the last six months. There are also a small number of new retailers considering an entry into the New Zealand market. Waitakere MegaCentre in West Auckland is now fully leased and demand exceeds supply at Albany MegaCentre on Auckland’s North Shore.
With what appears to be a more stable residential property market, in Auckland at least, and an improved economic outlook, the retail sector is expected to move through stability and towards modest
growth fairly rapidly as a result of limited excess capacity in the markets.
Over the next twelve months, modest improvement in market rentals and some reduction in incentive levels are expected for retail space, particularly in areas well positioned for future growth.
PROPERTY ADDRESS
WEIGHTEDAVERAGE
LEASE TERM(YEARS)
NET LETTABLE
AREA (SQM)
VACANTSPACE
(SQM)PASSING
YIELD MAJOR TENANT
Rebel Sports, Main Street, Palmerston North 0.00 1,467 0 12.00% The Sports Authority Limited
Waitakere MegaCentre, Auckland 5.80 18,027 196 8.56% Coles Myer New Zealand Holdings Limited
28-30 Catherine Street, Henderson, Auckland 6.40 2,427 0 7.44% Appliance Shed
Albany MegaCentre, Albany, Auckland 5.60 24,502 0 7.98% Farmers Trading Co Limited
Cnr Taniwha & Paora Hape Streets, Taupo 1.84 7,525 0 8.16% The Warehouse Limited
320 Ti Rakau Drive, East Tamaki, Auckland 6.17 26,628 0 8.88% Bunnings Limited (Retail)
Briscoes, Main Street, Palmerston North 0.00 2,340 0 12.09% Briscoes (NZ) Limited
Albany Lifestyle Centre, Albany, Auckland 8.94 24,933 1,543 6.27% Mitre 10 New Zealand Limited
10 Tutu Place, Porirua, Wellington 3.48 1,200 0 7.13% Ebbert Waikato Limited
7 Wagener Place, St Lukes, Auckland 6.07 7,056 0 8.55% JB Hi Fi Group (NZ) Limited
39 Cavendish Drive, Manukau City, Auckland 1.84 8,171 0 8.48% The Warehouse Limited
501 Ti Rakau Drive, East Tamaki, Auckland 5.75 3,083 0 8.57% Danske Mobler
180-202 Hutt Road, Kaiwharawhara 1.38 6,019 0 8.84% Fletcher Distribution Limited
Stewart Dawsons Corner, Wellington 5.72 1,752 0 8.61% Rodd & Gunn NZ Limited
Porirua MegaCentre, Porirua, Wellington 5.44 6,540 0 8.70% Smith City (Southern) NZ Limited
9 Tutu Place, Porirua, Wellington 6.22 3,727 0 7.79% Spotlight Stores (New Zealand) Limited
7 Maui Street, Hamilton 5.08 1,410 0 9.40% Redpaths NZ Limited
5 Tutu Place, Porirua, Wellington 1.08 3,781 0 11.47% Department of Inland Revenue
3 Semple Street, Porirua, Wellington 0.08 1,470 0 8.85% Placemakers
Total retail portfolio 5.71 152,058 1,739 8.00%
OCCUPANCY IN NOTE 5 OF THE FINANCIAL STATEMENTS IS CALCULATED USING RENT VALUES AS OPPOSED TO AREA VALUES AS SHOWN IN THE TABLES ON PAGES 24 TO 29.

25 / ARGOSY PROPERTY TRUST (FORMERLY ING PROPERTY TRUST)
RETAIL PORTFOLIO STATISTICS TOP 10 RETAIL TENANTS BY PERCENTAGE OF RENTAL INCOME
BRISCOES (NEW ZEALAND LIMITED)
THE WAREHOUSE LIMITED
MITRE 10 NEW ZEALAND LIMITED
DSE (NZ) LIMITED
WAGENER STORAGE LIMITED
WAREHOUSE STATIONERY LIMITED
19
8.00%
$344.8m
Number of buildings
Passing yield
Market value of assets ($m)
FLETCHER DISTRIBUTION LIMITED
STEINHOFF ASIA PACIFIC LIMITED
COLES MYER NEW ZEALAND
HOLDINGS LIMITED
DANSKE MOBLER
OTHER TENANTS
0.93%Vacancy factor
5.71yrsWALT (years)
26 / ARGOSY PROPERTY TRUST (FORMERLY ING PROPERTY TRUST)
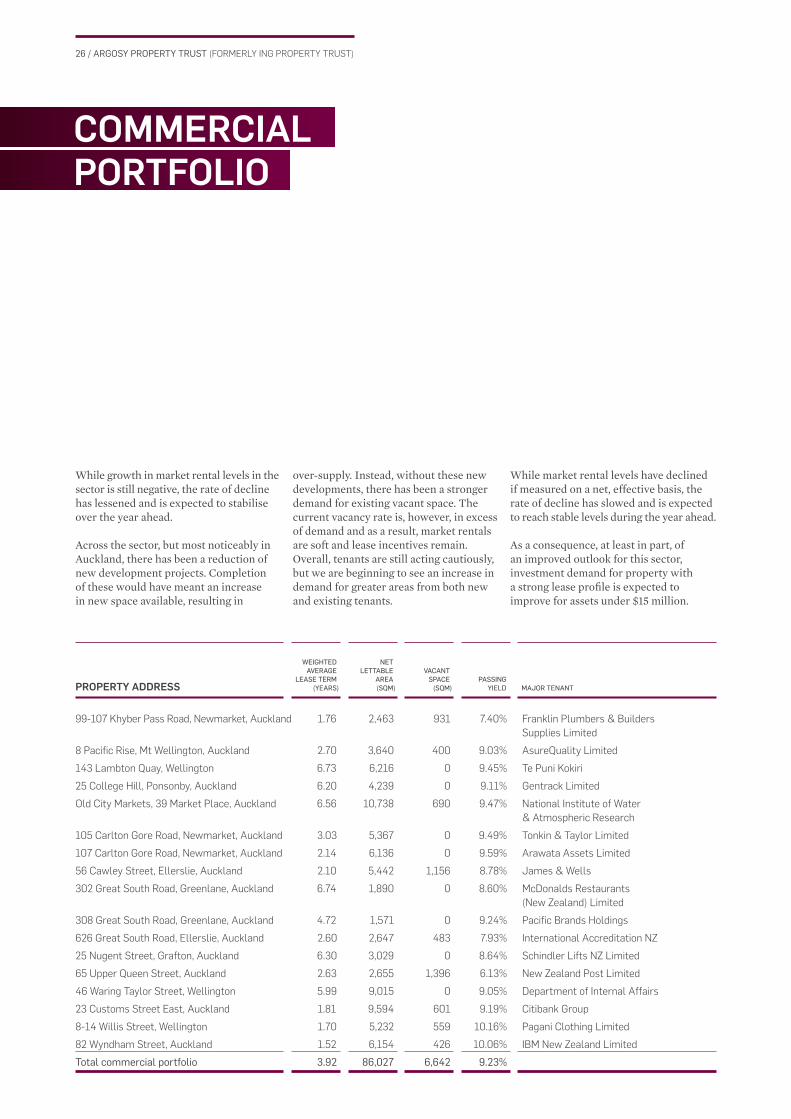
While growth in market rental levels in the sector is still negative, the rate of decline has lessened and is expected to stabilise over the year ahead.
Across the sector, but most noticeably in Auckland, there has been a reduction of new development projects. Completion of these would have meant an increase in new space available, resulting in
over-supply. Instead, without these new developments, there has been a stronger demand for existing vacant space. The current vacancy rate is, however, in excess of demand and as a result, market rentals are soft and lease incentives remain. Overall, tenants are still acting cautiously, but we are beginning to see an increase in demand for greater areas from both new and existing tenants.
While market rental levels have declined if measured on a net, effective basis, the rate of decline has slowed and is expected to reach stable levels during the year ahead.
As a consequence, at least in part, of an improved outlook for this sector, investment demand for property with a strong lease profi le is expected to improve for assets under $15 million.
PROPERTY ADDRESS
WEIGHTEDAVERAGE
LEASE TERM(YEARS)
NET LETTABLE
AREA (SQM)
VACANTSPACE
(SQM)PASSING
YIELD MAJOR TENANT
99-107 Khyber Pass Road, Newmarket, Auckland 1.76 2,463 931 7.40% Franklin Plumbers & Builders
Supplies Limited
8 Pacifi c Rise, Mt Wellington, Auckland 2.70 3,640 400 9.03% AsureQuality Limited
143 Lambton Quay, Wellington 6.73 6,216 0 9.45% Te Puni Kokiri
25 College Hill, Ponsonby, Auckland 6.20 4,239 0 9.11% Gentrack Limited
Old City Markets, 39 Market Place, Auckland 6.56 10,738 690 9.47% National Institute of Water
& Atmospheric Research
105 Carlton Gore Road, Newmarket, Auckland 3.03 5,367 0 9.49% Tonkin & Taylor Limited
107 Carlton Gore Road, Newmarket, Auckland 2.14 6,136 0 9.59% Arawata Assets Limited
56 Cawley Street, Ellerslie, Auckland 2.10 5,442 1,156 8.78% James & Wells
302 Great South Road, Greenlane, Auckland 6.74 1,890 0 8.60% McDonalds Restaurants
(New Zealand) Limited
308 Great South Road, Greenlane, Auckland 4.72 1,571 0 9.24% Pacifi c Brands Holdings
626 Great South Road, Ellerslie, Auckland 2.60 2,647 483 7.93% International Accreditation NZ
25 Nugent Street, Grafton, Auckland 6.30 3,029 0 8.64% Schindler Lifts NZ Limited
65 Upper Queen Street, Auckland 2.63 2,655 1,396 6.13% New Zealand Post Limited
46 Waring Taylor Street, Wellington 5.99 9,015 0 9.05% Department of Internal Affairs
23 Customs Street East, Auckland 1.81 9,594 601 9.19% Citibank Group
8-14 Willis Street, Wellington 1.70 5,232 559 10.16% Pagani Clothing Limited
82 Wyndham Street, Auckland 1.52 6,154 426 10.06% IBM New Zealand Limited
Total commercial portfolio 3.92 86,027 6,642 9.23%
COMMERCIALPORTFOLIO
27 / ARGOSY PROPERTY TRUST (FORMERLY ING PROPERTY TRUST)
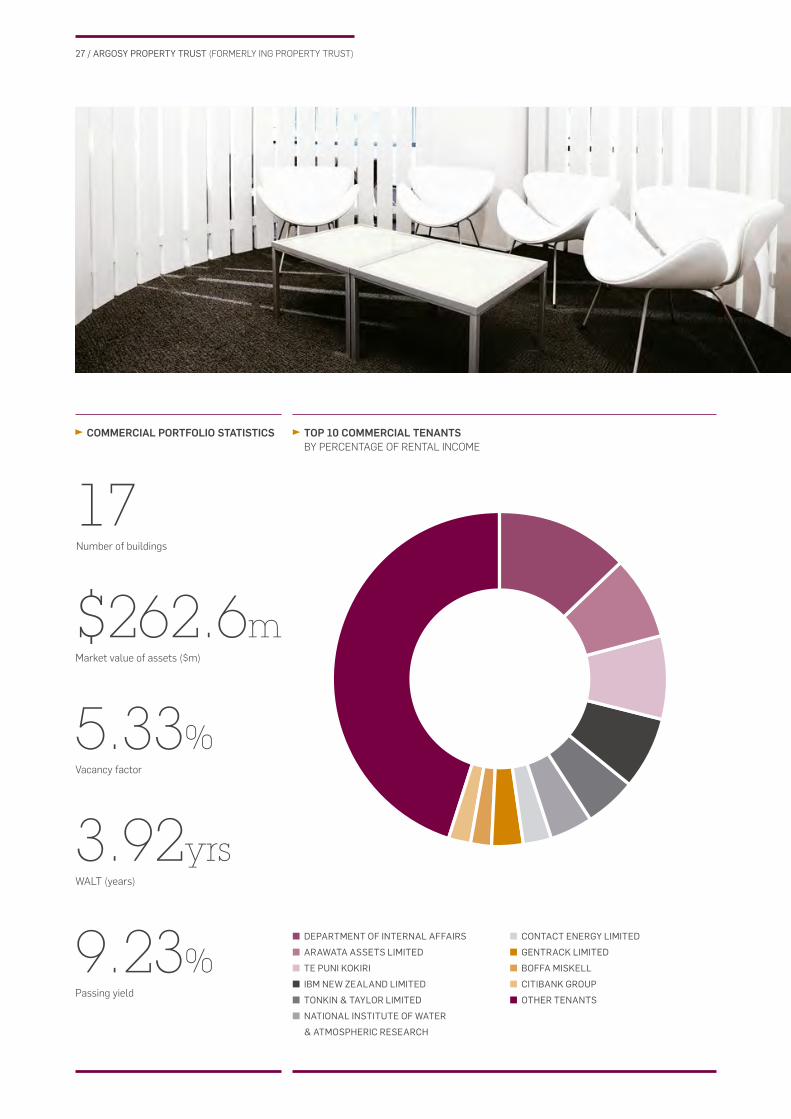
COMMERCIAL PORTFOLIO STATISTICS TOP 10 COMMERCIAL TENANTS BY PERCENTAGE OF RENTAL INCOME
17
9.23%
$262.6m
Number of buildings
Passing yield
Market value of assets ($m)
5.33%Vacancy factor
3.92yrsWALT (years)
DEPARTMENT OF INTERNAL AFFAIRS
ARAWATA ASSETS LIMITED
TE PUNI KOKIRI
IBM NEW ZEALAND LIMITED
TONKIN & TAYLOR LIMITED
NATIONAL INSTITUTE OF WATER
& ATMOSPHERIC RESEARCH
CONTACT ENERGY LIMITED
GENTRACK LIMITED
BOFFA MISKELL
CITIBANK GROUP
OTHER TENANTS
28 / ARGOSY PROPERTY TRUST (FORMERLY ING PROPERTY TRUST)
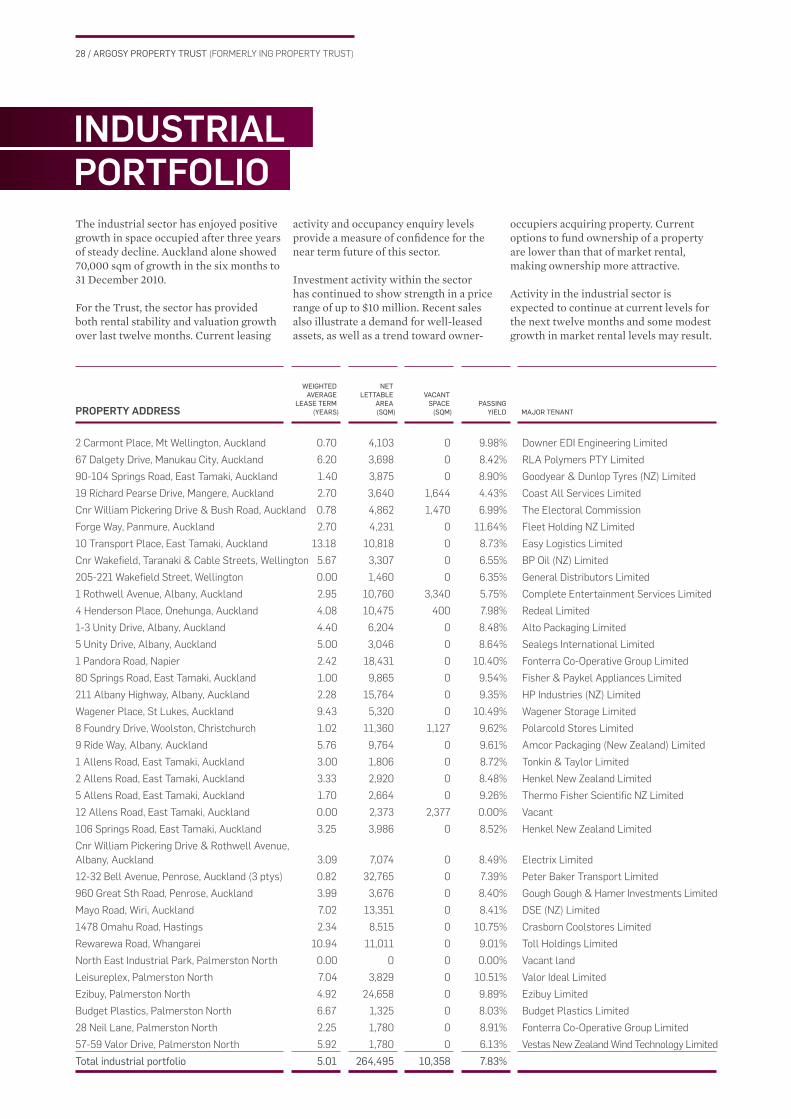
The industrial sector has enjoyed positive growth in space occupied after three years of steady decline. Auckland alone showed 70,000 sqm of growth in the six months to 31 December 2010.
For the Trust, the sector has provided both rental stability and valuation growth over last twelve months. Current leasing
activity and occupancy enquiry levels provide a measure of confi dence for the near term future of this sector.
Investment activity within the sector has continued to show strength in a price range of up to $10 million. Recent sales also illustrate a demand for well-leased assets, as well as a trend toward owner-
PROPERTY ADDRESS
WEIGHTEDAVERAGE
LEASE TERM(YEARS)
NET LETTABLE
AREA (SQM)
VACANTSPACE
(SQM)PASSING
YIELD MAJOR TENANT
2 Carmont Place, Mt Wellington, Auckland 0.70 4,103 0 9.98% Downer EDI Engineering Limited
67 Dalgety Drive, Manukau City, Auckland 6.20 3,698 0 8.42% RLA Polymers PTY Limited
90-104 Springs Road, East Tamaki, Auckland 1.40 3,875 0 8.90% Goodyear & Dunlop Tyres (NZ) Limited
19 Richard Pearse Drive, Mangere, Auckland 2.70 3,640 1,644 4.43% Coast All Services Limited
Cnr William Pickering Drive & Bush Road, Auckland 0.78 4,862 1,470 6.99% The Electoral Commission
Forge Way, Panmure, Auckland 2.70 4,231 0 11.64% Fleet Holding NZ Limited
10 Transport Place, East Tamaki, Auckland 13.18 10,818 0 8.73% Easy Logistics Limited
Cnr Wakefi eld, Taranaki & Cable Streets, Wellington 5.67 3,307 0 6.55% BP Oil (NZ) Limited
205-221 Wakefi eld Street, Wellington 0.00 1,460 0 6.35% General Distributors Limited
1 Rothwell Avenue, Albany, Auckland 2.95 10,760 3,340 5.75% Complete Entertainment Services Limited
4 Henderson Place, Onehunga, Auckland 4.08 10,475 400 7.98% Redeal Limited
1-3 Unity Drive, Albany, Auckland 4.40 6,204 0 8.48% Alto Packaging Limited
5 Unity Drive, Albany, Auckland 5.00 3,046 0 8.64% Sealegs International Limited
1 Pandora Road, Napier 2.42 18,431 0 10.40% Fonterra Co-Operative Group Limited
80 Springs Road, East Tamaki, Auckland 1.00 9,865 0 9.54% Fisher & Paykel Appliances Limited
211 Albany Highway, Albany, Auckland 2.28 15,764 0 9.35% HP Industries (NZ) Limited
Wagener Place, St Lukes, Auckland 9.43 5,320 0 10.49% Wagener Storage Limited
8 Foundry Drive, Woolston, Christchurch 1.02 11,360 1,127 9.62% Polarcold Stores Limited
9 Ride Way, Albany, Auckland 5.76 9,764 0 9.61% Amcor Packaging (New Zealand) Limited
1 Allens Road, East Tamaki, Auckland 3.00 1,806 0 8.72% Tonkin & Taylor Limited
2 Allens Road, East Tamaki, Auckland 3.33 2,920 0 8.48% Henkel New Zealand Limited
5 Allens Road, East Tamaki, Auckland 1.70 2,664 0 9.26% Thermo Fisher Scientifi c NZ Limited
12 Allens Road, East Tamaki, Auckland 0.00 2,373 2,377 0.00% Vacant
106 Springs Road, East Tamaki, Auckland 3.25 3,986 0 8.52% Henkel New Zealand Limited
Cnr William Pickering Drive & Rothwell Avenue,
Albany, Auckland 3.09 7,074 0 8.49% Electrix Limited
12-32 Bell Avenue, Penrose, Auckland (3 ptys) 0.82 32,765 0 7.39% Peter Baker Transport Limited
960 Great Sth Road, Penrose, Auckland 3.99 3,676 0 8.40% Gough Gough & Hamer Investments Limited
Mayo Road, Wiri, Auckland 7.02 13,351 0 8.41% DSE (NZ) Limited
1478 Omahu Road, Hastings 2.34 8,515 0 10.75% Crasborn Coolstores Limited
Rewarewa Road, Whangarei 10.94 11,011 0 9.01% Toll Holdings Limited
North East Industrial Park, Palmerston North 0.00 0 0 0.00% Vacant land
Leisureplex, Palmerston North 7.04 3,829 0 10.51% Valor Ideal Limited
Ezibuy, Palmerston North 4.92 24,658 0 9.89% Ezibuy Limited
Budget Plastics, Palmerston North 6.67 1,325 0 8.03% Budget Plastics Limited
28 Neil Lane, Palmerston North 2.25 1,780 0 8.91% Fonterra Co-Operative Group Limited
57-59 Valor Drive, Palmerston North 5.92 1,780 0 6.13% Vestas New Zealand Wind Technology Limited
Total industrial portfolio 5.01 264,495 10,358 7.83%
occupiers acquiring property. Current options to fund ownership of a property are lower than that of market rental, making ownership more attractive.
Activity in the industrial sector is expected to continue at current levels for the next twelve months and some modest growth in market rental levels may result.
INDUSTRIALPORTFOLIO
29 / ARGOSY PROPERTY TRUST (FORMERLY ING PROPERTY TRUST)
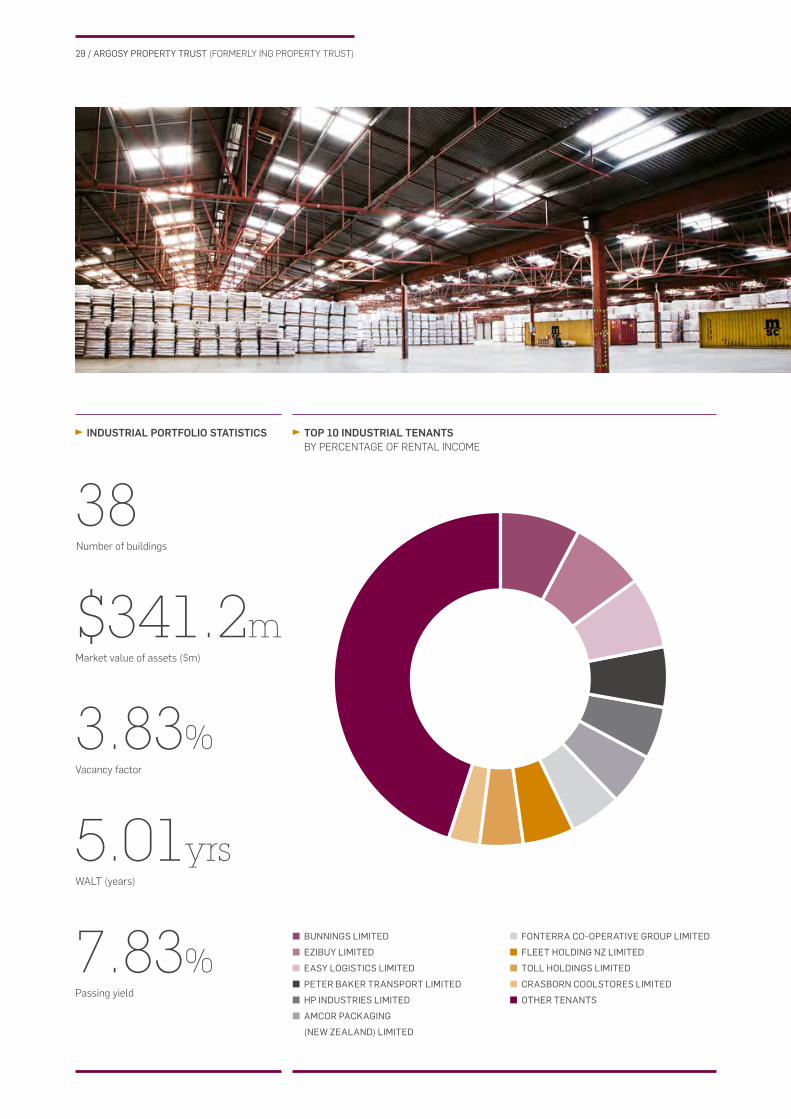
INDUSTRIAL PORTFOLIO STATISTICS TOP 10 INDUSTRIAL TENANTS BY PERCENTAGE OF RENTAL INCOME
38
7.83%
$341.2m
Number of buildings
Passing yield
Market value of assets ($m)
3.83%Vacancy factor
5.01yrsWALT (years)
BUNNINGS LIMITED
EZIBUY LIMITED
EASY LOGISTICS LIMITED
PETER BAKER TRANSPORT LIMITED
HP INDUSTRIES LIMITED
AMCOR PACKAGING
(NEW ZEALAND) LIMITED
FONTERRA CO-OPERATIVE GROUP LIMITED
FLEET HOLDING NZ LIMITED
TOLL HOLDINGS LIMITED
CRASBORN COOLSTORES LIMITED
OTHER TENANTS
30 / ARGOSY PROPERTY TRUST (FORMERLY ING PROPERTY TRUST)
Argosy Property Management Limited (Argosy) recognises that certain natural resources are fi nite and must therefore be used responsibly. We are committed to managing our impact on the environment and believe that we have an important role to play in contributing to sustainable development.
The protection of the environment has become more important. Scarce resources must be preserved for future generations. At the same time, there is a growing awareness that many environmental issues do not stand alone, but are intertwined with broader social and political developments.
The team at Argosy are expected to be aware of environmental issues and we encourage environmentally responsible behaviour. Over and above our in-house recycling and printing initiatives, we believe our biggest impact on the environment can be seen in our buildings, building management policy and our communications.
COMMUNICATION AND REPORTING
Raw materials (natural wood) and the use of bleaching chemicals make the production of paper harmful to the environment. Argosy uses vast quantities of paper for its internal and external communications, so to limit our impact on the environment Argosy aims to reduce paper consumption by making greater use of electronic communications such as the internet, intranet and document imaging. All unitholders are able to receive most communications from the Manager via email should they wish to do so.
The Board encourages business units to use environmentally friendly paper that is non-bleached (ECF and TCF) and originates from sustainable sources.
Argosy uses a range of environmentally responsible paper stock for all printed unitholder publications.
Advance Laser is an environmentally responsible paper manufactured from farmed trees under the environmental management system ISO 14001. The paper is elemental chlorine free and manufactured from fast-growing eucalyptus trees.
The water used in the production of Advance Laser is sourced from the Advance Agro mill’s own purpose-built reservoir which collects rainwater and run off. Advance Agro uses tree waste (bark and lignin) to generate electricity to run its mill.
Printing companies used by Argosy use the latest in vegetable oil-based and mineral oil-free inks for all printed publications. These inks contain less chemicals, are more biodegradable
ENVIRONMENTALSTATEMENT
We believe our biggest impact on the environment can be seen in our buildings, building management policy and our communications.

31 / ARGOSY PROPERTY TRUST (FORMERLY ING PROPERTY TRUST)
and more carbon effi cient than their synthetically produced counterparts.
OUR BUILDING MANAGEMENT POLICY
As a responsible investor and landlord, we’re keen to ensure that each of our investments uses initiatives to achieve environmentally sustainable features in each individual building’s strategic plan. We consider the initiative to produce environmentally responsible developments a fundamental requirement of any project, be it a new development or a retro-fi t.
This view is supported by tenant demand for green accommodation that:
• Provides a reduction in operating costs
• Provides an improved environment for the occupants
• Mitigates the functional obsolescence of an investment
• Results in increased tenant demand for our buildings, and an increase in the property value.
The Manager is committed to fi nding innovative ways of making the Trust’s new and existing buildings more environmentally sound and sustainable. OnePath (NZ) Limited is a member of the New Zealand Green Building Council, the non-government organisation made up of industry leaders committed to developing market based solutions that help deliver effi cient, healthier, innovative buildings for New Zealand.
To date, these initiatives include rainwater harvesting for reuse, installing bike racks to encourage the use of environmentally friendly transport and bringing essential services (lifts, airconditioning etc) within a building in line with green operating standards.
We’re keen to ensure that each of our investments uses initiatives to achieve environmentally sustainable features in each individual building’s strategic plan.

32 / ARGOSY PROPERTY TRUST (FORMERLY ING PROPERTY TRUST)
Statement of Financial Position / p.33
Statement of Comprehensive Income / p.34
Statement of Changes in Equity / p.35
Statement of Cash Flows / p.36
Notes to the fi nancial statements / p.37
Auditor’s report / p.69
Unitholder statistics / p.70
FINANCIALSTATEMENTS
The notes on pages 37–68 form part of and are to be read in conjunction with these fi nancial statements.
33 / ARGOSY PROPERTY TRUST (FORMERLY ING PROPERTY TRUST)
NOTE
GROUP2011
$000s
TRUST2011
$000s
GROUP(RESTATED)
2010$000s
TRUST2010
$000s
GROUP(RESTATED)
2009$000s
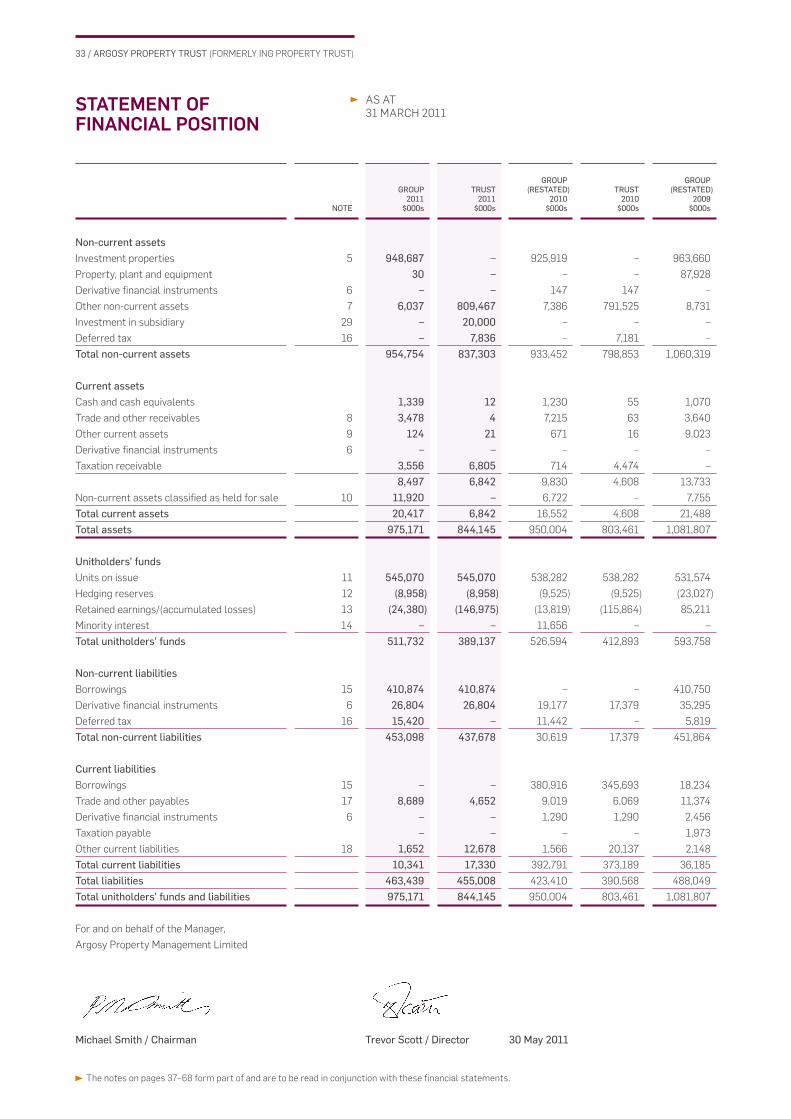
Non-current assetsInvestment properties 5 948,687 – 925,919 – 963,660
Property, plant and equipment 30 – – – 87,928
Derivative fi nancial instruments 6 – – 147 147 –
Other non-current assets 7 6,037 809,467 7,386 791,525 8,731
Investment in subsidiary 29 – 20,000 – – –
Deferred tax 16 – 7,836 – 7,181 –
Total non-current assets 954,754 837,303 933,452 798,853 1,060,319
Current assetsCash and cash equivalents 1,339 12 1,230 55 1,070
Trade and other receivables 8 3,478 4 7,215 63 3,640
Other current assets 9 124 21 671 16 9,023
Derivative fi nancial instruments 6 – – – – –
Taxation receivable 3,556 6,805 714 4,474 –
8,497 6,842 9,830 4,608 13,733
Non-current assets classifi ed as held for sale 10 11,920 – 6,722 – 7,755
Total current assets 20,417 6,842 16,552 4,608 21,488
Total assets 975,171 844,145 950,004 803,461 1,081,807
Unitholders’ fundsUnits on issue 11 545,070 545,070 538,282 538,282 531,574
Hedging reserves 12 (8,958) (8,958) (9,525) (9,525) (23,027)
Retained earnings/(accumulated losses) 13 (24,380) (146,975) (13,819) (115,864) 85,211
Minority interest 14 – – 11,656 – –
Total unitholders’ funds 511,732 389,137 526,594 412,893 593,758
Non-current liabilitiesBorrowings 15 410,874 410,874 – – 410,750
Derivative fi nancial instruments 6 26,804 26,804 19,177 17,379 35,295
Deferred tax 16 15,420 – 11,442 – 5,819
Total non-current liabilities 453,098 437,678 30,619 17,379 451,864
Current liabilitiesBorrowings 15 – – 380,916 345,693 18,234
Trade and other payables 17 8,689 4,652 9,019 6,069 11,374
Derivative fi nancial instruments 6 – – 1,290 1,290 2,456
Taxation payable – – – – 1,973
Other current liabilities 18 1,652 12,678 1,566 20,137 2,148
Total current liabilities 10,341 17,330 392,791 373,189 36,185
Total liabilities 463,439 455,008 423,410 390,568 488,049
Total unitholders’ funds and liabilities 975,171 844,145 950,004 803,461 1,081,807
For and on behalf of the Manager,
Argosy Property Management Limited
Michael Smith / Chairman Trevor Scott / Director 30 May 2011
STATEMENT OF FINANCIAL POSITION
AS AT
31 MARCH 2011
The notes on pages 37–68 form part of and are to be read in conjunction with these fi nancial statements.
34 / ARGOSY PROPERTY TRUST (FORMERLY ING PROPERTY TRUST)
NOTE
GROUP2011
$000s
TRUST2011
$000s
GROUP(RESTATED)
2010$000s
TRUST2010
$000s
STATEMENT OF COMPREHENSIVE INCOME
FOR THE YEAR ENDED
31 MARCH 2011
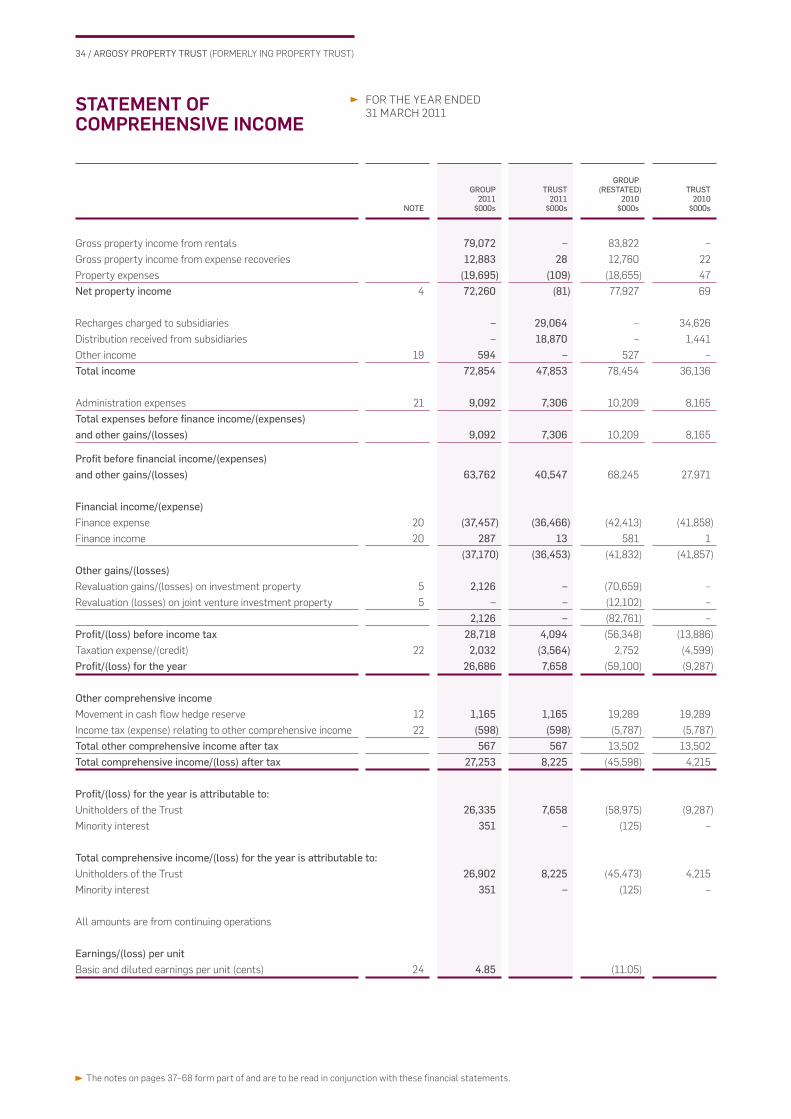
Gross property income from rentals 79,072 – 83,822 –
Gross property income from expense recoveries 12,883 28 12,760 22
Property expenses (19,695) (109) (18,655) 47
Net property income 4 72,260 (81) 77,927 69
Recharges charged to subsidiaries – 29,064 – 34,626
Distribution received from subsidiaries – 18,870 – 1,441
Other income 19 594 – 527 –
Total income 72,854 47,853 78,454 36,136
Administration expenses 21 9,092 7,306 10,209 8,165
Total expenses before fi nance income/(expenses) and other gains/(losses) 9,092 7,306 10,209 8,165
Profi t before fi nancial income/(expenses) and other gains/(losses) 63,762 40,547 68,245 27,971
Financial income/(expense)Finance expense 20 (37,457) (36,466) (42,413) (41,858)
Finance income 20 287 13 581 1
(37,170) (36,453) (41,832) (41,857)
Other gains/(losses)Revaluation gains/(losses) on investment property 5 2,126 – (70,659) –
Revaluation (losses) on joint venture investment property 5 – – (12,102) –
2,126 – (82,761) –
Profi t/(loss) before income tax 28,718 4,094 (56,348) (13,886)
Taxation expense/(credit) 22 2,032 (3,564) 2,752 (4,599)
Profi t/(loss) for the year 26,686 7,658 (59,100) (9,287)
Other comprehensive incomeMovement in cash fl ow hedge reserve 12 1,165 1,165 19,289 19,289
Income tax (expense) relating to other comprehensive income 22 (598) (598) (5,787) (5,787)
Total other comprehensive income after tax 567 567 13,502 13,502
Total comprehensive income/(loss) after tax 27,253 8,225 (45,598) 4,215
Profi t/(loss) for the year is attributable to:Unitholders of the Trust 26,335 7,658 (58,975) (9,287)
Minority interest 351 – (125) –
Total comprehensive income/(loss) for the year is attributable to:Unitholders of the Trust 26,902 8,225 (45,473) 4,215
Minority interest 351 – (125) –
All amounts are from continuing operations
Earnings/(loss) per unitBasic and diluted earnings per unit (cents) 24 4.85 (11.05)
The notes on pages 37–68 form part of and are to be read in conjunction with these fi nancial statements.
35 / ARGOSY PROPERTY TRUST (FORMERLY ING PROPERTY TRUST)
NOTE
GROUP2011
$000s
TRUST2011
$000s
GROUP(RESTATED)
2010$000s
TRUST2010
$000s
FOR THE YEAR ENDED
31 MARCH 2011STATEMENT OF CHANGES IN EQUITY
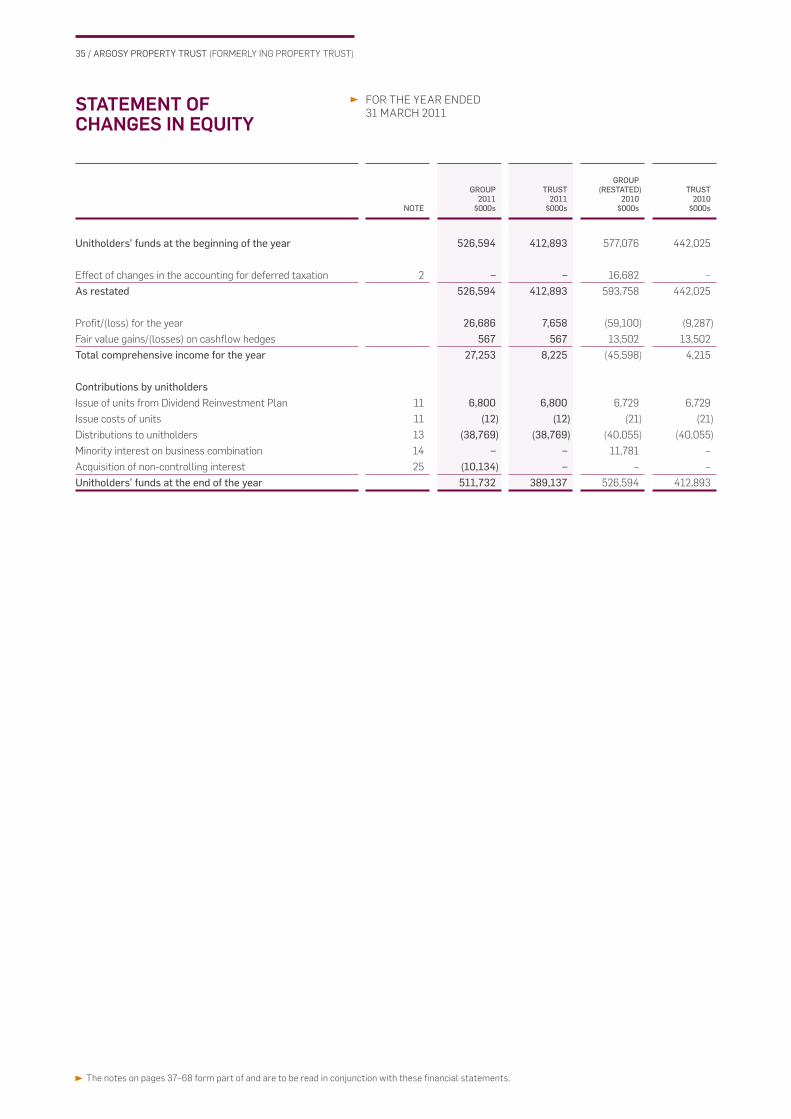
Unitholders’ funds at the beginning of the year 526,594 412,893 577,076 442,025
Effect of changes in the accounting for deferred taxation 2 – – 16,682 –
As restated 526,594 412,893 593,758 442,025
Profi t/(loss) for the year 26,686 7,658 (59,100) (9,287)
Fair value gains/(losses) on cashfl ow hedges 567 567 13,502 13,502
Total comprehensive income for the year 27,253 8,225 (45,598) 4,215
Contributions by unitholdersIssue of units from Dividend Reinvestment Plan 11 6,800 6,800 6,729 6,729
Issue costs of units 11 (12) (12) (21) (21)
Distributions to unitholders 13 (38,769) (38,769) (40,055) (40,055)
Minority interest on business combination 14 – – 11,781 –
Acquisition of non-controlling interest 25 (10,134) – – –
Unitholders’ funds at the end of the year 511,732 389,137 526,594 412,893

The notes on pages 37–68 form part of and are to be read in conjunction with these fi nancial statements.
36 / ARGOSY PROPERTY TRUST (FORMERLY ING PROPERTY TRUST)
NOTE
GROUP2011
$000s
TRUST2011
$000s
GROUP(RESTATED)
2010$000s
TRUST2010
$000s
FOR THE YEAR ENDED
31 MARCH 2011STATEMENT OF CASH FLOWS
Cash fl ows from operating activitiesCash was provided from:
Property income 90,802 – 91,762 –
Interest received 311 13 398 1
Cash was applied to:
Property expenses (17,456) – (21,129) –
Management and Trustee fees (5,820) (5,820) (6,548) (6,545)
Interest paid (28,924) (28,137) (26,848) (25,983)
Close of swaps contracts (2,270) (2,270) (12,284) (11,985)
Tax paid (1,494) – (4,756) (862)
Other trust expenses (1,720) (1,041) (1,951) (1,508)
Net cash from operating activities 23 33,429 (37,255) 18,644 (46,882)
Cash fl ows from investing activitiesCash was provided from:
Sale of properties 18,005 – 101,509 –
Cash was applied to:
Loan to Argosy Property No. 3 Limited Limited – – (330) –
Capital additions on investment properties (15,553) – (19,061) –
Purchase of properties (33,148) – – –
Net cash used in investing activities (30,696) – 82,118 –
Cash fl ows from fi nancing activitiesCash was provided from:
Debt drawdown 429,307 429,307 54,842 54,287
Advances from subsidiaries – 4,582 – 145,871
Cash was applied to:
Repayment of debt (397,972) (362,682) (122,139) (119,808)
Distributions paid to unitholders (31,905) (31,990) (33,439) (33,439)
Issue of units (net of issue costs) (12) (12) (21) (21)
Facility refi nancing fee (2,042) (1,993) – –
Net cash from fi nancing activities (2,624) 37,212 (100,757) 46,890
Net increase/(decrease) in cash and cash equivalents 109 (43) 5 8
Cash and cash equivalents bought through business combination – – 155 –
Cash and cash equivalents at the beginning of the year 1,230 55 1,070 47
Cash and cash equivalents at the end of the year 1,339 12 1,230 55
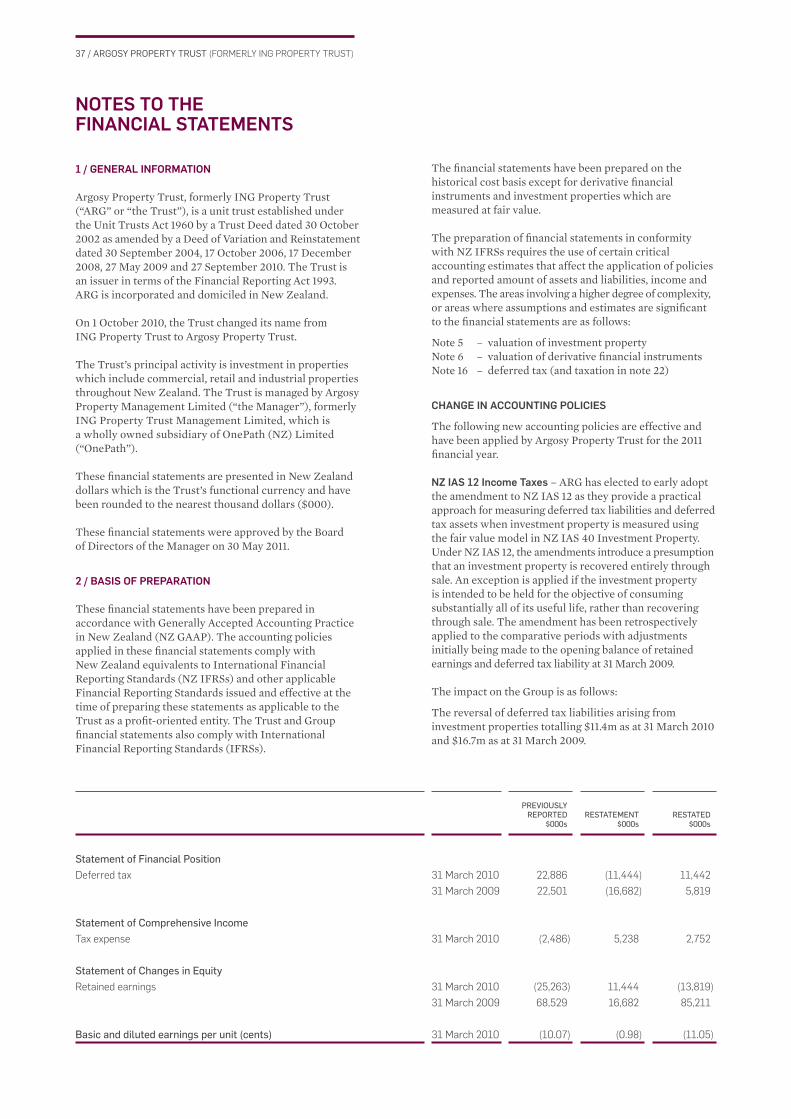
37 / ARGOSY PROPERTY TRUST (FORMERLY ING PROPERTY TRUST)
PREVIOUSLY REPORTED
$000sRESTATEMENT
$000sRESTATED
$000s
1 / GENERAL INFORMATION
Argosy Property Trust, formerly ING Property Trust (“ARG” or “the Trust”), is a unit trust established under the Unit Trusts Act 1960 by a Trust Deed dated 30 October 2002 as amended by a Deed of Variation and Reinstatement dated 30 September 2004, 17 October 2006, 17 December 2008, 27 May 2009 and 27 September 2010. The Trust is an issuer in terms of the Financial Reporting Act 1993. ARG is incorporated and domiciled in New Zealand.
On 1 October 2010, the Trust changed its name from ING Property Trust to Argosy Property Trust.
The Trust’s principal activity is investment in properties which include commercial, retail and industrial properties throughout New Zealand. The Trust is managed by Argosy Property Management Limited (“the Manager”), formerly ING Property Trust Management Limited, which is a wholly owned subsidiary of OnePath (NZ) Limited (“OnePath”).
These fi nancial statements are presented in New Zealand dollars which is the Trust’s functional currency and have been rounded to the nearest thousand dollars ($000).
These fi nancial statements were approved by the Board of Directors of the Manager on 30 May 2011.
2 / BASIS OF PREPARATION
These fi nancial statements have been prepared in accordance with Generally Accepted Accounting Practice in New Zealand (NZ GAAP). The accounting policies applied in these fi nancial statements comply with New Zealand equivalents to International Financial Reporting Standards (NZ IFRSs) and other applicable Financial Reporting Standards issued and effective at the time of preparing these statements as applicable to the Trust as a profi t-oriented entity. The Trust and Group fi nancial statements also comply with International Financial Reporting Standards (IFRSs).
The fi nancial statements have been prepared on the historical cost basis except for derivative fi nancial instruments and investment properties which are measured at fair value.
The preparation of fi nancial statements in conformity with NZ IFRSs requires the use of certain critical accounting estimates that affect the application of policies and reported amount of assets and liabilities, income and expenses. The areas involving a higher degree of complexity, or areas where assumptions and estimates are signifi cant to the fi nancial statements are as follows:
Note 5 – valuation of investment propertyNote 6 – valuation of derivative fi nancial instrumentsNote 16 – deferred tax (and taxation in note 22)
CHANGE IN ACCOUNTING POLICIES
The following new accounting policies are effective and have been applied by Argosy Property Trust for the 2011 fi nancial year.
NZ IAS 12 Income Taxes – ARG has elected to early adopt the amendment to NZ IAS 12 as they provide a practical approach for measuring deferred tax liabilities and deferred tax assets when investment property is measured using the fair value model in NZ IAS 40 Investment Property. Under NZ IAS 12, the amendments introduce a presumption that an investment property is recovered entirely through sale. An exception is applied if the investment property is intended to be held for the objective of consuming substantially all of its useful life, rather than recovering through sale. The amendment has been retrospectively applied to the comparative periods with adjustments initially being made to the opening balance of retained earnings and deferred tax liability at 31 March 2009.
The impact on the Group is as follows:
The reversal of deferred tax liabilities arising from investment properties totalling $11.4m as at 31 March 2010 and $16.7m as at 31 March 2009.
NOTES TO THEFINANCIAL STATEMENTS
Statement of Financial PositionDeferred tax 31 March 2010 22,886 (11,444) 11,442
31 March 2009 22,501 (16,682) 5,819
Statement of Comprehensive IncomeTax expense 31 March 2010 (2,486) 5,238 2,752
Statement of Changes in EquityRetained earnings 31 March 2010 (25,263) 11,444 (13,819)
31 March 2009 68,529 16,682 85,211
Basic and diluted earnings per unit (cents) 31 March 2010 (10.07) (0.98) (11.05)
38 / ARGOSY PROPERTY TRUST (FORMERLY ING PROPERTY TRUST)
NOTES TO THEFINANCIAL STATEMENTS (CONT.)
3 / SIGNIFICANT ACCOUNTING POLICIES
BASIS OF CONSOLIDATION
The Group’s fi nancial statements incorporate the fi nancial statements of ARG and its controlled subsidiaries accounted for using the purchase method. Control is achieved where the Group has the power to govern the fi nancial and operating policies of an entity so as to obtain benefi ts from its activities. The results of the subsidiaries are included in the consolidated statement of comprehensive income from the date of acquisition which is the date the Trust became entitled to income from the subsidiaries acquired. All signifi cant intercompany transactions are eliminated on consolidation.
Non-controlling interests in a subsidiary’s net assets are reported as a separate item in the Group’s equity. In the consolidated statement of comprehensive income, non-controlling interests are included in net profi t.
ACQUISITION ON NON-CONTROLLING INTERESTS
Acquisitions of non-controlling interests in subsidiaries are accounted for as transactions between shareholders. There is no remeasurement to fair value of net assets acquired that were previously attributable to non-controlling shareholders.
Transactions with non-controlling interests are handled in the same way as transactions with external parties.
The Trust’s subsidiaries are:Argosy Property No.1 LimitedArgosy Property No.3 LimitedArgosy Property No.4 Limited as corporate trustee of Argosy No.1 TrustArgosy Property Holdings LimitedArgosy Property Investments LimitedArgosy Property Limited
INVESTMENT PROPERTIES
Investment property is property held either to earn rental income, for capital appreciation or for both. Investment property is measured at fair value with any change therein recognised in profi t or loss. When the use of a property changes such that it is reclassifi ed as property, plant and equipment, its fair value at the date of reclassifi cation becomes its cost for subsequent accounting. Initial direct costs incurred in negotiating and arranging operating leases and lease incentives granted are added to the carrying amount of the leased asset.
In accordance with the valuation policy of the Trust complete property valuations are carried out at least annually by independent registered valuers. The valuation policy stipulates that the same valuer may not value a building for more than two consecutive years. The fair values are based on market values being the estimated amount for which a property could be exchanged on the date of the valuation between a willing buyer and a willing seller in an arm’s length transaction after proper
marketing wherein the parties had each acted knowledgeably, prudently and without compulsion.
In the absence of current prices in an active market, the valuations are prepared using a discounted cash fl ow methodology based on the estimated rental cash fl ows expected to be received from the property adjusted by a discount rate that appropriately refl ects the risks inherent in the expected cash fl ows.
Investment properties are derecognised when they have been disposed of and any gains or losses incurred on disposal are recognised in profi t or loss in the year of derecognition.
GOODWILL
Goodwill arises on the acquisition of subsidiaries, associates and joint ventures. Goodwill represents the excess of the cost of the acquisition over the Group’s interest in the net fair value of the identifi able assets, liabilities and contingent liabilities of the acquiree. When the excess is negative (negative goodwill), it is recognised immediately in the profi t or loss. Goodwill is tested annually for impairment and carried at cost less accumulated impairment losses. Impairment losses on goodwill are not reversed.
STATEMENT OF CASH FLOWS
The statement of cash fl ows is prepared on a GST exclusive basis, which is consistent with the statement of comprehensive income.
The following terms are used in the statement of cash fl ows:
Operating activities are the principal revenue producing activities of the Group and other activities that are not investing or fi nancing activities.
Investing activities are the acquisition and disposal of long term assets and other investments not included in cash equivalents.
Financing activities are activities that result in changes in the size and composition of the contributed equity and borrowings of the entity.
FINANCIAL INSTRUMENTS
Non-derivative fi nancial instrumentsNon-derivative fi nancial instruments comprise investments, trade and other receivables, cash and cash equivalents, borrowings and trade and other payables.
Non-derivative fi nancial instruments are recognised and derecognised on trade date where the purchase or sale of investment is under a contract whose terms require delivery of the fi nancial instrument within the timeframe established by the market concerned, and are initially measured at fair value plus, for instruments not at fair value through profi t or loss, any directly attributable transaction costs.
39 / ARGOSY PROPERTY TRUST (FORMERLY ING PROPERTY TRUST)
NOTES TO THEFINANCIAL STATEMENTS (CONT.)
subsequent reporting dates. Changes in the fair value of derivative fi nancial instruments that are designated and effective as hedges of future cash fl ows are recognised in other comprehensive income and accumulated in equity and the ineffective portion is recognised immediately in profi t or loss. The Group designates certain hedges of both fi rm commitments and highly probable forecast transactions as cash fl ow hedges.
The Group documents at the inception of the transaction the relationship between hedging instruments and hedged items, as well as its risk management objective and strategy for undertaking various hedge transactions. The Group also documents its assessment, both at hedge inception and on an ongoing basis, of whether the derivatives that are used in hedging transactions are highly effective in offsetting changes in cash fl ows of hedged items.
When a hedging instrument expires or is sold, or when a hedge no longer meets the criteria for hedge accounting, any cumulative gain or loss existing in equity at that time remains in equity and is recognised in profi t or loss when the forecast transaction is ultimately recognised. When a forecast transaction is no longer expected to occur, the cumulative gain or loss that was reported in equity is immediately transferred to the profi t or loss.
Fair value hedgeThe Group designates hedges of the fair value of recognised assets and liabilities as fair value hedges. These include hedges of borrowings issued at fi xed interest rates which expose the group to fair value interest rate risk. Changes in the fair value of derivatives that are designated and qualify as fair value hedges are recorded in profi t or loss together with any changes in the fair value of the hedged asset or liability that are attributable to the hedged risk.
Derivatives that do not qualify for hedge accountingChanges in the fair value of derivative fi nancial instruments that do not qualify for hedge accounting are recognised in profi t or loss as they arise.
Fair value estimationThe fair value of interest rate swaps is the estimated amount that the group would receive or pay to terminate the swap at the balance sheet date, taking into account current interest rates and the current creditworthiness of the swap counterparties.
RECOGNITION OF INCOME
Rental income from investment property is recognised in profi t or loss on a straight-line basis over the term of the lease. Lease incentives granted are recognised as an integral part of the total rental income, over the term of the lease. Operating expenses borne by tenants are offset by recoveries from tenants.
Dividend revenue from investments is recognised when the Group’s right to receive the payment has been established.
Cash and cash equivalentsCash and cash equivalents comprise cash balances and demand deposits. Bank overdrafts that are repayable on demand and form an integral part of the Group’s cash management are included as a component of cash and cash equivalents for the purpose of the statement of cash fl ows.
Trade and other receivablesTrade and other receivables are recognised initially at fair value and subsequently measured at amortised cost using the effective interest method, less provision for impairment. A provision for impairment of trade receivables is established when there is objective evidence that the Group will not be able to collect all amounts due according to the original terms of the receivables. The amount of the provision is the difference between the asset’s carrying amount and the present value of estimated future cash fl ows, discounted at the original effective interest rate.
Trade and other payablesTrade and other payables are recognised initially at fair value and subsequently measured at amortised cost using the effective interest method.
Bank BorrowingsInterest-bearing bank loans and overdrafts are initially measured at fair value net of transaction costs. Subsequent to initial recognition, borrowings are measured at amortised cost with any difference being recognised in profi t and loss over the period of the borrowing using the effective interest rate method.
Borrowing costsBorrowing costs directly attributable to property under development are capitalised as part of the cost of those assets in note 5.
NON-CURRENT ASSETS HELD FOR SALE
Non-current assets are classifi ed as held for sale if their carrying amount will be recovered principally through a sale transaction rather than through continuing use. This condition is regarded as met only when the sale is highly probable and the asset (or disposal group) is available for immediate sale in its present condition.
Non-current assets classifi ed as held for sale (principally investment property) are measured at the lower of their previous carrying amount and fair value.
DERIVATIVE FINANCIAL INSTRUMENTS
Interest rate swaps are entered into to manage interest rate exposure. For interest rate swaps, the net differential paid or received is recognised as a component of interest expense in profi t or loss.
Cash fl ow hedgeDerivative fi nancial instruments are initially recognised at fair value on the date a derivative contract is entered into and are subsequently remeasured at their fair value at
40 / ARGOSY PROPERTY TRUST (FORMERLY ING PROPERTY TRUST)
NOTES TO THEFINANCIAL STATEMENTS (CONT.)
The amendments of NZ IAS 12 Income Taxes provide a practical approach for measuring deferred tax liabilities and deferred tax assets when investment property is measured using the fair value model in NZ IAS 40 Investment Property. Under NZ IAS 12, the measurement of deferred tax liabilities and deferred tax assets depends on whether an entity expects to recover an asset by using it or by selling it. The amendment introduces a presumption that an investment property is recovered entirely through sale unless all of its useful life will be consumed.
OPERATING LEASE COMMITMENTS
ARG has entered into commercial property leases on its investment properties. ARG has determined that it retains all signifi cant risks and rewards of ownership of these properties and has thus classifi ed the leases as operating leases.
STANDARDS AND INTERPRETATIONS IN ISSUE NOT YET EFFECTIVE
At the date of authorisation of these fi nancial statements the following Standards and Interpretations were in issue but not yet effective, which are not expected to have a material impact but may affect presentation and disclosure:
NZ IFRS 9 Financial Instruments (effective for accounting periods beginning on or after 1 January 2013);
NZ IAS 24 (Revised) Related Party Disclosures (effective for accounting periods beginning on or after 1 January 2011);
IFRS 10 Consolidated Financial Statements (effective for accounting periods beginning on or after 1 January 2013);
IFRS 12 Disclosures of Interest in Other Entities (effective for accounting periods beginning on or after 1 January 2013); and
IFRS 13 Fair Value Measurements (effective for accounting periods beginning on or after 1 January 2013).
Other Standards and Interpretations in issue but not yet effective are not expected to have an impact in the fi nancial statements of the Group and Trust in the period of initial application.
Management fees are recognised in the period in which the services are performed.
FINANCIAL INCOME AND EXPENSES
Finance income comprises interest income using the effective interest method. The effective interest method is a method of calculating the amortised cost of a fi nancial asset or fi nancial liability and of allocating interest income over the relevant period (including all fees and points paid or received between the parties to the contract that form an integral part of the effective interest rate, transaction costs and other premiums or discounts) through the expected life of the fi nancial instrument, or, where appropriate, a shorter period to the net carrying amount of the fi nancial instrument.
Finance expenses comprise interest expense on borrowings and gains and losses on hedging instruments that are recognised in profi t or loss. All borrowing costs are recognised in profi t or loss using the effective interest method.
TAXATION
Income tax expenseIncome tax expense comprises current and deferred tax. Income tax expense is recognised in profi t or loss except to the extent that it relates to items recognised directly in equity, in which case it is recognised in equity.
Current Tax Current tax is the expected tax payable on the taxable income for the year, using tax rates enacted or substantively enacted at the reporting date, and any adjustment to tax payable in respect of previous years.
Deferred taxDeferred tax is recognised on differences between the carrying amount of assets and liabilities in the fi nancial statements and the corresponding tax bases used in the computation of taxable profi t, and is accounted for using the balance sheet liability method. Deferred tax liabilities are generally recognised for all taxable temporary differences and deferred tax assets are recognised to the extent that it is probable that taxable profi ts will be available against which deductible temporary differences can be utilised. Such assets and liabilities are not recognised if the temporary difference arises from goodwill or from the initial recognition (other than in a business combination) of other assets and liabilities in a transaction that affect neither the taxable profi t nor the accounting profi t.
Deferred tax is calculated at the tax rates that are expected to apply in the period when the liability is settled or the asset realised.
3 / SIGNIFICANT ACCOUNTING POLICIES (CONT.)
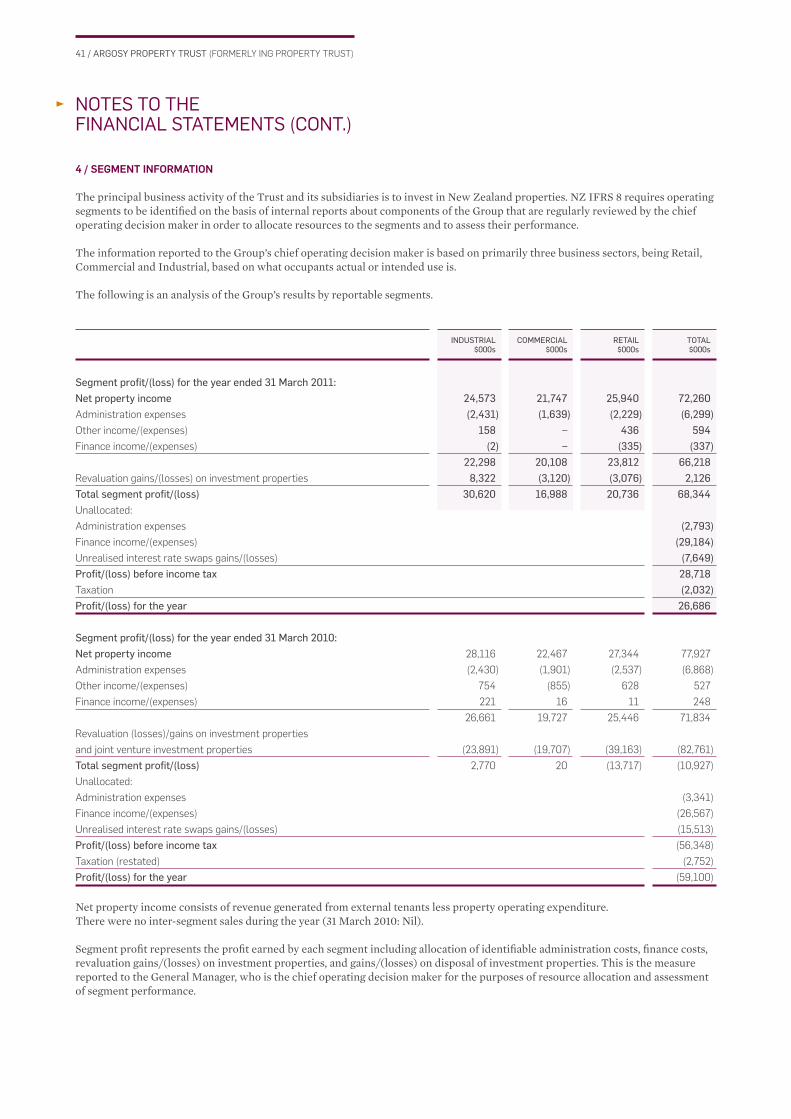
41 / ARGOSY PROPERTY TRUST (FORMERLY ING PROPERTY TRUST)
INDUSTRIAL$000s
COMMERCIAL$000s
RETAIL$000s
TOTAL$000s
NOTES TO THEFINANCIAL STATEMENTS (CONT.)
4 / SEGMENT INFORMATION
The principal business activity of the Trust and its subsidiaries is to invest in New Zealand properties. NZ IFRS 8 requires operating segments to be identifi ed on the basis of internal reports about components of the Group that are regularly reviewed by the chief operating decision maker in order to allocate resources to the segments and to assess their performance.
The information reported to the Group’s chief operating decision maker is based on primarily three business sectors, being Retail, Commercial and Industrial, based on what occupants actual or intended use is.
The following is an analysis of the Group’s results by reportable segments.
Segment profi t/(loss) for the year ended 31 March 2011:Net property income 24,573 21,747 25,940 72,260Administration expenses (2,431) (1,639) (2,229) (6,299)Other income/(expenses) 158 – 436 594 Finance income/(expenses) (2) – (335) (337) 22,298 20,108 23,812 66,218Revaluation gains/(losses) on investment properties 8,322 (3,120) (3,076) 2,126Total segment profi t/(loss) 30,620 16,988 20,736 68,344Unallocated:
Administration expenses (2,793)Finance income/(expenses) (29,184)Unrealised interest rate swaps gains/(losses) (7,649)Profi t/(loss) before income tax 28,718Taxation (2,032)Profi t/(loss) for the year 26,686
Segment profi t/(loss) for the year ended 31 March 2010:Net property income 28,116 22,467 27,344 77,927
Administration expenses (2,430) (1,901) (2,537) (6,868)
Other income/(expenses) 754 (855) 628 527
Finance income/(expenses) 221 16 11 248
26,661 19,727 25,446 71,834
Revaluation (losses)/gains on investment properties
and joint venture investment properties (23,891) (19,707) (39,163) (82,761)
Total segment profi t/(loss) 2,770 20 (13,717) (10,927)
Unallocated:
Administration expenses (3,341)
Finance income/(expenses) (26,567)
Unrealised interest rate swaps gains/(losses) (15,513)
Profi t/(loss) before income tax (56,348)
Taxation (restated) (2,752)
Profi t/(loss) for the year (59,100)
Net property income consists of revenue generated from external tenants less property operating expenditure.There were no inter-segment sales during the year (31 March 2010: Nil).
Segment profi t represents the profi t earned by each segment including allocation of identifi able administration costs, fi nance costs, revaluation gains/(losses) on investment properties, and gains/(losses) on disposal of investment properties. This is the measure reported to the General Manager, who is the chief operating decision maker for the purposes of resource allocation and assessment of segment performance.
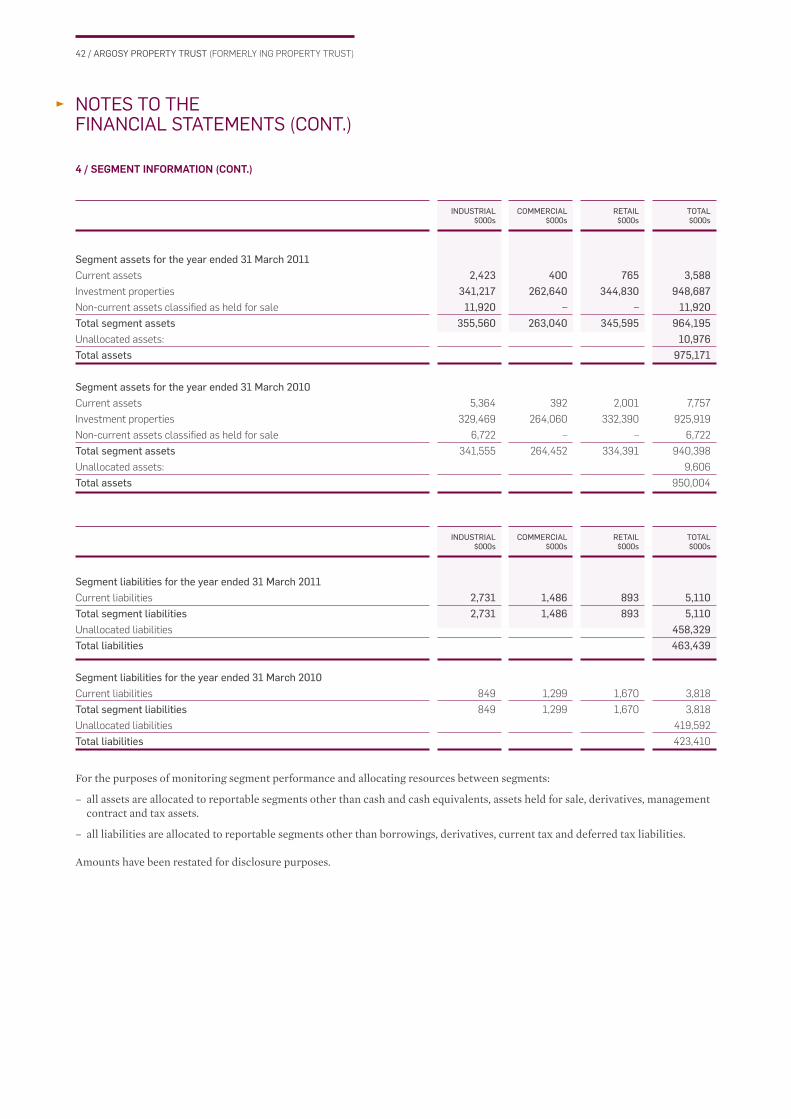
42 / ARGOSY PROPERTY TRUST (FORMERLY ING PROPERTY TRUST)
INDUSTRIAL$000s
COMMERCIAL$000s
RETAIL$000s
TOTAL$000s
INDUSTRIAL$000s
COMMERCIAL$000s
RETAIL$000s
TOTAL$000s
NOTES TO THEFINANCIAL STATEMENTS (CONT.)
4 / SEGMENT INFORMATION (CONT.)
Segment assets for the year ended 31 March 2011Current assets 2,423 400 765 3,588Investment properties 341,217 262,640 344,830 948,687Non-current assets classifi ed as held for sale 11,920 – – 11,920Total segment assets 355,560 263,040 345,595 964,195Unallocated assets: 10,976Total assets 975,171
Segment assets for the year ended 31 March 2010Current assets 5,364 392 2,001 7,757
Investment properties 329,469 264,060 332,390 925,919
Non-current assets classifi ed as held for sale 6,722 – – 6,722
Total segment assets 341,555 264,452 334,391 940,398
Unallocated assets: 9,606
Total assets 950,004
Segment liabilities for the year ended 31 March 2011Current liabilities 2,731 1,486 893 5,110 Total segment liabilities 2,731 1,486 893 5,110Unallocated liabilities 458,329Total liabilities 463,439
Segment liabilities for the year ended 31 March 2010Current liabilities 849 1,299 1,670 3,818
Total segment liabilities 849 1,299 1,670 3,818
Unallocated liabilities 419,592
Total liabilities 423,410
For the purposes of monitoring segment performance and allocating resources between segments:
– all assets are allocated to reportable segments other than cash and cash equivalents, assets held for sale, derivatives, management contract and tax assets.
– all liabilities are allocated to reportable segments other than borrowings, derivatives, current tax and deferred tax liabilities.
Amounts have been restated for disclosure purposes.
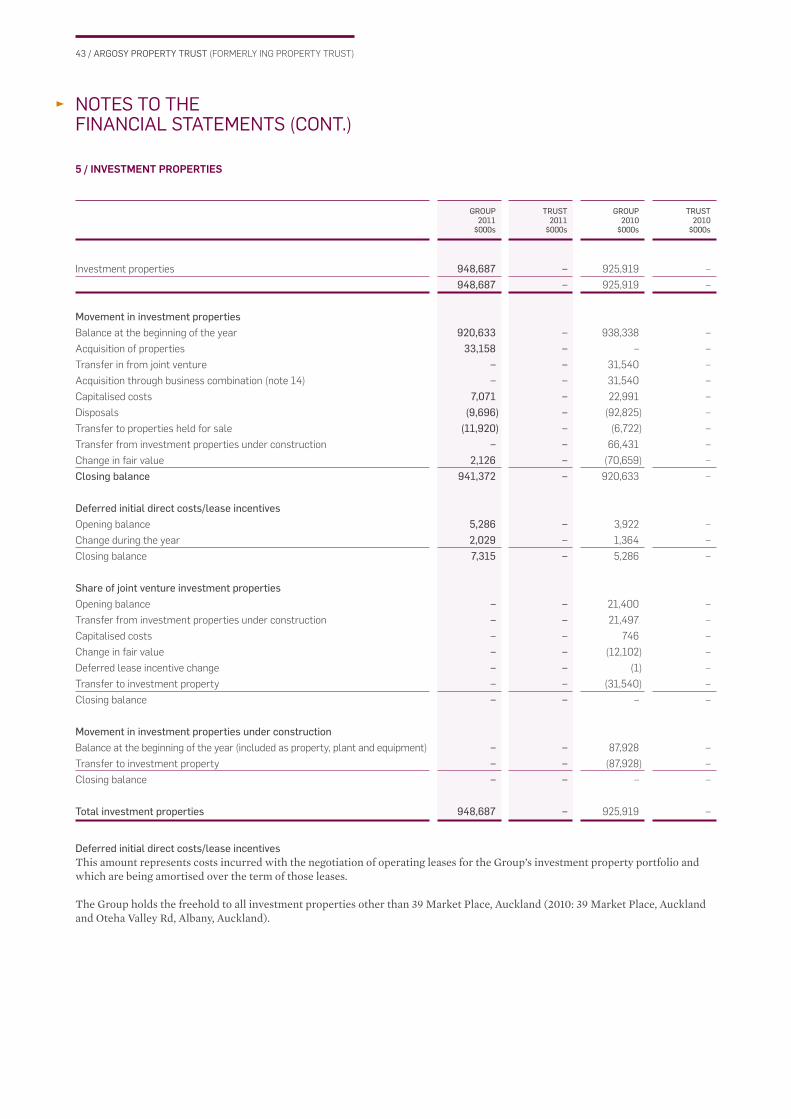
43 / ARGOSY PROPERTY TRUST (FORMERLY ING PROPERTY TRUST)
GROUP2011
$000s
TRUST2011
$000s
GROUP2010
$000s
TRUST2010
$000s
NOTES TO THEFINANCIAL STATEMENTS (CONT.)
5 / INVESTMENT PROPERTIES
Investment properties 948,687 – 925,919 –
948,687 – 925,919 –
Movement in investment propertiesBalance at the beginning of the year 920,633 – 938,338 –
Acquisition of properties 33,158 – – –
Transfer in from joint venture – – 31,540 –
Acquisition through business combination (note 14) – – 31,540 –
Capitalised costs 7,071 – 22,991 –
Disposals (9,696) – (92,825) –
Transfer to properties held for sale (11,920) – (6,722) –
Transfer from investment properties under construction – – 66,431 –
Change in fair value 2,126 – (70,659) –
Closing balance 941,372 – 920,633 –
Deferred initial direct costs/lease incentivesOpening balance 5,286 – 3,922 –
Change during the year 2,029 – 1,364 –
Closing balance 7,315 – 5,286 –
Share of joint venture investment propertiesOpening balance – – 21,400 –
Transfer from investment properties under construction – – 21,497 –
Capitalised costs – – 746 –
Change in fair value – – (12,102) –
Deferred lease incentive change – – (1) –
Transfer to investment property – – (31,540) –
Closing balance – – – –
Movement in investment properties under constructionBalance at the beginning of the year (included as property, plant and equipment) – – 87,928 –
Transfer to investment property – – (87,928) –
Closing balance – – – –
Total investment properties 948,687 – 925,919 –
Deferred initial direct costs/lease incentivesThis amount represents costs incurred with the negotiation of operating leases for the Group’s investment property portfolio and which are being amortised over the term of those leases.
The Group holds the freehold to all investment properties other than 39 Market Place, Auckland (2010: 39 Market Place, Auckland and Oteha Valley Rd, Albany, Auckland).
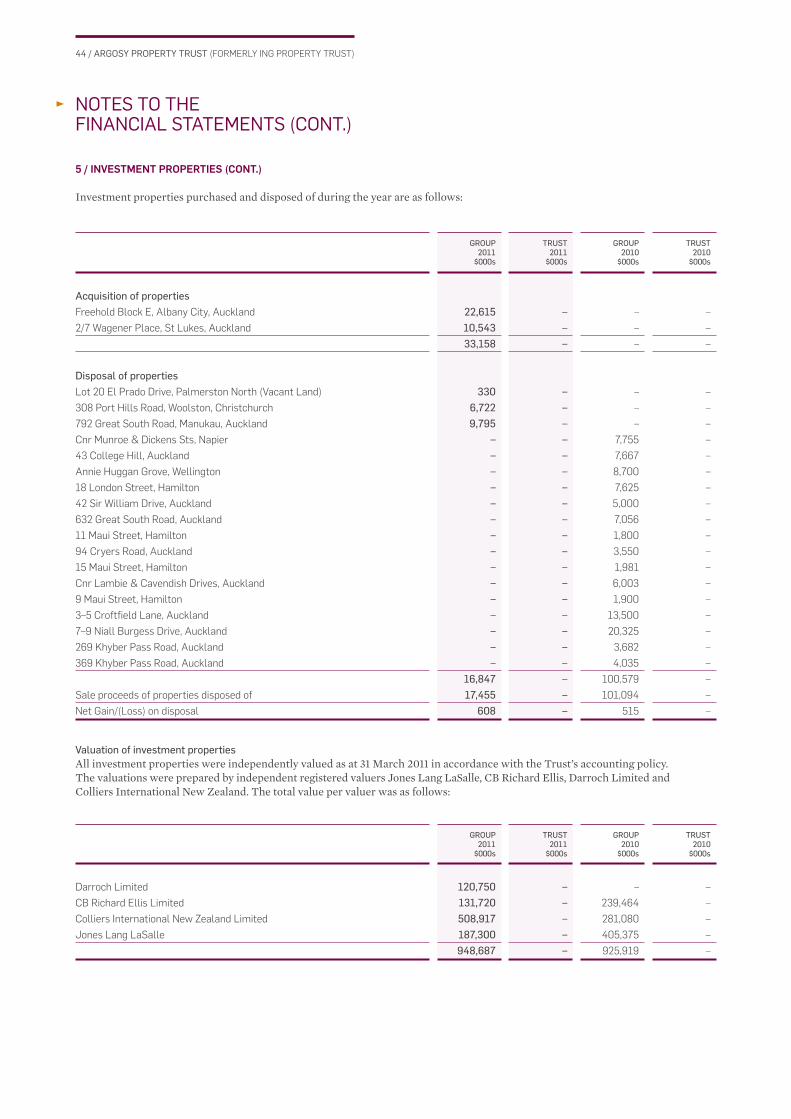
44 / ARGOSY PROPERTY TRUST (FORMERLY ING PROPERTY TRUST)
GROUP2011
$000s
TRUST2011
$000s
GROUP2010
$000s
TRUST2010
$000s
GROUP2011
$000s
TRUST2011
$000s
GROUP2010
$000s
TRUST2010
$000s
NOTES TO THEFINANCIAL STATEMENTS (CONT.)
5 / INVESTMENT PROPERTIES (CONT.)
Investment properties purchased and disposed of during the year are as follows:
Acquisition of propertiesFreehold Block E, Albany City, Auckland 22,615 – – –
2/7 Wagener Place, St Lukes, Auckland 10,543 – – –
33,158 – – –
Disposal of propertiesLot 20 El Prado Drive, Palmerston North (Vacant Land) 330 – – –
308 Port Hills Road, Woolston, Christchurch 6,722 – – –
792 Great South Road, Manukau, Auckland 9,795 – – –
Cnr Munroe & Dickens Sts, Napier – – 7,755 –
43 College Hill, Auckland – – 7,667 –
Annie Huggan Grove, Wellington – – 8,700 –
18 London Street, Hamilton – – 7,625 –
42 Sir William Drive, Auckland – – 5,000 –
632 Great South Road, Auckland – – 7,056 –
11 Maui Street, Hamilton – – 1,800 –
94 Cryers Road, Auckland – – 3,550 –
15 Maui Street, Hamilton – – 1,981 –
Cnr Lambie & Cavendish Drives, Auckland – – 6,003 –
9 Maui Street, Hamilton – – 1,900 –
3–5 Croftfi eld Lane, Auckland – – 13,500 –
7–9 Niall Burgess Drive, Auckland – – 20,325 –
269 Khyber Pass Road, Auckland – – 3,682 –
369 Khyber Pass Road, Auckland – – 4,035 –
16,847 – 100,579 –
Sale proceeds of properties disposed of 17,455 – 101,094 –
Net Gain/(Loss) on disposal 608 – 515 –
Valuation of investment propertiesAll investment properties were independently valued as at 31 March 2011 in accordance with the Trust’s accounting policy. The valuations were prepared by independent registered valuers Jones Lang LaSalle, CB Richard Ellis, Darroch Limited and Colliers International New Zealand. The total value per valuer was as follows:
Darroch Limited 120,750 – – –
CB Richard Ellis Limited 131,720 – 239,464 –
Colliers International New Zealand Limited 508,917 – 281,080 –
Jones Lang LaSalle 187,300 – 405,375 –
948,687 – 925,919 –
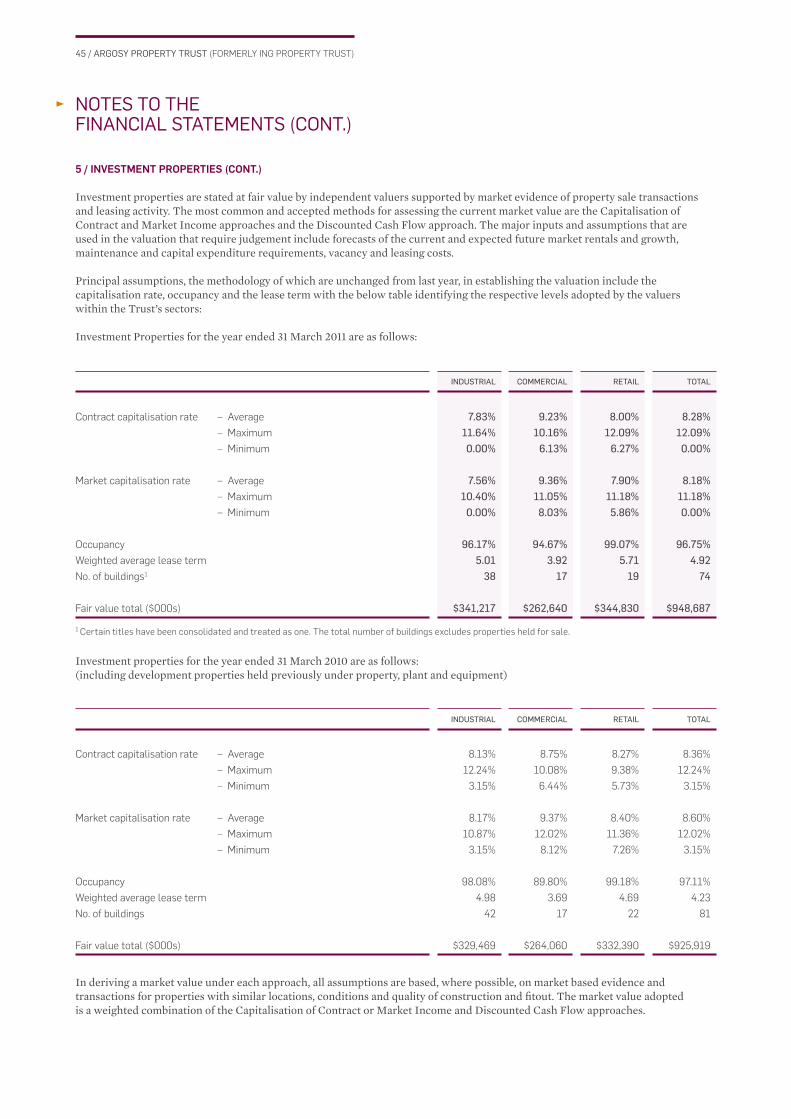
45 / ARGOSY PROPERTY TRUST (FORMERLY ING PROPERTY TRUST)
INDUSTRIAL COMMERCIAL RETAIL TOTAL
INDUSTRIAL COMMERCIAL RETAIL TOTAL
NOTES TO THEFINANCIAL STATEMENTS (CONT.)
5 / INVESTMENT PROPERTIES (CONT.)
Investment properties are stated at fair value by independent valuers supported by market evidence of property sale transactions and leasing activity. The most common and accepted methods for assessing the current market value are the Capitalisation of Contract and Market Income approaches and the Discounted Cash Flow approach. The major inputs and assumptions that are used in the valuation that require judgement include forecasts of the current and expected future market rentals and growth, maintenance and capital expenditure requirements, vacancy and leasing costs.
Principal assumptions, the methodology of which are unchanged from last year, in establishing the valuation include the capitalisation rate, occupancy and the lease term with the below table identifying the respective levels adopted by the valuers within the Trust’s sectors:
Investment Properties for the year ended 31 March 2011 are as follows:
Contract capitalisation rate – Average 7.83% 9.23% 8.00% 8.28% – Maximum 11.64% 10.16% 12.09% 12.09% – Minimum 0.00% 6.13% 6.27% 0.00%
Market capitalisation rate – Average 7.56% 9.36% 7.90% 8.18% – Maximum 10.40% 11.05% 11.18% 11.18% – Minimum 0.00% 8.03% 5.86% 0.00%
Occupancy 96.17% 94.67% 99.07% 96.75%Weighted average lease term 5.01 3.92 5.71 4.92No. of buildings1 38 17 19 74
Fair value total ($000s) $341,217 $262,640 $344,830 $948,687
1 Certain titles have been consolidated and treated as one. The total number of buildings excludes properties held for sale.
Investment properties for the year ended 31 March 2010 are as follows:(including development properties held previously under property, plant and equipment)
Contract capitalisation rate – Average 8.13% 8.75% 8.27% 8.36%
– Maximum 12.24% 10.08% 9.38% 12.24%
– Minimum 3.15% 6.44% 5.73% 3.15%
Market capitalisation rate – Average 8.17% 9.37% 8.40% 8.60%
– Maximum 10.87% 12.02% 11.36% 12.02%
– Minimum 3.15% 8.12% 7.26% 3.15%
Occupancy 98.08% 89.80% 99.18% 97.11%
Weighted average lease term 4.98 3.69 4.69 4.23
No. of buildings 42 17 22 81
Fair value total ($000s) $329,469 $264,060 $332,390 $925,919
In deriving a market value under each approach, all assumptions are based, where possible, on market based evidence and transactions for properties with similar locations, conditions and quality of construction and fi tout. The market value adopted is a weighted combination of the Capitalisation of Contract or Market Income and Discounted Cash Flow approaches.
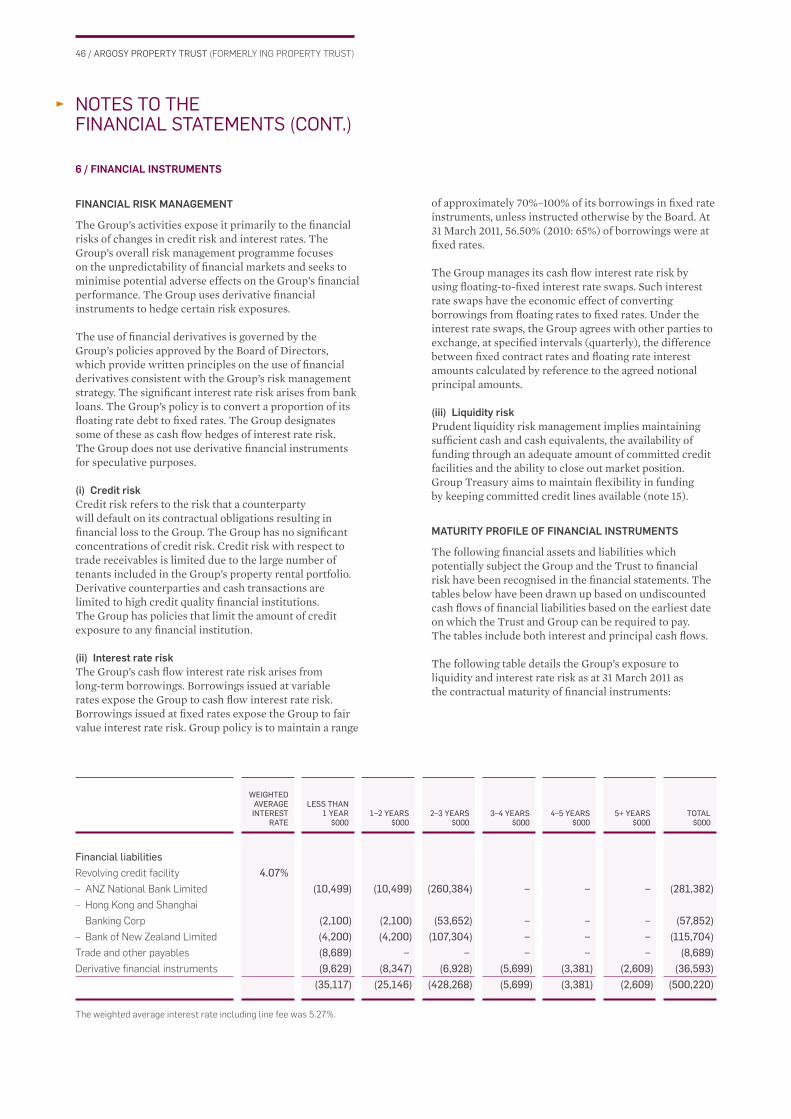
46 / ARGOSY PROPERTY TRUST (FORMERLY ING PROPERTY TRUST)
WEIGHTED AVERAGE INTEREST
RATE
LESS THAN 1 YEAR
$0001–2 YEARS
$0002–3 YEARS
$0003–4 YEARS
$0004–5 YEARS
$0005+ YEARS
$000TOTAL
$000
NOTES TO THEFINANCIAL STATEMENTS (CONT.)
6 / FINANCIAL INSTRUMENTS
FINANCIAL RISK MANAGEMENT
The Group’s activities expose it primarily to the fi nancial risks of changes in credit risk and interest rates. The Group’s overall risk management programme focuses on the unpredictability of fi nancial markets and seeks to minimise potential adverse effects on the Group’s fi nancial performance. The Group uses derivative fi nancial instruments to hedge certain risk exposures.
The use of fi nancial derivatives is governed by the Group’s policies approved by the Board of Directors, which provide written principles on the use of fi nancial derivatives consistent with the Group’s risk management strategy. The signifi cant interest rate risk arises from bank loans. The Group’s policy is to convert a proportion of its fl oating rate debt to fi xed rates. The Group designates some of these as cash fl ow hedges of interest rate risk. The Group does not use derivative fi nancial instruments for speculative purposes.
(i) Credit riskCredit risk refers to the risk that a counterparty will default on its contractual obligations resulting in fi nancial loss to the Group. The Group has no signifi cant concentrations of credit risk. Credit risk with respect to trade receivables is limited due to the large number of tenants included in the Group’s property rental portfolio. Derivative counterparties and cash transactions are limited to high credit quality fi nancial institutions. The Group has policies that limit the amount of credit exposure to any fi nancial institution.
(ii) Interest rate riskThe Group’s cash fl ow interest rate risk arises from long-term borrowings. Borrowings issued at variable rates expose the Group to cash fl ow interest rate risk. Borrowings issued at fi xed rates expose the Group to fair value interest rate risk. Group policy is to maintain a range
of approximately 70%–100% of its borrowings in fi xed rate instruments, unless instructed otherwise by the Board. At 31 March 2011, 56.50% (2010: 65%) of borrowings were at fi xed rates.
The Group manages its cash fl ow interest rate risk by using fl oating-to-fi xed interest rate swaps. Such interest rate swaps have the economic effect of converting borrowings from fl oating rates to fi xed rates. Under the interest rate swaps, the Group agrees with other parties to exchange, at specifi ed intervals (quarterly), the difference between fi xed contract rates and fl oating rate interest amounts calculated by reference to the agreed notional principal amounts.
(iii) Liquidity riskPrudent liquidity risk management implies maintaining suffi cient cash and cash equivalents, the availability of funding through an adequate amount of committed credit facilities and the ability to close out market position. Group Treasury aims to maintain fl exibility in funding by keeping committed credit lines available (note 15).
MATURITY PROFILE OF FINANCIAL INSTRUMENTS
The following fi nancial assets and liabilities which potentially subject the Group and the Trust to fi nancial risk have been recognised in the fi nancial statements. The tables below have been drawn up based on undiscounted cash fl ows of fi nancial liabilities based on the earliest date on which the Trust and Group can be required to pay. The tables include both interest and principal cash fl ows.
The following table details the Group’s exposure to liquidity and interest rate risk as at 31 March 2011 as the contractual maturity of fi nancial instruments:
Financial liabilitiesRevolving credit facility 4.07%– ANZ National Bank Limited (10,499) (10,499) (260,384) – – – (281,382)– Hong Kong and Shanghai
Banking Corp (2,100) (2,100) (53,652) – – – (57,852)– Bank of New Zealand Limited (4,200) (4,200) (107,304) – – – (115,704)Trade and other payables (8,689) – – – – – (8,689)Derivative fi nancial instruments (9,629) (8,347) (6,928) (5,699) (3,381) (2,609) (36,593) (35,117) (25,146) (428,268) (5,699) (3,381) (2,609) (500,220)
The weighted average interest rate including line fee was 5.27%.
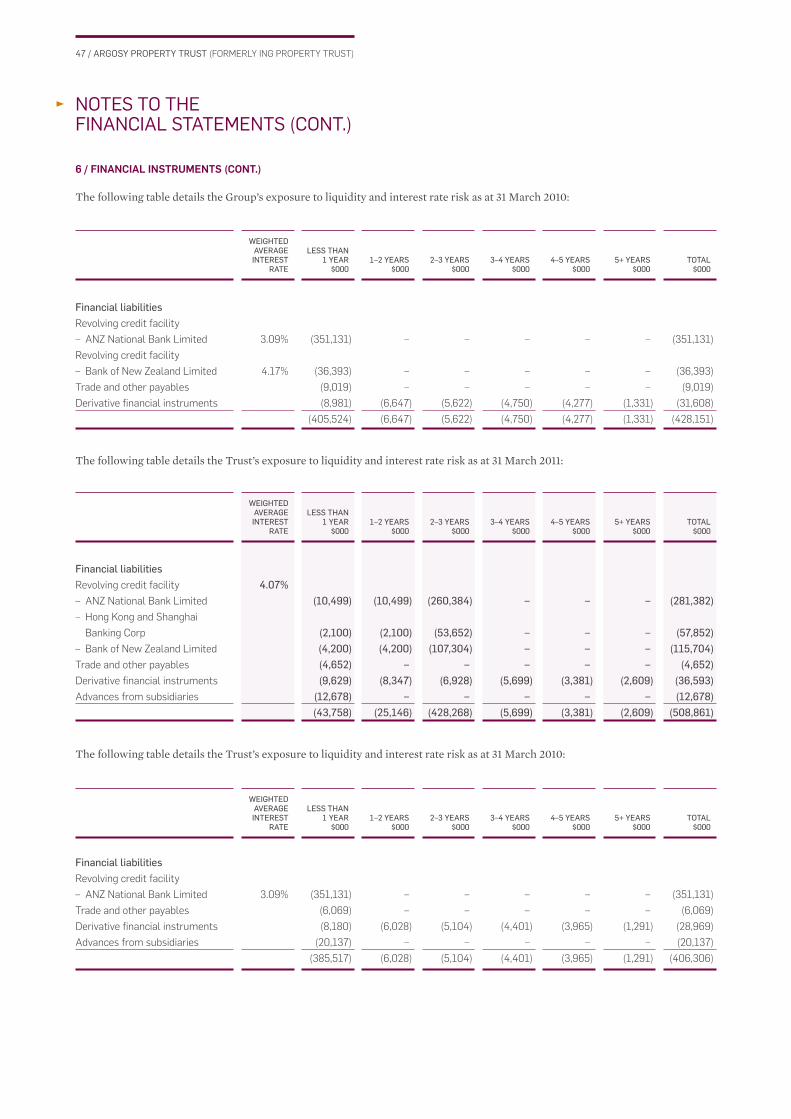
47 / ARGOSY PROPERTY TRUST (FORMERLY ING PROPERTY TRUST)
WEIGHTED AVERAGE INTEREST
RATE
LESS THAN 1 YEAR
$0001–2 YEARS
$0002–3 YEARS
$0003–4 YEARS
$0004–5 YEARS
$0005+ YEARS
$000TOTAL
$000
WEIGHTED AVERAGE INTEREST
RATE
LESS THAN 1 YEAR
$0001–2 YEARS
$0002–3 YEARS
$0003–4 YEARS
$0004–5 YEARS
$0005+ YEARS
$000TOTAL
$000
WEIGHTED AVERAGE INTEREST
RATE
LESS THAN 1 YEAR
$0001–2 YEARS
$0002–3 YEARS
$0003–4 YEARS
$0004–5 YEARS
$0005+ YEARS
$000TOTAL
$000
NOTES TO THEFINANCIAL STATEMENTS (CONT.)
6 / FINANCIAL INSTRUMENTS (CONT.)
The following table details the Group’s exposure to liquidity and interest rate risk as at 31 March 2010:
Financial liabilitiesRevolving credit facility
– ANZ National Bank Limited 3.09% (351,131) – – – – – (351,131)
Revolving credit facility
– Bank of New Zealand Limited 4.17% (36,393) – – – – – (36,393)
Trade and other payables (9,019) – – – – – (9,019)
Derivative fi nancial instruments (8,981) (6,647) (5,622) (4,750) (4,277) (1,331) (31,608)
(405,524) (6,647) (5,622) (4,750) (4,277) (1,331) (428,151)
The following table details the Trust’s exposure to liquidity and interest rate risk as at 31 March 2011:
Financial liabilitiesRevolving credit facility 4.07%– ANZ National Bank Limited (10,499) (10,499) (260,384) – – – (281,382)– Hong Kong and Shanghai
Banking Corp (2,100) (2,100) (53,652) – – – (57,852)– Bank of New Zealand Limited (4,200) (4,200) (107,304) – – – (115,704)Trade and other payables (4,652) – – – – – (4,652)Derivative fi nancial instruments (9,629) (8,347) (6,928) (5,699) (3,381) (2,609) (36,593)Advances from subsidiaries (12,678) – – – – – (12,678) (43,758) (25,146) (428,268) (5,699) (3,381) (2,609) (508,861)
The following table details the Trust’s exposure to liquidity and interest rate risk as at 31 March 2010:
Financial liabilitiesRevolving credit facility
– ANZ National Bank Limited 3.09% (351,131) – – – – – (351,131)
Trade and other payables (6,069) – – – – – (6,069)
Derivative fi nancial instruments (8,180) (6,028) (5,104) (4,401) (3,965) (1,291) (28,969)
Advances from subsidiaries (20,137) – – – – – (20,137)
(385,517) (6,028) (5,104) (4,401) (3,965) (1,291) (406,306)
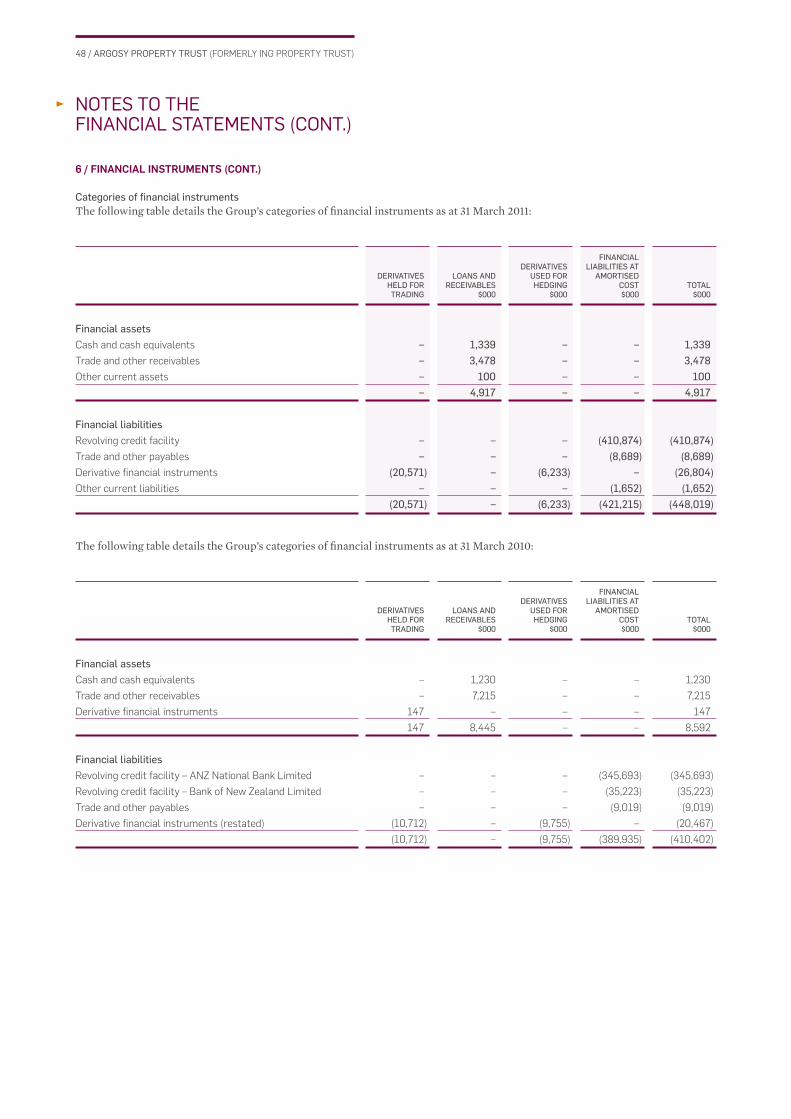
48 / ARGOSY PROPERTY TRUST (FORMERLY ING PROPERTY TRUST)
DERIVATIVES HELD FOR TRADING
LOANS AND RECEIVABLES
$000
DERIVATIVES USED FOR HEDGING
$000
FINANCIAL LIABILITIES AT
AMORTISED COST$000
TOTAL$000
DERIVATIVES HELD FOR TRADING
LOANS AND RECEIVABLES
$000
DERIVATIVES USED FOR HEDGING
$000
FINANCIAL LIABILITIES AT
AMORTISED COST$000
TOTAL$000
NOTES TO THEFINANCIAL STATEMENTS (CONT.)
6 / FINANCIAL INSTRUMENTS (CONT.)
Categories of fi nancial instrumentsThe following table details the Group’s categories of fi nancial instruments as at 31 March 2011:
Financial assetsCash and cash equivalents – 1,339 – – 1,339Trade and other receivables – 3,478 – – 3,478Other current assets – 100 – – 100 – 4,917 – – 4,917
Financial liabilitiesRevolving credit facility – – – (410,874) (410,874)Trade and other payables – – – (8,689) (8,689)Derivative fi nancial instruments (20,571) – (6,233) – (26,804)Other current liabilities – – – (1,652) (1,652) (20,571) – (6,233) (421,215) (448,019)
The following table details the Group’s categories of fi nancial instruments as at 31 March 2010:
Financial assetsCash and cash equivalents – 1,230 – – 1,230
Trade and other receivables – 7,215 – – 7,215
Derivative fi nancial instruments 147 – – – 147 147 8,445 – – 8,592
Financial liabilitiesRevolving credit facility – ANZ National Bank Limited – – – (345,693) (345,693)
Revolving credit facility – Bank of New Zealand Limited – – – (35,223) (35,223)
Trade and other payables – – – (9,019) (9,019)
Derivative fi nancial instruments (restated) (10,712) – (9,755) – (20,467)
(10,712) – (9,755) (389,935) (410,402)
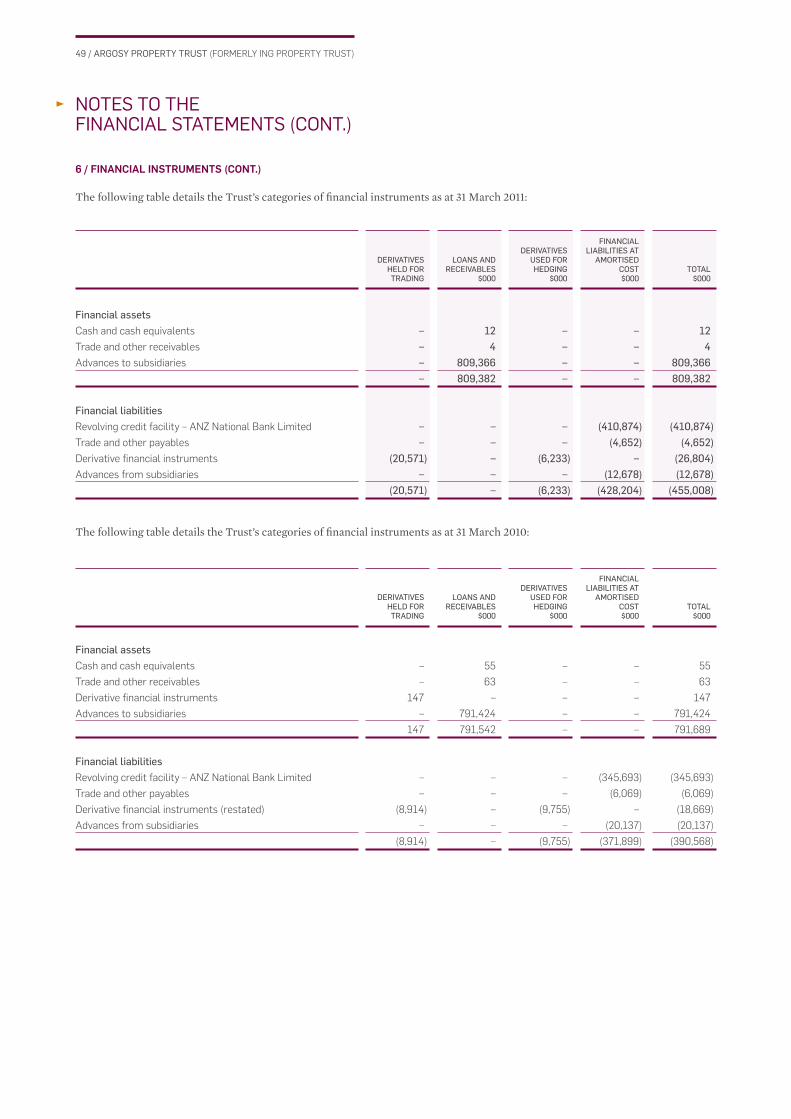
49 / ARGOSY PROPERTY TRUST (FORMERLY ING PROPERTY TRUST)
DERIVATIVES HELD FOR TRADING
LOANS AND RECEIVABLES
$000
DERIVATIVES USED FOR HEDGING
$000
FINANCIAL LIABILITIES AT
AMORTISED COST$000
TOTAL$000
DERIVATIVES HELD FOR TRADING
LOANS AND RECEIVABLES
$000
DERIVATIVES USED FOR HEDGING
$000
FINANCIAL LIABILITIES AT
AMORTISED COST$000
TOTAL$000
NOTES TO THEFINANCIAL STATEMENTS (CONT.)
6 / FINANCIAL INSTRUMENTS (CONT.)
The following table details the Trust’s categories of fi nancial instruments as at 31 March 2011:
Financial assetsCash and cash equivalents – 12 – – 12Trade and other receivables – 4 – – 4Advances to subsidiaries – 809,366 – – 809,366 – 809,382 – – 809,382
Financial liabilitiesRevolving credit facility – ANZ National Bank Limited – – – (410,874) (410,874)Trade and other payables – – – (4,652) (4,652)Derivative fi nancial instruments (20,571) – (6,233) – (26,804)Advances from subsidiaries – – – (12,678) (12,678) (20,571) – (6,233) (428,204) (455,008)
The following table details the Trust’s categories of fi nancial instruments as at 31 March 2010:
Financial assetsCash and cash equivalents – 55 – – 55
Trade and other receivables – 63 – – 63
Derivative fi nancial instruments 147 – – – 147
Advances to subsidiaries – 791,424 – – 791,424
147 791,542 – – 791,689
Financial liabilitiesRevolving credit facility – ANZ National Bank Limited – – – (345,693) (345,693)
Trade and other payables – – – (6,069) (6,069)
Derivative fi nancial instruments (restated) (8,914) – (9,755) – (18,669)
Advances from subsidiaries – – – (20,137) (20,137)
(8,914) – (9,755) (371,899) (390,568)
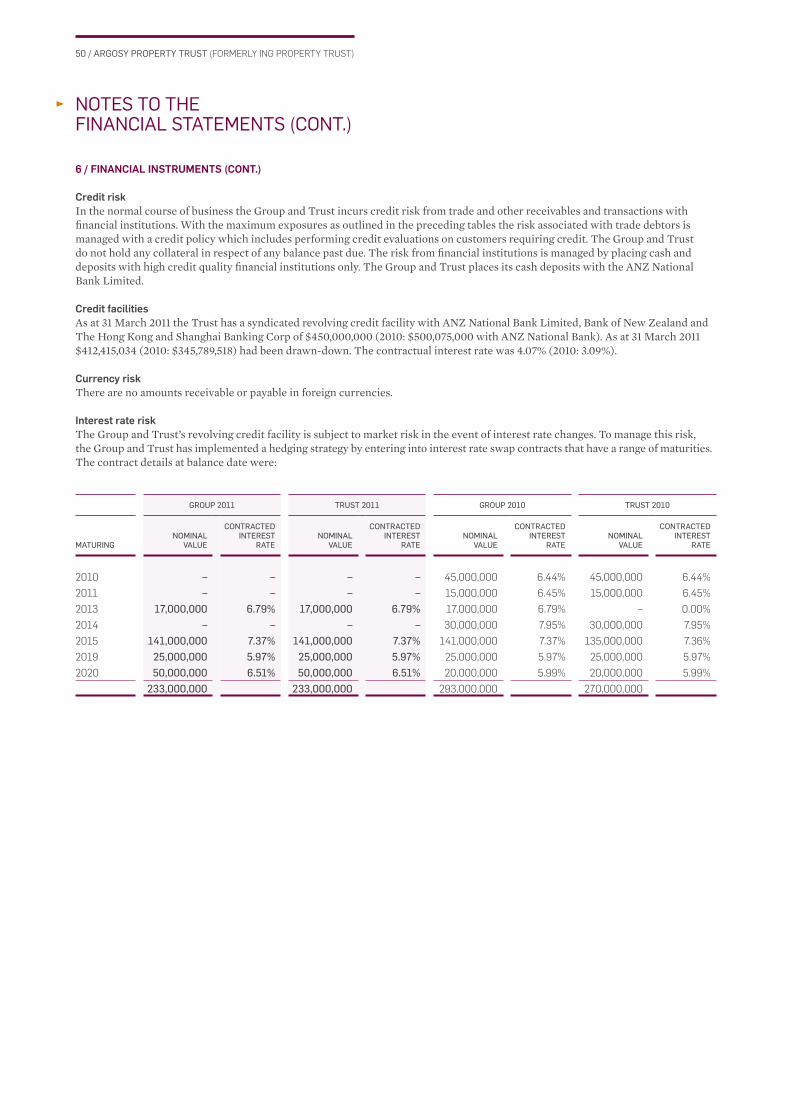
50 / ARGOSY PROPERTY TRUST (FORMERLY ING PROPERTY TRUST)
GROUP 2011 TRUST 2011 GROUP 2010 TRUST 2010
MATURINGNOMINAL
VALUE
CONTRACTED INTEREST
RATENOMINAL
VALUE
CONTRACTED INTEREST
RATENOMINAL
VALUE
CONTRACTED INTEREST
RATENOMINAL
VALUE
CONTRACTED INTEREST
RATE
NOTES TO THEFINANCIAL STATEMENTS (CONT.)
6 / FINANCIAL INSTRUMENTS (CONT.)
Credit riskIn the normal course of business the Group and Trust incurs credit risk from trade and other receivables and transactions with fi nancial institutions. With the maximum exposures as outlined in the preceding tables the risk associated with trade debtors is managed with a credit policy which includes performing credit evaluations on customers requiring credit. The Group and Trust do not hold any collateral in respect of any balance past due. The risk from fi nancial institutions is managed by placing cash and deposits with high credit quality fi nancial institutions only. The Group and Trust places its cash deposits with the ANZ National Bank Limited.
Credit facilitiesAs at 31 March 2011 the Trust has a syndicated revolving credit facility with ANZ National Bank Limited, Bank of New Zealand and The Hong Kong and Shanghai Banking Corp of $450,000,000 (2010: $500,075,000 with ANZ National Bank). As at 31 March 2011 $412,415,034 (2010: $345,789,518) had been drawn-down. The contractual interest rate was 4.07% (2010: 3.09%).
Currency riskThere are no amounts receivable or payable in foreign currencies.
Interest rate riskThe Group and Trust’s revolving credit facility is subject to market risk in the event of interest rate changes. To manage this risk, the Group and Trust has implemented a hedging strategy by entering into interest rate swap contracts that have a range of maturities. The contract details at balance date were:
2010 – – – – 45,000,000 6.44% 45,000,000 6.44%
2011 – – – – 15,000,000 6.45% 15,000,000 6.45%
2013 17,000,000 6.79% 17,000,000 6.79% 17,000,000 6.79% – 0.00%
2014 – – – – 30,000,000 7.95% 30,000,000 7.95%
2015 141,000,000 7.37% 141,000,000 7.37% 141,000,000 7.37% 135,000,000 7.36%
2019 25,000,000 5.97% 25,000,000 5.97% 25,000,000 5.97% 25,000,000 5.97%
2020 50,000,000 6.51% 50,000,000 6.51% 20,000,000 5.99% 20,000,000 5.99%
233,000,000 233,000,000 293,000,000 270,000,000
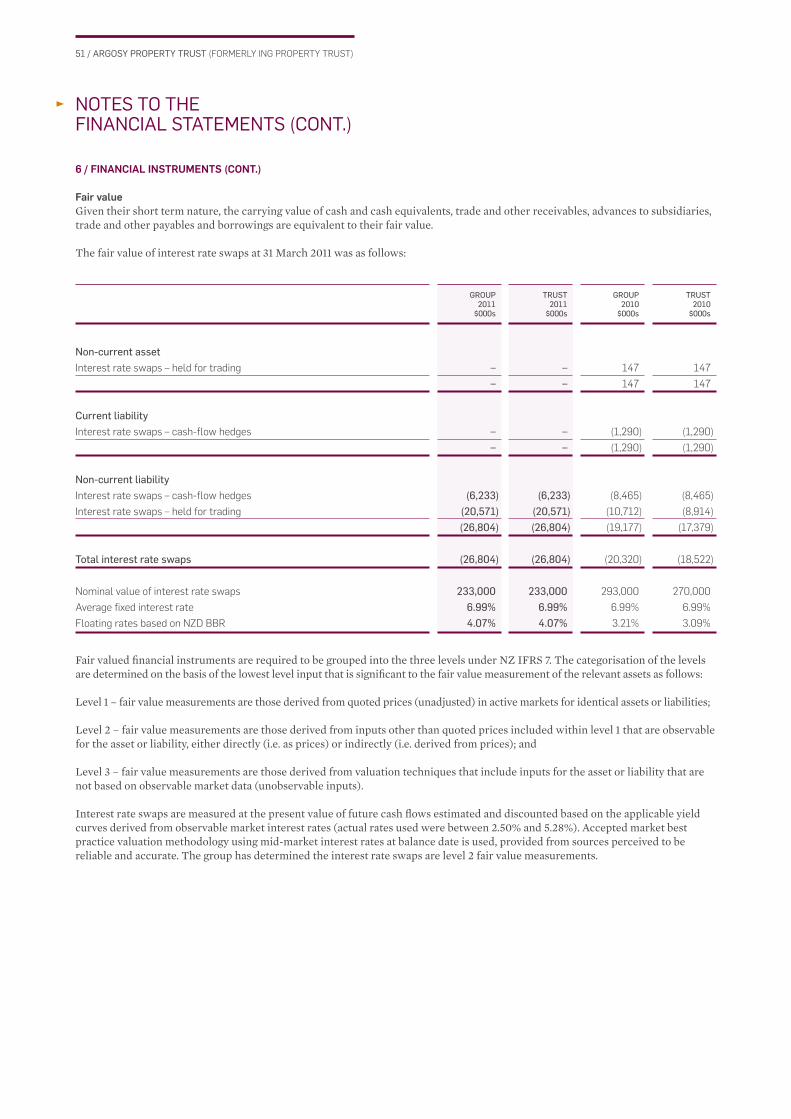
51 / ARGOSY PROPERTY TRUST (FORMERLY ING PROPERTY TRUST)
GROUP2011
$000s
TRUST2011
$000s
GROUP2010
$000s
TRUST2010
$000s
NOTES TO THEFINANCIAL STATEMENTS (CONT.)
6 / FINANCIAL INSTRUMENTS (CONT.)
Fair valueGiven their short term nature, the carrying value of cash and cash equivalents, trade and other receivables, advances to subsidiaries, trade and other payables and borrowings are equivalent to their fair value.
The fair value of interest rate swaps at 31 March 2011 was as follows:
Non-current assetInterest rate swaps – held for trading – – 147 147
– – 147 147
Current liabilityInterest rate swaps – cash-fl ow hedges – – (1,290) (1,290)
– – (1,290) (1,290)
Non-current liabilityInterest rate swaps – cash-fl ow hedges (6,233) (6,233) (8,465) (8,465)
Interest rate swaps – held for trading (20,571) (20,571) (10,712) (8,914)
(26,804) (26,804) (19,177) (17,379)
Total interest rate swaps (26,804) (26,804) (20,320) (18,522)
Nominal value of interest rate swaps 233,000 233,000 293,000 270,000
Average fi xed interest rate 6.99% 6.99% 6.99% 6.99%
Floating rates based on NZD BBR 4.07% 4.07% 3.21% 3.09%
Fair valued fi nancial instruments are required to be grouped into the three levels under NZ IFRS 7. The categorisation of the levels are determined on the basis of the lowest level input that is signifi cant to the fair value measurement of the relevant assets as follows:
Level 1 – fair value measurements are those derived from quoted prices (unadjusted) in active markets for identical assets or liabilities;
Level 2 – fair value measurements are those derived from inputs other than quoted prices included within level 1 that are observable for the asset or liability, either directly (i.e. as prices) or indirectly (i.e. derived from prices); and
Level 3 – fair value measurements are those derived from valuation techniques that include inputs for the asset or liability that are not based on observable market data (unobservable inputs).
Interest rate swaps are measured at the present value of future cash fl ows estimated and discounted based on the applicable yield curves derived from observable market interest rates (actual rates used were between 2.50% and 5.28%). Accepted market best practice valuation methodology using mid-market interest rates at balance date is used, provided from sources perceived to be reliable and accurate. The group has determined the interest rate swaps are level 2 fair value measurements.

52 / ARGOSY PROPERTY TRUST (FORMERLY ING PROPERTY TRUST)
TOTAL$000s
LEVEL 1$000s
LEVEL 2$000s
LEVEL 3$000s
TOTAL$000s
LEVEL 1$000s
LEVEL 2$000s
LEVEL 3$000s
NOTES TO THEFINANCIAL STATEMENTS (CONT.)
6 / FINANCIAL INSTRUMENTS (CONT.)
The following table provides an analysis of fi nancial instruments that are measured subsequent to initial recognition at fair value.
The Group’s fi nancial assets as at 31 March 2011
Interest rate swaps – – – –Total – – – –
The Group’s fi nancial liabilities as at 31 March 2011
Interest rate swaps 26,804 – 26,804 –Total 26,804 – 26,804 –
The Trust’s fi nancial assets as at 31 March 2011
Interest rate swaps – – – –Total – – – –
The Trust’s fi nancial liabilities as at 31 March 2011
Interest rate swaps 26,804 – 26,804 –Total 26,804 – 26,804 –
There have been no transfers during the year between levels 1 and 2 (2010: nil).
The following table provides an analysis of fi nancial instruments that are measured subsequent to initial recognition at fair value.
The Group’s fi nancial assets as at 31 March 2010
Interest rate swaps 147 – 147 –
Total 147 – 147 –
The Group’s fi nancial liabilities as at 31 March 2010
Interest rate swaps 20,467 – 20,467 –
Total 20,467 – 20,467 –
The Trust’s fi nancial assets as at 31 March 2010
Interest rate swaps 147 – 147 –
Total 147 – 147 –
The Trust’s fi nancial liabilities as at 31 March 2010
Interest rate swaps 18,669 – 18,669 –
Total 18,669 – 18,669 –
There have been no transfers during the year between levels 1 and 2.
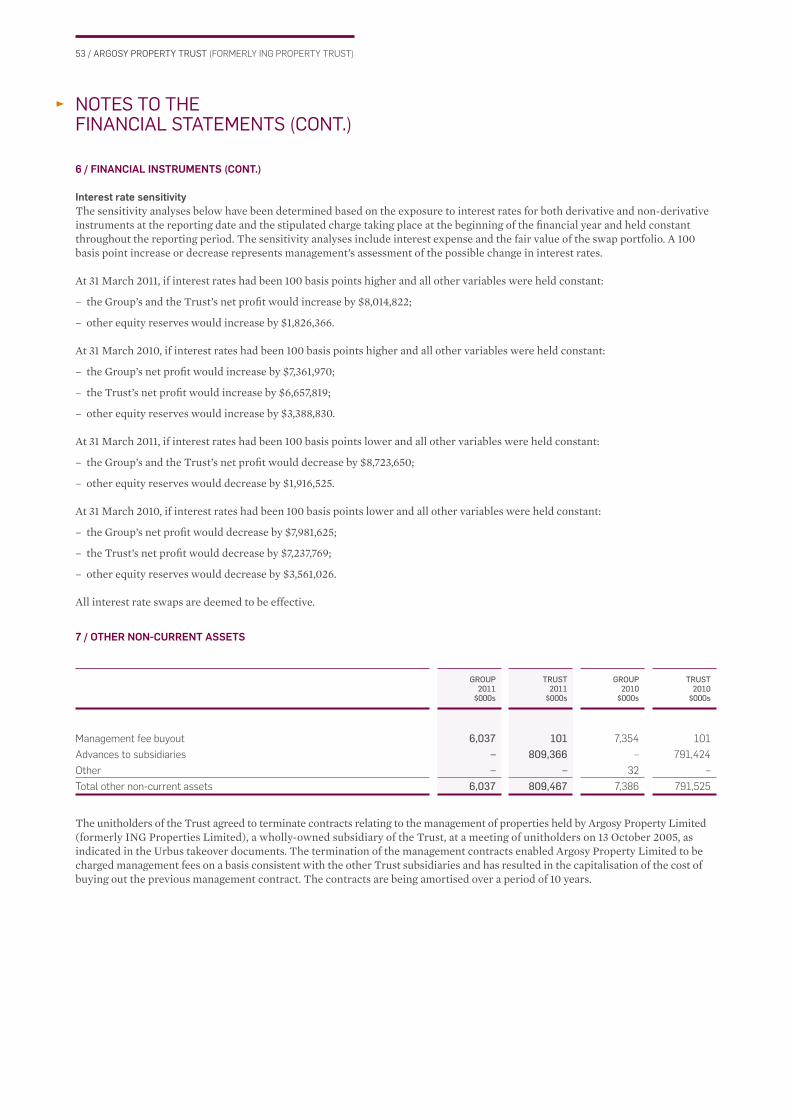
53 / ARGOSY PROPERTY TRUST (FORMERLY ING PROPERTY TRUST)
GROUP2011
$000s
TRUST2011
$000s
GROUP2010
$000s
TRUST2010
$000s
NOTES TO THEFINANCIAL STATEMENTS (CONT.)
6 / FINANCIAL INSTRUMENTS (CONT.)
Interest rate sensitivityThe sensitivity analyses below have been determined based on the exposure to interest rates for both derivative and non-derivative instruments at the reporting date and the stipulated charge taking place at the beginning of the fi nancial year and held constant throughout the reporting period. The sensitivity analyses include interest expense and the fair value of the swap portfolio. A 100 basis point increase or decrease represents management’s assessment of the possible change in interest rates.
At 31 March 2011, if interest rates had been 100 basis points higher and all other variables were held constant:
– the Group’s and the Trust’s net profi t would increase by $8,014,822;
– other equity reserves would increase by $1,826,366.
At 31 March 2010, if interest rates had been 100 basis points higher and all other variables were held constant:
– the Group’s net profi t would increase by $7,361,970;
– the Trust’s net profi t would increase by $6,657,819;
– other equity reserves would increase by $3,388,830.
At 31 March 2011, if interest rates had been 100 basis points lower and all other variables were held constant:
– the Group’s and the Trust’s net profi t would decrease by $8,723,650;
– other equity reserves would decrease by $1,916,525.
At 31 March 2010, if interest rates had been 100 basis points lower and all other variables were held constant:
– the Group’s net profi t would decrease by $7,981,625;
– the Trust’s net profi t would decrease by $7,237,769;
– other equity reserves would decrease by $3,561,026.
All interest rate swaps are deemed to be effective.
7 / OTHER NON-CURRENT ASSETS
Management fee buyout 6,037 101 7,354 101
Advances to subsidiaries – 809,366 – 791,424
Other – – 32 –
Total other non-current assets 6,037 809,467 7,386 791,525
The unitholders of the Trust agreed to terminate contracts relating to the management of properties held by Argosy Property Limited (formerly ING Properties Limited), a wholly-owned subsidiary of the Trust, at a meeting of unitholders on 13 October 2005, as indicated in the Urbus takeover documents. The termination of the management contracts enabled Argosy Property Limited to be charged management fees on a basis consistent with the other Trust subsidiaries and has resulted in the capitalisation of the cost of buying out the previous management contract. The contracts are being amortised over a period of 10 years.
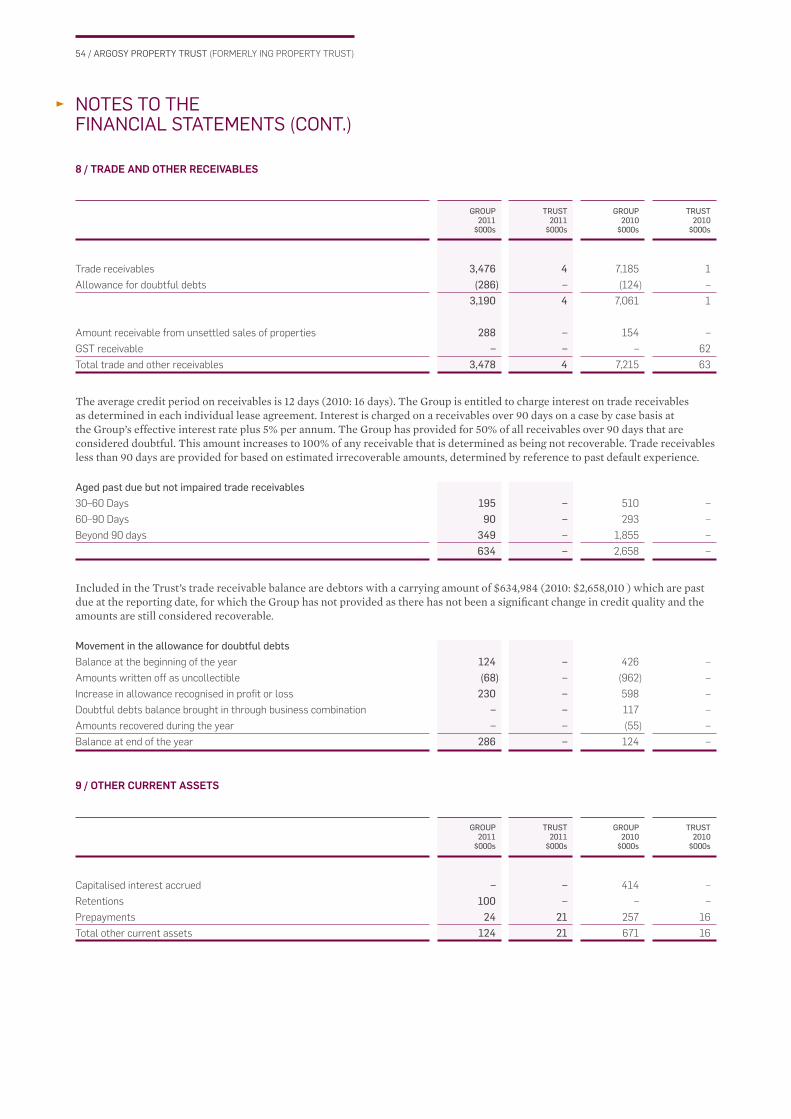
54 / ARGOSY PROPERTY TRUST (FORMERLY ING PROPERTY TRUST)
GROUP2011
$000s
TRUST2011
$000s
GROUP2010
$000s
TRUST2010
$000s
GROUP2011
$000s
TRUST2011
$000s
GROUP2010
$000s
TRUST2010
$000s
NOTES TO THEFINANCIAL STATEMENTS (CONT.)
8 / TRADE AND OTHER RECEIVABLES
Trade receivables 3,476 4 7,185 1
Allowance for doubtful debts (286) – (124) –
3,190 4 7,061 1
Amount receivable from unsettled sales of properties 288 – 154 –
GST receivable – – – 62
Total trade and other receivables 3,478 4 7,215 63
The average credit period on receivables is 12 days (2010: 16 days). The Group is entitled to charge interest on trade receivables as determined in each individual lease agreement. Interest is charged on a receivables over 90 days on a case by case basis at the Group’s effective interest rate plus 5% per annum. The Group has provided for 50% of all receivables over 90 days that are considered doubtful. This amount increases to 100% of any receivable that is determined as being not recoverable. Trade receivables less than 90 days are provided for based on estimated irrecoverable amounts, determined by reference to past default experience.
Aged past due but not impaired trade receivables30–60 Days 195 – 510 –
60–90 Days 90 – 293 –
Beyond 90 days 349 – 1,855 –
634 – 2,658 –
Included in the Trust’s trade receivable balance are debtors with a carrying amount of $634,984 (2010: $2,658,010 ) which are past due at the reporting date, for which the Group has not provided as there has not been a signifi cant change in credit quality and the amounts are still considered recoverable.
Movement in the allowance for doubtful debtsBalance at the beginning of the year 124 – 426 –
Amounts written off as uncollectible (68) – (962) –
Increase in allowance recognised in profi t or loss 230 – 598 –
Doubtful debts balance brought in through business combination – – 117 –
Amounts recovered during the year – – (55) –
Balance at end of the year 286 – 124 –
9 / OTHER CURRENT ASSETS
Capitalised interest accrued – – 414 –
Retentions 100 – – –
Prepayments 24 21 257 16
Total other current assets 124 21 671 16

55 / ARGOSY PROPERTY TRUST (FORMERLY ING PROPERTY TRUST)
GROUP2011
$000s
TRUST2011
$000s
GROUP2010
$000s
TRUST2010
$000s
Property Address Tenant Expected settlement date
NOTES TO THEFINANCIAL STATEMENTS (CONT.)
10 / PROPERTY HELD FOR SALE
Five industrial investment properties (2010: 308 Port Hills Road, Port Hills, Christchurch) were subject to a sale and purchase agreement at balance date. The valuation of the properties were based on the agreed purchase price which approximates to its fair value at 31 March 2011.
Five industrial investment properties held for sale during the year are as follows:
6 Zelanian Drive, East Tamaki, Auckland Greenmark Wholesaler (NZ) Limited August 2011
17 El Prado Drive, Palmerston North Allfl ex New Zealand Limited April 2011
34 El Prado Drive, Palmerston North Fliway Transport Limited April 2011
3 El Prado Drive, Palmerston North Hooker Bros Holdings Limited April 2011
57–59 Valor Drive, Palmerston North Vestas NZ Wind Technology Limited April 2011
11 / UNITS ON ISSUE
Balance at the beginning of the year 538,282 538,282 531,574 531,574
Issue of units from Dividend Reinvestment Plan 6,800 6,800 6,729 6,729
Issue costs of units (12) (12) (21) (21)
Total units on issue 545,070 545,070 538,282 538,282
The number of units on issue at 31 March 2011 was 549,185,785 (2010: 539,328,036). The units have no par value and are fully paid. Fully paid ordinary units carry one vote per unit and carry the right to distributions.
(in thousands of units)Balance at the beginning of the year 539,328 539,328 529,704 529,704
Issue of units from Dividend Reinvestment Plan 9,858 9,858 9,624 9,624
Total number of units on issue 549,186 549,186 539,328 539,328
Capital risk managementThe Group’s capital includes units, reserves and retained earnings with total unitholders’ funds sitting at $511.7m (Restated 2010: $526.6m).
The Group maintains a strong capital base so as to maintain investor, creditor and market confi dence and to sustain the Group’s future on-going activities and development of the business. The impact of the level of capital on Unitholder returns is also recognised along with the need to maintain a balance between the higher returns that might be possible with greater gearing and the advantages and security afforded by a sound capital position.
The Group is subject to imposed capital requirements arising from the Trust Deed, which requires the total borrowings to not exceed 50% of the gross value of the Trust.
The Group’s banking covenants require that the aggregate principal amount of the loan outstanding does not exceed 45% of the fair value of property at all times. All banking covenants have been met during the year.
The Group manages its capital to ensure that entities in the Group will be able to continue as a going concern while maximising the return to stakeholders through the optimisation of the debt and equity balance. The Group’s policies in respect of capital management and allocation are reviewed regularly by the Board of Directors. There have been no material changes in the Group’s overall strategy during the year.

56 / ARGOSY PROPERTY TRUST (FORMERLY ING PROPERTY TRUST)
GROUP2011
$000s
TRUST2011
$000s
GROUP2010
$000s
TRUST2010
$000s
GROUP2011
$000s
TRUST2011
$000s
GROUP(RESTATED)
2010$000s
TRUST2010
$000s
GROUP &TRUST
2011CPU
GROUP &TRUST
2010CPU
NOTES TO THEFINANCIAL STATEMENTS (CONT.)
12 / HEDGING RESERVES
Balance at the beginning of the year (9,525) (9,525) (23,027) (23,027)
Gain on revaluation of cashfl ow hedges (50) (50) 1,684 1,684
Transferred to fi nance expense 1,215 1,215 101 101
Loss/(gain) arising from ineffective interest rate swaps transferred
to fi nance expense – – 17,504 17,504
Effect on reserve balance due to change in income tax rate from 30% to 28% (248) (248) – –
Tax on fair value (losses)/gains on cashfl ow hedges (350) (350) (5,787) (5,787)
Total hedging reserves (8,958) (8,958) (9,525) (9,525)
The hedging reserve represents hedging gains and losses recognised on the effective portion of cash fl ow hedges. The cumulative deferred gain or loss on the hedge is recognised in profi t or loss when the hedged transaction impacts the profi t or loss, or is included as a basis adjustment to the non-fi nancial hedged item, consistent with the applicable accounting policy.
13 / RETAINED EARNINGS
Balance at the beginning of the year (13,819) (115,864) 68,529 (66,522)
Effect of changes in the accounting for deferred taxation – – 16,682 –
As restated (13,819) (115,864) 85,211 (66,522)
Profi t/(loss) for the year 26,335 7,658 (58,975) (9,287)
Distributions to unitholders (38,769) (38,769) (40,055) (40,055)
Discount on purchase of minority interest 1,873 – – –
Total retained earnings (24,380) (146,975) (13,819) (115,864)
DISTRIBUTIONS TO UNITHOLDERS
Interim 5.25 5.63
Imputation credits 0.19 0.52
5.44 6.15
Final 1.75 1.87
Imputation credits – –
1.75 1.87
Total 7.00 7.50
Imputation credits 0.19 0.52
7.19 8.02
After 31 March 2011 the fi nal distribution was declared by the Directors. The distribution has not been provided for and there are no income tax consequences.
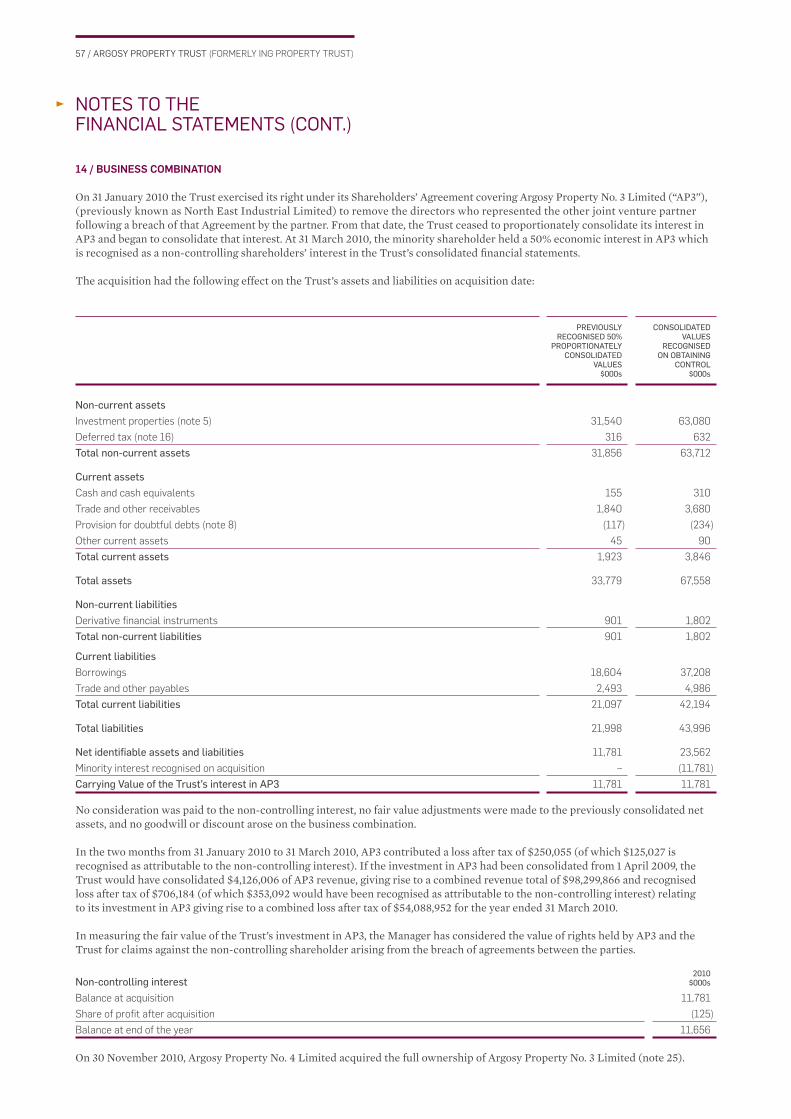
57 / ARGOSY PROPERTY TRUST (FORMERLY ING PROPERTY TRUST)
PREVIOUSLY RECOGNISED 50%
PROPORTIONATELY CONSOLIDATED
VALUES$000s
CONSOLIDATED VALUES
RECOGNISED ON OBTAINING
CONTROL$000s
NOTES TO THEFINANCIAL STATEMENTS (CONT.)
14 / BUSINESS COMBINATION
On 31 January 2010 the Trust exercised its right under its Shareholders’ Agreement covering Argosy Property No. 3 Limited (“AP3”), (previously known as North East Industrial Limited) to remove the directors who represented the other joint venture partner following a breach of that Agreement by the partner. From that date, the Trust ceased to proportionately consolidate its interest in AP3 and began to consolidate that interest. At 31 March 2010, the minority shareholder held a 50% economic interest in AP3 which is recognised as a non-controlling shareholders’ interest in the Trust’s consolidated fi nancial statements.
The acquisition had the following effect on the Trust’s assets and liabilities on acquisition date:
Non-current assetsInvestment properties (note 5) 31,540 63,080
Deferred tax (note 16) 316 632
Total non-current assets 31,856 63,712
Current assetsCash and cash equivalents 155 310
Trade and other receivables 1,840 3,680
Provision for doubtful debts (note 8) (117) (234)
Other current assets 45 90
Total current assets 1,923 3,846
Total assets 33,779 67,558
Non-current liabilitiesDerivative fi nancial instruments 901 1,802
Total non-current liabilities 901 1,802
Current liabilitiesBorrowings 18,604 37,208
Trade and other payables 2,493 4,986
Total current liabilities 21,097 42,194
Total liabilities 21,998 43,996
Net identifi able assets and liabilities 11,781 23,562
Minority interest recognised on acquisition – (11,781)
Carrying Value of the Trust’s interest in AP3 11,781 11,781
No consideration was paid to the non-controlling interest, no fair value adjustments were made to the previously consolidated net assets, and no goodwill or discount arose on the business combination.
In the two months from 31 January 2010 to 31 March 2010, AP3 contributed a loss after tax of $250,055 (of which $125,027 is recognised as attributable to the non-controlling interest). If the investment in AP3 had been consolidated from 1 April 2009, the Trust would have consolidated $4,126,006 of AP3 revenue, giving rise to a combined revenue total of $98,299,866 and recognised loss after tax of $706,184 (of which $353,092 would have been recognised as attributable to the non-controlling interest) relating to its investment in AP3 giving rise to a combined loss after tax of $54,088,952 for the year ended 31 March 2010.
In measuring the fair value of the Trust’s investment in AP3, the Manager has considered the value of rights held by AP3 and the Trust for claims against the non-controlling shareholder arising from the breach of agreements between the parties.
2010Non-controlling interest $000s
Balance at acquisition 11,781
Share of profi t after acquisition (125)
Balance at end of the year 11,656
On 30 November 2010, Argosy Property No. 4 Limited acquired the full ownership of Argosy Property No. 3 Limited (note 25).
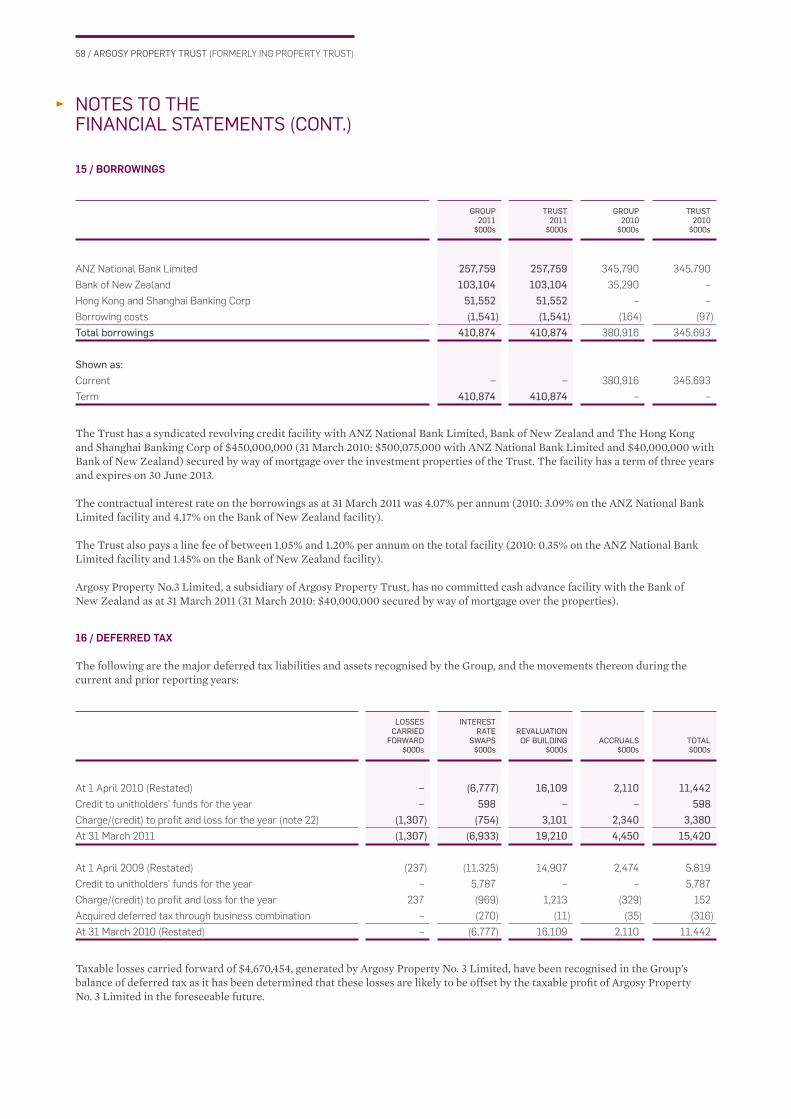
58 / ARGOSY PROPERTY TRUST (FORMERLY ING PROPERTY TRUST)
GROUP2011
$000s
TRUST2011
$000s
GROUP2010
$000s
TRUST2010
$000s
LOSSES CARRIED
FORWARD$000s
INTEREST RATE
SWAPS$000s
REVALUATION OF BUILDING
$000sACCRUALS
$000sTOTAL$000s
NOTES TO THEFINANCIAL STATEMENTS (CONT.)
15 / BORROWINGS
ANZ National Bank Limited 257,759 257,759 345,790 345,790
Bank of New Zealand 103,104 103,104 35,290 –
Hong Kong and Shanghai Banking Corp 51,552 51,552 – –
Borrowing costs (1,541) (1,541) (164) (97)
Total borrowings 410,874 410,874 380,916 345,693
Shown as:Current – – 380,916 345,693
Term 410,874 410,874 – –
The Trust has a syndicated revolving credit facility with ANZ National Bank Limited, Bank of New Zealand and The Hong Kong and Shanghai Banking Corp of $450,000,000 (31 March 2010: $500,075,000 with ANZ National Bank Limited and $40,000,000 with Bank of New Zealand) secured by way of mortgage over the investment properties of the Trust. The facility has a term of three years and expires on 30 June 2013.
The contractual interest rate on the borrowings as at 31 March 2011 was 4.07% per annum (2010: 3.09% on the ANZ National Bank Limited facility and 4.17% on the Bank of New Zealand facility).
The Trust also pays a line fee of between 1.05% and 1.20% per annum on the total facility (2010: 0.35% on the ANZ National Bank Limited facility and 1.45% on the Bank of New Zealand facility).
Argosy Property No.3 Limited, a subsidiary of Argosy Property Trust, has no committed cash advance facility with the Bank of New Zealand as at 31 March 2011 (31 March 2010: $40,000,000 secured by way of mortgage over the properties).
16 / DEFERRED TAX
The following are the major deferred tax liabilities and assets recognised by the Group, and the movements thereon during the current and prior reporting years:
At 1 April 2010 (Restated) – (6,777) 16,109 2,110 11,442Credit to unitholders’ funds for the year – 598 – – 598Charge/(credit) to profi t and loss for the year (note 22) (1,307) (754) 3,101 2,340 3,380At 31 March 2011 (1,307) (6,933) 19,210 4,450 15,420
At 1 April 2009 (Restated) (237) (11,325) 14,907 2,474 5,819
Credit to unitholders’ funds for the year – 5,787 – – 5,787
Charge/(credit) to profi t and loss for the year 237 (969) 1,213 (329) 152
Acquired deferred tax through business combination – (270) (11) (35) (316)
At 31 March 2010 (Restated) – (6,777) 16,109 2,110 11,442
Taxable losses carried forward of $4,670,454, generated by Argosy Property No. 3 Limited, have been recognised in the Group’s balance of deferred tax as it has been determined that these losses are likely to be offset by the taxable profi t of Argosy Property No. 3 Limited in the foreseeable future.
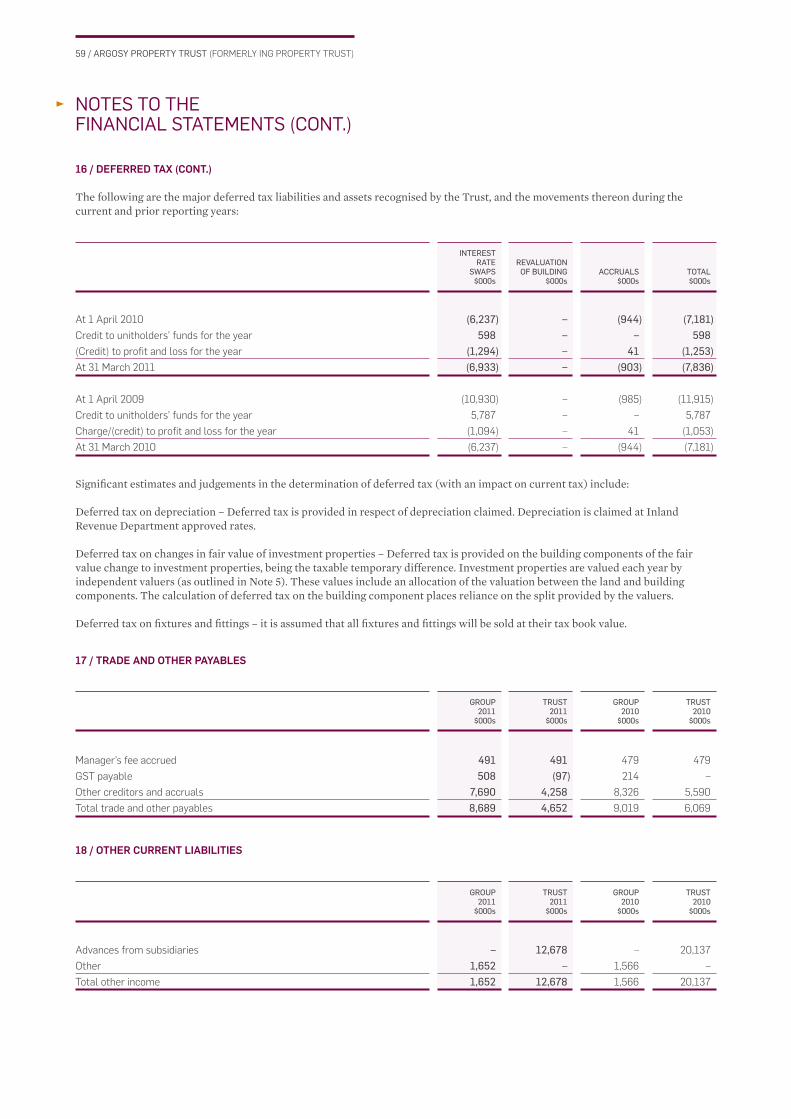
59 / ARGOSY PROPERTY TRUST (FORMERLY ING PROPERTY TRUST)
INTEREST RATE
SWAPS$000s
REVALUATION OF BUILDING
$000sACCRUALS
$000sTOTAL$000s
GROUP2011
$000s
TRUST2011
$000s
GROUP2010
$000s
TRUST2010
$000s
GROUP2011
$000s
TRUST2011
$000s
GROUP2010
$000s
TRUST2010
$000s
NOTES TO THEFINANCIAL STATEMENTS (CONT.)
16 / DEFERRED TAX (CONT.)
The following are the major deferred tax liabilities and assets recognised by the Trust, and the movements thereon during the current and prior reporting years:
At 1 April 2010 (6,237) – (944) (7,181)Credit to unitholders’ funds for the year 598 – – 598(Credit) to profi t and loss for the year (1,294) – 41 (1,253)At 31 March 2011 (6,933) – (903) (7,836)
At 1 April 2009 (10,930) – (985) (11,915)
Credit to unitholders’ funds for the year 5,787 – – 5,787
Charge/(credit) to profi t and loss for the year (1,094) – 41 (1,053)
At 31 March 2010 (6,237) – (944) (7,181)
Signifi cant estimates and judgements in the determination of deferred tax (with an impact on current tax) include:
Deferred tax on depreciation – Deferred tax is provided in respect of depreciation claimed. Depreciation is claimed at Inland Revenue Department approved rates.
Deferred tax on changes in fair value of investment properties – Deferred tax is provided on the building components of the fair value change to investment properties, being the taxable temporary difference. Investment properties are valued each year by independent valuers (as outlined in Note 5). These values include an allocation of the valuation between the land and building components. The calculation of deferred tax on the building component places reliance on the split provided by the valuers.
Deferred tax on fi xtures and fi ttings – it is assumed that all fi xtures and fi ttings will be sold at their tax book value.
17 / TRADE AND OTHER PAYABLES
Manager’s fee accrued 491 491 479 479
GST payable 508 (97) 214 –
Other creditors and accruals 7,690 4,258 8,326 5,590
Total trade and other payables 8,689 4,652 9,019 6,069
18 / OTHER CURRENT LIABILITIES
Advances from subsidiaries – 12,678 – 20,137
Other 1,652 – 1,566 –
Total other income 1,652 12,678 1,566 20,137
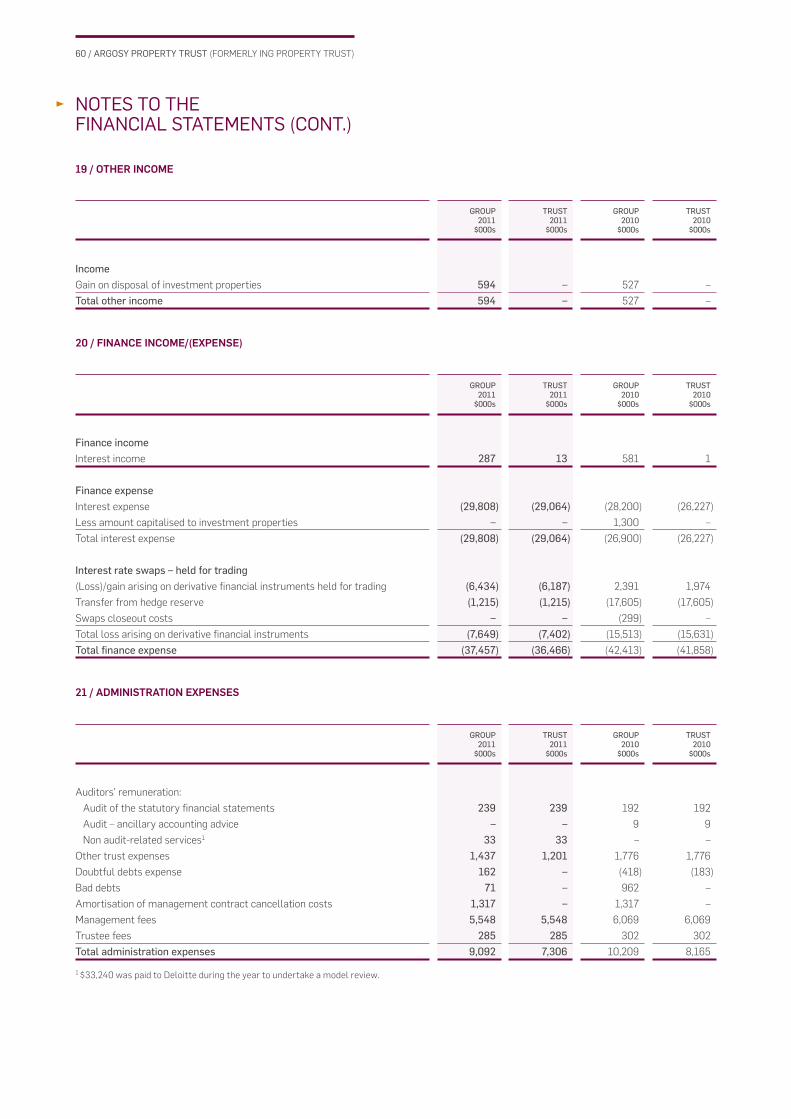
60 / ARGOSY PROPERTY TRUST (FORMERLY ING PROPERTY TRUST)
GROUP2011
$000s
TRUST2011
$000s
GROUP2010
$000s
TRUST2010
$000s
GROUP2011
$000s
TRUST2011
$000s
GROUP2010
$000s
TRUST2010
$000s
GROUP2011
$000s
TRUST2011
$000s
GROUP2010
$000s
TRUST2010
$000s
NOTES TO THEFINANCIAL STATEMENTS (CONT.)
19 / OTHER INCOME
IncomeGain on disposal of investment properties 594 – 527 –
Total other income 594 – 527 –
20 / FINANCE INCOME/(EXPENSE)
Finance incomeInterest income 287 13 581 1
Finance expenseInterest expense (29,808) (29,064) (28,200) (26,227)
Less amount capitalised to investment properties – – 1,300 –
Total interest expense (29,808) (29,064) (26,900) (26,227)
Interest rate swaps – held for trading(Loss)/gain arising on derivative fi nancial instruments held for trading (6,434) (6,187) 2,391 1,974
Transfer from hedge reserve (1,215) (1,215) (17,605) (17,605)
Swaps closeout costs – – (299) –
Total loss arising on derivative fi nancial instruments (7,649) (7,402) (15,513) (15,631)
Total fi nance expense (37,457) (36,466) (42,413) (41,858)
21 / ADMINISTRATION EXPENSES
Auditors’ remuneration:
Audit of the statutory fi nancial statements 239 239 192 192
Audit – ancillary accounting advice – – 9 9
Non audit-related services1 33 33 – –
Other trust expenses 1,437 1,201 1,776 1,776
Doubtful debts expense 162 – (418) (183)
Bad debts 71 – 962 –
Amortisation of management contract cancellation costs 1,317 – 1,317 –
Management fees 5,548 5,548 6,069 6,069
Trustee fees 285 285 302 302
Total administration expenses 9,092 7,306 10,209 8,165
1 $33,240 was paid to Deloitte during the year to undertake a model review.
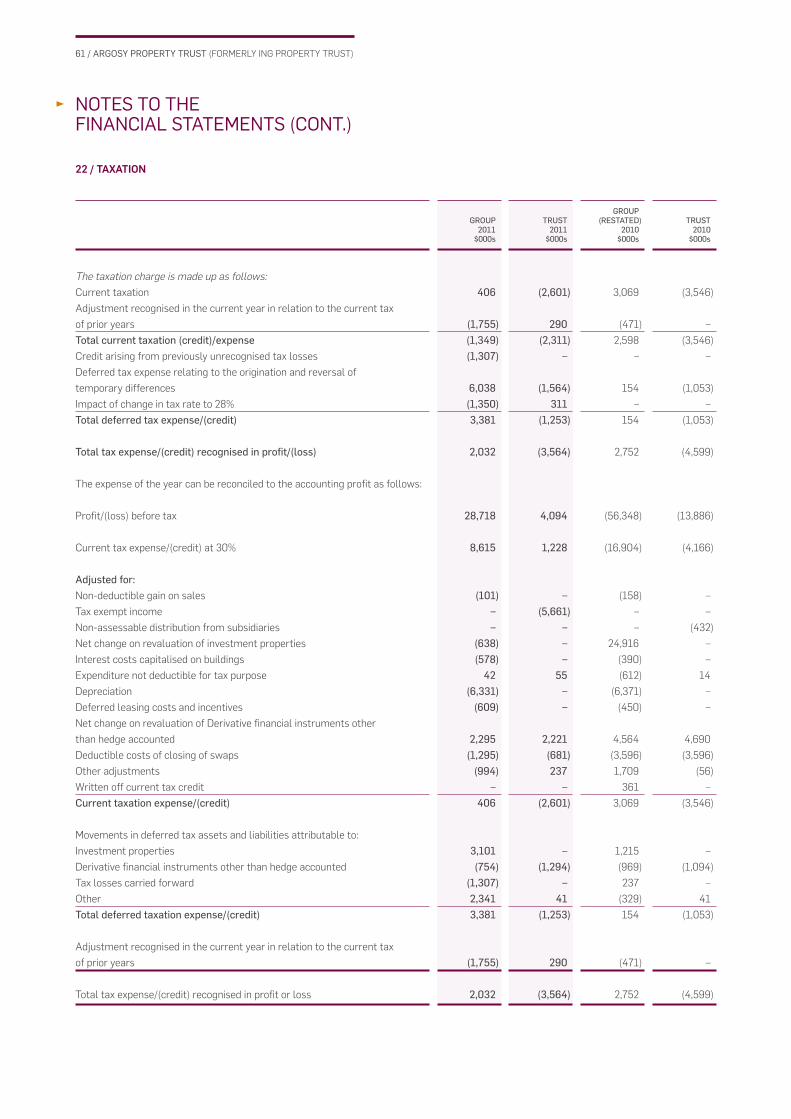
61 / ARGOSY PROPERTY TRUST (FORMERLY ING PROPERTY TRUST)
GROUP2011
$000s
TRUST2011
$000s
GROUP(RESTATED)
2010$000s
TRUST2010
$000s
NOTES TO THEFINANCIAL STATEMENTS (CONT.)
22 / TAXATION
The taxation charge is made up as follows:
Current taxation 406 (2,601) 3,069 (3,546)
Adjustment recognised in the current year in relation to the current tax
of prior years (1,755) 290 (471) –
Total current taxation (credit)/expense (1,349) (2,311) 2,598 (3,546)
Credit arising from previously unrecognised tax losses (1,307) – – –
Deferred tax expense relating to the origination and reversal of
temporary differences 6,038 (1,564) 154 (1,053)
Impact of change in tax rate to 28% (1,350) 311 – –
Total deferred tax expense/(credit) 3,381 (1,253) 154 (1,053)
Total tax expense/(credit) recognised in profi t/(loss) 2,032 (3,564) 2,752 (4,599)
The expense of the year can be reconciled to the accounting profi t as follows:
Profi t/(loss) before tax 28,718 4,094 (56,348) (13,886)
Current tax expense/(credit) at 30% 8,615 1,228 (16,904) (4,166)
Adjusted for:Non-deductible gain on sales (101) – (158) –
Tax exempt income – (5,661) – –
Non-assessable distribution from subsidiaries – – – (432)
Net change on revaluation of investment properties (638) – 24,916 –
Interest costs capitalised on buildings (578) – (390) –
Expenditure not deductible for tax purpose 42 55 (612) 14
Depreciation (6,331) – (6,371) –
Deferred leasing costs and incentives (609) – (450) –
Net change on revaluation of Derivative fi nancial instruments other
than hedge accounted 2,295 2,221 4,564 4,690
Deductible costs of closing of swaps (1,295) (681) (3,596) (3,596)
Other adjustments (994) 237 1,709 (56)
Written off current tax credit – – 361 –
Current taxation expense/(credit) 406 (2,601) 3,069 (3,546)
Movements in deferred tax assets and liabilities attributable to:
Investment properties 3,101 – 1,215 –
Derivative fi nancial instruments other than hedge accounted (754) (1,294) (969) (1,094)
Tax losses carried forward (1,307) – 237 –
Other 2,341 41 (329) 41
Total deferred taxation expense/(credit) 3,381 (1,253) 154 (1,053)
Adjustment recognised in the current year in relation to the current tax
of prior years (1,755) 290 (471) –
Total tax expense/(credit) recognised in profi t or loss 2,032 (3,564) 2,752 (4,599)
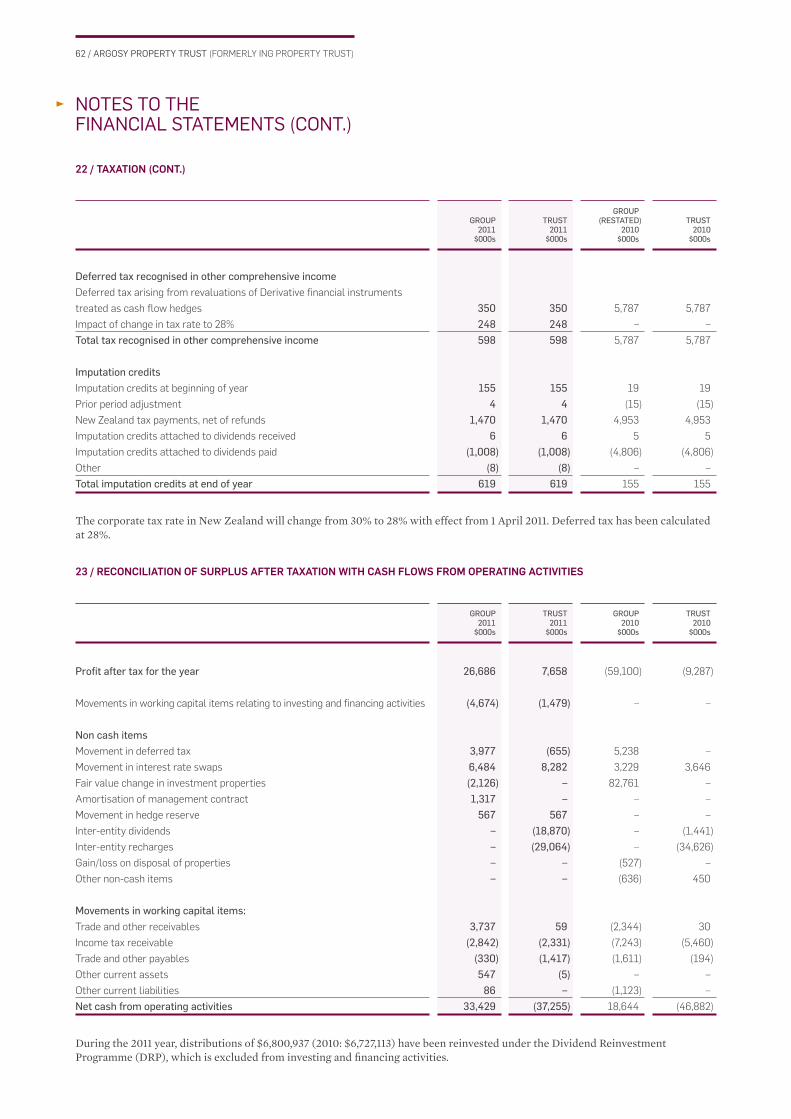
62 / ARGOSY PROPERTY TRUST (FORMERLY ING PROPERTY TRUST)
GROUP2011
$000s
TRUST2011
$000s
GROUP(RESTATED)
2010$000s
TRUST2010
$000s
GROUP2011
$000s
TRUST2011
$000s
GROUP2010
$000s
TRUST2010
$000s
NOTES TO THEFINANCIAL STATEMENTS (CONT.)
22 / TAXATION (CONT.)
Deferred tax recognised in other comprehensive incomeDeferred tax arising from revaluations of Derivative fi nancial instruments
treated as cash fl ow hedges 350 350 5,787 5,787
Impact of change in tax rate to 28% 248 248 – –
Total tax recognised in other comprehensive income 598 598 5,787 5,787
Imputation creditsImputation credits at beginning of year 155 155 19 19
Prior period adjustment 4 4 (15) (15)
New Zealand tax payments, net of refunds 1,470 1,470 4,953 4,953
Imputation credits attached to dividends received 6 6 5 5
Imputation credits attached to dividends paid (1,008) (1,008) (4,806) (4,806)
Other (8) (8) – –
Total imputation credits at end of year 619 619 155 155
The corporate tax rate in New Zealand will change from 30% to 28% with effect from 1 April 2011. Deferred tax has been calculated at 28%.
23 / RECONCILIATION OF SURPLUS AFTER TAXATION WITH CASH FLOWS FROM OPERATING ACTIVITIES
Profi t after tax for the year 26,686 7,658 (59,100) (9,287)
Movements in working capital items relating to investing and fi nancing activities (4,674) (1,479) – –
Non cash itemsMovement in deferred tax 3,977 (655) 5,238 –
Movement in interest rate swaps 6,484 8,282 3,229 3,646
Fair value change in investment properties (2,126) – 82,761 –
Amortisation of management contract 1,317 – – –
Movement in hedge reserve 567 567 – –
Inter-entity dividends – (18,870) – (1,441)
Inter-entity recharges – (29,064) – (34,626)
Gain/loss on disposal of properties – – (527) –
Other non-cash items – – (636) 450
Movements in working capital items:Trade and other receivables 3,737 59 (2,344) 30
Income tax receivable (2,842) (2,331) (7,243) (5,460)
Trade and other payables (330) (1,417) (1,611) (194)
Other current assets 547 (5) – –
Other current liabilities 86 – (1,123) –
Net cash from operating activities 33,429 (37,255) 18,644 (46,882)
During the 2011 year, distributions of $6,800,937 (2010: $6,727,113) have been reinvested under the Dividend Reinvestment Programme (DRP), which is excluded from investing and fi nancing activities.
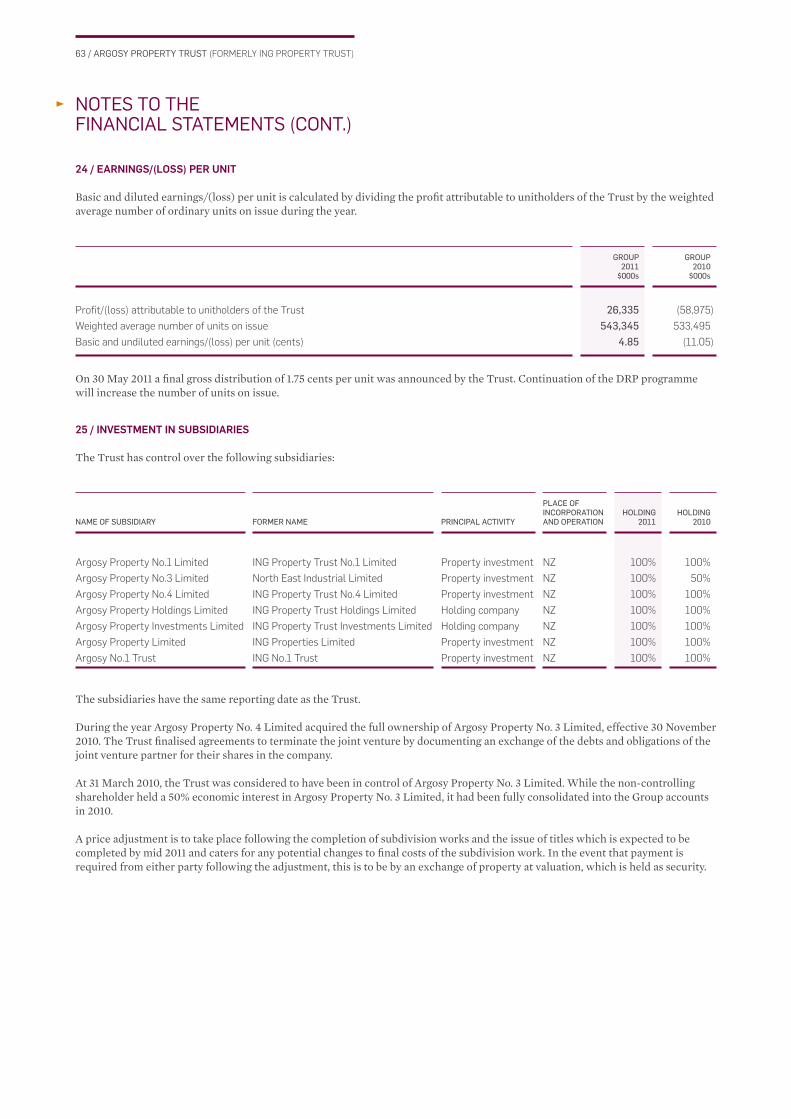
63 / ARGOSY PROPERTY TRUST (FORMERLY ING PROPERTY TRUST)
NAME OF SUBSIDIARY FORMER NAME PRINCIPAL ACTIVITY
PLACE OFINCORPORATION AND OPERATION
HOLDING2011
HOLDING2010
Argosy Property No.1 Limited ING Property Trust No.1 Limited Property investment NZ 100% 100%
Argosy Property No.3 Limited North East Industrial Limited Property investment NZ 100% 50%
Argosy Property No.4 Limited ING Property Trust No.4 Limited Property investment NZ 100% 100%
Argosy Property Holdings Limited ING Property Trust Holdings Limited Holding company NZ 100% 100%
Argosy Property Investments Limited ING Property Trust Investments Limited Holding company NZ 100% 100%
Argosy Property Limited ING Properties Limited Property investment NZ 100% 100%
Argosy No.1 Trust ING No.1 Trust Property investment NZ 100% 100%
GROUP2011
$000s
GROUP2010
$000s
NOTES TO THEFINANCIAL STATEMENTS (CONT.)
24 / EARNINGS/(LOSS) PER UNIT
Basic and diluted earnings/(loss) per unit is calculated by dividing the profi t attributable to unitholders of the Trust by the weighted average number of ordinary units on issue during the year.
Profi t/(loss) attributable to unitholders of the Trust 26,335 (58,975)
Weighted average number of units on issue 543,345 533,495
Basic and undiluted earnings/(loss) per unit (cents) 4.85 (11.05)
On 30 May 2011 a fi nal gross distribution of 1.75 cents per unit was announced by the Trust. Continuation of the DRP programme will increase the number of units on issue.
25 / INVESTMENT IN SUBSIDIARIES
The Trust has control over the following subsidiaries:
The subsidiaries have the same reporting date as the Trust.
During the year Argosy Property No. 4 Limited acquired the full ownership of Argosy Property No. 3 Limited, effective 30 November 2010. The Trust fi nalised agreements to terminate the joint venture by documenting an exchange of the debts and obligations of the joint venture partner for their shares in the company.
At 31 March 2010, the Trust was considered to have been in control of Argosy Property No. 3 Limited. While the non-controlling shareholder held a 50% economic interest in Argosy Property No. 3 Limited, it had been fully consolidated into the Group accounts in 2010.
A price adjustment is to take place following the completion of subdivision works and the issue of titles which is expected to be completed by mid 2011 and caters for any potential changes to fi nal costs of the subdivision work. In the event that payment is required from either party following the adjustment, this is to be by an exchange of property at valuation, which is held as security.
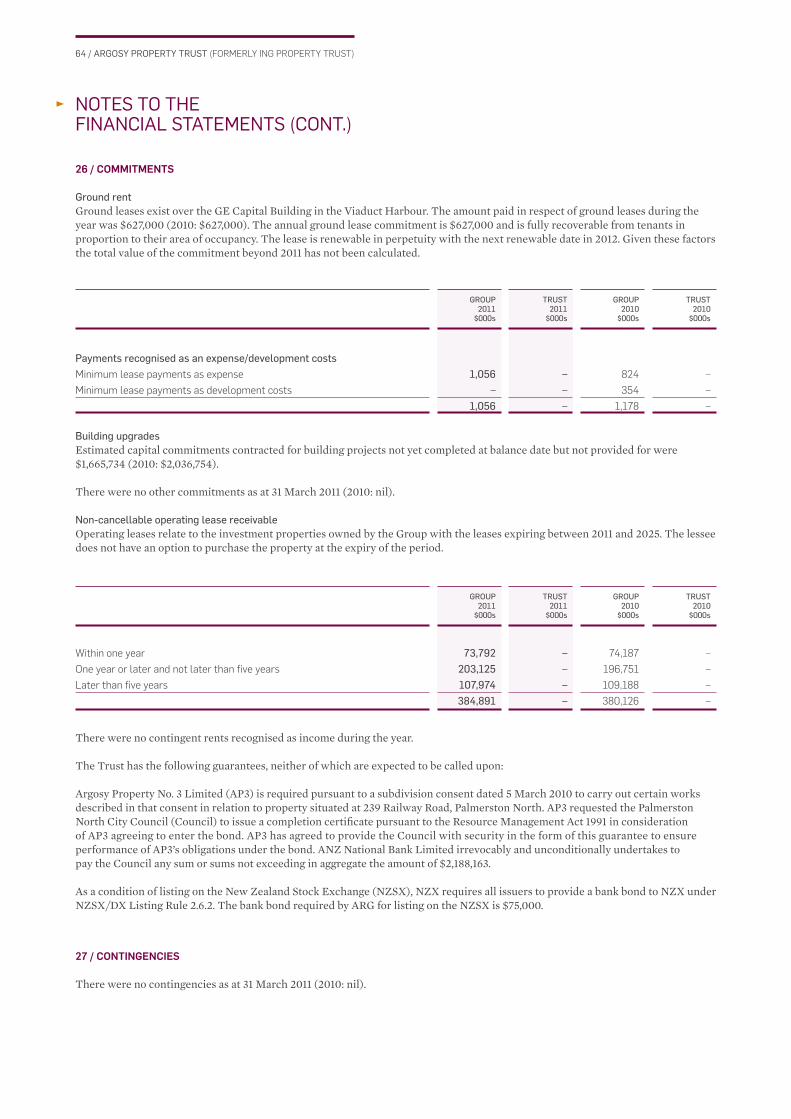
64 / ARGOSY PROPERTY TRUST (FORMERLY ING PROPERTY TRUST)
GROUP2011
$000s
TRUST2011
$000s
GROUP2010
$000s
TRUST2010
$000s
GROUP2011
$000s
TRUST2011
$000s
GROUP2010
$000s
TRUST2010
$000s
NOTES TO THEFINANCIAL STATEMENTS (CONT.)
26 / COMMITMENTS
Ground rentGround leases exist over the GE Capital Building in the Viaduct Harbour. The amount paid in respect of ground leases during the year was $627,000 (2010: $627,000). The annual ground lease commitment is $627,000 and is fully recoverable from tenants in proportion to their area of occupancy. The lease is renewable in perpetuity with the next renewable date in 2012. Given these factors the total value of the commitment beyond 2011 has not been calculated.
Payments recognised as an expense/development costsMinimum lease payments as expense 1,056 – 824 –
Minimum lease payments as development costs – – 354 –
1,056 – 1,178 –
Building upgradesEstimated capital commitments contracted for building projects not yet completed at balance date but not provided for were $1,665,734 (2010: $2,036,754).
There were no other commitments as at 31 March 2011 (2010: nil).
Non-cancellable operating lease receivableOperating leases relate to the investment properties owned by the Group with the leases expiring between 2011 and 2025. The lessee does not have an option to purchase the property at the expiry of the period.
Within one year 73,792 – 74,187 –
One year or later and not later than fi ve years 203,125 – 196,751 –
Later than fi ve years 107,974 – 109,188 –
384,891 – 380,126 –
There were no contingent rents recognised as income during the year.
The Trust has the following guarantees, neither of which are expected to be called upon:
Argosy Property No. 3 Limited (AP3) is required pursuant to a subdivision consent dated 5 March 2010 to carry out certain works described in that consent in relation to property situated at 239 Railway Road, Palmerston North. AP3 requested the Palmerston North City Council (Council) to issue a completion certifi cate pursuant to the Resource Management Act 1991 in consideration of AP3 agreeing to enter the bond. AP3 has agreed to provide the Council with security in the form of this guarantee to ensure performance of AP3’s obligations under the bond. ANZ National Bank Limited irrevocably and unconditionally undertakes to pay the Council any sum or sums not exceeding in aggregate the amount of $2,188,163.
As a condition of listing on the New Zealand Stock Exchange (NZSX), NZX requires all issuers to provide a bank bond to NZX under NZSX/DX Listing Rule 2.6.2. The bank bond required by ARG for listing on the NZSX is $75,000.
27 / CONTINGENCIES
There were no contingencies as at 31 March 2011 (2010: nil).
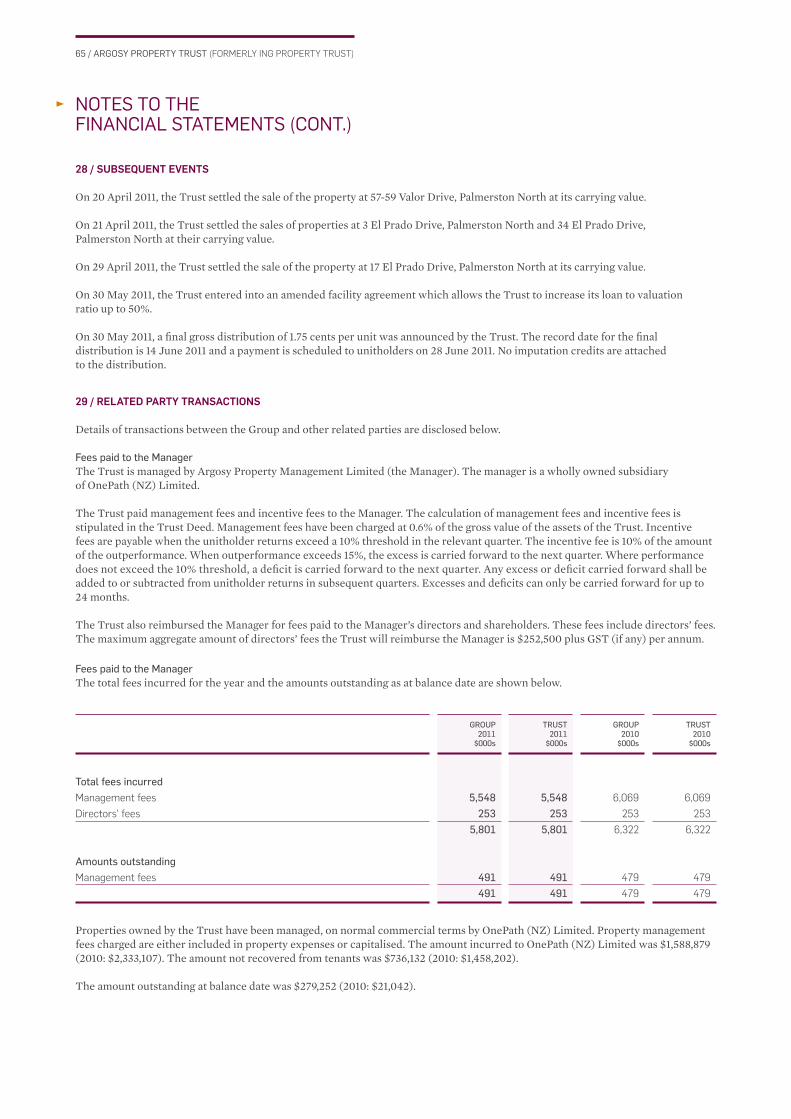
65 / ARGOSY PROPERTY TRUST (FORMERLY ING PROPERTY TRUST)
GROUP2011
$000s
TRUST2011
$000s
GROUP2010
$000s
TRUST2010
$000s
NOTES TO THEFINANCIAL STATEMENTS (CONT.)
28 / SUBSEQUENT EVENTS
On 20 April 2011, the Trust settled the sale of the property at 57-59 Valor Drive, Palmerston North at its carrying value.
On 21 April 2011, the Trust settled the sales of properties at 3 El Prado Drive, Palmerston North and 34 El Prado Drive, Palmerston North at their carrying value.
On 29 April 2011, the Trust settled the sale of the property at 17 El Prado Drive, Palmerston North at its carrying value.
On 30 May 2011, the Trust entered into an amended facility agreement which allows the Trust to increase its loan to valuation ratio up to 50%.
On 30 May 2011, a fi nal gross distribution of 1.75 cents per unit was announced by the Trust. The record date for the fi nal distribution is 14 June 2011 and a payment is scheduled to unitholders on 28 June 2011. No imputation credits are attached to the distribution.
29 / RELATED PARTY TRANSACTIONS
Details of transactions between the Group and other related parties are disclosed below.
Fees paid to the ManagerThe Trust is managed by Argosy Property Management Limited (the Manager). The manager is a wholly owned subsidiary of OnePath (NZ) Limited.
The Trust paid management fees and incentive fees to the Manager. The calculation of management fees and incentive fees is stipulated in the Trust Deed. Management fees have been charged at 0.6% of the gross value of the assets of the Trust. Incentive fees are payable when the unitholder returns exceed a 10% threshold in the relevant quarter. The incentive fee is 10% of the amount of the outperformance. When outperformance exceeds 15%, the excess is carried forward to the next quarter. Where performance does not exceed the 10% threshold, a defi cit is carried forward to the next quarter. Any excess or defi cit carried forward shall be added to or subtracted from unitholder returns in subsequent quarters. Excesses and defi cits can only be carried forward for up to 24 months.
The Trust also reimbursed the Manager for fees paid to the Manager’s directors and shareholders. These fees include directors’ fees. The maximum aggregate amount of directors’ fees the Trust will reimburse the Manager is $252,500 plus GST (if any) per annum.
Fees paid to the ManagerThe total fees incurred for the year and the amounts outstanding as at balance date are shown below.
Total fees incurredManagement fees 5,548 5,548 6,069 6,069
Directors’ fees 253 253 253 253
5,801 5,801 6,322 6,322
Amounts outstandingManagement fees 491 491 479 479
491 491 479 479
Properties owned by the Trust have been managed, on normal commercial terms by OnePath (NZ) Limited. Property management fees charged are either included in property expenses or capitalised. The amount incurred to OnePath (NZ) Limited was $1,588,879 (2010: $2,333,107). The amount not recovered from tenants was $736,132 (2010: $1,458,202).
The amount outstanding at balance date was $279,252 (2010: $21,042).

66 / ARGOSY PROPERTY TRUST (FORMERLY ING PROPERTY TRUST)
GROUP2011
$000s
TRUST2011
$000s
GROUP2010
$000s
TRUST2010
$000s
NOTES TO THEFINANCIAL STATEMENTS (CONT.)
29 / RELATED PARTY TRANSACTIONS (CONT.)
Other related party transactionsOnePath paid for rental and car parks within the building at 8–14 Willis Street, Wellington. The total paid by OnePath for the year was $295,260 (2010: $225,965).
ANZ National Bank Limited (a 100% shareholder of the Manager) paid for rental and car parks within 107 Carlton Gore Rd. The total paid by ANZ National Bank Limited for the year was $1,975,865 (2010: $1,975,865).
The Trust has a syndicated revolving credit facility with, amongst others, ANZ National Bank Limited of $450,000,000 (2010: $500,075,000 with ANZ National Bank Limited, as set out in note 15). As at 31 March 2011 $412,415,034 (2010: $345,789,519) had been drawn-down. The Trust paid $24,283,596 (31 March 2010: $26,872,139) in interest and fees to ANZ National Bank Limited during the period.
Argosy Property No.3 Limited (a subsidiary of Argosy Property Trust) has been fully managed on normal commercial terms by OnePath (NZ) Limited and Valor Ideal Limited up until 30 November 2010. Argosy Property No.4 Limited acquired the full ownership of Argosy Property No. 3 Limited on 30 November 2010 from its joint venture partner. Management fees paid to Valor Ideal Limited and not recovered from tenants was $48,637 (2010: $77,462).
Valor Ideal Limited (“Valor”) is associated with the Trust’s former partner in Argosy Property No.3 Limited prior to 30 November 2010. Valor paid for services provided by the Trust in relation to the Manawatu Business Park. The total billed to Valor for the year was $813,523 (2010: $1,224,312). Argosy Property No. 3 Limited also paid costs associated with the subdivision of Manawatu Business Park on behalf of Valor. The total amount paid during the year was $5,105,778 (2010: $86,727).
Argosy Property No.4 Limited (a subsidiary of Argosy Property Trust) has advanced loans of $39,574,543 to AP3 at balance date, of which $33,267,890 was advanced in the current fi nancial year. The total interest received from AP3 during this period was $808,717. No interest has been charged on the loan since 30 November 2010. The loan is payable on demand.
The Trust paid $44,550 (2010: $24,195) to one of its directors, Andrew Evans, for valuation and consultancy fees. The amount outstanding at balance date was $31,125 (2010: nil).
The following transactions occurred between the Trust and its subsidiaries during the year:
Financial PositionAdvances to subsidiaries – 809,366 – 791,424
Investment in Argosy Property No. 4 Limited – 20,000 – –
Advances from subsidiaries – (12,678) – (20,137)
– 816,688 – 771,287
Profi t and LossFees recharged to subsidiaries – – – 8,535
Interest recharged to subsidiaries – 29,064 – 26,091
Distributions from subsidiaries – 18,870 – 1,441
– 47,934 – 36,067
Advances have been made by Argosy Property Trust to its subsidiaries to fi nance the purchases of investment properties and to fund working capital requirements when necessary. The subsidiaries have returned money to Argosy Property Trust upon the settlement of properties intended for sale and at other times when working capital requirements allow. The Trust re-charges expenses, including management fees and interest, to the subsidiaries.
No related party debts have been written off or forgiven during the year. The Trust has provided $3,064,513 for intercompany receivable (2010: $3,064,513).
The Manager held no units in the Trust as at 31 March 2011 and 31 March 2010.

67 / ARGOSY PROPERTY TRUST (FORMERLY ING PROPERTY TRUST)
NOTES TO THEFINANCIAL STATEMENTS (CONT.)
30 / TRUST DEED
The terms of the Trust are set out in the Trust Deed dated 30 October 2002 (as amended and restated by deeds of variation and restatement dated 30 September 2004, 17 October 2006, 17 December 2008 and 27 May 2009). The Trust Deed was amended on 27 September 2010 to refl ect the name change of the Trust from ING Property Trust to Argosy Property Trust and the name change of the manager from ING Property Trust Management Limited to Argosy Property Management Limited.
31 / TRUSTEE INFORMATION
The Trustee is The New Zealand Guardian Trust Company Limited. In accordance with the Trust Deed, the Trustee will receive from the Trust a fee to a maximum of 0.075% per annum of the gross value of the Trust, or such lesser percentage as is agreed between the Manager and Trustee from time to time.
The Trustee and the Manager have currently agreed an annual fee based on the gross value of the assets of the Trust as follows:
• $250,000 per annum on the fi rst $750 million of gross assets
• 0.020% per annum on the gross assets above $750 million
32 / NZX WAIVERS
The following waivers from the NZX Listing Rules (Listing Rules) were applicable as at balance date.
MANAGEMENT FEES
In 2002, prior to the initial public offer of units in the Trust, the Trust obtained a waiver from the requirement to seek unitholder approval under Listing Rule 9.2 to the extent that the amounts payable to the Manager under the Trust Deed, or to OnePath (NZ) Limited (OnePath(NZ)) under the Property Management Agreement, exceed the thresholds set out in Listing Rule 9.2. This waiver was granted on conditions described (and satisfi ed) in the prospectus in relation to the initial public offer of units in the Trust dated 31 October 2002.
CORPORATE GOVERNANCE
On 25 May 2005, NZX granted the Trust waivers in respect of 3.1.1(a), 3.3.1B(a), 3.3.2 to 3.3.12 and 3.4.3 in relation to the application of the Listing Rules to the Trust’s corporate governance structure, in light of the fact that those Listing Rules are not readily applicable to an issuer which is a unit trust where the directors for the purposes of the Listing Rules are the directors of the Manager. The waivers provided for the following:
(a) 3.1.1(a): to exempt the Trust from incorporating in its Trust Deed those Listing Rules for which waivers outlined in the decision were granted;
(b) 3.3.1B(a): to exempt the Trust and the Manager from identifying which directors are independent no later than 10 business days following the Trust’s annual meeting. The waiver was granted on the condition that the Manager announce to the market, within 10 business days of such determination, the names of those directors of the Manager deemed to be independent;
(c) 3.3.2 to 3.3.12: to exempt the Trust from compliance with such Listing Rules which relate to the process for the appointment of an issuer’s directors. The waiver was granted on the basis that since listing, the Trust, nor any other listed unit trust, has been required to comply with these provisions; and
(d) 3.4.3: the directors of the Manager who are interested, solely due to being a director of the Manager, may vote on transactions which the Manager is entering into for the purposes of the day-to-day management of the Trust. This waiver is conditional upon a director abstaining from voting on a transaction entered into by the Manager, on behalf of the Trust with another entity, in respect of which the director would otherwise be interested.
DIVIDEND REINVESTMENT PLAN
On 14 September 2006, the Trust obtained a waiver from Listing Rule 7.11.1 to allow units to be allotted, pursuant to its dividend reinvestment plan (DRP), later than fi ve business days after applications to participate in the DRP are required to be submitted.
Applications to participate in the DRP are required to be submitted by the Record Date (being 5pm on the date fi xed by the Manager to determine unitholder entitlements to a distribution). Under the terms of the DRP, the price per unit is determined with reference to the period of seven days immediately following the Record Date for the relevant distribution, or if no sale occurs during that period, the net asset value per unit on the day immediately following the Record Date. On the strict application of Listing Rule 7.11.1, units to be allotted under the DRP would need to be allotted within fi ve business days of the Record Date, which would be before the price for the units had been determined.
The waiver was granted subject to the following conditions:
(a) that the Trust will allot units pursuant to the DRP within two business days of payment of the relevant distribution; and
(b) that if the DRP does not proceed to allotment, and monies are returned to subscribers, the Trust will refund any interest accrued on such monies between the latest date on which applications for units close and the date of the refund.
68 / ARGOSY PROPERTY TRUST (FORMERLY ING PROPERTY TRUST)
NOTES TO THEFINANCIAL STATEMENTS (CONT.)
ACQUISITION AND DEVELOPMENT OF BLOCK E, ALBANY
On 17 May 2007, the Trust obtained a waiver from the requirement to seek unitholder approval under Listing Rule 9.2 in respect of a transaction involving the Trust (i) acquiring a leasehold interest in Block E, Albany on Auckland’s North Shore from the Albany City Joint Venture and (ii) entering into a development agreement with Symphony Projects Management Limited pursuant to which Symphony will develop the land (together the Transaction). The leasehold acquisition and development arrangements constitute a related series of transactions which include a Material Transaction of the Trust for the purposes of Listing Rule 9.2.2.
The waiver was granted subject to the following conditions:
(a) that each director of the Manager, other than Mr P C Brook, certify that:
(i) the directors are satisfi ed that the personal connections with, involvement or personal interests of Symphony Group Limited (which owns 50% of the Manager through its ownership of Symphony Investments Limited) are immaterial and have not infl uenced the promotion of the Transaction or its terms and conditions;
(ii) Symphony has not used its shareholding in the Manager to appoint nominees or representatives to the Manager’s Board or to infl uence the day to day operation, management or decision making of the Trust;
(iii) Mr Reynolds has not provided any advice to the Board of the Manager in respect of the Transaction;
(iv) the Transaction and its terms will be undertaken on an arm’s length and commercial basis;
(v) they consider entering into the Transaction to be in the best interests of the Trust’s unitholders not associated with Symphony; and
(vi) each of the development proposals under the development agreement will be approved by the Trustee.
(b) that at the time the Manager decides to proceed with a proposal for development pursuant to the development agreement (the Development Proposal), each director of the Manager, other than Mr P C Brook, certify that:
(i) the directors are satisfi ed that the personal connections with, involvement or personal interests of Symphony are immaterial and have not infl uenced the promotion of the Development Proposal or its terms and conditions;
(ii) the Development Proposal and its terms will be undertaken on an arms length and commercial basis; and
(iii) they consider entering into the Development Proposal to be in the best interests of the Trust’s unitholders not associated with Symphony.
(c) that each Development Proposal is approved by the Trustee in reliance on a report from a qualifi ed adviser who is independent from Symphony and its associated persons.
32 / NZX WAIVERS (CONT.)
69 / ARGOSY PROPERTY TRUST (FORMERLY ING PROPERTY TRUST)
TO THE UNITHOLDERS OF ARGOSY PROPERTY TRUST
REPORT ON THE FINANCIAL STATEMENTS
We have audited the fi nancial statements of Argosy Property Trust (the “Trust”) and Group (the “Group”) on pages 35 to 70, which comprise the consolidated and separate statement of fi nancial positions of the Trust and Group, as at 31 March 2011, the consolidated and separate statements of comprehensive income, statements of changes in equity and statements of cash fl ow for the year then ended, and a summary of signifi cant accounting policies and other explanatory information.
This report is made solely to the Trust’s unitholders, as a body. Our audit has been undertaken so that we might state to the Trust’s unitholders those matters we are required to state to them in an auditor’s report and for no other purpose. To the fullest extent permitted by law, we do not accept or assume responsibility to anyone other than the Trust’s unitholders as a body, for our audit work, for this report, or for the opinions we have formed.
MANAGER’S RESPONSIBILITY FOR THE FINANCIAL STATEMENTS
The Manager is responsible for the preparation of fi nancial statements in accordance with generally accepted accounting practice in New Zealand and that give a true and fair view of the matters to which they relate, and for such internal control as the Manager determine is necessary to enable the preparation of fi nancial statements that are free from material misstatement, whether due to fraud or error.
AUDITOR’S RESPONSIBILITIES
Our responsibility is to express an opinion on these fi nancial statements based on our audit. We conducted our audit in accordance with International Standards on Auditing and International Standards on Auditing (New Zealand). Those standards require that we comply with ethical requirements and plan and perform the audit to obtain reasonable assurance about whether the fi nancial statements are free from material misstatement.
An audit involves performing procedures to obtain audit evidence about the amounts and disclosures in the fi nancial statements. The procedures selected depend on the auditor’s judgement, including the assessment of the risks of material misstatement of the fi nancial statements, whether due to fraud or error. In making those risk assessments, the auditor considers internal control relevant to the entity’s preparation of fi nancial statements that give a true and fair view of the matters to which they relate in order to design audit procedures that are appropriate in the circumstances, but not for the purpose of expressing an opinion on the effectiveness of the entity’s internal control. An audit also includes evaluating the appropriateness of the accounting policies used and the reasonableness of accounting estimates, as well as the overall presentation of the fi nancial statements.
We believe that the audit evidence we have obtained is suffi cient and appropriate to provide a basis for our audit opinion.
Other than in our capacity as auditor, and the provision of a model review, we have no relationship with or interests in Argosy Property Trust or any of its subsidiaries.
OPINION
In our opinion, the fi nancial statements on pages 35 to 70:
• comply with generally accepted accounting practice in New Zealand;
• comply with International Financial Reporting Standards; and
• give a true and fair view of the fi nancial position of Argosy Property Trust and Group as at 31 March 2011, and their fi nancial performance and cash fl ows for the year then ended.
REPORT ON OTHER LEGAL AND REGULATORY REQUIREMENTS
We also report in accordance with section 16 of the Financial Reporting Act 1993. In relation to our audit of the fi nancial statements for the year ended 31 March 2011:
• we have obtained all the information and explanations we have required
• in our opinion proper accounting records have been kept by Argosy Property Trust as far as appears from our examination of those records.
Chartered Accountants30 May 2011
Auckland, New Zealand
This audit report relates to the fi nancial statements of Argosy Property Trust and Group for the year ended 31 March 2011 included on Argosy Property Trust’s website. The audit
committee is responsible for the maintenance and integrity of Argosy Property Trust’s website. We have not been engaged to report on the integrity of Argosy Property Trust’s
website. We accept no responsibility for any changes that may have occurred to the fi nancial statements since they were initially presented on the website. The audit report refers
only to the fi nancial statements named above. It does not provide an opinion on any other information which may have been hyperlinked to/from these fi nancial statements. If readers
of this report are concerned with the inherent risks arising from electronic data communication they should refer to the published hard copy of the audited fi nancial statements and
related audit report dated 30 May 2011 to confi rm the information included in the audited fi nancial statements presented on this website. Legislation in New Zealand governing the
preparation and dissemination of fi nancial statements may differ from legislation in other jurisdictions.
INDEPENDENT AUDITOR’S REPORT

70 / ARGOSY PROPERTY TRUST (FORMERLY ING PROPERTY TRUST)
UNITHOLDERS NO OF UNITS% OF TOTAL
ISSUED UNITS
UNITHOLDERS
DATENOTICE
FILEDNO OFUNITS
% OF TOTALISSUED UNITS
TWENTY LARGEST SECURITY HOLDERS AS AT 10 JUNE 2011
MFL Mutual Fund Limited 122,759,317 22.35
Accident Compensation Corporation 33,198,342 6.04
Premier Nominees Limited - OnePath Wholesale Property Securities 21,657,988 3.94
Investment Custodial Services Limited 21,099,577 3.84
HSBC Nominees (New Zealand) Limited A/C State Street 20,517,241 3.73
BT NZ Unit Trust Nominees Limited 13,399,176 2.43
FNZ Custodians Limited 7,754,306 1.41
Forsyth Barr Custodians Limited 6,642,493 1.20
Forsyth Barr Custodians Limited 5,946,470 1.08
New Zealand Superannuation Fund Nominees Limited 5,529,293 1.00
Citibank Nominees (New Zealand) Limited 5,196,517 0.94
Albany Power Centre Limited (in liquidation) 5,038,434 0.91
HSBC Nominees (New Zealand) Limited 5,001,191 0.91
Mint Nominees Limited 4,189,141 0.76
James Harvey Mansell & Christine Anne Mansell & Douglas Tony Brown 4,159,731 0.75
Peter John Whiting & Janet Graham Whiting & Wayne Derek Anderson 3,799,000 0.69
Lynwalsh Holdings Limited 3,500,000 0.63
University of Otago Foundation Trust 3,500,000 0.63
Cogent Nominees (NZ) Limited 3,466,620 0.63
Guardian Trust Investment Nominees Limited 3,463,517 0.63
Total 299,818,354 54.50Total units on issue 549,185,775
SUBSTANTIAL SECURITY HOLDERS AS AT 10 JUNE 2011
The following security holders had fi led substantial security holder notices in accordance with the Securities Markets Act 1988.
MFL Mutual Fund Limited 24-Dec-10 126,834,058 23.19%
Accident Compensation Corporation 03-Jun-11 33,610,326 6.12%
The total number of units on issue in the Trust as at 10 June 2011 was 549,185,775.
UNITHOLDERSTATISTICS

71 / ARGOSY PROPERTY TRUST (FORMERLY ING PROPERTY TRUST)
UNITHOLDERSNO OF
UNITHOLDERSTOTALUNITS
% OF TOTALISSUED UNITS
DIRECTORS
HOLDINGS (NUMBER OF UNITS)
NON-BENEFICIAL BENEFICIALASSOCIATED
PERSON
DISTRIBUTION OF SECURITY HOLDERS AND SECURITY HOLDINGS AS AT 10 JUNE 2011
1 to 99 10 581 0.00%
100 to 199 6 925 0.00%
200 to 499 13 4,078 0.00%
500 to 999 67 46,179 0.01%
1,000 to 1,999 158 214,655 0.04%
2,000 to 4,999 1,005 3,562,469 0.65%
5,000 to 9,999 1,526 10,962,965 2.00%
10,000 to 49,999 3,548 76,720,639 13.97%
50,000 to 99,999 541 35,491,680 6.46%
100,000 to 499,999 310 52,434,459 9.55%
500,000 to 999,999 26 17,101,165 3.11%
1,000,000+ 33 352,645,980 64.21%
Total 7,243 549,185,775 100%
HOLDING OF DIRECTORS OF THE MANAGER AS AT 10 JUNE 2011
Trevor Scott 2,013,167 6,200,000 –
Peter Brook 304,389 74,083 –
Michael Smith – 100,000 –
Andrew Evans 48,599 – –
Hon. Philip Burdon – – –
UNITHOLDERSTATISTICS (CONT.)

72 / ARGOSY PROPERTY TRUST (FORMERLY ING PROPERTY TRUST)
DIRECTORY
MANAGER
ARGOSY PROPERTY MANAGEMENT LIMITED
ASB Bank Centre135 Albert StreetPO Box 7149, Wellesley StreetAuckland 1141
t / 09 357 1800f / 09 357 1801
www.argosy.co.nz
DIRECTORS OF THE MANAGER
Philip Michael Smith, AucklandAndrew Hardwick Evans, AucklandPeter Clynton Brook, AucklandHon. Philip Ralph Burdon, ChristchurchTrevor Donald Scott, Wanaka
TRUSTEE
THE NEW ZEALAND GUARDIAN TRUSTCOMPANY LIMITED
Vero Centre48 Shortland StreetPO Box 1934Auckland 1015
t / 09 377 7300f / 09 377 7477
AUDITOR
DELOITTE
Deloitte Centre80 Queen StreetPrivate Bag 115-003Auckland 1010
t / 09 303 0700f / 09 303 0701
LEGAL ADVISERS TO THE MANAGER
HARMOS HORTON LUSK
Vero Centre48 Shortland StreetPO Box 28Auckland 1015
t / 09 921 4300f / 09 921 4319
BELL GULLY
Vero Centre48 Shortland StreetPO Box 4199Auckland 1140
t / 09 916 8800f / 09 916 8801
LEGAL ADVISERS TO THE TRUSTEE
MINTER ELLISON
Level 18-20Lumley Centre88 Shortland StreetPO Box 3798Auckland 1140
t / 09 353 9700f / 09 353 9701
BANKERS TO THE TRUST
BANK OF NEW ZEALAND
THE HONG KONG AND SHANGHAI BANKING CORPORATION LIMITED
ANZ NATIONAL BANK LIMITEDSECURITY TRUSTEE
ANZ Centre23-29 Albert StreetPO Box 6334Auckland 1141
t / 0800 103 123
UNIT REGISTRAR
COMPUTERSHARE INVESTORSERVICES LIMITED
159 Hurstmere RoadTakapunaNorth Shore City 0622Private Bag 92119Auckland 1142New Zealand
MANAGING YOUR UNITHOLDING ONLINE
To change your address, update your payment instructions and to view your investment portfolio including transactions, please visit www.computershare.co.nz/investorcentre
GENERAL ENQUIRIES CAN BE DIRECTED TO:
Private Bag 92119Auckland 1142
t / 09 488 8777f / 09 488 8787e / [email protected]
Please assist our registrar by quoting your CSN or shareholder number.