annual report 2009 - mhi.com · annual report 2009 annual report 2009 for the year ended march 31,...
TRANSCRIPT

MITSU
BISH
I HEA
VY
IND
USTR
IES, LTD. A
nnual Report 2009
Annual Report 2009For the Year Ended March 31, 2009
Printed in JapanTo protect the environment, this annual report is printed on FSC-certified paper, and the cover is printed on recycled paper, by a waterless printing method that generates no harmful wastewater.
K060-ANAL09E1-A-0,(8.0)09-7,R

Board of Directors
Directors
Kazuo Tsukuda
Shiro IijimaGeneral Manager, Shipbuild-ing & Ocean Development Headquarters
Ken WatabeGeneral Manager, Paper & Printing Machinery Division
Katsuhiko YasudaIn charge of Internal Audit, Corporate Social Responsi-bility, General Affairs, Legal and Personnel
Makoto ShintaniGeneral Manager, Production System Innovation Planning Department
Akira SawaGeneral Manager, Nuclear Energy Systems Headquarters
Takashi AbeDeputy General Manager, Presidential Administration Office; General Manager, Corporate Planning Department
Teruaki KawaiGeneral Manager, Aerospace Headquarters
Akira HishikawaGeneral Manager, General Machinery & Special Vehicle Headquarters
Shunichi MiyanagaGeneral Manager, Machinery & Steel Structures Headquarters
Mikio SasakiChairman of the Board of Mitsubishi Corporation
Yoshiaki TsukudaGeneral Manager, Power Systems Headquarters
Akihiro WadaAdvisor, Executive Technical Advisor of Aisin Seiki Co., Ltd.
Yujiro KawamotoIn charge of Accounting, Finance and Material
Yoshihiro SakamotoFormer Vice-Minister for International Affairs of the Ministry of International Trade and Industry
Koshin Nakamoto
Hideaki Omiya
Naoki Yasaka Toyoshi NakanoSenior Adviser of Mitsubishi UFJ Trust and Banking Corporation
Ichiro FukueProviding assistance to the President. In charge of Production System Innovation Planning, Energy & Environment business and other matters specially assigned by the President
Hiroshi KanProviding assistance to the President. General Manager, Presidential Administration Office. In charge of other matters specially assigned by the President
Sunao AokiProviding assistance to the President. General Manager, Technical Headquarters. In charge of Information Systems & Communications and other matters specially assigned by the President
Kichisaburo NomuraExecutive Adviser of All Nippon Airways Co., Ltd.
Nobuo KuroyanagiPresident & CEO of Mitsubishi UFJ Financial Group, Inc.; Chairman of The Bank of Tokyo-Mitsubishi UFJ, Ltd.
CHAIRMAN
EXECUTIVE VICE PRESIDENTS
SENIOR VICE PRESIDENTS OUTSIDE DIRECTORS
STATUTORY AUDITORS
PRESIDENT SENIOR EXECUTIVE VICE PRESIDENTS
Creed
1. We strongly believe that the customer comes first and that we are obligated to be an
innovative partner to society.
2. We base our activities on honesty, harmony, and a clear distinction between public and
private life.
3. We shall strive for innovative management and technological development from an
international perspective.
Reason for Instituting the CreedIn Japan there are many enterprises with their own “creeds” which simply represent their management concept.
Mitsubishi Heavy Industries, Ltd. has a creed of this type, also. This creed was instituted in 1970 on the basis of the
policy advocated by Koyata Iwasaki, president of Mitsubishi Goshi Kaisha in the 1920s, to indicate the essential attitude
of the company, the mental attitude of the employees, and the future directions of the company. The reason for instituting
the present creed is so that all of us can call to mind our one hundred years of tradition, and strive for further development
in the future.
This CI statement represents our intention to
“continuously provide an assured future
where people can live safe, secure and enriched lives
through technologies that can excite people
and passion as a manufacturer for the sustainability
of the earth and humankind.”
Our Technologies,
Your Tomorrow
ANNUAL REPORT 2009 63
(As of June 25, 2009)

ANNUAL REPORT 2009 1
Contents
Forward-Looking StatementsForecasts regarding future performance in this report are based on judgments made in accordance with information available at the time this presentation was prepared. As such, these projections involve risks and uncertainties. For this reason, investors are recommended not to depend solely on these projections for making investment decisions. It is possible that actual results may differ significantly from these projections for a number of factors. Such factors include, but are not limited to, economic trends affecting the Company’s operating environment, currency movements of the yen value to the U.S. dollar and other foreign currencies, and trends of stock markets in Japan.
2 Consolidated Financial Highlights
3 Consolidated Financial Performance
4 A Message from the Management
6 Special Feature:
Our Emergency Measures for Fiscal 2009 12 Topics:
Energy & Environment Business 14 MHI at a Glance
16 Review of Operations
16 Shipbuilding & Ocean Development
18 Power Systems
20 Machinery & Steel Structures
22 Aerospace
24 Mass and Medium-Lot Manufactured Machinery
27 Intellectual Property and R&D
29 Corporate Governance
33 Corporate Social Responsibility
34 Financial Section
34 Segment Information
36 Management’s Discussion and Analysis
40 Consolidated Balance Sheets
42 Consolidated Statements of Income
43 Consolidated Statements of Changes in Net Assets
44 Consolidated Statements of Cash Flows
45 Notes to Consolidated Financial Statements
61 Report of Independent Auditors
62 Corporate Data
63 Board of Directors

MITSUBISHI HEAVY INDUSTRIES, LTD.2
Consolidated Financial Highlights
Mitsubishi Heavy Industries, Ltd. and Consolidated Subsidiaries
Years ended March 31 of respective years
In millions of yen except per share amounts
In thousands of U.S. dollars
except per share amounts*
2009 2008 2007 2006 2005 2004 2009
Net sales ¥3,375,674 ¥3,203,085 ¥3,068,504 ¥2,792,108 ¥2,590,733 ¥2,373,440 $34,365,000
Operating income 105,859 136,030 108,912 70,912 14,772 66,630 1,077,664
Interest expense—net of interest
income and dividend income (6,031) (5,729) (4,807) (1,968) (5,589) (6,332) (61,396)
Income before income taxes
and minority interests 64,923 101,375 83,711 52,383 16,398 50,123 660,928
Net income 24,217 61,332 48,839 29,816 4,049 21,787 246,533
Per share information of common stock:
(yen / U.S. dollars)
Net income—basic ¥ 7.22 ¥ 18.28 ¥ 14.56 ¥ 8.85 ¥ 1.20 ¥ 6.46 $ 0.074
Net income—diluted 7.21 18.27 14.55 8.83 1.20 6.46 0.073
Net assets 369.94 423.17 425.54 410.15 390.44 393.17 3.766
Cash dividends 6.00 6.00 6.00 4.00 4.00 6.00 0.061
Total assets ¥4,526,213 ¥4,517,148 ¥4,391,864 ¥4,047,122 ¥3,831,144 ¥3,715,358 $46,077,705
Net assets** 1,283,251 1,440,429 1,446,436 1,376,289 1,309,977 1,324,497 13,063,738
Current assets 3,165,059 2,936,886 2,787,315 2,543,485 2,465,645 2,402,987 32,220,899
Current liabilities 1,994,892 1,825,894 1,807,411 1,626,662 1,567,987 1,519,466 20,308,378
Short-term borrowings
and long-term borrowings 1,612,859 1,365,393 1,273,572 1,198,664 1,172,896 1,101,268 16,419,210
Cash flows:
Cash flows from operating activities ¥ 79,533 ¥ 161,823 ¥ 158,721 ¥ 73,928 ¥ 107,065 ¥ 134,240 $ 809,660
Cash flows from investing activities (156,593) (193,055) (158,653) (104,065) (163,321) (95,379) (1,594,146)
Ratios:
Return on equity*** 1.82% 4.31% 3.48% 2.22% 0.31% 1.68%
Equity ratio**** 27.43% 31.44% 32.52% 34.01% 34.19% 35.65%
Notes: * U.S. dollar amounts in this annual report are translated from yen, for convenience only, at the rate of ¥98.23=US$1, the exchange rate prevailing at
March 31, 2009.
** In calculating the net assets, MHI and its consolidated subsidiaries have applied the “Accounting Standard for Presentation of Net Assets in the Balance
Sheet” (Accounting Standard Boards of Japan (ASBJ) Statement No. 5) and the “Guidance on Accounting Standard for Presentation of Net Assets in the
Balance Sheet” (ASBJ Guidance No. 8) since the year ended March 31, 2007.
*** Return on equity = net income / (net assets – share subscription rights – minority interests) × 100
**** Equity ratio = (net assets – share subscription rights – minority interests) / total assets × 100

500
1,000
1,500
2,000
2,500
3,000
3,500
00908070605
09080706050
1,000
2,000
3,000
4,000
5,000
09080706050
100
200
300
400
500
600
0
5
10
15
20
25
30
30
60
90
120
150
00908070605
09080706050
300
600
900
1,200
1,500
09080706050
5
10
15
20
25
30
35
40
0
1
2
3
4
5
6
7
8
10
20
30
40
50
60
70
00908070605
09080706050
500
1,000
1,500
2,000
0908070605-250
-200
-150
-100
-50
0
50
100
150
200
ANNUAL REPORT 2009 3
Consolidated Financial Performance
Net Sales(In billions of yen)
Total Assets(In billions of yen)
Per Share Information of Common Stock (yen)
Operating Income(In billions of yen)
Net Assets(In billions of yen)
Ratios(%)
Net Income(In billions of yen)
Short-term Borrowings and Long-term Borrowings (In billions of yen)
Cash Flows(In billions of yen)
Net income—basic (left scale)Net assets (right scale)
Return on equity (left scale)Equity ratio (right scale)
Cash flows from operating activitiesCash flows from investing activities

MITSUBISHI HEAVY INDUSTRIES, LTD.4
A Message from the Management
The MHI Group’s fundamental business policy is to
contribute to the development of a society where
people can live a safe and fulfilling life. Toward this
end, the MHI Group provides trustworthy products
and services backed by its unsurpassed technology
in various fields that underpin society, including
energy and environment, transportation and trans-
port, and industrial infrastructure.
Based on this fundamental policy, we are working
to further advance and strengthen our manufacturing
capabilities and technical capabilities, which are the
underpinnings of our business. In conjunction, we are
taking steps to enhance our business framework by
concentrating R&D, personnel, and other corporate
resources in businesses having high growth potential.
Operating Environment and PerformanceIn the fiscal year ended March 31, 2009, the global econ-
omy remained firm during the first half, but rapidly
slumped from autumn 2008 as the financial crisis which
began from the U.S. exerted a wide-ranging effect on the
real economy.
In this operating environment, orders received by the
MHI Group were favorable during the first half, particularly
for the Power Systems segment which won orders for
large-scale thermal power plants overseas. In the second
half, however, while there were some results such as a
contract for a large-scale chemical plant in the Machinery
& Steel Structures segment, many business negotiations
were postponed or suspended in all segments under the
heavy influence of the global recession. As a result, the
total value of consolidated orders in the fiscal year ended
March 31, 2009 declined approximately 12% from the
previous year to ¥3,268.7 billion (US$33,276 million), with
declines in the Mass and Medium-Lot Manufactured
Machinery and Aerospace segments.
Consolidated net sales, however, actually rose approxi-
mately 5% to ¥3,375.6 billion (US$34,365 million), despite
Left
Kazuo Tsukuda, Chairman
Right
Hideaki Omiya, President

ANNUAL REPORT 2009 5
declines in the Mass and Medium-Lot Manufactured
Machinery and Shipbuilding & Ocean Development seg-
ments, on higher revenues from the Power Systems seg-
ment coupled with year-on-year increases in the Machinery
& Steel Structures and Aerospace segments.
Operating income fell ¥30.1 billion to ¥105.8 billion
(US$1,077 million), while ordinary income was down ¥34.1
billion to ¥75.3 billion (US$766 million). The MHI Group
advanced various measures throughout the fiscal year
under review under the 2008 Business Plan (Three-Year
Medium-Term Business Plan which began from April 2008),
and realized some success in such areas as improving
productivity. Nevertheless, profits declined because of
lower earnings in the Mass and Medium-Lot Manufactured
Machinery segment and in other segments amid the global
recession, combined with the foreign exchange effects
from the appreciation of the yen year on year.
Net income decreased ¥37.1 billion to ¥24.2 billion
(US$246 million). While posting extraordinary gain from
gain on sales of fixed assets, gain on sales of investment
securities and gain on contribution of securities to retire-
ment benefit trust, the MHI Group posted extraordinary
loss from effect of the application of the accounting stan-
dard for measurement of inventories, loss on legal claims
and business structure improvement expenses.
Launch Company-wide Emergency Measures “Challenge 09”The MHI Group has been actively advancing business
development worldwide based on the 2008 Business
Plan. Despite this, our business has been severely
affected by the sudden deceleration of the global econ-
omy since autumn 2008. The MHI Group is vigorously
advancing the following approaches to transcend this
unprecedented crisis and realize continuous growth into
the future.
First, with the growing global interest in energy and
environmental issues, coupled with greater efforts by gov-
ernments and businesses in each nation, we project large
demand over the middle to long term for energy and
environmental products, which constitute the core of the
MHI Group’s businesses. We also have high expectations
for an increase in demand of infrastructure development in
BRICs, Southeast Asia and other emerging economies,
and for high potential growth in those countries and areas.
For these reasons, even amid the present harsh business
conditions, the MHI Group continues to advance large-
scale projects in each field, secure personnel, implement
the necessary capital investment and research and devel-
opment aimed at expanding our global businesses and
achieving growth, with our energy and environment busi-
nesses and transportation systems businesses at the core.
Meanwhile, the contraction of the U.S. and European
markets and downturn in automobile-related businesses
are expected to continue for the time being, particularly
for the Mass and Medium-Lot Manufactured Machinery
business. In response to this severe business environ-
ment, the MHI Group is implementing Company-wide
emergency measures “Challenge 09” aimed at improving
profits to secure business performance.
By strengthening growth businesses based on
middle- to long-term business strategies while carrying
out short-term activities to improve profits in parallel, the
MHI Group aims to overcome the present difficult situa-
tion and realize rapid business growth when economic
conditions recover.
Shareholder ReturnsThe MHI Group is implementing diverse measures to deal
with today’s harsh business climate and striving to secure
business performance. We will continue to advance our
business from the standpoint of customers and society,
giving highest priority to enhancement of our internal con-
trol system, compliance and CSR (corporate social
responsibility) in our management, and ceaseless efforts
to contribute to the development of society.
We endeavor to meet shareholders’ expectations
regarding dividends while comprehensively considering
the level of profits and the need for internal reserves to
fund future business expansion.

FY2005 FY2006 FY2007 FY2009(Forecast)
FY2008
70.9108.9
136.0105.8
65.0
2,942.03,274.7
3,715.2
3,268.73,100.0
4.95.4 5.2
3.2
-1.3
111115 115
103
95
World GDP growth rate(%)
Exchange rate(yen/U.S. dollar)
(In billions of yen)
Orders received
Operating income
2008Business Plan
Challenge 092006 Business Plan
The business environment will remain severe in FY2009
MITSUBISHI HEAVY INDUSTRIES, LTD.6
Special Feature:Our Emergency Measures for Fiscal 2009
We are expecting the extremely severe business envi-
ronment to continue in fiscal 2009. Taking this busi-
ness environment into consideration, in our
consolidated forecasts for fiscal 2009, we expect
orders of ¥3,100 billion and operating income of ¥65
billion both down from the previous year.
In light of these projections, we have put on hold
our original profit target of ¥160 billion for fiscal 2010
as stated in our 2008 Business Plan. We have also
decided to launch “Challenge 09,” our company-wide
emergency plan aimed at securing profits in both the
current fiscal 2009 and in fiscal 2010.
In fiscal 2009, although we face numerous factors
that could weaken profits such as strong yen
exchange rates, weaker sales, rising material costs,
and increased research and development expenses,
aiming to increase profits by following the measures
of “Challenge 09,” we plan to achieve operating
income of ¥65 billion.
Source: IMF (World Economic Outlook, April 2009)

ANNUAL REPORT 2009 7
Fiscal 2009 Company-wide MeasuresGiven the severity of our business environment, we are
implementing measures on a company-wide scale along
two tracks that form important pillars of management
policy for the entire MHI Group. One consists of emer-
gency measures for securing profits in the short term. The
other consists of enhancement measures leading to
future growth.
“Challenge 09,” our emergency measures, is a group
of company-wide initiatives to overcome the current difficult
challenges. We are pressing forward in earnest with these
activities, which include cost reduction activities, sales
securing activities, and actions to cope with a strong yen.
The focus of these measures is to improve the current
revenue situation.
On the other hand, we shall not neglect our business
activities for future growth. Even in this difficult business
environment, by enhancing rather than stopping these
activities, we can continue to strengthen various
resources for growth businesses.
“Challenge 09” Company-wide Emergency MeasuresThe three pillars of “Challenge 09” are cost reduction
activities, sales securing activities, and actions to cope
with a strong yen.
Cost reduction activities
Our activities aimed at reducing costs are “enhancement
and acceleration of innovations in manufacturing,”
“across-the-board cost cutting,” “measures for the Mass
and Medium-Lot Manufactured Machinery segment,” and
“reduction in officers’ remuneration.”
Concerning “enhancement and acceleration of inno-
vations in manufacturing,” we are focusing on (a) the
establishment of a solid foundation through innovations in
three main areas, (b) the enhancement of engineering,
procurement and construction (EPC) business practices
and (c) the accelerated reform of the value chain business
process through the deployment of engineers from
Technical Headquarters.
We are working to establish a solid foundation
through innovations in three main areas that form the
pillars of business process reform outlined in the 2008
Business Plan.
(i) Through innovations related to standardization
and sharing, we shall expand the number of
repetitive production models company-wide by
accelerating the sharing of drawings and parts to
achieve cost reductions and quality stabilization.
Currently we are pressing forward with the goal
of reducing production lead times by 30%.
Emergency measures
Emergency measures
Outline of FY2009 Company-wide Measures
Emergency
measures
Implementing two-track management combining emergency measures for
securing profits in the short term and enhancement measures leading to future growth
Enhancement
measures
Challenge 09: Company-wide initiatives to overcome the current challenges
Continuing enhancement of growth businesses even amid the difficult business environment
Sales securing activities
Continuing enhancement of growth business resources (R&D expenditure, capital expenditure, investment and loans, and employees)
Actions to cope with a strong yenCost reduction activities

MITSUBISHI HEAVY INDUSTRIES, LTD.8
(ii) Through innovations related to product reliability,
while pressing ahead with the reform of our
manufacturing processes through the application
of the latest simulation technology for complex
manufacturing processes, allowing us to achieve
higher accuracy in turbine blade clearance set-
tings, for example, we are strengthening our
quality control systems including those of our
business partners.
(iii) Through innovations related to supply chains,
while working to introduce greater visualization,
through the use of IT, of flows of goods and
information throughout the supply chain with the
aim of constructing optimal supply chain struc-
tures, we are accelerating the realization of a
united value engineering (VE) activity structure by
forming company-wide business partner teams.
With respect to “enhancement of EPC business
practices,” we have long-standing experience in the EPC
business, and we shall press forward with further devel-
oping business IT tools and our best-practice business
risk management (according to company and outside
standards) such as through company-wide horizontal
expansion of chemical plant business knowledge—upon
which our business processes are established.
With a 1,400-strong research staff, Technical Head-
quarters up until now has been carrying out activities
focused on cutting-edge technologies and product devel-
opment. By expanding its activities to include direct par-
ticipation in the manufacturing process and supply chain,
we aim to accelerate company-wide business process
reforms such as eliminating bottleneck processes and
developing sales support systems and SCM systems.
Concerning “across-the-board cost cutting,” we are
working to cut general expenses and reduce overtime
hours by improving business efficiency.
Concerning “measures for the Mass and Medium-Lot
Manufactured Machinery segment,” which had consider-
ably deteriorated earnings, in addition to measures related
to plant operation such as measures affecting roughly
1,000 employees including reallocation to the plants with
ordered goods operations and measures to adjust oper-
ating hours on a production-line basis, we have also
reviewed our capital expenditure plan of the 2008 Business
Plan and reduced or carried over capital expenditure in
line with production cuts.
Also, as a measure to cope with the strong yen, we
have brought forward the implementation of our overseas
production plans to establish plants for turbochargers and
forklift trucks. In the U.S., however, we decided to tempo-
rarily halt production at an automotive thermal systems
subsidiary in July 2009 due to the severe impact from
production cuts. We are also examining a reorganization of
the overseas marketing structure for printing machinery to
make it more efficient.
Given the severity of the business conditions, we have
reduced the remuneration of all officers as from April 2009.
Sales securing activities
Expanding the short-term contract service business will
prove effective in securing sales for fiscal 2009. Moreover,
we aim to relocate personnel of the Mass and Medium-Lot
Manufactured Machinery segment to the service operations
to enhance customer visit services, proposal-type services,
and service business for reselling of pre-owned machinery
such as printing machinery.
We shall also strengthen sales activities by estab-
lishing meetings of company-wide sales managers,
sharing market and customer information, expanding
joint sales activities and holding focused discussions of
the latest market and customer trends at Executive
Committee meetings.
Actions to cope with a strong yen
To construct a business framework that is not easily
impacted by exchange-rate fluctuations, while maintaining
attention to quality, we are working to establish the optimal
global procurement network. We are also working to
expand overseas production and increase the portion of
business costs paid for in overseas currencies.

ANNUAL REPORT 2009 9
Measures to Strengthen Growth BusinessesEnergy & Environment business
Given the rise in measures across the world to address the
global environment, we aim to globally expand our Energy
& Environment business as an important growth business.
Gas turbines
Utilizing our technology assets, we have fully developed
and are ready to launch the J-series gas turbines featur-
ing the world’s largest power generation capacity and
highest thermal efficiency. Compared with conventional
coal-fired power generation, the J-series achieves
approximately a 50% cut in CO2 emissions. It can there-
fore considerably contribute to global warming prevention
measures. Responding to the expanding global demand,
we plan on constructing a system that can produce 50
units annually by fiscal 2012, but our final decision on
investment timing will be based on market trends.
Jointly with leading global manufacturer, General
Electric, we are developing steam turbines for gas turbine
combined cycles. Combining the cutting-edge technolo-
gies of both companies, we aim to develop highly efficient
and reliable turbines.
Integrated coal gasification combined cycle (IGCC)
We anticipate a growing demand for IGCC, which uses the
coal, one of the most stable of resources. Moreover, many
speculate that an extremely large market will develop for
IGCC + carbon dioxide capture and storage (CCS) sys-
tems, which combine CO2 capture technology, a technol-
ogy in which our expertise is considered globally top class.
Renewable energy
In addition to our wind turbine business, which includes
offshore wind turbines, we have ongoing initiatives to
promote a broad range of products to suit various geo-
graphical characteristics such as solar cells, world-class
geothermal generation and biomass power generation.
Fuel
Use
Environmental measures
Coal/PetroleumNatural gasAlternative fuelsRenewable energy
Electric power
Nuclear fuel
Atomic
power reactor
(Power Systems)
Wind turbines
(Power Systems)
Solar cells
(Power Systems)
Geothermal
(Power Systems)
Biomass
(Machinery &
Steel Structures)
GTCC
(Power Systems)
IGCC
(Power Systems)
Conventional
power plant
(Power Systems)
Fuel cells
(Power Systems)
Nuclear
fuel cycle
CTL/GTL (Machinery &
Steel Structures)
Lithium batteries
(Power Systems)
Turbo chillers (Air-Conditioning
& Refrigeration Systems)
Seawater desalinization
(Power Systems)
Hybrid cars
Electric carsAutomobiles
Energ
y conversio
n
Denitration
(Power Systems)
Desulfurization (Machinery &
Steel Structures)
CO2 recovery (Machinery &
Steel Structures)
EOR (Machinery &
Steel Structures)
CO2 storage (Machinery &
Steel Structures)
CTL: Coal to Liquid, GTL: Gas to Liquid, GTCC: Gas Turbine Combined Cycle, IGCC: Integrated coal Gasification Combined Cycle, EOR: Enhanced Oil Recovery

MITSUBISHI HEAVY INDUSTRIES, LTD.10
Nuclear energy
We are actively expanding global orders for the 1,700 MWe
class large strategic reactors, US-APWR and EU-APWR,
and for the 1,100 MWe class mid-sized strategic reactor,
ATMEA1, the latter of which we are developing jointly with
French company AREVA.
We also aim to expand the business scale of our fuel
business, including overseas expansion and the establish-
ment of Mitsubishi Nuclear Fuel Co., Ltd., which will be
active in all aspects of the business, including design,
development, manufacturing and sales.
APWR: Advanced Pressurized Water Reactor
Lithium-ion batteries
In preparation for growing demand in the future, we are
promoting the development of future products.
Aerospace
We are making steady progress in advanced projects for
the future.
Commercial aircraft business
Development is progressing rapidly for the Mitsubishi
Regional Jet (MRJ), a revolutionary next-generation jet. The
basic plan is now complete and we have mostly selected
our primary equipment partners. Our aim is to make the
first flight in 2011 and deliver the first aircraft in 2013. As
for the Boeing 787 composite-material wing boxes, mass
production will be in full-scale from fiscal 2009. Regarding
commercial aircraft engines, we are currently developing a
new type of engine for B787 and Airbus.
Space equipment business
In September 2009, the first launch of our H-IIB launch
vehicle, which is an upgraded version of the H-IIA, is
scheduled. It will be mounted with a demonstration model
of the H-II transfer vehicle (HTV) currently under develop-
ment, which will deliver supplies to the International
Space Station.
Defense-related business
In addition to participating in the development of the suc-
cessor to the F-4 fighter, we are also involved in the joint
development of ballistic missile defense (BMD) by Japan
and the U.S.
Transportation systems, Plant engineering
We are expanding our operations in these areas globally.
Fertilizer and methanol plants
We are strongly promoting fertilizer and methanol plants,
focusing on securing orders from emerging economies.
With our focus overseas, we are also steadily marketing
CO2 capture plants targeting not only chemical plants, but
also enhanced oil recovery (EOR) and CCS which are
growth areas.
Transportation systems
We are also strengthening our activities in large-scale
projects that are being accelerated under economic stim-
ulus measures.
Accelerated expansion of downstream businesses
Our downstream businesses, mostly related to services
and operation, are modeled to facilitate expansion of
business scale through the utilization of external resources.
We shall continue to further expand these businesses.
Building a global network for power systems after
sales services
Presently, we have bases in Asia and the U.S. and are
now looking to strengthen our presence in Europe and
the Middle East. We have acquired Maintenance Partners
NV of Belgium and are progressing towards the establish-
ment of a tri-polar global structure.
Expansion of alliances
Aiming to expand our sales of key components and
acquire license fees, we are expanding a joint-venture
business with Larsen & Toubro Limited of India for the
manufacturing of boilers and steam turbines.
Chemical plants in the Middle East
Also, through investments in chemical plants in the Middle
East, we are expanding our business and accumulating
operational know-how.

ANNUAL REPORT 2009 11
Strengthening of business in transportation system
operations
In the U.S., we are boosting our transportation system
operations and have established the Operation & Mainte-
nance business company.
Building an optimal business operation system
The Machinery & Steel Structures Headquarters is making
a considerably shift towards growth business. Its current
organization has many medium-sized products and we
plan to build a new business structure to accelerate our
creation of management processes suited to global
development and our transformation to highly profitable
business units.
Sustained investments into growth businesses and
key technologies
We plan to allocate ¥120 billion in fiscal 2009 for R&D
investment which we aim to use for large-scale develop-
ment projects, development of key technologies that will
lead to next-generation products and to accelerate the
“open innovation” initiative, which involves collaboration
with world-class experts.
Securing key personnel for future growth
We plan to continue our recruitment drive and hire
approximately 1,500 new graduates in fiscal 2009. We
also continue to actively hire career professionals. The
hiring of personnel is integral to our management strate-
gies for enterprise growth. While we are actively recruit-
ing personnel to expand in the field of growth
businesses, with the future firmly in mind, we plan to
continue to hire key personnel in the Mass and Medium-
Lot Manufactured Machinery business, which is currently
facing a difficult business environment.
Development of Our Next Medium-Term Business PlanIn fiscal 2009, we shall formulate a new business plan that
reflects the changes of the current business environment
and plan to announce the new plan in April 2010. In our
formulation of the new plan, we shall focus our sights on
business restructuring to strengthen earning capacity in
the new competitive environment, developing our global
resources through expansion of M&As and overseas pro-
duction, and establishing an optimal business operational
structure that includes alliances and Group companies.
Classification SegmentOrders received Net sales
Operating income (loss)
FY2008FY2009 Forecast
FY2008FY2009 Forecast
FY2008FY2009 Forecast
Ordered Goods
Shipbuilding & Ocean Development 271.3 120.0 240.1 240.0 1.6 11.0
Power Systems 1,148.8 1,380.0 1,209.1 1,130.0 80.0 62.0
Machinery & Steel Structures 527.8 420.0 542.2 500.0 31.6 26.0
Aerospace 510.8 550.0 512.3 490.0 (10.3) (6.0)
Subtotal 2,458.9 2,470.0 2,503.8 2,360.0 102.9 93.0
Mass and Medium-Lot
Manufactured Machinery
General Machinery & Special Vehicles 439.3 320.0 432.7 320.0 (1.3) (14.0)
Air-Conditioning & Refrigeration Systems 186.2 140.0 187.5 140.0 (2.4) (12.0)
Industrial Machinery 141.3 120.0 185.0 130.0 (3.1) (9.0)
Mass and Medium-Lot Manufactured Machinery total 767.0 580.0 805.4 590.0 (7.0) (35.0)
Others 99.0 100.0 121.1 100.0 9.9 7.0
Inter-group consolidation adjustments (56.2) (50.0) (54.7) (50.0) – –
Total 3,268.7 3,100.0 3,375.6 3,000.0 105.8 65.0
(In billions of yen)

MITSUBISHI HEAVY INDUSTRIES, LTD.12
Topics: Energy & Environment Business
MHI’s Energy & Environment business strategyBy applying its comprehensive capabilities and strengths
in integration, MHI has the following concrete business
strategies to expand its business.
(1) Create next generation businesses by putting
strengths of existing businesses to good use.
By utilizing GTCC, wind turbines, nuclear power
plants, chemical plants and other existing businesses,
we shall invest in next-generation businesses such as
IGCC, CCS, photovoltaic and solar thermal power
plants, offshore wind turbines, EV related businesses
and eco-houses.
(2) Expand business opportunities through com-
prehensive proposals of energy/environment-
related products (policies).
We are providing comprehensive proposals to contrib-
ute to a country’s clean energy policies by utilizing our
technologies and know-how.
(3) Accelerate global expansion (expand base net-
works and form alliances).
We expect our individual businesses to expand in line
with the expansion of business opportunities. From
the perspective of risk management, however, we aim
to expand our businesses by forming alliances.
Applying comprehensive capabilities through integration of product operationsIn April 2008, MHI established, under the direct control of
the President, the Sustainability Energy & Environment
Strategic Planning Department to strengthen the company-
wide strategies of the energy & environment businesses.
Looking forward, MHI, guided by the activities of this
department, shall strengthen its existing businesses and
work to create new businesses by integrating technologies
that have been developed in a broad range of fields,
aiming to be a leading company in the energy and envi-
ronmental fields.
By striving for business expansion based on the
above business strategies, MHI is aiming to lift its total
sales of energy and environment related products from
the current ¥2 trillion to ¥3 trillion in 2012 and beyond.
Green energy revolution is becoming the global mainstreamAll nations and regions place social investment into energy
and the environment at the core of their economic stimulus
measures. The challenge of constructing an infrastructure
for a low-carbon society is one shared globally.
We expect investment in low-carbon social infrastruc-
tures to increase in the coming years. According to the
latest world green energy-related investment forecasts
(IEA), such investment is expected to peak during 2030–
50 at a scale of ¥50 trillion per year.
New business opportunities are expectedNow that the creation of this new market has started, MHI
is identifying considerable business opportunities. MHI is
uniquely equipped with technologies and products in a
wide range of fields that can be applied equally to the
stable supply of energy or to the reduction of environmen-
tal impacts. We can provide integrated solutions for
achieving a low-carbon society.
Contribute to creation of
low-carbon social infrastructure
High-efficiency power plants
Energy-saving products
Innovation in other
infrastructures
Innovation in electricity
infrastructures
Innovation in transportation
systems
Renewable energy
Nuclear power plants

ANNUAL REPORT 2009 13
Nuclear power plants
High-efficiency power plants
Energy-saving products
Innovation in other infrastructures
Renewable energy
Innovation in transportation systems
Innovation in electricity infrastructures
As they emit no CO2 at the point of electricity generation, nuclear power plants are a very important technology for constructing a low-carbon society. MHI is devel-oping the US/EU-APWR and the nuclear fuel cycle.
The improvement of efficiency in fossil fuel power plants is essential from the viewpoints of effective utilization of energy and CO2 reduction. MHI is engaged in global cutting-edge technological development, which includes GTCC and IGCC.
In order to contribute to energy-saving on the energy demand side such as in homes or build-ings, MHI is advancing techno-logical development such as eco-friendly houses that utilize heat-pump hot water systems and lithium-ion batteries.
MHI is developing a wide range of infrastructural technologies other than power plants etc. such as seawater desalination plants, CTL (Coal to Liquid) plants and bio-fuel synthetic.
In order to effectively utilize non-exhaustible clean energy, in addi-tion to its main focus of wind turbines, MHI is developing pho-tovoltaic and solar thermal power plants, geothermal power plants, and hydropower plants.
In order to reduce CO2 emissions in transportation fields, it is essen-tial that we increase efficiency and make the modal shift to electrifi-cation. MHI contributes to CO2 reductions in transportation fields by developing technologies such as MRJ (Mitsubishi Regional Jet), Eco-ships and LRT.
In order to depart from fossil fuels and promote energy saving, it is important that we become energy societies based on easy-to-use and highly-efficient electrical energy. MHI contributes to reform-ing the electricity infrastructure in areas such as lithium-ion batteries.
GTCC: Gas Turbine Combined Cycle
IGCC: Integrated coal Gasification Combined Cycle
CCS: Carbon dioxide Capture and Storage
EV: Electric Vehicle
APWR: Advanced Pressurized Water Reactor
LRT: Light Rail Transit
MITSUBISHI HEAVY INDUSTRIES, LTD.14
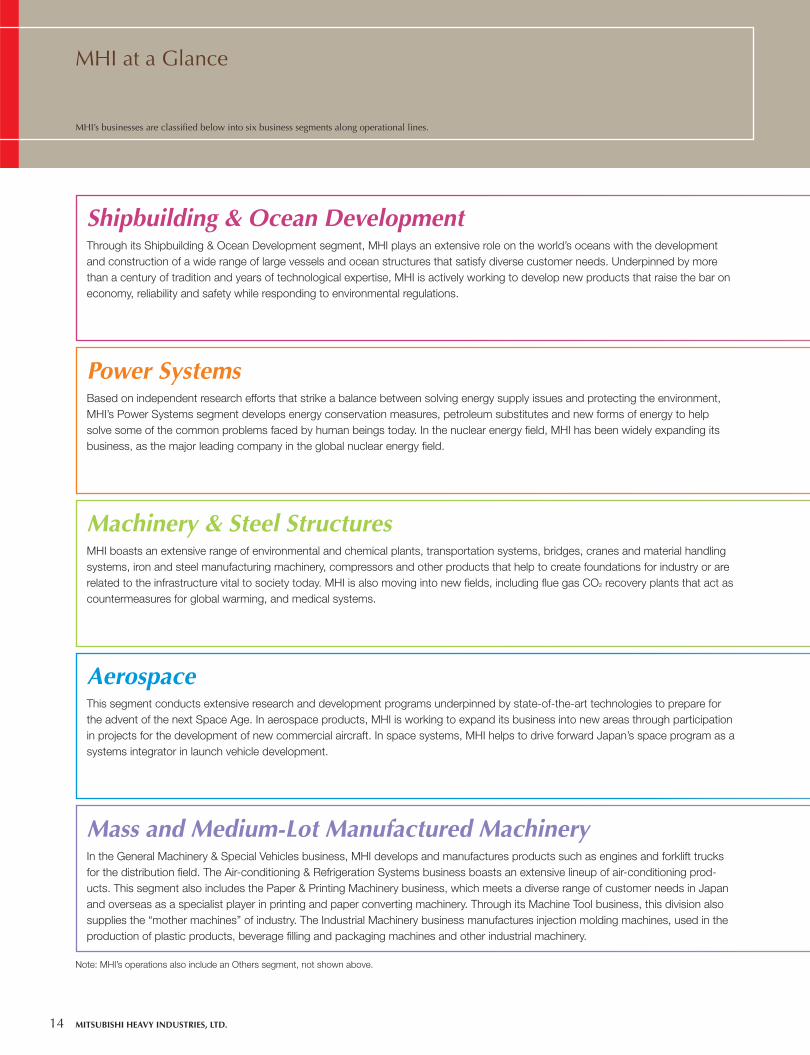
MHI at a Glance
MHI’s businesses are classified below into six business segments along operational lines.
Note: MHI’s operations also include an Others segment, not shown above.
Shipbuilding & Ocean Development
Power Systems
Machinery & Steel Structures
Aerospace
Mass and Medium-Lot Manufactured Machinery
Through its Shipbuilding & Ocean Development segment, MHI plays an extensive role on the world’s oceans with the development and construction of a wide range of large vessels and ocean structures that satisfy diverse customer needs. Underpinned by more than a century of tradition and years of technological expertise, MHI is actively working to develop new products that raise the bar on economy, reliability and safety while responding to environmental regulations.
Based on independent research efforts that strike a balance between solving energy supply issues and protecting the environment, MHI’s Power Systems segment develops energy conservation measures, petroleum substitutes and new forms of energy to help solve some of the common problems faced by human beings today. In the nuclear energy field, MHI has been widely expanding its business, as the major leading company in the global nuclear energy field.
MHI boasts an extensive range of environmental and chemical plants, transportation systems, bridges, cranes and material handling systems, iron and steel manufacturing machinery, compressors and other products that help to create foundations for industry or are related to the infrastructure vital to society today. MHI is also moving into new fields, including flue gas CO2 recovery plants that act as countermeasures for global warming, and medical systems.
This segment conducts extensive research and development programs underpinned by state-of-the-art technologies to prepare for the advent of the next Space Age. In aerospace products, MHI is working to expand its business into new areas through participation in projects for the development of new commercial aircraft. In space systems, MHI helps to drive forward Japan’s space program as a systems integrator in launch vehicle development.
In the General Machinery & Special Vehicles business, MHI develops and manufactures products such as engines and forklift trucks for the distribution field. The Air-conditioning & Refrigeration Systems business boasts an extensive lineup of air-conditioning prod-ucts. This segment also includes the Paper & Printing Machinery business, which meets a diverse range of customer needs in Japan and overseas as a specialist player in printing and paper converting machinery. Through its Machine Tool business, this division also supplies the “mother machines” of industry. The Industrial Machinery business manufactures injection molding machines, used in the production of plastic products, beverage filling and packaging machines and other industrial machinery.

100
005 06 07 08 09
200
300
400
100
005 06 07 08 09
200
300
10
0
20
30
600
300
900
005 06 07 08 09
1,200
1,500
10
20
0
30
40
50
200
005 06 07 08 09
400
600
10
0
20
30
200
005 06 07 08 09
400
600
10
0
20
30
250
005 06 07 08 09
750
1,000
10
0
30
500 20
40
500
005 06 07 08 09
1,000
1,500
20
005 06 07 08 09
80
60
40
100
005 06 07 08 09
200
400
600
10
–1005 06 07 08 09
30
20
40
0
200
005 06 07 08 09
400
600
800
250
005 06 07 08 09
500
750
1,000
0
–1505 06 07 08 09
15
30
05 06 07 08 09–10
0
10
20
30
50
40
–10
–2005 06 07 08 09
0
10
A breakdown for fiscal years up to 2005 is not disclosed.
ANNUAL REPORT 2009 15
35.8%
16.1%
15.2%
23.8%
7.1%
Share of Net Sales Orders Received Net Sales/Share of Net Sales Operating Income (Loss)(In billions of yen) (In billions of yen) (%)
General Machinery & Special VehiclesAir-conditioning & Refrigeration SystemsIndustrial MachineryShare of Net Sales
General Machinery & Special VehiclesAir-conditioning & Refrigeration SystemsIndustrial Machinery
General Machinery & Special VehiclesAir-conditioning & Refrigeration SystemsIndustrial Machinery
(In billions of yen)

1.6
11.0
240.1
240.0271.3
120.0
Operating income(In billions of yen)
Shipbuilding &Ocean Development
Net sales(In billions of yen)
Orders received (In billions of yen)
FY2008 FY2009[Actual] [Forecast]
MITSUBISHI HEAVY INDUSTRIES, LTD.16
Review of Operations
Shipbuilding & Ocean Development
Fiscal 2008 ReviewAmid the sudden contraction in the global demand for
new shipbuilding, the MHI Group focused its sales
activities on our strongest types of ships. We received
orders for a total of 18 ships including 8 pure car and
track carriers, 3 oil tankers, 2 container ships as well as
1 escort ship and 1 submarine for the Japan Ministry of
Defense. As a result, the total value of consolidated
orders totaled ¥271.3 billion (US$2,762 million), falling
from the previous year when the maritime transport
market conditions were favorable. Outstanding orders at
the end of the fiscal year were for 66 ships, for a total of
approximately 3.85 million gross tons.
Consolidated net sales totaled ¥240.1 billion
(US$2,445 million), with deliveries of a total of 23 ships
including 10 pure car and track carriers and 5 LNG carri-
ers. Operating income was ¥1.6 billion (US$16 million).
Despite the progress of efforts to improve profitability, oper-
ating income declined because of the appreciation of the
yen coupled with higher steel and other materials prices.
FY2009 forecast:Orders received: 120.0 billion yen
Net sales: 240.0 billion yen
Operating income: 11.0 billion yen
ProductsManufacturing, installation, sale and repair of crude oil carriers, container ships, cruise ships, car ferries, LPG carriers, LNG carriers and various other ships, defense vessels, offshore structures, etc.
LNG Carrier “SERI BALHAF”

ANNUAL REPORT 2009 17
(2) Sales securing activities
• Shift focus to specified projects (including special
ships) and ocean development business
• Strengthen response capability to orders and devel-
opment, and strengthen cost competitiveness
(3) Actions to cope with a strong yen
• Renegotiation reflecting most recent business peri-
od’s exchange rates and steel prices
Future InitiativesIn this segment, we shall promote the “two-track man-
agement” of emergency measures to secure profits in the
short term, and measures for strengthening operations
toward future negotiations. We shall weather the crisis
through company-wide determination in the face of chal-
lenging times.
As part of the emergency measures, our primary
challenge is to secure our sales targets for 2012 and
beyond. We are also concentrating our efforts on cost
reduction measures based on two pillars: changing the
shipbuilding process and strengthening and accelerating
manufacturing innovation promotion activities.
Concrete activities
(1) Cost reduction activities
• Accelerate productivity enhancement through
production process reforms
• Accelerate manufacturing innovation activities
• Review of resources
Pure Car and Truck Carrier “TOREADOR” Passenger/Ro-Ro Cargo Ship “FERRY AKEBONO”

FY2008 FY2009
80.0
62.0
1,209.11,130.0
1,148.8
1,380.0
Operating income(In billions of yen)
Power Systems
Net sales(In billions of yen)
Orders received (In billions of yen)
[Actual] [Forecast]
MITSUBISHI HEAVY INDUSTRIES, LTD.18
Review of Operations
Power Systems
Fiscal 2008 ReviewWithin Japan, improvement, reform and maintenance
services for existing plants were firm, and orders were also
received for large-scale thermal power plants. Overseas,
the MHI Group worked to win more orders, especially in
Southeast Asia and the Middle East. Contracts were con-
cluded for gas turbine combined cycle thermal power
plants in Indonesia, Qatar and other countries and an
order was received for nuclear power turbines in China.
Nevertheless, with the cancellation of a wind turbine con-
tract and a series of project postponements and suspen-
sions in the second half, the total value of consolidated
orders declined to ¥1,148.8 billion (US$11,695 million).
Consolidated net sales rose to ¥1,209.1 billion
(US$12,309 million) with the construction of new power
plants and growth in improvement, reform and mainte-
nance services of existing plants. Operating income
increased to ¥80.0 billion (US$814 million), with greater
profits from the higher net sales.
FY2009 forecast:Orders received: 1,380.0 billion yen
Net sales: 1,130.0 billion yen
Operating income: 62.0 billion yen
ProductsPower SystemsManufacturing, installation, sale and repair of boilers, steam turbines, gas turbines, diesel engines, water turbines, wind turbines, SCR (DeNOx) systems, marine machinery, and desalination plants, etc. Nuclear Energy SystemsManufacturing, installation, sale and repair of nuclear power plants and equipment, advanced reactor plants, nuclear fuel cycle plants, etc.
Kaliakra Wind Power Generation Farm

ANNUAL REPORT 2009 19
(2) Sales securing activities
• Shift to after-sales services by assigning key resources
• Provision of fine-tuned services corresponding to the
requirements of each plant
(3) Actions to cope with a strong yen
• Accelerate global sourcing/production
Future InitiativesAlthough we are experiencing a short-term drop in the
overall market in this segment, early recovery is expected
in the energy/environment sector, which is where the MHI
Group will focus in the future. We are preparing for a
recovery in demand, which is expected to occur in the
near future, and are continuing to allocate resources.
Moreover, as a leading company in the global nuclear
energy field we shall continue to allocate resources to
improve the availability factor of nuclear power plants and
contribute to reducing CO2 emissions.
Concrete activities
(1) Cost reduction activities
• Strengthening of procurement capability (SCM
optimization, etc.)
• Low-price procurement (through simplified specifica-
tions, sharing, adoption of standard products)
• Planned procurement of large/special materials
• Tight budget controls for existing contracts
• Shortening work periods by improving the accuracy
of project planning and management (after-sales
services and construction)
• Elimination of nonconformance by thorough
advance verification
Replacement Reactor Vessel Head for
Nuclear Power Plant
Replacement Core Internal for
Nuclear Power Plant
Gas Turbine Power Combined Cycle Plant
(Chubu Electric Power Company)

FY2008 FY2009
31.6
26.0
527.8
420.0
542.2
500.0
Operating income(In billions of yen)
Machinery &Steel Structures
Net sales(In billions of yen)
Orders received (In billions of yen)
[Actual] [Forecast]
MITSUBISHI HEAVY INDUSTRIES, LTD.20
Review of Operations
Machinery & Steel Structures
Fiscal 2008 ReviewOverseas, while orders for transportation systems declined
with the cancellation of major planned projects, energetic
marketing efforts won orders for large-scale fertilizer plants
and iron and steel manufacturing machinery. Within Japan,
material handling machines and other orders declined as
business negotiations were postponed amid the acceler-
ating review of corporate capital investment plans. As a
result, the total value of consolidated orders declined to
¥527.8 billion (US$5,373 million).
Consolidated net sales rose to ¥542.2 billion
(US$5,519 million) with higher sales of iron and steel man-
ufacturing machinery and compressors. Operating income
increased to ¥31.6 billion (US$321 million) with greater
profits from the higher net sales and the progress of mea-
sures to improve profitability.
FY2009 forecast:Orders received: 420.0 billion yen
Net sales: 500.0 billion yen
Operating income: 26.0 billion yen
ProductsManufacturing, installation, sale and repair of transpor tation systems, toll and fare collection machinery and other ITS equipment, petro-chemical plants, flue gas desulfurization sys-tems, flue gas CO2 recovery plants and various other chemical plants, oil and gas production plants, compressors and turbines, iron and steel manufacturing machinery, automotive products, medical systems, semiconductor production equipment and other advanced equipment, transportation equipment, cranes and material-handling systems, rubber and tire machinery, waste treatment equipment, electrostatic precipitator and various other environmental control systems, bridges, hydraulic gates, stacks, parking systems, tanks, and various other steel products, etc.
Methanol Plant (Saudi Arabia)

ANNUAL REPORT 2009 21
(2) Sales securing activities
• Additional sales (after-sales services, small-scale
construction, etc.)
• Focus on areas with demand
(infrastructure investments in line with fiscal policy,
investments in industrial infrastructure of emerging
markets, food security (population increase, eco-
nomic development))
• Strengthening of competitiveness (costs, sales,
services)
(3) Actions to cope with a strong yen
• Measures to hedge exchange rate risk through a
distribution of contracts in different currency
denominations
Future InitiativesAlthough the market environment surrounding this seg-
ment continues to be severe and further growth efforts
are required, there is the expectation of additional orders
for chemical plants and iron and steel manufacturing
machinery in the second half of fiscal 2009. Moreover,
early recovery is expected in the energy/environment
sector, which is where the MHI Group will focus in the
future and we are continuing to inject resources in prepa-
ration for a recovery in demand.
Concrete Activities
(1) Cost reduction activities
• Complete management of construction work at hand
• Standardization/sharing innovations
• Overall strengthening of quality control system
• Supply chain innovations (joint purchasing, strength-
ening ties with overseas partners)
Crystal Mover for Atlanta International Airport Onboard Equipment for ETC System “MOBE-500 series”

FY2008 FY2009
(10.3)
510.8
490.0512.3
550.0
Operating income (In billions of yen)
Aerospace
Net sales (In billions of yen)
Orders received (In billions of yen)
[Actual] [Forecast]
(6.0)
MITSUBISHI HEAVY INDUSTRIES, LTD.22
Review of Operations
Aerospace
Fiscal 2008 ReviewIn commercial aircraft, orders were less than the previous
year because of the decline of orders for aft fuselage and
other components for the Boeing 777 due to a strike at
Boeing (U.S.A.). Orders for defense-related products also
fell because the government completed procurement of
the F-2 fighter in the previous year, while orders for guided
missiles and for modifying the F-15 fighter remained firm.
In space systems, orders also declined despite some
successes including the first overseas order for launch
services by the H-IIA rocket from South Korea agency. As
a result, the total value of consolidated orders declined to
¥510.8 billion (US$5,200 million).
Consolidated net sales totaled ¥512.3 billion
(US$5,215 million), surpassing the previous year, with
increased sales of defense-related products notwithstand-
ing the decrease of sales of commercial aircraft. Operating
income totaled loss of ¥10.3 billion (US$105 million),
mostly due to the appreciation of the yen.
FY2009 forecast:Orders received: 550.0 billion yen
Net sales: 490.0 billion yen
Operating income: –6.0 billion yen
ProductsManufacturing, installation, sale and repair of fighters, helicopters and other aircraft, struc-tural parts and components of commer cial transport aircraft, aero engines, missiles, torpedoes, and space systems, launch services via launch vehicles and Mitsubishi Regional Jet
Boeing 787 Transport Aircraft (international collaboration)

ANNUAL REPORT 2009 23
(2) Sales securing activities
• Strengthening of sales and service capabilities
• Boosting of after-sales service business and associ-
ated businesses
(3) Actions to cope with a strong yen
• Accelerate global sourcing/production
Future InitiativesIn this segment, although demand for commercial aircraft
slowed temporarily as airlines faced worsening business
conditions, we will carry out mid/long term strategic
investments because long-range expansion of the market
is expected.
Also business structure will be strengthened through
manufacturing improvements and production system
innovation activities.
Concrete activities
(1) Cost reduction activities
• Promotion and acceleration of innovation in
manufacturing
• Productivity improvements through reform of produc-
tion processes
• Standardization, commoditization
• Supply chain reform
Mitsubishi Regional Jet (MRJ) H-IIA Launch Vehicle Flight No. 15

FY2008 FY2009
(7.0)
(35.0)
(3.1)(2.4)(1.3)
(9.0)
(12.0)
(14.0)
Operating income(In billions of yen)
GM & SV
Air-con
Industrial
Orders received(In billions of yen)
Net sales(In billions of yen)
[Actual] [Forecast]
GM & SV : General Machinery & Special VehiclesAir-con : Air-conditioning & Refrigeration SystemsIndustrial : Industrial Machinery
767.0
805.4
580.0
590.0
MITSUBISHI HEAVY INDUSTRIES, LTD.24
Review of Operations
Mass and Medium-Lot Manufactured Machinery
Fiscal 2008 ReviewIn the General Machinery and Special Vehicles business,
domestic orders for special vehicles remained firm. In con-
trast, after strong performance in the previous year, forklift
orders slumped as customers refrained from purchases,
despite efforts to reinforce our sales network and enrich
our product lineup. Orders for turbochargers also declined
under large-scale production adjustments by automobile
manufacturers. As a result, the total value of consolidated
orders and net sales in the General Machinery and Special
Vehicles business fell to ¥439.3 billion (US$4,473 million)
and ¥432.7 billion (US$4,405 million), respectively, with an
operating loss of ¥1.3 billion (US$14 million).
FY2009 forecast:Orders received: 580.0 billion yen
Net sales: 590.0 billion yen
Operating income: –35.0 billion yen
ProductsGM&SVManufacturing, installation, sale and services of forklift trucks, construction machinery, earth-moving and grading machinery, medium- and small-sized engines, turbochargers, agricultural machinery, tractors, special vehicles, etc.Air-conAir-conditioners (commercial use, residential), automotive thermal systems, chilling systems, etc.Paper & Printing Machinery Sheet-fed offset presses, commercial web offset presses, newspaper offset presses, corrugating machinery, and box making machinesMachine Tool Various machine tools, precision cutting tools, engine valves, power transmissions, etc.Industrial MachineryPlastic processing machinery, food and packing machinery, etc.Internally Toothed Ring Gear
Grinding Machine “ZI20A”
Inverter Integrated Electric
Scroll Compressor “EV30AN”Mitsubishi Forklift Trucks (Internal combustion model)
Sheet-fed Offset Press “DIAMOND V3000”
GM & SV
Air-con
Industrial
General Machinery & Special Vehicle Headquarters
Air-conditioning & Refrigeration Systems Headquarters
Paper & Printing Machinery Division
Machine Tool Division
Industrial Machinery

ANNUAL REPORT 2009 25
an emphasis on profitability to lay solid business foundations
that will pave the way for growth strategies in the future.
Concrete Activities
(1) Cost reduction activities
• Standardization/commoditization reform
• Product reliability reform
• Supply chain reform
(2) Sales securing activities
• Expand service projects
• Focus on needs in emerging countries and target the
energy/environmental sectors
(3) Actions to cope with a strong yen
• Expand production in emerging countries (Thailand,
China, India)
• Actively step up overseas procurement
Air-Conditioning and Refrigeration Systems
Under the current business conditions, the situation has
become difficult because of the slowdown in residential
and commercial use air- conditioners and a massive slow-
down by Japanese and U.S. automakers who are the
main customer for our automotive thermal systems.
Operating under these conditions we are quickly respond-
ing to market trends such as adjusting operations of
domestic production lines and temporarily suspending pro-
duction at a U.S. automotive thermal systems subsidiary.
In the Air-conditioning and Refrigeration Systems busi-
ness, domestic and foreign orders both declined despite
efforts to reinforce our sales networks. Orders for automo-
tive thermal systems slumped, while orders for residential
and commercial use air-conditioners also declined, espe-
cially in Europe where demand had remained strong in
recent years. The total value of consolidated orders and
net sales in the Air-conditioning and Refrigeration Systems
business decreased to ¥186.2 billion (US$1,895 million)
and ¥187.5 billion (US$1,909 million), with an operating
loss of ¥2.4 billion (US$24 million).
In the Industrial Machinery business, orders slumped
amid the marked downturn in capital investment, as orders
for sheet-fed offset presses declined where many business
negotiations were postponed or suspended because of
the rapid appreciation of the yen. Machine tool orders fell
with the abrupt drop in demand, particularly in automobile-
related industries. Consequently, the total value of con-
solidated orders and net sales in the industrial machinery
business declined to ¥141.3 billion (US$1,439 million) and
¥185.0 billion (US$1,883 million), respectively, with an
operating loss of ¥3.1 billion (US$32 million).
Future InitiativesGeneral Machinery and Special Vehicles
As the current downturn in the market is expected to con-
tinue for the time being, we intend to comprehensively cut
costs to boost profits and implement product strategies with
Twin Scroll Turbochargers Refrigeration Unit for Trailer “TFV2000D” PEGASUS

MITSUBISHI HEAVY INDUSTRIES, LTD.26
Concrete Activities
(1) Cost reduction activities
• Operation adjustments (temporary production halt at
U.S. branch (MCC), adjustment of production lines at
domestic plants)
• Innovation in manufacturing (improved activities at
MACO (Thailand))
(2) Sales securing activities
• Solutions business (comprehensive system propos-
als of air-conditioning equipment for offices and
plants, operation of its own business)
• Service business (focus on expanding the service
business, strengthening the stock business)
• Transport refrigeration units (by mounting scroll
compressors, capture demand of products for new
trucks complied with the new emission control)
• Residential use air-conditioners (measures to
respond to Eco Point)
• Expand sales of centrifugal chiller by launching
new models
(3) Actions to cope with a strong yen
• Aim to transfer production to overseas for air-
conditioning parts to put more costs in dollar
denominations
Industrial Machinery
Under the current business conditions, the situation has
become difficult as a result of the global demand for
paper and printing machinery coming to a standstill in the
economic slowdown and a slowdown in demand for
automobile-related machine tools due to the current auto-
maker doldrums. On the other hand, signs of recovery are
starting to appear in the markets of the emerging coun-
tries such as China and we are striving to sustain sales by
accelerating sales expansion.
Concrete Activities
(1) Cost reduction activities
• Step up and accelerate innovative activities in
manufacturing
• Relocate staff within the division as well as in the
other divisions of MHI
• Radically reduce selling expenses, advertising
expenses etc.
• Review equipment investment plan
(2) Sales securing activities
• Increase the certainty of order receipts through
speedier responses in negotiations and higher
levels of judgment
• Expand sales by launching new models
• Expand after-service business
• Focus on increasing exports to potential markets
• Provide machining technology support for customers
in order to generate demand
(3) Actions to cope with a strong yen
• Increase local presence (expanding global procure-
ment through standardization, transferring more roles
to overseas subsidiaries)
Box Making Machine “EVOL Flexo Folder Gluer” Horizontal Boring Mill “MAF150R”

ANNUAL REPORT 2009 27
Intellectual Property and R&D
Intellectual Property: An Integrated Approach Linking Business Activities and R&DMHI’s intellectual property activities are an integral part of
its business and R&D strategies.
MHI has established a team made up of members
from its business divisions (sales and design personnel)
and R&D and intellectual property departments for each
core, mainstay and new product line. By sharing informa-
tion from a wide variety of sources—business plans, busi-
ness schemes, product development, R&D policy,
technology roadmaps, and analyses of R&D trends and
patents at both MHI and other companies—the team
works to formulate an optimal intellectual property strategy.
To promote activities in line with this strategy, the
Intellectual Property Division develops effective and effi-
cient business processes, takes steps to manage intel-
lectual property appropriately, and develops highly
specialized and skilled personnel.
Guided by MHI’s fundamental business strategy of
adopting a more international approach in its operations,
and the basic R&D strategy of ensuring that MHI remains
successful in the face of ever-intensifying competition
worldwide, the Intellectual Property Division is shifting the
focus of patent acquisition from the domestic market to a
more aggressive global approach.
MHI’s Intellectual Property Activities PolicyMHI’s priority in acquiring patents is to protect its technol-
ogy assets and competitiveness. Accordingly, we take
every possible step to apply for and acquire patents for
technologies we have developed that will be used in MHI
products. Although this is partly to protect our technology
assets from copying by other parties, our main aim here is
to ensure that our customers can use MHI products with
peace of mind.
Against a backdrop of fierce competition in new
technology development between companies worldwide,
our integrated approach to intellectual property activities
is based on two key principles—protecting the results of
R&D with patents, and promoting global patent-
protected manufacturing.
Intellectual Property Strategy
Analysis of R&D Trends and Patentsat MHI and Other Companies
Intellectual Property Division
Business PlansBusiness Schemes
Product Development
IntellectualProperty
Management
HumanResources
Training
BusinessDivisions
R&D DivisionR&D PolicyTechnology Roadmaps
8,746
5,473
7,938
5,193
6,965
5,411
6,301
5,165
5,850
5,121
FY08FY07FY06FY05FY040
2,000
4,000
6,000
8,000
10,000
Number of Domestic and Overseas Patents
DomesticOverseas

MITSUBISHI HEAVY INDUSTRIES, LTD.28
Research and Development ActivitiesThrough close cooperation between manufacturing facili-
ties and R&D centers, the MHI Group (the Company and
its consolidated subsidiaries) is working to reinforce its R&D
activities to enhance product competitiveness in the ship-
building & ocean development, power systems, aerospace
and other business fields, and drive business expansion.
Shipbuilding & Ocean Development
In this segment, our goal is to improve the performance
and reliability of ships and ocean structures. R&D activities
cover a wide range of areas—technologies related to the
fluid-dynamic technology to improve ship propulsion; tech-
nologies that increase structural strength; and vibration -
and noise-reduction technologies. These efforts also
encompass technologies that reduce environmental
impact, including those pertaining to fuel efficiency and
fuel tank positioning, to prevent fuel spills and leakage. All
of these efforts are channeled into developing a variety of
ships and other products. These include large-scale vessels
such as liquefied natural gas (LNG) and liquefied petroleum
gas (LPG) carriers, container vessels and car carriers,
which are responsible for the stable transport of goods on
a global scale, as well as large cruise ships and ferries, for
which growth in future demand is expected. We also work
to enhance the performance and reliability of special -
purpose vessels, namely survey and training ships.
Power Systems
Aiming to develop pioneering technologies that realize
stable energy supplies, protect the environment and
achieve greater efficiency, this segment conducts R&D
into clean fuels, such as natural gas and nuclear energy,
and renewable energy technologies, distributed power
systems and high-efficiency generation systems in an
effort to meet market needs covering upstream to down-
stream energy sectors.
Machinery & Steel Structures
R&D in this segment is focused on the development of
technologies and products that enable MHI to supply
high-added-value products and social infrastructure,
among other products. These products and infrastructure
help prevent global warming and protect the environment,
enable land transport and logistics, and support the
supply of basic facilities and energy to the steel, chemical
and other industries.
Aerospace
As Japan’s leading company in the aerospace sector,
MHI develops cutting-edge products leveraging its
years of experience in the development of aircraft and
aerospace equipment.
Mass and Medium-Lot Manufactured Machinery
This segment is involved in the development of technolo-
gies related to a wide range of products that support
today’s industrial infrastructure. In addition to cutting-edge
technologies unique to the products in this segment, MHI
also draws on and applies the latest and most advanced
pioneering technologies from its extensive product lines in
other segments in product development.
R&D Investment(In billions of yen)
* Includes expenses related to R&D under contract.
99.5
124.0
100.7 101.3106.3 107.9
FY08FY07FY06FY05FY040
30
60
90
120
150

Corporate Governance
ANNUAL REPORT 2009 29
Corporate Governance
Fundamental PolicyCommitted to the ethos of customer-first, MHI conducts
its business activities as a responsible corporate citizen
based on consideration for all stakeholders.
MHI is implementing a number of initiatives to
enhance management efficiency and strengthen compli-
ance, including reforming the management system to allow
more effective decision-making in response to radical
changes in the economic environment, and promoting fair
and sound management. MHI is also working to make
management more transparent by disclosing information
rapidly and accurately to shareholders and other external
stakeholders.
Corporate Governance InitiativesCorporate Governance Framework
The Board of Directors makes important management
decisions and oversees the execution of business opera-
tions. MHI is strengthening management oversight func-
tions through the appointment of outside directors. As of
June 25, 2009, of the Company’s 19 directors, three are
from outside MHI. Additionally, MHI has established an
Executive Committee to provide a forum for discussing
important matters related to business execution. This allows
for a more cohesive approach to discussion as part of the
operational execution framework centered on the President,
and consequently leads to more appropriate management
decisions and business execution.
MHI overhauled its corporate governance framework
in June 2005 to improve the soundness and transparency
of management and increase efficiency and flexibility. The
main components of this reform included streamlining the
Board of Directors while increasing the number of outside
directors, shortening the terms of directors, and introduc-
ing an executive officer system. These modifications were
aimed at enhancing the oversight functions of the Board
of Directors and clearly delineating the roles and responsi-
bilities of directors and executive officers. Directors are
responsible for general oversight of the Company’s opera-
tions and making important business decisions, while
executive officers are responsible for the day-to-day busi-
ness and affairs of the Company.
MHI has concluded liability limitation agreements with
each of its outside directors and outside auditors based on
Article 423, Paragraph 1 of the Corporate Law. The limit of
liability pursuant to these agreements is ¥10 million or the
statutory minimum liability limit stipulated in Article 425,
Paragraph 1 of the Corporate Law, whichever is higher.
Enhancing Internal Control Systems
In compliance with the Corporate Law and the Enforcement
Regulations of the Corporate Law, the Board of Directors
has approved resolutions to establish systems that ensure
business operations are conducted in an appropriate
manner. An overview of these resolutions is as follows:
1. System to ensure the execution of duties by
Directors is in compliance with relevant laws and
the Articles of Incorporation
(i) Directors shall lead by example in realizing the
Company’s fundamental principle of fair and
honest business activities that comply with all
relevant laws and emphasize social norms and
business ethics.
(ii) The Board of Directors shall fully discuss all mat-
ters raised and reports submitted by Directors
and monitor the Company’s operations from the
perspectives of sound and efficient manage-
ment. The views of Outside Directors shall be
employed to introduce greater objectivity and
enhance the effectiveness of oversight.
2. System to store and manage information related
to the execution of duties by directors
(i) Principle matters related to the management of
documents shall be specified in Company regu-
lations, and information related to the execution
of duties by directors shall be appropriately
recorded, stored and managed.
(ii) Directors and Statutory Auditors shall be given
access to such information at any time where it
is deemed necessary to supervise and audit
actions by the Directors.

MITSUBISHI HEAVY INDUSTRIES, LTD.30
3. Regulations and other systems to manage risk
(i) Systems designed to manage each type of risk
shall be implemented and responsibilities shall
be clearly defined to ensure the appropriate
management of risk.
(ii) Risk shall be regularly evaluated and analyzed
and necessary avoidance or mitigating measures
taken; internal audits shall monitor the effective-
ness and appropriateness of these measures
and reports shall be regularly submitted to the
Board of Directors.
(iii) To prepare for cases where significant risk may
materialize, the Company shall ensure the
means to immediately communicate information
to senior management to respond promptly and
accurately to emergency situations; individuals
responsible for crisis management shall also be
appointed in each business division.
4. System to ensure directors execute their duties
efficiently
(i) The Board of Directors shall formulate business
plans and establish Companywide management
policy and objectives; business execution, led by
the President, shall be conducted with the aim of
achieving these objectives.
(ii) The Company’s organizational structure, division
of duties, and lines of authority shall be specified in
Company regulations to ensure steps to achieve
management objectives are conducted efficiently.
5. System to ensure the duties and actions of
employees comply with relevant laws and the
Articles of Incorporation
(i) The Company shall create a framework compris-
ing the Compliance Committee and other bodies
to raise awareness of compliance among
employees by formulating a code of conduct,
implementing various training programs and
taking other steps.
(ii) The Company shall establish a whistleblower
system and other mechanisms to enhance the
effectiveness of compliance, conduct internal
audits of the compliance framework, and report
the results to the Board of Directors.
6. System to ensure appropriate business activities
by the MHI Group
(i) The presidents of Group companies shall be
responsible for the independent management
of their companies as autonomous bodies; in
addition, the Company shall create a system to
define the management responsibilities of
Group companies, determine operational pro-
cedures and provide support and guidance with
the aim of improving consolidated operating
performance through sound and efficient
Groupwide management.
(ii) To ensure appropriate Groupwide operations,
the Company shall promote various compliance
and risk measures in conjunction with Group
companies and create internal control systems
tailored to the size and specific nature of each
company; the respective departments in the
Company responsible for managing Group com-
panies shall also monitor the status of compli-
ance at these companies.
(iii) MHI and MHI Group companies shall ensure the
accuracy of their respective financial information,
and arrange the organization, company regula-
tions and other matters required for the prepara-
tion and disclosure of reliable financial reports.
7. Matters related to employees requested by statu-
tory auditors to support audit activities
(i) In response to requests by the statutory audi-
tors, the Company shall establish a Statutory
Auditor’s Office with a dedicated staff to support
the smooth conduct of audit activities.
8. Independence of employees in 7. (above) from
directors
(i) To ensure independence from the executive
bodies of the Company, Auditing Office staff
shall not be subject to the orders of directors,
and the appointment, transfer and evaluation of

ANNUAL REPORT 2009 31
these employees shall be conducted with the
agreement of the statutory auditors.
9. System to allow directors and employees to report
information to the statutory auditors and other
related reporting systems
(i) The Company shall implement arrangements to
allow the reporting and provision of information to
statutory auditors, and promote appropriate com-
munication through regular exchanges of views.
10. Other systems to ensure statutory auditor
activities are conducted effectively
(i) Due consideration shall be given to statutory audi-
tors to allow them to conduct audits in an effective
manner by gathering information, conducting sur-
veys and taking other steps to ensure appropriate
communication with related divisions in the Com-
pany, the accounting auditors and other parties.
Internal Audits and Statutory AuditorsThe Company conducts internal audits to check the
effectiveness of internal control systems. For each fiscal
year, the 23-member Internal Audit Department, the
Company’s dedicated internal audit organization, formu-
lates an internal audit policy and instructs each of MHI’s
departments to conduct audits in accordance with this
policy. The department confirms the status and results of
these internal audits and conducts its own separate
audits targeting specific themes.
The Board of Statutory Auditors has five members,
three of whom are outside appointments. In accordance
with the auditing policy and auditing plan determined by
the Board of Statutory Auditors, statutory auditors attend
meetings of the Board of Directors, the Executive Com-
mittee and other key meetings related to business plan-
ning, enabling them to accurately assess the status of
management in a timely manner. As part of the audit,
statutory auditors make sure the execution of director
duties complies with laws and regulations and the Articles
of Incorporation and ascertain whether or not business
operations of the Company are being executed appropri-
ately by conducting spot checks and verifying compliance
with relevant laws and regulations, and by monitoring the
status of development and operation of internal control
systems including those in relation to financial reporting.
General Meeting of Shareholders
Group Companies
Directors (Board of Directors)
President
Executive Officers CSR Committee
Monitoring Committee
Risk Management .....Other
(Internal Departments)
.....Other
Executive Vice PresidentsExecutive
Committee
Election/Dismissal Proposal/Report
Provide opinions
Election/Dismissal Election/Dismissal
Report on accounting audit
Coordination
Instruction
Report
guidance
Survey
t/Guidancet/Guidance Survey
Coordination
Internal reports/Consult
ReportInstruction
Consult/Report
Proposal/ReportNomination/Oversight
Deliberate
Report

MITSUBISHI HEAVY INDUSTRIES, LTD.32
In addition to regularly exchanging information and opin-
ions with the Internal Audit Department and accounting
auditors, statutory auditors also work in close collabora-
tion in other ways, including receiving audit results and
being present for the auditing performed by the account-
ing auditors. As a support to the statutory auditors, the
Company has established a Statutory Auditor’s Office with
a dedicated six-member staff, which assists the auditors
in performing their duties more smoothly.
The Company’s corporate governance framework,
including internal control systems, is shown in the dia-
gram on page 31.
Accounting AuditsMHI’s accounting auditor is Ernst & Young ShinNihon
LLC. The firm’s certified public accountants (designated
and engagement partners) that audit the Company’s
financial statements are: Michio Shibuya, Masayuki Ueda,
Ichiro Ishii and Yoshiaki Morita. None of these individuals
has been continually auditing the Company’s financial
statements for longer than seven years.
In addition to the above, the auditing team includes
11 other certified public accountants and 26 assistant
accountants.
Conflicts of Interest Between Outside Direc-tors and Statutory Auditors and the CompanyNone of the outside directors or statutory auditors has
any particular conflicts of interest with MHI.
Director and Statutory Auditor Compensation and Audit FeesDirector and Statutory Auditor Compensation
Position No. of recipientsAmount of compensation
(In millions of yen)
Directors(Of which, outside)
23(3)
1,244(44)
Statutory Auditors(Of which, outside)
6(3)
125(36)
Total(Of which, outside)
29(6)
1,369(80)
In addition to the amounts specified above, for officers
other than outside officers a gap emerged this fiscal year
under review between the compensation amounts dis-
closed for the previous fiscal year (the estimated compen-
sation amounts) and the compensation amounts actually
disbursed. Consequently, a total of ¥964 million was paid
to 17 directors and a total of ¥122 million was paid to five
statutory auditors.
Also, based on the resolution passed at the 81st
Ordinary General Meeting of Shareholders on June 28,
2006, a total of ¥15 million will be paid to two outside
directors and a total of ¥20 million to three outside statu-
tory auditors at the times of their retirement as part of
terminating the retirement allowance program.(Notes)1. The personnel in the table include four directors and one statutory auditor
who retired during the fiscal year under review.2. The compensation amounts in the table include stock acquisition rights
issued in a so-called stock-linked compensation scheme (with a total value of ¥252 million) for the 16 directors excluding outside directors. The total issuance price of stock acquisition rights to directors excluding outside directors is limited to ¥300 million per fiscal year (resolution of the 82nd Ordinary General Meeting of Shareholders on June 27, 2007).
3. The maximum permitted financial compensation amounts are ¥1,200 million per fiscal year for directors and ¥160 million per fiscal year for statutory auditors (resolution of the 81st Ordinary General Meeting of Shareholders on June 28, 2006).
Auditing Certified Public Accountant
Compensation
Category
Fiscal year 2008
Audit attestation duty based compensation
(In millions of yen)
Non-audit based compensation
(In millions of yen)
MHI 186 3
Consolidated subsidiaries 132 –
Total 319 3
Other material compensation
In the fiscal year 2008, 17 of the Company’s overseas sub-
sidiaries commissioned the Ernst & Young Group, which
belongs to the same network as the Company’s auditing
public certified accountants, to undertake audit attestation
and other duties. The total compensation for these services
for the fiscal year 2008 was ¥479 million.

Corporate Social Responsibility
ANNUAL REPORT 2009 33
Aiming to win the solid trust of society through the advancement of CSRThe underlying objective of the MHI Group is, as a manufacturer, to carry out CSR through production activities; and we
are working to achieve that goal under our CSR Action Guidelines.
MHI Group CSR Action Guidelines(formulated July 2007)
In order to ensure a secure future for the Earth, we will establish and maintain,
Close ties with the EarthSafeguard an abundantly green Earth through environmental technologies and environmental awareness;
Close ties with SocietyBuild a relationship of trust with society through proactive participation in society and trustworthy actions;
A bridge to the next GenerationContribute to the cultivation of human resources who can shoulder responsibility
in the next generation through technologies that can realize dreams.
Undertaking CSR through production activitiesAs outlined in our corporate creed the underlying objective of the MHI Group is to contribute to society as a manufactur-
ing enterprise that provides products in support of the world’s infrastructure as well as its ecological, economic and
energy needs.
The core aims of our CSR initiatives are to minimize the environmental loads emanating from our production activities
through the achievement of zero emissions and CO2 emission reduction activities, to generate solid earnings through
product differentiation, and to allocate our earnings appropriately on an ongoing basis for the growth of all stakeholders
and the MHI Group.
For more information, please refer to the documents that can be accessed from the “CSR” webpage of our website.
http://www.mhi.co.jp/en/csr/

MITSUBISHI HEAVY INDUSTRIES, LTD.34
Segment Information
Mitsubishi Heavy Industries, Ltd. and Consolidated Subsidiaries
Years ended March 31, 2009 and 2008
Net Sales Operating Income (Loss)
In millions of yenIn thousands of
U.S. dollars In millions of yenIn thousands of
U.S. dollars
INDUSTRY SEGMENT 2009 2008 2009 2009 2008 2009
Shipbuilding & Ocean Development . . . . . . . . . . . . . ¥ 240,178 ¥ 283,955 $ 2,445,057 ¥ 1,641 ¥ 4,064 $ 16,705
Power Systems . . . . . . . . . . . . . . . . . . . . . . . . . . . . 1,209,150 946,997 12,309,375 80,001 58,287 814,425
Machinery & Steel Structures . . . . . . . . . . . . . . . . . . 542,203 472,537 5,519,729 31,605 11,328 321,744
Aerospace . . . . . . . . . . . . . . . . . . . . . . . . . . . . . . . . 512,355 500,576 5,215,870 (10,340) 14,657 (105,263)
Mass and Medium-Lot Manufactured Machinery . . . 805,403 913,606 8,199,155 (7,030) 40,058 (71,566)
Others . . . . . . . . . . . . . . . . . . . . . . . . . . . . . . . . . . . 121,147 140,045 1,233,299 9,982 7,633 101,618
Subtotal . . . . . . . . . . . . . . . . . . . . . . . . . . . . . . . . 3,430,438 3,257,718 34,922,508 105,859 136,030 1,077,664
Eliminations or Corporate . . . . . . . . . . . . . . . . . . . . . (54,763) (54,632) (557,497) – – –
Total . . . . . . . . . . . . . . . . . . . . . . . . . . . . . . . . . ¥3,375,674 ¥3,203,085 $34,365,000 ¥105,859 ¥136,030 $1,077,664
Total Assets Depreciation and Amortization
In millions of yenIn thousands of
U.S. dollars In millions of yenIn thousands of
U.S. dollars
INDUSTRY SEGMENT 2009 2008 2009 2009 2008 2009
Shipbuilding & Ocean Development . . . . . . . . . . . . . ¥ 250,386 ¥ 233,301 $ 2,548,976 ¥ 9,707 ¥ 7,332 $ 98,819
Power Systems . . . . . . . . . . . . . . . . . . . . . . . . . . . . 1,238,460 1,044,513 12,607,757 36,629 30,357 372,890
Machinery & Steel Structures . . . . . . . . . . . . . . . . . . 494,383 502,265 5,032,912 10,624 9,520 108,154
Aerospace . . . . . . . . . . . . . . . . . . . . . . . . . . . . . . . . 954,452 923,014 9,716,502 46,103 33,533 469,337
Mass and Medium-Lot Manufactured Machinery . . . 821,649 842,574 8,364,542 33,541 30,973 341,453
Others . . . . . . . . . . . . . . . . . . . . . . . . . . . . . . . . . . . 189,606 202,786 1,930,224 17,250 17,545 175,608
Subtotal . . . . . . . . . . . . . . . . . . . . . . . . . . . . . . . . 3,948,939 3,748,456 40,200,946 153,856 129,263 1,566,283
Eliminations or Corporate . . . . . . . . . . . . . . . . . . . . . 577,274 768,691 5,876,758 – – –
Total . . . . . . . . . . . . . . . . . . . . . . . . . . . . . . . . . ¥4,526,213 ¥4,517,148 $46,077,705 ¥153,856 ¥129,263 $1,566,283
Capital Expenditures
In millions of yenIn thousands of
U.S. dollars
INDUSTRY SEGMENT 2009 2008 2009
Shipbuilding & Ocean Development . . . . . . . . . . . . . ¥ 8,045 ¥ 15,637 $ 81,899
Power Systems . . . . . . . . . . . . . . . . . . . . . . . . . . . . 66,220 55,653 674,132
Machinery & Steel Structures . . . . . . . . . . . . . . . . . . 15,765 13,545 160,490
Aerospace . . . . . . . . . . . . . . . . . . . . . . . . . . . . . . . . 40,225 51,638 409,498
Mass and Medium–Lot Manufactured Machinery . . . 58,957 37,243 600,193
Others . . . . . . . . . . . . . . . . . . . . . . . . . . . . . . . . . . . 7,463 17,734 75,974
Subtotal . . . . . . . . . . . . . . . . . . . . . . . . . . . . . . . . 196,677 191,454 2,002,209
Eliminations or Corporate . . . . . . . . . . . . . . . . . . . . . – – –
Total . . . . . . . . . . . . . . . . . . . . . . . . . . . . . . . . . ¥ 196,677 ¥ 191,454 $ 2,002,209
In millions of yenIn thousands of
U.S. dollars
OVERSEAS SALES 2009 2008 2009
Overseas Sales . . . . . . . . . . . . . . . . . . . . . . . . . . . . . ¥1,652,269 ¥1,561,139 $16,820,411
Ratio to Total Net Sales . . . . . . . . . . . . . . . . . . . . . . 48.9% 48.7%
Notes: 1. U.S. dollar amounts in this annual report are translated from yen, for convenience only, at the rate of ¥98.23=US$1, the exchange rate prevailing at March 31, 2009.
2. The accompanying consolidated financial statements for the years ended March 31, 2009 and 2008 have been compiled in accordance with accounting principles and practices generally accepted in Japan.

26.6%
25.1%17.9%
13.7%
13.9%
1.5%1.3%
500
1,000
1,500
2,000
2,500
3,000
3,500
00908070605 0908070605
–25
0
25
50
75
100
125
150
ANNUAL REPORT 2009 35
COMPOSITION OF OVERSEASNET SALES BY GEOGRAPHIC DISTRIBUTION
NET SALES BY INDUSTRY SEGMENT
(In billions of yen)
OPERATING INCOME (LOSS) BY INDUSTRY SEGMENT
(In billions of yen)
Shipbuilding & Ocean DevelopmentPower SystemsMachinery & Steel StructuresAerospaceMass and Medium-LotManufactured MachineryOthers
AsiaNorth AmericaEuropeCentral and South AmericaThe Middle EastOceaniaAfrica
Shipbuilding & Ocean DevelopmentPower SystemsMachinery & Steel StructuresAerospaceMass and Medium-Lot Manufactured MachineryOthers
Net Sales Operating Income
In millions of yenIn thousands of
U.S. dollars In millions of yenIn thousands of
U.S. dollars
GEOGRAPHIC DISTRIBUTION 2009 2008 2009 2009 2008 2009
Japan . . . . . . . . . . . . . . . . . . . . . . . . . . . . . . . . . . . . ¥3,120,614 ¥2,916,934 $31,768,441 ¥ 91,203 ¥121,535 $ 928,463
North America . . . . . . . . . . . . . . . . . . . . . . . . . . . . . 297,395 297,874 3,027,537 6,647 8,284 67,667
Asia . . . . . . . . . . . . . . . . . . . . . . . . . . . . . . . . . . . . . 120,344 105,797 1,225,124 2,471 1,339 25,155
Europe . . . . . . . . . . . . . . . . . . . . . . . . . . . . . . . . . . . 166,908 166,112 1,699,155 2,821 4,473 28,718
Others . . . . . . . . . . . . . . . . . . . . . . . . . . . . . . . . . . . 39,155 52,213 398,605 2,715 397 27,639
Subtotal . . . . . . . . . . . . . . . . . . . . . . . . . . . . . . . . 3,744,419 3,538,932 38,118,894 105,859 136,030 1,077,664
Eliminations or Corporate . . . . . . . . . . . . . . . . . . . . . (368,744) (335,846) (3,753,883) – – –
Total . . . . . . . . . . . . . . . . . . . . . . . . . . . . . . . . . ¥3,375,674 ¥3,203,085 $34,365,000 ¥105,859 ¥136,030 $1,077,664
Total Assets
In millions of yenIn thousands of
U.S. dollars
GEOGRAPHIC DISTRIBUTION 2009 2008 2009
Japan . . . . . . . . . . . . . . . . . . . . . . . . . . . . . . . . . . . . ¥3,447,183 ¥3,303,873 $35,092,975
North America . . . . . . . . . . . . . . . . . . . . . . . . . . . . . 217,999 196,340 2,219,271
Asia . . . . . . . . . . . . . . . . . . . . . . . . . . . . . . . . . . . . . 84,073 72,376 855,879
Europe . . . . . . . . . . . . . . . . . . . . . . . . . . . . . . . . . . . 115,970 105,920 1,180,596
Others . . . . . . . . . . . . . . . . . . . . . . . . . . . . . . . . . . . 83,711 69,944 852,193
Subtotal . . . . . . . . . . . . . . . . . . . . . . . . . . . . . . . . 3,948,939 3,748,456 40,200,946
Eliminations or Corporate . . . . . . . . . . . . . . . . . . . . . 577,274 768,691 5,876,758
Total . . . . . . . . . . . . . . . . . . . . . . . . . . . . . . . . . ¥4,526,213 ¥4,517,148 $46,077,705

MITSUBISHI HEAVY INDUSTRIES, LTD.36
Management’s Discussion and Analysis
Analysis of Operating ResultsIn fiscal 2008, ended March 31, 2009, consolidated net sales of Mitsubishi Heavy Industries, Ltd. (MHI)
and its consolidated subsidiaries (MHI Group) increased ¥172,589 million, or 5.4%, from the previous
year, to ¥3,375,674 million (US$34,365,000 thousand). Increases were recorded in Power Systems—
due to the construction of new power plants, as well as a growth in improvement, reform and mainte-
nance services of existing plants—Machinery & Steel Structures, and Aerospace. Mass and
Medium-Lot Manufactured Machinery and Shipbuilding & Ocean Development, however, recorded
lower sales.
Operating income fell ¥30,171 million, or 22.2%, to ¥105,859 million (US$1,077,664 thousand).
Despite the success of various measures under the 2008 Business Plan (Medium-Term Business Plan),
which commenced fiscal year 2008, and achievements in productivity improvement, not only did profits
deteriorate under the effect of economic recession, particularly in Mass and Medium-Lot Manufactured
Machinery, but profits were also reduced because the yen continued to be much stronger than the
previous year in exchange rates.
Net non-operating expenses were ¥30,552 million (US$311,025 thousand), ¥4,027 million more
than in the previous year. This was mainly due to deterioration of income from equity in earnings of
unconsolidated subsidiaries and affiliates which offset a year-on-year improvement in foreign exchange
gain. Ordinary income fell ¥34,198 million, or 31.2%, to ¥75,306 million (US$766,629 thousand).
Extraordinary gain totaled ¥54,323 million (US$553,018 thousand), due to gain on contribution of
securities to retirement benefit trust, gain on sales of investment securities and gain on sales of fixed
assets. Extraordinary loss totaled ¥64,705 million (US$658,709 thousand), due to the amount
recorded as effect of the application of the accounting standard for measurement of inventories, loss
on legal claims, and business structure improvement expenses.
Income before income taxes and minority interests declined ¥36,452 million, or 36.0%, to ¥64,923
million (US$660,928 thousand), and net income declined ¥37,115 million, or 60.5%, to ¥24,217 million
(US$246,533 thousand).
Key Factors Affecting Operating ResultsKey factors that affect the management of the MHI Group include external factors such as market
trends, foreign exchange rate fluctuations and changes in material costs, and internal factors such as
risks associated with various overseas business contracts, accidents and disasters. Another key factor
is the risk of manufacturing capabilities weakening due to technology and skill transfer issues associ-
ated with generational change.

ANNUAL REPORT 2009 37
Market trends
The impact of the financial crisis that originated in the U.S. has spread broadly across the global real
economies. The resulting trends in the market include weakening consumption and a shrinking market
on a global scale, particularly with respect to the unstable financial market trends. In Japan, exports
and capital expenditure, traditionally the drivers of the economy, fell considerably to heavily impact
corporate earnings. These conditions also heavily impacted the operating results of the MHI Group.
However, in the medium- to long-term, we recognize considerable business chances especially in
areas where demand is expected to expand globally such as energy and environmental solutions and
infrastructural development in emerging countries. The MHI Group is continuing its efforts to further
strengthen its management framework and provide products and services suited to the needs of
customers using technologies superior to the competition.
Exchange rate fluctuation
Foreign exchange rate fluctuation can significantly affect the MHI Group’s competitiveness and operat-
ing results. In order to minimize exchange rate fluctuation risk, the MHI Group is increasing its liabilities
denominated in foreign currencies by expanding the procurement of overseas materials, promoting
greater use of yen-denominated contracts, and hedging risk with timely forward foreign exchange
contracts. It is also expanding overseas production and bringing forward overseas production dates.
Changes in costs of materials
Although the trend of rising prices for materials such as steel products, non-ferrous metals and crude
oil has abated, the MHI Group is responding to the impact of certain material price rises and boosting
the price competitiveness of its products by promoting design standardization, increasing its utilization
of common components, employing standardized parts, signing comprehensive procurement contracts,
and expanding its overseas production activities. The MHI Group is also strengthening relationships
with its business partners, promoting an even greater level of information sharing, and striving to
achieve further cost reductions.
Overseas business contracts
The MHI Group is exposed to a number of risks associated with individual business contracts it concludes
in overseas markets. These include the quality and delivery dates of locally procured materials and the
skill levels and specific labor practices of the local staff, as well as the risks inherent in its contractual
obligations. In order to prevent or mitigate these risks, all contracts undergo a rigorous internal assess-
ment process prior to their formal conclusion. In addition to the business headquarters and the segments
concerned, several administrative departments are involved in this process, which includes the verifica-
tion of local contractual obligations, the removal of unilateral conditions, and other prudent steps.

MITSUBISHI HEAVY INDUSTRIES, LTD.38
Accidents and disasters
Accidents and disasters can have a significant impact on the management of the MHI Group. The
MHI Group is taking steps to minimize the probability of accidents and disasters occurring, by carry-
ing out ongoing work-site management activities, including the training of on-site workers to be more
aware of risks.
Technology and skill transfer
The MHI Group is at risk of manufacturing capabilities weakening due to technology and skill transfer
issues associated with generational change. In response, the MHI Group invests in production process
improvement aimed at rationalization and carries out focused investment in R&D related to manufac-
turing technology. The MHI Group also strives to enhance its basic manufacturing capabilities through
programs to train and improve the skills of its employees.
Source of Funds and LiquidityCash flow analysis
Operating activities provided net cash of ¥79,533 million (US$809,660 thousand), ¥82,290 million
less than in the previous year. This mainly reflected a decrease in income before income taxes and
minority interests.
Investing activities used net cash of ¥156,593 million (US$1,594,146 thousand), ¥36,462 million
less than the previous year. This decrease was mainly due to proceeds from sales of investment secu-
rities offsetting continued aggressive capital expenditures in growth fields, mainly in the Power Systems
and Aerospace segments.
Financing activities provided net cash of ¥262,002 million (US$2,667,229 thousand), due to the
procurement of new funds to secure cash-on-hand fluidity in response to the post-financial crisis eco-
nomic disarray.
Primary funding requirements
The MHI Group primarily requires funds for working capital for manufacturing activities (materials, out-
sourcing and personnel costs), order preparation costs and other sales expenses related to winning new
orders, and funds for R&D activities that enhance the competitiveness of its products and strengthen
manufacturing capabilities. In investing activities, funds are required for capital investment to grow
business and enhance productivity, and for the purchase of investment securities related to the execu-
tion of business strategies.
Since the sharp economic slowdown that began in autumn 2008, the MHI Group is reviewing part
of its investment timing. It still expects, however, increased requirements for working capital and invest-
ment funds particularly in growth areas next year and beyond. The MHI Group is planning to aggres-
sively execute necessary capital investment and R&D investment to expand global business,
particularly in growth areas such as energy and environment-related businesses and transportation
systems businesses.

ANNUAL REPORT 2009 39
Breakdown of interest-bearing debt and its applications
The breakdown of interest-bearing debt as of March 31, 2009 was as follows:
(In millions of yen)
Total Due within one year Due after one year
Short-term borrowings 248,734 248,734 –
Commercial papers 115,000 115,000 –
Long-term borrowings 964,224 108,267 855,956
Bonds 284,901 20,300 264,601
Total 1,612,859 492,301 1,120,558
(In thousands of U.S. dollars)
Total Due within one year Due after one year
Short-term borrowings 2,532,159 2,532,159 –
Commercial papers 1,170,721 1,170,721 –
Long-term borrowings 9,815,982 1,102,178 8,713,794
Bonds 2,900,346 206,657 2,693,688
Total 16,419,210 5,011,717 11,407,492
The MHI Group is involved in numerous projects with comparatively long construction periods. It
also owns numerous manufacturing facilities that employ large-scale machinery facilities. Conse-
quently, the MHI Group must secure a stable level of working capital and funds for capital investments.
Taking into account these factors, the MHI Group has procured funds to increase its cash deposits to
higher than normal levels to secure cash-on-hand fluidity in response to the economic disarray of the
financial crisis that began in autumn 2008.
As a result, the MHI Group’s total interest-bearing debt at the end of fiscal year 2008 was
¥1,612,859 million (US$16,419,210 thousand): ¥492,301 million (US$5,011,717 thousand) due within
one year, and ¥1,120,558 million (US$11,407,492 thousand) due after one year.
The interest-bearing debt mentioned above is utilized as working capital and for capital investment
required for business activities. In addition to using these funds mainly in key growth fields expected to
require funds, including the Power Systems and Aerospace segments, the MHI Group continues to
maintain ample cash deposits to ensure it has cash-on-hand fluidity.
Financial policy
The MHI Group, currently funds its working capital and capital investments from its operating cash
flows. Any additional requirements can be met with interest-bearing debt.
In appropriately determining the amounts and methods of procuring long-term funds through
long-term borrowings, bonds, and other means, the MHI Group takes into account the funding
requirements of its business plans, interest-rate trends and various other factors, as well as the
amount of and repayment schedule for its existing debt.
Additionally, the MHI Group strives to efficiently utilize surplus funds within the Group using a cash
management system. At the same time, the MHI Group is working to improve asset efficiency by reducing
trade receivables and inventories and by raising the utilization rate of its property, plant and equipment.
The MHI Group flexibly considers the repurchase of treasury stock based on the financial position
of the Group, the stock price, as well as recent earnings forecasts and other factors.
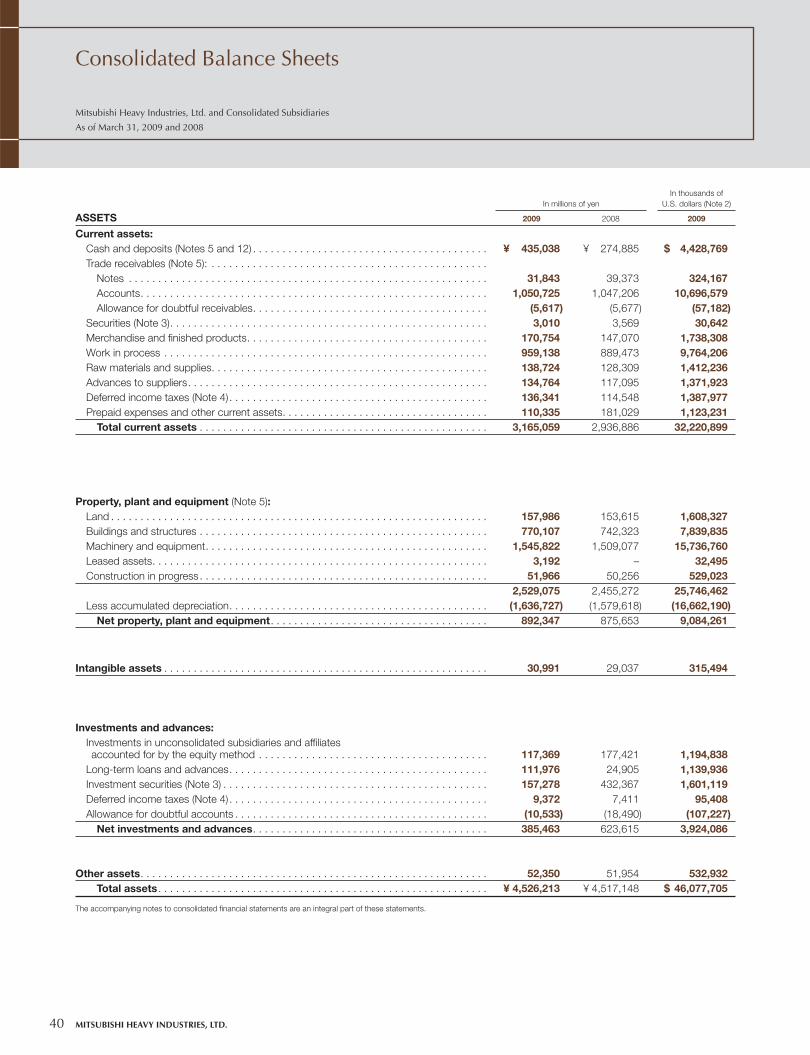
MITSUBISHI HEAVY INDUSTRIES, LTD.40
Consolidated Balance Sheets
Mitsubishi Heavy Industries, Ltd. and Consolidated Subsidiaries
As of March 31, 2009 and 2008
In millions of yenIn thousands of
U.S. dollars (Note 2)
ASSETS 2009 2008 2009
Current assets: Cash and deposits (Notes 5 and 12) . . . . . . . . . . . . . . . . . . . . . . . . . . . . . . . . . . . . . . . . ¥ 435,038 ¥ 274,885 $ 4,428,769 Trade receivables (Note 5): . . . . . . . . . . . . . . . . . . . . . . . . . . . . . . . . . . . . . . . . . . . . . . . Notes . . . . . . . . . . . . . . . . . . . . . . . . . . . . . . . . . . . . . . . . . . . . . . . . . . . . . . . . . . . . . 31,843 39,373 324,167 Accounts . . . . . . . . . . . . . . . . . . . . . . . . . . . . . . . . . . . . . . . . . . . . . . . . . . . . . . . . . . . 1,050,725 1,047,206 10,696,579 Allowance for doubtful receivables . . . . . . . . . . . . . . . . . . . . . . . . . . . . . . . . . . . . . . . . (5,617) (5,677) (57,182) Securities (Note 3) . . . . . . . . . . . . . . . . . . . . . . . . . . . . . . . . . . . . . . . . . . . . . . . . . . . . . . 3,010 3,569 30,642 Merchandise and finished products . . . . . . . . . . . . . . . . . . . . . . . . . . . . . . . . . . . . . . . . . 170,754 147,070 1,738,308 Work in process . . . . . . . . . . . . . . . . . . . . . . . . . . . . . . . . . . . . . . . . . . . . . . . . . . . . . . . 959,138 889,473 9,764,206 Raw materials and supplies . . . . . . . . . . . . . . . . . . . . . . . . . . . . . . . . . . . . . . . . . . . . . . . 138,724 128,309 1,412,236 Advances to suppliers . . . . . . . . . . . . . . . . . . . . . . . . . . . . . . . . . . . . . . . . . . . . . . . . . . . 134,764 117,095 1,371,923 Deferred income taxes (Note 4) . . . . . . . . . . . . . . . . . . . . . . . . . . . . . . . . . . . . . . . . . . . . 136,341 114,548 1,387,977 Prepaid expenses and other current assets . . . . . . . . . . . . . . . . . . . . . . . . . . . . . . . . . . . 110,335 181,029 1,123,231 Total current assets . . . . . . . . . . . . . . . . . . . . . . . . . . . . . . . . . . . . . . . . . . . . . . . . . 3,165,059 2,936,886 32,220,899
Property, plant and equipment (Note 5): Land . . . . . . . . . . . . . . . . . . . . . . . . . . . . . . . . . . . . . . . . . . . . . . . . . . . . . . . . . . . . . . . . 157,986 153,615 1,608,327 Buildings and structures . . . . . . . . . . . . . . . . . . . . . . . . . . . . . . . . . . . . . . . . . . . . . . . . . 770,107 742,323 7,839,835 Machinery and equipment . . . . . . . . . . . . . . . . . . . . . . . . . . . . . . . . . . . . . . . . . . . . . . . . 1,545,822 1,509,077 15,736,760 Leased assets . . . . . . . . . . . . . . . . . . . . . . . . . . . . . . . . . . . . . . . . . . . . . . . . . . . . . . . . . 3,192 – 32,495 Construction in progress . . . . . . . . . . . . . . . . . . . . . . . . . . . . . . . . . . . . . . . . . . . . . . . . . 51,966 50,256 529,023
2,529,075 2,455,272 25,746,462 Less accumulated depreciation . . . . . . . . . . . . . . . . . . . . . . . . . . . . . . . . . . . . . . . . . . . . (1,636,727) (1,579,618) (16,662,190) Net property, plant and equipment . . . . . . . . . . . . . . . . . . . . . . . . . . . . . . . . . . . . . 892,347 875,653 9,084,261
Intangible assets . . . . . . . . . . . . . . . . . . . . . . . . . . . . . . . . . . . . . . . . . . . . . . . . . . . . . . . 30,991 29,037 315,494
Investments and advances: Investments in unconsolidated subsidiaries and affiliates accounted for by the equity method . . . . . . . . . . . . . . . . . . . . . . . . . . . . . . . . . . . . . . . 117,369 177,421 1,194,838 Long-term loans and advances . . . . . . . . . . . . . . . . . . . . . . . . . . . . . . . . . . . . . . . . . . . . 111,976 24,905 1,139,936 Investment securities (Note 3) . . . . . . . . . . . . . . . . . . . . . . . . . . . . . . . . . . . . . . . . . . . . . 157,278 432,367 1,601,119 Deferred income taxes (Note 4) . . . . . . . . . . . . . . . . . . . . . . . . . . . . . . . . . . . . . . . . . . . . 9,372 7,411 95,408 Allowance for doubtful accounts . . . . . . . . . . . . . . . . . . . . . . . . . . . . . . . . . . . . . . . . . . . (10,533) (18,490) (107,227) Net investments and advances . . . . . . . . . . . . . . . . . . . . . . . . . . . . . . . . . . . . . . . . 385,463 623,615 3,924,086
Other assets . . . . . . . . . . . . . . . . . . . . . . . . . . . . . . . . . . . . . . . . . . . . . . . . . . . . . . . . . . . 52,350 51,954 532,932 Total assets . . . . . . . . . . . . . . . . . . . . . . . . . . . . . . . . . . . . . . . . . . . . . . . . . . . . . . . . ¥ 4,526,213 ¥ 4,517,148 $ 46,077,705
The accompanying notes to consolidated financial statements are an integral part of these statements.

In millions of yenIn thousands of
U.S. dollars (Note 2)
LIABILITIES AND NET ASSETS 2009 2008 2009
Current liabilities: Trade payables: Notes . . . . . . . . . . . . . . . . . . . . . . . . . . . . . . . . . . . . . . . . . . . . . . . . . . . . . . . . . . . . . . ¥ 12,252 ¥ 13,453 $ 124,727 Accounts . . . . . . . . . . . . . . . . . . . . . . . . . . . . . . . . . . . . . . . . . . . . . . . . . . . . . . . . . . . . 687,395 720,046 6,997,811 Short-term borrowings (Note 5) . . . . . . . . . . . . . . . . . . . . . . . . . . . . . . . . . . . . . . . . . . . . . 248,734 233,801 2,532,159 Commercial papers (Note 5) . . . . . . . . . . . . . . . . . . . . . . . . . . . . . . . . . . . . . . . . . . . . . . . 115,000 – 1,170,721 Current portion of long-term borrowings (Note 5) . . . . . . . . . . . . . . . . . . . . . . . . . . . . . . . 128,567 125,716 1,308,836 Advance payments received on contracts . . . . . . . . . . . . . . . . . . . . . . . . . . . . . . . . . . . . . 479,004 469,285 4,876,351 Accrued expenses . . . . . . . . . . . . . . . . . . . . . . . . . . . . . . . . . . . . . . . . . . . . . . . . . . . . . . 134,378 122,113 1,367,993 Accrued income taxes . . . . . . . . . . . . . . . . . . . . . . . . . . . . . . . . . . . . . . . . . . . . . . . . . . . 13,942 36,862 141,932 Reserve for product warranties (Note 1) . . . . . . . . . . . . . . . . . . . . . . . . . . . . . . . . . . . . . . 23,872 23,660 243,021 Reserve for losses on construction contracts (Note 1) . . . . . . . . . . . . . . . . . . . . . . . . . . . . 37,911 6,893 385,941 Reserve for legal claims (Note 1) . . . . . . . . . . . . . . . . . . . . . . . . . . . . . . . . . . . . . . . . . . . . 23,300 – 237,198 Other current liabilities (Note 4) . . . . . . . . . . . . . . . . . . . . . . . . . . . . . . . . . . . . . . . . . . . . . 90,532 74,060 921,632 Total current liabilities . . . . . . . . . . . . . . . . . . . . . . . . . . . . . . . . . . . . . . . . . . . . . . . . 1,994,892 1,825,894 20,308,378
Long-term liabilities: Long-term borrowings (Note 5) . . . . . . . . . . . . . . . . . . . . . . . . . . . . . . . . . . . . . . . . . . . . . 1,120,558 1,005,876 11,407,492 Deferred income taxes (Note 4) . . . . . . . . . . . . . . . . . . . . . . . . . . . . . . . . . . . . . . . . . . . . . 7,519 94,134 76,544 Reserve for retirement allowance (Note 6) . . . . . . . . . . . . . . . . . . . . . . . . . . . . . . . . . . . . . 50,776 89,936 516,909 Reserve for treatment of PCB waste (Note 1) . . . . . . . . . . . . . . . . . . . . . . . . . . . . . . . . . . 4,293 4,300 43,703 Other long-term liabilities . . . . . . . . . . . . . . . . . . . . . . . . . . . . . . . . . . . . . . . . . . . . . . . . . . 64,921 56,577 660,908 Total long-term liabilities . . . . . . . . . . . . . . . . . . . . . . . . . . . . . . . . . . . . . . . . . . . . . . 1,248,068 1,250,824 12,705,568 Total liabilities . . . . . . . . . . . . . . . . . . . . . . . . . . . . . . . . . . . . . . . . . . . . . . . . . . . . . . . 3,242,961 3,076,719 33,013,957
Net assetsStockholders’ equity (Note 10): Common stock, without par value: Authorized—6,000,000,000 shares Issued in 2009 and 2008—3,373,647,813 shares . . . . . . . . . . . . . . . . . . . . . . . . . . . . . 265,608 265,608 2,703,939 Capital surplus . . . . . . . . . . . . . . . . . . . . . . . . . . . . . . . . . . . . . . . . . . . . . . . . . . . . . . . . . 203,928 203,893 2,076,025 Retained earnings . . . . . . . . . . . . . . . . . . . . . . . . . . . . . . . . . . . . . . . . . . . . . . . . . . . . . . . 788,948 787,007 8,031,640 Treasury stock, at cost:
2009—17,474,958 shares . . . . . . . . . . . . . . . . . . . . . . . . . . . . . . . . . . . . . . . . (5,041) (51,318)2008—17,573,785 shares . . . . . . . . . . . . . . . . . . . . . . . . . . . . . . . . . . . . . . . . (5,045)
Total stockholders’ equity . . . . . . . . . . . . . . . . . . . . . . . . . . . . . . . . . . . . . . . . . . . . . 1,253,443 1,251,464 12,760,287Valuation, translation adjustments and others Net unrealized gains on investment securities . . . . . . . . . . . . . . . . . . . . . . . . . . . . . . . . . . 17,313 157,546 176,249 Deferred gains or losses on hedges . . . . . . . . . . . . . . . . . . . . . . . . . . . . . . . . . . . . . . . . . 323 7,346 3,288 Foreign currency translation adjustments . . . . . . . . . . . . . . . . . . . . . . . . . . . . . . . . . . . . . (29,482) 3,847 (300,132) Total valuation, translation adjustments and others . . . . . . . . . . . . . . . . . . . . . . . . (11,845) 168,739 (120,584)Share subscription rights (Note 11) . . . . . . . . . . . . . . . . . . . . . . . . . . . . . . . . . . . . . . . . . 881 549 8,968Minority interests . . . . . . . . . . . . . . . . . . . . . . . . . . . . . . . . . . . . . . . . . . . . . . . . . . . . . . . . 40,772 19,676 415,066 Total net assets . . . . . . . . . . . . . . . . . . . . . . . . . . . . . . . . . . . . . . . . . . . . . . . . . . . . . 1,283,251 1,440,429 13,063,738 Total liabilities and net assets . . . . . . . . . . . . . . . . . . . . . . . . . . . . . . . . . . . . . . . . . . ¥4,526,213 ¥4,517,148 $46,077,705
ANNUAL REPORT 2009 41

Consolidated Statements of Income
Mitsubishi Heavy Industries, Ltd. and Consolidated Subsidiaries
For the years ended March 31, 2009 and 2008
In millions of yenIn thousands of
U.S. dollars (Note 2)
2009 2008 2009
Net Sales . . . . . . . . . . . . . . . . . . . . . . . . . . . . . . . . . . . . . . . . . . . . . . . . . . . . . . . . . . . . . . ¥3,375,674 ¥3,203,085 $34,365,000Cost of sales . . . . . . . . . . . . . . . . . . . . . . . . . . . . . . . . . . . . . . . . . . . . . . . . . . . . . . . . . . . 2,945,340 2,753,951 29,984,118 Gross profit . . . . . . . . . . . . . . . . . . . . . . . . . . . . . . . . . . . . . . . . . . . . . . . . . . . . . . . . . . 430,334 449,134 4,380,881Selling, general and administrative expenses . . . . . . . . . . . . . . . . . . . . . . . . . . . . . . . . 324,475 313,103 3,303,216 Operating income . . . . . . . . . . . . . . . . . . . . . . . . . . . . . . . . . . . . . . . . . . . . . . . . . . . . . 105,859 136,030 1,077,664Non-operating income (expense): Interest income . . . . . . . . . . . . . . . . . . . . . . . . . . . . . . . . . . . . . . . . . . . . . . . . . . . . . . . . . 5,575 7,071 56,754 Dividend income . . . . . . . . . . . . . . . . . . . . . . . . . . . . . . . . . . . . . . . . . . . . . . . . . . . . . . . . 8,617 7,487 87,722 Equity in earnings of unconsolidated subsidiaries and affiliates . . . . . . . . . . . . . . . . . . . . . – 8,224 – Foreign exchange gain . . . . . . . . . . . . . . . . . . . . . . . . . . . . . . . . . . . . . . . . . . . . . . . . . . . 1,230 – 12,521 Other income . . . . . . . . . . . . . . . . . . . . . . . . . . . . . . . . . . . . . . . . . . . . . . . . . . . . . . . . . . 2,584 5,425 26,305 Interest expense . . . . . . . . . . . . . . . . . . . . . . . . . . . . . . . . . . . . . . . . . . . . . . . . . . . . . . . . (20,224) (20,288) (205,884) Equity in losses of unconsolidated subsidiaries and affiliates . . . . . . . . . . . . . . . . . . . . . . . (9,006) – (91,682) Foreign exchange loss . . . . . . . . . . . . . . . . . . . . . . . . . . . . . . . . . . . . . . . . . . . . . . . . . . . – (10,784) – Loss on disposal of fixed assets . . . . . . . . . . . . . . . . . . . . . . . . . . . . . . . . . . . . . . . . . . . . (7,080) (7,344) (72,075) Other expenses . . . . . . . . . . . . . . . . . . . . . . . . . . . . . . . . . . . . . . . . . . . . . . . . . . . . . . . . (12,248) (16,317) (124,686)
(30,552) (26,525) (311,025) Ordinary income . . . . . . . . . . . . . . . . . . . . . . . . . . . . . . . . . . . . . . . . . . . . . . . . . . . . . . 75,306 109,504 766,629Extraordinary gain (loss): Gain on contribution of securities to retirement benefit trust (Note 3) . . . . . . . . . . . . . . . . . 36,104 – 367,545 Gain on sales of investment securities . . . . . . . . . . . . . . . . . . . . . . . . . . . . . . . . . . . . . . . . 14,286 – 145,434 Gain on sales of fixed assets (Note 7) . . . . . . . . . . . . . . . . . . . . . . . . . . . . . . . . . . . . . . . . 3,932 18,467 40,028 Gain on transfer of business (Note 8) . . . . . . . . . . . . . . . . . . . . . . . . . . . . . . . . . . . . . . . . – 3,664 – Effect of the application of the accounting standard for measurement of inventories (Note 1) . . . . . . . . . . . . . . . . . . . . . . . . . . . . . . . . . . . . . . . . . . . . . . . . . . . (33,436) – (340,384) Loss on legal claims . . . . . . . . . . . . . . . . . . . . . . . . . . . . . . . . . . . . . . . . . . . . . . . . . . . . . (20,835) – (212,104) Business structure improvement expenses (Note 9) . . . . . . . . . . . . . . . . . . . . . . . . . . . . . (10,434) (30,261) (106,220)
(10,382) (8,128) (105,690) Income before income taxes and minority interests . . . . . . . . . . . . . . . . . . . . . . . . . . . . 64,923 101,375 660,928Income taxes (Note 4): Current . . . . . . . . . . . . . . . . . . . . . . . . . . . . . . . . . . . . . . . . . . . . . . . . . . . . . . . . . . . . . . . 54,206 58,889 551,827 Deferred . . . . . . . . . . . . . . . . . . . . . . . . . . . . . . . . . . . . . . . . . . . . . . . . . . . . . . . . . . . . . . (13,144) (20,612) (133,808)Minority interests in income after taxes . . . . . . . . . . . . . . . . . . . . . . . . . . . . . . . . . . . . . (355) 1,765 (3,613) Net income . . . . . . . . . . . . . . . . . . . . . . . . . . . . . . . . . . . . . . . . . . . . . . . . . . . . . . . . . . ¥ 24,217 ¥ 61,332 $ 246,533
In yenIn U.S. dollars
(Note 2)
2009 2008 2009
Per share information of common stock (Note 1): Net income—basic . . . . . . . . . . . . . . . . . . . . . . . . . . . . . . . . . . . . . . . . . . . . . . . . . . . . . . ¥ 7.22 ¥ 18.28 $ 0.074 Net income—diluted . . . . . . . . . . . . . . . . . . . . . . . . . . . . . . . . . . . . . . . . . . . . . . . . . . . . . 7.21 18.27 0.073 Cash dividends . . . . . . . . . . . . . . . . . . . . . . . . . . . . . . . . . . . . . . . . . . . . . . . . . . . . . . . . . 6.00 6.00 0.061
The accompanying notes to consolidated financial statements are an integral part of these statements.
MITSUBISHI HEAVY INDUSTRIES, LTD.42

In millions of yenStockholders’ equity Valuation, translation adjustments and others
Common stock
Capital surplus
Retained earnings
Treasury stock
Total stockholders’
equity
Net unrealized gains on
investment securities
Deferred gains or
losses on hedges
Foreign currency
translation adjustments
Total valuation, translation
adjustments and others
Share subscription
rightsMinority interests
Total net assets
Balance as of March 31, 2007 . . ¥265,608 ¥203,879 ¥744,562 ¥(5,063) ¥1,208,987 ¥ 212,165 ¥ 657 ¥ 6,211 ¥ 219,034 ¥293 ¥18,120 ¥1,446,436 Cash dividends (Note 10) . . . . . . (20,135) (20,135) (20,135) Net income . . . . . . . . . . . . . . . . . 61,332 61,332 61,332 Increase resulting from inclusion in the scope of consolidation and equity method . . . . . . . . . . . . . . 1,247 1,247 1,247 Purchase of treasury stock . . . . . (118) (118) (118) Disposal of treasury stock . . . . . . 14 136 151 151 Net changes in items other than stockholders’ equity . . . . . . . . . – (54,619) 6,688 (2,364) (50,295) 255 1,555 (48,483) Subtotal . . . . . . . . . . . . . . . . . – 14 42,444 18 42,477 (54,619) 6,688 (2,364) (50,295) 255 1,555 (6,006)Balance as of March 31, 2008 . . ¥265,608 ¥203,893 ¥787,007 ¥(5,045) ¥1,251,464 ¥ 157,546 ¥ 7,346 ¥ 3,847 ¥ 168,739 ¥549 ¥19,676 ¥1,440,429 Effect of changes in accounting policies applied to foreign subsidiaries . . . . . . . . . . (2,142)* (2,142) (2,142) Cash dividends (Note 10) . . . . . . (20,137) (20,137) (20,137) Net income . . . . . . . . . . . . . . . . . 24,217 24,217 24,217 Increase resulting from inclusion in the scope of consolidation and equity method . . . . . . . . . . . . . . 3 3 3 Purchase of treasury stock . . . . . (72) (72) (72) Disposal of treasury stock . . . . . . 34 76 111 111 Net changes in items other than stockholders’ equity . . . . . . . . . – (140,232) (7,022) (33,329) (180,585) 332 21,095 (159,157) Subtotal . . . . . . . . . . . . . . . . . – 34 4,083 3 4,121 (140,232) (7,022) (33,329) (180,585) 332 21,095 (155,035)Balance as of March 31, 2009 . . ¥265,608 ¥203,928 ¥788,948 ¥(5,041) ¥1,253,443 ¥ 17,313 ¥ 323 ¥(29,482) ¥ (11,845) ¥881 ¥40,772 ¥1,283,251
In thousands of U.S. dollars (Note 2)Stockholders’ equity Valuation, translation adjustments and others
Common stock
Capital surplus
Retained earnings
Treasury stock
Total stockholders’
equity
Net unrealized gains on
investment securities
Deferred gains or
losses on hedges
Foreign currency
translation adjustments
Total valuation, translation
adjustments and others
Share subscription
rightsMinority interests
Total net assets
Balance as of March 31, 2008 . . $2,703,939 $2,075,669 $8,011,880 $(51,359) $12,740,140 $ 1,603,848 $ 74,783 $ 39,163 $ 1,717,794 $5,588 $200,305 $14,663,839 Effect of changes in accounting policies applied to foreign subsidiaries . . . . . . . . . . (21,805)* (21,805) (21,805) Cash dividends (Note 10) . . . . . . (204,998) (204,998) (204,998) Net income . . . . . . . . . . . . . . . . . 246,533 246,533 246,533 Increase resulting from inclusion in the scope of consolidation and equity method . . . . . . . . . . . . . . 30 30 30 Purchase of treasury stock . . . . . (732) (732) (732) Disposal of treasury stock . . . . . . 346 773 1,130 1,130 Net changes in items other than stockholders’ equity . . . . . . . . . – (1,427,588) (71,485) (339,295) (1,838,389) 3,379 214,751 (1,620,248) Subtotal . . . . . . . . . . . . . . . . . – 346 41,565 30 41,952 (1,427,588) (71,485) (339,295) (1,838,389) 3,379 214,751 (1,578,285)Balance as of March 31, 2009 . . $2,703,939 $2,076,025 $8,031,640 $(51,318) $12,760,287 $ 176,249 $ 3,288 $(300,132) $ (120,584) $8,968 $415,066 $13,063,738
* Decrease of 2,111 million yen ($21,490 thousand) included in the above figures was an effect of changes in accounting policies applied to overseas subsidiaries of an affiliate company accounted for by the equity method. (This was an amount proportionate to the number of its shares the MHI Group held.)
Consolidated Statements of Changes in Net Assets
Mitsubishi Heavy Industries, Ltd. and Consolidated Subsidiaries
For the years ended March 31, 2009 and 2008
ANNUAL REPORT 2009 43

Consolidated Statements of Cash Flows
Mitsubishi Heavy Industries, Ltd. and Consolidated Subsidiaries
For the years ended March 31, 2009 and 2008
In millions of yenIn thousands of
U.S. dollars (Note 2)
2009 2008 2009
Cash flows from operating activities: Income before income taxes and minority interests . . . . . . . . . . . . . . . . . . . . . . . . . . . . . . . . ¥ 64,923 ¥ 101,375 $ 660,928 Adjustments to reconcile income before income taxes and minority interests to net cash provided by operating activities: Depreciation and amortization . . . . . . . . . . . . . . . . . . . . . . . . . . . . . . . . . . . . . . . . . . . . . . . . 152,989 128,260 1,557,456 Decrease in reserve for retirement allowance . . . . . . . . . . . . . . . . . . . . . . . . . . . . . . . . . . . . . (38,827) (8,554) (395,266) Interest and dividend income . . . . . . . . . . . . . . . . . . . . . . . . . . . . . . . . . . . . . . . . . . . . . . . . (14,193) (14,558) (144,487) Interest expense . . . . . . . . . . . . . . . . . . . . . . . . . . . . . . . . . . . . . . . . . . . . . . . . . . . . . . . . . . 20,224 20,288 205,884 Equity in losses (earnings) of unconsolidated subsidiaries and affiliates . . . . . . . . . . . . . . . . . 9,006 (8,224) 91,682 Gain on sales of investment securities . . . . . . . . . . . . . . . . . . . . . . . . . . . . . . . . . . . . . . . . . . (14,286) – (145,434) Gain on sales of fixed assets (Note 7) . . . . . . . . . . . . . . . . . . . . . . . . . . . . . . . . . . . . . . . . . . (3,932) (18,467) (40,028) Loss on disposal of fixed assets . . . . . . . . . . . . . . . . . . . . . . . . . . . . . . . . . . . . . . . . . . . . . . 7,080 7,344 72,075 Loss on legal claims . . . . . . . . . . . . . . . . . . . . . . . . . . . . . . . . . . . . . . . . . . . . . . . . . . . . . . . 20,835 – 212,104 Business structure improvement expenses (Note 9) . . . . . . . . . . . . . . . . . . . . . . . . . . . . . . . 10,434 30,261 106,220 Gain on transfer of business (Note 8) . . . . . . . . . . . . . . . . . . . . . . . . . . . . . . . . . . . . . . . . . . – (3,664) – Decrease in investment securities due to the contribution to retirement benefit trust (Note 3) . . 71,735 – 730,275 (Increase) decrease in receivables . . . . . . . . . . . . . . . . . . . . . . . . . . . . . . . . . . . . . . . . . . . . . (41,289) 80,076 (420,329) (Increase) decrease in inventories and advances to suppliers . . . . . . . . . . . . . . . . . . . . . . . . (149,996) (140,789) (1,526,987) (Increase) decrease in other assets . . . . . . . . . . . . . . . . . . . . . . . . . . . . . . . . . . . . . . . . . . . . (40,010) (3,559) (407,309) Increase (decrease) in payables . . . . . . . . . . . . . . . . . . . . . . . . . . . . . . . . . . . . . . . . . . . . . . . 305 (14,683) 3,104 Increase (decrease) in advance payments received on contracts . . . . . . . . . . . . . . . . . . . . . . 26,492 76,971 269,693 Increase (decrease) in other liabilities . . . . . . . . . . . . . . . . . . . . . . . . . . . . . . . . . . . . . . . . . . . 77,159 (17,543) 785,493 Others . . . . . . . . . . . . . . . . . . . . . . . . . . . . . . . . . . . . . . . . . . . . . . . . . . . . . . . . . . . . . . . . . . (1,397) (504) (14,221) Subtotal . . . . . . . . . . . . . . . . . . . . . . . . . . . . . . . . . . . . . . . . . . . . . . . . . . . . . . . . . . . . . . 157,255 214,027 1,600,885 Interest and dividends received . . . . . . . . . . . . . . . . . . . . . . . . . . . . . . . . . . . . . . . . . . . . . . . 18,644 16,240 189,799 Interest paid . . . . . . . . . . . . . . . . . . . . . . . . . . . . . . . . . . . . . . . . . . . . . . . . . . . . . . . . . . . . . (19,863) (20,068) (202,209) Payments for income taxes . . . . . . . . . . . . . . . . . . . . . . . . . . . . . . . . . . . . . . . . . . . . . . . . . . (76,503) (48,375) (778,815) Net cash provided by operating activities . . . . . . . . . . . . . . . . . . . . . . . . . . . . . . . . . . . . . . 79,533 161,823 809,660 Cash flows from investing activities: Net decrease in time deposits . . . . . . . . . . . . . . . . . . . . . . . . . . . . . . . . . . . . . . . . . . . . . . . . 3,029 2,903 30,835 Purchases of marketable securities . . . . . . . . . . . . . . . . . . . . . . . . . . . . . . . . . . . . . . . . . . . . (245) – (2,494) Proceeds from sales and redemption of marketable securities . . . . . . . . . . . . . . . . . . . . . . . 555 793 5,650 Purchases of property, plant, equipment and intangible assets . . . . . . . . . . . . . . . . . . . . . . . (182,273) (194,660) (1,855,573) Proceeds from sales of property, plant, equipment and intangible assets . . . . . . . . . . . . . . . 6,363 15,100 64,776 Purchases of investment securities . . . . . . . . . . . . . . . . . . . . . . . . . . . . . . . . . . . . . . . . . . . . (41,068) (28,366) (418,080) Proceeds from sales and redemption of investment securities . . . . . . . . . . . . . . . . . . . . . . . . 53,541 8,986 545,057 Disbursement of long-term loans . . . . . . . . . . . . . . . . . . . . . . . . . . . . . . . . . . . . . . . . . . . . . (1,615) (1,956) (16,441) Collection of long-term loans . . . . . . . . . . . . . . . . . . . . . . . . . . . . . . . . . . . . . . . . . . . . . . . . . 5,038 1,142 51,287 Others . . . . . . . . . . . . . . . . . . . . . . . . . . . . . . . . . . . . . . . . . . . . . . . . . . . . . . . . . . . . . . . . . . 80 3,000 814 Net cash used in investing activities . . . . . . . . . . . . . . . . . . . . . . . . . . . . . . . . . . . . . . . . . . (156,593) (193,055) (1,594,146) Cash flows from financing activities: Net increase (decrease) in short-term borrowings and commercial papers . . . . . . . . . . . . . . 134,936 (56,816) 1,373,674 Proceeds from long-term borrowings . . . . . . . . . . . . . . . . . . . . . . . . . . . . . . . . . . . . . . . . . . 249,621 132,219 2,541,189 Repayment of long-term borrowings . . . . . . . . . . . . . . . . . . . . . . . . . . . . . . . . . . . . . . . . . . . (84,925) (60,402) (864,552) Proceeds from issuance of bonds . . . . . . . . . . . . . . . . . . . . . . . . . . . . . . . . . . . . . . . . . . . . . – 130,000 – Payment for redemption of bonds . . . . . . . . . . . . . . . . . . . . . . . . . . . . . . . . . . . . . . . . . . . . . (40,300) (52,656) (410,261) Proceeds from issuance of stock to minority stockholders of subsidiaries . . . . . . . . . . . . . . . 23,533 – 239,570 Dividends paid to stockholders . . . . . . . . . . . . . . . . . . . . . . . . . . . . . . . . . . . . . . . . . . . . . . . (20,083) (20,078) (204,448) Dividends paid to minority stockholders of subsidiaries . . . . . . . . . . . . . . . . . . . . . . . . . . . . . (501) (712) (5,100) Others . . . . . . . . . . . . . . . . . . . . . . . . . . . . . . . . . . . . . . . . . . . . . . . . . . . . . . . . . . . . . . . . . . (279) (324) (2,840) Net cash provided by financing activities . . . . . . . . . . . . . . . . . . . . . . . . . . . . . . . . . . . . . . 262,002 71,228 2,667,229Effect of exchange rate changes on cash and cash equivalents . . . . . . . . . . . . . . . . . . . (23,388) (5,339) (238,094)Net increase in cash and cash equivalents. . . . . . . . . . . . . . . . . . . . . . . . . . . . . . . . . . . . . 161,554 34,657 1,644,650Cash and cash equivalents at beginning of year . . . . . . . . . . . . . . . . . . . . . . . . . . . . . . . . 262,852 227,584 2,675,883Increase in cash and cash equivalents resulting from inclusion of consolidated subsidiaries . . . 1,506 610 15,331Cash and cash equivalents at end of year (Note 12) . . . . . . . . . . . . . . . . . . . . . . . . . . . . . . ¥ 425,913 ¥ 262,852 $ 4,335,874The accompanying notes to consolidated financial statements are an integral part of these statements.
MITSUBISHI HEAVY INDUSTRIES, LTD.44

a) Basis of presenting consolidated financial statementsThe accompanying consolidated financial statements of the Mitsubishi Heavy Industries Group (the “Group”), which consists of Mitsubishi Heavy Industries, Ltd. (“MHI”) and its consolidated subsidiaries (“Subsidiaries”), have been prepared in accordance with accounting principles generally accepted in Japan, which are different in certain respects as to the application and disclosure requirements of International Financial Reporting Standards and have been prepared from the consolidated financial statements filed with the Financial Services Agency (“FSA”) in Japan. Certain items presented in the consolidated financial statements filed with the FSA have been reclassified.
As permitted by the Financial Instruments and Exchange Act of Japan, amounts of less than one million yen have been omitted. Consequently, the totals shown in the accompanying consolidated financial statements (both in yen and U.S. dollars) do not necessarily agree with the sums of the individual amounts.
b) Principles of consolidationThe accompanying consolidated financial statements for the years ended March 31, 2009 and 2008 include the accounts of the Group. All significant inter-company transactions and accounts have been eliminated. Investments in unconsolidated subsidiaries and affiliates, with certain minor exceptions, are accounted for by the equity method.
c) Foreign currency translationForeign currency monetary assets and liabilities are translated into Japanese yen at the exchange rate in effect at the end of the respective fiscal year and the resulting translation gains or losses are included in net income.
All assets and liabilities of overseas subsidiaries and affiliates are translated into Japanese yen at the exchange rate in effect at the end of the respective fiscal year, revenues and expenses at the average exchange rate during the year, and stockholders’ equity at historical rates. The resulting foreign currency translation adjustments are accounted for as a separate component of “Valuation, translation adjustments and others.”
d) SecuritiesSecurities include investments in unconsolidated subsidiaries and affiliates, and other securities (available-for- sale securities).
Investments in unconsolidated subsidiaries and affiliates excluding those accounted for by the equity method are stated at cost determined by the moving average method. Other securities with market value are stated at market value based on market prices or other fair values at the balance sheet date. Unrealized holding gains and losses of other securities with market value are accounted for as a separate component of “Valuation, translation adjustments and others,” net of tax effect. The cost of other securities sold with market value is computed based on the moving average method. Other securities without market value are stated at cost determined by the moving average method.
As to the presentation of the balance sheet, the Group has classified securities due within one year as securities in current assets and the others as investment securities in “Investments and advances.”
e) InventoriesMerchandise and finished products are principally stated at cost determined by the moving average method. (Balance sheet amounts are determined by the method of writing down to reflect a decline in the profitability of the assets.)
Work in process is principally stated at cost determined by the specific identification method. (Balance sheet amounts are determined by the method of writing down to reflect a decline in the profitability of the assets.)
Raw materials and supplies are principally stated at cost determined by the moving average method. (Balance sheet amounts are determined by the method of writing down to reflect a decline in the profitability of the assets.)
(Change in accounting policy)The Group has applied the “Accounting Standard for Measurement of Inventories” (Accounting Standards Board of Japan (“ASBJ”) Statement No. 9, issued on July 5, 2006) from the year ended March 31, 2009.
The amount of the write-downs at the end of the year ended March 31, 2009 due to this application was 53,932 million yen ($549,037 thousand). Out of the total amount, 33,436 million yen ($340,384 thousand) write-downs taken at the beginning of the same year were recognized as extraordinary loss on the “effect of the application of the accounting standard for measurement of inventories.” As the result of this change, operating income and ordinary income for the same year decreased by 20,496 million yen ($208,653 thousand), respectively and income before income taxes and minority interests for the same year decreased by 53,932 million yen ($549,037 thousand).
1. SUMMARY OF SIGNIFICANT ACCOUNTING POLICIES
Notes to Consolidated Financial Statements
Mitsubishi Heavy Industries, Ltd. and Consolidated Subsidiaries
Years ended March 31, 2009 and 2008
ANNUAL REPORT 2009 45

f) Property, plant and equipment and depreciationProperty, plant and equipment, including significant renewals and additions, are carried at cost.
Depreciation is principally computed using the straight-line method for buildings (excluding the equipment attached to them) and the declining-balance method for the other tangible assets over the assets’ useful lives, which are substantially the same as those provided for in the Corporation Income Tax Law.(Additional information)MHI and Subsidiaries located in Japan revised the categorization and useful lives of machinery in order to reflect their actual status more properly in relation to the amendment of the Corporation Income Tax Law in fiscal year 2008.
As the result of this treatment, operating income, ordinary income and income before income taxes and minority interests for the year ended March 31, 2009 decreased by 5,361 million yen ($54,575 thousand), respectively.
g) Intangible assetsDepreciation of leased assets is computed using the straight-line method over the assets’ useful lives, which are substantially the same as those provided for in the Corporation Income Tax Law.
Goodwill is amortized on a straight-line basis over the investment recovery period of up to 20 years.
h) LeasesDepreciation of leased assets is computed using the straight-line method over the lease terms.
i) Allowance for doubtful receivablesAllowance for doubtful receivables is provided at an amount sufficient to cover possible losses on the collection of receivables. The amount of the allowance is determined based on (1) an estimated amount for probable doubtful accounts based on a review of the collectibility of individual receivables, and (2) a ratio based on the Group’s historical experience of write-offs of receivables other than those covered in item (1) above.
j) Reserve for product warrantiesReserve for product warranties is provided for the purpose of reserving for the product warranty expenditure after products are delivered, which is estimated based on the historical experience.
k) Reserve for losses on construction contractsReserve for losses on construction contracts is provided based on an estimate of the total losses to be realized in the following years in respect of construction projects on which eventual losses are deemed inevitable and amounts thereof can be reasonably estimated.
If the costs of partially completed construction contracts (out of the construction contracts covered by the reserve for losses on construction contracts) at the end of the fiscal year exceed their respective total contract revenues, the excess of such costs is recognized as a loss on revaluation of partially completed construction contracts and, accordingly, is not included in the reserve for losses on construction contracts.
l) Reserve for legal claimsReserve for legal claims is provided based on estimates of damage compensations and other expenses on legal claims.
m) Reserve for retirement allowanceReserve for retirement allowance is provided to prepare for employees’ retirement based on estimates of the retirement benefit obligation and the pension fund assets including the retirement benefit trust at the end of the fiscal year.
Prior service costs are either expensed as incurred or amortized by the straight-line method over the years shorter than the average remaining service periods of the Group’s employees.
Actuarial gains and losses for each year are amortized, starting in the following year of the incurrence, by the straight-line method over the years shorter than the employees’ average remaining service periods.
MITSUBISHI HEAVY INDUSTRIES, LTD.46

(Additional information)In the year ended March 31, 2009, MHI made a contribution of investment securities with the aggregate book value of 71,735 million yen ($730,275 thousand) whose aggregate market value was 107,840 million yen ($1,097,831 thousand) to a retirement benefit trust. An extraordinary gain of 36,104 million yen ($367,545 thousand) was recognized as a result.
n) Reserve for treatment of PCB wasteReserve for treatment of PCB (Poly Chlorinated Biphenyl) waste is provided based on estimated costs of the treatment for PCB products and equipment as well as their collection and transportation fees.
o) Revenue recognitionSales of products are principally recognized upon acceptance by the customers. Revenues from long-term contracts with both the contract amount of 5,000 million yen ($50,900 thousand) or greater and the contract period of two years or longer are recognized on the basis of the percentage-of-completion method.
p) Hedge accountingPrincipally, the “deferral method” is applied where the Group defers recognition of gains or losses until the related losses or gains on the hedged items are recognized.
If a forward exchange contract for foreign currency receivables or payables meets conditions of hedged item in terms of amount, currency and period, the “assigning method” is applied where the hedged item is stated at the forward exchange contract rate. (Note: The “assigning method” is not applied in case of comprehensive forward exchange contracts.)
Also, if an interest rate swap contract meets conditions of hedged items in terms of amount, index and period, the “exceptional method” is applied where the net amount to be paid or received under the contract is added to or deducted from the interest.
The Group evaluates the effectiveness of its hedging activities by reference to the accumulated gains or losses on the hedging instruments and the related hedged items from the commencement of the hedges.
q) Tax-effect accountingDeferred income taxes are accounted for under the asset and liability method. Under this method, deferred tax assets and liabilities are recognized based on temporary differences between the financial statement and tax basis of assets and liabilities using enacted tax rates expected to apply to taxable income in the years in which these temporary differences are expected to be recovered or settled.
r) Cash and cash equivalentsFor the purpose of the consolidated statements of cash flows, cash, demand deposits and highly liquid investments with insignificant risk of changes in value which have maturities of three months or less when purchased are treated as cash and cash equivalents.
s) Net income per shareThe computation of basic net income per share is based on the net income available to common stockholders and the weighted average number of shares outstanding during each period.
Diluted net income per share is computed based on the assumption that all the share subscription rights are exercised at the beginning of the year (or issue date if later).
t) Others(1) Application of the “Practical Solution on Unification of Accounting Policies Applied to Foreign
Subsidiaries for Consolidated Financial Statements”The Group has applied the “Practical Solution on Unification of Accounting Policies Applied to Foreign Subsidiaries for Consolidated Financial Statements” (ASBJ PITF No.18, issued on May 17, 2006) from the year ended March 31, 2009 and made necessary adjustments in preparing consolidated financial statements.
As a result, retained earnings at the beginning of the same year decreased by 30 million yen ($305 thousand).The effects on operating income, ordinary income and income before income taxes and minority interests for
the same year are negligible.
ANNUAL REPORT 2009 47
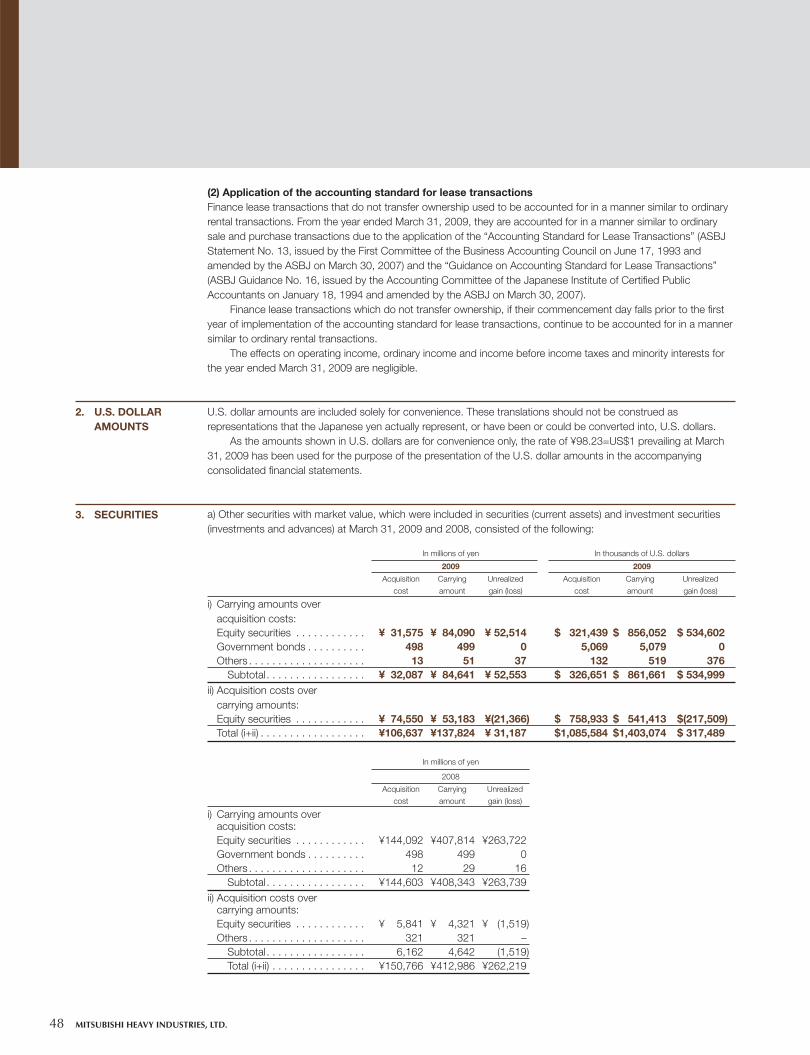
(2) Application of the accounting standard for lease transactionsFinance lease transactions that do not transfer ownership used to be accounted for in a manner similar to ordinary rental transactions. From the year ended March 31, 2009, they are accounted for in a manner similar to ordinary sale and purchase transactions due to the application of the “Accounting Standard for Lease Transactions” (ASBJ Statement No. 13, issued by the First Committee of the Business Accounting Council on June 17, 1993 and amended by the ASBJ on March 30, 2007) and the “Guidance on Accounting Standard for Lease Transactions” (ASBJ Guidance No. 16, issued by the Accounting Committee of the Japanese Institute of Certified Public Accountants on January 18, 1994 and amended by the ASBJ on March 30, 2007).
Finance lease transactions which do not transfer ownership, if their commencement day falls prior to the first year of implementation of the accounting standard for lease transactions, continue to be accounted for in a manner similar to ordinary rental transactions.
The effects on operating income, ordinary income and income before income taxes and minority interests for the year ended March 31, 2009 are negligible.
U.S. dollar amounts are included solely for convenience. These translations should not be construed as representations that the Japanese yen actually represent, or have been or could be converted into, U.S. dollars.
As the amounts shown in U.S. dollars are for convenience only, the rate of ¥98.23=US$1 prevailing at March 31, 2009 has been used for the purpose of the presentation of the U.S. dollar amounts in the accompanying consolidated financial statements.
a) Other securities with market value, which were included in securities (current assets) and investment securities (investments and advances) at March 31, 2009 and 2008, consisted of the following:
In millions of yen In thousands of U.S. dollars
2009 2009
Acquisition
cost
Carrying
amount
Unrealized
gain (loss)
Acquisition
cost
Carrying
amount
Unrealized
gain (loss)
i) Carrying amounts over acquisition costs:
Equity securities . . . . . . . . . . . . ¥ 31,575 ¥ 84,090 ¥ 52,514 $ 321,439 $ 856,052 $ 534,602 Government bonds . . . . . . . . . . 498 499 0 5,069 5,079 0 Others . . . . . . . . . . . . . . . . . . . . 13 51 37 132 519 376 Subtotal . . . . . . . . . . . . . . . . . ¥ 32,087 ¥ 84,641 ¥ 52,553 $ 326,651 $ 861,661 $ 534,999ii) Acquisition costs over
carrying amounts: Equity securities . . . . . . . . . . . . ¥ 74,550 ¥ 53,183 ¥(21,366) $ 758,933 $ 541,413 $(217,509) Total (i+ii) . . . . . . . . . . . . . . . . . . ¥106,637 ¥137,824 ¥ 31,187 $1,085,584 $1,403,074 $ 317,489
In millions of yen
2008
Acquisition
cost
Carrying
amount
Unrealized
gain (loss)
i) Carrying amounts over acquisition costs:
Equity securities . . . . . . . . . . . . ¥144,092 ¥407,814 ¥263,722 Government bonds . . . . . . . . . . 498 499 0 Others . . . . . . . . . . . . . . . . . . . . 12 29 16 Subtotal . . . . . . . . . . . . . . . . . ¥144,603 ¥408,343 ¥263,739ii) Acquisition costs over
carrying amounts: Equity securities . . . . . . . . . . . . ¥ 5,841 ¥ 4,321 ¥ (1,519) Others . . . . . . . . . . . . . . . . . . . . 321 321 – Subtotal . . . . . . . . . . . . . . . . . 6,162 4,642 (1,519) Total (i+ii) . . . . . . . . . . . . . . . . ¥150,766 ¥412,986 ¥262,219
3. SECURITIES
2. U.S. DOLLAR AMOUNTS
MITSUBISHI HEAVY INDUSTRIES, LTD.48

Note: The Group treated as impaired those securities whose market values showed a substantial decline and were not judged to recover. The amount reflecting the impairment loss is recorded as the acquisition cost for these securities.
Securities were judged as impaired when their market values had declined 50% or more from their book values at the end of respective fiscal years, or had declined between 30% and 50% from their book values at every quarter end (Q1–Q4) of respective fiscal years.
The amount of impairment losses for the years ended March 31, 2009 and 2008 amounted to 420 million yen ($4,275 thousand) and 33 million yen with respect to other securities with market value.
b) Sales amounts of other securities and related gains and losses for the years ended March 31, 2009 and 2008, excluding investment securities contributed to the retirement benefit trust mentioned in Note 1 m), were as follows:
In millions of yenIn thousands of
U.S. dollars
2009 2008 2009
Sales amounts . . . . . . . . . . . . . . . . . . . . . . . . . . . . . . . . . . . . . . . . . . . ¥1,266 ¥ 8,541 $12,888Gains . . . . . . . . . . . . . . . . . . . . . . . . . . . . . . . . . . . . . . . . . . . . . . . . . . 282 2,051 2,870Losses . . . . . . . . . . . . . . . . . . . . . . . . . . . . . . . . . . . . . . . . . . . . . . . . . ¥ (16) ¥(1,304) $ (162)
Note: The aggregate book value of the investment securities contributed to the retirement benefit trust was 71,735 million yen ($730,275 thousand) and the gain on the contribution was 36,104 million yen ($367,545 thousand). These amounts are not included in the above table.
c) Other securities without market value, which were included in securities (current assets) and investment securities (investments and advances) at March 31, 2009 and 2008, mainly consisted of the following:
In millions of yenIn thousands of
U.S. dollars
2009 2008 2009
Equity securities – unlisted . . . . . . . . . . . . . . . . . . . . . . . . . . . . . . . . . . ¥14,326 ¥14,295 $145,841Certificate of deposit . . . . . . . . . . . . . . . . . . . . . . . . . . . . . . . . . . . . . . . ¥ 3,000 ¥ 3,500 $ 30,540
Note: The Group treated as impaired those securities whose equity values were judged to have declined 50% or more from their book values due to financial difficulties of the issuers.
The amount of impairment loss for the years ended March 31, 2009 and 2008 amounted to 9 million yen ($91 thousand) and 150 million yen, respectively, with respect to other securities without market value.
d) The contractual maturities of other securities at March 31, 2009 and 2008 were as follows:
In millions of yen In thousands of U.S. dollars2009 2009
Due within
one year
Due after one
year through
five years
Due within
one year
Due after one
year through
five years
Certificate of deposit . . . . . . . . . . . . . ¥3,007 ¥ – $30,611 $ –Bonds: Government bonds . . . . . . . . . . . . – 509 – 5,181 Total . . . . . . . . . . . . . . . . . . . . . ¥3,007 ¥509 $30,611 $5,181
In millions of yen
2008
Due within
one year
Due after one
year through
five years
Certificate of deposit . . . . . . . . . . . . . ¥3,507 ¥ –Bonds: Government bonds . . . . . . . . . . . . 9 499 Others . . . . . . . . . . . . . . . . . . . . . . 383 – Total . . . . . . . . . . . . . . . . . . . . . ¥3,901 ¥499
ANNUAL REPORT 2009 49

The Group is subject to corporation income tax, inhabitants’ tax and enterprise tax, based on income, which in the aggregate resulted in the statutory effective tax rate of approximately 40.5% for the years ended March 31, 2009 and 2008.
a) Significant components of deferred tax assets and liabilities at March 31, 2009 and 2008, which arose as a result of the recognition of the tax effect mentioned in section q) of Note 1 “Summary of Significant Accounting Policies,” were as follows:
In millions of yenIn thousands of
U.S. dollars
2009 2008 2009
Deferred tax assets: Reserve for retirement allowance . . . . . . . . . . . . . . . . . . . . . . . . ¥ 109,792 ¥ 110,315 $ 1,117,703 Accrued expenses for product warranties . . . . . . . . . . . . . . . . . . 30,568 30,339 311,188 Accrued expenses for construction contracts . . . . . . . . . . . . . . . 24,982 25,447 254,321 Tax loss carryforwards . . . . . . . . . . . . . . . . . . . . . . . . . . . . . . . . 21,658 – 220,482 Inventory write-downs . . . . . . . . . . . . . . . . . . . . . . . . . . . . . . . . . 18,251 – 185,798 Reserve for losses on construction contracts . . . . . . . . . . . . . . . 16,780 – 170,823 Others . . . . . . . . . . . . . . . . . . . . . . . . . . . . . . . . . . . . . . . . . . . . . 121,251 108,431 1,234,358 Subtotal . . . . . . . . . . . . . . . . . . . . . . . . . . . . . . . . . . . . . . . . . 343,285 274,533 3,494,706 Valuation allowance . . . . . . . . . . . . . . . . . . . . . . . . . . . . . . . . . . . (56,362) (33,813) (573,775) Total gross deferred tax assets. . . . . . . . . . . . . . . . . . . . . . . 286,922 240,720 2,920,920Deferred tax liabilities: Gain on contribution of securities to retirement benefit trust . . . . (84,421) (70,682) (859,421) Reserve for reduction in costs of fixed assets . . . . . . . . . . . . . . . (22,576) (23,199) (229,827) Net unrealized gains on investment securities . . . . . . . . . . . . . . . (21,278) (106,823) (216,614) Deferred (gains) losses on hedges . . . . . . . . . . . . . . . . . . . . . . . . (1,719) (5,564) (17,499) Reserve for accelerated depreciation . . . . . . . . . . . . . . . . . . . . . – (2,566) – Others . . . . . . . . . . . . . . . . . . . . . . . . . . . . . . . . . . . . . . . . . . . . . (18,910) (4,059) (192,507) Total gross deferred tax liabilities . . . . . . . . . . . . . . . . . . . . . . . (148,905) (212,895) (1,515,881) Net deferred tax assets (liabilities) . . . . . . . . . . . . . . . . . . . . . . ¥ 138,016 ¥ 27,824 $ 1,405,029
Notes: 1. “Others” in deferred tax assets at March 31, 2008 includes “Tax loss carryforwards” which amounts to 9,412 million yen, “Inventory write-downs” which amounts to 1,645 million yen and “Reserve for losses on construction contracts” which amounts to 4,817 million yen.
2. “Others” in deferred tax liabilities at March 31, 2009 includes “Reserve for accelerated depreciation” which amounts to 1,192 million yen ($12,134 thousand).
3. Net deferred tax assets (liabilities) at March 31, 2009 and 2008 are reflected in the consolidated balance sheets as follows:
In millions of yenIn thousands of
U.S. dollars
2009 2008 2009
Deferred income taxes in current assets . . . . . . . . . . . . . . . . . ¥136,341 ¥114,548 $1,387,977Deferred income taxes in investments and advances . . . . . . . 9,372 7,411 95,408Other current liabilities . . . . . . . . . . . . . . . . . . . . . . . . . . . . . . (177) (1) (1,801)Deferred income taxes in long-term liabilities. . . . . . . . . . . . . . ¥ (7,519) ¥ (94,134) $ (76,544)
b) Reconciliation of the statutory effective income tax rate and the income tax rate as a percentage of income before income taxes and minority interests at March 31, 2009 and 2008 are as follows:
2009 2008
Japanese statutory effective income tax rate . . . . . . . . . . . . . . . . . . . . . . . . . . . . . . . 40.5% 40.5%Adjustment: Items excluded from expenses . . . . . . . . . . . . . . . . . . . . . . . . . . . . . . . . . . . . . . . . 2.5 1.3 Items excluded from gross income . . . . . . . . . . . . . . . . . . . . . . . . . . . . . . . . . . . . . (12.9) (1.9) Equity in losses (earnings) of unconsolidated subsidiaries and affiliates . . . . . . . . . . 5.6 (3.3) Valuation allowance . . . . . . . . . . . . . . . . . . . . . . . . . . . . . . . . . . . . . . . . . . . . . . . . . 34.6 8.0 Tax exemption for research & development expenditure . . . . . . . . . . . . . . . . . . . . . (7.7) (4.4) Others . . . . . . . . . . . . . . . . . . . . . . . . . . . . . . . . . . . . . . . . . . . . . . . . . . . . . . . . . . . 0.6 (2.4)Income tax rate as a percentage of income before income taxes and minority interests . 63.2% 37.8%
4. INCOME TAXES
MITSUBISHI HEAVY INDUSTRIES, LTD.50

a) Short-term borrowings and commercial papers at March 31, 2009 and 2008 consisted of the following:
In millions of yenIn thousands of
U.S. dollars
2009 2008 2009
Loans, principally from banks, with weighted-average interest rate of 1.3% at March 31, 2009 and 1.6% at March 31, 2008: Secured . . . . . . . . . . . . . . . . . . . . . . . . . . . . . . . . . . . . . . . . . . ¥ 10,065 ¥ 11,196 $ 102,463 Unsecured . . . . . . . . . . . . . . . . . . . . . . . . . . . . . . . . . . . . . . . . 238,669 222,604 2,429,695Commercial papers with weighted-average interest rate of 0.4% at March 31, 2009: 115,000 – 1,170,721 Total . . . . . . . . . . . . . . . . . . . . . . . . . . . . . . . . . . . . . . . . . . . ¥363,734 ¥233,801 $3,702,880
b) Long-term borrowings at March 31, 2009 and 2008 consisted of the following:
In millions of yenIn thousands of
U.S. dollars
2009 2008 2009
Loans, principally from banks and insurance companies, due 2009 to 2023 with weighted-average interest rate of 1.7% at March 31, 2009 and due 2008 to 2023 with weighted-average interest rate of 1.7% at March 31, 2008: Secured . . . . . . . . . . . . . . . . . . . . . . . . . . . . . . . . . . . . . . . . . . ¥ 8,764 ¥ 21,792 $ 89,219 Unsecured . . . . . . . . . . . . . . . . . . . . . . . . . . . . . . . . . . . . . . . . 951,050 775,387 9,681,869Export loans, principally from main contractors, due 2009 to 2018 with weighted-average interest rate of 2.7% at March 31, 2009 and due 2008 to 2018 with weighted-average interest rate of 2.6% at March 31, 2008: Unsecured . . . . . . . . . . . . . . . . . . . . . . . . . . . . . . . . . . . . . . . . 4,409 8,054 44,884Unsecured bonds: 2.15% bonds due 2008 . . . . . . . . . . . . . . . . . . . . . . . . . . . . . . – 40,000 – 0.63% bonds due 2010 . . . . . . . . . . . . . . . . . . . . . . . . . . . . . . 20,000 20,000 203,603 1.03% bonds due 2013 . . . . . . . . . . . . . . . . . . . . . . . . . . . . . . 30,000 30,000 305,405 0.365% bonds due 2010 . . . . . . . . . . . . . . . . . . . . . . . . . . . . . 20,000 20,000 203,603 0.70% bonds due 2013 . . . . . . . . . . . . . . . . . . . . . . . . . . . . . . 50,000 50,000 509,009 1.45% bonds due 2011 . . . . . . . . . . . . . . . . . . . . . . . . . . . . . . 10,000 10,000 101,801 2.04% bonds due 2016 . . . . . . . . . . . . . . . . . . . . . . . . . . . . . . 20,000 20,000 203,603 1.47% bonds due 2012 . . . . . . . . . . . . . . . . . . . . . . . . . . . . . . 50,000 50,000 509,009 1.69% bonds due 2014 . . . . . . . . . . . . . . . . . . . . . . . . . . . . . . 20,000 20,000 203,603 2.03% bonds due 2017 . . . . . . . . . . . . . . . . . . . . . . . . . . . . . . 60,000 60,000 610,811Unsecured bonds issued by Subsidiaries: 0.62% bonds, due 2009 to 2010 in 2009 and due 2008 to 2010 in 2008 . . . . . . . . . . . . . . . . . . . . . . . . . . . . 350 650 3,563 6.45% bonds due 2011 . . . . . . . . . . . . . . . . . . . . . . . . . . . . . . 4,551 5,707 46,330 Subtotal . . . . . . . . . . . . . . . . . . . . . . . . . . . . . . . . . . . . . . . . 1,249,125 1,131,592 12,716,329Less current portion due within one year . . . . . . . . . . . . . . . . . . . (128,567) (125,716) (1,308,836) Total . . . . . . . . . . . . . . . . . . . . . . . . . . . . . . . . . . . . . . . . . . . ¥1,120,558 ¥1,005,876 $11,407,492
5. SHORT-TERM BORROWINGS AND LONG-TERM BORROWINGS
ANNUAL REPORT 2009 51

c) A summary of assets pledged as collateral for short-term borrowings and long-term borrowings at March 31, 2009 and 2008 consisted of the following:
In millions of yenIn thousands of
U.S. dollars
2009 2008 2009
Property, plant and equipment . . . . . . . . . . . . . . . . . . . . . . . . . . . . ¥23,787 ¥23,765 $242,156Trade receivables: Notes . . . . . . . . . . . . . . . . . . . . . . . . . . . . . . . . . . . . . . . . . . . . . – 3,194 – Accounts . . . . . . . . . . . . . . . . . . . . . . . . . . . . . . . . . . . . . . . . . . – 11,424 –Others . . . . . . . . . . . . . . . . . . . . . . . . . . . . . . . . . . . . . . . . . . . . . . 283 763 2,880 Total . . . . . . . . . . . . . . . . . . . . . . . . . . . . . . . . . . . . . . . . . . . . ¥24,070 ¥39,147 $245,037
d) The aggregate annual maturities of long-term borrowings at March 31, 2009 were as follows:
Years ending March 31 In millions of yenIn thousands of
U.S. dollars
2010. . . . . . . . . . . . . . . . . . . . . . . . . . . . . . . . . . . . . . . . . . . . . . . . . . . . . . . . . . ¥ 128,567 $ 1,308,8362011. . . . . . . . . . . . . . . . . . . . . . . . . . . . . . . . . . . . . . . . . . . . . . . . . . . . . . . . . . 119,706 1,218,6292012. . . . . . . . . . . . . . . . . . . . . . . . . . . . . . . . . . . . . . . . . . . . . . . . . . . . . . . . . . 223,941 2,279,7612013. . . . . . . . . . . . . . . . . . . . . . . . . . . . . . . . . . . . . . . . . . . . . . . . . . . . . . . . . . 194,202 1,977,0132014. . . . . . . . . . . . . . . . . . . . . . . . . . . . . . . . . . . . . . . . . . . . . . . . . . . . . . . . . . 178,868 1,820,910Thereafter . . . . . . . . . . . . . . . . . . . . . . . . . . . . . . . . . . . . . . . . . . . . . . . . . . . . . . 403,839 4,111,157 Total . . . . . . . . . . . . . . . . . . . . . . . . . . . . . . . . . . . . . . . . . . . . . . . . . . . . . . . . ¥1,249,125 $12,716,329
e) The aggregate annual maturities of lease obligations at March 31, 2009 were as follows:
Years ending March 31 In millions of yenIn thousands of
U.S. dollars
2010. . . . . . . . . . . . . . . . . . . . . . . . . . . . . . . . . . . . . . . . . . . . . . . . . . . . . . . . . . ¥1,394 $14,1912011. . . . . . . . . . . . . . . . . . . . . . . . . . . . . . . . . . . . . . . . . . . . . . . . . . . . . . . . . . 1,313 13,3662012. . . . . . . . . . . . . . . . . . . . . . . . . . . . . . . . . . . . . . . . . . . . . . . . . . . . . . . . . . 979 9,9662013. . . . . . . . . . . . . . . . . . . . . . . . . . . . . . . . . . . . . . . . . . . . . . . . . . . . . . . . . . 835 8,5002014. . . . . . . . . . . . . . . . . . . . . . . . . . . . . . . . . . . . . . . . . . . . . . . . . . . . . . . . . . 628 6,393Thereafter . . . . . . . . . . . . . . . . . . . . . . . . . . . . . . . . . . . . . . . . . . . . . . . . . . . . . . 1,593 16,217 Total . . . . . . . . . . . . . . . . . . . . . . . . . . . . . . . . . . . . . . . . . . . . . . . . . . . . . . . . ¥6,744 $68,655
The Group has several non-contributory defined benefit pension plans and severance indemnity plans, and there are occasions where employees receive special lump-sum payments at retirement. Contributions to the plans are funded in accordance with the applicable laws and regulations. MHI has established a retirement benefit trust, as mentioned in section m) of Note 1 “Summary of Significant Accounting Policies.”
Prior service costs are expensed as incurred by MHI and most of the Subsidiaries. Some Subsidiaries amortize them by the straight-line method over the years shorter than the employees’ estimated average remaining service periods.
Actuarial gains and losses for each year are amortized, starting in the following year of the incurrence, by the straight-line method over the years shorter than the employees’ estimated average remaining service periods.
6. RETIREMENT BENEFITS
MITSUBISHI HEAVY INDUSTRIES, LTD.52

a) Benefit obligations and related information at March 31, 2009 and 2008 were as follows:
In millions of yenIn thousands of
U.S. dollars
2009 2008 2009
Benefit obligations . . . . . . . . . . . . . . . . . . . . . . . . . . . . . . . . . . . . . ¥(692,808) ¥(712,123) $(7,052,916)Fair value of plan assets . . . . . . . . . . . . . . . . . . . . . . . . . . . . . . . . . 479,574 530,621 4,882,154Unfunded benefit obligations . . . . . . . . . . . . . . . . . . . . . . . . . . . . . (213,233) (181,502) (2,170,752)Unrecognized actuarial losses (gains) . . . . . . . . . . . . . . . . . . . . . . . 259,640 119,851 2,643,184Unrecognized prior service costs (benefits) . . . . . . . . . . . . . . . . . . . (449) (531) (4,570)Net benefit liability recognized on the consolidated balance sheets . . 45,958 (62,182) 467,861Prepaid pension expense . . . . . . . . . . . . . . . . . . . . . . . . . . . . . . . . 96,734 27,754 984,770Reserve for retirement allowance . . . . . . . . . . . . . . . . . . . . . . . . . . ¥ (50,776) ¥ (89,936) $ (516,909)
b) The components of net periodic retirement benefit expenses for the years ended March 31, 2009 and 2008 consisted of the following:
In millions of yenIn thousands of
U.S. dollars
2009 2008 2009
Service cost . . . . . . . . . . . . . . . . . . . . . . . . . . . . . . . . . . . . . . . . . . ¥ 29,694 ¥ 28,894 $ 302,290Interest cost . . . . . . . . . . . . . . . . . . . . . . . . . . . . . . . . . . . . . . . . . . 14,017 14,835 142,695Expected return on plan assets . . . . . . . . . . . . . . . . . . . . . . . . . . . (12,917) (15,060) (131,497)Amortization of actuarial losses (gains) . . . . . . . . . . . . . . . . . . . . . . 16,484 9,857 167,810Amortization of prior service costs (credits) . . . . . . . . . . . . . . . . . . . (105) (267)* (1,068)Net benefit expenses . . . . . . . . . . . . . . . . . . . . . . . . . . . . . . . . . . . ¥ 47,174 ¥ 38,259 $ 480,240
* Amortization of prior service costs (credits) for the year ended March 31, 2008 included the credits generated by the retirement benefit system revision in some Subsidiaries, which were credited as incurred in that year.
c) The principal assumptions used in determining the information above at March 31, 2009 and 2008 were as follows:
2009 2008
Discount rate 2.0% 2.0%Expected rate of return on plan assets 3.5% 3.5%Amortization period for prior service costs Expensed as incurred
or 10 to 11 yearsExpensed as incurred
or 10 to 11 yearsAmortization period for actuarial gains and losses 11 to 18 years 11 to 18 years
Gain on sales of fixed assets for the years ended March 31, 2009 and 2008 consisted of the following:
In millions of yenIn thousands of
U.S. dollars
2009 2009
Land . . . . . . . . . . . . . . . . . . . . . . . . . . . . . . . . . . . . . . . . . . . . . . . . . . . . . . . . . . . ¥3,457 $35,192Others . . . . . . . . . . . . . . . . . . . . . . . . . . . . . . . . . . . . . . . . . . . . . . . . . . . . . . . . . 474 4,825 Total . . . . . . . . . . . . . . . . . . . . . . . . . . . . . . . . . . . . . . . . . . . . . . . . . . . . . . . ¥3,932 $40,028
In millions of yen
2008
Land . . . . . . . . . . . . . . . . . . . . . . . . . . . . . . . . . . . . . . . . . . . . . . . . . . . . . . . . . . ¥18,857Others . . . . . . . . . . . . . . . . . . . . . . . . . . . . . . . . . . . . . . . . . . . . . . . . . . . . . . . . . (390) Total . . . . . . . . . . . . . . . . . . . . . . . . . . . . . . . . . . . . . . . . . . . . . . . . . . . . . . . ¥18,467
7. GAIN ON SALES OF FIXED ASSETS
ANNUAL REPORT 2009 53

Gain on transfer of business for the year ended March 31, 2008 consisted of the transfer of the pulp and paper machinery business and the turbo-molecular pump business.
Business structure improvement expenses for the year ended March 31, 2009, which mainly arose from Mass and Medium–Lot Manufactured Machinery business and Power Systems business consisted of the following:
In millions of yenIn thousands of
U.S. dollars
2009 2009
Expenses on the restructuring of affiliate companies . . . . . . . . . . . . . . . . . . . . . . . ¥ 7,883 $ 80,250Expenses on the restructuring of the production structure . . . . . . . . . . . . . . . . . . 2,550 25,959 Total . . . . . . . . . . . . . . . . . . . . . . . . . . . . . . . . . . . . . . . . . . . . . . . . . . . . . . . ¥10,434 $106,220
Business structure improvement expenses for the year ended March 31, 2008, which arose from Aerospace business, Mass and Medium–Lot Manufactured Machinery business, and Machinery and Steel Structures business consisted of the following:
In millions of yen
2008
Expenses related to the contract cancellation . . . . . . . . . . . . . . . . . . . . . . . . . . . . ¥26,991Others . . . . . . . . . . . . . . . . . . . . . . . . . . . . . . . . . . . . . . . . . . . . . . . . . . . . . . . . . 3,269 Total . . . . . . . . . . . . . . . . . . . . . . . . . . . . . . . . . . . . . . . . . . . . . . . . . . . . . . . ¥30,261
a) Retained earningsThe Corporate Law of Japan provides that an amount equal to 10% of the amount to be disbursed as distributions of capital surplus (other than the capital reserve) and retained earnings (other than the legal reserve) be transferred to the capital reserve and the legal reserve, respectively, until the sum of the capital reserve and the legal reserve equals 25% of the capital stock account. Such distributions can be made at any time by resolution of the shareholders, or by the Board of Directors if certain conditions are met.
b) Total number of shares issued and treasury stock at March 31, 2009 and 2008 is as follows:
Type of
shares At March 31, 2008
Increase by
March 31, 2009
Decrease by
March 31, 2009 At March 31, 2009
Total number of the shares issued . . . . . Common
stock 3,373,647,813 – – 3,373,647,813
Treasury stock . . . . . . . . . . . . . . . . . . . . Common
stock 17,573,785 165,116 263,943 17,474,958
(1) Main reason for increase of treasury stockRepurchasing of shares that were less than the minimum trading unit. . . . . . . . . . . . . . . . . . . . . . . 165,115
(2) Reason for decrease of treasury stockDisposal resulting from the exercise of share subscription rights, which were issued for the purpose of providing stock options . . . . . . . . . . . . . . . . . . . . . . . . . . . . . . . . . . . . . . . . . . . . . . . . 167,000Disposal resulting from purchase request from shareholders who have some shares that were less than the minimum trading unit . . . . . . . . . . . . . . . . . . . . . . . . . . . . . . . . . . . . . . . . . . . . . . . . 96,943 Total . . . . . . . . . . . . . . . . . . . . . . . . . . . . . . . . . . . . . . . . . . . . . . . . . . . . . . . . . . . . . . . . . . . . 263,943
9. BUSINESS STRUCTURE IMPROVEMENT EXPENSES
8. GAIN ON TRANSFER OF BUSINESS
10. CONSOLIDATED STATEMENT OF CHANGES IN NET ASSETS
MITSUBISHI HEAVY INDUSTRIES, LTD.54

c) Cash dividends(1) Cash dividends paid
Cash dividends
per share Total cash dividends paid
Resolution
Type of
shares Record date Effective date In yen
In U.S.
dollars
In millions
of yen
In thousands
of U.S.
dollars
June 26, 2008
Ordinary General Meeting of Shareholders . .
Common stock
March 31, 2008
June 27, 2008 ¥3 $0.0305 ¥10,068 $102,494
October 31, 2008 Board of Directors . . . . . . . .
Common stock
September 30, 2008
December 3, 2008 ¥3 $0.0305 ¥10,068 $102,494
Total . . . . . . . . . . . . . . . . . . . . . . . . . . . . . . . . . . . . . . . . . . . . . . . . . . . . . . . . . . . . . . ¥20,136 $204,988
(2) Dividends of which record date is within this fiscal year but the effective date is within next fiscal year
Cash dividends
per share Total cash dividends paid
Resolution
Type of
shares
Record
date
Effective
date In yen
In U.S.
dollars
In millions
of yen
In thousands
of U.S.
dollars
June 25, 2009 Ordinary General
Meeting of Shareholders . . .Common
stockMarch 31,
2009June 26,
2009 ¥3 $0.0305 ¥10,068 $102,494
MHI has the following share-based compensation plans for the directors and corporate executive officers.The share-based compensation expenses, which amount to 388 million yen ($3,949 thousand) in the year
ended March 31, 2009 and 257 million yen in the year ended March 31, 2008, are included in selling, general and administrative expenses.
a) Conditions for issue of stock options
Stock options
(1st grant)
Stock options
(2nd grant)
Stock options
(3rd grant)
Stock options
(4th grant)
Stock options
(5th grant)
Stock options
(6th grant)
Stock options
(7th grant)
Grantee (Number of individuals) . . .
Directors (29)
Directors (27)
Directors & Executive officers
(26)
Directors & Executive officers
(25)
Directors & Executive officers
(30)
Directors & Executive officers
(33)
Executive officers
(2)Number of shares . . . . . 535,000 500,000 502,000 663,000 400,000 806,000 46,000Type of share . . . . . . . . . Common stock Common stock Common stock Common stock Common stock Common stock Common stockDate of grant . . . . . . . . . August 11, 2003 August 11, 2004 August 11, 2005 August 17, 2006 August 16, 2007 August 18, 2008 February 20, 2009Exercise period (from) . . . June 27, 2005 June 26, 2006 June 29, 2007 August 18, 2006 August 17, 2007 August 19, 2008 February 21, 2009 (to) . . . June 26, 2009 June 25, 2010 June 28, 2011 June 28, 2036 August 16, 2037 August 18, 2038 February 20, 2039
11. SHARE-BASED COMPENSATION PLANS
ANNUAL REPORT 2009 55

b) Activities of stock options in the years ended March 31, 2008 and 2009
Number of sharesStock options
(1st grant)
Stock options
(2nd grant)
Stock options
(3rd grant)
Stock options
(4th grant)
Stock options
(5th grant)
Stock options
(6th grant)
Stock options
(7th grant)
Unexercised at March 31, 2007 . . 46,000 113,000 502,000 663,000 – – – Granted . . . . . . . . . . . . . . . – – – – 400,000 – – Vested . . . . . . . . . . . . . . . . – – – – 400,000 – – Exercised . . . . . . . . . . . . . . 45,000 92,000 299,000 5,000 – – – Expired . . . . . . . . . . . . . . . – – – – – – –Unexercised at March 31, 2008 . . 1,000 21,000 203,000 658,000 400,000 – – Granted . . . . . . . . . . . . . . . – – – – – 806,000 46,000 Vested . . . . . . . . . . . . . . . . – – – – – 806,000 46,000 Exercised . . . . . . . . . . . . . . – – 55,000 78,000 34,000 – – Expired . . . . . . . . . . . . . . . – – – – – – –Unexercised at March 31, 2009 . . 1,000 21,000 148,000 580,000 366,000 806,000 46,000
c) Price per share
In yenStock options
(1st grant)
Stock options
(2nd grant)
Stock options
(3rd grant)
Stock options
(4th grant)
Stock options
(5th grant)
Stock options
(6th grant)
Stock options
(7th grant)
Weighted-average exercise price . . ¥315 ¥289 ¥294 ¥ 1 ¥ 1 ¥ 1 ¥ 1Weighted-average market share price when the share subscription rights were exercised in the year ended March 31, 2008 . . . . . . . . . . . . . 749 755 632 413 – – –Weighted-average market share price when the share subscription rights were exercised in the year ended March 31, 2009 . . . . . . . . . . . . . – – 519 454 477 – –Fair value on the date of grant . . – – – 443 644 471 194
In U.S. dollarsStock options
(1st grant)
Stock options
(2nd grant)
Stock options
(3rd grant)
Stock options
(4th grant)
Stock options
(5th grant)
Stock options
(6th grant)
Stock options
(7th grant)
Weighted-average exercise price . . $3.20 $2.94 $2.99 $0.01 $0.01 $0.01 $0.01Weighted-average market share price when the share subscription rights were exercised in the year ended March 31, 2009 . . . . . . . . . . . . . – – 5.28 4.62 4.85 – –Fair value on the date of grant . . – – – 4.50 6.55 4.79 1.97
MITSUBISHI HEAVY INDUSTRIES, LTD.56

d) Estimate method of fair value of stock optionsThe fair value of stock options (5th, 6th and 7th grant) were estimated using the Black-Scholes option-pricing model with the following assumptions.
Stock options
(5th grant)
Stock options
(6th grant)
Stock options
(7th grant)
Expected volatility Note 1 33.267% 34.420% 36.454%Expected life (of option) Note 2 15 years 15 years 15 yearsExpected dividends Note 3 ¥6
per share¥6 ($0.061) per share
¥6 ($0.061) per share
Risk-free interest rate Note 4 1.936% 1.873% 1.783%
Notes: 1. Estimated based on the actual share prices of 15 years shown below. Stock options (5th grant): August 16, 1992–August 16, 2007 Stock options (6th grant): August 18, 1993–August 18, 2008 Stock options (7th grant): February 20, 1994–February 20, 2009 2. Calculated on the assumption that the share subscription rights would be excised at the middle point of the exercise period. 3. Actual cash dividends for the following periods. Stock options (5th grant): full year ended March 31, 2007 Stock options (6th grant): full year ended March 31, 2008 Stock options (7th grant): second half of the year ended March 31, 2008 and first half of the year ended March 31, 2009 4. Yield of Japanese government bonds with the same years to maturity as the above expected life of options.
e) Estimate method of number of vested share subscription rightsAll of the share subscription rights were vested when granted.
Cash and cash equivalents at March 31, 2009 and 2008 consisted of the following:
In millions of yenIn thousands of
U.S. dollars
2009 2008 2009
Cash and deposits . . . . . . . . . . . . . . . . . . . . . . . . . . . . . . . . . . . . . ¥435,038 ¥274,885 $4,428,769Time deposits with maturities over three months . . . . . . . . . . . . . . (12,124) (15,533) (123,424)Short-term investments with maturities within three months included in securities . . . . . . . . . . . . . . . . . . . . . . . . . . . . . . . . . . . 3,000 3,500 30,540 Total . . . . . . . . . . . . . . . . . . . . . . . . . . . . . . . . . . . . . . . . . . . . ¥425,913 ¥262,852 $4,335,874
12. CASH AND CASH EQUIVALENTS
ANNUAL REPORT 2009 57

The Group utilizes derivative financial instruments, which are principally comprised of forward foreign exchange contracts, foreign currency options, foreign currency swaps and interest rate swaps. They are utilized for the purpose of reducing the risk of losses resulting from fluctuations in foreign exchange rates and interest rates.
The Group believes that market risks are insignificant, because the Group utilizes such derivative financial instruments solely in order to hedge against certain risks in accordance with internal control procedures. The Group also believes that the risk of nonperformance by counterparties is insignificant because of the high credit ratings of the counterparties.
Summarized below are the notional amounts and the fair values of the derivative positions, except the ones hedge accounting are applied to, outstanding at March 31, 2009 and 2008.
In millions of yen In thousands of U.S. dollars
2009 2009
Notional amount
Fair value
Unrealized gain (loss)
Notional amount
Fair value
Unrealized gain (loss)
Forward foreign exchange contracts Sell: US$ . . . . . . . . . . . . . . . . . . . . ¥22,350 ¥21,363 ¥ 987 $227,527 $217,479 $10,047 Euro . . . . . . . . . . . . . . . . . . . . 15,616 13,702 1,914 158,973 139,488 19,484 Others . . . . . . . . . . . . . . . . . . 2,627 2,232 394 26,743 22,722 4,010 Buy: US$ . . . . . . . . . . . . . . . . . . . . 1,076 982 (93) 10,953 9,996 (946) Others . . . . . . . . . . . . . . . . . . . 790 811 20 8,042 8,256 203 Total . . . . . . . . . . . . . . . . . . ¥3,223 $32,810
In millions of yen
2008
Notional amount
Fair value
Unrealized gain (loss)
Forward foreign exchange contracts Sell: US$ . . . . . . . . . . . . . . . . . . . . ¥68,355 ¥60,032 ¥8,323 Euro . . . . . . . . . . . . . . . . . . . . 38,325 37,986 338 Others . . . . . . . . . . . . . . . . . . 4,919 4,559 359 Buy: US$ . . . . . . . . . . . . . . . . . . . . 3,782 3,555 (226) Total . . . . . . . . . . . . . . . . . . ¥8,794
13. DERIVATIVE FINANCIAL INSTRUMENTS
MITSUBISHI HEAVY INDUSTRIES, LTD.58

Contingent liabilities for guarantees to loans of others made in the ordinary course of business amounted to 94,606 million yen ($963,106 thousand) and 111,863 million yen at March 31, 2009 and 2008, respectively.
In millions of yenIn thousands of
U.S. dollars
2009 2008 2009
Depreciation . . . . . . . . . . . . . . . . . . . . . . . . . . . . . . . . . . . . . . . . . . ¥153,856 ¥129,263 $1,566,283Research and development costs (including routine or periodic alterations to existing products) . . . . 101,332 107,960 1,031,578
(Additional information)The Group has applied the “Accounting Standard for Related Party Disclosures” (ASBJ Statement No. 11, issued on October 17th, 2006) and the “Guidance on Accounting Standard for Related Party Disclosures” (ASBJ Guidance No. 13, issued on October 17th, 2006) from the year ended March 31, 2009.
As a result, “notes regarding the parent entity and significant affiliates” have been added to the scope of disclosure.
1. Transactions with related parties
Category Name Address Capital Stock Description of the Business
Affiliate Company Caterpillar Japan Ltd. (*1)
Setagaya-ku, Tokyo 23,100 million yen($235,162 thousand)
Manufacture and sale of construction machinery, including hydraulic excavators, wheel loaders and track-type tractors
Percentage of voting rights held by the Issuer (%) Relation with the Related Parties Description of the Transactions
Transaction Amounts (in millions of yen)
Transaction Amounts (in thousands of U.S. dollars)
(Direct holdings) 33.3 MHI sells its products to the related party.
Sale of the shares of Caterpillar Japan Ltd. held by MHI
Price ¥50,000 $509,009Gain on Sales (*2) 13,921 141,718
*1. The company name was changed on August 1, 2008 from Shin Caterpillar Mitsubishi Ltd.*2. Terms of the Contracts and the Policy in Deciding Them MHI sold to Caterpillar Japan Ltd. 115,500 shares (out of 231,000 shares MHI held) of the buyer on August 1, 2008 based on the agreement reached
on March 26, 2008 among Caterpillar International Investments Coöperatie U.A., Caterpillar Japan Ltd. and MHI on the revision of the ownership allocation of Caterpillar Japan Ltd. The price was decided after the negotiation based on the enterprise value.
14. CONTINGENT LIABILITIES
15. SUPPLEMENTARY INCOME INFORMATION
16. RELATED PARTY DISCLOSURES
ANNUAL REPORT 2009 59

2. Notes regarding the parent entity and significant affiliatesMitsubishi Motors Corporation was a significant affiliate in the year ended March 31, 2009. The condensed consolidated financial statements of it were as follows:
In millions of yenIn thousands of
U.S. dollars
Mitsubishi Motors Corporation 2009 2009
Total current assets . . . . . . . . . . . . . . . . . . . . . . . . . . . . . . . . . . . . . . . . . . . . . . ¥ 540,943 $ 5,506,902Total non-current assets . . . . . . . . . . . . . . . . . . . . . . . . . . . . . . . . . . . . . . . . . . . 597,066 6,078,244
Total current liabilities . . . . . . . . . . . . . . . . . . . . . . . . . . . . . . . . . . . . . . . . . . . . . 620,093 6,312,664Total non-current liabilities . . . . . . . . . . . . . . . . . . . . . . . . . . . . . . . . . . . . . . . . . . 294,891 3,002,046
Total net assets . . . . . . . . . . . . . . . . . . . . . . . . . . . . . . . . . . . . . . . . . . . . . . . . . 223,024 2,270,426
Sales . . . . . . . . . . . . . . . . . . . . . . . . . . . . . . . . . . . . . . . . . . . . . . . . . . . . . . . . . 1,973,572 20,091,336Loss before income taxes and minority interests . . . . . . . . . . . . . . . . . . . . . . . . . (53,717) (546,849)Net loss for the period . . . . . . . . . . . . . . . . . . . . . . . . . . . . . . . . . . . . . . . . . . . . ¥ (54,883) $ (558,719)
MITSUBISHI HEAVY INDUSTRIES, LTD.60

Report of Independent Auditors
ANNUAL REPORT 2009 61

Monthly Stock Price Range & Trading Volume(Tokyo Stock Exchange)
FinancialInstitutions34.85%
ForeignInstitutionsand Individuals16.47%
Individualsand Others37.49%
Other Corporations9.58%
Securities Companies1.61%
Note: Government and Local Public Entities hold less than 0.01 percent of outstanding shares.
Common stock price range (Left scale) TOPIX (Right scale)
FY2004 FY2005 FY2006 FY2007 FY2008
FY2004 FY2005 FY2006 FY2007 FY2008(Thousands of shares)
(TOPIX)
0
750
250
500
1,000(¥)
0
500
1,000
1,500
2,000
0
200,000
400,000
600,000
800,000
1,000,000
1,200,000
1,400,000
1,600,000
Head Office16-5, Konan 2-chome, Minato-ku, Tokyo 108-8215, JapanPhone: +81-3-6716-3111Fax: +81-3-6716-5800
Established: January 11, 1950
Paid-in Capital: ¥265.6 billion
Total Number of Issuable Shares: 6,000,000,000
Total Number of Shares Issued: 3,373,647,813
Number of Shareholders: 375,538
Number of Employees: 67,416 (Consolidated)
Composition of Shareholders
Number of shares owned % of Major Shareholders by major shareholders total shares
Japan Trustee Services Bank, Ltd. (Holder in Trust 4G) 198,062,000 5.9
Japan Trustee Services Bank, Ltd. (Holder in Trust) 180,983,900 5.4
The Master Trust Bank of Japan, Ltd. (Holder in Trust) 131,709,000 3.9
The Nomura Trust and Banking Co., Ltd. (Holder in Retirement Benefit Trust for The Bank of Tokyo-Mitsubishi UFJ, Ltd.) 125,666,000 3.7
Meiji Yasuda Life Insurance Company 80,022,741 2.4
Tokio Marine & Nichido Fire Insurance Co., Ltd. 63,000,000 1.9
The Nomura Trust and Banking Co., Ltd. (Holder in Retirement Benefit Trust for Mitsubishi UFJ Trust and Banking Corporation) 45,934,000 1.4
Japan Trustee Services Bank, Ltd. (Holder in Trust 4) 33,732,000 1.0
OD 05 Omnibus China Treaty 808150 33,171,554 1.0
MHI Stock Ownership Plan 28,645,897 0.8
Stock Listings: Tokyo, Osaka, Nagoya, Fukuoka and Sapporo Stock Exchanges
Ticker Code: 7011
Manager of the Register of Shareholders: Mitsubishi UFJ Trust and Banking Corporation
4-5, Marunouchi 1-chome, Chiyoda-ku, Tokyo 100-8212, Japan
Independent Auditors: Ernst & Young ShinNihon LLC
Hibiya Kokusai Bldg., 2-2-3, Uchisaiwai-cho, Chiyoda-ku, Tokyo 100-0011, Japan
Corporate Data
As of March 31, 2009
MITSUBISHI HEAVY INDUSTRIES, LTD.62

Board of Directors
Directors
Kazuo Tsukuda
Shiro IijimaGeneral Manager, Shipbuild-ing & Ocean Development Headquarters
Ken WatabeGeneral Manager, Paper & Printing Machinery Division
Katsuhiko YasudaIn charge of Internal Audit, Corporate Social Responsi-bility, General Affairs, Legal and Personnel
Makoto ShintaniGeneral Manager, Production System Innovation Planning Department
Akira SawaGeneral Manager, Nuclear Energy Systems Headquarters
Takashi AbeDeputy General Manager, Presidential Administration Office; General Manager, Corporate Planning Department
Teruaki KawaiGeneral Manager, Aerospace Headquarters
Akira HishikawaGeneral Manager, General Machinery & Special Vehicle Headquarters
Shunichi MiyanagaGeneral Manager, Machinery & Steel Structures Headquarters
Mikio SasakiChairman of the Board of Mitsubishi Corporation
Yoshiaki TsukudaGeneral Manager, Power Systems Headquarters
Akihiro WadaAdvisor, Executive Technical Advisor of Aisin Seiki Co., Ltd.
Yujiro KawamotoIn charge of Accounting, Finance and Material
Yoshihiro SakamotoFormer Vice-Minister for International Affairs of the Ministry of International Trade and Industry
Koshin Nakamoto
Hideaki Omiya
Naoki Yasaka Toyoshi NakanoSenior Adviser of Mitsubishi UFJ Trust and Banking Corporation
Ichiro FukueProviding assistance to the President. In charge of Production System Innovation Planning, Energy & Environment business and other matters specially assigned by the President
Hiroshi KanProviding assistance to the President. General Manager, Presidential Administration Office. In charge of other matters specially assigned by the President
Sunao AokiProviding assistance to the President. General Manager, Technical Headquarters. In charge of Information Systems & Communications and other matters specially assigned by the President
Kichisaburo NomuraExecutive Adviser of All Nippon Airways Co., Ltd.
Nobuo KuroyanagiPresident & CEO of Mitsubishi UFJ Financial Group, Inc.; Chairman of The Bank of Tokyo-Mitsubishi UFJ, Ltd.
CHAIRMAN
EXECUTIVE VICE PRESIDENTS
SENIOR VICE PRESIDENTS OUTSIDE DIRECTORS
STATUTORY AUDITORS
PRESIDENT SENIOR EXECUTIVE VICE PRESIDENTS
Creed
1. We strongly believe that the customer comes first and that we are obligated to be an
innovative partner to society.
2. We base our activities on honesty, harmony, and a clear distinction between public and
private life.
3. We shall strive for innovative management and technological development from an
international perspective.
Reason for Instituting the CreedIn Japan there are many enterprises with their own “creeds” which simply represent their management concept.
Mitsubishi Heavy Industries, Ltd. has a creed of this type, also. This creed was instituted in 1970 on the basis of the
policy advocated by Koyata Iwasaki, president of Mitsubishi Goshi Kaisha in the 1920s, to indicate the essential attitude
of the company, the mental attitude of the employees, and the future directions of the company. The reason for instituting
the present creed is so that all of us can call to mind our one hundred years of tradition, and strive for further development
in the future.
This CI statement represents our intention to
“continuously provide an assured future
where people can live safe, secure and enriched lives
through technologies that can excite people
and passion as a manufacturer for the sustainability
of the earth and humankind.”
Our Technologies,
Your Tomorrow
ANNUAL REPORT 2009 63
(As of June 25, 2009)

MITSU
BISH
I HEA
VY
IND
USTR
IES, LTD. A
nnual Report 2009
Annual Report 2009For the Year Ended March 31, 2009
Printed in JapanTo protect the environment, this annual report is printed on FSC-certified paper, and the cover is printed on recycled paper, by a waterless printing method that generates no harmful wastewater.
K060-ANAL09E1-A-0,(8.0)09-7,R