annual report 2006 - · pdf fileheineken is one of the world’s great brewers and is...
TRANSCRIPT

Annual Report
2006

Contents
170 brands Heineken’s leading brand portfolio includes more than 170 international premium, regional, local and specialty beers. Our principal brands are Heineken® and Amstel®. We continually seek to reinforce our brands through innovations in production, marketing and packaging.
131.9 million hl The Heineken brand is available in almost every country on the planet. We own more than 115 breweries in more than 65 countries brewing a Group beer volume of 131.9 million hectolitres.
01 Profi le02 Performance highlights04 Report of the Supervisory Board08 Report of the Executive Board08 Chief Executive’s statement14 Outlook 200716 Executive Committee18 Operational review:18 Introduction 18 The Heineken brand18 Innovation20 Heineken brand communication21 The Amstel brand21 Brand portfolios22 Sustainability24 Personnel and organisation26 Regional review:26 Western Europe30 Central and Eastern Europe34 Americas38 Africa and the Middle East42 Asia Pacifi c46 Risk management51 Financial review56 Corporate governance56 Decree Article 10 Takeover Directive58 Dutch Corporate Governance Code62 Remuneration report
Financial statements67 Consolidated income statement68 Consolidated statement of recognised income
and expense69 Consolidated balance sheet70 Consolidated statement of cash fl ows72 Notes to the consolidated fi nancial statements116 Heineken N.V. balance sheet117 Heineken N.V. income statement118 Notes to Heineken N.V. fi nancial statements
Other information122 Auditor’s report124 Appropriation of profi t125 Shareholder information129 Countries and brands136 Historical summary138 Glossary140 Reference information

Heineken is one of the world’s great brewers and is committed to remaining strong and independent. The brand that bears the founder’s name – Heineken – is available in almost every country on the planet and is the world’s most valuable international premium beer brand.
Profi le
Heineken
Heineken brews great beers and builds great brands. In addition to the Heineken brand, we have more than 170 international, regional, local and specialty beers around the globe. Our famous brands include Amstel®, Europe’s third-largest selling beer, Cruzcampo®, Tiger®, Zywiec®, Birra Moretti®, Ochota®, Murphy’s® and Star®.
At Heineken we aim to be a leading brewer in each of the markets in which we operate and to have the world’s best brand portfolio.
We have the widest presence of all international brewers, thanks to our global network of distributors and 115 breweries in more than 65 countries. Our brands are well established in profi table, mature markets, while the popularity of our beers is growing daily in emerging beer markets such as Russia, China and Latin America.
We are the largest brewer and distributor in Europe. Our global coverage is achieved through a combination of wholly-owned companies, licence agreements, affi liates and strategic partnerships and alliances. Often, our wholesalers also distribute wine, spirits and soft drinks. Our international export operations ship beer to large and profi table markets worldwide.
We are committed to growth and have embraced innovation as a key component of our strategy in the areas of production, marketing, communication and packaging. In all of these areas, it is the consumers and their changing needs that is at the heart of our efforts.
We also fully acknowledge the role that we have to play in society. Social responsibility and sustainability underpin everything we do. We will continue expanding initiatives to combat alcohol abuse and misuse and work hard to reach the highest environmental standards in the industry.
History The Heineken story began more than 140 years ago in 1864 when Gerard Adriaan Heineken acquired a small brewery in the heart of Amsterdam. Since then, four generations of the Heineken family have expanded the Heineken brand and the Company throughout Europe and the rest of the world.
57,557 employees In 2006 the average number of employees employed increased from 56,598 to 57,557 (pro rata).
Heineken N.V.Annual Report 2006 01

2002
2003
2004
2005
2006
1,330
1,357
1,377
1,392
1,569
EBIT BEIAIn millions of EUR
2002
2003
2004
2005
2006
795
806
803
840
930
Net profit BEIAIn millions of EUR
2002
2003
2004
2005
2006
73.8
85.2
96.7
100.5
111.9
Consolidated beer volumeIn millions of hectolitres
2002
2003
2004
2005
2006
17.4
18.5
19.2
20.1
22.5
Heineken volume in premium segmentIn millions of hectolitres
Performance highlights
Our performance
Revenue +9.6%
€11,829 million EBIT (BEIA) +12.7%
€1,569 million Net profi t (BEIA) +10.7%
€930 million Consolidated beer volume +11.3%
111.9 million hectolitres Heineken volume in premium segment +11.8%
22.5 million hectolitres
• Net profi t (BEIA)1 increased by €90 million or 10.7 per cent to €930 million. Net profi t (BEIA) grew organically by 12.6 per cent. Net profi t increased to €1,211 million.
• Consolidated beer volume grew by 11.3 per cent (from
100.5 million hectolitres to 111.9 million hectolitres); of this 6.9 per cent was organic and 4.4 per cent the effect of fi rst time consolidation.
• Volume of Heineken in the premium segment grew by
11.8 per cent to 22.5 million hectolitres and the brand achieved its biggest increase since the 1980s. The brand also increased its share in the segment and grew in every region.
1 Please refer to the Glossary for defi nitions.
Heineken N.V.Annual Report 200602
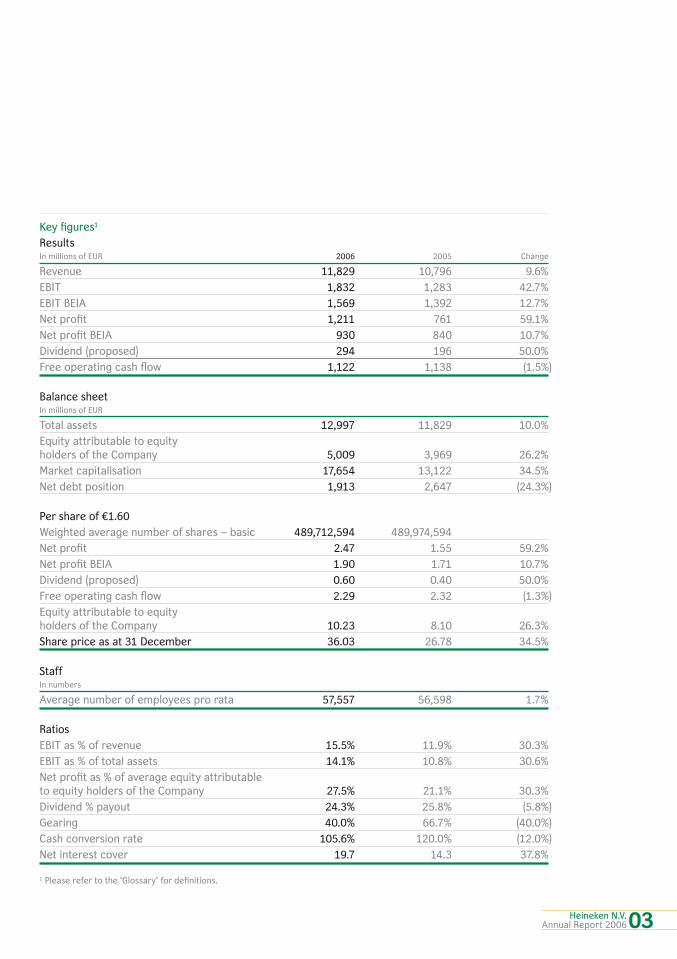
Key fi gures1
Results In millions of EUR 2006 2005 Change
Revenue 11,829 10,796 9.6%
EBIT 1,832 1,283 42.7%
EBIT BEIA 1,569 1,392 12.7%
Net profi t 1,211 761 59.1%
Net profi t BEIA 930 840 10.7%
Dividend (proposed) 294 196 50.0%
Free operating cash fl ow 1,122 1,138 (1.5%)
Balance sheet In millions of EUR
Total assets 12,997 11,829 10.0%
Equity attributable to equityholders of the Company 5,009 3,969 26.2%
Market capitalisation 17,654 13,122 34.5%
Net debt position 1,913 2,647 (24.3%)
Per share of €1.60
Weighted average number of shares – basic 489,712,594 489,974,594
Net profi t 2.47 1.55 59.2%
Net profi t BEIA 1.90 1.71 10.7%
Dividend (proposed) 0.60 0.40 50.0%
Free operating cash fl ow 2.29 2.32 (1.3%)
Equity attributable to equityholders of the Company 10.23 8.10 26.3%
Share price as at 31 December 36.03 26.78 34.5%
Staff In numbers
Average number of employees pro rata 57,557 56,598 1.7%
Ratios
EBIT as % of revenue 15.5% 11.9% 30.3%
EBIT as % of total assets 14.1% 10.8% 30.6%
Net profi t as % of average equity attributable to equity holders of the Company 27.5% 21.1% 30.3%
Dividend % payout 24.3% 25.8% (5.8%)
Gearing 40.0% 66.7% (40.0%)
Cash conversion rate 105.6% 120.0% (12.0%)
Net interest cover 19.7 14.3 37.8%
1 Please refer to the ‘Glossary’ for defi nitions.
Heineken N.V.Annual Report 200603

Report of the Supervisory Board
During the year under review, the Supervisory Board performed its duties in accordance with the law and the Articles of Association of Heineken N.V. and supervised and advised the Executive Board on an ongoing basis.
Financial statements and profi t appropriation The Executive Board has submitted its fi nancial statements for 2006 to the Supervisory Board.
These fi nancial statements can be found on pages 67 to 121 of this Annual Report.
KPMG ACCOUNTANTS N.V. audited the fi nancial statements. Their report appears on page 122.
A new dividend policy will be submitted to the Annual General Meeting of Shareholders for approval. The new policy will fi rst be applied over the fi nancial year 2006. Under the existing policy Heineken reviewed every three years if there would be scope to increase the dividend via a share-split, thereby increasing the number of shares, whilst maintaining the annual dividend per share at the same level. This resulted in an intended dividend payout ratio of 20-25 per cent. In the new policy it is proposed to increase the annual dividend payout to 30-35 per cent of net profi t before exceptional items and amortisation of brands (net profi t beia). This will reinforce the relationship between dividend payments and the annual development net profi t beia. The new policy supports the intention of Heineken N.V. to preserve its independence, to maintain a healthy fi nancial structure and to
retain suffi cient earnings in order to grow the business both organically and through acquisitions. Under the new policy Heineken will only consider share splits if and when the share price has reached a level where the liquidity of the stock becomes adversely affected. Heineken will continue to pay the annual dividend in the form of an interim dividend and a fi nal dividend. The interim dividend will be fi xed at 40 per cent of the total dividend of the previous year.
The Supervisory Board recommends that the shareholders, in accordance with the Articles of Association, adopt these fi nancial statements and, as proposed by the Executive Board, appropriate €294 million of the profi t as dividend, based on the new policy, and add the remainder, amounting to €917 million, to retained earnings. The proposed dividend amounts to €0.60 per share of €1.60 nominal value, of which €0.16 was paid as an interim dividend on 20 September 2006.
Supervisory Board changes and appointments Messrs. C.J.A. van Lede and J.M. de Jong resigned by rotation from the Supervisory Board at the Annual General Meeting of Shareholders on 20 April 2006. Both were eligible for immediate reappointment for a period of four years. Messrs. Van Lede (Chairman) and De Jong
Supervisory Board as at 20 February 2007 Cees (C.J.A.) van Lede (1942) Dutch nationality; male. Appointed in 2002; latest reappointment in 2006; next reappointment in 2010. Chairman (2004).Profession: Company director.Supervisory directorships Dutch stock listed companies: Akzo Nobel N.V., Royal Philips Electronics N.V., Reed Elsevier Group, Stork N.V.*
Other: Sara Lee Corporation, Air Liquide S.A., Air France/KLM, Senior Advisor Europe, JP Morgan Plc., London.
Jan Maarten (J.M.) de Jong (1945)Dutch nationality; male. Appointed in 2002; latest reappointment in 2006; next reappointment in 2010. Vice-Chairman (2004).Profession: Banker. Supervisory directorships Dutch stock listed companies: Nutreco Holding N.V.Other: Banca Antonveneta SpA, Italy, CRH plc, Ireland, AON Groep Nederland B.V.
* Temporary appointment by the Enterprise Chamber of the Amsterdam District Court as from January 2007.
Maarten (M.) Das (1948) Dutch nationality; male. Appointed in 1994; latest reappointment in 2005; next reappointment in 2009. Delegated member (1995).Profession: Lawyer, Partner of Loyens & Loeff N.V. Supervisory directorships Dutch stock listed companies: none.Other: Greenfee B.V. (Chairman).Other posts**: Heineken Holding N.V. (Chairman), Stichting Administratiekantoor Priores, LAC B.V.
** Where relevant to performance of the duties of the Supervisory Board.
To the shareholders
Heineken N.V.Annual Report 200604
(Vice-Chairman) were duly reappointed for a period of four years.
Mr. M.R. de Carvalho will resign by rotation from the Supervisory Board at the Annual General Meeting of Shareholders on 19 April 2007. Mr. de Carvalho is eligible for immediate reappointment for a period of four years. The Supervisory Board proposes the reappointment of Mr. M.R. de Carvalho. A non-binding nomination for his appointment will be submitted to the Annual General Meeting of Shareholders.
Mr. Risseeuw is not eligible for reappointment, due to his age, based on the internal regulations of the Supervisory Board. We thank Mr. Risseeuw for his contributions to both the Supervisory Board meetings and to the Audit Committee meetings.
After the resignation of Mr. Risseeuw the Supervisory Board will comprise seven members. All members of the Supervisory Board comply with best practice provision III.3.4 of the Dutch Corporate Governance Code (maximum number of Supervisory Board seats).
Executive Board changes Mr. M.J. Bolland resigned as COO and member of the Executive Board as per 1 August 2006. We are grateful for his contributions to the Company in various jobs over the last 20 years, the last four years as member of the Executive Board.
As per 1 August the Executive Board consists of two members: Messrs. J.F.M.L. van Boxmeer (CEO) and D.R. Hooft Graafl and (CFO). An Executive Committee was established in April 2005 and
comprises the members of the Executive Board, fi ve Regional Presidents and fi ve Group Directors. Information on the Executive Committee is included on page 16 and 17 of this annual report.
Articles of Association A proposal to amend the Articles of Association will be submitted to the Annual General Shareholders meeting of 19 April 2007. The proposed amendments mainly relate to the recently adopted law on the use of electronic communication devices at decision-making within companies (Wijziging van Boek 2 van het Burgelijk Wetboek ter bevordering van het gebruik van elektronische communicatiemiddelen bij de besluitvorming in rechtspersonen), which came into force on 1 January 2007.
Corporate Governance The Annual General Meeting of Shareholders of 20 April 2005 sanctioned the Comply or Explain report on the basis of the Dutch Corporate Governance Code of 9 December 2003, and in particular the non-compliance with a limited number of best practice provisions (see page 58), as a consequence of the special character of the Company. There has been no change in the way Heineken N.V. deals with the Code.
Consultation and decision-making The Supervisory Board held six regular meetings with the Executive Board and fi ve meetings by telephone. The items discussed in the meetings included recurring subjects, such as the Company’s strategy, the fi nancial position and results, the operating companies’ policies and business plans, acquisitions, large investment proposals and management development.
Michel (M.R.) de Carvalho (1944) British nationality; male. Appointed in 1996; latest reappointment in 2003; next reappointment in 2007.Profession: Banker, Investment Banking (Vice-Chairman) Citigroup Inc., United Kingdom.Supervisory directorships Dutch stock listed companies: none.Other: none.
Ton (A.H.J.) Risseeuw (1936) Dutch nationality; male. Appointed in 2000; latest reappointment in 2004; retires in 2007.Profession: Company director.Supervisory directorships Dutch stock listed companies: KPN N.V. (Chairman).Other: Blokker Holding B.V., Intergamma B.V., Groeneveld B.V.
Jan Michiel (J.M.) Hessels (1942) Dutch nationality; male. Appointed in 2001; latest reappointment in 2005; next reappointment in 2009.Profession: Company director.Supervisory directorships Dutch stock listed companies: Euronext N.V. (Chairman), Royal Philips Electronics N.V., Fortis N.V. Other: Schiphol Area Development Company – SADC (Chairman), S.C. Johnson Europlant N.V. (Chairman), Member International Advisory Board Blackstone Group, USA.
Heineken N.V.Annual Report 200605
Report of the Supervisory Board continued
The agenda also included subjects such as the review of completed investment plans, interest rate and exchange rate risks, the proposal for the top management structure, the effectiveness of the internal risk management and control systems and the governance structure of the Company. The external auditor attended the meeting in which the annual results were discussed.
In the absence of the Executive Board, the Supervisory Board discussed the functioning of the Executive Board and its members as well as the profi le, composition and the functioning of the Supervisory Board and its members.
One meeting was held in Moscow, Russia where the Regional President Central & Eastern Europe presented the main issues of the region. The Management Team of Heineken Brewery LLC (Russia) presented an overview of developments in Russia.
None of the members of the Supervisory Board were frequently absent. An absence of two times or more is considered frequent.
Independence With regard to the independence of the Supervisory Board members, reference is made to the comments made regarding best practice provision III.2.2 of the Dutch Corporate Governance Code as contained in the ‘Comply or Explain’ report (21 February 2005). See page 58.
Remuneration Executive Board The Annual General Meeting of Shareholders adopted on 20 April 2005 the remuneration policy for the Executive Board. In 2006 a new pension
scheme was introduced. Details of the policy and its implementation are described on page 62 of this report. The policy aims to ensure that highly qualifi ed managers can be attracted and retained as members of the Executive Board. The package provides a strong focus on the strategic short-term and long-term performance of the Company and includes a base salary, an annual bonus and a long-term incentive.
Every two years the policy is evaluated. A revised policy will be submitted for adoption by the Annual General Meeting of Shareholders on 19 April 2007. The proposal for the revised policy is stated on page 62 of this report.
Committees The Supervisory Board has four committees, the Preparatory Committee, the Audit Committee, the Selection & Appointment Committee and the Remuneration Committee.
Preparatory Committee Composition: Messrs. Van Lede (Chairman), Das and de Carvalho.
The Preparatory Committee met six times. The committee prepares decision-making by the Supervisory Board.
Audit Committee Composition: Messrs. De Jong (Chairman), Risseeuw, Hessels and Mrs. Fentener van Vlissingen.
The members collectively have the experience and fi nancial expertise to supervise the fi nancial statements and the risk profi le of Heineken N.V.
To the shareholders
continued
Annemiek (A.M.) Fentener van Vlissingen (1961) Dutch nationality; female. Appointed in 2006; reappointment in 2010.Profession: Company DirectorSupervisory directorships Dutch stock listed companies: Draka Holding N.V. Other: SHV Holdings N.V. (Chairman).
Ian (I.C.) MacLaurin (1937) British nationality; male. Appointed in 2006; reappointment in 2010.Profession: Company DirectorSupervisory directorships Dutch stock listed companies: noneOther: Evolution Group Plc.
Board memberships mentioned under ‘Other’ only list other major board memberships.
Except for Mr. de Carvalho, who owns 8 shares in Heineken N.V., the Supervisory Board members do not hold shares in Heineken N.V.
Heineken N.V.Annual Report 200606
The CEO and the CFO are invited to attend the meetings, as well as the external auditor, the Director Group Control & Accounting and the Group Internal Auditor.
The Audit Committee met three times to discuss the regular topics, such as the annual and half-year results, the risk profi le and risk management, the report of the external auditor and the report from the Group Internal Auditor.
The external auditor was appointed in the Annual General Meeting of 2003 for a fi ve-year period.
Selection & Appointment Committee Composition: Messrs. Van Lede (Chairman), Das, de Carvalho and Lord MacLaurin.
The Selection & Appointment Committee met four times. In its meetings the composition of the Supervisory Board and the rotation schedule was discussed. Furthermore, the committee prepared the evaluation of the Executive Board and Supervisory Board for discussion in a full Supervisory Board meeting.
Remuneration Committee Composition: Messrs. Das (Chairman), Van Lede and de Carvalho.
The Remuneration Committee met four times. The target setting was discussed for the annual bonus and long-term incentive plans for the Executive Board and the payout of the annual bonus. In the other meetings the remuneration policy was evaluated and a proposal prepared for a new policy. Also the pensions were reviewed.
Appreciation The Supervisory Board would like to take this opportunity to express its gratitude to the members of the Executive Board and all Heineken employees for their contribution to the results in 2006.
Supervisory Board Heineken N.V.
Van Lede De Jong Das d e Carvalho Risseeuw Hessels Fentener van Vlissingen MacLaurin
Amsterdam, 20 February 2007
Heineken N.V.Annual Report 2006 07

2006 was an important year for Heineken. It was a year in which we continued to make positive changes to the business and the results showed us that these changes are taking us in the right direction.
Chief Executive’s Statement
“ The clear message to all our stakeholders is that we are proud of what we have achieved this year and we are confi dent in the outlook for the future. Our challenge now is to make high-level performance sustainable.”
Jean-François van Boxmeer
Heineken N.V. Executive Board
Left: Jean-François van Boxmeer Chairman of the Executive Board/CEO
Right: René Hooft Graafl and Member of the Executive Board/CFO
Report of the Executive Board
Heineken N.V.Annual Report 200608

Organic net profi t growth of 12.6 per cent coupled with revenue growth of 9.6 per cent and consolidated volume growth of 11.3 per cent are fi gures that are better than we envisaged at the start of the year, and signify the continued strength of our business and our brands.
Nothing shows this strength better than the results we achieved for the Heineken brand which, as with the last nearly 150 years, has been at the heart of the business strategically and emotionally.
In 2006, we achieved the best annual growth fi gures for the Heineken premium brand for many years with growth of 11.8 per cent. To achieve this performance on the world’s most valuable, available and recognisable international premium beer brand is an achievement of which our whole organisation is proud. In particular, this growth has been driven by the USA where the introduction of Heineken Premium Light has made a major contribution to overall performance.
Whilst the Heineken brand is critical to success, growing value and volume of our local and regional brands is equally important. Markets such as Russia, Nigeria, Romania, Hungary, amongst others are seeing clear benefi ts from the implementation of last year’s portfolio review fi ndings. It is therefore pleasing to note that – as with the Heineken brand – we are achieving business and brand growth from every region and across the majority of our brand portfolios.
As you read through this annual report, you will see the contribution that has been made by all of our operating companies and all of our regions to the improved performance this year.
But, as always, we are not complacent. The clear message to the business and all our stakeholders is that we are proud of what we have achieved this year and we are confi dent in the outlook for the future. However, our challenge now is to make high-level performance sustainable.
To do this, we will continue to focus on the priorities I set 18 months ago.
It is the framework of these priorities that has helped us to focus our management and the resources of the organisation during the year and it is my belief that we are only just beginning to see the benefi ts that this increased alignment and focus can deliver.
Our philosophy though is that it is not just our performance that needs to be sustainable. Underpinning our growth this year has been the continued acknowledgement of our responsibilities to balance sustainable performance with a sustainable future.
You will see our efforts, achievements and – importantly – our areas of underachievement transparently set out in our separate 2006 Sustainability Report. I and my colleagues on the Executive Board and Executive Committee will continue to accept this as part of our challenge.
Heineken N.V.Annual Report 200609

Innovative products and packaging For a premium brand like Heineken, development and innovation are key in order to stay competitive. Well-known examples of innovative packaging are our BeerSystems like the David, BeerTender and DraughtKeg. In the context of product development, a successful innovation is the introduction of Heineken Premium Light in the USA.
Improving sales revenue and volume growth is the life-blood of any branded consumer business. Creating strong consumer appeal and building strong brand propositions and imagery are central to success and this year we have begun to see the rewards across much of our brand portfolio.
The jewel in the crown of our portfolio is Heineken®. Keeping the brand healthy and growing requires continuous commitment to and focus on innovation and impactful consumer advertising.
In 2006, the consumer continued to be at the heart of our innovation agenda. The success of Heineken Premium Light in the USA demonstrates that when we know the consumer well we can build a strong, winning proposition. It also shows us what is possible when we apply the considerable resources of the organisation and its people to making innovation a success. And this is not the only example. DraughtKeg®, the one-way BeerTender® and Xtreme Draught®
all tell the same story. And it is a story that we will re-apply as we roll out new programmes in 2007 such as Heineken® ExtraCold.
The continued implementation of our portfolio reviews allowed us to improve our pricing, resource allocation and consumer focus. It is this greater understanding of the consumer and brand landscape that has helped to drive our top-line performance in markets as diverse as Russia, Hungary, the USA and Nigeria.
However, despite top-line growth in Western Europe, there remain markets such as France, Italy and the Netherlands where our businesses and the beer market face challenges that we will continue to address.
Accelerate top-line growth
Report of the Executive Board continued
Chief Executive’s Statement
continued
10 Heineken N.V.Annual Report 2006

Generating top-line growth is only part of the journey towards sustained high performance. Becoming more effi cient in our production and our ongoing operations is also a prerequisite if we are to remain strong, independent and competitive.
That is the reality and the aim of our three-year ‘Fit2Fight’ initiative. It is this initiative that aims to make gross savings of €450 million of our fi xed-cost base by the end of 2008. The savings will be split across our regions, operations, functions and head offi ce.
In 2006, we made some tough choices linked to this initiative. In total, in 2006, we achieved approximately 25 per cent of the total savings. In 2007 we expect to achieve 30-34 per cent and in 2008, the remaining 41-45 per cent.
Whilst we have made progress, and I am confi dent that we will achieve our goal, no-one in Heineken underestimates the impact of the programme on those of our employees directly involved and we
do all we can to support those affected through the process. We also recognise that we have to balance our cost reduction with investment in generating top-line growth.
In 2006, it was not just new initiatives such as Fit2Fight, which helped us improve our effi ciency. The continued focus on Total Productive Management (TPM) throughout our organisation is allowing us to continually reduce the cost of brewing our beers. TPM is now established in every signifi cant operation within the Heineken Group and will continue to be a major programme within the organisation for the foreseeable future.
Accelerate effi ciencies
Effi cient business Internal programmes enable us to be in top condition to tackle competition. Not only by cutting costs but also by changing the way in which we do business. Our focus is on our core business, whilst economies of scale and IT support functions are leveraged.
Heineken N.V.Annual Report 2006 11
Report of the Executive Board continued
Chief Executive’s Statement
continued
In 2006, we continued to put into practice our belief that fl atter and less complex management structures are essential to increase the speed at which decisions are taken and implemented across the business. That was the clear thinking behind the creation of the Executive Committee and a smaller Executive Board.
It was this desire to continually streamline our management structures that led us not to replace the role of Chief Operating Offi cer on the Executive Board and for each of the Regional Presidents to report directly to me.
In addition, the same philosophy drove management changes in markets such as France, the USA, the Netherlands, Latin America, Caribbean, Central and Eastern Europe and within our Head Offi ce. But it is our culture as well as our structure that is changing.
I see big initiatives within our business that clearly signal that we are beginning to understand the need to move quicker: taking Heineken Premium Light from an agreed concept to launch in just three months; our decision to accelerate the roll-out of DraughtKeg early in its life cycle and then to invest further in production; the accelerated integration of our Russian business; our decision to centralise the IT function; these and many more examples like it convince me that the sense of urgency is more than just talk.
As always, there is more we need to do and in 2007 we will continue to deliver that message via the Executive Committee and the management teams throughout the organisation.
Accelerate speed of implementation
Amstel volume12.2 million hectolitres
Heineken volume25.8 million hectolitres
Consolidated beer volume111.9 million hectolitres
Heineken N.V.Annual Report 200612

It is our aim that wherever we choose to compete, we should put ourselves in a winning position. For us, that means being the number one or two player in markets which we believe are important for our future development.
Whilst in some markets we expect to reach this position through organic growth, we will also increasingly focus our acquisition and partnership strategy in order to achieve our goal priority.
In 2006 we focused our energies on Indo-China. Our joint venture in Asia, Asia Pacifi c Breweries, made a number of strategic and tactical acquisitions.
In particular, through Asia Pacifi c Breweries, we acquired the Fosters brewing assets in Vietnam and Quang Nam Brewery in Central Vietnam; we acquired a further business in the developing market of India and an acquisition in Laos was announced. And we acquired shares in the Tunisian company, Société de Production et de Distribution des Boissons. Further details on these acquisitions are provided in the operational and regional review of this report.
As the consolidation of the global beer industry continues, this focus will guide our acquisition strategy. It goes without saying that in order for us to remain an independent leading brewer, we will continue to play an active role in this global consolidation.
To conclude, as always, I would like to thank all of the employees of Heineken – wherever they work – for the role that they have played in 2006 to build a stronger, fi tter Heineken Group.
Jean-François van Boxmeer Chairman/CEOAmsterdam, 20 February 2007
Focus on selective opportunities
Growth potential Heineken continues to look for investment opportunities in the international brewing sector. Selective investments fi t well with our strategy of combining our international premium brand Heineken with strong local brands.
Acquisitions and the portfolio review in the rapidly expanding beer market of Russia as well as capitalisation of growth opportunities in Asia Pacifi c are good examples of this growth strategy.
13Heineken N.V.Annual Report 2006

Report of the Executive Board continued
Outlook 2007
GeneralThe world beer market is expected to grow by almost 3 per cent in terms of volume. Developing markets like China, the Far East, Latin America and Russia will drive a large part of the growth. In terms of value about half of the growth will be generated by the increase in the premium segment of the market. The growth rate of the premium segment is expected to be twice as high as that of the total market. The premium segment develops positively in mature as well as in developing markets and with the Heineken brand we occupy a leading position in this attractive segment. New communication platforms, like the UEFA Champions League soccer and rugby, successful innovations, like the DraughtKeg, and excellent execution in on-trade and off-trade, will drive the volume growth of the Heineken brand to a level that exceeds the segment growth.
In 2006, most of our key markets developed well and, in general, Heineken expects a continuation of this trend in 2007.
In the USA, the Company will benefi t from the growing consumption of imported beer in the regular and large light beer market. The introduction of Heineken Premium Light in the luxury light segment gave new opportunities to trade-up the US beer consumer. Russia, our largest operation by volume, will continue to grow, be it at a more normal rate, and our optimised portfolio of brands offers ample opportunities for further growth in the premium
and mainstream segment of the market. With the greater political stability and resulting economic growth in Africa, beer markets in Central Africa have returned to growth and the Heineken Group is well positioned to benefi t from this development. The outlook for Nigeria and Egypt, where substantial restructurings were undertaken in 2005 and 2006, are positive. In Eastern Europe, in particular in Poland, and in the Far East, beer continues to gain in popularity at the expense of local alcoholic beverages. The southern part of Western Europe offers good long-term volume and value growth, whilst in Northwest Europe opportunities for strong brands and attractive innovations are available despite the overall decline of beer consumption as a result of an ageing population.
Uncertainties remain in the fi eld of government actions like excise duty increases, smoking bans in the on-trade and advertising limitations.
Full-year profi t outlook 2007 Based on these developments, Heineken expects strong top-line growth in 2007 as a result of higher volumes, better pricing and an improvement in sales mix. On the cost side, the industry is faced with increasing input costs as a result of higher purchasing prices for barley and packaging materials, mitigated by lower cost of energy and transportation.
In 2007, we expect a substantial reduction of our fi xed-cost base on the back of the realisation of our Fit2Fight cost saving programme.
This outlook for 2007 provides further information on general developments in the international beer industry, their effects on Heineken’s position, its profi t forecast and its capital investments.
Heineken N.V.Annual Report 200614

Capital investments and headcount Heineken expects the capital expenditure related to property, plant and equipment to total around €900 million in 2007. A large part of this investment is related to replacement of existing equipment. In Spain, Tunisia, Laos, India and Mongolia we are in the process of constructing new breweries whilst major capacity expansions are underway in Poland, Thailand, Chile and Africa. In principle, the capital investments will be fi nanced from the cash fl ow.
The cost-saving programme Fit2Fight and outsourcing of activities will lead to a further increase of effi ciency and will enable the Company to better compete on the world beer market. As a result of the cost-reduction programmes, the downward trend in the number of employees will continue.
The world beer market will continue to grow in 2007. The volume of the international premium segment is expected to grow at an average rate twice that of the overall beer market. Thanks to its strong position in this segment, the Heineken® brand in particular will benefi t from this trend, driving the growth of revenue and profi t.
Heineken Premium Light in the USA will sell more than 1 million hectolitres and will be EBIT neutral in 2007 even though incremental marketing investments will rise from USD55 million in 2006 to USD70 million in 2007. After the completion of the integration and brand portfolio optimisation in 2006, revenues and EBIT in Russia will continue to grow organically. Heineken expects input costs to increase by 7-8 per cent as a result of higher purchasing prices for barley and packaging materials. In 2007 the further implementation of Fit2Fight, targeting €450 million of annual fi xed cost reductions before tax and after infl ation by 2008, will result in gross savings of €135-€155 million before tax and €140-170 million restructuring costs before tax.
Based on the above, Heineken expects to achieve organic growth in net profi t in the range of 10-13 per cent in 2007.
Currency exchange rates are not expected to have a major impact on Heineken’s profi t development as the transaction risk of the dollar has been hedged to a large extent at rates which are only slightly lower than those realised in 2006.
Heineken N.V.Annual Report 2006 15
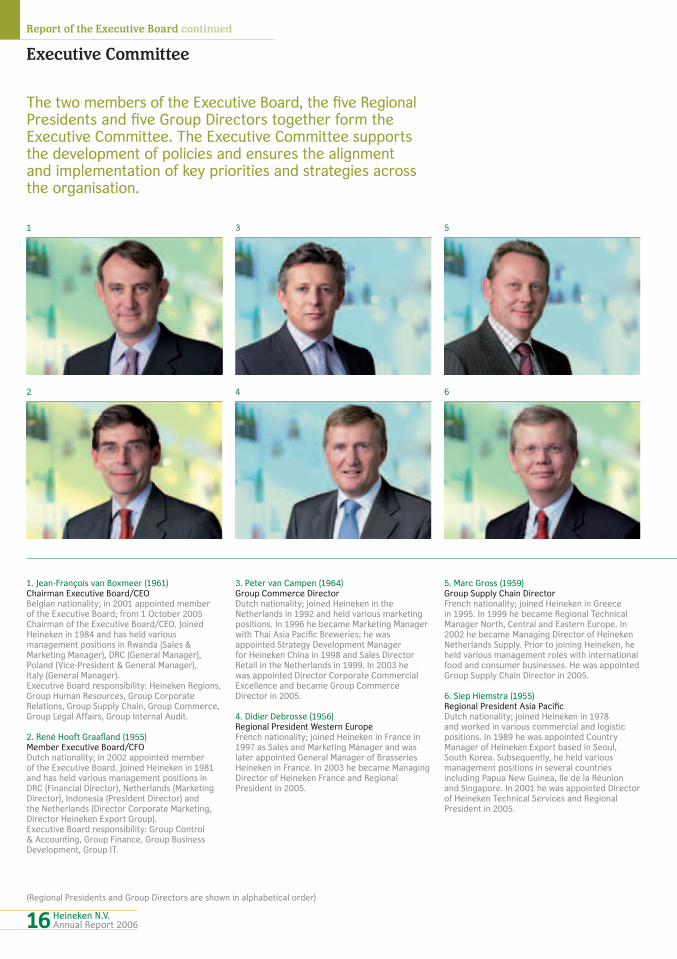
The two members of the Executive Board, the fi ve Regional Presidents and fi ve Group Directors together form the Executive Committee. The Executive Committee supports the development of policies and ensures the alignment and implementation of key priorities and strategies across the organisation.
Executive Committee
Report of the Executive Board continued
1. Jean-François van Boxmeer (1961) Chairman Executive Board/CEO Belgian nationality; in 2001 appointed member of the Executive Board; from 1 October 2005 Chairman of the Executive Board/CEO. Joined Heineken in 1984 and has held various management positions in Rwanda (Sales & Marketing Manager), DRC (General Manager), Poland (Vice-President & General Manager), Italy (General Manager). Executive Board responsibility: Heineken Regions, Group Human Resources, Group Corporate Relations, Group Supply Chain, Group Commerce, Group Legal Affairs, Group Internal Audit.
2. René Hooft Graafl and (1955) Member Executive Board/CFO Dutch nationality; in 2002 appointed member of the Executive Board. Joined Heineken in 1981 and has held various management positions in DRC (Financial Director), Netherlands (Marketing Director), Indonesia (President Director) and the Netherlands (Director Corporate Marketing, Director Heineken Export Group). Executive Board responsibility: Group Control & Accounting, Group Finance, Group Business Development, Group IT.
3. Peter van Campen (1964) Group Commerce Director Dutch nationality; joined Heineken in the Netherlands in 1992 and held various marketing positions. In 1996 he became Marketing Manager with Thai Asia Pacifi c Breweries; he was appointed Strategy Development Manager for Heineken China in 1998 and Sales Director Retail in the Netherlands in 1999. In 2003 he was appointed Director Corporate Commercial Excellence and became Group Commerce Director in 2005.
4. Didier Debrosse (1956) Regional President Western Europe French nationality; joined Heineken in France in 1997 as Sales and Marketing Manager and was later appointed General Manager of Brasseries Heineken in France. In 2003 he became Managing Director of Heineken France and Regional President in 2005.
5. Marc Gross (1959) Group Supply Chain Director French nationality; joined Heineken in Greece in 1995. In 1999 he became Regional Technical Manager North, Central and Eastern Europe. In 2002 he became Managing Director of Heineken Netherlands Supply. Prior to joining Heineken, he held various management roles with international food and consumer businesses. He was appointed Group Supply Chain Director in 2005.
6. Siep Hiemstra (1955) Regional President Asia Pacifi c Dutch nationality; joined Heineken in 1978 and worked in various commercial and logistic positions. In 1989 he was appointed Country Manager of Heineken Export based in Seoul, South Korea. Subsequently, he held various management positions in several countries including Papua New Guinea, Ile de la Réunion and Singapore. In 2001 he was appointed Director of Heineken Technical Services and Regional President in 2005.
(Regional Presidents and Group Directors are shown in alphabetical order)
1 3 5
2 4 6
Heineken N.V.Annual Report 200616

7. Tom de Man (1948) Regional President Africa and the Middle East Dutch nationality; joined Heineken Technical Services in 1971. Following this, he held various management positions in Singapore, Korea, Japan, Nigeria and Italy. From 1992, he was the Production Policy & Control Director for the Group and in 2003 he was appointed Managing Director of Heineken’s operations in Sub-Saharan Africa and Regional President in 2005.
8. Frans van der Minne (1948) Group Human Resources Director Dutch nationality; joined Heineken in 1975 in sales. He held management positions in the export organisation. In 1988 he was appointed general manager of the Murphy Brewery, Ireland. In 1989 he became director of Heineken Export and in 1999 he became cluster director of Central and Eastern Europe. He was appointed President of Heineken USA in 2000 and became Group Human Resources Director in 2005.
9. Nico Nusmeier (1961) Regional President Central and Eastern Europe Dutch nationality; joined Heineken in 1985 as a management trainee and graduated as a master brewer in 1988. Since then he has held various management positions within Heineken in many parts of the world. In 2001 he was appointed President of the Management Board of Grupa Zywiec in Poland and Regional President in 2005.
10. Sean O’Neill (1963) Group Corporate Relations Director British nationality; joined Heineken in 2004 following eight years in senior roles within the alcoholic beverages sector. Prior to this, he held management roles with a global communication and corporate affairs consultancy based in the UK, Russia, the Middle East and Australia. In 2005 he was appointed Group Corporate Relations Director.
11. Floris van Woerkom (1963) Group Control and Accounting Director Dutch nationality; joined Heineken in 2005 as Group Control & Accounting Director, after having worked with Unilever for 18 years, where he held various international positions including Finance Director in Mexico and regional Vice-President Finance in Latin America.
12. Massimo von Wunster (1957) Regional President Americas Italian nationality; before joining Heineken in 1995 Massimo worked with Wunster Brewery, a family-owned brewery founded in 1879. He held various positions within Heineken’s Italian organisation, before being appointed Managing Director of Heineken Italia in 2001 and Regional President in 2005.
7 9 11
8 10 12
Heineken N.V.Annual Report 2006 17

Introduction Accelerating top-line growth is a simple priority, which gives the marketing and commercial function of Heineken its clear and focused goal. In order for us to meet this goal, the challenge across the whole of our business is to balance the management and growth of our local, regional and international brands, with the management and growth of Heineken, the world’s most valuable international premium beer brand. In 2006, we made signifi cant progress against both sides of this equation.
The Heineken brand The Heineken brand is our most important asset. Although it is only 20 per cent of our Group beer volume, it is, and will remain, at the emotional heart of our Company. It is the clear leader in the premium segment of the market, which is expected to generate a signifi cant part of the total beer category profi t growth over the next 10 years. At the end of 2006, the brand’s share of the international premium segment went up to 19.2 per cent from 18.7 per cent in 2005.
In 2006, we achieved total Heineken premium volume growth of 11.3 per cent – the best growth fi gures for the brand since the 1980s. As important, the growth came from all regions and from most of the markets where the brand is enjoyed.
Achieving this level of growth on a brand with the heritage, equity and global scale of Heineken requires a commitment to delivering excellence in two critical elements: innovation and communication.
Innovation Our innovation agenda on the Heineken brand has the consumers and their needs as the starting point. This means we need to consider ‘total’ innovation – across the beer, the package and the way we deliver draught beer.
It is fair to say that changes to the beer itself have not been a feature of Heineken’s approach to innovation during the last 130 years. However,
the launch of Heineken Premium Light in the USA coupled with an additional €43 million marketing investment showed us the value of genuinely understanding the consumer and the market. In its fi rst year, the brand achieved sales of 680,000 hectolitres, far above our original forecast. The launch of this fi rst true brand extension was the most important innovation in the actual beer since the Heineken brand was born in 1873. It is a great example of a bold decision backed up by the commitment and belief of the organisation.
We are also aware of the value our packaging creates, both for consumers and for our top-line growth. The introduction of the ‘embossed’ can is the latest in a line of can innovations which
Operational review
Report of the Executive Board continued
Our number one priority is to drive top-line growth through the creation of a global portfolio that combines the power of local and international brands and which has Heineken as the jewel in the crown.
Heineken N.V.Annual Report 200618
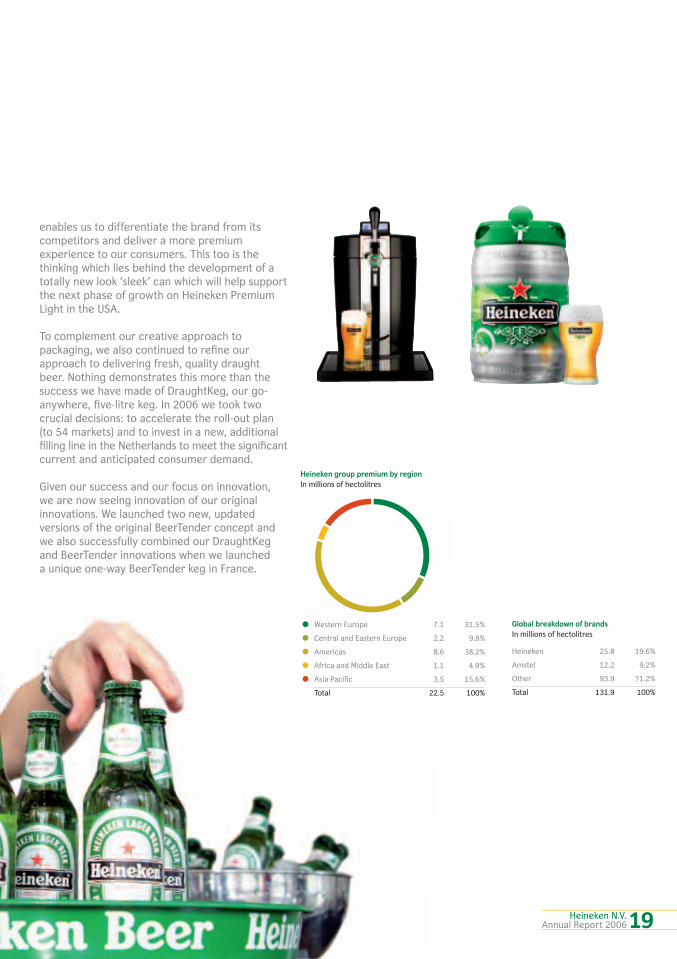
• Western Europe 7.1 31.5%
• Central and Eastern Europe 2.2 9.8%
• Americas 8.6 38.2%
• Africa and Middle East 1.1 4.9%
• Asia Pacific 3.5 15.6%
Total 22.5 100%
Heineken group premium by regionIn millions of hectolitres
Heineken 25.8 19.6%
Amstel 12.2 9.2%
Other 93.9 71.2%
Total 131.9 100%
Global breakdown of brandsIn millions of hectolitres
enables us to differentiate the brand from its competitors and deliver a more premium experience to our consumers. This too is the thinking which lies behind the development of a totally new look ‘sleek’ can which will help support the next phase of growth on Heineken Premium Light in the USA.
To complement our creative approach to packaging, we also continued to refi ne our approach to delivering fresh, quality draught beer. Nothing demonstrates this more than the success we have made of DraughtKeg, our go-anywhere, fi ve-litre keg. In 2006 we took two crucial decisions: to accelerate the roll-out plan (to 54 markets) and to invest in a new, additional fi lling line in the Netherlands to meet the signifi cant current and anticipated consumer demand.
Given our success and our focus on innovation, we are now seeing innovation of our original innovations. We launched two new, updated versions of the original BeerTender concept and we also successfully combined our DraughtKeg and BeerTender innovations when we launched a unique one-way BeerTender keg in France.
Heineken N.V.Annual Report 2006 19

Our David draught system for lower-volume outlets in the on-trade was also extended by the roll-out of the Xtreme Draught concept, a slimmer, more mobile version. In total, our David system is delivering benefi t to outlet owners in more than 70 markets and has delivered more than 1 million hectolitres since its introduction in 2002.
In line with our commitment to driving top-line growth, we took the decision to implement an Extra Cold beer programme around the world. This builds on the consumer insight that there are different occasions on which consumers seek a beverage that both cools and refreshes. The programme covers both draught and packaged beer and incorporates sub-zero degree fridges for the on- and off-trade as well as frozen draught beer founts for the on-trade. These innovations allow Heineken to be served at -2°c.
In 2006 our innovations accounted for approximately 40 per cent of all new growth on the Heineken brand.
It is clear that, as with Heineken Premium Light, we are now seeing the benefi t of taking bold decisions and supporting them with action and investment across the organisation.
Heineken brand communication During the year, our advertising and promotional programme was highly effective in delivering growth.
We translated our international Heineken brand sponsorships into high-impact consumer communication platforms. 2006 was the fi rst year of our UEFA Champions League sponsorship. As a basis for consumer promotion and association with ‘the global game’ the tournament is a natural and successful fi t for Heineken.
The brand’s unquestioned leadership in Europe also allows us to exploit the Heineken Rugby Cup tournament across six key markets. Combined with the UEFA Champions League, this means that we have arguably the two highest-profi le Pan- European sporting events within the Heineken brand stable. These events have certainly helped to drive growth of the brand in Europe over the last 12 months.
We have become known for our creative use of fi lm to support the Heineken brand proposition. Our association with the latest James Bond fi lm – Casino Royale – has given us the opportunity to extend this reputation and build promotion and activation programmes for those of legal drinking age and above in 55 markets around the world.
These major activities were complemented by the work that our markets undertook to associate the Heineken brand with music and music events such as Thirst, our global DJ competition.
Operational review
continued
Report of the Executive Board continued
Heineken N.V.Annual Report 200620

The Amstel brand Amstel is available in more than 90 markets worldwide with total group sales of 12.2 million hectolitres. In addition to Amstel Lager we brew and sell various Amstel propositions including Light beers, non-alcoholics and taste suited for regional markets.
In line with our portfolio approach we developed a revised strategy for the Amstel brand which provides a distinctive role for the brand in our international portfolio. Part of this new approach has been the creation and launch of Amstel Pulse. This is a beer which meets the growing consumer desire for more accessible taste and which, through signifi cantly lower calories and carbohydrates, taps into the consumer wellness and lifestyle trend.
In Russia, during the fi rst year of introduction, sales of Amstel Pulse have exceeded 100,000 hectolitres. Amstel Pulse has also been launched in Australia, Greece, Dubai and New Zealand.
The packaging identity for the Amstel brand has been refreshed, fi rst introduced in the Netherlands at the end of 2006. This new design will be rolled out to other markets in 2007. This will increase the brand’s point of differentiation and re-confi rm its quality credentials within the portfolio.
In the USA a new campaign ‘Live tastefully’ was launched in the summer with new TV ads in order to revitalise the Amstel Light brand, building up on its European fl avour and long-standing heritage. With Amstel Light and Heineken Premium Light our Group enjoys the largest share in the imported light beer market in the USA.
Brand portfolios Managing a portfolio of brands requires a signifi cant level of sales and marketing capability. That’s why we have focused a signifi cant amount of effort on training and development initiatives throughout the global function, implemented via the new regional structure. These initiatives have
James Bond set Heineken invested in a ground-breaking promotional partnership with Sony Pictures Entertainment for the 21st edition of James Bond, Casino Royale. Heineken’s promotional campaign included a TV commercial featuring Bond girl Eva Green. The partnership marked the fi rst time that a commercial product was allowed access to the actual Bond set to shoot an ad.
Heineken N.V.Annual Report 2006 21

2002
2003
2004
2005
2006
10.8
11.0
11.1
11.4
12.2
Total Amstel volumeIn millions of hectolitres
been focused on three areas of skill development: portfolio management, sales and distribution management and mainstream brand management.
Over the last two years, a large part of this has been the implementation of portfolio reviews across our operating companies. This work has allowed us to re-allocate both money and people to focus on the ‘winning’ brands. To date, we have covered approximately 80 per cent of our global volume and are now undertaking the second phase which is fully executing the fi ndings. We are now clearly beginning to see greater consistency of approach and more exchange of best practice across markets which is making a signifi cant contribution to improved performance.
Sustainability One of the biggest challenges facing an international businesses like Heineken is achieving a balance between the sustainability of business performance with the sustainable development of the communities in which we operate. At Heineken, we recognise this need and work hard to put social and environmental sustainability at the heart of the actions that support Heineken’s priorities.
Improving our sustainability ‘footprint’ is part of our commitment to all stakeholders. We aspire to deliver business results that support the long-term health, safety and well-being of our employees, consumers, customers and the communities in which our stakeholders live and work.
We believe that beer forms part of an enjoyable lifestyle when consumed and marketed responsibly. Looking ahead, we will continue to actively encourage the responsible consumption of beer and marketing of our beer. We will do this both as Heineken and through membership of international industry groups such as the International Center for Alcohol Policies (ICAP), Global Alcohol Producers Group and the Brewers of Europe and through our work with local, non-governmental organisations.
Operational review
continued
Report of the Executive Board continued
Heineken N.V.Annual Report 200622
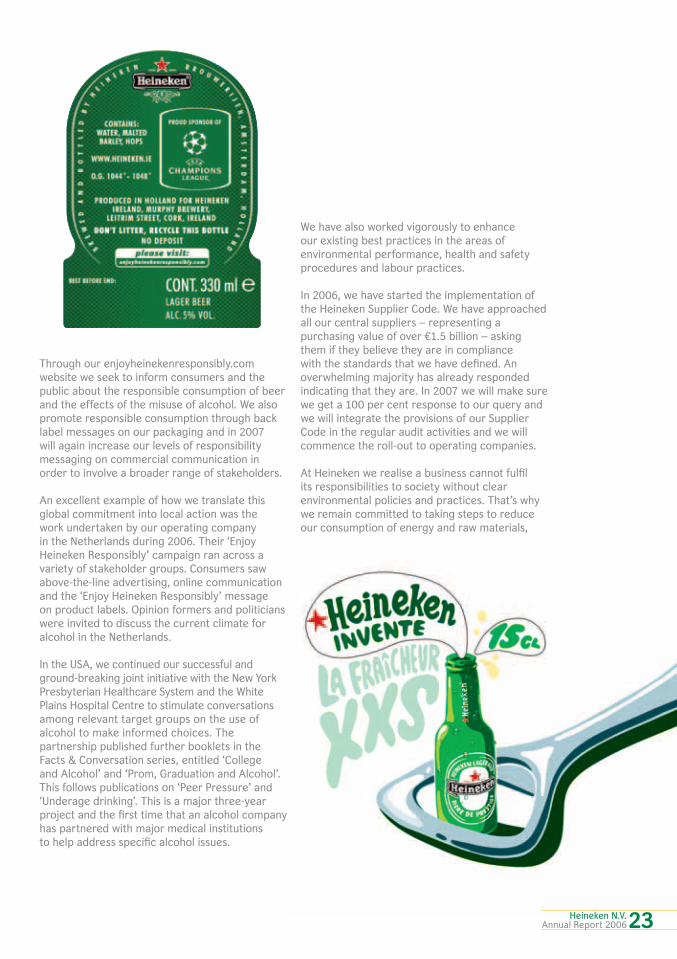
Through our enjoyheinekenresponsibly.com website we seek to inform consumers and the public about the responsible consumption of beer and the effects of the misuse of alcohol. We also promote responsible consumption through back label messages on our packaging and in 2007 will again increase our levels of responsibility messaging on commercial communication in order to involve a broader range of stakeholders.
An excellent example of how we translate this global commitment into local action was the work undertaken by our operating company in the Netherlands during 2006. Their ‘Enjoy Heineken Responsibly’ campaign ran across a variety of stakeholder groups. Consumers saw above-the-line advertising, online communication and the ‘Enjoy Heineken Responsibly’ message on product labels. Opinion formers and politicians were invited to discuss the current climate for alcohol in the Netherlands.
In the USA, we continued our successful and ground-breaking joint initiative with the New York Presbyterian Healthcare System and the White Plains Hospital Centre to stimulate conversations among relevant target groups on the use of alcohol to make informed choices. The partnership published further booklets in the Facts & Conversation series, entitled ‘College and Alcohol’ and ‘Prom, Graduation and Alcohol’. This follows publications on ‘Peer Pressure’ and ‘Underage drinking’. This is a major three-year project and the fi rst time that an alcohol company has partnered with major medical institutions to help address specifi c alcohol issues.
We have also worked vigorously to enhance our existing best practices in the areas of environmental performance, health and safety procedures and labour practices.
In 2006, we have started the implementation of the Heineken Supplier Code. We have approached all our central suppliers – representing a purchasing value of over €1.5 billion – asking them if they believe they are in compliance with the standards that we have defi ned. An overwhelming majority has already responded indicating that they are. In 2007 we will make sure we get a 100 per cent response to our query and we will integrate the provisions of our Supplier Code in the regular audit activities and we will commence the roll-out to operating companies.
At Heineken we realise a business cannot fulfi l its responsibilities to society without clear environmental policies and practices. That’s why we remain committed to taking steps to reduce our consumption of energy and raw materials,
Heineken N.V.Annual Report 200623

Operational review
continued
Report of the Executive Board continued
whilst preventing harmful emissions and production of waste where possible.
Once again, our efforts were recognised by our continued inclusion in the Dow Jones Sustainability Index (second within our global industry category) and by our membership of the FTSE4Good index.
In April 2006, Heineken published a full sustainability report that covered 2004 and 2005. Our 2006 Sustainability Report will be published in April 2007. You will fi nd both reports on our website and we invite you to visit and fi nd out more. Also see the dedicated website www.enjoyheinekenresponsibly.com.
Personnel and organisation The new regional structure under the direction of new management, implemented in 2005, continued to work to improve operational effi ciency and improve top- and bottom-line growth. Thanks to these changes and to the new senior management reward policy, which came
into effect on 1 January 2006, we have made signifi cant steps towards a more performance-oriented company. In addition to the improved results, this has become apparent in greater clarity of direction, a higher speed of decision-making and a better focus on implementation.
In 2006 we completed a benchmark of the effi ciency and effectiveness of our support functions, both externally and internally. In general, the benchmark indicated that we perform at reasonable levels, but effi ciency and effectiveness improvement opportunities are available across all functional areas. Especially in our back offi ce, we have possibilities to reduce our error rate and time spent, which could help to focus more on added-value activities. Increased leverage of technology is an important enabler for this.
Initial quick wins have been achieved and more structural improvement projects have been initiated. This has resulted in better focus on (centralised) HR-related purchasing. In 2007, we will continue our drive for improved performance.
Progress was made in strengthening our senior management review and performance management processes and the goal of upgrading our information systems to provide more transparency across the organisation. Human Resources information can now better be shared among regions and this is especially helpful when identifying potential high-performing individuals so that we can develop these people across all disciplines and regions.
Heineken N.V.Annual Report 200624
• Western Europe 16,395
(of which in the Netherlands) 4,315
• Central and Eastern Europe 25,281
• Americas 6,108
• Africa and the Middle East 12,163
• Asia Pacific 5,701
Geographical distribution of personnelIn numbers (not pro rata)
We continue to make signifi cant improvement in the Health and Safety management of our employees. We enlarged our provision of (preventive) medicine for diseases such as malaria and HIV/Aids. We continue to work on and improve our policy of listening to employees and to be a place where our employees can fulfi l their career ambitions. Increasingly, we approach this interaction more structurally, not only via regular performance dialogues, but also with employee engagement surveys among large parts of our staff.
In 2006 the average number of employees (not pro rata) increased from 64,305 to 65,648.
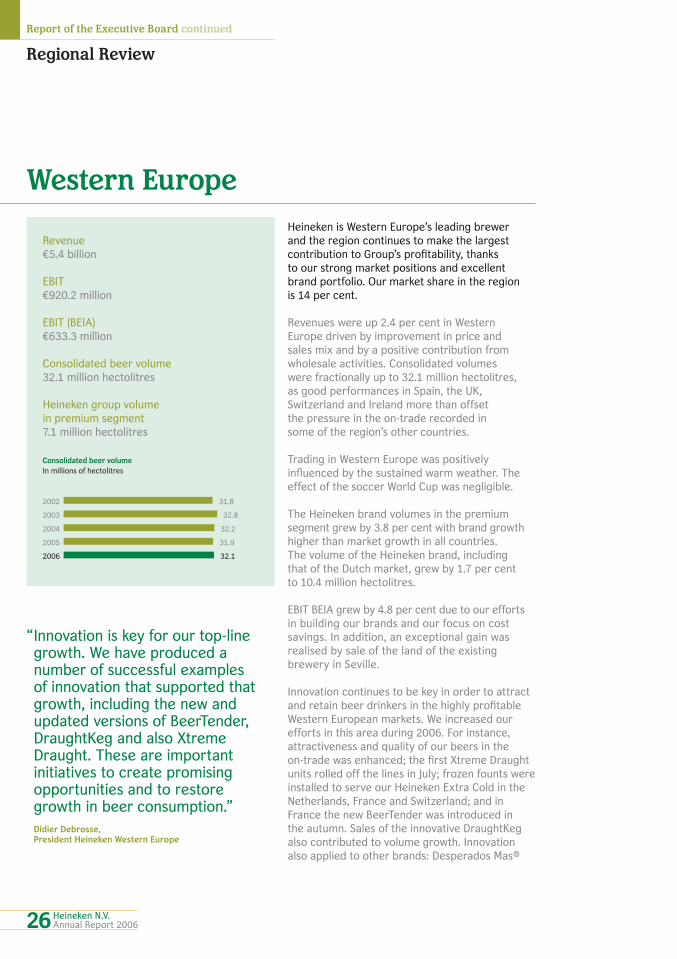
Consolidated beer volumeIn millions of hectolitres
2002
2003
2004
2005
2006
31.8
32.8
32.2
31.9
32.1
Report of the Executive Board continued
Regional Review
Heineken is Western Europe’s leading brewer and the region continues to make the largest contribution to Group’s profi tability, thanks to our strong market positions and excellent brand portfolio. Our market share in the region is 14 per cent.
Revenues were up 2.4 per cent in Western Europe driven by improvement in price and sales mix and by a positive contribution from wholesale activities. Consolidated volumes were fractionally up to 32.1 million hectolitres, as good performances in Spain, the UK, Switzerland and Ireland more than offset the pressure in the on-trade recorded in some of the region’s other countries.
Trading in Western Europe was positively infl uenced by the sustained warm weather. The effect of the soccer World Cup was negligible.
The Heineken brand volumes in the premium segment grew by 3.8 per cent with brand growth higher than market growth in all countries. The volume of the Heineken brand, including that of the Dutch market, grew by 1.7 per cent to 10.4 million hectolitres.
EBIT BEIA grew by 4.8 per cent due to our efforts in building our brands and our focus on cost savings. In addition, an exceptional gain was realised by sale of the land of the existing brewery in Seville.
Innovation continues to be key in order to attract and retain beer drinkers in the highly profi table Western European markets. We increased our efforts in this area during 2006. For instance, attractiveness and quality of our beers in the on-trade was enhanced; the fi rst Xtreme Draught units rolled off the lines in July; frozen founts were installed to serve our Heineken Extra Cold in the Netherlands, France and Switzerland; and in France the new BeerTender was introduced in the autumn. Sales of the innovative DraughtKeg also contributed to volume growth. Innovation also applied to other brands: Desperados Mas®
Western Europe
“ Innovation is key for our top-line growth. We have produced a number of successful examples of innovation that supported that growth, including the new and updated versions of BeerTender, DraughtKeg and also Xtreme Draught. These are important initiatives to create promising opportunities and to restore growth in beer consumption.”
Didier Debrosse, President Heineken Western Europe
Revenue €5.4 billion
EBIT€920.2 million
EBIT (BEIA)€633.3 million
Consolidated beer volume32.1 million hectolitres
Heineken group volume in premium segment7.1 million hectolitres
Heineken N.V.Annual Report 200626

Principal brands Our principal international brands are Heineken and Amstel. Heineken is positioned as a premium brand, except for the Dutch market and Amstel is positioned in the mid-priced mainstream segment.
DraughtKeg: extraordinary success
DraughtKeg was introduced in France in April 2005 and the one-way BeerTender version in October 2006.
The DraughtKeg is a 5 litre CO2 pressurized keg with a tap.
The consumer chills the keg and then simply clicks on the easy-to-install tap tube to draw a fresh draught beer. Our unique and patented carbonator pressure unit inside the keg releases CO
2 to keep the pressure at 1 bar. This allows
for a crisp quality beer with the right head of foam and the right ‘bite’. The DraughtKeg stays fresh for 21 days after fi rst tapping, right down to the last glass. On average, 20 glasses can be dispensed.
The DraughtKeg is now available in 54 countries around the globe, proving an extraordinary success. It is exclusively used for the Heineken brand.
With the new one-way BeerTender technology, the DraughtKeg can now be used as a keg for our BeerTender appliance as well. The new system was introduced in the French market for the fi rst time.
We are more than tripling our manufacturing capacity in order to meet the high consumer demand. The new fi lling line will be up and running in the fi rst half of 2007.
established its fi rst advertising campaign in France, while Cruzcampo® Shandy in Spain and Birra Moretti® Zero are creating new opportunities.
The Fit2Fight programme was implemented in the region and we are confi dent that this programme will further improve profi tability and will support long-term growth.
The proposal of the European Union for the harmonisation of excise duty levels across the region is still being discussed. Heineken supports an equal treatment of beer in comparison with wine and believes that excise duty on beer – where wine is not taxed – leads to further unfair competition.
Heineken N.V.Annual Report 2006 27
The Netherlands
Consolidated beer volume 5.7 million hectolitres Market share 49.8 per cent Market position 1
Our volumes were fractionally down. Amstel and Brand® beer grew well, whilst volumes of the Heineken brand slightly decreased.
Revenues remained broadly unchanged. EBIT (BEIA) was virtually unchanged, as the effect of a better sales mix was offset by lower results in the wholesale operations. On the other hand, the result of the brewing activities grew thanks to ongoing savings in fi xed costs.
The DraughtKeg was a great success, with 5.4 million kegs sold by year end. The installation of the much needed additional fi lling capacity in our Dutch brewery in Zoeterwoude is progressing according to plan. BeerTender, the other innovative draught system for home use, is now available in 11 of our brands. By the end of 2006, six million BeerTender Kegs had been sold.
In November, new Amstel returnable bottles were rolled out with the restyled label, featuring the well-known bulls-eye. Other packaging types will also be improved accordingly. The upgrade of the labels will be rolled out internationally.
Our soft drink operation, Vrumona, recorded a positive volume growth, which resulted in an increased EBIT.
Spain
Consolidated beer volume 11.2 million hectolitres Market share 30.4 per cent Market position 1
Heineken España revenues increased by 7.7 per cent thanks to strong volume growth driven by all three key brands: Heineken, Amstel and Cruzcampo. Buckler®, our alcohol-free beer, continues its success and volumes grew by 1.7 per cent in 2006, following on strong growth posted in 2005.
EBIT grew organically thanks to the buoyant volume growth and a better pricing and sales mix, despite higher costs related to the expansion of the distribution business and the new collective wage contracts.
In August Heineken announced the sale of the land in the centre of Seville where the existing brewery is located. The receipts from the sale will be paid in instalments over three years (2006-2008). The construction of the new 4.5 million hectolitre brewery in Seville is proceeding according to plan and operations will start in 2008.
France
Consolidated beer volume 6.6 million hectolitres Market share 30.9 per cent Market position 2
France remains a challenging market for brewers, particularly in the on-trade in the fi rst half of the year. The implementation of the Loi Dutreil, the law which restricts discount payments to retailers, but gives our customers the opportunity to include discounts to consumer prices, had a signifi cant impact in 2006. Heineken France volumes decreased in line with market trends. Both Heineken, up 1 per cent, and Desperados, up 0.9 per cent, outperformed the market.
Report of the Executive Board continued
Regional Review
continued
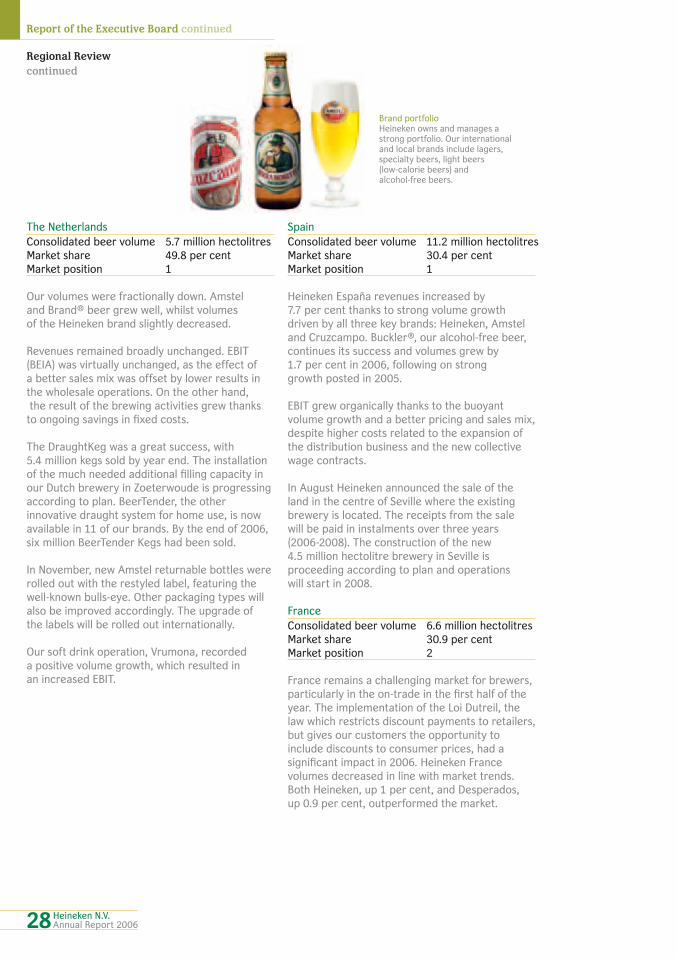
Brand portfolio Heineken owns and manages a strong portfolio. Our international and local brands include lagers, specialty beers, light beers (low-calorie beers) and alcohol-free beers.
Heineken N.V.Annual Report 200628
Our revenues were up 1.7 per cent organically year-on-year. Part of the success was due to the Heineken brand, which clearly benefi ts from the focus on innovation, and the new BeerTender compatible with the DraughtKeg. Likewise, our consistent price policy, improved sales mix and successful marketing concepts such as ‘Culture Bière’ in Paris, a vibrant, gastronomic and retail experience dedicated to the celebration of beer, helped protect revenues.
EBIT improved thanks to a better contribution from our wholesale operations, ongoing cost cutting in the context of the Fit2Fight programme and the improved mix. In addition, the book gain from the sale of four distribution centres was realised.
Italy
Consolidated beer volume 5.7 million hectolitres Market share 31.9 per cent Market position 1
The market in Italy increased, despite an excise duty increase, driven by low-priced imports.
The Heineken brand showed healthy growth, reaching a record volume. Birra Moretti, our key brand in Italy, continued its growth to more than 2 million hectolitres. During the summer we launched Birra Moretti Zero, a non-alcoholic beer, targeting the growing alcohol-free segment.
EBIT increased thanks to stronger pricing and stringent cost control, despite the lower profi tability in the wholesale business. Part of the Fit2Fight programme in Italy is focused on improving the performance of distribution.
As a result of the closure of the Pedavena brewery and further restructuring, headcount was reduced by more than 325.
Other markets in Western Europe
In the United Kingdom, Heineken brand volume rose by 24 per cent. This refl ects consumers’ growing acceptance of the brand’s premium positioning and an improved distribution network.
In Ireland, we reinforced our number one position in the growing lager segment, increasing our overall market share to more than 21 per cent. Volumes were up 2 per cent, and Heineken Ireland outperformed the market. EBIT grew as a result of good top-line growth.
The sponsorship of the Heineken Rugby Cup contributed to this success, as did the roll-out of our David draught system. The on-trade is in slight decline due to changing beer drinking habits and anti-drink-driving activities.
In Switzerland volumes grew by 1 per cent with considerable performance improvements in Heineken and Calanda®.
Heineken N.V.Annual Report 2006 29

Consolidated beer volumeIn millions of hectolitres
2002
2003
2004
2005
2006
20.9
27.1
36.9
39.3
46.9
Report of the Executive Board continued
Regional Review
continued
Central and Eastern Europe is Heineken’s largest region by volume and is showing continued growth. Our business is benefi ting from integration of acquired breweries and the outcome of portfolio optimisation. The Heineken brand is increasing its popularity.
Revenues grew 20.1 per cent, with an organic growth rate of 10.4 per cent driven by the outstanding volume performance. First-time consolidations accounted for a 4.4 million hectolitre increase and are mostly related to the integration of Ivan Taranov Breweries. EBIT BEIA grew signifi cantly fuelled by higher volumes, better price and sales mix and by stronger currencies, mainly the zloty and the rouble. EBIT growth was particularly strong in Austria, Greece, and Romania.
The Heineken brand posted a healthy 15.2 per cent growth throughout the region, exceeding the 2 million hectolitre mark for the fi rst time driven in part by an outstanding performances in Poland, Russia and Greece. Consolidated beer volumes grew 19.4 per cent to 46.9 million hectolitres. First-time consolidations contributed 4.4 million hectolitres. Volumes grew in every country with the exception of Austria and Slovakia.
Central and Eastern Europe
“ Our integration of acquired breweries, our successful portfolio optimisation in a number of countries and our focus on premium brands have explicitly strengthened our position and allow us to tap the growth potential in the Central and Eastern European region.”
Nico Nusmeier, President Heineken Central and Eastern Europe
Revenue €3.4 billion
EBIT€339.2 million
EBIT (BEIA)€364.3 million
Consolidated beer volume46.9 million hectolitres
Heineken group volume2.2 million hectolitres
Increasing popularity Central and Eastern Europe is Heineken’s largest region by volume and has huge growth potential. Many markets are benefi ting from a growing European Union. In addition, the Heineken brand is benefi ting from the increased popularity of premium beers.
Heineken N.V.Annual Report 200630

In 2006, we optimised our brand portfolio to create a winning portfolio that would give us an advantage in the Russian market. We reduced our portfolio from 36 to 23 brands, including the brands we produce under licence, and developed a strong premium brand offering.
Nine of the brands in our optimised portfolio are top international premium beers, nine are regional and fi ve are national brands.
The mainstream beer brands Ochota, and premium brand Zlaty Bazant are performing very well. Ochota in particular was a big success in 2006 and its volume grew to more than 3 million hectolitres.
The positioning of the brands in our portfolio is reported as indicated below.
Russia
In Germany the soccer World Cup drove beer consumption up, especially in the fi rst half and our joint venture Brau Holding International outperformed the market.
In Russia an exceptionally strong third quarter, coupled with the success of our portfolio optimisation, led to volumes of 13 million hectolitres.
Beer sold in plastic PET bottles has grown so rapidly that it now represents more than 40 per cent of consumption in some countries in the region. To capitalise on this trend, we rolled out new products in this packaging. One example of this is the new TopStar®, a high-quality PET bottle, which has been used for Goldenbrau® and Zagorka®.
Russia is now our largest operation by volume, while we are the strong third player in the market with a share of 13.2 per cent. We are targeting a market share of 20 per cent in fi ve to six years time.
Russian portfolio:
National brands Regional brands
Heineken N.V.Annual Report 2006 31
Poland
Consolidated beer volume 11.0 million hectolitres Market share 33.6 per cent Market position 2
The Polish beer market enjoyed another positive year, up 6.4 per cent. Grupa Zywiec performed very well, with volumes rising more than 8 per cent and growth in all brands.
Zywiec, Poland’s leading national premium brand, reached 2.7 million hectolitres, which represents an 8.3 per cent growth. Warka® Jasne Pelne, our mainstream brand, enjoyed a 25 per cent growth. The Heineken brand had a good year too, up 14.7 per cent, confi rming its leadership in the international premium segment.
Revenues were ahead of last year, driven by the strong volumes and a better sales mix. Costs related to the brewery closure at Bydgoszcz at the end of 2006 and other Fit2Fight-related costs hit EBIT, which was slightly down on last year. EBIT was also affected by changes in package and channel mix.
In December Grupa Zywiec completed a buy back of 5.3 per cent of its outstanding shares.
Germany
Consolidated beer volume 3.6 million hectolitres Market position 4
The German beer market improved in 2006, after several years of decline, thanks to the World Cup soccer competition hosted there and favourable weather conditions in the fi rst half of the year.
BrauHolding International, our joint venture with the Schorghuber Group, increased its volume organically. In particular the speciality beer, Paulaner® Weissbier, recorded a good year with a volume growth of 14.2 per cent, in part driven by exports. BrauHolding International became the leader in the ‘weiss’ beer segment.
Russia
Consolidated beer volume 13.0 million hectolitres Market share 13.2 per cent Market position 3
The market developed very positively in 2006, thanks to economic conditions, good weather and an exceptional trading environment in the third quarter. Our volumes grew well, both organically and through the fi rst-time consolidation of Ivan Taranov. Volumes reached 13 million hectolitres.
Volumes grew across the portfolio, with the Heineken brand up by more than 30 per cent, and Ochota, our leading mainstream brand, up by 26 per cent. We also recorded strong growth in the premium portfolio, with Zlaty Bazant®, Amstel Pulse, Bitburger®, Guinness® and Bud®, |as well as with the recently acquired mainstream brands. Three Bears®. Bochkarov® volumes were lower.
Heineken Russia’s revenues doubled as a result of fi rst-time consolidations, volume and price growth. EBIT increased as well, mostly because of the fi rst-time consolidation. The increase of our sales and marketing investment and integration costs limited organic growth.
Amstel Pulse, introduced at the end of 2005, recorded high sales and positive consumer appreciation.
In 2006 we focussed on the integration of the recently acquired brewers and development of the existing business: we completed the fi rst brand portfolio review, identifying 14 key strategic brands and 9 top premium brands. We also completed the production allocation study of the 10 breweries and defi ned our distribution strategy. We introduced several new products and packages, mostly new PET, with good consumer response.
Report of the Executive Board continued
Regional Review
continued
Heineken N.V.Annual Report 200632
Volumes in economy brands fell substantially, resulting in slightly lower EBIT.
Austria
Consolidated beer volume 4.5 million hectolitres Market share 50 per cent Market position 1
In 2006 we carried out an extensive brand portfolio optimisation programme, which resulted in a marketing focus on key brands and price increases. Related volume decline was limited to the Zipfer® and Gösser® brands but Puntigamer® and Kaiser® showed single-digit growth and the Heineken brand grew by over 34 per cent from a low base.
EBIT grew substantially also thanks to stringent cost control, especially in fi xed costs.
Better pricing and sales mix compensated for some volume pressure. The on-trade market remains challenging.
Pago, our fruit juice operation, grew slightly in volume terms and the turnaround is proceeding according to expectations.
Greece
Consolidated beer volume 3.3 million hectolitres Market share 82.1 per cent Market position 1
The Greek beer market grew thanks to better summer weather and increased tourism. Volumes grew healthily.
Revenues rose, driven by a price increase of 3.5 per cent executed in March and the good volumes. Volumes in the on-trade outperformed, improving the mix and profi tability. EBIT increased at a double-digit rate, helped by reductions in fi xed costs and a better allocated marketing budget.
The Heineken brand grew 6 per cent and Amstel volumes were stable. We launched Amstel Pulse in the second half of the year.
Greece was one of the fi rst countries to enjoy the roll-out of sub-zero coolers that allow beer to be served at a temperature below zero degrees Celsius, in both the off- and on-trade.
Other markets in Central and Eastern Europe
Brau Union Romania recorded a very strong performance, in both volume and profi t. Volumes grew by 20 per cent, surpassing 4 million hectolitres. The performance was driven mainly by the Goldenbrau and Bucegi® brands, which underwent re-styling, with new packaging. A new seasonal beer of the Ciuc® brand, Ciuc® Winter, was introduced at year-end.
In Hungary, trading conditions remained challenging as a result of intense competition, cheap German imports and a sluggish economy. Nevertheless, Heineken Hungary volumes were slightly up, with an excellent 8 per cent growth in the Heineken brand. EBIT grew signifi cantly due to a better sales mix and improved cost control.
The Bulgarian market rebounced from the effects of the excise duty increases in 2005. We enjoyed 9 per cent volume growth, which translated to an improvement in EBIT. The returnable version of the BeerTender was introduced in December.
Heineken N.V.Annual Report 200633
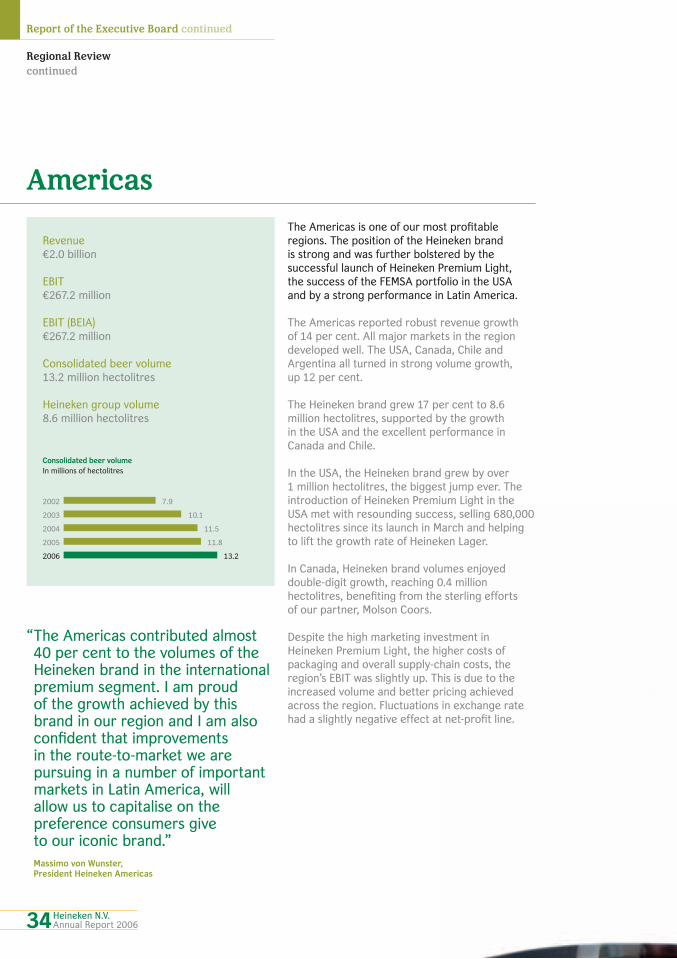
2002
2003
2004
2005
2006
Consolidated beer volumeIn millions of hectolitres
7.9
10.1
11.5
11.8
13.2
Report of the Executive Board continued
Regional Review
continued
The Americas is one of our most profi table regions. The position of the Heineken brand is strong and was further bolstered by the successful launch of Heineken Premium Light, the success of the FEMSA portfolio in the USA and by a strong performance in Latin America.
The Americas reported robust revenue growth of 14 per cent. All major markets in the region developed well. The USA, Canada, Chile and Argentina all turned in strong volume growth, up 12 per cent.
The Heineken brand grew 17 per cent to 8.6 million hectolitres, supported by the growth in the USA and the excellent performance in Canada and Chile.
In the USA, the Heineken brand grew by over 1 million hectolitres, the biggest jump ever. The introduction of Heineken Premium Light in the USA met with resounding success, selling 680,000 hectolitres since its launch in March and helping to lift the growth rate of Heineken Lager.
In Canada, Heineken brand volumes enjoyed double-digit growth, reaching 0.4 million hectolitres, benefi ting from the sterling efforts of our partner, Molson Coors.
Despite the high marketing investment in Heineken Premium Light, the higher costs of packaging and overall supply-chain costs, the region’s EBIT was slightly up. This is due to the increased volume and better pricing achieved across the region. Fluctuations in exchange rate had a slightly negative effect at net-profi t line.
Americas
“ The Americas contributed almost 40 per cent to the volumes of the Heineken brand in the international premium segment. I am proud of the growth achieved by this brand in our region and I am also confi dent that improvements in the route-to-market we are pursuing in a number of important markets in Latin America, will allow us to capitalise on the preference consumers give to our iconic brand.”
Massimo von Wunster, President Heineken Americas
Revenue €2.0 billion
EBIT€267.2 million
EBIT (BEIA)€267.2 million
Consolidated beer volume13.2 million hectolitres
Heineken group volume8.6 million hectolitres
Heineken N.V.Annual Report 200634

Imported beer The Americas remains one of our most profi table regions, aided by popularity of mini-kegs and the ‘halo effect’ of the introduction of Heineken Premium Light. Import and specialty beers perform strongly in the USA. Americans know that their Heineken beer they drink has been imported.
Light beer is defi ned as beer lower in calories, carbohydrates and alcohol content. In 2006 the US light beer market exceeded the regular market in volumes, accounting for 121 million hectolitres. This segment continued to grow in 2006 and offers new opportunities, as consumers seek to trade up, creating a luxury light segment.
Heineken Premium Light is positioned as the premium beer in the luxury light segment, offering unique brand image, excellent taste and attractive packaging.
After a test marketing campaign in 2005, the nationwide introduction of the 12-ounce bottle took place in March and April 2006. To date, penetration in the supermarket and liquor store channels is high, whilst there is still plenty of room for expansion in the on-trade and convenience stores. Further expansion will also be achieved by the planned introduction of cans and DraughtKeg and by increasing the volume per retail outlet.
Since American beer drinkers know Heineken as a full-fl avoured European beer only, we placed great emphasis on sampling. In parallel, a new marketing campaign was executed, with broad use of on-site events and online communication, supported by new television commercials in English and Spanish.
Heineken estimated total volumes of 400,000 hectolitres for 2006, but results were ahead of our own forecast and actual sales settled at 680,000 hectolitres, 70 per cent ahead of plans.
Compared to Heineken Lager, the consumer and geographical profi le of Heineken Premium Light shows a higher incidence of females and Hispanic beer drinkers. Geographically, it is more evenly spread across the states, with higher sales in the North East and in the Midwest.
Heineken Premium Light
Heineken N.V.Annual Report 200635

USA
Consolidated beer volume* 7.5 million hectolitres Market share* 19 per cent Market position* 1
* Imported beer segment.
The beer market in the USA was slightly up and the segments of imported premium beer and speciality beer continued their robust growth rate, refl ecting the increasing consumer demand for sophisticated and exciting beers.
Revenues of Heineken USA grew 15 per cent driven by substantially higher volumes and higher realised prices. Total volumes of Heineken USA were up 15 per cent to 7.5 million hectolitres whilst depletions, the sales by the distributors to retailers, rose by 14 per cent. Market share increased.
EBIT, despite the additional investments in Heineken Premium Light, was broadly unchanged. The impact of the exchange rate of the dollar was positive at EBIT level.
In the last quarter of 2006 Heineken USA increased net prices by 2.5 per cent for all brands in the states of Texas, Florida and Hawaii, which represent 20 per cent of its volume. In the fi rst quarter of 2007, prices of the remaining 80 per cent of the volume were increased by an average 2.5 per cent.
Heineken beer recorded an increase in volume in all four regions of the country, growing by 19 per cent to 6.5 million hectolitres. This performance is due to new marketing programmes, better sales execution, the upgraded packaging and the halo effect of the launch of Heineken Premium Light. The DraughtKeg was introduced and demand exceeded supply.
In the second year of the exclusive distribution deal with FEMSA, the portfolio of Mexican beers of FEMSA continued to grow. The volume grew by 14 per cent to 2.5 million hectolitres. In particular the Dos Equis® and Tecate® brands performed strongly, strengthening our position in the import segment, which is dominated by Mexican and Dutch beer.
Amstel Light reported lower volumes. The brand’s consumer base is increasingly switching to wine and premium spirits. Programmes are developed to reposition and strengthen Amstel Light.
Report of the Executive Board continued
Regional Review
continued
Heineken N.V.Annual Report 200636
Chile and Argentina
Heineken operations in the region are conducted through a 50/50 joint venture (IRSA) that controls Compania Cervecerias Unidas (CCU), Chile’s leading brewer and the number two brewer in Argentina.
The market in Chile grew 12.2 per cent on the back of a strong economy and despite increased competition. CCU in Chile grew its group volume by 12.9 per cent to 4.7 million hectolitres and achieved better pricing. Beer volume in Argentina grew 7.9 per cent to 2.4 million hectolitres. In 2006, revenues increased 17 per cent and EBIT grew 20 per cent.
The CCU brands developed well, in particular the Cristal brand, which exceeded 2.8 million hectolitres. The Heineken brand grew strongly and (combined) was 20 per cent up.
Caribbean
Volumes were stable and EBIT grew slightly on an organic basis. The Heineken brand was stable too.
At the end of 2006, Heineken Premium Light was introduced in Puerto Rico.
Heineken N.V.Annual Report 2006 37

2002
2003
2004
2005
2006
Consolidated beer volumeIn millions of hectolitres
8.7
10.4
10.8
11.6
13.3
Report of the Executive Board continued
Regional Review
continued
Heineken’s has a long-standing presence in Africa. Our knowledge of the environment, coupled with more stable economies and healthier trading conditions boosted volumes and profi tability in the region. The popularity of our brands and of Heineken beer in particular, is growing rapidly.
Revenues jumped more than 12 per cent, and EBIT increased by more than 18 per cent. EBIT growth was particularly strong in Nigeria, whilst the performance in the North Africa region was moderate.
In 2006, consolidated volumes in the region increased organically by 1.7 million hectolitres, bringing the regional total to 13.3 million hectolitres. Nigeria and the sub-Saharan breweries in Congo, Burundi, Rwanda and the Democratic Republic of Congo contributed more than 70 per cent to the total increase.
Heineken brand volumes grew by more than 23 per cent, turning in positive performances in all countries. Heineken brand growth was particularly strong in South Africa, up 48 per cent, in Nigeria, up 49 per cent and in Rwanda up 65 per cent.
Volumes were the major driver of the signifi cant increase in EBIT and in margins. This result was achieved despite a rise in marketing expenditures. The marketing budget was augmented in order to increase the share of voice of our key brands and to support the launch of new products. In addition, previously implemented effi ciencies in fi xed costs are starting to pay off.
In South Africa, where it is brewed under license, the Amstel brand performed very well and strengthened its position as an established premium brand. Sales of Amstel contributed to an increase in royalties.
Brandhouse, the South-African joint venture between Heineken, Diageo and Namibian Breweries, performed well in terms of volumes in its second year of operations.
Africa and the Middle East
“ We have always been well positioned for growth and since the economic situation in Central Africa has been stabilising, we have clearly benefi ted from the potential provided by this attractive region. We were able to increase volumes and to boost profi tability.”
Tom de Man, President Heineken Africa and the Middle East
Revenue €1.2 billion
EBIT€234.1 million
EBIT (BEIA)€233.4 million
Consolidated beer volume13.3 million hectolitres
Heineken group volume1.1 million hectolitres
Heineken N.V.Annual Report 200638

African beers Star is Africa’s number 1 selling beer. Star is brewed by Sierra Leone Brewery Ltd, in which Heineken has a 42.5 per cent stake. Primus beer is another popular lager beer brewed by the Congolese brewing company Bralima, owned by Heineken.
The Great Lakes area in Africa has gone through more than a decade of civil strife, political turmoil, war and economic decay that ended about two years ago. Heineken never ceased operating in the region during these diffi cult years. Because of our continued presence, we were well positioned to improve our performance as soon as the political and economic situation started to change for the better.
The economics of the region are still diffi cult, but the potential in terms of population and volume growth is very attractive, especially if the peace process consolidates. According to external studies, the expected total beer volume growth in our key markets – Congo, Burundi, Democratic Republic of Congo (DRC), Reunion and Rwanda – should exceed 3.7 per cent per year until 2010, making this area one of the most attractive in terms of organic growth.
Heineken is widely present in these markets, with majority stakes in operations located in the area. We have a total of 13 production units for beer and soft drinks. We sell a wide portfolio of brands: Amstel, Primus® and Mutzig® are present in all the countries, together with Guinness for which we have national licences. Other key brands, like Maltina® and TurboKing® are mostly sold in Congo and DRC. In DRC we recently reopened two breweries after years of inactivity.
Consolidated volumes in the region totalled 4 million hectolitres by the end of 2006, or 1 million hectolitres higher than at the end of 2005. As a result, EBIT contribution in those countries increased by 60 per cent.
Central Africa: well positioned for growth
Irrespective of the confl ict in the country, our brewery in Lebanon remained operational. In Israel, EBIT grew slightly. Our partnership Sirocco in the United Arab Emirates continued to perform well.
We recorded excellent results in our soft drinks operations, with double-digit volume growth. These activities are mainly based in the sub-Saharan region, Israel and Egypt.
In December, we acquired 49.99 per cent of the shares in the Tunisian company, Société de Production et de Distribution des Boissons S.A. (SPDB) in Tunisia. This joint-venture company will invest in the construction of a new brewery, which is expected to be operational early 2008, and will brew and distribute Heineken and local mainstream brands in Tunisia.
Heineken N.V.Annual Report 2006 39

Nigeria
Consolidated beer volume 7.1 million hectolitres Market share 64.6 per cent Market position 1
The economic growth in the country is very strong, driven in part by the increase of oil prices during the last two years. As a result, consumption trends are on the rise and the beer industry is benefi ting.
Volumes of Nigerian Breweries soared by more than 11 per cent, back on track after large price increases implemented in late 2004. All major brands with the exception of Gulder® posted double-digit growth, with Amstel up by 56 per cent, and Star, our biggest mainstream brand, exceeding 3 million hectolitres. Heineken brand performance was also brilliant, up almost 50 per cent.
Revenues at Nigerian Breweries surged at almost double-digit rates, driven by strong volumes. EBIT improved for the second year in a row. This result was also achieved thanks to savings in variable costs and the positive currency contribution, as Naira was appreciated against the Euro.
Report of the Executive Board continued
Regional Review
continued
Trends were equally positive at Consolidated Breweries of Nigeria, which recorded 32 per cent growth in volumes and an increase in EBIT and which relaunched the “33”® and Hi-malt® brands.

Egypt
Consolidated beer volume 1.1 million hectolitres Market share 95.9 per cent Market position 1
The business in Egypt was affected by the political situation, and lower tourist fl ows. In this diffi cult context, Al-Ahram managed to increase its beer volumes by almost 6 per cent and its soft drink volumes by 7.3 per cent. The Heineken brand grew well from a low base.
In 2006, a major restructuring took place throughout the company.
Restructuring costs affected EBIT, which was lower than last year. The volume of Fayrouz® was lower as a result of 25 per cent price increase, but the brand developed well in its export markets.
The brand was introduced in Nigeria, Morocco, the United Arab Emirates and Saudi Arabia, and further roll-outs are planned.
To meet demand Heineken produces the malt-based adult soft drink Fayrouz. Fayrouz differs from other soft drinks in that its production avoids fermentation, so alcohol is never produced.
Heineken N.V.Annual Report 2006 41

2002
2003
2004
2005
2006
Consolidated beer volumeIn millions of hectolitres
4.7
4.8
5.3
6.0
6.4
Report of the Executive Board continued
Regional Review
continued
Heineken’s history in Asia Pacifi c stretches back some 75 years. We remain committed to increasing our market share in this important region through a strategy of acquisitions and organic growth in key, fast-growing countries.
In a large part of the region Heineken works through Asia Pacifi c Breweries, its joint venture with Fraser and Neave. Heineken has fully-owned operations in Indonesia and New Caledonia and we export the Heineken brand to Taiwan, Hong Kong, South Korea and other markets in the region. In addition, we enjoy successful partnerships in some of the region’s large beer markets, such as those with Kirin in Japan and Lion Nathan in Australia. Looking forward, we will strive to increase our share of the regional beer markets and profi t pools by growing organically and through selective value-creating acquisitions.
Revenues grew by more than 11 per cent. Consolidated volumes increased 7 per cent, to 6.4 million hectolitres. EBIT rose 29 per cent to €95 million as a result of higher beer sales and despite higher marketing and personnel costs, the latter mainly as a result of the expansion of the business.
The Heineken brand further extended its leadership of the international premium segment, growing volumes steadily throughout much of the region, up more than 10 per cent to 3.5 million hectolitres. The Heineken brand achieved particularly strong volume growth in Taiwan, Vietnam, Indonesia, South Korea and Australia.
Tiger, Asia’s leading beer brand, continues to expand its worldwide network and is now available in 60 countries, including Australia, Europe, the Russian Federation, the UK and US. Tiger is the leading Asian imported beer brand in the United Kingdom in terms of volume and increased its visibility and sales in the US after signing a new distribution agreement.
Innovation is one of the drivers behind our revenue and profi t expansion in the region. We introduced new brands, beer types and packaging
Asia Pacifi c
“ We have always been committed to the region for the long-term. Whilst our organic growth in the region continues to be strong, we actively seek opportunities to grow our business, especially in the relatively untapped beer markets. In the long-term, we aim at signifi cantly increasing our share of the rapidly growing regional profi t pool.”
Siep Hiemstra, President Heineken Asia Pacifi c
Revenue €0.6 billion
EBIT€94.5 million
EBIT (BEIA)€94.5 million
Consolidated beer volume6.4 million hectolitres
Heineken group volume3.5 million hectolitres
Heineken N.V.Annual Report 200642

Signifi cant success Heineken maintained its position in the premium segment by engaging consumers in innovative and creative consumer connection programmes. Our Heineken brand has generated signifi cant success in Thailand, New Zealand, Vietnam, China, Singapore and Malaysia.
Today, the beer consumption in India is tiny relative to the size of the country and the population of more than 1 billion. The market size is a mere 8 million hectolitres and the consumption per capita less then 1 litre.
The traditional alcoholic beverage in India is whisky. Also, strict regulation limits the opportunities to transport beer across the country. However, there are signs the tide is turning: beer consumption has grown at double-digit rates over the last fi ve years.
The developing young middle class has an increasing taste for beer and the purchasing power to buy it. In addition, beer better suits the warm climate than spirits. And unlike in China, the price level is healthy and the consumer has a clear understanding of premium beer. Deregulation is also gaining momentum. The key beer consuming states are Andhra Pradesh (13 per cent of the market in terms of value), Maharashtra (16 per cent of market value), Tamil Nadu, Karnataka, Rajasthan and Uttar Pradesh.
Through Asia Pacifi c Breweries, Heineken entered India, purchasing a majority stake in Aurangabad Breweries, which owns a brewery in Aurangabad, Maharashtra. We also created a company, Asia Pacifi c Breweries-Pearl Private Ltd., with the aim to build a new brewery in Hyderabad, Andhra Pradesh, with an initial capacity of 250,000 hectolitres. Imported Heineken beer is already available in India.
in several markets. In May 2006, Australia became the second market to launch the new premium Amstel Pulse brand. As part of our efforts to encourage greater consumer interest in Hong Kong, the fi rst cases of the new embossed Heineken cans were delivered to outlets in October in 33 centilitre and 55 centilitre formats and in a range of multi-pack presentations. DraughtKeg is available in Southeast Asia.
New activities in India
Heineken N.V.Annual Report 200643

Singapore
Asia Pacifi c Breweries (Singapore) continues to be the largest player in the market. Beer volumes (including export) were up 7 per cent. Tiger brand volumes were higher. We re-designed the brand’s logo and TigerLive, a multi-sensory brand entertainment centre opened in December. Heineken brand volumes were stable. EBIT was slightly higher despite an increase in marketing investments.
We launched APB’s Archipelago Brewery range of specialty beers in the market, including Traveller’s Wheat®, Straits Pale® and Trader’s Ale®.
Malaysia
The Malaysian market was affected by yet another year in which excise duty was increased, resulting in weaker trading and lower volumes and causing the total beer market to shrink by 8 per cent. However, with higher marketing investments to build stronger relationships, Guinness Anchor Berhad’s volume was down by 2 per cent.
China
In China, profi t in the beer market continued to be hurt by fi erce competition, low selling prices and high overcapacity levels. In terms of hectolitres, China is the largest beer market in the world but in terms of profi t, this market continues to be relatively small.
Heineken Asia Pacifi c Breweries China (HAPBC, the APB vehicle managing the Chinese operation) grew high single-digits and EBIT became positive, helped by the improvement in Hainan and Shanghai and the contribution by new associates. Volume of the Heineken brand increased by 9.8 per cent. HAPBC operates 12 breweries in Hainan, Shanghai, Guang Dong, Jiangsu and Tianji through its subsidiaries and associates. Three more breweries are under construction. Jiangsu DaFuHao is in the process of building two more breweries. APB’s stake in Jiangsu DaFuHao in China was increased from 40 to 49 per cent.
In 2006 several new beers were introduced including Reeb Antarktik, Reeb Ice beer and Reeb 1841 Pilsner. The volume of the Reeb brand grew by 6 per cent in Shanghai.
Vietnam
The growth of the profi table Vietnamese beer market continued unabated. The Heineken brand developed well and volumes were up by 20 per cent, bringing the total Heineken volume in Vietnam close to the 1 million hectolitre mark. EBIT grew as a result of the better volumes and an increase in price for Heineken in cans implemented at the end of 2005.
Asia Pacifi c Breweries extended its market coverage with the acquisition of Foster’s breweries in Danang in Central Vietnam and in Tien Giang on the north of the Mekong Delta. In January 2007, APB also acquired the assets of Quang Nam Brewery in Central Vietnam. The acquisition makes the company a strong number-two player in the market with national coverage. The deals also expanded our portfolio in Vietnam with the brands Foster’s® lager and Biere Larue®, BGI®, Flag®, Song Han®, Larger® and Larue®. These brands will help increase our market share in the international premium and national mainstream segment. During the year we introduced locally-brewed Coors Light®, completing our range of international premium beers.
Thailand
The development of the beer market in Thailand was hampered by stricter government rules on the selling, distribution and advertising of alcoholic beverages. Heineken continues to be the beer of choice in the premium segment despite the fact that the operating environment in Thailand became more restrictive with new regulations. Total volumes were up by 6 per cent but EBIT was lower as a result of marketing investments in building the Cheers® brand, the new local mainstream brand introduced in 2005.
Report of the Executive Board continued
Regional Review
continued
Heineken N.V.Annual Report 200644

New Zealand
Fierce discounting by our competitors in New Zealand resulted in lower volumes and reduced EBIT. In addition, the New Zealand dollar fell against the Euro by 9 per cent. Growth of the Heineken brand remained steady as the premium beer segment continued to expand in 2006. The company has also developed plans to strengthen its brands through innovation and further marketing investments.
Indonesia
The beer market in Indonesia continued to grow until an excise duty increase was introduced in November 2006. The market came under pricing pressure due to discounting activities by a competitor. Volumes and EBIT at Multi Bintang Indonesia increased and the company maintained its leading position in the market. The Heineken brand enjoyed very strong growth.
Other markets in Asia Pacifi c
In July we held the ground-breaking ceremony for the new Laos brewery, which will be operational by 2007.
Papua New Guinea had an excellent year with 13 per cent-higher volumes, slightly better pricing and good cost management resulting in a substantially improved EBIT.
In Australia, the international premium beer segment continued to grow. Heineken brand volumes rose 33 per cent. Heineken beer is now produced locally by our partner Lion Nathan.
In Taiwan, the Heineken brand performed exceptionally well, with a volume increase of 36 per cent as a result of improvements in the economy and excellent performance by the Taiwan team, that made Heineken the favourite international beer in Taiwan.
Volumes in Cambodia continued to develop well and EBIT increased.
Strong position P.T. Multi Bintang Indonesia was able to increase volume and maintain its leading position in the market.
45Heineken N.V.Annual Report 2006

Risk management and control system The Heineken risk management and control systems are aimed at a reasonable level of assurance, that the risks of the Company are identifi ed and managed and that the operational and fi nancial objectives are met, in compliance with applicable laws and regulations. A system of controls to ensure adequate fi nancial reporting is included. Heineken’s internal control system is based on the COSO Internal Control Framework.
Risk profi le Heineken is a single-product company, with a high level of commonality in its worldwide business operations spread over many mature and emerging markets. The worldwide activities are exposed to varying degrees of risk and uncertainty, some of which, if not identifi ed and managed, may result in a material impact on a particular operating company, but may not materially affect the group as a whole.
Risk management Doing business inherently involves taking risks, and by managing these risks Heineken strives to be a sustainable and performance driven company. Business risk assessments are part of Heineken’s business planning and performance monitoring process, which was further structured in 2006. Operational risks are mainly managed through the progressing embedding of Key Controls based on Heineken common processes and systems. The risk management and control systems are considered to be in balance with Heineken’s risk profi le, although such systems can never provide absolute assurance. Following Heineken’s continuing growth and changing risk profi le, the Company’s risk management and control systems are subject to continuous review and adaptations.
Responsibilities The Executive Board, under the supervision of the Supervisory Board, has overall responsibility for Heineken’s risk management and control systems. Regional and operating company management are responsible for managing performance, underlying risks and effectiveness of operations, within the Rules set by the Executive Board, supported and supervised by group departments.
Heineken Company Rules In 2006, the Heineken Company Rules on the various functional areas were reviewed and updated. Group departments further strengthened their monitoring activities.
Business planning and performance monitoring The main pillar of Heineken’s internal governance activities is the business planning and performance monitoring process. Operating companies strategy, business plan and quarterly performance are discussed with Regional Management. Regional performance is discussed with the Executive Board. The approved business plans include clear objectives, performance indicators and target setting, which provide the basis for monitoring performance compared to plan. In 2006, the process of planning and reporting were further streamlined and aligned to the regional management structure introduced in 2005.
Risk management
Report of the Executive Board continued
Managing risks is explicitly on the agenda of the management in order to protect the business from the effects of disasters, failures and reputational damage. Continuity and sustainability of the business is as important to stakeholders as growing and operating it.
Heineken N.V.Annual Report 200646
Internal control in operating companies Heineken is progressing on the group-wide development and implementation of uniform processes, common IT systems and control frameworks based on best practices. At the end of 2006, 71 per cent of Heineken’s operations (based on revenue) work in accordance with the evolving Heineken common system. In developing and implementing common systems, risk assessments were included and controls established or adjusted. These internal controls ensure the integrity of the information processing in supporting the day-to-day transactions and fi nancial and management reporting. In 2006, further progress was made on establishing and using Heineken best practice Key Control Frameworks for testing and further improving controls in the operations.
Code of Business Conduct and Whistleblowing After the introduction of the Code of Business Conduct and Whistleblowing Procedure two years ago, almost the whole group has implemented their local policies and procedures at the end of 2006. The whistleblowing implementation is to be fi nalised in 2007. The Corporate offi ce is closely monitoring the implementation and effectiveness. The Integrity Committee oversees the functioning of whistleblowing and issued two reports to the Executive Board and the Audit Committee in the year under review on effectiveness of the procedure and reported cases.
Supervision The Executive Board oversees the adequacy and functioning of the entire system of risk management and internal control, assisted by Group departments. Group Internal Audit provides independent assurance on the entire risk management and internal control system.
The Assurance Meetings at operating company and regional level, oversee the adequacy and operating effectiveness of the risk management and internal control system. Regional Management and Group Internal Audit participate in these meetings to ensure effective dialogue and transparency.
The outcome and effectiveness of the risk management and internal control systems have been discussed with the Audit Committee of the Supervisory Board.
Financial reporting The risk management and control system over fi nancial reporting contains clear accounting rules and a standard chart of accounts. The Heineken common systems, as implemented in almost the entire group in terms of turnover, support common accounting and regular fi nancial reporting in standard forms.
The worldwide external audit activities – which are based on local statutory requirements, and therefore more detailed than necessary for the audit of the Heineken N.V. consolidated fi gures – provide additional assurance on fair presentation of fi nancial reporting on operating company level. Within the parameters of their fi nancial audit assignment, external auditors also report on internal control issues through their management letters and attend local and regional Assurance Meetings.
Considering Heineken’s risk management and control system described in this section, the fi nancial reporting is adequately designed and worked effectively in the year under review in providing reasonable assurance that the 2006 fi nancial statements do not contain any material inaccuracies. This statement cannot be construed as a statement in accordance with the requirements of Section 404 of the US Sarbanes-Oxley Act, which is not applicable to Heineken N.V.
Heineken N.V.Annual Report 2006 47
Main risks Under the explicit understanding that this is not an exhaustive list, Heineken’s major strategic, operational, fi nancial and regulatory risks are described below, including the risk mitigation measures in place or planned enhancements.
Strategic risks Heineken brand perception and Company reputation As both the group and its most valuable brand carry the same name, reputation management is of utmost importance. Heineken enjoys a positive corporate reputation and our operating companies are well respected in their region. Constant management attention is directed towards enhancing Heineken’s social, environmental and fi nancial reputation. The Heineken brand is key to Heineken’s growth strategy and is the most valuable asset of the Company. Anything that adversely affects consumer and stakeholder confi dence in the Heineken brand or Company could have a negative impact on the overall business.
The Company reputation and sales could be damaged by product integrity issues. Therefore, production and logistics are subject to rigorous quality standards and monitoring procedures, which are further strengthened in 2006. Brand perception is managed by strict marketing control procedures. A Code of Business Conduct and Whistleblowing Procedure aim to prevent any unethical and irresponsible behaviour by the Company or its employees. Reference is made to Heineken’s Sustainability Report 2006 for reviewing Heineken’s priorities in the area of social responsibility supporting Company reputation.
Pressure on alcohol An increasingly negative perception in society towards alcohol could prompt legislators to introduce restrictive measures. Limitations in advertising and availability could lead to a decrease in sales and damage the industry in general. Sales of Heineken products could materially decrease.
Heineken’s Alcohol Policy is based on the principle to produce, market, and sell beer in ways that have a positive impact on society at large. With this policy, Heineken promotes awareness of the advantages and disadvantages of alcohol, encouraging informed consumers to be accountable for their own actions. In 2006 the launching of the ‘Enjoy Heineken Responsibly’ programme (a responsibility message on back labels directing consumers to a dedicated website) in Heineken’s markets was fi nalised. Markets are becoming more and more engaged to promote responsible consumption, in partnership with third parties. The alcohol policy compliance monitoring was strengthened in 2006.
In 2006 the European Commission announced the creation of an EU Forum on alcohol, similar to their approach on obesity. The role of the industry has been acknowledged and developments around the issue are closely monitored.
Attractiveness of beer category under pressure Heineken has many operations in mature – mainly Western European – beer markets where the attractiveness of the beer category is being challenged by other beverage categories. In }these markets, management focus is on product innovation, portfolio management and cost-effectiveness in order to secure market position and profi tability. Since Heineken is acquiring new businesses in emerging markets, the relative dependency on profi tability from mature markets will decline over time.
Risk management
continued
Report of the Executive Board continued
Heineken N.V.Annual Report 200648
Stability Africa & Middle East Region In the Africa & Middle East Region volume growth is driven by economic growth in Nigeria and the Middle East and continued stability and economic growth in Central Africa. Compared to previous years the Region is in most areas at peace, with some uncertainty coming up in Nigeria due to the elections in 2007. The situation in Lebanon remains fragile which could escalate further in the Middle East and could affect our operations in Egypt and the United Arab Emirates.
Operational risks Reorganisations from Fit2Fight Heineken’s Fit2Fight programme has the objective to reduce fi xed costs versus 2005 by €200 million net of infl ation by the end of 2008. Reorganisation projects that will save €450 million by the end of 2008 (after infl ation) have been identifi ed, mainly in supply chain, wholesale and support functions in Europe. There is risk that due to social unrest, the production quality and supply continuity are affected, negatively impacting fi nancial performance and Company reputation.
The operating companies concerned will manage the reorganisation projects with care; the right speed, alignment with relevant industrial and external relations and consistent communication to employees. Contingency plans have been put in place. Total restructuring and other costs are estimated at €325 to 375 million before tax.
Acquisitions and business integration In the pursuit of further expansion, Heineken seeks to strike a balance between organic and acquired growth within the limits of a conservative fi nancing structure. In acquisitions, specifi cally in emerging markets, Heineken will be faced with different cultures, business principles and political, economic and social environments. This may affect corporate values, image and quality standards. It may also impact the realization of long-term business plans including synergy objectives, underlying the value of newly acquired companies.
In order to mitigate these risks, Heineken has further strengthened its business development and integration activities, which includes signifi cant involvement from relevant group departments, operating companies and regional management in carrying out effective due diligence processes and preparing take charge and integration plans.
Business continuity Business interruptions could affect sales and market shares. These are not considered a major risk due to the relative size and spread of operations. An exception is the supply of beer products from the Netherlands to the USA, one of Heineken’s most profi table markets. Contingency measures are in place, and Heineken’s group purchasing department manages long-term contracts with preferred suppliers in order to secure supply of critical raw and packaging materials. Monitoring business continuity risks was further structured in 2006, including on the launch of Heineken Premium Light in the USA.
IT security Heineken’s worldwide operations rely increasingly on information systems.
Heineken has a strict IT security policy to ensure confi dentiality, integrity and availability of information. Tools are used to support compliance with that policy and compliance monitoring is applied. A more structured IT auditing approach is implemented in 2006. Progressing centralisation of IT systems and infrastructure has a positive impact on ensuring IT security measures.
Heineken N.V.Annual Report 2006 49

Report of the Executive Board continued
Risk management
continued
Financial risks Currency risks Heineken operates internationally and reports in Euros. Currency fl uctuations, especially relating to the US Dollar, could materially affect overall Company results. Heineken has a clear policy on hedging transactional exchange risks, which postpones the impact on fi nancial results. Translation exchange risks are not hedged. The sensitivity on the fi nancial results with regard to currency risks are explained on page 107.
Capital availability and liquidity risks There could be insuffi cient capital generated in order to fi nance the long-term growth.
Suffi cient access to capital is ensured to fi nance long-term growth and to keep pace with the consolidation of the global beer market. Financing strategies are under continuous evaluation. Strong cost and cash management and strong controls over investment proposals are in place to ensure effective and effi cient allocation of fi nancial resources.
Regulatory risks Tax Heineken and its operating companies are subject to a variety of local excise and other tax regulations. The EU Council did not adopt the Commission proposal to adapt the minimum excise rate for beer with the rate of infl ation. This adjustment would have lead to increases in some European markets. The developments surrounding this issue are continuously monitored.
In principle, Heineken’s sales prices are adjusted to refl ect changes in the rate of excise duty, but increased rates may have a negative impact on sales volume.
Litigation Due to increasing legislation there is an increased possibility of non-compliance. Additionally, more supervision by regulators and the growing claim culture may potentially increase the impact of
non-compliance, both fi nancially and on the reputation of the Company. Therefore, various Heineken Company Rules and monitoring measures are in place to enable compliance with laws and regulations. Every half year all majority- owned companies formally report outstanding claims and litigations against the Company in access of €1 million to Group Legal Affairs, including an assessment of the amounts to be provided for.
Heineken is defending itself against two main accusations: one from the European Commission on restricting competition in the Netherlands during the second half of the 1990s, and one on unlawfully advertising and marketing products to underage people in the USA. These two cases are further explained on page 111.
There may be current risks that the Company has not fully assessed, and are currently identifi ed as not having a signifi cant impact on the business but which could – in a later stage – develop a material impact on the Company’s business. The Company’s risk management systems are focused on timely discovery of such incidents.
Heineken N.V.Annual Report 200650
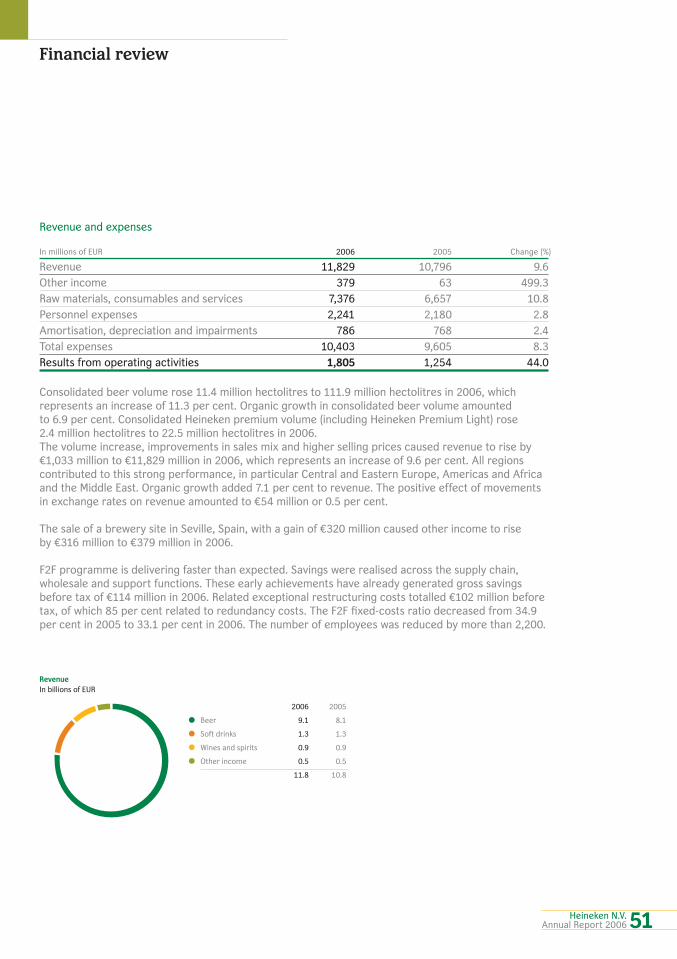
2006 2005
• Beer 9.1 8.1
• Soft drinks 1.3 1.3
• Wines and spirits 0.9 0.9
• Other income 0.5 0.5
11.8 10.8
RevenueIn billions of EUR
Financial review
Revenue and expenses
In millions of EUR 2006 2005 Change (%)
Revenue 11,829 10,796 9.6
Other income 379 63 499.3
Raw materials, consumables and services 7,376 6,657 10.8
Personnel expenses 2,241 2,180 2.8
Amortisation, depreciation and impairments 786 768 2.4
Total expenses 10,403 9,605 8.3
Results from operating activities 1,805 1,254 44.0
Consolidated beer volume rose 11.4 million hectolitres to 111.9 million hectolitres in 2006, which represents an increase of 11.3 per cent. Organic growth in consolidated beer volume amounted to 6.9 per cent. Consolidated Heineken premium volume (including Heineken Premium Light) rose 2.4 million hectolitres to 22.5 million hectolitres in 2006. The volume increase, improvements in sales mix and higher selling prices caused revenue to rise by €1,033 million to €11,829 million in 2006, which represents an increase of 9.6 per cent. All regions contributed to this strong performance, in particular Central and Eastern Europe, Americas and Africa and the Middle East. Organic growth added 7.1 per cent to revenue. The positive effect of movements in exchange rates on revenue amounted to €54 million or 0.5 per cent.
The sale of a brewery site in Seville, Spain, with a gain of €320 million caused other income to rise by €316 million to €379 million in 2006.
F2F programme is delivering faster than expected. Savings were realised across the supply chain, wholesale and support functions. These early achievements have already generated gross savings before tax of €114 million in 2006. Related exceptional restructuring costs totalled €102 million before tax, of which 85 per cent related to redundancy costs. The F2F fi xed-costs ratio decreased from 34.9 per cent in 2005 to 33.1 per cent in 2006. The number of employees was reduced by more than 2,200.
Heineken N.V.Annual Report 2006 51
Report of the Executive Board continued
Financial review
continued
Raw materials, consumables and services expenses increased by 10.8 per cent, which were mainly caused by higher packaging material, marketing and selling and energy expenses. Marketing and selling expenses increased organically by 9.2 per cent and remained stable at 12.6 per cent of revenue and refl ects our continuous marketing investments efforts in various markets in 2006. Next to the volume increase, the introduction of the clear plastic label was the main cause for the rise in packaging material expenses, whilst the increase in oil and gas prices was the main cause for the rise in energy and water expenses by 22.9 per cent.
Personnel expenses increased by 2.8 per cent, including €79 million exceptional restructuring charges.
As such, total expenses increased less than revenue and rose by 8.3 per cent to €10,403 million. The effect of movements in exchange rates had an insignifi cant impact on total operating expenses of 0.3 per cent or €35 million.
EBIT and profi t attributable to equity holders of the Company (net profi t)
In millions of EUR EBIT Net profi t
2005 1,283 761
Organic growth 149 106
Changes in consolidation 9 (15)
Effects of movements in exchange rates 19 (1)
Exceptional items and amortisation of brands 372 360
2006 1,832 1,211
EBIT and net profi t In 2006 EBIT amounts to €1,832 million compared to €1,283 million in 2005, heavily impacted by exceptionals of which the sale of the land and brewery in Seville, Spain and related expenses were important contributors. 2006 EBIT beia of €1,569 million compared to the 2005 EBIT beia of €1,392 million represents an organic growth of €10.7 per cent.
EBIT as a proportion of revenue increased to 15.5 per cent from 11.9 per cent.
The positive €19 million impact of movements in exchange rates is considerably higher than previous years, due to the stable US Dollar compared to 2005 and our hedging policy.
The effective tax rate decreased from 26.6 per cent to 22.0 per cent in 2006, mainly due to sale of real estate in Spain, which is taxed at a lower tax rate due to re-investment facilities and recognition of previously recognized deferred tax assets as a result of fi nalisation of local tax rulings in 2006. Without these exceptional tax gains, the tax burden would have been 27.3 per cent compared to 26.6 per cent in 2005.
Basic earnings per share increased from €1.55 to €2.47 as a result of higher net profi t.
Heineken N.V.Annual Report 200652

1997
1998
1999
2000
2001
2002
2003
2004
2005
2006
574
703
1,170
1,323
1,330
1,369
1,283
980
850
1,832
EBIT performanceIn millions of EUR
2002
2003
2004
2005
2006
696
481
611
615
705
853
844
719
560
706
Property, plant & equipment, investments and depreciationIn millions of EUR
• Investments
• Depreciation
Results
In millions of EUR 2006 2005 Change (%)
Result from operating activities 1,805 1,254 44.0
Share of profi t of associates 27 29 (6.9)
EBIT 1,832 1,283 42.7
Net fi nance expenses (122) (114) 7.0
Profi t before tax 1,710 1,169 46.2
Income tax expense (365) (300) 21.7
Profi t 1,345 869 54.8
Minority interests (134) (108) 23.2
Net profi t 1,211 761 59.1
Cash fl ow
In millions of EUR 2006 2005
Cash fl ow from operating activities 1,849 1,872
Cash fl ow from investing activities (799) (1,194)
Cash fl ow from fi nancing activities (649) (592)
401 86
Cash fl ow and investments Cash fl ow from operating activities decreased by €23 million to €1,849 million in 2006, as the substantially increased profi t was more than offset by higher income taxes paid. These higher taxes were due to a refund of €70 million taxes in 2005.
Heineken N.V.Annual Report 200653

2002
2003
2004
2005
2006
38.9
35.8
34.6
38.2
42.5
Total equity as a percentage of total assets
2002
2003
2004
2005
2006
52.7
74.0
84.8
66.7
40.0
GearingNet debt as a percentage of Shareholders’ equity
Report of the Executive Board continued
Purchase of property, plant and equipment was on a slightly lower level compared to 2005. Proceeds from the sale of property, plant and equipment amounted to €182 million versus €161 million in 2005. A net amount of €72 million in 2006 was invested in acquisitions and expansion of existing interests, compared to €460 million in 2005. In 2005 we invested €730 million of which €530 million in Russia. As part of the divestment of non-core assets we sold amongst others our real estate business in Austria, which resulted in a total cash infl ow of €270 million in 2005.
Net cash fl ow increased strongly to €401 million compared to €86 million in 2005. This was mainly due to the decline in cash fl ow from acquisitions amounting to €388 million. This decline was partly offset by higher cash fl ow from fi nancing activities of €57 million, largely due to higher dividend payments of €23 million and purchase of own shares of €14 million in connection with our long-term incentive plan for our Executive Board and Senior Management.
Financing structure
In millions of EUR 2006 % 2005 %
Total equity 5,520 42 4,514 38
Deferred tax liabilities 471 4 393 3
Employee benefi ts 665 5 664 6
Provisions 242 2 273 2
Other liabilities 6,099 47 5,985 51
12,997 100 11,829 100
Financial review
continued
Heineken N.V.Annual Report 200654

Financing and liquidity As at 31 December 2006, total equity increased by €1,006 million to €5,520 million, whilst equity attributable to equity holders of the Company increased with €1,040 million to €5,009. The total recognised income and expense attributable to equity holders of the Company of €1,246 million were offset by dividend distribution of €196 million, the purchase of own shares of €14 million and the share based payments of €4 million.
The net interest-bearing debt position improved with €734 million to €1,913 million as at 31 December 2006, in line with the strong generation of cash fl ow.
Profi t appropriation Heineken N.V.’s profi t (attributable to shareholders of the Company) in 2006 amounted to €1,211 million. In accordance with Article 12, paragraph 7, of the Articles of Association, the Annual General Meeting of Shareholders will be invited to appropriate an amount of €294 million for distribution as dividend. This proposed appropriation corresponds to a dividend of €0.60 per share of €1.60 nominal value, on account of which an interim dividend of €0.16 was paid on 20 September 2006. The fi nal dividend thus amounts to €0.44 per share. Dutch withholding tax will be deducted from the fi nal dividend at 15 per cent. It is proposed that the remaining €917 million be added to retained earnings.
Heineken N.V.Annual Report 200655

The issued share capital of Heineken N.V. amounts to €783,959,350.40, consisting of 489,974,594 shares of €1.60 each. Each share carries one vote. The shares are listed on Euronext Amsterdam.
The shares are freely transferable.
Pursuant to the Financial Markets Supervision Act (Wet op het fi nancieel toezicht) and the Decree on Disclosure of Major Holdings and Capital Interests in Securities-Issuing Institutions (Besluit melding zeggenschap en kapitaalbelang in uitgevende instellingen), the Authority Financial Markets has been notifi ed about the following substantial shareholdings regarding Heineken N.V.:
• Mrs. C.L. de Carvalho-Heineken (indirectly 50.047 per cent; the direct 50.047 per cent shareholder is Heineken Holding N.V.);
• ING Group N.V. (indirectly 5.40 per cent; the direct 5.40 per cent shareholder is a subsidiary of ING Group N.V.).
All shares carry equal rights.
There are share-based long-term incentive plans for both the Executive Board members and senior management. Eligibility for participation is based on objective criteria. Each year, performance shares are awarded to the participants. Depending on the fulfi lment of certain predetermined performance conditions during a three-year performance period, the performance shares will vest and the participants will receive real Heineken N.V. shares. In principle, the shares required for the share-based long-term incentive plans will be repurchased by Heineken N.V. The transfer of shares to the participants requires the approval of the Supervisory Board of Heineken N.V.
Shares repurchased by Heineken N.V. for the share-based long-term incentive plans do not carry any voting rights and dividend rights. As regards other Heineken N.V. shares, there are no restrictions on voting rights. Shareholders who hold shares on a predetermined record date are
entitled to attend and vote at General Meetings of Shareholders. The record date for the General Meeting of Shareholders of 19 April 2007 is 7 days before the General Meeting of Shareholders, i.e. on 12 April 2007.
As far as known to Heineken N.V., there is no agreement involving a shareholder of Heineken N.V. that could lead to a restriction of the transferability of shares or of voting rights on shares.
Members of the Supervisory Board and the Executive Board are appointed by the General Meeting of Shareholders on the basis of a non-binding nomination by the Supervisory Board. The General Meeting of Shareholders can dismiss members of the Supervisory Board and the Executive Board by a majority of the votes cast, if the subject majority at least represents one-third of the issued capital.
The Articles of Association can be amended by resolution of the General Meeting of Shareholders in which at least half of the issued capital is represented and exclusively either at the proposal of the Supervisory Board or at the proposal of the Executive Board which has been approved by the Supervisory Board, or at the proposal of one or more Shareholders representing at least half of the issued capital.
On 20 April 2005, the General Meeting of Shareholders authorised the Executive Board (which authorisation was renewed on 20 April 2006 for the statutory maximum period of 18 months), to repurchase shares subject to the following conditions and with due observance of the law and the Articles of Association (which require the approval of the Supervisory Board):
a. the maximum number of shares which may be repurchased is the statutory maximum of 10 per cent of the issued share capital of Heineken N.V.;
b. repurchase transactions must be executed at a price between the nominal value of the shares
Corporate Governance
Report of the Executive Board continued
Information pursuant to Decree Article 10 Takeover Directive (Besluit artikel 10 Overnamerichtlijn).
Heineken N.V.Annual Report 200656
and 110 per cent of the opening price quoted for the shares in the Offi cial Price List (Offi ciële Prijscourant) of Euronext Amsterdam on the date of the repurchase transaction or, in the absence of such a price, the latest price quoted therein;
c. repurchase transactions may be executed on the stock exchange or otherwise.
The authorisation to repurchase shares may be used mainly in connection with the share-based long-term incentive plans for both the Executive Board members and senior management, but may also serve other purposes, such as in connection with acquisitions. A further renewal of the authorisation will be submitted for approval to the General Meeting of Shareholders of 19 April 2007.
On 20 April 2005, the General Meeting of Shareholders also authorised the Executive Board (which authorisation was renewed on 20 April 2006 for a period of 18 months) to issue (rights) to shares and to restrict or exclude shareholders’ pre-emption rights, with due observance of the law and Articles of Association (which require the approval of the Supervisory Board). The authorisation is limited to 10 per cent of Heineken N.V.’s issued share capital, as per the date of issue. The authorisation may be used in connection with share-based long-term incentive plans for both the Executive Board members and senior management, but may also serve other purposes, such as in connection with acquisitions. A further renewal of the authorisation will be submitted for approval to the General Meeting of Shareholders of 19 April 2007.
There are no important agreements to which Heineken N.V. is a party and that will come into force, be amended or be terminated under the condition of a change of control over Heineken N.V. as a result of a public offer.
There are no agreements of Heineken N.V. with Executive Board members or other employees that entitle them to any compensation rights upon termination of their employment after completion of a public offer on Heineken N.V. shares.
Heineken N.V.Annual Report 2006 57

The Annual Meeting of Shareholders of 20 April 2005 sanctioned the way Heineken deals with the Code and in particular the non-compliance with a limited number of best practice provisions. Below are the best practice provisions not (fully) applied, or applied with explanation. The full Comply or Explain report was published in February 2003 and is available at www.heinekeninternational.com
II.1.1 An Executive Board member is appointed for a maximum period of four years. A member may be reappointed for a term of not more than four years at a time. Members of the Executive Board who have been appointed before 31 December 2003 have been appointed for an indefi nite period. This best practice provision cannot be applied, as it violates the law.
II.2.7 The maximum remuneration in the event of dismissal is one year’s salary (the ‘fi xed’ remuneration component). If the maximum of one year’s salary would be manifestly unreasonable for a member of the Executive Board who is dismissed during his fi rst term of offi ce, such board member shall be eligible for a severance pay not exceeding twice the annual salary. In the contracts of the members of the Executive Board there is no mention of a specifi c scheme in the event of dismissal. This best practice provision will not be applied as it violates the law.
III.2.1 All Supervisory Board members, with the exception of not more than one person, shall be independent within the meaning of best practice provision III.2.2. Heineken endorses the principle and Heineken considers the members of the Supervisory Board as independent. In a strictly formal sense, however, three members of the Supervisory Board do not meet the applicable criteria.
III.2.2 A Supervisory Board member shall be deemed to be independent if the following criteria of dependence do not apply to him. The said criteria are that the Supervisory Board member concerned or his wife, registered partner or other life companion, foster child or relative by blood or marriage up to the second degree:
a. has been an employee or member of the management board of the company (including associated companies as referred to in section 1 of the Disclosure of Major Holdings in Listed Companies Act (WMZ) 1996) in the fi ve years prior to the appointment; Mr. De Jong was prior to his appointment in 2002 member of the Board of Directors of Heineken Holding N.V. for one year. According to this criterion Mr. De Jong would not be independent. With reference to criterion f., which contains an exception for management board positions in a group company, Heineken does not consider this as an impediment to Mr. De Jong being independent.
b. receives personal fi nancial compensation from the company, or a company associated with it, other than the compensation received for the work performed as a Supervisory Board member and in so far as this is not in keeping with the normal course of business; Mr. Das receives from Heineken Holding N.V. a fi nancial compensation as Chairman of the Board of Directors of Heineken Holding N.V. Messrs. Van Lede and de Carvalho receive from Heineken Holding N.V. a compensation for attending the meetings of the Board of Directors of Heineken Holding N.V. These compensations are in keeping with the normal course of business. No other Supervisory Board member receives
Report of the Executive Board continued
Dutch Corporate Governance Code of December 2003
Heineken N.V. endorses the Code’s principles and applies virtually all best practice provisions. In particular, the structure of the Heineken Group – and specifi cally the relationship between Heineken Holding N.V. and Heineken N.V. – prevents Heineken N.V. from applying a small number of best practice provisions.
Heineken N.V.Annual Report 200658

personal fi nancial compensation from the company, or a company associated with it, other than the compensation received from the work performed as a Supervisory Board member.
c. has had an important business relationship with the company, or a company associated with it, in the year prior to the appointment. This includes the case where the Supervisory Board member, or the fi rm of which he is a shareholder, partner, associate or adviser, has acted as adviser to the company (consultant, external auditor, civil notary and lawyer) and the case where the supervisory board member is a management board member or an employee of any bank with which the company has a lasting and signifi cant relationship; In a strict sense Mr. Das also would not be independent, as he was a partner in a fi rm which was appointed as a consultant to Heineken N.V. the year before his appointment in 1994. However, Heineken does not consider this as an impediment to Mr. Das being independent.
e. holds at least ten per cent of the shares in the company (including the shares held by natural persons or legal entities which cooperate with him under an express or tacit, oral or written agreement); Mr. de Carvalho is married to Mrs. de Carvalho-Heineken (large shareholder and delegated member of the Board of Directors of Heineken Holding N.V.). Mrs. de Carvalho indirectly holds more than 10% of the shares in Heineken N.V. Heineken does not consider this an impediment to Mr. de Carvalho being independent.
III.2.3 The report of the Supervisory Board shall state that, in the view of the Supervisory Board members, best practice provision III.2.1 has been fulfi lled, and shall also
state which Supervisory Board member is not considered to be independent, if any. As indicated in III.2.2, in a strictly formal sense, three members of the Supervisory Board do not meet the dependence criteria as set out in best practice provision III.2.2. However, Heineken does not consider this as an impediment to Messrs. De Jong, Das and de Carvalho being independent.
III.3.4 The number of supervisory boards of Dutch listed companies of which an individual may be a member shall be limited to such an extent that the proper performance of his duties is assured; the maximum number is fi ve, for which purpose the chairmanship of a supervisory board counts double. Heineken takes the view that the decision on whether to apply this best practice provision should also be guided by the Company’s interest in terms of its ability to attract and retain skilled Supervisory Board members. Any departures for this provision will be mentioned in the annual report.
III.3.5 A person may be appointed to the Supervisory Board for a maximum of three 4-year terms. Given the structure of the Heineken group, the maximum appointment period will not be applied to members who are related by blood or marriage to the Heineken family or who are members of the Board of Directors of Heineken Holding N.V. For all other members Heineken applies the best practice provision.
III.4.1 The Chairman of the Supervisory Board shall see to it that:
a. the Supervisory Board members follow
their induction and education or training programme;
b. the Supervisory Board members receive
Heineken N.V.Annual Report 2006 59

Report of the Executive Board continued
Dutch Corporate Governance Code of December 2003
continued
in good time all information which is necessary for the proper performance of their duties;
c. there is suffi cient time for consultation
and decision-making by the Supervisory Board;
d. the committees of the Supervisory Board
function properly; e. the performance of the Executive
Board members and Supervisory Board members is assessed at least once a year;
f. the Supervisory Board elects a Vice-
Chairman; g. the Supervisory Board has proper contact
with the Executive Board and the Works Council (or Central Works Council).
Heineken applies this best practice
provision, with the exception of a part of criterion g: contact with the Central Works Council. This relates to the structure of the group. The Central Works Council operates on the level of Heineken Nederlands Beheer B.V., a subsidiary with a separate Supervisory Board
III.5.11 The Remuneration Committee shall not be chaired by the Chairman of the Supervisory Board or by a former member of the Executive Board of the company, or by a Supervisory Board member who is a member of the management board of another listed company. Given the structure of the Heineken Group and the character of the Board of Directors of Heineken Holding N.V., Heineken will not apply this best practice provision to the extent that the Remuneration Committee can be chaired by a Supervisory Board member who is
also a member of the Board of Directors of Heineken Holding N.V. Currently the Remuneration Committee is chaired by Mr. Das, who is chairman of the Board of Directors of Heineken Holding N.V.
III.6.6 A delegated Supervisory Board member is a Supervisory Board member who has a special duty. The delegation may not extend beyond the duties of the Supervisory Board itself and may not include the management of the company. It may entail more intensive supervision and advice and more regular consultation with the Executive Board. The delegation shall be of a temporary nature only. The delegation may not detract from the role and power of the Supervisory Board. The delegated Supervisory Board member remains a member of the Supervisory Board. As regulated in the Articles of Association of Heineken N.V., the delegated Supervisory Board member, a position currently held by Mr. Das (Chairman of the Board of Directors of Heineken Holding N.V.) is consistent with this best practice provision, except insofar that the position is not temporary and is held for the term for which the member concerned is appointed by the General Meeting of Shareholders of Heineken N.V. Heineken considers that, as regulated by the Articles of Association of Heineken N.V., the post of delegated Supervisory Board member, which has been in existence since 1952, befi ts the structure of the Heineken Group.
III.7.3 The Supervisory Board shall adopt a set of regulations containing rules governing ownership of and transactions in securities by Supervisory Board members, other than securities issued by their ‘own’ company. The regulations shall be posted on the company’s website. A Supervisory Board member shall give periodic notice, but in any event at least
Heineken N.V.Annual Report 200660
once a quarter, of any changes in his holding of securities in Dutch listed companies to the compliance offi cer or, if the company has not appointed a compliance offi cer, to the Chairman of the Supervisory Board. A Supervisory Board member who invests exclusively in listed investment funds or who has transferred the discretionary management of his securities portfolio to an independent third party by means of a written mandate agreement is exempted from compliance with this last provision. This best practice provision will be applied, provided, however, that the periodic notice will be given only once per year.
III.8.1 The Chairman of the management board shall not also be and shall not have been an executive director. The Chairman of the management board shall check the proper composition and functioning of the entire board. The management board shall apply chapter III.5 of this code. The committees referred to in chapter III.5 shall consist only of non-executive management board members. The majority of the members of the management board shall be non-executive directors and are independent within the meaning of best practice provision III.2.2. Heineken has a two-tier management structure. Principle III.8 and the best practice provisions do not apply to Heineken.
IV.3.8 The report of the General Meeting of Shareholders shall be made available, on request, to shareholders no later than three months after the end of the meeting, after which the shareholders shall have the opportunity to react to the report in the following three months. The report shall then be adopted in the manner provided for in the Articles of Association. A notarial record is made of the proceedings of the meeting, as provided for in the Articles of Association. Heineken considers
it desirable to continue this practice. Therefore this best practice provision will be applied to the extent that it is consistent with a notarial record. The notarial record will be available no later than three months after the meeting.
Amsterdam, 20 February 2007
Van Boxmeer
Hooft Graafl and
Heineken N.V.Annual Report 2006 61

Remuneration report
Report of the Supervisory Board continued
Remuneration structure 2006 The remuneration package of the Executive Board includes a base salary, a short-term incentive and a long-term incentive. The base salary accounts for 45 per cent of the total remuneration package when targets are achieved. The variable portion is divided equally between short-term and long-term. This ensures a balanced focus, on both short-term and long-term performance.
The Company aims to achieve consistency in the structure of the remuneration packages of both Executive Board members and senior Heineken executives. The performance-related elements in Executive Board members’ remuneration are emphasised more strongly than those of senior executives, refl ecting the principle of increasing performance sensitivity in line with the impact on Group results.
Both internal pay relativities and relevant market data are used to defi ne the remuneration package for the Executive Board. For market data, a specifi c labour market is defi ned.
Heineken operates in a highly international labour market and is headquartered in the Netherlands. Consequently, the reference for market data is primarily other Dutch multinational companies (75 per cent). To refl ect the specifi c business of Heineken a minority of Continental European companies that operate in the branded consumer products markets are included (25 per cent). The labour market peer group consists of the following companies: Akzo Nobel, DSM, Reed Elsevier, Royal Ahold, Royal KPN, Royal Numico, TNT, Unilever, VNU, Wolters Kluwer, InBev, Henkel, L’Oréal and Nestlé.
Base salary For the members of the Executive Board, the remuneration policy includes a base salary at the median level of the labour market peer group. The base salary for the CEO is set at 30 per cent above the base salary for the other members of the Executive Board. In 2006 the base salaries
were adjusted in line with policy: CEO €680,000 and other Executive Board members €525,000.
Annual bonus The emphasis of the annual bonus is on annual operational performance. Organic net profi t growth is the measure to assess the operational performance of Heineken on a one-year basis and accounts for 75 per cent of the bonus opportunity. At target level, the annual bonus level for the CEO is €422,500 and for the other members of the Executive Board €325,000.
Each year, the Supervisory Board determines an ambitious, yet realistic organic net profi t growth target. The threshold level of payout is set at 60 per cent of the target level of payout. A linear pay-out curve applies. The maximum payout will not exceed 1.4 times the target bonus level. Part of the payout is subject to meeting an acceptable cash conversion rate.
The remaining 25 per cent of the annual bonus is linked to yearly targets. The specifi c targets are commercially sensitive and cannot be disclosed.
Long-term incentive The long-term incentive plan for the Executive Board, as per 1 January 2005, is a performance share plan. A similar plan was implemented for senior management in 2006.
Each year a number of performance shares are conditionally awarded, the vesting of which is subject to meeting a stretching performance target after three years. The value of the performance shares at target level is €422,500 for the CEO and €325,000 for the other members of the Executive Board.
The Executive Board performance share allocation at target level is as follows:
• for the year starting 1 January 2005, based on the share price at 31 December 2004 of €24.53, 17,224 performance shares for the
The remuneration policy and structure refl ects the strategic ambitions of the Company, takes into account internal and external circumstances and preserves the highest standards of good corporate citizenship. The policy seeks to maintain a tight focus on the strategic short-term and long-term results. The policy was adopted in the Annual General Meeting of Shareholders in 2005. A review of the policy is conducted every two years.
Heineken N.V.Annual Report 200662

CEO and 13,250 for the other Executive Board members. These will vest, subject to the fulfi lment of the performance condition, in 2008.
• for the year starting 1 January 2006, based on the share price at 31 December 2005 of €26.78, 15,777 shares for the CEO and 12,136 shares for the other Executive Board members. These will vest, subject to the fulfi lment of the performance condition, in 2009.
The performance condition is total shareholder return, measured over a three-year period, relative to a performance peer group. The performance peer group is different from the labour market peer group and includes companies with which Heineken competes for shareholder preference. It is composed of other brewers, but also includes European companies operating in the branded consumer products market. The performance peer group consists f the following companies: Anheuser-Busch, Carlsberg, InBev, SABMiller, Scottish & Newcastle, Henkel, L’Oréal, LVMH, Nestlé, Numico and Unilever.
If, over a three-year period, Heineken performs better than the median of the peer group a proportion of the performance shares will vest. These vested shares are subject to a holding restriction of two years. Below median, no performance shares will vest. At sixth position, 25 per cent of the target amount will vest. A linear vesting schedule applies, with 50 per cent of the target number vesting at fi fth position and 75 per cent at fourth position. At third position, the target number will vest. If Heineken is ranked fi rst, the maximum number of performance shares will vest. This is 1.5 times the target amount of shares. At the end of 2006 for the performance period 2005-07 Heineken was ranked 5th. For the performance period 2006-08 Heineken was ranked 2nd (at the end of 2005, for the performance period 2005-07 Heineken was ranked eleventh).
Heineken will acquire the shares that will be required for vesting.
Contracts The contracts of the Executive Board are for an indefi nite period of time. The general notice period is 6 months for the Company and 3 months for the members of the Executive Board. There is no specifi c scheme in the event of dismissal. As stated in the Comply or Explain Report (February 2005), on the basis of the Dutch Corporate Governance Code, provision II.2.7 cannot be complied with as it violates the law.
Shares held by the Executive Board As at 31 December 2006, the members of the Executive Board did not hold directly any of the Company’s shares, convertible bonds or option rights. One of the Executive Board members held 3,052 shares of Heineken Holding N.V. as per 31 December 2006.
Agreements with former Executive Board member(s) An arrangement was made with Mr. Bolland, who left the company as per 1 August 2006. Mr. Bolland was compensated with an amount of €2,550,000, refl ecting his 20 years of service within the company. Furthermore, his salary, including his short-term bonus (set at target level) for 2006 was fi xed at €850,000 gross (with a pro-rated payment over 1 January–1 August 2006). The vesting of the performance shares awarded to him in 2005 and in 2006 will be pro-rated over the period in service during the relative performance period. The vesting awarded to him will occur in 2008 and 2009 respectively, according to the fulfi lment of the performance condition.
In the annual report over the fi nancial year 2005 a description was given of the agreements with Messrs. Ruys and Büche. At the end of 2006 their long-term bonuses were calculated. The amounts of the bonuses are stated on page 112.
Heineken N.V.Annual Report 200663

Remuneration Supervisory Board The amounts paid to the members of the Supervisory Board are stated on page 112 of the fi nancial statements. These amounts came into force as per 2006.
Shares held by the Supervisory Board As at 31 December 2006, one of the Supervisory Board members holds 8 shares in Heineken N.V. The other Supervisory Board members do not hold any of the Company’s shares, convertible bonds or option rights. Three Supervisory Board members together held 9,508 shares of Heineken Holding N.V. as at 31 December 2006.
Remuneration policy as from 2007 A proposal will be submitted to the Annual General Meeting of Shareholders to revise the remuneration policy, such revision to have effect as from 2007. The amended remuneration policy refl ects the organisational structure and the strategic ambitions.
The proposed changes in the policy are:
Base salary The CEO will be paid at market median of the labour market peer group. In 2005 and 2006 the CEO was paid 30 per cent above the level of the other Executive Board members. There is no change to the median pay policy for the other members of the Executive Board. This represents €750,000 for the CEO and €550,000 for the CFO.
Annual bonus and long-term incentive In practice the median of the labour market peer group has moved towards greater variable pay. For 2007 this will be refl ected in the increase of target annual bonus and target long-term incentive for the CEO from 62 per cent to 100 per cent and for the CFO from 62 per cent to 75 per cent.
The maximum annual bonus will change from 1.4 times target annual bonus to 1.5 times target annual bonus, in line with the fi gures for the long-term incentive plan. The effect of the variable compensation changes is to make the package
more performance sensitive. In 2005, at target level, base salary accounted for 45 per cent of the CEO’s remuneration package. In the revised policy (as from 2007) it will account for only 33 per cent. For the CFO the fi gures are 45 per cent and 40 per cent respectively.
The value of performance shares at target level is equivalent to 100 per cent of base salary for the CEO, and 75 per cent for the CFO. Based on the share price as per 31 December 2006 of €36.03 this corresponds at target level to 20,816 performance shares for the CEO and 11,449 performance shares for the CFO. These will vest, subject to the fulfi lment of the performance conditions in 2010.
Peer group The labour market peer group will be adjusted. Philips N.V. replaces VNU as the change in ownership of VNU renders the inclusion in Heineken’s labour market peer group no longer appropriate. Philips is the most suitable company to replace VNU.
Pensions As from 2006 a new pension policy has been introduced for current and future members of the Executive Board, refl ecting the Netherlands market and Netherlands legislative changes. The arrangements are based on the principle of defi ned contribution. The policy aims to provide for a secure income after retirement. Executive Board members can choose to participate in the Defi ned Contribution Plan or to allocate, within the fi scal rules, the amounts into a Capital Creation option. In the Defi ned Contribution Plan, apart from the survivor’s pension, a separate lump sum of two times base salary will be paid in the event of death whilst in service.
In the Capital Creation option the Executive Board member may elect to receive as income the Defi ned Contribution premium amounts from the pension scheme, less an amount equivalent to the employee contribution. Instead of a survivor’s pension, a lump sum of, depending on age, ten,
Report of the Supervisory Board continued
Remuneration report
continued
Heineken N.V.Annual Report 200664
eight, six or four times base salary will be paid, in the event of death whilst in service.
The retirement age is 65, but individual Executive Board members may retire earlier with a reduced level of benefi t. Contribution rates are designed to enable the current Executive Board member to retire from the Company at the age of 62.
Supervisory Board Heineken N.V.
20 February 2007
Heineken N.V.Annual Report 200665

Financial Statements
67 Consolidated income statement68 Consolidated statement of recognised income
and expense69 Consolidated balance sheet70 Consolidated statement of cash fl ows72 Notes to the consolidated fi nancial statements116 Heineken N.V. balance sheet117 Heineken N.V. income statement118 Notes to Heineken N.V. fi nancial statements
66Heineken N.V.Annual Report 2006

In millions of EUR Note 2006 2005*
Revenue 5 11,829 10,796
Other income 7 379 63
Raw materials, consumables and services 8 7,376 6,657
Personnel expenses 9 2,241 2,180
Amortisation, depreciation and impairments 10 786 768
Total expenses 10,403 9,605
Results from operating activities 1,805 1,254
Interest income 52 60
Interest expenses (185) (199)
Other net fi nance income 11 11 25
Net fi nance expenses (122) (114)
Share of profi t of associates 27 29
Profi t before income tax 1,710 1,169
Income tax expense 12 (365) (300)
Profi t 1,345 869
Attributable to:
Equity holders of the Company (net profi t) 1,211 761
Minority interest 134 108
Profi t 1,345 869
Weighted average number of shares – basic 23 489,712,594 489,974,594
Weighted average number of shares – diluted 23 489,974,594 489,974,594
Basic earnings per share 23 2.47 1.55
Diluted earnings per share 23 2.47 1.55
* Restated for comparison purposes, see note 3 signifi cant accounting policies.
Consolidated income statement For the year ended 31 December 2006
Financial Statements
Heineken N.V.Annual Report 2006 67

Financial Statements continued
In millions of EUR Note 2006 2005
Foreign currency translation differences for foreign operations (84) 201
IFRS transitional adjustments prior year (10) –
Transition to IAS 32 and 39: Change in hedging and fair value reserve – 67 Change in retained earnings – (23)
Cash fl ow hedges: Effective portion of changes in fair value 50 (63)
Net changes in fair value transferred to the income statement – 7
Net change in fair value available for sale investments 48 17
Income and expense recognised directly in equity 22 4 206
Profi t 1,345 869
Total recognised income and expense 1,349 1,075
Attributable to:
Equity holders of the Company 1,246 909
Minority interest 103 166
Total recognised income and expense 1,349 1,075
Consolidated statement of recognised income and expense For the year ended 31 December 2006
Heineken N.V.Annual Report 200668

In millions of EUR Note 2006 2005
Assets
Property, plant & equipment 13 4,944 5,067
Intangible assets 14 2,449 2,380
Investments in associates 15 186 172
Other Investments 16 786 646
Deferred tax assets 17 395 286
Total non-current assets 8,760 8,551
Inventories 18 893 883
Other Investments 16 12 23
Trade and other receivables 19 1,917 1,787
Cash and cash equivalents 20 1,374 585
Assets classifi ed as held for sale 21 41 –
Total current assets 4,237 3,278
Total assets 12,997 11,829
Equity
Share capital 784 784
Reserves 666 568
Retained earnings 3,559 2,617
Equity attributable to equity holders of the company 22 5,009 3,969
Minority interests 511 545
Total equity 5,520 4,514
Liabilities
Loans and borrowings 25 2,091 2,233
Employee benefi ts 26 665 664
Provisions 28 242 273
Deferred tax liabilities 17 471 393
Total non–current liabilities 3,469 3,563
Bank overdraft 25 747 351
Loans and borrowings 25 494 709
Trade and other payables 29 2,496 2,451
Tax liabilities 149 141
Provisions 28 122 100
Total current liabilities 4,008 3,752
Total liabilities 7,477 7,315
Total equity and liabilities 12,997 11,829
Consolidated balance sheet As at 31 December 2006
Heineken N.V.Annual Report 2006 69

Financial Statements continued
In millions of EUR Note 2006 2005*
Operating activities
Profi t 1,345 869
Adjustments for:
Depreciation, amortisation and impairments 10 786 768
Net interest expenses 133 139
Gain on sale of property, plant & equipment, intangible assets and subsidiaries, joint ventures and associates 7 (379) (63)
Investment income and share of profi t of associates (40) (42)
Income tax expense 12 365 300
Other non-cash items 285 368
Cash fl ow from operations before changes in working capital and provisions 2,495 2,339
Change in inventories (50) (18)
Change in trade and other receivables 46 (76)
Change in trade and other payables 102 208
Total change in working capital 98 114
Change in provisions and employee benefi ts (211) (240)
Cash fl ow from operations 2,382 2,213
Interest paid & received (138) (141)
Dividend received 13 20
Income taxes paid (408) (220)
Cash fl ow used for interest, dividend and income tax (533) (341)
Cash fl ow from operating activities 1,849 1,872
Investing activities
Proceeds from sale of property, plant & equipmentand intangible assets 182 161
Purchase of property, plant & equipment 13 (844) (853)
Purchase of intangible assets 14 (33) (21)
Loans and advances issued to customers and other investments (166) (152)
Repayment on loans and advances to customers 134 131
Cash fl ow used in operational investing activities (727) (734)
Acquisition of subsidiaries, joint ventures, minority interests and associates, net of cash acquired (113) (730)
Disposal of subsidiaries, joint ventures, minority interests and associates, net of cash disposed 41 270
Cash fl ow used for acquisitions and disposals (72) (460)
Cash fl ow used in investing activities (799) (1,194)
Consolidated statement of cash fl ows For the year ended 31 December 2006
Heineken N.V.Annual Report 200670

In millions of EUR Note 2006 2005*
Financing activities
Proceeds from long-term borrowings 262 363
Repayment of long-term borrowings (578) (700)
Dividends paid (294) (271)
Purchase own shares 22 (14) –
Other (25) 16
Cash fl ows used in fi nancing activities (649) (592)
Net Cash Flow 401 86
Cash and cash equivalents at 1 January 234 161
Effect of movements in exchange rates (8) (13)
Cash and cash equivalents at 31 December 20 627 234
* Restated for comparison purposes, see note 3 signifi cant accounting policies.
Heineken N.V.Annual Report 2006 71

Financial Statements continued
1 Reporting entity Heineken N.V. (the ‘Company’) is a company domiciled in the Netherlands. The address of the Company’s registered offi ce is Vijzelstraat 72, Amsterdam. The consolidated fi nancial statements of the Company as at and for the year ended 31 December 2006 comprise the Company and its subsidiaries (together referred to as ‘Heineken’ or the ‘Group’) and Heineken’s interest in joint ventures and associates.
A summary of the main subsidiaries, joint ventures and associates is included in note 34, 35 and 15.
Heineken is primarily involved in brewing and selling of beer.
2 Basis of preparation (a) Statement of compliance The consolidated fi nancial statements have been prepared in accordance with International Financial Reporting Standards (IFRS) as endorsed by the EU and also comply with the fi nancial reporting requirements included in Part 9 of Book 2 of the Netherlands Civil Code.
The fi nancial statements have been prepared by the Executive Board of the Company and authorised for issue on 20 February 2007 and will be submitted for approval to the Annual General Meeting of Shareholders on 19 April 2007.
(b) Basis of measurement The consolidated fi nancial statements have been prepared on the historical cost basis except for the following assets and liabilities:
• available-for-sale investments are measured at fair value • investments at fair value through profi t and loss are measured at fair value • derivative fi nancial instruments are measured at fair value • liabilities for equity-settled share-based payment arrangements are measured at fair value
The methods used to measure fair values are discussed further in note 4.
(c) Functional and presentation currency These consolidated fi nancial statements are presented in Euro, which is the Company’s functional currency. All fi nancial information presented in Euro has been rounded to the nearest million.
(d) Use of estimates and judgements The preparation of fi nancial statements requires management to make judgements, estimates and assumptions that affect the application of accounting policies and the reported amounts of assets and liabilities, income and expenses. Actual results may differ from these estimates.
Estimates and underlying assumptions are reviewed on an ongoing basis. Revisions to accounting estimates are recognised in the period in which the estimate is revised and in any future periods affected.
In particular, information about signifi cant areas of estimation uncertainty and critical judgements in applying accounting policies that have the most signifi cant effect on the amount recognised in the fi nancial statements are described in the following notes:
• Note 6 business combinations. • Note 14 measurement of the recoverable amounts of cash-generating units. • Note 17 utilisation of tax losses. • Note 26 measurement of defi ned benefi t obligations. • Note 27 measurement of share-based payments – Long-Term Incentive Plan. • Note 28 and 32 provisions and contingencies. • Note 30 valuation of fi nancial instruments.
Notes to the consolidated fi nancial statements
Heineken N.V.Annual Report 200672

3 Signifi cant accounting policies The accounting policies set out below have been applied consistently to all periods presented in these consolidated fi nancial statements and have been applied consistently by Heineken entities.
The adoption in 2005 of IAS 32 and 39 fi nancial instruments by Heineken and its effect on the balance sheet as at 1 January 2005 is disclosed in note 24.
Certain comparative amounts have been reclassifi ed to conform with current year’s presentation of geographical segmentation (see note 5) and of gains and losses on sale of property, plant & equipment, intangible assets and subsidiaries, joint ventures and associates (see note 7).
(a) Basis of consolidation (i) Subsidiaries Subsidiaries are entities controlled by Heineken. Control exists when Heineken has the power, directly or indirectly, to govern the fi nancial and operating policies of an entity so as to obtain benefi ts from its activities. In assessing control, potential voting rights that presently are exercisable or convertible are taken into account. The fi nancial statements of subsidiaries are included in the consolidated fi nancial statements from the date that control commences until the date that control ceases. Accounting policies have been changed where necessary to ensure consistency with the policies adopted by Heineken.
(ii) Associates Associates are those entities in which Heineken has signifi cant infl uence, but not control, over the fi nancial and operating policies. The consolidated fi nancial statements include Heineken’s share of the total recognised income and expenses of associates on an equity-accounted basis, from the date that signifi cant infl uence commences until the date that signifi cant infl uence ceases. When Heineken’s share of losses exceeds the carrying amount of the associate, the carrying amount is reduced to nil and recognition of further losses is discontinued except to the extent that Heineken has an obligation or has made a payment on behalf of the associate.
(iii) Joint ventures Joint ventures are those entities over whose activities Heineken has joint control, established by contractual agreement and requiring unanimous consent for strategic fi nancial and operating decisions. The consolidated fi nancial statements include Heineken’s proportionate share of the entities’ assets, liabilities, revenue and expenses with items of a similar nature on a line-by-line basis, from the date that joint control commences until the date that joint control ceases.
(iv) Transactions eliminated on consolidation Intra-Heineken balances and transactions, and any unrealised gains and losses or income and expenses arising from intra-Heineken transactions, are eliminated in preparing the consolidated fi nancial statements. Unrealised income arising from transactions with associates and joint ventures are eliminated to the extent of Heineken’s interest in the entity. Unrealised expenses are eliminated in the same way as unrealised income, but only to the extent that there is no evidence of impairment.
(b) Foreign currency (i) Foreign currency transactions Transactions in foreign currencies are translated to the respective functional currencies of Heineken entities at the exchange rates at the dates of the transactions. Monetary assets and liabilities denominated in foreign currencies at the balance sheet date are retranslated to the functional currency at the exchange rate at that date. The foreign currency gain or loss arising on monetary items is the difference between amortised cost in the functional currency at the beginning of the period, adjusted for effective interest and payments during the period, and the amortised cost in foreign currency translated at the exchange rate at the end of the period. Non-monetary assets and liabilities denominated in foreign currencies that are measured at fair value are retranslated to the functional currency at the exchange rate at the date that the fair value was determined. Foreign currency differences arising on retranslation are recognised in the income statement, except for
Heineken N.V.Annual Report 2006 73
Financial Statements continued
Notes to the consolidated fi nancial statements
continued
differences arising on the retranslation of available-for-sale (equity) investments. Non-monetary assets and liabilities denominated in foreign currencies that are measured at cost remain translated into the functional currency at historical exchange rates.
(ii) Foreign operations The assets and liabilities of foreign operations, including goodwill and fair value adjustments arising on consolidation, are translated to Euro at exchange rates at the balance sheet date. The revenue and expenses of foreign operations are translated to Euro at exchange rates approximating the exchange rates ruling at the dates of the transactions.
Foreign currency differences are recognised directly in equity as a separate component. Since 1 January 2004, the date of transition to IFRS, such differences have been recognised in the translation reserve. The cumulative currency differences at the date of transition to IFRS were deemed to be zero. When a foreign operation is disposed of, in part or in full, the relevant amount in the translation reserve is transferred to the income statement.
The following exchange rates, for most important countries in which Heineken has operations, were used while preparing these fi nancial statements:
Year end Average In EUR 2006 2005 2006 2005
CLP 0.001423 0.001651 0.001502 0.001442
EGP 0.133333 0.148588 0.138910 0.139265
NGN 0.005910 0.006464 0.006217 0.006137
PLN 0.261097 0.259081 0.256988 0.248562
RUB 0.028825 0.029416 0.029323 0.028442
SGD 0.495050 0.510204 0.501968 0.483394
USD 0.758380 0.845380 0.797258 0.804366
(c) Non-derivative fi nancial instruments (i) General Non-derivative fi nancial instruments comprise investments in equity and debt securities, trade and other receivables, cash and cash equivalents, loans and borrowings, and trade and other payables.
Non-derivative fi nancial instruments are recognised initially at fair value plus, for instruments not at fair value through profi t or loss, any directly attributable transaction costs, except as described below. Subsequent to initial recognition non-derivative fi nancial instruments are measured as described below.
A fi nancial instrument is recognised if Heineken becomes a party to the contractual provisions of the instrument. Financial assets are derecognised if Heineken’s contractual rights to the cash fl ows from the fi nancial assets expire or if Heineken transfers the fi nancial asset to another party without retaining control or substantially all risks and rewards of the asset. Regular way purchases and sales of fi nancial assets are accounted for at trade date, i.e., the date that Heineken commits itself to purchase or sell the asset. Financial liabilities are derecognised if Heineken’s obligations specifi ed in the contract expire or are discharged or cancelled.
Cash and cash equivalents comprise cash balances and call deposits. Bank overdrafts that are repayable on demand and form an integral part of Heineken’s cash management are included as a component of cash and cash equivalents for the purpose of the statement of cash fl ows.
Accounting for interest income and expenses and net fi nance expenses is discussed in note 3(o).
3 Signifi cant accounting policies continued
Heineken N.V.Annual Report 200674

(ii) Held to maturity investments If Heineken has the positive intent and ability to hold debt securities to maturity, they are classifi ed as held-to-maturity. Debt securities are loans and long-term receivables and are measured at amortised cost using the effective interest method, less any impairment losses. Investments held-to-maturity are recognised or derecognised on the day they are transferred to/by Heineken.
Held to maturity investments include advances and loans to customers of Heineken.
(iii) Available-for-sale investments Heineken’s investments in equity securities and certain debt securities are classifi ed as available-for-sale. Subsequent to initial recognition, they are measured at fair value and changes therein, except for impairment losses (see note 3h(i)), and foreign exchange gains and losses on available-for-sale monetary items (see note 3b(i)), are recognised directly in equity, When these investments are derecognised, the cumulative gain or loss previously recognised directly in equity is recognised in the income statement. Where these investments are interest bearing, interest calculated using the effective interest method is recognised in the income statement. Available-for-sale investments are recognised/derecognised by Heineken on the date it commits to purchase/sell the investments.
(iv) Investments at fair value through profi t or loss An investment is classifi ed as at fair value through profi t or loss if it is held for trading or is designated as such upon initial recognition. Investments are designated at fair value through profi t or loss if Heineken manages such investments and makes purchase and sale decisions based on their fair value. Upon initial recognition, attributable transactions costs are recognised in the income statement when incurred.
Investments at fair value through profi t or loss are classifi ed as current assets and are measured at fair value, with changes therein recognised in the income statement. Investments at fair value through profi t and loss are recognised/derecognised by Heineken on the date it commits to purchase/sell the investments.
(v) Share capital – repurchase of share capital When share capital recognised as equity is repurchased, the amount of the consideration paid, including directly attributable costs, is recognised as a deduction from equity. Repurchased shares are classifi ed as treasury shares and are presented in the reserve for own shares.
(d) Derivative fi nancial instruments (i) General Heineken uses derivative fi nancial instruments to hedge its exposure to foreign currency and interest rate risks exposures.
Derivative fi nancial instruments are recognised initially at fair value, with attributable transaction cost recognised in the income statement as incurred. Derivatives for which hedge accounting is not applied are accounted for as instruments at fair value through profi t or loss. When derivatives qualify for hedge accounting, subsequent measurement is at fair value, and changes therein accounted for as described in note 3d(ii).
The fair value of interest rate swaps is the estimated amount that Heineken would receive or pay to terminate the swap at the balance sheet date, taking into account current interest rates and the current creditworthiness of the swap counter parties.
(ii) Cash fl ow hedges Changes in the fair value of the derivative hedging instrument designated as a cash fl ow hedge are recognised directly in equity to the extent that the hedge is effective. To the extent that the hedge is ineffective, changes in fair value are recognised in the income statement.
Heineken N.V.Annual Report 2006 75
Financial Statements continued
Notes to the consolidated fi nancial statements
continued
If the hedging instrument no longer meets the criteria for hedge accounting, expires or is sold, terminated or exercised, then hedge accounting is discontinued and the cumulative unrealised gain or loss recognised in equity is recognised in the income statement immediately. When a hedging instrument is terminated, but the hedged transaction still is expected to occur, the cumulative gain or loss at that point remains in equity and is recognised in accordance with the above-mentioned policy when the transaction occurs. When the hedged item is a non-fi nancial asset, the amount recognised in equity is transferred to the carrying amount of the asset when it is recognised. In other cases the amount recognised in equity is transferred to the income statement in the same period that the hedged item affects the income statement.
(iii) Economic hedges Hedge accounting is not applied to derivative instruments that economically hedge monetary assets and liabilities denominated in foreign currencies. Changes in the fair value of such derivatives are recognised in the income statement as part of foreign currency gains and losses.
(e) Property, Plant and Equipment (P, P & E) (i) Owned assets Items of property, plant and equipment are measured at cost less government grants received (refer iv), accumulated depreciation (refer v) and impairment losses (refer accounting policy 3h(ii)).
Cost comprises the initial purchase price increased with expenditures directly attributable to the acquisition of the asset (like transports and non-recoverable taxes). The cost of self-constructed assets includes the cost of materials and direct labour and any other costs directly attributable to bringing the asset to a working condition for its intended use (like an appropriate proportion of production overheads).
Spare parts that are acquired as part of an equipment purchase and only to be used in connection with this specifi c equipment are initially capitalised and amortised as part of the equipment.
Where an item of property, plant and equipment comprises major components having different useful lives, they are accounted for as separate items of property, plant and equipment.
(ii) Leased assets Leases in terms of which Heineken assumes substantially all the risks and rewards of ownership are classifi ed as fi nance leases. Upon initial recognition P, P & E acquired by way of fi nance lease is measured at an amount equal to the lower of its fair value and the present value of the minimum lease payments.
Other leases are operating leases and are not recognised on Heineken’s balance sheet.
(iii) Subsequent expenditure The cost of replacing part of an item of property, plant and equipment is recognised in the carrying amount of the item if it is probable that the future economic benefi ts embodied within the part will fl ow to Heineken and its cost can be measured reliably. The costs of the day-to-day servicing of property, plant and equipment are recognised in the income statement as incurred.
(iv) Government grants Government grants related to plant, property and equipment and grants relating to research and development activities are recognised when it is reasonably assured that Heineken will comply with the conditions attaching to them and the grants will be received.
3 Signifi cant accounting policies continued
Heineken N.V.Annual Report 200676

(v) Depreciation Depreciation is charged to the income statement on a straight-line basis over the estimated useful lives of items of property, plant and equipment, and major components that are accounted for separately. Land and assets under construction are not depreciated. The estimated useful lives are as follows:
• Buildings 30-40 years • Plant and equipment 10-30 years • Other fi xed assets 5-10 years The depreciation methods, residual value as well as the useful lives are reassessed annually.
(vi) Gains and losses on sale Gains and losses on sale of items of P, P & E, are presented in the income statement as other income. Gains and losses are recognised in the income statement when the signifi cant risks and rewards of ownership have been transferred to the buyer, recovery of the consideration is probable, the associated costs can be estimated reliably, and there is no continuing management involvement with the P, P & E.
(f) Intangible assets (i) Goodwill Goodwill arises on the acquisition of subsidiaries and joint ventures and represents the excess of the cost of the acquisition over Heineken’s interest in net fair value of the net identifi able assets, liabilities and contingent liabilities of the acquiree.
Goodwill arising on the acquisition of associates is included in the carrying value of the associate.
In respect of acquisitions prior to 1 October 2003, goodwill is included on the basis of deemed cost, being the amount recorded under previous GAAP.
Goodwill on acquisitions purchased before 1 January 2003 has been deducted from equity.
Goodwill arising on the acquisition of a minority interest in a subsidiary represents the excess of the cost of the additional investment over the carrying amount of the net assets acquired at the date of exchange.
Goodwill is measured at cost less accumulated impairment losses (refer accounting policy 3h(ii)). Goodwill is allocated to cash-generating units and is tested annually for impairment. In respect of associates, the carrying amount of goodwill is included in the carrying amount of the associate.
Negative goodwill is recognised directly in the income statement.
(ii) Brands Brands acquired, separately, or as part of a business combination are capitalised as part of a brand portfolio if the portfolio meets the defi nition of an intangible asset and the recognition criteria are satisfi ed. Brand portfolios acquired as part of a business combination include the customer base related to the brand because it is assumed that brands have no value without a customer base and vice versa. Brand portfolios acquired as part of a business combination are valued at fair value based on the royalty relief method. Brands and brand portfolio’s acquired separately are measured at cost. Brands and brand portfolio’s are amortised on a straight-line basis over their estimated useful life.
Heineken N.V.Annual Report 200677

Financial Statements continued
Notes to the consolidated fi nancial statements
continued
(iii) Software, research and development and other intangible assets Purchased software is measured at cost less accumulated amortisation (refer v) and impairment losses (refer accounting policy 3h(ii)). Expenditure on internally developed software is capitalised when the expenditure qualifi es as development activities, otherwise it is recognised in the income statement when incurred.
Expenditure on research activities, undertaken with the prospect of gaining new technical knowledge and understanding, is recognised in the income statement when incurred.
Development activities involve a plan or design for the production of new or substantially improved products and processes. Development expenditure is capitalised only if development costs can be measured reliably, the product or process is technically and commercially feasible, future economic benefi ts are probable, and Heineken intends to and has suffi cient resources to complete development and to use or sell the asset. The expenditure capitalised includes the cost of materials, direct labour and overhead costs that are directly attributable to preparing the asset for its intended use. Other development expenditure is recognised in the income statement when incurred.
Capitalised development expenditure is measured at cost less accumulated amortisation (refer v) and accumulated impairment losses (refer accounting policy 3h(ii)).
Other intangible assets that are acquired by Heineken are measured at cost less accumulated amortisation (refer v) and impairment losses (refer accounting policy 3h(ii)). Expenditure on internally generated goodwill and brands is recognised in the income statement when incurred.
(iv) Subsequent expenditure Subsequent expenditure is capitalised only when it increases the future economic benefi ts embodied in the specifi c asset to which it relates. All other expenditure is expensed when incurred.
(v) Amortisation Amortisation is charged to the income statement on a straight-line basis over the estimated useful lives of intangible assets, other than goodwill, from the date they are available for use. The estimated useful lives are as follows:
• Brands 15-25 years • Software 3 years • Capitalised development costs 3 years (vi) Gains and losses on sale Gains and losses on sale of intangible assets, are presented in the income statement as other income. Gains and losses are recognised in the income statement when the signifi cant risks and rewards of ownership have been transferred to the buyer, recovery of the consideration is probable, the associated costs can be estimated reliably, and there is no continuing management involvement with the intangible assets.
(g) Inventories (i) General Inventories are measured at the lower of cost and net realisable value, based on the First In First Out principle and includes expenditure incurred in acquiring the inventories and bringing them to their existing location and condition. Net realisable value is the estimated selling price in the ordinary course of business, less the estimated costs of completion and selling expenses.
(ii) Finished products and work in progress Finished products and work in progress are measured at manufacturing cost based on weighted averages and takes into account the production stage reached. Costs include an appropriate share of direct production overheads based on normal operating capacity.
3 Signifi cant accounting policies continued
Heineken N.V.Annual Report 200678

(iii) Other inventories and spare parts The cost of other inventories is based on weighted averages.
Spare parts are valued at the lower of cost and net realisable value. Value reductions and usage of parts are charged to the income statement. Spare parts that are acquired as part of an equipment purchase and only to be used in connection with this specifi c equipment are initially capitalised and amortised as part of the equipment.
(h) Impairment (i) Financial assets A fi nancial asset is considered to be impaired if objective evidence indicates that one or more events have had a negative effect on the estimated future cash fl ows of that asset.
An impairment loss in respect of a fi nancial asset measured at amortised cost is calculated as the difference between its carrying amount, and the present value of the estimated future cash fl ows discounted at the original effective interest rate. An impairment loss in respect of an available-for-sale fi nancial asset is calculated by reference to its current fair value.
Individually signifi cant fi nancial assets are tested for impairment on a individual basis. The remaining fi nancial assets are assessed collectively in groups that share similar credit risk characteristics.
All impairment losses are recognised in the income statement. Any cumulative loss in respect of an available-for-sale fi nancial asset recognised previously in equity is transferred to the income statement.
An impairment loss is reversed if the reversal can be related objectively to an event occurring after the impairment loss was recognised. For fi nancial assets measured at amortised cost and available-for-sale fi nancial assets that are debt securities, the reversal is recognised in the income statement. For available-for-sale fi nancial assets that are equity securities, the reversal is recognised directly in equity.
(ii) Non-fi nancial assets The carrying amounts of Heineken’s non-fi nancial assets, other then inventories (refer accounting policy g) and deferred tax assets (refer accounting policy p), are reviewed at each reporting date to determine whether there is any indication of impairment. If any such indication exists then the asset’s recoverable amount is estimated. For goodwill and intangible assets that have indefi nite lives or that are not yet available for use, recoverable amount is estimated at each reporting date.
An impairment loss is recognised if the carrying amount of an asset or its cash-generating unit exceeds its recoverable amount. A cash-generating unit is the smallest identifi able asset group that generates cash fl ows that largely are independent from other assets and groups. Impairment losses are recognised in the income statement. Impairment losses recognised in respect of cash-generating units are allocated fi rst to reduce the carrying amount of any goodwill allocated to the units and then to reduce the carrying amount of the other assets in the unit (group of units) on a pro rata basis.
The recoverable amount of an asset or cash-generating unit is the greater of its value in use and its fair value less costs to sell. In assessing value in use, the estimated future cash fl ows are discounted to their present value using a pre-tax discount rate that refl ects current market assessments of the time value of money and the risks specifi c to the asset.
An impairment loss in respect of goodwill is not reversed. In respect of other assets, impairment losses recognised in prior periods are assessed at each reporting date for any indications that the loss has decreased or no longer exists. An impairment loss is reversed if there has been a change in the estimates used to determine the recoverable amount. An impairment loss is reversed only to the extent that the asset’s carrying amount does not exceed the carrying amount that would have been determined, net of depreciation or amortisation, if no impairment loss had been recognised.
Heineken N.V.Annual Report 2006 79
Financial Statements continued
Notes to the consolidated fi nancial statements
continued
(i) Assets held for sale Non-current assets (or disposal groups comprising assets and liabilities) that are expected to be recovered primarily through sale rather than through continuing use are classifi ed as held for sale. Immediately before classifi cation as held for sale, the assets (or components of a disposal group) are remeasured in accordance with Heineken’s accounting policies. Thereafter the assets (or disposal group) are measured at the lower of their carrying amount and fair value less cost to sell. Any impairment loss on a disposal group fi rst is allocated to goodwill, and then to remaining assets and liabilities on a pro rata basis, except that no loss is allocated to inventories, fi nancial assets, deferred tax assets and employee benefi t assets, which continue to be measured in accordance with Heineken’s accounting policies. Impairment losses on initial classifi cation as held for sale and subsequent gains or losses on remeasurement are recognised in the income statement. Gains are not recognised in excess of any cumulative impairment loss.
(j) Employee benefi ts (i) Defi ned contribution plans Obligations for contributions to defi ned contribution pension plans are recognised as an expense in the income statement when they are due.
(ii) Defi ned benefi t plans Heineken’s net obligation in respect of defi ned benefi t pension plans is calculated separately for each plan by estimating the amount of future benefi t that employees have earned in return for their service in the current and prior periods; that benefi t is discounted to determine its present value, and any unrecognised past service costs and the fair value of any plan assets are deducted. The discount rate is the yield at balance sheet date on AA rated bonds that have maturity dates approximating the terms of Heineken’s obligations.
The calculations are performed by qualifi ed actuaries using the projected unit credit method. Where the calculation results in a benefi t to Heineken, the recognised asset is limited to the net total of any unrecognised actuarial losses and past service costs and the present value of any future refunds from the plan or reductions in future contributions to the plan.
When the benefi ts of a plan are improved, the portion of the increased benefi t relating to past service by employees is recognised as an expense in the income statement on a straight-line basis over the average period until the benefi ts become vested. To the extent that the benefi ts vest immediately, the expense is recognised immediately in the income statement.
In respect of actuarial gains and losses that arise, Heineken applies the corridor method in calculating the obligation in respect of a plan. To the extent that any cumulative unrecognised actuarial gain or loss exceeds ten per cent of the greater of the present value of the defi ned benefi t obligation and the fair value of plan assets, that portion is recognised in the income statement over the expected average remaining working lives of the employees participating in the plan. Otherwise, the actuarial gain or loss is not recognised.
(iii) Other long-term employee benefi ts Heineken’s net obligation in respect of long-term employee benefi ts, other than pension plans, is the amount of future benefi t that employees have earned in return for their service in the current and prior periods; that benefi t is discounted to determine its present value, and the fair value of any related assets is deducted. The discount rate is the yield at balance sheet date on high-quality credit-rated bonds that have maturity dates approximating the terms of Heineken’s obligations. The obligation is calculated using the projected unit credit method.
(iv) Termination benefi ts Termination benefi ts are recognised as an expense when Heineken is demonstrably committed, without realistic possibility of withdrawal, to a formal detailed plan to terminate employment before the normal retirement date. Termination benefi ts for voluntary redundancies are recognised
3 Signifi cant accounting policies continued
Heineken N.V.Annual Report 200680

if Heineken has made an offer encouraging voluntary redundancy, it is probable that the offer will be accepted, and the number of acceptances can be estimated reliably.
(v) Share-based payment plan (long-term incentive plan) At 1 January 2005 Heineken established a share plan for the Executive Board members (see note 27), as at 1 January 2006 Heineken also established a share plan for senior management members (see note 27).
The share plan for the Executive Board is fully based on external performance conditions, whilst the plan for senior management members is for 25 per cent based on external market performance conditions and for 75 per cent on internal performance conditions.
The grant date fair value of the share rights granted is recognised as personnel expenses with a corresponding increase in equity. The costs of the share plan for the Executive Board members are spread evenly over the performance period. The costs of the share plan for senior management members are spread evenly over the performance period and are partly adjusted to refl ect the actual number of share rights that will vest.
The fair value is measured at grant date using the Monte Carlo model taking into account the terms and conditions of the plan.
(vi) Short-term benefi ts Short-term employee benefi t obligations are measured on an undiscounted basis and are expensed as the related service is provided.
A liability is recognised for the amount expected to be paid under short-term benefi ts if the Group has a present legal or constructive obligation to pay this amount as a result of past service provided by the employee and the obligation can be estimated reliably.
(k) Provisions (i) General A provision is recognised if, as a result of a past event, Heineken has a present legal or constructive obligation that can be estimated reliably, and it is probable that an outfl ow of economic benefi ts will be required to settle the obligation. Provisions are determined by discounting the expected future cash fl ows at a pre-tax rate that refl ects current market assessments of the time value of money and the risks specifi c to the liability.
(ii) Restructuring A provision for restructuring is recognised when Heineken has approved a detailed and formal restructuring plan, and the restructuring has either commenced or has been announced publicly. Future operating costs are not provided for. The provision includes the benefi t commitments in connection with early retirement, relocation and redundancy schemes.
(iii) Onerous contracts A provision for onerous contracts is recognised when the expected benefi ts to be derived by Heineken from a contract are lower than the unavoidable cost of meeting its obligations under the contract. The provision is measured at the present value of the lower of the expected cost of terminating the contract and the expected net cost of continuing with the contract. Before a provision is established, Heineken recognises any impairment loss on the assets associated with that contract.
(l) Revenue (i) Products sold Revenue from the sale of products in the ordinary course of business is measured at the fair value of the consideration received or receivable, net of sales tax, excise duties, customer discounts and other sales-related discounts. Revenue from the sale of products is recognised in the income statement when the amount of revenue can be measured reliable, the signifi cant risks and rewards of ownership have
Heineken N.V.Annual Report 2006 81

Financial Statements continued
Notes to the consolidated fi nancial statements
continued
been transferred to the buyer, recovery of the consideration is probable, the associated costs and possible return of products can be estimated reliably, and there is no continuing management involvement with the products.
(ii) Other revenue Other revenue are proceeds from sale of by-products, POS material, royalties, rental income and technical services to third parties, net of sales tax. Sales of by-products and POS materials are recognised in the income statement when ownership has been transferred to the buyer. Royalties are recognised in the income statement on an accrual basis in accordance with the substance of the relevant agreement. Rental income and technical services are recognised in the income statement when the services have been delivered.
(m) Other income Other income are gains from sale of P, P & E, intangible assets and (interests in) subsidiaries, joint ventures and associates, net of sales tax. They are recognised in the income statement when ownership has been transferred to the buyer.
(n) Expenses (i) Operating lease payments Payments made under operating leases are recognised in the income statement on a straight-line basis over the term of the lease. Lease incentives received are recognised in the income statement as an integral part of the total lease expense, over the term of the lease.
(ii) Finance lease payments Minimum lease payments under fi nance leases are apportioned between the fi nance expense and the reduction of the outstanding liability. The fi nance expense is allocated to each period during the lease term so as to produce a constant periodic rate of interest on the remaining balance of the liability. Contingent lease payments are accounted for by revising the minimum lease payments over the remaining term of the lease when the lease adjustment is confi rmed.
(o) Interest income, interest expenses and other net fi nance expenses Interest income and expenses are recognised as they accrue, using the effective interest method.
Other fi nance income comprises dividend income, gains on the disposal of available-for-sale fi nancial assets, changes in the fair value of fi nancial assets at fair value through profi t or loss, foreign currency gains, and gains on hedging instruments that are recognised in the income statement. Dividend income is recognised on the date that Heineken’s right to receive payment is established, which in the case of quoted securities is the ex-dividend date.
Other fi nance expenses comprise unwinding of the discount on provisions, changes in the fair value of fi nancial assets at fair value through profi t or loss, foreign currency losses, impairment losses recognised on fi nancial assets, and losses on hedging instruments that are recognised in the income statement.
(p) Income tax Income tax comprises current and deferred tax. Income tax is recognised in the income statement except to the extent that it relates to items recognised directly to equity, in which case it is recognised in equity.
Current tax is the expected tax payable on the taxable income for the year, using tax rates enacted or substantially enacted at the balance sheet date, and any adjustment to tax payable in respect of previous years.
Deferred tax is recognised using the balance sheet method, for temporary differences between the carrying amounts of assets and liabilities for fi nancial reporting purposes and the amounts used for taxation purposes. Deferred tax is not recognised for the following temporary differences: the initial
3 Signifi cant accounting policies continued
Heineken N.V.Annual Report 200682

recognition of goodwill, the initial recognition of assets or liabilities in a transaction that is not a business combination and that affects neither accounting nor taxable profi t, and differences relating to investments in subsidiaries and joint ventures to the extent that the Company is able to control the timing of the reversal of the temporary difference and they will probably not reverse in the foreseeable future. Deferred tax is measured at the tax rates that are expected to be applied to the temporary differences when they reverse, based on the laws that have been enacted or substantively enacted by the balance sheet date.
A deferred tax asset is recognised only to the extent that it is probable that future taxable profi ts will be available against which the asset can be utilised. Deferred tax assets are reviewed at each balance sheet date and are reduced to the extent that it is no longer probable that the related tax benefi t will be realised.
(q) Earnings per share Heineken presents basic and diluted earnings per share (EPS) data for its ordinary shares. Basic EPS is calculated by dividing the profi t or loss attributable to ordinary shareholders of the Company by the weighted average number of ordinary shares outstanding during the period. Diluted EPS is determined by adjusting the profi t or loss attributable to ordinary shareholders and the weighted average number of ordinary shares outstanding for the effects of all dilutive potential ordinary shares, which comprise share rights granted to employees.
(r) Segment reporting A segment is a distinguishable component of Heineken that is engaged either in providing related products or services (business segment), or in providing products or services within a particular economic environment (geographical segment), which is subject to risks and rewards that are different from those of other segments. Heineken’s primary format for segment information is based on geographical segments.
(s) New standards not yet adopted The following new standard and amendment to standard is not yet effective for the year ended 31 December 2006, and has not been applied in preparing these consolidated fi nancial statements:
IFRS 7 Financial Instruments: Disclosures and the Amendment to IAS 1 Presentation of Financial Statements: Capital Disclosures require extensive disclosures about the signifi cance of fi nancial instruments for an entity’s fi nancial position and performance, and qualitative and quantitative disclosures on the nature and extent of risks. IFRS 7 and amended IAS 1, which will become mandatory for Heineken’s 2007 fi nancial statements, will require additional disclosures with respect to Heineken’s fi nancial instruments and share capital.
Heineken N.V.Annual Report 200683

Financial Statements continued
Notes to the consolidated fi nancial statements
continued
4 Determination of fair values (i) General A number of Heineken’s accounting policies and disclosures require the determination of fair value, for both fi nancial and non-fi nancial assets and liabilities. Fair values have been determined for measurement and/or disclosure purposes based on the following methods. Where applicable, further information about the assumptions made in determining fair values is disclosed in the notes specifi c to that asset or liability.
(ii) Property, plant and equipment The fair value of property, plant and equipment recognised as a result of a business combination is based on market values. The market value of property, plant & equipment, fi xtures and fi ttings is based on the quoted market prices for similar items.
(iii) Intangible assets The fair value of brands acquired in a business combination is based on ‘relief of royalty’ method. The fair value of other intangible assets is based on the discounted cash fl ows expected to be derived from the use and eventual sale of the assets.
(iv) Inventory The fair value of inventory acquired in a business combination is determined based on its estimated selling price in the ordinary course of business less the estimated costs of completion and sale, and a reasonable profi t margin based on the effort required to complete and sell the inventory.
(v) Investments in equity and debt securities The fair value of fi nancial assets at fair value through profi t or loss, held-to-maturity investments and available-for-sale fi nancial assets is determined by reference to their quoted bid price at the reporting date. The fair value of held-to-maturity investments is determined for disclosure purposes only.
(vi) Trade and other receivables The fair value of trade and other receivables is estimated as the present value of future cash fl ows, discounted at the market rate of interest at the reporting date.
(vii) Derivative fi nancial instruments The fair value of forward exchange contracts is based on their listed market price, if available. If a listed market price is not available, then fair value is in general estimated by discounting the difference between the contractual forward price and the current forward price for the residual maturity of the contract using a risk-free interest rate (based on interbank interest rates).
The fair value of interest rate swaps is estimated by discounting the difference between cash fl ows resulting from the contractual interest rates of both legs of the transaction, taking into account current interest rates and the current creditworthiness of the swap counter parties.
(viii) Non-derivative fi nancial instruments Fair value, which is determined for disclosure purposes, is calculated based on the present value of future principal and interest cash fl ows, discounted at the market rate of interest at the reporting date. For fi nance leases the market rate of interest is determined by reference to similar lease agreements.
Heineken N.V.Annual Report 200684

5 Segment reporting General Segment information is presented only in respect of geographical segments consistent with Heineken’s management and internal reporting structure. Over 80 per cent of the Heineken sales consist of beer. The risks and rewards in respect of sales of other beverages do not differ signifi cantly from beer, as such no business segments are reported.
Inter-segment pricing is determined on an arm’s-length basis.
Segment results, assets and liabilities include items directly attributable to a segment as well as those that can be allocated on a reasonable basis. Unallocated result items comprise net fi nance expenses and income tax expense. Unallocated assets comprise current other investments and cash call deposits.
Segment capital expenditure is the total cost incurred during the period to acquire property, plant and equipment, goodwill and other intangible assets.
Geographical segments In presenting information on the basis of geographical segments, segment revenue is based on the geographical location of customers. Export revenue and results are also allocated to the regions. Most of the production facilities are located in Europe. Sales to the other regions are charged at transfer prices with a surcharge for cost of capital. Segment assets are based on the geographical location of the assets.
In 2005 Head Offi ce revenue and expenses were included in Western Europe but are presented this year separately together with eliminations. Prior-year fi gures have been restated.
Heineken distinguishes the following geographical segments:
• Western Europe • Central and Eastern Europe • The Americas • Africa and the Middle East • Asia Pacifi c • Head Offi ce/eliminations
Heineken N.V.Annual Report 200685

Financial Statements continued
Notes to the consolidated fi nancial statements
continued
5. Segment reporting continued Geographical segments Western Europe Central & Eastern Europe The Americas
In millions of EUR 2006 2005 2006 2005 2006 2005
Revenue
Third-party revenue1 4,752 4,711 3,337 2,768 1,975 1,733
Inter-regional revenue 599 515 12 28 – –
Total revenue 5,351 5,226 3,359 2,796 1,975 1,733
Other income 361 31 16 26 15 5
Results from operating activities 916 511 339 296 257 242
Net fi nance expenses
Share of profi t of associates 4 3 – 2 10 14
Income tax expense
Profi t
Attributable to:
Equity holders of the company (net profi t)
Minority interest
Beer volumes2
Consolidated volume 32,100 31,896 46,925 39,308 13,197 11,782
Minority interests – – 6,433 6,160 3,555 3,197
Licences 305 285 – – 172 144
Inter-regional volume 10,596 9,135 269 120 – –
Group volume 43,001 41,316 53,627 45,588 16,924 15,123
Segment assets 4,046 3,656 5,238 4,902 1,176 1,122
Investment in associates 9 10 14 15 55 62
Total segment assets 4,055 3,666 5,252 4,917 1,231 1,184
Unallocated assets
Total assets
Segment liabilities 3,583 3,598 2,950 2,908 546 691
Total equity
Total equity and liabilities
Purchase of P, P & E 340 346 287 254 53 60
Acquisition of goodwill 5 15 12 430 7 34
Purchase of intangible assets 5 5 16 13 11 2
Depreciation of P, P & E 264 296 298 252 42 51
Impairment and reversal of impairment of P, P & E 11 5 12 – – –
Amortisation intangible assets 6 13 18 19 3 3
Impairment intangible assets – – 19 15 – –
1 Includes other revenue of €241 million in 2006 and €257 million in 2005.
2 Please refer to the Glossary for defi nitions.
Heineken N.V.Annual Report 200686

Africa and the Middle East Asia Pacifi c Head Offi ce/Eliminations Consolidated 2006 2005 2006 2005 2006 2005 2006 2005
1,179 1,049 560 502 26 33 11,829 10,796
3 3 – – (624) (546) – –
1,182 1,052 560 502 (598) (513) 11,829 10,796
3 3 – 1 (16) (3) 379 63
231 196 86 65 (24) (56) 1,805 1,254
(122) (114)
4 2 9 8 – – 27 29
(365) (300)
1,345 869
1,211 761
134 108
1,345 869
13,281 11,559 6,402 5,976 – – 111,905 100,521
925 679 4,157 3,779 – – 15,070 13,815
3,500 2,798 993 1,047 – – 4,970 4,274
– – – – (10,865) (9,255) – –
17,706 15,036 11,552 10,802 (10,865) (9,255) 131,945 118,610
1,105 1,148 457 388 307 193 12,329 11,409
36 16 72 69 – – 186 172
1,141 1,164 529 457 307 193 12,515 11,581
482 248
12,997 11,829
631 668 279 224 (512) (774) 7,477 7,315
5,520 4,514
12,997 11,829
98 116 34 51 32 26 844 853
4 45 39 (11) – – 67 513
1 1 – – – – 33 21
78 82 20 18 4 6 706 705
1 6 – – 9 – 33 11
1 2 – – – – 28 37
– – – – – – 19 15
Heineken N.V.Annual Report 2006 87

Financial Statements continued
Notes to the consolidated fi nancial statements
continued
6. Acquisitions and disposals of subsidiaries, joint ventures and minority interests There were a limited number of changes in the scope of the consolidation during the year, with regard to the fi nancial statements as mentioned below.
In 2006 a wholesaler in Spain, a number of horeca enterprises in the Netherlands and a number of breweries (the latter through Heineken’s Asia Pacifi c joint venture) were acquired. Furthermore Heineken acquired a limited number of minority interests from third parties. The contribution in 2006 to operating profi t was nil and to revenue was immaterial.
Disposals during the year concerned a number of wholesalers in France and Italy.
Effect of acquisitions and disposal Acquisitions and disposals had the following effect on Heineken’s assets and liabilities on acquisition date.
Acquisitions Disposal In millions of EUR 2006 2006
Property, plant & equipment 17 (2)
Intangible assets 3 –
Investments in associates 4 5
Other investments 1 (2)
Inventories 1 (2)
Trade and other receivables 6 (6)
Minority interests 6 –
Loans and borrowings (4) –
Employee benefi ts (1) 1
Current Liabilities (26) 8
Net identifi able assets and liabilities 7 2
Goodwill on acquisition 66 –
Consideration paid/(received), satisfi ed in cash 73 2
Cash disposed of/(acquired) 2 (20)
Net cash outfl ow/(infl ow) 75 (18)
The fair values of assets and liabilities of some acquisitions have been determined on a provisional basis, since not all information was available yet on the date of acquisition.
The amount of goodwill paid relates to synergies to be achieved. Synergies to be achieved are a result of a stronger presence in the market and synergies in purchasing, sourcing and selling due to the integration of our activities in the applicable regions.
In addition to above adjustments, the provisional determined fair values of assets and liabilities of our 2005 Russian acquisitions have been adjusted downwards with €6 million in 2006, since not all information was available yet on the date of acquisition. The related goodwill reported has been adjusted accordingly, presented with a positive effect on goodwill of €6 million.
Heineken N.V.Annual Report 200688

7. Other income
In millions of EUR 2006 2005
Net gain on sale of P, P & E 351 58
Net gain on sale of intangible assets 10 –
Net gain on sale of subsidiaries, joint ventures and associates 18 5
379 63
The net gain on sale of P, P & E is for €32 million relating to the sale of a brewery site in Seville, Spain.
8. Raw materials, consumables and services
In millions of EUR 2006 2005
Raw materials 780 715
Non-returnable packaging 1,439 1,244
Goods for resale 1,531 1,404
Inventory movements (11) 10
Marketing and selling expenses 1,493 1,353
Transport expenses 640 525
Energy and water 268 218
Repair and maintenance 258 241
Other expenses 978 947
7,376 6,657
Heineken N.V.Annual Report 2006 89

Financial Statements continued
Notes to the consolidated fi nancial statements
continued
9. Personnel expenses In millions of EUR 2006 2005
Wages and salaries 1,490 1,413
Compulsory social security contributions 249 251
Contributions to defi ned contribution plans 10 13
Expenses related to the increase in liability defi ned benefi t plans 100 96
Increase in other long-term employee benefi ts 10 11
Share-based payment plan 4 –
Other personnel expenses 378 396
2,241 2,180
The average number of employees during the year was:
2006 2005
The Netherlands 4,315 4,541
Other Western Europe 12,080 12,831
Central and Eastern Europe 20,220 18,211
The Americas 1,785 1,827
Africa and Middle East 11,504 11,897
Asia Pacifi c 1,035 1,050
Heineken N.V. and subsidiaries 50,939 50,357
Central and Eastern Europe 5,061 4,824
The Americas 4,323 4,069
Africa and Middle East 659 630
Asia Pacifi c 4,666 4,425
Joint ventures3 14,709 13,948
Average number of joint venture employees pro rata 6,618 6,241
57,557 56,598
3 Employees of joint ventures are stated at 100%.
10. Amortisation, depreciation and impairments
In millions of EUR 2006 2005
Property, plant & equipment 739 716
Intangible assets 47 52
Total 786 768
11. Other net fi nance income In millions of EUR 2006 2005
Impairment investments – (6)
Dividend income 13 13
Exchange rate differences (16) 19
Other 14 (1)
11 25
Heineken N.V.Annual Report 200690

12. Income tax expense Recognised in the income statement In millions of EUR 2006 2005
Current tax expense
Current year 439 326
Over provided in prior years (26) (14)
413 312
Deferred tax expense
Change in previously unrecognised temporary differences (55) –
Origination and reversal of temporary differences (6) (12)
Change in tax rate 10 (6)
Charge of tax losses recognised 3 6
(48) (12)
Total income tax expense in income statement 365 300
Reconciliation of effective tax rate
Profi t before income tax 1,710 1,169
Net gain on sale of subsidiaries, joint ventures and associates (18) (5)
Income from associates (27) (29)
Dividend income (13) (13)
Impairment other investments – 6
Taxable profi t 1,652 1,128
% 2006 % 2005
Income tax using the Company’s domestic tax rate 29.6 489 31.5 354
Effect of tax rates in foreign jurisdictions (3.0) (50) (2.5) (29)
Effect of non-deductible expenses 2.4 40 2.6 30
Effect of tax incentives and exempted income (3.2) (53) (4.0) (45)
Change in previously unrecognised temporary differences (3.3) (55) – –
Effect of recognition of previously unrecognised tax losses (0.3) (4) (0.1) (1)
Current-year losses for which no deferred tax asset was recognised 0.4 7 0.6 7
Effect of change in tax rates 0.6 10 (0.6) (6)
(Over)/under provided in prior years (1.6) (26) (1.2) (14)
Other reconciling items 0.4 7 0.3 4
22.0 365 26.6 300
Deferred tax (debit)/credit recognised directly in equity
In millions of EUR 2006 2005
Relating to accounting policy changes – (12)
Relating to fair value adjustments and cash fl ow hedges (14) 31
(14) 19
Heineken N.V.Annual Report 2006 91

Financial Statements continued
Notes to the consolidated fi nancial statements
continued
13. Property, plant & equipment Land and Plant and Other Under In millions of EUR buildings equipment fi xed assets construction Total
Cost
Balance at 1 January 2005 2,798 4,595 2,812 163 10,368
Changes in consolidation (202) 122 (40) 7 (113)
Purchases 59 197 299 298 853
Transfer of completed projects under construction 48 77 82 (207) –
Disposals (64) (82) (253) – (399)
Effect of movements in exchange rates 86 184 85 10 365
Balance at 31 December 2005 2,725 5,093 2,985 271 11,074
Balance at 1 January 2006 2,725 5,093 2,985 271 11,074
Changes in consolidation 88 (125) 53 2 18
Purchases 40 125 311 368 844
Transfer of completed projects under construction 27 104 90 (221) –
Transfer to assets classifi ed as held for sale (70) – (6) – (76)
Disposals (150) (214) (198) – (562)
Effect of movements in exchange rates (39) (76) (30) (7) (152)
Balance at 31 December 2006 2,621 4,907 3,205 413 11,146
Depreciation and impairment losses
Balance at 1 January 2005 (1,269) (2,521) (1,805) – (5,595)
Changes in consolidation 12 71 54 – 137
Depreciation charge for the year (76) (274) (355) – (705)
Impairment loss (1) (6) (15) – (22)
Reversal Impairment loss 1 9 1 – 11
Disposals 23 61 215 – 299
Effect of movements in exchange rates (29) (64) (39) – (132)
Balance at 31 December 2005 (1,339) (2,724) (1,944) – (6,007)
Balance at 1 January 2006 (1,339) (2,724) (1,944) – (6,007)
Changes in consolidation 11 8 (9) – 10
Depreciation charge for the year (75) (251) (380) – (706)
Impairment loss (10) (24) (3) – (37)
Reversal Impairment loss – 2 2 – 4
Transfer to assets classifi ed as held for sale 35 – – – 35
Disposals 115 163 169 – 447
Effect of movements in exchange rates 14 23 15 – 52
Balance at 31 December 2006 (1,249) (2,803) (2,150 ) – (6,202)
Carrying amount
At 1 January 2005 1,529 2,074 1,007 163 4,773
At 31 December 2005 1,386 2,369 1,041 271 5,067
At 1 January 2006 1,386 2,369 1,041 271 5,067
At 31 December 2006 1,372 2,104 1,055 413 4,944
Heineken N.V.Annual Report 200692
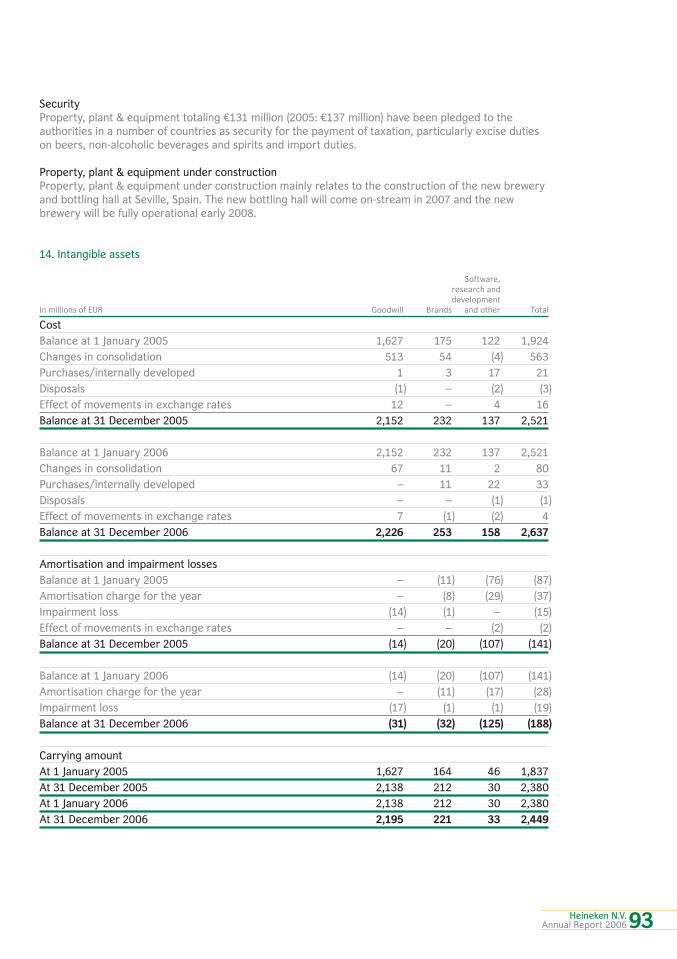
Security Property, plant & equipment totaling €131 million (2005: €137 million) have been pledged to the authorities in a number of countries as security for the payment of taxation, particularly excise duties on beers, non-alcoholic beverages and spirits and import duties.
Property, plant & equipment under construction Property, plant & equipment under construction mainly relates to the construction of the new brewery and bottling hall at Seville, Spain. The new bottling hall will come on-stream in 2007 and the new brewery will be fully operational early 2008.
14. Intangible assets Software, research and development In millions of EUR Goodwill Brands and other Total
Cost
Balance at 1 January 2005 1,627 175 122 1,924
Changes in consolidation 513 54 (4) 563
Purchases/internally developed 1 3 17 21
Disposals (1) – (2) (3)
Effect of movements in exchange rates 12 – 4 16
Balance at 31 December 2005 2,152 232 137 2,521
Balance at 1 January 2006 2,152 232 137 2,521
Changes in consolidation 67 11 2 80
Purchases/internally developed – 11 22 33
Disposals – – (1) (1)
Effect of movements in exchange rates 7 (1) (2) 4
Balance at 31 December 2006 2,226 253 158 2,637
Amortisation and impairment losses
Balance at 1 January 2005 – (11) (76) (87)
Amortisation charge for the year – (8) (29) (37)
Impairment loss (14) (1) – (15)
Effect of movements in exchange rates – – (2) (2)
Balance at 31 December 2005 (14) (20) (107) (141)
Balance at 1 January 2006 (14) (20) (107) (141)
Amortisation charge for the year – (11) (17) (28)
Impairment loss (17) (1) (1) (19)
Balance at 31 December 2006 (31) (32) (125) (188)
Carrying amount
At 1 January 2005 1,627 164 46 1,837
At 31 December 2005 2,138 212 30 2,380
At 1 January 2006 2,138 212 30 2,380
At 31 December 2006 2,195 221 33 2,449
Heineken N.V.Annual Report 2006 93

Financial Statements continued
Notes to the consolidated fi nancial statements
continued
14. Intangible assets continued Impairment tests for cash-generating units containing Goodwill The aggregate carrying amounts of goodwill allocated to each cash-generating units are as follows:
In millions of EUR 2006 2005
Brau Union 1,116 1,115
Russia 451 448
Compania Cervecerias Unidas (CCU) 339 320
1,906 1,883
Various other entities 289 255
2,195 2,138
Goodwill has been tested for impairment at 31 December 2006. The recoverable amounts exceed the carrying amount of the cash-generating units including goodwill, except for two cash-generating units where an impairment loss of €17 million was charged to the income statement. In 2005 for three cash-generating units an impairment loss of €14 million was charged to the income statement.
The recoverable amounts of the cash-generating units are based on value-in-use calculations. Value in use was determined by discounting the future cash fl ows generated from the continuing use of the unit and was based on the following key assumptions:
• Cash fl ows were projected based on actual operating results and the three-year business plan. Cash fl ows for a further seven-year period were extrapolated using expected annual per country volume growth rates, which are based on external sources. Management believes that this forecasted period was justifi ed due to the long-term nature of the beer business and past experiences.
• Country-specifi c expected annual volume growth rates used was -0.5 to 9.5 per cent for the years
2010 to 2016. • The beer price growth per year after the fi rst three-year period is assumed to be at specifi c per
country expected annual long-term infl ation, based on external sources. • Cash fl ows after the fi rst ten-year period were extrapolated using expected annual long-term
infl ation, based on external sources, in order to calculate the terminal recoverable amount. • Expected annual long-term infl ation used was 1.5 to 9.4 per cent for the years 2010 to 2016 and
thereafter. • A per cash-generating unit specifi c post tax Weighted Average Cost of Capital (WACC) was applied in
determining the recoverable amount of the units. WACC used was 6.0 to 17.1 per cent. WACC used for Brau Union, Russia and CCU was 8.6 per cent, 14.1 per cent and 9.5 per cent respectively.
The values assigned to the key assumptions represent management’s assessment of future trends in the beer industry and are based on both external sources and internal sources (historical data).
Heineken N.V.Annual Report 200694
15. Investment in associates Heineken has the following investments in associates, direct or indirect through subsidiaries or joint ventures:
Ownership Ownership Country 2006 2005
Cervecerias Costa Rica S.A. Costa Rica 25.0% 25.0%
Brasserie Nationale d’Haïti Haïti 23.3% 23.3%
Guinness Ghana Breweries Ltd. Ghana 20.0% 20.0%
Sierra Leone Brewery Sierra Leone 42.5% 42.5%
Guinness Anchor Berhad* Malaysia 10.7% 10.7%
Thai Asia Pacifi c Brewery Co. Ltd.4 * Thailand 14.7% 14.7%
Jiangsu DaFuHao Breweries Co. Ltd.4 * China 22.5% 18.4%
* Indirect through joint ventures. 4 The reporting date of the fi nancial statements of this associate is 30 September
Heineken’s share in the profi t of associates for the year ended 31 December 2006 was €27 million (2005: €29 million). Guinness Anchor Berhad is listed on the Malaysian stock exchange. Fair value as at 31 December 2006 amounted €42 million.
16. Other investments In millions of EUR 2006 2005
Non-current other investments
Held to maturity investments 584 481
Available-for-sale investments 202 165
786 646
Current other investments
Investments at fair value through profi t or loss 12 23
Included in held-to-maturity investments are loans to customers with a carrying amount €329 million as at 31 December 2006 (2005: €375 million). Effective interest rates range from 2 to 10 per cent. €317 million (2005: €355 million) matures between 1 and 5 years and €12 million (2005: €20 million) after 5 years. Also included in held-to-maturity investments are part of the deferred payments in relation to the sale of a brewery site in Seville, Spain, amounting to €147 million.
The impairment loss in respect to loans to customers recognised in the current year was €37 million.
Heineken N.V.Annual Report 2006 95

Financial Statements continued
17. Deferred tax assets and liabilities Recognised deferred tax assets and liabilities Deferred tax assets and liabilities are attributable to the following items:
Assets Liabilities Net
In millions of EUR 2006 2005 2006 2005 2006 2005
Property, plant & equipment 21 21 (387) (381) (366) (360)
Intangible assets 79 27 (41) (42) 38 (15)
Investments 9 16 (2) (2) 7 14
Inventories 12 4 (2) 5 10 9
Loans and borrowings (3) 3 – – (3) 3
Employee benefi ts 134 144 1 (5) 135 139
Provisions 73 56 5 4 78 60
Other items 72 65 (58) (41) 14 24
Tax losses carry-forwards 13 19 (2) – 11 19
Tax assets/(liabilities) 410 355 (486) (462) (76) (107)
Set-off of tax (15) (69) 15 69 – –
Net tax assets/(liabilities) 395 286 (471) (393) (76) (107)
Unrecognised deferred tax assets Deferred tax assets have not been recognised in respect of the following items:
In millions of EUR 2006 2005
Tax losses 77 140
The tax losses expire in different years. Deferred tax assets have not been recognised in respect of these items because it is not probable that future taxable profi t will be available against which Heineken can utilise the benefi ts therefrom.
Tax losses Heineken has for an amount of €119 million (2005: €190 million), losses carry forward as per 31 December 2006 which expire in the following years:
In millions of EUR 2006 2005
2006 – 8
2007 23 42
2008 24 42
2009 13 15
2010 7 10
2011 3 –
After 2011 respectively 2010 but not unlimited 36 33
Unlimited 13 40
119 190
Recognised as deferred tax assets (42) (50)
Unrecognised 77 140
Notes to the consolidated fi nancial statements
continued
Heineken N.V.Annual Report 200696

Movement in temporary differences during the year Effect of Balance Balance movements 31 1 January Changes in in foreign Recognised Recognised December In millions of EUR 2005 consolidation exchange in income in equity 2005
Property, plant & equipment (341) (18) (16) 15 – (360)
Intangible assets (18) 6 – (3) – (15)
Investments 5 – – 4 5 14
Inventories 11 – 1 (3) – 9
Loans and borrowings 1 – – – 2 3
Employee benefi ts 157 1 – (19) – 139
Provisions 51 – 2 7 – 60
Other items (3) 1 (2) 17 11 24
Tax losses carry-forwards 22 – 2 (6) 1 19
(115) (10) (13) 12 19 (107)
Effect of Balance Balance movements 31 1 January Changes in in foreign Recognised Recognised December In millions of EUR 2006 consolidation exchange income in equity 2006
Property, plant & equipment (360) (3) 9 (13) 1 (366)
Intangible assets (15) 6 – 47 – 38
Investments 14 – – (6) (1) 7
Inventories 9 – (1) 2 – 10
Loans and borrowings 3 (6) – – – (3)
Employee benefi ts 139 – (1) (3) – 135
Provisions 60 – – 19 (1) 78
Other items 24 (7) 1 9 (13) 14
Tax losses carry-forwards 19 – (1) (7) – 11
(107) (10) 7 48 (14) (76)
18. Inventories
In millions of EUR 2006 2005
Raw materials 131 147
Work in progress 86 83
Finished products 226 191
Goods for resale 162 172
Non-returnable packaging 85 83
Other inventories 203 207
893 883
In millions of EUR 2006 2005
Inventories measured at fair value less costs to sell 97 68
In 2006 the write-down of inventories to net realisable value amounted to €8 million (2005: €12 million), The write-downs are included in expenses for raw materials, consumables and services.
Heineken N.V.Annual Report 2006 97

Financial Statements continued
19. Trade and other receivables In millions of EUR 2006 2005
Trade receivables due from associates and joint ventures 22 29
Trade receivables 1,388 1,435
Other amounts receivable including current part loans to customers 369 218
Derivatives 47 11
Prepayments and accrued income 91 94
1,917 1,787
At 31 December 2006 trade receivables are shown net of an allowance for doubtful debts of €241 million (2005: €251 million). The impairment loss recognised in the current year was €39 million (2005: €69 million), included in expenses for raw materials, consumables and services.
20. Cash and cash equivalents In millions of EUR 2006 2005
Bank balances 894 354
Call deposits 480 231
Cash and cash equivalents 1,374 585
Bank overdrafts (747) (351)
Cash and cash equivalents in the statement of cash fl ows 627 234
Heineken has set up a notional Euro cash pool in 2006. The main Eurozone subsidiaries participate in this cash pool. The structure facilitates interest and balance compensation of cash and bank overdrafts. This notional pooling does not meet the strict set-off rules under IFRS, and as a result the cash and bank overdraft balances must be reported ‘gross’ on the balance sheet. On a ‘netted’ pro forma basis cash and cash equivalents and overdraft balances would have been €401 million lower, resulting in €973 million cash and cash equivalents and €346 million bank overdraft balances.
21. Assets classifi ed as held for sale
In millions of EUR 2006 2005
Property, plant and equipment 41 –
Assets classifi ed as held for sale represent land and buildings following the commitment of Heineken to a plan to sell the land and buildings. Efforts to sell the assets have commenced and a sale is expected in 2007.
Notes to the consolidated fi nancial statements
continued
Heineken N.V.Annual Report 200698
22. Total equity Equity attribu- table to equity Trans- Other Fair Reserve holders Share lation legal Hedging value for own Retained of the Minority Total In millions of EUR capital reserve reserves reserve reserve shares earnings Company interests equity
Balance at 1 January 2005 784 5 349 – – – 2,118 3,256 477 3,733
Total recognised income and expense6 – 143 25 (21) 49 – (48) 148 58 206
Profi t – – 80 – – – 681 761 108 869
Transfer to retained earnings – – (62) – – – 62 – – –
Dividends to shareholders – – – – – – (196) (196) (86) (282)
Purchase minority shares – – – – – – – – (1) (1)
Changes in consolidation – – – – – – – – (11) (11)
Balance at 31 December 2005 784 148 392 (21) 49 – 2,617 3,969 545 4,514
Balance at 1 January 2006 784 148 392 (21) 49 – 2,617 3,969 545 4,514
Total recognised income and expense – (52) (6) 49 48 – (4) 35 (31) 4
Profi t – – 110 – – – 1,101 1,211 134 1,345
Transfer to retained earnings – – (37) – – – 37 – – –
Dividends to shareholders – – – – – – (196) (196) (101) (297)
Purchase minority shares – – – – – – – – (30) (30)
Purchase own shares – – – – – (14) – (14) – (14)
Shared based payments – – – – – – 4 4 – 4
Changes in consolidation – – – – – – – – (6) (6)
Balance at 31 December 2006 784 96 459 28 97 (14) 3,559 5,009 511 5,520
6 Included is the effect of the change in accounting policy as of 1 January 2005 due to the application of IAS 32/39 amounting to €44 million.
Share capital Ordinary shares In millions of EUR 2006 2005
On issue at 1 January 784 784
Issued for cash – –
On issue at 31 December 784 784
At 31 December 2006 the issued share capital comprised 489,974,594 ordinary shares (2005: 489,974,594). The ordinary shares have a par value of €1.60. All issued shares are fully paid.
The holders of ordinary shares are entitled to receive dividends as declared from time to time and are entitled to one vote per share at meetings of the Company. In respect of the Company’s shares that are held by Heineken (see below), rights are suspended.
Heineken N.V.Annual Report 200699
Financial Statements continued
Notes to the consolidated fi nancial statements
continued
22. Total equity continued Translation reserve The translation reserve comprises foreign currency differences arising from the translation of the fi nancial statements of foreign operations of the Company (excluding amounts attributable to minority interests).
Other legal reserves These reserves relate to the share of profi t of joint ventures and associates over the distribution of which Heineken does not have control. The movement in these reserves refl ects retained profi ts of joint ventures and associates minus dividends received.
Hedging reserve This reserve comprises the effective portion of the cumulative net change in the fair value of cash fl ow hedging instruments where the hedged transaction has not yet occurred.
Fair vale reserve This reserve comprises the cumulative net change in the fair value of available-for-sale investments until the investment is derecognised.
Reserve for own shares The reserve for the Company’s own shares comprises the cost of the Company’s shares held by Heineken. At 31 December 2006 Heineken held 410,000 of the Company’s shares (2005: nil).
Dividends The following dividends were declared and paid by Heineken:
In millions of EUR 2006 2005
Final dividend previous year €0.24 per qualifying ordinary share 118 118
Interim dividend current year €0.16 per qualifying ordinary share 78 78
Total dividend declared and paid 196 196
The Company intends to renew its dividend policy which will be applicable to the dividend for the fi nancial year 2006. The proposal is subject to approval at the Annual General Meeting of shareholders of Heineken N.V. in April 2007.
After the balance sheet date the Executive Board proposed the following dividends. The dividends have not been provided for.
In millions of EUR 2006 2005
€0.60 per qualifying ordinary share (2005: €0.40) 294 196
Prior-year adjustments In 2006, BHI recognised IFRS transitional adjustments, which should have been refl ected in the 2004 Heineken IFRS opening balance sheet. The prior year estimation error, with a negative impact of €10 million, is not considered material and is recognized in equity in 2006. Comparatives have not been restated.
23. Earnings per share Basic earnings per share The calculation of basic earnings per share at 31 December 2006 was based on the profi t attributable to ordinary shareholders of the Company (net profi t) of €1,211 million (2005: €761 million) and a weighted average number of ordinary shares outstanding during the year ended 31 December 2006 of 489,712,594 (2005: 489,974,594). Basic earnings per share for the year amount to €2.47.
Heineken N.V.Annual Report 2006100

Weighted average number of shares – basic
In thousands of shares 2006 2005
Weighted average number of shares – basic – at 1 January 489,974,594 489,974,594
Effect of own shares held (262,000) –
Weighted average number of shares – basic – at 31 December 489,712,594 489,974,594
Diluted earnings per share The calculation of diluted earnings per share at 31 December 2006 was based on the profi t attributable to ordinary shareholders of the Company (net profi t) of €1,211 million (2005: €761 million) and a weighted average number of ordinary shares outstanding after adjustment for the effects of all dilutive potential ordinary shares of 489,974,594 (2005: 489,974,594). Diluted earnings per share for the year amount to €2.47.
24. Changes in accounting policy In 2005 Heineken adopted IAS 32 and IAS 39 Financial instruments.In 2004 under IFRS, Heineken did not recognize derivatives. In accordance with IAS 32 and IAS 39 derivatives should be recognised at fair value. The changes in accounting policy had the following impact on the opening balance of 1 January 2005.
Balance 31 Effect of Balance December policy 1 January In millions of EUR 2004 change 2005
Deferred tax assets 269 9 278
Investments 632 37 669
Inventories 782 (14) 768
Trade and other receivables 1,646 68 1,714
Loans and borrowings (23) (23) (46)
Deferred tax liabilities (384) (20) (404)
Trade and other payables (2,025) (13) (2,038)
Recognised directly in equity (44)
25. Loans and borrowings This note provides information about the contractual terms of Heineken’s interest-bearing loans and borrowings. For more information about Heineken’s exposure to interest rate risk and foreign currency risk refer to note 30.
Non-current liabilities In millions of EUR 2006 2005
Secured bank loans 10 7
Unsecured bank loans 699 841
Unsecured bond issues 1,343 1,341
Finance lease liabilities 6 6
Non–current interest bearing liabilities 2,058 2,195
Non-current non-interest bearing liabilities 33 38
2,091 2,233
101 Heineken N.V.Annual Report 2006

Financial Statements continued
Notes to the consolidated fi nancial statements
continued
25. Loans and borrowings continued Current interest bearing liabilities In millions of EUR 2006 2005
Current portion of unsecured bank loans 184 404
Current portion of unsecured bond issues – 3
Current portion of fi nance lease liabilities 1 2
Total current portion of non-current interest bearing liabilities 185 409
Deposits from third parties 299 284
Other current interest bearing liabilities 10 16
Bank overdrafts 747 351
1,241 1,060
Net interest-bearing debt position In millions of EUR 2006 2005
Non-current interest bearing liabilities 2,058 2,195
Current portion of non-current interest bearing liabilities 185 409
Deposits from third parties and other current interest bearing liabilities 309 300
2,552 2,904
Bank overdrafts 747 351
3,299 3,255
Cash, cash equivalents and other investments (1,386) (608)
Net interest bearing debt position 1,913 2,647
Terms and debt repayment schedule Terms and conditions of outstanding loans are as follows:
Carrying Carrying Nominal amount amount In millions of EUR Currency interest rate Repayment 2006 2005
Secured bank loans various various various 10 7
Unsecured bank loans EUR various 2007-various 520 818
Unsecured bank loans PLN 4.33% 2007-2011 26 76
Unsecured bank loan CLP 5.26% 2007-2011 87 98
Unsecured bank loan EGP 10.63% 2007-2011 85 111
Unsecured bank loans various various 2007-various 165 142
Unsecured bond issue EUR 4.38% 2010 499 498
Unsecured bond issue EUR 5.00% 2013 597 596
Unsecured bond issue EUR 5.50% 2008 200 200
Unsecured bond issue CLP 5.91% 2007-2024 47 50
Deposits from third parties and other current interest bearing liabilities various various 2007-various 309 300
Finance lease liabilities various various 2007-various 7 8
2,552 2,904
Committed facilities: the Heineken N.V. €2 billion Revolving Credit Facility 2005-2012 was not utilised per 31 December 2006 (31 December 2005: €60 million utilised).
Heineken N.V.Annual Report 2006102

26. Employee benefi ts In millions of EUR 2006 2005
Present value of unfunded obligations 309 291
Present value of funded obligations 2,734 2,830
Total present value of obligations 3,043 3,121
Fair value of plan assets (2,397) (2,268)
Present value of net obligations 646 853
Less: Unrecognised actuarial losses (78) (285)
Recognised liability for defi ned benefi t obligations 568 568
Other long-term employee benefi ts 97 96
665 664
Plan assets consist of the following:
In millions of EUR 2006 2005
Equity securities 968 937
Government bonds 955 867
Properties and real estate 199 177
Other plan assets 275 287
2,397 2,268
Liability for defi ned benefi t obligations Heineken makes contributions to a number of defi ned benefi t plans that provide pension benefi ts for employees upon retirement in a number of countries being mainly: the Netherlands, Greece, Austria, Germany, Italy, France, Spain and Nigeria. In other countries the pension plans are defi ned contribution plans and/or similar arrangements for employees.
Other long-term employee benefi ts mainly relate to long-term bonus plans, termination benefi ts and jubilee benefi ts.
Movements in the liability for defi ned benefi t obligations In millions of EUR 2006 2005
Net liability at 1 January 568 634
Changes in consolidation and reclassifi cation (1) (29)
Effect of movements in exchange rates (2) 5
Benefi ts paid (97) (138)
Expense recognised in the income statement 100 96
Net liability at 31 December 568 568
Movements in plan assets In millions of EUR 2006 2005
Fair value of plan assets at 1 January 2,268 2,250
Effect of movements in exchange rates (3) (1)
Contributions paid into the plan 111 44
Benefi ts paid (97) (138)
Expected return on plan assets 118 113
Fair value of plan assets at 31 December 2,397 2,268
103 Heineken N.V.Annual Report 2006

Financial Statements continued
Notes to the consolidated fi nancial statements
continued
26. Employee benefi ts continued Expense recognised in the income statement In millions of EUR 2006 2005
Current service costs 84 82
Interest on obligation 125 131
Expected return on plan assets (118) (112)
Effect of any curtailment or settlement 9 (5)
100 96
Principal actuarial assumptions at the balance sheet date Western and Central Africa/ Asia & Eastern Europe Americas Middle East Pacifi c 2006 2005 2006 2005 2006 2005 2006 2005
Discount rate at 31 December 2.5-6 2.5-6.5 5.5-6.5 5.5-6.5 4.5-15 4.5-19 3.5-13 3.5-13
Expected return on plan assets at 1 January 3.5-6.6 3.5-6.6 6.5 5.25 6.5 5 3.5-11 3.5-11
Future salary increases 1.5-8 1.5-8 0.5-5 0.5-5 3-14 3-17 3-8 3.5-8
Future pension increases 1-2.5 1-3.5 3.5 3.5 2 2 8 8
Medical cost trend rate 1.5 1.5 5 5 – – – –
Assumptions regarding future mortality are based on published statistics and mortality tables.
The overall expected long-term rate of return on assets is 5.9 per cent. The return is based exclusively on historical returns, without adjustments.
27. Share-based payments – Long-Term Incentive Plan On 1 January 2005 Heineken established a performance-based share plan (Long-Term Incentive Plan; LTIP) for the Executive Board. On 1 January 2006 a similar LTIP was established for senior management.
The Long-Term Incentive Plan includes share rights, which are conditionally awarded to the Executive Board each year, are subject to Heineken’s Relative Total Shareholder Return (RTSR) performance in comparison with the TSR performance of a selected peer group. At target performance, 100 per cent of the shares will vest. At maximum performance 150 per cent of the shares will vest. The LTIP share rights conditionally awarded to senior management each year are for 25 per cent subject to Heineken’s Relative RTSR performance and for 75 per cent subject to internal performance conditions.
The performance period for share rights granted in 2005 is from 1 January 2005 to 31 December 2007. The performance period for share rights granted in 2006 is from 1 January 2006 to 31 December 2008. The vesting date for the Executive Board is fi ve business days and for senior management twenty business days after the publication of the annual results of 2007, respectively of 2008.
The costs recognised are measured at grant date using the Monte Carlo model taking into account the terms and conditions of the plan.
Heineken N.V.Annual Report 2006104

The terms and conditions of the share rights granted are as follows:
Based on Vesting Contractual Grant date/employees entitled Number share price conditions life of rights
Share rights granted to Continued service 3 years Executive Board on 1 January 2005 43,724 24.53 and RTSR performance
Share rights granted to Continued service 3 years Executive Board on 1 January 2006 40,049 26.78 and RTSR performance
Share rights granted to senior Continued service, 3 years 75% internal performance conditions and 25% management on 1 January 2006 352,098 26.78 RTSR performance
435,871
The number and weighted average share price per share is as follows:
Weighted Weighted average Number average Number share of share share of share price 2006 rights 2006 price 2005 rights 2005
Outstanding at 1 January 24.53 43,724 – –
Granted during the year 26.78 392,147 24.53 43,724
Outstanding at 31 December 26.55 435,871 24.53 43,724
The fair value of services received in return for share rights granted is based on the fair value of shares granted, measured using the Monte Carlo model, with following inputs:
Executive Executive Senior Senior Board Board management management In EUR 2006 2005 2006 2005
Fair value at grant date 424,519 424,560 8,814,436 –
Expected volatility 22.4% 26.3% 22.4% –
Expected dividends 1.5% 1.3% 1.5%
Personnel expenses In millions of EUR 2006 2005
Share rights granted in 2005 – –
Share rights granted in 2006 4 –
Total expense recognised as personnel expenses 4 –
Heineken’s Relative Total Shareholder Return (RTSR) as at 31 December 2006 is a number 2 position.
105 Heineken N.V.Annual Report 2006
Financial Statements continued
Notes to the consolidated fi nancial statements
continued
28. Provisions In millions of EUR Restructuring Other Total
Balance at 1 January 2006 236 137 373
Provisions made during the year 105 30 135
Provisions used during the year (79) (26) (105)
Provisions reversed during the year (10) (26) (36)
Effect of movements in exchange rates – (3) (3)
Balance at 31 December 2006 252 112 364
Non-current part 167 75 242
Current part 85 37 122
252 112 364
Restructuring The provision for restructuring of €252 million relates to restructuring programmes in the Netherlands, France, Spain and Italy. During the year, €102 million restructuring expenses relating to Fit2Fight have been recognised of which main part has not been used as at 31 December 2006.
Other provisions Other provisions include amongst others provisions formed for onerous contracts, surety provided and for litigations and claims.
29. Trade and other payables In millions of EUR 2006 2005
Trade payables due to associates and joint ventures 9 7
Other trade payables 1,030 1,042
Returnable packaging deposits 340 334
Taxation and social security contributions 301 281
Dividend 29 31
Interest 34 41
Derivatives 10 62
Other payables 140 127
Accruals and deferred income 603 526
2,496 2,451
30. Financial instruments Exposure to credit, interest rate, foreign currency and commodity risks arise in the normal course of Heineken’s business. Derivative fi nancial instruments are used to hedge exposure to fl uctuations in interest rates and exchange rates. Heineken applies hedge accounting in order to manage volatility in the income statement.
Hedging policy Derivatives, such as interest rate swaps, forward rate agreements, caps and fl oors, are used to minimise the effects of interest rate fl uctuations in the income statement. In addition, forward exchange contracts and options are used to limit the effects of currency and commodity price fl uctuations in the income statement. Transactions are entered into with a limited number of counter parties with strong credit ratings. Foreign currency, commodity and interest rate hedging operations are governed by an internal policy and rules approved and monitored by the Executive Board.
Heineken N.V.Annual Report 2006106

Credit risk Management has credit policies in place and the exposure to credit risk is monitored on an ongoing basis. Credit evaluations are performed on all customers requiring credit over a certain amount. Heineken does not require collateral in respect of fi nancial assets.
Transactions involving hedging instruments and investments, only allowed in liquid securities, are conducted only with counter parties that have a credit rating of minimal single A or equivalent. Given their high credit ratings, management does not expect any counter party to fail to meet its obligations.
At balance sheet date there were no signifi cant concentrations of credit risk. The maximum exposure to credit risk is represented by the carrying amount of each fi nancial instrument, including derivative fi nancial instruments, in the balance sheet.
Interest rate risk Heineken opts for a well-balanced mix of fi xed and variable interest rates in its fi nancing operations, possibly combined with the use of interest rate instruments. Currently Heineken’s interest rate position is more fi xed then fl oating. The interest rate instruments used are interest rate swaps, forward rate agreements, caps and fl oors.
Swaps mature over the next years following the maturity of the related loans and have swap rates ranging from 3.4 per cent to 5.5 per cent (2005: from 2.1 per cent to 5.5 per cent).
In principle Heineken applies hedge accounting to interest rate swaps and states them at fair value.
Foreign currency risk Heineken is exposed to foreign currency risk on sales, purchases and borrowings that are denominated in a currency other than the respective functional currencies of Heineken entities. The currencies giving rise to this risks are primarily US Dollars, Chilean Pesos, Singapore Dollars, Nigerian Nairas, Russian Rubles and Polish Zloty.
Heineken hedges up to 90 per cent of its mainly intra Heineken US Dollar cash fl ows on the basis of rolling cash fl ow forecasts in respect to forecasted sales and purchases. Cash fl ows in other foreign currencies are also hedged on the basis of rolling cash fl ow forecasts. Heineken uses mainly forward exchange contracts to hedge its foreign currency risk. Most of the forward exchange contracts have maturities of less than one year after the balance sheet date.
The Company has a clear policy on hedging transactional hedging risks, which postpones the impact on fi nancial results. Translation exchange risks are not hedged.
Commodity risk Commodity risk is the risk that changes in commodity prices will affect Heineken’s income. The objective of commodity risk management is to manage and control commodity risk exposures within acceptable parameters, whilst optimising the return on risk. So far, commodity trading by the Company is limited to the sale of surplus CO
2 emission rights.
Heineken does not enter into commodity contracts other than to meet Heineken’s expected usage and sale requirements.
Firm commitments and forecasted transactions Heineken classifi es its forward exchange contracts and options, hedging forecasted transactions and fi rm commitments, as cash fl ow hedges and states them at fair value.
Sensitivity analysisIn managing interest rate and currency risks Heineken aims to reduce the impact of short-term fl uctuations on Heineken’s earnings. Over the longer term, however, permanent changes in foreign exchange and interest rates would have an impact on profi t.
107 Heineken N.V.Annual Report 2006

Financial Statements continued
Notes to the consolidated fi nancial statements
continued
30. Financial instruments continued At balance sheet date it is estimated that a general increase of one per centage point in interest rates would have decreased Heineken’s profi t before income tax by approximately €0.5 million (2005: approximately €3.3 million). The effect of interest rate swaps has been included in this calculation.
It is estimated that a general increase of one per centage point in the value of the Euro against other currencies would have decreased Heineken’s profi t before income tax by approximately €4 million for the year ended 31 December 2006 (2005: approximately €11 million). The effect of the forward exchange contracts has been included in this calculation.
Effective interest rates and repricing analysis In respect of income-earning fi nancial assets and interest-bearing fi nancial liabilities, the following table indicates their average effective interest rates at the balance sheet date and the periods in which they mature or, if earlier, re-price.
2006 Average effective More interest 1 year 1-2 2-5 than In millions of EUR rate Total or less years years 5 years
Cash and cash equivalentsand current other investments – 1,386 1,379 2 1 4
Secured bank loans – (10) (10) – – –
Unsecured bank loans:
Loans from banks in EUR 4.79% (520) (4) (180) (167) (169)
Loans from banks in PLN 4.33% (26) – (13) (13) –
Loans from banks in CLP 3.59% (87) (18) (1) (68) –
Loans from banks in EGP 10.60% (85) (25) (26) (34) –
Bank loans in various currencies 5.16% (165) (118) (22) (16) (9)
Unsecured bond issues:
Bond issue in EUR 4.47% (499) – – (499) –
Bond issue in EUR 5.10% (597) – – – (597)
Bond issue in EUR 5.50% (200) – – (200) –
Bond issue in CLP 3.90% (47) – (3) (5) (39)
Deposits from third parties and other current interest bearing liabilities 4.74% (309) (302) (2) (4) (1)
Finance lease liabilities – (7) (1) (2) (3) (1)
Bank overdrafts – (747) (747) – – –
Net interest-bearing debt position (1,913) 154 (247) (1,008) (812)
Heineken N.V.Annual Report 2006108

2005 Average effective More interest 1 year 1-2 2-5 than In millions of EUR rate Total or less years years 5 years
Cash and cash equivalentsand current other investments – 608 596 4 4 4
Secured bank loans – (7) (7) – – –
Unsecured bank loans:
Loans from banks in EUR 2.70% (818) (249) (21) (279) (269)
Loans from banks in PLN 5.09% (76) (11) – (65) –
Loans from banks in CLP 2.97% (98) (6) – (39) (53)
Loans from banks in EGP 10.86% (111) (17) (29) (65) –
Bank loans in various currencies 3.83% (142) (121) (1) (12) (8)
Unsecured bond issues:
Bond issue in EUR 4.47% (498) – – (498) –
Bond issue in EUR 5.10% (596) – – – (596)
Bond issue in EUR 5.50% (200) – – (200) –
Bond issue in CLP 4.00% (50) (3) (3) (9) (35)
Deposits from third parties and othercurrent interest bearing liabilities 5.29% (300) (300) – – –
Finance lease liabilities – (8) (2) (2) (3) (1)
Bank overdrafts – (351) (351) – – –
Net interest-bearing debt position (2,647) (471) (52) (1,166) (958)
Committed facilities: the Heineken N.V. €2 billion Revolving Credit Facility 2005-2012 was not utilised per 31 December 2006 (31 December 2005: €160 million utilised).
109 Heineken N.V.Annual Report 2006

Financial Statements continued
Notes to the consolidated fi nancial statements
continued
30. Financial instruments continued Fair values The fair values of fi nancial instruments, together with their carrying amounts are shown below:
Carrying Fair Carrying Fair amount value amount value In millions of EUR 2006 2006 2005 2005
Held to maturity investments 583 583 481 481
Available-for-sale investments 202 202 165 165
Investments at fair value through profi t or loss 12 12 23 23
Trade and other receivables excluding derivatives 1,869 1,869 1,776 1,776
Cash and cash equivalents 1,466 1,466 580 580
Interest rate swaps (cash fl ow hedges):
Assets 1 1 2 2
Liabilities (3) (3) (8) (8)
Forward exchange contracts (cash fl ow hedges):
Assets 47 47 4 4
Liabilities (6) (6) (44) (44)
Forward rate agreements
Assets – – 5 5
Liabilities (1) (1) (10) (10)
Unsecured bond loans (1,343) (1,374) (1,344) (1,415)
Bank loans (893) (877) (1,252) (1,258)
Deposits from third parties and other current liabilities (309) (325) (300) (302)
Finance lease liabilities (7) (7) (8) (8)
Non-current non-interest bearing liabilities (33) (31) (38) (40)
Trade and other payables excluding dividend, interest and derivatives (2,421) (2,421) (2,317) (2,317)
(836) (866) (2,285) (2,366)
Unrecognised losses 30 81
The methods used in determining the fair values of fi nancial instruments are discussed in note 4.
31. Off balance sheet commitments Less than 1-5 More than Total In millions of EUR Total 1 Year Years 5 Years 2005
Guarantees to banks for loans (by third parties) 398 193 124 81 353
Other guarantees 116 30 67 19 65
Total guarantees 514 223 191 100 418
Lease & operational lease commitments 242 38 139 65 172
Property, plant & equipment ordered 127 127 – – 173
Raw material purchase contracts 610 117 185 308 227
Other off-balance sheet obligations 267 64 156 47 385
Off-balance sheet obligations 1,246 346 480 420 957
Committed bank facilities 2,411 211 200 2,000 2,341
Heineken leases buildings, cars and equipment.
Heineken N.V.Annual Report 2006110

During the year ended 31 December 2006, €133 million (2005: €126 million) was recognised as an expense in the income statement in respect of operating leases and rent.
Other off-balance sheet obligation include mainly rental, service and sponsorship contracts.
Committed bank facilities are credit facilities on which a commitment fee is paid as compensation for the bank’s requirement to reserve capital. The bank is obliged to provide the facility under the terms and conditions of the agreement.
In relation to the sale of a brewery site in Seville, Spain, Heineken España received bank guarantees from several banks to cover deferred payments by the buyer, due in November 2007 and March 2008.
32. Contingencies Netherlands Heineken Nederland, among some other brewers operating in the Netherlands, received a statement of objections from the European Commission in 2005, claiming that these brewers entered into concerted practices restricting competition in the Dutch market in the period 1995-1999. Heineken is challenging the allegations of the European Commission and submitted its defence on 24 November 2005. A ruling from the EC is expected during 2007.
USA Heineken USA and Heineken N.V. (and in certain cases other Heineken companies and Heineken Holding N.V.) have been named as defendants in purported ‘class action’ lawsuits fi led in nine states. The lawsuits claim that Heineken companies, along with other producers and distributors of alcohol beverages, have unlawfully advertised and marketed its products to underage people. Heineken is defending vigorously against these accusations, as Heineken companies advertise and market their products lawfully to people of legal drinking age.
Since 2005 six of the lawsuits were dismissed. Notices of appeal have been fi led by plaintiffs.
33. Related parties Identity of related parties Heineken also has a related party relationship with its associates (refer note 15), joint ventures (refer note 35), Heineken Holding N.V., Heineken pension fund and with its Executive Board and the Supervisory Board.
Board remuneration In millions of EUR 2006 2005
Executive Board 7.5 16.7
Supervisory Board 0.4 0.3
7.9 17.0
Executive Board The remuneration of the member of the Executive Board comprises a fi xed component and a variable component. The variable component is made up of a Short-Term Incentive Plan and a Long-Term Incentive Plan. The Short-Term Incentive Plan is based on an organic profi t growth target and specifi c year targets as set by the Supervisory Board. For the The Long-Term Incentive Plan we refer to note 27 and the separate remuneration report on page 62.
As at 31 December 2006 and as at 31 December 2005, the members of the Executive Board did not hold any of the Company’s shares, bonds or option rights, other then under the Long-Term Incentive Plan aforementioned. One of the Executive Board members held 3,052 shares of Heineken Holding N.V. as at 31 December 2006 (2005: 790 shares).
111 Heineken N.V.Annual Report 2006

Financial Statements continued
Notes to the consolidated fi nancial statements
continued
33. Related parties continued Executive Board Short-term Long-term Other Fixed incentive incentive Pension deferred Salary Plan Plan/bonus plan benefi ts Total In thousands of EUR 2006 2005 2006 2005 2006 2005 2006 2005 2006 2005 2006 2005
J.F.M.L. van Boxmeer 1 680 472 592 489 93 46 96 1,581 – – 1,461 2,588
M.J. Bolland1,4 306 418 189 455 50 43 82 1,358 2,550 – 3,177 2,274
D.R Hooft Graafl and1 525 418 455 455 86 43 129 1,795 – – 1,195 2,711
A. Ruys2 – 634 – 618 499 – – 4,000 – 1,160 499 6,412
K. Büche3 – 418 – 376 541 – – 980 – 901 541 2,675
Total 1,511 2,360 1,236 2,393 1,269 132 307 9,714 2,550 2,061 6,873 16,660
1 An extra payment over past service was made in 2005 in anticipation of the new pension policy for the current Executive Board members in effect as of 2006. The retirement age is 65, but individual Executive Board members may retire earlier with a reduced level of benefi t. Contribution rates are designed to enable an Executive Board member to retire from the company at the age of 62.
2 Stepped down from the Executive Board on 1 October 2005. At the end of 2006 their long-term bonuses were calculated. 3 Stepped down from the Executive Board on 1 October 2005. At the end of 2006 their long-term bonuses were calculated. 4 Stepped down from the Executive Board on 1 August 2006. Mr Bolland was compensated with an amount of €2,550,000,
refl ecting his 20 years of service within the Company.
Supervisory Board The individual members of the Supervisory Board received the following remuneration:
In thousands of EUR 2006 2005
C.J.A. van Lede 66 51
J.M. de Jong 52 45
M. Das 52 45
M.R. de Carvalho 50 43
A.H.J. Risseeuw 50 43
J.M.Hessels 50 43
I.C. MacLaurin 33 –
A.M. Fentener van Vlissingen 33 –
Total 386 270
One Supervisory Board member held 8 shares of Heineken N.V. as at 31 December 2006 (2005: 8 shares).
As at 31 December 2006 and 2005, the Supervisory Board members did not hold any of the Company’s bonds or option rights. Three (2005: two) Supervisory Board members together held 9,508 shares of Heineken Holding N.V. as at 31 December 2006 (2005: 9,508 shares).
Other related-party transactions There are no signifi cant transactions with associates and joint ventures.
Heineken Holding N.V In 2006 an amount of €551,000 (2005: €543,000) was paid to Heineken Holding N.V. for management services for the Heineken Group.
Heineken N.V.Annual Report 2006112

34. Heineken entities Control of Heineken The shares and options of the Company are traded on Euronext Amsterdam, where the Company is included in the main AEX index. Pursuant to the Major Holdings in Listed Companies Disclosure Act, Heineken Holding N.V. Amsterdam has disclosed an interest of 50.047 per cent in the Company. The fi nancial statements of the Company are included in the consolidated fi nancial statements of Heineken Holding N.V.
A declaration of joint and several liability pursuant to the provisions of Section 403, Part 9, Book 2, of the Netherlands civil code has been issued with respect to the legal entities established in the Netherlands marked with a • below.
Signifi cant subsidiaries Ownership interest Country of incorporation 2006 2005
• Heineken Nederlands Beheer B.V The Netherlands 100% 100%
• Heineken Brouwerijen B.V. The Netherlands 100% 100%
• Heineken Nederland B.V. The Netherlands 100% 100%
• Heineken International B.V. The Netherlands 100% 100%
• Heineken Supply Chain B.V. The Netherlands 100% 100%
• Amstel Brouwerij B.V. The Netherlands 100% 100%
• Amstel Internationaal B.V. The Netherlands 100% 100%
• Vrumona B.V. The Netherlands 100% 100%
• Invebra Holland B.V. The Netherlands 100% 100%
• B.V. Beleggingsmaatschappij Limba The Netherlands 100% 100%
• Brand Bierbrouwerij B.V. The Netherlands 100% 100%
• Beheer- en Exploitatiemaatschappij Brand B.V. The Netherlands 100% 100%
• Heineken CEE Holdings B.V. The Netherlands 100% 100%
• Brasinvest B.V. The Netherlands 100% 100%
• Heineken Beer Systems B.V. The Netherlands 100% 100%
Heineken France S.A. France 100% 100%
Heineken España S.A. Spain 98.5% 98.3%
Heineken Italia S.p.A Italy 100% 100%
Athenian Brewery S.A. Greece 98.8% 98.8%
Brau Union AG Austria 100% 100%
Grupa Zywiec S.A.1 Poland 61.8% 61.8%
Heineken Ireland Ltd.2 Ireland 100% 100%
Brau Union Hungary Rt Hungary 99.6% 99.5%
Heineken Slovensko a.s. Slovakia 100% 100%
Heineken Switzerland AG Switzerland 100% 100%
Karlovacka Pivovara d.d. Croatia 100% 97.5%
Mouterij Albert N.V. Belgium 100% 100%
Ibecor S.A. Belgium 100% 100%
Affl igem Brouwerij BDS N.V. Belgium 100% 100%
LLC Heineken Brewery Russia 100% 100%
Dinal LLP Kazakhstan 99.9% 99.9%
Heineken USA Inc. USA 100% 100%
Starobrno a.s. Czech Republic 97.6% 97.6%
Brau Union Romania S.A. Romania 96.3% 96.3%
Ivan Taranov Breweries Ltd. Cyprus 100% 100%
LLC Combinat named after Stepan Razin Russia 100% 100%
113 Heineken N.V.Annual Report 2006

Financial Statements continued
Notes to the consolidated fi nancial statements
continued
34. Heineken entities continued
Ownership interest Country of incorporation 2006 2005
OJSC Patra Russia 100% 100%
OJSC Baikal Brewery Company Russia 100% 100%
LLC Central-European Brewing Company Russia 100% 100%
Commonwealth Brewery Ltd. Bahamas 53.2% 53.2%
Windward & Leeward Brewery Ltd. St Lucia 72.7% 72.7%
Cervecerias Baru-Panama S.A. Panama 74.9% 74.8%
Nigerian Breweries Plc. Nigeria 54.1% 54.1%
Al Ahram Beverages Company S.A.E. Egypt 99.9% 99.9%
Brasserie Lorraine S.A. Martinique 83.1% 83.1%
Surinaamse Brouwerij N.V. Surinam 76.1% 76.1%
Consolidated Breweries Ltd. Nigeria 50.1% 50.1%
Grande Brasserie de Nouvelle Calédonie S.A. New Caledonia 87.3% 87.3%
Brasserie Almaza S.A.L. Lebanon 67.0% 67.0%
Brasseries, Limonaderies et Malteries ‘Bralima’ S.A.R.L. R.D. Congo 95.0% 95.0%
Brasseries et Limonaderies du Rwanda ‘Bralirwa’ S.A. Rwanda 70.0% 70.0%
Brasseries et Limonaderies du Burundi ‘Brarudi’ S.A. Burundi 59.3% 59.3%
Brasseries de Bourbon S.A. Réunion 85.6% 85.6%
P.T. Multi Bintang Indonesia Tbk. Indonesia 84.5% 84.5%
1 Excluding treasury shares (will be cancelled in the course of 2007).
2 In accordance with article 17 of the Republic of Ireland Companies (Amendment) Act 1986, the Company issued an irrevocable guarantee for the year ended 31 December 2006 and 2005 regarding the liabilities of Heineken Ireland Ltd., and Heineken Ireland Sales Ltd., as referred to in article 5(c) of the Republic of Ireland Companies (Amendment) Act 1986.
35. Interests in joint ventures Heineken has interests in the following joint ventures:
Ownership interest Country of incorporation 2006 2005
BrauHolding International GmbH & Co KGaA Germany 49.9% 49.9%
Zagorka Brewery A.D. Bulgaria 49.0% 49.0%
Pivara Skopje A.D Macedonia 27.6% 27.6%
Brasseries du Congo S.A. Congo 50.0% 50.0%
Asia Pacifi c Investment Pte.Ltd. Singapore 50.0% 50.0%
Asia Pacifi c Breweries (Singapore) Pte.Ltd. Singapore 41.9% 41.9%
Shanghai Asia Pacifi c Brewery Ltd. China 44.6% 44.6%
Hainan Asia Pacifi c Brewery Ltd. China 46.0% 46.0%
South Pacifi c Brewery Ltd. Papua New Guinea 31.8% 31.8%
Vietnam Brewery Ltd. Vietnam 25.2% 25.2%
Cambodia Brewery Ltd. Cambodia 33.5% 33.5%
DB Breweries Ltd. New Zealand 41.9% 41.9%
Compania Cervecerias Unidas S.A. Chile 33.1% 32.1%
Tempo Beverages Ltd. Israel 40.0% 40.0%
United Breweries Lanka Ltd. Sri Lanka 25.2% 25.3%
Société de Production et de Distribution des Boissons “SPDB” Tunesia 49.9%
Heineken N.V.Annual Report 2006114

Via joint ventures Heineken is able to jointly govern the fi nancial and operating policies of the above-mentioned companies. Consequently, Heineken proportionally consolidates these companies.
Reporting date The reporting date of the fi nancial statements of all Heineken entities and joint ventures disclosed are the same as for the Company, except for: Asia Pacifi c Breweries (Singapore) Pte. Ltd., Shanghai Asia Pacifi c Brewery Ltd., Hainan Asia Pacifi c Brewery Ltd., South Pacifi c Brewery Ltd., Vietnam Brewery Ltd. and Cambodia Brewery Ltd., which have a 30 September reporting date.
Included in the consolidated fi nancial statements are the following items that represent Heineken’s interests in the assets and liabilities, revenue and expenses of the joint ventures:
In millions of EUR 2006 2005
Non-current assets 982 958
Current assets 504 489
Non-current liabilities (328) (333)
Current liabilities (441) (381)
Net assets 717 733
Revenue 1,295 1,125
Expenses (1,155) (1,009)
Operating Profi t 140 116
36. Subsequent events There are no signifi cant subsequent events to report until 20 February 2007.
115 Heineken N.V.Annual Report 2006

Financial Statements continued
Heineken N.V. balance sheet Before appropriation of profi t as at 31 December 2006
In millions of EUR Note 2006 2005
Fixed assets
Financial fi xed assets 37 6,160 5,319
Total fi xed assets 6,160 5,319
Trade and other receivables 3 1
Cash and cash equivalents 3 41
Total current assets 6 42
Total assets 6,166 5,361
Shareholders’ equity
Issued capital 784 784
Translation reserve 96 148
Other legal reserves 459 392
Hedging reserve 28 (21)
Fair value reserve 97 49
Reserve for own shares (14) –
Retained earnings 2,348 1,856
Net profi t 1,211 761
Total shareholders’ equity 38 5,009 3,969
Liabilities
Loans and borrowings 39 1,096 1,254
Total non-current liabilities 1,096 1,254
Current loans and borrowings – 68
Trade and other payables 27 32
Tax payable 34 38
Total current liabilities 61 138
Total liabilities 1,157 1,392
Total shareholders’ equity and liabilities 6,166 5,361
Heineken N.V.Annual Report 2006116

In millions of EUR Note 2006 2005
Share of profi t of participating interests, after income tax 37 1,190 743
Other profi t after income tax 21 18
Net profi t 1,211 761
Heineken N.V. income statement For the year ended 31 December 2006
117 Heineken N.V.Annual Report 2006
Financial Statements continued
Reporting entityThe fi nancial statements of Heineken N.V. (the ‘Company’) are included in the consolidated statements of Heineken.
Basis of preparation The Company fi nancial statements have been prepared in accordance with the provisions of Part 9, Book 2, of the Netherlands Civil Code. The Company uses the option of Article 362.8 of Part 9, Book 2, of the Netherlands Civil Code to prepare the Company fi nancial statements, using the same accounting policies as in the consolidated fi nancial statements. Valuation is based on recognition and measurement requirements of accounting standards adopted by the EU (i.e., only IFRSs that are adopted for use in the EU at the date of authorisation) as explained further in the notes to the consolidated fi nancial statements).
The Company presents a condensed income statement, using the facility of Article 402 of Part 9, Book 2, of the Netherlands Civil Code.
Signifi cant accounting policies Financial fi xed assets Participating interests (subsidiaries, joint ventures and associates) are measured on the basis of the equity method.
Shareholders’ equity The translation reserve and other legal reserves are previously formed under and still recognised and measured in accordance with the Netherlands Civil Code.
Profi t of participating interests The share of profi t of participating interests consists of the share of the Company in the results of these participating interests. Results on transactions, where the transfer of assets and liabilities between the Company and its participating interests and mutually between participating interests themselves, are not recognised.
Notes to Heineken N.V. fi nancial statements
Heineken N.V.Annual Report 2006118

37. Financial fi xed assets
Loans to Participating participating In millions of EUR interest interest Total
Balance at 1 January 2005 950 3,422 4,372
Change in accounting policies IAS 32/39 44 – 44
Profi t of participating interests 743 – 743
Dividend payments by participating interests (244) 244 –
Effect of movements in exchange rates 143 – 143
Changes in hedging and fair value adjustments (38) – (38)
Other movements 55 55
Balance as at 31 December 2005 1,598 3,721 5,319
Balance at 1 January 2006 1,598 3,721 5,319
Loans converted into share capital 815 (815) –
Profi t of participating interests 1,190 – 1,190
Dividend payments by participating interests (232) 232 –
Effect of movements in exchange rates (52) – (52)
Changes in hedging and fair value adjustments 97 – 97
Other movements (1) (393) (394)
Balance as at 31 December 2006 3,415 2,745 6,160
119 Heineken N.V.Annual Report 2006

Financial Statements continued
38. Shareholders’ equityCapital and reserves
Other Fair Reserve Issued Translation legal Hedging value for own Retained Total In millions of EUR capital reserve reserves reserve reserve shares earnings Net profi t equity
Balance at 1 January 2005 784 5 349 – – – 1,476 642 3,256
Net income recognised directly in equity 7,8 – 143 25 (21) 49 – (48) – 148
Profi t – – 80 – – – (80) 761 761
Transfer to retained earnings – – (62) – – – 704 (642) –
Dividends to shareholders – – – – – – (196) – (196)
Balance at 31 December 2005 784 148 392 (21) 49 – 1,856 761 3,969
Balance at 1 January 2006 784 148 392 (21) 49 – 1,856 761 3,969
Net income recognised directly in equity7 – (52) (6) 49 48 – (4) – 35
Profi t – – 110 – – – (110) 1,211 1,211
Transfer to retained earnings – – (37) – – – 798 (761) –
Dividends to shareholders – – – – – – (196) – (196)
Purchase own shares – – – – – (14) – – (14)
Share based payments – – – – – – 4 – 4
Balance at 31 December 2006 784 96 459 28 97 (14) 2,348 1,211 5,009
7 Net income recognised directly in equity is explained in the consolidated statement of income and expense. 8 Included is the effect of the change in accounting policy due to the application of IAS 32/39 amounting to €44 million.
For more details on reserves, please refer to note 22 of the consolidated fi nancial statements.
For more details on LTIP, please refer to note 27 of the consolidated fi nancial statements.
Notes to Heineken N.V. fi nancial statements
continued
Heineken N.V.Annual Report 2006120

39. Loans and borrowings Terms and debt repayment schedule
Average effective 1 year 1-2 2-5 More than In millions of EUR interest rate Total or less years years 5 years 2005
Bond loan in EUR 4.47% 499 – – 499 – 498
Bond loan in EUR 5.10% 597 – – – 597 596
Loans from banks in EUR 2.41% – – – – – 160
1,096 – – 499 597 1,254
40. Off-balance-sheet commitments Less than 1-5 More than In millions of EUR Total 1 year years 5 years 2005
Committed bank facility 2,000 – – 2,000 2,000
2006 2005 Third Heineken Third Heineken parties companies parties companies
Declarations of joint and several liability – 1,364 – 920
Fiscal unity The Company is part of the fi scal unity of Heineken in the Netherlands. Based on this the Company is liable for the tax liability of the fi scal unity in the Netherlands.
41. Other disclosures Remuneration We refer to note 33 of the Consolidated Financial Statements for the remuneration and the incentives of the Executive Board members and the Supervisory Board. The Executive Board members are the only employees of the Company.
Participating interests For the list of direct and indirect participating interests, we refer to notes 15, 34 and 35 to the consolidated fi nancial statements.
Amsterdam, 20 February 2006 Executive Board Supervisory Board
Van Boxmeer Van Lede
Hooft Graafl and De Jong
Das
de Carvalho
Risseeuw
Hessels
Fentener van Vlissingen
MacLaurin
121 Heineken N.V.Annual Report 2006

Report on the fi nancial statements We have audited the 2006 fi nancial statements of Heineken N.V., Amsterdam as set out on pages 67 to 121. The fi nancial statements consist of the consolidated fi nancial statements and the Company fi nancial statements. The consolidated fi nancial statements comprise the consolidated balance sheet as at 31 December 2006, the income statement, statement of recognised income and expense and statement of cash fl ows for the year then ended, and a summary of signifi cant accounting policies and other explanatory notes. The Company fi nancial statements comprise the Company balance sheet as at 31 December 2006, the Company income statement for the year then ended and the notes.
Management’s responsibility The Executive Board is responsible for the preparation and fair presentation of the fi nancial statements in accordance with International Financial Reporting Standards as adopted by the European Union and with Part 9 of Book 2 of the Netherlands Civil Code, and for the preparation of the report of the Executive Board in accordance with Part 9 of Book 2 of the Netherlands Civil Code. This responsibility includes: designing, implementing and maintaining internal control relevant to the preparation and fair presentation of the fi nancial statements that are free from material misstatement, whether due to fraud or error; selecting and applying appropriate accounting policies; and making accounting estimates that are reasonable in the circumstances.
Auditor’s responsibility Our responsibility is to express an opinion on the fi nancial statements based on our audit. We conducted our audit in accordance with Dutch law. This law requires that we comply with ethical requirements and plan and perform our audit to obtain reasonable assurance whether the fi nancial statements are free from material misstatement.
An audit involves performing procedures to obtain audit evidence about the amounts and disclosures in the fi nancial statements. The procedures selected depend on the auditor’s judgement, including the assessment of the risks of material misstatement of the fi nancial statements, whether due to fraud or error. In making those risk assessments, the auditor considers internal control relevant to the entity’s preparation and fair presentation of the fi nancial statements in order to design audit procedures that are appropriate in the circumstances, but not for the purpose of expressing an opinion on the effectiveness of the entity’s internal control. An audit also includes evaluating the appropriateness of accounting policies used and the reasonableness of accounting estimates made by management, as well as evaluating the overall presentation of the fi nancial statements.
We believe that the audit evidence we have obtained is suffi cient and appropriate to provide a basis for our audit opinion.
Opinion with respect to the consolidated fi nancial statements In our opinion, the consolidated fi nancial statements give a true and fair view of the fi nancial position of Heineken N.V. as at 31 December 2006, and of its result and its cash fl ow for the year then ended in accordance with International Financial Reporting Standards as adopted by the European Union and with Part 9 of Book 2 of the Netherlands Civil Code.
Opinion with respect to the Company fi nancial statements In our opinion, the Company fi nancial statements give a true and fair view of the fi nancial position of Heineken N.V. as at 31 December 2006, and of its result for the year then ended in accordance with Part 9 of Book 2 of the Netherlands Civil Code.
Other information
To: Annual General Meeting of Shareholders of Heineken N.V.
Auditor’s report
Heineken N.V.Annual Report 2006122

Report on other legal and regulatory requirementsPursuant to the legal requirement under 2:393 sub 5 part e of the Netherlands Civil Code, we report, to the extent of our competence, that the report of the Executive Board as set out on pages 8 to 61 is consistent with the fi nancial statements as required by 2:391 sub 4 of the Netherlands Civil Code.
Amsterdam, 20 February 2007
KPMG ACCOUNTANTS N.V.
J.F.C. van Everdingen RA
123Heineken N.V.Annual Report 2006

Other information continued
Appropriation of profi t
Appropriation of profi t Article 12, paragraph 7, of the Articles of Association stipulates:
‘Of the profi ts, payment shall fi rst be made, if possible, of a dividend of six per cent of the issued part of the authorised share capital. The amount remaining shall be at the disposal of the General Meeting of Shareholders.’
It is proposed to appropriate €294 million of the profi t for payment of dividend and to add €917 million to the retained profi ts.
Civil Code Heineken N.V. is not a ‘structuurvennootschap’ within the meaning of Sections 152-164 of the Netherlands Civil Code. Heineken Holding N.V., a company listed on Euronext Amsterdam, holds 50.047 per cent of the shares of Heineken N.V.
Authorised capital The Company’s authorised capital amounts to €2.5 billion.
Heineken N.V.Annual Report 2006124

Investor Relations Heineken takes a proactive role in maintaining an open dialogue with shareholders and bondholders, providing accurate and complete information in a timely and consistent way. We do this through press releases, the annual report, presentations, webcasts, regular briefi ngs and open days with analysts, fund managers and shareholders.
Ownership structure Standing at the head of the Heineken Group, Heineken Holding N.V. is no ordinary holding company. Since its formation in 1952, the objective of Heineken Holding N.V., pursuant to its Articles of Association has been to manage and/or supervise the Heineken Group and to provide services to the Heineken Group. The role Heineken Holding N.V. has performed for the Heineken Group since 1952 has been to safeguard its continuity, independence and stability and create conditions for controlled, steady growth of the activities of the Heineken Group. This stability has enabled the Heineken Group to rise to its present position as the brewer with the widest international presence and one of the world’s largest brewing groups. Every Heineken N.V. share held by Heineken Holding N.V. is matched by one share issued by Heineken Holding N.V. The net asset value of one Heineken Holding N.V. share is therefore identical to the net asset value of one Heineken N.V. share. The dividend payable on the two shares is also identical. Historically, however, Heineken Holding N.V. shares have traded at a lower price due to technical factors that are market-specifi c.
Shares and options Heineken N.V. Heineken N.V. shares are traded on Euronext Amsterdam, where the Company is included in the main AEX Index. Prices for the ordinary shares may be accessed on Bloomberg under the symbols HEIA NA and HEIO NA and on the Reuters Equities 2000 Service under HEIA.AS and HEHN.AS. The ISIN code is NL0000009165. Options on Heineken N.V. shares are listed on Euronext.Liffe.
Additional information is available on the website: www.heinekeninternational.com.
In 2006, the average daily volume of trade was 1,608,718 shares. Heineken N.V. is not a ‘structuurvennootschap’ within the meaning of the Netherlands Civil Code. Consequently, decisions on all important matters are taken by the General Meeting of Shareholders.
Right to add agenda items Shareholders who, alone or together, represent at least 1 per cent of Heineken N.V.’s issued capital or hold shares with a market value of €50 million have the right to request items to be placed on the agenda of the General Meeting of Shareholders. Requests to place items on the agenda must be received by Heineken N.V. at least 60 days before the date of the General Meeting of Shareholders. Heineken N.V. reserves the right to refuse to place an item on the agenda if its inclusion would be contrary to the Company’s material interest.
Market capitalisation On 29 December 2006, there were 489,974,594 shares of €1.60 nominal value in issue. At a year-end price of €36.03 on 29 December 2006, the market capitalisation of Heineken N.V. on balance sheet date was €17.7 billion.
Year-end price €36.03 29 December 2006 High €37.89 21 November 2006 Low €26.76 6 January 2006
Shareholder information
125Heineken N.V.Annual Report 2006
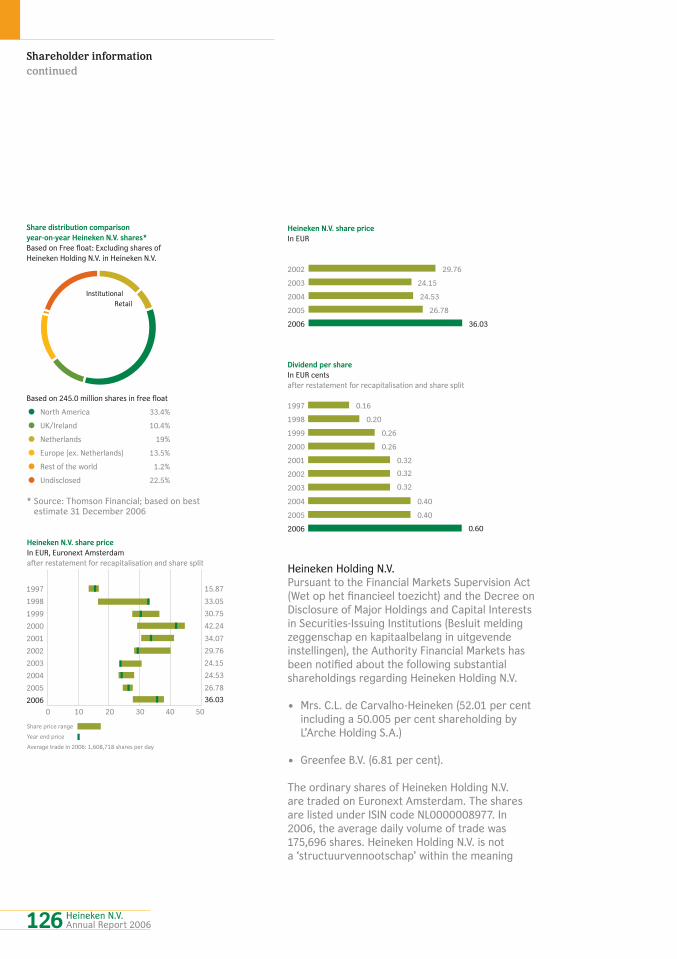
1997
1998
1999
2000
2001
2002
2003
2004
2005
2006
0.16
0.20
0.26
0.26
0.32
0.32
0.32
0.40
0.40
0.60
Dividend per share In EUR cents
after restatement for recapitalisation and share split
2002
2003
2004
2005
2006
29.76
24.15
24.53
26.78
36.03
Heineken N.V. share price In EUR
0 10 20 30 40 50
1997
1998
1999
2000
2001
2002
2003
2004
2005
2006
26.78
36.03
24.53
24.15
29.76
34.07
42.24
30.75
33.05
15.87
Heineken N.V. share priceIn EUR, Euronext Amsterdam
after restatement for recapitalisation and share split
Share price range
Year end price
Average trade in 2006: 1,608,718 shares per day
Based on 245.0 million shares in free float
• North America 33.4%
• UK/Ireland 10.4%
• Netherlands 19%
• Europe (ex. Netherlands) 13.5%
• Rest of the world 1.2%
• Undisclosed 22.5%
Share distribution comparisonyear-on-year Heineken N.V. shares*Based on Free float: Excluding shares of
Heineken Holding N.V. in Heineken N.V.
Institutional
Retail
Heineken Holding N.V. Pursuant to the Financial Markets Supervision Act (Wet op het fi nancieel toezicht) and the Decree on Disclosure of Major Holdings and Capital Interests in Securities-Issuing Institutions (Besluit melding zeggenschap en kapitaalbelang in uitgevende instellingen), the Authority Financial Markets has been notifi ed about the following substantial shareholdings regarding Heineken Holding N.V.
• Mrs. C.L. de Carvalho-Heineken (52.01 per cent including a 50.005 per cent shareholding by L’Arche Holding S.A.)
• Greenfee B.V. (6.81 per cent).
The ordinary shares of Heineken Holding N.V. are traded on Euronext Amsterdam. The shares are listed under ISIN code NL0000008977. In 2006, the average daily volume of trade was 175,696 shares. Heineken Holding N.V. is not a ‘structuurvennootschap’ within the meaning
Shareholder information
continued
* Source: Thomson Financial; based on best estimate 31 December 2006
Heineken N.V.Annual Report 2006126
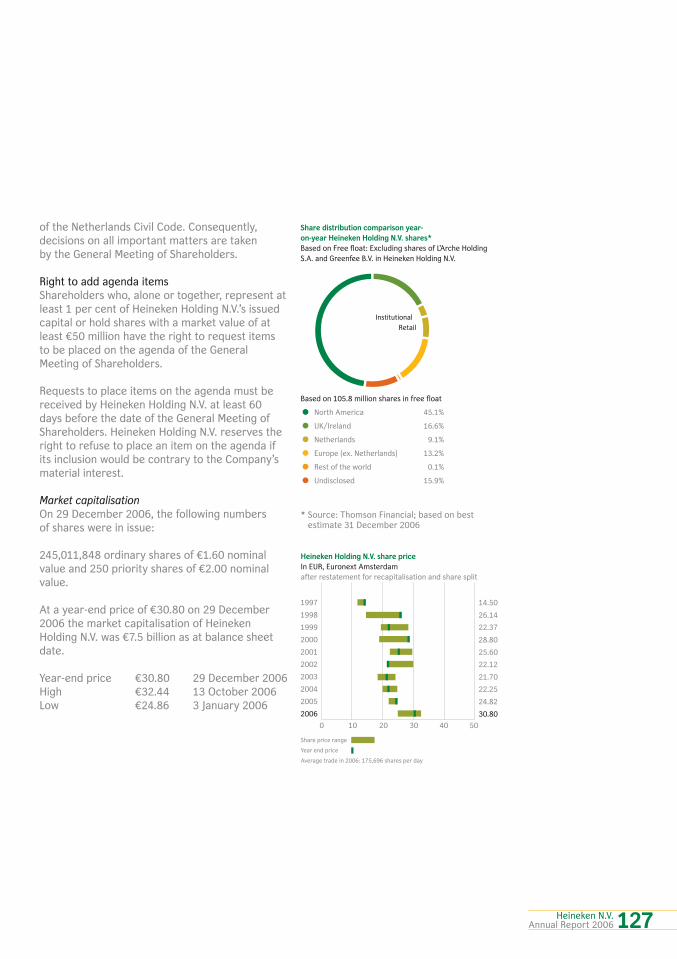
Based on 105.8 million shares in free float
• North America 45.1%
• UK/Ireland 16.6%
• Netherlands 9.1%
• Europe (ex. Netherlands) 13.2%
• Rest of the world 0.1%
• Undisclosed 15.9%
Share distribution comparison year- on-year Heineken Holding N.V. shares*Based on Free float: Excluding shares of L’Arche Holding
S.A. and Greenfee B.V. in Heineken Holding N.V.
Institutional
Retail
0 10 20 30 40 50
24.82
30.80
22.25
21.70
22.12
25.60
28.80
22.37
26.14
14.50
Heineken Holding N.V. share price In EUR, Euronext Amsterdam
after restatement for recapitalisation and share split
Share price range
Year end price
Average trade in 2006: 175,696 shares per day
1997
1998
1999
2000
2001
2002
2003
2004
2005
2006
of the Netherlands Civil Code. Consequently, decisions on all important matters are taken by the General Meeting of Shareholders.
Right to add agenda items Shareholders who, alone or together, represent at least 1 per cent of Heineken Holding N.V.’s issued capital or hold shares with a market value of at least €50 million have the right to request items to be placed on the agenda of the General Meeting of Shareholders.
Requests to place items on the agenda must be received by Heineken Holding N.V. at least 60 days before the date of the General Meeting of Shareholders. Heineken Holding N.V. reserves the right to refuse to place an item on the agenda if its inclusion would be contrary to the Company’s material interest.
Market capitalisation On 29 December 2006, the following numbers of shares were in issue:
245,011,848 ordinary shares of €1.60 nominal value and 250 priority shares of €2.00 nominal value.
At a year-end price of €30.80 on 29 December 2006 the market capitalisation of Heineken Holding N.V. was €7.5 billion as at balance sheet date.
Year-end price €30.80 29 December 2006High €32.44 13 October 2006Low €24.86 3 January 2006
* Source: Thomson Financial; based on best estimate 31 December 2006
127Heineken N.V.Annual Report 2006

Shareholder information
continued
Financial calendar in 2007 for both Heineken N.V. and Heineken Holding N.V. Announcement of 2006 results 21 February Publication of annual report 19 March Annual General Meeting of Shareholders, Amsterdam 19 April Quotation ex-fi nal dividend 23 April Final dividend 2006 payable 8 May Announcement of half-year results 2007 29 August Quotation ex-interim dividend 30 August Interim dividend 2007 payable 20 September
Bonds Heineken N.V. bonds are listed at the Luxembourg Stock Exchange. Two bond loans were issued on 4 November 2003. One was issued for €500 million with a coupon interest rate of 4.375 per cent, maturing on 4 February 2010 and listed under ISIN code XS0179266597.
Another one was issued for €600 million with a coupon interest rate of 5.00 per cent, maturing on 4 November 2013 and listed under ISIN code XS0179266753.
Contacting Heineken N.V. and Heineken Holding N.V. Further information on Heineken N.V. is obtainable from the Group Corporate Relations and/or Investor Relations department, telephone +31 20 523 92 39 or by e-mail: [email protected].
Further information on Heineken Holding N.V. is obtainable by telephone +31 20 622 11 52 or fax +31 20 625 22 13. Information is also obtainable from the Investor Relations department, telephone +31 20 523 92 39 or by e-mail: [email protected].
The website www.heinekeninternational.com also carries further information about both Heineken N.V. and Heineken Holding N.V.
Heineken N.V.Annual Report 2006128

1. Western Europe Heineken is Western Europe’s largest and leading beer brewer. We have market leadership positions in the Netherlands, Spain and Italy and we are the number two player in France, Ireland and Switzerland. Heineken, and in some cases Amstel, are also brewed under licence or imported into several other Western European markets.
2. Central and Eastern Europe Brau Union is Heineken’s Central European operating company and the largest brewing group in Central Europe, leading in Greece, Austria, Romania, Slovakia, Bulgaria and Macedonia. We are the number two player in Poland. Brau Union has also strong market positions in Russia, Germany, Hungary, Croatia and the Czech Republic.
3. The AmericasHeineken has built a strong position in the Americas, with exports to the USA, Central America and the Caribbean. Heineken also owns a number of breweries in the Caribbean and Central America and has interests in and licensing agreements with several breweries in Central and South America. The agreement of Heineken USA and FEMSA Cerveza in Mexico makes Heineken the exclusive national importer, marketer and seller of FEMSA’s brands. Our interest in CCU has strengthened our position in Chile and Argentina.
4. Africa and the Middle East Heineken has owned breweries and has enjoyed substantial market positions in several African countries for more than 50 years. In Africa we brew a variety of local brands and in some countries Heineken and Amstel beer are also brewed locally. Most of the operating companies also produce and market soft drinks. In South Africa, Amstel is brewed and distributed under licence.
5. Asia Pacifi c Underpinning our position in the region is our Singapore-based joint venture with Fraser & Neave, Asia Pacifi c Breweries (APB). It operates 23 breweries in Singapore, Malaysia, Thailand, Vietnam, Cambodia, China, New Zealand, Papua New Guinea, India and Sri Lanka. Heineken is brewed at several of APB’s breweries throughout the region. In addition, we have our own breweries in Indonesia and on New Caledonia. We also import Heineken into the region. Heineken beer has a strong market position, particularly in Thailand, Vietnam, Hong Kong, Australia, New Zealand, Singapore and Taiwan.
Geographical distribution of Consolidated beer volume
In millions of hectolitres 2006 2005 %
Western Europe 32,100 31,896 0.6
Central and Eastern Europe 46,925 39,308 19.4
The Americas 13,197 11,782 12.0
Africa and the Middle East 13,281 11,559 14.9
Asia Pacifi c 6,402 5,976 7.1
Consolidated beer volume 111,905 100,521 11.3
Reach
Countries and brands
As at 31 December 2006 Export offi ces are not shown
129Heineken N.V.Annual Report 2006
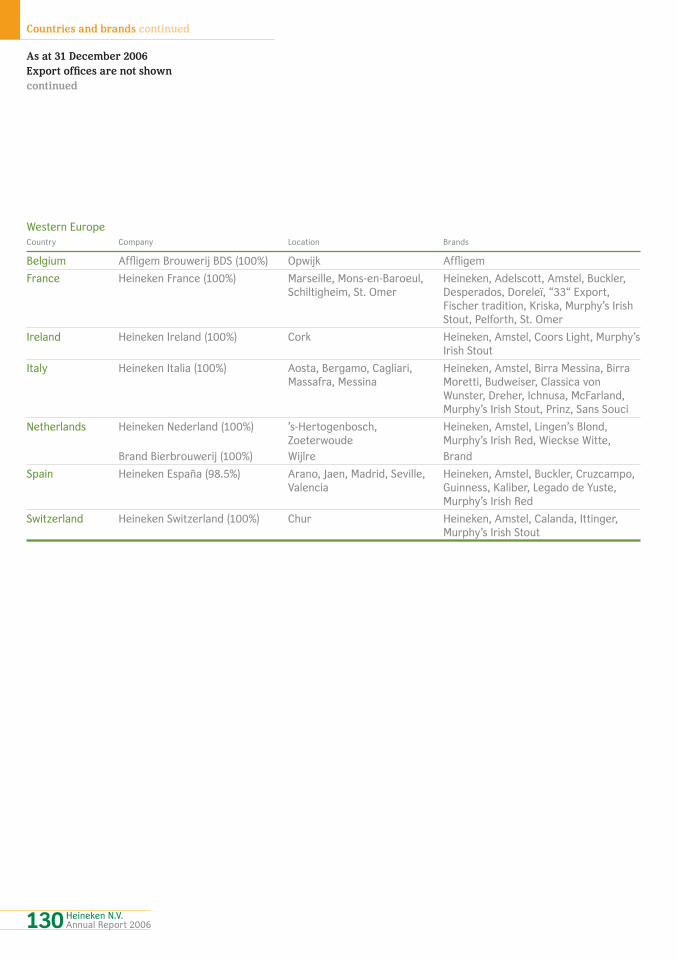
Western Europe Country Company Location Brands
Belgium Affl igem Brouwerij BDS (100%) Opwijk Affl igem
France Heineken France (100%) Marseille, Mons-en-Baroeul, Schiltigheim, St. Omer
Heineken, Adelscott, Amstel, Buckler, Desperados, Doreleï, “33“ Export, Fischer tradition, Kriska, Murphy’s Irish Stout, Pelforth, St. Omer
Ireland Heineken Ireland (100%) Cork Heineken, Amstel, Coors Light, Murphy’s Irish Stout
Italy Heineken Italia (100%) Aosta, Bergamo, Cagliari, Massafra, Messina
Heineken, Amstel, Birra Messina, Birra Moretti, Budweiser, Classica von Wunster, Dreher, Ichnusa, McFarland, Murphy’s Irish Stout, Prinz, Sans Souci
Netherlands Heineken Nederland (100%)
Brand Bierbrouwerij (100%)
’s-Hertogenbosch, Zoeterwoude
Wijlre
Heineken, Amstel, Lingen’s Blond, Murphy’s Irish Red, Wieckse Witte,
Brand
Spain Heineken España (98.5%) Arano, Jaen, Madrid, Seville, Valencia
Heineken, Amstel, Buckler, Cruzcampo, Guinness, Kaliber, Legado de Yuste, Murphy’s Irish Red
Switzerland Heineken Switzerland (100%) Chur Heineken, Amstel, Calanda, Ittinger, Murphy’s Irish Stout
Countries and brands continued
As at 31 December 2006
Export offi ces are not shown
continued
Heineken N.V.Annual Report 2006130

Central and Eastern Europe Country Company Location Brands
Austria Brau Union Österreich (100%) Göss, Puntigam, Schladming, Schwechat, Wieselburg, Zipf
Heineken, Edelweiss, Gösser, Kaiser, Puntigamer, Schlossgold, Schwechater, Wieselburger, Zipfer
Bulgaria Zagorka Brewery (49%) Stara Zagora Heineken, Amstel, Ariana, Stolichno, Zagorka
Croatia Karlovacka Pivovara (100%) Karlovac Heineken, Desperados, Karlovacko
Czech Republic Starobrno (97.6%) Brno, Znojmo Heineken, Amstel, Hostan, Starobrno, Zlaty Bazant
Germany Paulaner Brauerei (25%)
Kulmbacher Brauerei (31.4%)
Karlsberg (22.5%)
Fürstlich Fürstenbergische Brauerei (49.9%)
Hoepfner Brauerei (49.9%)
Würzburger Hofbräu (31.4%)
Munich, Rosenheim
Chemnitz, Kulmbach, Plauen
Homburg, Koblenz
Donaueschingen
Karlsruhe
Würzburg, Poppenhausen
Hacker-Pschorr, Paulaner, Paulaner Weissbier
Kulmbacher, Mönchshof, Sternquell-pils
Desperados, Karlsberg, Mixery, UrPils
Bären Pilsner, Fürstenberg, Riegeter, QOWAZ
Arnegger, Edel-Weizen, Export, Goldköpfl e, Grape, Hefe Weißbier, Hoepfner Pilsner, Judelbier, Keller-Weißbier, Kraüsen, Leicht, Maibock, Porter, Radler
Würzburger Hofbräu, Werner Bräu, Lohrer Bier, Wächtersbacher
Greece Athenian Brewery (98.8%) Athens, Patras, Thessaloniki Heineken, Alfa, Amstel, Buckler, Desperados, Fischer McFarland, Murphy’s Irish Stout, Zorbas
Hungary Brau Union Hungaria (99.6%) Martfü, Sopron Heineken, Amstel, Buckler, Gösser, Kaiser, Schlossgold, Soproni Ászok, Talléros, Zlaty Bazant
Kazakhstan Dinal (99.9%) Almaty Heineken, Amstel, Tian Shan
Macedonia Pivara Skopje (27.6%) Skopje Heineken, Amstel, Gorsko, Skopsko
131Heineken N.V.Annual Report 2006

Central and Eastern Europe continued
Country Company Location Brands
Poland Grupa Zywiec (61.8%) Bydgoszcz, Cieszyn, Elblag, Lezajsk, Warka, Zywiec
Heineken, Krolewskie, Kujawiak, Lezajsk, Specjal, Strong, Tatra, Warka Jasne Pelne, Zywiec, Budweiser
Romania Brau Union Romania (96.3%) Bucuresti, Constanta, Craiova, Hateg, Miercurea Ciuc
Heineken, Bucegi, Ciuc, Gambrinus, Golden Brau, Gösser, Schlossgold, Silva
Russia Heineken Brewery (100%)
Heineken Brewery Siberia (100%)
Shikhan Brewery (99.2%)
Volga Brewery (100%)
Stepan Razin (100%)
Patra (100%)
Heineken Brewery Baikal (100%)
PIT Kaliningrad (100%)
PIT Novotroitsk (100%)
Amur-Pivo (98.8%)
St. Petersburg
Novosibirsk
Sterlitamak
Nizhnyi Novgorod
St. Petersburg
Ekaterinburg
Irkutsk
Kaliningrad
Novotroitsk
Chabarovsk
Heineken, Amstel, Botchkarov, Ochota, Zlaty Bazant, Bud, Kirin, Guinness, Kilkenny, Buckler
Sobol, Zhigulevskoye
Sedoy Ural, Shikhan, Solyanaya Pristan
Okskoye, Rusich, Volga
Stepan Razin, Kalinkin, Ordinar
Patra, Strelets, Zhigulevskoye
Zhigulevskoye, Yantarnie, Rizhkoye, Kumanda, Gubernatorskoye, Brandmayor
PIT, Docter Diesel, Ostmark, Three Bears, Gösser, Bitburger
PIT, Docter Diesel, Three Bears, Gösser
PIT, Amur-Pivo, Docter Diesel, Three Bears
Slovakia Heineken Slovensko (100%) Hurbanovo Heineken, Amstel, Corgon, Gemer, Kelt, Martiner, Zlaty Bazant
As at 31 December 2006
Export offi ces are not shown
continued
Countries and brands continued
Heineken N.V.Annual Report 2006132

The Americas
Country Company Location Brands
Argentina Companias Cervecerias Unidas Argentina (30.4%)
Salta, Santa Fe Heineken, Budweiser, Cordoba, Rosario, Salta, Santa Fe, Schneider
Bahamas Commonwealth Brewery (53.2%) Nassau Heineken, Guinness, Kalik, Vitamalt
Chile Companias Cervecerias Unidas (33.1%)
Antofagasta, Santiago, Temuco
Heineken, Cristal, Escudo
• Costa Rica Cervecería Costa Rica (25%) San José Heineken, Bavaria, Imperial, Pilsen, Rock Ice
• Dominican Republic
Cervecería Nacional Dominicana (9.3%)
Santo Domingo Presidente
• Haiti Brasserie Nationale d’Haïti (23.3%) Port-au-Prince Guinness, Malta, Prestige
• Jamaica Desnoes & Geddes (15.5%) Kingston Heineken, Dragon Stout, Guinness, Red Stripe
Martinique Brasserie Lorraine (83.1%) Lamentin Heineken, Lorraine, Malta, Porter
• Nicaragua Consorcio Cervecero Centroamericano (12.4%)
Managua Heineken, Bufalo, Tona, Victoria
Panama Cervecerias Barú-Panama (74.9%) Panama City Heineken, Cristal, Guinness, Panama, Soberana, Budweiser
St. Lucia Windward & Leeward Brewery (72.7%)
Vieux-Fort Heineken, Guinness, Piton
Surinam Surinaamse Brouwerij (76.1%) Paramaribo Heineken, Parbo
• Affi liated company (non-consolidated)
133Heineken N.V.Annual Report 2006

Africa and the Middle East
Country Company Location Brands
Burundi Brarudi (59.3%) Bujumbura, Gitega Amstel, Primus
• Cameroon Brasseries du Cameroun (8.8%) Bafoussam, Douala, Garoua, Yaoundé
Amstel, Dynamalt, Mützig
Congo Brasseries du Congo (50%) Brazzaville, Pointe Noire Amstel, Guinness, Maltina, Mützig, Ngok, Primus, Turbo King
Democratic Republic of Congo
Bralima (95%) Boma, Bukavu, Kinshasa, Kisangani, Lubumbashi, Mbandaka
Amstel, Guinness, Maltina, Mützig, Primus, Turbo King
Egypt Al Ahram Beverages Company (99.9%)
Badr, El Obour, Sharkí Heineken, Birell, Fayrouz, Meister, Sakara, Stella
• Ghana Guinness Ghana Breweries Ltd. (20%)
Accra, Kumasi Amstel Malt, Guinness, Gulder, Star
Israel Tempo Beverages Limited (40%) Netanya Heineken, Gold Star, Maccabee, Malt Star, Nesher
• Jordan General Investment (10.8%) Zerka Amstel
Lebanon Almaza (67%) Beirut Almaza, Laziza
• Morocco Brasseries du Maroc (2.2%) Casablanca, Fès, Tanger Heineken, Amstel
• Namibia Namibia Breweries (14.5%) Swakopmund, Windhoek Heineken, Beck’s, Guinness, Killkenny, Windhoek
Nigeria
Nigerian Breweries (54.1%)
Consolidated Breweries (50.1%)
Aba, Ama, Ibadan, Kaduna, Lagos
Jjebu Ode, Owe Omamma
Heineken, Amstel Malta, Gulder, Legend, Maltina, Star
“33” Export, Hi-malt
Réunion Brasseries de Bourbon (85.6%) Saint Denis Bourbon, Dynamalt
Rwanda Bralirwa (70%) Gisenyi, Kigali Amstel, Guinness, Mützig, Primus
• Sierra Leone Sierra Leone Brewery (42.1%) Freetown Heineken, Guinness, Maltina, Star
Tunisia Société de Production et de Distribution des Boissons (49.99%)
Tunis Heineken
United Arab Emirates
Sirocco (50%) Dubai Heineken, Amstel Light, Bud, Amstel Pulse, Almaza
• Affi liated company (non-consolidated).
As at 31 December 2006
Export offi ces are not shown
continued
Countries and brands continued
Heineken N.V.Annual Report 2006134

Asia Pacifi c
Country Company Location Brands
Cambodia Cambodia Brewery (33.5%) Phnom Penh ABC Extra Stout, Anchor, Gold Crown, Tiger
China Shanghai Asia Pacifi c Brewery (44.6%)
Hainan Asia Pacifi c (46%)
Kingway Brewery (9.0%)
Jiangsu Da Fu Hao Breweries (22.5%)
Shanghai
Haikou
Shantou, Shenzhen
Nantong, Tongzhou, Qidong, Yancheng
Heineken, Reeb, Tiger
Anchor, Aoke, Tiger
Kingway
BBOSS, Tongzhou, Changjiang
India Aurangabad Breweries (31.9%)
Asia Pacifi c Breweries – Pearl Private (28.1%)**
Maharashtra, Goa Cannon – 10000, Arlem
Indonesia Multi Bintang Indonesia (84.5%)
Sampang Agung, Tangerang
Heineken, Bintang, Guinness, Bintang Zero, Green Sands
Laos Lao Asia Pacifi c Breweries (28.6%)**
• Malaysia Guinness Anchor Berhad (10.7%) Kuala Lumpur Heineken, Anchor, Baron’s, Guinness, Kilkenny, Tiger, Lion, Malta, Anglia
Mongolia Asia Pacifi c Breweries (23.1%)**
New Caledonia Grande Brasserie de Nouvelle Calédonie (87.3%)
Noumea Heineken, Number One, Desperados
New Zealand DB Breweries (41.9%) Greymouth, Mangatainoka, Otahuhu, Timaru
Heineken, Amstel, DB Draught, Export Gold, Export Dry, Tiger, Erdinger, Sol, Budejovicky Budvar, Monteith’s, Tui
Papua New Guinea
SP Brewery (31.8%) Lae, Port Moresby Niugini Ice Beer, South Pacifi c Export Lager, SP Lager
Singapore Asia Pacifi c Breweries (41.9%) Singapore Heineken, ABC Extra Stout, Anchor, Baron’s, Tiger, Gold Crown
Sri Lanka United Breweries Lanka (25.2%) Archipelago, Bisonxxtra, Kings Lager, Pilsener, Stout
• Thailand Thai Asia Pacifi c Brewery (14.7%) Bangkok Heineken, Tiger, Cheers
Vietnam Vietnam Brewery (25.2%)
Hatay Brewery (41.9%)
Foster's Da Nang Co (41.9%)
Foster's Tien Giang (25.2%)
Ho Chi Minh City
Hatay
Heineken, Bivina, Tiger, Coors Light
Heineken, Anchor Draft, Tiger, Coors Light, Foster' s, Biere Larue
• Affi liated company (non-consolidated).
** Under construction
135Heineken N.V.Annual Report 2006

Dutch Dutch Dutch Dutch Dutch Dutch Dutch Dutch IFRS IFRS IFRS GAAP GAAP GAAP GAAP GAAP GAAP GAAP GAAP 2006 2005 2004 2004 2003 2002 2001 2000 1999 1998 1997
Revenue and profi tIn millions of EUR
Revenue 11,829 10,796 10,062 10,005 9,255 8,482 7,637 6,766 5,973 5,347 5,174
Results from operating activities 1,805 1,249 1,348 1,248 1,222 1,282 1,125 921 799 659 546
Results from operating BEIA 1,559 1,301 1,386 1,329 1,327 1,282 1,125 921 799 659 546
as % of revenue 13.2 12.1 13.8 13.3 14.3 15.1 14.7 13.6 13.4 12.3 10.6
as % of total assets 12.0 11.0 12.9 12.8 12.2 16.4 15.6 14.6 13.3 12.4 10.7
Interest cover ratio 19.7 14.3 12.2 11.2 13.3 16.6 22.5 21.0 30.1 92.7 72.1
Net profi t 1,211 761 642 537 798 795 767 621 516 445 345
Net profi t BEIA 930 840 803 791 806 795 715 621 516 445 345
as % of equity attributable to equity holders of the Company 18.6 21.2 24.7 23.4 25.4 30.1 25.9 25.9 19.7 19.4 14.9
Dividend 196 196 173 173 157 157 157 125 125 100 80
as % of net profi t 16.2 25.8 26.9 32.2 19.7 19.7 20.5 20.1 24.2 22.4 23.1
Bonus sharesIn millions of EUR
Increase in share capital – – – – – – 73 – – 142 –
Cash payment – – – – – – – – – 16 –
Distribution from reserves – – – – – – 73 – – 158 –
Percentage increase – – 25 25 – – 10 – – 25 –
Per share of €1.601
In millions of EUR
Cash fl ow from operating activities 3.77 3.82 3.29 3.10 3.34 2.42 2.38 2.11 1.91 1.80 1.54
Net profi t BEIA 1.90 1.71 1.64 1.61 1.64 1.62 1.46 1.27 1.05 0.91 0.70
Dividend 0.40 0.40 0.40 0.40 0.32 0.32 0.32 0.26 0.26 0.20 0.16
Equity attributable to equity holders of the Company 10.23 8.10 6.65 6.90 6.46 5.38 5.63 4.89 5.34 4.69 4.73
Bonus shares (par value) – – – – – – 0.23 – – 0.57 –
Cash payment – – – – – – – – – 0.06 –
Cash fl ow statementIn millions of EUR
Cash fl ow from operating activities 1,849 1,872 1,611 1,520 1,638 1,184 1,165 1,035 935 882 753
Dividend (294) (271) (243) (243) (241) (187) (168) (160) (112) (114) (94)
Investing (799) (1,194) (1,795) (1,671) (2,081) (1,973) (783) (1,503) (527) (728) (439)
Financing (355) (321) (123) (125) 1.233 427 (39) 335 (13) 80 36
Net cash fl ow 401 86 (550) (519) 549 (549) 175 (293) 283 120 255
1 Adjusted for the 5:4 share split in 2004.
All years prior to 2005 have been restated using the current number of issued shares of 489,974,594.
Historical summary
Other information continued
Heineken N.V.Annual Report 2006136
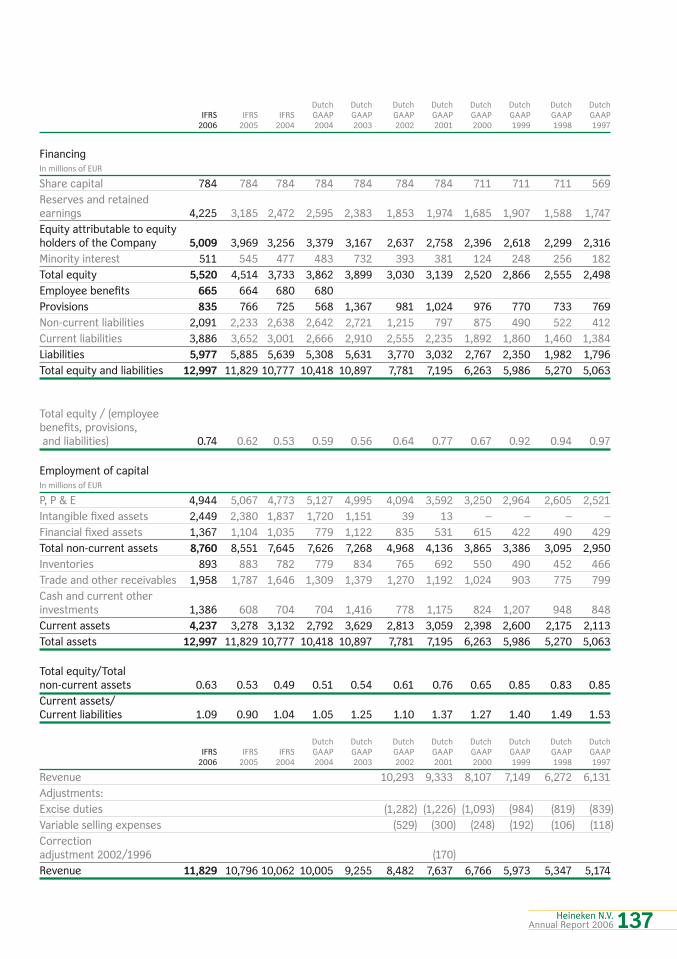
Dutch Dutch Dutch Dutch Dutch Dutch Dutch Dutch IFRS IFRS IFRS GAAP GAAP GAAP GAAP GAAP GAAP GAAP GAAP 2006 2005 2004 2004 2003 2002 2001 2000 1999 1998 1997
FinancingIn millions of EUR
Share capital 784 784 784 784 784 784 784 711 711 711 569
Reserves and retained earnings 4,225 3,185 2,472 2,595 2,383 1,853 1,974 1,685 1,907 1,588 1,747
Equity attributable to equity holders of the Company 5,009 3,969 3,256 3,379 3,167 2,637 2,758 2,396 2,618 2,299 2,316
Minority interest 511 545 477 483 732 393 381 124 248 256 182
Total equity 5,520 4,514 3,733 3,862 3,899 3,030 3,139 2,520 2,866 2,555 2,498
Employee benefi ts 665 664 680 680
Provisions 835 766 725 568 1,367 981 1,024 976 770 733 769
Non-current liabilities 2,091 2,233 2,638 2,642 2,721 1,215 797 875 490 522 412
Current liabilities 3,886 3,652 3,001 2,666 2,910 2,555 2,235 1,892 1,860 1,460 1,384
Liabilities 5,977 5,885 5,639 5,308 5,631 3,770 3,032 2,767 2,350 1,982 1,796
Total equity and liabilities 12,997 11,829 10,777 10,418 10,897 7,781 7,195 6,263 5,986 5,270 5,063
Total equity / (employee benefi ts, provisions, and liabilities) 0.74 0.62 0.53 0.59 0.56 0.64 0.77 0.67 0.92 0.94 0.97
Employment of capitalIn millions of EUR
P, P & E 4,944 5,067 4,773 5,127 4,995 4,094 3,592 3,250 2,964 2,605 2,521
Intangible fi xed assets 2,449 2,380 1,837 1,720 1,151 39 13 – – – –
Financial fi xed assets 1,367 1,104 1,035 779 1,122 835 531 615 422 490 429
Total non-current assets 8,760 8,551 7,645 7,626 7,268 4,968 4,136 3,865 3,386 3,095 2,950
Inventories 893 883 782 779 834 765 692 550 490 452 466
Trade and other receivables 1,958 1,787 1,646 1,309 1,379 1,270 1,192 1,024 903 775 799
Cash and current otherinvestments 1,386 608 704 704 1,416 778 1,175 824 1,207 948 848
Current assets 4,237 3,278 3,132 2,792 3,629 2,813 3,059 2,398 2,600 2,175 2,113
Total assets 12,997 11,829 10,777 10,418 10,897 7,781 7,195 6,263 5,986 5,270 5,063
Total equity/Totalnon-current assets 0.63 0.53 0.49 0.51 0.54 0.61 0.76 0.65 0.85 0.83 0.85
Current assets/ Current liabilities 1.09 0.90 1.04 1.05 1.25 1.10 1.37 1.27 1.40 1.49 1.53
Dutch Dutch Dutch Dutch Dutch Dutch Dutch Dutch IFRS IFRS IFRS GAAP GAAP GAAP GAAP GAAP GAAP GAAP GAAP 2006 2005 2004 2004 2003 2002 2001 2000 1999 1998 1997
Revenue 10,293 9,333 8,107 7,149 6,272 6,131
Adjustments:
Excise duties (1,282) (1,226) (1,093) (984) (819) (839)
Variable selling expenses (529) (300) (248) (192) (106) (118)
Correction adjustment 2002/1996 (170)
Revenue 11,829 10,796 10,062 10,005 9,255 8,482 7,637 6,766 5,973 5,347 5,174
137Heineken N.V.Annual Report 2006

BEIA Before exceptional items and amortisation of brands.
CAPEX Capital expenditure on property, plant and equipment.
Cash conversion ratio Free operating cash fl ow/Net profi t (beia) before deduction of minority interests.
Depletions Sales by distributors to the retail trade.
Dividend pay out Dividend as percentage of net profi t.
Earnings per share Net profi t divided by the weighted average number of shares – basic – during the year.
EBIT Earnings before interest and taxes and net fi nance expenses.
EBITDA Earnings before interest and taxes and net fi nance expenses before depreciation and amortisation.
Effective tax rate Taxable profi t adjusted for share of profi t of associates, dividend income and impairments of other investments.
Fit2Fight Cost saving programme aimed at reducing the fi xed cost base versus 2005 by €450 million by 2008.
Fixed costs ratio Fixed costs under Fit2Fight as a per centage of revenue.
Free operating cash fl ow This represents the total of cash fl ow from operating activities, and cash fl ow from operational investing activities.
Gearing Net debt/shareholders’ equity.
Net debt Non-current and current interest-bearing loans and borrowings and bank overdrafts less securities and cash.
Net interest cover EBITDA/Net interest expenses.
Glossary
Defi nitions of terms and phrases used in this report
Heineken N.V.Annual Report 2006138
Net profi t Profi t after deduction of minority interests (profi t attributable to equity holders of the Company).
Organic growth Growth excluding the effect of foreign exchange rate movements, consolidation changes, exceptional items, amortisation of brands and changes in accounting policies.
Organic volume growth Increase in consolidated volume, excluding the effect of the fi rst time consolidation of acquisitions.
Profi t Total profi t of the group before deduction of minority interests.
® All brand names mentioned in this report, including those brand names not marked by an ®, represent registered trade marks and are legally protected.
Region A region is defi ned as Heineken’s managerial classifi cation of countries in geographical units.
Revenue Net realised sales proceeds in Euros.
Top-line growth Growth in net revenue.
Volume Amstel® volume The volume of the Amstel brand.
Consolidated beer volume 100 per cent of beer volume produced and sold by fully consolidated companies and a share of beer volume produced and sold by proportionately consolidated joint-venture companies.
Group beer volume The part of the total group volume that relates to beer.
Heineken® volume The volume of the Heineken brand.
Heineken® volume in Premium segment The groupvolume of the Heineken brand in the premium segment (Heineken volume in the Netherlands is excluded).
Total group volume 100 per cent of beer, soft drinks and other beverages volume produced and sold by fully consolidated companies and by proportionately consolidated joint-venture companies as well as the volume of Heineken’s brands produced and sold under licence by third parties.
139Heineken N.V.Annual Report 2006
Other information continued
A Heineken N.V. publication
Heineken N.V. P.O. Box 28 1000 AA Amsterdam The Netherlands
telephone +31 20 523 92 39 fax +31 20 626 35 03
Copies of the annual report and further information are obtainable from the Group Corporate Relations department via www.heinekeninternational.com
Production and editing Heineken N.V. Group Corporate Relations Text CitySavvy Media, London/Amsterdam Heineken International
Translation V V H Business Translations, Utrecht,the Netherlands
Photography Bert Theunissen, AmsterdamDuncan Loughrey, Luton AP/Wide World PhotosHeineken International
Graphic design and electronic publishing Addison Corporate Marketing Ltd, London
Colour separations Nederlof Repro, Cruquius, the Netherlands
Printing Boom Planeta Graphics, Haarlem, the Netherlands
Binding and distribution Hexspoor, Boxtel, the Netherlands
Paper Hello silk 300 gms cover Hello silk 135 gms inside pages 01-64 Hello silk 100 gms inside pages 65-140
Hello silk is manufactured via Environmental Management Systems that comply with and are certifi ed to ISO 14001 and EMAS. The majority of the pulp is Totally Chlorine Free (TCF) with some being Elemental Chlorine Free (ECF).
This report is available in the Dutch language as well. In the case of any discrepancy between language versions, the English version prevails.
Reference information
Heineken N.V.Annual Report 2006140


Also see www.enjoyheinekenresponsibly.com
He
ine
ken
N.V. 2
00
6 A
nn
ual R
ep
ort