annual report 2003 - remgro · 2013-05-08 · pro forma pro forma pro forma pro forma ... the...
TRANSCRIPT

ANNUAL REPORT
2003
Corporate structure 1
Salient features – Financial results 2
Seven year consolidated financial review 3
Analysis of shareholders 4
Directorate 6
General review 8
Corporate governance 18
Service company 24
Employment equity 24
Sustainability report 25
Dates of importance to shareholders 28
Financial report 2003 31
C O N T E N T S
h
REGISTRATION NUMBER 1968/006415/06
ISIN ZAE000026480 SHARE CODE REM

P A G E 1
R E M G R O L I M I T E D
C O R P O R AT E S T R U C T U R E
h
G R O U P S T R U C T U R E
AT 3 1 M A R C H 2 0 0 3
The Company is an investment holding company established
with effect from 1 April 2000, after the restructuring of the
former Rembrandt Group Limited.
Subsidiaries which are not wholly owned are mainly listed
companies with independent Boards of Directors on which this
Company has non-executive representation. Other non-subsidiary
investments comprise both listed and unlisted companies which are
not controlled by this Company and which are mostly associated
companies due to significant influence and Board representation.
The Company’s activities are, therefore, mainly
concentrated on the management of investments and the
provision of support, than of being involved in the day-to-day
management of business units of those investees. The
Company is a long-term investor, forging strategic alliances
on a partnership basis while endeavouring to add value where
possible.
Refer to the General Review for a more comprehensive
summary of the activities of the individual investments.
REMGRO LIMITED
Percentages represent the Group’s effective direct interests and have been rounded off.* Unlisted companies
** Foreign company (United Kingdom)Annexures A and B provide further information of subsidiary companies and investments.
ASSOCIATED COMPANIES SUBSIDIARY COMPANIES
TRADE MARK INTERESTS
Transvaal Sugar* 100%
Wispeco* 100%
Rainbow Chicken 54%
Gencor 11%
Trans Hex Group 41%
British American Tobacco** 9%
Distell Group 30%
Unilever Bestfoods Robertsons* 41%
Henkel SA* 50%
Nampak 14%
Total South Africa* 34%
Dorbyl 42%
Air Products SA* 50%
FirstRand 10%
RMB Holdings 23%
Absa Group 9%
Sage Group 16%
INDUSTRIAL INTERESTS
MINING INTERESTS
FINANCIAL SERVICES
Remgro Finance Corporation* 100%
Remgro Finance and Services* 100%
Medi-Clinic Corporation 52%
CORPORATE AND OTHER INTERESTS

P A G E 2
R E M G R O L I M I T E D
S A L I E N T F E AT U R E S – F I N A N C I A L R E S U LT S
h
2003 2002
HE A D L I N E E A R N I N G S R4 914 million R4 252 million
BA S I C E A R N I N G S – N E T P R O F I T F O R T H E Y E A R R8 744 million R3 507 million
Number of shares in issue– Ordinary shares of 1 cent each 486 493 650 486 493 650– Unlisted B ordinary shares of 10 cents each 35 506 352 35 506 352
Total number of shares in issue 522 000 002 522 000 002Shares repurchased and held in treasury– Ordinary shares of 1 cent each (11 616 128) –
510 383 874 522 000 002
Weighted number of shares in issue 519 565 424 522 000 002
HE A D L I N E E A R N I N G S P E R S H A R E 945.8c 814.5c
BA S I C E A R N I N G S P E R S H A R E 1 682.9c 671.8c
Dividends per share– Ordinary 248.00c 206.00c– Special – 100.00c
Net asset value per share(attributable to own members)– at book value R54.49 R46.10– Tobacco interests R18.31 R14.36– Other investments R36.18 R31.74
– at intrinsic value R76.91 R89.50– Tobacco interests R38.21 R51.12– Other investments R38.70 R38.38
Exchange ratesPound sterling/SA rand exchange rate – weighted average for the year 15.0678 13.5592
– at 31 March 12.4915 16.2056
Stock exchange pricesClosing price per share at 31 March R51.45 R63.00
2003 2002Cash flow R million R million
Net cash flow from operating activities 3 372 2 204Dividends paid – ordinary (1 152) (934)Dividends baal – special (522) –Investing activities (2 042) (235)Financing activities (82) (158)
Net increase/(decrease) in cash and cash equivalents (426) 877
P A G E 3
R E M G R O L I M I T E D
S E V E N Y E A R C O N S O L I D AT E D F I N A N C I A L R E V I E W
h
2003 2002 2001 2000 1999 1998 1997R million R million R million R million R million R million R million
Pro forma Pro forma Pro forma Pro forma
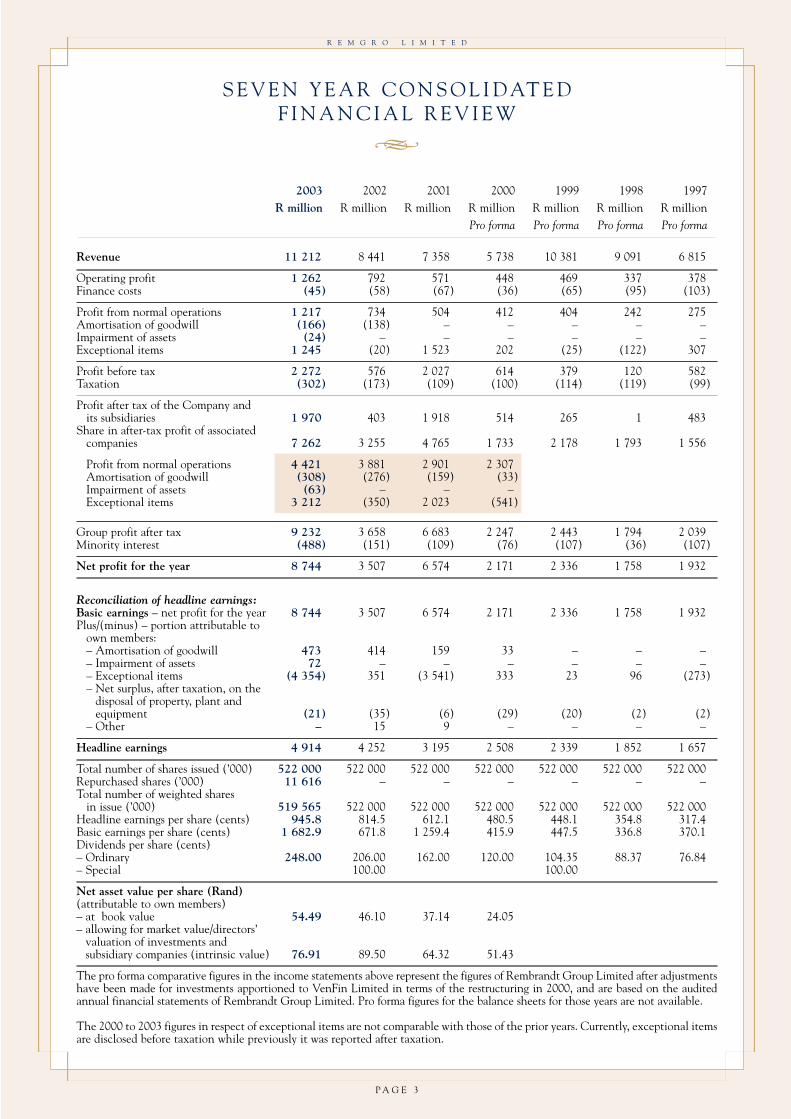
Revenue 11 212 8 441 7 358 5 738 10 381 9 091 6 815
Operating profit 1 262 792 571 448 469 337 378Finance costs (45) (58) (67) (36) (65) (95) (103)
Profit from normal operations 1 217 734 504 412 404 242 275Amortisation of goodwill (166) (138) – – – – –Impairment of assets (24) – – – – – –Exceptional items 1 245 (20) 1 523 202 (25) (122) 307
Profit before tax 2 272 576 2 027 614 379 120 582Taxation (302) (173) (109) (100) (114) (119) (99)
Profit after tax of the Company and its subsidiaries 1 970 403 1 918 514 265 1 483
Share in after-tax profit of associated companies 7 262 3 255 4 765 1 733 2 178 1 793 1 556
Profit from normal operations 4 421 3 881 2 901 2 307Amortisation of goodwill (308) (276) (159) (33)Impairment of assets (63) – – –Exceptional items 3 212 (350) 2 023 (541)
Group profit after tax 9 232 3 658 6 683 2 247 2 443 1 794 2 039Minority interest (488) (151) (109) (76) (107) (36) (107)
Net profit for the year 8 744 3 507 6 574 2 171 2 336 1 758 1 932
Reconciliation of headline earnings:Basic earnings – net profit for the year 8 744 3 507 6 574 2 171 2 336 1 758 1 932Plus/(minus) – portion attributable to
own members:– Amortisation of goodwill 473 414 159 33 – – –– Impairment of assets 72 – – – – – –– Exceptional items (4 354) 351 (3 541) 333 23 96 (273)– Net surplus, after taxation, on the
disposal of property, plant and equipment (21) (35) (6) (29) (20) (2) (2)
– Other – 15 9 – – – –
Headline earnings 4 914 4 252 3 195 2 508 2 339 1 852 1 657
Total number of shares issued (’000) 522 000 522 000 522 000 522 000 522 000 522 000 522 000Repurchased shares (’000) 11 616 – – – – – –Total number of weighted shares
in issue (’000) 519 565 522 000 522 000 522 000 522 000 522 000 522 000Headline earnings per share (cents) 945.8 814.5 612.1 480.5 448.1 354.8 317.4Basic earnings per share (cents) 1 682.9 671.8 1 259.4 415.9 447.5 336.8 370.1Dividends per share (cents)– Ordinary 248.00 206.00 162.00 120.00 104.35 88.37 76.84– Special 100.00 100.00
Net asset value per share (Rand)(attributable to own members)– at book value 54.49 46.10 37.14 24.05– allowing for market value/directors’
valuation of investments and subsidiary companies (intrinsic value) 76.91 89.50 64.32 51.43
The pro forma comparative figures in the income statements above represent the figures of Rembrandt Group Limited after adjustmentshave been made for investments apportioned to VenFin Limited in terms of the restructuring in 2000, and are based on the auditedannual financial statements of Rembrandt Group Limited. Pro forma figures for the balance sheets for those years are not available.
The 2000 to 2003 figures in respect of exceptional items are not comparable with those of the prior years. Currently, exceptional itemsare disclosed before taxation while previously it was reported after taxation.

P A G E 4
R E M G R O L I M I T E D
A N A LY S I S O F S H A R E H O L D E R SAT 3 1 M A R C H 2 0 0 3
h
Number of % of % ofshare- share- Number shares
holders holders of shares issued
DI S T R I B U T I O N O F S H A R E H O L D E R SOrdinary sharesPublic shareholders 25 659 99.89 483 425 532 99.37Non-public shareholders
Directors and their associates 28 0.11 3 068 118 0.63
25 687 100.00 486 493 650 100.00
Number of% shares
MA J O R B E N E F I C I A L S H A R E H O L D E R SOrdinary sharesPublic Investment Commissioner 12.46 60 606 914Old Mutual Life Assurance Company SA 10.14 49 353 063Other 77.40 376 533 673
100.00 486 493 650B ordinary sharesRembrandt Trust (Pty) Limited 100.00 35 506 352
Total 522 000 002
No other shareholders held an interest of more than 5% in your Company on 31 March 2003.
JSE Securities Exchange South Africa 2003 2002 2001
Market capitalisation at 31 March (R million)– Ordinary shares only 25 030 30 649 22 865Price (cents per share)– 31 March 5 145 6 300 4 700– Highest 7 399 6 650 5 550– Lowest 5 145 4 780 3 850Number of shares traded (’000) 218 938 203 231 78 267
Private17%
Institutional83%
Overseas5%
South Africa95%
AD D I T I O N A L I N F O R M AT I O N (2003)IN S T I T U T I O N A L A N D P R I VAT E
S H A R E H O L D I N G I N RE M G R O LI M I T E D
O R D I N A RY S H A R E S
OV E R S E A S A N D L O C A L S H A R E H O L D I N G
I N RE M G R O LI M I T E D O R D I N A RY S H A R E S

P A G E 5
R E M G R O L I M I T E D
Interest of the directors in the issued capital of the CompanyOrdinary shares
Direct IndirectNon- Non-
Beneficial beneficial Beneficial beneficial Total
31 March 2003
P E Beyers 34 024 – 7 000 – 41 024W E Bührmann 37 527 – – – 37 527G D de Jager 1 740 – 28 300 – 30 040J W Dreyer 8 996 – – – 8 996D M Falck 200 – 18 133 – 18 333P K Harris – – 57 118 – 57 118E de la H Hertzog 228 245 – 1 499 885 4 484 1 732 614E Molobi 174 – – – 174J F Mouton – – 20 000 – 20 000J A Preller 26 141 – – – 26 141J P Rupert – – 270 001 – 270 001P G Steyn 51 474 – 635 596 – 687 070T van Wyk 42 996 – 5 000 – 47 996M H Visser 2 888 – 88 196 – 91 084
434 405 – 2 629 229 4 484 3 068 118
31 March 2002
P E Beyers – – 49 024 – 49 024W E Bührmann 26 745 – 10 782 – 37 527G D de Jager 1 740 – – – 1 740J W Dreyer 4 298 – 3 698 – 7 996P J Erasmus 38 730 – – – 38 730D M Falck 200 – 18 133 – 18 333P K Harris – – 57 118 – 57 118E de la H Hertzog 202 383 – 1 525 747 4 484 1 732 614E Molobi 174 – – – 174J F Mouton – – 20 000 – 20 000J A Preller 18 280 – 7 861 – 26 141J P Rupert – – 270 001 – 270 001P G Steyn 51 474 – 635 596 – 687 070T van Wyk 29 992 – 18 004 – 47 996M H Visser 2 888 – 88 196 – 91 084
376 904 – 2 704 160 4 484 3 085 548
B ordinary sharesMr J P Rupert is a director of Rembrandt Trust (Pty) Limited which owns all the issued unlisted B ordinary shares.
Since the end of the financial year to the date of this report the interest of directors remained unchanged.

P A G E 6
R E M G R O L I M I T E D
NON-EXECUTIVE DIRECTORS
J P RU P E RT (53) ‡Chairman
Attendance3 out of 5 Board meetings2 out of 3 Remuneration Committee meetings
DirectorshipsChairman of Compagnie Financière Richemont SA,VenFin Limited and Business Partners Limited. Member ofthe International Advisory Board of DaimlerChrysler.
P E BE Y E R S (53) Businessman
Attendance5 out of 5 Board meetings
DirectorshipsDistell Group Limited, Richemont Société Anonyme and VenFin Limited.
G D D E JA G E R (52) ∆Businessman
Attendance4 out of 5 Board meetings
DirectorshipsLenco Corporate Finance (Pty) Limited.
J W DR E Y E R (52) Businessman
Attendance4 out of 5 Board meetings
DirectorshipsAvis Southern Africa Limited, RMB Holdings Limitedand VenFin Limited.
P K HA R R I S (53) ‡ ∆Businessman
Attendance3 out of 5 Board meetings1 out of 3 Remuneration Committee meetings
DirectorshipsChief Executive Officer of FirstRand Banking Group.
E D E L A H HE RT Z O G (53) Businessman
Attendance5 out of 5 Board meetings
DirectorshipsChairman of Medi-Clinic Corporation Limited. Serves on theBoard of Distell Group Limited, Total South Africa (Pty)Limited and Trans Hex Group Limited.
E MO L O B I (58) ∆Businessman
Attendance1 out of 5 Board meetings
DirectorshipsChairman of Kagiso Trust Investment Company (Pty) Limited.
J F MO U T O N (56) * ‡ ∆Businessman
Attendance5 out of 5 Board meetings3 out of 4 Audit Committee meetings3 out of 3 Remuneration Committee meetings
DirectorshipsChairman of PSG Group Limited, Capitec Bank Limited andother companies in the PSG group and director of SteinhoffInternational Limited.
F RO B E RT S O N (48) * ‡ ∆Businessman
Attendance5 out of 5 Board meetings4 out of 4 Audit Committee meetings3 out of 3 Remuneration Committee meetings
DirectorshipsChairman of Lion of Africa Insurance Company Limited andLion of Africa Life Assurance Company Limited and ExecutiveDeputy Chairman of Brimstone Investments CorporationLimited and director of South African Tourism.
P G ST E Y N (69) * ∆Businessman
Attendance5 out of 5 Board meetings4 out of 4 Audit Committee meetings
D I R E C T O R AT E
h

P A G E 7
R E M G R O L I M I T E D
EXECUTIVE DIRECTORS
M H VI S S E R (49) #Deputy Chairman and Chief Executive Officer
Qualification: BComm (Hons), CA(SA)Years of service with the Group: 23
Attendance5 out of 5 Board meetings6 out of 6 Executive Committee meetings
DirectorshipsBritish American Tobacco Plc, Distell Group Limited, NampakLimited, Unilever Bestfoods (Robertsons) Holdings LLC andChairman of Rainbow Chicken Limited.
W E BÜ H R M A N N (48) #Investments
Qualification: BComm, CA(SA)Years of service with the Group: 16
Attendance4 out of 5 Board meetings5 out of 6 Executive Committee meetings
DirectorshipsAir Products SA (Pty) Limited, Dorbyl Limited,Gencor Limited, Medi-Clinic Corporation Limited,Rainbow Chicken Limited, Transvaal Sugar Limited,Trans Hex Group Limited and Wispeco Holdings Limited.
D M FA L C K (57) # *Group Finance
Qualification: CA(SA)Years of service with the Group: 31
Attendance5 out of 5 Board meetings5 out of 6 Executive Committee meetings4 out of 4 Audit Committee meetings
DirectorshipsRMB Holdings Limited, FirstRand Limited, FirstRand BankLimited and Total South Africa (Pty) Limited.
J A PR E L L E R (M R S) (53) #Corporate Affairs
Qualification: BEconYears of service with the Group: 31
Attendance5 out of 5 Board meetings6 out of 6 Executive Committee meetings
T VA N WY K (55) #Investments
Qualification: BComm, LLB, LLM, H Dip TaxYears of service with the Group: 13
Attendance5 out of 5 Board meetings6 out of 6 Executive Committee meetings
DirectorshipsAbsa Group Limited, Air Products SA (Pty) Limited, DorbylLimited, Sage Group Limited and Wispeco Holdings Limited.
# Member of the Executive Committee* Member of the Audit and Risk Committee‡ Member of the Remuneration and Nomination Committee∆ Independent non-executive director

P A G E 8
R E M G R O L I M I T E D
G E N E R A L R E V I E W
h
HE A D L I N E E A R N I N G S
Headline earnings for the year to 31 March 2003 grew by 15.6%
from R4 252 million to R4 914 million.
Headline earnings per share, however, increased by 16.1%
from 814.5c to 945.8c reflecting the “uplift” resulting from the
share repurchase programme.
During the year under review, a wholly-owned subsidiary
acquired 11.6 million Remgro ordinary shares in the open
market, representing 2.4% of the issued ordinary share capital of
the Company. The total purchase consideration amounted to
R704 million at an average of R60.64 per ordinary share. The
shares have not been cancelled and are held as treasury stock.
We have regularly in the past drawn attention to the fact
that currency movements could have a significant impact on the
Group’s earnings. In particular, British American Tobacco Plc’s
(BAT) Sterling profit contribution, translated into South African
rands, amounts to almost 50% of Remgro’s total headline earnings.
The favourable currency impact on translation of BAT’s
contribution to headline earnings as set out in the table below,
has declined from R427 million during 2002 to R243 million for
the year under review.
Financial year: 2003 2002
Average exchange rate (£/R) 15.0678 13.5592
Closing exchange rate
at year-end (£/R) 12.4915 16.2056
BAT contribution (£m) 161 154
BAT contribution (Rm) 2 423 2 088
Favourable currency impact (Rm) 243 427
It should be noted that BAT’s profit contribution is
translated at an average exchange rate. If the average for the
year to 31 March 2004 was to be equal to the current £/R spot
rate, which is lower (i.e. stronger rand) compared to the average
rate for the past year, it will result in an unfavourable currency
impact during the new financial year.
BA S I C E A R N I N G S
Basic earnings per share increased by a substantial 151% to
1 682.9 cents. Basic earnings reflects earnings after goodwill
amortisation and inclusion of non-recurring exceptional items.
During the current year, attributable after-tax exceptional items
amounted to R4 293 million. These included large exceptional
gains such as:
h R310 million in respect of the disposal of the interest in
Malbak Limited in exchange for shares in Nampak
Limited.
h R408 million relating to the restructuring of the Bestfoods
Robertsons joint venture resulting in a revised
holding in the enlarged Unilever Bestfoods Robertsons
venture.
h R270 million on the disposal of the Robertsons Homecare
interests.
h R3 204 million in respect of the revaluation gain arising on
R&R Holdings’ ownership of BAT preference shares following
the issue of call warrants on such preference shares.
CA S H E A R N I N G S
Attributable cash earnings (which excludes the Group’s share of
net profits retained by associated companies), before
exceptional items and amortisation of goodwill, increased by
41.6% from R1 986 million to R2 813 million or 541.4 cents per
share, mainly as a result of an increase in dividends received
from associated companies. The latter amounted to
R2 203 million compared to R1 508 million in 2001/2002,
mainly due to higher dividends from R&R Holdings, FirstRand
Limited and RMB Holdings Limited.
The balance sheet reflects cash and cash equivalents of
R2 286 million at 31 March 2003. Of this, R647 million is
attributable to Rainbow Chicken, Transvaal Sugar and
Medi-Clinic Corporation. Cash at the centre amounted to
R1 639 million.
Headline earnings per share increased by 16.1% from 814.5c to 945.8c

P A G E 9
R E M G R O L I M I T E D
DI V I D E N D S
Ordinary dividends of 248 cents per share were declared for the
year, compared to 206 cents the previous year. This represents
an increase of 20.4%. The dividends are covered 3.8 times by
headline earnings and 2.2 times by cash earnings, against
4.0 times and 1.8 times respectively the previous year.
NE T A S S E T VA L U E
In the past we have reported the underlying, or “intrinsic”, net
asset value of the Group at year-end, which differs from the book
value of net assets shown in the balance sheet. Such valuation
includes all investments, incorporating subsidiary and associated
companies, either at listed market value or, in the case of
unlisted investments, at directors’ valuation. The net assets of
wholly-owned non-investment subsidiary companies, consisting
mainly of monetary items, are included at book value.
The intrinsic net asset value as at the end of March 2003,
amounted to R76.91 per share compared to R89.50 and R64.32
per share at 31 March 2002 and 2001 respectively. A schedule setting
out the calculation of the intrinsic net asset value per share as at
31 March 2003 has been included at the end of this review.
The table below reflects a comparison of the relative
performance of the Remgro intrinsic net asset value per share in
relation to certain selected JSE indices.
No account has been taken of dividends declared on the
Remgro shares.
2003 2002 2001
Remgro intrinsic
net asset value
– Rand per share 76.91 89.50 64.32
JSE – All share index 7 680 11 015 8 094
– Fin & Ind 30 index 6 682 9 713 9 464
– Financial 15 index 2 744 3 415 3 758
Comparative performance 1 year to 2 years to31 March 2003 31 March 2003% year-on-year % comp p.a.
Remgro intrinsic
net asset value – 14.1 + 9.3
JSE – All share index – 30.3 – 2.6
– Fin & Ind 30 index – 31.2 – 16.0
– Financial 15 index – 19.6 – 14.5
TRADE MARK INTERESTS
Contribution to headline earnings:
h R2 498 million (2002: R2 167 million)
h Increase 15.3%
Percentage of headline earnings:
h 51% (2002: 51%)
TO B A C C O
R&R HOLDINGS: Effective interest 331/3% (2002: 331/3%)
Remgro’s tobacco interests are represented by a one-third
shareholding in R&R Holdings SA, Luxembourg (R&R). The
other two-thirds are held by Compagnie Financière Richemont
SA (Richemont).
In January 2003, R&R issued secured call warrants
exercisable into ordinary shares of BAT in 2004. This
transaction effectively locked in the value of the 120.9 million
convertible redeemable preference shares which R&R has in
BAT and which it was obliged to either sell or tender for
redemption in June 2004 at the redemption price of 675 pence
per share. Together with the gross warrant premium of 34.29 pence
per share received in January 2003, the value locked in
amounted to 709.29 pence per share, before costs. R&R also
holds 604.3 million BAT ordinary shares.
As a consequence of the warrant issue, the preference
shares are now treated as a debt instrument in the consolidated
accounts of R&R and are no longer equity accounted. For the
nine months ended 31 December 2002, R&R’s effective interest
in BAT, reflecting the holding of both ordinary and preference
shares, was 31.5%. For the three-month period ended
31 March 2003, R&R has accounted for its 27.9% effective
interest in BAT ordinary shares under the equity method and, in
respect of the preference shares, has recorded the movement in
the present value of the shares as investment income. Similarly,
this movement in net present value effectively became an
investment expense for BAT in accounting terms and therefore,
for purposes of equity accounting the interest in the ordinary
shares, R&R reduced BAT’s attributable profit for the quarter
ended 31 March 2003 accordingly.
Whilst R&R has applied IAS 39 (Financial Instruments:
Recognition and Measurement) in accordance with International
Financial Reporting Standards, the South African equivalent,

P A G E 1 0
R E M G R O L I M I T E D
G E N E R A L R E V I E W
hAC 133, was not yet applicable to Remgro in the year under
review. This required Remgro to make the necessary
adjustments to the reported results of R&R for the difference
in accounting policies. Had R&R not applied IAS 39, the
conversion rights embedded in the preference shares would not
have been valued, and consequently these conversion rights,
represented by the warrant premium, would have been accounted
for as income either proportionately over the remaining term of
the preference shares, or in one amount upon their redemption in
June 2004. Accordingly, the net warrant premium, amounting to
£30 million, has been deferred in accounting for Remgro’s share
of the results of R&R for the year to 31 March 2003. With AC 133
subsequently becoming applicable to Remgro, the deferred
income will be included in equity accounted income in the
ensuing financial year.
Linked to the realisation of the value of the preference
shares and their reclassification, R&R recorded an exceptional
gain during the year under review, Remgro’s share of which
amounted to R3 204.4 million.
After elimination of exceptional items and goodwill
amortisation and the necessary adjustments referred to above,
R&R’s contribution to Remgro’s headline earnings is made up as
set out in the table alongside.
BAT had shipments of 777 billion cigarettes in the year to
31 December 2002 representing a global market share of 14.6%.
It has a robust position in all regions worldwide which, together
with the broad based portfolio of international, regional and
local brands, provides the platform for achieving global
leadership of the tobacco business. Growth in profit is achieved
by a continuous focus on increasing its share in the key growth
consumer segments of international and premium priced brands.
For BAT the most encouraging aspect of the results for the
year was the impressive growth in their global drive brands.
Dunhill, Kent, Lucky Strike and Pall Mall grew by 8% between
them. Dunhill in particular performed well with sales exceeding
30 billion cigarettes for the first time. Although Lucky Strike
declined in 2002 as a result of the planned reduction in duty-free
sales, the brand should return to growth in 2003 whilst Dunhill,
Kent and Pall Mall should maintain their progress.
2003 2002£ million £ million
Attributable profit as reported by BAT
for the year ended 31 December 2002 1 152 1 010
Less: attributable profit as reported by
BAT for the quarter ended
31 March 2002
(2002: to 31 March 2001) (229) (226)
Add: attributable profit as reported
by BAT for the quarter ended
31 March 2003
(2002: to 31 March 2002) 235 229
Adjustments:
– to eliminate goodwill amortisation 380 390
– to eliminate exceptional items
reported by BAT – 53
1 538 1 456
– movement in present value of BAT
preference shares and dividends (10) –
Adjusted attributable profit of
BAT for the twelve months
ended 31 March 1 528 1 456
R&R’s 31.5% share of the adjusted
attributable profit of BAT for the
twelve months to 31 March 2002 – 459
R&R’s 31.5% share of the adjusted
attributable profit of BAT for
the period 1 April 2002 to
31 December 2002 380 –
R&R’s 27.9% share of the adjusted
attributable profit of BAT for
the period 1 January 2003 to
31 March 2003 89 –
Movement in present value of BAT
preference shares and dividends 10 –
R&R’s other income 3 3
R&R’s headline earnings for the
year ended 31 March 482 462
Remgro’s 331/3% share thereof 161 154
R million R million
Translated at an average £/R rate
of 15.0678 (2002: 13.5592) 2 423 2 088

P A G E 1 1
R E M G R O L I M I T E D
Within BAT’s regions, America-Pacific’s operating profit
was in line with the prior year, reflecting the net effect of a good
performance from all its regional markets offset by the adverse
exchange rate movements. Asia-Pacific, along with the
Africa and Middle East regions, suffered from the planned
reduction in duty-free sales with profits down £46 million and
£50 million respectively. Latin America performed well given
the exceptionally difficult economic circumstances and political
uncertainty in many countries during the year with profits down
£35 million, reflecting lower volumes and a significant
weakening of the region’s major currencies against Sterling.
Europe’s operating profit was £42 million higher as a
result of solid market performances in Russia, Ukraine,
Poland, Hungary, France and Switzerland. This was despite a
significant loss of profit from the dissolution of the UK
partnership, a price war in Romania and excise tax increases
in Germany.
In the year to 31 December 2002, BAT’s adjusted earnings
per share, arguably the best measure of the company’s underlying
performance, grew by 8% as a result of lower net interest
expense, an improved tax position and lower minority charges.
These results were achieved despite a 3% decline in operating
profit caused by the impact of weak currencies and the planned
decline in duty-free sales, but at comparable rates of exchange
operating profits were up by 3%.
WI N E A N D SP I R I T S
DISTELL: Effective interest 30.0% (2002: 30.0%)
Distell Group Limited (Distell) contributed R76 million to
Remgro’s headline earnings, compared to R79 million in the
previous year. This relates to Distell’s two consecutive six-month
periods ended 31 December 2002.
Distell reported sales volume growth for most of its major
brands for the six months ended 31 December 2002.
International sales revenue increased by 30.7% and
comprised 21.6% of total sales revenue. Distell’s trading income
increased substantially by 52.3%. This was largely the result
of increased sales revenue, a favourable sales mix and improved
production efficiencies. The increase in trading income
was however negated by the unfavourable effect of
the strengthening in the value of the rand towards the end
of 2002.
On 18 June 2003 the Competition Tribunal finally approved
the merger between Stellenbosch Farmers’ Winery Group Limited
and Distillers Corporation (SA) Limited, subject to Distell
relinquishing control of two of its brands in the South African
spirits market, i.e. the Martell and KWV brands.
FINANCIAL SERVICES
Contribution to headline earnings:
h R1 121 million (2002: R958 million)
h Increase 17.0%
Percentage of headline earnings:
h 23% (2002: 23%)
FIRSTRAND and RMBH
Both FirstRand Limited (FirstRand) and RMB Holdings Limited
(RMBH) have June year-ends and therefore their results for the
twelve months to 31 December 2002 were equity accounted by
Remgro in the year under review.
Resulting from the rand’s strength, FirstRand reported
exceptional translation losses amounting to R528 million for the
twelve months to 31 December 2002 (2001: R650 million gain).
Remgro’s portion of these translation losses was R90 million
(2002: R110 million gain) – R50 million through its direct
interest in FirstRand, and R40 million indirectly through its
interest in RMBH.
FIRSTRAND: Effective direct interest 9.6% (2002: 9.3%)
FirstRand’s contribution to Remgro’s headline earnings was
R424 million (2002: R437 million). This excludes the indirect
contribution of FirstRand through Remgro’s interest in RMBH.
For the six months ended 31 December 2002 FirstRand’s
headline earnings decreased by 19.3% to R2 223 million
(2001: R2 754 million). FirstRand’s core operational headline
earnings, before taking into account the exceptional translation
loss mentioned above, increased by 26.7% to R2 585 million.
During this period FirstRand’s Retail Banking division
reflected growth of 26% over the corresponding period. This
increase is due to scale benefits achieved as a result of organic
growth as well as growth resulting from the acquisition of the
mortgage loan books from BoE Limited and Saambou Bank
Limited during the first half of 2002.

P A G E 1 2
R E M G R O L I M I T E D
G E N E R A L R E V I E W
hRMBH: Effective interest 23.1% (2002: 23.1%)
RMBH’s contribution to Remgro’s headline earnings was
R371 million (2002: R384 million). For the twelve months
ended 31 December 2002, 90.7% (2001: 92.3%) of RMBH’s
headline earnings was derived from FirstRand while 9.3%
(2001: 7.7%) was contributed by its other interests.
RMBH’s other interests include RMB Structured
Insurance Limited, OUTsurance Limited (OUTsurance),
Glenrand M.I.B Limited and Global Resorts (SA) (Pty) Limited
(GRSA). OUTsurance reported an exceptional six months to
December 2002 with record sales volumes and profitability
being achieved.
On 22 May 2003 it was announced that the proposed
transaction whereby RMBH intended selling its 48.4% interest
in GRSA to a consortium backed by Mettalon Corporation
Limited, was terminated due to certain conditions precedent not
being met within the contracted time periods.
ABSA: Effective interest 9.4% (2002: 9.4%)
Absa Group Limited’s (Absa) contribution to Remgro’s headline
earnings was R324 million (2002: R179 million).
Absa’s headline earnings for the year ended 31 March 2003
increased by 82.3% to R3 441 million. This high growth stems
from the low earnings base of the previous financial year which
resulted from losses suffered by its microlending subsidiary,
Unifer Holdings Limited (Unifer). Excluding the impact
of Unifer, Absa’s headline earnings increased by 19.8%.
Commercial banking showed good advances growth of 11.9%.
This performance was primarily driven by growth in
Bankfin’s advances. Wholesale domestic advances increased
by 1.7%.
SAGE: Effective interest 16.2% (2002: 16.3%)
Effective 31 December 2002, Sage Group Limited’s (Sage)
financial year-end was changed from March to December. For
the nine months ended 31 December 2002, Sage reported a
GAAP headline loss of R48 million (twelve months ended
31 March 2002: R251 million). Due to the fact that Remgro’s
portion of Sage’s accumulated losses exceeds its carrying value,
Remgro did not account for its portion of Sage’s results for the
nine months ended 31 December 2002. In 2001/2002 Remgro’s
portion of Sage’s headline loss was R42 million.
On 9 April 2003 Sage announced that the company
planned to raise additional capital amounting to R350 million.
This will be achieved by an issue of shares to a consortium of
investors, represented by, and including, AVASA Holdings
Limited, as well as a rights issue to all shareholders of Sage.
Remgro’s maximum exposure in terms of the underwriting
agreement amounts to R92.5 million.
INDUSTRIAL INTERESTS
Contribution to headline earnings:
h R696 million (2002: R570 million)
h Increase 22.1%
Percentage of headline earnings:
h 14% (2002: 13%)
The schemes of arrangement in terms of which Industrial
Partnership Investments Limited (IPI), a wholly-owned
subsidiary of Remgro, acquired all the ordinary and preference
shares in Hunt Leuchars & Hepburn Holdings Limited (HL&H)
not held by it, were sanctioned by the High Court of South
Africa on 22 October 2002. The total purchase consideration
amounted to R985.6 million.
During September 2001 it was announced that Robertsons
Holdings (Proprietary) Limited (Robertsons) and Unilever Plc
(Unilever) had agreed in principle to restructure the interests
they held in the existing joint venture between Robertsons and
Bestfoods Europe. This was a direct result of Unilever’s
acquisition of Bestfoods’ global interests.
The new Unilever Bestfoods Robertsons (UBR) venture, in
which Robertsons holds 41%, was established with effect from
1 April 2002. From that date the interest in UBR has been equity
accounted. In the past the interest in the former Bestfoods
Robertsons joint venture was consolidated proportionately.
P A G E 1 3
R E M G R O L I M I T E D
UNILEVER BESTFOODS ROBERTSONS:
Effective interest 41.0% (2002: 0%)
The UBR venture covers the territories of Southern Africa and
Israel, and it manufactures and markets an extensive range of
food products, enjoying market leadership in most of its major
categories. The overriding objectives of the new venture are to
deliver above-average, top-line growth and increased value
through the realisation of synergies, increased scale and
enhanced resources in leading brands, people, experience and
innovative capabilities.
In South Africa, well-known international and local
brands include Robertsons herbs and spices, Knorr soups, Aromat
seasonings, Skippy, Bovril and Marmite spreads, Rama and Flora
margarine, Melrose cheese, Lipton and Joko tea, and Mrs Ball’s
culinary products.
Notwithstanding difficult economies in several of the
territories included in the venture, good progress has been made
during the first year of operation. In Israel, trading conditions
have become progressively more difficult due to the escalation of
political unrest in the country and a gradual slowdown of the
economy. The Israeli operation has to some extent managed to
offset these difficulties by achieving good growth in retail sales.
UBR’s contribution to Remgro’s headline earnings was
R54 million. The contribution from the former Bestfoods
Robertsons joint venture in 2001/2002 was R91 million. These
results are however not directly comparable due to the fact that
UBR incurred exceptional restructuring expenses against its
headline earnings during the year under review. Excluding the
impact of these exceptional items, UBR’s contribution to
Remgro’s headline earnings would have been R106 million.
TSB: Effective interest 100% (2002: 72.4%)
Transvaal Sugar Limited (TSB) is primarily involved in cane
growing and the production, transport and marketing of refined
and brown sugar and animal feed. Citrus and tea are also grown
on the company’s estates.
The primary area of operation is the Nkomazi region in the
Mpumalanga Lowveld. Sugar production operations are situated
near Malelane and Komatipoort, while citrus is grown on TSB’s
estates in the same region.
Refined and brown sugar products are sold under the Selati
brand name, while citrus is being marketed in the overseas
markets under the Komati Fruits brand name. Approximately
48% of the sugar production is exported. Other products include
Molatek animal feed and Senteeko black tea, which are sold on
the local market.
The sugar industry’s production increased by 15.3% to
2.75 million tons in 2002/2003, whereas TSB’s sugar production
increased by 14.6% during the same period. Cane production on
TSB’s own estates amounted to a best ever 0.85 million tons of
cane compared to 0.76 million tons the previous year.
The citrus operations benefited from an aggressive marketing
effort, the return of export prices to normal levels and the
normalisation of export markets. A total of 36.2 thousand tons of
oranges and grapefruit were exported versus 28.5 thousand tons
the previous year.
TSB achieved record results for its 2003 year with headline
earnings of R105.7 million (2002: R72.4 million).
Operating profit has shown an improvement of
R25.6 million or 15.6%. This marked improvement was mainly
contributed to by focused management attention to productivity
enhancements and cost containment, as well as excellent
climatic conditions which resulted in a record sugar production.
Despite increased competition in the national market,
TSB was able to maintain its market share. TSB’s
contribution to Remgro’s headline earnings was R94 million
(2002: R55 million).
RAINBOW: Effective interest 54.5% (2002: 55.7%)
Rainbow Chicken Limited’s (Rainbow) contribution to
Remgro’s headline earnings increased from R86 million in the
previous year to R152 million in the period under review.
Its headline earnings grew by 77.9% from R154.7 million
to R275.2 million on revenue which, including the impact of
volume and mix improvements in feedmilling, breeding and
boiler operations, increased by 23.8%, from R3.0 billion to
R3.8 billion. The significant increase in revenue was
predominantly attributable to the recovery of higher feed raw
material input costs in sales prices.
Rainbow reported that its optimisation strategy, although
in its early stages, is progressing as planned and benefits
are already beginning to be realised in terms of both cost
efficiencies and better realisations as a result of an enhanced
product mix.

P A G E 1 4
R E M G R O L I M I T E D
G E N E R A L R E V I E W
hAIR PRODUCTS: Effective interest 50% (2002: 50%)
Air Products South Africa (Proprietary) Limited’s (Air Products)
contribution to Remgro’s headline earnings was R44 million
compared to R42 million in the previous year.
In the year under review Air Products continued to
experience strong growth in all the segments in which it
operates following the commissioning of major capital projects
the previous year.
DORBYL: Effective interest 42.4% (2002: 42.6%)
Dorbyl Limited’s (Dorbyl) contribution to Remgro’s headline
earnings was R41 million (2002: R47 million). This
contribution excludes special dividends amounting to
R141 million declared by Dorbyl as a result of its disposal
programme set out hereunder.
During the past year the core focus of Dorbyl has been
considerably narrowed and to this end a significant number of
disposals have been made. Dorbyl’s interest in parts distributor
Midas Limited was sold to a management consortium with effect
from 1 June 2002. In addition, Dorbyl Engineering was sold to a
management consortium with a black empowerment partner
effective August/September 2002.
Due to the significant disposals referred to above, Dorbyl’s
turnover for the year ended 31 March 2003 declined by 34% to
R2.9 billion, while operating income decreased by 15% to
R143.8 million. The continuing operations, however, reflected
significantly higher operating profits for the year when
compared to those of the previous year.
Subsequent to 31 March 2003, Dorbyl disposed of its local
Global Roofing Solutions division.
TOTAL SOUTH AFRICA: Effective interest 34.4%
(2002: 34.4%)
Total South Africa (Proprietary) Limited’s financial position has
remained sound during its 2002 financial year and its retail
market share continued to grow. Its contribution to Remgro’s
headline earnings was R95 million (2002: R92 million).
On 30 April 2003 a new economic empowerment
grouping, Tosaco (Pty) Limited (Tosaco), effectively acquired a
25% shareholding of Total South Africa. This partnership was
finalised after negotiations lasting more than a year. It was
structured to ensure a sustainable transaction, compliant with
the Petroleum and Liquid Fuels Charter on empowering
historically disadvantaged South Africans, with specific
emphasis on enhancing the Total South Africa value chain and
empowering Tosaco in all aspects thereof with a strong
operational involvement in the South African oil industry.
The three shareholders of Total South Africa prior to the
transaction, which consisted of the French-based oil giant
Total, Remgro and Old Mutual, also played a key role in
facilitating this empowerment transaction. Total France
reduced its equity stake to 50.1%, Remgro agreed to dilute its
shareholding from 34.4% to 24.9%, and Old Mutual agreed to
sell its 8% participation back to Total South Africa, thus
making it possible for Tosaco to acquire 25% of Total South
Africa’s share capital.
MALBAK and NAMPAK
The merger between Malbak Limited (Malbak) and Nampak
Limited (Nampak) was successfully concluded during August 2002.
Since then Remgro’s interest in Nampak has been 13.5%.
Malbak’s results were equity accounted for the four months
to 31 July 2002 and that of the enlarged Nampak for the eight
months to 31 March 2003.
NAMPAK: Effective interest 13.5% (2002: 0%)
Nampak’s contribution to Remgro’s headline earnings was
R88 million. Together with Malbak’s earnings for the first four
months, the packaging interests contributed R131 million for
the year under review (2002: R101 million).
For the six months ended 31 March 2003 Nampak reported
an increase in headline earnings of 56% to R468.9 million
(2002: R301.3 million). During this period Nampak’s divisions
achieved overall real volume growth of approximately 2%. In
South Africa the continuation of exports by its local businesses
was a major contributor to this growth.

P A G E 1 5
R E M G R O L I M I T E D
On 7 May 2003 it was announced that Nampak had sold
its 51% interest in NamITech to Allied Technologies Limited
for R522.5 million. This transaction is subject to a number of
conditions, including approval of the competition authorities.
WISPECO: Effective interest 100% (2002: 100%)
Wispeco Holdings Limited’s (Wispeco) contribution to Remgro’s
headline earnings was R28 million (2002: R27 million). It should
however be noted that headline earnings for Wispeco’s previous
financial year included the creation of a deferred tax asset of
R7.5 million (with a corresponding credit in its income state-
ment), while that of the current year included a deferred tax
expense amounting to R11.4 million.
Wispeco’s profit before tax grew by 87.3% from
R20.8 million to R39.0 million. Overall production efficiencies
at Wispeco improved steadily, contributing towards satisfactory
financial results.
MINING INTERESTS
Contribution to headline earnings:
h R322 million (2002: R306 million)
h Increase 5.2%
Percentage of headline earnings:
h 7% (2002: 7%)
GENCOR: Effective interest 10.9% (2002: 10.9%)
Gencor Limited’s (Gencor) contribution to Remgro’s headline
earnings was R223 million (2002: R231 million). These figures
relate to Gencor’s twelve months to 31 December 2002.
Gencor reported attributable profits of R927 million for
the six months ended 31 December 2002 which was 9.5%
lower than the R1 024 million achieved in the corresponding
previous six months. This decrease was mainly due to the lower
income from Impala Platinum Holdings Limited (Impala).
The unbundling of Gencor’s interest in Impala by way
of a dividend in specie was approved by Gencor’s shareholders
on 25 April 2003. Gencor shareholders received their Impala
shares on 18 June 2003. In terms of the Listings Requirements
of the JSE Securities Exchange South Africa, Gencor’s listing
will be suspended six months after the proposed unbundling.
Remgro’s interest in Impala will be approximately 5.0% and it
will no longer be equity accounted.
TRANS HEX: Effective interest 41.1% (2002: 41.9%)
Trans Hex Group Limited’s (Trans Hex) contribution to Remgro’s
headline earnings was R96 million (2002: R75 million).
Trans Hex’s headline earnings increased by 29.9% from
R176.7 million in 2002 to R229.6 million in 2003. Despite
challenging world economic conditions, steady rough diamond
demand with limited seasonal pricing variations contributed to
record diamond sales of $104 million, being an increase of 27%
in dollar terms over the previous year.
CORPORATE FINANCE AND OTHER INTERESTS
Contribution to headline earnings:
h R277 million (2002: R251 million)
h Increase 10.4%
Percentage of headline earnings:
h 5% (2002: 6%)
CORPORATE: Effective interest 100% (2002: 100%)
The central treasury division’s contribution to Remgro’s
headline earnings increased from R143 million to R152 million.
This was mainly the result of higher interest rates than the
previous year, as well as higher cash balances during the first half
of the financial year.
Net corporate costs, including donations, increased by
R6 million from R57 million in 2002 to R63 million in 2003.
MEDI-CLINIC: Effective interest 52.4% (2002: 52.3%)
Medi-Clinic Corporation Limited’s (Medi-Clinic) contribution to
Remgro’s headline earnings was R191 million (2002: R158 million).
Medi-Clinic’s turnover, which consists entirely of
hospital fees levied, increased by 20% to R2 924 million
(2002: R2 438 million), while headline earnings increased by 18%
to R366 million (2002: R309 million) during the year under review.
On 1 December 2002 Medi-Clinic, in conjunction with
Nozala Investments (Proprietary) Limited, Mvelaphanda Capital
(Proprietary) Limited and Utlwanang Holdings (Proprietary)
Limited (a consortium of black medical professionals), acquired

P A G E 1 6
R E M G R O L I M I T E D
G E N E R A L R E V I E W
hthe Curamed Group (Curamed). Curamed is a group of six
Pretoria-based specialist hospitals comprising approximately
700 beds of which about 150 were commissioned in early
June 2003. Medi-Clinic financed its black economic empower-
ment partners in this transaction on commercial terms to the
amount of R49 million, pending external finance being granted.
In addition to the 9 million shares acquired during
its previous financial year, Medi-Clinic acquired a further
2 million of its own shares during the year under review.
These shares will be held in treasury and a total of 1 689 600
shares have already been utilised in terms of its share option
scheme.
ACKNOWLEDGEMENT
To all of those who contributed to the performance of the Group
over the past year, we extend our sincere thanks: to the
shareholders for their continued confidence; the managing
directors and all colleagues in the various Group companies for
their co-operation and support; all other directors, officials and
employees for their dedication; and all parties concerned for
services rendered.
In particular, we express our gratitude to Mr P J Erasmus
who retired from the Board on 28 August 2002, for his valuable
contribution over more than 45 years.
Johann Rupert Thys Visser
Stellenbosch
24 June 2003

P A G E 1 7
R E M G R O L I M I T E D
I N T R I N S I C N E T A S S E T VA L U EAT 3 1 M A R C H 2 0 0 3
h Shares 31 March
held Closing Exchange 2003Notes million price £ million rate R million
Trade mark interestsR&R Holdings 1 561.2 (12.4915) 19 502
– BAT ordinary shares 201.4 (591.5p) 1 191.5– BAT preference shares 1 40.3 (672.9p) 271.1– BAT dividends received/accrued 2 85.1– Other net assets 13.5
Distell Group 58.7 (1 200c) 704
Financial servicesAbsa Group 61.4 (2 940c) 1 805FirstRand 520.7 (650c) 3 385RMB Holdings 274.1 (930c) 2 549Sage Group 10.8 (154c) 17Sagecor 3 9
Industrial interestsRainbow 143.1 (325c) 465TSB 3 1 009Unilever Bestfoods Robertsons 3 1 442Wispeco 3 186Air Products South Africa 3 423Dorbyl 14.0 (1 620c) 228Henkel South Africa 3 13Nampak 86.8 (1 150c) 998Total South Africa 3 1 198
Mining interestsGencor 38.0 (3 500c) 1 330Trans Hex Group 35.2 (1 700c) 599
Other interestsCaxton 7.8 (556c) 43Medi-Clinic 178.6 (750c) 1 339Sundry investments and loans 229Other net assets 143
Cash at the centre 4 1 639
Intrinsic value 39 255
Issued shares less shares repurchased (million) 510.4
INTRINSIC VALUE PER SHARE R76.91
Notes1. The BAT preference shares have been valued on the discounted present value method.2. Remgro’s share of the BAT dividends is repatriated to South Africa annually after year-end. 3. The unlisted investments are at directors’ valuation.4. Cash at the centre excludes cash held by subsidiaries and associates that are separately valued above.

P A G E 1 8
R E M G R O L I M I T E D
C O R P O R AT E G O V E R N A N C E
hRemgro endorses, and is fully committed to comply with, the
principles of the King Report’s Code of Corporate Practices and
Conduct.
The Company is an investment holding company. Reference
to “the Company” also means the Company and its wholly-owned
subsidiaries. It operates on a decentralised business model, as
explained on page 1. Each entity in which the Company is
invested has its own governance structures. In giving effect to its
risk management responsibilities, Remgro has also approved the
maintenance of a broader risk management review programme to
ensure a coherent governance approach throughout the Group.
All the Company’s listed subsidiaries and associated
companies endorse the Code of Corporate Practices and
Conduct where applicable. The Company encourages full
compliance where possible and disclosure where not.
BO A R D C H A RT E R
The Board has adopted a formal charter which has been
implemented to:
h identify, define and record the responsibilities, functions
and composition of the Board, and to
h serve as a reference to new directors.
The charter has been endorsed by all directors of Remgro
Limited.
CO M P O S I T I O N O F T H E BO A R D
Remgro has a fully functional board to lead and control
the Group. The Board currently consists of five executive and
ten non-executive directors of whom six are independent.
The Board shall not comprise fewer than four or more than
sixteen directors or any other number as the directors may from
time to time determine.
The roles of the chairman and the chief executive officer
are separated. The chairman is a non-executive director but is
not independent.
Board members are listed on pages 6 and 7.
RO L E A N D R E S P O N S I B I L I T I E S
The Board is ultimately accountable for the performance and
affairs of the Company. It provides strategic direction. In
directing the Group, the Board exercises leadership, integrity and
judgement based on fairness, accountability, responsibility and
transparency so as to achieve continuing prosperity for the
Group.
After approving operational and investment plans and
strategies, the Board empowers executive management to
implement these and to provide timely, accurate and relevant
feedback on progress made.
The Board remains accountable for the overall success of
the approved strategies, based on values, objectives and
stakeholder requirements, and for the process and policy to
ensure the integrity of risk management and internal controls.
The Board is the focal point of the Group’s corporate
governance and is also responsible for ensuring that it complies
with all relevant laws, regulations and codes of best business
practices.
The Board is responsible for monitoring the operational
and investment performance of the Group including relevant
financial and non-financial aspects. It is also responsible for
ensuring that procedures and practices are in place which will
protect the Company’s assets and reputation.
The Board has established the following subcommittees to
assist it in discharging its duties and responsibilities:
h The Remuneration and Nomination Committee, consisting
of four non-executive directors, advises the Board on
the remuneration of all directors and members of senior
management and is responsible for succession planning.
Additionally, it annually participates in evaluating the
performance of directors, the effectiveness of the Board as well
as that of the Audit and Risk Committee. The committee is
also responsible for nominating directors. The chairman of the
Board is chairman of this committee. The chief executive
officer attends meetings only by invitation.
The committee has a formal mandate and its
effectiveness is judged by the Board in terms thereof.
Directors do not have long-term contracts or exceptional
benefits associated with the termination of services.
h The Audit and Risk Committee, consisting of three non-
executive directors and one executive director, reviews the
adequacy and effectiveness of the following: the financial

P A G E 1 9
R E M G R O L I M I T E D
reporting process; the system of internal control; the
management of financial, investment, technological and
operating risks; risk funding; the internal and external audit
processes; the Company’s process for monitoring compliance
with laws and regulations; its own code of business conduct;
and procedures implemented to safeguard the Company’s
assets. An independent non-executive director is chairman
of the committee.
The committee has a formal mandate and its
effectiveness is judged by the Board in terms thereof.
h The Executive Committee, consisting of all five executive
directors, meets regularly between Board meetings to deal
with issues delegated by the main Board.
The Board is responsible for the appointment of new
directors and for the orientation of new directors.
Non-executive directors are selected for their broader
knowledge and experience and are expected to contribute
effectively to decision-making and the formulation of policy.
Executive directors contribute their detailed insight to
day-to-day operations enabling the Board to identify goals,
provide direction and determine the feasibility of the strategies
proposed. These directors are generally responsible for taking
and implementing all operational decisions.
The Board annually reviews and assesses the mix of skills
and experience offered by Board members as well as its
composition in the light of the country’s demographics to ensure
that it is adequately equipped to achieve the Company’s
objectives and to create shareholder value over the long term.
ME E T I N G S A N D Q U O R U M
The articles of association requires three directors to form a
quorum for Board meetings. A majority of members, preferably
with significant representation of the non-executive directors,
are required to attend all committee meetings.
The Remgro Board meets at least six times a year. The
Audit and Risk Committee meets at least four times a year, and
the Remuneration and Nomination Committee meets at least
once a year.
MAT E R I A L I T Y A N D A P P R OVA L F R A M E W O R K
Issues of a material or strategic nature, which can impact on the
reputation of the Company, are referred to the Board. All other
issues, as mandated by the Board, are dealt with at senior
management level.
The minutes of all the committee meetings are circulated
to the members of the Board. Issues that require the Board’s
attention or a Board resolution, are highlighted and included as
agenda items for the next Board meeting.
RE M U N E R AT I O N P R I N C I P L E S
The Company’s policy that guides the remuneration of all
directors and senior management is aimed at:
h retaining the services of existing directors and senior
management
h attracting potential directors and senior managers
h providing directors and senior management with
remuneration that is fair and just
h ensuring that no discrimination occurs
h recognising and encouraging exceptional and value-added
performance
In line with these objectives, the Remuneration and
Nomination Committee annually reviews and evaluates the
performance of each director and member of senior
management, and determines their annual salary adjustments.
For this purpose it also refers to salary surveys compiled by
independent organisations.
DU T I E S O F D I R E C T O R S
The provisions of the Companies Act place certain duties on
directors and stipulate that they should apply the necessary care
and skill in fulfilling their duties. To ensure that this is achieved,
best practice principles, as contained in the King Report on
Corporate Governance for South Africa (King II), are applied.
The Companies Act does not differentiate between executive
and non-executive directors and requires that the directors:
h prepare annual financial statements that fairly represent the
Company’s state of affairs and its profit or loss position for
the period under review;
h select suitable accounting policies and apply them
consistently;
h state whether applicable accounting standards have been
followed; and
h make judgements and estimates that are reasonable and
prudent.

P A G E 2 0
R E M G R O L I M I T E D
In terms of the legislation they also have a duty to:
h keep proper accounting records;
h take steps to safeguard the assets of the Company;
h prevent and detect fraud and other irregularities;
h implement a system of internal control and review its
effectiveness;
h disclose conflicts of interest; and
h disclose information truthfully.
The Board is also responsible for formulating the
Company’s communication policy and to ensure that
spokespersons adhere to it. This responsibility includes clear,
balanced and truthful communication to shareholders and
relevant stakeholders.
CO N F L I C T S
Mechanisms are in place to recognise, respond to and manage
any potential conflicts of interest. Directors are required to sign,
at least once a year, a declaration stating that they are not aware
of any conflicts of interest that may exist due to their interest in
or association with any other company. In addition, the
Companies Act also requires directors to disclose interests in
contracts that are of significance to the Company’s business.
All information not disclosed publicly, which directors
acquire in the performance of their duties, must be treated as
confidential, and directors may not use, or appear to use, such
information for personal advantage or for the advantage of third
parties.
All directors of the Company are required to comply with
the Remgro Code of Conduct and the requirements of the JSE
Securities Exchange South Africa (JSE) regarding inside
information, transactions and disclosure of transactions.
CO M PA N Y SE C R E TA RY A N D P R O F E S S I O N A L
A D V I C E
All directors are entitled to seek independent professional
advice concerning the affairs of the Group, at the Company’s
expense.
All directors have unlimited access to the services of the
Company Secretary, who is responsible to the Board for ensuring
that proper corporate governance principles are adhered to.
Board orientation or training is done when appropriate.
GO I N G C O N C E R N
The Board must at least once a year consider the going concern
status of the Group with reference to the following:
h Net available funds and the liquidity thereof
h The Group’s residual risk profile
h World economic events
h The following year’s strategic/business plan and budgets
h The Group’s current financial position
The Board, having reflected on the above, is satisfied that, for
the year under review, it executed the required actions
contained in the charter satisfactorily.
RI S K M A N A G E M E N T A N D I N T E R N A L C O N T R O L
Risk management is a process whereby specific risks are
terminated, transferred or tolerated by means of the planning,
implementing and controlling of activities and resources to
minimise the impact of all risks to acceptable levels.
Internal control is a process to manage certain risks and to
achieve efficiency and effectiveness of operations, sound
financial controls and compliance with applicable laws and
regulations. It provides reasonable, but not absolute, assurance
against material misstatement and loss.
In addressing its risk management and internal control
responsibilities the Board has formalised the practices adopted by
Remgro in an Enterprise-wide Risk Management Methodology,
which incorporates recognised control frameworks and the
recommendations contained in King II. The Board has satisfied
itself as to the effectiveness and efficiency of this process.
The Enterprise-wide Risk Management Methodology
consists of the following six stages:
h Corporate governance
An important part of Remgro’s corporate governance strategy
aims to exploit judiciously the opportunities presented to the
Group in accordance with its risk appetite, whilst striving to
C O R P O R AT E G O V E R N A N C E
h

P A G E 2 1
R E M G R O L I M I T E D
increase the entity’s capacity to retain risk whilst minimising its
cost of risk.
Key to this is the communication, recommendation,
support and implementation of appropriate strategies, policies,
procedures and corporate values within the Group.
In defining the strategic plan for sustainable wealth
creation, cognisance is taken of Remgro’s risk appetite, which is
influenced by economic cycles, global events, available assets,
risk financing strategies, etc.
h Group risk analysis
The purpose of the Group risk analysis is to, as far as possible and
with the assistance of the various companies, determine and
interpret the structures, interrelations and objectives of the
various key activities of the entities within the Group. It is
formally conducted annually and is subject to continuous review.
This analysis recognises objectives per key activity,
identified risk, potential impact of such risks, probability of
occurrence of the identified risks and the controls and procedures
in place to timeously identify and respond to new emerging risks.
h Activity risk assessment
The activity risk assessments are performed at key activity level
to further refine the risk profile developed under the Group risk
analysis.
This process includes prioritisation of analysed risks in
terms of significance to objectives, benchmarking of existing
controls to risk profiles and changes in the control environment.
h Risk financing
It is Remgro’s policy that the financing of residual risk takes
place subsequent to the implementation of prudent risk
management initiatives aimed at reducing exposure to
acceptable levels in accordance with the Group’s risk appetite.
In this regard, Remgro’s strategy is to limit the risk
financing activities to catastrophe levels only once adequate risk
retention levels have been created.
h Integrated assurance
Corporate governance models advocate the integration of
internal and external audit initiatives. Over and above this, the
Board wants to ensure that their initiatives are also integrated
with the control measures related to management and other
activities.
In this regard integrated assurance providers use Risk
Minimiser® to ensure that these initiatives support the Group’s
Control Self-assessment Methodology.
The various assurance providers to the Board comprise:
h The Executive Committee, executive directors and senior
management
h The Audit and Risk Committee
In addition to the responsibilities mandated by the Board in
its charter to the Audit and Risk Committee in respect of
the Company and its wholly-owned subsidiaries, the
committee also aims, as far as possible, to be fully informed
regarding effective risk management and internal control
assurances processes of non-wholly-owned subsidiaries and
associated companies.
If and when required, this committee will, through
Remgro’s representatives on those boards or through any
other appropriate means, bring as much influence to bear as
possible to have the responsible parties take the necessary
corrective action.
Internal audit
The Company has an internal audit function which has
been outsourced to the service company’s Risk
Management and Internal Audit department. It is an
effective independent appraisal function and employs a
risk-based audit approach, formally defined in line with the
Institute of Internal Auditors’ (IIA) definition of internal
auditing in a charter approved by the Audit Committee.
The head of this department has direct access to the
chairman of the Audit Committee as well as to the
chairman of the Group. The head of this department is also
the chairperson of the Group’s Risk Management and
Internal Audit Forum established to promote best practice
throughout the Group.
External audit
The Company’s external auditors attend all Audit
Committee meetings and have direct access to the
chairman of the Audit Committee. Their audit coverage is
adequately integrated with the Internal Audit functions
without their scope being restricted.
Other services provided by the auditing firm mainly
comprise tax matters and are effected by a department
independent to the audit partners.
P A G E 2 2
R E M G R O L I M I T E D
h Tax Committee
The Tax Committee, which is a management committee
consisting of senior officers and executive directors, meets
regularly to attend to the implications of all relevant tax
amendments with a view to ensure optimal tax planning and
compliance with relevant legislation.
h Risk Funding Committee
The Risk Funding Committee, which is a management
committee, deals with pure risk, risk funding strategies and
related matters.
h Management of risk
Remgro and its service company, as well as various group
companies, have selected Risk Minimiser® as the appropriate
computerised risk management tool, using control self-assessment
to manage the risks within its various core key activities.
Risk Minimiser® is designed to empower management,
through control and risk self-assessment capability, to enable
informed decision-making and plan for contingencies. The
system confirms compliance with key controls, drives real-time
risk profiles, reports incidents and non-compliances on an
exception basis whilst distributing all relevant laws, policies and
procedures to accountable management.
The process of risk management has also been
incorporated into the daily activities of the service company.
The system incorporates self-monitoring mechanisms, and
actions are taken to correct deficiencies as they are identified.
It is subject to regular internal and external audit reviews.
The Company has a safety, security, health and
environment committee addressing pertinent matters. The
Company Secretary, along with the Group Risk Manager and
the Tax Committee, addresses certain compliance risks.
h
The Audit and Risk Committee has reviewed the risk
management programmes and systems of internal control of the
Company and its wholly-owned subsidiaries for the financial
year to 31 March 2003. The directors are of the opinion that,
based on inquiries made and the reports from the internal and
external auditors, the risk management programmes and systems
of internal control were effective for the period under review.
The Audit and Risk Committee has also satisfied itself that
there are effective audit committees functioning at the
Company’s significant non-wholly-owned subsidiaries and
associated companies.
HIV/AI D S P O L I C Y
During February 2003, the GLOBAL Reporting Initiative™
(GRI) published a resource document to serve as a reporting
guidance on HIV/Aids. Because the GRI chose South Africa as
the development area for this resource document, which will
eventually become a technical protocol, Remgro chose it as its
reporting standard on this matter.
From the perspective of an investment holding company,
the risk of HIV/Aids comprises two elements, namely:
Group risk
Given the potential impact of HIV/Aids on the markets, on
human capital cost of employment and on the operational
processes of the various businesses invested in, this risk is
managed within the governance structures of the various
companies.
Remgro monitors the progress of these policies and
strategies as against best practice standards.
Company risk
The service company, M&I Management Services (Proprietary)
Limited (M&I), has a formal Aids policy and has committed itself
to manage actively the pandemic, and the business risks associated
with it. Its policy makes provision, inter alia, for the following:
h Compliance with all legal requirements as far as HIV/Aids
is concerned
h No discrimination against employees or potential
employees based on their HIV status
h Strict confidential treatment of information on the HIV
status of employees
h General measures to prevent accidental infection
Remedi Medical Aid Scheme, of which most of M&I’s staff
are members, has a management plan for HIV/Aids and
employees can participate in it by choice.
C O R P O R AT E G O V E R N A N C E
h

P A G E 2 3
R E M G R O L I M I T E D
The above guidelines developed into what is
today Remgro’s value system. The Company fundamentally
believes that these values incorporate the spirit whereby it
strives to be a good corporate citizen. It furthermore believes
that ethical behaviour stems from the values system
communicated from and demonstrated by the Board of
Directors.
Remgro’s commitment to ethical behaviour is contained in
the following widely published documents:
h Code of ethics
h Code of conduct
h Fraud prevention policy
h Internet policy
h Disciplinary code
The Board was responsible for the establishment
and distribution of these documents with compliance being
monitored by means of management structures, internal audit,
and the Group’s central forensic function including hotlines.
AC C E S S T O I N F O R M AT I O N
Remgro complies with the regulations of the Promotion of
Access to Information Act (Act No 2 of 2000) which ensure the
constitutional right of access to information required for the
exercising or protection of any rights.
DE A L I N G S I N S E C U R I T I E S
In accordance with the Listings Requirements of the JSE, the
Company has adopted a code of conduct for insider trading.
During the closed period directors and designated employees are
prohibited from dealing in the Company’s securities. The closed
period endures from the end of a financial reporting period until
the publication of financial results for that period. Additional
closed periods may be declared from time to time if circumstances
so warrant.
GR O U P E T H I C S
Dr Anton Rupert, the founding Chairman of the Rembrandt
Group, which today includes Remgro Limited, more than
40 years ago drew up guidelines for doing business successfully.
These included:
h Honesty
h Correctness
h Courtesy
h Service
h Mutual support
h Faith
h Transparency
h Integrity in all dealings with stakeholders
h Respect for company property, assets and the law

P A G E 2 4
R E M G R O L I M I T E D
S E RV I C E C O M PA N Y
hAn agreement was concluded with a service company, M&I
Management Services (Proprietary) Limited (M&I), to render
management and support services to Remgro. The shareholders of
M&I are employees of M&I who own all the issued ordinary shares.
Rembrandt Trust (Proprietary) Limited owns all the A ordinary
shares of M&I. The A ordinary shares only have voting rights but
have no rights to the income or assets of M&I.
Remgro pays fees to M&I which cover the overhead costs of the
management of Remgro. These fees will not exceed 0.463% per
year of the market capitalisation of Remgro, calculated on a
monthly average basis. This percentage may not be exceeded
without the approval of 75% of all classes of shareholders of
Remgro. The fees for the past year are disclosed in note 16 to the
annual financial statements.
E M P L O Y M E N T E Q U I T Y
hThe service company, M&I, strives to afford all staff the
opportunity to realise their full potential, in accordance with the
Employment Equity Act.
A steering committee and various work groups, together
with M&I’s management, are involved in determining training
and development needs and in the implementation and
monitoring of a labour plan. Special attention is given to those
groups which, because of historic reasons, might be in a
disadvantaged position.
In accordance with the requirements of the Employment
Equity Act, M&I Group Services submitted during the past year
its third labour plan to the Department of Labour.
Because of the nature of its operations, to provide inter alia
core services to Remgro, M&I’s work force is characterised by
the following:
h A high level of expertise within the top structure of the
organisation and in various specialised divisions
h A young employee profile, especially with regard to
management
h A low turnover rate of staff and, consequently, limited
opportunities for new appointments
In view of the constraints inherent in an investment holding
company, M&I has, from the outset, chosen a five-year period for its
labour plan to allow sufficient time to add value to its labour force.
The service company believes that the quality of its staff
affords it an important sustainable competitive advantage.
Therefore it believes that its success does not lie in the
uniformity of its staff but in the diversity and development of
their collective talents. For these, space and opportunity will
always be created.

P A G E 2 5
R E M G R O L I M I T E D
S U S TA I N A B I L I T Y R E P O RTS E R V I C E T O T H E C O M M U N I T Y
hCorporate citizenship, namely the commitment of business
to contribute to sustainable economic development, has always
been part of our Group’s business philosophy. This includes
working with employees, their families, the local community
and society at large to improve their quality of life.
The Company’s viewpoint, as far as its business and its
community service programme are concerned, is to make a
meaningful contribution and to add value. Donations are often
made over a term to provide beneficiaries with a measure of
security. They are also not spread over such a broad area that the
extent and effect become negligible.
In accordance with this approach, the Company is
currently involved in the following projects and institutions:
EN T R E P R E N E U R S H I P A N D T R A I N I N G
In partnership with VenFin, the Company has made a
substantial investment in two notable educational and job
creating projects: the SA College for Tourism at Graaff Reinet
and the Southern African Wildlife College near the border of the
Kruger National Park.
SA College for Tourism – This college, initiated by Dr Anton
Rupert, was officially opened by the wife of the President,
Mrs Zanele Mbeki, on 18 October 2002. She praised the College
at Graaff Reinet for its initiative in creating career opportunities
for black women in the age group 25 – 35.
The College was established as one of four pillars identified
by the Peace Parks Foundation for a successful transnational
park strategy to attract ever-increasing numbers of foreign
tourists to Southern Africa. The pillar the College represents is
accommodation – the training of students from previously
disadvantaged communities for careers in the hospitality
industry.
Last year 28 students followed courses in culinary arts; food
and beverage studies; room division and front-of-house services;
communication, marketing and tourism; entrepreneurship
(business administration) and financial management. Three of
the students were from Lesotho and the others from the Eastern
Cape (12), Western Cape (6), Free State (3), Limpopo (2),
Gauteng and KwaZulu-Natal.
South African Wildlife College – A report on the College’s
long-course programmes was published during the past year by
two independent reviewers. It was most favourable.
Their research took them to 10 African countries. After
interviewing 48 graduates and gathering information on
approximately 20 others, it was found that 90% of the graduates
had remained in the conservation field. Employers of these
students recognised their training and increased their
responsibilities, particularly in management areas. Positive
results flowing from this recognition included the following: the
establishment of an education centre for local schoolchildren, a
library and a visitor centre (Zambia), the compilation and
implementation of management plans for protected area
management (Botswana and Kenya), and the development
of conservation training programmes for communities
(Mozambique and Zambia).
Scimathus – This is a project of the Institute for Mathematical
and Science Teaching at the University of Stellenbosch. Its aim
is to provide students from formerly disadvantaged communities
with the opportunity to improve their efficiency in mathematics
and science or accountancy in order to gain access to tertiary
education.
Remgro is now in its third year of involvement with
Scimathus and is grateful to report that the project has already
made a difference in the lives of these students. The course is
not without sacrifice on the part of the students. Some of them
travel 90 km daily to attend classes.
Scimathus has set itself various goals, amongst which are:
a well-functioning school with 60 black post-matric students;
highly skilled teachers to guide the students and to engender a
culture of learning among students so that, on completing the
course, they will be able to enroll for degree programmes in the
natural sciences, applied natural sciences and economic and
management sciences at the University of Stellenbosch and
other tertiary institutions.

P A G E 2 6
R E M G R O L I M I T E D
S U S TA I N A B I L I T Y R E P O RTS E R V I C E T O T H E C O M M U N I T Y
hMost of these goals have already been achieved and,
thanks to the quality attention they received, many of last year’s
students were able to improve upon their matriculation results of
the previous year.
EN V I R O N M E N T
WWF-South Africa – Remgro has been a corporate member
of this conservation organisation since its establishment
35 years ago.
Over the past year WWF-SA has shifted its approach to a
bigger focus on thematic programmes which include: oceans and
coastal areas, freshwater, forests, grasslands, fynbos, succulent
Karoo, species of special concern, toxics and environmental
education.
The following are highlights of the past year:
h The most recent southern right whale survey (funded by The
Green Trust for the second year in a row, and by
WWF-SA for four years before that) indicated the highest
number of whales ever seen in the 32-year history of the survey.
h WWF-SA hosted WWF’s Africa and Madagascar
Environmental Education Network meeting, which was
attended by delegates from throughout Africa and
Madagascar.
h The wild dog re-introduction project in Hluhluwe-
Umfolozi continues successfully. Seven puppies were born
last year.
h A total of R24 million of the required R30 million was
raised for the Noordhoek Kommetjie wetlands to secure this
missing link in the conservation spine of the Cape
Peninsula.
CU LT U R A L D E V E L O P M E N T
Klein Karoo National Arts Festival (KKNK) – This
festival is in its ninth year and Remgro’s sponsorship of the
festival in its third year. As a display window of the country’s
performing arts, the festival cannot be equalled.
In his sponsor’s message to the festival, the Company’s
Chief Executive Officer said inter alia:
“It is a liberating thought that we are starting to realise
that art has no colour. Of this, the Arts Festival is a worthy
display window. It also serves as a mirror of society’s hope,
anxiety, despair and even feelings of guilt.
The value of such a festival for stimulating and weighing
the beliefs and values of society, should not be underestimated.
It can hardly be expected of artists to act as moral protectors or
the conscience of society. However, their interpretation thereof
can help to give perspective and a new dimension, and rid us of
rigid stereotypes.”
Parliamentary Millennium Project (PMP) – A donation
has been made to this nation-building project that forms part of
the South African and African Renaissance.
The project strives to create a common perspective and an
acceptance of the realities in South Africa. It wants to build
bridges of understanding and appreciation for the way in which
everyone’s experience of the past is helping to shape the present,
with the ultimate goal of uniting all South Africans under the
President’s banner of I am an African, and to support the values
embedded in the Constitution.
One of the pilot projects of the PMP was the exhibition,
for the first time in public, of a digitalised version of the Da Ming
Hun Yi Tu, a Chinese map of the entire continent of Africa,
dating from 1389.
Stellenbosch Festival – In the 15th year of this festival,
Remgro once again participated and sponsored a symphony
concert by the Cape Philharmonic Orchestra, with Christopher
Dowdeswell as conductor and Anton Nel as soloist.
The Festival enjoyed good publicity and an important
contribution to the development of music was made through
various workshops and master classes for students and pupils
from all communities.
SP O RT D E V E L O P M E N T
SA Golf Development Board (SAGDB) – Good progress
has been made during the past year with the execution of the
Board’s business plan. Staff have been appointed to manage
resources and to implement the proposed development strategy.

P A G E 2 7
R E M G R O L I M I T E D
For the purpose of its activities, the SAGDB has divided
the country into two manageable sections, which were
again subdivided into ten regions. Of these regions Gauteng,
Free State and Northern Cape, KwaZulu-Natal, Border and the
Western Cape (including Boland) are fully operational.
The Eastern Cape, Mpumalanga, Southern Cape, Limpopo
and North West will become operational during 2003.
During the past year the Technikon Pretoria has assisted
the SAGDB in drawing up a training programme for teachers of
golf. This programme, comprising a three-year diploma course to
be recognised by the South African Qualifications Board, will
train teachers to teach golf to children.
Included in the teaching is a life skills programme
incorporating the following core values: honesty, integrity,
sportsmanship, respect, confidence, responsibility, perseverance,
courtesy and judgement.
Western Cape Cricket Academy – As founder-sponsor of
the Academy, Remgro resumed its financial support of the
Academy during the past year following BAT’s withdrawal from
the sponsorship.
The Academy, a joint undertaking between the Boland
Cricket Board and the Western Province Cricket Association, is
now in its tenth year and has reached, to a great extent, maturity
as an institution. Long gone are the days of mutual rivalry
between the two provinces. Good co-operation in the interest of
cricket is now the overriding aim.
The Academy’s relatively short history is characterised by
many highlights, amongst which are the following: 20 players
of the Boland Academy and 16 of the WP Academy have
already been promoted to their respective provincial teams,
while four players from the Boland and one from the WP have
played for the SA national side.
At national level, especially after the World Cup
Tournament, cricket is going through a process of reflection and
introspection. Yet, at ground level, there can be peace of mind,
especially in the Western Cape, where a solid foundation is
being laid for players who, in future, could carry the flag at
provincial and national level.
CO M M U N I T Y D E V E L O P M E N T
Ikamva Labantu – In partnership with VenFin, Remgro is
largely responsible for the administrative costs of this
community organisation.
Ikamva Labantu has more than one thousand projects
under its umbrella and the support it receives from Remgro and
VenFin helps to give financial peace of mind to people who are
at the frontline of poverty alleviation.
Commenting on this partnership in a recent report, Helen
Lieberman, Director of Ikamva, said the following:
“This security has allowed us all to reach a point of
development where we are able to be critical of our work,
understand the need for transformation of the organisation and
in doing so pledge to be more professional, effective and
efficient.”
“Thanks to this sponsorship,” says Mr Sipho Puwani
(Managing Director), “the organisation has stability; the staff
members are motivated in the knowledge that there is
sustainability; the organisation is focused on service delivery and
identifying critical areas of intervention rather than striving for
survival; and Ikamva now has the ability to attract and sustain
competent staff.”
Home-based care, school readiness programmes, child and
family centres, skills development, care for senior citizens, special
programmes for the disabled and the provision of wheelchairs are
only a few of the many areas in which Ikamva Labantu is active.
Organ Donor Foundation SA – The group from which Remgro
developed has for 35 years been directly involved in the alleviation
of health needs. From 1968 to 1993 it sustained financially a
Medical Shuttle Service that provided medical assistance to Lesotho.
During the 25 years the service was rendered, more than 5 000
operations were performed over weekends by volunteers from the
medical profession in South Africa.
Since 1990 the Company has supported the Gift of Life
programme of the Organ Donor Foundation of SA. Four flights,
in which the staff of Falconair involve themselves with great
distinction, are sponsored annually to transport life-giving
organs for emergency operations.
P A G E 2 8
R E M G R O L I M I T E D
D AT E S O F I M P O RTA N C E T O S H A R E H O L D E R S
hFinancial year-end 31 March
Annual general meeting 26 August 2003
Financial reportsAnnouncement of interim results NovemberInterim report DecemberAnnouncement of annual results JuneAnnual financial statements July
DividendsInterim dividend– declared November– paid JanuaryFinal dividend– declared June– paid August
FINANCIAL REPORT
2003

C O N T E N T S
h
Statement of responsibility by the
Board of Directors 32
Certificate by the Company Secretary 33
Report of the independent auditors 33
Report of the Board of Directors 34
Accounting policies 41
Balance sheets 44
Income statements 45
Statements of changes in equity 46
Cash flow statements 47
Notes to the annual financial statements 48
Annexure A – Principal subsidiary companies 68
Annexure B – Principal investments 69
Annexure C – Significant associated companies 70
Annexure D – Information on business and
geographical segments 72
Administration 74
Notice to shareholders 75
Explanatory notes to the notice to shareholders 77
Guidelines for the use of: 78
– Form of proxy Attached
– Voting instruction form Attached
P A G E 3 1

P A G E 3 2
R E M G R O L I M I T E D
S TAT E M E N T O F R E S P O N S I B I L I T YB Y T H E B O A R D O F D I R E C T O R S
hThe directors are responsible for the maintenance of adequate accounting records and the preparation and integrity of the annual
financial statements included in this Annual Report. The independent auditors are responsible for reporting on the annual financial
statements.
The annual financial statements are prepared, in accordance with South African Statements of Generally Accepted Accounting
Practice and the requirements of the South African Companies Act, on the going concern basis and incorporate full and responsible
disclosure. The annual financial statements are based upon appropriate accounting policies which are in accordance with those of the
previous year and supported by reasonable and prudent judgements and estimates, with the exception of accounting for the
Company’s long-term share incentive scheme and the implementation of the South African Statement of Generally Accepted
Accounting Practice, AC 433: Consolidation and equity method – Potential voting rights and allocation of ownership interests.
The directors are of the opinion that the Group will continue as a going concern in the future.
Signed on behalf of the Board of Directors.
Johann Rupert Thys Visser
Chairman Chief Executive Officer/Deputy Chairman
Stellenbosch
24 June 2003
P A G E 3 3
R E M G R O L I M I T E D
C E RT I F I C AT E B Y T H E C O M PA N Y S E C R E TA RY
hI, Mariza Lubbe, being the Company Secretary of Remgro Limited, hereby certify that all returns required of a public company have,
in respect of the year under review, been lodged with the Registrar of Companies and that all such returns are true, correct and
up-to-date.
Mariza Lubbe
Secretary
Stellenbosch
24 June 2003
R E P O RT O F T H E I N D E P E N D E N T AU D I T O R ST O T H E M E M B E R S O F R E M G R O L I M I T E D
hWe have audited the annual financial statements and Group annual financial statements of Remgro Limited set out on pages 34 to 73
for the year ended 31 March 2003. These financial statements are the responsibility of the Company’s directors. Our responsibility is
to express an opinion on these financial statements based on our audit.
SC O P E
We conducted our audit in accordance with statements of South African Auditing Standards. Those standards require that we plan
and perform the audit to obtain reasonable assurance that the financial statements are free of material misstatement.
An audit includes:
h examining, on a test basis, evidence supporting the amounts and disclosures included in the financial statements,
h assessing the accounting principles used and significant estimates made by management, and
h evaluating the overall financial statement presentation.
We believe that our audit provides a reasonable basis for our opinion.
AU D I T O P I N I O N
In our opinion, the financial statements fairly present, in all material respects, the financial position of the Company and Group at
31 March 2003 and the results of their operations, changes in equity and cash flows for the year then ended in accordance with South
African Statements of Generally Accepted Accounting Practice, and in the manner required by the Companies Act in South Africa.
Registered Accountants and Auditors
Chartered Accountants (SA)
Stellenbosch
24 June 2003
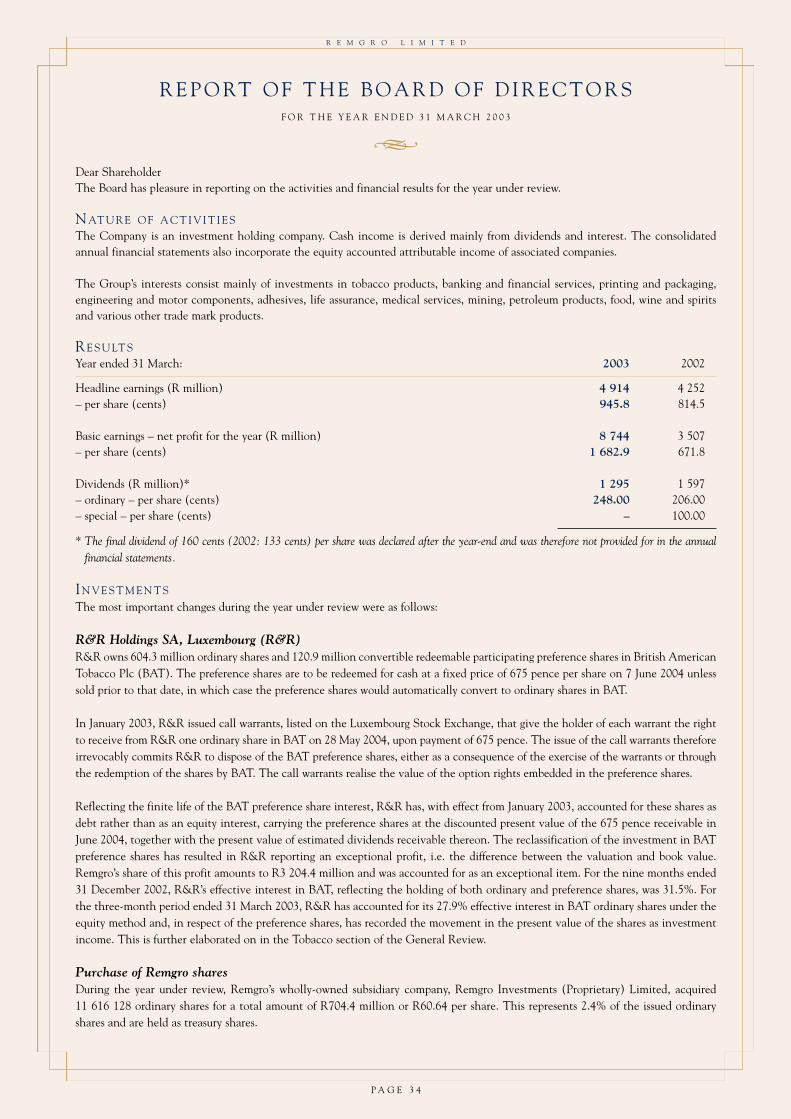
P A G E 3 4
R E M G R O L I M I T E D
R E P O RT O F T H E B O A R D O F D I R E C T O R SF O R T H E Y E A R E N D E D 3 1 M A R C H 2 0 0 3
hDear ShareholderThe Board has pleasure in reporting on the activities and financial results for the year under review.
NAT U R E O F A C T I V I T I E SThe Company is an investment holding company. Cash income is derived mainly from dividends and interest. The consolidatedannual financial statements also incorporate the equity accounted attributable income of associated companies.
The Group’s interests consist mainly of investments in tobacco products, banking and financial services, printing and packaging,engineering and motor components, adhesives, life assurance, medical services, mining, petroleum products, food, wine and spiritsand various other trade mark products.
RE S U LT SYear ended 31 March: 2003 2002
Headline earnings (R million) 4 914 4 252– per share (cents) 945.8 814.5
Basic earnings – net profit for the year (R million) 8 744 3 507– per share (cents) 1 682.9 671.8
Dividends (R million)* 1 295 1 597– ordinary – per share (cents) 248.00 206.00– special – per share (cents) – 100.00
* The final dividend of 160 cents (2002: 133 cents) per share was declared after the year-end and was therefore not provided for in the annualfinancial statements.
IN V E S T M E N T S
The most important changes during the year under review were as follows:
R&R Holdings SA, Luxembourg (R&R)R&R owns 604.3 million ordinary shares and 120.9 million convertible redeemable participating preference shares in British AmericanTobacco Plc (BAT). The preference shares are to be redeemed for cash at a fixed price of 675 pence per share on 7 June 2004 unlesssold prior to that date, in which case the preference shares would automatically convert to ordinary shares in BAT.
In January 2003, R&R issued call warrants, listed on the Luxembourg Stock Exchange, that give the holder of each warrant the rightto receive from R&R one ordinary share in BAT on 28 May 2004, upon payment of 675 pence. The issue of the call warrants thereforeirrevocably commits R&R to dispose of the BAT preference shares, either as a consequence of the exercise of the warrants or throughthe redemption of the shares by BAT. The call warrants realise the value of the option rights embedded in the preference shares.
Reflecting the finite life of the BAT preference share interest, R&R has, with effect from January 2003, accounted for these shares asdebt rather than as an equity interest, carrying the preference shares at the discounted present value of the 675 pence receivable inJune 2004, together with the present value of estimated dividends receivable thereon. The reclassification of the investment in BATpreference shares has resulted in R&R reporting an exceptional profit, i.e. the difference between the valuation and book value.Remgro’s share of this profit amounts to R3 204.4 million and was accounted for as an exceptional item. For the nine months ended31 December 2002, R&R’s effective interest in BAT, reflecting the holding of both ordinary and preference shares, was 31.5%. Forthe three-month period ended 31 March 2003, R&R has accounted for its 27.9% effective interest in BAT ordinary shares under theequity method and, in respect of the preference shares, has recorded the movement in the present value of the shares as investmentincome. This is further elaborated on in the Tobacco section of the General Review.
Purchase of Remgro sharesDuring the year under review, Remgro’s wholly-owned subsidiary company, Remgro Investments (Proprietary) Limited, acquired11 616 128 ordinary shares for a total amount of R704.4 million or R60.64 per share. This represents 2.4% of the issued ordinaryshares and are held as treasury shares.

P A G E 3 5
R E M G R O L I M I T E D
Standard Bank Investment Corporation Limited (Stanbic)The 3.1 million Stanbic shares received during April 2000 by way of a dividend in specie from the Gencor Limited’s unbundling weresold for R110.6 million during May 2002. The transaction realised an after-tax capital surplus of R77.1 million which was accountedfor as an exceptional item.
FirstRand Limited (FirstRand)During May 2002 a further investment of R111 million was made in FirstRand. Since then Remgro’s direct interest in FirstRandamounts to 9.6%.
Malbak Limited (Malbak)The scheme of arrangement between Malbak and its shareholders was sanctioned by the High Court of South Africa on 14 August 2002.In terms of this arrangement, Remgro received 74 374 104 Nampak Limited (Nampak) shares and R167.7 million in cash in exchangefor its Malbak shares. The transaction realised an after-tax capital surplus of R310.4 million which was accounted for as anexceptional item. During August 2002 Remgro made a further investment of R159.0 million in Nampak. Since then Remgro’s interestin Nampak amounts to 13.5%.
Malbak’s results were equity accounted for the four months to 31 July 2002 and that of the enlarged Nampak for the eight months to31 March 2003.
Universa (Proprietary) Limited (Universa)On 20 August 2002 the Mine Employees Pension Fund and Sentinel Mining Industry Retirement Fund (collectively, the MPFs), Sage
Group Limited (Sage) and Financial Securities Limited (FSL), a wholly-owned subsidiary of Remgro, (collectively, the Universa
shareholders) and Sanlam Limited (Sanlam) announced that they had restructured the agreements between them in respect of their
interests in Absa Group Limited (Absa). In addition, FSL, the MPFs and Sanlam have entered into a new Absa shareholders’
agreement. Sage elected to withdraw from the previous Absa shareholders’ agreement and no longer participates in the new Absa
shareholding pool.
The unbundling of Universa’s shareholding in Absa was finalised on 8 November 2002. An application for the voluntary liquidation of
Universa was submitted on 22 January 2003. Remgro has a direct interest in Absa of 9.4%.
Hunt Leuchars & Hepburn Holdings Limited (HL&H)The schemes of arrangement in terms of which Industrial Partnership Investments Limited (IPI), a wholly-owned subsidiary of
Remgro, acquired all the ordinary and preference shares in HL&H not held by it, were sanctioned by the High Court of South Africa
on 22 October 2002.
The listing of HL&H shares on the JSE Securities Exchange South Africa (JSE) was terminated on 28 October 2002. In terms of the
schemes of arrangement, IPI acquired 60.0 million HL&H ordinary shares and 37.9 million HL&H preference shares on 4 November 2002
for a total consideration of R985.6 million. HL&H has since been a wholly-owned subsidiary of Remgro.
Robertsons Holdings (Proprietary) Limited (Robertsons)During September 2001 it was announced that Robertsons and Unilever Plc (Unilever) had agreed in principle to restructure their
interests in the existing joint venture between Robertsons and Bestfoods Europe. This proposal was a direct result of Unilever’s
acquisition of Bestfoods’ global interests.
The new Unilever Bestfoods Robertsons (UBR) venture, in which Robertsons holds 41%, was established with effect from 1 April 2002.
From that date the interest in UBR has been equity accounted for. In the past the interest in the former Bestfoods Robertsons joint
venture was consolidated proportionately.

P A G E 3 6
R E M G R O L I M I T E D
Medi-Clinic Corporation Limited (Medi-Clinic)The interest in Medi-Clinic on 31 March 2003 was 52.4%. Previously the interest in excess of 50% was considered to be temporary
due to personnel options not yet exercised which could dilute the interest to below 50%. Because of the purchase of shares by Medi-
Clinic this expected dilution will probably not take place and therefore, from 1 April 2002, Medi-Clinic has been consolidated as a
subsidiary company.
Subsequent to the year-end:
Total South Africa (Proprietary) Limited
An empowerment transaction was announced recently. On 30 April 2003 the shareholders of Total South Africa, namely Total France,
Remgro and Old Mutual, restructured their shareholding and Total South Africa issued 25% of its voting capital to Tosaco (Proprietary)
Limited (Tosaco) in exchange for cash. Total France now holds 50.1%, Remgro 24.9% and Tosaco 25.0% of Total South Africa.
Gencor Limited (Gencor)
The unbundling of Gencor’s interest in Impala Platinum Holdings Limited (Impala) by way of a dividend in specie was approved by
Gencor’s shareholders on 25 April 2003.
Gencor shareholders received their Impala shares on 18 June 2003. In terms of the Listings Requirements of the JSE, Gencor’s listing
will be suspended six months after the proposed unbundling. Remgro’s interest in Impala will be approximately 5.0% and it will no
longer be equity accounted.
Sage Group Limited (Sage)
On 9 April 2003 Sage announced that the company plans to raise additional capital to the amount of R350 million.
This will be accomplished by an issue of shares to a consortium of investors, represented by, and including, AVASA Holdings Limited,
as well as a rights issue to all shareholders of Sage.
Remgro’s maximum exposure in terms of the underwriting agreement amounts to R92.5 million.
GR O U P F I N A N C I A L R E V I E W
Prior year adjustmentsChanges in accounting policyThe accounting policy in respect of the Company’s long-term share incentive scheme (the “scheme”) has been changed.
In the past, the diluted headline and basic earnings per share were based on the weighted number of shares in issue after adjustment
for the dilutive effect of shares which were to be issued to participants in the scheme. The trustees of the Share Trust subsequently
decided rather to acquire shares in the open market and 3 950 000 shares were purchased for an amount of R277 million in June 2002
for this purpose.
The estimated cost of the scheme, after taking into account dividends received on the relevant shares, is accounted for against income
and headline earnings on a straight-line basis over a four-year period with a corresponding credit to equity. The comparative figures
have been restated in respect of the portion attributable to the expired periods. The effect of the change in accounting policy on
headline earnings and headline earnings per share was as follows:
R E P O RT O F T H E B O A R D O F D I R E C T O R SF O R T H E Y E A R E N D E D 3 1 M A R C H 2 0 0 3
h

P A G E 3 7
R E M G R O L I M I T E D
31 March2002
Headline earnings R million
Previously reported 4 277Net scheme cost for the year (25)
Restated headline earnings 4 252
Net scheme cost for the year to 31 March 2003 amounts to R16 million.
31 March2002
Headline earnings per share Cents
Previously reported 819.3Net scheme cost for the year (4.8)
Restated headline earnings per share 814.5
Net scheme cost per share for the year to 31 March 2003 amounts to 3.1 cents.
AC 433 During the year under review the Company implemented AC 433: Consolidation and equity method – Potential voting rights andallocation of ownership interests. The effect on earnings for the year ended 31 March 2002 was not material, therefore thecomparative income statement has not been restated.
ComparabilityCertain balance sheet and income statement items are not directly comparable with those of the prior financial year due to: a) the consolidation of Medi-Clinic as a subsidiary company from 1 April 2002. Previously it was equity accounted as an associated
company, andb) the equity accounting of the interest in Unilever Bestfoods Robertsons from 1 April 2002. Previously the interest in the former
Bestfoods Robertsons joint venture was proportionately consolidated.
Balance sheetThe analyses of “Equity” and of “Source of headline earnings” below reflect the divisions into which the interests have been classified.Each division represents the main business sector of the investments classified thereunder. No adjustment has been made wherecompanies are mainly active in one sector but also have interests in other sectors.
2003 2002R per R per
R million share R million share
Equity employedInterest of own members 27 809 54.49 24 062 46.10
Employment of equityTrade mark interests 10 001 19.59 8 117 15.55Financial services 8 735 17.11 8 222 15.75Industrial interests 5 877 11.52 4 158 7.97Mining interests 866 1.70 748 1.43Corporate finance and other interests 2 330 4.57 2 817 5.40
27 809 54.49 24 062 46.10
Income statement 2003 2002
R million % R million %
Source of headline earningsTrade mark interests 2 498 51 2 167 51Financial services 1 121 23 958 23Industrial interests 696 14 570 13Mining interests 322 7 306 7Corporate finance and other interests 277 5 251 6
4 914 100 4 252 100

P A G E 3 8
R E M G R O L I M I T E D
R E P O RT O F T H E B O A R D O F D I R E C T O R SF O R T H E Y E A R E N D E D 3 1 M A R C H 2 0 0 3
h2003 2002
R million R million
Composition of headline earningsSubsidiary companies and joint ventures 600 389
Profits 605 395Losses (5) (6)
Associated companies 4 314 3 863
Profits 4 316 3 914Losses (2) (51)
4 914 4 252
CO M PA N Y N E T P R O F I T A N D A P P R O P R I AT I O NThe Company’s own distributable reserves at the beginning of the year amounted to 8 000 7 350Net profit for the year 1 352 1 584Dividend No 4 of 133.00c per share paid in August 2002 (2001: 106.00c) (694) (553)Special dividend of 100.00c per share paid in August 2002 (522) –Dividend No 5 of 88.00c per share paid in January 2003 (2002: 73.00c) (460) (381)
The Company’s own distributable reserves carried forward to the following year amounted to 7 676 8 000
SH A R E S C H E M EDuring the year the trustees of the Remgro Share Scheme (the “scheme”) offered ordinary shares to participants as follows:(Also refer note 27)
NumberOffer Number of sharesprice of shares accepted on
Date (Rand) offered 31 March 2003
02/04/2002 63.00 11 169 11 16903/06/2002 69.80 8 181 2 72201/07/2002 69.40 1 361 1 36101/08/2002 68.00 4 868 4 86825/11/2002 68.50 321 204 –02/12/2002 66.20 1 736 –23/01/2003 63.00 383 896 –
732 415 20 120
The present position of the Remgro Share Scheme is as follows:Average
offer price Number(Rand) of shares
Ordinary shares offered and accepted:Previous financial year 44.31 3 952 638Offered and accepted in current financial year 65.56 20 120Offered in previous financial year and accepted in current financial year 63.11 24 123Resignations (32 198)
Total accepted as at 31 March 2003 44.53 3 964 683
The offers are valid for one year from the date of the offer. The scheme is a deferred purchase scheme and payment is made in threeequal annual instalments of which the first instalment is payable only after three years. Participants have no right to delivery, votingor dividends on shares before payment has been made. Participants may choose to pay on a later date with the resultant defermentof rights. Payment must, however, be made within ten years.

P A G E 3 9
R E M G R O L I M I T E D
SE RV I C E C O M PA N Y
In 2000, an agreement was concluded with a service company, M&I Management Services (Proprietary) Limited (M&I), to render
management and support services to Remgro. The shareholders of M&I are employees of M&I who own all the issued ordinary shares.
Rembrandt Trust (Proprietary) Limited (Rembrandt Trust) owns all the A ordinary shares of M&I. The A ordinary shares only have
voting rights but have no rights to the income or assets of M&I.
Remgro pays fees to M&I which cover the overhead costs of the management of Remgro. These fees will not exceed 0.463% per year
of the market capitalisation of Remgro, calculated on a monthly average basis. This percentage may not be exceeded without the
approval of 75% of all classes of shareholders of Remgro. The fees for the past year are disclosed in note 16 to the annual financial
statements.
PR I N C I PA L S H A R E H O L D E R
Rembrandt Trust holds all the issued unlisted B ordinary shares of the Company and is entitled to 42.2% of the total votes.
An analysis of the shareholders appears on page 4.
SU B S I D I A RY C O M PA N I E S A N D I N V E S T M E N T S
Particulars of subsidiary companies, associated companies and other investments are disclosed in Annexures A and B.
DI R E C T O R S
On 28 August 2002, Mr P J Erasmus retired as a non-executive director.
The names of the directors appear on pages 6 and 7.
In terms of the provision of the articles of association, Messrs D M Falck, J F Mouton, F Robertson, J P Rupert and P G Steyn retire
from the Board by rotation. These directors are eligible and offer themselves for re-election.
The following directors of the Company serve on committees of the Board:
Audit and Risk Committee: Messrs P G Steyn, D M Falck, J F Mouton and F Robertson.
Remuneration and Nomination Committee: Messrs J P Rupert, P K Harris, J F Mouton and F Robertson.
On 28 August 2002, Mr P J Erasmus retired as chairman of the Audit Committee and as member of the Remuneration Committee.
On 28 August 2002, Mr P G Steyn was appointed chairman of the Audit Committee.
DI R E C T O R S’ I N T E R E S T S
At 31 March 2003 the aggregate of the direct and indirect interests of the directors in the issued ordinary share capital of the
Company amounted to 0.63% (2002: 0.63%).
Mr J P Rupert is a director of Rembrandt Trust which owns all the issued unlisted B ordinary shares.
An analysis of directors’ interests in the issued capital of the Company appears on page 5.
DI R E C T O R S’ E M O L U M E N T S
The Board recommends that directors’ fees for services rendered as directors during the past financial year be fixed at R900 420
(2002: R499 000).
AC Q U I S I T I O N O F S H A R E S O F T H E CO M PA N Y
It is recommended that a general authority be granted to the Board to acquire, should circumstances warrant it, the Company’s own
shares and to approve the acquisition of shares in the Company by any of its subsidiaries, subject to the provisions of the Companies
Act 61 of 1973, as amended, and the Listings Requirements of the JSE.
Special resolutions to this effect are incorporated in the notice of the annual general meeting that appears on page 75.

P A G E 4 0
R E M G R O L I M I T E D
R E P O RT O F T H E B O A R D O F D I R E C T O R SF O R T H E Y E A R E N D E D 3 1 M A R C H 2 0 0 3
hDI V I D E N D S
Dividend No 6A final dividend of 160 cents (2002: 133 cents) per share was declared in respect of both the ordinary shares of one cent each and
the unlisted B ordinary shares of ten cents each, for the financial year ended 31 March 2003.
Together with the interim dividend of 88 cents (2002: 73 cents) per share paid during January 2003, total dividends for the financial
year amounted to 248 cents (2002: 206 cents) per share.
PaymentThe final dividend is payable to shareholders of the Company registered at the close of business on Friday, 15 August 2003.
On payment date, Monday 18 August 2003, if so mandated, dividends due to holders of certificated securities will either be transferred
electronically to bank accounts, or alternatively, cheques will be posted to their registered addresses.
Dividends in respect of dematerialised shareholdings will be paid through the STRATE system.
Shareholders may not dematerialise or rematerialise their holdings of ordinary shares between Monday, 11 August 2003, and Friday,
15 August 2003, both days inclusive.
SE C R E TA RY
The name and address of the Company Secretary appears on page 74.
AP P R OVA L
The annual financial statements set out on page 34 to 73 have been approved by the Board.
Signed on behalf of the Board of Directors.
Johann Rupert Thys VisserChairman Chief Executive Officer/Deputy Chairman
Stellenbosch24 June 2003

P A G E 4 1
R E M G R O L I M I T E D
A C C O U N T I N G P O L I C I E SF O R T H E Y E A R E N D E D 3 1 M A R C H 2 0 0 3
hThe annual financial statements are prepared mainly on the historical cost basis in accordance with South African Statementsof Generally Accepted Accounting Practice and the requirements of the South African Companies Act and incorporate the followingprincipal accounting policies which are consistent in all respects with those of the previous year, with the exception of accountingfor the Company’s long-term share incentive scheme and the implementation of the South African Statement of Generally AcceptedAccounting Practice, AC 433: Consolidation and equity method – Potential voting rights and allocation of ownership interests:
( I) CO N S O L I D AT I O N, P R O P O RT I O N AT E C O N S O L I D AT I O N A N D E Q U I T Y A C C O U N T I N GConsolidation – subsidiary companiesAll companies in which the Group, directly or indirectly, has an interest of more than one half of the voting rights orotherwise has the power to exercise control over the operations, are included in the consolidated financial statements inthe accepted manner.
The results of subsidiary companies acquired or disposed of during the year are included in the consolidated incomestatement from or to the date on which effective control was obtained or ceased.
In cases where the Group’s controlling interest is only of a temporary nature the particular companies are not consolidatedbut accounted for according to the equity method as associated companies.
Proportionate consolidation – joint venturesAll jointly controlled ventures are accounted for according to the proportionate consolidation method. In terms of thismethod the attributable share of assets, liabilities, income, expenditure and cash flow are included in the consolidatedstatements. The share of retained income is transferred to non-distributable reserves.
Equity accounting – associated companiesCompanies which are neither subsidiaries nor joint ventures, but in which a long-term interest is held and over whosefinancial and operating policies a significant influence can be exercised, are accounted for according to the equity methodas associated companies. Certain associated companies have year-ends which differ from that of the Company. In suchcircumstances the results of listed and certain unlisted companies are accounted for from the latest published informationand management accounts as at year-end, respectively. The Group’s share of retained income is transferred to non-distributable reserves. The Group’s share of other movements in the reserves of associated companies are accounted for aschanges in consolidated non-distributable reserves.
The results of associated companies acquired or disposed of are included in the consolidated income statement from theeffective date of acquisition and up to the effective date of disposal.
( I I ) PR O P E RT Y, P L A N T A N D E Q U I P M E N T A N D D E P R E C I AT I O NLeased assets – assets leased in terms of finance lease agreements are capitalised at their equivalent cash consideration.Depreciation is provided on the straight-line basis over the expected useful lives of the assets. Finance charges are writtenoff over the term of the lease in accordance with the effective interest rate method. Leases of assets in terms of which allthe risks and benefits of ownership are effectively retained by the lessor are classified as operating leases. Payments madeunder operating leases are accounted for in normal income.
Preproduction costs and interest – preproduction costs as well as interest on borrowings directly related to major capitalprojects under construction are capitalised until such assets are brought into a working condition for their intended use.
Land and buildings – are stated at cost. Buildings are depreciated on a straight-line basis over their expected useful lives.Leasehold improvements are stated at cost and are written off over the periods of the leases.
Machinery, equipment, office equipment and vehicles – are stated at cost and are depreciated on a straight-line basis overtheir expected useful lives.
Agricultural development costs – Agricultural development costs consist of planting and other development costs of sugarcane and other crops. These costs are capitalised in the first year of planting and depreciated on a straight-line basis overtheir expected useful lives. Ongoing cultivation costs are expensed as incurred.
Where assets are identified as being impaired, that is when the recoverable amount has declined below its carrying amount,the carrying amount is reduced to reflect the decline in value. Such written-off amounts are accounted for in normal income.
( I I I ) IN V E S T M E N T P R O P E RT I E SInvestment properties are held to generate rental income and appreciate capital value. Investment properties are treated aslong-term investments and are carried at cost less accumulated depreciation. Buildings are depreciated on a straight-linebasis over their expected useful lives.
Investment properties are valued by external independent professional valuers every third year. Where assets are identifiedas being impaired the carrying amount is reduced. Such written-off amounts are accounted for in normal income.

P A G E 4 2
R E M G R O L I M I T E D
A C C O U N T I N G P O L I C I E SF O R T H E Y E A R E N D E D 3 1 M A R C H 2 0 0 3
h( I V) IN TA N G I B L E A S S E T S
Goodwill – on the acquisition of an investment, fair values at the date of acquisition are attributed to the identifiableseparable assets and liabilities acquired.
The goodwill or negative goodwill is the difference between the cost of the investments and the reasonable value ofattributable net assets of the subsidiary companies, joint ventures and associated companies at the acquisition dates. Goodwillor negative goodwill is reported in the balance sheet as non-current assets and amortised using the straight-line method overits estimated useful life, not exceeding twenty years. Where the net assets of subsidiary companies, joint ventures andassociated companies at the date of acquisition exceed the cost of investments acquired, this excess is accounted for asnegative goodwill.
Trade marks – the costs of trade marks which are established and developed by the Group itself are expensed as incurred.The value thereof is consequently not reflected in the annual financial statements. The costs of trade marks which havebeen purchased are written off on a straight-line basis over their expected useful lives, not exceeding twenty years.
Research and development costs – research and development costs are written off against income as incurred. Where theasset recognition criteria have been met, development expenditure is capitalised and written off over the expected usefullife of the product.
(V) IN V E S T M E N T SAssociated companies – are stated at cost after adjustment for goodwill. In the consolidated annual financial statementsthe share of post-acquisition reserves and retained income, accounted for according to the equity method, is included inthe carrying value.
Other long-term investments – are stated at cost, less amounts written off for declines in value considered not to be of atemporary nature. Such amounts written off are accounted for as exceptional items.
Portfolio investments – are stated at cost less amounts written off for declines in value considered not to be of a temporarynature. Such amounts written off and profits and losses on realisation, are accounted for in normal income.
(V I) IN V E N T O R I E S A N D C O N T R A C T S I N P R O G R E S SInventories are stated at the lower of cost or net realisable value. The basis of determining cost is the first-in first-out costmethod. Where applicable, provision is made for slow-moving and redundant inventories. Work in progress and finished goodsinclude direct costs and an appropriate allocation of manufacturing overheads.
(V I I) TA X AT I O NDeferred taxation is provided for at current rates using the balance sheet liability method. Full provision is made for alltemporary differences between the taxation base of an asset or liability and its balance sheet carrying amount. No deferred taxliability is recognised in those circumstances where the initial recognition of an asset or liability has no impact on accountingprofit or taxable income. Assets are not raised in respect of deferred taxation on assessed losses, unless it is probable that futuretaxable profits will be available against which the deferred taxation asset can be realised in the foreseeable future.
Secondary taxation on companies is provided for in respect of dividend payments, net of dividends received or receivableand is recognised as a taxation charge for the year.
(V I I I ) FO R E I G N C U R R E N C I E STransactions in foreign currencies are accounted for at the rates of exchange ruling on the dates of the transactions. Foreigncurrency monetary items at year-end are translated to SA rand at the rates of exchange ruling at that date. Exchangedifferences that arise as a result thereof, are accounted for in income together with realised exchange differences on forwardexchange contracts.
Assets, liabilities and reserves of foreign entities at year-end are translated to SA rand at the rates of exchange ruling atthat date. Operating results of foreign subsidiaries and income of foreign associated companies are translated to SA rand atthe average of the exchange rates prevailing during the year for each of the currencies concerned. Differences arising ontranslation are accounted for in reserves as exchange rate adjustments.
( I X) FI N A N C I A L I N S T R U M E N T SFinancial instruments include those carried on the balance sheet and off-balance sheet instruments.
Financial instruments carried on the balance sheet include cash and cash equivalents, investments, trade and otherreceivables, trade and other payables, provisions, leases and borrowings.
Certain group companies are also parties to financial instruments that reduce exposure to fluctuations in foreign currencyexchange rates. These instruments, which mainly comprise forward exchange contracts, are not recognised in the financialstatements on inception.

R E M G R O L I M I T E D
Fair values and the recognition methods of the different financial instruments are disclosed in the notes to the financialstatements. Fair values represent an approximation of possible values, which may differ from the value that will befinally realised.
Where the redemption of loans is provided for by means of investments in financial instruments which allow for thecontractual right of set-off against the loan and it is expected that the loan will be settled in this way, the related balancesheet items are set off against one another.
(X) PR OV I S I O N SProvisions are recognised when a legal or constructive obligation exists as a result of past events, it is probable that anoutflow of resources embodying economic benefits will be required to settle the obligation, and a reliable estimate of theamount of the obligation can be made.
Employee entitlements to leave are recognised when they accrue to employees involved. A provision is made for theestimated liability for leave as a result of services rendered by employees up to balance sheet date.
(X I) EM P L O Y E E B E N E F I T SPension obligations – companies in the Group provide defined benefit and defined contribution plans for the benefit ofemployees, the assets of which are held in separate trustee-administered funds. These plans are funded by payments fromthe employees and the Group, taking into account recommendations of independent qualified actuaries.
For the defined benefit plans, the pension accounting costs are assessed using the projected unit credit method. Underthis method, the cost of providing pensions is charged to the income statement to spread the regular costs overthe service lives of the employees in accordance with advice of qualified actuaries who carry out a full valuation of the plansevery three years. The pension obligation is measured as the present value of the estimated future cashoutflows using interest rates of government securities that have terms to maturity approximating the terms of the relatedliability.
The net surplus or deficit of the benefit obligation is the difference between the present value of the funded obligations andthe fair value of the plan assets.
All actuarial gains and losses are spread forward over the average remaining service lives of the employees.
The Group’s contribution to the defined contribution pension plans is charged to the income statement in the year inwhich they relate.
Post-retirement medical obligations – the Group provides post-retirement medical benefits to its retirees. The entitlementto post-retirement medical benefits is based on the employees remaining in service up to retirement age and the completionof a minimum service period.
The expected costs of these benefits are expensed and the liabilities accumulated over the period of employment, usingaccounting methodology similar to that for defined pension plans. Valuation of these obligations is carried out byindependent qualified actuaries.
(X I I) CA S H A N D C A S H E Q U I VA L E N T SFor the purpose of the cash flow statement, cash and cash equivalents comprise cash on hand, deposits held at call withbanks, and investments in money market instruments, net of bank overdrafts. In the balance sheet, bank overdrafts areincluded in short-term interest-bearing loans.
(X I I I ) RE V E N U E R E C O G N I T I O NThe sale of goods is recognised when the significant risks and rewards of ownership of the goods have been transferred.Revenue arising from services is recognised when the service is rendered. Interest is recognised on a time proportion basis(taking into account the principal outstanding, the effective rate and the period), unless collectability is in doubt.Dividends are recognised when the right to receive payment is established.
(X I V) TR E A S U RY S H A R E SShares in the Company held by a wholly-owned subsidiary company are classified as treasury shares and are held at cost.These shares are treated as a deduction from the issued number of shares and taken into account in the calculation of theweighted average number of shares. The cost price of the shares is deducted from the Group’s equity.
(X V) LO N G-T E R M S H A R E I N C E N T I V E S C H E M EThe estimated cost of the scheme, after taking into account dividends received on the relevant shares, is accounted foragainst income and headline earnings on a straight-line basis over a four-year period with a corresponding credit to equity.
P A G E 4 3

P A G E 4 4P A G E 4 4
R E M G R O L I M I T E D
B A L A N C E S H E E T SAT 3 1 M A R C H 2 0 0 3
h
CONSOLIDATED THE COMPANY
2003 2002 2003 2002Notes R million R million R million R million
AS S E T S
Non-current assetsProperty, plant and equipment 1 3 255 2 063 – –Investment properties 2 22 20 – –Goodwill and trade marks 3 3 361 2 687 – –Investments – Associated companies 4 19 844 16 984 – –
– Other 5 109 115 7 685 8 009Loans 6 326 12 – –Deferred taxation 20 84 17 – –
27 001 21 898 7 685 8 009Current assets 4 075 4 435 2 1
Inventories 7 676 616 – –Trade and other receivables 1 094 1 117 – –Taxation 19 5 2 1Cash and cash equivalents 2 286 2 697 – –
Total assets 31 076 26 333 7 687 8 010
EQ U I T Y A N D L I A B I L I T I E S
Capital and reservesIssued capital 8 8 8 8 8Reserves 9 28 505 24 054 7 676 8 000Treasury shares 8 (704) – – –
Interest of own members 27 809 24 062 7 684 8 008Minority interest 1 583 929
Total shareholders’ equity 29 392 24 991 7 684 8 008Non-current liabilities 358 244 – –
Retirement benefits 10 103 74 – –Long-term interest-bearing loans 11 140 41 – –Deferred taxation 20 115 129 – –
Current liabilities 1 326 1 098 3 2
Trade and other payables 929 859 3 2Short-term interest-bearing loans 12 73 110 – –Provisions 13 180 82 – –Taxation 144 47 – –
Total equity and liabilities 31 076 26 333 7 687 8 010

R E M G R O L I M I T E D
I N C O M E S TAT E M E N T SF O R T H E Y E A R E N D E D 3 1 M A R C H 2 0 0 3
h
CONSOLIDATED THE COMPANY
2003 2002 2003 2002Notes R million R million R million R million
Revenue 14 11 212 8 441 1 356 1 589
Operating profit 15 & 17 1 262 792 1 352 1 584Finance costs (45) (58) – –
Profit from normal operations 1 217 734 1 352 1 584Amortisation of goodwill 18 (166) (138)Impairment of assets (24) –Exceptional items 19 1 245 (20) – –
Profit before tax 2 272 576 1 352 1 584Taxation 20 (302) (173) * *
Profit after taxation of the Company and its subsidiaries 1 970 403 1 352 1 584Share of after-tax profit of associated companies 21 7 262 3 255
Profit from normal operations 4 421 3 881Amortisation of goodwill 18 (308) (276)Impairment of assets (63) –Exceptional items 19 3 212 (350)
Group profit after tax 9 232 3 658 1 352 1 584Minority interest 22 (488) (151)
Net profit for the year 8 744 3 507 1 352 1 584
* Amount smaller than R500 000
Reconciliation of headline earnings:Basic earnings – net profit for the year 8 744 3 507Plus/(minus) – portion attributable to own members:– Amortisation of goodwill 18 473 414– Impairment of assets 72 –– Exceptional items (4 354) 351– Net surplus, after taxation, on the disposal of
property, plant and equipment (21) (35)– Other – 15
Headline earnings 4 914 4 252
Earnings per share Cents Cents
Headline earnings per share 23 945.8 814.5
Basic earnings per share 23 1 682.9 671.8
P A G E 4 5

P A G E 4 6
R E M G R O L I M I T E D
S TAT E M E N T S O F C H A N G E S I N E Q U I T YF O R T H E Y E A R E N D E D 3 1 M A R C H 2 0 0 3
hCONSOLIDATED
Equity Other non- Distri-Issued accounted distributable butable Treasurycapital reserves reserves reserves shares Total
R million R million R million R million R million R million
2003Balances at 1 April – as previously reported 8 11 834 229 11 976 – 24 047Prior year adjustments 26 41 (52) 15
Adjusted balances at 1 April 8 11 860 270 11 924 – 24 062Net profit for the year 8 744 8 744Dividends paid (1 674) (1 674)Exchange rate adjustments (1 718) (16) (451) (2 185)Change in interests in subsidiary companies,
associated companies and joint ventures – (22) (1) (23)Change in reserves of associated companies and
other reserves (445) – 9 (436)Transfer of income of associated companies retained 4 680 (4 680) –Other transfers between reserves (558) 363 195 –Purchase of shares by wholly-owned subsidiary
(treasury shares) (704) (704)Long-term share incentive scheme reserve – 25 25
Balances at 31 March 8 13 819 620 14 066 (704) 27 809
2002Balances at 1 April – as previously reported 8 7 992 151 11 236 – 19 387Prior year adjustments – 12 (33) (21)
Adjusted balances at 1 April 8 7 992 163 11 203 – 19 366Net profit for the year 3 507 3 507Dividends paid (934) (934)Exchange rate adjustments 1 996 98 37 2 131Change in interests in subsidiary companies,
associated companies and joint ventures 86 (30) 5 61Change in reserves of associated companies and
other non-distributable reserves (89) (5) – (94)Transfer of income of associated companies retained 1 844 (1 844) –Other transfers between reserves 31 19 (50) –Long-term share incentive scheme reserve 25 25
Balances at 31 March 8 11 860 270 11 924 – 24 062
THE COMPANY
2003 2002R million R million
Balances at 1 April 8 008 7 358
Issued capital 8 8Distributable reserves 8 000 7 350
Net profit for the year 1 352 1 584Dividends paid (1 676) (934)
Balances at 31 March 7 684 8 008

R E M G R O L I M I T E D
C A S H F L OW S TAT E M E N T SF O R T H E Y E A R E N D E D 3 1 M A R C H 2 0 0 3
h
CONSOLIDATED THE COMPANY
2003 2002 2003 2002Notes R million R million R million R million
Cash flows – operating activitiesNet operating profit before taxation 2 272 576 1 352 1 584Adjustments 24.1 (1 105) 249 (1 352) (1 584)
Operating profit before working capital changes 1 167 825 – –Working capital changes 24.2 (117) (207) 1 1
Cash generated from operations 1 050 618 1 1Cash flow generated from returns on investments 2 542 1 697 1 352 1 584
Interest received 372 235 – –Interest paid (45) (58) – –Dividends received 24.3 2 215 1 520 1 352 1 584
Taxation (paid)/received 24.4 (220) (111) (1) 1
Cash available from operating activities 3 372 2 204 1 352 1 586Dividends paid 24.5 (1 773) (968) (1 676) (934)
Cash inflow/(outflow) from operating activities 1 599 1 236 (324) 652
Cash flows – investing activitiesNet investments to maintain operations (99) (18) – –
Replacement of property, plant and equipment (128) (40) – –Proceeds on disposal of property, plant and equipment 29 22 – –
Investments to expand operations (1 870) (231) – –
Additions to – property, plant and equipment (262) (145) – –– investments and loans (622) (86) – –
Buy-out of subsidiary company’s minorities (986) – – –
Proceeds from disposal of investments and business 576 48 – –
Proceeds from disposal of – investments 365 48 – –– business 211 – – –
Cash acquired on acquisition of business 154 – – –Purchase of treasury shares (704) – – –
Net cash generated/(utilised) before financing activities (344) 1 035 (324) 652
Cash flows– financing activities (82) (158) 324 (652)
(Increase)/decrease in loans to subsidiary companies – – 324 (652)Issue of new shares by subsidiary companies 9 – – –Capital contributed by minorities of subsidiary company 14 – – –Decrease in interest-bearing debt (98) (158) – –Buy-back of own shares by a subsidiary company (7) – – –
Net increase/(decrease) in cash and cash equivalents (426) 877 – –Cash and cash equivalents at the beginning of the year 2 677 1 800 – –
Cash and cash equivalents at the end of the year 2 251 2 677 – –
Cash and cash equivalents – per balance sheet 2 286 2 697Bank overdraft (35) (20)
P A G E 4 7
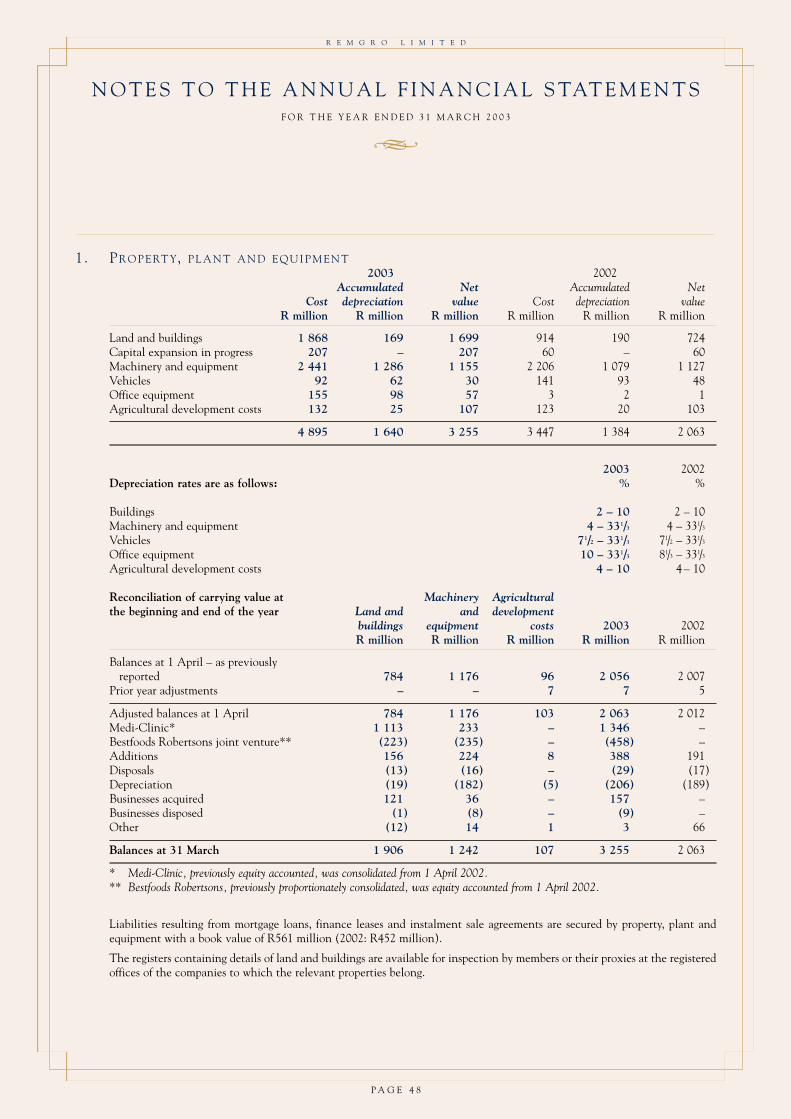
P A G E 4 8
R E M G R O L I M I T E D
N O T E S T O T H E A N N U A L F I N A N C I A L S TAT E M E N T SF O R T H E Y E A R E N D E D 3 1 M A R C H 2 0 0 3
h
1. PR O P E RT Y, P L A N T A N D E Q U I P M E N T2003 2002
Accumulated Net Accumulated NetCost depreciation value Cost depreciation value
R million R million R million R million R million R million
Land and buildings 1 868 169 1 699 914 190 724Capital expansion in progress 207 – 207 60 – 60Machinery and equipment 2 441 1 286 1 155 2 206 1 079 1 127Vehicles 92 62 30 141 93 48Office equipment 155 98 57 3 2 1Agricultural development costs 132 25 107 123 20 103
4 895 1 640 3 255 3 447 1 384 2 063
2003 2002Depreciation rates are as follows: % %
Buildings 2 – 10 2 – 10Machinery and equipment 4 – 331/3 4 – 331/3
Vehicles 71/2 – 331/3 71/2 – 331/3
Office equipment 10 – 331/3 81/3 – 331/3
Agricultural development costs 4 – 10 4 – 10
Reconciliation of carrying value at Machinery Agriculturalthe beginning and end of the year Land and and development
buildings equipment costs 2003 2002R million R million R million R million R million
Balances at 1 April – as previously reported 784 1 176 96 2 056 2 007
Prior year adjustments – – 7 7 5
Adjusted balances at 1 April 784 1 176 103 2 063 2 012Medi-Clinic* 1 113 233 – 1 346 –Bestfoods Robertsons joint venture** (223) (235) – (458) –Additions 156 224 8 388 191Disposals (13) (16) – (29) (17)Depreciation (19) (182) (5) (206) (189)Businesses acquired 121 36 – 157 –Businesses disposed (1) (8) – (9) –Other (12) 14 1 3 66
Balances at 31 March 1 906 1 242 107 3 255 2 063
* Medi-Clinic, previously equity accounted, was consolidated from 1 April 2002.** Bestfoods Robertsons, previously proportionately consolidated, was equity accounted from 1 April 2002.
Liabilities resulting from mortgage loans, finance leases and instalment sale agreements are secured by property, plant andequipment with a book value of R561 million (2002: R452 million).
The registers containing details of land and buildings are available for inspection by members or their proxies at the registeredoffices of the companies to which the relevant properties belong.

P A G E 4 9
R E M G R O L I M I T E D
2 . IN V E S T M E N T P R O P E RT I E S2003 2002
Accumulated Net Accumulated NetCost depreciation value Cost depreciation value
R million R million R million R million R million R million
Land 3 – 3 3 – 3Buildings 25 6 19 23 6 17
28 6 22 26 6 20
2003 2002Depreciation rates are as follows: % %Buildings 2 2
Reconciliation of carrying value at Land Buildings 2003 2002the beginning and end of the year R million R million R million R million
Balances at 1 April – as previously reported 3 17 20 26Prior year adjustments – – – (6)
Adjusted balances at 1 April 3 17 20 20Additions – 2 2 *
Balances at 31 March 3 19 22 20
* Amount smaller than R500 000
The investment properties were valued during the year by an independent qualified valuer. The fair value of the investmentproperties, VAT inclusive, is R238 million (1999 valuation: R86 million).The registers containing details of investment properties are available for inspection by members or their proxies at theregistered offices of the companies to which the relevant properties belong.
3 . GO O D W I L L A N D T R A D E M A R K S2003 2002
Cost or Accumulated Net Cost or Accumulated Netvaluation amortisation value valuation amortisation valueR million R million R million R million R million R million
Goodwill 3 657 305 3 352 2 759 138 2 621Trade marks 68 59 9 146 80 66
3 725 364 3 361 2 905 218 2 687
2003 2002Amortisation rates are as follows: % %Goodwill 5 5Trade marks 5 – 62/3 5 – 62/3
TradeReconciliation of carrying value at Goodwill marks 2003 2002the beginning and end of the year R million R million R million R million
Balances at the beginning of the year 2 621 66 2 687 2 834Medi-Clinic** 12 6 18 –Bestfoods Robertsons joint venture*** – (31) (31) –Additions 864 – 864 *Disposals * – * (1)Amortisation (166) (6) (172) (147)Impairment – (21) (21) –Businesses acquired 21 – 21 –Businesses disposed – (5) (5) –Other – – – 1
Balances at the end of the year 3 352 9 3 361 2 687
* Amount smaller than R500 000** Medi-Clinic, previously equity accounted, was consolidated from 1 April 2002.*** Bestfoods Robertsons, previously proportionately consolidated, was equity accounted from 1 April 2002.

P A G E 5 0
R E M G R O L I M I T E D
N O T E S T O T H E A N N U A L F I N A N C I A L S TAT E M E N T SF O R T H E Y E A R E N D E D 3 1 M A R C H 2 0 0 3
h
4. IN V E S T M E N T S – A S S O C I AT E D C O M PA N I E S(Annexures B & C)
2003 2002Listed Unlisted Total Listed Unlisted Total
R million R million R million R million R million R million
Shares – at cost less goodwill 4 405 750 5 155 4 466 359 4 825Equity adjustment 3 288 10 578 13 866 2 326 9 781 12 107
Carrying value 7 693 11 328 19 021 6 792 10 140 16 932Debentures and long-term loans – 823 823 – 52 52
7 693 12 151 19 844 6 792 10 192 16 984
Market values of listedinvestments 10 911 10 911 10 786 10 786
Directors’ valuation ofunlisted investments 23 369 23 369 30 895 30 895
Market values and directors’ valuation 10 911 23 369 34 280 10 786 30 895 41 681
Excess of market values and directors’ valuation over the book value of investments and appropriate goodwill:– attributable to own members 11 396 22 076– attributable to minority 16 –
11 412 22 076
Of the directors’ valuations of unlisted investments stated above, a substantial proportion amounting to R20 216 million(2002: R29 070 million) was based on the stock exchange prices of underlying listed shares held by the unlisted investmentsconcerned.
2003 2002R million R million
5. IN V E S T M E N T S – S U B S I D I A RY C O M PA N I E S A N D O T H E R(Annexures A & B)5.1 The Company
Unlisted subsidiary companies and other:Advances and loans 7 685 8 009

P A G E 5 1
R E M G R O L I M I T E D
5 . IN V E S T M E N T S – S U B S I D I A RY C O M PA N I E S A N D O T H E R (continued)2003 2002
Listed Unlisted Total Listed Unlisted TotalR million R million R million R million R million R million
5.2 ConsolidatedInvestments – other
Shares – at cost 44 65 109 50 65 115
Market values of listed investments 47 47 136 136
Directors’ valuation of unlisted investments 74 74 73 73
Market values and directors’ valuation 47 74 121 136 73 209
Excess of market values and directors’ valuation over the book value of investments:– attributable to own members 12 94– attributable to minority – *
12 94
* Amount smaller than R500 0002003 2002
R million R million
6. LO A N SLoan to Remgro Share Trust 277 –Other 49 12
326 12
7. IN V E N T O R I E SRaw materials 510 387Finished products 117 164Work in progress 2 11Consumable stores 47 54
676 616
8. SH A R E C A P I TA LAuthorised512 493 650 ordinary shares of 1 cent each 5.1 5.1
40 506 352 B ordinary shares of 10 cents each 4.1 4.1
9.2 9.2
Issued486 493 650 (2002: 486 493 650) ordinary shares of 1 cent each 4.9 4.9
35 506 352 (2002: 435 506 352) B ordinary shares of 10 cents each 3.5 3.5
8.4 8.4
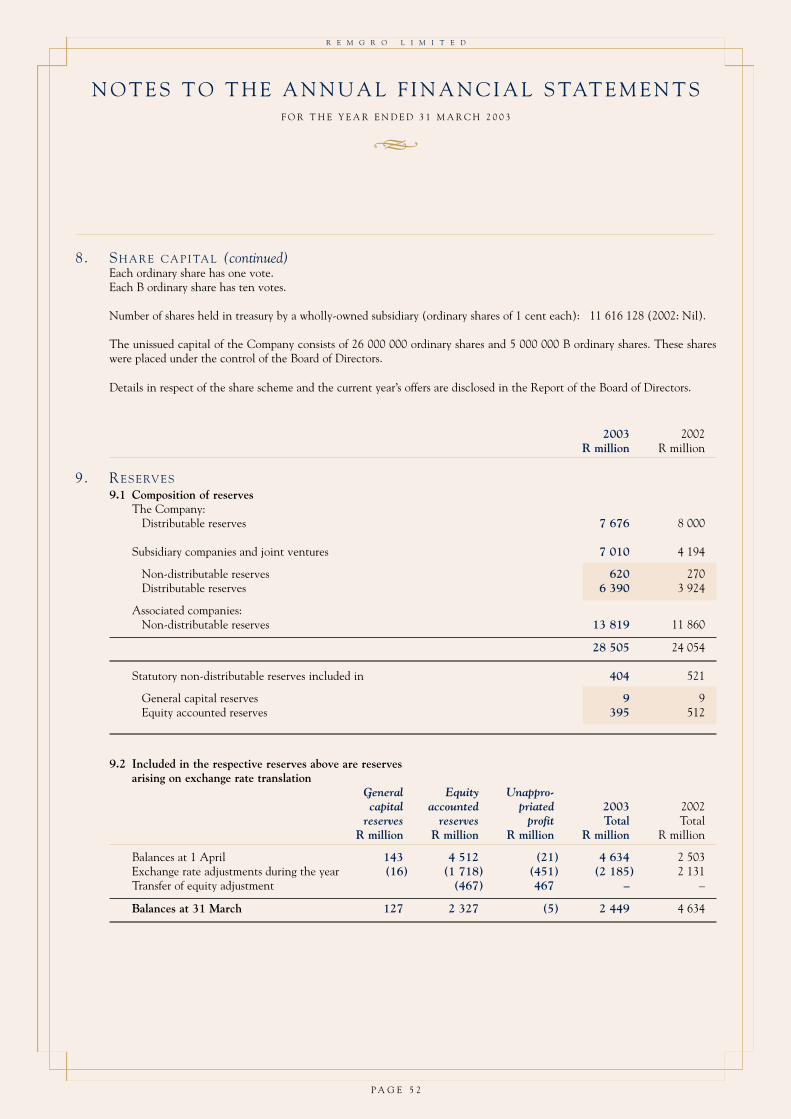
P A G E 5 2
R E M G R O L I M I T E D
N O T E S T O T H E A N N U A L F I N A N C I A L S TAT E M E N T SF O R T H E Y E A R E N D E D 3 1 M A R C H 2 0 0 3
h
8. SH A R E C A P I TA L (continued)Each ordinary share has one vote.Each B ordinary share has ten votes.
Number of shares held in treasury by a wholly-owned subsidiary (ordinary shares of 1 cent each): 11 616 128 (2002: Nil).
The unissued capital of the Company consists of 26 000 000 ordinary shares and 5 000 000 B ordinary shares. These shareswere placed under the control of the Board of Directors.
Details in respect of the share scheme and the current year’s offers are disclosed in the Report of the Board of Directors.
2003 2002R million R million
9. RE S E RV E S9.1 Composition of reserves
The Company:Distributable reserves 7 676 8 000
Subsidiary companies and joint ventures 7 010 4 194
Non-distributable reserves 620 270Distributable reserves 6 390 3 924
Associated companies:Non-distributable reserves 13 819 11 860
28 505 24 054
Statutory non-distributable reserves included in 404 521
General capital reserves 9 9Equity accounted reserves 395 512
9.2 Included in the respective reserves above are reservesarising on exchange rate translation
General Equity Unappro-capital accounted priated 2003 2002
reserves reserves profit Total TotalR million R million R million R million R million
Balances at 1 April 143 4 512 (21) 4 634 2 503Exchange rate adjustments during the year (16) (1 718) (451) (2 185) 2 131Transfer of equity adjustment (467) 467 – –
Balances at 31 March 127 2 327 (5) 2 449 4 634

P A G E 5 3
R E M G R O L I M I T E D
10. RE T I R E M E N T B E N E F I T S
10.1 Retirement benefitsThe Company and its subsidiaries have various defined benefit pension funds, defined contribution pension funds anddefined contribution provident funds which are privately administered independent of the finances of the Group. Allthe funds are governed by the Pension Funds Act, 1956 (as amended). All salaried employees are obliged to acceptmembership of one of these funds.
The defined benefit pension funds are actuarially valued every three years and reviewed every year by independentactuaries according to the projected unit credit method. The other funds are financially reviewed every year.
Assets2003 2002
R million R million
Balance sheetAmounts recognised in the balance sheet are as follows:Present value of funded obligations (167) (248)Fair value of plan assets 183 324
Funded position 16 76Unrecognised actuarial (profits)/losses 25 (27)Pension fund surplus limitation* (41) (49)
Net asset in balance sheet Nil Nil
Movement for the year:Balances at 1 April – –Pension fund surplus limitation* (4) (4)Total expense (8) (14)Contributions 12 18
Balances at 31 March Nil Nil
* The pension fund surplus is not recognised as an asset in the balance sheet as the process of allocating these surpluses accordingto the Pension Funds Act is not yet finalised.

P A G E 5 4
R E M G R O L I M I T E D
N O T E S T O T H E A N N U A L F I N A N C I A L S TAT E M E N T SF O R T H E Y E A R E N D E D 3 1 M A R C H 2 0 0 3
h
Assets2003 2002
R million R million
10. RE T I R E M E N T B E N E F I T S (continued)10.1 Retirement benefits (continued)
Income statementAmounts recognised in the income statement are as follows:Current service costs 14 17Interest on liability 16 38Expected return on plan assets (21) (41)Recognised net actuarial (profits)/losses in the year (1) *
Total expense 8 14Pension fund surplus limitation 4 4
Totals included in staff costs 12 18
Actual return on plan assets 7 (59)
* Amount smaller than R500 000
Principal actuarial assumptions on balance sheet date % %Discount rate 11.0 11.5Expected rates of return on plan assets 11.0 11.5 – 12.0Future salary increases 7.5 8.0 – 10.5Future pension increases 6.5 6.5Inflation rate 6.0 6.5
Liabilities2003 2002
R million R million
10.2 Post-retirement medical benefits
Balance sheetAmounts recognised in the balance sheet are as follows:Present value of funded obligations 103 74
Movement for the year:Balances at 1 April – as previously reported 74 33Prior year adjustment – 20
Adjusted balances at the beginning of the year 74 53Total expense in the income statement recognised 15 22Liability acquired in business combination 25 –Contributions (11) (1)
Balances at 31 March 103 74
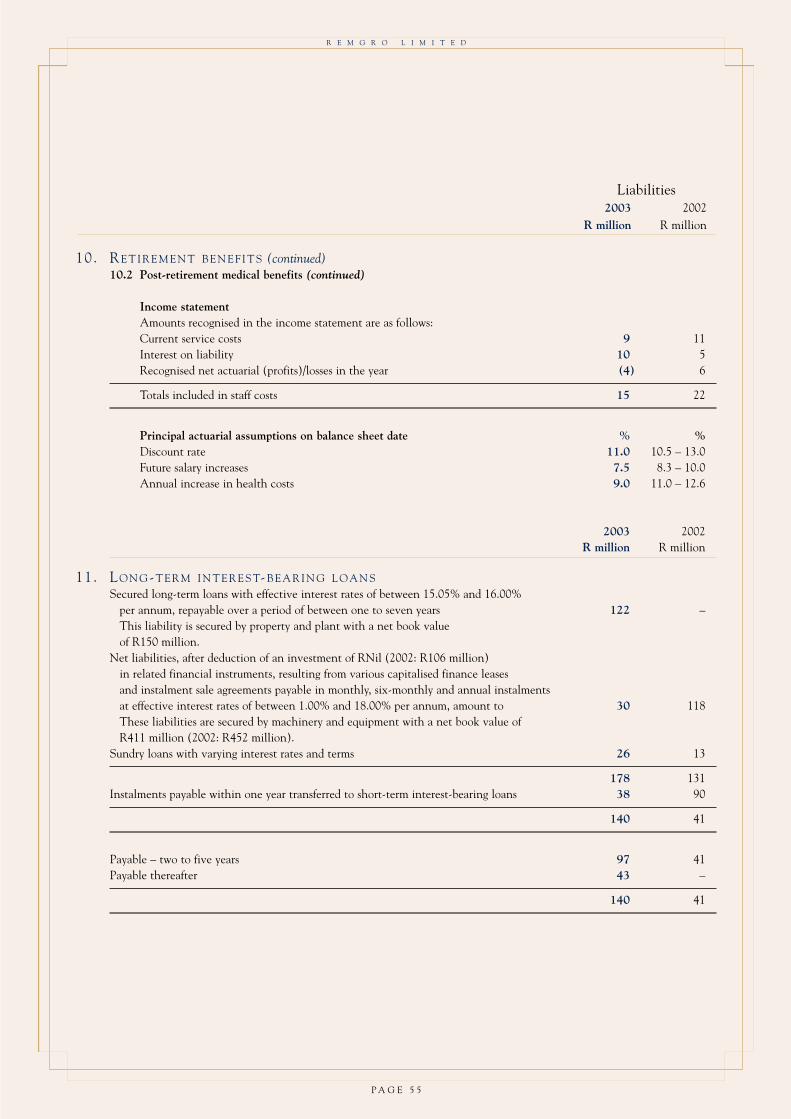
P A G E 5 5
R E M G R O L I M I T E D
Liabilities2003 2002
R million R million
10. RE T I R E M E N T B E N E F I T S (continued)10.2 Post-retirement medical benefits (continued)
Income statementAmounts recognised in the income statement are as follows:Current service costs 9 11Interest on liability 10 5Recognised net actuarial (profits)/losses in the year (4) 6
Totals included in staff costs 15 22
Principal actuarial assumptions on balance sheet date % %Discount rate 11.0 10.5 – 13.0Future salary increases 7.5 8.3 – 10.0Annual increase in health costs 9.0 11.0 – 12.6
2003 2002R million R million
11. LO N G-T E R M I N T E R E S T-B E A R I N G L O A N SSecured long-term loans with effective interest rates of between 15.05% and 16.00%
per annum, repayable over a period of between one to seven years 122 –This liability is secured by property and plant with a net book value of R150 million.
Net liabilities, after deduction of an investment of RNil (2002: R106 million)in related financial instruments, resulting from various capitalised finance leasesand instalment sale agreements payable in monthly, six-monthly and annual instalments at effective interest rates of between 1.00% and 18.00% per annum, amount to 30 118These liabilities are secured by machinery and equipment with a net book value ofR411 million (2002: R452 million).
Sundry loans with varying interest rates and terms 26 13
178 131Instalments payable within one year transferred to short-term interest-bearing loans 38 90
140 41
Payable – two to five years 97 41Payable thereafter 43 –
140 41
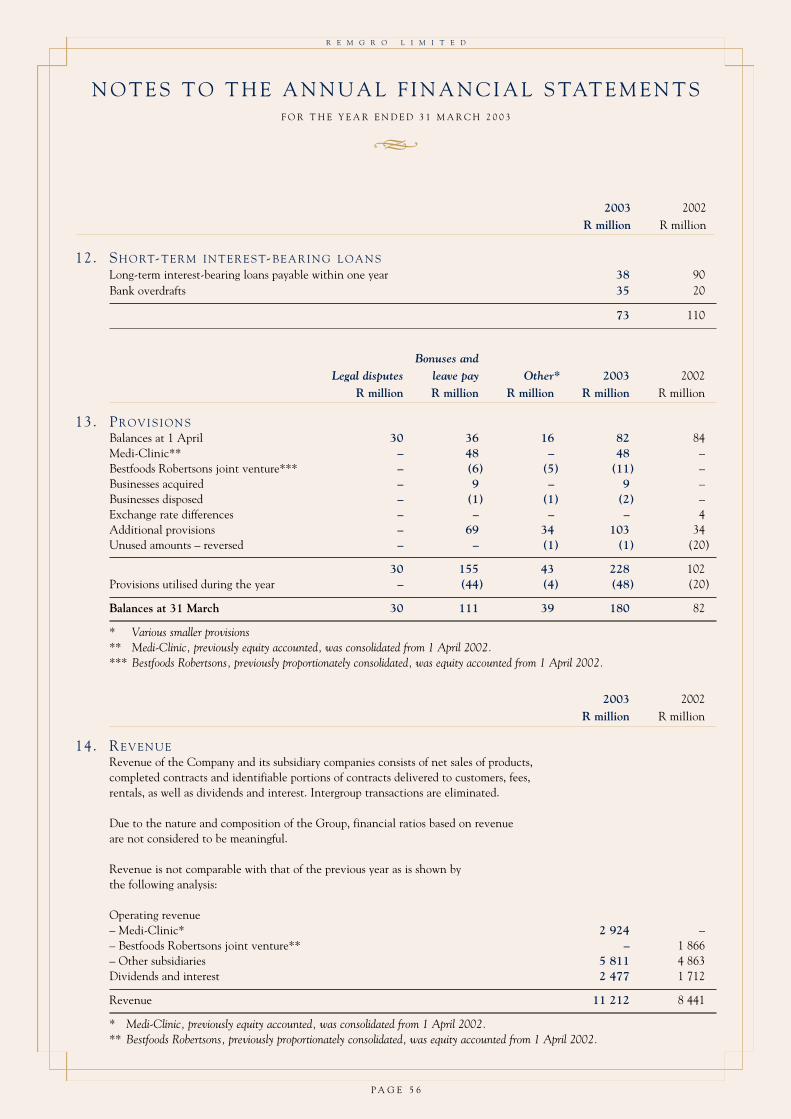
P A G E 5 6
R E M G R O L I M I T E D
N O T E S T O T H E A N N U A L F I N A N C I A L S TAT E M E N T SF O R T H E Y E A R E N D E D 3 1 M A R C H 2 0 0 3
h
2003 2002R million R million
12. SH O RT-T E R M I N T E R E S T-B E A R I N G L O A N SLong-term interest-bearing loans payable within one year 38 90Bank overdrafts 35 20
73 110
Bonuses andLegal disputes leave pay Other* 2003 2002
R million R million R million R million R million
13. PR OV I S I O N SBalances at 1 April 30 36 16 82 84Medi-Clinic** – 48 – 48 –Bestfoods Robertsons joint venture*** – (6) (5) (11) –Businesses acquired – 9 – 9 –Businesses disposed – (1) (1) (2) –Exchange rate differences – – – – 4Additional provisions – 69 34 103 34Unused amounts – reversed – – (1) (1) (20)
30 155 43 228 102Provisions utilised during the year – (44) (4) (48) (20)
Balances at 31 March 30 111 39 180 82
* Various smaller provisions** Medi-Clinic, previously equity accounted, was consolidated from 1 April 2002.*** Bestfoods Robertsons, previously proportionately consolidated, was equity accounted from 1 April 2002.
2003 2002R million R million
14. RE V E N U ERevenue of the Company and its subsidiary companies consists of net sales of products, completed contracts and identifiable portions of contracts delivered to customers, fees, rentals, as well as dividends and interest. Intergroup transactions are eliminated.
Due to the nature and composition of the Group, financial ratios based on revenue are not considered to be meaningful.
Revenue is not comparable with that of the previous year as is shown by the following analysis:
Operating revenue– Medi-Clinic* 2 924 –– Bestfoods Robertsons joint venture** – 1 866– Other subsidiaries 5 811 4 863Dividends and interest 2 477 1 712
Revenue 11 212 8 441
* Medi-Clinic, previously equity accounted, was consolidated from 1 April 2002.** Bestfoods Robertsons, previously proportionately consolidated, was equity accounted from 1 April 2002.

P A G E 5 7
R E M G R O L I M I T E D
2003 2002R million R million
15. OP E R AT I N G P R O F I TOperating profit is stated after taking the following into account:
IncomeForeign exchange profits 7 15Interest received 372 235
Shareholders’ loan to associated company 51 –Other 321 235
Property rental income 8 7Surplus on sale of property, plant and equipment – 3
ExpensesAmortisation of trade marks 6 9Auditors’ remuneration – audit fees 6 5
– other services 2 1Cost of sales 6 783 4 760Depreciation 206 189
Buildings 19 24Machinery and equipment 157 144Vehicles 9 15Office equipment 16 1Agricultural development costs 5 5
Loss on sale of property, plant and equipment 1 –Loss on sale of trade marks – 1Professional fees 11 7Property expenses 2 1Rental 49 50
Land and buildings 26 31Machinery and equipment 14 4Vehicles 3 9Office equipment 6 6
Research and development costs written off 1 12
16. AD M I N I S T R AT I O N A N D M A N A G E M E N T F E E S– N E T C O R P O R AT E C O S T SPaid to M&I Management Services (Proprietary) Limited in respect of costs 73 58Donations 2 10
75 68Less: Fees received (12) (11)
Intergroup – excluding wholly-owned subsidiaries (5) (2)Other (7) (9)
63 57

P A G E 5 8
R E M G R O L I M I T E D
N O T E S T O T H E A N N U A L F I N A N C I A L S TAT E M E N T SF O R T H E Y E A R E N D E D 3 1 M A R C H 2 0 0 3
h
THE COMPANY CONSOLIDATED
2003 2002 2003 2002R million R million R million R million
17. DI V I D E N D I N C O M EIncluded in operating profit:
Listed – – 4 3Unlisted – Subsidiary companies 1 352 1 584
– Other – – 6 5
1 352 1 584 10 8
Dividends from associated companies set off against investments 2 095 1 469
2003 2002R million R million
18. AM O RT I S AT I O N O F G O O D W I L LSubsidiary companies 166 138Associated companies 308 276
474 414
19. EX C E P T I O N A L I T E M SExceptional items of subsidiary companies:
Net capital surplus/(loss) on the sale of investments and businesses 1 244 (18)Other 1 (2)
Total before taxation – per income statement 1 245 (20)Taxation (22) 18
Total after taxation 1 223 (2)
Share of exceptional items of associated companies:Net capital surplus on BAT preference shares 3 204 –Restructuring costs (123) (148)Net capital surplus/(loss) on sale of investments and businesses 86 (250)Other 6 (19)Taxation effect 37 65Attributable to minorities of associated companies 2 2
Total – per income statement 3 212 (350)
Grand total 4 435 (352)Attributable to minorities (142) 1
Attributable to own members 4 293 (351)

P A G E 5 9
R E M G R O L I M I T E D
2003 2002R million R million
20. TA X AT I O N20.1 Taxation in income statement
Current 292 130
– current year – South African normal taxation 273 110– Taxation on capital gain 20 –– Foreign taxation 7 35
300 145– previous year – South African normal taxation (8) (19)
– Foreign taxation – 4
Secondary tax on companies 6 5Deferred – current year 6 44
– previous year (2) (6)
302 173
20.2 Reconciliation of effective tax rate of the Company and itssubsidiaries with standard rate % %Effective tax rate 13.3 30.0Reduction/(increase) in standard rate as a result of:
Permanent differences 11.9 (8.4)Foreign taxation (0.1) (2.0)Timing differences not provided for (0.5) (6.4)Taxation in respect of previous years 0.4 3.5Taxation losses of prior years utilised 4.4 12.8Tax losses that can be utilised in future years – 1.3Exempt capital gain 0.9 –Secondary tax on companies (0.3) (0.8)
Standard rate 30.0 30.0
2003 2002R million R million
20.3 Deferred taxationDeferred taxation liabilities 115 129
Property, plant and equipment 115 150Inventories 13 81Provisions (13) (67)Other * 95Tax losses utilised * (130)
Deferred tax asset (84) (17)
Property, plant and equipment 17 *Inventories 62 –Provisions (124) (2)Tax losses utilised (39) (15)
Net deferred taxation 31 112
* Amount smaller than R500 000

P A G E 6 0
R E M G R O L I M I T E D
N O T E S T O T H E A N N U A L F I N A N C I A L S TAT E M E N T SF O R T H E Y E A R E N D E D 3 1 M A R C H 2 0 0 3
h
2003 2002R million R million
20. TA X AT I O N (continued)20.3 Deferred taxation (continued)
The movement between balances at the beginning and end of the year of deferred taxation can be analysed as follows:Beginning of the year
As previously reported 78 37Prior year adjustments 34 33Business acquired (50) –
Adjusted balance 62 70Movements during the year attributable to:
Property, plant and equipment (22) 14Inventories (5) 7Provisions (15) (17)Other (96) (22)Tax losses utilised 107 60
31 112
20.4 Tax lossesEstimated tax losses available for set-off against
future taxable income 130 486
20.5 Secondary taxation on companies (STC)The STC credits on 31 March, which could be set off against future
dividend payments, amount to 3 218 2 741
– The Company 666 990– Wholly-owned subsidiary companies 2 552 1 751

P A G E 6 1
R E M G R O L I M I T E D
2003 2002R million R million
21. EQ U I T Y A D J U S T M E N TShare of net profit of associated companies:Operating profit 6 790 6 161Amortisation of goodwill (308) (276)Impairment of assets (63) –Exceptional items 3 173 (417)
Share of net profit of associated companies – before taxation 9 592 5 468Taxation (2 058) (1 984)
Normal operations (2 095) (2 049)Exceptional items 37 65
After taxation 7 534 3 484Share of minority of associated companies (272) (229)
Share of net attributable profit of associated companies 7 262 3 255Minority interest (10) –Share of net profit retained in distributable reserves (10) –Dividends received from associated companies (2 095) (1 469)
Share of net profit retained by associated companies 5 147 1 786Exchange rate differences on translation between average rates and year-end rates (467) 58
Equity adjustment transferred to non-distributable reserves(Refer to statements of changes in equity) 4 680 1 844
Portion of the share of net profit/(loss) after exceptional items and amortisation, retained by associated companies, that has been accounted for from unaudited interim reports and management accounts 407 467
22. MI N O R I T Y I N T E R E S TSubsidiaries and joint ventures 488 151Share of minority interest of associated companies 272 229
760 380

P A G E 6 2
R E M G R O L I M I T E D
N O T E S T O T H E A N N U A L F I N A N C I A L S TAT E M E N T SF O R T H E Y E A R E N D E D 3 1 M A R C H 2 0 0 3
h
23. EA R N I N G S P E R S H A R EIn determining the headline and basic earnings per share the weighted number of shares in issue, being 519 565 424(2002: 522 000 002), was taken into account.
THE COMPANY CONSOLIDATED
2003 2002 2003 2002R million R million R million R million
24. CA S H F L OW I N F O R M AT I O N24.1 Adjustments
Depreciation, amortisation of goodwill and trade marks – – 378 336
Other – – (1) 36Movement in provisions – – 67 19Interest received – – (372) (235)Interest paid – – 45 58Dividends received (1 352) (1 584) (10) (8)Capital loss/(surplus) on the sale of investments – – (1 261) 18Impairment of assets – – 24 –Share scheme cost – – 25 25
(1 352) (1 584) (1 105) 249
24.2 Decrease/(increase) in working capitalIncrease in inventories – – (226) (78)Decrease/(increase) in trade and other receivables – – (87) (130)Increase in trade and other payables 1 1 196 1
1 1 (117) (207)
24.3 Reconciliation of dividends received Receivable at the beginning of the year – – 3 153Per income statement 1 352 1 584 10 8Dividends from associated companies set off
against investments 2 095 1 469Receivable at the end of the year – – – (3)
Cash received 1 352 1 584 2 108 1 627

P A G E 6 3
R E M G R O L I M I T E D
THE COMPANY CONSOLIDATED
2003 2002 2003 2002R million R million R million R million
24. CA S H F L OW I N F O R M AT I O N (cont inued)24.4 Taxation paid is reconciled with the amount
disclosed in the income statement as followsPaid in advance at the beginning of the year 1 2 5 18Unpaid at the beginning of the year – – (47) (36)Per income statement – – (298) (135)
– normal income – – (270) (148)– exceptional items – – (22) 18– STC – – (6) (5)
Business acquired – – (37) –Business disposed – – 32 –Unpaid at the end of the year – – 144 47Paid in advance at the end of the year (2) (1) (19) (5)
Cash (paid)/received (1) 1 (220) (111)
24.5 Reconciliation of dividends paidPer statements of changes in equity (1 676) (934) (1 674) (934)Paid by subsidiary companies to minority (99) (34)
Cash paid (1 676) (934) (1 773) (968)
2003 2002R million R million
25. STA F F C O S T S– of subsidiary companies
Salaries and wages 1 505 967Long-term share incentive scheme 16 25
Scheme cost 25 25Less: Dividends received (9) –
Retirement benefits 12 5Pension costs – defined contribution 73 38Pension costs – defined benefit 12 18Other post-retirement benefits 15 22Other 96 76
1 729 1 151
Number Number
Persons employed by subsidiary companies at year-end:South Africa 19 858 10 950Abroad 3 1 139
19 861 12 089

P A G E 6 4
R E M G R O L I M I T E D
N O T E S T O T H E A N N U A L F I N A N C I A L S TAT E M E N T SF O R T H E Y E A R E N D E D 3 1 M A R C H 2 0 0 3
h
26. DI R E C T O R S’ E M O L U M E N T S
2003 2002Non- Non-
Executive executive Total Executive executive TotalR’000 R’000 R’000 R’000 R’000 R’000
Salaries and fees 6 742.2 450.4 7 192.6 5 782.3 229.0 6 011.3Retirement fund contributions 1 493.3 1 493.3 984.5 984.5Other benefits 1 077.5 1 077.5 887.2 887.2
9 313.0 450.4 9 763.4 7 654.0 229.0 7 883.0
Paid by:The Company 450.4 229.0Management company 9 313.0 7 654.0
9 763.4 7 883.0
Salaries Retire- Salaries Retire-and ment Other 2003 and ment Other 2002fees fund benefits(7) Total fees fund benefits(7) Total
R’000 R’000 R’000 R’000 R’000 R’000 R’000 R’000
ExecutiveW E Bührmann 905.0 179.5 215.5 1 300.0 820.1 162.7 172.2 1 155.0D M Falck(1) 1 071.9 212.6 215.5 1 500.0 941.3 137.1 171.6 1 250.0J A Preller 696.4 138.1 215.5 1 050.0 674.1 109.9 146.0 930.0M H Visser(2) 3 205.6 791.9 215.5 4 213.0 2 577.7 422.2 199.1 3 199.0T van Wyk 863.3 171.2 215.5 1 250.0 769.1 152.6 198.3 1 120.0
Subtotal 6 742.2 1 493.3 1 077.5 9 313.0 5 782.3 984.5 887.2 7 654.0
Retirement 2003 Retirement 2002Fees fund Other Total Fees fund Other Total
R’000 R’000 R’000 R’000 R’000 R’000 R’000 R’000
Non-executiveG D de Jager 50.0 50.0 30.0 30.0P J Erasmus(3) 39.6 39.6 45.0 45.0P K Harris(4) 65.0 65.0 10.0 10.0E Molobi 50.0 50.0 30.0 30.0J F Mouton(5) 85.0 85.0 39.0 39.0F Robertson(5) 85.0 85.0 39.0 39.0P G Steyn(6) 75.8 75.8 36.0 36.0
Subtotal 450.4 450.4 229.0 229.0
Total 7 192.6 1 493.3 1 077.5 9 763.4 6 011.3 984.5 887.2 7 883.0
1. Mr D M Falck is a member of the Audit and Risk Committee.2. Mr M H Visser earns an extra director’s fee of GBP50 000 per annum from British American Tobacco Plc, an associated company.3. On 28 August 2002, Mr P J Erasmus retired as a non-executive director.4. Mr P K Harris is a member of the Remuneration and Nomination Committee.5. Messrs J F Mouton and F Robertson are members of the Audit and Risk Committee and members of the Remuneration and Nomination
Committee.6. Mr P G Steyn is a member and Chairman of the Audit and Risk Committee.7. Benefits include medical aid contributions and vehicle benefits.
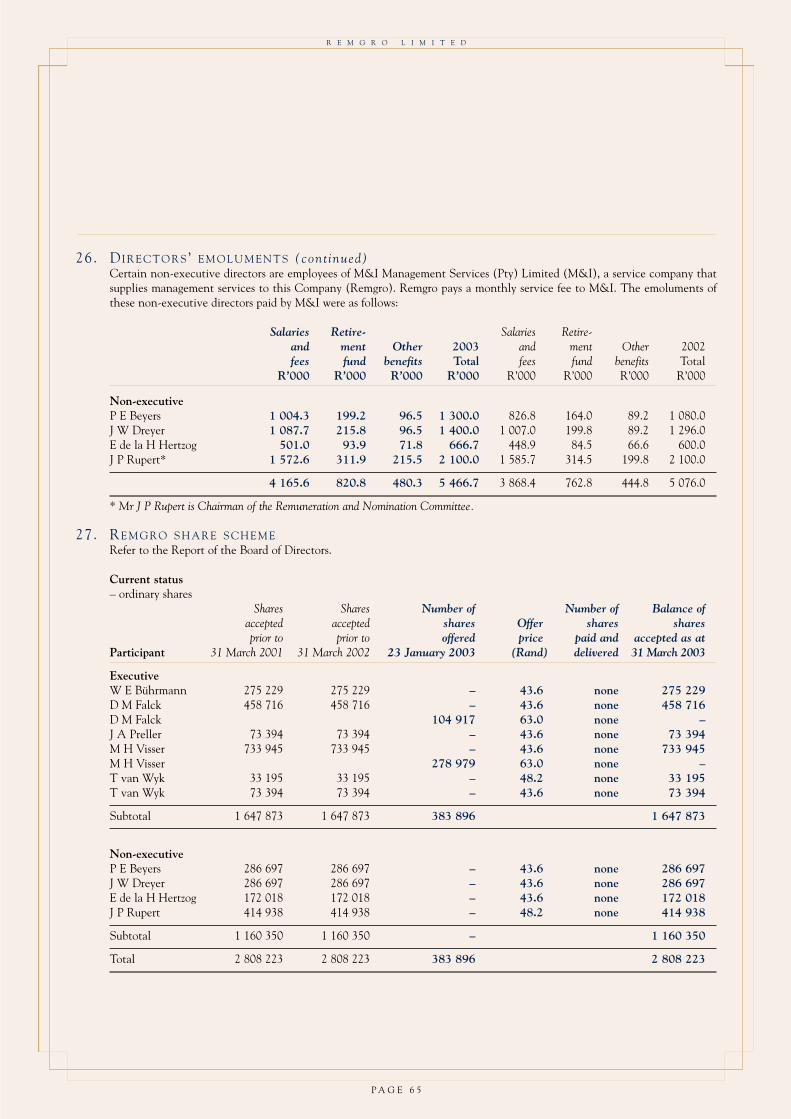
P A G E 6 5
R E M G R O L I M I T E D
26. DI R E C T O R S’ E M O L U M E N T S (cont inued)Certain non-executive directors are employees of M&I Management Services (Pty) Limited (M&I), a service company thatsupplies management services to this Company (Remgro). Remgro pays a monthly service fee to M&I. The emoluments ofthese non-executive directors paid by M&I were as follows:
Salaries Retire- Salaries Retire-and ment Other 2003 and ment Other 2002fees fund benefits Total fees fund benefits Total
R’000 R’000 R’000 R’000 R’000 R’000 R’000 R’000
Non-executiveP E Beyers 1 004.3 199.2 96.5 1 300.0 826.8 164.0 89.2 1 080.0J W Dreyer 1 087.7 215.8 96.5 1 400.0 1 007.0 199.8 89.2 1 296.0E de la H Hertzog 501.0 93.9 71.8 666.7 448.9 84.5 66.6 600.0J P Rupert* 1 572.6 311.9 215.5 2 100.0 1 585.7 314.5 199.8 2 100.0
4 165.6 820.8 480.3 5 466.7 3 868.4 762.8 444.8 5 076.0
* Mr J P Rupert is Chairman of the Remuneration and Nomination Committee.
27. RE M G R O S H A R E S C H E M ERefer to the Report of the Board of Directors.
Current status– ordinary shares
Shares Shares Number of Number of Balance ofaccepted accepted shares Offer shares shares prior to prior to offered price paid and accepted as at
Participant 31 March 2001 31 March 2002 23 January 2003 (Rand) delivered 31 March 2003
ExecutiveW E Bührmann 275 229 275 229 – 43.6 none 275 229D M Falck 458 716 458 716 – 43.6 none 458 716D M Falck 104 917 63.0 none –J A Preller 73 394 73 394 – 43.6 none 73 394M H Visser 733 945 733 945 – 43.6 none 733 945M H Visser 278 979 63.0 none –T van Wyk 33 195 33 195 – 48.2 none 33 195T van Wyk 73 394 73 394 – 43.6 none 73 394
Subtotal 1 647 873 1 647 873 383 896 1 647 873
Non-executiveP E Beyers 286 697 286 697 – 43.6 none 286 697J W Dreyer 286 697 286 697 – 43.6 none 286 697E de la H Hertzog 172 018 172 018 – 43.6 none 172 018J P Rupert 414 938 414 938 – 48.2 none 414 938
Subtotal 1 160 350 1 160 350 – 1 160 350
Total 2 808 223 2 808 223 383 896 2 808 223

P A G E 6 6
R E M G R O L I M I T E D
N O T E S T O T H E A N N U A L F I N A N C I A L S TAT E M E N T SF O R T H E Y E A R E N D E D 3 1 M A R C H 2 0 0 3
h
2003 2002R million R million
28. CO M M I T M E N T SCapital commitments 579 112
Uncompleted contracts for capital expenditure 180 48Capital expenditure authorised but not yet contracted 399 64
Operating lease commitments 131 238
Due within one year 29 34Due – two to five years 94 188Due thereafter 8 16
710 350
Above-mentioned commitments will be financed by internal sources and borrowed funds.
29. BO R R OW I N G P OW E R SThere are no limitations to the borrowing powers of the Company and its subsidiaries in respect of loans and guaranteed debts.
30. FI N A N C I A L I N S T R U M E N T S30.1 Credit risk
Financial assets which are subject to credit risk consist mainly of cash and cash equivalents and trade and otherreceivables. Cash and cash equivalents are placed with various financial institutions subject to approved limits. All theseinstitutions are of a high standing. Trade and other receivables are disclosed net of a provision for doubtful debt.
30.2 Interest rate riskSubsidiary companies generally adopt a policy of ensuring that their borrowings are at market related rates to addresstheir interest rate risk.
30.3 Forward exchange contractsSubsidiary companies undertake transactions denominated in foreign currency and therefore exposures to exchange ratefluctuations arise. If deemed necessary, these exposures are hedged through the use of forward exchange contracts.
The following material forward exchange contracts existed at 31 March 2003:
Currency Average Randamount forward amount
Foreign currency million rate R million
Buy: USA dollar (USD) 2.8 8.79 24.7British pound (GBP) 0.4 14.92 6.2Other 1.5
Sell: USA dollar (USD) 7.2 9.36 67.0
30.4 Fair valueOn 31 March 2003 and 2002 the fair value of financial instruments equals their carrying value.

P A G E 6 7
R E M G R O L I M I T E D
2003 2002R million R million
31. GU A R A N T E E S A N D C O N T I N G E N T L I A B I L I T I E S31.1 Guarantees
Guarantees by subsidiary companies 76 79
31.2 Contingent liabilitiesPut option 13 13Legal actions pending 8 52Other 34 12
55 77
The Company guarantees certain share transactions entered into by a subsidiary company.
32. RE L AT E D PA RT I E STransactionsRelated party transactions are concluded on an arms-length basis.
SubsidiariesDetails of investments in, and income from, subsidiaries are disclosed in notes 5 and 17 respectively, and in Annexure A.
Associated companiesDetails of investments in and income from associated companies are disclosed in notes 4 and 21 respectively, as well as inAnnexures B and C. Interest income from associated companies amounted to R180 million (2002: R87 million) and isincluded in interest received. Interest paid to associated companies amounted to R2 million (2002: R10 million) and isincluded in finance costs. Fees from associated companies amounted to R7 million (2002: R9 million).
DirectorsDetails of directors’ emoluments and shareholding in the Company are disclosed in notes 26 and 27 and in the Report of theBoard of Directors.
ShareholdersDetails of the principal shareholder appear in the Report of the Board of Directors. A detailed analysis of shareholders appearson page 4 of the Annual Report.

P A G E 6 8
R E M G R O L I M I T E D
A N N E X U R E AP R I N C I P A L S U B S I D I A R Y C O M P A N I E S AT 3 1 M A R C H 2 0 0 3
hNAME OF COMPANY ISSUED EFFECTIVE HELD BY COMPANY
CAPITAL INTEREST SHARES LOANIncorporated in South Africa R (unless other- 2003 2002 2003 2002 2003 2002unless otherwise stated wise stated) % % R R R million R million
Trade mark interestsRemgro International Holdings (Pty) Limited 2 100.0 100.0 2 2
Remgro Investments Limited – Jersey (GBP) 1 201 610 100.0 100.0
Financial servicesFinancial Securities Limited 250 000 100.0 100.0 250 000 250 000
Industrial interestsIndustrial Partnership Investments Limited 125 000 100.0 100.0 125 000 125 000
Hunt Leuchars & Hepburn Holdings Limited (1) 592 954 000 100.0 72.4
– held by Hunt Leuchars & Hepburn Holdings Limited:
– Robertsons Holdings (Pty) Limited (100%) 100.0 72.4
– Transvaal Sugar Limited (100%) 100.0 72.4
Rainbow Chicken Limited * (1) 1 090 423 000 54.5 55.7
Wispeco Holdings Limited 5 000 000 100.0 100.0
Mining interestsPartnership in Mining Limited 100 100.0 100.0 100 100
Tegniese Mynbeleggings Limited 2 100.0 100.0
Corporate finance and other interestsEikenlust (Pty) Limited 100 100.0 100.0
Entek Investments Limited 810 630 62.7 62.1
Historical Homes of South Africa Limited 555 000 51.4 51.4
Medi-Clinic Corporation Limited * (2) 35 007 000 52.4 52.3
M.F.I. Investments (Pty) Limited 2 100.0 100.0
Remgro Finance and Services Limited 100 100.0 100.0
Remgro Finance Corporation Limited 300 000 100.0 100.0
Remgro Investments (Pty) Limited 4 100.0 100.0
Remgro Loan Corporation Limited 700 100.0 100.0 7 673 7 997
Remgro South Africa (Pty) Limited 48 614 100.0 100.0 96 506 96 506 12 12
Stellenryck Trust Limited 700 100.0 100.0
TTR Holdings (Pty) Limited 7 100.0 100.0 7 7
Note 5.1: 471 615 471 615 7 685 8 009
* Listed company
(1) Issued capital includes both ordinary shares and compulsory convertible preference shares. Effective interest is calculated on a fully diluted basis.
(2) The interest was considered to be temporary, therefore not consolidated in the previous year.
(GBP) British pound
Details of sundry subsidiary companies which are not material to the evaluation of the business of the Group, are not shown.

P A G E 6 9
R E M G R O L I M I T E D
A N N E X U R E BP R I N C I P A L I N V E S T M E N T S AT 3 1 M A R C H 2 0 0 3
hNAME OF COMPANY LISTED UNLISTED
2003 2002 2003 2002EFFECTIVE EFFECTIVE EFFECTIVE EFFECTIVE
Incorporated in South Africa SHARES INTEREST SHARES INTEREST SHARES INTEREST SHARES INTEREST
unless otherwise stated HELD % HELD % HELD % HELD %
Trade mark interests
R&R Holdings SA – Luxembourg (1)– ordinary shares 316 000 33.3 316 000 33.3– debentures 870 516 33.3 870 516 33.3– held by R&R Holdings SA:
– British American Tobacco Plc – UK (1) 9.3 10.5– ordinary shares (27.9%)– preference shares (100.0%)
Remgro-KWV Beleggings Limited (2) 50 50.0 50 50.0– held by Remgro-KWV
Beleggings Limited:
– Distell Group Limited (60%) 30.0 30.0
Financial services
RMB Holdings Limited (1) 274 109 670 23.1 274 109 670 23.1– held by RMB Holdings Limited:
– FirstRand Limited (32.8%) 7.6 7.6
FirstRand Limited (1) 520 716 856 9.6 507 636 856 9.3Universa (Pty) Limited (1)– ordinary shares – – 7 875 39.4– preference shares – – 2 705 643 35.5– held by Universa (Pty) Limited:
– Absa Group Limited (22.9%) – 9.4
Absa Group Limited (1) 61 387 729 9.4 – –
Sagecor (Pty) Limited (1) 2 992 50.0 2 992 50.0– held by Sagecor (Pty) Limited:
– Sage Group Limited (18.3%) 9.2 9.0
Sage Group Limited (3) 10 848 109 7.0 10 724 315 7.3
Industrial interests
Air Products South Africa (Pty) Limited (1) 4 500 000 50.0 4 500 000 50.0
Dorbyl Limited (1) 14 058 346 42.4 14 058 346 42.6Henkel South Africa (Pty) Limited (2)– ordinary shares 4 812 500 50.0 4 812 500 50.0– preference ordinary shares 12 550 000 50.0 12 550 000 50.0
Malbak Limited (4) – – 276 742 707 58.0Nampak Limited (5) 86 774 104 13.5 – –Unilever Bestfoods Robertsons
Holdings Ltd LLC – USA (1) 8 200 41.0 – –Total South Africa (Pty) Limited (2) 15 500 000 34.4 15 500 000 34.4
Mining interests
Gencor Limited (2) 37 995 039 10.9 37 995 039 10.9Trans Hex Group Limited (1) 35 215 000 41.1 35 215 000 41.9
Other interests
Medi-Clinic Corporation Limited * (1) – – 178 577 982 52.3Business Partners Limited # 28 696 220 16.0 28 696 220 16.0
Financial period:(1) Twelve months to 31 March 2003(2) Twelve months to 31 December 2002 * From 1 April 2002 consolidated as a subsidiary company. Refer Annexure A.(3) Nine months to 31 December 2002 # Not an associated company.(4) Four months to 31 July 2002 UK – United Kingdom(5) Eight months to 31 March 2003 USA – United States of America
Details of investments which are not material to the evaluation of the business of the Group, are not shown.

P A G E 7 0
R E M G R O L I M I T E D
A N N E X U R E CS I G N I F I C A N T A S S O C I AT E D C O M P A N I E S – A D D I T I O N A L I N F O R M AT I O N
hRMB HOLDINGS FIRSTRAND ABSA R&R(FINANCIAL SERVICES) (FINANCIAL SERVICES) (FINANCIAL SERVICES) (TOBACCO INTERESTS)
2003 2003 2003 2003
Effective interest 23.1% 9.6% 9.4% 331/3%
R million R million R million R million
Carrying value of investments after writedown of goodwill 2 424 1 894 1 589 9 342
Share of retained equity income – Current year 89 137 144 1 846
Normal income 371 423 327 2 423Dividends (132) (164) (75) (1 277)Exceptional items and goodwill amortisation (58) (35) (8) 2 993Other changes in reserves and exchange rates (92) (87) (100) (2 293)
– Cumulative 387 532 1 349 9 343
Summarised financial information: Per Interim Per Interim Per PerReport Report Annual Report Annual Report
31/12/2002 31/12/2002 31/03/2003 31/03/2003
Note 1BALANCE SHEET
AssetsNet insurance-related assets – 3 574 – –Net advances, loans and bank-related securities 242 28 352 (2 216) –Intangible assets 3 478 672 187 78 047Property, plant and equipment and other 23 1 631 20 866 32 503Investments and loans 7 202 3 465 3 956 10 243Net current assets/(liabilities) – (10 012) – 13 690
10 945 27 682 22 793 134 483
Equity and liabilitiesShareholders’ funds and long-term debt 10 945 27 682 22 793 134 483
12 months 12 months 12 months 12 monthsended ended ended ended
31/12/2002 31/12/2002 31/03/2003 31/03/2003
Note 2INCOME STATEMENT
Headline earnings 1 608 4 486 3 441 7 268Net profit for the year 1 354 4 111 3 391 16 249Dividends paid 528 1 552 801 3 830
There are no loans to these associated companies.
Note 1: In the audited balance sheet of R&R, its interest in British American Tobacco Plc (BAT) is only shown as a single itemrepresenting the carrying value thereof as an equity accounted associated company. So as to disclose more meaningfulinformation, BAT’s abridged balance sheet is presented above instead. This balance sheet is at 31 December as BAT has notincluded a balance sheet in its quarterly report to 31 March.
Note 2: Headline earnings and net profit for the year relates to the income statement of R&R which includes its share of the netprofit of BAT.
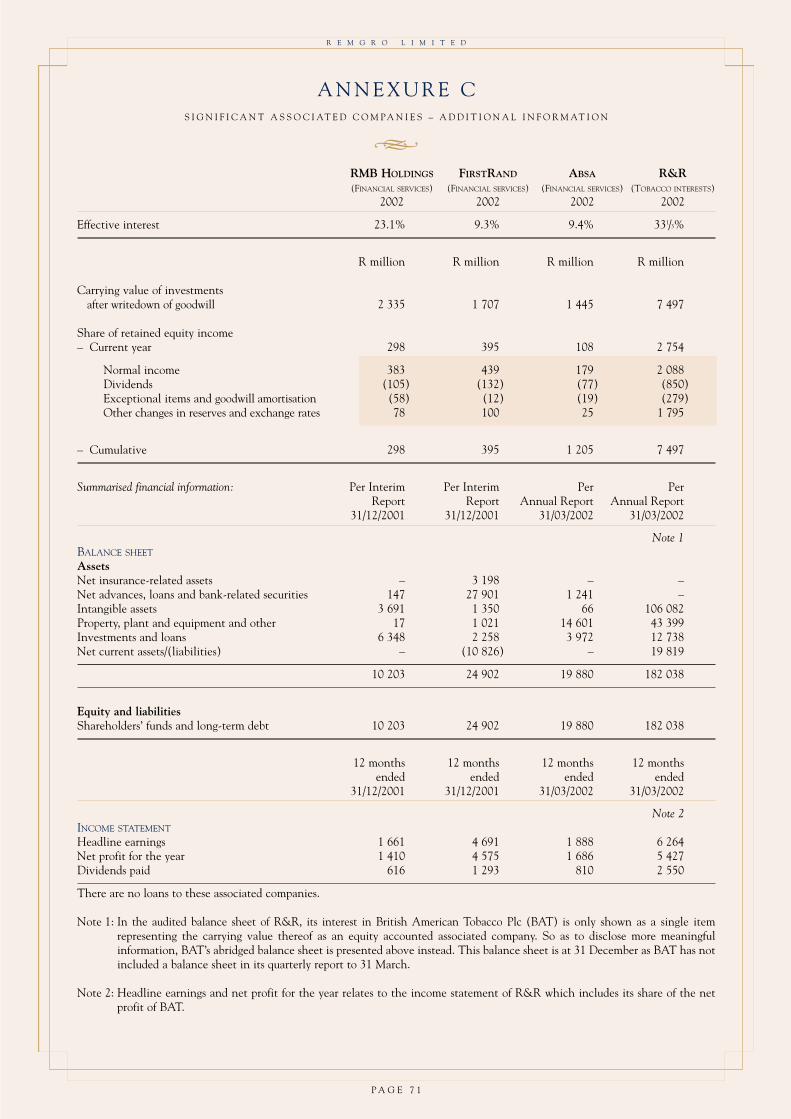
P A G E 7 1
R E M G R O L I M I T E D
A N N E X U R E CS I G N I F I C A N T A S S O C I AT E D C O M P A N I E S – A D D I T I O N A L I N F O R M AT I O N
hRMB HOLDINGS FIRSTRAND ABSA R&R(FINANCIAL SERVICES) (FINANCIAL SERVICES) (FINANCIAL SERVICES) (TOBACCO INTERESTS)
2002 2002 2002 2002
Effective interest 23.1% 9.3% 9.4% 331/3%
R million R million R million R million
Carrying value of investments after writedown of goodwill 2 335 1 707 1 445 7 497
Share of retained equity income – Current year 298 395 108 2 754
Normal income 383 439 179 2 088Dividends (105) (132) (77) (850)Exceptional items and goodwill amortisation (58) (12) (19) (279)Other changes in reserves and exchange rates 78 100 25 1 795
– Cumulative 298 395 1 205 7 497
Summarised financial information: Per Interim Per Interim Per PerReport Report Annual Report Annual Report
31/12/2001 31/12/2001 31/03/2002 31/03/2002
Note 1BALANCE SHEET
AssetsNet insurance-related assets – 3 198 – –Net advances, loans and bank-related securities 147 27 901 1 241 –Intangible assets 3 691 1 350 66 106 082Property, plant and equipment and other 17 1 021 14 601 43 399Investments and loans 6 348 2 258 3 972 12 738Net current assets/(liabilities) – (10 826) – 19 819
10 203 24 902 19 880 182 038
Equity and liabilitiesShareholders’ funds and long-term debt 10 203 24 902 19 880 182 038
12 months 12 months 12 months 12 monthsended ended ended ended
31/12/2001 31/12/2001 31/03/2002 31/03/2002
Note 2INCOME STATEMENT
Headline earnings 1 661 4 691 1 888 6 264Net profit for the year 1 410 4 575 1 686 5 427Dividends paid 616 1 293 810 2 550
There are no loans to these associated companies.
Note 1: In the audited balance sheet of R&R, its interest in British American Tobacco Plc (BAT) is only shown as a single itemrepresenting the carrying value thereof as an equity accounted associated company. So as to disclose more meaningfulinformation, BAT’s abridged balance sheet is presented above instead. This balance sheet is at 31 December as BAT has notincluded a balance sheet in its quarterly report to 31 March.
Note 2: Headline earnings and net profit for the year relates to the income statement of R&R which includes its share of the netprofit of BAT.

P A G E 7 2
R E M G R O L I M I T E D
A N N E X U R E DI N F O R M AT I O N O N B U S I N E S S A N D G E O G R A P H I C A L S E G M E N T S F O R T H E Y E A R E N D E D 3 1 M A R C H 2 0 0 3
hCorporate CONSOLI-
Trade finance DATEDmark Financial Industrial Mining and other 2003
interests services interests interests interests TotalR million R million R million R million R million R million
BU S I N E S S S E G M E N TA L A N A LY S I SRevenue 1 321 376 6 107 145 3 263 11 212
Operating profit * 2 559 2 654 1 217Amortisation of goodwill (166)Impairment of assets (24)Exceptional items 1 245
2 272Taxation (302)
Profit after taxation of the Company and its subsidiaries 1 970
Share of after-tax profit of associated companies 7 262
Profit from normal operations 2 510 1 121 454 317 19 4 421Amortisation of goodwill (308)Impairment of assets (63)Exceptional items 3 212
Group profit after tax 9 232Minority interest (488)
Net profit for the year 8 744
Headline earnings 2 498 1 121 696 322 277 4 914
OT H E R I N F O R M AT I O NSegment assets 1 2 828 4 362 – 3 938 11 129Investments in associated companies 10 001 5 908 3 025 867 43 19 844
30 973Taxation – Deferred 84
– Current 19
Consolidated total assets 31 076
Segment liabilities 1 * 836 * 588 1 425Taxation – Deferred 115
– Current 144
Consolidated total liabilities 1 684
Additions to property, plant and equipment – – 206 – 182 388Depreciation and amortisation 211 216 182 – 77 686
* Amount smaller than R500 000The interests of the Group have been classified into five main operating divisions/business segments – trade mark interests, financialservices, industrial interests, mining interests and corporate finance/other interests. Each segment represents the main business sector ofthe investments classified thereunder. No adjustment has been made where companies are mainly active in one sector but have alsointerests in other sectors.
Income and expenses, as well as the attributable portion of the income from associated companies, are directly attributable to the segment.
Segment assets mainly include cash and cash equivalents, trade and other receivables, inventories, property, plant and equipment,intangible assets and other investments. Investments in associated companies, accounted for on the equity method, are stated separately.
Segment liabilities include all operating liabilities, except for taxation.
GE O G R A P H I C A L S E G M E N TA L A N A LY S I SThe Group’s interests can be divided into two main geographical areas, namely South Africa and abroad.
Headline TotalRevenue earnings assets
2003 2003 2003R million R million R million
South Africa 9 935 2 491 21 629Abroad 1 277 2 423 9 344
11 212 4 914 30 973
Total assets include assets and investments in associated companies, but exclude deferred tax assets and taxation paid in advance.

P A G E 7 3
R E M G R O L I M I T E D
A N N E X U R E DI N F O R M AT I O N O N B U S I N E S S A N D G E O G R A P H I C A L S E G M E N T S F O R T H E Y E A R E N D E D 3 1 M A R C H 2 0 0 2
hCorporate CONSOLI-
Trade finance DATEDmark Financial Industrial Mining and other 2002
interests services interests interests interests TotalR million R million R million R million R million R million
BU S I N E S S S E G M E N TA L A N A LY S I SRevenue 895 339 6 849 96 262 8 441
Operating profit – 2 590 1 141 734Amortisation of goodwill (138)Exceptional items (20)
576Taxation 172
Profit after taxation of the Company andits subsidiaries 404
Share of after-tax profit of associated companies 3 255
Profit from normal operations 2 168 944 305 306 158 3 881Amortisation of goodwill (276)Exceptional items (350)
Group profit after tax 3 659Minority interest 151
Net profit for the year 3 508
Headline earnings 2 167 958 570 306 251 4 252
OT H E R I N F O R M AT I O NSegment assets 1 2 735 4 286 32 2 273 9 327Investments in associated companies 8 116 5 487 2 110 716 555 16 984
26 311Taxation – Deferred 17
– Current 5
Consolidated total assets 26 333
Segment liabilities – – 1 157 – 9 1 166Taxation – Deferred 129
– Current 47
Consolidated total liabilities 1 342
Additions to property, plant and equipment – – 185 – – 185Depreciation and amortisation 214 194 200 – – 608
The interests of the Group have been classified into five main operating divisions/business segments – trade mark interests, financialservices, industrial interests, mining interests and corporate finance/other interests. Each segment represents the main business sector ofthe investments classified thereunder. No adjustment has been made where companies are mainly active in one sector but have alsointerests in other sectors.
Income and expenses, as well as the attributable portion of the income from associated companies, are directly attributable to the segment.
Segment assets mainly include cash and cash equivalents, trade and other receivables, inventories, property, plant and equipment,intangible assets and other investments. Investments in associated companies, accounted for on the equity method, are stated separately.
Segment liabilities include all operating liabilities, except for taxation.
GE O G R A P H I C A L S E G M E N TA L A N A LY S I SThe Group’s interests can be divided into two main geographical areas, namely South Africa and abroad.
Headline TotalRevenue earnings assets
2002 2002 2002R million R million R million
South Africa 6 347 2 164 18 813Abroad 2 094 2 088 7 498
8 441 4 252 26 311
Total assets include assets and investments in associated companies, but exclude deferred tax assets and taxation paid in advance.

R E M G R O L I M I T E D
A D M I N I S T R AT I O N
hSE C R E TA RYM Lubbe (Mrs)
BU S I N E S S A D D R E S S A N D R E G I S T E R E D O F F I C ECarpe Diem Office ParkQuantum StreetTechno ParkStellenbosch7600
PO Box 456Stellenbosch7599
TR A N S F E R S E C R E TA R I E SComputershare Investor Services Limited70 Marshall Street Johannesburg2001
PO Box 61051Marshalltown2107
AU D I T O R SPricewaterhouseCoopers Inc.Stellenbosch
LI S T I N GJSE Securities Exchange South AfricaSector: Financial – Investment Companies
AM E R I C A N D E P O S I TA RY R E C E I P T (A D R) P R O G R A MCusip number 75956M107ADR to ordinary share 1:1
Depos i tary:The Bank of New York620 Avenue of the AmericasNew York NY 10011
SP O N S O RRand Merchant Bank Corporate Finance
WE B S I T Ewww.remgro.com
P A G E 7 4

P A G E 7 5
R E M G R O L I M I T E D
N O T I C E T O S H A R E H O L D E R S
hThe 2003 Annual General Meeting of the Company will be held on Tuesday, 26 August 2003, at 15:30 in the Vergelegen Room, The
Lord Charles Hotel, Corner of Faure and Stellenbosch Roads, Somerset West, to, if approved, pass the following resolutions with or
without modification:
1 . AP P R OVA L O F A N N U A L F I N A N C I A L S TAT E M E N T S
Ordinary Resolution Number 1
Resolved that the audited annual financial statements of the Company and the Group for the year ended 31 March 2003 be accepted
and approved.
2 . AP P R OVA L O F D I R E C T O R S’ R E M U N E R AT I O N
Ordinary Resolution Number 2
Resolved that the joint remuneration of the non-executive directors in the amount of R900 420 for the year ended 31 March 2003
be approved.
3 . EL E C T I O N O F D I R E C T O R S
Ordinary Resolution Number 3
Resolved that Messrs D M Falck, J F Mouton, F Robertson, J P Rupert and P G Steyn, who retire in terms of clause 31.1.1 of the
Company’s Articles of Association and who offered themselves for re-election, are hereby re-elected as directors of the Company.
4 . AU T H O R I T Y T O P L A C E S H A R E S U N D E R C O N T R O L O F T H E D I R E C T O R S
Ordinary Resolution Number 4
Resolved that the ordinary shares of one cent each and the B shares of ten cents each in the authorised but unissued share capital of
the Company be and are hereby placed under the control of the Board of Directors of the Company as a general authority in terms of
section 221(2) of the Companies Act (Act 61 of 1973), as amended (“the Companies Act”), subject to the provisions of the Companies
Act and the Listings Requirements of the JSE Securities Exchange South Africa (“the Listings Requirements”) until the next annual
general meeting, for allotment and issue to such persons and on such conditions as the Board of Directors may deem fit.
5 . AU T H O R I T Y T O R E P U R C H A S E S H A R E S
Special Resolution Number 1
Resolved that the Board of Directors of the Company be hereby authorised, by way of a general authority, to approve the purchase
of its own shares by the Company or to approve the purchase of shares in the Company by any subsidiary of the Company, provided:
h that this authority shall not extend beyond 15 months from the date of this meeting or the date of the next annual general
meeting, whichever is the earlier date;
h that the shares be purchased in the open market as defined by the JSE;
h that a paid press release giving such details as may be required in terms of the Listings Requirements be published when the
Company or its subsidiaries have cumulatively repurchased 3% of the shares in issue as at the time the authority was given;
h that the general repurchase may not exceed 20% of the number of shares in the Company’s issued share capital at the time this
authority is given, provided that the acquisition of shares as treasury stock by a subsidiary of the Company may not exceed 10%
of the number of issued shares of the Company;
h that repurchases must not be made at a price more than 10% above the weighted average of the market value of the securities
for the five business days immediately preceding the date on which the transaction was agreed; and

P A G E 7 6
R E M G R O L I M I T E D
h that such repurchase shall be subject to the Companies Act and the Listings Requirements.
It is the intention of the Board of Directors that they may use such authority should prevailing circumstances (including the tax
dispensation and market conditions) in their opinion warrant it.
The Company’s directors undertake that they will not implement any such repurchases in the period of this general authority unless:
h the Company and its subsidiary companies will be able, in the ordinary course of business, to pay its debts;
h the consolidated assets of the Company and its subsidiary companies would exceed the consolidated liabilities of the Company
and its subsidiary companies, respectively, both assets and liabilities being fairly valued in accordance with the accounting policies
used in the latest annual financial statements and with South African Statements of Generally Accepted Accounting Practice;
h the Company and its subsidiary companies will have adequate share capital and reserves;
h the Company and its subsidiary companies will have sufficient working capital for their requirements; and
h the sponsor of the Company provides a letter to the JSE on the adequacy of working capital in terms of section 2.14 of the
Listings Requirements.
Reason for and effect of the special resolution
The reason for and the effect of the special resolution are to grant the Company’s directors a general authority, up to and including
the date of the following annual general meeting of the Company, to approve the Company’s purchase of shares in itself or to permit
a subsidiary of the Company to purchase shares in the Company.
And to transact any other business that may be transacted at an annual general meeting.
Members who have not dematerialised their shares or who have dematerialised their shares with “own name” registration are entitled
to attend and vote at the meeting and are entitled to appoint a proxy or proxies to attend, speak and vote in their stead. The person
so appointed need not be a member. Proxy forms should be forwarded to reach the registered office of the company/company’s transfer
secretaries by Friday, 22 August 2003, at 15:30 (South African time).
Members who have dematerialised their shares, other than those members who have dematerialised their shares with “own name”
registration, should contact their CSDP or broker in the manner and time stipulated in their agreement:
h to furnish them with their voting instructions; and
h in the event that they wish to attend the meeting, to obtain the necessary authority to do so.
By order of the Board of Directors.
M Lubbe
Secretary
Stellenbosch
24 June 2003
N O T I C E T O S H A R E H O L D E R S
h

P A G E 7 7
R E M G R O L I M I T E D
E X P L A N AT O RY N O T E S T O T H EN O T I C E T O S H A R E H O L D E R S
hO R D I N A RY R E S O L U T I O N S
1. Approval of annual financial statements
In terms of the Companies Act (Act 61 of 1973), as amended (“the Act”), the directors are obliged to present the annual financial
statements and Group annual financial statements to the members at the annual general meeting for approval.
2. Approval of directors’ remuneration
In terms of the Company’s Articles of Association, the remuneration payable to non-executive directors must be determined at
the Company’s annual general meeting.
3. Election of directors
In terms of the Company’s Articles of Association, one-third of the directors or, if their number is not a multiple of three, then
the number nearest to but not less than one-third are required to retire at each annual general meeting and may offer themselves
for re-election. Biographical details of all directors of the Company are set out on pages 6 and 7.
4. Authority to place shares under control of the directors
In terms of the Act, the members of the Company must approve the placement of the unissued shares under the control of the
directors. This authority is due to expire at the forthcoming annual general meeting, unless renewed.
SP E C I A L R E S O L U T I O N
5. Authority to repurchase shares
The annual renewal of the authority is required in terms of the Act and the Listings Requirements. The existing authority to the
directors is due to expire at the forthcoming annual general meeting, unless renewed.

R E M G R O L I M I T E D
G U I D E L I N E S F O R T H E U S E O F T H E F O R M O F P R O X Y A N D T H E V O T I N G I N S T R U C T I O N F O R M
h1. Remgro shareholders whose Remgro ordinary shares have not been dematerialised
1.1 If your Remgro ordinary shares have not been dematerialised, in other words if you are still the holder of a Remgro share
certificate, you only have to complete the Form of Proxy if you wish to appoint a proxy to attend, speak and vote on your
behalf at the annual general meeting.
1.2 If you plan on attending the annual general meeting in person or if you have no intention of voting at the annual general
meeting, you do not have to complete the Form of Proxy.
1.3 Under no circumstances do you have to complete the Voting Instruction Form.
2. Remgro shareholders whose Remgro ordinary shares have been dematerialised
2.1 If your Remgro ordinary shares have been dematerialised, in other words if you no longer hold a Remgro share certificate,
your decision on which form you will have to complete will depend on whether your dematerialised Remgro ordinary shares
are registered in Remgro’s electronic subregister of members –
2.1.1 in your own name (so-called “own name registration”); or
2.1.2 in the name of your CSDP, broker or Computershare Custodial Services Limited in its capacity as your issuer-
sponsored nominee (“Computershare”).
2.2 In the case of own name registration you only have to complete the Form of Proxy if you wish to appoint a proxy to attend,
speak and vote on your behalf at the annual general meeting. If you plan on attending the annual general meeting in
person, or if you have no intention of voting at the annual general meeting, you do not have to complete the Form of Proxy.
Under no circumstances do you have to complete the Voting Instruction Form.
2.3 If your dematerialised Remgro ordinary shares are registered in Remgro’s electronic subregister of members in the name of
your CSDP, broker or Computershare and you wish to vote at the annual general meeting but do not want to or cannot
attend the annual general meeting in person, you must complete the Voting Instruction Form. If you wish to attend the
annual general meeting in person you must request your designated CSDP, broker or Computershare to provide you with
the necessary authority to do so. Under no circumstances do you have to complete the Form of Proxy.
3. For comprehensive information regarding the completion of the Form of Proxy and the Voting Instruction Form please see
the instructions contained in these forms.
G R A P H I C O R 2 8 3 2 3

THIS FORM OF PROXY IS ONLY FOR USE BY:1. REGISTERED MEMBERS WHO HAVE NOT YET DEMATERIALISED THEIR REMGRO LIMITED ORDINARY
SHARES; AND
2. REGISTERED MEMBERS WHO HAVE ALREADY DEMATERIALISED THEIR REMGRO LIMITED ORDINARYSHARES AND ARE REGISTERED IN THEIR OWN NAMES IN THE COMPANY’S SUBREGISTER *
* See explanatory note 3 overleaf
For completion by the aforesaid registered members who hold ordinary shares of the Company (“member”) and who are unable to attend the2003 Annual General Meeting of the Company to be held on Tuesday, 26 August 2003, at 15:30 in the Vergelegen Room, The Lord CharlesHotel, Corner of Faure and Stellenbosch Roads, Somerset West (“the annual general meeting”).
I/We ______________________________________________________________________________________________________
being the holder/s of ____________________________________________ ordinary shares in the Company, hereby appoint (see instruction 1 overleaf)
1. __________________________________________________________________________________________ or failing him/her,
2. __________________________________________________________________________________________ or failing him/her,
3. the chairman of the annual general meeting, as my/our proxy to attend, speak and vote for me/us and on my/our behalf or to abstainfrom voting at the annual general meeting of the Company and at any adjournment thereof, as follows (see note 2 and instruction2 overleaf):
Insert an “X” or the number of votes exercisable(one vote per ordinary share)
Ordinary resolutions In favour of Against Abstain
1. Approval of annual financial statements
2. Approval of directors’ emoluments
3. Election of directors
3.1 Mr D M Falck
3.2 Mr J F Mouton
3.3 Mr F Robertson
3.4 Mr J P Rupert
3.5 Mr P G Steyn
4. Authority to place shares under control of the directors
Special resolution
5. Authority to repurchase shares
Signed at ____________________________________________ on ____________________________________________ 2003
Signature/s ________________________________________________________________________________________________
Assisted by ________________________________________________________________________________________________(where applicable)
Please read the notes and instructions overleaf.
(Incorporated in the Republic of South Africa)(Registration number 1968/006415/06)
(Share code: REM ISIN: ZAE000026480)(“the Company”)
F O R M O F P R O X YF O R T H E Y E A R E N D E D 3 1 M A R C H 2 0 0 3
h

R E M G R O L I M I T E D
Notes:
1. A member entitled to attend and vote at the annual general meeting is entitled to appoint one or more proxies to attend, speakand vote in his/her stead. A proxy need not be a registered member of the Company.
2. Every member present in person or by proxy and entitled to vote at the annual general meeting of the Company shall, on a showof hands, have one vote only, irrespective of the number of shares such member holds. In the event of a poll, every member shallbe entitled to that proportion of the total votes in the Company which the aggregate amount of the nominal value of the sharesheld by such member bears to the aggregate amount of the nominal value of all the shares issued by the Company.
3. Members registered in their own name are members who elected not to participate in the Issuer-Sponsored Nominee Programme andwho appointed Computershare Custodial Services as their Central Securities Depository Participant (CSDP) with the expressinstruction that their uncertificated shares are to be registered in the electronic subregister of members in their own names.
Instructions on signing and lodging the form of proxy:
1. A member may insert the name of a proxy or the names of two alternative proxies of the member’s choice in the space/s providedoverleaf, with or without deleting “the chairman of the annual general meeting”, but any such deletion must be initialled by themember. Should this space be left blank, the proxy will be exercised by the chairman of the annual general meeting. The personwhose name appears first on the form of proxy and who is present at the annual general meeting will be entitled to act as proxyto the exclusion of those whose names follow.
2. A member’s voting instructions to the proxy must be indicated by the insertion of an “X”, or the number of votes exercisable bythat member, in the appropriate spaces provided overleaf. Failure to do so will be deemed to authorise the proxy to vote or toabstain from voting at the annual general meeting, as he/she thinks fit in respect of all the member’s exercisable votes. A memberor his/her proxy is not obliged to use all the votes exercisable by him/her or by his/her proxy, but the total number of votes cast,or those in respect of which abstention is recorded, may not exceed the total number of votes exercisable by the member or byhis/her proxy.
3. A minor must be assisted by his/her parent or guardian unless the relevant documents establishing his/her legal capacity areproduced or have been registered by the transfer secretaries.
4. To be valid, the completed forms of proxy must be lodged with the transfer secretaries of the Company, Computershare InvestorServices Limited at 70 Marshall Street, Johannesburg, 2001, South Africa, or posted to the transfer secretaries at PO Box 61051,Marshalltown 2107, South Africa, to be received by them not later than Friday, 22 August 2003, at 15:30 (South African time).
5. Documentary evidence establishing the authority of a person signing this form of proxy in a representative capacity must beattached to this form of proxy unless previously recorded by the transfer secretaries or waived by the chairman of the annualgeneral meeting.
6. The completion and lodging of this form of proxy will not preclude the relevant member from attending the annual generalmeeting and speaking and voting in person thereat to the exclusion of any proxy appointed in terms hereof, should such memberwish to do so.
7. The completion of any blank spaces overleaf need not be initialled. Any alterations or corrections to this form of proxy must beinitialled by the signatory/ies.
8. The chairman of the annual general meeting may accept any form of proxy which is completed other than in accordance withthese instructions provided that he is satisfied as to the manner in which a member wishes to vote.
G R A P H I C O R 2 8 3 2 3

THIS VOTING INSTRUCTION FORM IS ONLY FOR USE BY MEMBERS WHO HAVE ALREADYDEMATERIALISED THEIR REMGRO LIMITED ORDINARY SHARES AND ARE NOT REGISTERED IN THEIROWN NAMES IN THE COMPANY’S SUBREGISTER.*
* See explanatory note 1 overleaf
For use in respect of the 2003 Annual General Meeting of the Company to be held on Tuesday, 26 August 2003, at 15:30 in the VergelegenRoom, The Lord Charles Hotel, Corner of Faure and Stellenbosch Roads, Somerset West (“the annual general meeting”).
Members who have already dematerialised their Remgro Limited ordinary shares may use this form to advise their Central SecuritiesDepository Participant (CSDP) or broker of their voting instructions on the proposed resolutions in the spaces provided below.However, should such members wish to attend the annual general meeting in person, then they will need to request their CSDP orbroker to provide them with the necessary authority to do so.
I/We ______________________________________________________________________________________________________
being a member(s) of the Company who has/have dematerialised my/our shares in Remgro Limited do hereby indicate in the spacesprovided below to my/our CSDP/broker my/our voting instructions on the resolutions to be proposed at the annual general meetingand at any adjournment thereof.
The number of votes exercisable(one vote per ordinary share)
Ordinary resolutions In favour of Against Abstain
1. Approval of annual financial statements
2. Approval of directors’ emoluments
3. Election of directors
3.1 Mr D M Falck
3.2 Mr J F Mouton
3.3 Mr F Robertson
3.4 Mr J P Rupert
3.5 Mr P G Steyn
4. Authority to place shares under control of the directors
Special resolution
5. Authority to repurchase shares
Signed at ____________________________________________ on ____________________________________________ 2003
Signature/s ________________________________________________________________________________________________
Assisted by ________________________________________________________________________________________________(where applicable)
Please read the notes overleaf.
(Incorporated in the Republic of South Africa)(Registration number 1968/006415/06)
(Share code: REM ISIN: ZAE000026480)(“the Company”)
V O T I N G I N S T R U C T I O N F O R MF O R T H E Y E A R E N D E D 3 1 M A R C H 2 0 0 3
h

R E M G R O L I M I T E D
Notes:
1. Members who elected not to participate in the Issuer-Sponsored Nominee Programme and who appointed ComputershareCustodial Services as their CSDP with the express instruction that their uncertificated shares are to be registered in the electronicsubregister of members in their own names must complete the form of proxy.
2. Please indicate in the appropriate spaces above the number of votes to be cast. Each ordinary share carries the right to one vote.
3. All the votes need not be exercised neither need all votes be cast in the same way, but the total of the votes cast and in respectof which abstention is directed may not exceed the total of the votes exercisable.
4. Any alteration or correction made to this voting instruction form must be initialled by the signatory/ies.
5. When there are joint holders of shares, any one holder may sign the voting instruction form.
6. Completed voting instruction forms should be forwarded to the CSDP or broker through whom the ordinary shares have beendematerialised. Members should contact their CSDP or broker with regard to the cut-off time for lodging of voting instructionforms.
G R A P H I C O R 2 8 3 2 3