annual r eport - special olympics bharatspecialolympicsbharat.org/resources/special olympics...and a...
TRANSCRIPT

ANNNUUAL
20
L R
010
REP
0
PORRT

Particulars Page No.'s
General InformaionGlobal Congress ‐ Morocco ‐ June 2010 1Asia Pacific Advisory Committee Meeting 2PYKKA and New Scheme for the Disabled 3Signature Campaign‐ Ban rthe R Word 4EKS Day Celebrations 7Area Directors Meeting March 2010 12Special Awards ‐Satish Pillai ‐ Lina Bardhan 14National Trust ‐ bravery awards 15Visit of Hon'ble British Pime Minister 16Meeting the British Hon'ble Minister ofd Sports 17Meeting with the Australian Sports Minister 18Queens Baton Torch Run ‐ CWG 19
Organization and DevelopmentStructure 21Startegic Growth 25
MYAS/SAI approved Sports ProgramsLong Term Dvelopment Plan 30New Scheme for the Disabled 32PYKKA 32
LTDP ProgramsNational Games 33Selection Committee 34Preparatory Camps 35National Coaching Camps 37Train the Trainer Programs 41Community Level Coaches Training 46GMS Training 48PG Diploma Course 49
New Scheme for the DisabledPYKKAState / District Games 50State Games 50District Events 51
Other ActivitiesYoung Athletes Programs 52HA Programs 53Family Forum 59
Finance and Fund Raising 61
Conclusion 71

Annual Report 2010 Page 1
SPECIAL OLYMPICS BHARAT
ANNUAL REPORT 2010
GENERAL INFORMATION GLOBAL CONGRESS ‐ MOROCCO – JUNE 2010
For the Special Olympics Movement, 2010 was a year of introspection and change. The Special Olympics Global Congress was held at Marrakech, Morocco in June 2010. Over 600 delegates from 170 countries attended the Congress, including the Staff of both SOI and the Regions and members of the Board of Directors of SOI. A new 5 year Strategic Plan for the Special Olympics Program, worldwide, was prepared by a team of dedicated specialists. This was
discussed and debated at the Congress and a general consensus reached. Regional and State level Plans have been prepared which will come into force from 1 January 2011. This new road map for Special Olympics envisages a more unified and integrated approach to the movement by which the Regions and Programs work together to meet the shared and mutually agreed global goals and aspiration of the Program through a general realignment of the systems and processes. There was a clear consensus, that sustained quality growth was an imperative if the system is to maintain its credibility and impact. Quality training of Coaches and Athlete’s is necessary to achieve and sustain high standards, for which a strong Trainer / Coaches program is essential. SO Bharat has developed and established such a system which is turning out high quality trainers in large numbers, to meet the requirements of a fast growing program.
Annual Report 2010 Page 2
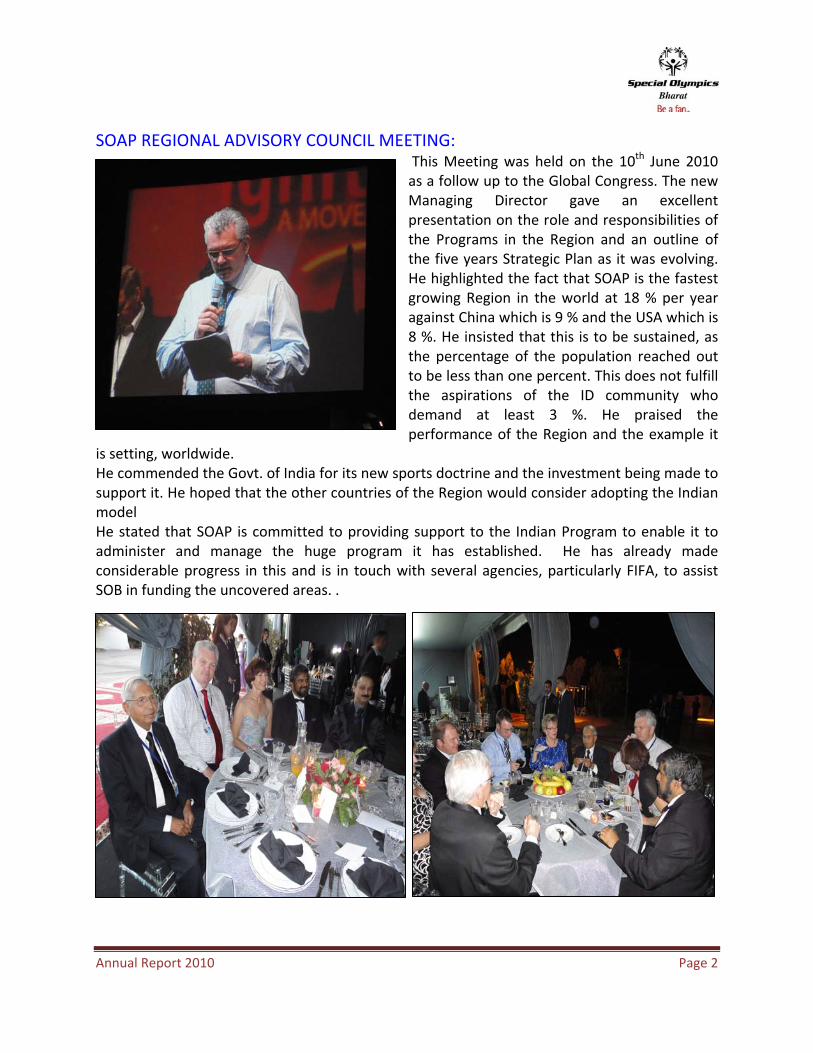
SOAP REGIONAL ADVISORY COUNCIL MEETING: This Meeting was held on the 10th June 2010 as a follow up to the Global Congress. The new Managing Director gave an excellent presentation on the role and responsibilities of the Programs in the Region and an outline of the five years Strategic Plan as it was evolving. He highlighted the fact that SOAP is the fastest growing Region in the world at 18 % per year against China which is 9 % and the USA which is 8 %. He insisted that this is to be sustained, as the percentage of the population reached out to be less than one percent. This does not fulfill the aspirations of the ID community who demand at least 3 %. He praised the performance of the Region and the example it
is setting, worldwide. He commended the Govt. of India for its new sports doctrine and the investment being made to support it. He hoped that the other countries of the Region would consider adopting the Indian model He stated that SOAP is committed to providing support to the Indian Program to enable it to administer and manage the huge program it has established. He has already made considerable progress in this and is in touch with several agencies, particularly FIFA, to assist SOB in funding the uncovered areas. .
Annual Report 2010 Page 3
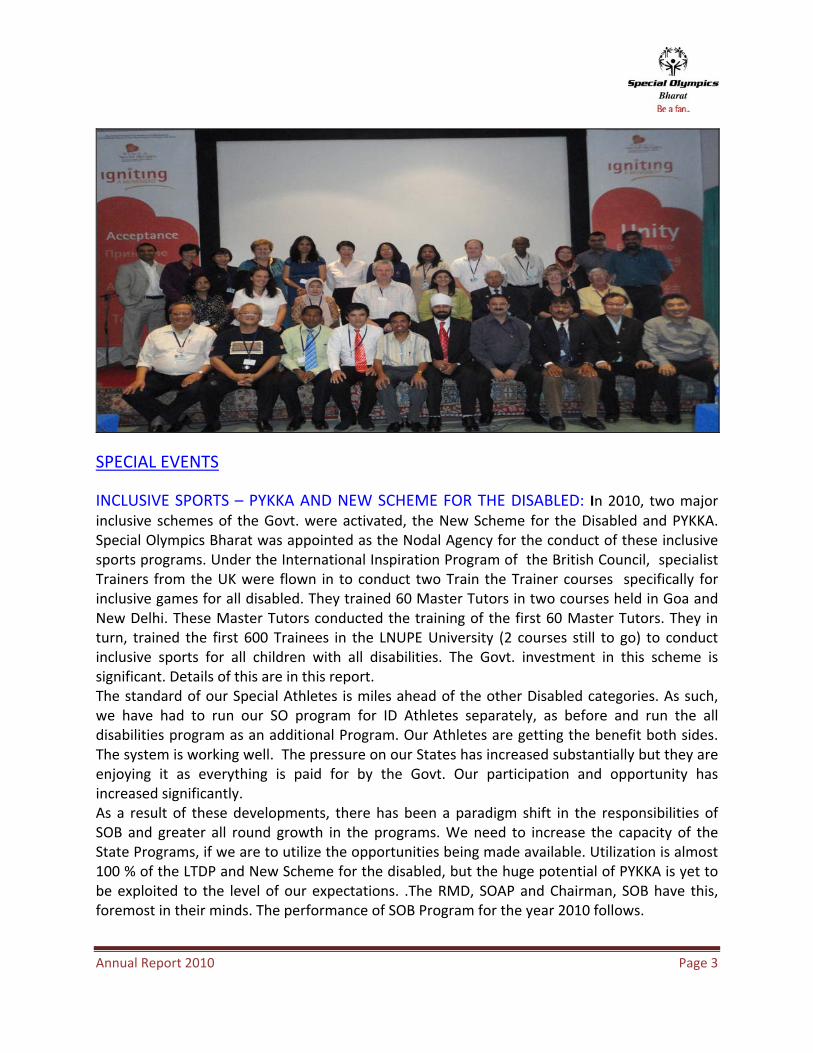
SPECIAL EVENTS
INCLUSIVE SPORTS – PYKKA AND NEW SCHEME FOR THE DISABLED: In 2010, two major inclusive schemes of the Govt. were activated, the New Scheme for the Disabled and PYKKA. Special Olympics Bharat was appointed as the Nodal Agency for the conduct of these inclusive sports programs. Under the International Inspiration Program of the British Council, specialist Trainers from the UK were flown in to conduct two Train the Trainer courses specifically for inclusive games for all disabled. They trained 60 Master Tutors in two courses held in Goa and New Delhi. These Master Tutors conducted the training of the first 60 Master Tutors. They in turn, trained the first 600 Trainees in the LNUPE University (2 courses still to go) to conduct inclusive sports for all children with all disabilities. The Govt. investment in this scheme is significant. Details of this are in this report. The standard of our Special Athletes is miles ahead of the other Disabled categories. As such, we have had to run our SO program for ID Athletes separately, as before and run the all disabilities program as an additional Program. Our Athletes are getting the benefit both sides. The system is working well. The pressure on our States has increased substantially but they are enjoying it as everything is paid for by the Govt. Our participation and opportunity has increased significantly. As a result of these developments, there has been a paradigm shift in the responsibilities of SOB and greater all round growth in the programs. We need to increase the capacity of the State Programs, if we are to utilize the opportunities being made available. Utilization is almost 100 % of the LTDP and New Scheme for the disabled, but the huge potential of PYKKA is yet to be exploited to the level of our expectations. .The RMD, SOAP and Chairman, SOB have this, foremost in their minds. The performance of SOB Program for the year 2010 follows.

Annual Report 2010 Page 4
SIGNATURE CAMPAIGN ‐ COLLECTING PLEDGES TO BAN THE “R WORD” This campaign was undertaken seriously during the year with a target of 10 million in mind. By
October 30th when the closing Ceremony was carried out at a glittering ceremony at Bangalore, the IT and aviation capital of India, we had crossed over 11.25 million. The star of the program was the Area Director of Bihar, Shivajee Kumar, who accounted for more than 50 % of the signatures. The details of this achievement is recorded on a CD and kept in the office archives. Many lessons were learnt, many high level contacts were made and a long time association with the BOLLYWOOD and FASHION Industry was established. This whole program was conducted and funded by Akshay Kumar and Special Olympics Bharat. Above,
Shivajee Kumar receiving the EKS Award from Akshay Kumar, Bollywood, super star.

Annual Report 2010 Page 5

Annual Report 2010 Page 6
DISTRICTS NO. OF SCHOOLS NO. OF SIGNATURESPATNA 658 1,548,864DARBHANGA 402 222,964NALANDA 383 190,410ARRAH (BHOJPUR) 244 133,480GAYA 376 179,419MUNGER 213 117,702BHAGALPUR 456 252,735MADHUBANI 464 246,398BETTIAH(West Champaran) 420 225,327NAWADA 274 135933GOPALGUNJ 436 200,013JEHANABAD 250 94,947PURNIA 377 169,675JAMUI 273 130,979SASARAM (Rohtas) 212 102,602KATIHAR 344 173,703SAHARSA 264 147,564ARARIYA 239 113,418BEGUSARAI 240 114,277MADHEPURA 283 132,088KISHANGUNJ 240 113,064SAMASTIPUR 435 190,221LAKHISARAI 265 112,991MOTIHARI 364 148,506SITAHMARHI 310 109,737SIWAN 307 96,532CHAPRA (Saran) 210 67,048BUXER 344 107,686BANKA 232 73,827KHAGARIYA 316 95,417SHIVHAR 191 56,680SHEKHPURA 213 66,326AURANGABAD 249 69,147KATIHAR 291 78,741VAISHALI 306 80,376SUPAUL 399 71,699ARWAL 17 7,053MUZAFFARPUR 448 383,884TOTAL 11,984 6,240,044

Annual Report 2010 Page 7
EKS DAY CELEBRATION ON 25TH SEPTEMBER 2010 This Year, EKS Day took on a new turn. The Area Director of Uttar Pradesh , Mr. Amitav Mishra, approached the head of the Sarva Shiksha Abhiyan ( SSA ) Schools in the State, with a proposal
to celebrate EKS Day by “ Remembering and Honoring the founder of the Special Olympics Movement , Mrs. Eunice Shriver”, during the assembly meetings in each SSA school, on the 25th September and follow this up by a verbal pledge by all Staff and Students , Banning the R Word. The population of Uttar Pradesh is 180 million. There are 113,620 SSA Schools in the State with over 20 million children registered. This proposal was accepted and carried out. Over one million signed pledges were recorded. Other States also celebrated EKS Day and the details are
contained in the report. The EUNICE SHRIVER AWARD FOR EXCELLENCE has been introduced for all deserving candidates. A sample has been sent to SOI. It will be improved upon. Amitav Mishra, received this award in recognition for his outstanding initiative with the SSA‘S. Above, Amitav is receiving the Award from Akshay Kumar, super star from Bollywood. The EKS Stadium to come up in Gujarat is still in the stage of land acquisition. It will take some time before we see the light at the end of the tunnel, as land allotment is a very sensitive issue. For future Celebrations of EKS day, 25th September each year, we are considering holding Regional Games in the three Regions and expand them to include International Regions. This will be subject to approval of SOI / SOAP as we are aware that the preference presently is on many small sports events! It was also suggested that EKS Anniversary be spread out over a week as, in many States, unavoidable circumstances forced them to pre‐pone or postpone the event by a day or two.

Annual Report 2010 Page 8
Annual Report 2010 Page 9

Annual Report 2010 Page 10
UP DISTRICT BREAK DOWN OF PLEDGES AND SIGNATURES
DISTRICTS COLLECTIVE PLEDGE AT
ASSEMBLYSIGNED PLEDGES
Agra 550,045 110,085
Aligarh 125,000 7,506
Allahabad 450,048 50,002
Ambedkar Nagar 120,000 0
Auraiya 120,000 10,052
Azamgarh 130,085 5,065
Baghpat 110,000 0
Bahraich 130,000 0
Ballia 150,000 5,075
Balrampur 150,000 5,042
Banda 160,000 12,062
Barabanki 130,000 15,042
Bareilly 1,750,000 12,508
Basti 325,000 25,096
Bijnor 114,528 0
Budaun 350,000 20,078
Bulandshahar 225,000 2,032
Chandauli 140,000 100,029
Chatrapati Nagar 125,000 0
Chitrakoot 150,065 2,011
Deoria 130,000 0
Etah 120,000 0
Etawah 200,000 30,032
Faizabad 125,000 40,452
Farrukhabad 175,000 20,022
Fatehpur 125,000 0
Firozabad 120,000 20,042
Gautam Buddha Nagar 325,000 2,063
Ghaziabad 800,000 115,096
Ghazipur 140,000 0
Gonda 125,000 4,052
Gorakhpur 150,000 5,000
Hamirpur 115,000 0
Hardoi 100,000 25,510
Hathras 125,000 8,032

Annual Report 2010 Page 11
Jalaun 115,000 15,096
Jaunpur 140,000 0
Jhansi 130,000 0
Jyotiba Phule Nagar 150,000 2,502
Kannauj 120,000 0
Kanpur Dehat 175,000 10,012
Kanpur Nagar 300,000 60,000
Kashiram Nagar 120,000 0
Kaushambi 125,000 0
Kheri 325,000 138,876
Kushinagar 130,000 0
Lalitpur 115,000 0
Lucknow 1,625,000 125,000
Maharajganj 120,000 5,007
Mahoba 115,000 0
Mainpuri 150,000 20,051
Mathura 400,000 40,065
Mau 145,000 0
Meerut 125,000 5,022
Mirzapur 150,000 0
Moradabad 750,000 75,058
Muzaffarnagar 110,000 2,002
Pilibhit 150,000 10,011
Pratapgarh 175,000 5,025
RaeBareli 175,000 25,062
Rampur 250,000 2,533
Saharanpur 175,000 5,056
Sant Kabir Nagar 125,000 5,066
Sant Ravidas Nagar 120,000 0
Shahjahanpur 125,000 25,022
Shravasti 150,025 4,066
Siddharthnagar 145,000 0
Sitapur 125,000 20,006
Sonbhadra 120,000 0
Sultanpur 140,000 0
Unnao 330,000 15,005
Varanasi 750,589 75,062TOTAL 17,070,385 1,342,591

Annual Report 2010 Page 12
AREA DIRECTORS MEETING HELD ON 9TH & 10TH MARCH 2010 The Annual Area Directors Meeting was held in Delhi in March 2010. It was attended by Mr. Brady Lum, President and CEO of SOI and the new Managing Director of SOAP, Mr., David Rutherford, a first visit for both.
The main aim of the Meeting was to:‐ a) Review the performance of the State Programs and discuss problems and solutions b) Finalize Plans and Targets for 2010 c) Award those whose performance deserve recognition d) Meet the President and CEO of SOI, Mr. Brady Lum and new MD of SOAP Mr. David
Rutherford e) Any other matters
Annual Report 2010 Page 13
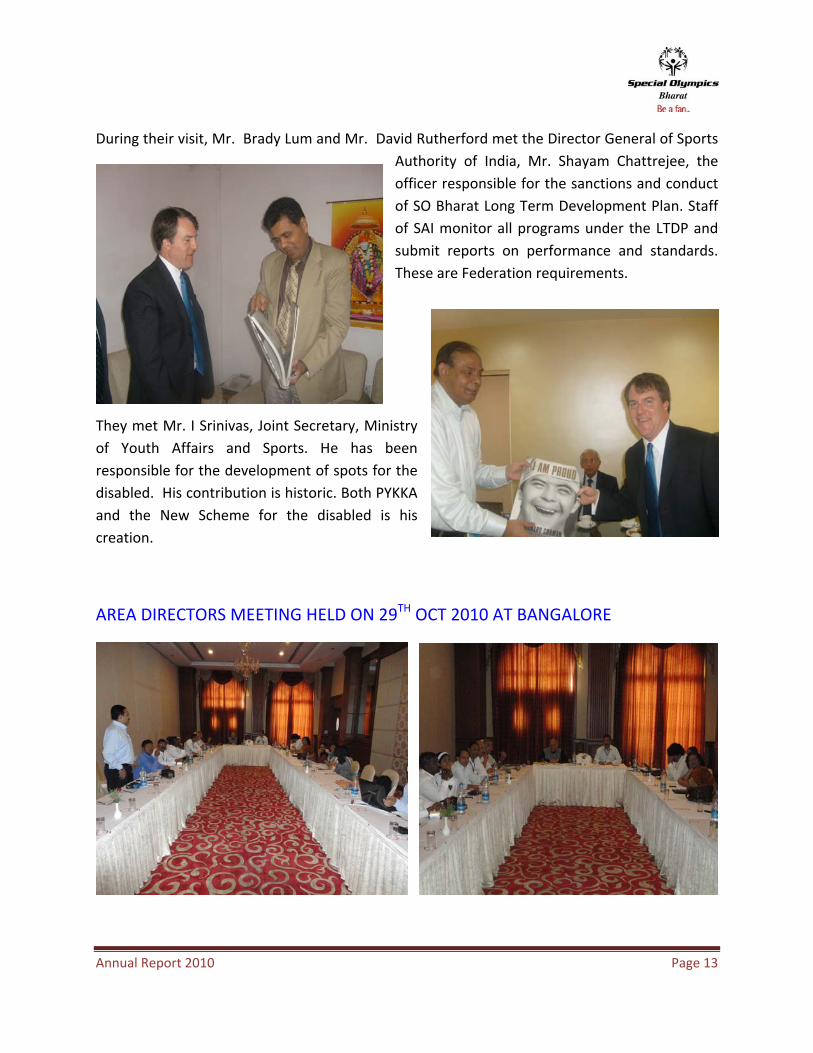
During their visit, Mr. Brady Lum and Mr. David Rutherford met the Director General of Sports Authority of India, Mr. Shayam Chattrejee, the officer responsible for the sanctions and conduct of SO Bharat Long Term Development Plan. Staff of SAI monitor all programs under the LTDP and submit reports on performance and standards. These are Federation requirements.
They met Mr. I Srinivas, Joint Secretary, Ministry of Youth Affairs and Sports. He has been responsible for the development of spots for the disabled. His contribution is historic. Both PYKKA and the New Scheme for the disabled is his creation.
AREA DIRECTORS MEETING HELD ON 29TH OCT 2010 AT BANGALORE

Annual Report 2010 Page 14
The main aim of the Meeting was to review the performance of the State Programs and discuss problems and solutions with special focus on:
(a) 5 pillar Strategic Plan of SOI
(b) STRATEGIC GROWTH
(c) LTDP
(d) NEW SCHEMES by MYAS
(e) DISTRICT GAMES in new scheme of MYAS
SPECIAL AWARDS / RECOGNITION THE DHYAN CHAND LIFE‐TIME AWARD FOR 2009
Mr. Satish Pillai was awarded the Dhyan Chand Life time award by the President of India for his contribution to the promotion of sports in the country. He received the award from the President at a National Sports Day ceremony held at Rashtrapathi Bhavan on 26 August 2010. Mr. Satish Pillai is the Chairman, East‐North East Region, Special Olympics Bharat and the President of Special Olympics Bharat – Jharkhand Sate Chapter. He is a staunch supporter of the SOB Program.
Annual Report 2010 Page 15
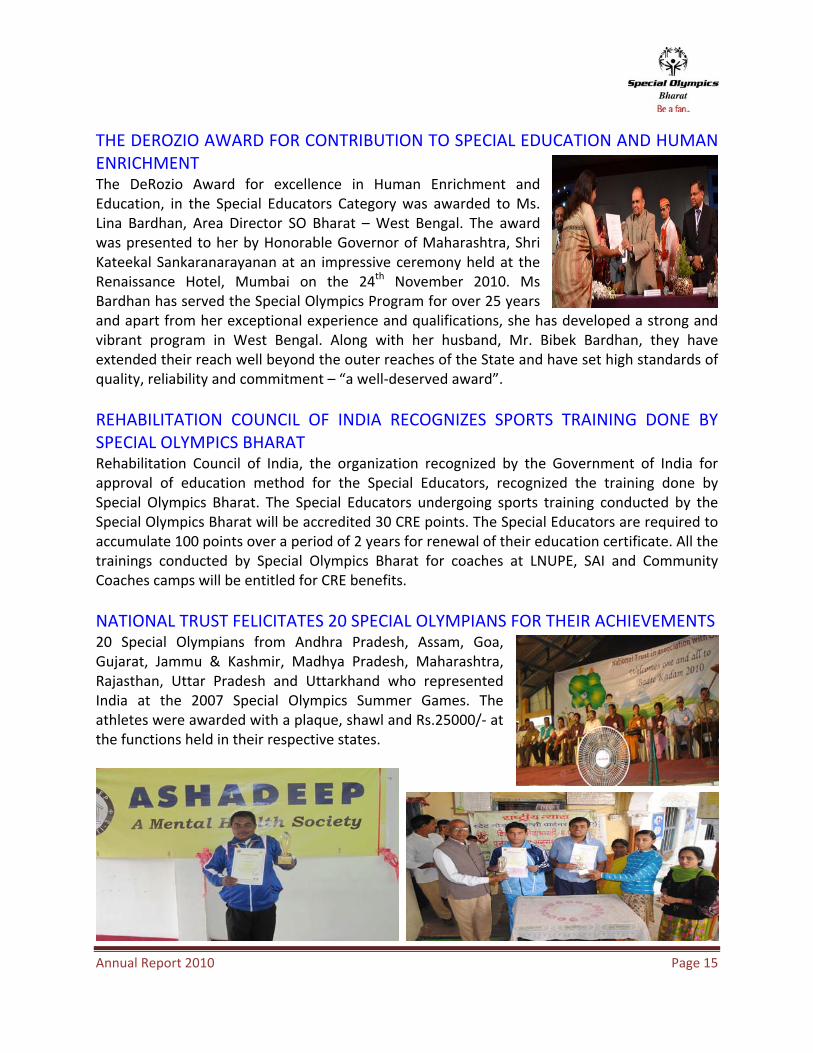
THE DEROZIO AWARD FOR CONTRIBUTION TO SPECIAL EDUCATION AND HUMAN ENRICHMENT The DeRozio Award for excellence in Human Enrichment and Education, in the Special Educators Category was awarded to Ms. Lina Bardhan, Area Director SO Bharat – West Bengal. The award was presented to her by Honorable Governor of Maharashtra, Shri Kateekal Sankaranarayanan at an impressive ceremony held at the Renaissance Hotel, Mumbai on the 24th November 2010. Ms Bardhan has served the Special Olympics Program for over 25 years and apart from her exceptional experience and qualifications, she has developed a strong and vibrant program in West Bengal. Along with her husband, Mr. Bibek Bardhan, they have extended their reach well beyond the outer reaches of the State and have set high standards of quality, reliability and commitment – “a well‐deserved award”. REHABILITATION COUNCIL OF INDIA RECOGNIZES SPORTS TRAINING DONE BY SPECIAL OLYMPICS BHARAT Rehabilitation Council of India, the organization recognized by the Government of India for approval of education method for the Special Educators, recognized the training done by Special Olympics Bharat. The Special Educators undergoing sports training conducted by the Special Olympics Bharat will be accredited 30 CRE points. The Special Educators are required to accumulate 100 points over a period of 2 years for renewal of their education certificate. All the trainings conducted by Special Olympics Bharat for coaches at LNUPE, SAI and Community Coaches camps will be entitled for CRE benefits. NATIONAL TRUST FELICITATES 20 SPECIAL OLYMPIANS FOR THEIR ACHIEVEMENTS 20 Special Olympians from Andhra Pradesh, Assam, Goa, Gujarat, Jammu & Kashmir, Madhya Pradesh, Maharashtra, Rajasthan, Uttar Pradesh and Uttarkhand who represented India at the 2007 Special Olympics Summer Games. The athletes were awarded with a plaque, shawl and Rs.25000/‐ at the functions held in their respective states.
Annual Report 2010 Page 16
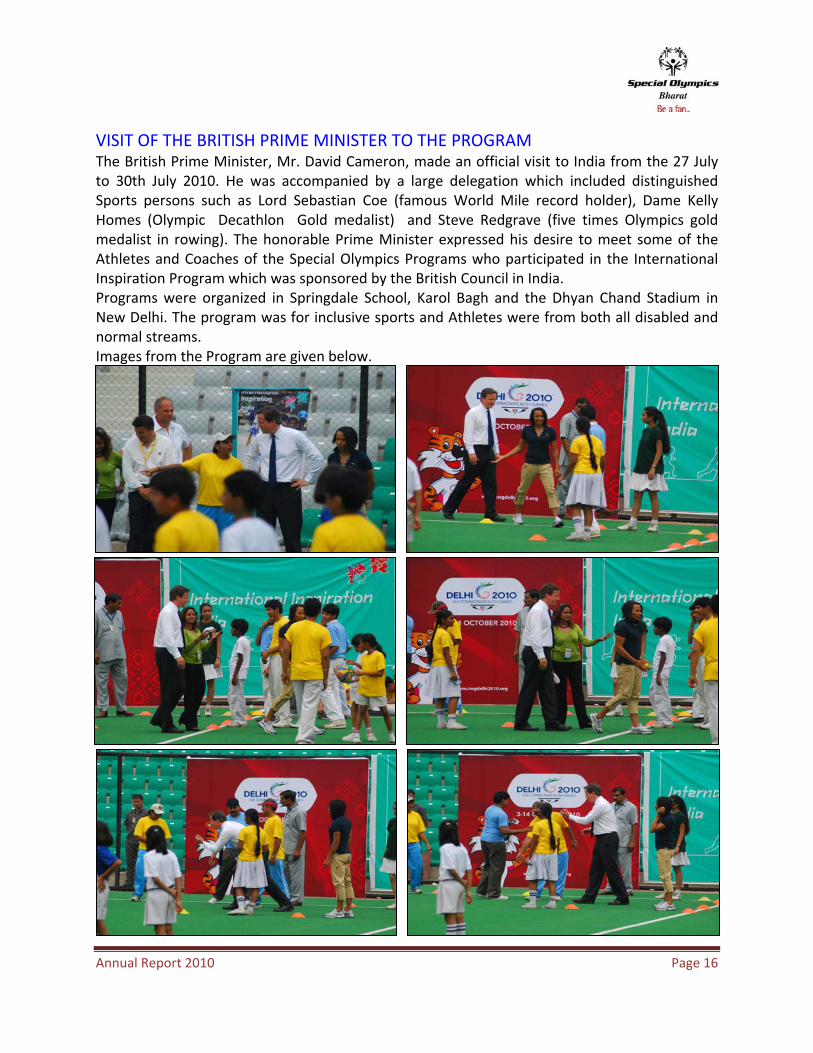
VISIT OF THE BRITISH PRIME MINISTER TO THE PROGRAM The British Prime Minister, Mr. David Cameron, made an official visit to India from the 27 July to 30th July 2010. He was accompanied by a large delegation which included distinguished Sports persons such as Lord Sebastian Coe (famous World Mile record holder), Dame Kelly Homes (Olympic Decathlon Gold medalist) and Steve Redgrave (five times Olympics gold medalist in rowing). The honorable Prime Minister expressed his desire to meet some of the Athletes and Coaches of the Special Olympics Programs who participated in the International Inspiration Program which was sponsored by the British Council in India. Programs were organized in Springdale School, Karol Bagh and the Dhyan Chand Stadium in New Delhi. The program was for inclusive sports and Athletes were from both all disabled and normal streams. Images from the Program are given below.

Annual Report 2010 Page 17
MEETING WITH THE BRITISH SPORTS MINISTER The UK Sports Minister, Mr. Hugh Robertson, visited Delhi during the Commonwealth games. The International Inspiration program members met the minister to discuss the impact of program and future of the program. Mr. Kuntia, Secretary, Education, Government of India applauded the efforts of British Council for introducing best practices in Education from UK in India. The Student Exchange Programs have proved as enriching experience. The

Annual Report 2010 Page 18
importance of inclusive and organized Physical Education at Primary level was one of the main focuses which were achieved. The PEC Resources were developed with help of Mrs. Balachandran, Director, Education Quality Foundation India, Mr. Pandey, Education Consultant and National Trainers of Special Olympics Bharat. The cards have been successfully rolled‐out in CBSE Schools.
Special Olympics Bharat was greatly impacted by the program. Our coach’s education program was re‐structured to meet the requirements of such a large program like India. The coaches were trained by International Experts from UK. Such continuous learning’s are the requirement of the day. Minister was
requested to carry forward
the support to this program as its funds and tenure ends with LONDON Olympics in 2012. The program still requires lot of help in terms of completion of projects, their assessment and successful roll‐out throughout India. The Minister appreciated the work done in India through Education collaboration and assured that he will take up this matter with Central authorities and Finance Ministry. MEETING WITH THE AUSTRALIAN SPORTS MINISTER The Australian Minister for Sport, Mark Arbib formally launched the Australian Sports Outreach Program in India on 6th October, at an hour‐long function, hosted by the Australian High Commission, New
Delhi. The event, attended by a select gathering of around 75 persons, included senior representatives from all the in‐country ASOP India partner agencies and the following organizations: Australian Sports Commission, Australian

Annual Report 2010 Page 19
Institute of Sport, Australian Department of Health & Ageing, Australian Gold Coast 2018 Commonwealth Games Bid Ltd., British Council, Canadian Commonwealth Games Association, Commonwealth Advisory Board on Sport, International Federation of Netball Associations and Netball Australia. The gathering was eloquently addressed, in turn, by the Australian High Commissioner, Mr. Peter Varghese, Ms. Anjali Gopalan, Executive Director of the Naz Foundation (India) Trust and the Hon. Mark Arbib, Australian Minister for Sport, in his speech, the Minister highlighted the immense potential of sport to help promote positive social change and community development as outcomes of sport‐based programs. During the programme, athletes from Special Olympics Bharat and the Naz Foundation’s GOAL program, respectively, demonstrated their skills at bocce and netball. To the delight of the young athletes and their coaches, the Hon. Minister joined in the games enthusiastically and spent quality time engaging with them.
COMMONWEALTH GAMES ‐ QUEENS BATON TORCH RUN The Commonwealth Games were held in October 2010 in New Delhi. Our Special Athletes were invited to participate in the Queen’s Baton Torch run in several States in the Country. Some of the Images of these events are given below. ASSAM
WEST BENGAL

Annual Report 2010 Page 20
JHARKHAND
MAHARASHTRA
GOA
COMMONWEALTH SPORT SCIENCE CONGRESS The Chairman SO Bharat was invited to speak about the Special
Olympics Program at a meeting of all the Commonwealth Delegates at the Commonwealth Sports Science Congress. A suitable Hand Out about Special Olympics was given to all the delegates for their information.

Annual Report 2010 Page 21
ORGANIZATION DEVELOPMENT & STRUCTURE
AN OVERVIEW OF SPECIAL OLYMPICS BHARAT 31 DECEMBER 2010
AQUATICSATHLETICS BADMINTON BASKETBALL BOCCE CRICKET CYCLING HANDBALL POWER LIFTING ROLLER SKATING SOCCER SOFTBALL TABLE TENNIS VOLLEYBALL FLOOR HOCKEY ALPINE SKIING SNOW SHOEING SPEED SKATING SNOWBOARDING KHO‐KHO FIGURE SKATING KHABADI
SPORTS OFFERED
TARGET for 2011: 850,000 Athletes
35 STATE PROGRAMS
Assam Arunachal Pradesh Andhra Pradesh Andaman & Nicobar Is Bihar Chandigarh Chattisgarh Delhi Dadar Nagar & Haveli Daman & Diu Goa Gujarat Haryana Himachal Pradesh Jharkhand Jammu & Kashmir Karnataka Kerala Lakshadeep Madhya Pradesh Maharashtra Manipur Mizoram Meghalaya Nagaland Orissa Punjab Pondicherry Rajasthan Sikkim Tripura Tamil Nadu Uttaranchal Uttar Pradesh West Bengal
CURRENT STATUS:Over 750,231 ATHLETES; 44,304 COACHES; 2685 TRAINERS;
49008 VOLUNTEERS; 74744 FAMILIES

Annual Report 2010 Page 22

Annual Report 2010 Page 23
NATIONAL OFFICE (ALL PAID STAFF) The strength of the National office Staff was increased from 7 to 11 (Paid Staff)
Two highly qualified trainers were hired to look after the GMS and to be available to the National Sports Director for field duties and preparation for the World Summer games.
One person has been assigned to the National Office to look after the HA Programs. One person has been hired for the accounts department. The National Sports Director has been provided with an independent, fully equipped office
and Staff funded by SOB. His travel is being funded by SOB through SAI
ORGANIZATION CHART
REGIONAL OFFICES (VOLUNTEERS) All three Regional Offices are operation Assistant to Chairman, Regional Committee has been appointed and is paid for through CRG The Offices are funded by funds raised by SOB / State This System of de‐centralization is working satisfactorily. Meetings are held annually at the Area Directors Meetings where the Regional Plans are finalized and within that they are actively involved with the Planning of Programs in their respective Regions. The East‐North Region conducted a Regional Games for the first time.

Annual Report 2010 Page 24
National Office
REGIONNorth & Central
Air Marshal A. Goel,(Reg. Coordinator)
REGIONWest & South
Mr. Shanker Menon,(Reg. Coordinator)
REGIONEast & North East
Mr. Bibek Bardhan,(Reg. Coordinator)
14 STATES
302 Districts 138 Districts 179 Districts
12 STATES9 STATES
REGIONAL SRUCTURE
STATE OFFICES (VOLUNTEERS)
No. of States 31 ID Population per State 1.8 million % of ID Population Registered 2.20 % Administrative Unit State Committee / Area Director Support Staff Trainers / Coaches Paid Staff Program Manager (Through CRG)
DISTRICT DIRECTORS (VOLUNTEERS)
Average ID Population 60,000 No. of Districts 619 No of Districts Activated 450 District Directors 450 (Volunteers) TA / DA Provided by MYAS / SAI

Annual Report 2010 Page 25
ADMINISTRATIVE COSTS
LEVEL OF OFFICES
DETAILS OF EXPENDITURE
OPERATING COST INR
OPERATING COST US $
SOURCE OF FUNDING
1‐National Office
Wages, Operating Cost, Stipend, Uncovered Expenditure
90,00,000 200,000
(CRG 150,000) SOI 75 % SOB 25%
3‐Regional Offices
Rs.50,000 per month for 12 months for 3 Regions
18,00,000
40,000 State 70 % SOB 30 %
31 State Offices
Rs,50,000 per month for 12 month for 31 States
1,86,00,000
413,333
State 50 % SOB 50 %
600 District Offices
Rs.10,000 per District per Month for 600 Districts
7,20,00,000
1,600,000
SOB 50 % State 50 %
TOTALS ‐ 10,14,00,000 2,253,333
(CRG 150,000)
SOI 6% SOB 35%
STATE 59%
STRATEGIC GROWTH – 2010 VISION – 2011 to 2015 ITEM 2010 2011 2012 2013 2014 2015
ATHLETES 750,000 850,000 950,000 1,050,000 1,150,000 1,250,000
TRAINERS 1,800 2,400 3,000 3,600 4,200 4,800
COACHES 40,000 45,000 50,000 55,000 60,000 65,000
VOLUNTEERS 50,000 55,000 60,000 65,000 70,000 75,000
FAMILIES 70,000 75,000 80,000 85,000 90,000 95,000

Annual Report 2010 Page 26
ACHIEVED as on 31st December 2010 ITEM 2008 2009 2010 REMARKS EXCESS
ATHLETES 560,766 655,234 750.231Over shot
Target + 231
TRAINERS 499 1,159 2685Over shot
Target +885
COACHES
NEW SCHEME
Total Coaches
32,766
‐
36,000
‐
44,304
6,893
51,197
Over shot Target
+ 11,197
VOLUNTEERS 36,147 43,948 49,008 Just short ‐ 98
FAMILIES 62,284 67,542 74,744Over Shot
Target + 4,744
STRATEGIC GROWTH
0
50000
100000
150000
200000
YEARS
REG
ISTE
RED
ATH
LETE
S
Plan Achieved
2005 2006 200920082007 2010 2011 20122004

Annual Report 2010 Page 27
STRATEGIC GROWTH – Dec 2010
15 BIG STATES STATES DISTRICTS S. No
State Districts Total Population
Total ID Population
Total Achieved
% Ach
Average ID Population
AverageAchieved
% Ach
1 Andhra 23 75,727,541 2,271,826 36097 1.59 98,775 1,569 1.592 Assam 23 12,850,608 385,518 12137 3.15 16,762 528 3.153 Bihar 37 82,878,726 2,486,362 78628 3.16 67,199 2,125 3.164 Delhi 9 13,782,976 413,489 35374 8.55 45,943 3,930 8.555 Gujarat 23 46,490,222 1,394,707 79289 5.68 60,639 3,447 5.686 Jharkhand 18 26,909,428 807,283 10849 1.34 44,849 603 1.347 Karnataka 27 52,823,961 1,584,719 45128 2.85 58,693 1,671 2.858 Kerala 14 31,838,619 955,159 86803 9.09 68,226 6,200 9.099 Maharashtra 35 97,152,127 2,914,564 42784 1.47 83,273 1,222 1.47
10 MP 45 61,015,118 1,830,454 61805 3.38 40,677 1,373 3.3811 Orissa 30 36,706,650 1,101,200 21935 1.99 36,707 731 1.9912 Rajasthan 32 56,473,122 1,694,194 31131 1.84 52,944 973 1.8413 Tamil Nadu 30 62,110,839 1,863,325 39653 2.13 62,111 1,322 2.1314 UP 70 166,052,859 4,981,586 66025 1.33 71,166 943 1.3315 West Bengal 18 80,221,171 2,406,635 46345 1.93 133,702 2,575 1.93 TOTAL 434 903,033,967 27,091,019 693983 2.56 62,422 1,599 2.56
16 MEDIUM/SMALL STATES STATES DISTRICTS 1 Arunachal 13 1,091,117 32,734 123 0.38 2,518 9 0.382 Chandigarh 5 900,914 27,027 650 2.40 5,405 130 2.403 Chattisgarh 16 20,785,956 623,579 9404 1.51 38,974 588 1.514 Goa 2 1,343,998 40,320 6445 15.98 20,160 3,223 15.985 Haryana 19 21,082,989 632,490 4236 0.67 33,289 223 0.676 Himachal 12 6,077,248 182,317 9607 5.27 15,193 801 5.277 Jammu 14 10,089,917 302,698 8146 2.69 21,621 582 2.698 Manipur 9 2,388,634 71,659 1335 1.86 7,962 148 1.869 Meghalaya 7 2,306,069 69,182 264 0.38 9,883 38 0.38
10 Mizoram 8 891,058 26,732 55 0.21 3,341 7 0.2111 Nagaland 8 1,988,636 59,659 130 0.22 7,457 16 0.2212 Pondicherry 4 973,829 29,215 1841 6.30 7,304 460 6.3013 Punjab 17 22,314,037 669,421 10656 1.59 39,378 627 1.5914 Sikkim 4 540,493 16,215 538 3.32 4,054 135 3.3215 Tripura 4 3,191,168 95,735 2056 2.15 23,934 514 2.1516 Uttaranchal 13 8,479,562 254,387 762 0.30 19,568 59 0.30 TOTAL 155 104,445,625 3,133,369 56248 1.80 20,215 363 1.80 GRAND TOTAL 589 1,007,479,592 30,224,388 750,231 2.48 82,637 1,962 2.48
Annual Report 2010 Page 28
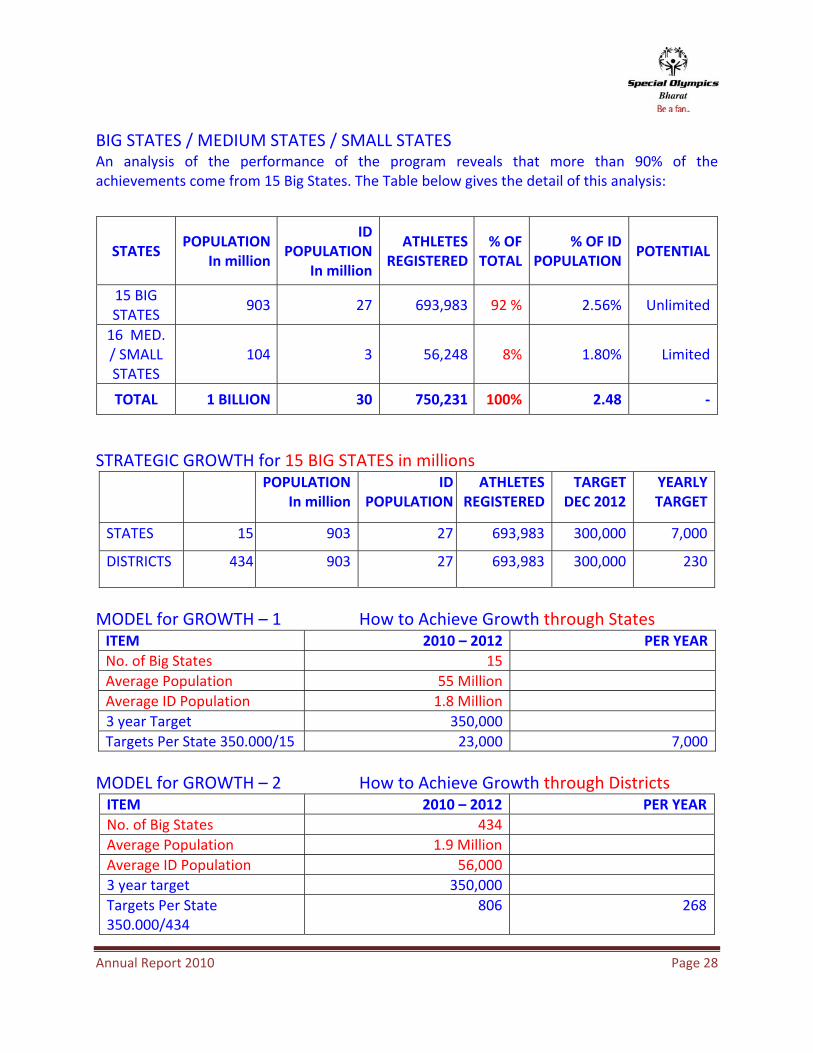
BIG STATES / MEDIUM STATES / SMALL STATES An analysis of the performance of the program reveals that more than 90% of the achievements come from 15 Big States. The Table below gives the detail of this analysis:
STRATEGIC GROWTH for 15 BIG STATES in millions POPULATION
In millionID
POPULATIONATHLETES
REGISTEREDTARGET
DEC 2012 YEARLYTARGET
STATES 15 903 27 693,983 300,000 7,000
DISTRICTS 434 903 27 693,983 300,000 230
MODEL for GROWTH – 1 How to Achieve Growth through States ITEM 2010 – 2012 PER YEARNo. of Big States 15Average Population 55 MillionAverage ID Population 1.8 Million3 year Target 350,000Targets Per State 350.000/15 23,000 7,000
MODEL for GROWTH – 2 How to Achieve Growth through Districts ITEM 2010 – 2012 PER YEARNo. of Big States 434Average Population 1.9 MillionAverage ID Population 56,0003 year target 350,000Targets Per State 350.000/434
806 268
STATES POPULATION
In million
ID POPULATION
In million
ATHLETES REGISTERED
% OF TOTAL
% OF ID POPULATION
POTENTIAL
15 BIG STATES
903 27 693,983 92 % 2.56% Unlimited
16 MED. / SMALL STATES
104 3 56,248 8% 1.80% Limited
TOTAL 1 BILLION 30 750,231 100% 2.48 ‐

Annual Report 2010 Page 29
ANNUAL COST OF ADMINISTRATION
ITEM DETAIL OF EXPENDITURE OPERATING
COSTSIN INR
OPERATING COSTS IN US $
SOURCE OF FUNDING
National Office
Wages Ops. Costs, Stipend, Uncovered exp.
90,00,000200,000
(CRG 150,000)
SOI 75 %SOB 25%
3 Regional Offices
Rs.50,000 per month for 12 month for 3 Regions
18,00,000 40,000 SOB 30 %States 70 %
31 State Offices
Rs.50,000 per month for 12 months for 31 States
1,86,00,000 413,333 SOB 50 %States 50 %
600 District Offices
Rss.10,000 per month for 12 months for 600 Districts
7,20,00,000 1,600,000 SOB 50 %States 50 %
TOTAL 10,14,00,0002,253,333
(CRG‐150,000)
SOI 6 %SOB 35 %States 59 %
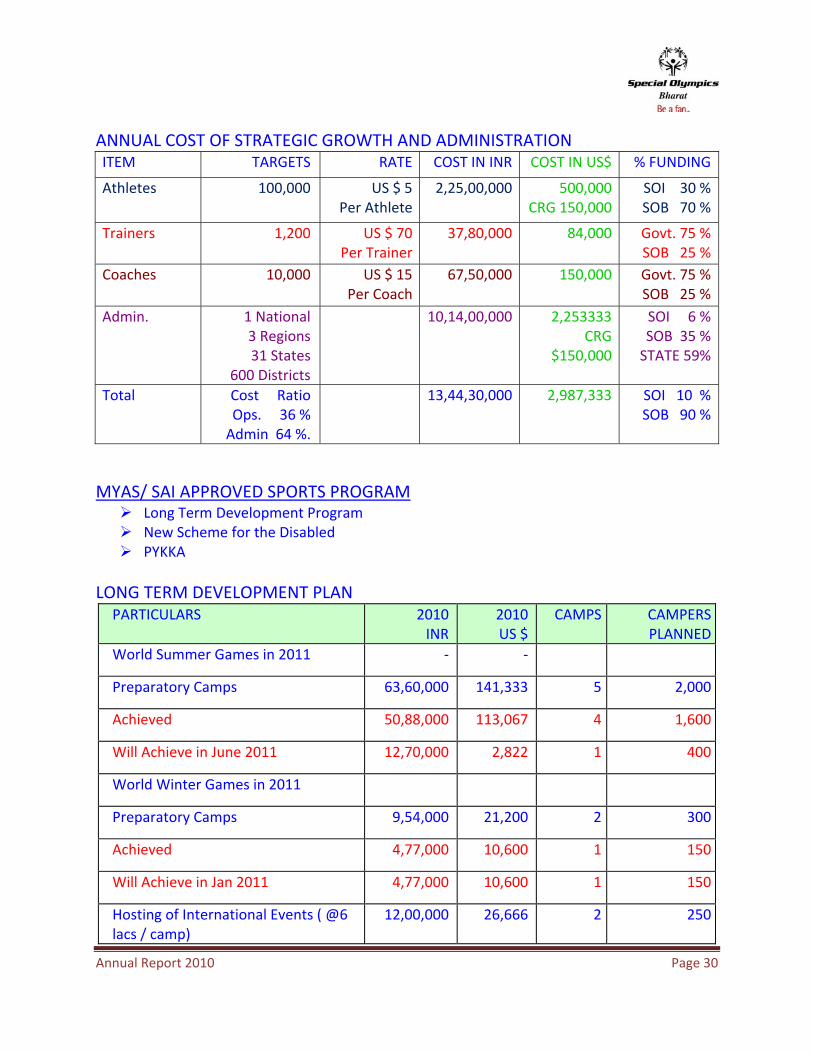
ANNUAL COST OF STRATEGIC GROWTH
ITEM NUMBERS RATE COST IN INR COST IN US $ % FUNDING
Athletes 100,000 US $ 5
Per Athlete2,25,00,000 500,000
SOI 30 %SOB 70 %
Trainers 1,200 US $ 70
Per Trainer37,80,000 84,000
Govt. 80 %SOB 20 %
Coaches 10,000 US $ 15
Per Coach67,50,000 150,000
Govt. 75 %SOB 25 %
Totals 3,30,30,000 734,000 Govt. 15 % SOI 20 % SOB 65 %
Annual Report 2010 Page 30
ANNUAL COST OF STRATEGIC GROWTH AND ADMINISTRATION ITEM TARGETS RATE COST IN INR COST IN US$ % FUNDING
Athletes 100,000 US $ 5Per Athlete
2,25,00,000 500,000 CRG 150,000
SOI 30 %SOB 70 %
Trainers 1,200 US $ 70Per Trainer
37,80,000 84,000 Govt. 75 %SOB 25 %
Coaches 10,000 US $ 15Per Coach
67,50,000 150,000 Govt. 75 %SOB 25 %
Admin. 1 National 3 Regions 31 States
600 Districts
10,14,00,000 2,253333 CRG
$150,000
SOI 6 %SOB 35 %STATE 59%
Total Cost Ratio Ops. 36 % Admin 64 %.
13,44,30,000 2,987,333
SOI 10 %SOB 90 %
MYAS/ SAI APPROVED SPORTS PROGRAM Long Term Development Program New Scheme for the Disabled PYKKA
LONG TERM DEVELOPMENT PLAN
PARTICULARS
2010INR
2010US $
CAMPS CAMPERS PLANNED
World Summer Games in 2011 ‐ ‐
Preparatory Camps 63,60,000 141,333 5 2,000
Achieved 50,88,000 113,067 4 1,600
Will Achieve in June 2011 12,70,000 2,822 1 400
World Winter Games in 2011
Preparatory Camps 9,54,000 21,200 2 300
Achieved 4,77,000 10,600 1 150
Will Achieve in Jan 2011 4,77,000 10,600 1 150
Hosting of International Events ( @6 lacs / camp)
12,00,000 26,666 2 250

Annual Report 2010 Page 31
* The major differences between budgeted and achieved are due to the holding of National Coaching Camps on a Regional basis. This cuts the cost of travel significantly.
Achieved
Will Achieve in Jan 2011 6,00,000 13,333 1 250
National Coaching Camps 5,59,68,000 1,243,733 44 17,600
Achieved 3,04,00,000 675,555 38 15,580
Will Achieve by Mar 2011 48,00,000 106,667 6 2,400
National Championship – Athletics (@6 lacs)
12,00,000 26,666 2 1,800
Achieved 21,00,000 46,667 1 1,200
Will Achieve in Mar 2011 12,00,000 26,666 1 1,200
National Championship – Others (@4 lacs. / camp)
12,00,000 26,666 3 2,400
Achieved 13,50,000 30,000 3 2,000
Advance Coaches Training Camps 37,62,000 83,600 15 825
Achieved 17,50,000 38,889 10 558
Will Achieve by Mar 2011 8,75,000 19,444 5 267
SSA Training OF Coaches 30,00,000 66,667 100 5,000
Achieved NOT APPROVED
P.G. Diploma RVM University (@ 4.35 lacs / camp)
4,35,000 9,667 1 30
Achieved 4,35,000 9,667 1 30
Games Management System 15,75,000 35,000 9 495
Achieved 10,50,000 23,333 6 330
Will Achieve by Mar 2011 5,25,000 1,167 3 165
TOTAL ( US $ 58/ Rs.2610 per Ath) ACHIEVED
7 ,26,54,0005,23,97,000
1,614,5311,128,477
83 82
25,70026,280
Annual Report 2010 Page 32
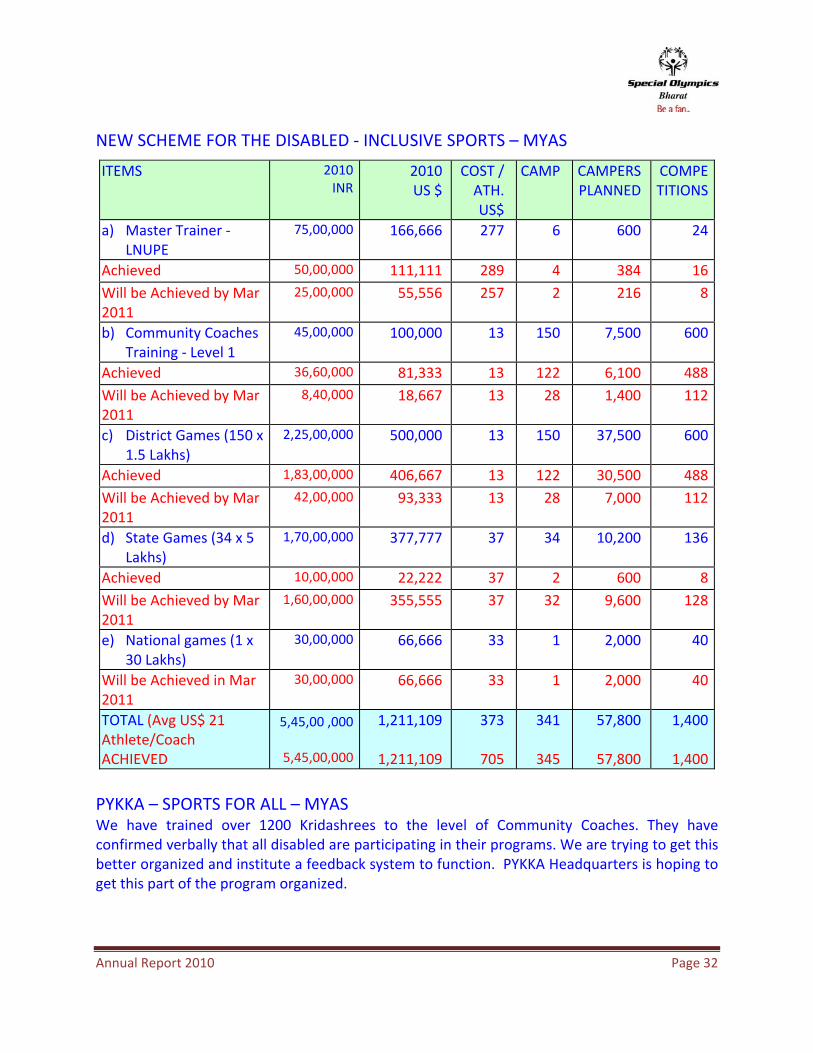
NEW SCHEME FOR THE DISABLED ‐ INCLUSIVE SPORTS – MYAS
PYKKA – SPORTS FOR ALL – MYAS We have trained over 1200 Kridashrees to the level of Community Coaches. They have confirmed verbally that all disabled are participating in their programs. We are trying to get this better organized and institute a feedback system to function. PYKKA Headquarters is hoping to get this part of the program organized.
ITEMS 2010INR
2010US $
COST / ATH. US$
CAMP CAMPERS PLANNED
COMPETITIONS
a) Master Trainer ‐ LNUPE
75,00,000 166,666 277 6 600 24
Achieved 50,00,000 111,111 289 4 384 16Will be Achieved by Mar 2011
25,00,000 55,556 257 2 216 8
b) Community Coaches Training ‐ Level 1
45,00,000 100,000 13 150 7,500 600
Achieved 36,60,000 81,333 13 122 6,100 488Will be Achieved by Mar 2011
8,40,000 18,667 13 28 1,400 112
c) District Games (150 x 1.5 Lakhs)
2,25,00,000 500,000 13 150 37,500 600
Achieved 1,83,00,000 406,667 13 122 30,500 488Will be Achieved by Mar 2011
42,00,000 93,333 13 28 7,000 112
d) State Games (34 x 5 Lakhs)
1,70,00,000 377,777 37 34 10,200 136
Achieved 10,00,000 22,222 37 2 600 8Will be Achieved by Mar 2011
1,60,00,000 355,555 37 32 9,600 128
e) National games (1 x 30 Lakhs)
30,00,000 66,666 33 1 2,000 40
Will be Achieved in Mar 2011
30,00,000 66,666 33 1 2,000 40
TOTAL (Avg US$ 21 Athlete/Coach ACHIEVED
5,45,00 ,000
5,45,00,000
1,211,109
1,211,109
373
705
341
345
57,800
57,800
1,400
1,400

Annual Report 2010 Page 33
PLAN ITEMS INR
US $
Cost per Ath
US$CAMPERS
COMPETITION
Blocks Level 1,50,00,000 333,334 3 125,000 125,000
District Level 1,00,00,000 222,224
State Level 50,00,000 111,112
TOTALS 3 US $ per Athlete
3,00,00,000 666,670 3.00 125,000 125,000
SUMMARY OF GOVERNMENT SPONSORED SPORTS SCHEMES ‐ BUDGET UTILIZATION ITEMS Budget
INR Utilized
INR Utilizat
ion Rate
Budget In US$
Utilized In US$
Cost per
AthleteLTDP 7,26,54,000 5,23,97,000 72 % 1,614,531 1,128,477 72
New Scheme
5,45,00 ,000
5,45,00,000 100 % 1,211,109 1,211,109 100 %
PYKKA 3,00,00,000 24,500 0.01 666,670 544 0.01 %
Others
Totals 15,71,54,000 10,69,21,500 68 % 3,492,310 2,340,130 68 %
REGIONAL GAMES One Regional Games was held in Jamshedpur
ITEM N0. OF CAMPS
NO. FO DAYS ATHLETES OTHERS TOTALCAMPERS
Planned 1 10 1,500 500 2,000
Achieved 1 10 1,200 400 1,600
Annual Report 2010 Page 34
NATIONAL EVENTS FUNDED UNDER LONG TERM DEVELOPMENT PLAN (LTDP) 2010
NATIONAL CHAMPIONSHIP National Championships in 20 games were held during 2008 and 2009. All 31 States participated. The final National Games, in 21 Athletic Disciplines, was held in Anantapur in Andhra Pradesh, January 2010. Athletes and Coaches from 23 States Participated. The GMS was used for the Championship. Mr. Reuben from SOI supervised the operation of the GMS by our Coaches and was pleased by their performance
Item N0. of Camps
No. of Days
Athletes Others Total Campers
Budget Actual Spent
Planned 1 10 1,500 500 2,000 12,00,000 ‐
Achieved 1 10 1,200 400 1,600 ‐ 21,00,000
SELECTION COMMITTEE FOR THE WORLD SUMMER GAMES Selection Committee was formed as per the guide lines laid down by SAI. Air Marshal S. K. Malik, a Trustee of SOB and the President of the Delhi State Chapter of SOB was appointed as the Chairman. He was assisted by Mr. Victor Vaz, a Trustee of SOB, the National Coach appointed representatives of SOAP, experienced Trainers / Coaches and Games Specialists from SAI. The Selection Committee short listed 650 Athletes and 100 Trainer / Coaches. These probable Athletes attended the six Preparatory Camps planned for 2010 where the final selection was carried out. The selection was based on performance, Quotas, equitable State

Annual Report 2010 Page 35
wise distribution and some special requirements. Stand byes were nominated for all games to ensure that if there were any drop outs, the replacements were appointed from the prepared list in seniority. The Indian Delegation, selected to represent India in the World Summer Games in Athens in July 2011, is given below. Additional Training Camps will be held in 2011 before the delegation leaves for Athens. HOD Air Marshal Ashok Goel Asst. Mrs. Sugandha Sukrutaraj National Coach Mr. Victor Vaz Athletes Trainers / Coaches Total Delegation 254
PREPARATORY CAMP Six preparatory Camps were approved during 2010 during which the final team for the World Summer Games was carried out. PONDICHERRY

Annual Report 2010 Page 36
HYDERABAD
ROHTAK To be held in 2011
DELHI To be held in 2011

Annual Report 2010 Page 37
NATIONAL COACHING CAMPS – 2010
NORTH AND CENTRAL ITEM NO. OF
CAMPS GAMES ATHLETES OTHERS TOTAL BUDGET
IN CR. RS.
PARTICIPATION %
Planned 18 10 5,760 1,440 7,200 1.44 100
Achieved 18 10 5,760 1,440 7,200 1.44 100
EAST AND NORTH EAST ITEM NO. OF
CAMPS GAMES ATHLETES OTHERS TOTAL BUDGET
IN CR. RS.
PARTICIPATION %
Planned 16 7 5,120 1,280 6,400 1.28 100
Achieved 16 7 5,120 1,280 6,400 1.28 100
SOUTH AND WEST ITEM NO. OF
CAMPS GAMES ATHLETES OTHERS TOTAL BUDGET
IN CR. RS.
PARTICIPATION %
Planned 10 8 3,200 800 4,000 0.80 100
Achieved 10 8 3,200 800 4,000 0.80 100
NATIONAL COACHING CAMPS REGION-WISE
0
5
10
15
20
North & Central East & N east South & WestREGIONS
Number of Camps
18 16 10

Annual Report 2010 Page 38
SUMMARY ITEM NO. OF
CAMPS GAMES ATHLETES OTHERS TOTAL BUDGET
IN CR RS. PARTICIPATION
%
Planned 44 25 14,080 3,520 17,600 3.52 100
Achieved 44 25 14,080 3,520 17,600 3.52 100
One group of Cricket Athletes working Second group of Cricket Athletes working on wake‐up exercise at Solan, HP on wake‐up exercise at Solan, HP
Third group of Athletes working on wake –up Fourth Group of Athletes on wake‐up exercise at Mysore, Karnataka. exercise at National Coaches Camp
Awareness rally about Rights of Special NCC‐ Athletics was declared Open by District Athletes with National Coaching Camp Collector of Ajmer district, Rajasthan

Annual Report 2010 Page 39
Resource Persons are briefing to state Campers are enjoying the tasty, Nutritious Coaches about the program & schedule of and healthy food (South zone) particular NCC.
Spl Athlete is getting coaching from SOB Spl Athlete is getting coaching from SOB coach in East & North East region coach in North & Central region NATIONAL COACHING CAMP BAREILLY – LAW ENFORCEMENT TORCH RUN

Annual Report 2010 Page 40

Annual Report 2010 Page 41
TRAIN THE TRAINER COURSES POLICY 2010 witnessed the biggest Train the Trainer program ever undertaken by SOB. This stemmed from a major change in Govt. Policy .The Govt. embarked on a massive scheme for the introduction of inclusive Sports in the Rural Area through (PYKKA and the New Scheme for the Disabled) Realizing that Special Olympics Bharat is best organized and structured to carry out this program for all the disabled, the Govt. appointed SOB as the Nodal Agency for the execution of the scheme To meet this requirement, SOB had to re‐cast its requirement of trainers and Coaches to meet this new requirement.
These are:‐ 2007‐08‐ PLAN – FOR ID ATHLETES Train the Trainer Courses for the Special Olympics Program – Advanced Coaches Training Courses
(ACTC’S) through International Inspiration 2009‐10 REVISED PLANS – FOR ID PROGRAM AND ALL DISABLED PROGRAM
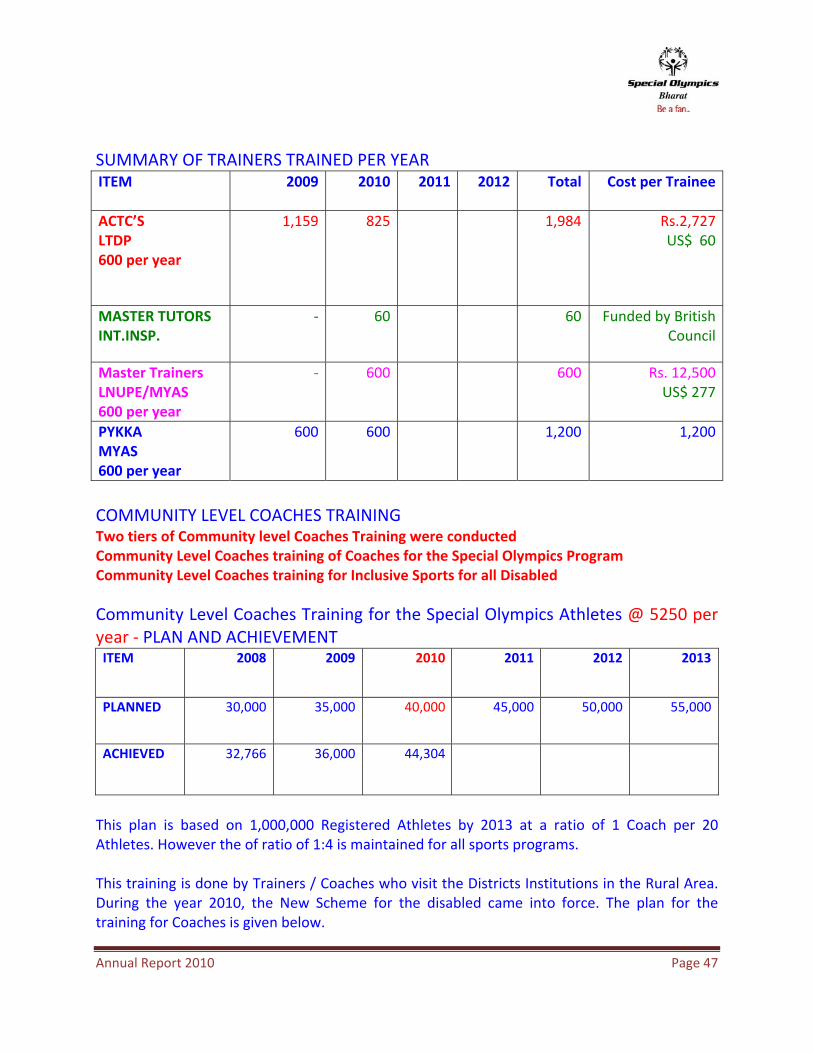
SUMMARY OF TRAINERS TRAINED PER YEAR ITEM 2009 2010 2011 2012 TOTAL COST PER
TRAINEE
ACTC’Sfor ID only LTDP 600 per year
1,159 825
1,984 Rs.2,727
US$ 60MASTER TUTORS INT.INSP. for All Disabled
‐ 60
60 Funded by British
CouncilMaster Trainers LNUPE/MYAS 600 per year
‐ 600
600 Rs. 12,500
US$ 277PYKKA MYAS 600 per year
600 600
1,200 1,200
Train the Trainer Courses for Inclusive Programs involving all disabled, through three programs. This is in addition to the 2007 Plan a) Master Tutors –Specialized courses run by experienced specialist from the British
Council b) Master Trainers Courses organized in the LNUPE by the MYAS for all Disabled c) Community Level Training Courses for the Kridashrees for all ,including Districts

Annual Report 2010 Page 42
ADVANCED COACHES TRAINING COURSES – FOR ID ATHLETES AND COACHES This course was initiated by UK Sports under the International Inspiration Scheme These courses have been conducted since 2007 and were planned to develop a cadre of Trainers the
Trainers for the Special Olympics Program. They are courses of excellence and lead to high quality training of Coaches and in turn, Athletes. The courses were fully developed, over the years, with the support of the MYAS and specialist arranged by U K Sports. The training schedule is supported by a comprehensive Coaches Manual which is issued to all Coaches .This program caters mainly for the requirements of the Special Olympics Program ID Athletes. Planned and Achieved @ 600 per year ITEM 2009 2010 2011 2012 2013 2014
PLANNED 600 per year
1,200 1,800 2,400 3,000 3,600 4,200
ACHIEVED 1,159 1,984
TRAINING COST SAI Grant per Camp Rs.1.5 lakh, SOB Balance Duration Seven days No. of Trainees 50 No. of Resource Personnel 10 Training cost per Trainee Rs.2,500/‐ US $ 55 per Trainer
Annual Report 2010 Page 43
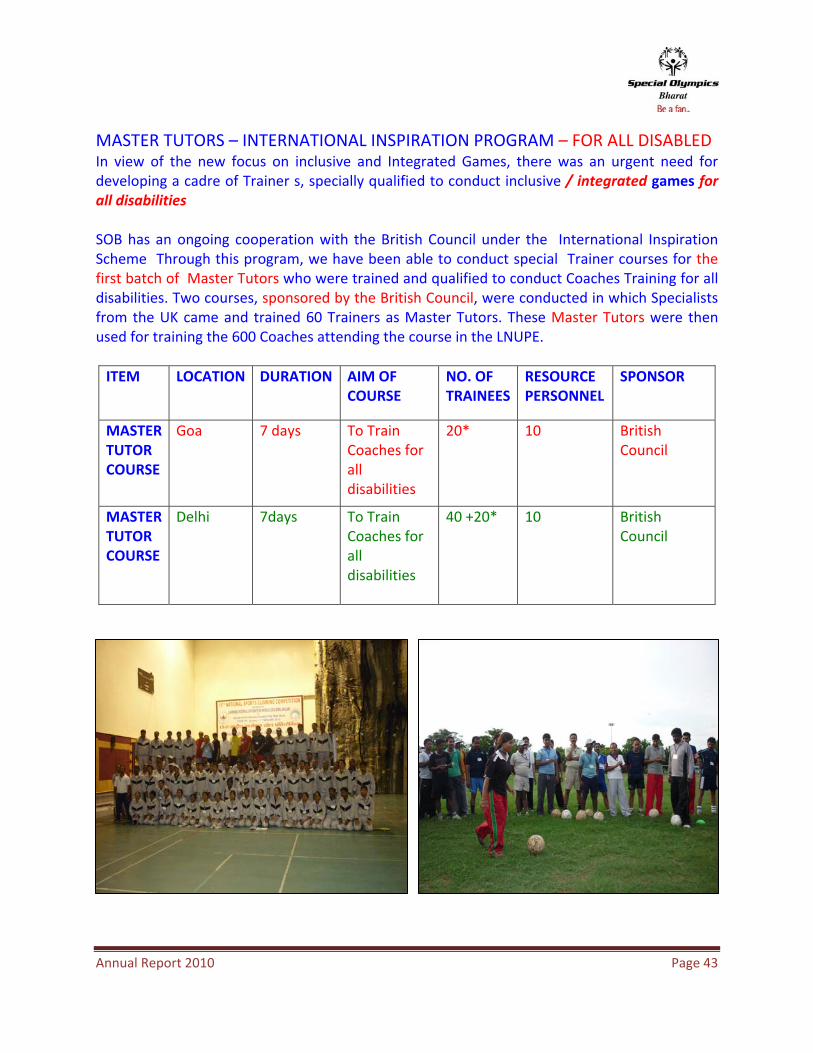
MASTER TUTORS – INTERNATIONAL INSPIRATION PROGRAM – FOR ALL DISABLED In view of the new focus on inclusive and Integrated Games, there was an urgent need for developing a cadre of Trainer s, specially qualified to conduct inclusive / integrated games for all disabilities SOB has an ongoing cooperation with the British Council under the International Inspiration Scheme Through this program, we have been able to conduct special Trainer courses for the first batch of Master Tutors who were trained and qualified to conduct Coaches Training for all disabilities. Two courses, sponsored by the British Council, were conducted in which Specialists from the UK came and trained 60 Trainers as Master Tutors. These Master Tutors were then used for training the 600 Coaches attending the course in the LNUPE. ITEM LOCATION DURATION AIM OF
COURSE NO. OF TRAINEES
RESOURCE PERSONNEL
SPONSOR
MASTER TUTOR COURSE
Goa 7 days To Train Coaches for all disabilities
20* 10 British Council
MASTER TUTOR COURSE
Delhi 7days To Train Coaches for all disabilities
40 +20* 10 British Council

Annual Report 2010 Page 44
MASTER TRAINERS COURSE FOR INCLUSIVE / INTEGRATED SPORTS – FOR ALL DISABLED For this Course, the Govt. established a series of courses in the LNUPE Gwalior (Apex Sports College of Excellence) to train 600 Special Olympics Trainers / Coaches in the year 2010, to supervise and train Coaches to conduct inclusive / integrated Sports, for all disabilities.
COURSE NO.
LOCATION NO OF DAYS
DATE OF COURSE TRAINEES RESOURCE PERSONNEL
ACHIEVED
1 LNUPE 7 20 – 24 July 100 20 84
2 LNUPE 7 26 – 30 August 100 20 100
3 LNUPE 7 3 – 8 September 100 20 100
4 LNUPE 7 3 ‐8 October 100 20 100
5 LNUPE 7 4 ‐8 January 2011 100 20 108
6 LNUPE 7 18 – 22 January 2011 100 20 108
Totals 600 600

Annual Report 2010 Page 45
DEVELOPMENT OF TRAINING RESOURCES FOR ALL DISABILITY Regional and National trainers from Special Olympics Bharat developed fresh training resources for its new role as Nodal agency for all disability. These resources are being used for training of 7500 community coaches at selected 150 districts in India. The courseware was developed with help of All India Sports Council for Deaf, Paraswim India and International Experts like Ken Black from British Council. A new series of Physical Education cards named as “PEC – Ability” were developed by British Council for the inclusive program for children with special needs. The resource team included Mr. Thomas Pires and Ms. Sulekha Rana from Special Olympics Bharat.
Annual Report 2010 Page 46
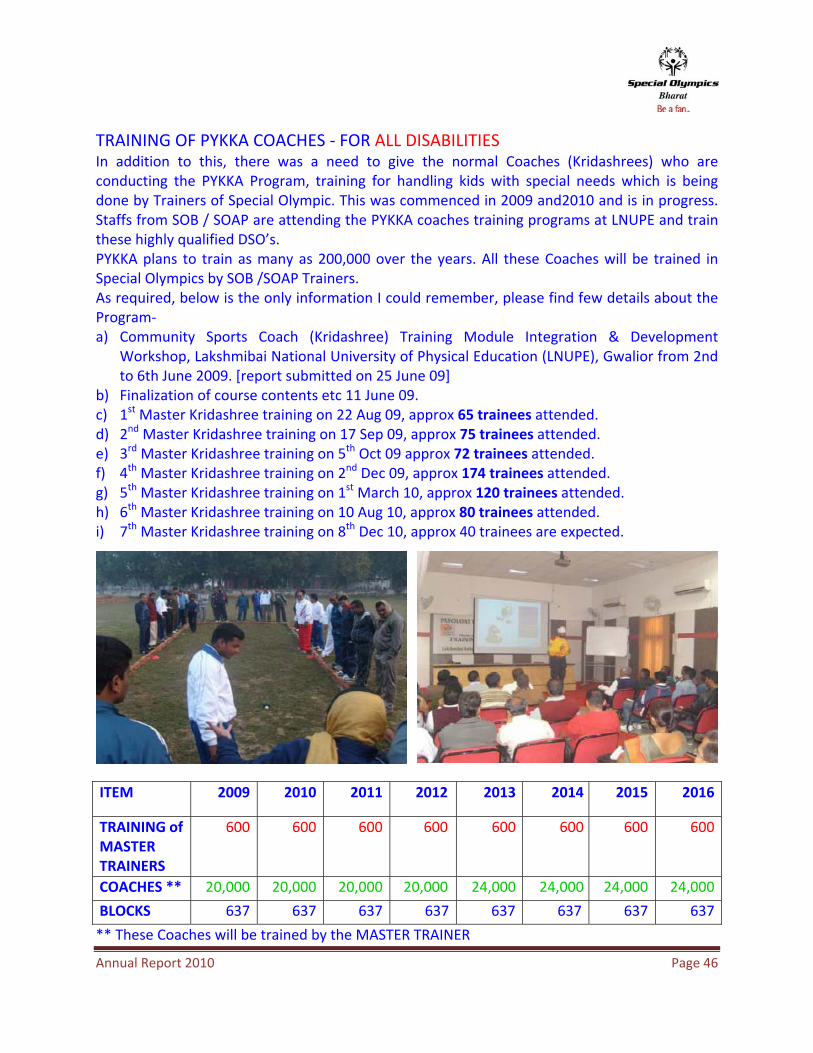
TRAINING OF PYKKA COACHES ‐ FOR ALL DISABILITIES In addition to this, there was a need to give the normal Coaches (Kridashrees) who are conducting the PYKKA Program, training for handling kids with special needs which is being done by Trainers of Special Olympic. This was commenced in 2009 and2010 and is in progress. Staffs from SOB / SOAP are attending the PYKKA coaches training programs at LNUPE and train these highly qualified DSO’s. PYKKA plans to train as many as 200,000 over the years. All these Coaches will be trained in Special Olympics by SOB /SOAP Trainers. As required, below is the only information I could remember, please find few details about the Program‐ a) Community Sports Coach (Kridashree) Training Module Integration & Development
Workshop, Lakshmibai National University of Physical Education (LNUPE), Gwalior from 2nd to 6th June 2009. [report submitted on 25 June 09]
b) Finalization of course contents etc 11 June 09. c) 1st Master Kridashree training on 22 Aug 09, approx 65 trainees attended. d) 2nd Master Kridashree training on 17 Sep 09, approx 75 trainees attended. e) 3rd Master Kridashree training on 5th Oct 09 approx 72 trainees attended. f) 4th Master Kridashree training on 2nd Dec 09, approx 174 trainees attended. g) 5th Master Kridashree training on 1st March 10, approx 120 trainees attended. h) 6th Master Kridashree training on 10 Aug 10, approx 80 trainees attended. i) 7th Master Kridashree training on 8th Dec 10, approx 40 trainees are expected.
ITEM 2009 2010 2011 2012 2013 2014 2015 2016
TRAINING of MASTER TRAINERS
600 600 600 600 600 600 600 600
COACHES ** 20,000 20,000 20,000 20,000 24,000 24,000 24,000 24,000
BLOCKS 637 637 637 637 637 637 637 637
** These Coaches will be trained by the MASTER TRAINER
Annual Report 2010 Page 47
SUMMARY OF TRAINERS TRAINED PER YEAR ITEM 2009 2010 2011 2012 Total Cost per Trainee
ACTC’S LTDP 600 per year
1,159 825 1,984 Rs.2,727US$ 60
MASTER TUTORS INT.INSP.
‐ 60 60 Funded by British Council
Master Trainers LNUPE/MYAS 600 per year
‐ 600 600 Rs. 12,500US$ 277
PYKKA MYAS 600 per year
600 600 1,200 1,200
COMMUNITY LEVEL COACHES TRAINING Two tiers of Community level Coaches Training were conducted Community Level Coaches training of Coaches for the Special Olympics Program Community Level Coaches training for Inclusive Sports for all Disabled
Community Level Coaches Training for the Special Olympics Athletes @ 5250 per year ‐ PLAN AND ACHIEVEMENT ITEM 2008 2009 2010 2011 2012 2013
PLANNED 30,000 35,000 40,000 45,000 50,000 55,000
ACHIEVED 32,766 36,000 44,304
This plan is based on 1,000,000 Registered Athletes by 2013 at a ratio of 1 Coach per 20 Athletes. However the of ratio of 1:4 is maintained for all sports programs. This training is done by Trainers / Coaches who visit the Districts Institutions in the Rural Area. During the year 2010, the New Scheme for the disabled came into force. The plan for the training for Coaches is given below.

Annual Report 2010 Page 48
COMMUNITY COACHES TRAINING PLAN FOR 2010 FOR THE NEW SCHEME FOR THE DISABLED NEW SCHEME FOR THE DISABLED – COACHES TRAINING LEVELS 2010 2011 2012 2013NO. OF DISTRICTS 150 300 450 600LEVEL – 1 COMMUNITY COACHES 7,500 7,500 7,500 7,500LEVEL – 2 DISTRICT COACHES 7,500 7,500 7,500LEVEL – 3 STATE COACHES 7,500 7,500LEVEL – 4 NATIONAL COACHES 7,500TOTALS 7,500 15,000 22,500 30,000
BUDGETARY ALLOTMENT IN LAKHS
45.00 90.00 135.00 180.00
180.00 630.00
IN US $
100,000 200,000 300,000 400,000
400,000 1,400,000
COMMUNITY COACHES TRAINING ACHIEVED LEVELS 2010 2011 2012 2013 2014
NO. OF DISTRICTS 150 300 450 600 600Level ‐ 1 Community Level 7,500
LEVEL – 2 District Level
LEVEL – 3 State LEVEL
LEVEL – 4 National Level
TOTALS 7,500
SUMMARY OF COMMUNITY LEVEL COACHES Item 2009 2010 2011 2012 2013 2014
Coaches for SOB
36,000 44,304
Coaches for all the Disabled
7,500

Annual Report 2010 Page 49
GAMES MANAGEMENT SYSTEM The GMS was used for all Sports Events for both Athletes and Coaches. Mr. Reuben, who has been training our Staff on the use if the system attended the National Games at Anantapur, Andhra Pradesh and was pleased at the progress made by the team operating the GMS for the event. The registration of Athletes and Coaches is progressing steadily. An experienced Coach has now been employed full time to look after the registration of coaches on the GMS. Difficulty is being experienced getting the data of the older Coaches from the States as many have either been transferred or left the system. The Coaches Program has now become complicated due to the divers training opportunities and schedules which have come into force and the new responsibilities to conduct of Inclusive games for all the disabled. The current state of registration as on Dec 2010 given below ITEM REGISTERED ENTERED ON THE
GMS IN PROCESS AWAITING DATA
Athletes 750,231 441,690 263,541 45,000
Trainers 2,685 2,685 ‐ ‐
Coaches 44,304 26,892 17,412 ‐
TRAININGS CARRIED OUT IN 2010 ITEM CAMPS REGION BASIC /
ADVANCEDTRAINEES OTHERS TOTAL AMOUNT
GMS 3 North All 150 15 165 4.5 Lakh
GMS 3 South All 150 15 165 4.5 Lakh
GMS 3 East All 150 15 165 4.5 Lakh
Total 13.5lakh/US$30,000
Cost Per Trainee Rs.2,700/‐ US$ 60 / ‐

Annual Report 2010 Page 50
PLAN FOR 2011 REGION STATE VENUE DATE REMARKS
NORTH &NORTH EAST
BIHAR 16‐19 FEBRUARY
2011 Confirmed
ASSAM JANUARY 2011
WEST BENGAL KOLKATA FEBRUARY 2011
NORTH & CENTRAL
HIMACHAL PRADESH
SHIMLA B14TH‐19TH
DECEMBER 2010 Confirmed
DELHI ST.MARY’S Confirmed
UTTAR PRADESH JANUARY 2011
WEST & SOUTH
ANDHRA PRADESH
ANANTAPUR 4TH‐9TH
JANUARY2011 Confirmed
TAMILNADU COIMBATORE 14TH ‐18TH January
2011
Not yet confirmed
GOA PANJIM MARCH 2011 Confirmed
POST GRADUATE DIPLOMA COURSE

Annual Report 2010 Page 51
STATE / DISTRICT GAMES
DISTRICT EVENTS STATE BIG STATES
NO. OF DISTRICT
DISTRICT GAMES
DISTRICT EVENTS
No of SCHOOLS /INSTITUTIONS ACTIVE IN SO
TOTAL NO. OF CAMPERS
Andhra 23 320 320 100 16,000Assam 23 140 130 60 7,000Bihar 37 630 630 175 31,500Delhi 9 119 130 35 5,950Gujarat 23 300 300 125 15,000Jharkhand 18 144 130 60 7,200Karnataka 27 360 310 100 18,000Kerala 14 168 180 70 11,760Maharashtra 35 325 325 125 16,250M P 45 525 530 175 26,250Orissa 30 120 80 120 6,000Rajasthan 32 425 430 125 21,250Tamil Nadu 30 300 300 125 15,000

Annual Report 2010 Page 52
UP 70 1,140 1,145 300 57,000West Bengal 18 210 225 125 10,500TOTAL 434 5,226 5,165 1,820 264,660Small / Medium States
No. of District
District Games
District Events
N. of Schools / Institutions Active in SO
Total No. of Campers
Arunachal 13 6 3 6 110Chandigarh 5 10 10 10 400Chattisgarh 16 168 170 60 8,400Goa 2 18 18 10 1,200Haryana 19 25 27 25 1,250Himachal 12 150 155 75 7,500J & K 14 15 17 15 750Manipur 9 20 20 25 800Meghalaya 7 6 6 12 180Mizoram 8 0 0 0 0Nagaland 8 1 1 2 80Pondicherry 4 2 2 5 100Punjab 17 84 88 35 2,940Sikkim 4 1 1 2 65Tripura 4 2 2 5 125Uttaranchal 13 0 0 0 0TOTAL 155 508 520 287 23,900GRAND TOTAL 589 5,734 5,685 2,107 288,560
STATE GAMES STATE BIG STATES
STATE GAMES
STATE EVENTS TOTAL ATHLETE /COACHES
PARTICIPATION
OTHER ACTIVITY SCHOOLS / INST
Andhra Pradesh 15 9 2,800 112Assam 7 3 1,600 64Bihar 15 12 4,250 170Delhi 13 9 2,550 102Gujarat 10 8 4,350 174Jharkhand 5 2 1,300 52Karnataka 11 4 1,050 42Kerala 10 10 2,850 114Maharashtra 10 7 3,100 124M P 12 12 1,960 78Orissa 4 950 38Rajasthan 12 5 3,200 128Tamil Nadu 6 3 1,550 62UP 15 12 3,600 144
Annual Report 2010 Page 53
West Bengal 13 5 3,450 138TOTAL 158 101 38,560 1,542SMALL / MEDIUM STATES
STATE GAMES
STATE EVENTS TOTAL ATHLETE /COACHES
PARTICIPATION
OTHER ACTIVITYSCHOOLS /
INSTITUTIONSArunachal Pradesh 0 0 0 0Chandigarh 2 0 165 7Chattisgarh 7 5 260 10Goa 8 5 1,450 58Haryana 5 2 1,600 64Himachal Pradesh 12 7 1,480 59Jammu & Kashmir 1 1 450 18Manipur 0 0 0 0Meghalaya 0 0 0 0Mizoram 0 0 0 0Nagaland 1 1 100 4Pondicherry 4 1 800 32Punjab 5 2 1,500 60Sikkim 1 0 160 6Tripura 1 1 150 6Uttaranchal 0 0 450 18TOTAL 47 25 8,565 343GRAND TOTAL 205 126 47,125 1,885 OTHER ACTIVITIES YOUNG ATHLETES PROGRAMS Item No, of
Camps N0. of Children
Resource Personnel
Sponsor Budget for Camp
Actual Equipment Remarks
Planned 5
Athletes 500 Teachers 50
Harpreet Singh, Mukta N. Thind, SO Delhi Team
UNICEF 370,000 Continue Program till Mar 2011
YA Kits, YA Manuals, LCD Screen
The Program is for 10 Delhi Districts
Achieved 5+1 in Assam
Athletes 525, Teachers 37, 1 Young Athlete demonstration with 25 Athletes and 9 Teachers
Harpreet Singh
SOB / SOI
YA Kits Assam YA Program was with Family Forum part

Annual Report 2010 Page 54
HEALTHY ATHLETES PROGRAM HA Plan for 2010 – Lions Club, etc.
Item No. 0f Camps Athletes Cause of Shortfall
Costing(USD)
Planned 43 Camps 17,500 157,247.7Achieved 16 Camps 5368 57,236.37Shortfall 27 Camps Breakdown 100,011
ACTUAL FOR 2010
S. No
STATE DATE PROGRAM NO OF
ATHLETES SCREENED
REFERRED FOR FURTHER TREATMENT
NO OF DOCTOR
NO OF VOLUNTEER
1 Gujarat Jan 2‐5, 2010 Opening Eyes 901 135 15 39
2 Jammu 21‐Mar‐10 MED FEST 234 Nil 50 30
3 Mumbai (Lotus Pilot Project)
Mar 25‐25, 2010
Opening Eyes 304 148 35 11

Annual Report 2010 Page 55
4 Chirwa (Rajasthan)
10‐Apr‐10 Special Smiles
137 96 5 30
5 Hajipur (Bihar)
Apr 21‐22, 2010
Opening Eyes 460 Nil 15 35
6 Guwahati May 8‐9, 2010 Fit Feet 247 111 23 50
7 Chennai
Aug 10‐11 TTT (Opening
Eyes) 51 Nil Nil 16
8 Nagpur (Maharashtra)
25‐Aug MED FEST 180 75 30 50
9 Bhagalpur (Bihar)
Sep 25‐26 Special Smiles
432 59 30 50
Fit Feet 432 30 50
10 Dibrugarh (Assam)
Oct 25‐26 Opening Eyes 150
11 Jammu 31‐Oct Special Smiles
240
12 Howrah (West Bengal)
December 11‐12
Opening Eyes & Fit Feet
300
13 Jodhpur (Rajasthan)
December 27‐28
Fit Feet 300
14 Madhubani (Bihar)
December 27‐29
Opening Eyes& Special
Smiles 1000
Totals 5,368 233 361

Annual Report 2010 Page 56
August 10: The event started with a training session. All 16 trainees attended the session conducted by Sandra Block and Susan Danberg. The program dealt with the technicalities in conducting an Opening Eyes Screening.
Annual Report 2010 Page 57
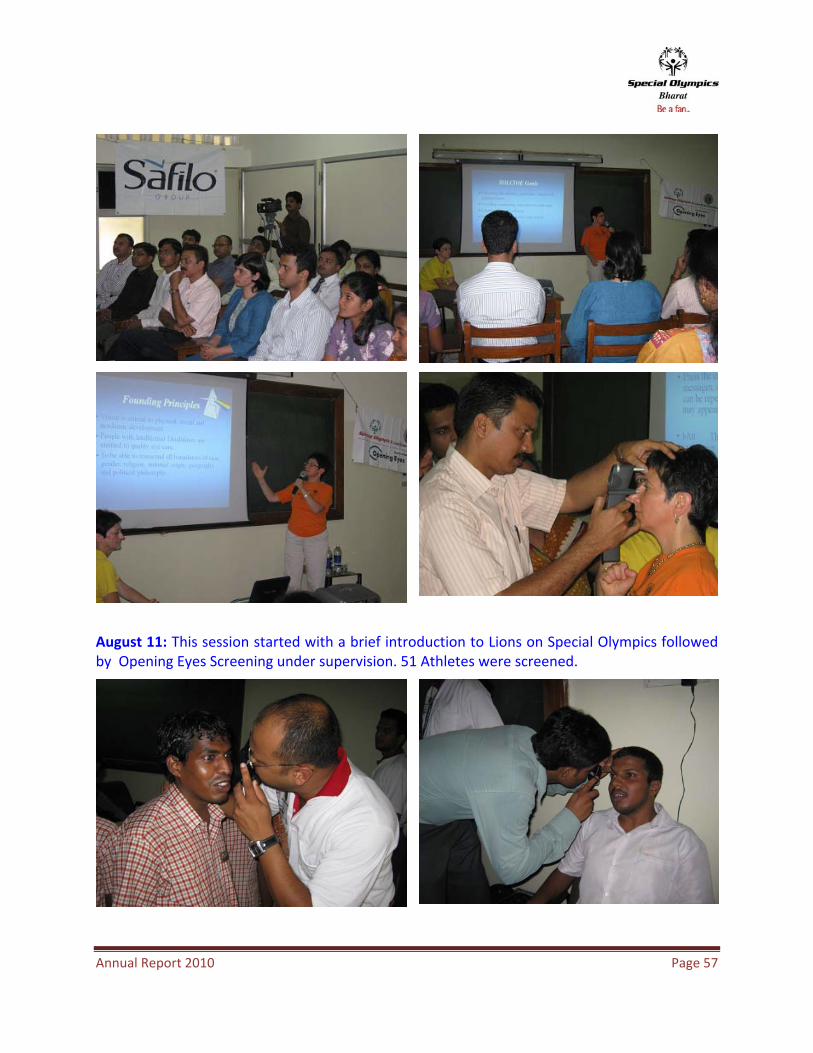
August 11: This session started with a brief introduction to Lions on Special Olympics followed by Opening Eyes Screening under supervision. 51 Athletes were screened.

Annual Report 2010 Page 58
At the end of the Program, the Susan Danberg and Sandra Block were felicitated.
HA PLAN FOR 2011 – LIONS CLUB, ETC Item No. 0f Camps Athletes Cause of
Shortfall Costing(USD)
Planned 43 Camps 13,600 195930
PLAN FOR 2011 Sl no States City Programs Dates
No. of Athletes
Requested Budget(US$)
1 Gujarat Mehsana Opening Eyes Jan 2‐5 1,200 9,930
2 Andhra Pradesh HyderabadHealth
Promotion Jan 8‐9 500 7,5003 Maharashtra Mumbai Special Smiles Jan 18‐19 300 4,5004 Andhra Pradesh Hyderabad Opening Eyes Feb 5‐6 300 4,500
5 Karnataka BangaloreHealth
Promotion Feb 10‐11 300 4,500

Annual Report 2010 Page 59
6 Jharkhand Jamshedpur Opening Eyes Feb 13‐14 300 4,5007 Orissa Bhubaneshwar Opening Eyes Feb 17‐18 300 4,5008 Gujarat Ahmadabad Special Smiles Feb 24‐25 300 4,5009 Assam Guwahati Special Smiles Mar 1‐2 300 4,50010 Karnataka Mysore MED FEST Mar 1‐2 300 4,50011 Delhi New Delhi Opening Eyes Mar 5‐6 300 4,50012 Tamil Nadu Chennai Opening Eyes Mar 14‐15 300 4,50013 Kerala Cochin Fun Fitness Mar 28‐29 300 4,500
14 Maharashtra Mumbai Opening EyesMar 18‐19, 2010 300 4,500
15 Karnataka Bangalore Opening Eyes Apr 4‐5 300 4,50016 Delhi New Delhi Fit Feet 9‐Apr 300 4,50017 Assam Guwahati MED FEST Apr 12‐13 300 4,500
18 Pondicherry PondicherryHealth
Promotion Apr 19‐20 300 4,50019 Sikkim Gangtok Opening Eyes apr 23‐24 200 3,00020 Madhya Pradesh Bhopal Special Smiles 25‐Apr 300 4,50021 Delhi New Delhi Special Smiles 28‐Apr 300 4,500
22 Gujarat BarodaHealth
Promotion May 2‐3 300 4,50023 Assam Jorhat Fun Fitness May 2‐3 300 4,50024 Uttar Pradesh Bareilly Healthy Hearing May 9‐10 300 4,50025 Rajasthan Jaipur MEDFEST 9‐Jul 300 4,500
26 Andhra Pradesh HyderabadHealth
Promotion Jul 12‐13 300 4,50027 Chattisgarh Korba Fun Fitness Jul 18‐19 300 4,50028 Nagaland Dimapur MEDFEST 25‐Jul 200 3,00029 Meghalaya Shillong MEDFEST Aug 200 3,00030 Manipur Imphal Fun Fitness Aug 200 3,000
31 Jammu & Kashmir Jammu Fit Feet Oct 27‐28 300 4,500
32 Tamil Nadu Chennai Fit Feet Nov 1‐2 300 4,50033 Punjab Jalandhar Fun Fitness Dec 5‐6 300 4,500
34 Awaiting approval 300 4,500
35 Awaiting approval 300 4,500
36 Awaiting approval 300 4,500
37 Awaiting approval 300 4,500
38 Awaiting approval 300 4,500

Annual Report 2010 Page 60
39 Awaiting approval 300 4,500
40 Awaiting approval 300 4,500
41 Awaiting approval 300 4,500
42 Awaiting approval 300 4,500
43 Awaiting approval 300 4,500
Total 13,600 195,930 APOLLO MOU Four Camps were carried out under the MOU signed between SOI – SOB – Apollo. The screening was Holistic, covered 8 disciplines and carried out within the protocols laid down by SOI. These screenings were mainly pilot projects. There has been no further progress on the case. Clinical Directors Training Program ‐ On 10th/11th August 2010, Special Olympics Bharat organized a Train‐the‐Trainer Opening Eyes program for 16 volunteer optometrist selected from across India. The main purpose of conducting this program was to train Opening Eyes Clinical Directors to conduct open eyes programs according to the protocol laid down by SOI. The program was organized in collaboration with Special Olympics Bharat‐Tamil Nadu Chapter & International Association of Lions Clubs District 324 A8 and Elite School of Optometry.
FAMILY FORUM Item No, of
Camps N0. of Children
Resource Personnel
Sponsor Budget for Camp
Actual Equipment Remarks
Planned 1
36 Parents Simon, Harpreet
SOI $7,000 $8,200 YA Kits, LCD Screen
This camp was in Assam for North Eastern 12 States
Achieved 1
24 Parents + 3ASD + 6 SOB + 2 SOAP + 3 Assam Staff
SOB / SOI
There were 2 state out of 12
Annual Report 2010 Page 61

Annual Report 2010 Page 62
FINANCE AND FUND RAISING ANNUAL COST OF ADMINISTRATION
ITEM DETAIL OF EXPENDITURE OPERATING
COSTS IN INROPERATING
COSTS IN US$ SOURCE OF FUNDING
National Office
Wages Opps. Costs, Stipend, Uncovered exp.
90,00,000 200,000(CRG 150,000)
SOI 75%SOB 25%
3 Regional Offices
Rs.50,000 per month for 12 month for 3 Regions
18,00,000 40,000 SOB 30%States 70%
31 State Offices
Rs.50,000 per month for 12 months for 31 States
1,86,00,000 413,333 SOB 50%States 50%
600 District Offices
Rs.10,000 per month for 12 months for 600 Districts
7,20,00,000 1,600,000 SOB 50%States 50%
TOTAL 10,14,00,0002,253,333(CRG‐
150,000)
SOI 6%SOB 35%
States 59%
ANNUAL COST OF STRATEGIC GROWTH ITEM NUMBERS RATE COST IN INR COST IN US$ % FUNDING
Athletes 100,000 US $ 5 Per Athlete
2,25,00,000 500,000 SOI 30 %
SOB 70 %
Trainers 1,200 US $ 70 Per Trainer
37,80,000 84,000 Govt. 80 % SOB 20 %
Coaches
10,000 US $ 15 Per Coach
67,50,000 150,000 Govt. 75 % SOB 25 %
TOTAL 3,30,30,000 734,000 Govt. 15% SOI 20 % SOB 65 %

Annual Report 2010 Page 63
ANNUAL COST OF STRATEGIC GROWTH AND ADMINISTRATION
ITEM TARGETS RATE COST IN INR COST IN US$ % FUNDING
Athletes 100,000 US $ 5
Per Athlete2,25,00,000
500,000 CRG 150,000
SOI 30%SOB 70%
Trainers 1,200 US $ 70
Per Trainer37,80,000
84,000
Govt. 75%SOB 25%
Coaches
10,000 US $ 15
Per Coach67,50,000 150,000
Govt. 75%SOB 25%
Admin.
1 National 3 Regions 31 States
600 Districts
10,14,00,0002,253333
CRG $150,000
SOI 6%SOB 35%
STATE 59%
TOTAL Cost Ratio Ops. 36 %
Admin 64 %.
13,44,30,000 2,987,333
SOI 10%SOB 90%
FUND RAISING FOR SPORTS PROGRAMS – 2008 TO 2011‐ US$
ITEM 2008 % 2009 % 2010 % ESTIMATED
2011%
SOI 681,034 10 430,410 10 355,770 7 525,000 (CRG+HA)
7
SOB 2,440,305 36 960,111 21 1,951,039 38 3,860,267 50
States 3,747,126 54 3,097,778 69 2,802,221 55 3,346,666 43
TOTALS
6,868,495 100 4,488,199 100 5,109,030 100 7,731,933 100

Annual Report 2010 Page 64
2008 2009
N.O, 2440305, 36%
31 St at es, 3747126, 54%
SOI, 681034, 10% N.O, 960111,
21%
31 States, 3097778, 69%
SOI, 430410, 10%
2010 2011
STATES, 2802221,
54%
SOI, 355770,
7%
SOB, 2046604.7,
39%
SOB, 3860267, 50%
STATES, 3346666, 43%
SOI, 525000, 7%
UTILIZATION RATE OF RESOURCES IN US$
ITEM 2008 % 2009 % 2010 % 2011 %
SOB Program
6,868,495 50 4,488,199 79 5,109,030 93 7,731,933

Annual Report 2010 Page 65
SOURCES OF FUND RAISING – CASH AND KIND – 2010 In Rupees ITEM
CENTRAL GOVT.
STATE GOVT.
SOI PEOPLE CORPORATE OTHERS TOTAL
SOB 8,77,96,764 29,84,000 13,16,448 92,097,212
SOI 1,60,09,650 1,60,09,650
States 6,00,00,000 2,00,00,000 4,00,00,000 60,99,945 12,60,99,945
TOTALS 8,77,96,764 6,00,00,000 1,60,09,650 2,00,00,000 4,29,84,000 74,16,393 23,42,06,807
CENTRAL GOVT.,
87,796,764, 37%
STATE GOVT.,
60,000,000, 26%
SOI, 16,009,650,
7%
PEOPLE, 20,000,000,
9%
CORPORTATE,
42,984,000, 18%
OTHERS, 7,416,393,
3%
SOB, 92097212,
39%
STATES, 126099945,
54%
SOI, 16009650, 7%
SOURCES OF FUND RAISING – CASH AND KIND – 2010 In US$
ITEM
CENTRAL GOVT.
STATE GOVT.
SOI PEOPLE COOPERATE OTHERS TOTAL
SOB 1,951,039 66,311 29,254 2,046,604
SOI 355,770 355770
States 1,333,333 444,444 888,888 135,554 2,802,219
TOTALS 1,951,039 1,333,333 355,770 444,444 955,199 164,808 5,204,593

Annual Report 2010 Page 66
SOI, 355,770,
7%
PEOPLE, 444,444,
9%
CORPORTATE,
955,200, 18%
OTHERS, 164,809,
3% CENTRAL GOVT.,
1,951,039, 37%
STATE GOVT.,
1,333,333, 26%
STATES, 2802221,
54%
SOI, 355770,
7%
SOB, 2046604.7,
39%
SUMMARY OF SOURCES OF FUNDS RAISED 2010 IN INR AND US$
ITEM
CENTRAL GOVT.
STATE GOVT.
SOI PEOPLE COOPERATE OTHERS TOTAL
Indian Rupees
8,77,96,764 6,00,00,000 1,60,09,650 2,00,00,000 4,29,84,000 74,16,393 23,42,06,807
US Dollars
1,951,039 1,333,333 355,770 444,444 955,199 164,808 5,204,593
CENTRAL GOVT.,
87,796,764, 37%
STATE GOVT.,
60,000,000, 26%
SOI, 16,009,650,
7%
PEOPLE, 20,000,000,
9%
CORPORTATE,
42,984,000, 18%
OTHERS, 7,416,393,
3%
SOB, 92097212,
39%
STATES, 126099945,
54%
SOI, 16009650, 7%
Annual Report 2010 Page 67
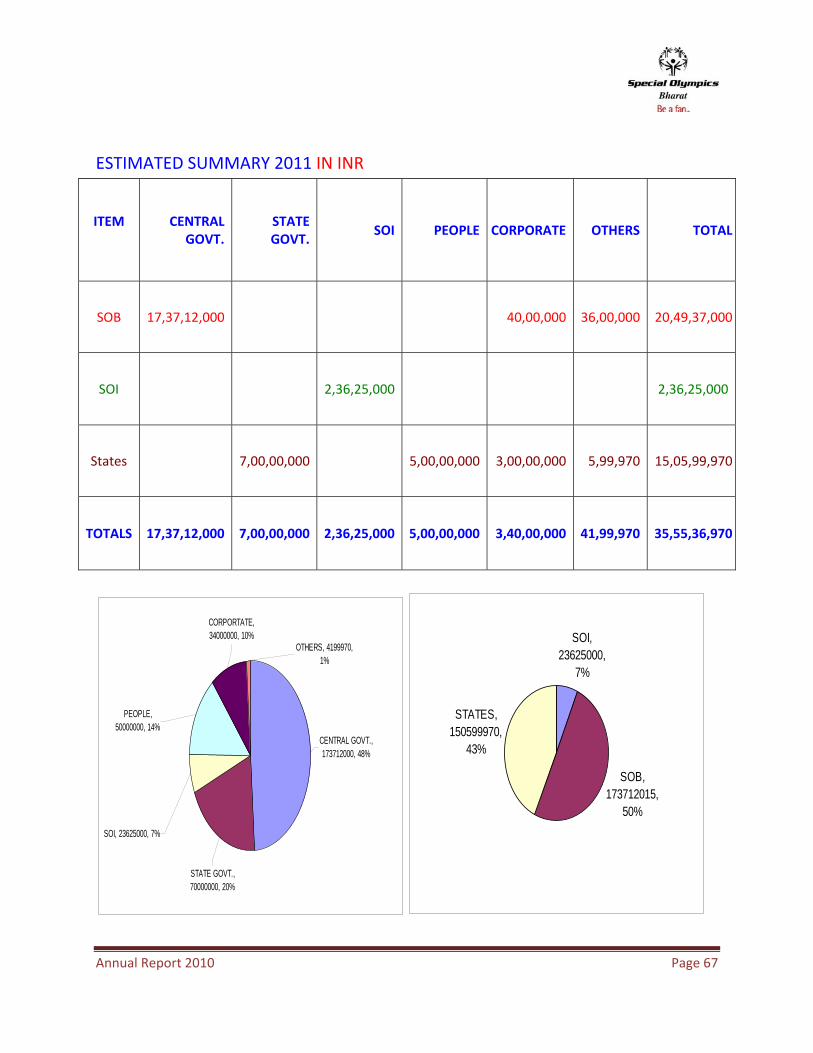
ESTIMATED SUMMARY 2011 IN INR
CENTRAL GOVT., 173712000, 48%
OTHERS, 4199970, 1%
STATE GOVT., 70000000, 20%
SOI, 23625000, 7%
CORPORTATE, 34000000, 10%
PEOPLE, 50000000, 14%
SOI, 23625000,
7%
SOB, 173712015,
50%
STATES, 150599970,
43%
ITEM
CENTRAL GOVT.
STATE GOVT.
SOI PEOPLE CORPORATE OTHERS TOTAL
SOB 17,37,12,000
40,00,000 36,00,000 20,49,37,000
SOI 2,36,25,000 2,36,25,000
States 7,00,00,000 5,00,00,000 3,00,00,000 5,99,970 15,05,99,970
TOTALS 17,37,12,000 7,00,00,000 2,36,25,000 5,00,00,000 3,40,00,000 41,99,970 35,55,36,970

Annual Report 2010 Page 68
ESTIMATED SUMMARY 2011 IN US$
CENTRAL GOVT.,
3860266, 48%
STATE GOVT.,
1555555, 20%
SOI, 525000, 7%
PEOPLE, 1111111, 14%
OTHERS, 93333, 1%
CORPORTATE, 755555,
10%
SOB, 3860267, 50%
STATES, 3346666, 43%
SOI, 525000, 7%
ITEM
CENTRAL GOVT.
STATE GOVT.
SOI PEOPLE CORPORATE OTHERS TOTAL
SOB 3,860,266
88,888 80,000 4,029,154
SOI 525,000 525,000
States 1,555,555 1,111,111 666,667 13,333 3,346,666
TOTAL 3,860,266 1,555,555 525,000 1,111,111 755,555 93,333 7,900,820

Annual Report 2010 Page 69
FUNDING OF SPORTS PROGRAMS LONG TERM DEVELOPMENT PLAN 2010 PARTICULARS 2010 2010
INR US$
World Summer Games ‐ ‐
Preparatory Camps 63,60,000 141,333
Train the Trainer 3,06,250 6,805
Asia Pacific Tour 23,62,500 52,500
World Winter Games ‐
Preparatory Camps 9,54,000 21,200
Hosting of International Events 12,00,000 26,666
National Coaching Camps 5,59,68,000 1,243,733
National Championship ‐ Athletics 12,00,000 26,666
National Championship – Others 12,00,000 26,666
Advance Coaches Training Camps 37,62,000 83,600
SSA Training 30,00,000 66,667
P.G. Diploma RVM University 4,35,000 9,667
Games Management System 22,57,200 50,160
PYKKA 3,00,00,000 666,666
New Scheme for All Disabilities MYAS
Coaches Training Camps 90,00,000 200,000
District Games 2,25,00,000 500,000
State Games 1,55,00,000 344,444
National Games 30,00,000 66,667
TOTAL Rs. 15,90,04,950 $ 3,533,442

Annual Report 2010 Page 70
NEW SCHEME – INCLUSIVE SPORTS FOR THE DISABLED (In Lakhs of Rupees) Details of the Scheme 2010 2011 2012 2013 2014 Total
1 Coaches Training
Grant – Rs.30,000 per District for 150 Distr. Going on to 300,450,
600 and another 600or 50 Coaches / camp
Coaches Trained(Includes Re‐Trg.
45.00
7,500
90.00
15,000
135.00
21,500
180.00
30,000
180.00
30,000
630.00
1,05,000
2 District Game
Grant‐ Rs.15,000 per Game for ten games per District for 150 Districts on a rotation basis to cover 600 Districts in four years with one extra round
Athletes Participating
225.00
45,000
225.00
45,000
225.00
45,000
225.00
45,000
225.00
45,000
1,125.000
2,25,000
3 State Games
Grant of Rs.5 lakh per State/ UT’S for 35 States /UT’S
Athletes Participating
175.00
1,000
1,000
175.00
1,000
175.00
1,000
175.00
1,000
875.000
5,000
4
National Games
Grant of Rs.30 lakhs per year, each year.
Athletes Participating
30.00
1.500
30.00
1,500
30.00
1,500
30.00
1,500
30.00
1,500
150.00
7,500
Total INR in LAKHS IN US $ MILLIONS COACHES TRAINED ATHLETES
475.00 1.055 7,500 47,500
520.00 1.155 15,000 47,500
565.001.255 21,00047,500
610.00 1.355 30,000 47,500
610.00 1.355 30,000 47,500
2780 6.175 105.00 2,37,500

Annual Report 2010 Page 71
PYKKA PROJECT FINANCIAL IMPLICATIONS ‐ ( In millions o US Dollars ) Component Panchayat 2007 2010 2011 2012 2013 2014 1015 2016 2017 Total
One time capital grant: i. Block ii. Village
54.46
341.3354.46
341.3354.46
341.3365.42
416.2665.42
416.2665.42
416.2665.42
416.2665.42
416.26 490.48
3,105.29
Annual Acquisition grant: i. Block ii. Village
51.55
888.8084.88
133.30113.33177.70
147.33231.10
152.88240.00
15.86248.80
164.22257.70
170.00266.60
900.092,444.00
Annual Operational grant: i. Block ii. Village
6.80
106.6010.20
160.0013.60
213.0017.66
304.0018.35
288.0019.02
298.6019.71
309.3320.40
320.00 125.74
1,999.53
Annual Competition grant: i. Block ii. Village
40.4070.82
40.4070.82
40.4070.82
40.4070.82
40.4070.82
40.4070.82
40.4070.82
40.4070.82
363.60637.38
Prize Money: i. Block ii. Village
12.1063.60
12.1063.60
12.1063.60
12.1063.60
12.1063.60
12.1063.60
12.1063.60
12.1063.60
96.80508.80
TSCBS 22.20 22.20 22.20 22.20 22.20 22.20 22.20 22.20 177.60
Total US $ 1,698.26 993.29 122.54 1,390.89 1,390.03 1,273.26 1,441.70 1,651.40 10,849
10,849 million USD ‐ (approx 4,882.05 Cr. Rupee)
Annual Report 2010 Page 72
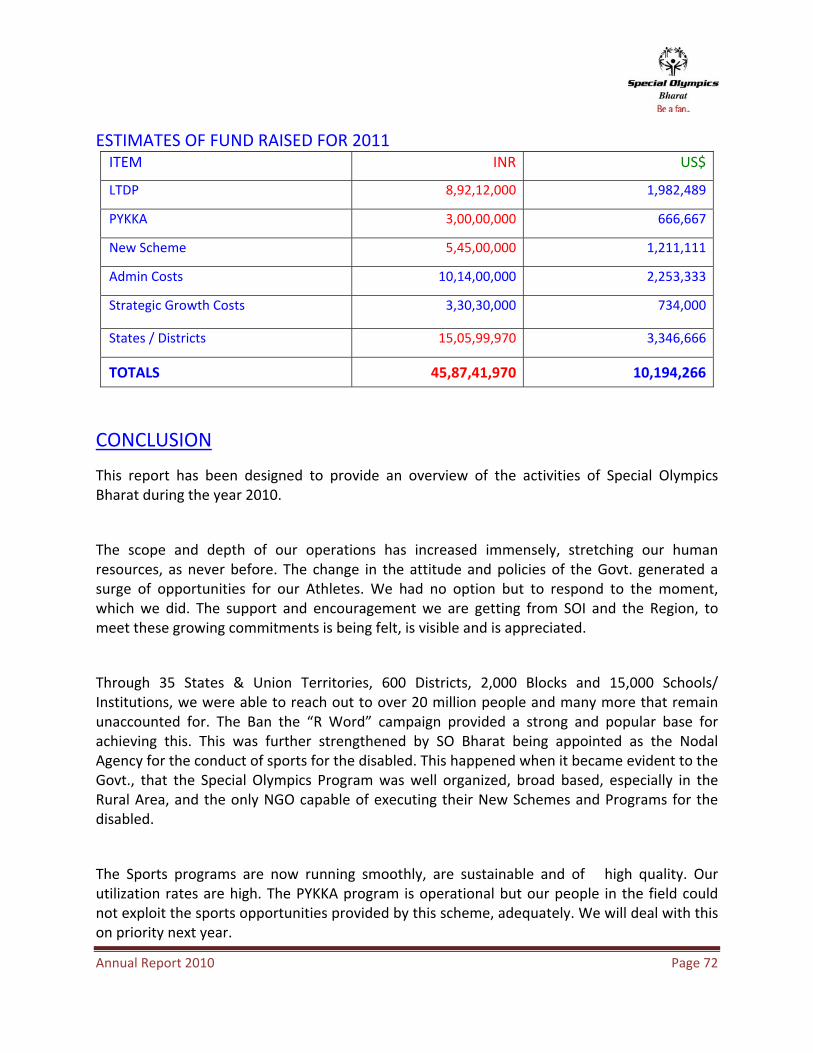
ESTIMATES OF FUND RAISED FOR 2011 ITEM INR US$
LTDP 8,92,12,000 1,982,489
PYKKA 3,00,00,000 666,667
New Scheme 5,45,00,000 1,211,111
Admin Costs 10,14,00,000 2,253,333
Strategic Growth Costs 3,30,30,000 734,000
States / Districts 15,05,99,970 3,346,666
TOTALS 45,87,41,970 10,194,266
CONCLUSION
This report has been designed to provide an overview of the activities of Special Olympics Bharat during the year 2010.
The scope and depth of our operations has increased immensely, stretching our human resources, as never before. The change in the attitude and policies of the Govt. generated a surge of opportunities for our Athletes. We had no option but to respond to the moment, which we did. The support and encouragement we are getting from SOI and the Region, to meet these growing commitments is being felt, is visible and is appreciated.
Through 35 States & Union Territories, 600 Districts, 2,000 Blocks and 15,000 Schools/ Institutions, we were able to reach out to over 20 million people and many more that remain unaccounted for. The Ban the “R Word” campaign provided a strong and popular base for achieving this. This was further strengthened by SO Bharat being appointed as the Nodal Agency for the conduct of sports for the disabled. This happened when it became evident to the Govt., that the Special Olympics Program was well organized, broad based, especially in the Rural Area, and the only NGO capable of executing their New Schemes and Programs for the disabled.
The Sports programs are now running smoothly, are sustainable and of high quality. Our utilization rates are high. The PYKKA program is operational but our people in the field could not exploit the sports opportunities provided by this scheme, adequately. We will deal with this on priority next year.
Annual Report 2010 Page 73
We had a problem with the HA program but it seems to have been activated again. There has been no further movement on the Apollo initiative.
The Young Athletes Program, as well as Family Forum programs, are enjoyable and gaining momentum. ALPS program will again come back into action from January.
The program’s outreach is expanding everyday, giving opportunities to our athletes on a wider scale.
The training being imparted to the coaches is evolving and is a huge learning experience, with International Agencies like the Australian Sports Outreach and Disability Sports Division from UK playing an active role in helping in development of training resources and training lead trainers to cater to the new scope and responsibilities of SO Bharat. SO Bharat is responding in a positive manner, taking all these new challenges in their stride.
The current funding of 150 District Games by the Govt., for the first time, is more than appreciated by the people in the field and their response has been very positive. We will take on 300 Districts next year
The morale of the program is high.