annual fi nancial statements - arb holdings limited · arb global (pty) ltd, a wholly owned...
TRANSCRIPT
5
Annual fi nancial statements
Directors’ responsibilities and approval .......46
Certificate of the Company Secretary ....... 47
Audit Committee report ............................ 48
Directors’ report ........................................ 49
Independent auditor’s report .................... 51
Statements of comprehensive income ..... 52
Statements of financial position ............... 53
Statements of changes in equity ............... 54
Statements of cash flows .......................... 55
Accounting policies ................................... 56
Notes to the annual financial statements .... 64

Consolidated annual fi nancial statements
| ARB Integrated report 201646
Directors’ responsibilities and approval
The Directors are required by the Companies Act of South Africa to
maintain adequate accounting records and are responsible for the
content and integrity of the consolidated and separate financial
statements and related financial information included in this report. It
is their responsibility to ensure that these consolidated and separate
financial statements comply with International Financial Reporting
Standards (“IFRS”) as to form and content and present fairly the
consolidated and separate statement of financial position, results of
operations and business of the Group, and explain the transactions
and financial position of the business of the Group at the end of the
financial year. The consolidated and separate financial statements are
based upon appropriate accounting policies consistently applied
throughout the Group and supported by reasonable and prudent
judgements and estimates.
The Directors acknowledge that they are ultimately responsible for
the system of internal financial control established by the Group and
place considerable importance on maintaining a strong control
environment. To enable the Directors to meet these responsibilities,
the Board sets standards for internal control aimed at reducing the
risk of error or loss in a cost effective manner. The standards include
the proper delegation of responsibilities within a clearly defined
framework, effective accounting procedures and adequate segregation
of duties to ensure an acceptable level of risk. These controls are
monitored throughout the Group and all employees are required to
maintain the highest ethical standards in ensuring the Group’s
business is conducted in a manner that in all reasonable circumstances
is above reproach.
The focus of risk management in the Group is on identifying,
assessing, managing and monitoring all known forms of risk across
the Group. While operating risk cannot be fully eliminated, the Group
endeavours to minimise it by ensuring that appropriate infrastructure,
controls, systems and ethical behaviour are applied and managed
within predetermined procedures and constraints.
The Directors are of the opinion, based on the information and
explanations given by management and the internal auditors that the
system of internal control provides reasonable assurance that the
financial records may be relied on for the preparation of the
consolidated and separate financial statements. However, any system
of internal financial control can provide only reasonable, and not
absolute, assurance against material misstatement or loss. The
going-concern basis has been adopted in preparing the financial
statements. Based on forecasts and available cash resources the
Directors have no reason to believe that the Group will not be a going
concern in the foreseeable future. The consolidated and separate
financial statements support the viability of the Group.
The consolidated and separate financial statements have been
audited by the independent auditing firm, PKF Durban, who have been
given unrestricted access to all financial records and related data,
including minutes of all meetings of shareholders, the Board of
Directors and committees of the Board. The Directors believe that all
representations made to the independent auditor during the audit
were valid and appropriate. The independent auditor’s unqualified
audit report is presented on page 51.
These consolidated and separate financial statements have been
prepared under the supervision of the Group’s Chief Financial Officer,
GM Scrutton CA(SA).
The consolidated and separate financial statements as set out on
pages 49 to 93 were approved by the Board on 23 August 2016 and
were signed on its behalf by:
AR Burke
Non-Executive Chairman
WR Neasham
Group Chief Executive Officer

ARB Integrated report 2016 | 47
Certifi cate of the Company Secretary
I certify that, to the best of my knowledge and belief, the requirements as stated in section 88(2) of the Companies Act of South Africa, have
been met and that all returns, as required of a public company in terms of the aforementioned Act, have been submitted to the Companies and
Intellectual Property Commission and that such returns are true, correct and up to date.
M Louw
Company Secretary
11 Larch Close
Zwartkop X4
Centurion
0046
23 August 2016

Consolidated annual fi nancial statements
| ARB Integrated report 201648
Audit Committee report
The Audit Committee is pleased to submit its report for the financial
year ended 30 June 2016 in terms of section 94 (7) (f) of the Companies
Act, 2008.
The Audit Committee has adopted formal terms of reference, delegated
to it by the Board of Directors, as its Audit Committee charter. This
charter is in line with the Companies Act, the King Report on
Governance for South Africa 2009 (“King III”) and the JSE Listings
Requirements. The committee has discharged the functions delegated
to it in terms of its charter. This process is supported by the Risk
Committee which monitors risk management and compliance activities.
During the year under review the committee performed the following
statutory duties:
1. Reviewed and recommended, for adoption by the Board, such
financial information that is required to be publicly disclosed,
which included the interim results for the six months ended 31
December 2015 and the consolidated and separate financial
statements for the year ended 30 June 2016.
2. Reviewed the scope, independence and objectivity of the internal
and independent auditors’ audits.
3. Considered and satisfied itself that the independent auditors, PKF
Durban, are independent.
4. Reviewed and approved the independent auditor’s budgeted fees
and terms of engagement for the 2016 financial year.
5. Determined the nature and extent of non-audit-related services
which the independent auditors were permitted to provide to the
Group and reviewed the policy for the use of the independent
auditors for non-audit-related services. All non-audit related
service agreements between the Group and the independent
auditors were pre-approved.
6. Reviewed and amended the Audit Committee Charter in line with
King III recommendations.
7. Confirmed the internal combined assurance plan for the 2016
financial year.
8. Reviewed and approved the IT governance structure for the Group.
9. Confirmed adequate whistle-blowing facilities were in place
throughout the Group and reviewed and considered action taken
with regard to incident reports.
10. Held separate meetings with management, the independent
auditors and internal audit to discuss any problems and
reservations arising from the year-end audit, and other matters,
that they wished to discuss.
11. Noted that it had not received any complaints, either from within
or outside the Group, relating either to the accounting practices,
the peer review audits, the content or auditing of the financial
statements, the internal financial controls or any other related
matter.
12. Conducted a self-evaluation exercise into the effectiveness of the
Audit Committee.
13. Recommended to the Board the reappointment of PKF Durban as
the Group’s independent auditors and Mr RC Boulle as the
registered auditor responsible for the audit for the year ending
30 June 2017, which will be considered at the forthcoming Annual
General Meeting.
14. Evaluated and satisfied itself as to the appropriateness of the
expertise and experience of the Company’s and the Group’s Chief
Financial Officer and the Company Secretary.
15. Satisfied itself with the expertise, resources and experience of the
Group’s finance function.
16. Considered the Group sustainability information as disclosed in
the integrated annual report.
Based on the information produced to the Audit Committee by the
independent auditors, internal auditors and management, the
committee is of the opinion that nothing has come to its attention that
would suggest that the Group’s system of internal financial controls
are not effective and do not form a basis for the presentation of
reliable financial statements. For further details regarding the Audit
Committee, shareholders are referred to the corporate governance
report on page 40 of this integrated report.
On behalf of the Audit Committee
ST Downes
Audit Committee Chairman
23 August 2016

ARB Integrated report 2016 | 49
Directors’ report
1. NATURE OF BUSINESS AND OPERATIONS
ARB Holdings Limited is a holding and investment company which
owns investments in closely related trading and distribution
businesses, as well as fixed property and vehicles for letting.
Electrical Division
ARB Electrical Wholesalers (Pty) Ltd together with its wholly
owned subsidiaries, a majority owned subsidiary (74%), is the
Company’s largest operating division. It is a black-empowered
electrical wholesaler operating in southern and South Africa
offering a wide range of locally manufactured and imported
products including power and instrumentation cabling; overhead
line hardware and conductors; insulators; transformers and
general electrical contracting materials. Clients range across
large and heavy industry, parastatals, major construction groups,
mining houses and electrical contractors. The subsidiary
continues to expand its footprint in the retail sector, marketing
mainly house brands through its Connect stores.
ARB Global (Pty) Ltd, a wholly owned subsidiary, sells a range of
locally manufactured and imported electrical products across
South African borders.
CED – Consolidated Electrical Distributor (Pty) Ltd (“CED”), a
wholly owned subsidiary, is the sole distributor of CHINT low
voltage products and the Horizon plugs and socket range in the
SADC region.
Lighting Division
Eurolux (Pty) Ltd, a majority owned subsidiary (60%), imports and
distributes electrical light fittings, lamps and related electrical
accessories principally in South Africa.
Corporate Division
ARB IT Solutions (Pty) Ltd, a wholly owned subsidiary, services
all the Electrical Division’s IT requirements and sells computer
hardware and software support.
ARB Holdings Limited owns a property portfolio and rents these
properties and some motor vehicles to certain of the Group
branch operations.
2. FINANCIAL RESULTS
The operating results and statement of financial position of the
Company and of the Group are fully set out in the attached
financial statements. There was a restatement of prior period
amounts in the current year relating to the recognition of the put
option liability for the option granted to Eurolux minority
shareholders as set out more fully in note 32.
The Electrical Division insured its trade receivable book from May
2015 and this is the first full year of trade receivable insurance.
The receivables impairment provision in note 18 includes both the
provision and the accrued insurance recovery.
Other than the matters referred to above, in our opinion, the
financial statements do not require further comment.
A six-year summary of the Group’s earnings is presented on page 19.
3. SHARE CAPITAL
Authorised share capital
The authorised share capital amounts to R100 000, being
1 000 000 000 ordinary shares of 0,01 cents each. There were no
changes to the authorised share capital during the year under
review.
Issued share capital
The issued share capital amounts to R23 500, being 235 000 000
ordinary shares of 0,01 cents each. There were no changes to the
issued share capital during the year under review.
4. DIVIDENDS
A final dividend was declared for the 2015 year and paid to
shareholders during the year under review of R70 735 000
(30,1 cents per share, comprising an ordinary dividend of
20,1 cents per share and a special dividend of 10,0 cents per
share) (2014: R70 735 000 [30,1 cents per share]).
Subsequent to year-end, the Board declared a final dividend to
shareholders of 23,1 cents per share. This is in line with the
Company’s dividend policy to distribute up to a maximum of 40%
of net profit after taxation, taking into account distributable
reserves and cash available for distribution. In addition, the Board
has resolved to pay a special dividend of 10,00 cents per share in
order to return excess cash to the shareholders.
5. DIRECTORS
The Directors of the Company during the year under review and to
the date of this report are as follows:
AR Burke Non-Executive Chairman
RB Patmore Lead Independent Non-Executive Director
WR Neasham Group Chief Executive Officer
JS Dixon Independent Non-Executive Director (appointed
18 January 2016)
ST Downes Independent Non-Executive Director
G Pretorius Independent Non-Executive Director (retired
12 November 2015)
GM Scrutton Financial Director and Chief Financial Officer
(appointed 1 October 2015)
Directors’ remuneration is reported in note 26 (related parties).
6. DIRECTORS’ INTEREST IN CONTRACTS
No material contracts in which Directors have an interest were
entered into during the year. All transactions with related parties
are detailed in note 26 to the consolidated and separate financial
statements.

Consolidated annual fi nancial statements
| ARB Integrated report 201650
Directors’ report (continued)
7. DIRECTORS’ SHAREHOLDING IN THE ISSUED SHARE CAPITAL OF THE COMPANY
Shares (000’s)
Direct
beneficially
Indirect
beneficially
Percentage
held
%
2016
Alan R Burke (Chairman)* 18 523 108 762 54,2
Simon Downes#* – 600 0,3
William Neasham (CEO) 4 862 75 2,1
Clinton Cockerell (resigned 31 July 2015)◊ 5 649 24 2,4
Jason Burke◊ 68 – –
Derrick Muller – – –
Blayne Burke◊ 70 – –
James Dixon#* (appointed 18 January 2016) 20 – –
Shannon Bester◊ 10 – –
29 202 109 461 59,0
2015
Alan R Burke (Chairman)* 18 523 106 548 53,2%
Byron Nichles (resigned 31 October 2014) – 2 550 1,1
Simon Downes#* – 600 0,3
William Neasham (CEO) 4 862 75 2,1
Clinton Cockerell◊ 5 725 24 2,4
Jason Burke◊ 68 – –
Derrick Muller 1 000 – 0,4
Blayne Burke◊ 68 – –
Shannon Bester◊ 10 – –
30 256 109 797 59,5
* Non-Executive.◊ Director of subsidiary, ARB Electrical Wholesalers (Pty) Ltd.
Director of subsidiary, ARB IT Solutions (Pty) Ltd.# Independent.
There were no changes in Directors’ shareholdings between the year-end and the date of this report.
8. BORROWINGS
The Directors have established credit facilities with various financial institutions for use by the Company and its subsidiary companies. The
Directors did not exceed any authorised levels of borrowings during the year under review.
9. SPECIAL RESOLUTIONS
The only special resolutions passed during the period were those passed at the Annual General Meeting, and included in the 2015
integrated report, giving directors general authority to repurchase up to 10% of the shares in the Company; approving the Non-Executive
Directors’ remuneration, and financial assistance of subsidiaries (in terms of s44 and s45 of the Companies Act). No shares were
repurchased during the year.
These resolutions will again be proposed at the forthcoming Annual General Meeting as well as a resolution to amend the Memorandum
of Incorporation (“MOI”) for changes in the treatment of fractions of shares as required by changes in the JSE regulations.
23 August 2016

ARB Integrated report 2016 | 51
Independent auditor’s report
TO THE SHAREHOLDERS OF ARB HOLDINGS LIMITED
We have audited the consolidated and separate financial statements
of ARB Holdings Limited set out on pages 52 to 93, which comprise
the statements of financial position as at 30 June 2016, and the
statements of comprehensive income, statements of changes in
equity and statements of cash flows for the year then ended, and the
notes, comprising a summary of significant accounting policies and
other explanatory information.
DIRECTORS’ RESPONSIBILITY FOR THE
CONSOLIDATED FINANCIAL STATEMENTS
The Company’s Directors are responsible for the preparation and fair
presentation of these consolidated and separate financial statements
in accordance with International Financial Reporting Standards and
the requirements of the Companies Act of South Africa, and for such
internal control as the Directors determine is necessary to enable the
preparation of consolidated and separate financial statements that
are free from material misstatement, whether due to fraud or error.
AUDITOR’S RESPONSIBILITY
Our responsibility is to express an opinion on these consolidated and
separate financial statements based on our audit. We conducted our
audit in accordance with International Standards on Auditing. Those
standards require that we comply with ethical requirements and plan
and perform the audit to obtain reasonable assurance about whether
the consolidated and separate financial statements are free from
material misstatement.
An audit involves performing procedures to obtain audit evidence
about the amounts and disclosures in the financial statements. The
procedures selected depend on the auditor’s judgement, including the
assessment of the risks of material misstatement of the financial
statements, whether due to fraud or error. In making those risk
assessments, the auditor considers internal control relevant to the
entity’s preparation and fair presentation of the financial statements
in order to design audit procedures that are appropriate in the
circumstances, but not for the purpose of expressing an opinion on
the effectiveness of the entity’s internal control. An audit also includes
evaluating the appropriateness of accounting policies used and the
reasonableness of accounting estimates made by management, as
well as evaluating the overall presentation of the financial statements.
We believe that the audit evidence we have obtained is sufficient and
appropriate to provide a basis for our audit opinion.
OPINION
In our opinion, the consolidated and separate financial statements
present fairly, in all material respects, the consolidated and separate
financial position of ARB Holdings Limited as at 30 June 2016, and its
consolidated and separate financial performance and consolidated
and separate cash flows for the year then ended in accordance with
International Financial Reporting Standards, and the requirements of
the Companies Act of South Africa.
OTHER REPORTS REQUIRED BY THE COMPANIES ACT
As part of our audit of the consolidated and separate financial
statements for the year ended 30 June 2016, we have read the
Directors’ report, the Audit Committee’s report and the Certificate by
the Company Secretary for the purpose of identifying whether there
are material inconsistencies between these reports and the audited
consolidated and separate financial statements. These reports are the
responsibility of the respective preparers. Based on reading these
reports we have not identified material inconsistencies between these
reports and the audited consolidated and separate financial
statements. However, we have not audited these reports and
accordingly do not express an opinion on these reports.
REPORT ON OTHER LEGAL AND REGULATORY
REQUIREMENTS
In terms of the IRBA Rule published in Government Gazette Number
39475 dated 4 December 2015, we report that PKF Durban has been
the auditor of ARB Holdings Limited for 16 years.
PKF Durban
Partner: RC Boulle
Registered Auditor
23 August 2016
Durban

Consolidated annual fi nancial statements
| ARB Integrated report 201652
for the year ended 30 June 2016
Statements of comprehensive income
Group Company
R000’s Note(s) 2016
2015
Restated 2016 2015
Revenue 2 489 791 2 150 764 27 284 28,563
Cost of sales (1 941 677) (1 633 459) – –
Gross profit 548 114 517 305 27 284 28 563
Other income 6 231 4 061 15 371 19 740
Overheads (337 630) (324 955) (11 431) (7 775)
Profit before interest and taxation 3 216 715 196 411 31 224 40 528
Dividends received – subsidiaries – – 53 300 55 524
Interest received 5 19 631 15 175 19 250 8 484
Interest paid 6 (7 720) (6 751) (8 213) (2 393)
Profit before taxation 228 626 204 835 95 561 102 143
Taxation 7 (68 455) (58 481) (14 845) (11 994)
Profit for the year 160 171 146 354 80 716 90 149
Other comprehensive income
Items that will not be reclassified into profit or loss
Revaluation of property 5 679 13 419 – –
Taxation of other comprehensive income (3 230) (3 217) – –
Total other comprehensive income 8 2 449 10 202 – –
Total comprehensive income 162 620 156 556 80 716 90 149
Profit for the year attributable to:
Non-controlling interests 24 594 24 849
ARB ordinary shareholders 135 577 121 505
160 171 146 354
Total comprehensive income attributable to:
Non-controlling interests 24 594 24 849
ARB ordinary shareholders 138 026 131 707
162 620 156 556
Earnings per share
Basic earnings per share (cents) 9.1 57,69 51,70
Diluted earnings per share (cents) 9.1 57,69 51,70
Headline earnings per share (cents) 9.2 59,74 51,71
Diluted headline earnings per share (cents) 9.2 59,74 51,71
Dividends per share (cents) 9.4 30,10 30,10
Ordinary dividend 20,10 20,10
Special dividend 10,00 10,00

ARB Integrated report 2016 | 53
as at 30 June 2016
Statements of fi nancial position
Group Company
R000’s Note(s) 2016
2015
Restated
2014
Restated 2016 2015 2014
Assets
Non-current assets
Investment property 10 – – – 177 069 179 688 163 231
Property, plant and equipment 11 225 313 221 672 205 525 2 434 4 291 7698
Intangible assets 12 78 003 83 659 83 971 – – –
Investments in subsidiaries 13 – – – 78 008 78 008 78 008
Investment in joint venture 14 1 041 – – – – –
Deferred lease income 15 – – – – 2 044 –
Deferred taxation 16 6 957 8 149 13 188 – – –
311 314 313 480 302 684 257 511 264 031 248 937
Current assets
Inventory 17 439 913 387 973 391 348 – – –
Trade and other receivables 18 431 775 351 345 341 924 578 160 10
Taxation overpaid – 200 122 – – –
Deferred lease income 15 – 328 – 2 012 – –
Loans receivable 19 7 289 – – 137 810 89 430 72 702
Cash and cash equivalents 20 243 269 226 780 197 584 138 534 16 511 547
1 122 246 966 626 930 978 278 934 106 101 73 259
Total assets 1 433 560 1 280 106 1 233 662 536 445 370 132 322 196
Equity and liabilities
Equity and reserves
Share capital and premium 21 116 174 116 174 116 174 116 174 116 174 116 174
Revaluation reserve 22 71 002 70 302 60 100 71 118 71 314 62 062
Capital reserve 22 – – – 26 234 26 234 26 234
Accumulated profits 638 012 571 421 520 651 114 412 104 235 94 073
Attributable to ARB ordinary shareholders 825 188 757 897 696 925 327 938 317 957 298 543
Non-controlling interests 161 594 152 600 143 351 – – –
986 782 910 497 840 276 327 938 317 957 298 543
Non-current liabilities
Deferred lease payments 23 393 981 – – – –
Put option liability 25 84 510 75 314 71 958 – – –
Deferred taxation 16 41 469 38 626 34 127 23 207 19 218 15 559
126 372 114 921 106 085 23 207 19 218 15 559
Current liabilities
Trade and other payables 24 316 416 252 185 284 136 2 510 2 741 7 008
Taxation payable 2 850 2 492 2 725 646 221 886
Loans payable 19 – – – 182 144 29 995 200
Deferred lease payments 23 1 140 11 440 – – –
320 406 254 688 287 301 185 300 32 957 8 094
Total equity and liabilities 1 433 560 1 280 106 1 233 662 536 445 370 132 322 196

Consolidated annual fi nancial statements
| ARB Integrated report 201654
for the year ended 30 June 2016
Statements of changes in equity
R000’s
Share capital
and premium
Revaluation
reserve
Accumulated
profits
Equity
attributable to
ARB ordinary
shareholders
Non-
controlling
interests Total
Group
Opening balance as previously reported 116 174 60 100 536 122 712 396 199 838 912 234
Restatement of put option liability – – (15 471) (15 471) (56 487) (71 958)
Balance at 1 July 2014 as restated 116 174 60 100 520 651 696 925 143 351 840 276
Total comprehensive income for the year – 10 202 121 505 131 707 24 849 156 556
Profit for the year – – 121 505 121 505 24 849 146 354
Other comprehensive income – 10 202 – 10 202 – 10 202
Dividends – – (70 735) (70 735) (15 600) (86 335)
Balance at 30 June 2015 as restated 116 174 70 302 571 421 757 897 152 600 910 497
Total comprehensive income for the year – 2 449 135 577 138 026 24 594 162 620
Profit for the year – – 135 577 135 577 24 594 160 171
Other comprehensive income – 2 449 – 2 449 – 2 449
Net transfer from reserve – (1 749) 1 749 – – –
Dividends – – (70 735) (70 735) (15 600) (86 335)
Balance at 30 June 2016 116 174 71 002 638 012 825 188 161 594 986 782
R000’s
Share capital
and premium
Property
reserve
Capital
reserve
Accumulated
profits Total
Company
Balance 1 July 2014 116 174 62 062 26 234 94 073 298 543
Total comprehensive income for the year
Profit for the year – – – 90 149 90 149
Dividends – – – (70 735) (70 735)
Transfer from accumulated profits to property reserve – 9 252 – (9 252) –
Balance at 30 June 2015 116 174 71 314 26 234 104 235 317 957
Balance 1 July 2015 116 174 71 314 26 234 104 235 317 957
Total comprehensive income for the year
Profit for the year – – – 80 716 80 716
Dividends – – – (70 735) (70 735)
Transfer to accumulated profits from property reserve – (196) – 196 –
Balance at 30 June 2016 116 174 71 118 26 234 114 412 327 938

ARB Integrated report 2016 | 55
for the year ended 30 June 2016
Statements of cash fl ows
Group Company
R000’s Note(s) 2016
2015
Restated 2016 2015
Cash flows from operating activities
Profit for the year 160 171 146 354 80 716 90 149
Adjustments for:
Income tax 7 68 455 58 481 14 845 11 994
Amortisation of intangible assets 3 156 312 – –
Depreciation 3 11 361 11 180 360 856
Impairment of goodwill 3 5 500 – – –
Change in put option liability assumptions 3 1 476 (3 300) – –
Equity income from joint venture 3 (1 041) – – –
Interest received 5 (19 631) (15 175) (19 250) (8 484)
Interest paid 6 7 720 6 751 8 213 2 393
Loss on disposal of investment property 3 – – 540 –
Loss on disposal of property, plant and equipment 3 1 022 29 365 –
Change in fair value of investment property 3 – – (5 710) (11 375)
Operating lease smoothing 869 223 32 (2 044)
Dividends received from subsidiaries – – (53 300) (55 524)
Operating cash flow before working capital changes 236 058 204 855 26 811 27 965
Working capital changes
(Increase)/decrease in inventories (51 940) 3 375 – –
(Increase)/decrease in trade and other receivables (80 430) (9 421) (418) (150)
Increase/(decrease) in trade and other payables 64 231 (31 933) (231) (4 267)
Cash generated by operating activities 167 919 166 876 26 162 23 548
Interest received 5 19 631 15 175 19 250 8 484
Interest paid 6 – (95) (8 213) (2 393)
Dividends received from subsidiaries – – 53 300 55 524
Dividends paid (86 335) (86 335) (70 735) (70 735)
Income tax paid 31 (67 092) (52 470) (10 431) (9 000)
Net cash generated by operating activities 34 123 43 151 9 333 5 428
Cash flows from investing activities
Investment property improvements acquired 10 – – (371) (5 082)
Property, plant and equipment acquired 11 (19 943) (15 662) (24) (17)
Proceeds on disposals of property, plant and equipment
and investment property 9 598 1 725 9 316 2 568
Net cash (utilised in)/generated from investing activities (10 345) (13 937) 8 921 (2 530)
Cash flows from financing activities
Loans repaid – (18) 152 149 29 795
Loans receivable advanced (7 289) – (48 380) (16 728)
Net cash (utilised in)/generated from financing activities (7 289) (18) 103 769 13 067
Increase in cash and cash equivalents 16 489 29 196 122 023 15 964
Cash and cash equivalents at beginning of the year 226 780 197 584 16 511 547
Cash and cash equivalents at end of the year 20 243 269 226 780 138 534 16 511

Consolidated annual fi nancial statements
| ARB Integrated report 201656
for the year ended 30 June 2016
Accounting policies
1. STATEMENT OF COMPLIANCE
The consolidated and separate financial statements of ARB Holdings Limited (“the Company”) are prepared in accordance with IFRS and
its interpretations by the International Accounting Standards Board (“IASB”) in issue and effective for the Group at 30 June 2016, the SAICA
Financial Reporting Guides as issued by the Accounting Practices Committee, the Financial Reporting Pronouncements as issued by the
Financial Reporting Standards Council, the JSE Listings Requirements and the Companies Act of South Africa. These policies have been
applied consistently to all years presented, unless otherwise stated. Refer to note 32 for details of a restatement of prior period amounts.
2. BASIS OF PREPARATION
The consolidated and separate financial statements are prepared on the historical cost basis, except for land and buildings and certain
financial instruments which are measured at fair value, and incorporate the principal accounting policies listed below.
The preparation of financial statements in conformity with IFRS requires management to make judgements, estimates and assumptions
that may affect the application of policies and reported amounts of assets, liabilities, income and expenses. The estimates and associated
assumptions are based on historical experience and various other factors that are believed to be reasonable under the circumstances, the
results of which form the basis of making the judgements about carrying values of assets and liabilities that are not readily apparent from
other sources. The estimates and underlying assumptions are reviewed on an ongoing basis. Revisions to accounting estimates are
recognised in the period in which the estimate is revised if the revision only affects that period, or in the period of the revision and future
periods if the revision affects both current and future periods. The areas involving a higher degree of judgement or complexity, or areas
where assumptions and estimates are significant to the financial statements, are disclosed in note 2.1.
New standards and interpretations issued and not yet adopted
The Group has not applied the following new, revised or amended pronouncements that have been issued by the IASB as they are not yet
effective for the financial year beginning 1 July 2015 and it is not expected that they will have a material impact on the financial statements.
The Board anticipates that the new standards, amendments and interpretations will be adopted in the Group’s consolidated and separate
financial statements when they become effective. The Group has assessed, where practicable, the potential impact of all these new
standards, amendments and interpretations that will be effective in future periods. Certain other new standards and interpretations have
been issued but are not expected to have any impact on the Group’s financial statements.
Standard Details of amendments
Annual
periods
beginning
on or after
IFRS 9:
Financial
instruments
Replaces IAS 39 and provides more guidance on measurement of financial instruments.
Introduces a new approach to the classification of financial assets, a single impairment model.
New model for hedge accounting that aligns accounting treatment with the risk management
activity with enhanced disclosures.
1 January
2018
IFRS 15:
Revenue from
Contracts with
Customers
New guidance on recognition of revenue that requires recognition of revenue in a manner that
depicts the transfer of goods or services to customers at an amount that reflects the
consideration the entity expects to be entitled to in exchange for those goods or service.
1 January
2018
IFRS 16:
Leases
Requires lessees to account for leases “on balance sheet” by recognising a “right of use” asset
and lease liability.
It also changes the definition of a lease, sets requirements on how to account for the asset and
lability, provides exemptions for short-term leases and leases of low value assets, changes the
accounting for sale-and-leaseback arrangements, largely retains IAS 17’s approach to lessor
accounting and introduces new disclosure requirements.
1 January
2019

ARB Integrated report 2016 | 57
2. BASIS OF PREPARATION (continued)
2.1 Accounting estimates and judgements
The estimates and judgements that have a significant risk of causing a material adjustment to the carrying amounts of assets and
liabilities within the next financial year are as follows:
Key sources of estimation uncertainty
Impairment of inventory
The inventory obsolescence provision is management’s estimate, based on historic sales trends and its assessment of quality and
volume, and the extent to which the merchandise for resale on hand at reporting date will not be sold or will be sold below cost.
Impairment of gross trade receivables
Provision is made for doubtful debts based on management’s estimate of the prospect of recovering the debt. Where management
has determined that the recovery of the debt is doubtful, the amount less the anticipated insurance recovery is provided for
immediately.
Put option liability
The liability arises when new acquisitions have contractual obligations enabling non-controlling shareholders to put their shares
back to the Group at an agreed upon formula. In arriving at the liability the future earnings need to be assessed and discounted back
to calculate the present value. This requires a high level of estimation and judgement.
Residual values and useful lives of items of property, plant and equipment
Property, plant and equipment is depreciated over its useful life taking into account residual values where appropriate. Assessments
of useful lives and residual values are performed annually after considering factors such as relevant market information, the
condition of the asset and management’s consideration. In assessing the residual values, the Group considers the remaining life of
the assets, their projected disposal value and future market conditions.
Vehicles
The Group has a policy of utilising all vehicles for a period between four and five years. It is estimated that vehicles have a residual
value approximating 20% to 60%, depending on their age and nature of use, of their initial purchase price based on historical sales
trends.
Buildings
The Group has a policy of utilising all buildings for a period of 50 years. The estimated residual values are determined with
reference to expected proceeds on disposal adjusted for current market prices and trends. The Company does not depreciate
buildings that are held as investment properties.
The estimates are reviewed at each financial year-end and if estimates change the residual values and useful lives are adjusted for
accordingly and the changes accounted for prospectively.
Impairment of intangible assets and goodwill
The Group tests for impairment at each reporting date or more frequently if there are indicators that the intangible assets and
goodwill may be impaired.
Goodwill
The recoverable amount of a cash-generating unit is determined based on value-in-use calculations. For this calculation, the
discounted cash flow method is used, taking into account financial forecasts approved by management over a five-year period.
Key assumptions applied in value-in-use of the cash-generating unit’s revenue, gross profit and cost forecasts are based on
management’s views and estimates. These cash flows are then discounted and compared to the current carrying value and, if
lower, the assets are impaired to the present value of the cash flows. A discount rate has been used, taking into account the level
of risk associated with the cash-generating unit.
Trademarks – Eurolux brand
The recoverable amount of the intangible asset is determined using the relief from royalty’s methodology. Key assumptions
applied when using this method is the historical growth rate of revenue. The discount rate used is based on the weighted average
cost of capital to Eurolux (Pty) Ltd. The determined recoverable amount is compared to the current carrying value and, if lower,
the assets are impaired to the determined recoverable amount. The trademark is considered to have an indefinite useful life as it
already has been in existence for over 20 years and it is self-evident that a trademark can endure for many decades.

Consolidated annual fi nancial statements
| ARB Integrated report 201658
for the year ended 30 June 2016
Accounting policies (continued)
2. BASIS OF PREPARATION (continued)
2.1 Accounting estimates and judgements (continued)
Revaluation of land and buildings and investment properties
The Group values the land and buildings and investment properties with the assistance of an independent valuer with reference to
current market conditions, recent sales transactions of similar geographical locations and the present value of future rental income.
Fair value measurement and valuation process
The measurement of non-financial assets at fair value takes into account a market participant’s ability to generate economic
benefits by using the asset in its highest and best use or by selling it to another market participant that would use the asset in its
highest and best use.
The Group uses valuation techniques that are appropriate in the circumstances and for which sufficient data are available to
measure fair value, maximising the use of relevant observable inputs and minimising the use of unobservable inputs.
All assets and liabilities for which fair value is measured or disclosed in the financial statements are categorised within the fair
value hierarchy, described as follows, based on the lowest level input that is significant to the fair value measurement as a whole:
– Level 1: Quoted (unadjusted) market prices in active markets for identical assets or liabilities;
– Level 2: Valuation techniques for which the lowest level input that is significant to the fair value measurement is directly or
indirectly observable; and
– Level 3: Valuation techniques for which the lowest level input that is significant to the fair value measurement is unobservable.
For assets and liabilities that are recognised in the financial statements on a recurring basis, the Company determines whether
transfers have occurred between levels in the hierarchy by reassessing categorisation (based on the lowest level input that is
significant to the fair value measurement as a whole) at the end of each reporting period.
Critical judgements in applying the Group’s accounting policies
Contingent liabilities
Management applies its judgement to advice it receives from its attorneys, advocates and other advisors in assessing if an obligation
is probable, more likely than not, or remote. This judgement application is used to determine if the obligation is recognised as a
liability in the form of a provision or disclosed as a contingent liability.
2.2 Basis of consolidation
These financial statements are the consolidated and separate financial statements of ARB Holdings Limited and entities controlled
by it and its subsidiaries. Control is achieved when the Group has control of the voting rights of the subsidiary, is exposed to or has
rights to variable returns from its involvement with the subsidiary and has the ability to use its voting rights to affect its returns. If
facts and circumstances indicate that there are changes to one or more of the elements of control, the Group shall reassess whether
it controls the subsidiary.
Investment in subsidiaries
Investments in subsidiaries are carried at cost less accumulated impairments, if any. The cost of the investment in a subsidiary is
the aggregate of the fair value of the assets given, liabilities incurred and equity instruments issued by the Company.
Consolidation of a subsidiary begins from the date the investor gains control of an investee and ceases when the investor loses
control of an investee.
The acquisition method of accounting is used to account for the acquisition of subsidiaries by the Group. The cost of the acquisition
is measured as the fair value of assets transferred, equity instruments issued and liabilities incurred at the date of exchange. Intra-
group transactions, balances and unrealised gains and losses on transactions between Group companies are eliminated.
Non-controlling interests in subsidiaries are presented in the consolidated statement of financial position separately from the equity
attributable to equity owners of the parent company. Non-controlling shareholders’ interest may initially be measured either at fair
value or at the non-controlling shareholders’ interests’ proportionate share of the fair value of the acquiree’s identifiable net assets.
The choice of measurement basis is made on each acquisition individually. Subsequent to acquisition, the carrying amount of non-
controlling interests is the amount of those interests at initial recognition plus the non-controlling interests’ share of subsequent
changes in equity. Total comprehensive income is attributed to non-controlling interests even if this results in the non-controlling
interests having a deficit balance.
ARB Integrated report 2016 | 59
2. BASIS OF PREPARATION (continued)
2.2 Basis of consolidation (continued)
Goodwill
Goodwill on acquisitions comprises the excess of the aggregate of the fair value of the consideration transferred, the fair value of
any previously held interests and the recognised value of the non-controlling interest in the acquiree over the net amounts of the
identifiable assets acquired and liabilities assumed at the acquisition date.
Goodwill is carried at cost less accumulated impairment losses. Goodwill is tested for impairment annually. Gains and losses on the
disposal of an entity include the carrying amount of goodwill relating to the entity sold.
2.3 Property, plant and equipment
Property, plant and equipment, except for land and buildings, are initially recorded at cost less any accumulated depreciation and
any accumulated impairment losses. Depreciation is computed by allocating the depreciable amount of an asset on a systematic
basis over its useful life and is applied separately to each identifiable component. Residual values and useful lives are assessed at
the end of every financial year and the year’s depreciation determined.
The carrying amounts of property, plant and equipment are reviewed annually for an indication whether or not the relevant asset is
impaired. If any such indication exists and where the carrying amount exceeds the estimated recoverable amount, the assets or
cash-generating units are written down to their recoverable amounts. Impairment losses and reversals are recognised directly in
the statement of comprehensive income under the line item “other expenses” unless such reversals relate to previously recognised
revaluation reserves in equity.
Land and buildings held for use in the production or supply of goods or services or for administrative purposes are stated in the
statement of financial position at their revalued amounts, being the fair value at the date of revaluation and less any subsequent
accumulated impairment losses. Revaluations are performed with sufficient regularity such that the carrying amounts do not differ
materially from those that would be determined using fair values at the reporting date.
Any revaluation increase arising on revaluation of such land and buildings is credited in equity to the revaluation reserve except to
the extent that it reverses a revaluation decrease for the same asset previously recognised in profit or loss in which case the
increase is credited to profit or loss to the extent of the decrease previously charged. A decrease in the carrying amount arising on
the revaluation of such land and buildings is charged to profit or loss to the extent that it exceeds the balance, if any, held in the
properties’ revaluation reserve relating to a previous revaluation of that asset.
Property, plant and equipment are depreciated over their useful lives as follows:
Plant and equipment 5 to 15 years
Office furniture and fittings 6 years
Office equipment 5 to 6 years
Computer equipment 3 years
Leasehold improvements over the shorter of useful life or the term of the lease
Buildings 50 years
Vehicles 4 to 5 years
Land is not depreciated.
Where the estimated residual value of an asset is above its carrying value, no depreciation is recognised.
2.4 Intangible assets
Intangible assets acquired separately are shown at historical cost less accumulated amortisation and impairment losses. An
intangible asset is recognised when:
it is probable that the expected future economic benefits that are attributable to the asset will flow to the entity; and
the cost of the asset can be measured reliably.
Intangible assets are initially recognised at cost.
An intangible asset is regarded as having an indefinite useful life when, based on all relevant factors, there is no foreseeable limit
to the period over which the asset is expected to generate net cash inflows. Amortisation is not provided for in respect of these
intangible assets. For all other intangible assets, amortisation is provided on a straight-line basis over their useful life.

Consolidated annual fi nancial statements
| ARB Integrated report 201660
for the year ended 30 June 2016
2. BASIS OF PREPARATION (continued)
2.4 Intangible assets (continued)
Software development costs are amortised over 10 years. The carrying value of intangible assets is reviewed for impairment
annually or more frequently if there are indicators that the intangible assets may be impaired. Amortisation periods and methods
are reviewed annually and are adjusted if appropriate.
2.5 Impairment
The carrying amounts of the assets are reviewed at each reporting date to determine whether there is any indication of impairment.
If any such indication exists, or when annual impairment testing for an asset is required, the recoverable amount is estimated as
the higher of the “net selling price” and “value in use”.
In assessing “value in use”, the expected future cash flows are discounted to their present value using a pre-tax discount rate that
reflects current market assessments of the time value of money and the risk specific to the asset. An impairment loss is recognised
whenever the carrying amount exceeds the recoverable amount. Impairment losses and reversals of impairment losses are
separately disclosed in the statement of comprehensive income, above the profit before tax sub-total.
For an asset that does not generate cash inflows largely independent of those from other assets, the recoverable amount is
determined for the cash-generating unit to which the asset belongs. An impairment loss is recognised whenever the carrying
amount of the cash-generating unit exceeds its recoverable amount.
2.6 Investment property
Investment property in the Company, which is property held to earn rentals and/or for capital appreciation, is measured initially at
cost, including transaction costs. Subsequent to initial recognition, investment property is measured at fair value. Gains or losses
arising from changes in fair value of investment property are included in profit or loss for the period in which they arise. The
Company, although not required by IFRS, maintains a voluntary distributable reserve that represents the (net), after tax, revaluation
of the investment property. Changes to the fair value are transferred annually between accumulated profits and the reserve in the
statements of changes in equity.
2.7 Operating leases
Leases of assets under which all the risks and benefits of ownership are effectively retained by the lessor are classified as operating
leases. Payments made under operating leases are charged to profit or loss on a straight-line basis over the period of the lease.
Assets held by the Company for operating leases are depreciated over their estimated useful lives. Income is recognised on a
straight-line basis over the lease term unless another systematic basis is more representative of the time pattern in which benefits
are diminished.
2.8 Inventory
Inventory consists of power and instrumentation cable, overhead line conductor and equipment, general electrical contracting
materials and lamps and light fittings purchased for resale and is valued at the lower of cost or net realisable value. Cost is
determined using the weighted average cost basis. Adequate provision is made for obsolete, redundant and slow moving inventory.
2.9 Investments in joint ventures
Investments in joint ventures are accounted for using the equity method. Under the equity method, on initial recognition the
investment in a joint venture is recognised at cost, and the carrying amount is increased or decreased to recognise the investor’s
share of the profit or loss of the investee after the date of acquisition. The investors’ share of the investee’s profit or loss is
recognised in the investors profit or loss. Distributions received from an investee reduce the carrying amount of the investment.
2.10 Financial instruments
The Group classifies financial instruments, or their component parts, on initial recognition as a financial asset, a financial liability
or an equity instrument in accordance with the substance of the contractual arrangement. Financial instruments are recognised
when the Group becomes a party to the contractual provisions of the instrument.
Financial instruments are recognised initially at fair value plus transaction costs that are directly attributable to the acquisition or
issue of the financial instrument, except for financial assets and financial liabilities at “fair value through profit or loss”, which are
initially measured at fair value, excluding transaction costs which are recognised in profit or loss.
Accounting policies (continued)

ARB Integrated report 2016 | 61
2. BASIS OF PREPARATION (continued)
2.10 Financial instruments (continued)
Financial assets are derecognised when the rights to receive cash flows from the investments have expired or have been transferred
and the Group has transferred substantially all the risks and rewards of ownership. Financial liabilities are derecognised when the
obligation specified in the contract is discharged, cancelled or expires.
Financial assets at fair value through profit and loss
Financial assets at “fair value through profit and loss” include financial assets held for trading and financial assets designated upon
initial recognition at fair value through profit or loss. A financial asset is classified in this category if acquired principally for the
purpose of selling or repurchasing in the short term.
Financial assets at fair value through profit and loss comprise derivative financial instruments, namely forward exchange contracts.
Subsequent to initial recognition, financial assets at fair value through profit and loss are stated at fair value. Movements in fair
values are recognised in profit and loss.
Loans receivable and payable
Loans receivable and payable are initially measured at fair value and subsequently measured at amortised cost using the effective
interest rate method and are stated at fair value. Movements in fair values are recognised in profit and loss.
Trade and other receivables
Trade receivables are measured at initial recognition at fair value, and are subsequently measured at amortised cost using the
effective interest rate method, less provision for impairment. The effective interest rate method is a method of calculating the
amortised cost of a financial instrument and of allocating interest over the relevant period. Trade receivables are reduced by
appropriate allowances for estimated irrecoverable amounts. Interest on overdue trade receivables is recognised as it is received.
Put option liability
Written put options on the shares of a subsidiary held by non-controlling interests entitle the non-controlling interests to sell its
interest in the subsidiary to the Group. The Group records a financial liability for its contractual obligation to pay the put option at
the present value of the estimated option price discounted from the date the option is first exercisable to the reporting date. In
recognising this liability, the non-controlling interest is derecognised and any excess or shortfall is charged or realised directly in
accumulated profits in the statement of changes in equity. Dividends paid to the derecognised non-controlling interests are charged
to profit and loss.
The unwinding of the present value discount on this financial liability is recorded in finance charges. The financial liability is fair
valued at the end of each financial year and any changes in the fair value of the liability as a result of changes in assumptions used
to estimate the future option price are also recognised in profit and loss.
Trade and other payables
Trade payables are initially measured at fair value and subsequently measured at amortised cost using the effective interest rate
method.
Cash and cash equivalents
Cash and cash equivalents comprise cash balances, money market instruments, call deposits and cash floats. Cash and cash
equivalents are measured at amortised cost.
Impairment of financial assets
All financial assets measured at amortised cost are assessed for indicators of impairment at each reporting date.
Offsetting of financial instruments
Financial assets and liabilities are offset and the net amount reported in the statements of financial position when there is a legally
enforceable right to offset the recognised amounts and there is an intention to settle on a net basis or to realise the asset and settle
the liability simultaneously.

Consolidated annual fi nancial statements
| ARB Integrated report 201662
for the year ended 30 June 2016
2. BASIS OF PREPARATION (continued)
2.11 Employee benefits
Share-based payments
Cash settled
Share-linked instruments have been granted to certain employees in the Group. The fair value of the amount payable to the
employee is recognised as an expense with a corresponding increase in liabilities. The fair value is initially measured at grant date
and expensed over the period during which the employees are required to provide services in order to become unconditionally
entitled to payment.
The fair value of the instruments granted is measured using the Black Scholes pricing market model, taking into account the terms
and conditions upon which the instruments are granted. The liability is remeasured at each reporting date and at settlement date.
Any changes in the fair value of the liability are recognised as employees’ remuneration in profit or loss.
Short-term employee benefits
The cost of all short-term benefits is recognised during the period in which the employee renders the related service.
The provisions for employee entitlements to salaries, bonus and annual leave represent the amount which the Group has a present
obligation to pay as a result of employees’ services provided to the reporting date. The provisions have been calculated at
undiscounted amounts based on current salary rates.
Retirement benefits
The Group contributes to defined contribution funds. Contributions to defined contribution funds are charged against income as
incurred.
2.12 Income taxation
Current tax
The charge for current tax is based on the results for the year adjusted for items which are tax exempt or are not tax deductible. Tax
is calculated using rates that have been enacted or substantively enacted at the reporting date.
Deferred tax
Deferred tax is the future tax consequences of temporary differences between the carrying amounts and tax bases of assets and
liabilities shown on the statement of financial position.
Deferred tax assets and liabilities are measured at the tax rates that are expected to apply to the period when the asset is realised
or the liability is settled, based on tax rates (and tax laws) that have been enacted or substantively enacted by the reporting date.
Deferred tax assets and liabilities are offset when there is a legally enforceable right to offset current tax assets and liabilities and
when the deferred tax balances relate to the same taxation authority.
2.13 Revenue recognition
Group revenue comprises the fair value of the consideration received or receivable in the ordinary course of the Group’s activities
and is shown net of value-added taxes, estimated returns, rebates and discounts after eliminating sales within the Group. Company
revenue includes rental income but excludes management fees received. The Group recognises revenue when the amount can be
reliably measured, it is probable that future economic benefits will flow to the entity and when the specific criteria have been met.
The consideration received from customers is recorded as revenue to the extent that the Group has performed its contractual
obligations in respect of that consideration and the significant risks and rewards have been transferred to the purchaser.
Rental income from operating leases is recognised in income on a straight-line basis over the lease term.
2.14 Dividends
Dividend distributions to the Company’s shareholders are recognised as a liability in the Company’s financial statements in the
period in which the dividends are approved by the Company’s Directors.
2.15 Contingencies and commitments
Transactions are classified as contingent liabilities where the Group’s obligations and possible obligations depend on uncertain
events and where the liability is not recognised in the statement of financial position. Items are classified as commitments where
the Group commits itself to future transactions, particularly in the acquisition of property, plant and equipment.
Accounting policies (continued)

ARB Integrated report 2016 | 63
2. BASIS OF PREPARATION (continued)
2.16 Foreign currency transactions
Foreign currency transactions are converted to the respective functional currency at the rate of exchange ruling at the date of the
transaction. Gains or losses on translation are recognised in profit or loss. At the end of the reporting period foreign currency
monetary items are translated using the closing rate. Exchange differences arising on settlement of monetary items or on
translating monetary items at rates different from those at which they were translated on initial recognition during the period, or in
previous consolidated and separate financial statements, are recognised in profit or loss in the period in which they arise.
2.17 Interest income
Interest revenue is recognised in the period in which interest is earned. The amount of revenue is measured using the effective
interest rate method.
2.18 Earnings per share
Earnings per share is based on attributable profit for the year divided by the weighted average number of ordinary shares in issue
during the year. Fully diluted earnings per share is presented when the inclusion of potential ordinary shares has a dilutive effect
on the earnings per share.
2.19 Headline earnings per share
Headline earnings per share is based on the same calculation as in note 2.18 above except that attributable profit specifically
excludes items as set out in Circular 2/2015: “Headline Earnings” issued by the South African Institute of Chartered Accountants.
Fully diluted headline earnings per share is presented when the inclusion of potential ordinary shares has a dilutive effect on
headline earnings per share.
2.20 Operating segments
Operating segments are reported in a manner consistent with the internal reporting provided to the chief operating decision-maker.
The chief operating decision making body who is responsible for allocating resources and assessing operating segments has been
identified as the Group Executive Committee.
Segment operating assets and liabilities are only those that can be specifically identified within a particular segment.

Consolidated annual fi nancial statements
| ARB Integrated report 201664
for the year ended 30 June 2016
Notes to the annual fi nancial statements
Group Company
R000’s Note(s) 2016 2015 2016 2015
3. PROFIT BEFORE INTEREST AND TAXATION
Profit before interest and taxation is arrived at after
taking into account the following items:
Income
Lease rentals 678 640 27 284 28 563
Fair value adjustment to investment properties 10 – – 5 710 11 375
Equity income from joint ventures 14 1 041 – – –
Exchange rate profits on foreign exchange 6 579 247 – –
Expenditure
Exchange rate losses on foreign exchange 3 819 4 720 – –
Depreciation 11 11 361 11 180 360 856
Amortisation of intangible assets 12 156 312 – –
Auditors’ remuneration 1 233 1 195 420 443
Current 1 213 1 119 400 367
Other services 20 76 20 76
Operating lease charges – premises 14 990 17 978 – –
Allowance for impairment – inventory 17 1 302 4 218 – –
Allowance for impairment – trade receivables 18 (2 498) 4 560 – –
Impairment of goodwill 12 5 500 – – –
Loss on disposal of property, plant and equipment 1 022 29 365 –
Change in put option liability assumptions 25 1 476 (3 300) – –
Dividends paid to derecognised NCI now expensed 3 600 3 416 – –
Loss on disposal of investment property – – 540 –
Share appreciation rights cost/(reversal) 26 281 (1 114) – (1 283)
Direct operating expenses of investment property – – 67 327
4. STAFF COSTS
Short-term employee benefits 165 814 141 359 784 720
Contributions to retirement funds 12 008 11 797 58 40
Other employment benefits 7 333 12 611 191 188
Other staff costs 11 388 7 789 57 31
196 543 173 556 1 090 979
Short-term employee benefits comprise salaries, commissions, share appreciation rights and bonuses paid.
Other employment benefits comprise travel allowances, fringe benefits on the use of company vehicles and contributions to medical aid
funds.
Other staff costs comprise accruals raised but not paid in respect of the future liability for share appreciation rights and other bonuses,
as well as staff training and related expenditure.
Staff costs includes key management personnel (note 26) and excludes Directors’ remuneration (note 26).

ARB Integrated report 2016 | 65
4. STAFF COSTS (continued)
Employee benefits
Defined contribution plan
It is the policy of the Group to provide retirement benefits to all its employees. A number of defined contribution provident and pension funds, all
of which are governed by the Pensions Fund Act of 1956, exist for this purpose. These include the Alexander Forbes Retirement Fund, Investment
Solutions, Liberty Corporate Provident Fund and Momentum Funds at Work. All the schemes are funded by Group contributions, which are
charged to the statement of comprehensive income as they are incurred. The total Group contribution to such schemes in 2016 was R12 008 000
(2015: R11 797 000) and for the Company was R58 000 (2015: R40 000). Amounts contributed in respect of the Directors is included in note 26.
Group Company
R000’s Note(s) 2016 2015 2016 2015
5. INTEREST RECEIVED
Financial institutions 13 495 9 147 8 178 1 249
Trade receivables 5 269 6 016 – –
South African Revenue Service – 12 – –
Group companies and related parties 867 – 11 072 7 235
19 631 15 175 19 250 8 484
6. INTEREST PAID
Unwinding of put option liability discount
to present value 25 (7 720) (6 656) – –
Financial institutions – (54) – –
South African Revenue Service – (41) – –
Group companies – – (8 213) (2 393)
(7 720) (6 751) (8 213) (2 393)
7. TAXATION
SA normal tax
Current taxation (67 650) (52 159) (10 856) (8 335)
Deferred taxation
Current year temporary differences (805) (6 322) (1 110) (3 659)
CGT inclusion rate change – – (2 879) –
Tax for the year (68 455) (58 481) (14 845) (11 994)
% % % %
SA normal taxation rate 28,00 28,00 28,00 28,00
Adjusted for:
Special allowances – (0,54) – –
Exempt income – – (15,62) (15,22)
Non-deductible expenses 1,94 1,09 – –
CGT inclusion rate change – – 3,29 –
Revaluation of investment properties at CGT rate – – (0,14) (1,04)
Net adjustment 1,94 0,55 (12,47) (16,26)
Effective rate of taxation 29,94 28,55 15,53 11,74
In a subsidiary, the SA normal tax charge in the current year has been reduced by R6 046 000 (2015: R2 825 000) as a result of the
utilisation of a tax loss. The value of the unutilised tax loss amounts to R nil (2015: R6 046 000).

Consolidated annual fi nancial statements
| ARB Integrated report 201666
Notes to the annual fi nancial statements (continued)
for the year ended 30 June 2016
Group Company
R000’s 2016 2015 2016 2015
8. TOTAL OTHER COMPREHENSIVE INCOME
Revaluation of land 2 130 5 790 – –
Revaluation of buildings 3 549 7 629 – –
Gain on property revaluation 5 679 13 419 – –
Taxation on revaluation of land (477) (1 081) – –
Taxation on revaluation of buildings (994) (2 136) – –
CGT inclusion rate change (1 759) – – –
Total deferred taxation (3 230) (3 217) – –
Total other comprehensive income 2 449 10 202 – –
The tax charge in respect of land is calculated at the effective capital gains tax (“CGT”) rate.
Group
R000’s 2016 2015
9. EARNINGS AND DIVIDENDS PER SHARE
9.1 Basic and diluted earnings per share
Basic earnings as disclosed 135 577 121 505
Weighted number of shares 235 000 235 000
Diluted number of shares 235 000 235 000
Basic and diluted earnings per share (cents) 57,69 51,70
9.2 Headline and diluted headline earnings per share
Basic earnings as disclosed 135 577 121 505
Impairment of goodwill 5 500 –
Loss on disposal of property, plant and equipment (net of taxation) 747 21
Non-controlling interests therein (1 430) (8)
Headline earnings 140 394 121 518
Headline and diluted earnings per share (cents) 59,74 51,71
9.3 Reconciliation of weighted and diluted weighted average number of shares
Issued shares at beginning of the year 235 000 235 000
Weighted average number of shares 235 000 235 000
Dilutive effect of share options – –
Diluted weighted average number of shares 235 000 235 000

ARB Integrated report 2016 | 67
Group
R000’s 2016 2015
9. EARNINGS AND DIVIDENDS PER SHARE (continued)
9.4 Dividends per share
Dividends declared during the year 70 735 70 735
Number of shares 235 000 235 000
Dividends per share (cents) 30,10 30,10
Ordinary dividend per share (cents) 20,10 20,10
Special dividend per share (cents) 10,00 10,00
The final dividend for the year ended 30 June 2016 which has only been declared after year-end has not been included as a liability
in the financial statements.
Group Company
R000’s 2016 2015 2016 2015
10. INVESTMENT PROPERTY
Opening carrying value – – 179 688 163 231
Additions at cost – – 371 5 082
Disposals at valuation – – (8 700) –
Net valuation – – 5 710 11 375
Revaluation – – 5 678 13 419
Deferred lease smoothing – – 32 (2 044)
Closing carrying value – – 177 069 179 688
Land at carrying value – – 91 311 92 181
Buildings at carrying value – – 85 758 87 507
Closing carrying value – – 177 069 179 688
A register of land and buildings is available to shareholders at the registered office of the Company. No properties have been provided as
security.
The fair value of properties is determined every three years and updated annually by an independent professionally qualified valuator,
Glen MacMillan (M.I.V.S.A.; S.A.C.V. No. 2964). The fair values were determined at 30 June 2014 using the income and comparable method
of valuation. This involved estimating the future net annual income of the properties and capitalising this at an appropriate discount rate.
In updating the valuations at 30 June 2016, the valuator referred to current market conditions, recent sales transactions of similar
properties in similar geographical locations and the present value of future rental income expected to be earned in respect of the
properties in their current condition. The cash flows were estimated based on external evidence of current rentals for similar properties
in similar locations. In estimating the fair value of the properties, the highest and best use of the property is their current use. There has
been no change in the valuation technique used during the year. The fair value measurement of land and buildings has been classified at
a level 3 (2015: 3. The prior year level was incorrectly classified as a level 2 whereas it should have been a level 3. There have been no
changes in the inputs used in the fair value measurement, so correction not treated as a transfer). There were no transfers between fair
value levels 1, 2 or 3 during the year.

Consolidated annual fi nancial statements
| ARB Integrated report 201668
Notes to the annual fi nancial statements (continued)
for the year ended 30 June 2016
10. INVESTMENT PROPERTY (continued)
The significant and key assumptions used in the fair value measurement are as follows:
Assumption
2016
%
2015
%
Average portfolio capitalisation rate 11,77 11,61
Average portfolio cost ratio 22,87 19,81
If the average portfolio capitalisation rate changed by 0,50% upwards or downwards then the fair value adjustment to the portfolio
carrying value would have decreased by R7,6m (2015: R7,6m) and increased by R8,0m (2015: R8,4m) respectively.
If the average portfolio cost ratio changed by 2,00% upwards or downwards then the fair value adjustment to the portfolio carrying value
would have decreased by R4,8m (2015: R4,4m) and increased by R4,4m (2015: R4,4m) respectively.
R000’s
Cost/
valuation
2016
Accumulated
depreciation
2016
Carrying
value
2016
Cost/
valuation
2015
Accumulated
depreciation
2015
Carrying
value
2015
11. PROPERTY, PLANT
AND EQUIPMENT
Group
Land 91 311 – 91 311 92 181 – 92 181
Buildings 87 770 (880) 86 890 89 550 (436) 89 114
Plant and equipment 14 615 (5 132) 9 483 20 553 (14 531) 6 022
Vehicles 43 273 (17 117) 26 156 42 027 (14 651) 27 376
Office furniture and fittings 7 474 (2 556) 4 918 9 063 (6 642) 2 421
Leasehold improvements 3 191 (794) 2 397 2 194 (1 254) 940
Office equipment 2 885 (1 288) 1 597 5 608 (3 718) 1 890
Computer equipment 3 983 (1 422) 2 561 10 105 (8 377) 1 728
254 502 (29 189) 225 313 271 281 (49 609) 221 672
The carrying amounts of property, plant and equipment can be reconciled as follows:
R000’s
Carrying value
at beginning
of year Additions Revaluation Disposals Depreciation
Carrying value
at end of year
2016
Land 92 181 – 2 130 (3 000) – 91 311
Buildings 89 114 371 3 549 (5 700) (444) 86 890
Plant and equipment 6 022 5 991 – (67) (2 463) 9 483
Vehicles 27 376 5 234 – (1 641) (4 813) 26 156
Office furniture and fittings 2 421 3 674 – – (1 177) 4 918
Leasehold improvements 940 1 910 – (158) (295) 2 397
Office equipment 1 890 487 – (1) (779) 1 597
Computer equipment 1 728 2 276 – (53) (1 390) 2 561
221 672 19 943 5 679 (10 620) (11 361) 225 313

ARB Integrated report 2016 | 69
R000’s
Carrying value
at beginning
of year Additions Revaluation Disposals Depreciation
Carrying value
at end of year
11. PROPERTY, PLANT
AND EQUIPMENT
(continued)
2015
Land 86 391 – 5 790 – – 92 181
Buildings 76 840 5 081 7 629 – (436) 89 114
Plant and equipment 7 429 1 056 – (57) (2 406) 6 022
Vehicles 27 960 6 100 – (1 609) (5 075) 27 376
Office furniture and fittings 2 521 794 – (70) (824) 2 421
Leasehold improvements 915 231 – – (206) 940
Office equipment 1 470 1 050 – (7) (623) 1 890
Computer equipment 1 999 1 350 – (11) (1 610) 1 728
205 525 15 662 13 419 (1 754) (11 180) 221 672
The fair value of properties is determined every three years and updated annually by an independent professionally qualified valuator as
set out in note 10 above. There has been no change in the valuation technique used during the year. The assumptions and sensitivity to
these assumptions are also set out in note 10. The fair value measurement of land and buildings has been classified at a level 3 (2015: 3.
The prior year level was incorrectly classified as a level 2 whereas it should have been a level 3. There have been no changes in the inputs
used in the fair value measurement, so correction not treated as a transfer). There were no transfers between fair value levels 1, 2 or 3
during the year.
If the cost model had been applied, the carrying value of land would have been R27 594 000 (2015: R30 594 000) and the buildings would
have been R57 827 000 (2015: R60 904 000). A register of land and buildings is available to shareholders at the registered office of the
Company. No properties have been provided as security.
R000’s
Cost
2016
Accumulated
depreciation
2016
Carrying
value
2016
Cost
2015
Accumulated
depreciation
2015
Carrying
value
2015
Company
Plant and equipment 238 (137) 101 672 (543) 129
Vehicles 5 694 (3 361) 2 333 9 338 (5 176) 4 162
5 932 (3 498) 2 434 10 010 (5 719) 4 291
The carrying amounts of property, plant and equipment can be reconciled as follows:
R000’s
Carrying value
at beginning
of year Additions Disposals Depreciation
Carrying value
at end of year
2016
Plant and equipment 129 24 – (52) 101
Vehicles 4 162 – (1 521) (308) 2 333
4 291 24 (1 521) (360) 2 434

Consolidated annual fi nancial statements
| ARB Integrated report 201670
Notes to the annual fi nancial statements (continued)
for the year ended 30 June 2016
R000’s
Carrying value
at beginning
of year Additions Disposals Depreciation
Carrying value
at end of year
11. PROPERTY, PLANT AND EQUIPMENT
(continued)
2015
Plant and equipment 1 674 17 (1 516) (46) 129
Vehicles 6 024 – (1 052) (810) 4 162
7 698 17 (2 568) (856) 4 291
R000’s
Cost
2016
Accumulated
impairment/
amortisation
2016
Carrying
value
2016
Cost
2015
Accumulated
impairment/
amortisation
2015
Carrying
value
2015
12. INTANGIBLE ASSETS
Group
Goodwill 23 910 (5 500) 18 410 23 910 – 23 910
Trademarks 58 940 (440) 58 500 58 940 (440) 58 500
Software development costs 1 561 (468) 1 093 1 561 (312) 1 249
84 411 (6 408) 78 003 84 411 (752) 83 659
The cash-generating units (“CGU”) concerned are the Eurolux business operation and two branches in Elektro Vroomen. The carrying
amounts of intangible assets can be reconciled as follows:
R000’s
Carrying value
at beginning
of year
Impairment/
amortisation
Carrying value
at end of year
2016
Goodwill – Eurolux 18 410 – 18 410
Goodwill – Elektro Vroomen 5 500 (5 500) –
Trademark – Eurolux brand 58 500 – 58 500
Software development costs 1 249 (156) 1 093
83 659 (5 656) 78 003
2015
Goodwill – Eurolux 18 410 – 18 410
Goodwill – Elektro Vroomen 5 500 – 5 500
Trademark – Eurolux brand 58 500 – 58 500
Software development costs 1 561 (312) 1 249
83 971 (312) 83 659

ARB Integrated report 2016 | 71
12. INTANGIBLE ASSETS (continued)
Intangible assets have been valued as stated in note 2.1 and 2.4.
Elektro Vroomen goodwill was impaired as the CGUs performances were inadequate to support the valuation.
Software development costs capitalised were brought into use in 2014. Impairment tests were conducted on the carrying value based on
forecast cash flows and no impairment was considered necessary.
Impairment tests relating to the Eurolux trademark and goodwill were conducted. The Eurolux trademark is currently believed to have
an indefinite useful life as the brand is increasing its market share and there is no foreseeable limit to the period that this brand will be
generating economic benefits for the Group.
Management has calculated its cash flow and revenue projection over a five-year period. Estimated cash flows longer than five years may
result in significant fluctuations due to the higher degree of uncertainty. Impairments are made when the aggregate carrying amount
exceeds the aggregate recoverable amount of the CGU. The growth rates used do not exceed the long-term average growth rate for the
industry or market in which the Group operates. Key assumptions used in the projection are as follows:
Elektro
Vroomen
2016
%
Eurolux
2016
%
Elektro
Vroomen
2015
%
Eurolux
2015
%
Growth rate year 1 to 5 7 10 7 10
Terminal growth rate 1 4 5 5
Discount rate 13,8 11,6 20 20
Management has based its assumptions on past experience and external sources of information, such as industry sector reports and
market expectations. The discounted cash flows are most sensitive to changes in the discount rate. A 3,63% change in the discount rate
would result in the Eurolux goodwill starting to be impaired.
Ownership Shares issued Investment
% 2016 2015
2016
R000’s
2015
R000’s
13. INVESTMENTS IN SUBSIDIARIES
Company
ARB Electrical Wholesalers (Pty) Ltd 74 10 000 10 000 8 8
(Local empowered electrical wholesaler)
Eurolux (Pty) Ltd 60 1 900 1 900 78 000 78 000
(Lighting wholesaler)
ARB IT Solutions (Pty) Ltd 100 100 100 – –
(IT system developer and provider)
ARB Global (Pty) Ltd 100 100 100 – –
(Global electrical wholesaler)
CED – Consolidated Electrical Distributor (Pty) Ltd 100 120 120 – –
(Chint distributor)
78 008 78 008
Company’s share of the aggregate profits after
tax of subsidiaries 112 101 92 399

Consolidated annual fi nancial statements
| ARB Integrated report 201672
Notes to the annual fi nancial statements (continued)
for the year ended 30 June 2016
13. INVESTMENTS IN SUBSIDIARIES (continued)
All investments are stated at cost. All subsidiaries are incorporated in the Republic of South Africa. Set out below is the summarised
information in respect of each subsidiary with material non-controlling interests. Loans to and from subsidiaries is set out in note 19
below. As disclosed in note 25, the Eurolux minority shareholders hold a “put option” over their shares in the company. The Group has a
“call option” over the shares held by the Eurolux minorities, but only in the event that a minority’s employment is terminated. The “call
option” value will be determined using the same method as the “put option” disclosed in note 25. The summarised information below is
presented before inter-company eliminations and adjustments on consolidation:
ARB Electrical Wholesalers
(Pty) Ltd
R000’s 2016 2015
% of interest and voting rights held by non-controlling interest 26% 26%
Profit for the year allocated to non-controlling interest 24 594 24 849
Accumulated non-controlling interests at end of the reporting period 161 594 152 616
Dividend paid to non-controlling interest 15 600 15 600
Total revenue 1 930 086 1 695 749
Profit for the year 94 537 95 573
Total assets 882 704 783 103
Total liabilities 261 183 196 120
Net cash flow from operating activities 52 070 75 961
Net cash flow from investing activities (133 276) (9 359)
Net cash flow from financing activities (148 598) (51 145)
14. INVESTMENT IN JOINT VENTURE
Eurolux (Pty) Ltd is a 50% investor with Power Technologies Limited in Crabtree Retail (Pty) Ltd, a new venture with no initial investment
and which commenced trading in July 2015. The joint venture company is not material to the Group and is the only investment in the Group
that is accounted for using the equity method in accordance with IAS 28. It is incorporated in South Africa and distributes the Crabtree
range of electrical products to the retail trade.
Group Company
R000’s 2016 2015 2016 2015
Share of joint venture profits 1 041 – – –
Net assets of joint venture 2 082 – – –
Portion of ownership interest 50% – – –
Investment in joint venture 1 041 – – –
The joint venture has the same year-end as the Group and no dividends were received. As it is a private company no quoted market prices
are available for its shares. Loans to the joint venture are reported in note 19, and transactions are reported in note 26 (related parties).
There are no unusual restrictions on profit distribution or on the loans and advances other than normal solvency and liquidity tests. The
Directors’ valuation is R1 041 000.

ARB Integrated report 2016 | 73
Group Company
R000’s Note(s) 2016 2015 2016 2015
15. DEFERRED LEASE INCOME
Arising on the straight-lining of income earned under
operating leases:
Long-term portion – – – 2 044
Current portion – 328 2 012 –
Net deferred lease income – 328 2 012 2 044
16. DEFERRED TAXATION
Carrying value at beginning of year (30 477) (20 938) (19 218) (15 559)
Movements during the year attributable to:
Investment properties – – (4 067) (2 489)
Revaluation of land and buildings (3 139) (3 217) (371) –
Intangible assets 350 87 – –
Property, plant and equipment – other (453) (392) 309 543
Assessed loss (1 693) (2 825) – –
Provisions and other 900 (3 192) 140 (1 713)
Carrying value at end of year (34 512) (30 477) (23 207) (19 218)
The carrying value comprises:
Investment properties – – (22 235) (17 797)
Revaluation of investment properties – – (20 529) (16 462)
Building allowance – – (1 706) (1 335)
Revaluation of land and buildings (22 656) (19 517) – –
Intangible assets (16 380) (16 730) – –
Property, plant and equipment – other (4 186) (3 733) (620) (929)
Assessed loss – 1 693 – –
Provisions and other 8 710 7 810 (352) (492)
(34 512) (30 477) (23 207) (19 218)
Deferred taxation liability (41 469) (38 626) (23 207) (19 218)
Deferred taxation asset 6 957 8 149 – –
(34 512) (30 477) (23 207) (19 218)
Balance at 1 July (30 477) (20 938) (19 218) (15 559)
Current year charge 7 (805) (6 322) (1 110) (3 659)
CGT inclusion rate change 7 – – (2 879) –
Included in other comprehensive income 8 (3 230) (3 217) – –
Balance at year-end (34 512) (30 477) (23 207) (19 218)
There are no assessed losses in subsidiaries (2015: R6 046 000).
Certain prior year comparative line items have been consolidated for simplification of the note.

Consolidated annual fi nancial statements
| ARB Integrated report 201674
Notes to the annual fi nancial statements (continued)
for the year ended 30 June 2016
Group Company
R000’s Note(s) 2016 2015 2016 2015
17. INVENTORY
Merchandise for resale 458 169 404 927 – –
Allowance for impairment (18 256) (16 954) – –
439 913 387 973 – –
Inventory has been valued as stated in note 2.8.
Impairment allowance
Allowance for impairment in respect of inventory
can be reconciled as follows:
Opening carrying value 16 954 12 736 – –
Increase in impairment allowance recognised in
profit and loss 3 1 302 4 218 – –
Closing carrying value 18 256 16 954 – –
The following factors were considered in determining
the amount of the impairment of inventory:
Historic sales trends; and
Merchandise for resale on hand at reporting date
which will likely not be sold or will be sold below
cost.
18. TRADE AND OTHER RECEIVABLES
Gross trade receivables 406 184 334 402 – –
Other receivables 29 034 17 789 – –
Prepayments – 6 031 578 160
Deposits – 659 – –
VAT refundable 269 4 231 – –
435 487 363 112 578 160
Allowance for impairment (3 712) (11 767) – –
431 775 351 345 578 160
The carrying value of trade and other receivables approximated
their fair value due to the short-term nature of these instruments.
Impairment allowance
Allowance for impairment in respect of trade receivables
Opening carrying value 11 767 7 207 – –
Provision utilised (5 433) (2 005) – –
Reversal of provisions (6 334) (5 202) – –
New provisions raised 3 712 11 767 – –
Closing carrying value 3 712 11 767 – –

ARB Integrated report 2016 | 75
18. TRADE AND OTHER RECEIVABLES (continued)
The following table illustrates the relationship between aged gross trade receivables and the impairment allowance:
Group
R000’s
Gross trade
receivables
2016
Impairment
allowance
2016
Gross trade
receivable
2015
Impairment
allowance
2015
Not past due 345 074 (181) 292 420 (497)
Past due 1 to 30 days 32 763 (176) 16 401 (1 192)
Past due 31 to 60 days 6 787 (332) 8 440 (2 791)
Past due 61 days+ 21 560 (3 023) 17 141 (7 287)
406 184 (3 712) 334 402 (11 767)
The following factors were considered in determining the amount of the impairment of trade receivables: Financial difficulties, disputes,
delinquent accounts and late payments without adequate repayment arrangements. Included in gross trade receivables are non-paying
trade receivables for which claims submitted to trade credit insurance of R16,6 million (2015: nil) but against which no allowance for
impairment is considered necessary.
The gross trade receivables at the reporting date by type of customer was spread across the following categories: Government/
parastatals/municipalities; Large industry/mining sector; Large contractors; Small contractors; Wholesalers; Export customers; and
Retail and hardware chains. The Group’s diverse trade receivable balances with government, retail and hardware chains, parastatals,
municipalities, large industry, the mining sector and large contractors, reduces the Group’s exposure to credit risk.
Credit risk in respect of Group customers is reduced through the use of credit insurance. All receivables are insured except government,
parastatals, Group accounts and accounts less than R25 000. Credit evaluations are performed using the reports and tools of credit vetting
agencies amongst other things, on new customers and existing customers requiring credit above their previously authorised levels.
Listings of overdue customer balances are reviewed daily and any customers exceeding their credit terms must settle their overdue
balance before any further credit is extended. Overdue trade receivables are handed over to insurers or attorneys for collection as soon
as it becomes apparent that recovery may be uncertain.
The credit risk in respect of other receivables is considered by the Directors to be minimal as it relates to transactions with major
corporations within the Republic of South Africa.
The Group has an overdraft facility in terms of which certain subsidiaries have ceded their book debts in favour of Nedbank Ltd as security
for this facility. Of this facility, R556 000 was utilised at 30 June 2016 (for guarantees) (2015: unutilised).

Consolidated annual fi nancial statements
| ARB Integrated report 201676
Notes to the annual fi nancial statements (continued)
for the year ended 30 June 2016
Group Company
R000’s 2016 2015 2016 2015
19. LOANS RECEIVABLE/(PAYABLE)
Crabtree Retail (Pty) Ltd (Joint venture) 7 289 – – –
CED – Consolidated Electrical Distributor (Pty) Ltd – – 19 064 12 738
Eurolux (Pty) Ltd – – 117 786 76 692
ARB Global (Pty) Ltd – – 960 (2 804)
ARB IT Solutions (Pty) Ltd – – (795) (221)
ARB Electrical Wholesalers (Pty) Ltd – – (181 349) (26 970)
7 289 – (44 334) 59 435
Current assets 7 289 – 137 810 89 430
Current liabilities – – (182 144) (29 995)
7 289 – (44 334) 59 435
The carrying value of loans receivable/payable approximated their fair value due to the short-term nature of these instruments. These
loans are unsecured, bear interest at rates linked to prime and have no fixed terms of repayment. They arise primarily for the purposes
of trading as the Company performs a treasury function for the Group. These loans are neither past due nor impaired.
Group Company
R000’s 2016 2015 2016 2015
20. CASH AND CASH EQUIVALENTS
Cash on hand – 161 – 1
Money market instruments 138 402 – 138 402 –
Bank balances 104 867 226 619 132 16 510
243 269 226 780 138 534 16 511
Money market instruments are collective investments in various cash and cash equivalent investments with a 24-hour liquidity, mainly
the Nedgroup Core Income Fund.
Group Company
R000’s 2016 2015 2016 2015
21. SHARE CAPITAL AND PREMIUM
Authorised
1 000 000 000 ordinary shares of 0,01 cents each 100 100 100 100
Issued
235 000 000 ordinary shares of 0,01 cents 24 24 24 24
Share premium 116 150 116 150 116 150 116 150
116 174 116 174 116 174 116 174
The Directors are authorised, until the forthcoming Annual General Meeting, to issue and allot 5% of the unissued shares for any purpose
and upon such terms and conditions as they deem fit.

ARB Integrated report 2016 | 77
Group Company
R000’s 2016 2015 2016 2015
22. RESERVES
Revaluation reserve 71 002 70 302 – –
Property reserve – – 71 118 71 314
The property reserve is a voluntary reserve that represents
the amount by which land and buildings have been revalued.
There are no restrictions on the distribution of this reserve.
Capital reserve
The capital reserve is the gain which arose from the
sale of the electrical wholesale operations to ARB Electrical
Wholesalers (Pty) Ltd in 2004 in terms of a Broad-Based Black
Economic Empowerment transaction. There are no restrictions
on the distribution of this voluntary reserve. – – 26 234 26 234
23. DEFERRED LEASE PAYMENTS
Arising on the straight-lining of payments made under
operating leases:
Long-term portion 393 981 – –
Current portion 1 140 11 – –
Net deferred lease payments 1 533 992 – –
24. TRADE AND OTHER PAYABLES
Trade payables 263 393 218 822 – –
Accruals 31 963 9 180 2 145 1 930
Leave pay and bonus accrual 14 203 7 112 – 286
VAT payable 6 857 9 908 365 525
Payroll accruals – 5 257 – –
Share appreciation rights – 1 030 – –
Other payables – 876 – –
316 416 252 185 2 510 2 741
The carrying value of trade and other payables approximated their fair value due to the short-term nature of these instruments.

Consolidated annual fi nancial statements
| ARB Integrated report 201678
Notes to the annual fi nancial statements (continued)
for the year ended 30 June 2016
Group Company
R000’s Note(s) 2016 2015 2016 2015
25. PUT OPTION LIABILITY
Balance at the beginning of the year 75 314 71 958 – –
Unwinding present value discount 6 7 720 6 656 – –
Change in assumptions 3 1 476 (3 300) – –
Balance at the end of the year 84 510 75 314 – –
A put option liability in respect of the non-controlling interests in subsidiaries arise from arrangements whereby the non-controlling
shareholders of Eurolux (Pty) Ltd have the right to put their remaining shareholding to the Group after December 2016 at a multiple of
60% of the Group’s 120-day Volume Weighted Average Price Earnings Multiple (with a minimum of 4 and a maximum of 7,5) applied to
the annual average of Eurolux’s last 36 months profit after tax, immediately preceding the Group’s most recent reporting period. For a
maturity analysis and further disclosures refer to note 27.5.
The key assumptions used in estimating the value of the put option liability are: Growth rate of 10% (2015: 10%); price earnings multiple
of 6,85x (2015: 7,5x) and the discount rate of 10,25% (2015: 9,25%). If the multiple was decreased to 5,7x or increased to 7,5x, the put
option liability would decrease by R14,2m (2015: R16,1m) or increase by R8,0m (2015: nil), respectively.
26. RELATED-PARTY TRANSACTIONS
The subsidiaries of the Group are identified in note 13 and their nature of business is set out in the Directors’ report. Joint ventures in
note 14 are also included as related parties. All of these are related parties to the Company.
Key management personnel
Key management personnel of the Group are those persons having authority and responsibility for planning, directing and controlling the
activities of the Group, directly and indirectly, and include Directors of subsidiaries, Divisional Directors and Regional Managers. The key
management personnel of the Company exclude the Directors.
Group Company
R000’s Note(s) 2016 2015 2016 2015
Rentals paid to companies controlled by key
management in Eurolux* (12 060) (11 644) – –
Purchases from companies controlled by key
management (640) – – –
Sales to entities controlled by Directors 250 298 – –
Recoveries from joint venture 1 315 – – –
Sales to joint venture 3 311 – – –
Interest charged to joint venture 5 867 – – –
Rentals from Group companies – – 26 606 22 310
Management fees to Group companies – – 9 661 8 364
Interest paid to Group companies 6 – – (8 213) (2 393)
Interest received from Group companies 5 – – 11 072 7 235
* The Group has a “call option” to acquire the properties held by companies controlled by the key management of Eurolux at fair market value exercisable after December 2016.
Details of material transactions with related parties are disclosed below and also in note 5 (Interest received); note 6 (interest paid);
note 13 (investment in subsidiaries); note 19 (loans receivable/payable).

ARB Integrated report 2016 | 79
26. RELATED-PARTY TRANSACTIONS (continued)
Directors’ emoluments
R000’s Salary
Performance
bonus
Directors’
fees
Contributions
to retire-
ment funds
Share
appreciation
rights
Other
employment
benefits Total
2016
Executive Directors
WR Neasham 2 410 – – 241 – 247 2 898
GM Scrutton1 1 180 – – 207 – 159 1 546
Non-Executive Directors
AR Burke – – 436 – – – 436
ST Downs – – 367 – – – 367
JS Dixon2 – – 171 – – – 171
G Pretorius3 – – 139 – – – 139
RB Patmore – – 350 – – – 350
3 590 – 1 462 448 – 406 5 907
2015
Executive Directors
B Nichles4 973 1 363 – 90 – 69 2 495
WR Neasham 1 857 996 – 180 406 174 3 613
Non-Executive Directors
AR Burke – – 424 – – – 424
ST Downs – – 364 – – – 364
JR Modise – – 119 – – – 119
G Pretorius – – 327 – – – 327
RB Patmore – – 347 – – – 347
2 830 2 359 1 581 270 406 243 7 689
1. Appointed 1 October 2015.2. Appointed 18 January 2016.3. Retired 12 November 2015.4. Resigned 31 October 2014.

Consolidated annual fi nancial statements
| ARB Integrated report 201680
Notes to the annual fi nancial statements (continued)
for the year ended 30 June 2016
26. RELATED-PARTY TRANSACTIONS (continued)
Remuneration paid to key management
Group Company
R000’s 2016 2015 2016 2015
Short-term employment benefits 26 860 34 535 – –
Contributions to retirement funds 2 651 2 548 – –
Other employment benefits 3 547 3 969 – –
33 058 41 052 – –
Share appreciation rights
Accrual at beginning of year 1 030 8 572 – 1 689
Cost of SARs exercised during the year (1 269) (6 428) – (406)
Expense/(gain) during the year 281 (1 114) – (1 283)
Accrual at the end of the year 42 1 030 – –
The expense/gain above arises from SARs forfeited with the resignation of the participants and the effect of the change in assumptions
as disclosed above.
Share appreciation rights
The Directors elected to introduce a Share Appreciation Rights (“SARs”) Plan in previous years. These were awarded to Directors of the
Company and its subsidiaries, together with key management personnel. These plans are 100% cash-settled and no shares will be
subscribed for or allotted in terms hereof. The details of the SARs granted for each plan are detailed below:
Group Company Group Company Group Company
Number of SARs Plan 3 No. of SARs Plan 2 No. of SARs Plan 1 No. of SARs
Outstanding at beginning of
prior year 8 644 2 032 868 120 1 856 400
Current year transactions
Exercised (1 933) (280) (249) – (708) –
Forfeited/declined (1 632) (912) (320) (120) (440) (400)
Outstanding at beginning
of year 5 079 840 299 – 708 –
Current year transactions
Exercised (1 665) (280) (130) – (668) –
Forfeited/declined (82) – (40) – (40) –
Outstanding at the end
of the year 3 332 560 129 – – –

ARB Integrated report 2016 | 81
26. RELATED-PARTY TRANSACTIONS (continued)
The fair value was calculated using the Black Scholes pricing market model. The assumptions used in determining the fair value of each
SARs granted are summarised below:
2016 2015 2016 2015 2016 2015
Hurdle price R6,25 R5,58 R5,54 R4,95 R4,92 R4,33
Share price R5,50 R6,00 R5,50 R6,00 R5,50 R6,00
Grant price R4,72 R4,72 R3,84 R3,84 R3,11 R3,11
Expected SAR life 5 years 5 years 5 years 5 years 5 years 5 years
Volatility 30% 30% 30% 30% 30% 30%
Risk-free rate 8,8% 7,8% 8,8% 7,8% 8,8% 7,8%
Dividend yield 2,99% 3,35% 2,99% 3,35% 2,99% 3,35%
Year of issue 2013 2013 2012 2012 2011 2011
Remaining contractual life 2 years 3 years 1 year 2 years – 1 year
The risk-free rate of 8,8% (2015: 7,8%) has been assumed, based on the prevailing return on a R186 government bond as at 30 June 2016.
The volatility of 30% was determined based on the historical volatility of the Company’s share price over the previous year. The dividend
yield of 2,99% is based on the dividends paid over the previous year.
The share price of R5,50 is determined by the Volume Weighted Average Price (“VWAP”) of the Company’s share price for June 2016.
No further SARs have been awarded during the year under review.
The expense/(gain) above arises from SARs forfeited with the resignation of the participants and the effect of the change in assumptions
as disclosed above.
R000’s
Non-financial
instruments
Loans and
receivables
Liabilities
at amortised
cost
Liabilities at
fair value
through profit
and loss
Carrying
value
27. FINANCIAL RISK MANAGEMENT
Classification of financial instruments
Group
Assets
2016
Trade and other receivables 269 431 506 – – 431 775
Cash and cash equivalents – 243 269 – – 243 269
Loans receivable – 7 289 – – 7 289
2015
Trade and other receivables 4 231 347 114 – – 351 345
Cash and cash equivalents – 226 780 – – 226 780
Deferred lease income – 329 – – 329
Liabilities
2016
Put option liability – – – 84 510 84 510
Trade and other payables 21 060 – 295 356 – 316 416
Deferred lease payments 1 140 – – – 1 140

Consolidated annual fi nancial statements
| ARB Integrated report 201682
Notes to the annual fi nancial statements (continued)
for the year ended 30 June 2016
R000’s
Non-financial
instruments
Loans and
receivables
Liabilities
at amortised
cost
Liabilities at
fair value
through profit
and loss
Carrying
value
27. FINANCIAL RISK MANAGEMENT
(continued)
2015
Put option liability – – – 75 314 75 314
Trade and other payables 18 050 – 234 135 – 252 185
Deferred lease payments – – 981 – 981
Company
Assets
2016
Deferred lease income 2 012 – – – 2 012
Loan receivable – 137 810 – – 137 810
Trade and other receivables 578 – – – 578
Cash and cash equivalents – 138 534 – – 138 534
2015
Deferred lease income – 2 044 – – 2 044
Loans receivable – 89 430 – – 89 430
Trade and other receivables – 160 – – 160
Cash and cash equivalents – 16 511 – – 16 511
Liabilities
2016
Trade and other payables 365 – 2 145 – 2 510
Loans payable – – 182 144 – 182 144
2015
Trade and other payables 812 – 1 929 – 2 741
Loans payable – – 29 995 – 29 995
The Group’s operations expose it to a number of financial instrument risks, namely credit, liquidity, interest rate and foreign exchange
risks. The Group has a financial risk management process in place to protect against and minimise the potential effects of these financial
risks. This note presents information regarding the exposure to each of these risks and processes for managing them.

ARB Integrated report 2016 | 83
27. FINANCIAL RISK MANAGEMENT (continued)
27.1 Credit risk
Credit risk is the risk of financial loss if a customer or counter-party to a financial instrument fails to meet its contractual obligations
and arises principally from the Group’s gross trade receivables and cash and cash equivalents held at banking institutions.
The Group trades only with recognised, creditworthy third parties and it is the Group’s policy that all customers who wish to trade
on credit terms are subject to credit verification procedures. In addition, trade receivable balances are monitored on an ongoing
basis with the result that the Group’s exposure to bad debts is not significant. The Group also believes that it has no significant
exposure to credit risk due to the large number of customers comprising the Group’s customer base and their dispersion across
different industries and geographical areas. Credit risk in respect of ARB Electrical Wholesalers (Pty) Ltd (since 1 May 2015),
Eurolux (Pty) Ltd and CED – Consolidated Electrical Distributor (Pty) Ltd is reduced as they maintain credit insurance in respect
of all their customers except government, parastatals and small accounts under R25 000. The maximum exposure is the carrying
amount as disclosed in note 18.
With respect to credit risk arising from the other financial assets of the Group, the Group’s exposure to credit risk arises from
default of the counter-party, with a maximum exposure equal to the carrying amount of these instruments.
With respect to credit risk arising from loans to related parties, the Company’s exposure to credit risk is mitigated by the fact that
all related parties are solvent and liquid and have the ability to raise capital from outside the Group to repay the loans from the
holding company.
To limit this exposure, the Group’s cash is placed only with reputable financial institutions of high credit standing and limits its
exposure to A rated (or better) counterparties.
27.2 Liquidity risk
Liquidity risk is the risk that the Group will not be able to meet its financial obligations as they fall due.
The Group ensures, as far as possible, that it has sufficient liquidity available to meet its liabilities as and when they fall due. Daily
and monthly cash flow requirements are monitored to ensure sufficient cash is available on demand or that access to facilities is
available to meet expected operational expenses. Any surplus cash is appropriately invested. The Group maintains a balance
between continuity of funding and flexibility through the use of bank facilities and inter-company funding.
In addition, the subsidiaries have primary and secondary general banking facilities of R155m (2015: R118m) and R73m
(2015: R110m) respectively available to finance any foreign trade requirements. At the year-end only R0,6m (2015: R nil) of general
banking facilities had been used and R33m (2015: R nil) of the trade facilities had been used. The Group has complied with all bank
facility covenants during the year, predominantly related to times debtors’ cover (two times trade debtors less than 90 days old
and excluding intercompany accounts), negative pledge over assets and incurring of new debt.
In terms of the Company’s Memorandum of Incorporation, there is no limit on the Group’s authority to raise interest-bearing debt.
27.3 Interest rate risk
Interest rate risk is the risk that changes in the interest rate will affect the Group’s income or value of its financial instruments,
namely its cash and cash equivalents and interest-bearing borrowings.
The Group’s exposure to the risk of changes in market interest rates relate primarily to the borrowing obligations and loans
receivable within the Group, with a variable interest rate. As part of the process of managing the Group’s interest rate risk, interest
rate characteristics of new borrowings and the refinancing of existing borrowings are positioned according to expected movement
in the interest rate. Full details of interest rates relating to borrowings and loans receivable are detailed in note 19.
The Group’s income and operating cash flows are substantially independent of changes in the interest rates.

Consolidated annual fi nancial statements
| ARB Integrated report 201684
Notes to the annual fi nancial statements (continued)
for the year ended 30 June 2016
27. FINANCIAL RISK MANAGEMENT (continued)
27.3 Interest rate risk (continued)
Surplus cash and cash equivalents exposed to interest rate risk are placed with institutions and facilities which yield the highest rate
of return, but which are still within acceptable risk parameters. The cash equivalent balances vary during the month and during the
year in line with business cycles. The sensitivity analysis below is based on the year-end cash and loans receivable balances:
Sensitivity analysis
Group Company
R000’s 2016 2015 2016 2015
Loans receivable less loans payable
Increase of 100 basis points would result in an
improvement of profit before tax of 73 – (443) 594
Decrease of 200 basis points would result in a reduction
of profit before tax of (145) – 886 (1 189)
Cash and cash equivalents
Increase of 100 basis points would result in an
improvement of profit before tax of 2 433 2 268 1 385 165
Decrease of 200 basis points would result in a reduction
of profit before tax of (4 866) (4 536) (2 770) (330)
27.4 Foreign exchange risk
ARB Global, CED and ARB Electrical counter their exposure to foreign currency risk against stronger currencies by entering into
forward exchange contracts where there is a pre-determined selling price. Such exposure arises from purchases in currencies
other than in South African Rands. It is the Group’s policy to make use of forward exchange contracts to eliminate the currency
exposure on any individual transaction for which the payment is anticipated to be more than one month after the Group has entered
into a firm commitment for a purchase. The Group does not formally hedge its foreign currency risk.
Forward exchange contracts which relate to future commitments at year-end were:
Currency 000’s Average rate Matures
US$ 1 547 15,41 1 to 4 months
EUR 130 17,30 1 month
The Group has the following exposures in foreign currencies as follows:
Group
000’s
US$
2016
Euro
2016
US$
2015
Euro
2015
Year-end rates 14,68 16,26 12,19 13,64
Foreign denominated receivables 1 388 444 936 89
Foreign denominated cash and equivalents 353 342 513 11
Foreign denominated payables (1 466) (1) (2 060) (134)
On-balance sheet exposures 275 785 (611) (34)

ARB Integrated report 2016 | 85
Group
000’s
US$
2016
Euro
2016
US$
2015
Euro
2015
27. FINANCIAL RISK MANAGEMENT (continued)
27.4 Foreign exchange risk (continued)
Open purchase orders (5 064) (135) (882) –
Open sales orders 995 – – –
Open normal letters of credit (not accrued) (839) (130) – –
Open forward exchange contracts (buy) 1 547 130 92 135
Total exchange exposure (3 086) 650 (1 401) 101
R000’s R000’s R000’s R000’s
Foreign exchange – sensitivity analysis
If the Rand weakened by 10%, it would result in a
decrease of profit before tax of: (4 530) 1 057 (512) (185)
If the Rand strengthened by 10%, it would result in an
increase of profit before tax of: 4 530 (1 057) 512 185
27.5 Financial liabilities – maturity analysis
The table below summarises the maturity profile of the financial liabilities based on contractual undiscounted payments and the
Directors’ view on the timing of the payment of the put option liability:
Group Company
R000’s 2016 2015 2016 2015
Payable 2 to 5 years
Put option liability* 88 736 89 258 – –
Payable in 1 to 12 months
Trade and other payables 295 356 234 135 2 145 1 930
Loan payable to Group Companies – – 182 144 29 995
* The put options are exercisable at the option of the non-controlling interests after December 2016 and payable six months after notice has been given. The Directors are of the opinion, however, that 40% of the value of the put option liability will be exercised in two to four years and the balance in 10 to 20 years’ time.

Consolidated annual fi nancial statements
| ARB Integrated report 201686
Notes to the annual fi nancial statements (continued)
for the year ended 30 June 2016
27. FINANCIAL RISK MANAGEMENT (continued)
27.6 Capital management
The Group’s objectives when managing capital are to safeguard the entity’s ability to continue as a going concern, so that it can
continue to provide returns for shareholders and benefits for other stakeholders, and to provide an adequate return to shareholders
by pricing products and services commensurately with the level of risk.
The Group sets the amount of capital in proportion to risk. The Group changes the capital structure and makes adjustments to it
in the light of changes in economic conditions and the risk characteristics of the underlying assets. In order to maintain or adjust
the capital structure, the Group may adjust the amount of dividends paid to shareholders, return capital to shareholders, issue
new shares, repurchase shares or sell assets to reduce debt.
There were no changes in the Group’s approach to capital management during the year. The Group is not subject to any externally
imposed capital requirements.
The Group monitors capital on the basis of the debt-to-adjusted capital ratio. This ratio is calculated as net debt divided by capital.
Net debt is calculated as total debt# (as shown in the statement of financial position) excluding the put option liability and less cash
and cash equivalents.
Capital comprises all components of equity.
The debt-to-adjusted capital ratio at 30 June was as follows:
Group Company
R000’s 2016 2015 2016 2015
Total debt# 316 416 252 185 184 654 52 175
Cash and cash equivalents (243 269) (226 780) (138 534) (16 511)
Net debt 73 147 25 405 46 120 35 664
Total equity 986 782 910 497 327 938 317 957
Debt to adjusted capital ratio 0,07:1 0,03:1 0,14:1 0,11:1
The increase in the Group’s debt-to-capital ratio during 2016 resulted mainly from creditor funding (creditor days) which is largely
as a result of the nature and timing of stock purchases and not as a consequence of any change in payment terms to suppliers.
Stock days remained similar to the previous year.
27.7 Fair value hierarchy of financial instruments
Financial assets and liabilities measured at fair value in the statement of financial position are categorised in its entirety into the
following three levels of the fair value hierarchy based on the basis of the lowest level input that is significant to the fair value
measurement in its entirety:
Level 1: fair value measured using quoted prices (unadjusted) in active markets for identical financial assets or liabilities;
Level 2: fair value measured using inputs other than quoted prices included within level 1 that are observable for the financial
asset or liability, either directly or indirectly; and
Level 3: fair value measured using inputs for the financial asset or liability that are not based on observable market data.
Financial assets and liabilities that are measured at fair value on a recurring basis:

ARB Integrated report 2016 | 87
27. FINANCIAL RISK MANAGEMENT (continued)
27.7 Fair value hierarchy of financial instruments (continued)
Group Company
R000’s
Carrying
value
Fair value
Level 3
At amortised
cost
Carrying
value
At amortised
cost
2016
Financial assets
Trade and other receivables 431 775 – – 578 –
Trade and other receivables 431 506 – 431 506 – –
Non-financial instruments 269 – – 578 –
Loans receivable 7 289 – 7 289 137 810 137 810
Cash and cash equivalents 243 269 – 243 269 138 534 138 534
682 332 – 682 064 276 922 276 922
Financial liabilities
Put option liability 84 510 84 510 – – –
Trade and other payables 316 416 – – 2 510 –
Trade and other payables 295 356 – 295 356 2 145 2 145
Non-financial instruments 21 060 – – 365 –
Loans payable – – – 182 144 182 144
Deferred lease payments 1 140 – – – –
402 066 84 510 295 356 184 654 184 289
2015
Financial assets
Deferred lease income 328 – 328 2 044 2 044
Trade and other receivables 351 345 – – 160 –
Trade and other receivables 347 114 – 347 114 160 160
Non-financial instruments 4 231 – – – –
Loans receivable – – – 89 430 89 430
Cash and cash equivalents 226 780 – 226 780 16 511 16 511
578 454 – 574 223 108 145 108 145
Financial liabilities
Put option liability 75 314 75 314 – – –
Trade and other payables 252 185 – – 2 741 –
Trade and other payables 234 135 – 234 135 1 929 1 929
Non-financial instruments 18 050 – – 812 –
Loans payable – – – 29 995 29 995
Deferred lease payments 981 – 981 – –
328 480 75 314 235 116 32 736 31 924

Consolidated annual fi nancial statements
| ARB Integrated report 201688
Notes to the annual fi nancial statements (continued)
for the year ended 30 June 2016
27. FINANCIAL RISK MANAGEMENT (continued)
27.7 Fair value hierarchy of financial instruments (continued)
There have been no transfers between levels. The fair value of the put option financial liability disclosed under level 3 has been
determined in accordance with the predetermined valuation method, inputs and present value techniques. The key assumptions,
sensitivity analysis and a reconciliation of the movement has been disclosed in note 25. The only unobservable from market data
input is Eurolux’s historic profits. The assumed profits were based on historic performance but adjusted for expected growth.
28. GUARANTEES
A limited cross guarantee, incorporating a cession of loan funds, has been given by each of ARB Holdings Limited, ARB Electrical
Wholesalers (Pty) Ltd, Elektro Vroomen (Pty) Ltd, Industrial Cable Supplies (Pty) Ltd and ARB Global (Pty) Ltd in favour of Nedbank for
general banking and trade facilities granted to ARB Electrical Division of R48m.
A limited guarantee, incorporating a cession of loan funds, has been given in favour of Nedbank for general banking and trade facilities
granted to Eurolux (Pty) Ltd of R55m.
Guarantees issued by Nedbank Ltd on behalf of subsidiaries amounted to R611 000 (2015: R559 000). Other than these guarantees, the
general banking facilities within the Company and the Group are unutilised at 30 June 2016 and 2015. Trade facilities have been utilised
for letters of credit, forward exchange contracts and similar trade products to the extent of R29,8m.
29. COMMITMENTS AND CONTINGENCIES
Group contingencies
During December 2015 the Group received a summons from a major listed construction company, as third respondent (after their
insurance company and insurance broker), claiming R76,4m “as a result of the incorrect cable being procured or incorrect cables being
installed incorrectly”. The Group is confident that it supplied and delivered the cable specified on their order. Attorneys have been
appointed to defend the matter and no provision has been made as the Directors believe that there is no justification for this claim.
Group commitments
The Group has capital commitments of:
R000’s
Contracted
2016
Not contracted
2016
Contracted
2015
Not contracted
2015
Motor vehicles 1 446 – 3 021 –
Furniture and fittings 1 862 – 888 –
3 308 – 3 909 –
The Company has no capital commitments.
Operating lease commitments
The Group has entered into 12 (2015: eight) operating lease agreements in respect of fixed property used for warehousing, offices and
branch trading facilities. These leases generally have an initial three to five-year lease term with options to renew at market-related
rentals. Annual escalations from 6% to 10% are common to all leases. No leases contain contingent rent provisions or covenants. Future
maximum lease payments under non-cancellable operating leases are as follows:
R000’s Up to 1 year 2 to 5 years 6 to 10 years Total
Group
2016 20 635 68 748 1 996 91 379
2015 13 581 63 759 9 794 87 134

ARB Integrated report 2016 | 89
29. COMMITMENTS AND CONTINGENCIES (continued)
Operating lease income
At year-end the Company has operating lease income from Group companies under 13 (2015: 14) lease agreements. These premises are
leased monthly from 1 June 2014 to 30 June 2017. At 30 June 2017, these leases will be renegotiated at market-related rentals and
escalations for another three years. Future maximum lease income under non-cancellable leases are as follows:
R000’s Up to 1 year 2 to 5 years 6 to 10 years Total
Company
2016 25 315 – – 25 315
2015 24 524 26 730 – 51 254
30. SEGMENT REPORT
IFRS 8 requires operating segments to be identified on the basis of internal reporting on operating divisions of the Group that are regularly
reviewed by the chief operating decision maker in order to allocate resources to the segments and to assess their performance. The
Group’s reportable segments were identified primarily based on the difference in products or services offered by the different segments
rather than geographical area or regulatory environments in which they operate.
Based on management’s monthly significant reporting segments, the segment report has been prepared by operating segment. As a
result, the primary reporting format is by business segments with no secondary reporting format.
The Group has three operating segments from which it derives its revenue. The activities associated with each segment are noted below:
Electrical – Distributors of electrical products across three main categories: power and instrumentation cable, overhead line equipment
and conductors, and low voltage products.
Lighting – Distributors of incandescent, energy saving LED and fluorescent lamps, light fittings and electrical accessories.
Corporate – Property holding and specialist IT hardware, software services and support.
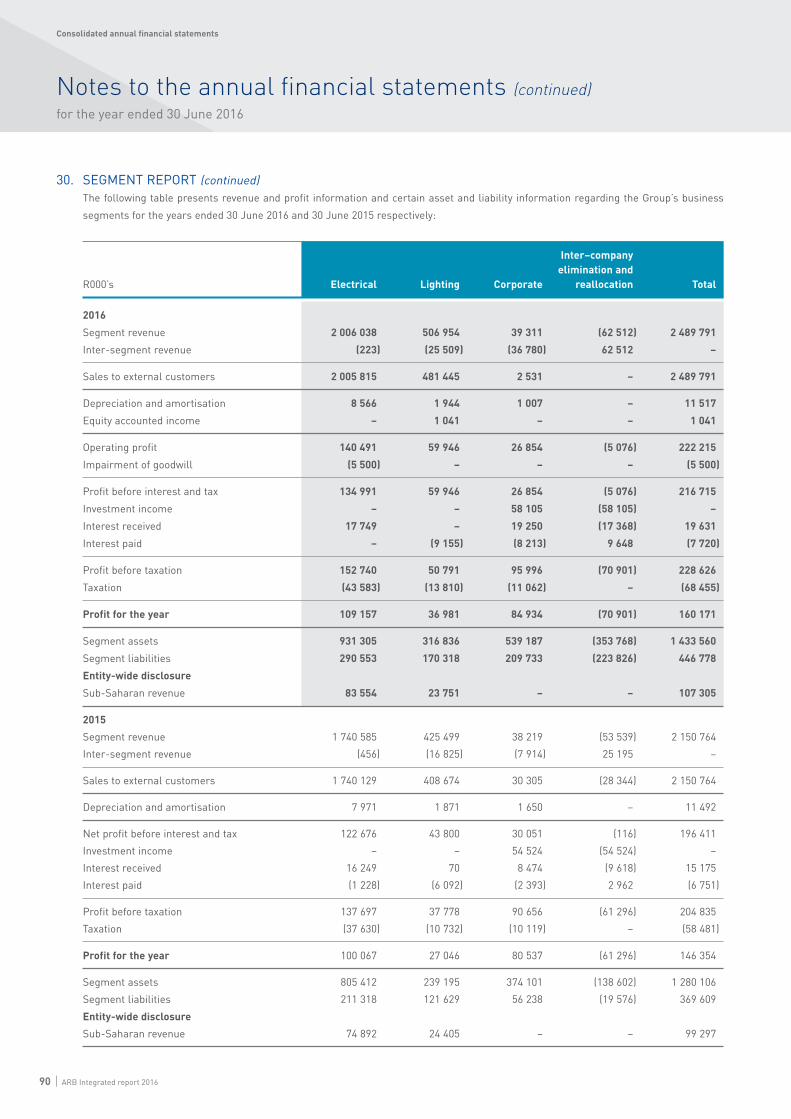
Consolidated annual fi nancial statements
| ARB Integrated report 201690
Notes to the annual fi nancial statements (continued)
for the year ended 30 June 2016
30. SEGMENT REPORT (continued)
The following table presents revenue and profit information and certain asset and liability information regarding the Group’s business
segments for the years ended 30 June 2016 and 30 June 2015 respectively:
R000’s Electrical Lighting Corporate
Inter–company
elimination and
reallocation Total
2016
Segment revenue 2 006 038 506 954 39 311 (62 512) 2 489 791
Inter-segment revenue (223) (25 509) (36 780) 62 512 –
Sales to external customers 2 005 815 481 445 2 531 – 2 489 791
Depreciation and amortisation 8 566 1 944 1 007 – 11 517
Equity accounted income – 1 041 – – 1 041
Operating profit 140 491 59 946 26 854 (5 076) 222 215
Impairment of goodwill (5 500) – – – (5 500)
Profit before interest and tax 134 991 59 946 26 854 (5 076) 216 715
Investment income – – 58 105 (58 105) –
Interest received 17 749 – 19 250 (17 368) 19 631
Interest paid – (9 155) (8 213) 9 648 (7 720)
Profit before taxation 152 740 50 791 95 996 (70 901) 228 626
Taxation (43 583) (13 810) (11 062) – (68 455)
Profit for the year 109 157 36 981 84 934 (70 901) 160 171
Segment assets 931 305 316 836 539 187 (353 768) 1 433 560
Segment liabilities 290 553 170 318 209 733 (223 826) 446 778
Entity-wide disclosure
Sub-Saharan revenue 83 554 23 751 – – 107 305
2015
Segment revenue 1 740 585 425 499 38 219 (53 539) 2 150 764
Inter-segment revenue (456) (16 825) (7 914) 25 195 –
Sales to external customers 1 740 129 408 674 30 305 (28 344) 2 150 764
Depreciation and amortisation 7 971 1 871 1 650 – 11 492
Net profit before interest and tax 122 676 43 800 30 051 (116) 196 411
Investment income – – 54 524 (54 524) –
Interest received 16 249 70 8 474 (9 618) 15 175
Interest paid (1 228) (6 092) (2 393) 2 962 (6 751)
Profit before taxation 137 697 37 778 90 656 (61 296) 204 835
Taxation (37 630) (10 732) (10 119) – (58 481)
Profit for the year 100 067 27 046 80 537 (61 296) 146 354
Segment assets 805 412 239 195 374 101 (138 602) 1 280 106
Segment liabilities 211 318 121 629 56 238 (19 576) 369 609
Entity-wide disclosure
Sub-Saharan revenue 74 892 24 405 – – 99 297

ARB Integrated report 2016 | 91
30. SEGMENT REPORT (continued)
Geographical information
All trading activities and non-current assets of the segments are domiciled in South Africa. No single customer contributes more than
10% of the Group’s revenue.
Group Company
R000’s 2016 2015 2016 2015
31. STATEMENTS OF CASH FLOW NOTES
Taxation paid
Taxation paid in advance at beginning of year 200 122 – –
Taxation owing at beginning of year (2 492) (2 725) (221) (886)
Current year tax charge (67 650) (52 159) (10 856) (8 335)
Taxation paid in advance at year-end – (200) – –
Taxation owing at year-end 2 850 2 492 646 221
Taxation paid (67 092) (52 470) (10 431) (9 000)
32. RESTATEMENT OF PRIOR PERIOD AMOUNTS
Put option liability
When Eurolux was acquired in January 2012, the financial liability relating to the written put options on the shares of Eurolux held by non-
controlling interests (“NCI”), which entitle the NCI to sell their interest in Eurolux to the Group, was not accounted for. On the signing of the put
option agreement, the Group should have recorded a financial liability for its contractual obligation to pay the put option at the present value of
the estimated option price discounted from the option exercisable date to the reporting date. In recognising this put option liability in accordance
with the Group’s accounting policy, the NCI should have been derecognised, and any excess or shortfall charged or realised directly in
accumulated profits in the statement of changes in equity. Dividends paid to the derecognised NCI should have been charged to profit and loss.
The unwinding of the present value discount on this financial liability should have been recorded in finance charges. The financial liability
should have been fairly valued at the end of each financial year and any changes in the fair value of the liability as a result of changes in
assumptions used to estimate the future option price should have been recognised in profit and loss.
In terms of the put options, the NCI have the right to put their remaining shareholding to the Group after December 2016. The put option
value is calculated at a multiple of 60% of the Group’s 120-day Volume Weighted Average Price Earnings Multiple (with a minimum of 4 and
a maximum of 7,5) applied to the annual average of Eurolux’s last 36 months profit after tax, immediately preceding the Group’s most recent
reporting period.
Further details surrounding the put option liability and related expenses are disclosed in notes 3, 6 and 25. The adjustment and effect on
earnings per share, which is the same as the headline earnings per share, are set out below:
R000’s Gross amount Tax effect EPS effect
Effect on basic and diluted earnings per share in 2015
Profit as previously reported 117 459 – 49,98
Dividends paid to derecognised non-controlling interests now expensed (3 416) – (1,45)
Change in put option liability assumptions 3 300 – 1,40
Unwinding of put option liability discount to present value (6 656) – (2,83)
Derecognition of non-controlling interest 10 818 – 4,60
121 505 – 51,70
The effects on headline and diluted headline earnings are the same as above.

Consolidated annual fi nancial statements
| ARB Integrated report 201692
Notes to the annual fi nancial statements (continued)
for the year ended 30 June 2016
32. RESTATEMENT OF PRIOR PERIOD AMOUNTS (continued)
The effects on previously reported comparative figures are as follows:
R000’s
As previously
stated
Prior period
restatement As restated
2015
Statements of comprehensive income
Overheads (324 839) (116) (324 955)
Profit before interest and taxation 196 527 (116) 196 411
Interest paid (95) (6 656) (6 751)
Profit before taxation 211 607 (6 772) 204 835
Profit for the year 153 126 (6 772) 146 354
Total comprehensive income 163 328 (6 772) 156 556
Profit for the year attributable to: 153 126 (6 772) 146 354
Non-controlling interests 35 667 (10 818) 24 849
ARB ordinary shareholders 117 459 4 046 121 505
Total comprehensive income attributable to: 163 328 (6 772) 156 556
Non-controlling interests 35 667 (10 818) 24 849
ARB ordinary shareholders 127 661 4 046 131 707
Statements of financial position
Accumulated profits 582 845 (11 424) 571 421
Attributable to ARB ordinary shareholders 769 321 (11 424) 757 897
Non-controlling interests 216 490 (63 890) 152 600
Total equity and reserves 985 811 (75 314) 910 497
Put option liability – 75 314 75 314
Non-current liabilities 39 607 75 314 114 921
Statements of cash flow
Profit for the year 153 126 (6 772) 146 354
Change in put option liability assumptions – (3 300) (3 300)
Interest paid 95 6 656 6 751
Operating cash flow before working capital changes 208 271 (3 416) 204 855
Cash generated by operating activities 170 292 (3 416) 166 876
Dividends paid (89 751) 3 416 (86 335)
Statements of change in equity
Total comprehensive income for the year
Profit for the year – ARB ordinary shareholders 117 459 4 046 121 505
Profit for the year – non-controlling interests 35 667 (10 818) 24 849
Dividends – non-controlling interests 19 016 (3 416) 15 600

ARB Integrated report 2016 | 93
R000’s
As previously
stated
Prior period
restatement As restated
32. RESTATEMENT OF PRIOR PERIOD AMOUNTS (continued)
2014
Statements of financial position
Accumulated profits 536 122 (15 471) 520 651
Attributable to ARB ordinary shareholders 712 396 (15 471) 696 925
Non-controlling interests 199 838 (56 487) 143 351
Total equity and reserves 912 234 (71 958) 840 276
Put option liability – 71 958 71 958
Non-current liabilities 34 127 71 958 106 085