annual liquid pipeline safety performance report & strategic plan 2013
TRANSCRIPT

ANNUAL LIQUID PIPELINE SAFETY PERFORMANCE REPORT & STRATEGIC PLAN
2013
Pipeline Safety Excellence
TM
ASSOCIATION OF OIL PIPE LINES (AOPL) represents liquid pipeline owners and operators transporting crude oil, petroleum products like gasoline, diesel, jet fuel, and home heating oil and industrial products like propane and ethane.
AMERICAN PETROLEUM INSTITUTE (API) is the only national trade association that represents all aspects of America’s oil and natural gas industry.

Pipeline Safety Excellence
LETTER FROM AMERICA’S LIQUID PIPELINE LEADERSHIP January 2014
Pipelines make life better every day for U.S. workers and consumers. Pipelines deliver the energy and raw materials American workers need for good-paying jobs that can support a family. Pipelines deliver U.S. consumers the gasoline, diesel, home heating oil and jet fuel they need to get to work, lead their lives and travel.
Pipelines are an extremely safe way to transport energy across the country. A barrel of crude oil or petroleum product shipped by pipeline reaches its destination safely more than 99.999% of the time. Pipeline operators are proud of our overall pipeline safety record, but we know we can improve even more. The public demands the highest level of pipeline safety and we are committed to delivering top safety performance.
In 2014, the liquid pipeline industry is launching its Pipeline Safety ExcellenceTM initiative. It reflects the shared values and commitment we have to building and operating safe pipelines. One of those pipeline safety values is communicating with stakeholders. Pipeline operators are committed to sharing publicly the results of industry-wide safety performance. Starting this year, that sharing takes the form of an Annual Liquid Pipeline Safety Performance Report. In it we will document our industry-wide safety record and share it with the public. Together, we will know the areas in which we are doing well and where we can improve. At its heart, Pipeline Safety ExcellenceTM is about continuously improving pipeline safety until we reach the ultimate goal of zero incidents. This will be a key tool in that journey of improving pipeline safety performance. Sincerely,
Andrew J. Black Peter T. Lidiak AOPL President & CEO API Pipeline Director
“A barrel of crude oil or petroleum product shipped by pipeline reaches its destination safely more than 99.999% of the time.”
TM
energy


TABLE OF CONTENTS 1 PERFORMANCE SUMMARY
2 PIPELINE SAFETY EXCELLENCE INITIATVE 4 SHARED PIPELINE SAFETY VALUES 5 INDUSTRY-WIDE PIPELINE SAFETY TEAMS 10 PIPELINE INTEGRITY MANAGEMENT 12 PIPELINE SAFETY PERFORMANCE RESULTS 17 2014 STRATEGIC PLAN
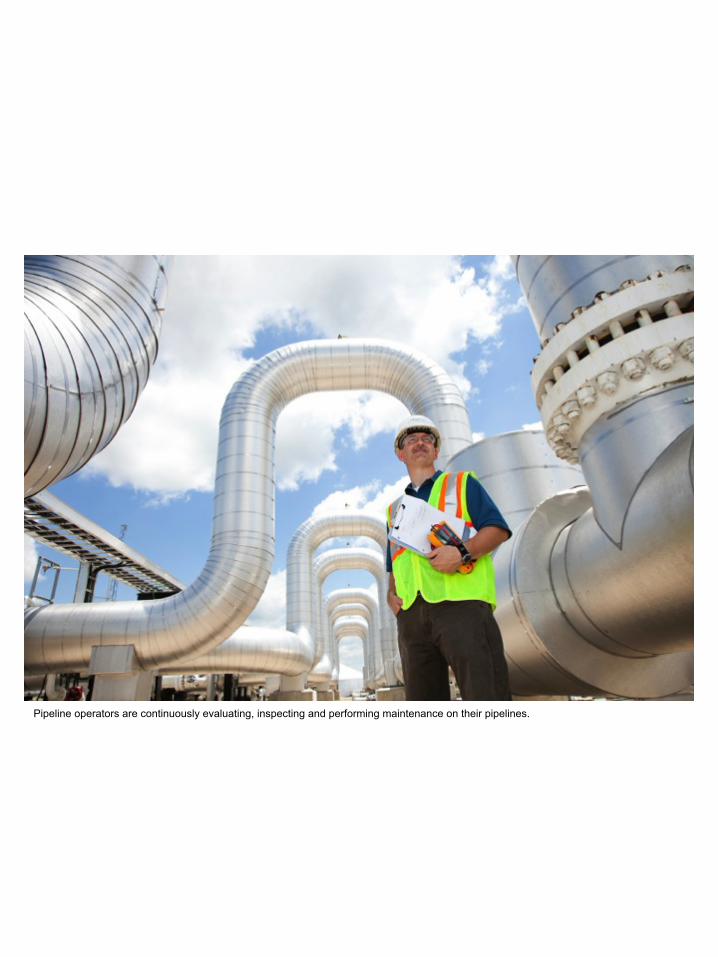
Pipeline operators are continuously evaluating, inspecting and performing maintenance on their pipelines.

LIQUID PIPELINE INDUSTRY PERFORMANCE SUMMARY Liquid pipeline operators delivered 14.1 billion barrels of crude oil and petroleum products by interstate pipeline in 2012
Liquid pipeline operators operated 185,599 miles of pipeline in 2012 including 57,051 miles of crude oil, 64,024 miles of petroleum product, and 59,853 miles of natural gas liquid pipelines
Liquid pipeline operators spent more than $1.6 billion on integrity management in 2012 evaluating, inspecting and maintaining their pipeline infrastructure
Liquid pipeline operators inspected 35,193 miles of their pipelines with “smart-pig” in-line inspection tools in 2012
Liquid pipeline operators performed 1,260 “smart-pig” in-line inspections in 2012
There were 93 releases in 2012 from onshore transmission liquid pipelines along the public right-of-way
Liquid pipeline releases are down 62% from 2001 to 2012
In 2012, 27,499 barrels of crude or petroleum product were released from onshore liquid pipelines along the public right-of-way
Barrels released from liquid pipelines are down 47% from 2001 to 2012
Corrosion as a cause of releases from liquid pipelines is down 79% from 2001 to 2012
Third-party caused damage to liquid pipelines is down 78% from 2001 to 2012
Material defects, seam and weld failures as a cause of pipeline releases are down 31% from 2001 to 2012
-62%
-47%
$1.6 Billion
1,260
35,193
-79%
-78%
-31%
14.1 Billion
185,599
27,499
93
2013 ANNUAL PERFORMANCE REPORT PIPELINE SAFETY EXCELLENCETM 1
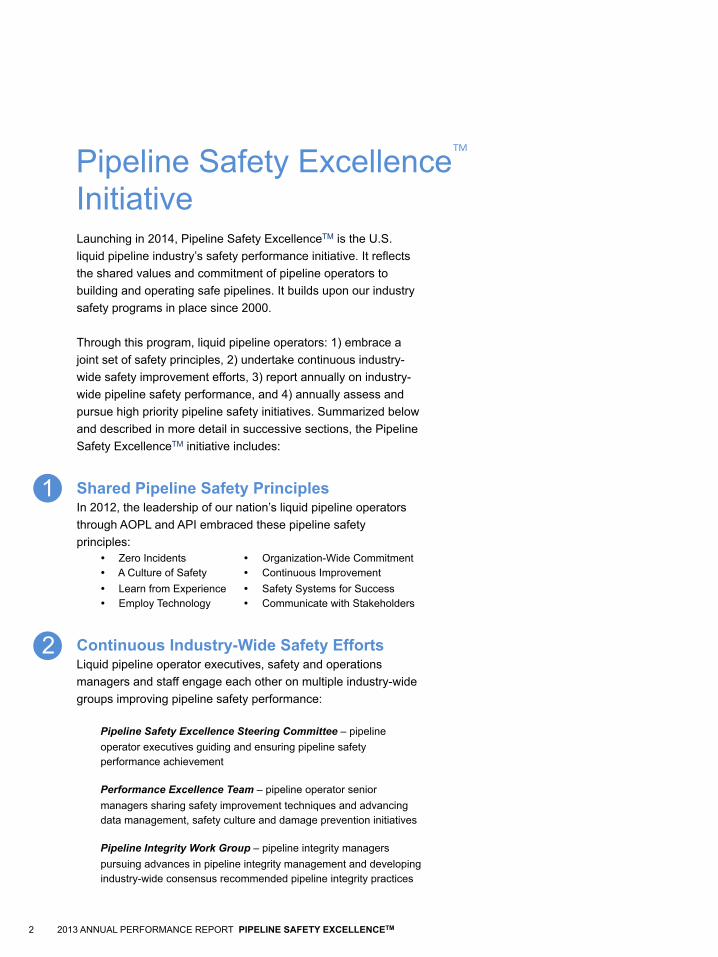
Launching in 2014, Pipeline Safety ExcellenceTM is the U.S. liquid pipeline industry’s safety performance initiative. It reflects the shared values and commitment of pipeline operators to building and operating safe pipelines. It builds upon our industry safety programs in place since 2000. Through this program, liquid pipeline operators: 1) embrace a joint set of safety principles, 2) undertake continuous industry-wide safety improvement efforts, 3) report annually on industry-wide pipeline safety performance, and 4) annually assess and pursue high priority pipeline safety initiatives. Summarized below and described in more detail in successive sections, the Pipeline Safety ExcellenceTM initiative includes:
Shared Pipeline Safety Principles In 2012, the leadership of our nation’s liquid pipeline operators through AOPL and API embraced these pipeline safety principles: � Zero Incidents � Organization-Wide Commitment
� A Culture of Safety � Continuous Improvement � Learn from Experience � Safety Systems for Success � Employ Technology � Communicate with Stakeholders
Continuous Industry-Wide Safety Efforts Liquid pipeline operator executives, safety and operations managers and staff engage each other on multiple industry-wide groups improving pipeline safety performance:
Pipeline Safety Excellence Steering Committee – pipeline operator executives guiding and ensuring pipeline safety performance achievement
Performance Excellence Team – pipeline operator senior managers sharing safety improvement techniques and advancing data management, safety culture and damage prevention initiatives
Pipeline Integrity Work Group – pipeline integrity managers pursuing advances in pipeline integrity management and developing industry-wide consensus recommended pipeline integrity practices
Pipeline Safety Excellence Initiative
1
2
TM
2 2013 ANNUAL PERFORMANCE REPORT PIPELINE SAFETY EXCELLENCETM
Operations & Technical Group – pipeline operations and engineering managers developing industry-wide recommended practices for pipelines Cybernetics Group – pipeline control systems managers sharing advances and lessons learned about leak detection technology and pipeline control systems Public Awareness Group – pipeline community outreach managers improving programs to raise public awareness of local pipelines and “call before you dig” programs Operator Qualification Work Group – pipeline managers ensuring operator qualification practices meet requirements and contribute to safe operations and operating culture Leadership Teams – pipeline managers and subject matter experts pursuing targeted initiatives to improve safety priorities, such as emergency response capabilities and research and development
Annual Pipeline Safety Performance Reporting Pipeline operators will annually measure and report industry-wide safety spending and performance to the public.
Annual Pipeline Safety Strategic Plan Pipeline operators will annually develop a pipeline safety strategic plan guiding industry-wide efforts to improve pipeline safety over the coming year.
2013 ANNUAL PERFORMANCE REPORT PIPELINE SAFETY EXCELLENCETM 3
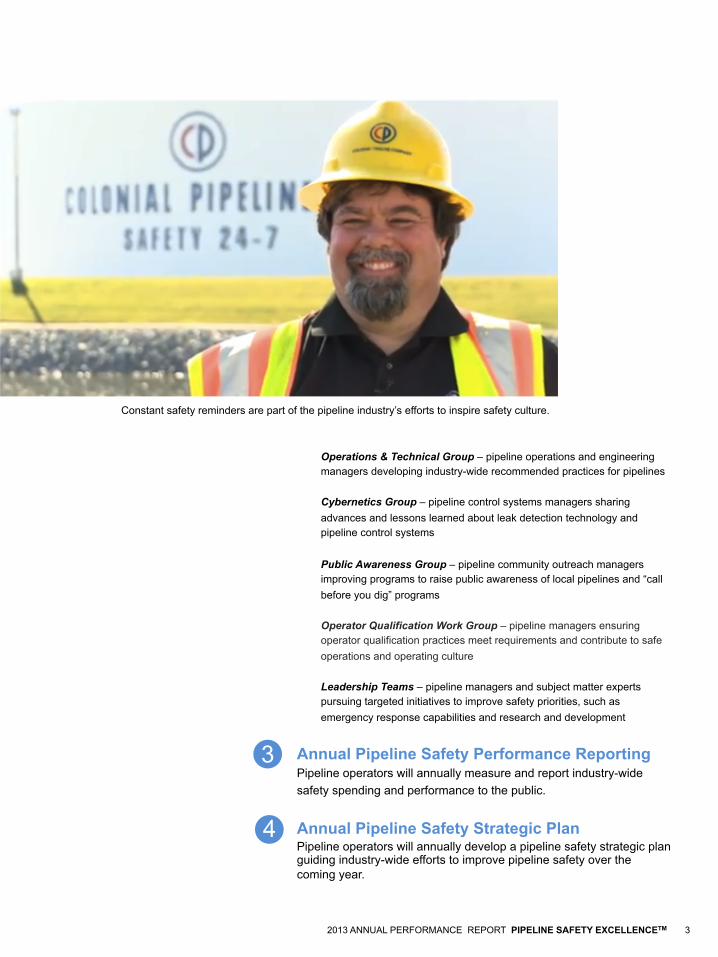
Constant safety reminders are part of the pipeline industry’s efforts to inspire safety culture.
3
4

Shared Pipeline Safety Principles In 2012, leadership of the liquid pipeline industry adopted these pipeline safety values to reflect their shared commitment to safety. They represent not only aspirational goals all operators strive toward, such as zero incidents, but also every day ways of doing business that promote continuous improvement and excellent safety performance: ZERO INCIDENTS – Only with a goal of zero safety incidents can we minimize accidents. Pipeline operators believe that every incident is preventable and work to that high standard. ORGANIZATION-WIDE COMMITMENT – Not only do senior leaders of pipeline companies value safety, but safety is emphasized at every level of the organization from employees who accept personal responsibility for safety to front-line managers who are vital to reinforcing a safety culture and implementing continuous improvement. A CULTURE OF SAFETY – Pipeline operators embrace the need to provide a workplace culture where safety is an enduring value that all employees share, act upon, learn from, are rewarded for and judged upon. CONTINUOUS IMPROVEMENT – Pipeline operators believe that no matter how safe they already are, they can always improve safety. Vision, commitment, culture, and systems are necessary to improve safety continuously. LEARN FROM EXPERIENCE – Pipeline operators learn how they can improve safety from their own experiences, and by sharing lessons learned with and from other pipeline operators. SYSTEMS FOR SUCCESS – Safety management systems demonstrate that safety efforts are succeeding by measuring performance, tracking changes and confirming improvements. 4 2013 ANNUAL PERFORMANCE REPORT PIPELINE SAFETY EXCELLENCETM

EMPLOY TECHNOLOGY – From in-line inspections with diagnostic robots traveling inside pipelines called “smart pigs” to innovative ways to interpret integrity data, operators constantly research and develop new ways to maximize safety. COMMUNICATE WITH STAKEHOLDERS – Operators know communicating with the public and stakeholders who value safety is vital to improving safety.
Making safety principles part of their culture is how pipeline operators operate safely every day.
2013 ANNUAL PERFORMANCE REPORT PIPELINE SAFETY EXCELLENCETM 5
Industry-Wide Pipeline Safety Teams Liquid pipeline operators, through their membership in AOPL and API, participate in a host of ongoing industry-wide safety performance teams. Operators send their leadership, designate their staff, and set aside time from their every-day duties to advance safety initiatives across the industry. Participants spend countless hours developing new pipeline safety standards, sharing safety learnings, and building safety programs, capacities and understandings for the benefit of all members. Many industry-wide pipeline safety groups are long-standing, focusing on constant issue areas of operations or pipeline integrity. Others are recently created as result of new areas of emphasis or recommendations from safety investigators, regulators and from industry experience. Industry is constantly reviewing the work of these safety groups, assessing their progress and ensuring areas of highest priority are receiving the resources and personnel they demand. In 2013, the following industry-wide safety groups pursued pipeline safety performance improvement goals: PIPELINE SAFETY EXCELLENCE (PSE) STEERING COMMITTEE - In 2012, pipeline operators recognized that multiple industry-wide safety groups had grown up over time, in some cases with overlapping missions and work products. Operators commissioned a group of pipeline executives to oversee all liquid pipeline safety efforts, assigning each executive to a safety group to champion their efforts and ensure they received the attention and resources they needed. Regular reporting through the PSE Steering Committee ensures that planned deliverables are on track and that safety efforts are resulting in safety improvements. PERFORMANCE EXCELLENCE TEAM (PET) - The PET brings together senior managers from across industry to exchange the latest information on pipeline safety.
6 2013 ANNUAL PERFORMANCE REPORT PIPELINE SAFETY EXCELLENCETM

PET members also engage in three standing subteams focusing on pipeline performance data management, pipeline damage prevention and safety culture. In 2013, PET led the pipeline industry’s first annual industry-wide pipeline safety performance strategic planning process. In 2014, PET will lead two 2014 Strategic Initiatives to Deploy Pipeline Safety Management Systems to Improve Pipeline Safety Performance and also Foster Pipeline Safety Culture with an Industry-Wide Sharing, Learning and Improvement Program. CYBERNETICS WORK GROUP – Cybernetics is an API led group of operations managers responsible for leak detection technology and control room systems. In 2014, Cybernetics will lead the 2014 Strategic Initiative to Develop an API Recommended Practice for Leak Detection Program Management.
PIPELINE INTEGRITY WORK GROUP (PIWG) - The PIWG is an API led group of industry managers with responsibility for ensuring the integrity of the pipelines at their companies. They oversee programs to evaluate, inspect and perform maintenance on their systems. As part of PIWG, they share learnings and best practices to improve pipeline integrity. PIWG recently completed an update to the industry-wide standard for managing integrity of pipelines. In 2014, PIWG will lead two 2014 Strategic Initiatives to Develop an API Recommended Practice (RP) on Crack Detection, Analysis and Response with an Emphasis on Seam-Related Cracks, as well as Develop Industry-Wide Guidance on Implementing Threat Data Integration Programs and Activities. OPERATIONS & TECHNICAL GROUP (OTG) - The OTG is an API led group of industry managers with responsibility for pipeline operations and engineering. They meet regularly to share operating experiences and best practices. Each year, OTG hosts an industry-wide Pipeline Information eXchange to share information on incidents or near misses that yielded learnings and improvements in pipeline safety. OTG also facilitates the consideration and adoption of industry-wide operations and safety standards.
Featured Initiative: Development of a Pipeline Safety Management System
Recommended Practice
In 2013, the liquid pipeline industry, on the recommendation of the U.S. National Transportation Safety Board, convened a group of liquid and gas pipeline operators, pipeline regulators and public representatives to develop together an industry-wide recommended practice for a pipeline safety management system (SMS).
Shown successful in other industrial settings, SMS help pipeline operators make improving safety a constant focus of their operations. Pipelines will operate safer under a pipeline SMS by having new ways to keep everyone focused on safety, constantly measuring and monitoring safety performance, identifying where they can improve safety, and learning safety lessons from their operating experiences.
The pipeline SMS development group continues to work on the new recommended practice and expects its finalization in late-summer 2014.
2013 ANNUAL PERFORMANCE REPORT PIPELINE SAFETY EXCELLENCETM 7

PUBLIC AWARENESS GROUP (PAG) – PAG is an API led group of community outreach managers working together to improve programs to raise public awareness of local pipelines and “call before you dig” programs. OPERATOR QUALIFICATION WORK GROUP (OQ) – OQ is an API led group that ensures operator qualification practices meet regulatory requirements that contribute to safe operations and a safe operating culture.
PIPELINE SAFETY LEADERSHIP TEAMS - In 2011, the executive leadership of the liquid pipeline industry launched several industry-wide teams to address specific safety performance issues. In 2012, they created an additional team to address emergency response. The groups take on special projects that are time sensitive or meet a specific program need.
Research and Development/Enhanced Technology Team – Coordinates industry efforts to research new in-line inspection capabilities to detect cracking and dents in pipes,
Industry-wide safety groups meet regularly to share lessons learned and best practices.
8 2013 ANNUAL PERFORMANCE REPORT PIPELINE SAFETY EXCELLENCETM

in-line inspection data analysis and diagnosis, leak detection and enhanced excavation damage prevention technologies. Leak Detection Team – Formed to explore ways to improve processes and technology to better recognize and respond to large pipeline leaks and ruptures. In 2013, the team produced an industry white paper on rupture detection procedures. In 2014, the team will work with the Cybernetics Group on the 2014 Strategic Initiative to Develop an API Recommended Practice for Leak Detection Program Management. Enhanced Data Integration Team – In 2013, the team completed a pipeline integrity threat matrix that catalogues major pipeline integrity threats, their symptoms, and methods of analysis. That threat matrix will serve as a basis of the PIWG 2014 Strategic Initiative to Develop Industry-Wide Guidance on Implementing Threat Data Integration Programs and Activities. Sharing Safety Practices and Lessons Learned Team –Promotes wider dissemination of internal industry learnings to members through safety performance lesson forums and sessions. In 2014, the team will work with the Safety Culture subteam of PET on the 2014 Strategic Initiative to Foster Pipeline Safety Culture with an Industry-Wide Sharing, Learning and Improvement Program. Damage Prevention Team – Develops and promotes model One-Call provisions, advocates for strong damage prevention laws and enforcement, engages directly with excavator groups, and develops public education programs with other stakeholders. Emergency Response Team – Executing a strategy to develop universal emergency response training for first responders, coordinate industry exercise opportunities, develop an industry-wide emergency response RP and improve communication with emergency responders. In 2014, the team will formally launch the RP development effort as part of the 2014 Strategic Initiative to Deploy a Nation-Wide Pipeline Emergency Response Training, Outreach & Standards Program.
2013 ANNUAL PERFORMANCE REPORT PIPELINE SAFETY EXCELLENCEYM 9
Pipeline Integrity Management
Every pipeline operator uses an integrity management (IM) program to evaluate, inspect and maintain their pipelines. Pipeline IM programs harness cutting edge diagnostic technologies to scan their pipelines, and the latest analytic software to review inspection results and isolate potential issues for maintenance. The goal of the IM program is to identify and treat symptoms long before they grow into a problem. The pipeline industry began collecting industry-wide integrity management spending data in 2011, when they reported over $1.1 billion spent on their integrity management programs. In 2012, liquid pipeline operators spent $1.6 billion on pipeline integrity management. That spending included 1,260 internal pipeline inspections by “smart pig” in-line inspection devices, covering 35,123 miles of pipeline. Based on results from those “smart pig” inspections, operators performed 10,210 digs of pipeline sections for maintenance. Such a large amount of spending and effort on pipeline safety is one reflection of the liquid pipeline industry’s commitment to pipeline safety. The pipeline industry’s commitment to integrity management has yielded large safety performance gains since 2003 when the program formally began. As the next section on performance data will show, under the pipeline integrity management program the number of liquid pipeline incidents are down by 62%. Amounts released from pipelines are down 47%. The main causes of pipeline incidents, targeted by industry and integrity management programs, are all down with pipe corrosion down 79% and third-party damage to pipelines down 78%. However, as the next section on performance results shows, there are areas of pipeline safety where both operators and the public want improved safety performance. Pipeline incidents from material defects, seam and weld failures are down 31% from 2001 to 2012.
10 2013 ANNUAL PERFORMANCE REPORT PIPELINE SAFETY EXCELLENCETM
In 2012, pipeline operators spent over $1.6 billion
on pipeline integrity
management evaluating,
inspecting and maintaining
their pipelines.

Pipeline operators use “smart pig” inspection devices that travel through pipelines analyzing and diagnosing issues in the pipeline.
While positive, this 31% improvement is not as great as the nearly 80% corrosion or third-party damage reductions. Additionally, the record of inspection technology identifying and diagnosing these types of potential issues is inconsistent. Advances in both the technology to discover and the techniques to diagnose and predict potential material defects and seam issues are needed to improve integrity management results. The 2014 Strategic Plan reflects aggressive action to make these improvements.
2013 ANNUAL PERFORMANCE REPORT PIPELINE SAFETY EXCELLENCETM 11

Pipeline Safety Performance Results
Overall pipeline safety continues to improve across the liquid pipeline industry. In 2012, there were 93 liquid pipeline releases, reflecting a 62% decline over the last decade. For the first time this year, the pipeline industry is formally releasing data such as this and other important measures of pipeline safety performance in an effort to share more with the public and work together to address the highest safety priorities.
12 2013 ANNUAL PERFORMANCE REPORT PIPELINE SAFETY EXCELLENCETM
0
50
100
150
200
250
300
3 yr. avg.1999-2001 to 2010-2012
# of Pipeline Releases
-62%
Pipeline Performance Tracking System The liquid pipeline industry tracks pipeline safety performance through its Pipeline Performance Tracking System (PPTS) maintained by the American Petroleum Institute. Created in 1999, PPTS allows the pipeline industry to know the state of the overall pipeline system, analyze emerging trends, and focus its resources on the issues most important to improving pipeline safety. Reflecting approximately 85% of the liquid pipeline mileage regulated by PHMSA, data submitted includes releases that are 5 gallons or more if released to soil, and any size released to water. Industry focuses its PPTS analysis on onshore releases along the right-of-way, where pipelines come into contact with the public and the environment. While PHMSA frequently includes facility releases when displaying performance results, these releases are usually small and contained within the facility fence line. PPTS’ focus on releases along the right-of-way allows industry to identify what efforts are succeeding and where improvements can do the most to protect the public and the environment.
Releases from pipelines are down 62% over the last
decade

0
20
40
60
80
100
# of Barrels Released
(in thous.) 3 yr. avg.1999-2001 to 2010-2012
-47%
Barrels Delivered by Pipeline In 2012, on-shore liquid interstate pipelines delivered over 14.1 billion barrels of crude oil and petroleum products. While deliveries of petroleum products such as gasoline, diesel and jet fuel have hovered around 6.5 billion barrels per year, deliveries of crude oil jumped nearly 500 million barrels to 7.5 billion barrels in 2012. 0
3,500,000,000
7,000,000,000
10,500,000,000
14,000,000,000
2009 2010 2011 2012
Crude Oil Gasoline, Diesel, Jet Fuel
Barrels Delivered by Pipeline
7.5B 7.0B 7.1B 7.0B
6.5B 6.4B 6.6B 6.6B
14.1B 13.6B 13.5B 13.5B Total
Release amounts are down 47% while
volumes delivered increased
Number of Barrels Released In 2012, the number of barrels released by liquid pipelines was 47% lower than 2001. Individual incidents gain widespread attention, as they should, but overall the trend of release amounts is down substantially.
2013 ANNUAL PERFORMANCE REPORT PIPELINE SAFETY EXCELLENCETM 13
, Etc.

0
20
40
60
80
100
120
140
Corrosion Third Party Equip/Non-Pipe Material/Seam/Weld
Operator Error
3 yr. avg.1999-2001 to 2010-2012
Major Spill Causes
-79% -78% -22%
-31% -57%
Major Spill Causes In addition to the number of pipeline incidents and amounts released, operators collect data on release causes. The 2012 numbers show great improvements in focus areas over the last 10 years. The integrity management program and PHMSA regulations emphasized detection of and response to corrosion related issues. Pipeline inspection technology for detecting corrosion is fully mature, and the performance data below shows a 79% drop in corrosion caused incidents over the last 10 years. This can be counted as a major success for the integrity management program. Similarly, pipeline operators, regulators, and many state partners have devoted a great deal of energy to public awareness campaigns, such as “Call 811” and “Know What’s Below. Call Before You Dig.” The data shows a 78% decrease over the last 10 years in pipeline incidents caused by third parties. At the same time, incidents caused by materials, seam failure or faulty welds are down 31%. While this is an overall reduction, it is less of a reduction than other areas and the focus of investigations in recent pipeline incidents.
14 2013 ANNUAL PERFORMANCE REPORT PIPELINE SAFETY EXCELLENCETM

Barrels of Crude Oil and Petroleum Products Delivered 14,139,546,005 by Transmission Pipeline1
Crude Oil Barrels Delivered by Transmission Pipeline 7,474,368,721 Petroleum Product Delivered by Transmission Pipeline2 6,665,177,284 Liquid Pipeline Miles Operated3 185,599 Crude Oil Pipeline Miles Operated 57,051 Petroleum Product Pipeline Miles Operated 64,024 Natural Gas Liquid Pipeline Miles Operated 59,853
Amount Spent Evaluating, Inspecting & Maintaining $1.624 billion Liquid Pipeline Infrastructure4
Miles of Liquid Pipeline Inspected by “Smart Pig” 35,193 In-Line “Smart Pig” Inspections of Liquid Pipeline 1,260 Number of Digs for Pipeline Maintenance 10,210 Pipeline Public Awareness Spending $14.937 million
2012 LIQUID PIPELINE INDUSTRY PERFORMANCE RESULTS
2013 ANNUAL PERFORMANCE REPORT PIPELINE SAFETY EXCELLENCETM 15
Number of Releases from Onshore Transmission Pipelines5 93 Percent Decrease in Number of Liquid Pipeline -62% Releases Over Last Ten Years6
Barrels of Crude Oil or Petroleum Product Released from 27,499 Onshore Transmission Liquid Pipelines in 2012 Percentage of Crude Oil or Petroleum Product Reaching Their 99.9998% Destination Safely by Transmission Liquid Pipeline in 2012 Percent Decrease in Barrels Released from Onshore -47% Transmission Liquid Pipelines Over Last Ten Years6
Number of Releases Caused by Corrosion in 20127 27
Percent Decrease in Corrosion as a Cause of Liquid -79% Pipeline Release Over Last Ten Years6
Number of Releases Caused by Third-Party Damage in 20127 9 Percent Decrease in Third-Party Damage to Liquid -78% Transmission Pipeline Over Last Ten Years6
Number of Releases Caused by Materials Defect, Seams 18 or Weld Failures in 20127 Percent Decrease in Material Defects, Seam and Weld -31% Failures as Cause of Liquid Pipeline Release Over Last Ten Years6
1. Transmission data compiled from operator submissions to U.S. Federal Energy Regulatory Commission of
trunk line deliveries (excludes gathering lines) 2. Includes natural gas liquid deliveries 3. Pipeline mileage data from U.S. Pipeline and Hazardous Materials Safety Administration 4. Integrity management data from survey of liquid pipeline operators 5. Performance data from Pipeline Performance Tracking System of liquid onshore transmission incidents along
the public right-of-way 6. Reflects comparison of 3 year averages from 1999-2001 to 2010-2012 7. Reflects 3 year average of 2010-2012


API-AOPL Pipeline Safety Excellence 2014 Strategic Plan This year, liquid pipeline operators have developed an industry-wide strategic plan to improve liquid pipeline safety performance. The API-AOPL Pipeline Safety Excellence 2014 Strategic Plan represents the liquid pipeline industry’s plan for improving performance in key strategic areas of pipeline safety. In the last 10 years, operators have come a long way, driving down overall liquid pipeline incidents over 60% and major causes of incidents such as corrosion and third party damage down by nearly 80%. However, pipeline safety excellence is the true aim of pipeline operators, with an industry-wide ultimate goal of zero pipeline incidents. Similarly, with major progress in some areas, operators recognize the need to make more progress addressing key strategic areas, such as pipeline inspection technology, crack detection and response, leak program management, and emergency response. The performance data of the previous section bears this out, and the recommendations of pipeline stakeholders supports the need for action in these areas. The following plan represents the strategic priorities for liquid pipeline operators, and we know also for our key stakeholders in government and the public. Working together, we look forward to the pipeline safety performance improvements this plan will bring.
2013 ANNUAL PERFORMANCE REPORT PIPELINE SAFETY EXCELLENCETM 17
TM

18 2013 ANNUAL PERFORMANCE REPORT PIPELINE SAFETY EXCELLENCETM
API-AOPL PIPELINE SAFETY EXCELLENCE 2014 STRATEGIC PLAN
GOAL 1: IMPROVE INSPECTION TECHNOLOGIES Strategic Initiative 1: Improve with Comprehensive and Accelerated R&D the
Capabilities of In-Line Inspection (ILI) Technologies to Detect and Diagnose Cracks
GOAL 2: ENHANCE THREAT IDENTIFICATION & RESPONSE Strategic Initiative 2: Develop an API Recommended Practice on Crack Detection,
Analysis and Response, with an Emphasis on Seam-Related Cracks
Strategic Initiative 3: Develop Industry-Wide Guidance on Implementing Threat Data
Integration Programs and Activities
GOAL 3: EXPAND SAFETY CULTURE & MANAGEMENT
PRACTICES Strategic Initiative 4: Deploy Newly Developed Pipeline Safety Management System
to Improve Pipeline Safety Performance Strategic Initiative 5: Foster Pipeline Safety Culture with an Industry-Wide Sharing,
Learning and Improvement Program
GOAL 4: BOOST RESPONSE CAPABILITIES Strategic Initiative 6: Develop an API Recommended Practice for Operator Leak
Detection Management Strategic Initiative 7: Deploy a Nation-Wide Pipeline Emergency Response Training,
Outreach and Standards Program
TM

Strategic Goal 1: Improve Inspection Technology Capabilities Challenge In-line inspection tools are a critical part of operator evaluation and inspection of their pipelines. Recent incidents are leading some to call into question the capabilities and reliabilities of ILI tools, especially for identifying cracking such as that experienced along some pipe seams. NTSB is recommending a comprehensive evaluation of ILI and confidence must be restored in the ability of ILI tools to detect such defects in order to reassure regulators and the public that operators can safely maintain both new and aging infrastructure. Also, tools and data analysis techniques need to be improved to make tools better able to detect anomalies and allow vendors and operators to improve how they discover them. Description Provide leadership and financial support for ongoing and planned industry-wide research on pipeline inspection technology. Efforts will focus on ILI tool capabilities and reliability for detection and sizing of potential defects, especially cracks. Research will consider the multiple tool types currently used by operators, as well as analytical techniques to boost performance. A 2013 survey showed that operators are using different ILI tools and technologies to detect and diagnose potential cracks. This initiative will encourage operators to submit data reflecting that full range of technologies. This will ensure that the final R&D results are comprehensive and can serve as a guide to all operators. Ongoing work supporting this initiative includes PRCI ILI technology project NDE-4 and ERW study IM-3, among many other industry commissioned PRCI projects. Outcome - ILI crack tool capability research completed in first half of 2014 - Roadmap for further work to develop improved sensors and
analytic techniques completed by end of 2014
Strategic Initiative 1: Improve with Comprehensive and Accelerated R&D the Capabilities of In-Line Inspection (ILI) Technologies to Detect and Diagnose Cracks
2013 ANNUAL PERFORMANCE REPORT PIPELINE SAFETY EXCELLENCETM 19
20 2013 ANNUAL PERFORMANCE REPORT PIPELINE SAFETY EXCELLENCETM
Timeline Project under way, additional data collected by end of 2013, ILI crack to capability analysis and findings completed in first half of 2014, roadmap for further work by end of 2014 Lead PRCI Research Project Team with API/AOPL Research & Development Team, OTG and PIWG
Strategic Goal 2: Enhance Threat Identification & Response Challenge Recent pipeline incidents have brought attention to the difficulty of detecting and managing both environmental and seam-related cracking. Industry practices and success at detecting and diagnosing cracks are uneven. Surveys show that operators are applying differing assessment technologies and techniques with mixed results. NTSB is recommending specific regulatory requirements on crack assessment and response. Industry must respond to public and regulator concern that it is able to safely manage and operate pipe segments with elevated risk of seam and crack issues. Additionally, while industry has made great progress reducing traditional causes of pipeline incidents such as corrosion and third-party damage, recent incidents have involved more subtle, interactive or hard-to-detect causes. The identification of defects, such as hook cracks at seams or environmental cracking under certain coatings, requires information from multiple operational, technological and analytic sources. PHMSA recommends development of industry protocols for data integration. The recently completed PIWG Data Integration Matrix describing multiple pipeline integrity threats and interpretation methodologies can serve as a building block for new industry guidance on “how” to integrate data from multiple sources.

2013 ANNUAL PERFORMANCE REPORT PIPELINE SAFETY EXCELLENCETM 21
Description Develop in 2014 an API Recommended Practice on crack detection, analysis and response. Guidance will include crack evaluation strategies, in-line and other tool selection, crack assessment and growth modeling techniques, specific crack response conditions and
timing, and methods for incorporating lessons learned about managing cracks and continuous improvement strategies into integrity management planning and activities. Guidance will include sections on specific crack threats and response, such as cracks along ERW seams and environmental or stress corrosion cracking and the tools, techniques and procedures required to address such threats. Work will build upon the 2013 crack survey and ILI inspection tool R&D begun in 2013.
Outcome Development and Implementation of Industry-Wide Recommended Practice
Timeline - Development by end of 2014 - Implementation in 2015
Lead Pipeline Integrity Work Group
Description Develop in 2014 industry-wide best practice guidance on implementing threat data integration programs and activities.
Strategic Initiative 2: Develop an API Recommended Practice on Crack Detection, Analysis and Response with an Emphasis on Seam-Related Cracks
Strategic Initiative 3: Develop Industry-Wide Guidance on Implementing Threat Data Integration Programs and Activities
Industry-Wide Recommended Practices
Recommended practices are industry-wide best practices developed by subject matter experts in their fields of safety and operations, often including local,
state and federal government representatives. The oil and natural gas industry has developed over 600 standards and recommended practices, many of
them focusing specifically on pipeline operations, to provide a uniform guide to operators striving for safety excellence. Recommended practices are developed through an open, accredited process, many with interaction with the public and formal comment and review periods. In many cases,
government regulators have incorporated recommended practices as regulatory requirements
due to their quality and rigor. Development of a recommended practice signals the industry-wide importance of an issue to safety and the desire of
operators to boost safety performance by industry as a whole. Additionally, as part of API’s American
National Standards Institute accredited standards development process, recommended practices are
reviewed and updated on a regular basis, and whenever a technical or safety justification exits.

22 2013 ANNUAL PERFORMANCE REPORT PIPELINE SAFETY EXCELLENCETM
The best practice will build upon the PIWG Threat Matrix completed in 2013 to provide additional guidance to operators on how they can best build data integration programs and incorporate them into their integrity and risk management activities. Effort will include guidance on how to approach threats with multiple indicators, assess interactive threats, select multiple and complimentary assessment tools, overlay different information sets, and consider technology limitations. Program guidance will include how to incorporate threat data integration strategies into regular activities to foster continuous improvement and benefit from lessons learned. Outcome Industry-wide data integration guidance Timeline End of 2014 Lead Pipeline Integrity Work Group
Strategic Goal 3: Expand Safety Culture & Management Practices Challenge Investigation of accidents in the energy production and refining sectors revealed organization-wide causes for the mishaps. Previous attention to worker personal safety was insufficient to prevent process safety problems. Leadership was found unaware of heightened risks in or the safety performance of their operations. Regular, continuous, intentional processes to review safety performance, identify deficiencies, incorporate lessons learned, and implement improvements were lacking. Safety investigators and regulators, such as NTSB, PHMSA, BSSE and the Chemical Safety Board, all recommend use of safety management systems to bring continuous safety performance improvements. In 2012, NTSB formally recommended the pipeline industry develop a pipeline safety management system for use by operators.

In addition to process improvements that would help pipeline operators better manage their pipeline safety resources and personnel, operators can benefit from sharing substantive safety lessons learned within their own organizations and from other operators. Near misses that do not result in an incident can also be useful sources of information to improve pipeline safety performance. While pipeline operators have historically shared results of incidents and lessons learned at industry-wide forums and through regular contact, more can be done to document changes operators make as a result of sharing sessions and measure improvements to operator safety performance. Description Encourage industry-wide deployment of the Pipeline Safety Management System (PSMS) Recommended Practice after its adoption in 2014. A broad stakeholder team, including several industry representatives, is currently developing the recommended practice per NTSB’s recommendation.
Strategic Initiative 4: Deploy Pipeline Safety Management Systems to Improve Pipeline Safety Performance
2013 ANNUAL PERFORMANCE REPORT PIPELINE SAFETY EXCELLENCETM 23

24 2013 ANNUAL PERFORMANCE REPORT PIPELINE SAFETY EXCELLENCETM
Liquid pipeline operators through the API Operations & Technical Group will have the opportunity to formally adopt it as an API RP in the spring or early summer of 2014. This 2014 strategic initiative will educate operators on the elements of and benefits they will gain from implementing the RP and provide tools and encouragement supporting its adoption. Outcome PSMS Implementation Plan with tools to educate, encourage and assist member adoption of the RP, and groups and mechanisms identified to execute the plan Timeline RP development throughout 2014, with RP finalization and publication in late-Summer 2014 and implementation activities from 2014 through 2015 Lead Performance Excellence Team

Description Expand and build on industry-wide pipeline safety sharing events with new tools and products to document learning among sharing recipients, operational changes reflecting lessons learned, and measurement of resulting improved pipeline safety performance. Industry currently engages in several sharing activities. At each meeting of standing association committees and teams, members share lessons learned in safety roundtable discussions. Each October, operators meet at a day-long Pipeline Information eXchange (PIX) to share case examples of pipeline incidents or near misses and benefit from lessons learned. In 2013, operators began quarterly “virtual tailgate” calls to share additional safety lessons. This year also saw several examples of peer-to-peer safety sharing meetings between individual pipeline operators. This initiative will build on those efforts with development of learning followup and improvement measurement components. Outcome Program to document pipeline safety sharing events, followup steps taken by participants reflecting lessons learned, and resulting pipeline safety improvements. Will report examples at the end of each year. Timeline Throughout 2014 Lead Performance Excellence Team Safety Culture Subteam with the Sharing Practices and Learning Leadership Team
2013 ANNUAL PERFORMANCE REPORT PIPELINE SAFETY EXCELLENCEYM 25
Strategic Initiative 5: Foster Pipeline Safety Culture with an Industry-Wide Sharing, Learning and Improvement Program

26 2013 ANNUAL PERFORMANCE REPORT PIPELINE SAFETY EXCELLENCETM
Strategic Goal 4: Boost Response Capabilities Challenge Prompt detection of and response to pipeline leaks is crucial to limiting the size and impact of any pipeline incident. Pipeline operators receive a host of real-time and historic data as they monitor their systems. Some signals of a potential problem are obvious, and others are subtle or conflicting. There are a number of different recommended practices for operating control rooms, managing personnel and system information display systems. A single industry-wide recommended practice for leak program management will ensure consistent performance across operators.
While the top priority of pipeline safety efforts is to prevent any release in the first place, aggressive emergency response to a pipeline incident is vital to minimizing the impact of any release on people, property or the environment. Most releases are small in size with little impact to the public. However, operators and first responders must be prepared for an incident of any size. Some first responder fire and police departments, especially smaller rural or volunteer departments, would benefit from more tools to learn, train and drill on pipeline emergencies. While individual operators attempt to reach out and provide resources to first responders along their systems, a more comprehensive effort that leverages emergency response stakeholder representatives

and associations is needed to broaden coverage and deploy training tools. Operators can also improve their preparedness and response by sharing best practices and learnings from conducting response drills with other operators and responders. Description Develop an API Recommended Practice for Leak Detection Program Management that complements and integrates with current practices for control room management and SCADA technology. Incorporate practices reflecting NTSB recommendations. Outcome API Recommended Practice Timeline 2014-2015 Lead Cybernetics Work Group Description Implement a comprehensive pipeline emergency response training, outreach and standards program. Major elements would develop web-based pipeline emergency response training materials accessible remotely in jurisdictions across the country, attain incorporation of industry training materials into first responder programs and certifications, increase outreach to and consultation with representatives of national fire and police organizations, and provide uniform guidance for operator emergency response preparation and activities.
Strategic Initiative 7: Deploy a Nation-Wide Pipeline Emergency Response Training, Outreach & Standards Program
2013 ANNUAL PERFORMANCE REPORT PIPELINE SAFETY EXCELLENCETM 27
Strategic Initiative 6: Develop an API Recommended Practice for Leak Detection Program Management

Outcomes - National pipeline emergency response training portal
developed and deployed - First responder outreach communications plan and outreach
materials developed and deployed - API Emergency Response RP under development
Timeline Outreach and training activities during 2014 and continuing beyond, with API Emergency Response RP draft developed by January 2015 and finalized during Summer 2015 Lead Emergency Response Team
28 2013 ANNUAL PERFORMANCE REPORT PIPELINE SAFETY EXCELLENCETM

To learn more about AOPL and API initiatives, please go to:
http://aopl.org/safety/safety-excellence-program/
www.aopl.org
www.api.org
