annual groundwater monitoring and corrective action … statistics ... that are subject to...
TRANSCRIPT
The business of sustainability
Annual Groundwater Monitoring and Corrective Action ReportCPS Energy Calaveras Power Station – Evaporation Pond San Antonio, Texas
January 2018
www.erm.com
Texas Registered Engineering Firm F-2393 Texas Board of Professional Geoscientist Firm 50036 © Copyright 2018 by ERM Worldwide Group Ltd and/or its affiliates (“ERM”). All Rights Reserved. No part of this work may be reproduced or transmitted in any form, or by any means, without the prior written permission of ERM.
Calaveras Power Station – Evaporation Pond
Annual Groundwater Monitoring and Corrective Action Report
January 2018
Project No. 0337367 San Antonio, Texas
Jeffery L. Bauguss, P.E. Partner-in-Charge
Walter Zverina Project Manager
Natasha Hausmann Senior Scientist Environmental Resources Management 206 East 9th Street, Suite 1700 Austin, TX 78701 T: 512-459-4700
Environmental Resources Management iii 0337367\A9025 EP
TABLE OF CONTENTS
1. INTRODUCTION .............................................................................................................................. 1
2. PROGRAM STATUS ......................................................................................................................... 2
2.1. GROUNDWATER FLOW RATE AND DIRECTION ........................................................... 2
2.2. SAMPLING SUMMARY ........................................................................................................... 2
2.3. DATA QUALITY ........................................................................................................................ 2
3. STATISTICAL ANALYSIS AND RESULTS ................................................................................... 3
3.1. INTERWELL VS INTRAWELL COMPARISONS ................................................................ 3
3.2. ESTABLISHMENT OF UPGRADIENT DATASET ............................................................... 3
3.2.1. Descriptive Statistics ........................................................................................................ 3
3.2.2. Outlier Determination ...................................................................................................... 4
3.2.3. Check for Temporal Stability ........................................................................................... 4
3.3. CALCULATION OF PREDICTION LIMITS ......................................................................... 4
3.4. CONCLUSIONS ......................................................................................................................... 5
4. RECOMMENDATIONS ................................................................................................................... 5
5. REFERENCES ..................................................................................................................................... 6
List of Tables
1 Groundwater Elevations Summary
2 Groundwater Sampling Summary
3 Groundwater Analytical Results Summary
List of Figures
1 CCR Well Network Location Map
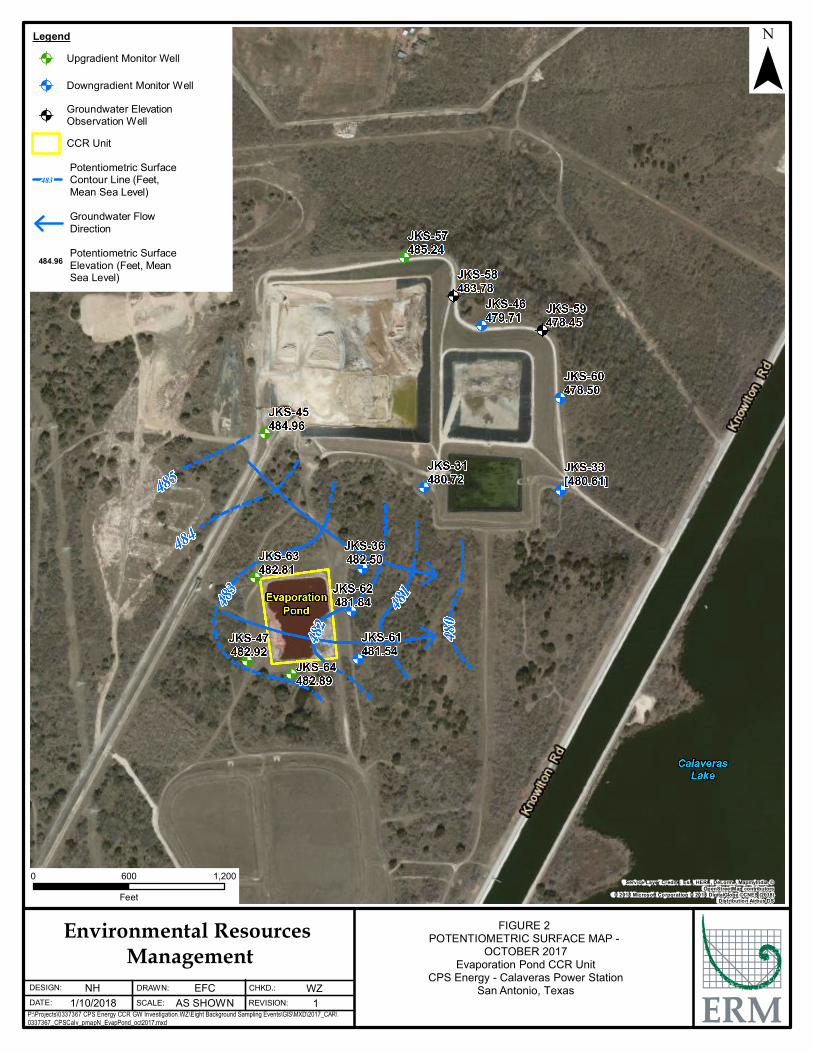
2 Potentiometric Surface Map – October 2017
List of Appendices
A Laboratory Data Packages
B Statistical Analysis Tables and Figures
Environmental Resources Management 1 0337367\A9025 EP
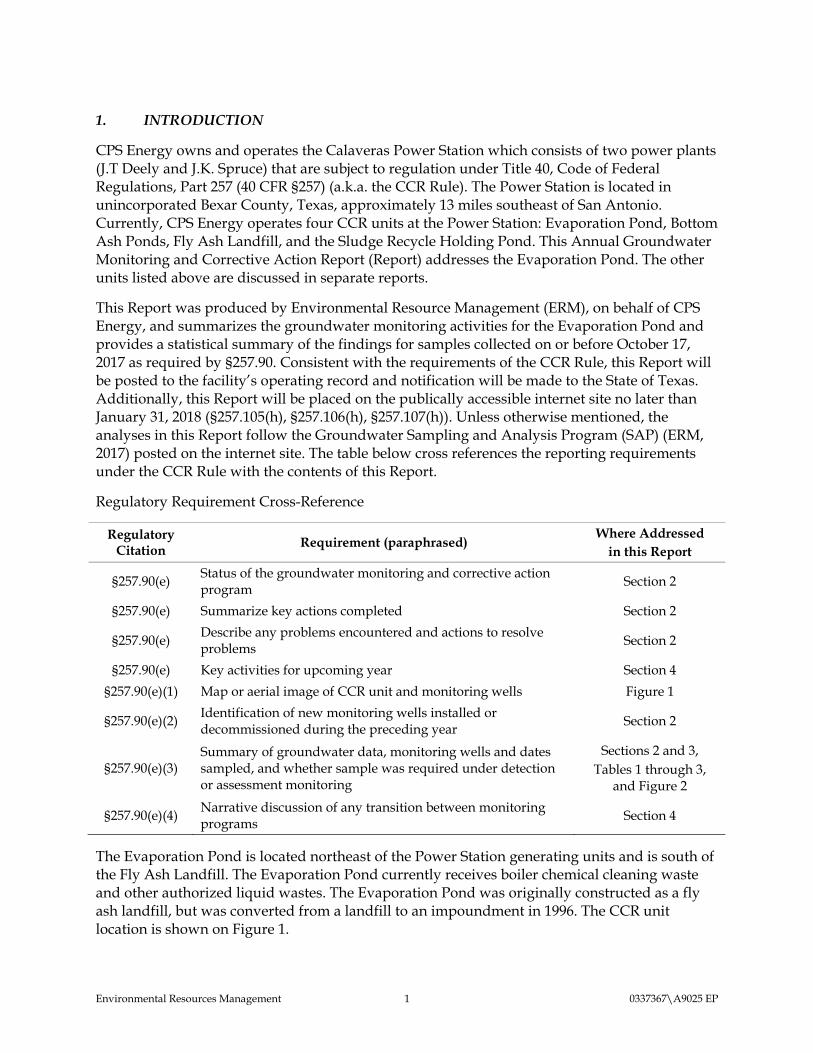
1. INTRODUCTION
CPS Energy owns and operates the Calaveras Power Station which consists of two power plants (J.T Deely and J.K. Spruce) that are subject to regulation under Title 40, Code of Federal Regulations, Part 257 (40 CFR §257) (a.k.a. the CCR Rule). The Power Station is located in unincorporated Bexar County, Texas, approximately 13 miles southeast of San Antonio. Currently, CPS Energy operates four CCR units at the Power Station: Evaporation Pond, Bottom Ash Ponds, Fly Ash Landfill, and the Sludge Recycle Holding Pond. This Annual Groundwater Monitoring and Corrective Action Report (Report) addresses the Evaporation Pond. The other units listed above are discussed in separate reports.
This Report was produced by Environmental Resource Management (ERM), on behalf of CPS Energy, and summarizes the groundwater monitoring activities for the Evaporation Pond and provides a statistical summary of the findings for samples collected on or before October 17, 2017 as required by §257.90. Consistent with the requirements of the CCR Rule, this Report will be posted to the facility’s operating record and notification will be made to the State of Texas. Additionally, this Report will be placed on the publically accessible internet site no later than January 31, 2018 (§257.105(h), §257.106(h), §257.107(h)). Unless otherwise mentioned, the analyses in this Report follow the Groundwater Sampling and Analysis Program (SAP) (ERM, 2017) posted on the internet site. The table below cross references the reporting requirements under the CCR Rule with the contents of this Report.
Regulatory Requirement Cross-Reference
Regulatory Citation
Requirement (paraphrased) Where Addressed
in this Report
§257.90(e) Status of the groundwater monitoring and corrective action program
Section 2
§257.90(e) Summarize key actions completed Section 2
§257.90(e) Describe any problems encountered and actions to resolve problems
Section 2
§257.90(e) Key activities for upcoming year Section 4
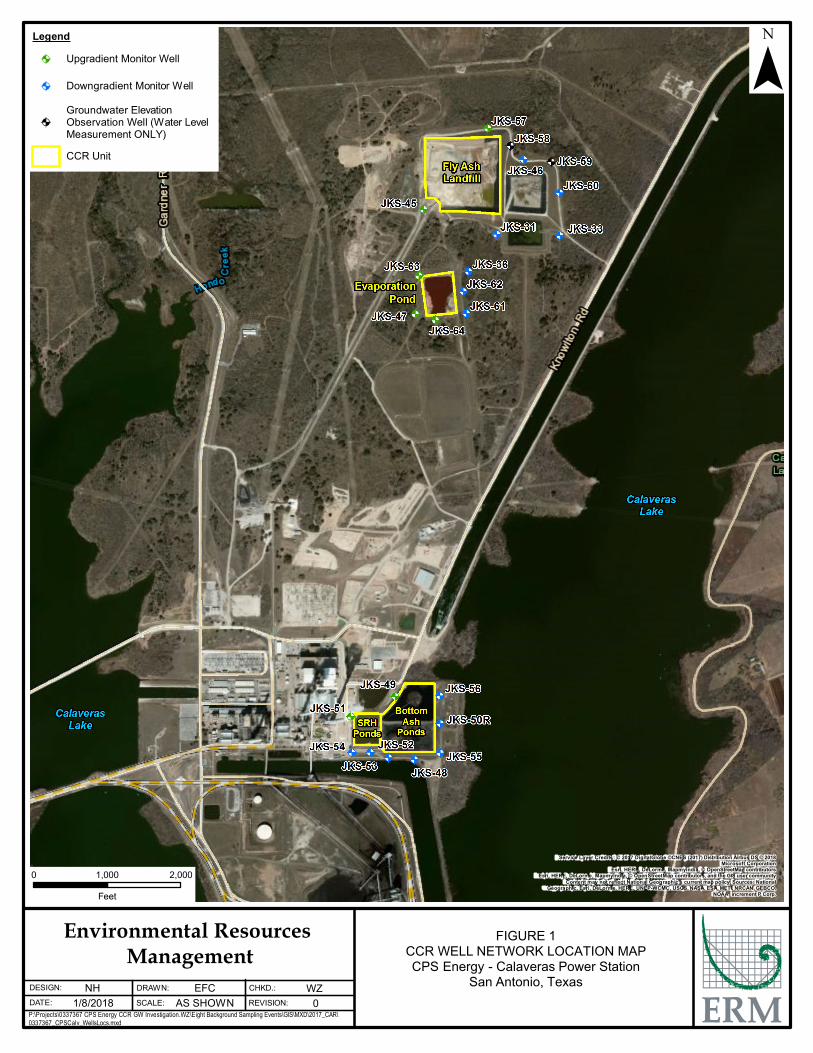
§257.90(e)(1) Map or aerial image of CCR unit and monitoring wells Figure 1
§257.90(e)(2) Identification of new monitoring wells installed or decommissioned during the preceding year
Section 2
§257.90(e)(3) Summary of groundwater data, monitoring wells and dates sampled, and whether sample was required under detection or assessment monitoring
Sections 2 and 3, Tables 1 through 3,
and Figure 2
§257.90(e)(4) Narrative discussion of any transition between monitoring programs
Section 4
The Evaporation Pond is located northeast of the Power Station generating units and is south of the Fly Ash Landfill. The Evaporation Pond currently receives boiler chemical cleaning waste and other authorized liquid wastes. The Evaporation Pond was originally constructed as a fly ash landfill, but was converted from a landfill to an impoundment in 1996. The CCR unit location is shown on Figure 1.

Environmental Resources Management 2 0337367\A9025 EP
2. PROGRAM STATUS
Since December 2016, groundwater samples were collected as part of background wamplingfrom the groundwater monitoring well network certified for use in determining compliance with the CCR Rule.
The groundwater monitoring well network consists of three upgradient monitoring wells (JKS-47, JKS-63, and JKS-64) and three downgradient monitoring wells (JKS-36, JKS-61, and JKS-62). All monitoring wells are screened within the uppermost groundwater bearing unit (GWBU). The uppermost GWBU is approximately 20 feet thick and is comprised of clayey/silty sand to well-sorted sand. The uppermost GWBU is located below unconfining units (i.e., sands, silts, and low to medium plasticity clays), and above a high plasticity clay (lower confining unit).
The monitoring well locations are shown in Figure 1. No problems were encountered in the data collection or in well performance with the exception of JKS-63. A groundwater sample was not collected from JKS-63 during the June 2017 sampling event due to well performance (well went dry). No action was required to resolve any issues. No new monitoring wells were installed or decommissioned after the certification of the well network.
2.1. GROUNDWATER FLOW RATE AND DIRECTION
Depth to groundwater surface measurements were made at each monitoring well prior to each sampling event. Groundwater elevations were calculated by subtracting the depth to groundwater from the surveyed reference elevation for each well.
Groundwater elevations for all eight sampling events are summarized in Table 1. Groundwater elevations and the potentiometric surface for the last sampling event (October 2017) are shown on Figure 2. Groundwater in the vicinity of the Evaporation Pond appears to flow towards Lake Calaveras (southeast). The horizontal gradient is approximately 0.003 feet/foot.
2.2. SAMPLING SUMMARY
A summary of the total number of samples collected from each monitoring well is provided in Table 2. Groundwater analytical results (Appendix III and Appendix IV constituents) for all eight sampling events are summarized in Table 3. Laboratory data packages are provided in Appendix A.
The Evaporation Pond monitoring wells were sampled using low flow sampling techniques during the eight sampling events from December 2016 to October 2017. CPS Energy completed each of the sampling events (ERM assisted during the first and second events). Although each monitoring well was sampled, with the exception of JKS-63 (as noted above), the following data gap has been identified:
Boron was not analyzed from the sample collected at monitoring well JKS-63 during the March 2017 sampling event due to an error by the laboratory.
2.3. DATA QUALITY
ERM reviewed field and laboratory documentation to assess the validity, reliability and usability of the analytical results. Samples were sent to Xenco Laboratories, located in San

Environmental Resources Management 3 0337367\A9025 EP
Antonio, Texas for analysis. Xenco Laboratories subcontracted Gel Laboratories, LLC located in Charleston, South Carolina for the analysis of Radium-226 and Radium-228. Data quality information reviewed for these results included field sampling forms, chain-of-custody documentation, holding times, lab methods, cooler temperatures, laboratory method blanks, laboratory control sample recoveries, field duplicate samples, matrix spikes / matrix spike duplicates, quantitation limits, and equipment blanks. A summary of the data qualifiers are included in Table 3. The data quality review found the results to be valid, reliable, and useable for decision making purposes with the listed qualifiers. No analytical results were rejected.
3. STATISTICAL ANALYSIS AND RESULTS
Consistent with the CCR Rule and the SAP, a prediction limit approach [40 CFR §257.93(f)] was used to identify potential impacts to groundwater. Tables and figures generated as part of the statistical analysis are provided in Appendix B. The steps outlined in the decision framework in the SAP include:
• Interwell versus intrawell comparisons; • Establishment of upgradient dataset; • Calculation of prediction limits; and • Conclusions.
3.1. INTERWELL VS INTRAWELL COMPARISONS
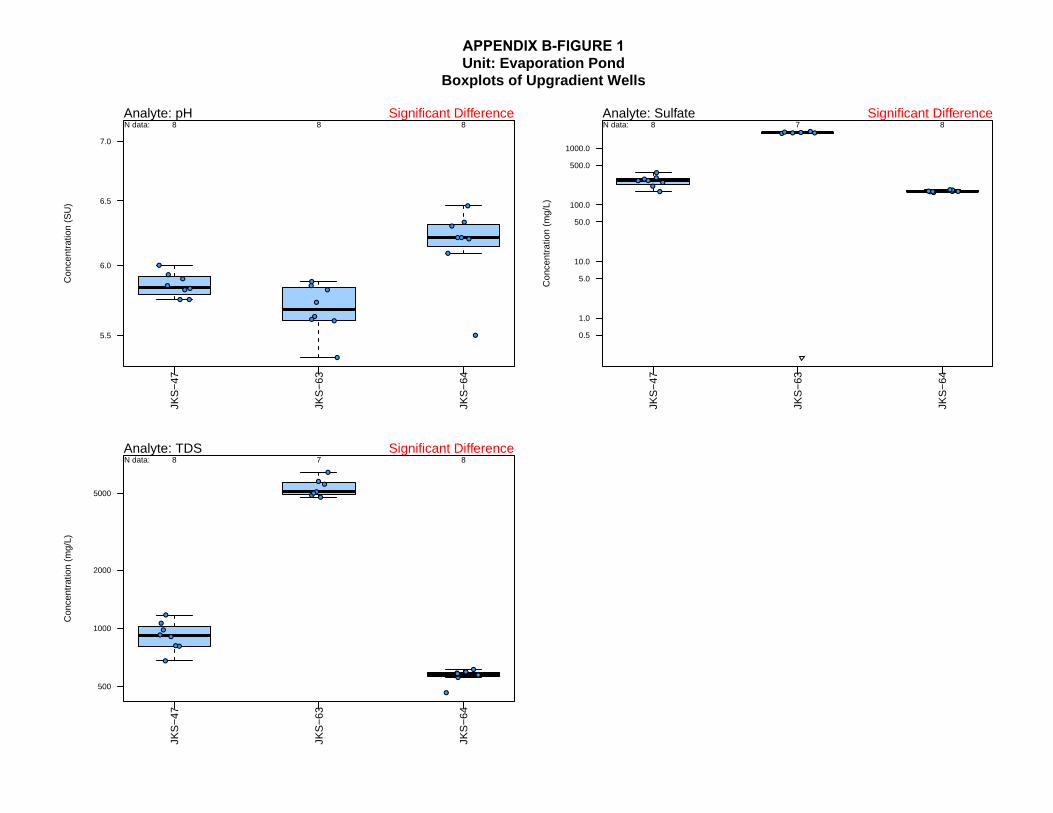
When multiple upgradient wells were available within the same unit, concentrations were compared among these wells to determine if they could be pooled to create a single, interwell, upgradient dataset. For each analyte, Boxplots (Appendix B, Figure 1) and Kruskal-Wallis test results (Appendix B, Table 1) are provided for upgradient wells. The statistical test shows that:
• One Appendix III analyte [fluoride] will follow interwell analysis, with no significant difference present in upgradient data; and
• The remaining six Appendix III analytes [boron, calcium, chloride, pH, sulfate, and total dissolved solids (TDS)] will follow intrawell analysis, with significant difference present in upgradient data.
Interwell analytes will use a pooled upgradient dataset for subsequent report sections. Conversely, intrawell analytes will have each individual upgradient dataset used for subsequent report sections.
3.2. ESTABLISHMENT OF UPGRADIENT DATASET
When evaluating the concentrations of analytes in groundwater, USEPA Unified Guidance (2009) recommends performing a careful quality check of the data to identify any anomalies. In addition to the data validation that was performed, descriptive statistics, outlier testing, and temporal stationarity checks were completed to finalize the upgradient dataset.
3.2.1. Descriptive Statistics
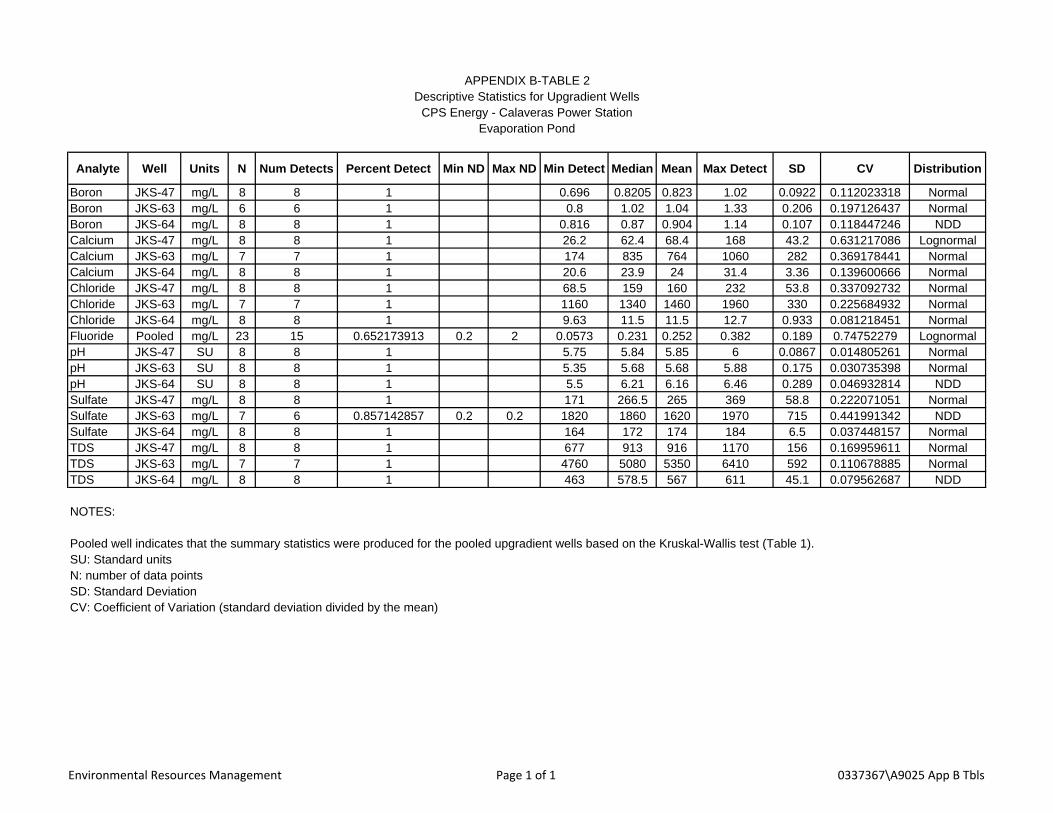
Descriptive statistics were calculated for the upgradient wells and analytes at the Evaporation Pond (Appendix B, Table 2). The descriptive statistics highlight a number of relevant characteristics about the upgradient datasets including:

Environmental Resources Management 4 0337367\A9025 EP
• There are a total of 19 well-analyte combinations for the upgradient dataset; • 19 well-analyte combinations have detection rates greater than or equal to 50 percent; • 17 well-analyte combinations have 100 percent detects; • 13 well-analyte combinations follow a normal distribution (using Shapiro-Wilks Normality
Test); • Two well-analyte combinations follow a log-normal distribution; and • Four well-analyte combinations have no discernible distribution.
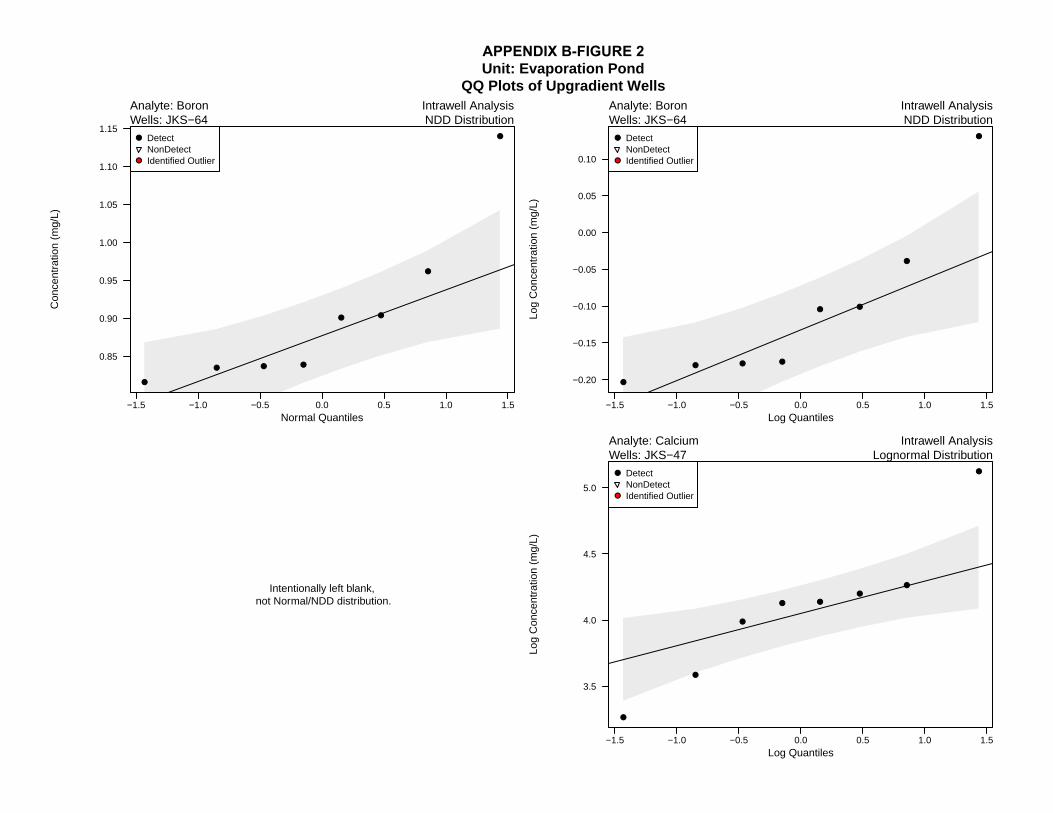
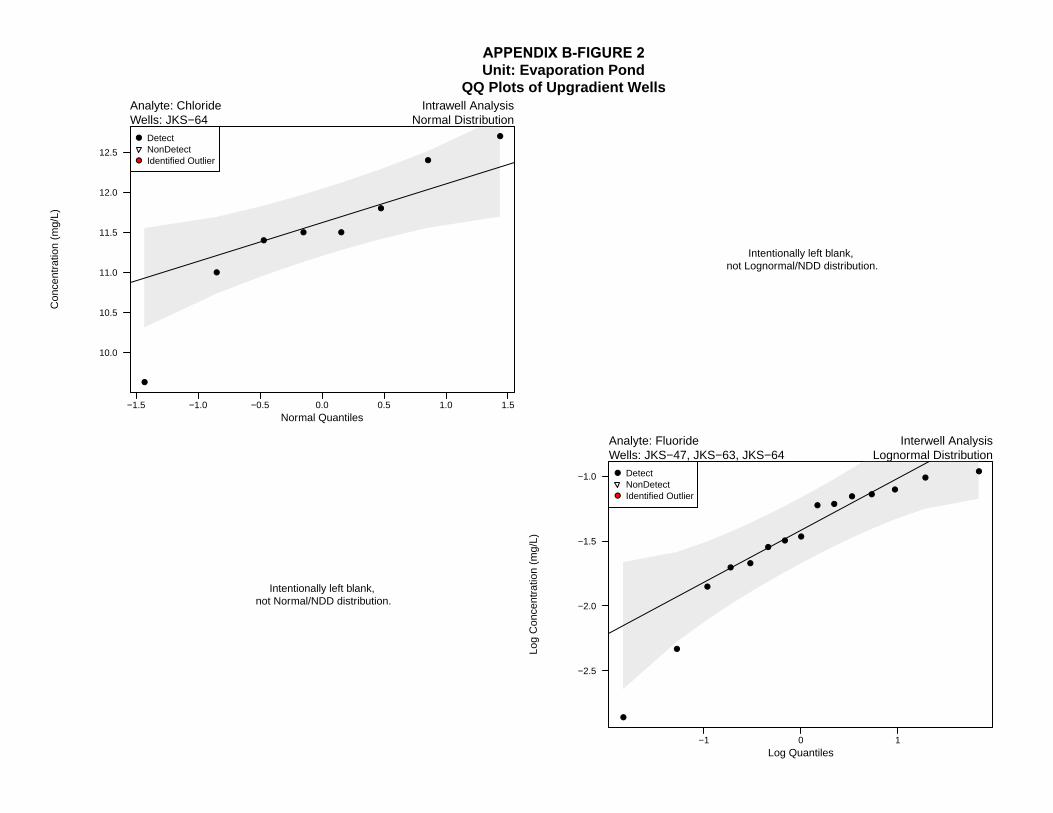
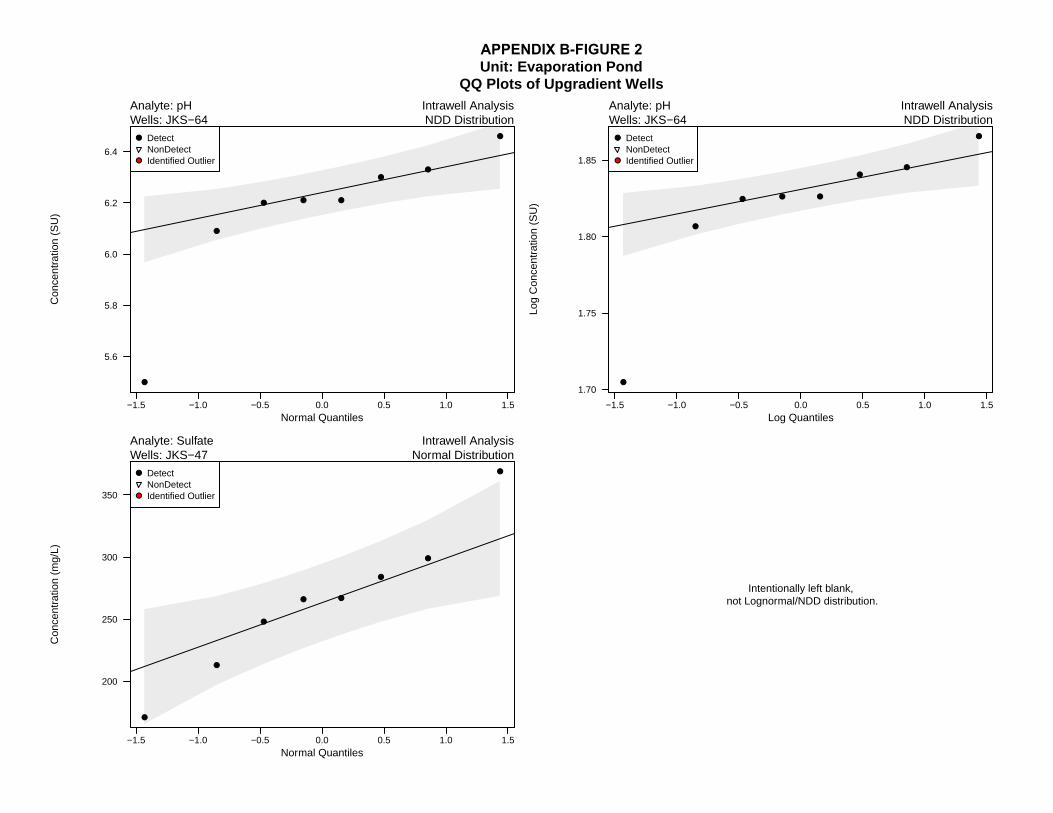
3.2.2. Outlier Determination
Both statistical and visual outlier tests were performed on the upgradient datasets. Data points identified as both a statistical and visual outlier (Appendix B, Table 3 and Appendix B, Figure 2) were reviewed before they were excluded from the dataset. A total of two outliers were initially flagged in the upgradient datasets. The outlier values were likely the result of seasonal fluctuations and were within the range of values found in nearby upgradient wells. No analytical or sampling issues were identified during data review, therefore these outlier values were considered valid and were retained in the dataset.
3.2.3. Check for Temporal Stability
A trend test was performed for all values in the upgradient wells that had at least five detected data points and at least 50 percent detection rate. Time series figures of upgradient wells are provided in Appendix B, Figure 3. Additionally, the Mann Kendall trend test results is provided in Appendix B, Table 4. The following summarizes the results of the trend analysis:
• There are a total of 19 well-analyte combinations in the upgradient dataset; • 19 well-analyte combinations meet the data requirements of the trend test of which:
o No well-analyte combinations had a significant increasing trend; o Two well-analyte combinations had a significant decreasing trend; and o 17 well-analyte combinations had no significant trend (i.e., concentrations were
stable over time).
3.3. CALCULATION OF PREDICTION LIMITS
A multi-part assessment of the monitoring wells was performed to determine what type of upper prediction limit (UPL) to calculate as a compliance point. Different decision framework will be applied for each upgradient well based on inter/intrawell analysis, data availability, and presence of temporal trends.
A total of two well-analyte combinations were found to have either increasing or decreasing trends. For these well-analyte pairs, a bootstrapped UPL calculated around a Theil Sen trend was used to derive a more accurate UPL. The remaining 17 well-analyte combinations were found to have no significant trend. Sanitas was used to calculate static UPLs using an annual site-wide false positive rate of 0.1 with a 1-of-2 re-testing approach.
A final UPL was selected for each analyte and compared to the most recent sample in the downgradient wells. A final lower prediction limit (LPL) was also selected for pH. For the one analyte following interwell analysis, the upgradient dataset was pooled prior to UPL
Environmental Resources Management 5 0337367\A9025 EP
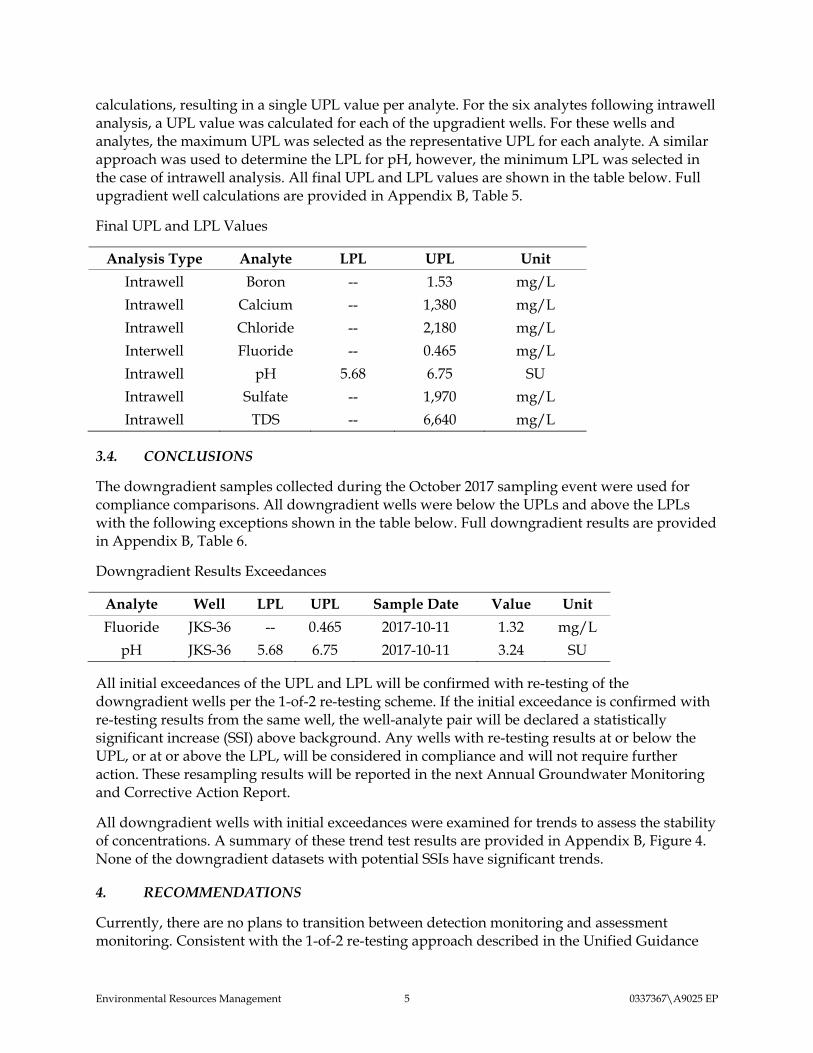
calculations, resulting in a single UPL value per analyte. For the six analytes following intrawell analysis, a UPL value was calculated for each of the upgradient wells. For these wells and analytes, the maximum UPL was selected as the representative UPL for each analyte. A similar approach was used to determine the LPL for pH, however, the minimum LPL was selected in the case of intrawell analysis. All final UPL and LPL values are shown in the table below. Full upgradient well calculations are provided in Appendix B, Table 5.
Final UPL and LPL Values
Analysis Type Analyte LPL UPL Unit
Intrawell Boron -- 1.53 mg/L
Intrawell Calcium -- 1,380 mg/L
Intrawell Chloride -- 2,180 mg/L
Interwell Fluoride -- 0.465 mg/L
Intrawell pH 5.68 6.75 SU
Intrawell Sulfate -- 1,970 mg/L
Intrawell TDS -- 6,640 mg/L
3.4. CONCLUSIONS
The downgradient samples collected during the October 2017 sampling event were used for compliance comparisons. All downgradient wells were below the UPLs and above the LPLs with the following exceptions shown in the table below. Full downgradient results are provided in Appendix B, Table 6.
Downgradient Results Exceedances
Analyte Well LPL UPL Sample Date Value Unit
Fluoride JKS-36 -- 0.465 2017-10-11 1.32 mg/L
pH JKS-36 5.68 6.75 2017-10-11 3.24 SU
All initial exceedances of the UPL and LPL will be confirmed with re-testing of the downgradient wells per the 1-of-2 re-testing scheme. If the initial exceedance is confirmed with re-testing results from the same well, the well-analyte pair will be declared a statistically significant increase (SSI) above background. Any wells with re-testing results at or below the UPL, or at or above the LPL, will be considered in compliance and will not require further action. These resampling results will be reported in the next Annual Groundwater Monitoring and Corrective Action Report.
All downgradient wells with initial exceedances were examined for trends to assess the stability of concentrations. A summary of these trend test results are provided in Appendix B, Figure 4. None of the downgradient datasets with potential SSIs have significant trends.
4. RECOMMENDATIONS
Currently, there are no plans to transition between detection monitoring and assessment monitoring. Consistent with the 1-of-2 re-testing approach described in the Unified Guidance

Environmental Resources Management 6 0337367\A9025 EP
and the SAP, initial exceedances will be re-tested within 90 days. Based on these re-testing results, if an SSI is found, a notification or written demonstration will be prepared within 90 days. Based on the findings of the written demonstration, detection monitoring and/or assessment monitoring will be initiated as appropriate under §257.94 and §257.95.
5. REFERENCES
ERM, 2017. Groundwater Sampling and Analysis Program. Austin, Texas.
USEPA, 2009. Statistical Analysis of Groundwater Monitoring Data at RCRA Facilities. Unified Guidance. USEPA/530/R/09/007. Office of Resource Conservation and Recovery. Washington, D.C.

Tables

TOC Elevation 513.63 TOC Elevation 526.862 TOC Elevation 507.84
Sampling Event Sampling Event DatesDepth to Water
(feet btoc)Water Level
(msl)Depth to Water
(feet btoc)Water Level
(msl)Depth to Water
(feet btoc)Water Level
(msl)
1 12/6/16 to 12/8/16 30.98 482.65 44.45 482.41 24.98 482.86
2 2/21/17 to 2/23/17 (1) 30.64 482.99 44.25 482.61 24.24 483.60
3 3/28/17 to 3/30/17 30.47 483.16 44.12 482.74 24.21 483.63
4 5/2/17 to 5/4/17 30.29 483.34 43.89 482.97 24.46 483.38
5 6/20/17 to 6/21/17 30.40 483.23 43.85 483.01 24.40 483.44
6 7/25/17 to 7/26/17 30.62 483.01 44.00 482.86 24.78 483.06
7 8/29/17 to 8/30/17 30.50 483.13 43.90 482.96 25.70 482.14
8 10/10/17 to 10/11/17 30.71 482.92 44.05 482.81 24.95 482.89
TOC Elevation 508.41 TOC Elevation 505.51 TOC Elevation 509.84
Sampling Event Sampling Event DatesDepth to Water
(feet btoc)Water Level
(msl)Depth to Water
(feet btoc)Water Level
(msl)Depth to Water
(feet btoc)Water Level
(msl)1 12/6/16 to 12/8/16 25.99 482.42 23.95 481.56 28.63 481.21
2 2/21/17 to 2/23/17 (1) 25.78 482.63 23.31 482.20 28.30 481.54
3 3/28/17 to 3/30/17 25.37 483.04 23.10 482.41 28.42 481.424 5/2/17 to 5/4/17 43.89 464.52 22.85 482.66 28.00 481.845 6/20/17 to 6/21/17 25.40 483.01 22.05 483.46 28.05 481.796 7/25/17 to 7/26/17 25.62 482.79 23.50 482.01 28.12 481.727 8/29/17 to 8/30/17 25.70 482.71 23.60 481.91 28.12 481.728 10/10/17 to 10/11/17 25.91 482.50 23.97 481.54 28.00 481.84
NOTES:btoc = below top of casingmsl = mean sea level(1) JKS-47 was re-sampled on 2/28/2017.
JKS-36 Downgradient JKS-61 Downgradient JKS-62 Downgradient
TABLE 1Groundwater Elevations Summary
CPS Energy - Calaveras Power StationEvaporation Pond
JKS-63 Background JKS-64 BackgroundJKS-47 Background
Environmental Resources Management Page 1 of 1 0337367\A9025

12/6/16 to 12/8/16
2/21/17 to
2/23/17 (1)3/28/17 to
3/30/175/2/17 to
5/4/176/20/17 to
6/21/177/25/17 to
7/26/178/29/17 to
8/30/1710/10/17 to
10/11/17
JKS-36 Downgradient Monitoring 8 X X X X X X X X Detection
JKS-47 Background Monitoring 8 X X X X X X X X Detection
JKS-61 Downgradient Monitoring 8 X X X X X X X X Detection
JKS-62 Downgradient Monitoring 8 X X X X X X X X Detection
JKS-63 Background Monitoring 7 X X X X (2) X X X Detection
JKS-64 Background Monitoring 8 X X X X X X X X Detection
NOTES:X = Indicates that a sample was collected.(1) JKS-47 was re-sampled on 2/28/2017.(2) A sample was not collected at JKS-63 during Event 5 (June 2017), due to the well going dry during sampling activities.
Evaporation Pond
2016 - 2017 Sample Dates
CCR Unit Well ID Well Function
Number of Samples
Collected in 2016 - 2017
TABLE 2Groundwater Sampling Summary
CPS Energy - Calaveras Power StationEvaporation Pond
Monitoring Program
Environmental Resources Management Page 1 of 1 0337367\A9025

TABLE 3
Groundwater Analytical Results Summary
CPS Energy - Calaveras Power Station
Evaporation Pond
12/8/16 2/28/17 3/29/17 5/3/17 6/21/17 7/26/17 8/30/17 10/11/17
Event 1Dec 2016
Event 2Feb 2017
Event 3Mar 2017
Event 4May 2017
Event 5Jun 2017
Event 6Jul 2017
Event 7Aug 2017
Event 8Oct 2017
Constituents Unit
Appendix III - Detection MonitoringBoron mg/L 0.824 0.838 0.696 0.817 0.804 0.828 JH 0.760 1.02
Calcium mg/L 54.0 62.1 168 26.2 71.1 62.7 JH 66.7 36.1
Chloride mg/L 107 150 232 193 168 148 JH 210 68.5
Fluoride mg/L < 0.200 < 0.200 JH 0.315 0.382 JH 0.213 JH < 2.00 < 0.200 < 0.500
Sulfate mg/L 213 267 369 299 266 248 JH 284 171
pH - Field Collected Std 5.82 5.83 5.75 6.00 5.75 5.85 5.90 5.93
Total dissolved solids mg/L 811 922 1170 1060 979 806 JH 904 677
Appendix IV - Assessment MonitoringAntimony mg/L < 0.0100 < 0.00200 < 0.00200 < 0.0100 0.000275 < 0.00200 < 0.00200 < 0.00200
Arsenic mg/L 0.00442 0.00130 < 0.00200 < 0.0100 0.00185 0.00105 0.00124 < 0.00200
Barium mg/L 0.0475 0.0132 0.0180 0.0118 0.0154 0.00981 0.0104 0.00785
Beryllium mg/L 0.000813 0.000255 < 0.00200 < 0.0100 0.000352 < 0.00200 0.000172 < 0.00200
Cadmium mg/L < 0.0100 0.000637 < 0.00200 < 0.00200 0.000735 0.000611 0.000814 < 0.00200
Chromium mg/L 0.234 0.00430 < 0.00400 < 0.0200 0.00262 0.000855 0.00130 < 0.00400
Cobalt mg/L 0.00915 0.00102 < 0.00200 < 0.00200 0.00227 0.000976 0.00107 < 0.00200
Fluoride mg/L < 0.200 < 0.200 JH 0.315 0.382 JH 0.213 JH < 2.00 < 0.200 < 0.500
Lead mg/L 0.00586 0.000950 < 0.00200 < 0.0100 0.00157 0.000202 0.000449 < 0.00200
Lithium mg/L 0.0615 0.0478 < 0.100 0.0207 0.0720 0.0644 0.0799 0.0521
Mercury mg/L 0.0000600 < 0.000200 < 0.000200 < 0.000200 < 0.000200 < 0.000200 < 0.000200 < 0.000200
Molybdenum mg/L 0.0317 0.00126 < 0.00200 < 0.00200 0.000788 0.000581 0.000653 < 0.00200
Selenium mg/L 0.0493 0.0697 0.0518 0.0564 0.0613 0.0577 0.0525 0.0854
Thallium mg/L < 0.0100 < 0.00200 < 0.00200 < 0.0100 < 0.00200 < 0.00200 < 0.00200 < 0.00200
Radium-226 pCi/L 1.20 ± 0.342 0.578 ± 0.275 0.630 ± 0.237 0.538 ± 0.192 0.729 ± 0.278 < 0.304 ± 0.233 1.06 ± 0.361 0.246 ± 0.180
Radium-228 pCi/L < 1.66 ± 1.15 < 1.34 ± 1.05 < 1.27 ± 0.960 2.17 ± 1.01 < 0.664 ± 0.929 < 0.771 ± 1.48 1.65 ± 1.05 < 0.463 ± 0.866
NOTES:
mg/L: Milligrams per Liter.Std.: Standard Units.pCi/L: Picocuries per Liter.
NS: Indicates sample was not collected.
H: Bias in sample result likely to be high.
(1) Constituent list from Appendix III and IV of the USEPA CCR Rule (2015).
-- : Laboratory did not analyze sample for indicated constituent.
<0.0360: Analyte Not Detected at the laboratory reporting limit (Sample Detection Limit).
J: Analyte detected above method (sample) detection limit but below method quantitation limit.
Task
Sample Date
JKS-47 Upgradient
Environmental Resources Management Page 1 of 6 0337367\A9025

TABLE 3
Groundwater Analytical Results Summary
CPS Energy - Calaveras Power Station
Evaporation Pond
Constituents Unit
Appendix III - Detection MonitoringBoron mg/L
Calcium mg/L
Chloride mg/L
Fluoride mg/L
Sulfate mg/L
pH - Field Collected Std
Total dissolved solids mg/L
Appendix IV - Assessment MonitoringAntimony mg/L
Arsenic mg/L
Barium mg/L
Beryllium mg/L
Cadmium mg/L
Chromium mg/L
Cobalt mg/L
Fluoride mg/L
Lead mg/L
Lithium mg/L
Mercury mg/L
Molybdenum mg/L
Selenium mg/L
Thallium mg/L
Radium-226 pCi/L
Radium-228 pCi/L
NOTES:
mg/L: Milligrams per Liter.Std.: Standard Units.pCi/L: Picocuries per Liter.
NS: Indicates sample was not collected.
H: Bias in sample result likely to be high.
(1) Constituent list from Appendix III and IV of the USEPA CCR Rule (2015).
-- : Laboratory did not analyze sample for indicated constituent.
<0.0360: Analyte Not Detected at the laboratory reporting limit (Sample Detection Limit).
J: Analyte detected above method (sample) detection limit but below method quantitation limit.
Task
Sample Date 12/8/16 2/22/17 3/29/17 5/3/17 7/26/17 8/30/17 10/11/17
Event 1Dec 2016
Event 2Feb 2017
Event 3Mar 2017
Event 4May 2017
Event 5Jun 2017
Event 6Jul 2017
Event 7Aug 2017
Event 8Oct 2017
0.800 0.866 -- 0.981 NS 1.33 JH 1.23 1.10
783 914 713 1060 NS 835 174 872
1230 1160 1220 1340 NS 1960 JH 1890 1450
0.0573 0.320 0.297 0.364 JH NS 0.0971 JH 0.182 JH < 0.500
< 0.200 1860 1890 1860 NS 1970 1920 1820
5.61 5.35 5.60 5.85 NS 5.88 5.82 5.63
5750 4760 4870 5560 NS 6410 5000 5540
< 0.0100 0.000459 0.000695 < 0.0100 NS < 0.00200 0.000424 < 0.00200
0.00332 0.00294 0.00128 < 0.0100 NS 0.000893 0.000992 < 0.00200
0.0626 0.0540 0.0336 0.0316 NS 0.0294 0.0258 0.0224
< 0.0100 0.000930 0.000442 < 0.0100 NS 0.000196 0.000223 < 0.00200
0.00339 0.00405 0.00394 0.00316 NS 0.00282 0.00263 0.00296
1.49 0.735 0.371 0.114 NS 0.0742 0.0584 0.0130
0.0802 0.0762 0.0546 0.0331 NS 0.0137 0.0119 0.0119
0.0573 0.320 0.297 0.364 JH NS 0.0971 JH 0.182 JH < 0.500
0.00441 0.00599 0.00108 < 0.0100 NS 0.000238 0.000551 < 0.00200
< 0.0200 0.116 < 0.100 0.654 NS 0.946 1.15 0.791
0.000236 0.000237 0.000206 0.0000400 NS 0.000260 0.000441 0.000381
0.186 0.00789 0.00966 0.00419 NS 0.00281 0.00180 < 0.00200
0.0188 0.0210 0.0257 0.0188 NS 0.0288 0.0318 0.0249
< 0.0100 < 0.00200 < 0.00200 < 0.0100 NS < 0.00200 < 0.00200 < 0.00200
3.42 ± 0.573 2.76 ± 0.476 5.79 ± 0.790 4.57 ± 0.577 NS 6.70 ± 0.744 7.36 ± 0.874 5.04 ± 0.711
2.44 ± 1.44 4.13 ± 1.21 < 2.04 ± 1.61 3.41 ± 0.968 NS 10.9 ± 2.31 < 1.79 ± 1.27 6.77 ± 1.48
JKS-63 Upgradient
Environmental Resources Management Page 2 of 6 0337367\A9025

TABLE 3
Groundwater Analytical Results Summary
CPS Energy - Calaveras Power Station
Evaporation Pond
Constituents Unit
Appendix III - Detection MonitoringBoron mg/L
Calcium mg/L
Chloride mg/L
Fluoride mg/L
Sulfate mg/L
pH - Field Collected Std
Total dissolved solids mg/L
Appendix IV - Assessment MonitoringAntimony mg/L
Arsenic mg/L
Barium mg/L
Beryllium mg/L
Cadmium mg/L
Chromium mg/L
Cobalt mg/L
Fluoride mg/L
Lead mg/L
Lithium mg/L
Mercury mg/L
Molybdenum mg/L
Selenium mg/L
Thallium mg/L
Radium-226 pCi/L
Radium-228 pCi/L
NOTES:
mg/L: Milligrams per Liter.Std.: Standard Units.pCi/L: Picocuries per Liter.
NS: Indicates sample was not collected.
H: Bias in sample result likely to be high.
(1) Constituent list from Appendix III and IV of the USEPA CCR Rule (2015).
-- : Laboratory did not analyze sample for indicated constituent.
<0.0360: Analyte Not Detected at the laboratory reporting limit (Sample Detection Limit).
J: Analyte detected above method (sample) detection limit but below method quantitation limit.
Task
Sample Date 12/8/16 2/23/17 3/29/17 5/4/17 6/21/17 7/26/17 8/30/17 10/11/17
Event 1Dec 2016
Event 2Feb 2017
Event 3Mar 2017
Event 4May 2017
Event 5Jun 2017
Event 6Jul 2017
Event 7Aug 2017
Event 8Oct 2017
0.839 0.837 1.14 0.962 0.816 0.904 JH 0.835 0.901
25.1 24.0 32.3 23.8 20.6 21.7 JH 21.6 25.2
12.8 12.4 11.8 11.0 11.4 11.5 11.5 9.63
< 0.200 0.294 JH < 4.00 0.188 0.231 JH 0.157 JH 0.224 JH < 0.500
171 182 184 174 172 170 JH 172 164
6.46 5.50 6.30 6.33 6.21 6.09 6.20 6.21
606 585 611 581 572 555 JH 463 576
< 0.00200 < 0.00200 < 0.00200 < 0.0100 < 0.00200 < 0.00200 < 0.00200 < 0.00200
0.000950 0.000730 0.000556 < 0.0100 0.000476 0.000490 0.000519 < 0.00200
0.00768 0.00451 0.00415 0.00410 0.00320 0.00324 0.00275 < 0.00400
< 0.0200 < 0.00200 < 0.00200 < 0.0100 < 0.00200 < 0.00200 < 0.00200 < 0.00200
< 0.00200 < 0.00200 < 0.00200 < 0.0100 < 0.00200 < 0.00200 < 0.00200 < 0.00200
< 0.00400 0.000905 < 0.00400 < 0.0200 0.000867 0.000637 0.000961 < 0.00400
0.00100 0.000952 0.000912 0.000859 0.000745 0.000856 0.000889 < 0.00200
< 0.200 0.294 JH < 4.00 0.188 0.231 JH 0.157 JH 0.224 JH < 0.500
< 0.00200 < 0.00200 < 0.00200 < 0.0100 < 0.00200 < 0.00200 < 0.00200 < 0.00200
0.0178 0.0146 < 0.100 0.0152 0.0173 0.0181 0.0252 0.0208
< 0.000200 < 0.000200 < 0.000200 < 0.000200 < 0.000200 < 0.000200 0.0000540 < 0.000200
0.000398 0.000317 < 0.00200 < 0.0100 0.000265 < 0.00200 0.000273 < 0.00200
< 0.00200 0.000550 0.000538 < 0.0100 0.000468 0.000468 < 0.00200 < 0.00200
< 0.00200 < 0.00200 < 0.00200 < 0.0100 < 0.00200 < 0.00200 < 0.00200 < 0.00200
0.981 ± 0.400 1.16 ± 0.408 0.530 ± 0.284 < 0.231 ± 0.174 0.258 ± 0.175 < 0.286 ± 0.247 1.05 ± 0.361 0.531 ± 0.276
< 0.429 ± 1.56 2.07 ± 1.22 < -0.102 ± 1.07 < 0.408 ± 0.764 < 0.699 ± 0.761 2.49 ± 1.54 < 0.260 ± 0.639 < 1.00 ±0.834
JKS-64 Upgradient
Environmental Resources Management Page 3 of 6 0337367\A9025
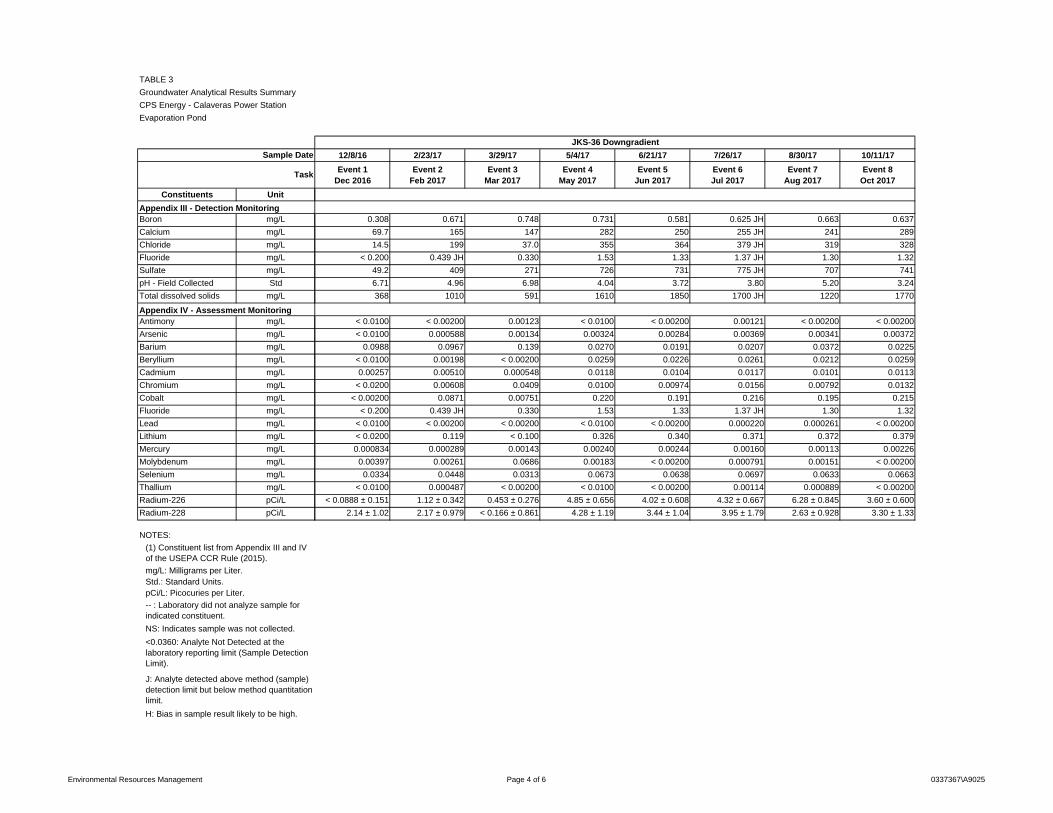
TABLE 3
Groundwater Analytical Results Summary
CPS Energy - Calaveras Power Station
Evaporation Pond
Constituents Unit
Appendix III - Detection MonitoringBoron mg/L
Calcium mg/L
Chloride mg/L
Fluoride mg/L
Sulfate mg/L
pH - Field Collected Std
Total dissolved solids mg/L
Appendix IV - Assessment MonitoringAntimony mg/L
Arsenic mg/L
Barium mg/L
Beryllium mg/L
Cadmium mg/L
Chromium mg/L
Cobalt mg/L
Fluoride mg/L
Lead mg/L
Lithium mg/L
Mercury mg/L
Molybdenum mg/L
Selenium mg/L
Thallium mg/L
Radium-226 pCi/L
Radium-228 pCi/L
NOTES:
mg/L: Milligrams per Liter.Std.: Standard Units.pCi/L: Picocuries per Liter.
NS: Indicates sample was not collected.
H: Bias in sample result likely to be high.
(1) Constituent list from Appendix III and IV of the USEPA CCR Rule (2015).
-- : Laboratory did not analyze sample for indicated constituent.
<0.0360: Analyte Not Detected at the laboratory reporting limit (Sample Detection Limit).
J: Analyte detected above method (sample) detection limit but below method quantitation limit.
Task
Sample Date 12/8/16 2/23/17 3/29/17 5/4/17 6/21/17 7/26/17 8/30/17 10/11/17
Event 1Dec 2016
Event 2Feb 2017
Event 3Mar 2017
Event 4May 2017
Event 5Jun 2017
Event 6Jul 2017
Event 7Aug 2017
Event 8Oct 2017
0.308 0.671 0.748 0.731 0.581 0.625 JH 0.663 0.637
69.7 165 147 282 250 255 JH 241 289
14.5 199 37.0 355 364 379 JH 319 328
< 0.200 0.439 JH 0.330 1.53 1.33 1.37 JH 1.30 1.32
49.2 409 271 726 731 775 JH 707 741
6.71 4.96 6.98 4.04 3.72 3.80 5.20 3.24
368 1010 591 1610 1850 1700 JH 1220 1770
< 0.0100 < 0.00200 0.00123 < 0.0100 < 0.00200 0.00121 < 0.00200 < 0.00200
< 0.0100 0.000588 0.00134 0.00324 0.00284 0.00369 0.00341 0.00372
0.0988 0.0967 0.139 0.0270 0.0191 0.0207 0.0372 0.0225
< 0.0100 0.00198 < 0.00200 0.0259 0.0226 0.0261 0.0212 0.0259
0.00257 0.00510 0.000548 0.0118 0.0104 0.0117 0.0101 0.0113
< 0.0200 0.00608 0.0409 0.0100 0.00974 0.0156 0.00792 0.0132
< 0.00200 0.0871 0.00751 0.220 0.191 0.216 0.195 0.215
< 0.200 0.439 JH 0.330 1.53 1.33 1.37 JH 1.30 1.32
< 0.0100 < 0.00200 < 0.00200 < 0.0100 < 0.00200 0.000220 0.000261 < 0.00200
< 0.0200 0.119 < 0.100 0.326 0.340 0.371 0.372 0.379
0.000834 0.000289 0.00143 0.00240 0.00244 0.00160 0.00113 0.00226
0.00397 0.00261 0.0686 0.00183 < 0.00200 0.000791 0.00151 < 0.00200
0.0334 0.0448 0.0313 0.0673 0.0638 0.0697 0.0633 0.0663
< 0.0100 0.000487 < 0.00200 < 0.0100 < 0.00200 0.00114 0.000889 < 0.00200
< 0.0888 ± 0.151 1.12 ± 0.342 0.453 ± 0.276 4.85 ± 0.656 4.02 ± 0.608 4.32 ± 0.667 6.28 ± 0.845 3.60 ± 0.600
2.14 ± 1.02 2.17 ± 0.979 < 0.166 ± 0.861 4.28 ± 1.19 3.44 ± 1.04 3.95 ± 1.79 2.63 ± 0.928 3.30 ± 1.33
JKS-36 Downgradient
Environmental Resources Management Page 4 of 6 0337367\A9025
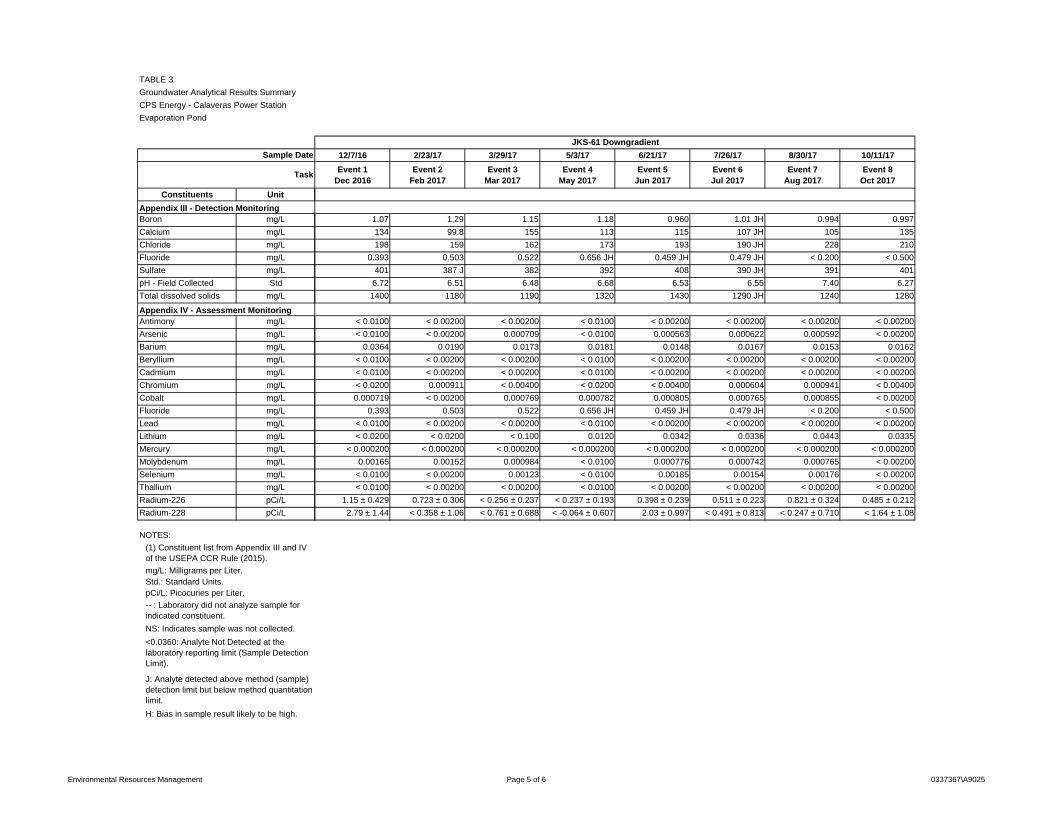
TABLE 3
Groundwater Analytical Results Summary
CPS Energy - Calaveras Power Station
Evaporation Pond
Constituents Unit
Appendix III - Detection MonitoringBoron mg/L
Calcium mg/L
Chloride mg/L
Fluoride mg/L
Sulfate mg/L
pH - Field Collected Std
Total dissolved solids mg/L
Appendix IV - Assessment MonitoringAntimony mg/L
Arsenic mg/L
Barium mg/L
Beryllium mg/L
Cadmium mg/L
Chromium mg/L
Cobalt mg/L
Fluoride mg/L
Lead mg/L
Lithium mg/L
Mercury mg/L
Molybdenum mg/L
Selenium mg/L
Thallium mg/L
Radium-226 pCi/L
Radium-228 pCi/L
NOTES:
mg/L: Milligrams per Liter.Std.: Standard Units.pCi/L: Picocuries per Liter.
NS: Indicates sample was not collected.
H: Bias in sample result likely to be high.
(1) Constituent list from Appendix III and IV of the USEPA CCR Rule (2015).
-- : Laboratory did not analyze sample for indicated constituent.
<0.0360: Analyte Not Detected at the laboratory reporting limit (Sample Detection Limit).
J: Analyte detected above method (sample) detection limit but below method quantitation limit.
Task
Sample Date 12/7/16 2/23/17 3/29/17 5/3/17 6/21/17 7/26/17 8/30/17 10/11/17
Event 1Dec 2016
Event 2Feb 2017
Event 3Mar 2017
Event 4May 2017
Event 5Jun 2017
Event 6Jul 2017
Event 7Aug 2017
Event 8Oct 2017
1.07 1.29 1.15 1.18 0.960 1.01 JH 0.994 0.997
134 99.8 155 113 115 107 JH 105 135
198 159 162 173 193 190 JH 228 210
0.393 0.503 0.522 0.656 JH 0.459 JH 0.479 JH < 0.200 < 0.500
401 387 J 382 392 408 390 JH 391 401
6.72 6.51 6.48 6.68 6.53 6.55 7.40 6.27
1400 1180 1190 1320 1430 1290 JH 1240 1280
< 0.0100 < 0.00200 < 0.00200 < 0.0100 < 0.00200 < 0.00200 < 0.00200 < 0.00200
< 0.0100 < 0.00200 0.000709 < 0.0100 0.000563 0.000622 0.000592 < 0.00200
0.0364 0.0190 0.0173 0.0181 0.0148 0.0167 0.0153 0.0162
< 0.0100 < 0.00200 < 0.00200 < 0.0100 < 0.00200 < 0.00200 < 0.00200 < 0.00200
< 0.0100 < 0.00200 < 0.00200 < 0.0100 < 0.00200 < 0.00200 < 0.00200 < 0.00200
< 0.0200 0.000911 < 0.00400 < 0.0200 < 0.00400 0.000604 0.000941 < 0.00400
0.000719 < 0.00200 0.000769 0.000782 0.000805 0.000765 0.000855 < 0.00200
0.393 0.503 0.522 0.656 JH 0.459 JH 0.479 JH < 0.200 < 0.500
< 0.0100 < 0.00200 < 0.00200 < 0.0100 < 0.00200 < 0.00200 < 0.00200 < 0.00200
< 0.0200 < 0.0200 < 0.100 0.0120 0.0342 0.0336 0.0443 0.0335
< 0.000200 < 0.000200 < 0.000200 < 0.000200 < 0.000200 < 0.000200 < 0.000200 < 0.000200
0.00165 0.00152 0.000984 < 0.0100 0.000776 0.000742 0.000765 < 0.00200
< 0.0100 < 0.00200 0.00123 < 0.0100 0.00185 0.00154 0.00176 < 0.00200
< 0.0100 < 0.00200 < 0.00200 < 0.0100 < 0.00200 < 0.00200 < 0.00200 < 0.00200
1.15 ± 0.429 0.723 ± 0.306 < 0.256 ± 0.237 < 0.237 ± 0.193 0.398 ± 0.239 0.511 ± 0.223 0.821 ± 0.324 0.485 ± 0.212
2.79 ± 1.44 < 0.358 ± 1.06 < 0.761 ± 0.688 < -0.064 ± 0.607 2.03 ± 0.997 < 0.491 ± 0.813 < 0.247 ± 0.710 < 1.64 ± 1.08
JKS-61 Downgradient
Environmental Resources Management Page 5 of 6 0337367\A9025
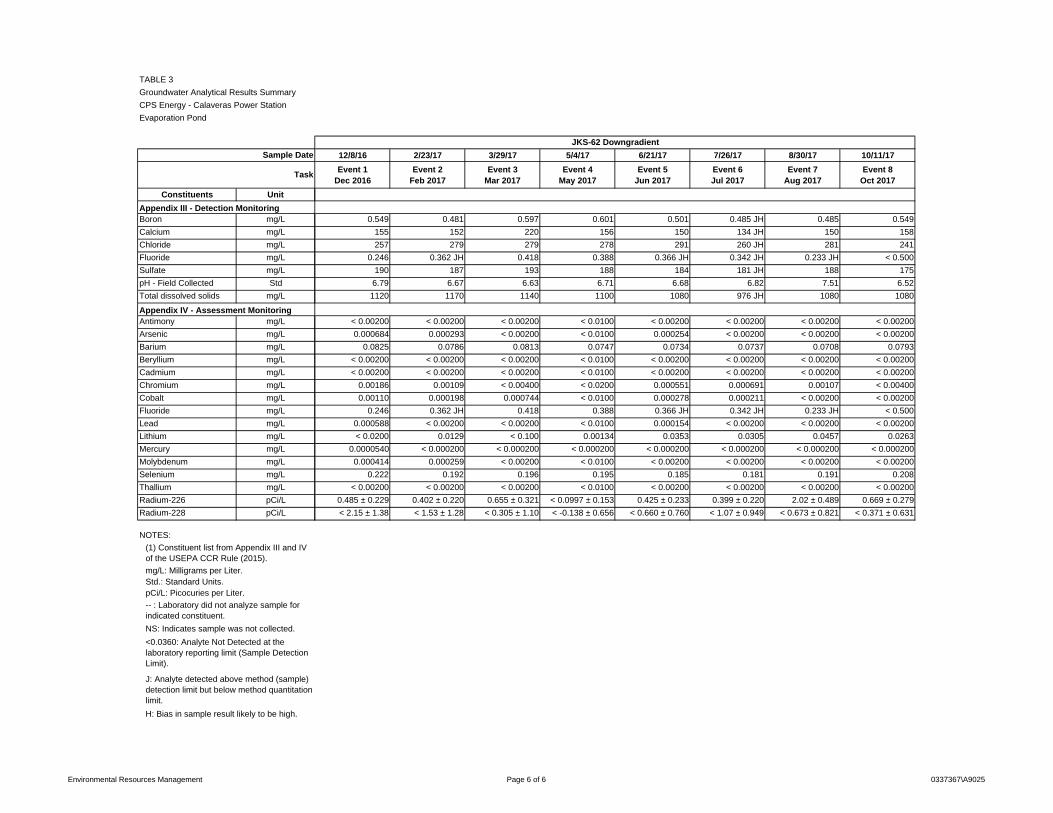
TABLE 3
Groundwater Analytical Results Summary
CPS Energy - Calaveras Power Station
Evaporation Pond
Constituents Unit
Appendix III - Detection MonitoringBoron mg/L
Calcium mg/L
Chloride mg/L
Fluoride mg/L
Sulfate mg/L
pH - Field Collected Std
Total dissolved solids mg/L
Appendix IV - Assessment MonitoringAntimony mg/L
Arsenic mg/L
Barium mg/L
Beryllium mg/L
Cadmium mg/L
Chromium mg/L
Cobalt mg/L
Fluoride mg/L
Lead mg/L
Lithium mg/L
Mercury mg/L
Molybdenum mg/L
Selenium mg/L
Thallium mg/L
Radium-226 pCi/L
Radium-228 pCi/L
NOTES:
mg/L: Milligrams per Liter.Std.: Standard Units.pCi/L: Picocuries per Liter.
NS: Indicates sample was not collected.
H: Bias in sample result likely to be high.
(1) Constituent list from Appendix III and IV of the USEPA CCR Rule (2015).
-- : Laboratory did not analyze sample for indicated constituent.
<0.0360: Analyte Not Detected at the laboratory reporting limit (Sample Detection Limit).
J: Analyte detected above method (sample) detection limit but below method quantitation limit.
Task
Sample Date 12/8/16 2/23/17 3/29/17 5/4/17 6/21/17 7/26/17 8/30/17 10/11/17
Event 1Dec 2016
Event 2Feb 2017
Event 3Mar 2017
Event 4May 2017
Event 5Jun 2017
Event 6Jul 2017
Event 7Aug 2017
Event 8Oct 2017
0.549 0.481 0.597 0.601 0.501 0.485 JH 0.485 0.549
155 152 220 156 150 134 JH 150 158
257 279 279 278 291 260 JH 281 241
0.246 0.362 JH 0.418 0.388 0.366 JH 0.342 JH 0.233 JH < 0.500
190 187 193 188 184 181 JH 188 175
6.79 6.67 6.63 6.71 6.68 6.82 7.51 6.52
1120 1170 1140 1100 1080 976 JH 1080 1080
< 0.00200 < 0.00200 < 0.00200 < 0.0100 < 0.00200 < 0.00200 < 0.00200 < 0.00200
0.000684 0.000293 < 0.00200 < 0.0100 0.000254 < 0.00200 < 0.00200 < 0.00200
0.0825 0.0786 0.0813 0.0747 0.0734 0.0737 0.0708 0.0793
< 0.00200 < 0.00200 < 0.00200 < 0.0100 < 0.00200 < 0.00200 < 0.00200 < 0.00200
< 0.00200 < 0.00200 < 0.00200 < 0.0100 < 0.00200 < 0.00200 < 0.00200 < 0.00200
0.00186 0.00109 < 0.00400 < 0.0200 0.000551 0.000691 0.00107 < 0.00400
0.00110 0.000198 0.000744 < 0.0100 0.000278 0.000211 < 0.00200 < 0.00200
0.246 0.362 JH 0.418 0.388 0.366 JH 0.342 JH 0.233 JH < 0.500
0.000588 < 0.00200 < 0.00200 < 0.0100 0.000154 < 0.00200 < 0.00200 < 0.00200
< 0.0200 0.0129 < 0.100 0.00134 0.0353 0.0305 0.0457 0.0263
0.0000540 < 0.000200 < 0.000200 < 0.000200 < 0.000200 < 0.000200 < 0.000200 < 0.000200
0.000414 0.000259 < 0.00200 < 0.0100 < 0.00200 < 0.00200 < 0.00200 < 0.00200
0.222 0.192 0.196 0.195 0.185 0.181 0.191 0.208
< 0.00200 < 0.00200 < 0.00200 < 0.0100 < 0.00200 < 0.00200 < 0.00200 < 0.00200
0.485 ± 0.229 0.402 ± 0.220 0.655 ± 0.321 < 0.0997 ± 0.153 0.425 ± 0.233 0.399 ± 0.220 2.02 ± 0.489 0.669 ± 0.279
< 2.15 ± 1.38 < 1.53 ± 1.28 < 0.305 ± 1.10 < -0.138 ± 0.656 < 0.660 ± 0.760 < 1.07 ± 0.949 < 0.673 ± 0.821 < 0.371 ± 0.631
JKS-62 Downgradient
Environmental Resources Management Page 6 of 6 0337367\A9025

Figures
DATE:DESIGN: DRAWN:
SCALE:CHKD.:REVISION:
Environmental Resources Management
FIGURE 1CCR WELL NETWORK LOCATION MAP CPS Energy - Calaveras Power Station
San Antonio, TexasNH1/8/2018
EFCAS SHOWN
WZ0
Service Layer Credits: © 2017 DigitalGlobe ©CNES (2017) Distribution Airbus DS © 2018Microsoft Corporation
Esri, HERE, DeLorme, MapmyIndia, © OpenStreetMap contributorsEsri, HERE, DeLorme, MapmyIndia, © OpenStreetMap contributors, and the GIS user community
Content may not reflect National Geographic's current map policy. Sources: NationalGeographic, Esri, DeLorme, HERE, UNEP-WCMC, USGS, NASA, ESA, METI, NRCAN, GEBCO,
NOAA, increment P Corp.
0 1,000 2,000Feet
¯Legend@A
@A
@A
Upgradient Monitor Well
Downgradient Monitor WellGroundwater Elevation Observation Well (Water Level Measurement ONLY)CCR Unit
P:\Projects\0337367 CPS Energy CCR GW Investigation.WZ\Eight Background Sampling Events\GIS\MXD\2017_CAR\0337367_CPSCalv_WellsLocs.mxd
DATE:DESIGN: DRAWN:
SCALE:CHKD.:REVISION:
Environmental Resources Management
FIGURE 2POTENTIOMETRIC SURFACE MAP -
OCTOBER 2017Evaporation Pond CCR Unit
CPS Energy - Calaveras Power Station San Antonio, TexasNH
1/10/2018EFC
AS SHOWNWZ
1
Service Layer Credits: Esri, HERE, DeLorme, MapmyIndia, ©OpenStreetMap contributors
© 2018 Microsoft Corporation © 2018 DigitalGlobe ©CNES (2018)Distribution Airbus DS
0 600 1,200Feet
¯Legend@A Upgradient Monitor Well
@A Downgradient Monitor Well
@AGroundwater ElevationObservation WellCCR Unit
P:\Projects\0337367 CPS Energy CCR GW Investigation.WZ\Eight Background Sampling Events\GIS\MXD\2017_CAR\0337367_CPSCalv_pmapN_EvapPond_oct2017.mxd
Potentiometric SurfaceContour Line (Feet, Mean Sea Level)Groundwater Flow DirectionPotentiometric Surface Elevation (Feet, Mean Sea Level)
484.96
483
Laboratory Data Packages Appendix A
(Data Packages Available Upon Request)

Statistical Analysis Tables and Figures
Appendix B

Analyte N Num Detects Percent Detect DF KW Statistic p-value Conclusion UPL Type
Boron 22 22 1 2 6.54 0.0379 Significant Difference IntrawellCalcium 23 23 1 2 19.2 <0.001 Significant Difference IntrawellChloride 23 23 1 2 19.6 <0.001 Significant Difference IntrawellFluoride 23 15 0.652173913 2 0.891 0.64 No Significant Difference InterwellpH 24 24 1 2 11.1 0.00384 Significant Difference IntrawellSulfate 23 22 0.956521739 2 11 0.00414 Significant Difference IntrawellTDS 23 23 1 2 19.6 <0.001 Significant Difference Intrawell
NOTES:
N: number of data pointsDF: degrees of freedomstatistic: Kruskal Wallis test statistic
UPL: upper prediction limit
p-value: P-values below 0.05 indicate that the median concentrations in the upgradient wells are significantly different from each other and the upgradient wells should not be pooled.
p-value: P-values equal or above 0.05 indicate that the median concentrations in the upgradient wells are not significantly different from each other and the upgradient wells can be pooled.
APPENDIX B-TABLE 1Kruskal-Wallis Test Comparison for Upgradient Wells
CPS Energy - Calaveras Power StationEvaporation Pond
Environmental Resources Management Page 1 of 1 0337367\A9025 App B Tbls
Analyte Well Units N Num Detects Percent Detect Min ND Max ND Min Detect Median Mean Max Detect SD CV Distribution
Boron JKS-47 mg/L 8 8 1 0.696 0.8205 0.823 1.02 0.0922 0.112023318 NormalBoron JKS-63 mg/L 6 6 1 0.8 1.02 1.04 1.33 0.206 0.197126437 NormalBoron JKS-64 mg/L 8 8 1 0.816 0.87 0.904 1.14 0.107 0.118447246 NDDCalcium JKS-47 mg/L 8 8 1 26.2 62.4 68.4 168 43.2 0.631217086 LognormalCalcium JKS-63 mg/L 7 7 1 174 835 764 1060 282 0.369178441 NormalCalcium JKS-64 mg/L 8 8 1 20.6 23.9 24 31.4 3.36 0.139600666 NormalChloride JKS-47 mg/L 8 8 1 68.5 159 160 232 53.8 0.337092732 NormalChloride JKS-63 mg/L 7 7 1 1160 1340 1460 1960 330 0.225684932 NormalChloride JKS-64 mg/L 8 8 1 9.63 11.5 11.5 12.7 0.933 0.081218451 NormalFluoride Pooled mg/L 23 15 0.652173913 0.2 2 0.0573 0.231 0.252 0.382 0.189 0.74752279 LognormalpH JKS-47 SU 8 8 1 5.75 5.84 5.85 6 0.0867 0.014805261 NormalpH JKS-63 SU 8 8 1 5.35 5.68 5.68 5.88 0.175 0.030735398 NormalpH JKS-64 SU 8 8 1 5.5 6.21 6.16 6.46 0.289 0.046932814 NDDSulfate JKS-47 mg/L 8 8 1 171 266.5 265 369 58.8 0.222071051 NormalSulfate JKS-63 mg/L 7 6 0.857142857 0.2 0.2 1820 1860 1620 1970 715 0.441991342 NDDSulfate JKS-64 mg/L 8 8 1 164 172 174 184 6.5 0.037448157 NormalTDS JKS-47 mg/L 8 8 1 677 913 916 1170 156 0.169959611 NormalTDS JKS-63 mg/L 7 7 1 4760 5080 5350 6410 592 0.110678885 NormalTDS JKS-64 mg/L 8 8 1 463 578.5 567 611 45.1 0.079562687 NDD
NOTES:
Pooled well indicates that the summary statistics were produced for the pooled upgradient wells based on the Kruskal-Wallis test (Table 1).SU: Standard unitsN: number of data pointsSD: Standard DeviationCV: Coefficient of Variation (standard deviation divided by the mean)
APPENDIX B-TABLE 2Descriptive Statistics for Upgradient Wells
CPS Energy - Calaveras Power StationEvaporation Pond
Environmental Resources Management Page 1 of 1 0337367\A9025 App B Tbls
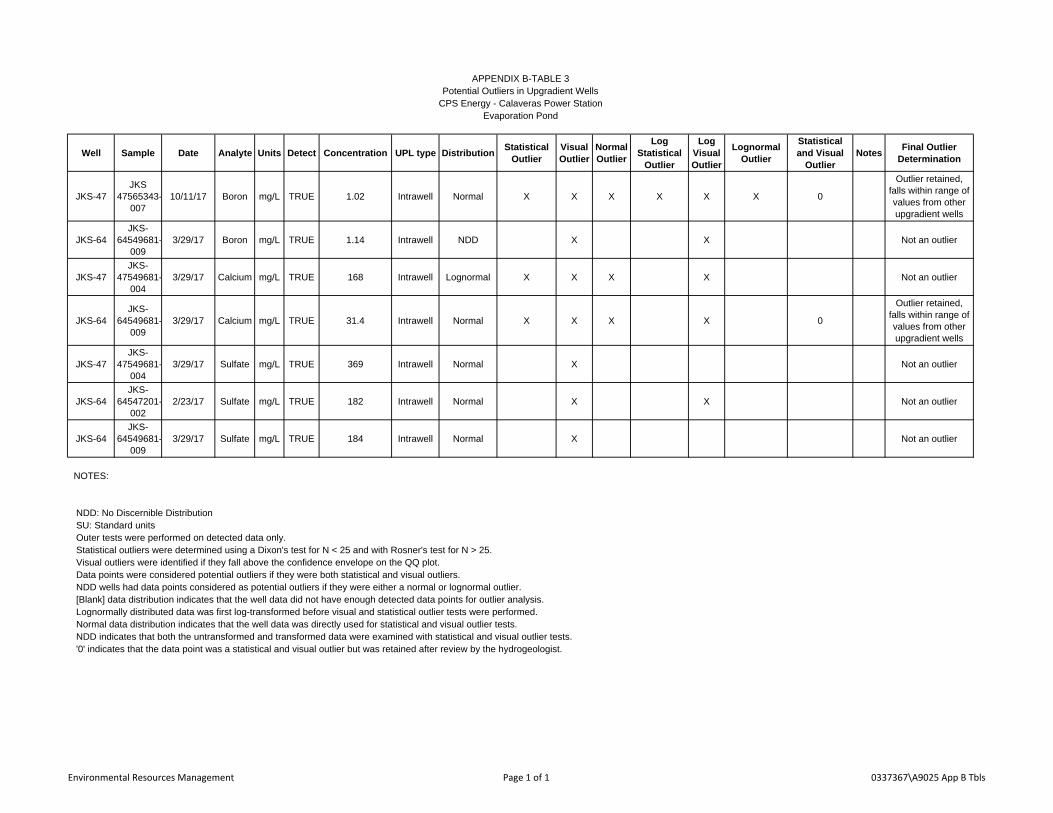
Well Sample Date Analyte Units Detect Concentration UPL type DistributionStatistical
OutlierVisual Outlier
Normal Outlier
Log Statistical
Outlier
Log Visual Outlier
Lognormal Outlier
Statistical and Visual
OutlierNotes
Final Outlier Determination
JKS-47JKS
47565343-007
10/11/17 Boron mg/L TRUE 1.02 Intrawell Normal X X X X X X 0
Outlier retained, falls within range of values from other upgradient wells
JKS-64JKS-
64549681-009
3/29/17 Boron mg/L TRUE 1.14 Intrawell NDD X X Not an outlier
JKS-47JKS-
47549681-004
3/29/17 Calcium mg/L TRUE 168 Intrawell Lognormal X X X X Not an outlier
JKS-64JKS-
64549681-009
3/29/17 Calcium mg/L TRUE 31.4 Intrawell Normal X X X X 0
Outlier retained, falls within range of values from other upgradient wells
JKS-47JKS-
47549681-004
3/29/17 Sulfate mg/L TRUE 369 Intrawell Normal X Not an outlier
JKS-64JKS-
64547201-002
2/23/17 Sulfate mg/L TRUE 182 Intrawell Normal X X Not an outlier
JKS-64JKS-
64549681-009
3/29/17 Sulfate mg/L TRUE 184 Intrawell Normal X Not an outlier
NOTES:
NDD: No Discernible DistributionSU: Standard unitsOuter tests were performed on detected data only.Statistical outliers were determined using a Dixon's test for N < 25 and with Rosner's test for N > 25.Visual outliers were identified if they fall above the confidence envelope on the QQ plot.Data points were considered potential outliers if they were both statistical and visual outliers.NDD wells had data points considered as potential outliers if they were either a normal or lognormal outlier.[Blank] data distribution indicates that the well data did not have enough detected data points for outlier analysis.Lognormally distributed data was first log-transformed before visual and statistical outlier tests were performed.Normal data distribution indicates that the well data was directly used for statistical and visual outlier tests.NDD indicates that both the untransformed and transformed data were examined with statistical and visual outlier tests.'0' indicates that the data point was a statistical and visual outlier but was retained after review by the hydrogeologist.
APPENDIX B-TABLE 3Potential Outliers in Upgradient Wells
CPS Energy - Calaveras Power StationEvaporation Pond
Environmental Resources Management Page 1 of 1 0337367\A9025 App B Tbls
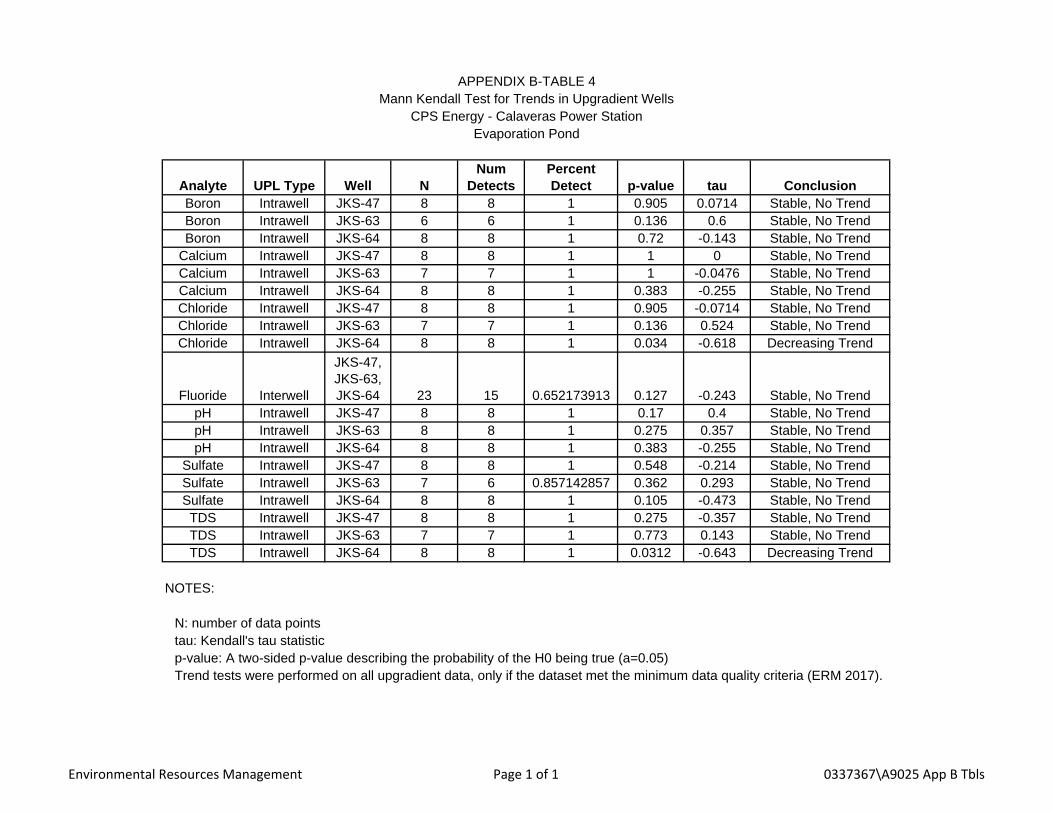
Analyte UPL Type Well NNum
DetectsPercent Detect p-value tau Conclusion
Boron Intrawell JKS-47 8 8 1 0.905 0.0714 Stable, No TrendBoron Intrawell JKS-63 6 6 1 0.136 0.6 Stable, No TrendBoron Intrawell JKS-64 8 8 1 0.72 -0.143 Stable, No Trend
Calcium Intrawell JKS-47 8 8 1 1 0 Stable, No TrendCalcium Intrawell JKS-63 7 7 1 1 -0.0476 Stable, No TrendCalcium Intrawell JKS-64 8 8 1 0.383 -0.255 Stable, No TrendChloride Intrawell JKS-47 8 8 1 0.905 -0.0714 Stable, No TrendChloride Intrawell JKS-63 7 7 1 0.136 0.524 Stable, No TrendChloride Intrawell JKS-64 8 8 1 0.034 -0.618 Decreasing Trend
Fluoride Interwell
JKS-47, JKS-63, JKS-64 23 15 0.652173913 0.127 -0.243 Stable, No Trend
pH Intrawell JKS-47 8 8 1 0.17 0.4 Stable, No TrendpH Intrawell JKS-63 8 8 1 0.275 0.357 Stable, No TrendpH Intrawell JKS-64 8 8 1 0.383 -0.255 Stable, No Trend
Sulfate Intrawell JKS-47 8 8 1 0.548 -0.214 Stable, No TrendSulfate Intrawell JKS-63 7 6 0.857142857 0.362 0.293 Stable, No TrendSulfate Intrawell JKS-64 8 8 1 0.105 -0.473 Stable, No TrendTDS Intrawell JKS-47 8 8 1 0.275 -0.357 Stable, No TrendTDS Intrawell JKS-63 7 7 1 0.773 0.143 Stable, No TrendTDS Intrawell JKS-64 8 8 1 0.0312 -0.643 Decreasing Trend
NOTES:
N: number of data pointstau: Kendall's tau statisticp-value: A two-sided p-value describing the probability of the H0 being true (a=0.05)Trend tests were performed on all upgradient data, only if the dataset met the minimum data quality criteria (ERM 2017).
APPENDIX B-TABLE 4Mann Kendall Test for Trends in Upgradient Wells
CPS Energy - Calaveras Power StationEvaporation Pond
Environmental Resources Management Page 1 of 1 0337367\A9025 App B Tbls
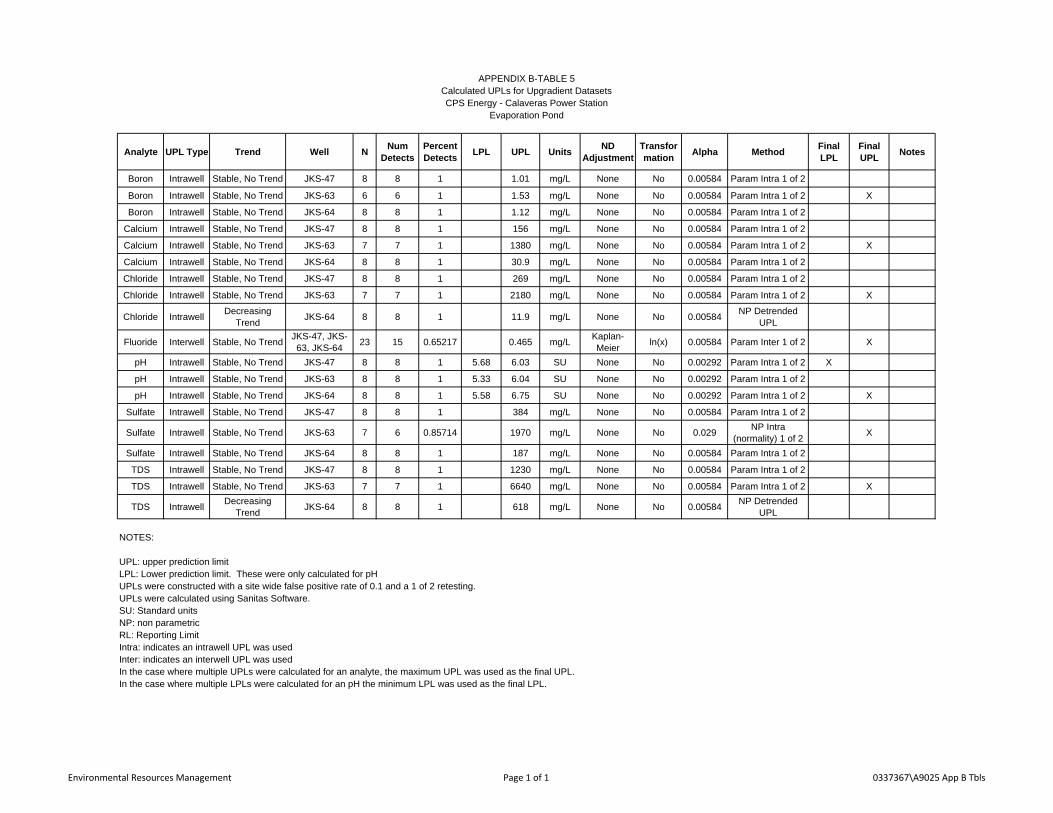
Analyte UPL Type Trend Well NNum
DetectsPercent Detects
LPL UPL UnitsND
AdjustmentTransformation
Alpha MethodFinal LPL
Final UPL
Notes
Boron Intrawell Stable, No Trend JKS-47 8 8 1 1.01 mg/L None No 0.00584 Param Intra 1 of 2
Boron Intrawell Stable, No Trend JKS-63 6 6 1 1.53 mg/L None No 0.00584 Param Intra 1 of 2 X
Boron Intrawell Stable, No Trend JKS-64 8 8 1 1.12 mg/L None No 0.00584 Param Intra 1 of 2
Calcium Intrawell Stable, No Trend JKS-47 8 8 1 156 mg/L None No 0.00584 Param Intra 1 of 2
Calcium Intrawell Stable, No Trend JKS-63 7 7 1 1380 mg/L None No 0.00584 Param Intra 1 of 2 X
Calcium Intrawell Stable, No Trend JKS-64 8 8 1 30.9 mg/L None No 0.00584 Param Intra 1 of 2
Chloride Intrawell Stable, No Trend JKS-47 8 8 1 269 mg/L None No 0.00584 Param Intra 1 of 2
Chloride Intrawell Stable, No Trend JKS-63 7 7 1 2180 mg/L None No 0.00584 Param Intra 1 of 2 X
Chloride IntrawellDecreasing
TrendJKS-64 8 8 1 11.9 mg/L None No 0.00584
NP Detrended UPL
Fluoride Interwell Stable, No TrendJKS-47, JKS-63, JKS-64
23 15 0.65217 0.465 mg/LKaplan-Meier
ln(x) 0.00584 Param Inter 1 of 2 X
pH Intrawell Stable, No Trend JKS-47 8 8 1 5.68 6.03 SU None No 0.00292 Param Intra 1 of 2 X
pH Intrawell Stable, No Trend JKS-63 8 8 1 5.33 6.04 SU None No 0.00292 Param Intra 1 of 2
pH Intrawell Stable, No Trend JKS-64 8 8 1 5.58 6.75 SU None No 0.00292 Param Intra 1 of 2 X
Sulfate Intrawell Stable, No Trend JKS-47 8 8 1 384 mg/L None No 0.00584 Param Intra 1 of 2
Sulfate Intrawell Stable, No Trend JKS-63 7 6 0.85714 1970 mg/L None No 0.029NP Intra
(normality) 1 of 2X
Sulfate Intrawell Stable, No Trend JKS-64 8 8 1 187 mg/L None No 0.00584 Param Intra 1 of 2
TDS Intrawell Stable, No Trend JKS-47 8 8 1 1230 mg/L None No 0.00584 Param Intra 1 of 2
TDS Intrawell Stable, No Trend JKS-63 7 7 1 6640 mg/L None No 0.00584 Param Intra 1 of 2 X
TDS IntrawellDecreasing
TrendJKS-64 8 8 1 618 mg/L None No 0.00584
NP Detrended UPL
NOTES:
UPL: upper prediction limitLPL: Lower prediction limit. These were only calculated for pHUPLs were constructed with a site wide false positive rate of 0.1 and a 1 of 2 retesting.UPLs were calculated using Sanitas Software.SU: Standard unitsNP: non parametricRL: Reporting LimitIntra: indicates an intrawell UPL was usedInter: indicates an interwell UPL was usedIn the case where multiple UPLs were calculated for an analyte, the maximum UPL was used as the final UPL.In the case where multiple LPLs were calculated for an pH the minimum LPL was used as the final LPL.
APPENDIX B-TABLE 5Calculated UPLs for Upgradient DatasetsCPS Energy - Calaveras Power Station
Evaporation Pond
Environmental Resources Management Page 1 of 1 0337367\A9025 App B Tbls

Analyte Well LPL UPL UnitsRecent
DateObservation Qualifier
Obs > UPL
NotesMann
Kendall p-value
Mann Kendall
tauBoron JKS-36 1.53 mg/L 10/11/17 0.637Boron JKS-61 1.53 mg/L 10/11/17 0.997Boron JKS-62 1.53 mg/L 10/11/17 0.549
Calcium JKS-36 1380 mg/L 10/11/17 289Calcium JKS-61 1380 mg/L 10/11/17 135Calcium JKS-62 1380 mg/L 10/11/17 158Chloride JKS-36 2180 mg/L 10/11/17 328Chloride JKS-61 2180 mg/L 10/11/17 210Chloride JKS-62 2180 mg/L 10/11/17 241
Fluoride JKS-36 0.465 mg/L 10/11/17 1.32 XTrend Test: Stable, No
Trend0.109 0.5
Fluoride JKS-61 0.465 mg/L 10/11/17 0.5 NDFluoride JKS-62 0.465 mg/L 10/11/17 0.5 ND
pH JKS-36 5.68 6.75 SU 10/11/17 3.24 XTrend Test: Stable, No
Trend0.109 -0.5
pH JKS-61 5.68 6.75 SU 10/11/17 6.27pH JKS-62 5.68 6.75 SU 10/11/17 6.52
Sulfate JKS-36 1970 mg/L 10/11/17 741Sulfate JKS-61 1970 mg/L 10/11/17 401Sulfate JKS-62 1970 mg/L 10/11/17 175
TDS JKS-36 6640 mg/L 10/11/17 1770TDS JKS-61 6640 mg/L 10/11/17 1280TDS JKS-62 6640 mg/L 10/11/17 1080
NOTES:
UPL: Upper Prediction LimitND: Not detectedSU: Standard unitstau: Kendall's tau statisticp-value: A two-sided p-value describing the probability of the H0 being true (a=0.05)
Exceed '0' indicated that the most recent observed value is higher than the UPL, but is not scored as an SSI due to Double Quantification Rule (ERM 2017).
APPENDIX B-TABLE 6Comparison of Downgradient Wells to UPLs/LPLs
CPS Energy - Calaveras Power Station Evaporation Pond
Exceed 'X' indicates that the most recent observed value is higher than the UPL (or out of range of the LPL and UPL in the case of pH.)Exceed 'X0' indicates that the two most recent values are higher than the UPL, but the upgradient well is 100% ND.
Environmental Resources Management Page 1 of 1 0337367\A9025 App B Tbls
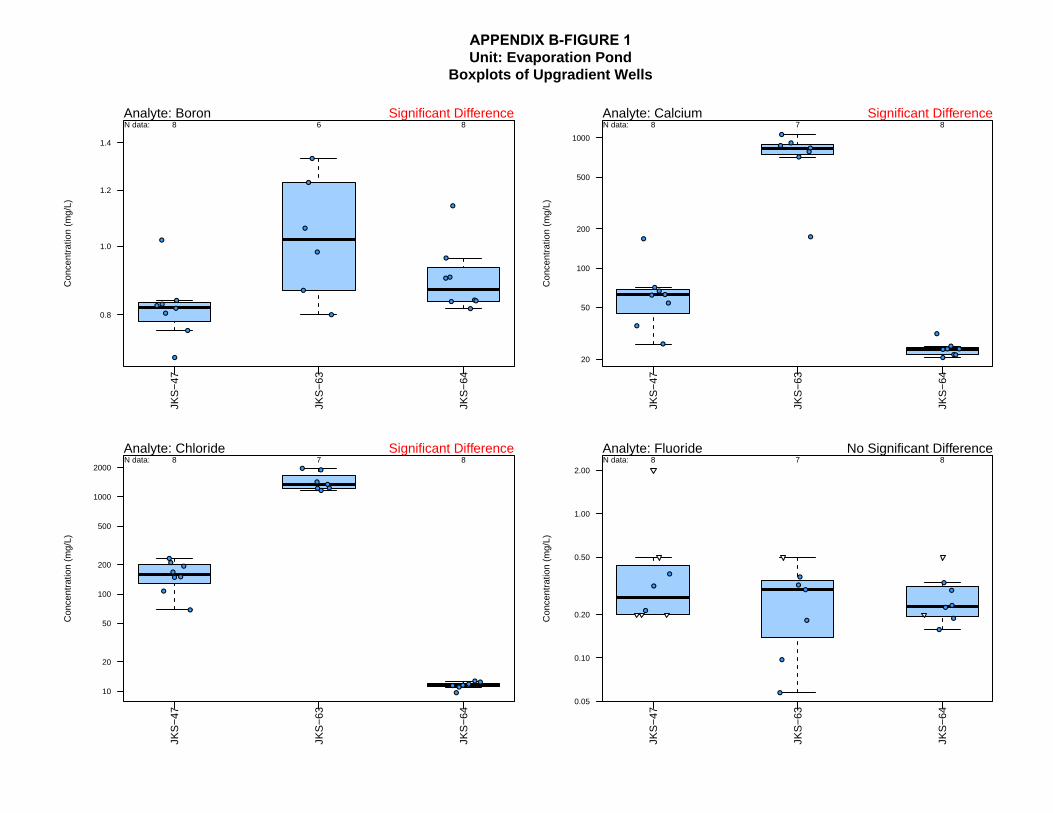
APPENDIX B-FIGURE 1Unit: Evaporation Pond
Boxplots of Upgradient Wells
Analyte: Boron Significant Difference
JKS
−47
JKS
−63
JKS
−64
Con
cent
ratio
n (m
g/L)
0.8
1.0
1.2
1.4
●
●
●
●
●
●
●
●●
●●
●
●
●
●
●
●
●●
●
●
●
N data: 8 6 8Analyte: Calcium Significant Difference
JKS
−47
JKS
−63
JKS
−64
Con
cent
ratio
n (m
g/L)
20
50
100
200
500
1000
●
●●
●
●●
●●
●
●
●
●
●
●
●
●
●
●
●●
●
●●
N data: 8 7 8
Analyte: Chloride Significant Difference
JKS
−47
JKS
−63
JKS
−64
Con
cent
ratio
n (m
g/L)
10
20
50
100
200
500
1000
2000
●●
●
●
●
●
● ●
●
●
●
●
●
●●●●
●
● ●●●●
N data: 8 7 8Analyte: Fluoride No Significant Difference
JKS
−47
JKS
−63
JKS
−64
Con
cent
ratio
n (m
g/L)
0.05
0.10
0.20
0.50
1.00
2.00
●
●
●
●
●
●
●
●●
●
●
●
●
●
●
N data: 8 7 8
Analyte: pH Significant Difference
JKS
−47
JKS
−63
JKS
−64
Con
cent
ratio
n (S
U)
5.5
6.0
6.5
7.0
● ●
●
●
●
●
●●
●
●
●
●
●
●
●●
●
●
●●
●
●
●●
N data: 8 8 8Analyte: Sulfate Significant Difference
JKS
−47
JKS
−63
JKS
−64
Con
cent
ratio
n (m
g/L)
0.5
1.0
5.0
10.0
50.0
100.0
500.0
1000.0
● ●●
●
●●
●●●
●●
●●
●●●●
● ●●● ●
N data: 8 7 8
Analyte: TDS Significant Difference
JKS
−47
JKS
−63
JKS
−64
Con
cent
ratio
n (m
g/L)
500
1000
2000
5000
●
●
●
●
●
●
●●●
●
●
●
●
●
●●
●
●
●●●
●
●
N data: 8 7 8
APPENDIX B-FIGURE 1Unit: Evaporation Pond
Boxplots of Upgradient Wells

APPENDIX B-FIGURE 2Unit: Evaporation Pond
QQ Plots of Upgradient Wells
Analyte: BoronWells: JKS−47
Intrawell AnalysisNormal Distribution
Normal Quantiles−1.5 −1.0 −0.5 0.0 0.5 1.0 1.5
Con
cent
ratio
n (m
g/L)
0.70
0.75
0.80
0.85
0.90
0.95
1.00
●
●
●
●● ●
●
●●
●
DetectNonDetectIdentified Outlier
Intentionally left blank, not Lognormal/NDD distribution.
Analyte: BoronWells: JKS−63
Intrawell AnalysisNormal Distribution
Normal Quantiles−1.0 −0.5 0.0 0.5 1.0
Con
cent
ratio
n (m
g/L)
0.8
0.9
1.0
1.1
1.2
1.3
●
●
●
●
●
●●
●
DetectNonDetectIdentified Outlier
Intentionally left blank, not Lognormal/NDD distribution.
Analyte: BoronWells: JKS−64
Intrawell AnalysisNDD Distribution
Normal Quantiles−1.5 −1.0 −0.5 0.0 0.5 1.0 1.5
Con
cent
ratio
n (m
g/L)
0.85
0.90
0.95
1.00
1.05
1.10
1.15
●
● ● ●
● ●
●
●●
●
DetectNonDetectIdentified Outlier
Analyte: BoronWells: JKS−64
Intrawell AnalysisNDD Distribution
Log Quantiles−1.5 −1.0 −0.5 0.0 0.5 1.0 1.5
Log
Con
cent
ratio
n (m
g/L)
−0.20
−0.15
−0.10
−0.05
0.00
0.05
0.10
●
● ● ●
● ●
●
●●
●
DetectNonDetectIdentified Outlier
Intentionally left blank, not Normal/NDD distribution.
Analyte: CalciumWells: JKS−47
Intrawell AnalysisLognormal Distribution
Log Quantiles−1.5 −1.0 −0.5 0.0 0.5 1.0 1.5
Log
Con
cent
ratio
n (m
g/L)
3.5
4.0
4.5
5.0
●
●
●
● ●
●
●
●●
●
DetectNonDetectIdentified Outlier
APPENDIX B-FIGURE 2Unit: Evaporation Pond
QQ Plots of Upgradient Wells

Analyte: CalciumWells: JKS−63
Intrawell AnalysisNormal Distribution
Normal Quantiles−1.0 −0.5 0.0 0.5 1.0
Con
cent
ratio
n (m
g/L)
200
400
600
800
1000
●
●
●
●
●
●
●●
●
DetectNonDetectIdentified Outlier
Intentionally left blank, not Lognormal/NDD distribution.
Analyte: CalciumWells: JKS−64
Intrawell AnalysisNormal Distribution
Normal Quantiles−1.5 −1.0 −0.5 0.0 0.5 1.0 1.5
Con
cent
ratio
n (m
g/L)
22
24
26
28
30
●
● ●
●● ●
●
●●
●
DetectNonDetectIdentified Outlier
Intentionally left blank, not Lognormal/NDD distribution.
APPENDIX B-FIGURE 2Unit: Evaporation Pond
QQ Plots of Upgradient Wells

Analyte: ChlorideWells: JKS−47
Intrawell AnalysisNormal Distribution
Normal Quantiles−1.5 −1.0 −0.5 0.0 0.5 1.0 1.5
Con
cent
ratio
n (m
g/L)
100
150
200
●
●
● ●
●
●
●
●●
●
DetectNonDetectIdentified Outlier
Intentionally left blank, not Lognormal/NDD distribution.
Analyte: ChlorideWells: JKS−63
Intrawell AnalysisNormal Distribution
Normal Quantiles−1.0 −0.5 0.0 0.5 1.0
Con
cent
ratio
n (m
g/L)
1200
1400
1600
1800
●
● ●
●
●
●
●●
●
DetectNonDetectIdentified Outlier
Intentionally left blank, not Lognormal/NDD distribution.
APPENDIX B-FIGURE 2Unit: Evaporation Pond
QQ Plots of Upgradient Wells
Analyte: ChlorideWells: JKS−64
Intrawell AnalysisNormal Distribution
Normal Quantiles−1.5 −1.0 −0.5 0.0 0.5 1.0 1.5
Con
cent
ratio
n (m
g/L)
10.0
10.5
11.0
11.5
12.0
12.5
●
●
●
● ●
●
●
●●
●
DetectNonDetectIdentified Outlier
Intentionally left blank, not Lognormal/NDD distribution.
Intentionally left blank, not Normal/NDD distribution.
Analyte: FluorideWells: JKS−47, JKS−63, JKS−64
Interwell AnalysisLognormal Distribution
Log Quantiles−1 0 1
Log
Con
cent
ratio
n (m
g/L)
−2.5
−2.0
−1.5
−1.0
●
●
●
●●
●●
●
● ●● ●
●
●●●
●
DetectNonDetectIdentified Outlier
APPENDIX B-FIGURE 2Unit: Evaporation Pond
QQ Plots of Upgradient Wells

Analyte: pHWells: JKS−47
Intrawell AnalysisNormal Distribution
Normal Quantiles−1.5 −1.0 −0.5 0.0 0.5 1.0 1.5
Con
cent
ratio
n (S
U)
5.75
5.80
5.85
5.90
5.95
6.00
● ●
●
●
●
●
●
●●
●
DetectNonDetectIdentified Outlier
Intentionally left blank, not Lognormal/NDD distribution.
Analyte: pHWells: JKS−63
Intrawell AnalysisNormal Distribution
Normal Quantiles−1.5 −1.0 −0.5 0.0 0.5 1.0 1.5
Con
cent
ratio
n (S
U)
5.4
5.5
5.6
5.7
5.8
5.9
●
●●
●
●
●
●
●●
●
DetectNonDetectIdentified Outlier
Intentionally left blank, not Lognormal/NDD distribution.
APPENDIX B-FIGURE 2Unit: Evaporation Pond
QQ Plots of Upgradient Wells
Analyte: pHWells: JKS−64
Intrawell AnalysisNDD Distribution
Normal Quantiles−1.5 −1.0 −0.5 0.0 0.5 1.0 1.5
Con
cent
ratio
n (S
U)
5.6
5.8
6.0
6.2
6.4
●
●
● ● ●
●●
●●
●
DetectNonDetectIdentified Outlier
Analyte: pHWells: JKS−64
Intrawell AnalysisNDD Distribution
Log Quantiles−1.5 −1.0 −0.5 0.0 0.5 1.0 1.5
Log
Con
cent
ratio
n (S
U)
1.70
1.75
1.80
1.85
●
●
● ● ●
●●
●●
●
DetectNonDetectIdentified Outlier
Analyte: SulfateWells: JKS−47
Intrawell AnalysisNormal Distribution
Normal Quantiles−1.5 −1.0 −0.5 0.0 0.5 1.0 1.5
Con
cent
ratio
n (m
g/L)
200
250
300
350
●
●
●
● ●
●
●
●●
●
DetectNonDetectIdentified Outlier
Intentionally left blank, not Lognormal/NDD distribution.
APPENDIX B-FIGURE 2Unit: Evaporation Pond
QQ Plots of Upgradient Wells

Analyte: SulfateWells: JKS−63
Intrawell AnalysisNDD Distribution
Normal Quantiles−1.0 −0.5 0.0 0.5 1.0
Con
cent
ratio
n (m
g/L)
1850
1900
1950
●
● ●
●
●
●●
●
DetectNonDetectIdentified Outlier
Analyte: SulfateWells: JKS−63
Intrawell AnalysisNDD Distribution
Log Quantiles−1.0 −0.5 0.0 0.5 1.0
Log
Con
cent
ratio
n (m
g/L)
7.52
7.54
7.56
7.58
●
● ●
●
●
●●
●
DetectNonDetectIdentified Outlier
Analyte: SulfateWells: JKS−64
Intrawell AnalysisNormal Distribution
Normal Quantiles−1.5 −1.0 −0.5 0.0 0.5 1.0 1.5
Con
cent
ratio
n (m
g/L)
165
170
175
180
●
●
●
● ●
●
●
●●
●
DetectNonDetectIdentified Outlier
Intentionally left blank, not Lognormal/NDD distribution.
APPENDIX B-FIGURE 2Unit: Evaporation Pond
QQ Plots of Upgradient Wells

Analyte: TDSWells: JKS−47
Intrawell AnalysisNormal Distribution
Normal Quantiles−1.5 −1.0 −0.5 0.0 0.5 1.0 1.5
Con
cent
ratio
n (m
g/L)
700
800
900
1000
1100
●
● ●
●
●
●
●
●●
●
DetectNonDetectIdentified Outlier
Intentionally left blank, not Lognormal/NDD distribution.
Analyte: TDSWells: JKS−63
Intrawell AnalysisNormal Distribution
Normal Quantiles−1.0 −0.5 0.0 0.5 1.0
Con
cent
ratio
n (m
g/L)
5000
5500
6000
●
●
●
●
●
●
●●
●
DetectNonDetectIdentified Outlier
Intentionally left blank, not Lognormal/NDD distribution.
APPENDIX B-FIGURE 2Unit: Evaporation Pond
QQ Plots of Upgradient Wells
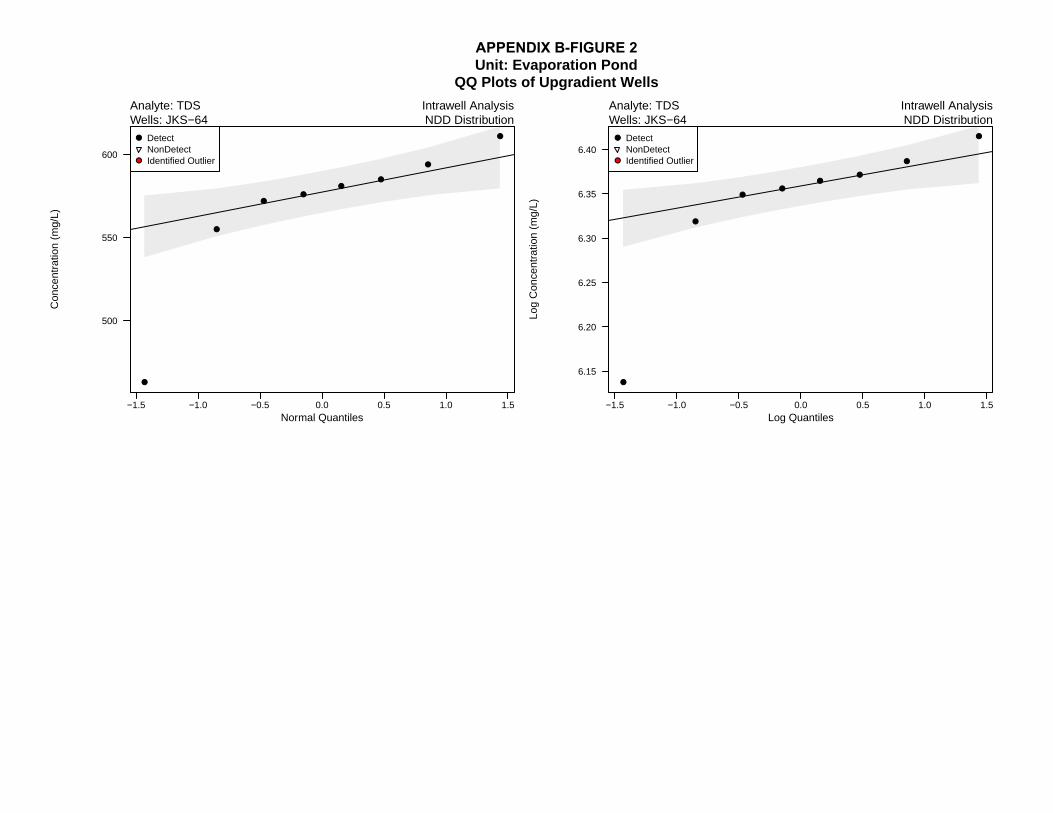
Analyte: TDSWells: JKS−64
Intrawell AnalysisNDD Distribution
Normal Quantiles−1.5 −1.0 −0.5 0.0 0.5 1.0 1.5
Con
cent
ratio
n (m
g/L)
500
550
600
●
●
●●
●●
●
●●
●
DetectNonDetectIdentified Outlier
Analyte: TDSWells: JKS−64
Intrawell AnalysisNDD Distribution
Log Quantiles−1.5 −1.0 −0.5 0.0 0.5 1.0 1.5
Log
Con
cent
ratio
n (m
g/L)
6.15
6.20
6.25
6.30
6.35
6.40
●
●
●●
●●
●
●●
●
DetectNonDetectIdentified Outlier
APPENDIX B-FIGURE 2Unit: Evaporation Pond
QQ Plots of Upgradient Wells

APPENDIX B-FIGURE 3Unit: Evaporation Pond
Timeseries of Upgradient Wells
Chemical: BoronSignificant Difference (Intrawell Analysis)
Jan2017
Apr2017
Jul2017
Oct2017
Con
cent
ratio
n (m
g/L)
0.0
0.2
0.4
0.6
0.8
1.0
1.2
● ●
●
● ●●
●
●
●
●
●
●
●
●
● ●
●
●
●
●
●
●
Wells
JKS−47JKS−63JKS−64
●
Symbols
DetectNonDetect
Chemical: CalciumSignificant Difference (Intrawell Analysis)
Jan2017
Apr2017
Jul2017
Oct2017
Con
cent
ratio
n (m
g/L)
0
200
400
600
800
1000
● ●
●
●
● ● ●●
●
●
●
●
●
●
●
● ● ● ● ● ● ● ●
Wells
JKS−47JKS−63JKS−64
●
Symbols
DetectNonDetect
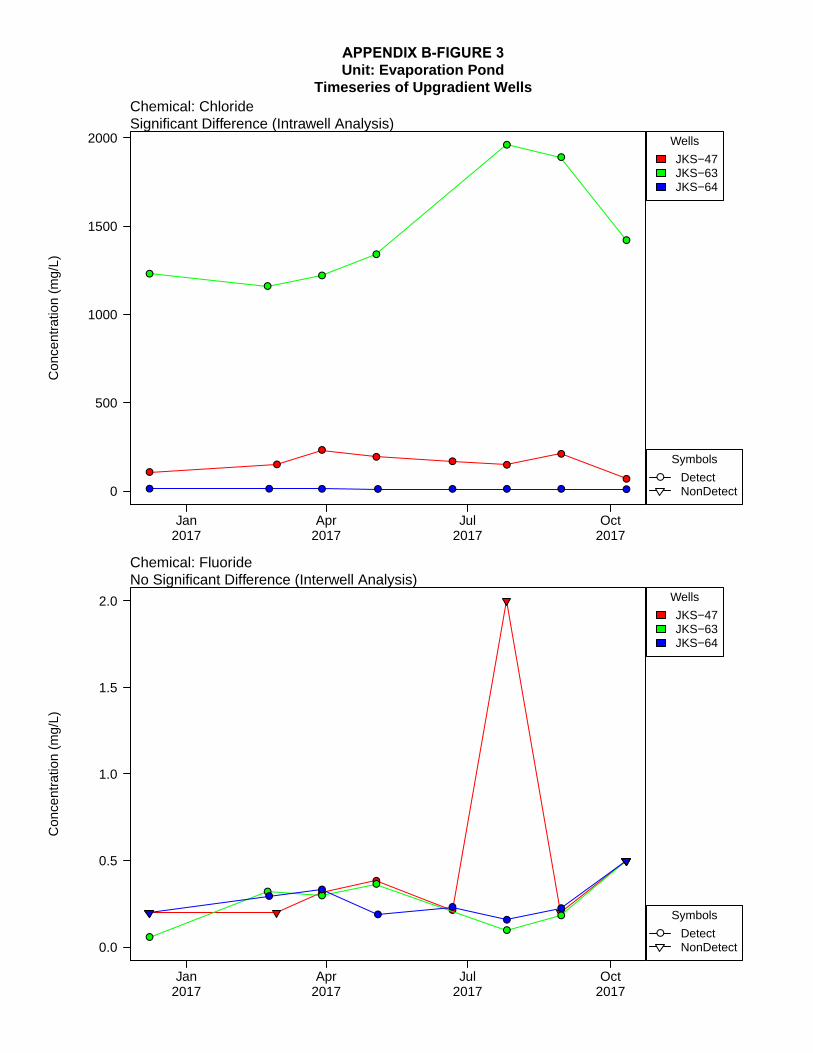
Chemical: ChlorideSignificant Difference (Intrawell Analysis)
Jan2017
Apr2017
Jul2017
Oct2017
Con
cent
ratio
n (m
g/L)
0
500
1000
1500
2000
●●
●●
● ●
●
●
●
●
●
●
●
●
●
● ● ● ● ● ● ● ●
Wells
JKS−47JKS−63JKS−64
●
Symbols
DetectNonDetect
Chemical: FluorideNo Significant Difference (Interwell Analysis)
Jan2017
Apr2017
Jul2017
Oct2017
Con
cent
ratio
n (m
g/L)
0.0
0.5
1.0
1.5
2.0
●
●
●
●
● ●
●
●
●
●●
●●
●
●
Wells
JKS−47JKS−63JKS−64
●
Symbols
DetectNonDetect
APPENDIX B-FIGURE 3Unit: Evaporation Pond
Timeseries of Upgradient Wells
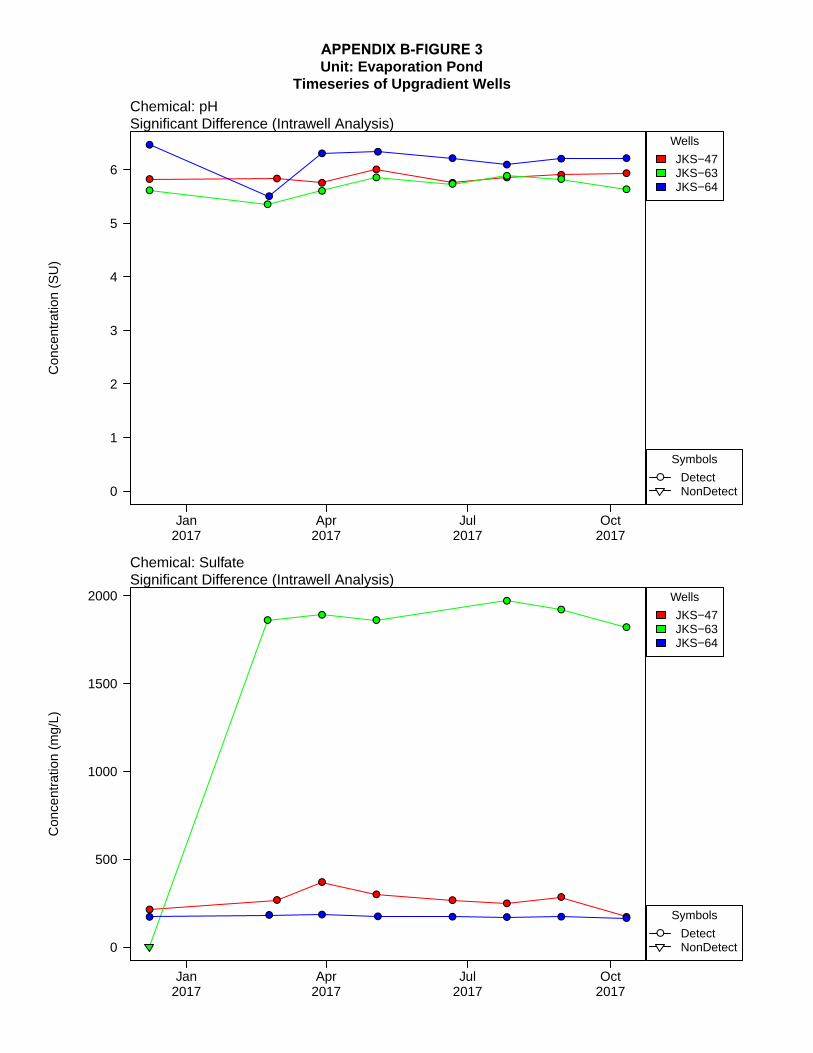
Chemical: pHSignificant Difference (Intrawell Analysis)
Jan2017
Apr2017
Jul2017
Oct2017
Con
cent
ratio
n (S
U)
0
1
2
3
4
5
6● ●
●
●
●● ● ●
●
●
●
●●
● ●●
●
●
● ●●
●● ●
Wells
JKS−47JKS−63JKS−64
●
Symbols
DetectNonDetect
Chemical: SulfateSignificant Difference (Intrawell Analysis)
Jan2017
Apr2017
Jul2017
Oct2017
Con
cent
ratio
n (m
g/L)
0
500
1000
1500
2000
●●
●
●● ●
●
●
●●
●
●●
●
● ● ● ● ● ● ● ●
Wells
JKS−47JKS−63JKS−64
●
Symbols
DetectNonDetect
APPENDIX B-FIGURE 3Unit: Evaporation Pond
Timeseries of Upgradient Wells
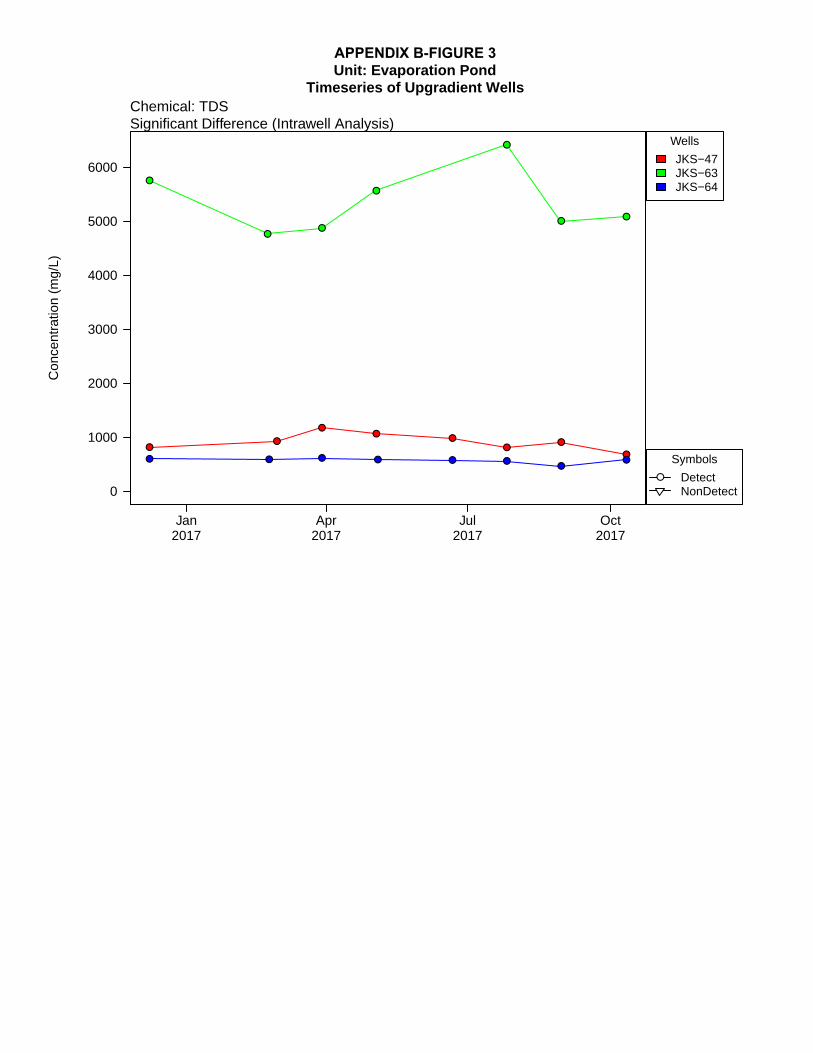
Chemical: TDSSignificant Difference (Intrawell Analysis)
Jan2017
Apr2017
Jul2017
Oct2017
Con
cent
ratio
n (m
g/L)
0
1000
2000
3000
4000
5000
6000
●●
●●
●●
●
●
●
●●
●
●
●●
● ● ● ● ● ●●
●
Wells
JKS−47JKS−63JKS−64
●
Symbols
DetectNonDetect
APPENDIX B-FIGURE 3Unit: Evaporation Pond
Timeseries of Upgradient Wells
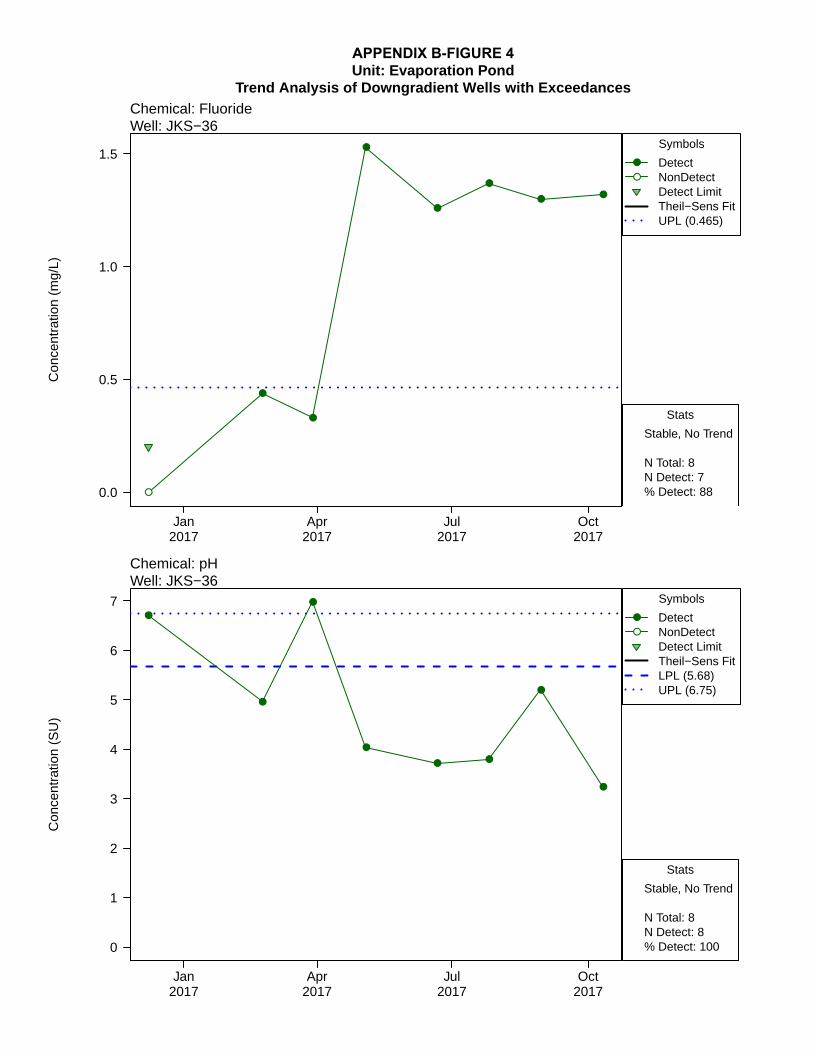
APPENDIX B-FIGURE 4Unit: Evaporation Pond
Trend Analysis of Downgradient Wells with ExceedancesChemical: FluorideWell: JKS−36
Jan2017
Apr2017
Jul2017
Oct2017
Con
cent
ratio
n (m
g/L)
0.0
0.5
1.0
1.5
●
●
●
●
●
●
●●
●
●
Symbols
DetectNonDetectDetect LimitTheil−Sens FitUPL (0.465)
Stats
Stable, No Trend
N Total: 8N Detect: 7% Detect: 88
Chemical: pHWell: JKS−36
Jan2017
Apr2017
Jul2017
Oct2017
Con
cent
ratio
n (S
U)
0
1
2
3
4
5
6
7●
●
●
●
● ●
●
●
●
●
Symbols
DetectNonDetectDetect LimitTheil−Sens FitLPL (5.68)UPL (6.75)
Stats
Stable, No Trend
N Total: 8N Detect: 8% Detect: 100