annual financial statements - jse · analysis 99 company primary ... • determined the nature and...
TRANSCRIPT

ANNUAL FINANCIAL STATEMENTSFOR THE YEAR ENDED 28 FEBRUARY 2014

ALTRON Annual Financial Statements 2014 2
This page has intentionally been left blank

ALTRON Annual Financial Statements 2014 3
01 03
02 04CONTENTS
Report of the Altron audit committee 4
Directors’ report 7
Certificate from the company secretaries 12
Independent auditor’s report 13
Primary financial statements 32
Notes to the financial statements 38
Accounting policies 14
Annexure 1 – interests in other entities 94
Annexure 2 – segmental analysis 99
Company primary financial statements 102
Notes to the company financial statements 106
The financial statements of Allied Electronics Corporation Limited have been audited in compliance with section 30 of the Companies Act.
Mr Alex Smith, CA, Financial Director, was responsible for the supervision of the preparation of the financial statements.
These financial statements for the year ended 28 February 2014 were published on 30 May 2014.

ALTRON Annual Financial Statements 2014 4
We are pleased to present our report for the financial year ended 28 February 2014.
AUDIT COMMITTEE MANDATE AND TERMS OF REFERENCE
The Altron audit committee (the committee) has adopted a formal mandate and terms of reference that has been approved by the board of directors. The committee has conducted its affairs in compliance with this mandate and terms of reference and has discharged its responsibilities contained therein. The mandate and terms of reference is available at http://www.altron.com and is also available on request.
AUDIT COMMITTEE MEMBERS AND ATTENDANCE AT MEETINGS
The committee consists of four independent, non-executive directors and meets at least three times per annum as per the committee mandate and terms of reference.
The Altron chief executive, finance director, sub-holding group chief executive officers, head of internal audit, external auditor and other assurance providers (tax manager and Altron finance manager) attend meetings by invitation.
Following the delisting of Altech in August 2013, the previous Altech audit committee was dissolved and replaced by a financial review and risk committee. The Altech audit committee’s erstwhile chairman, Mr AD Dixon, was formally appointed by the committee to chair the Altech financial review and risk committee and attends certain meetings of the committee by invitation.
During the year under review three meetings were held.
Name of MemberMay 2013
October 2013
February 2014
GG Gelink Present Present Present
CA (SA), BCompt (Hons) (UNISA), BCom (UND) (Hons) (UNISA), H Dip Education (UNISA), Dip Public Administration (Peninsula Technical College)
Year appointed: 2012 (as chairman)
NJ Adami Present Absent* Absent*
BBusSci (Hons) (UCT); MBA (Wits)
Year appointed: 2009
MJ Leeming Present Present Present
BCom (Rhodes); MCom (Wits); FIBSA, FCMA; AMP (Harvard)
Year appointed: 2003
JRD Modise Present Present Present
BCom (Wits); BAcc (Wits); CA (SA); MBA (Wits); AMP (Samford); AMP (Harvard)
Year appointed: 2004
* Submitted apologies
ROLES AND RESPONSIBILITIES
The committee’s roles and responsibilities include its statutory duties as per the Companies Act, 2008, as amended (the Companies Act) and the responsibilities assigned to it by the board.
Statutory duties
In the conduct of its duties, the committee has performed the following statutory duties:
• Nominated for re-appointment as external auditor of the company, KPMG Inc., a registered auditor which, in the opinion of the committee, is independent of the company;
• Determined the fees to be paid to the external auditor and their terms of engagement;• Ensured that the appointment of the external auditor complies with the Companies Act and any other legislation relating
to the appointment of auditors;• Determined the nature and extent of those non-audit services that the external auditor may provide to the company (and
the Altron group);
REPORT OF THE ALTRON AUDIT COMMITTEE

ALTRON Annual Financial Statements 2014 5
• Pre-approved any proposed agreement with the external auditor for the provision of non-audit services to the company (and the Altron group); and
• Discharged those statutory obligations of an audit committee as prescribed by section 94 of the Companies Act acting in its capacity as the appointed audit committee of Altech, Bytes and Powertech which conduct their activities through financial review and risk committees.
EXTERNAL AUDITORThe committee has satisfied itself that the external auditor, KPMG Inc., was independent of the company, as set out in sections 90(2)(c) and 94(8) of the Companies Act, which includes consideration of compliance with criteria relating to independence or conflicts of interest as prescribed by Independent Regulatory Board for Auditors. Requisite assurance was sought and provided by the external auditor that internal governance processes within KPMG Inc. support and demonstrate their claim to independence.
The committee, in consultation with executive management, agreed to the engagement letter, terms, audit plan and budgeted audit fees for the financial year ended 28 February 2014.
There is a formal written policy and procedure (incorporating an authority matrix) that governs the process whereby the external auditor is considered for non-audit services. The committee approved the terms of the written policy for the provision of non-audit services by the external auditor, and approved the nature and extent of non-audit services that the external auditor may provide.
The committee has nominated, for re-appointment at the annual general meeting, KPMG Inc. as the external auditor of Altron for the financial year ending 28 February 2015. It has further satisfied itself that KPMG Inc. and Mr NH Southon, the individual auditor, as well as the reporting accountants, are accredited to appear on the JSE List of Accredited Auditors. Furthermore, the committee has satisfied itself that KPMG Inc., the audit firm of Altron’s major subsidiaries, is not disqualified from acting as such.
INTERNAL FINANCIAL CONTROLSBased on the results of the formal documented review of the design, implementation and effectiveness of the Altron group’s system of internal financial controls conducted by the internal audit function during the financial year ended 28 February 2014, and in addition, considering information and explanations given by management plus discussions held with the external auditor on the results of their audit, the committee is of the opinion that the Altron group’s system of internal financial controls is effective and forms a basis for the preparation of reliable financial statements. No findings have come to the attention of the committee to indicate that any material breakdown in internal controls has occurred during the financial year under review.
FINANCIAL STATEMENTSThe committee has reviewed the financial statements of the company and the Altron group and is satisfied that they comply in all material respects with International Financial Reporting Standards and the requirements of the Companies Act.
GOING CONCERNThe committee reviewed a documented assessment by management of the going concern premise of the company and the Altron group before recommending to the board that the company, as well as the Altron group, will be a going concern in the foreseeable future.
EXPERTISE AND EXPERIENCE OF FINANCIAL DIRECTOR AND FINANCE FUNCTIONThe committee has satisfied itself that the financial director of Altron has appropriate expertise and experience as required in terms of paragraph 3.84(h) of the JSE Listings Requirements.
The committee has considered, and has satisfied itself of the overall appropriateness of the expertise and adequacy of resources of the Altron group’s finance function and experience of the senior members of management responsible for the financial function. Some weaknesses were identified in certain operations, but management has committed itself to ensuring that these weaknesses are addressed as a matter of priority and where necessary has seconded financial skills and experience to these operations.
DUTIES ASSIGNED BY THE BOARDThe committee fulfils an oversight role regarding the company’s integrated annual report and the reporting process, including the system of internal financial control. It is responsible for ensuring that the company and the Altron group’s internal audit function is independent and has the necessary resources, standing and authority within the organisation to enable it to effectively discharge its duties. Furthermore, the committee oversees co-operation between the internal and external auditors, and serves as a link between the board of directors and these functions.

ALTRON Annual Financial Statements 2014 6
REPORT OF THE ALTRON AUDIT COMMITTEE continued
During the year, the committee met with the external auditor and with the head of internal audit without management being present.
The committee is satisfied that it has complied in all material respects, with its legal, regulatory and other responsibilities.
RISK MANAGEMENTThe board has assigned oversight of the company’s (including the Altron group’s) risk management function to a separate risk management committee. The chairman of the committee attends the risk management committee meetings as an ex-officio member to ensure that information relevant to these committees is shared regularly. In addition, the chairman of the risk management committee is also a member of the committee. The committee fulfils an oversight role regarding financial reporting risks, internal financial controls, fraud risk as it relates to financial reporting and information technology risks as it relates to financial reporting.
INTERNAL AUDITThe committee has approved the internal audit charter as well as the internal audit function’s annual audit plan for the financial year ended 28 February 2014.
The internal audit function resides within the Altron corporate office and has responsibility for reviewing and providing assurance on the adequacy of the internal control environment across all of the Altron group’s operations. The head of internal audit is responsible for reporting the findings of the internal audit work against the agreed internal audit plan to the committee on a regular basis.
The head of internal audit has direct access to the committee, primarily through its chairman.
Once every four years, the Altron internal audit function undergoes a quality assurance review on its effectiveness as required by the standards of the Institute of Internal Auditors.
During 2010, an external effectiveness peer review (which was the most recent review) was conducted by PricewaterhouseCoopers Inc. on the company’s internal audit function. The review indicated that the Altron internal audit department ‘generally conforms’ to the International Standards for the Professional Practice of Internal Auditing. The ‘generally conforms’ rating is the highest possible rating that can be achieved. A peer review is due to be conducted during the current financial year and will be reported on in the 2015 Altron audit committee report.
WHISTLE-BLOWINGWhistle-blowing is reported to the Altron risk management committee via the internal audit function. The committee is satisfied that appropriate interventions have been put in place to deal with whistle-blowing throughout the Altron group and that the Altron group adequately follows up on and deals with instances of whistle-blowing.
SUSTAINABILITY REPORTINGThe committee recommended to the board the appointment of SustainabilityServices, an external assurance provider, to perform a limited assurance engagement on key performance indicators included in the company’s integrated annual report. The committee determined the scope of this assurance engagement and satisfied itself as to the independence and competency of the external assurance provider.
The committee considered the company’s sustainability information as disclosed in the integrated annual report and has assessed its consistency with operational and other information known to committee members, and for consistency with the annual financial statements. The committee discussed the sustainability information with management and the chairman of the risk management committee, and has considered the conclusions of the external assurance provider. The committee is satisfied that the sustainability information is in all material respects, reliable and consistent with the financial results. Nothing has come to the attention of the committee to indicate any material deficiencies in this regard.
RECOMMENDATION OF THE INTEGRATED ANNUAL REPORT FOR APPROVAL BY THE BOARDThe committee recommended the integrated annual report for approval by the board of directors, on 30 May 2014.
GG GelinkChairman
30 May 2014

ALTRON Annual Financial Statements 2014 7
DIRECTORS’ REPORT
TO THE SHAREHOLDERS OF ALLIED ELECTRONICS CORPORATION LIMITED (ALTRON)The directors have pleasure in submitting the annual financial statements of the Altron group for the year ended 28 February 2014.
NATURE OF BUSINESSAltron is an investment holding company. Its principal operations, Allied Technologies Limited (Altech), Power Technologies (Pty) Limited (Powertech) and Bytes Technology Group (Pty) Limited (Bytes), are invested in the power electronics, telecommunications, multi-media and information technology industries.
FINANCIAL RESULTSParticulars of the Altron group attributable earnings and earnings per share for the year ended 28 February 2014 are given in the statement of comprehensive income, whilst particulars of the Altron group headline earnings per share for the year ended 28 February 2014 are given in note 26 of the financial statements.
Full details of the financial position and results of the Altron group are set out in these annual financial statements.
DIVIDENDSThe following dividends were declared in respect of the year ended 28 February 2014:
• Ordinary dividend No 66 of 80 cents per share (2013: 60 cents); and• Participating preference dividend No 20 of 80 cents per share (2013: 60 cents).
It remains Altron’s policy to declare dividends annually at the time of announcing the group’s results in May of each year.
SUBSIDIARIES, ASSOCIATE COMPANIES AND OTHER INVESTMENTSParticulars of the principal subsidiaries of the Altron group are given in note 2 of the separate company financial statements and Annexure 1 of the financial statements. Particulars of the associate companies, joint ventures and other investments are also provided in Annexure 1 of the group financial statements.
CORPORATE ACTIVITY DURING THE YEARBRAND NEW TECHNOLOGIES
Effective 1 March 2013, Bytes Technology Group South Africa (Pty) Limited acquired the business of Brand New Technologies (Pty) Limited (BNTech) for a total estimated consideration of R49 million of which, R35 million is deferred and payable on the achievement of certain earn-outs over three years. BNTech is a leading provider of identity management products and solutions, specialising in protecting, securing and validating identities. The acquisition of BNTech complements existing Bytes offerings and allows the group to offer and provide a holistic identity management solution on a turnkey basis, both in South Africa and into Africa.
ALLIED TECHNOLOGIES LIMITED
Effective 1 August 2013, Altron Finance purchased the remaining Altech ordinary shares that the Altron group did not already own, from Altech non-controlling shareholders. The total cash consideration paid to 91% of the Altech non-controlling shareholders equalled R1,6 billion while 9% of the Altech non-controlling shareholders elected to be settled in Altron participating preference shares amounting to R158 million.
LIQUID TELECOMMUNICATIONS
On 7 January 2014, Altech exercised its put option and signed an agreement with, inter alia, Econet Wireless Global Limited to dispose of its 8.6% equity interest in Liquid Telecommunications Holdings Limited for a cash consideration of US$55 million. The exercise of the put became unconditional on 21 January 2014 and the transaction became effective on 28 February 2014. US$10 million was received in February 2014, with the balance being received after year-end.
TRIDONIC SOUTH AFRICA
On 1 February 2014, Powertech disposed of its 50% equity interest in Tridonic South Africa (Pty) Limited to Tridonic in Austria for a selling price of €900 000 (R14 million).
CORPORATE ACTIVITY AFTER THE BALANCE SHEET DATEABERDARE CABLES
Effective 31 March 2014 the Powertech group recognised the deferred sale of an interest in Aberdare Cables to the Izingwe Consortium. The obligation to repay the funding has been fully transferred to Izingwe and thus the Powertech group will recognise the non-controlling interest in Aberclare Cables from 1 April 2014.

ALTRON Annual Financial Statements 2014 8
DIRECTORS’ REPORT continued
BYTES DOCUMENT SOLUTIONS UK
Effective 30 April 2014 Bytes UK disposed of 100% of its equity interest in Bytes Document Solutions Limited in the UK to Xeratec Group Holdings Limited for a purchase price of £5.4 million.
ALTECH NUPAY
Effective 1 May 2014 Altech acquired the remaining 50% less one share equity interest in Altech NuPay (Pty) Limited which Altech did not already own for a purchase price of R80 million. The purchase price was settled via the issue of Altron participating preference shares by way of a vendor placement.
KAGISO STRATEGIC INVESTMENTS
On 9 May 2014 Bytes Technology Group South Africa (Pty) Limited (Bytes SA) entered into an agreement to acquire Kagiso Strategic Investments’ 27% equity interest in Bytes SA for a purchase price of R669 million. The transaction will become effective on 30 June 2014.
SHARE SCHEMESParticulars relating to The Altron Group Share Incentive Trust and The Altron 2009 Share Plan are set out in note 10 to the annual financial statements.
At the date of this report, a total of nil ordinary shares and 23 022 067 participating preference shares remain reserved for the purposes of the company’s employee share schemes.
GENERAL AUTHORITY TO ISSUE SHARESThe remaining unissued ordinary shares and participating preference shares are the subject of a general authority granted to the directors in terms of, among others, the Companies Act, 2008, as amended, and which authority remains valid only until the next annual general meeting which will be held on Monday, 21 July 2014. At that meeting, shareholders will be asked to place 5% of the unissued ordinary and 5% of the unissued participating preference shares under the control of the directors. Shareholders will also be asked to waive their pre-emptive rights in favour of the directors to allot and issue ordinary and/or participating preference shares for cash as and when suitable circumstances arise.
DIRECTORATEAppointments:
8 October 2013 Ms SN Mabaso-Koyana
8 October 2013 Mr RS Ntuli
Ms SN Mabaso-Koyana, Mr RS Ntuli, Dr WP Venter and Dr PM Maduna, as well as Messrs MC Berzack, MJ Leeming, JRD Modise, CG Venter and RE Venter retire from the board in accordance with article 25.17 of the company’s memorandum of incorporation.
All the retiring directors are eligible and available for election or re-election, as the case may be. Their profiles appear in this integrated annual report at www.altron.com.
SECRETARIESAltron Management Services (Pty) Limited act as the secretaries to the company. The secretaries’ business and postal addresses appear in the integrated annual report at www.altron.com.
SEGMENT REPORTINGSegment information is included in Annexure 2 of the group financial statements.
Attributable headline earnings contributions to Altron were as follows:
R millions 2014 2013
Altech 250 160Bytes 302 253Powertech 77 1Corporate, financial services and eliminations (26) 3

ALTRON Annual Financial Statements 2014 9
DIRECTORS’ INTERESTSAt 28 February 2014 the directors of the company held direct and indirect interests, including family interests, in 59 350 755 of the company’s issued ordinary shares (2013: 59 330 954) and 6 722 991 of the company’s issued participating preference shares (2013: 6 591 023). Details of shares held per individual director are listed below. A total of 1 849 036 conditional rights, share appreciation rights, performance shares and bonus shares are allocated to directors in terms of the company’s employee share schemes.
2014 Direct beneficial Direct non–beneficial
Name of directorOrdinary
shares
Participating preference
sharesOrdinary
shares
Participating preference
shares
Dr WP Venter 8 709 770 34 055 – –RE Venter – 117 981 – –RJ Abraham 19 801 28 807 – –MC Berzack – 260 190 – –MJ Leeming 2 500 – – –AMR Smith – 28 522 – –
Total 8 732 071 469 555 – –
Indirect beneficial Indirect non-beneficial
Name of directorOrdinary
shares
Participating preference
sharesOrdinary
shares
Participating preference
shares
Dr WP Venter 31 247 827 – 19 367 000* 6 197 129*MC Berzack 1 357 – – –MJ Leeming 2 500 21 307 – –SN Susman – 35 000 – –
Total 31 251 684 56 307 19 367 000 6 197 129
* Non-executive chairman and director, Dr WP Venter, and his family and related trusts, are the controlling shareholders of the company.
At the date of this report, these interests remain unchanged
2013 Direct beneficial Direct non–beneficial
Name of directorOrdinary shares
Participating preference
sharesOrdinary
shares
Participating preference
shares
Dr WP Venter 8 709 770 – – –RE Venter – 90 732 – –RJ Abraham – 13 282 – –MC Berzack – 232 690 – –MJ Leeming 2 500 – – –AMR Smith – 11 828 – –PL Wilmot – 3 971 – –
Total 8 712 270 352 503 – –
Direct beneficial Direct non–beneficial
Name of directorOrdinary shares
Participating preference
sharesOrdinary
shares
Participating preference
shares
Dr WP Venter 31 247 827 34 055 19 367 000* 6 197 129*MC Berzack 1 357 – – –MJ Leeming 2 500 1 307 – –PL Wilmot – 6 029 – –
Total 31 251 684 41 391 19 367 000 6 197 129
* Non-executive chairman and director, Dr WP Venter, and his family and related trusts, are the controlling shareholders of the company.

ALTRON Annual Financial Statements 2014 10
DIRECTORS' REPORT continued
PUBLIC AND NON-PUBLIC SHAREHOLDERS (AS AT 28 FEBRUARY 2014)
Ordinary shares
Number of share-
holders %Number of
shares %
Non-public shareholders 7 0,36 62 597 224 59,24
Directors and associates of the company 6 0,31 59 350 755 56,17
Repurchased shares 1 0,05 3 246 469 3,07
Public shareholders 1 944 99,64 43 071 907 40,76
Total 1 951 100,00 105 669 131 100,00
Participating preference shares
Non-public shareholders 11 0,23 34 427 004 13,78
Directors and associates of the company 9 0,19 6 722 991 2,69
Repurchased shares 2 0,04 27 704 013 11,09
Public shareholders 4 825 99,77 215 432 871 86,22
Total 4 836 100,00 249 859 875 100,00
MATERIAL SHAREHOLDERSBeneficial shareholders (excluding directors) holding 5% or more of the company’s listed ordinary shares as at 28 February 2014 were the following:
Number of shares %
Biltron 50 614 827 47.90
Government Employees Pension Fund 15 299 415 14.48
Total 65 914 242 62.38
Beneficial shareholders (excluding directors) holding 5% or more of the company’s listed participating preference shares as at 28 February 2014 were the following:
Number of shares %
Government Employees Pension Fund 55 933 344 22,38
Sanlam 30 364 981 12,15
Altron Finance (Pty) Limited 27 704 013 11,09
Coronation Fund Managers 25 363 865 10,15
Old Mutual 25 220 606 10,10
Total 164 586 809 65,87
SPECIAL RESOLUTIONSThe company passed five special resolutions during the year ended 28 February 2014:
• Approving the acquisition by the company or any of its subsidiaries of the company’s shares; • Approving the remuneration of the non-executive chairman, lead independent director and non-executive directors; • Approving the remuneration payable to non-executive directors participating in board committees; • Approving the remuneration payable to non-executive directors for participating in special/unscheduled board meetings
and ad hoc strategic planning sessions; and• Approving financial assistance to employee share scheme beneficiaries and related or inter-related companies
and corporations.
At subsidiary level, Altech passed four special resolutions during the year ended 28 February 2014 and while it remained a public listed company:
• general authority to acquire (repurchase) shares;• approving the remuneration of the Altech non-executive directors;• approving financial assistance to directors, prescribed officers, employee share scheme beneficiaries and related or
inter-related companies and corporations; and• approval of a scheme of arrangement.

ALTRON Annual Financial Statements 2014 11
Except for the above, no other special resolutions, the nature of which might be significant to shareholders in their appreciation of the state of affairs of the Altron group, were passed by the company or its subsidiaries during the period covered by these annual financial statements.
CORPORATE GOVERNANCEThe board endorses the contents of the King Report on Governance for South Africa, 2009, as well as the King Code of Governance Principles for South Africa 2009 (the Code) and has satisfied itself that Altron has complied throughout the period in all material aspects with the Code and the Listings Requirements of the JSE. The corporate governance report is set out in the integrated annual report at www.altron.com.
Altron’s application of the Principles set out in the Code is contained in the corporate governance register which appears in the integrated annual report at www.altron.com.
DIRECTORS’ EMOLUMENTSThe individual directors’ emoluments paid in respect of the financial period under review are contained in the remuneration report forming part of the integrated annual report at www.altron.com and are also included in note 20 to the annual financial statements.
REPURCHASED EQUITY SECURITIESNeither Altron nor any of its subsidiary companies repurchased any Altron equity securities during the period under review.
BORROWING POWERSIn terms of its memorandum of incorporation, Altron has unlimited borrowing powers. At 28 February 2014 unutilised borrowing facilities amounted to R1 616 million (2013: R1 858 million).
Post the balance sheet date, Altron Finance (Pty) Limited , a wholly owned subsidiary of Altron, successfully concluded the refinancing of all of the Altron group’s term indebtedness by raising R3,1 billion of senior unsecured term facilities, sourced from a consortium of South African lenders, comprising both banks and institutions. This exercise has, among others, refinanced the R1,6 billion of debt used to support the acquisition of the Altech non-controlling shareholders during August 2013, as well as the group’s other term facilities.
DIRECTORS’ RESPONSIBILITY STATEMENTThe directors are responsible for the preparation and fair presentation of the consolidated and separate annual financial statements of Altron, comprising the balance sheets at 28 February 2014, and the statements of comprehensive income, changes in equity and cash flows for the year then ended, and the notes to the financial statements which include a summary of significant accounting policies, other explanatory notes, Annexure 1 and Annexure 2, in accordance with International Financial Reporting Standards and the requirements of the Companies Act of South Africa. In addition, the directors are responsible for preparing the directors’ report.
The directors are also responsible for such internal control as the directors determine is necessary to enable the preparation of financial statements that are free from material misstatement, whether due to fraud or error, and for maintaining adequate accounting records and an effective system of risk management as well as the preparation of the supplementary schedules included in these financial statements.
The directors have made an assessment of the ability of the company and its subsidiaries to continue as going concerns and have no reason to believe that the businesses will not be going concerns in the year ahead.
The auditor is responsible for reporting on whether the consolidated and separate financial statements are fairly presented in accordance with the applicable financial reporting framework.
APPROVAL OF CONSOLIDATED AND SEPARATE ANNUAL FINANCIAL STATEMENTSThe consolidated and separate annual financial statements of Altron, as identified in the aforementioned paragraph, were approved by the board of directors on 13 May 2014 and signed by:
For: Allied Electronics Corporation Limited
Dr WP Venter RE Venter AMR SmithChairman Chief Executive Chief Financial Officer
13 May 2014

ALTRON Annual Financial Statements 2014 12
CERTIFICATE FROM THE COMPANY SECRETARIES
In terms of section 88 (2) (e) of the Companies Act No, 71 of 2008, as amended, we certify that to the best of our knowledge and belief the company has lodged with the Companies and Intellectual Property Commission all such returns as are required of a public company in terms of the Companies Act No, 71 of 2008, as amended, in respect of the year ended 28 February 2014, and that all such returns are true, correct and up to date.
ALTRON MANAGEMENT SERVICES (PTY) LIMITEDSecretaries
Andrew JohnstonGroup Company Secretary
13 May 2014

ALTRON Annual Financial Statements 2014 13
INDEPENDENT AUDITOR’S REPORT
To the Shareholders of Allied Electronics Corporation Limited
REPORT ON THE FINANCIAL STATEMENTSWe have audited the consolidated financial statements and separate financial statements of Allied Electronics Corporation Limited, which comprise the balance sheets at 28 February 2014, and the statements of comprehensive income, changes in equity and cash flows for the year then ended, and the notes to the financial statements which include a summary of significant accounting policies, other explanatory notes, Annexure 1 and Annexure 2, as set out on pages 14 to 108.
Directors’ Responsibility for the Financial StatementsThe company’s directors are responsible for the preparation and fair presentation of these financial statements in accordance with International Financial Reporting Standards and the requirements of the Companies Act of South Africa, and for such internal control as the directors determine is necessary to enable the preparation of financial statements that are free from material misstatement, whether due to fraud or error.
Auditor’s ResponsibilityOur responsibility is to express an opinion on these financial statements based on our audit. We conducted our audit in accordance with International Standards on Auditing. Those standards require that we comply with ethical requirements and plan and perform the audit to obtain reasonable assurance about whether the financial statements are free from material misstatement.
An audit involves performing procedures to obtain audit evidence about the amounts and disclosures in the financial statements. The procedures selected depend on the auditor’s judgement, including the assessment of the risks of material misstatement of the financial statements, whether due to fraud or error. In making those risk assessments, the auditor considers internal control relevant to the entity’s preparation and fair presentation of the financial statements in order to design audit procedures that are appropriate in the circumstances, but not for the purpose of expressing an opinion on the effectiveness of the entity’s internal control. An audit also includes evaluating the appropriateness of accounting policies used and the reasonableness of accounting estimates made by management, as well as evaluating the overall presentation of the financial statements.
We believe that the audit evidence we have obtained is sufficient and appropriate to provide a basis for our audit opinion.
OpinionIn our opinion, these financial statements present fairly, in all material respects, the consolidated and separate financial position of Allied Electronics Corporation Limited at 28 February 2014, and its consolidated and separate financial performance and consolidated and separate cash flows for the year then ended in accordance with International Financial Reporting Standards and the requirements of the Companies Act of South Africa.
Other Reports Required by the Companies ActAs part of our audit of the financial statements for the year ended 28 February 2014, we have read the Directors’ Report, the Report of the Altron Audit Committee and the Certificate from the Company Secretaries for the purpose of identifying whether there are material inconsistencies between these reports and the audited financial statements. These reports are the responsibility of the respective preparers. Based on reading these reports we have not identified material inconsistencies between these reports and the audited financial statements. However, we have not audited these reports and accordingly do not express an opinion on these reports.
KPMG INC.Registered Auditor
Per NH SouthonChartered Accountant (SA)Registered AuditorDirector13 May 2014

ALTRON Annual Financial Statements 2014 14
Allied Electronics Corporation Limited (the company) is a South African registered company. The consolidated financial statements of the company for the year ended 28 February 2014 comprise the company and its subsidiaries (together referred to as the group) and the group’s interests in associates and joint arrangements. Where reference is made to the group in the accounting policies, it should be interpreted as referring to the company where the context requires, unless otherwise noted.
STATEMENT OF COMPLIANCE The consolidated and separate financial statements have been prepared in accordance with International Financial Reporting Standards (IFRS), in compliance with JSE Listings Requirements, the interpretations adopted by the International Accounting Standards Board (IASB), the SAICA Financial Reporting Guides as issued by the Accounting Practices Committee and Financial Reporting Pronouncements as issued by Financial Reporting Standards Council, and the requirements of the Companies Act of South Africa No, 71 of 2008 of South Africa, as amended. They were authorised for issue by the group’s board of directors on 13 May 2014.
BASIS OF PREPARATION The consolidated and separate financial statements are presented in millions of South African rands, which is the company’s functional currency, on a historical-cost basis, except for the following assets and liabilities which are stated at fair value:
• Derivative financial instruments; • Financial instruments classified as available-for-sale; • Investments classified as held for trading; • Share-based payment recharge arrangement assets and liabilities; • Contingent purchase consideration; and • Net defined benefit asset.
Non-current assets and disposal groups held-for-sale are stated at the lower of carrying amount and fair value less costs to sell.
The preparation of financial statements in conformity with IFRS requires management to make judgements, estimates and assumptions that may affect the application of accounting policies and the reported amounts of assets, liabilities, income and expenses. The estimates and associated assumptions are based on historical experience and various other factors that are believed to be reasonable under the circumstances, the results of which form the basis of making the judgements about carrying values of assets and liabilities that are not readily apparent from other sources. Actual results may differ from these estimates.
The estimates and underlying assumptions are reviewed on an ongoing basis. Revisions to accounting estimates are recognised in the period in which the estimate is revised if the revision only affects that period, or in the period of the revision and future periods if the revision affects both current and future periods. Judgements made by management in the application of IFRS that have a significant effect on the financial statements and estimates with a significant risk of material adjustment in the next year are discussed in note 32.
The accounting policies set out below have been applied consistently to the periods presented in these consolidated and separate financial statements apart from the changes to accounting policies noted below.
The group’s accounting policies have been applied consistently by all group entities.
BASIS OF CONSOLIDATION SUBSIDIARIES
Subsidiaries are those entities controlled by the group. An investor controls an investee when it is exposed, or has rights, to variable returns from its involvement with the investee and has the ability to affect those returns through its power over the investee. The financial statements of subsidiaries are included in the consolidated financial statements from the date that control commences until the date that control ceases.
The consolidated financial statements incorporate the financial statements of the company and its subsidiaries. The results of subsidiaries, including those acquired or disposed of during the year, are included from the dates control commenced and up to the dates control ceased.
Losses and each component of comprehensive income applicable to non-controlling interests in a subsidiary are allocated to the non-controlling interests even if doing so causes the non-controlling interests to have a deficit balance.
On loss of control, the group derecognises the assets and liabilities of the subsidiary, any non-controlling interest and other components of equity related to the subsidiary. Any surplus or deficit arising on the loss of control is recognised in profit or loss.
ACCOUNTING POLICIES

ALTRON Annual Financial Statements 2014 15
ASSOCIATES
An associate is an entity in which the group holds an equity interest, over which the group has significant influence and is neither a subsidiary nor an interest in a joint arrangement. Significant influence is the power to participate in the financial and operating policy decisions of the associate but is not control or joint control over those policies. The equity method of accounting for associates is adopted in the consolidated financial statements. The consolidated financial statements include the group’s share of profit or loss and other comprehensive income of associates from the date significant influence commences until the date significant influence ceases.
Goodwill arising on the acquisition of associates is included in the carrying amount of the associate and is treated in accordance with the group’s accounting policy for goodwill.
Dividends received from associates are deducted from the carrying value of the investment. Where the group’s share of losses of an associate exceeds the carrying amount of the associate, the associate is carried at no value. Additional losses are only recognised to the extent that the group has an obligation or has made payments on behalf of the associate.
JOINT ARRANGEMENTS
Joint arrangements are those entities in respect of which there is a contractual agreement whereby the group and one or more other parties undertake an economic activity, which is subject to joint control.
A joint venture is an arrangement in which the group has joint control, whereby the group has rights to the net assets of the arrangement, rather than rights to its assets and obligations for its liabilities.
The group’s participation in joint ventures is accounted for using the equity method. They are recognised initially at cost, which includes transaction costs. Subsequent to initial recognition, the consolidated financial statements include the group’s share of profits or loss and other comprehensive income of the equity-accounted investees, until the date on which joint control ceases.
ELIMINATIONS ON CONSOLIDATION
Intra-group balances and transactions, and any unrealised gains or losses arising from intra-group transactions, are eliminated in preparing the consolidated financial statements. Unrealised gains arising from transactions with associates and joint ventures are eliminated to the extent of the group’s interest in these enterprises. Unrealised losses on transactions with associates and joint ventures are eliminated in the same way as unrealised gains, except that they are only eliminated to the extent that there is no evidence of impairment.
GOODWILL
All business combinations are accounted for by applying the ’acquisition method’, as at acquisition date, which is the date on which control is transferred to the group.
For acquisitions on or after 1 March 2010, the group measures goodwill at the acquisition date as:
• The fair value of consideration transferred; plus • The recognised amount of any non-controlling interests in the acquiree; plus • If the business combination is achieved in stages, the fair value of the existing equity interest in the acquiree; less • The net recognised amount (generally fair value) of the identifiable assets acquired and liabilities assumed.
When the result is negative, a bargain purchase gain is recognised immediately in profit or loss.
Subsequent to acquisition, goodwill is measured at cost less accumulated impairment losses and is allocated to cash-generating units and tested annually for impairment. Goodwill is not amortised.
The consideration transferred does not include amounts related to the settlement of pre-existing relationships. Such amounts are generally recognised in profit and loss.
Any contingent consideration payable is recognised at fair value at the acquisition date. If the contingent consideration is classified as equity, then it is not remeasured and settlement is accounted for within equity. Otherwise, subsequent changes in the fair value of contingent consideration are recognised in profit or loss.
Costs related to the acquisition, other than those associated with the issue of debt or equity securities, that the group incurs in connection with a business combination are expensed as incurred.

ALTRON Annual Financial Statements 2014 16
ACCOUNTING POLICIES continued
Cash-generating units represent the business operations from which the goodwill was originally generated. On disposal of a subsidiary, joint arrangement or associate, the attributable amount of goodwill is included in the determination of the profit or loss on disposal.
PREMIUMS AND DISCOUNTS ARISING ON PURCHASES FROM, OR SALES TO, NON-CONTROLLING INTERESTS IN SUBSIDIARIES
Any increases or decreases in ownership interests in subsidiaries without a change in control, are recognised as equity transactions in the consolidated financial statements.
Accordingly, any premiums or discounts on purchases of equity instruments from, or sales of equity instruments to, non-controlling interests are recognised directly in the equity of the parent shareholder.
BROAD-BASED BLACK ECONOMIC EMPOWERMENT (B-BBEE) TRANSACTIONS
B-BBEE transactions involving the disposal or issue of equity interests in subsidiaries are only recognised when the accounting recognition criteria have been met.
Although economic and legal ownership of such instruments may have transferred to the B-BBEE partner, the derecognition of such equity interest sold or recognition of equity instruments issued in the underlying subsidiary by the parent shareholder is postponed until the accounting recognition criteria have been satisfied.
A dilution in the earnings attributable to the parent shareholders (in the interim period until accounting recognition criteria have been met) is adjusted for in the diluted earnings per share calculation by an appropriate adjustment to the earnings used in such calculation.
CASH AND CASH EQUIVALENTS Cash and cash equivalents comprise cash balances, call deposits and cash floats. Bank overdrafts that are repayable on demand and form an integral part of the group’s cash management are included as a component of cash and cash equivalents for the purposes of the cash flow statement.
CAPITALISATION OF BORROWING COSTS Interest on borrowings that are directly attributable to the acquisition or construction of qualifying assets that require a substantial period of time to prepare for their intended use, are capitalised.
Interest is capitalised over the period during which the qualifying asset is being acquired or constructed and borrowings have been incurred. Capitalisation ceases when the construction is interrupted for an extended period or when the qualifying asset is substantially complete.
CAPITAL ITEMS Capital items are items of income and expense relating to the acquisition, disposal or impairment of property, plant and equipment, investments, subsidiaries and intangible assets.
Capital items relate to ’separately identifiable remeasurements’ (not adjusted for related taxation and related non-controlling interests) other than ’included remeasurements’ specifically included in headline earnings as defined in ’Circular 2/2013 – Headline earnings’.
EMPLOYEE BENEFITS SHORT-TERM EMPLOYEE BENEFITS
The cost of all short-term employee benefits are recognised in profit or loss during the period in which the employee renders the related service.
The accruals for employee entitlements to salaries, performance bonuses and annual leave represent the amounts which the group has a present obligation to pay as a result of the employee’s services provided. The accruals have been calculated at undiscounted amounts based on current salary levels.
RETIREMENT BENEFITS
The majority of the group’s employees are members of the Altron Group Pension Fund and Altron Group Provident Fund, which are defined contribution funds.

ALTRON Annual Financial Statements 2014 17
After the acquisition of subsidiaries, certain employees remained members of their previous funds. While a number of these are defined benefit plans, these industry-managed retirement benefit schemes are dealt with as defined contribution plans as the group’s obligations under the schemes are equivalent to those arising in a defined contribution plan.
The group’s contributions to defined contribution funds are recognised in profit or loss in the year they are incurred.
DEFINED BENEFIT OBLIGATIONS
Certain members of the Altron Group Pension Fund who were members prior to 1 September 1996 are entitled to a minimum benefit equal to the previously provided defined benefit pension.
The group’s net obligation in respect of the defined-benefit plan is calculated by estimating the amounts of future benefit that employees have earned in return for their service in the current and prior periods; that benefit is discounted to determine its present value. Any unrecognised past service costs and the fair value of any plan assets are deducted. The discount rate is the yield at the reporting date on suitable corporate bonds that have maturity dates approximating the terms of the group’s obligations and are denominated in rand as the benefits are expected to be paid in rand. Actuarial valuations are conducted annually. The calculation is performed by qualified actuaries using the projected unit credit method.
When the calculation results in a benefit to the group, the recognised asset is limited to the present value of economic benefits available in the form of any refunds available from the plan or reductions in contributions to the plan. In terms of the Fund rules, refunds to the group are limited to amounts credited or to be credited to the employer surplus account in accordance with the Pension Funds Act No 24 of 1956, as amended, where this does not exceed the total of any unrecognised past service costs. In order to calculate the present value of economic benefits, consideration is given to any minimum funding requirements that apply to any plan in the group. An economic benefit is available to the group if it is realisable during the life of the plan, or on settlement of the plan liabilities.
The defined-benefit cost recognised in profit or loss includes the current service cost and the net interest on the net defined-benefit liability (asset). Net interest expense (income) is the interest on the net defined-benefit liability (asset) at the beginning of the period, calculated using the discount rate used in the previous year’s actuarial valuation. The interest takes into account changes in the net defined-benefit liability (asset) during the year as a result of contributions and benefit payments.
The defined-benefit cost relating to actuarial gains and losses, which include the return on plan assets (excluding the interest income recognised in profit or loss) and the effect of the asset ceiling (excluding the interest cost) and any changes in actuarial assumptions or experience adjustments, are remeasurements and are recognised immediately in other comprehensive income.
POST-RETIREMENT MEDICAL AID BENEFITS
The group has an obligation to provide post-retirement medical aid benefits to certain eligible employees and pensioners. This obligation has been recognised in full.
TERMINATION BENEFITS
Termination benefits are recognised as an expense when the group is demonstrably committed, without a realistic possibility of withdrawal, to a formal and detailed plan to terminate employment before the normal retirement age. If the benefits are payable more than 12 months after the reporting date, they are discounted to their present value.
FINANCIAL INSTRUMENTS MEASUREMENT
Financial instruments are initially recognised at fair value, which includes transaction costs, except for those items measured at fair value through profit or loss, when the group becomes a party to the contractual arrangements as set out below. Subsequent to initial recognition, these instruments are measured as set out below:
FINANCIAL ASSETS
Financial assets are recognised when the group has rights or other access to economic benefits. Such assets consist of cash and cash equivalents, a contractual right to receive cash or another financial asset or a contractual right to exchange financial instruments with another entity on potentially favourable terms.

ALTRON Annual Financial Statements 2014 18
ACCOUNTING POLICIES continued
INVESTMENTS
Investments held-for-trading are classified as current assets and are measured at fair value, with any resultant gain or loss recognised in profit or loss.
Other investments held by the group are classified as available-for-sale and are measured at fair value, with any resultant gain or loss recognised directly in other comprehensive income, except for impairment losses and, in the case of available-for-sale debt instruments, foreign exchange gains or losses, which are recognised in profit or loss. When these investments are disposed of, the cumulative gain or loss previously recognised directly in other comprehensive income is recognised and presented within profit or loss as a capital item. Fair value, for this purpose, is a value arrived at by using appropriate valuation techniques.
TRADE AND OTHER RECEIVABLES
Trade and other receivables originated by the group are measured at amortised cost using the effective interest method less impairment losses.
CASH AND CASH EQUIVALENTS
Cash and cash equivalents are measured at amortised cost.
FINANCIAL LIABILITIES
Financial liabilities are recognised when there is an obligation to transfer benefits and that obligation is a contractual liability to deliver cash or another financial asset or to exchange financial instruments with another entity on potentially unfavourable terms. Financial liabilities other than derivative instruments are measured at amortised cost using the effective interest method.
TRADE AND OTHER PAYABLES
Trade and other payables are stated at amortised cost using the effective interest method.
INTEREST-BEARING BORROWINGS
Subsequent to initial recognition, interest-bearing borrowings are measured at amortised cost with any difference between initial fair value and redemption value being recognised in profit or loss over the period of the borrowings using the effective interest method.
DERIVATIVE FINANCIAL INSTRUMENTS
The group uses derivative financial instruments to manage its exposure to foreign exchange and commodity price risks arising from operational, financing and investment activities. The group does not hold or issue derivative financial instruments for trading purposes.
Subsequent to initial recognition, derivatives are measured at fair value through profit or loss. Fair value is determined by comparing the contracted forward rate to the present value of the current forward rate of an equivalent contract with the same maturity date. However, where derivatives qualify for hedge accounting, recognition of any resultant gain or loss depends on the nature of the item being hedged.
HEDGING
Where a derivative financial instrument is designated as a hedge of the variability in cash flows attributable to a particular risk associated with a recognised asset or liability, a firm commitment if it is a hedge of foreign exchange risk, or a highly probable forecast transaction that could affect profit or loss, the effective part of any gain or loss on the derivative financial instrument is recognised directly in other comprehensive income and presented in the cash flow hedging reserve in equity. Any ineffective portion of changes in the fair value of the derivative is recognised immediately in profit or loss.
When the hedged firm commitment or forecast transaction results in the recognition of a non-financial asset or a non-financial liability, the cumulative amount recognised in other comprehensive income up to the transaction date is adjusted against the initial measurement of the asset or liability. For other cash flow hedges, the cumulative amount is recognised in profit or loss in the period when the commitment or forecast transaction affects profit or loss.
Where the hedging instrument or hedge relationship is terminated but the hedged transaction is still expected to occur, the cumulative unrealised gain or loss remains in other comprehensive income and is recognised in accordance with the above policy when the underlying transaction occurs. If the hedged transaction is no longer expected to occur, then hedge accounting is discontinued and the cumulative unrealised gain or loss is immediately recognised in profit or loss.

ALTRON Annual Financial Statements 2014 19
Where a derivative financial instrument is used to economically hedge the foreign exchange exposure of a recognised monetary asset or liability and is not designated in a hedge relationship that qualifies for hedge accounting, no hedge accounting is applied and any gain or loss on the hedging instrument is recognised in profit or loss.
DERECOGNITION
Financial assets are derecognised if the group’s contractual rights to the cash flows from the financial assets expire or if the group transfers the financial assets to another party without retaining control or if the group transfers substantially all risks and rewards of the asset.
Financial liabilities are derecognised if the group’s obligations specified in the contract expire or are discharged or cancelled.
FINANCIAL INSTRUMENTS EXTINGUISHED WITH EQUITY INSTRUMENTS
Equity instruments issued to a creditor to extinguish all or part of a financial liability would represent ‘consideration paid’. The equity instruments will initially be measured at their fair value, unless such fair value cannot be reliably measured, in which case the fair value of the financial liability extinguished is used. The difference between the carrying amount of the financial liability (or part thereof) extinguished and the consideration paid is recognised in profit or loss.
OFFSET
Financial assets and financial liabilities are offset and the net amount reported in the balance sheet when the company has a legally enforceable right to set off the recognised amounts, and intends either to settle on a net basis, or to realise the asset and settle the liability simultaneously.
FINANCIAL INCOME AND EXPENSE
Financial income comprises interest income on funds invested, dividend income and changes in the fair value of financial assets at fair value through profit or loss, and gains on hedging instruments that are recognised in profit or loss. Interest income is recognised as it accrues in profit or loss, using the effective interest method.
Dividend income is recognised in profit or loss on the date that the group’s right to receive payment is established, which in the case of listed securities is the ex-dividend date.
Financial expenses comprise interest expense on borrowings, unwinding of the discount on provisions and contingent purchase considerations, changes in the fair value of financial assets at fair value through profit or loss, impairment losses recognised on financial assets, and losses on hedging instruments that are recognised in profit or loss.
FOREIGN CURRENCIES FOREIGN CURRENCY TRANSACTIONS
Foreign currency transactions are converted to the respective functional currencies of group entities at the rates of exchange ruling at the dates of the transactions. Monetary assets and liabilities denominated in foreign currencies at the reporting date are translated to the functional currency at the exchange rates ruling at that date. Gains or losses on translation are recognised in profit or loss. Non-monetary items in a foreign currency that are measured in terms of historical cost are translated using the exchange rate at the date of the transaction.
FOREIGN OPERATIONS
The assets and liabilities of all foreign operations, including goodwill and fair value adjustments arising on acquisition, are translated to South African rands at foreign exchange rates ruling at the reporting date. The revenues and expenses of foreign operations are translated to South African rands at yearly average rates which approximate the foreign exchange rates ruling at the dates of the transactions.
Foreign exchange differences arising on translation are recognised directly in other comprehensive income and presented in the foreign currency translation reserve in equity. The foreign currency translation reserve applicable to a foreign operation is released to profit or loss as a capital item upon disposal of that foreign operation.

ALTRON Annual Financial Statements 2014 20
ACCOUNTING POLICIES continued
IMPAIRMENT OF NON-FINANCIAL ASSETS The carrying amounts of the group’s non-financial assets, other than inventories and deferred tax assets, are reviewed at each reporting date to determine whether there is any indication of impairment. If there is an indication that an asset may be impaired, its recoverable amount is estimated.
The recoverable amount is the higher of an asset’s fair value less costs of disposal and its value in use.
For goodwill, intangible assets that have an indefinite useful life and intangible assets that are not yet available for use, the recoverable amount is estimated annually and whenever there is an indication that the asset may be impaired.
In assessing value in use, the expected future cash flows from the asset are discounted to their present value using a pre-tax discount rate that reflects current market assessments of the time value of money and the risks specific to the asset. An impairment loss is recognised in profit or loss whenever the carrying amount of an asset exceeds its recoverable amount.
For an asset that does not generate cash inflows that are largely independent of those from other assets, the recoverable amount is determined for the cash-generating unit to which the asset belongs.
An impairment loss is recognised in profit or loss whenever the carrying amount of the cash-generating unit exceeds its recoverable amount. Impairment losses recognised in respect of cash-generating units are allocated first to reduce the carrying amount of any goodwill allocated to the cash-generating units and then, to reduce the carrying amount of other assets in the unit, on a pro rata basis.
REVERSAL OF IMPAIRMENT OF NON-FINANCIAL ASSETS
A previously recognised impairment loss is reversed in profit or loss if there is an indication that the impairment loss no longer exists and the recoverable amount increases as a result of a change in the estimates used to determine the recoverable amount, but not to an amount higher than the carrying amount that would have been determined (net of depreciation or amortisation) had no impairment loss been recognised in prior years, except as detailed below.
An impairment loss in respect of an equity security classified as available-for-sale is not reversed through profit or loss.
An impairment loss in respect of goodwill is not reversed.
IMPAIRMENT OF FINANCIAL ASSETS A financial asset is assessed at each reporting date to determine whether there is any objective evidence that it is impaired. A financial asset is considered to be impaired if objective evidence indicates that one or more loss events have occurred and have had a negative effect on the estimated future cash flows of that asset.
The group considers the need for the impairment of financial assets at both a specific asset and collective level. All individually significant financial assets are assessed for specific impairment. All individually significant financial assets found not to be specifically impaired are then collectively assessed for any impairment that has been incurred but not yet identified.
Financial assets that are not individually significant are collectively assessed for impairment by grouping together financial assets with similar risk characteristics.
In assessing collective impairment, the group uses historical trends of the probability of default, timing of recoveries and the amount of loss incurred, adjusted for management’s judgement as to whether current economic and credit conditions are such that the actual losses are likely to be greater or lesser than suggested by historical trends.
An impairment loss in respect of a financial asset measured at amortised cost is calculated as the difference between its carrying amount and the present value of the estimated future cash flows discounted at the asset’s original effective interest rate.
Impairment losses are recognised in profit or loss. Impairment losses for trade and other receivables are reflected in an allowance account against trade and other receivables. When a subsequent event causes the amount of impairment loss to decrease, the decrease in impairment loss is reversed through profit or loss.
When a decline in the fair value of an available-for-sale financial asset has been recognised in other comprehensive income and there is objective evidence that the asset is impaired, the cumulative loss that has been recognised in other comprehensive income is recognised in profit or loss even though the financial asset has not been derecognised. The amount of the cumulative loss that is recognised in profit or loss is the difference between the acquisition cost and current fair value, less any impairment loss on that financial asset previously recognised in profit or loss.

ALTRON Annual Financial Statements 2014 21
An impairment loss in respect of an equity-accounted investee is measured by comparing the recoverable amount of the investment with its carrying amount. An impairment loss is recognised in profit or loss, and it is reversed if there has been a favourable change in the estimates used to determine the recoverable amount.
INTANGIBLE ASSETS GOODWILL
Refer to ‘basis of consolidation’.
RESEARCH AND DEVELOPMENT
Expenditure on research activities, undertaken with the prospect of gaining new scientific or technical knowledge and understanding, is recognised as an expense as incurred.
Expenditure on development activities, whereby research findings are applied to a plan or design for the production of new or substantially improved products and processes, is capitalised only if development costs can be measured reliably, the product or process is technically and commercially feasible, future economic benefits are probable and the group intends to and has sufficient resources to complete development and to use or sell the asset.
The expenditure capitalised includes the cost of materials, direct labour and an appropriate proportion of overheads. Capitalised development expenditure is measured at cost less accumulated amortisation and impairment losses. Other development expenditure is recognised as an expense as incurred.
OTHER INTANGIBLE ASSETS
Other intangible assets that are acquired by the group, which have finite useful lives, are measured at cost less accumulated amortisation and impairment losses.
SUBSEQUENT EXPENDITURE
Subsequent expenditure on intangible assets is capitalised only when it increases the future economic benefits embodied in the specific asset to which it relates. All other expenditure is expensed as incurred.
AMORTISATION
Amortisation is recognised in profit or loss on a straight-line basis over the estimated useful lives of intangible assets from the date they are available for use unless such lives are indefinite.
The estimated useful lives for the current and comparative periods are as follows:
• Data capacity indefeasible rights of use 15 to 20 years; • Trade names, designs, patents and trademarks three to 10 years; • Customer relationships one to 10 years; • Distribution rights and licence agreements indefinite life; and • Proprietary software two to three years.
Amortisation methods, useful lives and residual values are reviewed at each financial year-end and adjusted if appropriate.
INVENTORIES Inventories are measured at the lower of cost and net realisable value taking into account market conditions and technological changes. Cost is determined on the first-in first-out and weighted average cost methods. Work and contracts in progress and finished goods include direct costs and an appropriate portion of attributable overhead expenditure based on normal production capacity. Net realisable value is the estimated selling price in the ordinary course of business, less the estimated costs of completion and selling expenses.
INVESTMENTS IN SUBSIDIARIES Investments in subsidiaries, associates and joint arrangements are measured at cost, less accumulated impairment losses.
NON-CURRENT ASSETS HELD-FOR-SALE AND DISCONTINUED OPERATIONS Non-current assets are classified as held-for-sale if their carrying amount will be recovered principally through a sale transaction, not through continuing use. These assets may be a component of an entity, a disposal group or an individual non-current asset. Upon initial classification as held-for-sale, non-current assets and disposal groups are recognised at the lower of carrying amount and fair value less costs to sell. Any impairment losses arising are recognised in profit or loss as capital items.

ALTRON Annual Financial Statements 2014 22
ACCOUNTING POLICIES continued
A discontinued operation is a clearly distinguishable component of the group’s business that is abandoned or disposed of or is classified as held-for-sale pursuant to a single plan and which represents a separate major line of business or geographical area of operation that can be distinguished physically, operationally and for financial reporting purposes.
Classification as a discontinued operation occurs upon the earlier of disposal or when the operation meets the criteria to be classified as held-for-sale. When an operation is classified as a discontinued operation, the comparative statement of comprehensive income and statement of cash flow are restated as if the operation has been discontinued from the start of the comparative period.
LEASES OPERATING LEASES
Leases where the lessor retains the risks and rewards of ownership of the underlying asset are classified as operating leases.
Payments made under operating leases are recognised in profit or loss on a straight-line basis over the period of the lease.
FINANCE LEASES
Leases that transfer substantially all the risks and rewards of ownership of the underlying asset to the group are classified as finance leases. Assets acquired in terms of finance leases are capitalised at the lower of the fair value of the asset and the present value of the minimum lease payments at inception of the lease, and depreciated over the shorter of the estimated useful life of the asset or the lease term if there is no reasonable certainty that the group will obtain ownership at the end of the lease term.
The capital element of future obligations under the leases is included as a liability in the balance sheet. Lease payments are allocated using the effective interest method to determine the lease finance cost, which is recognised in profit or loss over the lease period, and the capital repayment, which reduces the liability to the lessor.
PROPERTY, PLANT AND EQUIPMENT OWNED ASSETS
Property, plant and equipment is measured at cost less accumulated depreciation and impairment losses. When components of an item of property, plant and equipment have different useful lives, those components are accounted for as separate items of property, plant and equipment.
Cost includes expenditure that is directly attributable to the acquisition of the asset. Purchased software that is integral to the functionality of the related equipment is capitalised as part of that equipment.
SUBSEQUENT COSTS
The group recognises in the carrying amount of an item of property, plant and equipment the cost of replacing part of such an item when the cost is incurred, if it is probable that additional future economic benefits embodied within the item will flow to the group and the cost of such item can be measured reliably. The carrying amount of the replaced item of property, plant and equipment is derecognised. All other costs are recognised in profit or loss as an expense when incurred.
DEPRECIATION
Depreciation is recognised in profit or loss for each category of assets on a straight-line basis over their expected useful lives to estimated residual values. Land is not depreciated.
The estimated useful lives for the current and comparative periods are as follows:
• Buildings 20 to 50 years; • Plant and machinery three to 20 years; • Furniture and equipment five to 20 years; • Data infrastructure eight to 15 years; • Motor vehicles four to eight years;• IT equipment and software two to eight years; and • Leasehold improvements (included in land and buildings) shorter of lease period or useful life of asset.
The depreciation methods, useful lives and residual values are reassessed annually and adjusted if appropriate. Gains and losses arising on the disposal of property, plant and equipment are included as capital items in profit or loss.

ALTRON Annual Financial Statements 2014 23
PROVISIONS GENERAL
Provisions are recognised when the group has a present legal or constructive obligation as a result of past events, for which it is probable that an outflow of economic benefits will be required to settle the obligation, and where a reliable estimate can be made of the amount of the obligation. Provisions are determined by discounting the expected future cash flows at a pre-tax discount rate that reflects current market assessments of the time value of money and, where appropriate, the risks specific to the liability.
WARRANTIES AND FAULT RECTIFICATION
A provision for warranties and fault rectification is recognised when the underlying products or services are sold. The provision is based on historical warranty and fault rectification data, claims made and a weighting of all possible outcomes against their associated probabilities.
RETRENCHMENTS AND RESTRUCTURING
A provision for retrenchments and restructuring is recognised when the group has approved a detailed and formal restructuring plan, and the restructuring either has commenced or has been announced publicly. Future operating costs are not provided for.
ONEROUS CONTRACTS
A provision for onerous contracts is recognised when the expected benefits to be derived by the group from a contract are lower than the unavoidable cost of meeting the obligations under the contract.
The provision is measured at the present value of the lower of the expected costs of terminating the contract and the expected net cost of continuing with the contract. Before a provision is established, the group recognises any impairment loss on the assets associated with that contract.
SHARE-BASED PAYMENT TRANSACTIONS EQUITY SETTLED
The fair value of share options and deferred delivery shares granted to employees is recognised as an employee expense with a corresponding increase in equity. The fair value is measured at grant date and expensed over the period during which the employees are required to provide services in order to become unconditionally entitled to the equity instruments.
The fair value of the instruments granted is measured using generally accepted valuation techniques, taking into account the terms and conditions upon which the instruments are granted. The amount recognised as an expense is adjusted to reflect the actual number of share options and deferred delivery shares that vest, except where forfeiture is only due to share prices not achieving the threshold for vesting. This accounting policy has been applied to all equity instruments granted after 7 November 2002 that had not yet vested at 1 January 2005.
GROUP SHARE-BASED PAYMENT TRANSACTIONS
Transactions in which a parent grants rights to its equity instruments directly to the employees of its subsidiaries are classified as equity settled in the financial statements of the subsidiary, as it receives the benefit of the services rendered and has no obligation to settle the award.
The subsidiary recognises the services acquired with the share-based payment as an expense and recognises a corresponding increase in equity for a capital contribution from the parent for those services acquired. The parent recognises in equity the equity-settled share-based payment and recognises a corresponding increase in the investment in subsidiary.
A recharge arrangement exists whereby the subsidiary is required to fund the difference between the exercise price on the share options and the market price of the share at the time of exercising the option. The recharge arrangement is accounted for separately from the underlying equity-settled share-based payment upon initial recognition, as follows:
• The subsidiary recognises a recharge liability and a corresponding adjustment against equity for the capital contribution recognised in respect of the share-based payment; and
• The parent recognises a recharge asset and a corresponding adjustment to the carrying amount of the investment in the subsidiary.
Subsequent to initial recognition, the recharge arrangement is remeasured at fair value at each subsequent reporting date until settlement date to the extent vested. Where the recharge amount recognised is greater than the initial capital contribution recognised by the subsidiary in respect of the share-based payment, the excess is recognised as a net capital distribution to the parent.

ALTRON Annual Financial Statements 2014 24
ACCOUNTING POLICIES continued
The amount of the recharge in excess of the capital contribution recognised as an increase in the investment in subsidiary is deferred and recognised as dividend income by the parent when settled by the subsidiary.
B-BBEE TRANSACTIONS
Where goods or services are considered to have been received from B-BBEE partners as consideration for equity instruments of the group, these transactions are accounted for as share-based payment transactions, even when the entity cannot specifically identify the goods or services received. This accounting policy is applicable to equity instruments that had not vested by 1 January 2005 (as above).
RENTAL FINANCE ADVANCES
Rental finance advances to customers are supported by finance leases and are stated at the outstanding capital balances.
The income earned is computed at the interest rates inherent in each contract, applied to the capital balance outstanding under such contract and is included in revenue.
REVENUE Revenue from the sale of goods is measured at the fair value of the consideration received or receivable, net of returns and allowances, trade discounts, volume rebates and value added tax.
Revenue is recognised when the significant risks and rewards have been transferred to the buyer, recovery of the consideration is probable, the associated costs and possible return of goods can be estimated reliably, there is no continuing management involvement with the goods and the amount of revenue can be measured reliably.
Revenue from services rendered is recognised in profit or loss in proportion to the stage of completion of the transaction at reporting date. The stage of completion is time based and dependent on the terms of the contract.
Revenue from operating lease arrangements is recognised in profit and loss on a straight-line basis over the term of the lease.
CUSTOMER FINANCIAL LEASE RECEIVABLES
Customer financial lease receivables represent amounts due by customers in respect of the equipment component of airtime and data usage service contracts. The amounts due are receivable over the contract term.
CONTRACT FULFILMENT COSTS
Contract fulfilment costs include hardware, fitment, commissions and other costs directly attributable to the negotiation and conclusion of customer service contracts. These costs are expensed over the expected period of the customer service contract.
COMMISSIONS
If the group acts in the capacity of an agent rather than principal in a transaction, then the revenue is the net amount of the commission made by the group.
SHARE CAPITAL ORDINARY SHARES
Ordinary shares are classified as equity. Incremental costs directly attributable to the issue of ordinary shares and share options are recognised as a deduction from equity, net of any tax effects.
PARTICIPATING PREFERENCE SHARE CAPITAL
Participating preference share capital is classified as equity if it is non-redeemable and any dividends are discretionary, or is redeemable but only at the company’s option. Dividends on preference share capital classified as equity are recognised as distributions within equity.
Participating preference share capital is classified as a liability if it is redeemable on a specific date or at the option of the shareholders or if dividend payments are not discretionary. Dividends thereon are recognised in profit or loss as interest expense.

ALTRON Annual Financial Statements 2014 25
REPURCHASE OF SHARE CAPITAL
When share capital recognised as equity is repurchased, the amount of the consideration paid, including directly attributable costs, is recognised as a deduction from equity.
Repurchased shares held by subsidiaries are classified as treasury shares and presented as a deduction from total equity.
TAXATION Income tax expense comprises current and deferred tax. Income tax expense is recognised in profit or loss, except to the extent that it relates to items recognised directly in equity or in other comprehensive income, in which case it is recognised in equity or other comprehensive income, respectively.
CURRENT TAX
Current tax comprises tax payable calculated on the basis of the expected taxable income for the year, using the tax rates enacted or substantively enacted at the reporting date, and any adjustment of tax payable for previous years.
DEFERRED TAX
Deferred tax is recognised based on temporary differences.
Temporary differences are differences between the carrying amounts of assets and liabilities for financial reporting purposes and their tax values.
Deferred tax is not recognised for the following temporary differences: the initial recognition of goodwill, the initial recognition of assets or liabilities in a transaction that is not a business combination and that affects neither accounting nor taxable profit or loss, and differences relating to investments in subsidiaries, associates and joint arrangements to the extent that the group is able to control the timing of the reversal of the temporary differences and it is probable that they will not reverse in the foreseeable future.
The amount of deferred tax provided is based on the expected manner of realisation or settlement of the carrying amount of assets and liabilities using tax rates enacted or substantively enacted at the reporting date. The effect on deferred tax of any changes in tax rates is recognised in profit or loss, except to the extent that it relates to items previously charged or credited directly to equity.
A deferred tax asset is recognised to the extent that it is probable that future taxable profits will be available against which the unused tax losses and deductible temporary differences can be utilised. Deferred tax assets are reviewed at each reporting date and are reduced to the extent that it is no longer probable that the related tax benefit will be realised.
In the event that the applicable taxation rate(s) are changed from those applied in the comparative financial reporting year, the opening balance of the deferred taxation liability shall be adjusted for the change in the taxation rates.
Deferred taxation assets and liabilities are offset if there is a legally enforceable right to offset current taxation liabilities and assets and they relate to income taxation levied by the same authority on the same taxable entity, or on different taxation entities, but they intend to settle current taxation liabilities and assets on a net basis or their taxation assets and liabilities will be realised simultaneously.
DIVIDENDS WITHHOLDING TAX
Dividends withholding tax is a tax on shareholders receiving dividends and is applicable to all dividends declared on or after 1 April 2012.
The group withholds dividends tax on behalf of its shareholders at a rate of 15% on dividends declared. Amounts withheld are not recognised as part of the group’s tax charge but rather as part of the dividend paid recognised directly in equity.
Where withholding tax is withheld on dividends received, the dividend is recognised at the gross amount with the related withholdings tax recognised as part of tax expense unless it is otherwise reimbursable in which case it is recognised as an asset.
EARNINGS PER SHARE The group presents basic and diluted earnings per share (EPS) data for its ordinary shares and participating preference shares.
Basic EPS is calculated by dividing the profit or loss attributable to ordinary and participating preference shareholders of the company by the weighted average number of ordinary and participating preference shares outstanding during the period.

ALTRON Annual Financial Statements 2014 26
Diluted EPS is determined by adjusting the profit or loss attributable to ordinary shareholders and the weighted average number of ordinary and participating preference shares outstanding for the effects of all dilutive potential ordinary and participating preference shares, which comprise share options granted to employees and B-BBEE transactions that have not yet met the applicable accounting recognition criteria.
OPERATING SEGMENTS An operating segment is a component of the group that engages in business activities from which it may earn revenues and incur expenses, including revenues and expenses that relate to transactions with any of the group’s other components.
The group determines and presents operating segments based on the information that is internally provided to the group’s chief executive (CE), who is the group’s chief operating decision-maker.
An operating segment’s operating results are reviewed regularly by the CE to make decisions about resources to be allocated to the segment and assess its performance, and for which discrete financial information is available.
Segment results that are reported to the CE include items directly attributable to a segment as well as those that can be allocated on a reasonable basis. Unallocated items comprise mainly corporate assets (primarily the group’s headquarters and the subgroup’s headquarters).
CHANGES IN ACCOUNTING POLICIESThe group has adopted the following new accounting standards and amendments to standards, including any consequential amendments to other standards, with a date of initial application of 1 March 2013:
a. IFRS 10 Consolidated Financial Statements (2011)b. IFRS 11 Joint Arrangementsc. IFRS 12 Disclosure of Interests in Other Entitiesd. IFRS 13 Fair Value Measuremente. IAS 19 Employee Benefits (as revised in 2011), including Amendments to IAS 19 relating to employee contributions to
defined benefit plans (early adoption)f. IAS 27 Separate Financial Statementsg. IAS 28 Investment in Associates and Joint Venturesh. Presentation of Items of Other Comprehensive Income (Amendments to IAS 1)i. IAS 36 Impairment of assets (2013) (early adoption)
In accordance with IAS 8: Accounting Policies, Changes in Accounting Estimates and Errors, the changes in accounting policies described below have been applied retrospectively to adjust the statement of comprehensive income, statement of changes in equity, balance sheet and statement of cash flows for the effects of new accounting standards.
(a) Subsidiaries
In accordance with the transitional provisions of IFRS 10 (2011), the group reassessed the control conclusion for its investees at 1 March 2013.
As a result of adopting IFRS 10, Altron has changed its accounting policy for evaluating control over its investees. IFRS 10 introduces a new control model that is applicable to all investees, by focusing on whether Altron has power over an investee, exposure or rights to variable returns from its involvement with the investee and ability to use its power to affect those returns.
As a consequence, the group has changed its control conclusion in respect of its investment in Tridonic SA (Pty) Limited (Tridonic). Tridonic has been reclassified from a jointly controlled entity that was previously proportionately consolidated to a subsidiary.
Altron has re-evaluated its treatment of the Autopage cell captive. The Autopage cell captive is no longer consolidated in terms of IFRS 10 and is accounted for as an in-substance reinsurance contract.
ACCOUNTING POLICIES continued

ALTRON Annual Financial Statements 2014 27
(b) Joint arrangements
Joint ventures were previously proportionately consolidated, whereby the group's share of the joint arrangements assets, liabilities, income, expenses and cash flows were combined with similar items, on a line-by-line basis, in the group's financial statements.
In terms of IFRS 11, proportionate consolidation of joint arrangements is no longer permitted. Joint arrangements are now classified as either joint ventures or joint operations. Joint ventures are required to be equity acccounted.
The group has re-evaluated its involvement in its joint venture with CBI Electric Aberdare ATC Telecom Cables (CBI) and has reclassified the investment from a jointly controlled entity that was previously proportionately consolidated to a joint venture that is now equity accounted.
(c) Disclosure of interests in other entities
As a result of IFRS 12, the group has expanded its disclosures with regards to its interests in subsidiaries, equity-accounted investees and unconsolidated structured entities (see Annexure 1).
(d) Fair value measurement
IFRS 13 establishes a single framework for measuring fair value and making disclosures about fair value measurements when such measurements are required or permitted by other IFRSs.
It unifies the definition of fair value as the price that would be received to sell an asset or paid to transfer a liability in an orderly transaction between market participants at the measurement date. It replaces and expands the disclosure requirements about fair value measurements in other IFRSs, including IFRS 7. As a result, the Group has included additional disclosures in this regard (see note 30.7)
In accordance with the transitional provisions of IFRS 13, the group has applied the new fair value measurement guidance prospectively and has not provided any comparative information for new disclosures. Notwithstanding the above, the change had no significant impact on the recognition and measurement of the group's assets and liabilities.
(e) Employee benefits
IAS 19: Employee Benefits became effective from 1 March 2013. Under its previous accounting policy, the group elected to apply the corridor method to account for the recognition of actuarial gains and losses.
Under IAS 19 (as revised in 2011), the calculations of interest cost and expected return on plan assets have been altered and a net interest income or expense will be calculated by applying the discount rate used to measure the defined-benefit obligation to the net defined-benefit asset/obligation at the beginning of the period. Profit from operating activities includes only the current service cost and the net interest income or expense. Remeasurements of the net defined-benefit asset/obligation are recognised in other comprehensive income. Remeasurements include actuarial gains and losses, the return on plan assets and change in the effect of the asset ceiling, excluding amounts included in the net interest on the defined benefit asset/obligation.
(f) Presentation of items of OCI
As a result of amendments to IAS 1, the Group has modified the presentation of items of OCI in its statement of comprehensive income, to present separately items that would be reclassified to profit or loss from those that would never be. Comparative information has been re-presented accordingly.
(g) Impairment of assets (Amendments to IAS 36)
The group has early adopted the amendments to IAS 36 (2013). The amendments correct the unintended disclosure consequences as a result of the adoption of IFRS 13 Fair Value Measurement.
SUMMARY OF QUANTITATIVE IMPACTS (a, b, e)The following tables summarise the impacts of the above changes on the group's balance sheet, statement of comprehensive income and cash flows. The impacts relate to the consolidation of an additional subsidiary (see (a)), the equity accounted joint venture (see (b)) and the change related to employee benefits (see (e)).

ALTRON Annual Financial Statements 2014 28
CONSOLIDATED BALANCE SHEET
at 29 February 2012 Impact of changes in accounting policiesAs
previouslyreported
SubsidiariesSee (a)
Joint venture
See (b)
Employee benefits
See (e)As
restatedR millions
AssetsNon-current assets 4 695 – 105 – 4 800
Property, plant and equipment 2 300 – (62) – 2 238Intangible assets, including goodwill 1 732 – (16) – 1 716Equity-accounted investments 74 – 174 – 248Other investments 233 – – – 233Rental finance advances 67 – – – 67Non-current receivables and other assets 150 – – – 150Deferred taxation 139 – 9 – 148
Current assets 7 585 4 (143) – 7 446
Inventories 2 475 8 (68) – 2 415Trade and other receivables, includingderivatives 3 872 22 (34) – 3 860Assets classified as held-for-sale 135 – – – 135Cash and cash equivalents 1 103 (26) (41) – 1 036
Total assets 12 280 4 (38) – 12 246
Equity and liabilitiesTotal equity 5 813 10 (2) – 5 821Non-current liabilities 936 – – – 936
Loans 707 – – – 707Empowerment funding obligation 47 – – – 47Provisions 20 – – – 20Deferred income 51 – – – 51Deferred taxation 111 – – – 111
Current liabilities 5 531 (6) (36) – 5 489
Loans 613 – – – 613Empowerment funding obligation 24 – – – 24Bank overdraft 550 – – – 550Trade and other payables, includingderivatives 4 079 (2) (36) – 4 041Provisions 118 – – – 118Liabilities classified as held-for-sale 67 – – – 67Taxation payable 80 (4) – – 76
Total equity and liabilities 12 280 4 (38) – 12 246
Net asset value per share (cents) 1 583 2 – 1 585
ACCOUNTING POLICIES continued

ALTRON Annual Financial Statements 2014 29
CONSOLIDATED BALANCE SHEETat 28 February 2013 Impact of changes in accounting policies
As previously
reportedSubsidiaries
See (a)
JointVenture
See (b)
Employee benefits
See (e)As
restatedR millions
AssetsNon-current assets 4 757 – 106 – 4 863
Property, plant and equipment 1 822 – (57) – 1 765Intangible assets including goodwill 1 613 – (16) – 1 597Equity-accounted investments 80 – 170 – 250Other investments 673 – – – 673Rental finance advances 45 – – – 45Non-current receivables and other assets 414 – – – 414Deferred tax 110 – 9 – 119
Current assets 8 210 12 (149) – 8 073
Inventories 2 653 14 (81) – 2 586Trade and other receivables, includingderivatives 4 255 46 (39) – 4 262Assets classified as held-for-sale – – – – –Cash and cash equivalents 1 302 (48) (29) – 1 225
Total assets 12 967 12 (43) – 12 936
Equity and liabilitiesTotal equity 5 220 11 (2) – 5 229Non-current liabilities 787 – – 5 792
Loans 609 – – – 609Empowerment funding obligation 17 – – – 17Provisions 25 – – – 25Deferred income – – – – –Deferred taxation 136 – – 5 141
Current liabilities 6 960 1 (41) (5) 6 915
Loans 1 308 – – – 1 308Empowerment funding obligation 29 – – – 29Bank overdraft 385 – – – 385Trade and other payables, includingderivatives 5 105 3 (41) – 5 067Provisions 100 – – – 100Liabilities classified as held-for-sale – – – – –Taxation payable 33 (2) – (5) 26
Total equity and liabilities 12 967 12 (43) – 12 936
Net asset value per share (cents) 1 498 – (1) – 1 497

ALTRON Annual Financial Statements 2014 30
CONSOLIDATED STATEMENT OF COMPREHENSIVE INCOME
For the year ended 28 February 2013 Impact of changes in accounting policies
As previously
reportedSubsidiaries
See (a)
JointVenture
See (b)
Employee benefits
See (e)As
restatedR millions
Continuing operationsRevenue 24 769 25 (330) – 24 464
Earnings before interest, tax, depreciation, amortisation and capital items (EBITDA) 1 692 1 (22) (19) 1 652Depreciation and amortisation (461) – 8 – (453)
Operating profit before capital items 1 231 1 (14) (19) 1 199Capital items (78) – – – (78)
Result from operating activities 1 153 1 (14) (19) 1 121Finance income 57 – (1) – 56Finance expense (134) – – – (134)Share of profit of equtiy-accounted investees, net of tax 5 – 10 – 15
Profit before taxation 1 081 1 (5) (19) 1 058Taxation (374) 5 5 (364)
Profit for the period from continuing operations 707 1 – (14) 694Discontinued operationsLoss for the period from discontinued operations (1 636) – – – (1 636)
Loss for the period (929) 1 – (14) (942)
Other comprehensive incomeItems that will never be reclassifiedto profit or lossRemeasurement of defined benefit obligation – – – 19 19Taxation on items that will never be reclassified to profit or loss – – – (5) (5)
Items that are or may be reclassifiedsubsequently to profit or lossForeign currency translation differences in respect of foreign operations 310 – – – 310Realisation of negative foreign currencytranslation reserve on disposal 196 – – – 196Fair value adjustment on available-for-sale investments (5) – – – (5)
Other comprehensive income for the period, net of taxation 501 – – 14 515
Total comprehensive income for the period (428) 1 – – (427)
ACCOUNTING POLICIES continued

ALTRON Annual Financial Statements 2014 31
For the year ended 28 February 2013 Impact of changes in accounting policies
As previously
reportedSubsidiaries
See (a)
JointVenture
See (b)
Employee benefits
See (e)As
restatedR millions
Net profit/(loss) attributable to:Non-controlling interests (631) 1 – – (630)Altron equity holders (298) – – (14) (312)
Altron equity holders from continuing operations 498 – – (14) 484Altron equity holders from discontinued operations (796) – – – (796)
Net profit/(loss) for the period (929) 1 – (14) (942)
Total comprehensive income attributable to:Non-controlling interests (439) – – – (439)Altron equity holders 11 – 1 – 12
Altron equity holders from continuing operations 650 – 1 – 651Altron equity holders from discontinued operations (639) – – – (639)
Total comprehensive income for the period (428) – 1 – (427)
Basic loss per share from total operations (cents) (94) – – (5) (99)Diluted basic loss per share from total operations (cents) (86) – – (4) (90)Headline earnings per share (cents) 136 – – (4) 132Diluted headline earnings per share (cents) 133 – – (4) 129
SUMMARISED CONSOLIDATED STATEMENT OF CASH FLOWS
For the year ended 28 February 2013 Impact of changes in accounting policies
R millions
As previously
reportedSubsidiaries
See (a)
Jointventure
See (b)
Employeebenefits
see (e)As
restated
Continuing operationsNet cash from operating activities 1 150 (1) (14) – 1 135Net cash from investing activities (1 137) – 5 – (1 132)Net cash from financing activities 1 005 – – – 1 005Net cash from discontinued operations (687) – – – (687)
Net increase in cash and cash equivalents 331 (1) (9) – 321
CONSOLIDATED STATEMENT OF COMPREHENSIVE INCOME

ALTRON Annual Financial Statements 2014 32
BALANCE SHEETat 28 February 2014
GROUP
2014 2013 2012R millions Notes (Restated) (Restated)
ASSETSNon-current assets 5 496 4 863 4 800
Property, plant and equipment 1 2 028 1 765 2 238Intangible assets, including goodwill 2 1 725 1 597 1 716Equity-accounted investments 3 243 250 248Other investments 3 181 673 233Rental finance advances 4 68 45 67Non-current receivables and other assets 5 921 414 150Defined benefit asset 17 180 – –Deferred taxation 6 150 119 148
Current assets 10 620 8 073 7 446
Inventories 7 3 116 2 586 2 415Trade and other receivables, including derivatives 8 5 805 4 262 3 860Assets classified as held-for-sale 41 214 – 135Taxation receivable 74 – –Cash and cash equivalents 9 1 411 1 225 1 036
Total assets 16 116 12 936 12 246
EQUITY AND LIABILITIESTotal equity 4 514 5 229 5 821
Altron equity holders 4 256 4 740 5 003Non-controlling interests 258 489 818
Non-current liabilities 495 792 936
Loans 13 283 609 707Empowerment funding obligation 14 – 17 47Provisions 15 36 25 20Deferred income 18 – – 51Deferred taxation 6 176 141 111
Current liabilities 11 107 6 915 5 489
Loans 13 2 649 1 308 613Empowerment funding obligation 14 17 29 24Bank overdrafts 9 1 777 385 550Provisions 15 59 100 118Trade and other payables, including derivatives 16 6 374 5 067 4 041Liabilities classified as held-for-sale 41 84 – 67Taxation payable 147 26 76
Total equity and liabilities 16 116 12 936 12 246
Net asset value per share (cents) 1 311 1 497 1 585

ALTRON Annual Financial Statements 2014 33
STATEMENT OF COMPREHENSIVE INCOMEfor the year ended 28 February 2014
GROUP2014 2013
R millions Notes (Restated)
CONTINUING OPERATIONSRevenue 19 27 772 24 464
Operating costs before capital items (25 984) (22 812)
Material and services consumed (21 304) (18 458)Employees' remuneration 20,3 (4 680) (4 354)
Earnings before interest, taxation, depreciation, amortisation and capital items 1 788 1 652Depreciation and amortisation (446) (453)
Operating profit before capital items 20 1 342 1 199Capital items 21 (38) (78)
Result from operating activities 1 304 1 121Financial income 22 103 56Financial expense 23 (363) (134)Share of profit of equity-accounted investees, net of taxation 24 14 15
Profit before taxation 1 058 1 058Taxation 25 (326) (364)
Profit for the year from continuing operations 732 694
DISCONTINUED OPERATIONSRevenue 19 – 280
Operating costs before capital items – (393)
Material and services consumed – (317)Employees' remuneration – (76)
Earnings before interest, taxation, depreciation, amortisation and capital items – (113)Depreciation and amortisation – (52)
Operating loss before capital items – (165)Capital items 21 43 (1 371)
Result from operating activities 43 (1 536)Financial income 22 – 2Financial expense 23 – (92)
Profit/(loss) before taxation 43 (1 626)Taxation 25 – (10)
Profit/(loss) for the year from discontinued operations 43 (1 636)
Net profit/(loss) for the year 775 (942)

ALTRON Annual Financial Statements 2014 34
STATEMENT OF COMPREHENSIVE INCOME continued
for the year ended 28 February 2014
GROUP2014 2013
R millions Notes (Restated)
Other comprehensive income Items that will never be reclassified to profit or lossRemeasurement of net defined benefit asset/obligation 192 19Taxation on items that will never be reclassified to profit or loss (3) (5)Items that are or may be reclassified subsequently to profit or lossForeign currency translation differences in respect of foreign operations 164 310Fair value adjustment on available-for-sale investments 13 (5)Realisation of negative foreign currency translation reserve on disposal – 196
Other comprehensive income for the year, net of taxation 366 515
Total comprehensive income for the year 1 141 (427)
Net profit/(loss) attributable to:Non-controlling interests 160 (630)Altron equity holders 615 (312)
Altron equity holders from continuing operations 572 484Altron equity holders from discontinued operations 43 (796)
Net profit/(loss) for the year 775 (942)
Total comprehensive income attributable to:
Non-controlling interests 174 (439)Altron equity holders 967 12
Altron equity holders from continuing operations 924 651Altron equity holders from discontinued operations 43 (639)
Total comprehensive income for the year 1 141 (427)
Basic earnings per share from continuing operations (cents) 26 179 153Diluted basic earnings per share from continuing operations (cents) 175 149Basic earnings/(loss) per share from discontinued operations (cents) 26 13 (252)Diluted basic earnings/(loss) per share from discontinued operations (cents) 26 13 (239)Basic earnings/(loss) per share from total operations (cents) 192 (99)Diluted basic earnings/(loss) per share from total operations (cents) 188 (90)Dividends per share (cents) – proposed 27 80 60

ALTRON Annual Financial Statements 2014 35
STATEMENT OF CASH FLOWSfor the year ended 28 February 2014
GROUP2014 2013
R millions CONTINUING OPERATIONS Notes (Restated)
CASH FLOWS FROM OPERATING ACTIVITIES 762 1 135
Cash generated by operations 34 1 506 2 043Interest received 84 44Dividends received from equity accounted investees and other investments 35 34 9Interest paid (360) (148)Taxation paid 36 (270) (380)
Cash available from operating activities 994 1 568Dividends paid– to Altron equity holders (190) (291)– to non-controlling interests (42) (142)
CASH FLOWS UTILISED IN INVESTING ACTIVITIES (2 866) (1 132)
Acquisition of subsidiaries 37 (18) (104)Proceeds/(cash disposed of) on disposal of subsidiaries 38 9 (24)Proceeds on disposal of property, plant and equipment 39 26 36(Increase)/decrease of rental finance advances (34) 22Additions to intangible assets (182) (157)Additions to property, plant and equipment (577) (491)Other investing activities 40 (2 090) (414)
CASH FLOWS FROM FINANCING ACTIVITIES 989 1 005
Loans advanced 2 221 1 128Loans repaid (1 232) (123)
DISCONTINUED OPERATIONSCash flows utilised in operating activities – (90)Cash flows utilised in investing activities – (22)Cash flows utilised in financing activities – (146)Cash flows on disposal of discontinued operations 38 (63) (429)
(63) (687)
NET (DECREASE)/INCREASE IN CASH AND CASH EQUIVALENTS (1 178) 321Net cash and cash equivalents at the beginning of the year 840 486Effect of exchange rate fluctuations on cash held 24 33Cash classified as held-for-sale (52) –
NET CASH AND CASH EQUIVALENTS AT THE END OF THE YEAR 9 (366) 840

ALTRON Annual Financial Statements 2014 36
STATEMENT OF CHANGES IN EQUITYfor the year ended 28 February 2014
Attributable to Altron equity holders
GROUP
Sharecapital and
premium(note 10)
R millions
Treasuryshares
(note 10)R millions
Foreigncurrency
translationreserve(note 11)
R millions
Premium/discount on
non-controlling
equitytransactions
(note 11)R millions
Share-based
paymentsreserve(note 11)
R millions
Statutoryreserves(note 11)
R millions
Fair valuereserve(note 11)
R millions
Retained earnings(note 11)
R millionsTotal
R millions
Non-controlling
interestsR millions
Totalequity
R millions
Balance at 29 February 2012 (Audited) 2 244 (299) (174) (1 217) 119 95 77 4 158 5 003 810 5 813Impact of changes in accounting policies – – – – – – – – – 8 8
Balance at 29 February 2012 (Restated) 2 244 (299) (174) (1 217) 119 95 77 4 158 5 003 818 5 821Total comprehensive income for the yearLoss for the year – – – – – – – (312) (312) (630) (942)Other comprehensive incomeForeign currency translation differences in respect of foreign operations – – 192 – – – – – 192 118 310Realisation of negative foreign currency translation reserve on disposal – – 120 – – – – – 120 76 196Fair value adjustment on available-for-sale investments – – – 2 – – (5) – (3) (2) (5)Remeasurement of net defined benefit asset/obligation – – – – – – 14 – 14 – 14
Total other comprehensive income – – 312 2 – – 9 – 323 192 515
Total comprehensive income for the year – – 312 2 – – 9 (312) 11 (438) (427)
Transactions with owners, recorded directly in equityContributions by and distributions to ownersDividends to equity holders – – – – – – – (291) (291) (142) (433)Issue of share capital 10 – – – (10) – – – – – –Share-based payment transactions – – – 1 16 – – – 17 6 23
Total contributions by and distributions to owners 10 – – 1 6 – – (291) (274) (136) (410)
Changes in ownership interests in subsidiariesIntroduction of non-controlling interests – – – – – – – – – 3 3Disposal of subsidiary – – – – – – – – – 242 242
Total changes in ownership interests in subsidiaries – – – – – – – – – 245 245
Total transactions with owners 10 – – 1 6 – – (291) (274) 109 (165)
Balance at 28 February 2013 (Restated) 2 254 (299) 138 (1 214) 125 95 86 3 555 4 740 489 5 229Total comprehensive income for the yearProfit for the year – – – – – – – 615 615 160 775Other comprehensive incomeForeign currency translation differences in respect of foreign operations – – 163 – – – – – 163 1 164Fair value adjustment on available-for-sale investments – – – – – – – – – 13 13Remeasurement of net defined benefit asset/obligation – – – – – – 189 – 189 – 189
Total other comprehensive income – – 163 – – – 189 – 352 14 366
Total comprehensive income for the year – – 163 – – – 189 615 967 174 1 141
Transactions with owners, recorded directly in equityContributions by and distributions to ownersDividends to equity holders – – – – – – – (190) (190) (42) (232)Issue of share capital 15 – – – (15) – – – – – –Share-based payment transactions – – – – 30 – – – 30 3 33
Total contributions by and distributions to owners 15 – – – 15 – – (190) (160) (39) (199)
Changes in ownership interests in subsidiariesBuy-back of non-controlling interest 158 – – (1 449) – – – – (1 291) (355) (1 646)Disposal of subsidiary – – – – – – – – – (11) (11)
Total changes in ownership interests in subsidiary 158 – – (1 449) – – – – (1 291) (366) (1 657)
Total transactions with owners 173 – – (1 449) 15 – – (190) (1 451) (405) (1 856)
Balance at 28 February 2014 2 427 (299) 301 (2 663) 140 95 275 3 980 4 256 258 4 514
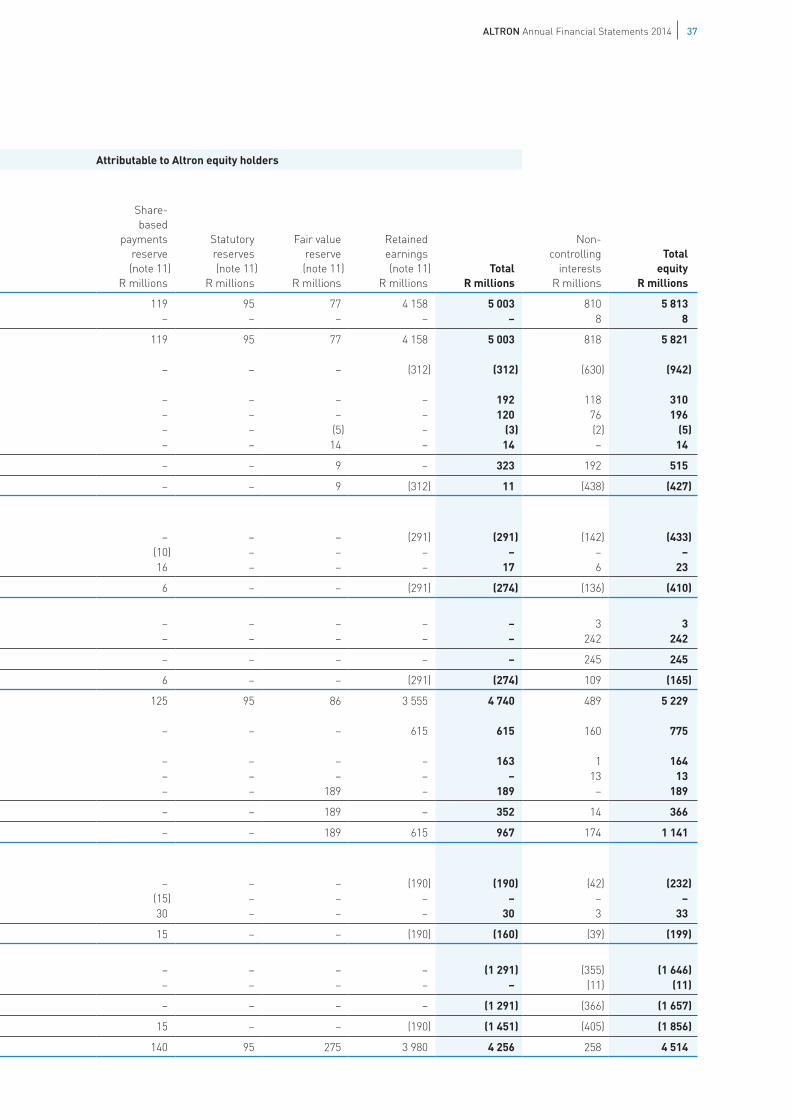
ALTRON Annual Financial Statements 2014 37
Attributable to Altron equity holders
GROUP
Sharecapital and
premium(note 10)
R millions
Treasuryshares
(note 10)R millions
Foreigncurrency
translationreserve(note 11)
R millions
Premium/discount on
non-controlling
equitytransactions
(note 11)R millions
Share-based
paymentsreserve(note 11)
R millions
Statutoryreserves(note 11)
R millions
Fair valuereserve(note 11)
R millions
Retained earnings(note 11)
R millionsTotal
R millions
Non-controlling
interestsR millions
Totalequity
R millions
Balance at 29 February 2012 (Audited) 2 244 (299) (174) (1 217) 119 95 77 4 158 5 003 810 5 813Impact of changes in accounting policies – – – – – – – – – 8 8
Balance at 29 February 2012 (Restated) 2 244 (299) (174) (1 217) 119 95 77 4 158 5 003 818 5 821Total comprehensive income for the yearLoss for the year – – – – – – – (312) (312) (630) (942)Other comprehensive incomeForeign currency translation differences in respect of foreign operations – – 192 – – – – – 192 118 310Realisation of negative foreign currency translation reserve on disposal – – 120 – – – – – 120 76 196Fair value adjustment on available-for-sale investments – – – 2 – – (5) – (3) (2) (5)Remeasurement of net defined benefit asset/obligation – – – – – – 14 – 14 – 14
Total other comprehensive income – – 312 2 – – 9 – 323 192 515
Total comprehensive income for the year – – 312 2 – – 9 (312) 11 (438) (427)
Transactions with owners, recorded directly in equityContributions by and distributions to ownersDividends to equity holders – – – – – – – (291) (291) (142) (433)Issue of share capital 10 – – – (10) – – – – – –Share-based payment transactions – – – 1 16 – – – 17 6 23
Total contributions by and distributions to owners 10 – – 1 6 – – (291) (274) (136) (410)
Changes in ownership interests in subsidiariesIntroduction of non-controlling interests – – – – – – – – – 3 3Disposal of subsidiary – – – – – – – – – 242 242
Total changes in ownership interests in subsidiaries – – – – – – – – – 245 245
Total transactions with owners 10 – – 1 6 – – (291) (274) 109 (165)
Balance at 28 February 2013 (Restated) 2 254 (299) 138 (1 214) 125 95 86 3 555 4 740 489 5 229Total comprehensive income for the yearProfit for the year – – – – – – – 615 615 160 775Other comprehensive incomeForeign currency translation differences in respect of foreign operations – – 163 – – – – – 163 1 164Fair value adjustment on available-for-sale investments – – – – – – – – – 13 13Remeasurement of net defined benefit asset/obligation – – – – – – 189 – 189 – 189
Total other comprehensive income – – 163 – – – 189 – 352 14 366
Total comprehensive income for the year – – 163 – – – 189 615 967 174 1 141
Transactions with owners, recorded directly in equityContributions by and distributions to ownersDividends to equity holders – – – – – – – (190) (190) (42) (232)Issue of share capital 15 – – – (15) – – – – – –Share-based payment transactions – – – – 30 – – – 30 3 33
Total contributions by and distributions to owners 15 – – – 15 – – (190) (160) (39) (199)
Changes in ownership interests in subsidiariesBuy-back of non-controlling interest 158 – – (1 449) – – – – (1 291) (355) (1 646)Disposal of subsidiary – – – – – – – – – (11) (11)
Total changes in ownership interests in subsidiary 158 – – (1 449) – – – – (1 291) (366) (1 657)
Total transactions with owners 173 – – (1 449) 15 – – (190) (1 451) (405) (1 856)
Balance at 28 February 2014 2 427 (299) 301 (2 663) 140 95 275 3 980 4 256 258 4 514

ALTRON Annual Financial Statements 2014 38
NOTES TO THE FINANCIAL STATEMENTSfor the year ended 28 February 2014
R millions
Land and
buildings
Plant and
machinery
Datainfrastructure,
motor vehicles,
furniture andequipment
IT equipment
and software
Capital work
In progress Total
1. PROPERTY, PLANT AND EQUIPMENTCostBalance at 29 February 2012 (Restated) 591 2 396 1 456 918 163 5 524Additions at cost 35 143 72 114 132 496Arising on business combinations 2 13 2 2 – 19Disposals (13) (38) (20) (37) – (108)Disposals of subsidiaries (125) (170) (1 142) (70) (19) (1 526)Reclassifications 14 166 (75) (2) (115) (12)Translation of foreign operations 34 116 120 15 2 287
Balance at 28 February 2013 (Restated) 538 2 626 413 940 163 4 680
Additions at cost 187 170 48 137 132 674Arising on business combinations – – 1 – – 1Disposals (83) (66) (43) (75) (5) (272)Reclassifications 31 89 (8) 3 (115) –Translation of foreign operations 40 136 16 15 (1) 206
Balance at 28 February 2014 713 2 955 427 1 020 174 5 289
Accumulated depreciation and impairment lossesBalance at 29 February 2012 (Restated) 165 1 612 786 682 – 3 245Depreciation for the year 26 146 75 98 – 345Impairments 1 (1) 327 8 – 335Arising on business combinations 2 11 1 1 – 15Disposals (4) (37) (20) (37) – (98)Disposal of subsidiary (18) (177) (847) (63) – (1 105)Reclassifications – 16 (41) 12 – (13)Translation of foreign operations 14 148 16 13 – 191
Balance at 28 February 2013 (Restated) 186 1 718 297 714 – 2 915
Depreciation for the year 23 159 40 104 – 326Arising on business combinations – – 1 – – 1Impairments 3 – – – – 3Disposals (31) (62) (34) (72) – (199)Reclassifications 2 4 (4) (2) – –Translation of foreign operations 20 123 12 14 – 169
Balance at 28 February 2014 203 1 942 312 758 – 3 215
Carrying amount at 29 February 2012 before items classified as held-for-sale 426 784 670 236 163 2 279Property, plant and equipment classified as held-for-sale (6) (29) (1) (5) – (41)
Carrying amount at 29 February 2012 (Restated) 420 755 669 231 163 2 238
Carrying amount at 28 February 2013 (Restated) 352 908 116 226 163 1 765
Carrying amount at 28 February 2014 before items classified as held-for-sale 510 1 013 115 262 174 2 074Property, plant and equipment classified as held-for-sale – (46) – – – (46)
Carrying amount at 28 February 2014 510 967 115 262 174 2 028

ALTRON Annual Financial Statements 2014 39
1. PROPERTY, PLANT AND EQUIPMENT continuedProperty in a group operation with a carrying amount of R50 million was exchanged in the current year for a sectional title unit with a fair value of R85 million.
Impairment lossesDetermination of the recoverable amountLand and buildingsImpairment tests were conducted on the carrying values and, based on the fair value less cost to sell, R3 million was impaired on one property.
Events and circumstances leading to the recognition of impairment losses:During the year, a group company has been seeking a purchaser for an owned property and, based on interest and offers received, the property has been impaired by R3 million. Management believes that the net book value now represents the realisable value of the property.
Encumbered assetsCertain property, plant and equipment, included in the above amounts, was encumbered as security for finance leases and secured bank loans (refer note 13). Their carrying amounts are as follows:R millions 2014 2013
Finance leases 18 39Secured bank loans – 105
18 144
Assets under constructionIncluded in the cost of capital work in progress are the following categories of assets:Buildings 8 6Plant and machinery 96 132IT equipment and software 68 24Data infrastructure and other equipment 2 1
174 163
Useful livesUseful lives are reflected under accounting policies.
Capital work in progress was previously not presented separately and incorporated into the relevant other categories of property, plant and equipment. In the current year, capital work in progress is now separately presented. Comparative information was also updated to reflect this enhanced disclosure.

ALTRON Annual Financial Statements 2014 40
NOTES TO THE FINANCIAL STATEMENTS continued
for the year ended 28 February 2014
R millions GoodwillCustomer
relationships
Trade names,
designs, patents and trademarks
Proprietarysoftware,
distributionrights
and licenceagreements
Data capacity –
indefeasiblerights of use
(IRUs) Total
2. INTANGIBLE ASSETS, INCLUDING GOODWILLCostBalance at 29 February 2012 (Restated) 2 102 300 838 58 533 3 831Additions at cost – – 20 1 16 37Development costs capitalised – – 127 – – 127Disposal of subsidiary (937) – (175) – (665) (1 777)Business combination purchase price allocation (5) – 5 – – –Arising on business combinations 130 32 7 – – 169Reclassifications – – 98 – – 98Translation of foreign operations 98 7 14 – 116 235
Balance at 28 February 2013 (Restated) 1 388 339 934 59 – 2 720
Additions at cost – – 12 51 – 63Development costs capitalised – – 162 – – 162Arising on business combinations 44 – – – – 44Translation of foreign operations 44 18 13 – – 75
Balance at 28 February 2014 1 476 357 1 121 110 – 3 064
Accumulated amortisation and impairment lossesBalance at 29 February 2012 (Restated) 1 007 244 561 23 280 2 115Amortisation for the year – 45 101 4 10 160Impairment losses 13 – 7 2 300 322Disposal of subsidiary (936) – (148) – (674) (1 758)Reclassifications – – 93 – 5 98Translation of foreign operations 69 4 34 – 79 186
Balance at 28 February 2013 (Restated) 153 293 648 29 – 1 123
Amortisation for the year – 23 92 5 – 120Impairment losses 20 – 6 – – 26Translation of foreign operations 10 13 – – – 23
Balance at 28 February 2014 183 329 746 34 – 1 292
Carrying amount at 29 February 2012 (Restated) 1 095 56 277 35 253 1 716Carrying amount at 28 February 2013 (Restated) 1 235 46 286 30 – 1 597
Carrying amount at 28 February 2014 before items classified as held-for-sale 1 293 28 375 76 – 1 772Intangible assets and goodwill classified as held-for-sale (46) (1) – – – (47)
Carrying amount at 28 February 2014 1 247 27 375 76 – 1 725

ALTRON Annual Financial Statements 2014 41
2. INTANGIBLE ASSETS, INCLUDING GOODWILL continuedImpairment lossesDetermination of the recoverable amountDistribution rights and licence agreementsThe group owns the rights to distribute Xerox equipment in 25 (2013: 25) African territories. It paid an initial fee to acquire these rights. These distribution rights within Bytes Document Solutions are considered to have indefinite useful lives as these rights will automatically be renewed at no further cost upon the renewal of the group's South African distribution agreement, which agreement was renewed for a further 10 year period, effective 1 January 2011. These intangible assets have a carrying value of R19 million (2013: R19 million) and are tested for impairment annually and whenever there is an indication that the asset may be impaired. The cash flows emanating from this asset are discounted to their present value using the calculated weighted average cost of capital of 19,65% (2013: 17,98%). In determining the future cash flows, management uses the earnings before interest and tax calculated based on approved budgeted revenue and actual achieved operating margins to be derived from this asset in the first year, and this is escalated for the next four years by the anticipated CPI of 5% (2013: 5%).
Trade names, designs, patents and trademarksThe impairment of indefinite useful life intangible assets, intangible assets not yet available for use and goodwill are tested at least annually. A discounted cash flow valuation model is used to calculate value in use. Future expected cash flows are based on management forecasts, typically over a three-year period, and thereafter a reasonable rate of growth is applied based on current market conditions.
Development costs on designs capitalised with a carrying value of R98 million (2013: R103 million) have not yet been brought into use. R6 million (2013: R7 million) of development costs was impaired.
Rnil (2013: R2 million) of internal developed software was impaired and R20 million (2013: R13 million) of goodwill was impaired during the year.
Events and circumstances leading to the recognition of impairment losses:GoodwillThe total goodwill impairment related to the Nor Paper business unit and resulted from a decline in operating results and a corresponding decline in forecasted future cash flows due to lower than anticipated activity levels without an envisaged material improvement in the short to medium term.
Other intangible assetsThe R6 million impairment of development costs capitalised relates to insufficient forecasted contributory cash flows of the underlying products to support the carrying values of these intangible assets.
Impairment of goodwill in associateDuring the year R7 million of goodwill was impaired in Battery Technologies (Pty) Limited. The impairment was transferred from income from equity accounted investees to capital items (note 21).

ALTRON Annual Financial Statements 2014 42
NOTES TO THE FINANCIAL STATEMENTS continued
for the year ended 28 February 2014
2. INTANGIBLE ASSETS, INCLUDING GOODWILL continuedImpairment tests for cash-generating units containing goodwillThe following units have significant carrying amounts of goodwill net of impairment losses and currency translation effects:
R millions 2014 2013
Bytes Document Solutions 135 135CS Holdings 107 107Bytes Healthcare Solutions 64 64Bytes Document Solutions UK 46 36ComTech 30 30Powertech IST 336 336Swanib Cables 24 24NOR Paper 15 35Powertech Transformers 69 69Altech Fleetcall 33 33Altech Nupay 48 48Swist Technology Solutions 23 23Security Partnerships 92 70SetOne 67 64Bytes Universal Systems 72 72Alliance 49 49BNTech 44 –Multiple units without significant goodwill 39 40
1 293 1 235Less: Goodwill classified as held-for-sale (46) –
1 247 1 235
Description of impairment tests and key assumptionsImpairment tests are conducted on an annual basis using a discounted cash flow valuation model on the basis of value-in-use.
For the purpose of impairment testing, goodwill is allocated to the operating divisions which represent the lowest level within the group at which the goodwill is monitored for internal management purposes. The impairment tests are prepared on the basis of forecast profits generated by the underlying cash-generating units.
Management forecasts typically cover a three-year period and thereafter a reasonable rate of growth is applied based on current market conditions.
In assessing future cash flows management has used assumptions relating to the growth in the units' market potential, new market opportunities as well as changes to the cost structure based on business plans.
Discount rates used in the discounted cash flow models are calculated using the principles of the capital asset pricing model, taking account of current market conditions.
The resulting weighted average cost of capital is then compared to industry and regional averages to ensure reasonableness. Weighted average cost of capital rates used for the purposes of impairment tests ranged between 7,18% and 19,5% (2013: 5,81% and 16,12%) at year end. Perpetuity growth rates applied ranged between 0,45% and 5,0% (2013: 0,46% and 5%), depending on the territory in which the business operates.
The purchase price allocation for BNTech was performed during the financial year and no recognisable intangible assets were identified.
A reasonably possible change in the assumptions used to calculate the value in use is not likely to cause the carrying value of the remaining cash-generating units to exceed their recoverable amounts.
Goodwill impairment lossesThe carrying amount of the NOR Paper cash-generating unit was determined to be higher than its recoverable amount, based on value in use, and an impairment loss of R20 million was recognised, which was fully allocated to goodwill. The discount rate used in the impairment assessment was 17,21%. The impairment is included in the Bytes Document Solutions Group operating segment.
Useful livesUseful lives are reflected under accounting policies.

ALTRON Annual Financial Statements 2014 43
GROUP
R millions 20142013
(Restated)
3. EQUITY-ACCOUNTED INVESTEES AND OTHER INVESTMENTSInterest in joint venture 170 170Interests in associates 73 80
243 250
Other investments
Non-current loans receivable at amortised costParticipation loan to Technologies Acceptances Receivables (Pty) Limited 148 143Loan to Izingwe Aberdare Cables Investments (Pty) Limited 5 5
Non-current available-for-sale investments at fair valuePreference share investment in Technologies Acceptances Receivables (Pty) Limited 21 21Investment in Izingwe Aberdare Cables Investments (Pty) Limited 6 6Izingwe Aberdare Cables Investments (Pty) Limited – cash on deposit 1 1Equity investment in Liquid Telecommunications Holdings Limited – 454Preference share investment in Gradolite (Pty) Limited – 43
Cost 43 43Accumulated impairment (note 21) (43) –
181 673
Refer Annexure 1 for details.
4. RENTAL FINANCE ADVANCESAssets at amortised costPresent value of minimum lease payments receivable 117 83Less: Current portion (note 8) (49) (38)
Non-current finance lease receivable 68 45
Liabilities at amortised cost (included under loans)Present value of minimum lease payments payable (note 13) 117 83Less: Current portion (note 13) (49) (38)
Non-current finance lease liability 68 45
Group entities sell certain document processing equipment to third parties on a finance lease basis.
The lease asset arising is in turn financed by a reciprocal lease agreement with financial institutions.
The underlying loans receivable and payable are settled in monthly instalments over periods of up to five years and bear interest at rates linked to the prime bank overdraft rate. The loans are secured by the underlying equipment sold.
The relationship between gross investment in the lease at the balance sheet date, and the present value of minimum lease payments receivable at the balance sheet date, is as follows:
Non-derivative financial assets
Finance lease assetsPresent value of minimum lease payments receivable 117 83Interest receivable 20 15
Future minimum lease payments receivable 137 98

ALTRON Annual Financial Statements 2014 44
4. RENTAL FINANCE ADVANCES continued2014 2014 2013 2013
R millions
Futureminimum
lease payments
Present valueof minimum
leasepayments
Futureminimum
lease payments
Present valueof minimum
leasepayments
Non-derivative financial liabilitiesFinance lease liabilities are payable as follows:Less than 1 year 60 49 46 38Between 1 and 5 years 77 68 52 45
137 117 98 83
R millions 2014 2013
Exposure to credit riskThe carrying amount of finance lease assets represents the maximum credit exposure. The maximum exposure to credit risk at the reporting date was:Finance lease assets 117 83
The maximum exposure to, and concentration of, credit risk for finance lease assets at the reporting date by type of customer was:Parastatals/government 77 52Corporates 40 31
117 83
The maximum exposure to, and concentration of, credit risk for finance lease assets at the reporting date by geographical region was:South Africa 117 83
All customers are subjected to stringent credit vetting. It is our experience that only large corporates and parastatal/government departments avail themselves of the document outsourcing services rendered by the group and hence there is a reduced risk of default. Lease payments are due 30 days after invoice. The percentage of delinquent leases at balance sheet date was 4,34% (2013: 14,11%) of the total lease book.
NOTES TO THE FINANCIAL STATEMENTS continued
for the year ended 28 February 2014

ALTRON Annual Financial Statements 2014 45
4. RENTAL FINANCE ADVANCES continuedExposure to liquidity riskThe following are the contractual maturities of finance lease assets and liabilities, including interest payments and excluding the impact of netting agreements:28 February 2014R millions
Carryingamount
Contractualcash flows
6 monthsor less
6 – 12 months
1 – 2 years
2 – 5 years
Non-derivative financial assetsFinance lease assets 117 137 31 29 48 29
Non-derivative financial liabilitiesFinance lease liabilities (117) (137) (31) (29) (48) (29)
28 February 2013
Non-derivative financial assets Finance lease assets 83 98 24 22 29 23
Non-derivative financial liabilities Finance lease liabilities (83) (98) (24) (22) (29) (23)
Exposure to interest rate riskAll finance leases are entered into on a back-to-back basis with financial institutions. The interest rate payable to financial institutions on the finance lease liability is equal to the rate being charged to the customer on the finance lease asset. These rates are automatically adjusted as and when the prime overdraft rate is amended. Accordingly the group does not have any exposure to interest rate risk as a result of these arrangements.
GROUP
R millions 20142013
(Restated)
5. NON-CURRENT RECEIVABLES AND OTHER ASSETSNon-current trade receivables 6 4Customer financial lease receivables 348 195Less: Short-term portion included in trade receivables (244) (128)Contract fulfilment costs 811 343
Opening balance 343 71Additions 854 430Terminations (26) (17)Expensed during the year* (360) (141)
921 414
* The amount expensed on contract fulfilment costs is included in EBITDA.
Customer financial lease receivablesCustomer financial lease receivables represent amounts due by customers in respect of the equipment component of airtime and data usage service contracts. The amounts due are receivable over the contract term.The interest rate inherent in the lease is nil.
The carrying amount of customer financial lease receivables represents the maximum credit exposure, Credit risk is solely concentrated in South Africa and is split between corporates, SMME’s and individual customers.
Contract fulfilment costsContract fulfilment costs include hardware, fitment, commissions and other costs directly attributable to the negotiation and conclusion of customer service contracts. These costs are expensed over the expected period of the customer service contract, which varies up to three years.

ALTRON Annual Financial Statements 2014 46
GROUP
R millions 20142013
(Restated)
6. DEFERRED TAXATION6.1 Deferred tax movement
Balance at the beginning of the year 22 (37)Recognised in profit or loss 6 65Charged directly in equity (1) 4Acquisitions of subsidiaries – 2Translation differences (1) (12)
Balance at the end of the year 26 22
6.2 Deferred tax balancesAttributable to the following temporary differences recognised at the normal tax rate in South Africa of 28% (2013: 28%) or the normal tax rate for foreign jurisdictions, unless otherwise indicated:Property, plant and equipment 182 149Intangible assets 101 76Construction work in progress (15) (8)Prepaid expenditure 10 16Receipts in advance (20) (14)Receivables (8) (6)Contract allowances 10 17Provisions, accruals and allowances (155) (124)Tax losses (156) (130)Investments and other – 40Share scheme recharge liabilities (19) (5)Unbilled receivables – 6Contract fulfilment costs 78 –Unbilled receivables 7 –Other 11 5
26 22
The above balance comprises:Deferred tax liabilities 176 141Deferred tax assets (150) (119)
26 22
Tax lossesEstimated tax losses available for set-off against future taxable income 1 078 1 160
Continuing operations 1 078 763Discontinued operations – 397
Applied to reduce deferred tax (continuing operations) (562) (459)
Unrecognised estimated tax losses 516 701
Continuing operations 516 304Discontinued operations – 397
NOTES TO THE FINANCIAL STATEMENTS continued
for the year ended 28 February 2014

ALTRON Annual Financial Statements 2014 47
GROUP
R millions 20142013
(Restated)
7. INVENTORIESRaw materials 855 760Work in progress 483 532Finished goods 1 279 1 065Merchandise 416 170Consumable stores 94 59
3 127 2 586Less: Inventories classified as held-for-sale (refer note 41) (11) –
3 116 2 586
Inventories carried at cost 2 496 2 247Inventories carried at net realisable value 620 339
3 116 2 586
Write-downs of inventories of R33 million (2013: R11 million) occurred in the group.
8. TRADE AND OTHER RECEIVABLES, INCLUDING DERIVATIVESGross trade receivables 4 615 3 779Less: Impairment allowance (169) (169)Less: Other allowances* (42) (38)Current portion of rental finance advances (note 4) 49 38Derivative assets at fair value: used for hedging 45 23Prepayments 122 83Deposits 21 25Revenue accrued on contracts not yet billed 34 48VAT receivable 45 17Customer financial lease receivables (note 5) 348 195Contract fulfilment costs (note 5) 811 343Autopage Cell captive receivable 20 45Other receivables 401 287Proceeds receivable on disposal of investment (note 38) 484 –Less: Receivables classified as held-for-sale (note 41) (58) –
6 726 4 676
Non-current (note 5) 921 414Current 5 805 4 262
6 726 4 676
* Other allowances comprise of credit note allowances and settlement discounts.

ALTRON Annual Financial Statements 2014 48
GROUP
R millions 20142013
(Restated)
8 TRADE AND OTHER RECEIVABLES, INCLUDING DERIVATIVES continuedExposure to credit riskTrade and other receivables represents the maximum credit exposure. The maximum exposure to credit risk at the reporting date was:
Trade and other receivables 5 383 3 847
The maximum exposure to credit risk for trade and other receivables at the reporting date by type of customer was:Parastatals/government 947 693Corporates 3 111 1 975SMMEs 726 715Individuals 599 464
5 383 3 847
The group generally deals with the larger corporates who have a sound credit standing. Collateral is generally not held for blue chip companies as their payment history does not require it, but collateral is obtained for other entities, or in certain cases credit risk insurance cover, as security where possible. Credit risk in respect of corporates and SMMEs is controlled through the use of credit vetting agencies and the setting of credit limits by experienced personnel. Credit limits are typically reviewed at least annually.R millions 2014 2013
South Africa 3 767 2 925Rest of Africa 939 297Europe 649 545Rest of world 28 80
5 383 3 847
Most of the receivables outside of South Africa are in respect of our international operations which are experienced in managing their own local credit risk. With regard to cross border trade, credit risk is managed through the use of letters of credit and credit insurance as considered necessary.
Impairment allowanceThe following table illustrates the relationship between aged debt and the impairment allowance.
2014 2014 2013 2013
R millions
Trade andother
receivablesImpairment
allowance
Trade andother
receivablesImpairment
allowance
Not past due 4 373 (4) 2 878 (9)Past due 0-30 days 592 (8) 348 (2)Past due 31-120 days 310 (16) 351 (27)Past due 121-365 days 169 (61) 307 (90)Past due 365+ days 108 (80) 132 (41)
5 552 (169) 4 016 (169)
Listings of overdue customer balances are reviewed monthly and reviewed against their credit terms/limits.
Customer financial lease receivables related to overdue customer balances are also included in the monthly review process.
Except under exceptional circumstances, customers exceeding their credit terms/limits must settle their overdue balances before any further credit is extended.
Appropriate action is taken to recover long overdue debts.
NOTES TO THE FINANCIAL STATEMENTS continued
for the year ended 28 February 2014

ALTRON Annual Financial Statements 2014 49
8 TRADE AND OTHER RECEIVABLES, INCLUDING DERIVATIVES continuedThe movement in the impairment allowance in respect of trade receivables during the year was as follows:
R millions 2014 2013
Balance at the beginning of the year 169 144Impairment loss recognised 43 37Acquisitions of operations – 7Disposals of operations (1) (4)Translation (16) 4Allowance utilised (26) (19)
Balance at the end of the year 169 169
Currency riskCurrency risk positions are reflected in note 30.
Derivative assets at fair valueDerivative assets at fair value include:Forward exchange contracts used for fair value hedging– Fair value hedge 45 23
45 23
Credit risk on derivative assetsThe group limits its exposure to credit risk by only entering into forward contracts with counterparties that have a sound credit rating. Given these high credit ratings, management does not expect any counterparty to fail to meet its obligations.
GROUP
R millions 20142013
restated
9. CASH AND CASH EQUIVALENTSCash at bank 1 147 962Cash floats 316 263Less: Cash at bank classified as held-for-sale (refer note 41) (52) –
1 411 1225Bank overdrafts (1 777) (385)
Net cash and cash equivalents per the statement of cash flows (366) 840
Credit riskThe group limits its credit risk exposure by investing only with financial institutions that have a sound credit rating.
Management monitors these financial institutions' ratings on an active basis.
Management does not expect any counterparty to fail to meet its obligations.
Interest riskInterest rate risk is monitored by management in light of the net cash position. Bank overdrafts and cash balances are subject to market related interest rates.
Currency riskCurrency risk positions are reflected in note 30.

ALTRON Annual Financial Statements 2014 50
10 SHARE CAPITAL AND PREMIUMGROUP AND COMPANY
2014Number
of shares
2013Number
of shares2014
R millions2013
R millions
10.1 AuthorisedOrdinary shares of 2 cents each 247 500 000 247 500 000 5 5Participating preference shares of 0,01 cent each 500 000 000 500 000 000 – –
5 5
10.2 Issued
Ordinary sharesIn issue 105 669 131 105 669 131 2 2
Less: Own shares acquired by subsidiary (3 246 469) (3 246 469)
Net ordinary shares 102 422 662 102 422 662
Participating preference sharesIn issue at the beginning of the year 241 848 047 241 381 356 – –Issued in terms of share schemes 619 408 466 691Issued in terms of scheme of arrangement with Altech's non-controlling shareholders 7 392 420 – – –
In issue at the end of the year 249 859 875 241 848 047 – –
Less: Own shares acquired by subsidiary (27 704 013) (27 704 013)
Net participating preference shares 222 155 862 214 144 034
Total number of shares in issue at the end of the year, net of own shares acquired 324 578 524 316 566 696
10.3 Share premiumBalance at the beginning of the year 2 252 2 242Share premium arising from the issue of shares in terms of share schemes 15 10Share premium arising from the scheme of arrangement with Altech's non-controlling shareholders 158 –
Balance at the end of the year 2 425 2 252
10.4 Total issued share capital and premium 2 427 2 254
10.5 Treasury sharesOrdinary and participating preference shares acquired by subsidiary at cost 299 299
NOTES TO THE FINANCIAL STATEMENTS continued
for the year ended 28 February 2014

ALTRON Annual Financial Statements 2014 51
2014Number of
shares
2013Number of
shares
10. SHARE CAPITAL AND PREMIUM continued10.6 Unissued
Ordinary sharesShares reserved for allocation under employee share schemes – –Shares under the control of the directors until the forthcoming annual general meeting 141 830 869 141 830 869
141 830 869 141 830 869
Participating preference sharesShares reserved to meet the requirements of:Conditional Rights Scheme 45 655 1 865 442Share Appreciation Rights 14 098 958 6 286 722Performance Share Awards 1 928 397 800 996Bonus Share Grants 2 805 148 1 821 409Shares reserved for allocation under employee share schemes 4 143 909 2 682 389Shares under the control of the directors until the forthcoming annual general meeting 227 118 058 244 694 995
250 140 125 258 151 953
Shares reserved for allocation under employee share schemes that were approved at a previous general meeting of the members are reflected in the table above.
Terms of equity sharesOrdinary sharesThe holders of ordinary shares are entitled to receive dividends as declared from time to time and are entitled to one vote per share at meetings of the company.
Participating preference sharesHolders of participating preference shares rank pari passu with the ordinary shares with regard to entitlement to dividends and the company's residual assets.
The shares have limited and diluted voting rights only in specific and limited circumstances.
Treasury sharesThe directors will seek to obtain a general authority to repurchase shares of the company not exceeding 5% of the company's ordinary and/or participating preference issued share capital in any one financial year at the next annual general meeting.

ALTRON Annual Financial Statements 2014 52
10. SHARE CAPITAL AND PREMIUM continued10.7 Employee share options – participating preference shares
Conditional Rights
Scheme
ShareAppreciation
Rights
PerformanceShare
Awards
BonusShare
Grants
Total share
options
Number of options allocated at 28 February 2012 3 030 297 5 188 441 742 538 1 553 698 10 514 974Number of options granted – 1 785 057 354 079 763 364 2 902 500Number of options lapsed/forfeited/reinstated (1 164 855) (686 776) (259 978) (139 490) (2 251 099)Number of options exercised – – (35 643) (356 163) (391 806)
Number of options allocated at 28 February 2013 1 865 442 6 286 722 800 996 1 821 409 10 774 569Number of options granted – 3 299 165 571 055 1 020 615 4 890 835Number of Altech options replaced with Altron options* – 6 069 271 1 111 208 589 683 7 770 162Number of options lapsed/forfeited/reinstated (1 779 787) (1 456 261) (402 844) (146 795) (3 785 687)Number of options exercised (40 000) (99 939) (152 018) (479 764) (771 721)
Number of options allocated at 28 February 2014 45 655 14 098 958 1 928 397 2 805 148 18 878 158
* On 19 August 2013, as part of the non-controlling interests bought out and delisting of Allied Technologies (Altech), all Altech options were replaced with Altron options at a rate of 2.22. The same terms of schemes as described below will apply to the converted options at the date of conversion.
Of the 771 721 (2013: 391 806) options exercised, 40 000 (2013: nil) relate to conditional rights exercised and 99 939 (2013: nil) relate to share appreciation rights. Conditional rights and share appreciation rights are net settled and as a result only 24 770 (2013: nil) shares were issued in satisfaction of those conditional rights and share appreciation rights. 37 082 options were exercised during the current financial year but will only be listed in the next financial year.
10.8 The Conditional Rights Scheme and the Altron 2009 Share PlanThe details of options outstanding at the financial year-end are as follows:
Date granted
Exerciseprice per
share
ConditionalRights
Scheme
ShareAppreciation
RightsPerformanceShare Awards
BonusShare
Grants
28 July 2008 R34.50 45 6551 December 2009 R21,50 1 133 74914 January 2011 R26,61 1 196 38613 July 2011 R25,86 10 34813 July 2011 R0,00 3 96728 November 2011 R0,00 247 30328 November 2011 R0,00 636 75128 November 2011 R21,50 1 723 00810 December 2012 R0,00 736 38810 December 2012 R0,00 325 44410 December 2012 R21,10 1 678 82516 August 2013 R20,26 3 230 15216 August 2013 R0,00 562 57816 August 2013 R0,00 1 007 605Altech options replaced with Altron options24 July 2009 R25,32 510 90029 September 2010 R25,68 754 25921 October 2011 R24,75 1 292 15121 October 2011 R0,00 156 18121 October 2011 R0,00 262 94730 January 2013 R17,94 2 569 18030 January 2013 R0,00 264 25630 January 2013 R0,00 530 125
45 655 14 098 958 1 928 397 2 805 148
NOTES TO THE FINANCIAL STATEMENTS continued
for the year ended 28 February 2014

ALTRON Annual Financial Statements 2014 53
10. SHARE CAPITAL AND PREMIUM continued10.8 The Conditional Rights Scheme and the Altron 2009 Share Plan continued
Terms of schemesThe Conditional Rights SchemeUnder the Conditional Rights Scheme, participants were granted rights to acquire shares subject to meeting future performance vesting conditions.
Vesting of Conditional Rights occurs in equal tranches over a three-year period commencing on the third anniversary of the granting of the Conditional Rights, subject to meeting the vesting conditions and conditional rights lapse six years after the grant date. This scheme is currently in run-off.
Altron 2009 Share PlanThe new share plan was approved by the shareholders in the general meeting on 11 May 2009. It comprises three elements as follows:
Share Appreciation RightsThese grant participants rights to acquire shares subject to meeting future performance vesting conditions. Vesting occurs in equal tranches over a three-year period commencing on the third anniversary of the grant, subject to meeting the vesting conditions. These rights lapse six years after the grant date.
Performance Share AwardsPerformance shares award participants with shares subject to meeting future performance vesting conditions. These rights vest and are exercised three years from the award date to the extent that the performance criteria have been met. Up to three times the number of rights may be awarded in shares. The full value of all the vested Performance shares will be settled to the participants in shares as the exercise price is Rnil per share.
Bonus Share GrantsThe Bonus Share Scheme is a three year scheme. The vesting period is three years from the initial date of the grant provided that the participants are still in the employ of the company. Participants receive a grant that matches, according to a specified ratio, a portion of the participants' annual performance bonus. The full value of the vested Bonus Shares will be settled to the participants in shares as the exercise price is Rnil per share.
Please refer to note 20.2 for more details of the options held by directors.
10.9 Share-based paymentsThe number and weighted average exercise prices of share options accounted for under IFRS 2 are as follows:
Weightedaverage
exercise priceRand2014
Numberof options
(000s)2014
Weightedaverage
exercise priceRand2013
Numberof options
(000s)2013
AltronOutstanding at the beginning of the year 23,17 10 775 17.97 10 515Altech options replaced with Altron options 16,91 7 770Options lapsed/forfeited/reinstated 25,67 (3 786) 24.87 (2 251)Exercised during the year 3,86 (772) – (392)Granted during the year 13,67 4 891 12.98 2 903
Outstanding at the end of the year 19,98 18 878 23.17 10 775
Exercisable at the end of the year 1 792 2 686
The weighted average market price on exercised options was R22,78 (2013: R21,11).Exercise prices on outstanding options at the end of the period ranged from Rnil to R34,50 (2013: Rnil to R36,10).The weighted average remaining period to vesting on outstanding options at the end of the period was 24 months (2013: 13 months).

ALTRON Annual Financial Statements 2014 54
10. SHARE CAPITAL AND PREMIUM continued10.9 Share-based payments
The fair value of services received in return for share options granted is measured by reference to the fair value of the share options granted. The estimate of the fair value of the services received is measured using the Black-Scholes Model for all options except for the performance share options which are valued using the Monte Carlo valuation model.
Up until 2007, options were assumed to be exercised midway between the vesting date and the expiry date. Subsequently, evidence indicated that most options are exercised on or shortly after the vesting date and the assumptions have been adjusted accordingly. There is no difference between the options granted to key management and senior employees.
Bonus and performance share awards vest entirely and are exercised after three years.
Fair value and assumptions of share options awarded during the yearFair value at grant date:
ShareAppreciation
RightsAltron
Bonus and Performance
SharesAltron
2014Fair value at grant date (Rand) 3,0 – 5,96 18,54
Share price (Rand) 20,26 20,26Exercise price (Rand) 20,26 –Expected volatility 26,08% – 30,28% 26,08%Option life (years) 3 – 5 3Dividend yield 2,96% 2,96%Risk-free interest rate 5,45% – 6,92% 5,45%
2013Fair value at grant date (Rand) 2,59 – 4,79 18,51
Share price (Rand) 21,10 21,10Exercise price (Rand) 21,10 –Expected volatility 18,78% – 29,09% 18,78%Option life (years) 3 – 5 3Dividend yield 4,36% 4,36%Risk-free interest rate 5,17% – 5,79% 5,17%
The expected volatility is based on the historic volatility over a similar period to the option life, adjusted for once-off events in the historic volatility and for any expected changes to future volatility due to publicly available information.
The share appreciation rights scheme includes both a service condition and a non-market performance condition. The performance share awards include a service condition, non-market performance and a market condition. The non-market performance conditions are not taken into account in the grant date fair value measurement of the service received. The market condition on the performance share awards is fair valued with reference to the expected mean total shareholder return performance.
Employee expensesGROUP
R millions 2014 2013
Equity-settled share schemes 33 22
Total expense recognised as employee costs (note 20.3) 33 22
NOTES TO THE FINANCIAL STATEMENTS continued
for the year ended 28 February 2014

ALTRON Annual Financial Statements 2014 55
GROUP
R millions 20142013
(Restated)
11 RESERVES11.1 Retained earnings 3 980 3 555
Are distributable and would be subject to the applicable taxation implications11.2 Foreign currency translation reserve 301 138
Comprises all foreign exchange differences arising from the translation of the financial statements of foreign operations
11.3 Premium/discount on non-controlling interest equity transactions (2 663) (1 214)Comprises the premium or discount on the subsequent purchase or sale of equity instruments in existing subsidiaries where there is no resulting change in control
11.4 Share-based payments reserve 140 125Comprises the net fair value of equity instruments granted to employees under share schemes expensed net of tax credits on deductible recharges in excess of expenses recognised
11.5 Statutory reserves 95 95Comprises the Capital Redemption Reserve funds as well as legal reserves of a foreign subsidiary
11.6 Fair value reserve 275 86Comprises the cumulative net change in the fair value of available-for-sale investments, net of deferred taxation, until the investment is derecognised. The change in the remeasurement of the defined benefit plan through other comprehensive income is also being recorded in this reserve
Total reserves 2 128 2 785
12 B-BBEE TRANSACTIONSThe group has entered into the following material B-BBEE transactions:
12.1 Powertech group – Aberdare Cables (Pty) Limited (Aberdare) – Izingwe Aberdare Cables Investments (Pty) Limited (Izingwe Aberdare Cables)In 2004 Powertech entered into an agreement with Izingwe Aberdare Cables to dispose of 30% of its equity interest and shareholders' loans in Aberdare. The purchase price was funded by redeemable preference shares issued to a financial institution. The financing arrangement includes certain put and call options to Altron and Powertech which only fall away when the preference shares have been fully repaid.
Although the rewards of ownership have fully vested in Izingwe Aberdare Cables, due to the requirements of the current accounting framework, the recognition of the disposal has been deferred in the financial statements until the obligation to repay the funding has been fully transferred to Izingwe. The funding obligation is consequently reflected as a liability of the group (refer note 14).
During previous financial years Powertech acquired a 16,7% equity interest in Izingwe Aberdare Cables for R6,3 million following the exit of two of the B-BBEE consortium shareholders (refer to Annexure 1). A diluted earnings adjustment of R3 million (2013: Rnil) and a diluted headline earnings adjustment of R2 million (2013: Rnil) have been calculated based on the recognition of the net 25% (83,3% of 30%) non-controlling interest with settlement of the outstanding purchase price of R17 million (comprising the empowerment funding obligation) adjusted for the dilutive effect of the option price at the Aberdare level (refer to note 26.5).
12.2 Powertech group – Powertech SA (Pty) Limited (Powertech SA) – Izingwe Investment Holdings (Pty) Limited (Izingwe)Following the acquisition of IST by the Powertech group, the business of IST was sold to Powertech SA with the full purchase price being funded by borrowings. Izingwe acquired 25,1% of Powertech SA for an amount equal to the net asset value at that date. This 25,1% non-controlling interest has been fully recognised as there are no conditional terms to their ownership of the shares. When Powertech SA incurred losses in previous years there was no attribution of the cumulative loss to the non-controlling interest prior to the 2011 financial year.
ALTRON Annual Financial Statements 2014 56
12 B-BBEE TRANSACTIONS continued12.3 Powertech group – Powertech Transformers (Pty) Limited (Powertech Transformers) – Power Matla (Pty)
Limited (Power Matla)Power Matla previously owned a 25,1% stake in Desta Power Matla (Pty) Limited with the remaining 74,9% being owned by Powertech Transformers. Following Powertech's acquisition of the 50% shares in Powertech Transformers previously owned by ABB, Power Matla moved their shareholding up to the Powertech Transformers level.
Effective 1 March 2009, Power Matla swapped its 25,1% stake in Desta Power Matla for a 16,77% stake in Powertech Transformers, based on market valuations of both entities.
At the same time, Power Matla acquired a further 3,23% stake in Powertech Transformers for R25 million, thereby increasing their stake to 20%. Since the transactions were completed at fair value and settled in cash, no IFRS 2 charge arose and the transaction and the relevant non-controlling interests have been recognised.
12.4 Bytes group – Bytes Technology Group South Africa (Pty) Limited (Bytes SA) – Kagiso Strategic Investments (Pty) Limited (Kagiso)In 2004 Bytes entered into an agreement with Kagiso to dispose of 5% of its equity interest in Bytes SA for a cash consideration fully funded by Kagiso and granted an option to Kagiso to acquire a further 22% equity interest in Bytes SA for R198 million. On 1 July 2009, Kagiso exercised its option over the 22% equity interest, following which Bytes SA performed a capital reduction of R198 million. This reduced the funding obligation associated with the exercise to R154 million, which was met through the issue of perpetual, non-cumulative preference shares to a financial institution, secured by a put option provided by Altron to the financial institution.
During the financial year the preference shares were redeemed in full and so the put option provided by Altron was cancelled. After the balance sheet date agreement was reached with Kagiso for the repurchase of their full 27% stake.
12.5 Altech group – Altech Netstar Group (Pty) Limited – Thebe Investment Corporation (Pty) Limited and Identity Capital Partners (Pty) LimitedIn December 2010 the Altech group entered into an empowerment transaction where Thebe Investment Corporation (Pty) Limited and Identity Capital Partners (Pty) Limited acquired a 25% plus 1 share shareholding in the Altech Netstar Group. This 25,1% non-controlling interest has been fully recognised as there are no conditional terms to their ownership of the shares.
As part of the vendor funding arrangement Altech Netstar declared a dividend equal to the fair value of the Netstar businesses to Altech. As a result the B-BBEE partners paid no consideration for the 25,1% stake, however the entity in which they invested had negative equity amounting to R1,38 billion. In line with group accounting policies and IAS 27, this resulted in a premium on non-controlling interest which was recognised directly in equity.
12.6 Altech group – Altech Radio Holdings (Pty) Limited – Southern Palace Group of Companies (Pty) LimitedThe Altech group entered into an empowerment transaction where the Southern Palace Group of Companies (Pty) Limited acquired a 25% plus 1 share shareholding in Altech Radio Holdings (Pty) Limited, the holding company for Altech Alcom Motomo (Pty) Limited, Altech Alcom Radio Distributors (Pty) Limited and Altech Fleetcall (Pty) Limited, effective 1 March 2011.
This 25,1% non-controlling interest has been fully recognised as there are no conditional terms to their ownership of the shares.
NOTES TO THE FINANCIAL STATEMENTS continued
for the year ended 28 February 2014
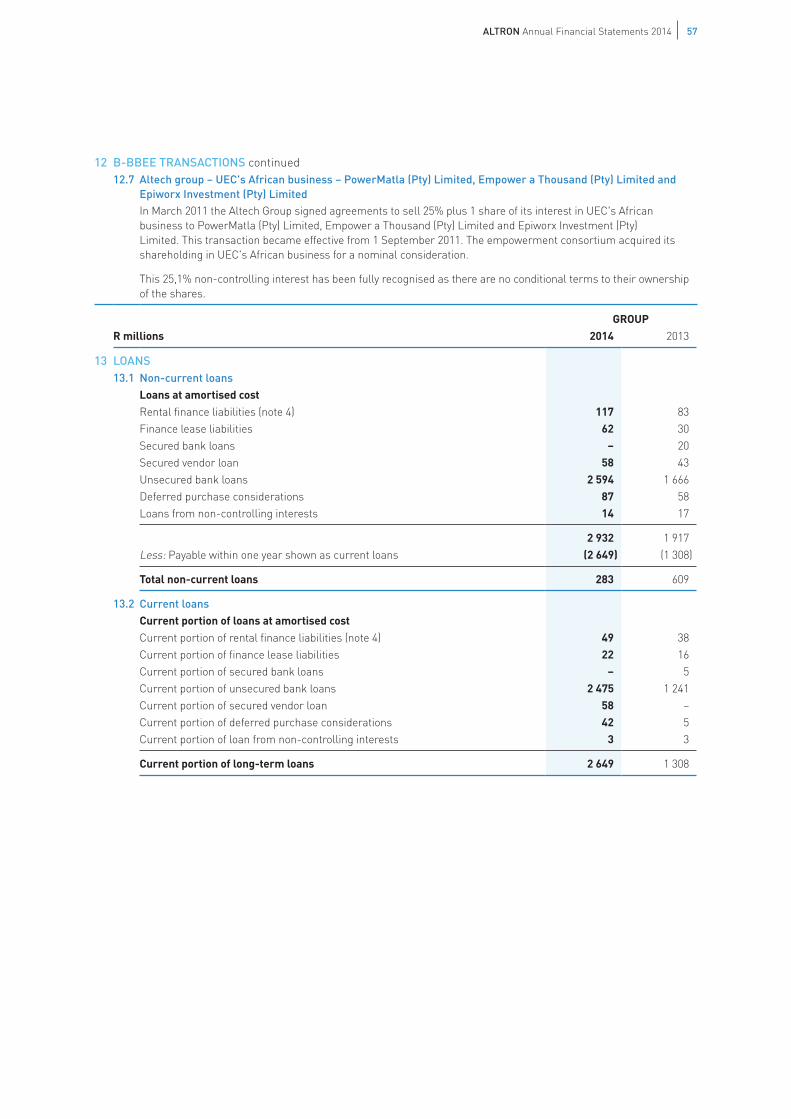
ALTRON Annual Financial Statements 2014 57
12 B-BBEE TRANSACTIONS continued12.7 Altech group – UEC's African business – PowerMatla (Pty) Limited, Empower a Thousand (Pty) Limited and
Epiworx Investment (Pty) LimitedIn March 2011 the Altech Group signed agreements to sell 25% plus 1 share of its interest in UEC's African business to PowerMatla (Pty) Limited, Empower a Thousand (Pty) Limited and Epiworx Investment (Pty) Limited. This transaction became effective from 1 September 2011. The empowerment consortium acquired its shareholding in UEC's African business for a nominal consideration.
This 25,1% non-controlling interest has been fully recognised as there are no conditional terms to their ownership of the shares.
GROUPR millions 2014 2013
13 LOANS13.1 Non-current loans
Loans at amortised costRental finance liabilities (note 4) 117 83Finance lease liabilities 62 30Secured bank loans – 20Secured vendor loan 58 43Unsecured bank loans 2 594 1 666Deferred purchase considerations 87 58Loans from non-controlling interests 14 17
2 932 1 917Less: Payable within one year shown as current loans (2 649) (1 308)
Total non-current loans 283 609
13.2 Current loansCurrent portion of loans at amortised costCurrent portion of rental finance liabilities (note 4) 49 38Current portion of finance lease liabilities 22 16Current portion of secured bank loans – 5Current portion of unsecured bank loans 2 475 1 241Current portion of secured vendor loan 58 –Current portion of deferred purchase considerations 42 5Current portion of loan from non-controlling interests 3 3
Current portion of long-term loans 2 649 1 308
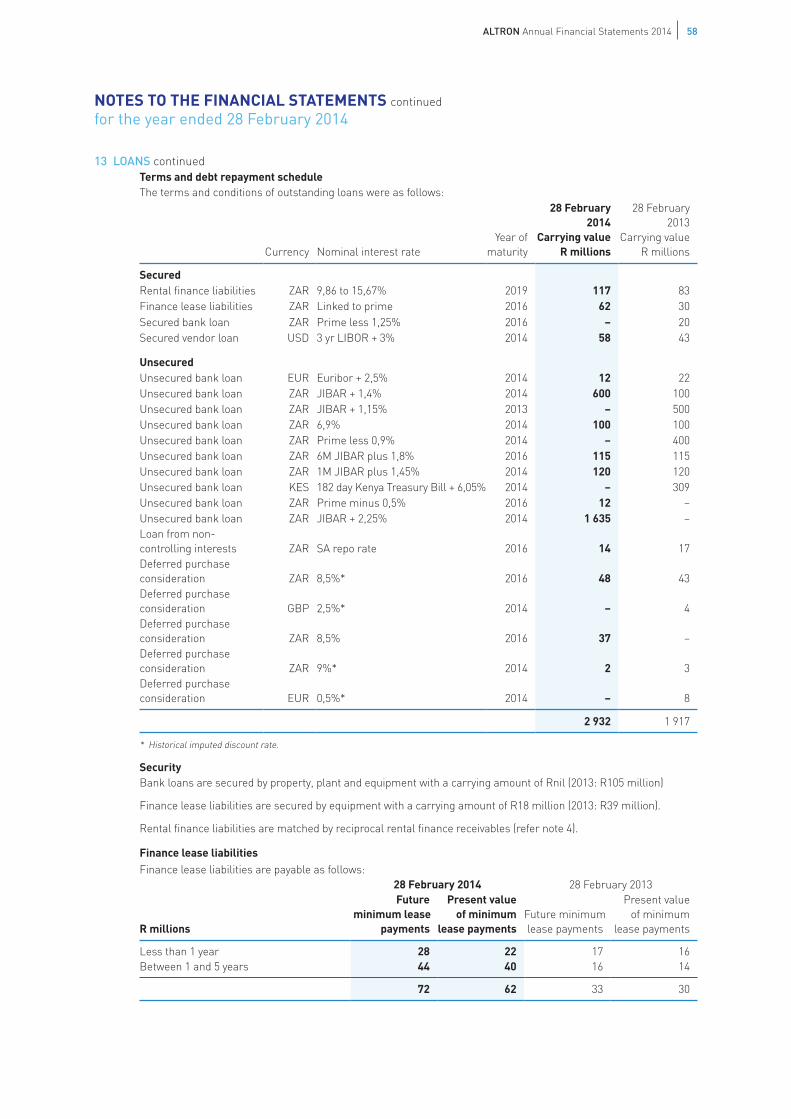
ALTRON Annual Financial Statements 2014 58
13 LOANS continuedTerms and debt repayment scheduleThe terms and conditions of outstanding loans were as follows:
Currency Nominal interest rateYear of
maturity
28 February2014
Carrying valueR millions
28 February2013
Carrying valueR millions
SecuredRental finance liabilities ZAR 9,86 to 15,67% 2019 117 83Finance lease liabilities ZAR Linked to prime 2016 62 30Secured bank loan ZAR Prime less 1,25% 2016 – 20Secured vendor loan USD 3 yr LIBOR + 3% 2014 58 43
UnsecuredUnsecured bank loan EUR Euribor + 2,5% 2014 12 22Unsecured bank loan ZAR JIBAR + 1,4% 2014 600 100Unsecured bank loan ZAR JIBAR + 1,15% 2013 – 500Unsecured bank loan ZAR 6,9% 2014 100 100Unsecured bank loan ZAR Prime less 0,9% 2014 – 400Unsecured bank loan ZAR 6M JIBAR plus 1,8% 2016 115 115Unsecured bank loan ZAR 1M JIBAR plus 1,45% 2014 120 120Unsecured bank loan KES 182 day Kenya Treasury Bill + 6,05% 2014 – 309Unsecured bank loan ZAR Prime minus 0,5% 2016 12 –Unsecured bank loan ZAR JIBAR + 2,25% 2014 1 635 –Loan from non-controlling interests ZAR SA repo rate 2016 14 17Deferred purchase consideration ZAR 8,5%* 2016 48 43Deferred purchase consideration GBP 2,5%* 2014 – 4Deferred purchase consideration ZAR 8,5% 2016 37 –Deferred purchase consideration ZAR 9%* 2014 2 3Deferred purchase consideration EUR 0,5%* 2014 – 8
2 932 1 917
* Historical imputed discount rate.
SecurityBank loans are secured by property, plant and equipment with a carrying amount of Rnil (2013: R105 million)
Finance lease liabilities are secured by equipment with a carrying amount of R18 million (2013: R39 million).
Rental finance liabilities are matched by reciprocal rental finance receivables (refer note 4).
Finance lease liabilitiesFinance lease liabilities are payable as follows:
28 February 2014 28 February 2013
R millions
Future minimum lease
payments
Present valueof minimum
lease paymentsFuture minimumlease payments
Present valueof minimum
lease payments
Less than 1 year 28 22 17 16Between 1 and 5 years 44 40 16 14
72 62 33 30
NOTES TO THE FINANCIAL STATEMENTS continued
for the year ended 28 February 2014

ALTRON Annual Financial Statements 2014 59
13 LOANS continuedLiquidity riskThe following are the contractual maturities of financial liabilities, including interest payments and excluding the impact of netting agreements:
28 February 2014Non-derivative financial liabilitiesR millions Currency
Carryingamount
Contrac-tual
cashflows
6 months
or less6 – 12
months1 – 2
years2 – 5
years
More than
5 years
Rental finance liabilities ZAR 117 137 31 29 48 29 –Finance lease liabilities ZAR 62 72 15 13 16 28 –Secured vendor loan USD 58 60 60 – – – –Unsecured bank loan EUR 12 12 12 – – – –Unsecured bank loan ZAR 600 601 601 – – – –Unsecured bank loan ZAR 100 107 107 – – – –Unsecured bank loan ZAR 12 13 5 4 4 – –Unsecured bank loan ZAR 115 119 – – 119 – –Unsecured bank loan ZAR 120 120 120 – – – –Unsecured bank loan ZAR 1 635 1 642 1 642 – – – –Loan from non-controlling interests ZAR 14 6 2 1 3 – –Deferred purchase consideration ZAR 48 50 35 – 13 2 –Deferred purchase consideration ZAR 37 42 7 – 17 18 –Deferred purchase consideration ZAR 2 2 1 – 1 – –
2 932 2 983 2 638 47 221 77 –
28 February 2013Non-derivative financial liabilities
Rental finance liabilities ZAR 83 98 24 22 29 23 –Finance lease liabilities ZAR 30 33 9 8 11 5 –Secured bank loan ZAR 20 22 3 3 12 4 –Secured vendor loan USD 43 51 – – 51 – –Unsecured bank loan EUR 22 22 22 – – – –Unsecured bank loan ZAR 100 104 2 102 – – –Unsecured bank loan ZAR 500 516 8 508 – – –Unsecured bank loan ZAR 100 103 103 – – – –Unsecured bank loan ZAR 400 430 15 415 – – –Unsecured bank loan ZAR 115 136 4 4 8 120 –Unsecured bank loan ZAR 120 128 4 124 – – –Unsecured bank loan KES 309 366 7 25 334 – –Loan from non-controlling interests ZAR 17 9 2 1 3 3 –Deferred purchase consideration ZAR 43 49 – – 34 13 2Deferred purchase consideration GBP 4 4 4 – – – –Deferred purchase consideration ZAR 3 3 – 1 1 1 –Deferred purchase consideration EUR 8 9 – – 9 – –
1 917 2 083 207 1 213 492 169 2

ALTRON Annual Financial Statements 2014 60
13 LOANS continuedInterest rate riskProfileAt the balance sheet date the interest rate profile of the group's interest-bearing loans was:
Carrying amountR millions 2014 2013
Variable-rate instruments – Financial liabilitiesZAR 2 675 1 385EUR 12 22KES – 309
2 687 1 716
Cash flow sensitivity analysis for variable-rate instrumentsA change of 100 basis points in interest rates at the reporting date would have increased/(decreased) profit or loss and equity by the amounts shown below for a period of one year compounded monthly. This analysis assumes that all other variables, in particular foreign currency rates, remain constant. The analysis is performed on the same basis for 2013.
Profit or loss and equity
R millions100 bp
increase100 bp
decrease
28 February 2014Variable-rate loans (27) 27
28 February 2013Variable-rate loans (17) 17
Currency riskThe principal and interest on certain borrowings is denominated in Euros that match the functional currencies of the underlying operations of the group. Accordingly currency risk does not arise from these financial instruments.
Currency risk positions on borrowings that do not match the functional currencies of the underlying operations of the group, are reflected in note 30.
R millions 2014 2013
Borrowing facilitiesIn terms of the articles of association, the borrowing powers of the group are unlimited.Unutilised banking facilities 1 616 1 858
NOTES TO THE FINANCIAL STATEMENTS continued
for the year ended 28 February 2014

ALTRON Annual Financial Statements 2014 61
R millions 2014 2013
14 EMPOWERMENT FUNDING OBLIGATIONAt amortised costOpening balance 46 71Interest accrued 3 5Repayments (32) (30)
17 46Current portion (17) (29)
– 17
Liquidity riskThe following are the contractual maturities of the empowerment funding obligation liability, including interest payments and excluding the impact of netting agreements:
R millions CurrencyCarryingamount
Contrac-tual cash
flows6 months
or less6 – 12
months1 – 2
years2 – 5
years
More than
5 years
28 February 2014 Rand 17 17 17 – – – –
28 February 2013 Rand 46 49 16 16 17 – –
Interest rate riskThe dividends on the preference shares bear an indicative dividend rate of 10,57% (2013: 10,57%). This interest rate has been fixed for the period of the funding and is not subject to variation as market rates alter.
R millionsOnerous
contracts
Retrenchments and
restructuring costs
Warrantiesand
faultrectification
Post retirementmedical aid
benefits Total
15 PROVISIONSNon-current provisions – – 22 3 25Current portion included in current liabilities 21 20 59 – 100
Total provisions at 28 February 2013 21 20 81 3 125
Provisions raised during the year – – 38 – 38Translation 1 – – – 1Provisions utilised/released during the year (12) (20) (37) – (69)
Total provisions at 28 February 2014 10 – 82 3 95
Non-current provisions – – 33 3 36Current provisions included in current liabilities 10 – 49 – 59
10 – 82 3 95
Refer to accounting policies for a description of provisions.

ALTRON Annual Financial Statements 2014 62
R millions 20142013
(Restated)
16 TRADE AND OTHER PAYABLES, INCLUDING DERIVATIVESTrade payables 5 265 4 363Derivative liability at fair value: used for hedging 36 25Payroll liabilities 239 165Vat accrual 40 41Receipts in advance 593 473Deferred income 282 –Less: Trade and other payables, including derivatives, classified as held-for-sale (refer note 41) (81) –
6 374 5 067
(a) Trade payablesManagement of liquidity risk:The group has negotiated favourable credit terms with suppliers, which enables the group to utilise its operating cashflow to full effect. The suppliers age analysis is reviewed by management on a regular basis to ensure that credit terms are adhered to and suppliers are paid when due.
The group utilises multiple credit terms, most of which are less than one year.
Currency riskMost amounts owed in foreign currency are covered by foreign exchange contracts (refer to note 30).
Interest rate riskThe group has no material exposure to interest rate risk as most suppliers do not charge interest.
(b) Receipts in advanceRevenue on receipts in advance is recognised as and when the goods are delivered or the services are rendered. Until the revenue recognition criteria are met these amounts remain payable to the respective customers.
Estimate of when revenues are expected to be earned on these receiptsR millions
Carryingamounts
6 monthsor less 6 – 12 months 1 – 2 years 2 – 5 years
28 February 2014 593 492 44 51 6
28 February 2013 473 356 64 39 14
R millions 2014 2013
(c) Derivative liability at fair valueDerivative liability at fair value includes:Forward exchange contracts used for fair value hedging 36 22Kick into forward contracts – 2Commodity forward contracts – 1
36 25
17 RETIREMENT BENEFIT PLANSDefined contribution plansThe majority of the group's employees are members of the Altron Group Pension Fund, which is a defined contribution fund and is governed by the Pension Funds Act, 1956, as amended. The contribution rate of the employers is 10% (2013: 10%), calculated on the pensionable emoluments of members.
Additionally the group provides retirement benefits for certain of its employees through the Altron Group Provident Fund. The fund is a defined contribution fund and is governed by the Pension Funds Act, 1956, as amended. Contributions to the fund comprise between 7% and 20% of pensionable emoluments.
The group's contribution to these funds amounted to R231 million (2013: R203 million).
NOTES TO THE FINANCIAL STATEMENTS continued
for the year ended 28 February 2014

ALTRON Annual Financial Statements 2014 63
17 RETIREMENT BENEFIT PLANS continuedMulti-employer plansPost acquisition of various subsidiaries, certain employees remained members of their previous funds. A number of these are defined benefit plans. These industry managed retirement benefit schemes are dealt with as defined contribution plans as the group's obligations under the schemes are equivalent to those arising in a defined contribution plan. The group's contribution to these other funds amounted to R27 million (2013: R26 million).
Defined benefit plansThe benefit plans disclosed below are only in respect of members with minimum entitlement benefits and retirees with purchased defined benefit pensions.
R millions 2014 2013
Total employee benefit asset 4 398 3 899
Total employee benefit liability 4 109 3 833
For details on the related employee benefit expenses, see note 20.3
Members of the Altron Group Pension Fund who were members prior to 1 September 1996 are entitled to a minimum benefit equal to the previously provided defined benefit pension. Furthermore, upon retirement, any member of the Altron Group Pension Fund can purchase a pension from the fund, though this option has now been closed to new employees joining the group after 31 May 2014. The base pension and subsequent increases granted, based on weighted average investment returns on funds, are guaranteed by the pension fund.
All employees with a defined benefit underpin who retire in the fund have their share of fund topped up (if necessary) at the time of retirement to enable them to purchase a pension in the fund equal to 1/45th of the average of the final two year's salary for each year of service rendered by the employee. All employees are treated identically.
The defined benefit plan is administered by a single pension fund that is legally separated from the group. The board of the pension fund comprises three employee, one pensioner and four employer representatives. The board of the pension fund is required by law to act in the best interests of the plan participants and is responsible for setting certain policies (e.g. investment, contribution and indexation policies) of the fund.
This defined benefit plan exposes the group to actuarial risks, such as longevity risk, currency risk, interest rate risk and market (investment) risk.
FundingThe defined benefit plans are fully funded by the group's subsidiaries and members as discussed above. The funding requirements are based on the pension fund’s actuarial measurement framework set out in its funding policies. The funding is based on a separate actuarial valuation for funding purposes for which the assumptions may differ from the assumptions below. The defined benefit component relating to the active members is funded by the employers through a guarantee reserve that resides in the fund. Under the latest IAS 19 valuation this reserve is fully funded on a total service cost basis and has a surplus of R180 million. The defined benefit component relating to the pensioners is also fully funded and retains an investment reserve in order to manage volatility in its investment returns.
The group expects to pay R43 million in contributions to its defined benefit plan in the next financial year.
R millions 20142013
(Restated)
17.1 Value of obligationsFair value of plan assets 4 398 3 899Present value of funded obligations (4 109) (3 833)
Surplus 289 66Amount not recognised due to asset ceiling limitation (109) (66)
Defined benefit asset recognised at the end of the year 180 –
17.2 Components of current year expenseCurrent service cost (53) (69)Interest cost (287) (292)Interest income on plan assets 287 284
(53) (77)

ALTRON Annual Financial Statements 2014 64
R millions 20142013
Restated
17 RETIREMENT BENEFIT PLANS continued17.3 Amounts recognised in other comprehensive income are as follows
Net cumulative amount at the beginning of the year 19 –Actuarial gain on plan assets 439 354Actuarial losses on liabilities (204) (324)Effect of asset ceiling limit (43) (11)
Net cumulative amount at the end of the year 211 19
17.4 Reconciliation of defined benefit obligationPresent value of defined benefit obligation at the beginning of the year 3 833 3 357Current service cost 53 69Interest cost 287 292Benefits paid (293) (228)Employee contributions to defined contribution fund credits subject to defined benefit underpin 10 11Transfers from defined contribution fund 15 8Actuarial loss 204 324
– Actuarial (gain)/loss arising on financial assumptions (30) 52– Actuarial loss – other 234 272
Present value of defined benefit obligation at the end of the year 4 109 3 833
17.5 Reconciliation of fair value of plan assetsAssets at market value at the beginning of the year 3 899 3 427Interest income on plan assets 287 284Contributions paid 51 54Benefits paid (293) (228)Transfers from defined contribution fund 15 8Actuarial gain 439 354
Assets at market value at the end of the year 4 398 3 899
Plan assetsPlan assets comprise: % %Equities:– Local 35,1 37,2– International 23,1 18,1Fixed interest– Local 23,5 27,1– International 4,6 4,5Property 3,5 4,3Collective investments:– Local 9,3 8,8Cash and other 0,9 –
NOTES TO THE FINANCIAL STATEMENTS continued
for the year ended 28 February 2014

ALTRON Annual Financial Statements 2014 65
17 RETIREMENT BENEFIT PLANS continued17.5 Reconciliation of fair value of plan assets continued
All equity securities and government bonds have quoted prices in active markets.
The board of trustees, in conjunction with the pension fund's investment advisor, operate the investments of the fund under an investment strategy that is aligned to the liabilities of the fund and is used to determine a strategic asset allocation. The investments are managed within defined rebalancing bands in accordance with that strategic asset allocation.
Defined benefit obligationActuarial assumptionsThe following were the principal actuarial assumptions at the reporting date (expressed as weighted averages).
2014%
2013%
Discount rate 9,2 7,7Future salary growth 7,0 6,0Future pension growth 4,0 2,57
At 28 February 2014, the weighted-average duration of the defined benefit obligation was 14.5 years (2013: 17.5 years).
Sensitivity analysisReasonably possible changes at the reporting date to one of the relevant actuarial assumptions, holding other assumptions constant, would have affected the defined benefit asset recognised by the amounts shown below.
2014Defined benefit
asset recognisedR millions Increase Decrease
28 February 2014Discount rate (1% movement) 106 (180)Salary increase (1% movement) (75) 55Pension increase (1% movement) (92) 64
Although the analysis does not take account of the full distribution of cash flows expected under the plan, it does provide an approximation of the sensitivity of the assumptions shown.
18 DEFERRED INCOMEDeferred income consisted of the unconditional proceeds arising from contractual indefeasible rights of use (IRU’s) of specified data capacity on cable networks previously owned by the group that were granted to third parties for a specified term. Deferred income has a Rnil balance in the current year (2013: Rnil).
R millions 20142013
(Restated)
19 REVENUEGoods sold 18 958 16 107Services rendered 8 752 8 569Rental finance income 62 68
27 772 24 744
Continuing operations 27 772 24 464Discontinued operations – 280
27 772 24 744

ALTRON Annual Financial Statements 2014 66
GROUP
R millions 20142013
(Restated)
20 OPERATING PROFIT BEFORE CAPITAL ITEMS20.1 Auditors' remuneration
Audit fees 31 30Fees for other services 2 3
33 33
20.2 Directors' and prescribed officers' remunerationNon-executive directors
2014R’000
2013R’000
Subsidiaries Altron Total Total
Fees for services as directorsN Adami – 283 283 255MC Berzack 200 396 596 378PMO Curle* – – – 733G Gelink** 105 431 536 349MJ Leeming 104 592 696 587S Mabaso-Koyana+ – 89 89 –Dr PM Maduna – 291 291 253B Masekela*** – – – 91JRD Modise – 399 399 344D Mokhobo – 293 293 202R Ntuli+ – 68 68 –SN Susman – 365 365 232Dr WP Venter (Chairman)# 217 3 597 3 814 4 194PL Wilmot**** – – – 215
626 6 804 7 430 7 833
# Fee inclusive of all board and sub-committee roles throughout the group* Emoluments from Altech for full time executive role from 21 July 2011 to 19 May 2012 – retired 19 May 2012** Appointed on 1 June 2012*** Retired 2 October 2012**** Retired 20 July 2012+ Appointed on 8 October 2013
NOTES TO THE FINANCIAL STATEMENTS continued
for the year ended 28 February 2014

ALTRON Annual Financial Statements 2014 67
20 OPERATING PROFIT BEFORE CAPITAL ITEMS continued
R millionsGuaranteed
pay
Definedcontribution
pensionpayments
Performancerelated
bonuses(Accrued)
Shareoption
expense2014Total
20.2 Directors' and prescribed officers' remuneration continuedFull time directorsExecutiveRE Venter 6 695 942 7 600 2 496 17 733AMR Smith 2 950 460 2 956 913 7 279CG Venter 5 820 725 5 529 2 061 14 135RJ Abraham 3 303 826 4 297 1 397 9 823
18 768 2 953 20 382 6 867 48 970
R millionsGuaranteed
pay
Definedcontribution
pensionpayments
Performancerelated
bonuses(Accrued)
Shareoption
expense2013Total
Full-time directorsExecutiveRE Venter 6 695 942 1 203 2 324 11 164AMR Smith 2 772 433 519 798 4 522CG Venter 5 479 691 – 1 565 7 735N Claussen+ 1 006 151 – – 1 157RJ Abraham 3 028 757 1 160 990 5 935
18 980 2 974 2 882 5 677 30 513
# – IFRS 2 profit and loss expense in respect of options granted to directors+ Resigned effective 30 June 2012
R millionsGuaranteed
Pay
Definedcontribution
pensionpayments
Performancerelated
bonuses(Accrued)
Shareoption
expense2014Total
Prescribed officersNM Kayton 3 001 327 599 655 4 582AG Johnston 2 131 315 1 756 543 4 745W Oosthuysen* 1 889 153 2 138 318 4 498
7 021 795 4 493 1 516 13 825
* Appointed 1 August 2013
R millionsGuaranteed
Pay
DefinedContribution
PensionPayments
Performancerelated
bonuses(Accrued)
Shareoption
expense2013Total
Prescribed officersNM Kayton** 1 942 191 267 281 2 681AG Johnston 2 073 303 321 435 3 132
4 015 494 588 716 5 813
** Appointed 1 July 2012

ALTRON Annual Financial Statements 2014 68
20 OPERATING PROFIT BEFORE CAPITAL ITEMS continued20.2 Directors' and prescribed officers' remuneration continued
Directors' options Entity
Allocationdate
Strikeprice
Balance01/03/2013
Converted/awarded Lapsed Exercised
Exercisedate
Netgains
R'000sExercise
priceBalance
28/02/2014Expiry
date
CG Venter Altech CRI 20/02/2008 49,00 41 829 41 829 – Feb-14Altech SAR 24/07/2009 56,20 24 652 (21 570) 3 082 – Jul-15Altron SAR 19/08/2013 25,32 – 47 886 47 886 Jul-15Altech SAR 1/11/2010 57,00 30 078 (26 736) 3 342 – Nov-16Altron SAR 19/08/2013 25,68 – 59 354 59 354 Nov-16Altech PS 1/11/2010 n/a 22 057 (22 057) – Nov-13Altron PS 19/08/2013 n/a – 48 967 34 279 14 688 9/10/2013 338 23,00 – Nov-13Altech BS 1/11/2010 n/a 11 612 (11 612) – Nov-13Altron BS 19/08/2013 n/a – 25 779 25 779 9/10/2013 593 23,00 – Nov-13Altech SAR 18/11/2011 55,00 33 665 (33 665) – Nov-17Altron SAR 19/08/2013 24,75 – 74 736 74 736 Nov-17Altech PS 18/11/2011 n/a 24 688 (24 688) – Nov-14Altron PS 19/08/2013 n/a – 54 807 54 807 Nov-14Altech BS 18/11/2011 n/a 9 545 (9 545) – Nov-14Altron BS 19/08/2013 n/a – 21 190 21 190 Nov-14Altech SAR 22/02/2013 39,83 46 487 (46 487) – Feb-19Altron SAR 19/08/2013 17,94 – 103 202 103 202 Feb-19Altech PS 22/02/2013 n/a 34 091 (34 091) – Feb-16Altron PS 19/08/2013 n/a – 75 682 75 682 Feb-16Altech BS 22/02/2013 n/a 12 087 (12 087) – Feb-16Altron BS 19/08/2013 n/a – 26 833 26 833 Feb-16Altron SAR 19/08/2013 20,26 72 870 72 870 Aug-19Altron PS 19/08/2013 n/a 53 860 53 860 Aug-16Altron BS 19/08/2013 n/a 24 543 24 543 Aug-16
AMR Smith Altron CRI 26/02/2008 35,00 21 846 21 846 – Feb-14Altron SAR 02/12/2009 25,50 20 588 2 574 18 014 Dec-15Altron SAR 14/01/2011 26,61 23 861 2 649 21 212 Jan-17Altron PS 14/01/2011 n/a 17 636 8 818 8 818 15/01/2014 209 23,70 – Jan-14Altron BS 14/01/2011 n/a 7 876 7 876 15/01/2014 187 23,70 – Jan-14Altron SAR 2/12/2011 21,50 31 895 31 895 Dec-17Altron PS 2/12/2011 n/a 23 574 23 574 Dec-14Altron BS 2/12/2011 n/a 10 389 10 389 Dec-14Altron SAR 12/12/2012 21,10 34 937 34 937 Dec-18Altron PS 12/12/2012 n/a 25 823 25 823 Dec-15Altron BS 12/12/2012 n/a 7 096 7 096 Dec-15Altron SAR 19/08/2013 20,26 37 841 37 841 Aug-19Altron PS 19/08/2013 n/a 27 969 27 969 Aug-16Altron BS 19/08/2013 n/a 7 945 7 945 Aug-16
NOTES TO THE FINANCIAL STATEMENTS continued
for the year ended 28 February 2014

ALTRON Annual Financial Statements 2014 69
20 OPERATING PROFIT BEFORE CAPITAL ITEMS continued20.2 Directors' and prescribed officers' remuneration continued
Directors' options Entity
Allocationdate
Strikeprice
Balance01/03/2013
Converted/awarded Lapsed Exercised
Exercisedate
Netgains
R'000sExercise
priceBalance
28/02/2014Expiry
date
RE Venter Altron CRI 25/02/2008 35,00 254 346 254 346 – Feb-14Altron SAR 02/12/2009 25,50 49 078 6 135 42 943 Dec-15Altron SAR 14/01/2011 26,61 57 672 6 402 51 270 Jan-17Altron PS 14/01/2011 n/a 50 150 25 075 25 075 15/01/2014 594 23,70 – Jan-14Altron BS 14/01/2011 n/a 21 904 21 904 15/01/2014 519 23,70 – Jan-14Altron SAR 02/12/2011 21,50 77 090 77 090 Dec-17Altron PS 02/12/2011 n/a 67 034 67 034 Dec-14Altron BS 02/12/2011 n/a 29 295 29 295 Dec-14Altron SAR 12/12/2012 21,10 83 242 83 242 Dec-18Altron PS 12/12/2012 n/a 72 385 72 385 Dec-15Altron BS 12/12/2012 n/a 21 317 21 317 Dec-15Altron SAR 19/08/2013 20,26 86 694 86 694 Aug-19Altron PS 19/08/2013 n/a 75 386 75 386 Aug-16Altron BS 19/08/2013 n/a 18 404 18 404 Aug-16
RJ AbrahamAltron CRI 27/02/2008 35,00 97 225 97 225 – Feb-14Altron SAR 02/12/2009 25,50 22 021 22 021 Dec-15Altron SAR 14/01/2011 26,61 26 794 26 794 Jan-17Altron PS 14/01/2011 n/a 11 650 5 825 5 825 15/01/2014 138 23,70 – Jan-14Altron BS 14/01/2011 n/a 9 700 9 700 15/01/2014 230 23,70 – Jan-14Altron SAR 02/12/2011 21,50 36 811 36 811 Dec-17Altron PS 02/12/2011 n/a 27 208 27 208 Dec-14Altron BS 02/12/2011 n/a 31 268 31 268 Dec-14Altron SAR 12/12/2012 21,10 41 259 41 259 Dec-18Altron PS 12/12/2012 n/a 30 496 30 496 Dec-15Altron BS 12/12/2012 n/a 49 594 49 594 Dec-15Altron SAR 19/08/2013 20,26 45 458 45 458 Aug-19Altron PS 19/08/2013 n/a 33 666 33 666 Aug-16Altron BS 19/08/2013 n/a 17 743 17 743 Aug-16
CRI – conditional rights, SAR – share appreciation rights, PS – performance shares (free shares), BS – bonus shares (free shares)
Conditional rights and share appreciation rights are net settled and are subject to performance conditions. Exercised amounts related to conditional rights and not the number of shares traded. Where performance conditions have not been met, a portion of the award lapses.

ALTRON Annual Financial Statements 2014 70
20 OPERATING PROFIT BEFORE CAPITAL ITEMS continued20.2 Directors' and prescribed officers remuneration continued
Directors' options Entity
Allocationdate
Strikeprice
Balance01/03/2013
Converted/awarded Lapsed Exercised
Exercisedate
Netgains
R'000sExercise
priceBalance
28/02/2014Expiry
date
NM Kayton Altron CRI 28/02/2008 35,50 11 990 11 990 – Feb-14Altron SAR 02/12/2009 25,50 14 780 1 846 12 934 Dec-15Altron SAR 14/01/2011 26,61 17 287 1 919 15 368 Jan-17Altron PS 14/01/2011 n/a 7 516 3 760 3 756 15/01/2014 89 23,70 – Jan-14Altron BS 14/01/2011 n/a 4 059 4 059 15/01/2014 96 23,70 – Jan-14Altron SAR 02/12/2011 21,50 23 535 23 535 Dec-17Altron PS 02/12/2011 n/a 10 233 10 233 Dec-14Altron BS 02/12/2011 n/a 10 211 10 211 Dec-14Altron SAR 12/12/2012 21,10 34 882 34 882 Dec-18Altron PS 12/12/2012 n/a 25 782 25 782 Dec-15Altron BS 12/12/2012 n/a 6 611 6 611 Dec-15Altron SAR 19/08/2013 20,26 37 781 37 781 Aug-19Altron PS 19/08/2013 n/a 27 925 27 925 Aug-16Altron BS 19/08/2013 n/a 7 051 7 051 Aug-16
AG JohnstonAltron CRI 28/02/2008 35,50 3 334 3 334 – Feb-14Altron SAR 02/12/2009 25,50 13 229 1 654 11 575 Dec-15Altron SAR 14/01/2011 26,61 17 287 1 919 15 368 Jan-17Altron PS 14/01/2011 n/a 9 771 4 885 4 886 15/01/2014 116 23,70 – Jan-14Altron BS 14/01/2011 n/a 4 209 4 209 15/01/2014 100 23,70 – Jan-14Altron SAR 02/12/2011 21,50 23 107 23 107 Dec-17Altron PS 02/12/2011 n/a 13 060 13 060 Dec-14Altron BS 02/12/2011 n/a 6 967 6 967 Dec-14Altron SAR 12/12/2012 21,10 25 900 25 900 Dec-18Altron PS 12/12/2012 n/a 14 639 14 639 Dec-15Altron BS 12/12/2012 n/a 4 300 4 300 Dec-15Altron SAR 19/08/2013 20,26 28 052 28 052 Aug-19Altron PS 19/08/2013 n/a 15 856 15 856 Aug-16Altron BS 19/08/2013 n/a 4 433 4 433 Aug-16
W OosthuysenAltech SAR 18/11/2011 54,95 12 545 (12 545) – Nov-17Altron SAR 19/08/2013 24,75 – 27 850 27 850 Nov-17Altech PS 18/11/2011 n/a 6 691 (6 691) – Nov-14Altron PS 19/08/2013 n/a – 14 854 14 854 Nov-14Altech BS 18/11/2011 n/a 6 839 (6 839) – Nov-14Altron BS 19/08/2013 n/a – 15 183 15 183 Nov-14Altech SAR 22/02/2013 39,83 19 402 (19 402) – Feb–19Altron SAR 19/08/2013 17,94 – 43 073 43 073 Feb–19Altech PS 22/02/2013 n/a 10 348 (10 348) – Feb–16Altron PS 19/08/2013 n/a – 22 973 22 973 Feb–16Altech BS 22/02/2013 n/a 2 274 (2 274) – Feb–16Altron BS 19/08/2013 n/a – 5 048 5 048 Feb–16Altron SAR 19/08/2013 20,26 31 876 31 876 Aug-19Altron PS 19/08/2013 n/a 18 017 18 017 Aug-16Altron BS 19/08/2013 n/a 8 292 8 292 Aug-16
NOTES TO THE FINANCIAL STATEMENTS continued
for the year ended 28 February 2014

ALTRON Annual Financial Statements 2014 71
GROUP
R millions 20142013
(Restated)
20 OPERATING PROFIT BEFORE CAPITAL ITEMS continuedContinuing operationsIs stated after taking account of the following items:
20.3 Employee remuneration (including directors' remuneration)Salaries and wages 4 389 4 103Share-based payments – equity settled (note 10.9) 33 22Retirement and provident funds 258 229
4 680 4 354
20.4 Fees paidManagerial fees 45 38Technical, consultancy and administration 266 279
311 317
20.5 Foreign exchange (gains)/lossesGains (179) (90)Losses 183 108Forward exchange contracts fair value adjustments (7) (9)
(3) 9
Being:Realised 55 6Unrealised (58) 3
20.6 Net decrease in provisions (note 15) (30) (14)
20.7 Operating lease chargesProperty 221 219Plant, equipment and vehicles 47 46
268 265
20.8 Research and development expenditure 69 95

ALTRON Annual Financial Statements 2014 72
NOTES TO THE FINANCIAL STATEMENTS continued
for the year ended 28 February 2014
GROUP
R millions 20142013
(Restated)
21 CAPITAL ITEMSContinuing operationsImpairment of goodwill (27) –Impairment of intangibles (6) (9)Net gain on disposal of property, plant and equipment 38 14Impairment of property, plant and equipment (3) (7)Profit/(loss) on disposal of subsidiary (note 38) 3 (5)Impairment of investment (note 3) (43) –Impairment of held-for-sale disposal group – (29)Loss on disposal of held-for-sale disposal group – (42)
(38) (78)
Discontinued operationsProfit/(loss) on disposal of discontinued operations 43 (730)Impairment of property, plant and equipment – (328)Impairment of intangible assets – (300)Impairment of goodwill – (13)
43 (1 371)
Total 5 (1 449)
Details on the impairment losses for property, plant and equipment are provided in note 1 and for intangible assets in note 2.
22 FINANCIAL INCOMERecognised in profit or lossInterest income on financial assets carried at amortised cost 83 49Dividend income on available-for-sale financial assets 20 9
103 58
Continuing operations 103 56Discontinued operations – 2
103 58
23 FINANCIAL EXPENSERecognised in profit or lossInterest expense on financial liabilities carried at amortised cost 363 226
363 226
Continuing operations 363 134Discontinued operations – 92
363 226
24 SHARE OF PROFIT OF EQUITY-ACCOUNTED INVESTEESAttributable earnings 14 15

ALTRON Annual Financial Statements 2014 73
GROUP
R millions 20142013
(Restated)
25 TAXATION25.1 Taxation charge
Current year– normal tax 360 322– deferred tax (3) 22– capital gains tax 3 1Adjustment to prior years– normal tax (43) (17)– deferred tax 9 30
326 358
Secondary tax on companies– normal tax – 3– deferred tax – 13
Income tax expense 326 374
Continuing operations 326 364Discontinued operations – 10
25.2 Reconciliation of effective tax rate% %
Continuing operationsSouth African normal tax rate 28,0 28,0Adjusted for:Non-deductible expenditure 5,6 5,3Goodwill impaired 0,7 –Non-taxable income (2,3) (2,2)Capital gains tax rate differential (0,2) –Foreign tax rate differential (0,3) (0,3)Income from associates (0,4) (0,1)Temporary differences and tax losses not recognised 5,6 1,1Utilisation of tax losses (2,7) (0,1)Prior year adjustments (3,2) 1,2
2,8 4,9Secondary tax on companies – 1,5
Net increase 2,8 6,4
Effective tax rate 30,8 34,4
Discontinued operationsSouth African normal tax rate 28,0 28,0
Adjusted for:Non-deductible expenditure – (7,5)Goodwill impaired – (0,2)Non-taxable income (28,0) –Foreign tax rate differential – (6,0)Temporary differences and tax losses not recognised – (14,9)
Net increase (28,0) (28,6)
Effective tax rate – (0,6)
Total effective tax rate 29,6 (65,8)

ALTRON Annual Financial Statements 2014 74
NOTES TO THE FINANCIAL STATEMENTS continued
for the year ended 28 February 2014
GROUP2014 2013
(Restated)
R millions Gross
Net of taxand non-
controlling interests Gross
Net of taxand non-
controlling interests
26 EARNINGS PER SHARE26.1 Reconciliation between earnings and headline
earningsEarnings attributable to Altron equity holders 615 (312)Adjustments for:
Impairment of goodwill 27 22 13 8Impairment of investments 43 43 – –Impairment of intangibles 6 6 309 115(Profit)/loss on disposal of subsidiaries (46) (46) 777 478Net gain on disposal of property, plant and equipment (38) (40) (14) (11)Impairment of property, plant and equipment 3 3 335 126Impairment of held-for-sale disposal group assets – – 29 13
Headline earnings 603 417
Headline earnings per share (cents) 188 132
GROUP2014 2013
Number of shares
Number of shares
26.2 Reconciliation of weighted average number of shares Issued shares at the beginning of the year (ordinary and participating preference shares) 347 517 178 347 050 487Effect of own shares held at the beginning of the year (30 950 482) (30 950 482)Effect of shares issued in March – 74 885Effect of shares issued in June 503 –Effect of shares issued in August 3 929 122 –Effect of shares issued in November 39 664 –Effect of shares issued in January – 32 203Effect of shares issued in February 3 983 –
Weighted average number of shares 320 539 968 316 207 093
26.3 Reconciliation between number of shares usedfor earnings per share and diluted earnings per shareWeighted average number of shares 320 539 968 316 207 093Dilutive options 4 863 043 2 453 264
Weighted average number of shares (diluted) 325 403 011 318 660 357
R millionsR millions(Restated)
26.4 Reconciliation between earnings attributable to Altronequity holders and fully diluted earnings:Earnings attributable to Altron equity holders 615 (312)Dilutive earnings attributable to B-BBEE non-controlling interests in subsidiaries (note 12) (3) –Additional earnings attributable to dilutive options at subsidiary level – 42Non-controlling interest in adjustments – (18)
Fully diluted earnings 612 (288)

ALTRON Annual Financial Statements 2014 75
GROUP2014 2013
(Restated)
R millions Gross
Net of tax and non-
controllinginterests Gross
Net of tax and non-
controllinginterests
26 EARNINGS PER SHARE continued 26.5 Reconciliation between headline earnings
attributable to Altron equity holders and fully diluted headline earnings
Headline earnings 603 417Dilutive earnings attributable to B-BBEE non-controlling interests in subsidiaries (note 12) (2) (2) – –Additional earnings attributable to dilutive options at subsidiary level – – (11) (7)
Fully diluted headline earnings 601 410
Diluted headline earnings per share (cents) 185 129
26.6 Reconciliation between headline earnings and normalised headline earnings
Normalised headline earnings have been presented to demonstrate the impact of material, non-operational once-off costs associated with accessing benefits that will only be realised in subsequent reporting periods, as well as certain restructuring costs on the headline earnings of the group.
The presentation of normalised headline earnings is not an IFRS requirement.
Headline earnings are reconciled to normalised headline earnings as follows: GROUP
2014 2013
R millions Gross
Net of tax and non-
controllinginterests Gross
Net of tax and non-
controllinginterests
Headline earnings 603 417Foreign currency losses on transaction funding 40 25 – –Breakage costs on transaction funding 5 3 – –Restructuring costs 39 29 26 18
660 435
Normalised headline earnings per share (cents) 206 138
26.7 Reconciliation between diluted headline earnings and normalised diluted headline earnings
Diluted headline earnings 601 410Foreign currency losses on transaction funding 40 25 – –Breakage costs on transaction funding 5 3 – –Restructuring costs 39 29 26 18
658 428
Normalised diluted headline earnings per share (cents) 202 134
Basic earnings per share is calculated by dividing the earnings attributable to Altron equity holders by the weighted average number of ordinary and participating preference shares in issue during the year.
Basic headline earnings per share is calculated by dividing headline earnings by the weighted average number of ordinary and participating preference shares in issue during the year.
For diluted earnings per share the weighted average number of shares is adjusted to assume conversion of all outstanding share options under the employee share option schemes, net of proceeds received on those options that have a dilutive effect.
Fully diluted earnings and diluted headline earnings have been calculated in accordance with the methodology prescribed in IAS 33 Earnings per share on the basis that:
The recognition of the deferred sale of a 30% interest in Aberdare Cables to the Izingwe Consortium based on the assumption that the outstanding purchase price will be settled in cash for R17 million, adjusted for the dilutive effect of the option price at the Aberdare level and after taking into account the 16,67% investment in the Izingwe Consortium by Power Technologies (Pty) Limited.

ALTRON Annual Financial Statements 2014 76
NOTES TO THE FINANCIAL STATEMENTS continued
for the year ended 28 February 2014
GROUPR millions 2014 2013
27 DIVIDENDS PROPOSEDOrdinary dividend number 66 of 80 cents (2013: 60 cents) per share 82 61Preference dividend number 20 of 80 cents (2013: 60 cents) per share 178 129
260 190
28 COMMITMENTS28.1 Capital expenditure
Contracts for capital expenditure not providedfor in the financial statements 48 85Capital expenditure authorised but not contracted for 61 41
109 126
This expenditure will be incurred in the ensuing year and will be financed from existing cash resources.
28.2 Amounts outstanding under operating lease agreementsAt the balance sheet date the group had outstanding commitments under non-cancellable operating leases, which fall due as follows:Within one yearProperty 234 208Plant, equipment and vehicles 22 24
256 232
One to five yearsProperty 471 511Plant, equipment and vehicles 27 24
498 535
ThereafterProperty 124 186
Total 878 953
29 EVENTS AFTER THE REPORTING PERIOD29.1 Debt refinance
On 10 March 2014, Altron refinanced all of its existing term debt. New term loans were taken out totalling R3,35 billion, with R1,9 billion of three year debt, R1,25 billion of five year amortising debt and R0,2 billion of Revolving Credit Facilities. Post the refinance, the group's balance sheet was affected as follows:
February 14 (Audited)
February 14 (Pro forma)
Non-current loans 283 3 034Current loans 2 649 678Bank overdraft 1 777 997
4 709 4 709
All of the debt has been centralised at the Altron Finance level which houses the group's treasury operations. All the refinanced debt is subject to a common terms agreement and all the term debt has been raised at a margin of 210 basis points over three month JIBAR.

ALTRON Annual Financial Statements 2014 77
29 EVENTS AFTER THE REPORTING PERIOD continued29.2 Repurchase of non-controlling interest in Bytes SA
On 9 May 2014 the group entered into an agreement to acquire the 27% of Bytes SA that it does not already own from the Kagiso Tiso Holdings group of companies for R669 million. The transaction will be effective on 30 June 2014.
29.3 Altech NupayEffective 1 May 2014 Altech acquired the remaining 50% less one share equity interest in Altech NuPay ((Pty)) Limited, which Altech did not already own for a purchase price of R80 million. The purchase price was settled via the issue of Altron participating preference shares by way of a vendor placement.
29.4 Aberdare IzingweEffective 31 March 2014 the Powertech group recognised the deferred sale of an interest in Aberdare Cables to the Izingwe Consortium. The obligation to repay the funding has been fully transferred to Izingwe and thus the Powertech group will recognise the non-controlling interest in Aberdare Cables from 1 April 2014.
29.5 Investment in Liquid Telecommunications Holdings LimitedOn 29 April 2014, Altech received the outstanding R484 million from Liquid Telecommunications Holdings Limited to settle the US$55 million put option that had been exercised in January 2014. R103 million had been received in February 2014.
29.6 Bytes Document Solutions UKEffective 30 April 2014, Bytes UK disposed of 100% of its equity interest in the Bytes Document Solutions operation in the UK to Xeratec Group Holdings Limited for a purchase price of R96 million.
30 FINANCIAL RISK MANAGEMENTExposure to currency, interest rate, liquidity and credit risk arises in the normal course of the group's business. This note presents information about the group's exposure to each of the above risks, the group's objectives, policies and processes for measuring and managing risk, and the group's management of capital. Further quantitative disclosures are included throughout these consolidated financial statements.
The board of directors has overall responsibility for the establishment and oversight of the group's risk management framework. The board has established the risk management committee, which is responsible for developing and monitoring the group's risk management policies. The committee reports regularly to the board of directors on its activities.
The group's risk management policies are established to identify and analyse the risks faced by the group, to set appropriate risk limits and controls, and to monitor risks and adherence to limits. Risk management policies and systems are reviewed regularly to reflect changes in market conditions and the group's activities.
30.1 Foreign currency riskForeign exchange contracts are used as a means of reducing exposure to fluctuations in foreign exchange rates.
The group incurs currency risk as a result of transactions which are denominated in a currency other than group entities' functional currency in respect of purchases, sales and borrowings. The currencies giving rise to currency risk in which the group primarily deals are British pounds (GBP), US dollars (USD), Swedish krona (SEK) and Euros (Euro). The group entities hedge payables, receivables and borrowings denominated in foreign currencies.
The settlement of these transactions takes place within a normal business cycle. The group has clearly defined policies for the management of foreign currency exchange risks. Transactions which create foreign currency cash flows are hedged with forward exchange contracts.
Speculative use of financial instruments or derivatives is not permitted and none has occurred during any periods presented.

ALTRON Annual Financial Statements 2014 78
NOTES TO THE FINANCIAL STATEMENTS continued
for the year ended 28 February 2014
30 FINANCIAL RISK MANAGEMENT continued30.1 Foreign currency risk continued
The group's exposure to foreign currency risk was as follows:
28 February 2014 28 February 2013 Foreign amount Foreign amount
Millions SEK GBP Euro USD SEK GBP Euro USD
Other non-current assets – 3 – 10 – 3 – – Other investments – – – – – – – 50 Trade and other receivables – – 3 116 – – 3 41 Cash and cash equivalents – – 1 5 1 – 2 9 Loans – – – (17) – (1) – (15)Trade and other payables (5) (11) (10) (127) (5) (16) (9) (83)
Gross balance sheet exposure (5) (8) (6) (13) (4) (14) (4) 2
Forecast transactions (1) 2 (1) (12) (3) – (2) (9)
Gross exposure (6) (6) (7) (25) (7) (14) (6) (7)
Forward exchange contracts 4 9 11 28 7 14 16 72 Kick into forward cover – – – – – 4 – –
Net exposure (2) 3 4 3 – 4 10 65
The following significant exchange rates were used for the conversion of foreign operations and transactional balances:
2014 2013 Average
rate Closing
rate Average
rate Closing
rate
British pound 15,86 18,02 13,31 13,76Euro 13,40 14,85 10,83 11,85US dollar 10,03 10,76 8,39 9,08Swedish krona 1,54 1,68 1,24 1,40
Sensitivity analysis A 1% strengthening/weakening in the Rand against the following currencies at 28 February 2014 would have increased/(decreased) profit or loss by the amounts shown below. This analysis assumes that all other variables, in particular interest rates, remain constant. The analysis is performed on the same basis for 2013.
The movement in other currencies is not material to the business and consequently is not elaborated on any further.
R millions Profit or loss Strengthening
Profit or loss
Weakening
28 February 2014 British pound (0,5) 0,5 Euro (0,6) 0,6 US Dollar (0,3) 0,3
29 February 2013 British pound (0,6) 0,6 Euro (1,2) 1,2 US dollar (5,9) 5,9

ALTRON Annual Financial Statements 2014 79
30 FINANCIAL RISK MANAGEMENT continued30.2 Foreign exchange contracts
The principal or contract amounts of the foreign exchange contracts for trade payables, receivables and borrowings, including forecast transactions, at balance sheet date were:
Net foreign exchange contracts to pay/(receive) 2014 2013
Millions Foreign amount
Rand amount
Foreign amount
Rand amount
British pounds 9 156 14 189 US dollars 28 301 72 643 Euros 11 174 16 182 Swedish krona 4 7 7 9 Australian dollars 2 24 (1) (5)Chinese yuan renminbi 4 8 – – Swiss francs 1 12 2 22 Japanese yen 70 8 2 –
690 1 040
Comprising foreign exchange contracts: – to pay 2 000 1 324 – to receive (1 310) (284)
690 1 040
Value of contracts at mark-to-market 699 1 041
Derivative asset at fair value (refer note 8) 45 23 Derivative liability at fair value (refer note 16) (36) (22)
Contracts in respect of forecast transactions The group has entered into certain forward exchange contracts, included above, which do not relate to specific items appearing on the balance sheet, but were entered into to cover foreign commitments not yet due. The contracts will be utilised for purposes of inventory procurement and debtor receipts during the following year. – to pay 198 120 – to receive (41) (4)
157 116
30.3 Commodity contractsCommodity forward contracts are entered into to hedge the variability in the price of forecast raw material purchases in respect of copper, aluminium and lead, where these are deemed effective given market pricing dynamics.
30.4 Interest rate riskFinancial assets and liabilities that are sensitive to interest rate risk are cash and cash equivalents, bank overdrafts, loans receivable/payable, and rental finance advances/liabilities.
The interest rates applicable to these financial instruments are on a floating basis in line with those currently available in the market.
The group has certain fixed rate financial liabilities:
– secured vendor loan (R58 million) (refer note 13);– unsecured bank loans (R100 million) (refer note 13);– deferred purchase considerations (R87 million) (refer note 13); and– empowerment funding obligation (R17 million) (refer note 14).

ALTRON Annual Financial Statements 2014 80
NOTES TO THE FINANCIAL STATEMENTS continued
for the year ended 28 February 2014
30 FINANCIAL RISK MANAGEMENT continued30.5 Credit risk
Credit risk is the risk of financial loss to the group if a customer or counterparty to a financial instrument fails to meet its contractual obligations, and arises principally from the group's loans receivable, trade and other receivables, rental finance advances, commodity and foreign exchange contracts and cash and cash equivalents.
Management has a credit risk policy in place and the exposure to credit risk is monitored on an ongoing basis.
Credit evaluations are performed on all customers requiring credit over a certain amount.
Credit guarantee insurance is taken where considered appropriate.
The maximum exposure to credit risk is represented by the carrying value of each financial asset in the balance sheet.
The group has no significant concentration of credit risk, with exposure spread over a large number of customers.
The maximum exposure to credit risk arising from derivative financial instruments are the contractual amounts receivable in respect of foreign exchange contracts. Foreign exchange contracts are only entered into with counter parties that have a sound credit rating.
The group establishes an allowance for impairment that represents its estimate of incurred losses in respect of trade and other receivables. The main components of this allowance are a specific loss component that relates to individually significant exposures, and a collective loss component established for groups of similar assets in respect of losses that have been incurred but not yet identified, based on the historical trends, adjusted for current economic conditions.
Cash and cash equivalentsThe group limits its exposure to credit risk by only investing in liquid investments and only with counterparties that have a sound credit rating. Given these high credit ratings, management does not expect any counterparty to fail to meet its obligations.
Deposits and cash balances are all maintained at reputable financial institutions. Cash management is performed by a central corporate treasury.
GuaranteesThe group's policy is to provide financial guarantees only to wholly owned subsidiaries. At 28 February 2014 no third-party guarantees were outstanding (2013: none).
30.6 Liquidity risk Liquidity risk is the risk that the group will not be able to meet its financial obligations as they fall due.The group's approach to managing liquidity risk is to ensure that sufficient liquidity is available to meet its liabilities when due.
The group ensures it has sufficient cash on demand or access to facilities to meet expected operational expenses for the next 12 months, including the servicing of financial obligations; this excludes the potential impact of extreme circumstances that cannot reasonably be predicted, such as natural disasters. The group maintains the following lines of credit –
R3,4 billion of overdraft facilities that are unsecured. Interest payable is linked to the prime interest rate.

ALTRON Annual Financial Statements 2014 81
30 FINANCIAL RISK MANAGEMENT continued30.7 Fair value and risk management(a) Accounting classifications and fair values
The following table shows the carrying amounts and fair values of financial assets and liabilities, including their levels in the fair value hierarchy. It does not include fair value information for financial assets and financial liabilities not measured at fair value if the carrying amount is a reasonable approximation of fair value.
Carrying amount Fair value hierarchy
R millions Note
Design-ated at
fair value
Fairvalue –
hedging instru-
ments Available-
for-sale Total Level 1 Level 2 Level 3 Total
28 February 2014Financial assets measured at fair value Equity investments 3 – – 28 28 1 – 27 28Derivative assets at fair value: used for hedging 8 – 45 – 45 – 45 – 45
– 45 28 73 1 45 27 73
Financial liabilities measured at fair value Derivative liabilities at fair value: used for hedging 16 – (36) – (36) – (36) – (36)Contingent purchase considerations 13 (87) – – (87) – – (87) (87)
(87) (36) – (123) – (36) (87) (123)
28 February 2013 (Restated)Financial assets measured at fair value Equity investments 3 – – 525 525 1 – 524 525Derivative assets at fair value: used for hedging 8 – 23 – 23 – 23 – 23
– 23 525 548 1 23 524 548
Financial liabilities measured at fair value Derivative liabilities at fair value: used for hedging 16 – (25) – (25) – (25) – (25)Contingent purchase considerations 13 (58) – – (58) – – (58) (58)
(58) (25) – (83) – (25) (58) (83)

ALTRON Annual Financial Statements 2014 82
NOTES TO THE FINANCIAL STATEMENTS continued
for the year ended 28 February 2014
OUR NUMBERS (CONTINUED)
30 FINANCIAL RISK MANAGEMENT continued30.7 Fair value and risk management continued(a) Accounting classifications and fair values
Financial assets that are not measured at fair value, namely rental finance advances, trade and other receivables, cash and cash equivalents and non-current loans receivable are categorised as loans and receivables. It has been concluded that the carrying amount of these assets approximates their fair value.
Financial liabilities that are not measured at fair value namely loans, empowerment funding obligation, bank overdrafts and trade and other payables are categorised as other financial liabilities. It has been concluded that the carrying amount of these liabilities approximates their fair value.
The different levels as disclosed in the table above have been defined as follows:Level 1 Quoted prices (unadjusted) in active markets for identical assets or liabilities.
Level 2 Inputs other than quoted prices included within Level 1 that are observable for the asset or liability, either directly (i.e. as prices) or indirectly (i.e. derived from prices).
Level 3 Inputs for the asset or liability that are not based on observable market data (unobservable inputs).
(b) Measurement of fair valuesValuation techniques and significant unobservable inputs used.The following tables show the valuation techniques used in measuring Level 2 and Level 3 fair values, as well as the significant unobservable inputs used.
Financial instruments measured at fair value
Type Valuation techniqueSignificant unobservable inputs
Inter-relationship between significant unobservable inputs and fair value measurements
Derivative assets and liabilities at fair value: used for hedging
Market comparison technique: The fair value of foreign currency contracts (used for hedging) are marked-to-market by comparing the contracted forward rate to the present value of the current forward rate of an equivalent contract with the same maturity date
Not applicable Not applicable
Preference share in Technologies Acceptances Receivables ((Pty)) Limited
Directors' valuations using discounted cash flows
• Discount rate of 17,3% (2013: 18,0%)
• Forecast annual perpetuity growth of 2.5% (2013: 3.5%)
The estimated fair value would increase (decrease) if:• the discount rate were
lower (higher);• the annual revenue
growth rate were higher (lower)
Deferred purchase consideration
Discounted cash flows: The valuation model considers the present value of expected payment, discounted using a risk, adjusted discount rate. The expected payment is determined by considering the possible scenarios of forecast adjusted profit after tax, the amount to be paid under each scenario and the probability of each scenario
• Forecast annual revenue growth rate 20 – 22% (2013: 39%)
• Forecast adjusted Profit after tax margin 27% – 38% (2013: 29%)
• Risk-adjusted discount rate 8.5% (2013: 8.5%)
The estimated fair value would increase (decrease) if:• the annual revenue
growth rate were higher (lower)
• the adjusted PAT margin were higher (lower); or
• the risk-adjusted discount rate were lower (higher).
TransfersThere were no transfer between Levels 1, 2 or 3 of the fair value hierarchy for the years ended 28 February 2014 and 28 February 2013.
Reconciliation of Level 3 fair valuesThe movement in Level 3 fair valued equity investments available for sale related to the disposal of the investment in Liquid Telecommunications Holdings Limited and the impairment of the investment in Gradolite (Pty) Limited during 2014.

ALTRON Annual Financial Statements 2014 83
30 FINANCIAL RISK MANAGEMENT continued30.8 Capital management
The board's policy is to maintain a strong capital base so as to maintain investor, creditor and market confidence and to sustain the future development of the business. The board of directors monitors both the demographic spread of shareholders and the return on capital, capital being defined as total shareholders' equity, excluding non-controlling interests. The board of directors monitors and approves the level of dividends to shareholders.
The board seeks to maintain a balance between the higher returns that might be possible with higher levels of borrowings and the advantages and security afforded by a sound capital position. Following a review of debt securities used in financial markets, the board has changed its approach to assuming appropriate debt levels and is now using the net debt to EBITDA ratio as apposed to the net debt to equity ratio used previously. The group‘s board has determined a target net debt level of 1,0x EBITDA to be achieved over the next two to three years. (at 28 February 2014 the net Debt to EBITDA equalled 1,83 times). However, the group would be prepared to leverage up to a maximum of up to 2,5x net debt to EBITDA to exploit attractive investment opportunities. The group’s target is to achieve a return on shareholders’ equity of between 20% and 25%. The return in 2014 was 16,1% (2013: 9,1%)
Altron's share capital consists of 105,7 million ordinary shares and 249,9 million participating preference shares. Management does not make any distinction between the two types of equity in managing the capital of the company.
The group utilises a share scheme, as approved by the shareholders, as a long term retention mechanism for senior executives and other key employees. The three components, which are disclosed fully in note 10 of the financial statements, each contain a performance element so that the interests of existing shareholders and management are aligned. Awards under this scheme are in accordance with a total remuneration strategy and are approved by the board's remuneration committee.
The group does not have a defined share buy-back plan, but does from time to time purchases its shares in the market; the timing of these purchases depends on market prices. Shares acquired are either held as treasury shares or would be cancelled on repurchase. The group currently holds approximately 31 million treasury shares (see note 10) and there are restrictions on the rights of these shares under the JSE Listings Requirements.
The group has a general authority in place to acquire up to 5% of the company’s issued share capital in any one financial year, which expires at the next annual general meeting, but adheres to a 10% limit on its holding of treasury shares.
Altron's capital management is partially restricted by covenants given to lenders in respect of some borrowing obligations. In respect of borrowings totalling R1 635 million, the group's net debt to EBITDA ratio is limited to two and a half times at 28 February 2014 and two times at 31 August 2014. In respect of borrowings totalling R600 million the group's net debt to EBITDA ratio is limited to two and a half times at 28 February 2014, the group's net interest to EBITDA is not less than four times while tangible net asset value cannot reduce below R1,5 billion. In the event that these parameters were exceeded the lenders would be able to require immediate repayment. In respect of borrowings totalling R235 million, Bytes SA (Pty) Limited’s total debt to EBITDA ratio is limited to three times and Bytes SA (Pty) Ltd's net interest to EBITDA is at least four times. In the event that these parameters were exceeded the lenders would be able to require immediate repayment.
These covenants were cancelled and replaced in the course of the group’s refinance as disclosed in note 29.1. The group now operates under two debt covenants – that net debt of EBITDA may not exceed three times and interest cover (EBITDA divided by net interest expense) may not be less than three times.
There were no changes in the group's approach to capital management during the year, except as disclosed above.
Refer to note 10 for a quantitative summary of authorised and issued capital.
31 RELATED-PARTY TRANSACTIONSR millions 2014 2013
The group has a related-party relationship with its subsidiaries (see note 2), associates and joint ventures (see Annexure 1) and with its directors (see note 20.2) and key management personnel (refer below). All these transactions occur on an arm‘s length basis.31.1 Associates and joint ventures
Sale of goods and services to associates 132 109Services received from joint ventures – 1Services received from associates 19 16Interest earned from associate 4 3Dividends received from joint ventures 10 15Dividends received from associate 4 –Management fees received from associate 17 31

ALTRON Annual Financial Statements 2014 84
NOTES TO THE FINANCIAL STATEMENTS continued
for the year ended 28 February 2014
31 RELATED-PARTY TRANSACTIONS continued31.2 Directors
Details relating to directors' emoluments are disclosed in note 20.2.
At 28 February 2014 the directors of the company held direct and indirect interests, including family interests, in 59 350 755 of the company’s issued ordinary shares (2013: 59 330 954) and 6 722 991 of the company’s issued participating preference shares (2013: 6 591 023). Details of shares held per individual director are listed below. A total of 1 849 036 conditional rights, share appreciation rights, performance shares and bonus shares are allocated to directors in terms of the company’s employee share schemes.
Direct beneficial Direct non-beneficial
Name of directorOrdinary
shares
Participating preference
sharesOrdinary
shares
Participating preference
shares
2014Dr WP Venter 8 709 770 34 055 – – RE Venter – 117 981 – – RJ Abraham 19 801 28 807 – – MC Berzack – 260 190 – – MJ Leeming 2 500 – – – AMR Smith – 28 522 – –
Total 8 732 071 469 555 – –
Indirect beneficial Indirect non-beneficial
Name of directorOrdinary
shares
Participating preference
sharesOrdinary
shares
Participating preference
shares
2014Dr WP Venter 31 247 827 – 19 367 000* 6 197 129* MC Berzack 1 357 – – – MJ Leeming 2 500 21 307 – – SN Susman – 35 000 – –
Total 31 251 684 56 307 19 367 000 6 197 129
* Non-executive chairman and director, Dr WP Venter, and his family and related trusts, are the controlling shareholders of the company.

ALTRON Annual Financial Statements 2014 85
31 RELATED-PARTY TRANSACTIONS continued31.2 Directors continued
Direct beneficial Direct non-beneficial
Name of directorOrdinary
shares
Participating preference
sharesOrdinary
shares
Participating preference
shares
2013Dr WP Venter 8 709 770 – – – RE Venter – 90 732 – – RJ Abraham – 13 282 – – MC Berzack – 232 690 – – MJ Leeming 2 500 – – – AMR Smith – 11 828 – – PL Wilmot – 3 971 – –
Total 8 712 270 352 503 – –
Indirect beneficial Indirect non-beneficial
Name of directorOrdinary
shares
Participating preference
sharesOrdinary
shares
Participating preference
shares
2013Dr WP Venter 31 247 827 34 055 19 367 000* 6 197 129* MC Berzack 1 357 – – – MJ Leeming 2 500 1 307 – – PL Wilmot 6 029
Total 31 251 684 41 391 19 367 000 6 197 129
* Non-executive chairman and director, Dr WP Venter, and his family and related trusts, are the controlling shareholders of the company.
R millions 2014 2013
31.3 Key management personnelKey management personnel are defined as directors of the company and members of the executive committees of Altron TMT and Altron Power. The prior year amounts reflect the previous operating structure.The key management personnel compensations were as follows:Short-term employee benefits, including salaries and bonuses 102 77Post-employment benefits 8 7Equity compensation benefits 13 11
123 95

ALTRON Annual Financial Statements 2014 86
NOTES TO THE FINANCIAL STATEMENTS continued
for the year ended 28 February 2014
Number of shareholders %
Number of shares %
31 RELATED-PARTY TRANSACTIONS continued31.4 Shareholders
Public and non-public shareholders (as at 28 February 2014)Ordinary sharesNon-public shareholders 7 0,36 62 597 224 59,24
Directors and associates of the company 6 0,31 59 350 755 56,17 Repurchased shares 1 0,05 3 246 469 3,07
Public shareholders 1 944 99,64 43 071 907 40,76
Total 1 951 100,00 105 669 131 100,00
Participating preference shares Non-public shareholders 11 0,23 34 427 004 13,78
Directors and associates of the company 9 0,19 6 722 991 2,69 Repurchased shares 2 0,04 27 704 013 11,09
Public shareholders 4 825 99,77 215 432 871 86,22
Total 4 836 100,00 249 859 875 100,00
Material shareholders Beneficial shareholders (excluding directors) holding 5% or more of the company’s listed ordinary shares as at 28 February 2014 were the following:
Number of shares %
Biltron 50 614 827 47,90 Government Employees Pension Fund 15 299 415 14,48
Total 65 914 242 62,38
Beneficial shareholders (excluding directors) holding 5% or more of the company’s listed participating preference shares as at 28 February 2014 were the following:Government Employees Pension Fund 55 933 344 22,38 Sanlam 30 364 981 12,15 Altron Finance (Pty) Limited 27 704 013 11,09 Coronation Fund Managers 25 363 865 10,15 Old Mutual 25 220 606 10,10
Total 164 586 809 65,87

ALTRON Annual Financial Statements 2014 87
32 JUDGEMENTS MADE BY MANAGEMENTIn preparing financial statements in conformity with IFRS, estimates and assumptions that affect the reported amounts and related disclosures are as follows:• Deferred tax assets
Deferred tax assets have been raised at year end on income tax losses and temporary differences in certain subsidiaries based on current profit forecasts for the business.
• Asset useful lives and residual valuesThe useful lives and residual values of property, plant, equipment and intangible assets are reviewed at each reporting date based on current utilisation, prospects and market conditions.
The useful life of the rights to distribute Xerox equipment in 25 African territories is considered to be indefinite as these rights will automatically be renewed at no further cost upon the renewal of the group's South African distribution agreement.
• Business combination purchase price allocationsOn completion of an acquisition management undertakes a full purchase price allocation exercise. Tangible assets and liabilities and contingent liabilities are fair valued.
The business is reviewed and types of intangible assets are identified. These are then valued according to established valuation techniques applicable to the type of intangible asset. Any excess of the purchase price over the value of the business as determined above is allocated to goodwill. Independent external consultants are utilised on the larger acquisitions.
• Impairment of assetsThe impairment of goodwill is tested at least annually. The discounted cash flow valuation model is used on the basis of value in use. Future expected cash flows are based on management forecasts, typically over a three year period, and thereafter a reasonable rate of growth is applied based on current market conditions.
Discount rates used are calculated using the principles of the capital asset pricing model based on current market conditions. The resulting weighted average cost of capital is compared to industry and regional averages to ensure reasonableness. Property, plant and equipment as well as intangible assets are considered for impairment when conditions indicate that impairment may be necessary. These conditions include economic conditions of the operating unit as well as the viability of the asset itself. The discounted cash flow method is used, taking into account future expected cash flows, market conditions and the expected useful lives of the assets.
• Post-employment benefit obligationsPost-retirement defined benefits are provided for certain existing and former employees (see note 17). The actuarial valuation method used to value the obligations is the projected unit method. The assumptions used include a discount rate, inflation rate, salary increase rate, expected rate of return on assets and a pension increase allowance.
• Prepaid airtime voucher revenue recognitionThe group accounts for revenue arising from the sale of prepaid airtime vouchers in their capacity as a principal, rather than an agent for the cellular networks. This is as a result of the group’s exposure to credit risk on these transactions with respect to the daily settlement with financial institutions and the group’s exposure to inventory risk as it is ultimately responsible for settling valid claims from customers in instances where neither the financial institution nor the cellular networks take responsibility for unsuccessful customer recharge transactions.
• On-seller revenue recognitionThe group sells top-up contracts to customers who in turn on-sell the airtime to their own customers. A portion of these top-up contracts are sold at discounted values in order to achieve additional rebates from the cellular networks and to meet contractual connection targets set by the cellular networks.
The total of the additional rebate earned, connection incentive and monthly access fees billed to on-seller customers over the life of the contract exceed the total costs of the individual underlying contracts and these on-seller transactions are managed on a collective rather than on an individual basis.
As no handset is supplied in these transactions, the connection incentive that is earned from the cellular network on each new on-seller contract is not linked to a separate transaction component for revenue recognition purposes and is therefore treated as deferred income and recognised over the life of the contracts.

ALTRON Annual Financial Statements 2014 88
NOTES TO THE FINANCIAL STATEMENTS continued
for the year ended 28 February 2014
32 JUDGEMENTS MADE BY MANAGEMENT continued• Technologies Acceptances Receivables Proprietary Limited (“TAR”)
The relevant activities identified by management with regards to the securitisation vehicle are the credit vetting of leases and the management of leases upon default.
Although Altron is exposed to variable returns from TAR due to the loan funding provided and the preference share investment held in TAR, it does not have the power over the above relevant activities that have an effect on TAR’s returns based on management’s consideration of a weighting of the various factors and indicators surrounding the securitisation vehicle.
Furthermore, management have assessed that the third party that has the power over the relevant activities does not use this power on behalf of Altron – is not acting as an agent of Altron.
• Valuation of financial instrumentsIn note 30.7 a detailed analysis is given of the fair value methodologies applied.
33 STANDARDS AND INTERPRETATIONS IN ISSUE BUT NOT YET EFFECTIVEA number of new standards, amendments to standards and interpretations are not yet effective for the year ended 28 February 2014. These include the following new standards and interpretations that are applicable to the business of the group, and have not been applied in preparing these consolidated financial statements.
IFRS 9 (2009) Financial InstrumentsThe revised statement is effective for the group for the year ending 29 February 2016 with restatement of comparatives required, subject to transitional provisions. IFRS 9 addresses the initial measurement and classification of financial assets and will replace the relevant sections of IAS 39.
Under IFRS 9, there are two options in respect of classification of financial assets, namely, financial assets measured at amortised cost or at fair value. Financial assets are measured at amortised cost when the business model is to hold assets in order to collect contractual cash flows and when they give rise to cash flows that are solely payments of principal and interest on the principal outstanding.
All other financial assets are measured at fair value. Embedded derivatives are no longer separated from hybrid contracts that have a financial asset host.
The new standard may have an impact on the group’s results as a consequence of the new classification requirements on financial assets if instruments classified as loans and receivables do not meet the criteria for measurement at amortised cost. Subject to a detailed analysis of the loans and receivables, management expects that most of the group’s receivables would qualify for measurement at amortised cost and accordingly it is not expected to significantly impact the group’s results.
In respect of the embedded derivative aspect of the new standard, the group has not historically concluded contracts that contain embedded derivatives. Management will, however, continuously review this position in order to ensure that the relevant requirements are appropriately applied should the group enter into embedded derivative contracts in the future.
IFRS 9 (2010) Financial InstrumentsIFRS 9 (2010) addresses both financial assets and financial liabilities and is effective for the group for the year ending 29 February 2016, with restatement of comparatives required, subject to transitional provisions.
IFRS 9 (2010) incorporates the guidance in IAS 39 dealing with fair value measurement, derivatives embedded in host contracts that are not financial assets, and the requirements of IFRIC 9 Reassessment of Embedded Derivatives.
Under IFRS 9 (2010), the classification and measurement requirements of financial liabilities are the same as per IAS 39, barring the following two aspects:

ALTRON Annual Financial Statements 2014 89
The fair value optionFair value changes for financial liabilities (other than financial guarantees and loan commitments) designated at fair value through profit or loss, attributable to the changes in the credit risk of the liability will be presented in other comprehensive income. The remaining change is recognised in profit or loss. However, if the requirement creates or enlarges an accounting mismatch in profit or loss, then the whole fair value change is presented in profit or loss. The determination as to whether such presentation would create or enlarge an accounting mismatch is made on initial recognition and is not subsequently reassessed.
Certain derivatives linked to unquoted equity instrumentsUnder IFRS 9 (2010), derivative liabilities that are linked to and must be settled by delivery of an unquoted equity instrument whose fair value cannot be reliably measured, are measured at fair value.
Although management has not yet assessed the input of the standard in detail they do not expect a significant impact from the application of IFRS 9 (2010) in respect of financial liabilities as classification and measurement of financial liabilities under IFRS 9 are mostly the same as in IAS 39. In addition, the group has not designated any of its financial liabilities at fair value through profit or loss. Historically, the group has not concluded derivative liabilities contracts that require settlement by unquoted equity instruments. Although management has not yet assessed the impact of the new standard in detail, they do not expect any significant impact on the financial results.
IFRIC 21 LeviesThis new interpretation relates to levies imposed by governments and is effective for the group for the year ending 28 February 2015 with retrospective application required.
IFRIC 21 provides guidance on accounting for levies imposed by governments in accordance with IAS 37 Provisions, Contingent Liabilities and Assets. However, an outflow within the scope of IAS 12 Income Taxes, fines and penalties, and liabilities arising from emission trading schemes are explicitly excluded from the scope. Management will assess the impact of the new standard but do not expect any significant impact on the financial results.
Annual Improvements to IFRSs: 2010–2012 and 2011–2013 cycles
The new cycles of improvement form part of the IASB’s annual improvements process to make non-urgent but necessary amendments to IFRS. Amendments have been made to a total of nine standards.
The amendments are effective for the group for the year ending 29 February 2016 and most amendments will apply prospectively. Management has not yet assessed the impact of the improvements in detail but does not expect a significant impact on the group’s results following the implementation of the applicable improvements.
Non-applicable standards, amendments and interpretationsThe other remaining standards, amendments and interpretations issued but not yet effective have been assessed for applicability to the group and management has concluded that they are not applicable to the business of the group and will therefore have no impact on future financial statements.

ALTRON Annual Financial Statements 2014 90
NOTES TO THE FINANCIAL STATEMENTS continued
for the year ended 28 February 2014
GROUP
R millions 20142013
(Restated)
34 CASH GENERATED BY OPERATIONS Operating profit before capital items 1 342 1 199 Adjustments for: Depreciation and amortisation 446 453 Expensing of contract fulfilment costs during the year 360 141 Terminations of contract fulfilment costs 26 17 Release of deferred revenue (94) – Movement in provisions (30) (14)Unrealised foreign exchange (gains)/losses (58) 3 Other non-cash movements 27 72
Cash generated before movements in working capital 2 019 1 871 Increase in inventories (551) (168)Increase in trade and other receivables (1 190) (633)Increase in trade and other payables 1 228 973
1 506 2 043
35 DIVIDENDS RECEIVED FROM ASSOCIATES AND OTHER INVESTMENTS Dividends receivable at the beginning of the year 1 1 Dividends declared during the year 34 9 Dividends receivable at the end of the year (1) (1)
34 9
36 TAXATION PAID Amounts unpaid at the beginning of the year (26) (76) Amounts recognised in profit or loss (320) (309) Amounts disposed – 3 Taxation payable classified as held-for-sale 3 – Amounts acquired in business combinations – (24) Amounts unpaid at the end of the year 73 26
(270) (380)
37 ACQUISITION OF SUBSIDIARIES Property, plant and equipment – (4)Intangibles – fair value adjustment – (39)Inventories (2) (4)Trade and other receivables (3) (184)Trade and other payables – 206 Provisions – 1 Deferred tax – 2 Net loans – 8 Net cash – (35)Taxation – 24 Goodwill arising on acquisition (44) (130)
Purchase consideration (49) (155)Non-controlling interest on acquisition – 3 Less: Deferred purchase considerations 35 43
Cash paid (14) (109)Less: Cash acquired – 35 Less: Deferred purchase consideration paid relating to prior year acquisition (4) (25)Less: Loans repaid – (7)Less: Deemed consideration – 2
(18) (104)
Refer to note 42 for details of acquisitions.

ALTRON Annual Financial Statements 2014 91
GROUP
R millions 20142013
(Restated)
38 PROCEEDS/(CASH DISPOSED OF) ON DISPOSAL OF SUBSIDIARIESContinuing operations Property, plant and equipment – 36 Goodwill and intangible assets – 1 Loans receivable – 33 Inventories – 10 Trade and other receivables 25 48 Trade and other payables (8) (59)Net loans – (54)Net cash 5 24 Non-controlling interest (11) 9
11 48 Less: Investment in associate – (2)Less: Realisation of negative foreign currency translation reserve on disposal – 30 Impairment of assets classified as held-for-sale – (29)Profit/(loss) on disposal of subsidiaries 3 (47)
Proceeds on disposal 14 – Less: Cash disposed (5) (24)
9 (24)
Discontinued operations Property, plant and equipment – 385 Goodwill and intangible assets – 18 Investments – – Inventories – 9 Trade and other receivables – 176 Trade and other payables – (180)Taxation – (3)Net loans – (199)Net cash – 76 Non-controlling interest – 233
– 515 Less: Investment received in Liquid Telecommunications Holdings Limited – (304)Less: FCTR disposed – 166 Profit/(loss) on disposal of subsidiaries – (730)
Cash flow on disposal - funds advanced to subsidiaries for no consideration – (353)Less: Cash disposed – (76)
– (429)
Disposal of related investment Carrying amount of investment disposed 592 – Less: FEC realised on disposal (4) –
Proceeds on disposal 588 – Less: Additional purchase price payment (150) – Less: Working capital true up (17) – Less: Proceeds receivable (refer note 8) (484) –
Net cash outflow on disposal of investment in Liquid Telecommunications Holdings Limited (63) –

ALTRON Annual Financial Statements 2014 92
GROUP
R millions 20142013
(Restated)
39 PROCEEDS ON DISPOSAL OF PROPERTY, PLANT AND EQUIPMENT Carrying amount 23 22 Surplus on disposal 3 14
Proceeds on disposal 26 36
40 OTHER INVESTING ACTIVITIES Net decrease of loans to associates and other investments (5) 52 Investment in Contract Fulfilment Costs (478) (430) Investment in Gradolite Preference shares – (43) Buy-back of non-controlling interest (1 646) – Cash received from cell captive 39 – Other – 7
(2 090) (414)
41 ASSETS AND LIABILITIES CLASSIFIED AS HELD-FOR-SALE During the year the decision was taken to sell Bytes Document Solutions UK and the Retail ATM base and the respective operations were subsequently classified as held-for-sale. These operations did not constitute discontinued operations.
Assets classified as held-for-sale Property, plant and equipment 46 –Intangible assets 1 – Goodwill 46 – Inventories 11 – Trade and other receivables 58 – Cash and cash equivalents 52 –
214 –
Liabilities classified as held-for-sale Trade and other payables 81 – Taxation payable 3 –
84 –
NOTES TO THE FINANCIAL STATEMENTS continued
for the year ended 28 February 2014

ALTRON Annual Financial Statements 2014 93
42 ACQUISITION OF SUBSIDIARYAcquisition of Brand New TechnologiesEffective 1 March 2013 the Bytes Group acquired the business of Brand New Technologies (Pty) Limited (BNTech) for a total estimated consideration of R49 million of which, R35 million is deferred and payable on the achievement of certain earn-outs over the next three years. BNTech is a leading provider of identity management products and solutions, specialising in protecting, securing and validating identities. The acquisition of BNTech complements existing Bytes offerings and allows the group to offer and provide a holistic identity management solution on a turnkey basis, both in South Africa and into Africa.
The acquired business contributed revenue of R57,3 million and net profit after tax of R14,5 million to the group.
These amounts have been calculated using the group's accounting policies.
R millionsRecognised
valuesFair value
adjustmentsCarryingamount
The acquired balances of BNTech at the effective date were as follows:Inventories 2 – 2Trade and other receivables 3 – 3
Total net assets on acquisition 5 – 5Goodwill on acquisition 44
Total purchase consideration 49Less: Amounts due to vendors (35)
Net cash outflow on acquisition 14
Brand New Technologies (Pty) Ltd (BNTech) is a leading provider of Identity Management (IDM) products and solutions, specialising in protecting, securing and validating identities. Bytes Technology Group (Bytes) as well as Altech have over time entered the field of IDM in various guises. An opportunity exists both in South Africa and into Africa to offer and provide a holistic IDM solution on a turnkey basis incorporating various devices, products, solutions and services, something that is not currently available within these markets. To this end, the acquisition of the business of BNTech would complement offerings currently provided by the group through Kronos (workforce management systems), Navajo (biometric software), Datacard (card personalisation) and various solutions available from within the Bytes Universal Systems arena. BNTech and specifically its stakeholders have realised that their ability to sustain and indeed progress profit growth will be greatly enhanced through the incorporation of the business into a substantial organisation. National (and wider) presence, complementary businesses, an extensive customer base, financial credibility and empowerment credentials are all factors seen by BNTech as catalysts in this regard.
R millions
43 DISPOSAL OF SUBSIDIARYDisposal of 50% interest in Tridonic South AfricaEffective 31 January 2014 the group disposed of its 50% interest in the issued share capital of Tridonic South Africa (Pty) Limited.The operation did not constitute a discontinued operation. Net assets of subsidiaries disposed: Current assets 30 Current liabilities (8)Non-controlling interest (11)
Disposal value 11 Profit on disposal of subsidiary 3
Proceeds on disposal 14

ALTRON Annual Financial Statements 2014 94
INTERESTS IN OTHER ENTITIES Subsidiaries Buy back of non-controlling interests in AltechThe Altron group acquired the Altech non-controlling shareholders' shares in Altech effective 1 August 2013. This brought Altron's shareholding in Altech to 100% and will enable it to integrate and initiate synergies between Altech and Bytes, through the creation of the Altron TMT division.
Non-controlling interests (“NCI”)
The following subsidiaries have material NCI.
Name
Principal place of business/country of incorporation
Ownership interests held
by NCI2014
Ownership interests held
by NCI2013
Allied Technologies Limited South Africa – 38%Altech UEC South Africa (Pty) Limited South Africa 25% + 1 share 25% + 1 shareAltech Netstar (Pty) Limited South Africa 25% + 1 share 25% + 1 shareBytes Technology Group South Africa (Pty) Limited South Africa 27% 27%Powertech Transformers (Pty) Limited South Africa 20% 20%
The following table summarises the information relating to each of the group's subsidiaries that have material NCI, before any intra-group eliminations. The information presented includes results from continuing and discontinued operations.
2014R millions
Altech UEC
SouthAfrica
Altech Netstar
BytesTech-
nology SA
PowertechTrans-
formers
Other non-material
NCITotal
NCI
Revenue 2 377 1 068 6 057 1609Profit 104 98 273 77
Profit attributable to non-controlling interests 26 25 74 15 20 160
Other comprehensive income – – (3) –Total comprehensive income 104 98 270 77
Total comprehensive income attributable to non-controlling interests 26 25 73 15 35 174
Current assets 814 212 2 716 1 004Non-current assets 519 351 913 409Equity loan – – (71) –Current liabilities (621) (235) (2 102) (742)Non-current liabilities (545) (1 499) (198) (61)Non-controlling interest – (2) – –
Net assets 167 (1 173) 1 258 610
Net assets attributable to non-controlling interests 42 (287) 340 122 41 258
Dividends paid to non-controlling interests during the year – 5 29 5 3 42
ANNEXURE 1

ALTRON Annual Financial Statements 2014 95
2013R millions
Altech UEC
SouthAfrica
Altech group
Altech Netstar
BytesTech-
nology SA
PowertechTrans-
formers
Other non-material
NCI*Total NCI
Revenue 1 438 10 441 1 037 4 945 1 459Profit/(loss) 62 (937) 68 259 63
Profit/(loss) attributable to non-controlling interests 16 (362) 17 70 13 (384) (630)
Other comprehensive income – 398 – 1 –Total comprehensive income 62 (539) 68 260 63
Total comprehensive income attributable to non-controlling interests 16 (208) 17 70 13 (346) (438)
Current assets 453 2 098 148 2 207 872Non-current assets 420 1 666 276 841 343Current liabilities (530) (2 718) (168) (166) (71)Equity Loan – – – (71) –Non-current liabilities (281) (449) (1 477) (1 717) (585)Non-controlling interest – 231 (1) – –
Net assets 62 828 (1 222) 1 094 559
Net assets attributable to non-controlling interests 16 320 (307) 295 112 53 489
Dividends paid to non-controlling interests during the year – 93 – 29 16 4 142
*Other non-material NCI for 2013 primarily relates to non-controlling interests of discontinued operations.Associate companiesThe following is summarised financial information for the group's interest in associates:
Altron controlled
interest
Investment at cost less
amounts written off
Attributable share of retained income Dividends Indebtedness
Total Investment
2014%
2013%
2014Rm
2013Rm
2014Rm
2013Rm
2014Rm
2013Rm
2014Rm
2013Rm
2014Rm
2013Rm
UnlistedBytes Healthcare Solutions international operations 49,9 49,9 – – 2 1 (1) – – – 1 1Battech (Pty) Limited 49,9 49,9 30 30 (10) (1) – – 35 35 55 64Alcon Marepha (Pty) Limited 49,9 49,9 1 1 18 13 (3) – (1) (1) 15 13Aeromaritime International management Services (Pty) Limited 20,0 20,0 2 2 – – – – – – 2 2
33 33 10 13 (4) – 34 34 73 80
The Group has no associates that are material to the group.
The table below summarises the associate entities in which the group holds an interest.Investment Nature of business
Battech (Pty) Limited A leading supplier to a number of major utilities and financial institutions in the highly-specialised field of stationary and solar battery power.
Bytes Healthcare Solutions international operations Provides healthcare IT and eCommerce solutions in Saudi Arabia and Namibia.

ALTRON Annual Financial Statements 2014 96
Investment Nature of business
Aeromaritime International Management Services (Pty) Limited
Provides services of customs clearing for both imports and exports, international forwarding on both seafreight and airfreight, local and national freight distribution and cross-border road freight to neighbouring countries in Africa.
Alcon Marepha (Pty) Limited Manufacturer of medium voltage power cable and aluminium conductors.
Joint ventureCBI Electric Aberdare ATC Telecom Cables (ATC) is the only joint arrangement in which the group participates, through its subsidiary Aberdare.
ATC is a telecom cable manufacturing joint venture with CBI Electric. Both Aberdare and CBI have a 50% board representation with no casting vote. Unanimous consent is required for decisions over relevant activities as no single party has an outright majority.
The arrangement does not give rise to either party having rights to substantially all economic benefits relating to the arrangement as the majority of ATC's output is sold to independent third parties. Furthermore, neither Abedare nor CBI has undertaken or is obliged to provide any loans, share capital or to give any guarantee or indemnity in respect of any liabilities or obligations of ATC (the initial working capital loan has been settled).
Accordingly, the group has classified its interest in ATC as a joint venture.
The following table summarises the financial information of ATC as included in its own financial statements, adjusted for fair value adjustments at acquisition and any differences in accounting policies. The table also reconciles the summarised financial information to the carrying amount of the group's interest in ATC, which is accounted for using the equity method. Refer to note 3.
R millions 2014 2013
Revenue 716 648
Profit* 20 21Other comprehensive income – –
Total comprehensive income 20 21
*Includes: Depreciation and amortisation of R15 million (2013: R15 million) Net interest received of Rnil (2013: R1 million) Income tax expense of R9 million (2013: R9 million)
Current assets** 322 301Non-current assets 193 199Current liabilities (101) (83)Non-current liabilities (24) (27)
**Includes: Cash and cash equivalents of R74 million (2013: R57 million)
Net assets 390 390
Group's interest in net assets of investee at beginning of year 195 199Total comprehensive income attributable to the group 10 11Dividends received during the year (10) (15)
Group's interest in net assets of investee at end of year 195 195At acquisition group adjustments (25) (25)
Carrying amount of interest in investee at end of year 170 170
ANNEXURE 1 continued

ALTRON Annual Financial Statements 2014 97
Involvement with unconsolidated structured entities
Preference share in Technologies Acceptances Receivables (Pty) Limited (TAR)TAR is a securitisation vehicle used to house leases predominately related to equipment sold by the group.
The group owns one variable rate cumulative redeemable preference share in TAR. At the reporting date, a fair value assessment was undertaken which, using recognised valuation principles and techniques, indicated that the preference share was fairly valued at R21 million (2013: R21 million). The discounted cash flow method was used to present value the forecasted income from the preference share investment over a seven year (2013: seven year) period using an effective discount rate of 17,3% (2013: 18,0%) and perpetuity growth rate of 3,5% (2013: 3,5%). The directors' valuation is equal to the fair value.
The group has concluded that it does not control, and therefore should not consolidate, the TAR securitisation vehicle. TAR was formed to pool leases of the group's products so that they can be repackaged into interest bearing loans from the group and a senior funder and a preference share investment held by the company. In substance, TAR's purpose is to facilitate the financing of lease equipment by the group and a senior funder and to house the lease transactions. When considering Altron’s lack of practical ability to direct the revelant activitives of TAR as well as agency vs. principal considerations, Altron does not have power over the revelant activities and hence does not control TAR.
The TAR loans are repayable when cash is available in accordance with a prescribed priority of payments.
Exposure to credit risk The maximum exposure to credit risk for the group is in repayment of loans receivable at the balance sheet date amounts to R148 million (2013: R143 million). TAR is exposed to the risk of customers defaulting on their lease rental payments. All customers are credit vetted, credit is only extended to customers in accordance with the stipulations of the securitisation vehicle, and is effectively secured by the underlying assets. Bad debt experience is in line with expectations given the nature of the book.
Exposure to interest rate risk The TAR participation loan notes earn a minimum interest rate of JIBAR plus 1,65% (2013: JIBAR plus 1,65%) and a maximum interest rate of prime plus 6%. Any return in excess of the prime plus 6% cap is declared as a dividend against the group’s preference share investment in TAR.

ALTRON Annual Financial Statements 2014 98
The following table summarises the financial information of TAR as included in its own financial statements.
R millions 2014 2013
Abridged balance sheetsNon-current assets 613 573 Current assets (excluding cash) 33 39 Cash and cash equivalents 70 67
Total assets 716 679
Current liabilities (24) (22)Non-current liabilities (684) (648)
Total liabilities (708) (670)
Equity 8 9
Abridged statements of comprehensive income Revenue 79 84 Expenditure (53) (74)
Profit before tax 26 10 Taxation (7) (2)
Profit for the year 19 8
Other comprehensive income – –
Total comprehensive income for the year 19 8
ANNEXURE 1 continued

ALTRON Annual Financial Statements 2014 99
SEGMENT ANALYSISThe following summary describes the operations and related products and services in each of the Group's reportable segments:
Powertech Cables Group Manufacturing of medium and low-voltage power cables, data cable systems, metallic cables and accessories operating in South Africa, its neighbouring countries and the Iberian peninsula.
Powertech Transformers Group Manufacturing of power and distribution transformers.
Powertech Battery Group Manufacturing and distribution of automotive batteries and DC power systems.
Powertech Services Group Diversified engineering solutions business.
Other Powertech segments Includes lighting control equipment, electrical accessories, standby power and rectifier systems and solar systems.
Bytes Technology Group UK Software Systems integration, Microsoft certified solutions provider in the United Kingdom.
Bytes Document Solutions Group Exclusive distributor of Xerox products and services in South Africa and 25 African territories.
Bytes Managed Solutions Exclusive South African distributor of NCR products for the financial services and retail sectors. Managed services and repairs for PC workspace products.
Bytes Systems Integration Networking, hardware, software, storage, services, software integration, SAP and management consulting, Microsoft certified solutions provider and a provider of Data Warehousing, CRM services and support.
Other Bytes Segments Includes Premier business partner and South African distributor of Alcatel voice communication and data solutions. Classroom and e-learning systems for IT professional training. IT and business process outsourcing services. Delivery of transaction switching services, practice management and informatics solutions to the healthcare industry.
Altech Autopage Cellular Sales, distribution and services provision for cellular network operations.
Altech UEC Group Design and manufacture of satellite and terrestrial digital set-top box decoders.
Altech Netstar Stolen Vehicle Recovery and Fleet Management business.
Converged Services (International) Full Service, data communications carrier in East Africa (discontinued).
Other Altech segments
Includes the design, installation and project management of Motorola radio systems, telecommunications middleware, payment systems and solutions, secure solutions and smartcard technologies as well as distribution of a range of professional electronic components and products.
During the year the Bytes SA Group implemented a business rationalisation programme, and divisionalised a number of subsidiaries in order to align business offerings. Certain operations at Bytes Connect were transferred to Bytes Managed Solutions and Bytes Systems Integration. The business management oversight responsibilities were transferred on 1 March 2013.
Revenue and EBITDA for Bytes Systems Integration and Bytes Managed Solutions for the prior year have therefore been restated.
The creation of Altron TMT (Telecommunications, Multi-media and Information Technology) in August 2013 followed Altron’s successful purchase of all the remaining shares in Altech Limited that it did not already own and the subsequent delisting of Altech Limited from the Johannesburg Stock Exchange (JSE) in August 2013. The rationale for the creation of Altron TMT is to reorganise Altron for future growth and to capture the full benefits that scale and integration offer. As part of the TMT reorganisation, Altron TMT which comprises both Altech and Bytes will undergo structural changes to its subsidiaries and divisions in the next financial year.
ANNEXURE 2

ALTRON Annual Financial Statements 2014 100
ANNEXURE 2 continued
Revenue EBITDA Operating profit Depreciation
R millions Feb 2014 Feb 2013 % Growth
Cur/Pyr Feb 2014 EM% Feb 2013 EM% % Growth
Cur/Pyr Feb 2014 OM% Feb 2013 OM% % Growth
Cur/Pyr Feb 2014 Feb 2013 % Growth
Cur/Pyr
Powertech Cables Group 5 053 4 431 14 131 2,6 18 0,4 623 42 0,8 (51) (1,1) 182 (89) (85) 5Powertech Transformers Group 1 609 1 459 10 160 10,0 138 9,5 16 119 7,4 110 7,5 8 (34) (26) 31Powertech Battery Group 775 680 14 82 10,6 82 12,1 – 64 8,3 66 9,7 (3) (18) (15) 20Powertech Services Group 845 752 12 27 3,2 43 5,7 (38) 13 1,5 21 2,8 (38) (6) (8) (25)Other Powertech segments 97 20 (14) (14) (23) – (53) 57 (7) (7)
Powertech Group 8 379 7 342 14 386 4,6 267 33,6 45 215 2,6 93 1,3 131 (154) (141) 9
Bytes Technology Group UK Software 2 066 1 541 34 76 3,7 45 2,9 69 73 3,5 42 2,7 74 (2) (3) (33)Bytes Document Solutions Group 2 470 2 216 11 124 5,0 142 6,4 (12) 98 4,0 113 5,1 (13) (24) (25) (4)Bytes Managed Solutions 1 630 1 205 35 175 10,7 150 12,4 17 154 9,4 124 10,3 24 (21) (26) (19)Bytes Systems Integration 1 517 1 120 35 89 5,9 82 7,3 9 73 4,8 69 6,2 6 (8) (10) (20)Other Bytes segments 1 078 922 17 131 12,2 112 12,1 17 97 9,0 75 8,1 29 (21) (16) 31
Bytes Group 8 761 7 004 25 595 6,8 531 7,6 12 495 5,7 423 6,0 17 (76) (80) (5)
Altech Autopage Cellular 5 501 6 027 (9) 260 4,7 253 4,2 3 236 4,3 232 3,8 2 (22) (21) 5Altech UEC Group 2 674 1 802 48 169 6,3 180 10,0 (6) 84 3,1 98 5,4 (14) (22) (20) 10Altech Netstar 1 079 1 045 3 317 29,4 291 27,8 9 294 27,2 270 25,8 9 (19) (16) 19Converged Services (International)* – 280 (100) – – (125) (44,6) 100 – – (176) (62,9) 100 – (41) (100)Other Altech segments 1 441 1 287 12 74 5,1 165 12,8 (55) 33 2,3 124 9,6 (73) (31) (20) 55
Altech Group 10 695 10 441 2 820 7,7 764 7,3 7 647 6,0 548 5,2 18 (94) (118) (20)
Corporate and financial services 6 18 (67) (13) (23) 43 (15) (30) 50 (2) (6) 67Inter-segment revenue (69) (61)
Altron Group 27 772 24 744 12 1 788 6,4 1 539 6,2 16 1 342 4,8 1 034 4,2 30 (326) (345) (6)
*The majority of this segment formed the discontinued operations.Revenue/EBITDA/operating profit from segments below the quantitative thresholds are attributable to smaller operating segments of the Altron group. None of those segments has met any of the quantitative thresholds for determining reportable segments for the reportable periods. Quantitative thresholds have been calculated based on totals for the Altron group and not per sub-group. Inter-segment revenue represents transactions between reportable segments. The price is set on an arm’s length basis which is eliminated on consolidation.
R millions Feb 2014 Feb 2013
Segment EBITDA can be reconciled to group operating profit before capital items as follows: Segment EBITDA 1 788 1 539 Reconciling items: Depreciation (326) (345)Amortisation (120) (160)
Group operating profit before capital items 1 342 1 034
Geographic information Revenue from external customers South Africa 21 193 19 522 Rest of Africa 2 680 1 930 Europe 3 748 3 006 North America 17 24 South America 11 11 Australasia 112 191 Middle East 4 51 Asia 7 9
27 772 24 744

ALTRON Annual Financial Statements 2014 101
Revenue EBITDA Operating profit Depreciation
R millions Feb 2014 Feb 2013 % Growth
Cur/Pyr Feb 2014 EM% Feb 2013 EM% % Growth
Cur/Pyr Feb 2014 OM% Feb 2013 OM% % Growth
Cur/Pyr Feb 2014 Feb 2013 % Growth
Cur/Pyr
Powertech Cables Group 5 053 4 431 14 131 2,6 18 0,4 623 42 0,8 (51) (1,1) 182 (89) (85) 5Powertech Transformers Group 1 609 1 459 10 160 10,0 138 9,5 16 119 7,4 110 7,5 8 (34) (26) 31Powertech Battery Group 775 680 14 82 10,6 82 12,1 – 64 8,3 66 9,7 (3) (18) (15) 20Powertech Services Group 845 752 12 27 3,2 43 5,7 (38) 13 1,5 21 2,8 (38) (6) (8) (25)Other Powertech segments 97 20 (14) (14) (23) – (53) 57 (7) (7)
Powertech Group 8 379 7 342 14 386 4,6 267 33,6 45 215 2,6 93 1,3 131 (154) (141) 9
Bytes Technology Group UK Software 2 066 1 541 34 76 3,7 45 2,9 69 73 3,5 42 2,7 74 (2) (3) (33)Bytes Document Solutions Group 2 470 2 216 11 124 5,0 142 6,4 (12) 98 4,0 113 5,1 (13) (24) (25) (4)Bytes Managed Solutions 1 630 1 205 35 175 10,7 150 12,4 17 154 9,4 124 10,3 24 (21) (26) (19)Bytes Systems Integration 1 517 1 120 35 89 5,9 82 7,3 9 73 4,8 69 6,2 6 (8) (10) (20)Other Bytes segments 1 078 922 17 131 12,2 112 12,1 17 97 9,0 75 8,1 29 (21) (16) 31
Bytes Group 8 761 7 004 25 595 6,8 531 7,6 12 495 5,7 423 6,0 17 (76) (80) (5)
Altech Autopage Cellular 5 501 6 027 (9) 260 4,7 253 4,2 3 236 4,3 232 3,8 2 (22) (21) 5Altech UEC Group 2 674 1 802 48 169 6,3 180 10,0 (6) 84 3,1 98 5,4 (14) (22) (20) 10Altech Netstar 1 079 1 045 3 317 29,4 291 27,8 9 294 27,2 270 25,8 9 (19) (16) 19Converged Services (International)* – 280 (100) – – (125) (44,6) 100 – – (176) (62,9) 100 – (41) (100)Other Altech segments 1 441 1 287 12 74 5,1 165 12,8 (55) 33 2,3 124 9,6 (73) (31) (20) 55
Altech Group 10 695 10 441 2 820 7,7 764 7,3 7 647 6,0 548 5,2 18 (94) (118) (20)
Corporate and financial services 6 18 (67) (13) (23) 43 (15) (30) 50 (2) (6) 67Inter-segment revenue (69) (61)
Altron Group 27 772 24 744 12 1 788 6,4 1 539 6,2 16 1 342 4,8 1 034 4,2 30 (326) (345) (6)
*The majority of this segment formed the discontinued operations.Revenue/EBITDA/operating profit from segments below the quantitative thresholds are attributable to smaller operating segments of the Altron group. None of those segments has met any of the quantitative thresholds for determining reportable segments for the reportable periods. Quantitative thresholds have been calculated based on totals for the Altron group and not per sub-group. Inter-segment revenue represents transactions between reportable segments. The price is set on an arm’s length basis which is eliminated on consolidation.
R millions Feb 2014 Feb 2013
Segment EBITDA can be reconciled to group operating profit before capital items as follows: Segment EBITDA 1 788 1 539 Reconciling items: Depreciation (326) (345)Amortisation (120) (160)
Group operating profit before capital items 1 342 1 034
Geographic information Revenue from external customers South Africa 21 193 19 522 Rest of Africa 2 680 1 930 Europe 3 748 3 006 North America 17 24 South America 11 11 Australasia 112 191 Middle East 4 51 Asia 7 9
27 772 24 744

ALTRON Annual Financial Statements 2014 102
BALANCE SHEETat 28 February 2014
COMPANYR’000 Notes 2014 2013
ASSETSNon-current assets 2 947 434 3 099 371
Investment in subsidiaries 2 2 697 864 2 690 381 Amount receivable from subsidiary 2 – 388 993 Defined benefit asset 11 180 000 –Group share scheme recharge receivable 7 69 570 19 997
Current assets 499 199 608 454
Trade and other receivables 201 243 Amounts receivable from subsidiaries 2 498 758 607 815 Cash and cash equivalents 240 396
Total assets 3 446 633 3 707 825
EQUITY AND LIABILITIES Shareholders' equity 3 443 732 3 096 506 Non-current liabilitiesLoans 3 – – Current liabilities 2 901 611 319
Trade and other payables 2 308 1 989 Current portion of loans 3 – 609 042 Derivative liability 5 – 1 Taxation payable 593 287
Total equity and liabilities 3 446 633 3 707 825

COMPANY ANNUAL FINANCIAL STATEMENTS 103
STATEMENT OF COMPREHENSIVE INCOME for the year ended 28 February 2014
COMPANYR’000 Notes 2014 2013
Revenue 167 718 353 691
Interest income on financial assets carried at amortised cost 23 138 37 361Dividends received from subsidiaries 144 580 316 330
Interest expense on financial liabilities measures at amortised cost (21 425) (35 269)Change in fair value of derivative liability 5 1 –Impairment of investment in subsidiary (1) –Operating expenditure (693) (599)
Profit before taxation 145 600 317 823Taxation (297) (450)
Profit for the year 145 303 317 373
Other comprehensive incomeItems that will never be reclassified to profit or lossRemeasurement of net defined benefit asset/obligation 180 000 –
Other comprehensive income for the year, net of taxation 180 000 –
Total comprehensive income for the year 325 303 317 373

COMPANY ANNUAL FINANCIAL STATEMENTS 104
R’000
Ordinary share
capital (Note 4)
Preference share
capital (Note 4)
Share premium
(Note 4)
Share-based
payment reserve
Fair value
reserve Retained earnings
Total equity
Balance at 29 February 2012 2 113 24 2 241 641 77 775 – 763 421 3 084 974 Total comprehensive income for the year Profit for the year – – – – – 317 373 317 373
Total comprehensive income for the year – – – – – 317 373 317 373
Transactions with owners, recorded directly in equity Share-based payments – – – 3 557 – – 3 557 Dividends paid – – – – – (319 355) (319 355)Shares issued – – 9 957 – – – 9 957
Total transactions with owners – – 9 957 3 557 – (319 355) (305 841)
Balance at 28 February 2013 2 113 24 2 251 598 81 332 – 761 439 3 096 506 Total comprehensive income for the year Profit for the year – – – – – 145 303 145 303
Other comprehensive incomeRemeasurement of net defined benefit asset/obligation – – – – 180 000 – 180 000
Total other comprehensive income – – – – 180 000 – 180 000
Total comprehensive income for the year – – – – 180 000 145 303 325 303
Transactions with owners, recorded directly in equity Share-based payments – – – 56 831 – – 56 831 Dividends paid – – – – – (208 504) (208 504)Shares issued – 1 173 595 – – – 173 596
Total transactions with owners – 1 173 595 56 831 – (208 504) 21 923
Balance at 28 February 2014 2 113 25 2 425 193 138 163 180 000 698 238 3 443 732
STATEMENT OF CHANGES IN EQUITYfor the year ended 28 February 2014
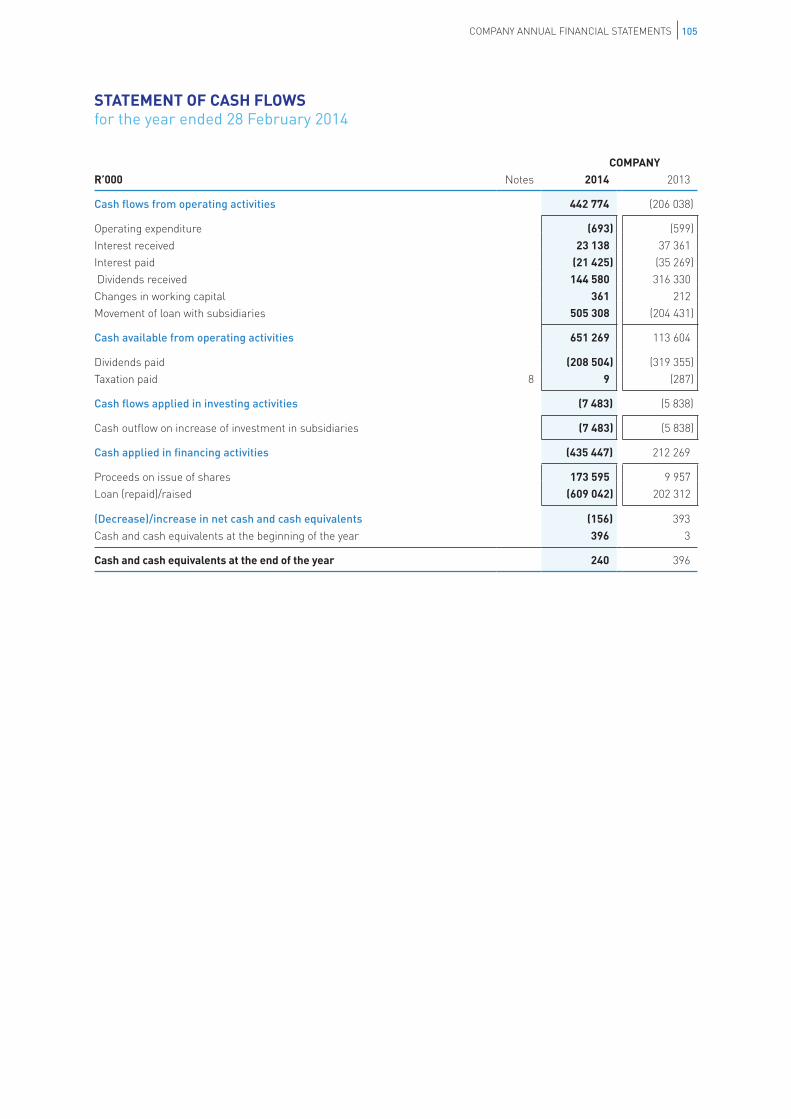
COMPANY ANNUAL FINANCIAL STATEMENTS 105
STATEMENT OF CASH FLOWS for the year ended 28 February 2014
COMPANYR’000 Notes 2014 2013
Cash flows from operating activities 442 774 (206 038)
Operating expenditure (693) (599)Interest received 23 138 37 361 Interest paid (21 425) (35 269) Dividends received 144 580 316 330 Changes in working capital 361 212 Movement of loan with subsidiaries 505 308 (204 431)
Cash available from operating activities 651 269 113 604
Dividends paid (208 504) (319 355)Taxation paid 8 9 (287)
Cash flows applied in investing activities (7 483) (5 838)
Cash outflow on increase of investment in subsidiaries (7 483) (5 838)
Cash applied in financing activities (435 447) 212 269
Proceeds on issue of shares 173 595 9 957 Loan (repaid)/raised (609 042) 202 312
(Decrease)/increase in net cash and cash equivalents (156) 393 Cash and cash equivalents at the beginning of the year 396 3
Cash and cash equivalents at the end of the year 240 396

COMPANY ANNUAL FINANCIAL STATEMENTS 106
1 ACCOUNTING POLICIES Please refer to the group accounting policies.
2 INTEREST IN SUBSIDIARIES
Effective holdingShare at cost less
amounts written off Indebtedness 2014
% 2013
% 2014 R’000
2013R’000
2014 R’000
2013R’000
Allied Technologies Limited – 62 – 235 095 – – Bytes Technology Group (Pty) Limited – 100 – 2 016 937 – – Power Technologies (Pty) Limited – 100 – 260 410 – 610 505 Altron Finance (Pty) Limited – ordinary shares 100 100 235 235 498 758 386 303 Altron Finance (Pty) Limited – preference shares 100 100 2 633 952 121 509 – – Investment in subsidiaries – share-based payments 63 677 56 194 – – Venopt (Pty) Limited * * – 1 – –
2 697 864 2 690 381 498 758 996 808
Less: Current portion disclosed as current assets 498 758 607 815
Non-current loans receivable – 388 993
Notes: The above details are given in respect of interests in subsidiaries, where material. A full list of South African subsidiaries is available on request, at the registered office of the company. All subsidiaries are incorporated in South Africa.
* Special purpose entity owning 22% of Bytes Technology Group South Africa (Pty) Limited and beneficially owned by Kagiso Strategic Investments (Pty) Limited. The entity was recognised as a subsidiary of the company by virtue of the put option issued in favour of a financial institution in respect of the preference share capital funding of the entity (refer note 5). This put option has now been cancelled.
On 2 August 2013, by way of an assets-for-shares transaction entered into with Altron Finance (Pty) Limited, the company sold all (62%) of its issued ordinary shares it held in Allied Technologies Limited (Altech), 100% of the issued ordinary shares held in Bytes Technology (Pty) Limited (Bytes) and 59,8% held in Power Technologies (Pty) Limited (Powertech).
In consideration for the assets acquired, Altron Finance (Pty) Limited alloted and issued 12 000 redeemable participating preference shares of 1 cent each in its authorised share capital to Altron for a consideration value equivalent to the sum total of the original cost of the assets acquired as follows:
ConsiderationR’000
Sharesissued
Altech – 59 934 685 ordinary shares at cost 235 095 4 644
Bytes – 170 093 565 ordinary shares at cost 2 016 937 5 367Powertech – 164 565 809 ordinary shares at cost 260 410 1 989
2 512 442 12 000
Prior to the above transaction, Altron Finance (Pty) Limited acquired all of the Altech non-controlling interests (38%), effectively bringing its total shareholding in Altech to 100%. The consideration was settled by cash and an issue of Altron shares.
COMPANY
R’000 2014 2013
3 LOANSUnsecured bank loans – 609 042 Current portion reflected as current liabilities – (609 042)
Non-current loans – –
NOTES TO THE FINANCIAL STATEMENTSfor the year ended 28 February 2014

COMPANY ANNUAL FINANCIAL STATEMENTS 107
COMPANY
R’000 2014 2013
4 SHARE CAPITAL AND PREMIUM Please refer to the group note 10
5 DERIVATIVE LIABILITY Fair value at inception recognised as investment in subsidiary 421 421 Fair value adjustment recognised in profit or loss in prior periods (420) (420)Fair value adjustment recognised in profit or loss in the current year (1) –
Fair value at year-end – 1
In terms of the Bytes B-BBEE transaction with Kagiso, Altron was required to write a put option to the financial institution in respect of the perpetual non-cumulative preference shares issued by Venopt (refer group note 12.4). The put option was initially recognised at fair value on the date that it was written. Subsequent to initial recognition, Altron measures the put option at its fair value at each balance sheet date and recognises the resulting fair value adjustment in profit or loss. This put option was cancelled during the year as the preference shares were paid in full. The fair value of the put option is determined at each balance sheet date using a European option pricing model. The fair value assumptions utilised in the valuation of the option were as follows:
COMPANY
2014 2013 At balance sheet date
At balance sheet date
On initial recognition
Underlying preference share value including dividends receivable – R154 million R154 million Risk free interest rate (%) – 5,17 9,54Option life (years) – 1,34 5 Dividend yield – 70% of prime 70% of prime Expected volatility (%) – 34 28
The value of the put option changes in response to an underlying variable namely, the value of the preference shares, which is impacted by the value of the Bytes SA shares held by Venopt.
2014 2013
6 TAXATION R'000 R'000Current taxation 479 583Current taxation prior year over provision (182) (133)
297 450
Reconciliation of rate of taxation % %
South African normal taxation rate 28,0 28,0Non-taxable income (27,8) 27,9Non-deductible expenses 0,1 0,1Prior year over provision (0,1) (0,1)
Effective taxation rate (0,2) (0,1)

COMPANY ANNUAL FINANCIAL STATEMENTS 108
7 GROUP SHARE-BASED PAYMENTSDetails of employee share options granted by the company are reflected in group notes 10.6 to 10.8. Options granted under the Conditional Rights Scheme and Altron 2009 Share Plan are subject to a recharge arrangement with participating subsidiaries upon exercise of the options by employees of those companies and have been accounted for as follows:
COMPANYR’000 2014 2013
Group share scheme recharge receivable at fair value 69 570 19 997
Cumulative equity-settled charge recognised by subsidiaries and receivable per balance sheet 69 570 19 997
The fair value of the share appreciation rights, the conditional rights and the bonus share awards at grant date are determined based on the Black Scholes Model. The fair value of the performance awards is determined based on the Monte Carlo valuation model. The fair value of the liability is remeasured at each balance sheet date and at settlement date. The model inputs at 28 February 2014 were as follows: Share price (Rand) 24,50 21,10 Exercise price (Rand) 0 – 26,61 0 – 34,5 Terms (years) 0,37– 4,47 0,41 – 4,78
Volatility 11,51% to
21,4% 11% to 29% Dividend yield 2,45% 4,36%Risk-free interest rate 6,53% – 8,01% 5,17% – 5,79%
8 TAXATION PAID Taxation payable at the beginning of the year 287 124 Recognised in profit or loss 297 450 Taxation payable at the end of the year (593) (287)
(9) 287
9 RELATED PARTIES The company has a related party relationship with its subsidiaries (see note 2) DividendsThe company received dividends from subsidiaries 144 580 316 330 InterestThe company received interest from subsidiaries 23 138 37 361 ShareholdersThe principal shareholders of the company are detailed in the analysis of shareholders in note 31.4 of the annual financial statements.DirectorsThe company has a related party relationship with its directors (see note 20 of the group financial statements). Directors' interests are disclosed in the directors’ report and in note 31.2 of the annual financial statements.
10 FINANCIAL RISK MANAGEMENTFinancial risk management and related disclosures have been dealt with in the group financial statements. See note 30.
11 DEFINED BENEFIT ASSETRetirement benefit plans have been dealt with in the group financial statements. See note 17.
NOTES TO THE FINANCIAL STATEMENTSfor the year ended 28 February 2014