annual financial statements ifrs
TRANSCRIPT
June 30, 2014
Page:
1 : Consolidated Financial Results for the Fiscal Year 2014(Year ended March 31, 2014)
2 : 1. Consolidated Financial Statements
2 : (1) Consolidated Statement of Comprehensive Income
4 : (2) Consolidated Statement of Financial Position
6 : (3) Consolidated Statement of Changes in Equity
7 : (4) Consolidated Statement of Cash Flows
8 : (5) Operating Segment Information
9 : (6) Per share Information
10 : 2. Disclosure of Transition to IFRS
ITOCHU Corporation
ANNUAL FINANCIAL STATEMENTS 〔IFRS〕For years ended March 31, 2014 and 2013

June 30, 2014
Company name: ITOCHU Corporation
Stock exchange code: 8001 URL: http://www.itochu.co.jp/en/ir/
President and Chief Executive Officer: Masahiro Okafuji
General Manager of Corporate Communications Division: Tomoyuki Takada TEL: 81 - 3 - 3497 - 7291
1. Consolidated operating results for fiscal year 2014 (from April 1, 2013 to March 31, 2014)(1) Consolidated operating results (Summary) (%: Changes from the previous fiscal year)
Fiscal year 2014
Fiscal year 2013
Fiscal year 2014
Fiscal year 2013
Equity in earnings of associates and joint ventures (millions of yen) FY 2014 : 56,036 (down 36.3%) FY 2013 : 87,967 ( -% ) Total comprehensive income attributable to ITOCHU (millions of yen) FY 2014 : 391,901 (down 17.4%) FY 2013 : 474,460 ( -% ) (*1) "Trading income" = "Gross trading profit" + "Selling, general and administrative expenses" + "Provision for doubtful accounts" (*2) Diluted earnings per share attributable to ITOCHU for fiscal year 2013 is not presented due to the anti-dilutive effect of convertible preferred stocks issued by associated companies
(2) Consolidated financial position
March 31, 2014
March 31, 2013
(3) Consolidated cash flows information
Fiscal year 2014
Fiscal year 2013
2. Dividend distribution
yen yen yen yen yen
Fiscal year 2013
Fiscal year 2014
3. Outlook of consolidated operating results for fiscal year 2015 [IFRS] (from April 1, 2014 to March 31, 2015)(%: Changes from the previous fiscal year)
yen
Outlook of consolidated operating results for the first half of fiscal year 2015 is not prepared.
(Notes) Explanation regarding the appropriate utilization of the Outlook, and other items to note1.This document is an English translation of a statement written initially in Japanese. The Japanese original document should be considered as the primary version.2.The consolidated financial statements and operating segment information are expressed in yen and, solely for the convenience of the reader, have been translated into U.S. dollars at the rate of 102.92 yen = 1 U.S. dollar, the exchange rate prevailing on March 31, 2014. The translation should not be construed as a representation that the Japanese yen amounts could be converted into U.S. dollars at the above or any other rate.3.The Company has voluntarily adopted the International Financial Reporting Standards ("IFRSs") from the consolidated financial statements of the Annual Report under the Financial Instruments and Exchange Law in Japan from the fiscal year ended March 31, 2014. 4.These Consolidated Financial Results for FY2014 are disclosures that provides selected major items from the consolidated financial statements of the Annual Report.5.The Company previously disclosed the Consolidated Financial Results based on U.S.GAAP for FY2014 (Year ended March 31, 2014) on May 1st , 2014.6.For your attention, these forecasts are forward looking statements that are based on the management's assumptions and beliefs based on information currently available and involve risks and uncertainties. Thus, the actual results could be substantially different from the above statement due to such factors including, but not limited to, global economic and market conditions, and currency exchange rate fluctuations.
189.81Fiscal year 2015 1,110,000 6.2 300,000 3.8 438,000 21.4 300,000 22.3millions of yen %millions of yen % millions of yen % millions of yen %
Gross trading profit Trading income Profit before taxNet profit attributable
to ITOCHUBasic earnings per shareattributable to ITOCHU
29.6 3.9Fiscal year 2015
(Planned)- 23.00 - 23.00 46.00 24.2
- 21.00 - 25.00 46.00 72,760
millions of yen
236,517 (203,811) 2,978
% %
- 20.00 - 20.00 40.00 63,271 24.4 4.2
570,335
Dividend distribution per shareTotal Dividend
distribution(Annual)
Payout ratio(Consolidated)
Ratio of dividenddistribution to
shareholders' equity(Consolidated)
millions of yen millions of yen millions of yen millions of yen
428,101 (270,377) (77,855) 653,739
End offirst
quarter
End ofsecondquarter
End ofthird
quarterYear-end Annual
7,783,756 2,399,537 2,045,683 26.3 1,294.34
Operating activities Investing activities Financing activities Cash and cash equivalents
7,198,501 2,075,194 1,718,980 23.9 1,087.61
millions of yen millions of yen millions of yen % yen
163.77 - 17.1 3.8
Total assets Total equity Total shareholders' equityRatio of shareholders'equity to total assets
Shareholders'equity per share
yen yen % %
155.21 154.71 13.0 3.3
258,843 - 507,060 -
Basic earnings per shareattributable to ITOCHU
Diluted earnings per shareattributable to ITOCHU (*2)
Ratio of net profit attributable toITOCHU to shareholders' equity
Ratio of net profit attributable toITOCHU to total assets
245,312 (5.2) 410,164 (19.1)945,778 - 256,858 - 379,639 -
millions of yen % millions of yen %
1,045,022 10.5 288,992 12.5 360,762 (5.0)millions of yen % millions of yen % millions of yen %
Gross trading profit Trading income (*1) Profit before taxNet profit attributable
to ITOCHUTotal comprehensive
income
Consolidated Financial Results for Fiscal Year 2014 【IFRS】 (Year ended March 31, 2014) [Prepared in conformity with International Financial Reporting Standards]
- 1 -
1. Consolidated Financial Statements
Consolidated Financial Statements have been prepared in conformity with IFRSs.
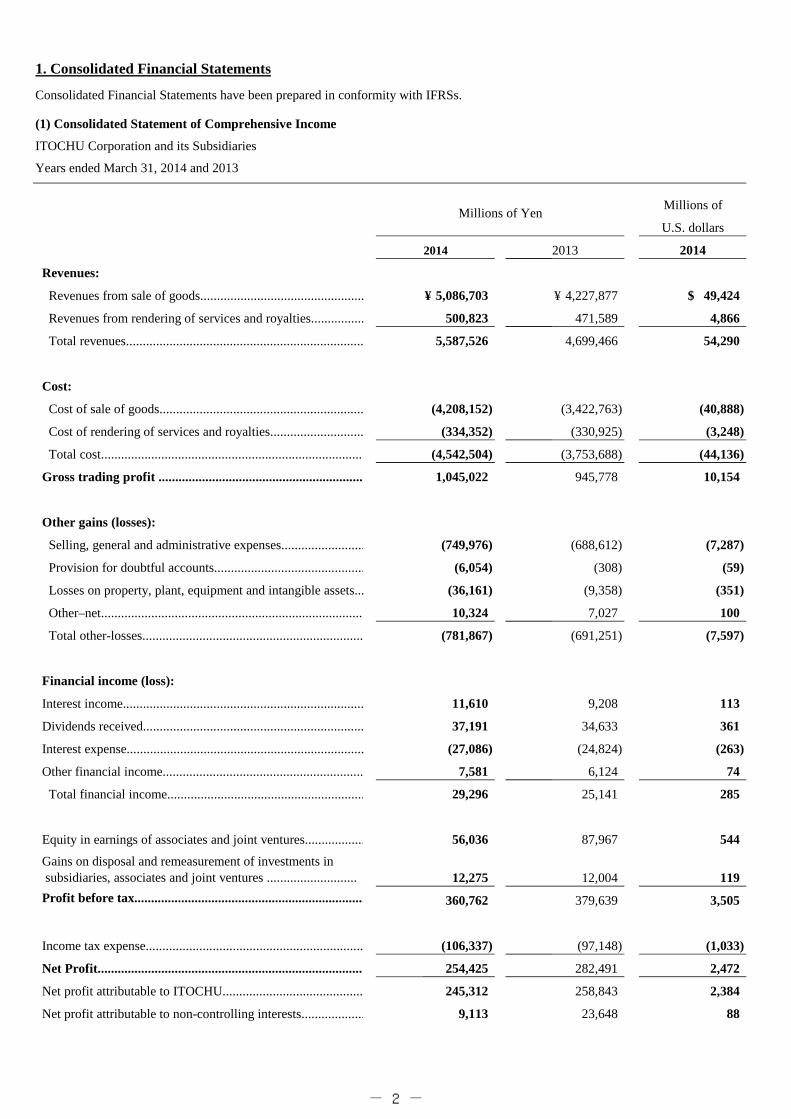
(1) Consolidated Statement of Comprehensive Income
ITOCHU Corporation and its Subsidiaries
Years ended March 31, 2014 and 2013
2014 2013 2014
Revenues:
Revenues from sale of goods................................................. 5,086,703¥ 4,227,877¥ 49,424$
Revenues from rendering of services and royalties................ 500,823 471,589 4,866
Total revenues....................................................................... 5,587,526 4,699,466 54,290
Cost:
Cost of sale of goods............................................................. (4,208,152) (3,422,763) (40,888)
Cost of rendering of services and royalties............................ (334,352) (330,925) (3,248)
Total cost............................................................................... (4,542,504) (3,753,688) (44,136)
Gross trading profit .............................................................. 1,045,022 945,778 10,154
Other gains (losses):
Selling, general and administrative expenses......................... (749,976) (688,612) (7,287)
Provision for doubtful accounts............................................. (6,054) (308) (59)
Losses on property, plant, equipment and intangible assets... (36,161) (9,358) (351)
Other–net............................................................................... 10,324 7,027 100
Total other-losses.................................................................. (781,867) (691,251) (7,597)
Financial income (loss):
Interest income........................................................................ 11,610 9,208 113
Dividends received.................................................................. 37,191 34,633 361
Interest expense....................................................................... (27,086) (24,824) (263)
Other financial income............................................................ 7,581 6,124 74
Total financial income........................................................... 29,296 25,141 285
Equity in earnings of associates and joint ventures.................. 56,036 87,967 544
12,275 12,004 119
Profit before tax..................................................................... 360,762 379,639 3,505
Income tax expense................................................................. (106,337) (97,148) (1,033)
Net Profit................................................................................ 254,425 282,491 2,472
Net profit attributable to ITOCHU.......................................... 245,312 258,843 2,384
Net profit attributable to non-controlling interests................... 9,113 23,648 88
Gains on disposal and remeasurement of investments in subsidiaries, associates and joint ventures ...........................
Millions of YenMillions of
U.S. dollars
- 2 -

2014 2013 2014
Other comprehensive income for the year, net of tax:
Items that will not be reclassified to profit or loss
FVTOCI financial assets...................................................... 18,692¥ 67,042¥ 182$
Remeasurement of net defined pension liability................... 11,235 4,139 109
5,924 2,960 58
Items that may be reclassified to profit or loss
Translation adjustments....................................................... 65,481 114,703 636
Cash flow hedges................................................................. (4,287) 2,478 (42)
58,694 33,247 569
155,739 224,569 1,512
Total comprehensive income for the year ........................... 410,164 507,060 3,984
Total comprehensive income attributable to ITOCHU ............ 391,901 474,460 3,807
18,263 32,600 177
Note 1 : The gains and losses on disposal and remeasurement of financial equity instruments, of which the changes in fair value are recorded in other comprehensive income, are recognized in FVTOCI financial assets.
Note 2 : "Total trading transactions" in accordance with Japanese accounting practice consists of sales with respect to transactions in which the companies act as principal and the total amount of transactions in which the companies act as agent. Total trading transactions for the years ended March 31, 2014 and 2013 were 14,645,718 million yen (142,302 million U.S. dollars) and 12,770,465 million yen respectively.
Total comprehensive income attributable to non-controlling interests .......................................................
Millions of YenMillions of
U.S. dollars
Other comprehensive income in associates and joint ventures..............................................................
Other comprehensive income in associates and joint ventures..............................................................
Total other comprehensive income for the year, net of tax.............................................................................
- 3 -

(2) Consolidated Statement of Financial Position (Assets)
ITOCHU Corporation and its Subsidiaries
As of March 31, 2014, 2013 and the date of transition to IFRSs (April 1, 2012)
Millions of
Assets U.S. dollars
Mar 31, 2014 Mar 31, 2013 Apr 1, 2012 Mar 31, 2014
Current assets:
Cash and cash equivalents................................................. 653,739¥ 570,335¥ 512,825¥ 6,352$
Time deposits..................................................................... 7,653 7,120 5,173 74
Trade receivables............................................................... 2,127,968 2,080,053 1,945,142 20,676
Other current receivables................................................... 103,019 109,802 115,254 1,001
Other current financial assets............................................ 29,172 36,191 36,652 283
Inventories......................................................................... 744,441 665,330 569,862 7,233
Advances to suppliers........................................................ 94,560 74,900 106,079 919
Other current assets........................................................... 78,984 70,029 81,710 768
Total current assets........................................................ 3,839,536 3,613,760 3,372,697 37,306
Non-current assets:
Investments accounted for by the equity method.............. 1,728,408 1,571,263 1,345,464 16,794
Other investments.............................................................. 565,936 541,139 498,346 5,499
Non-current receivables..................................................... 135,033 102,430 86,323 1,312
125,255 140,092 96,829 1,217
Property, plant and equipment........................................... 747,664 722,883 620,498 7,265
Investment property........................................................... 29,186 36,958 33,570 284
Goodwill............................................................................ 194,934 151,469 140,658 1,894
Intangible assets................................................................. 245,312 181,089 133,071 2,384
Deferred tax assets............................................................. 63,093 61,517 102,126 613
Other non-current assets.................................................... 109,399 75,901 58,573 1,061
Total non-current assets................................................. 3,944,220 3,584,741 3,115,458 38,323
Total assets............................................................. 7,783,756¥ 7,198,501¥ 6,488,155¥ 75,629$
Millions of Yen
Non-current financial assets other than investments and receivables............................................
- 4 -

(2) Consolidated Statement of Financial Position (Liabilities and Equity)
ITOCHU Corporation and its Subsidiaries
As of March 31, 2014, 2013 and the date of transition to IFRSs (April 1, 2012)
Millions of
Liabilities and Equity U.S. dollars
Mar 31, 2014 Mar 31, 2013 Apr 1, 2012 Mar 31, 2014
Current liabilities:
Short-term debentures and borrowings............................ 472,667¥ 498,816¥ 451,618¥ 4,593$
Trade payables................................................................. 1,661,973 1,609,225 1,535,082 16,148
Other current payables..................................................... 70,942 80,032 85,237 689
Other current financial liabilities..................................... 15,788 21,800 27,615 153
Current tax liabilities....................................................... 36,200 37,741 48,660 352
Advances from customers............................................... 106,176 67,945 109,918 1,032
Other current liabilities.................................................... 247,581 224,528 203,287 2,405
Total current liabilities ............................................ 2,611,327 2,540,087 2,461,417 25,372
Non-current liabilities:
Long-term debentures and borrowings............................ 2,420,713 2,282,067 2,084,800 23,520
Other non-current financial liabilities.............................. 103,279 105,733 100,073 1,003
Non-current liabilities for employee benefits.................. 57,022 69,118 83,976 554
Deferred tax liabilities..................................................... 117,438 71,229 48,032 1,141
Other non-current liabilities............................................. 74,440 55,073 67,227 724
Total non-current liabilities .................................... 2,772,892 2,583,220 2,384,108 26,942
Total liabilities .............................................................. 5,384,219 5,123,307 4,845,525 52,314
Equity:
Common stock:
Authorized: 3,000,000,000 shares;
issued: 1,584,889,504 shares........................................ 202,241 202,241 202,241 1,965
Capital surplus................................................................... 113,055 113,031 110,094 1,098
Retained earnings.............................................................. 1,365,858 1,160,939 962,445 13,271
Other components of equity :
Translation adjustments.................................................. 255,017 142,766 - 2,478
FVTOCI financial assets................................................ 116,292 104,709 47,580 1,130
Cash flow hedges............................................................ (3,980) (2,003) (2,747) (39)
Total other components of equity......................... 367,329 245,472 44,833 3,569
Treasury stock.................................................................... (2,800) (2,703) (2,685) (27)
Total shareholders' equity..................................... 2,045,683 1,718,980 1,316,928 19,876
Non-controlling interests................................................... 353,854 356,214 325,702 3,439
Total equity.................................................................... 2,399,537 2,075,194 1,642,630 23,315
Total liabilities and equity.................................... 7,783,756¥ 7,198,501¥ 6,488,155¥ 75,629$
Millions of Yen
- 5 -

(3) Consolidated Statement of Changes in Equity
ITOCHU Corporation and its Subsidiaries
Years ended March 31, 2014 and 2013
Millions of U.S. dollars
2014 2013 2014Common stock:
Balance at the beginning of the year................................................. 202,241¥ 202,241¥ 1,965$ Balance at the end of the year........................................................... 202,241¥ 202,241¥ 1,965$
Capital surplus:
Balance at the beginning of the year................................................. 113,031¥ 110,094¥ 1,098$
24 2,937 0Balance at the end of the year........................................................... 113,055¥ 113,031¥ 1,098$
Retained earnings:
Balance at the beginning of the year................................................. 1,160,939¥ 962,445¥ 11,280$
Net profit attributable to ITOCHU.................................................... 245,312 258,843 2,384
Transfer from other components of equity....................................... 24,459 14,785 237Cash dividends.................................................................................. (64,852) (75,134) (630)Balance at the end of the year........................................................... 1,365,858¥ 1,160,939¥ 13,271$
Other components of equity:
Balance at the beginning of the year................................................. 245,472¥ 44,833¥ 2,385$
Other comprehensive income attributable to ITOCHU.................... 146,589 215,617 1,424
Transfer to retained earnings............................................................. (24,459) (14,785) (237)
(273) (193) (3)Balance at the end of the year........................................................... 367,329¥ 245,472¥ 3,569$
Treasury stock:
Balance at the beginning of the year................................................. (2,703)¥ (2,685)¥ (26)$
Net change in treasury stock............................................................. (97) (18) (1)Balance at the end of the year........................................................... (2,800)¥ (2,703)¥ (27)$
Total shareholders’ equity............................................ 2,045,683¥ 1,718,980¥ 19,876$
Non-controlling interests:
Balance at the beginning of the year................................................. 356,214¥ 325,702¥ 3,461$
Net profit attributable to non-controlling interests........................... 9,113 23,648 88
9,150 8,952 88
Cash dividends to non-controlling interests...................................... (13,415) (6,812) (130)
(7,208) 4,724 (68)Balance at the end of the year........................................................... 353,854¥ 356,214¥ 3,439$
Total equity.................................................................... 2,399,537¥ 2,075,194¥ 23,315$
Millions of Yen
Net change in sale (purchase) of subsidiary shares to (from) non-controlling interests..................................................
Net change in sale (purchase) of subsidiary shares to (from) non-controlling interests..................................................
Net change in sale (purchase) of subsidiary shares to (from) non-controlling interests..................................................
Other comprehensive income attributable to non-controlling interests.................................................................
- 6 -
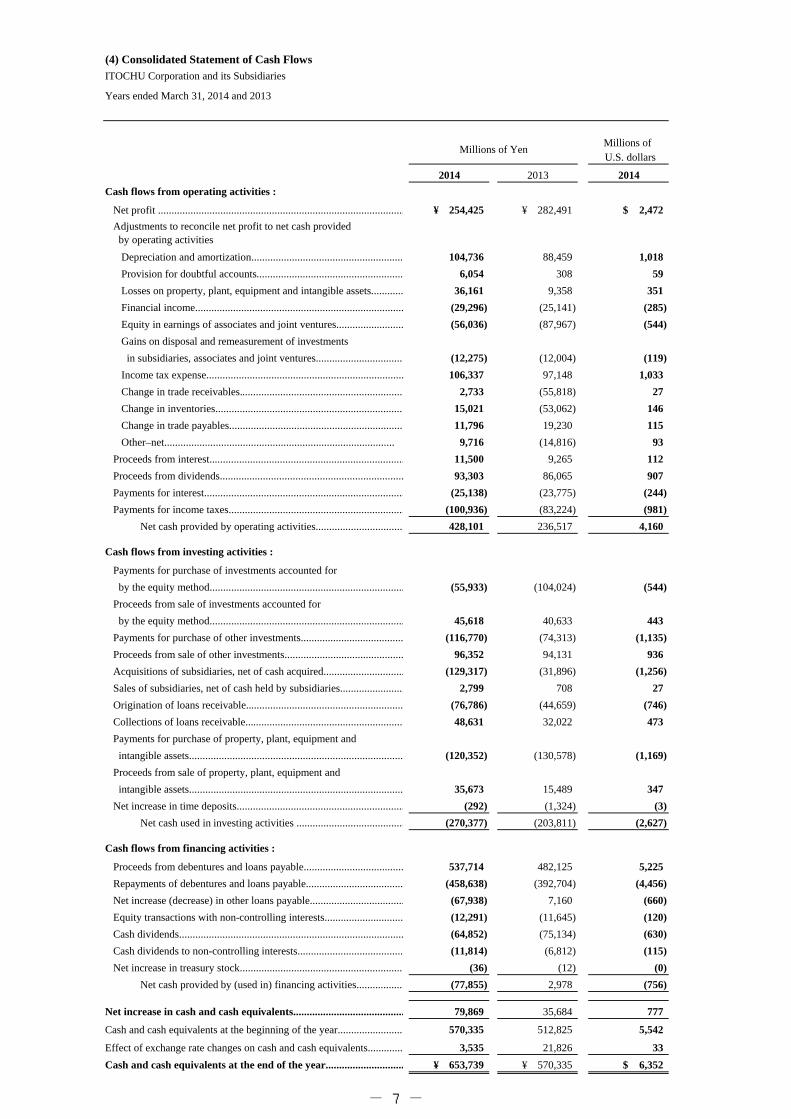
(4) Consolidated Statement of Cash Flows
ITOCHU Corporation and its Subsidiaries
Years ended March 31, 2014 and 2013
2014 2013 2014
Cash flows from operating activities :
Net profit ........................................................................................... 254,425¥ 282,491¥ 2,472$
Depreciation and amortization........................................................ 104,736 88,459 1,018
Provision for doubtful accounts...................................................... 6,054 308 59
Losses on property, plant, equipment and intangible assets............ 36,161 9,358 351
Financial income............................................................................. (29,296) (25,141) (285)
Equity in earnings of associates and joint ventures......................... (56,036) (87,967) (544)
Gains on disposal and remeasurement of investments
in subsidiaries, associates and joint ventures................................. (12,275) (12,004) (119)
Income tax expense......................................................................... 106,337 97,148 1,033
Change in trade receivables............................................................. 2,733 (55,818) 27
Change in inventories...................................................................... 15,021 (53,062) 146
Change in trade payables................................................................. 11,796 19,230 115
Other–net..................................................................................... 9,716 (14,816) 93
Proceeds from interest........................................................................ 11,500 9,265 112
Proceeds from dividends.................................................................... 93,303 86,065 907
Payments for interest.......................................................................... (25,138) (23,775) (244)
Payments for income taxes................................................................. (100,936) (83,224) (981)
Net cash provided by operating activities................................. 428,101 236,517 4,160
Cash flows from investing activities :
Payments for purchase of investments accounted for
by the equity method........................................................................ (55,933) (104,024) (544)
Proceeds from sale of investments accounted for
by the equity method........................................................................ 45,618 40,633 443
Payments for purchase of other investments...................................... (116,770) (74,313) (1,135)
Proceeds from sale of other investments............................................ 96,352 94,131 936
Acquisitions of subsidiaries, net of cash acquired.............................. (129,317) (31,896) (1,256)
Sales of subsidiaries, net of cash held by subsidiaries........................ 2,799 708 27
Origination of loans receivable.......................................................... (76,786) (44,659) (746)
Collections of loans receivable........................................................... 48,631 32,022 473
Payments for purchase of property, plant, equipment and
intangible assets............................................................................... (120,352) (130,578) (1,169)
Proceeds from sale of property, plant, equipment and
intangible assets............................................................................... 35,673 15,489 347
Net increase in time deposits.............................................................. (292) (1,324) (3)
Net cash used in investing activities ........................................ (270,377) (203,811) (2,627)
Cash flows from financing activities :
Proceeds from debentures and loans payable..................................... 537,714 482,125 5,225
Repayments of debentures and loans payable.................................... (458,638) (392,704) (4,456)
Net increase (decrease) in other loans payable................................... (67,938) 7,160 (660)
Equity transactions with non-controlling interests............................. (12,291) (11,645) (120)
Cash dividends................................................................................... (64,852) (75,134) (630)
Cash dividends to non-controlling interests....................................... (11,814) (6,812) (115)
Net increase in treasury stock............................................................. (36) (12) (0)
Net cash provided by (used in) financing activities.................. (77,855) 2,978 (756)
Net increase in cash and cash equivalents......................................... 79,869 35,684 777
Cash and cash equivalents at the beginning of the year......................... 570,335 512,825 5,542
Effect of exchange rate changes on cash and cash equivalents............. 3,535 21,826 33
Cash and cash equivalents at the end of the year............................. 653,739¥ 570,335¥ 6,352$
Millions of YenMillions of U.S. dollars
Adjustments to reconcile net profit to net cash provided by operating activities
- 7 -

(5) Operating Segment InformationITOCHU Corporation and its SubsidiariesYears ended March 31, 2014 and 2013
Information concerning operations in different operating segments for the years ended March 31, 2014 and 2013 is as follows:
For the year ended March 31, 2014 (April 1, 2013 -March 31, 2014)Millions of Yen
Metals Energy ICT, Others,Textile Machinery & & Food General Products Adjustments
Minerals Chemicals & Realty &Eliminations
Revenues: Revenues from external customers........ 533,322¥ 340,382¥ 305,495¥ 2,058,300¥ 989,477¥ 1,319,513¥ 41,037¥ 5,587,526¥ Intersegment revenues........................... 52 4 - 5 236 19,341 (19,638) - Total revenues..................................... 533,374 340,386 305,495 2,058,305 989,713 1,338,854 21,399 5,587,526
Gross trading profit .................................. 131,149 100,834 94,140 174,778 240,817 297,380 5,924 1,045,022
Net profit attributable to ITOCHU........... 23,960 35,945 44,505 12,114 50,838 63,775 14,175 245,312[Equity in earnings (losses) of associates and joint ventures]............... [11,862] [19,417] [9,902] [(33,013)] [19,843] [31,854] [(3,829)] [56,036]
Total assets at March 31, 2014................. 475,658 947,466 1,249,174 1,338,161 1,552,021 1,522,416 698,860 7,783,756
For the year ended March 31, 2013 (April 1, 2012 -March 31, 2013)Millions of Yen
Metals Energy ICT, Others,Textile Machinery & & Food General Products Adjustments
Minerals Chemicals & Realty &Eliminations
Revenues: Revenues from external customers........ 485,776¥ 265,572¥ 247,747¥ 1,792,343¥ 729,259¥ 1,137,820¥ 40,949¥ 4,699,466¥ Intersegment revenues........................... 20 4 - 6 227 17,109 (17,366) - Total revenues..................................... 485,796 265,576 247,747 1,792,349 729,486 1,154,929 23,583 4,699,466
Gross trading profit .................................. 128,922 89,967 81,336 165,391 203,529 262,818 13,815 945,778
Net profit attributable to ITOCHU........... 30,689 29,085 72,985 15,228 43,578 51,777 15,501 258,843[Equity in earnings (losses) of associates and joint ventures]............... [12,366] [14,244] [42,010] [(28,038)] [22,705] [23,916] [764] [87,967]
Total assets at March 31, 2013................. 467,501 887,117 1,162,365 1,390,839 1,351,064 1,406,264 533,351 7,198,501
For the year ended March 31, 2014 (April 1, 2013 -March 31, 2014) Millions ofU.S. dollars
Metals Energy ICT, Others,Textile Machinery & & Food General Products Adjustments
Minerals Chemicals & Realty &Eliminations
Revenues: Revenues from external customers........ 5,182$ 3,307$ 2,968$ 19,999$ 9,614$ 12,821$ 399$ 54,290$ Intersegment revenues........................... 1 - - - 2 188 (191) - Total revenues..................................... 5,183 3,307 2,968 19,999 9,616 13,009 208 54,290
Gross trading profit .................................. 1,274 980 915 1,698 2,340 2,889 58 10,154
Net profit attributable to ITOCHU........... 233 349 432 118 494 620 138 2,384[Equity in earnings (losses) of associates and joint ventures]............... [115] [189] [96] [(321)] [193] [309] [(37)] [544]
Total assets at March 31, 2014................. 4,622 9,206 12,137 13,002 15,080 14,792 6,790 75,629
Note : "Equity in earnings (losses) of associates and joint ventures" is included in Net profit attributable to ITOCHU.
Consolidated
Consolidated
Consolidated
- 8 -
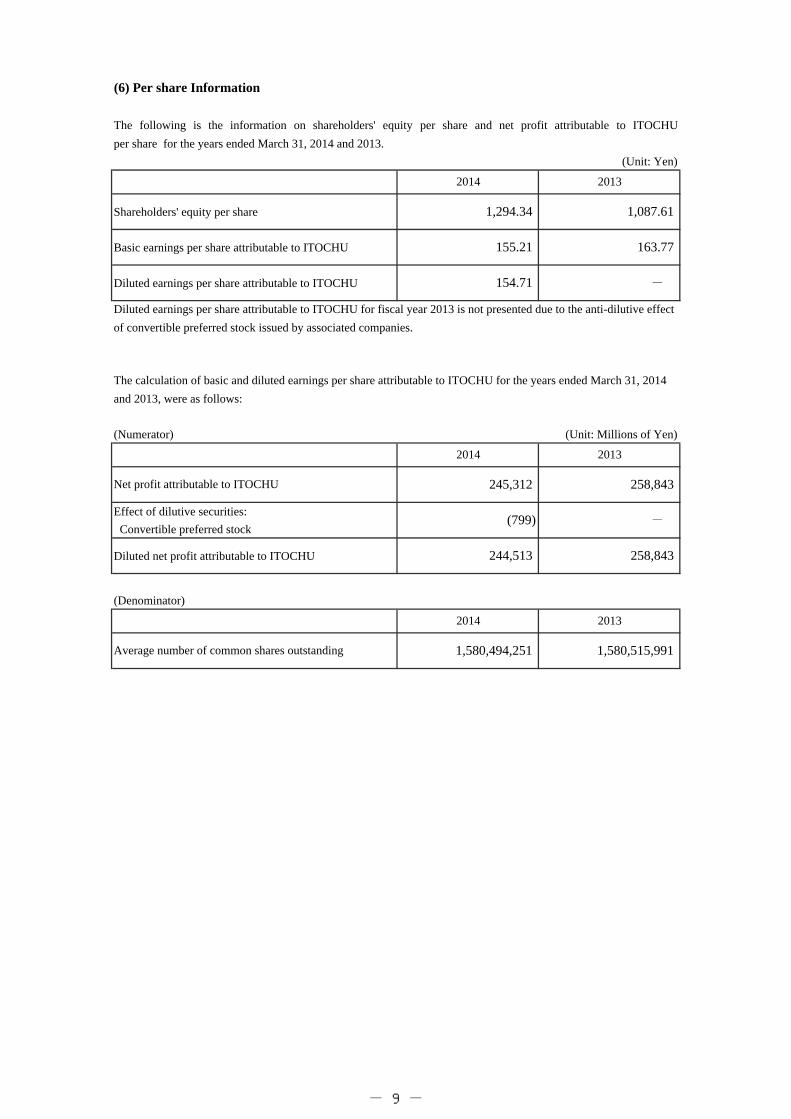
(6) Per share Information
per share for the years ended March 31, 2014 and 2013.
(Unit: Yen)
Shareholders' equity per share
Basic earnings per share attributable to ITOCHU
Diluted earnings per share attributable to ITOCHU
of convertible preferred stock issued by associated companies.
and 2013, were as follows:
(Numerator) (Unit: Millions of Yen)
Effect of dilutive securities:
Convertible preferred stock
Diluted net profit attributable to ITOCHU
(Denominator)
155.21 163.77
The following is the information on shareholders' equity per share and net profit attributable to ITOCHU
2014 2013
1,294.34 1,087.61
244,513 258,843
154.71 -
Diluted earnings per share attributable to ITOCHU for fiscal year 2013 is not presented due to the anti-dilutive effect
The calculation of basic and diluted earnings per share attributable to ITOCHU for the years ended March 31, 2014
2014 2013
Net profit attributable to ITOCHU 245,312 258,843
(799) -
2014 2013
Average number of common shares outstanding 1,580,494,251 1,580,515,991
- 9 -

2. Disclosure of Transition to IFRS
From the accounting period form April 1, 2013 to March 31, 2014, the consolidated financial statements are prepared in conformity with IFRSs.
The effect of the transition from U.S. GAAP to IFRSs on the Company's consolidated financial position, financial results, and cash flows were as follows:
Reconciliation of comprehensive income for the year ended March 31, 2014
Revenue: Revenues:
Sales revenue 5,193,867 (107,164) 5,086,703 Revenues from sale of goods
Trading margins and commissions ontrading transactions
337,028 (337,028)
500,823 500,823 Revenues from rendering of services and royalties
Total revenue 5,530,895 56,631 5,587,526 Total revenues
Cost: Cost:
Cost of sales (4,502,622) 294,470 (4,208,152) Cost of sale of goods
(334,352) (334,352) Cost of rendering of services and royalties
Total cost (4,502,622) (39,882) (4,542,504) Total cost
Gross trading profit 1,028,273 16,749 1,045,022 Gross trading profit
Other income (expenses): Other gains (losses):
Selling, general and administrative expenses (743,117) (6,859) (749,976) Selling, general and administrative expenses
Provision for doubtful receivables (6,062) 8 (6,054) Provision for doubtful accounts
Loss on property and equipment–net (1,616) (34,545) (36,161)Losses on property, plant, equipment and intangibleassets
Other - net 13,033 (2,709) 10,324 Other - net
(44,105) (781,867) Total other losses
Financial income (loss):
Interest income 11,659 (49) 11,610 Interest income
Dividends received 37,079 112 37,191 Dividends received
Interest expense (24,945) (2,141) (27,086) Interest expense
7,581 7,581 Other financial income
5,503 29,296 Total financial income
Gain on investments–net 59,504 (59,504)
56,036 56,036 Equity in earnings of associates and joint ventures
12,275 12,275Gains on disposal and remeasurements of investmentsin subsidiaries, associates and joint ventures
Total other-expenses (654,465)
Income before income taxes and equity in earningsof associated companies
373,808 (13,046) 360,762 Profit before tax
Income taxes (130,408) 24,071 (106,337) Income tax expense
Income before equity in earnings of associatedcompanies
243,400
Equity in earnings of associated companies 85,252 (85,252)
Net income 328,652 (74,227) 254,425 Net profit
Net income attributable to ITOCHU 310,267 (64,955) 245,312 Net profit attributable to ITOCHU
Net income attributable to the noncontrollinginterest
18,385 (9,272) 9,113 Net profit attributable to non-controlling interests
(Unit: Millions of Yen)
U.S. GAAP Adjustments IFRS
- 10 -

Other comprehensive income (loss) (net of tax):Other comprehensive income for the year, net oftax:
Items that will not be reclassified to profit or loss
Unrealized holding gains on securities 476 18,216 18,692 FVTOCI financial assets
Pension liability adjustments 12,674 (1,439) 11,235 Remeasurement of net defined pension liability
5,924 5,924Other comprehensive income in associates andjoint ventures
Items that may be reclassified to profit or loss
Foreign currency translation adjustments 133,031 (67,550) 65,481 Translation adjustments
Unrealized holding gains on derivativeinstruments
75 (4,362) (4,287) Cash flow hedges
58,694 58,694Other comprehensive income in associates andjoint ventures
Total other comprehensive income(loss) (net of tax)
146,256 9,483 155,739Total other comprehensive income for the year,net of tax:
Comprehensive income (loss) 474,908 (64,744) 410,164 Total comprehensive income for the year
Comprehensive income (loss) attributableto ITOCHU
446,214 (54,313) 391,901Total comprehensive income attributableto ITOCHU
Comprehensive income (loss) attributableto the noncontrolling interest
28,694 (10,431) 18,263Total comprehensive income attributableto non-controlling interests
(Unit: Millions of Yen)
U.S. GAAP Adjustments IFRS
- 11 -
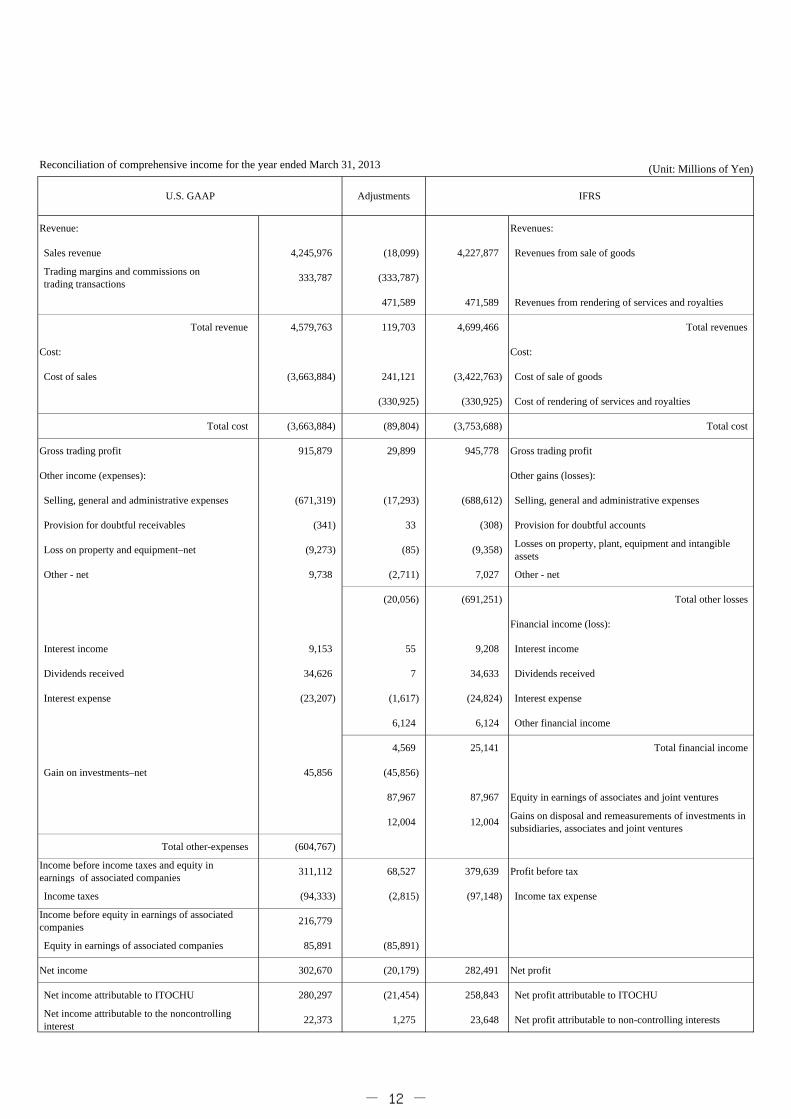
Reconciliation of comprehensive income for the year ended March 31, 2013
Revenue: Revenues:
Sales revenue 4,245,976 (18,099) 4,227,877 Revenues from sale of goods
Trading margins and commissions ontrading transactions
333,787 (333,787)
471,589 471,589 Revenues from rendering of services and royalties
Total revenue 4,579,763 119,703 4,699,466 Total revenues
Cost: Cost:
Cost of sales (3,663,884) 241,121 (3,422,763) Cost of sale of goods
(330,925) (330,925) Cost of rendering of services and royalties
Total cost (3,663,884) (89,804) (3,753,688) Total cost
Gross trading profit 915,879 29,899 945,778 Gross trading profit
Other income (expenses): Other gains (losses):
Selling, general and administrative expenses (671,319) (17,293) (688,612) Selling, general and administrative expenses
Provision for doubtful receivables (341) 33 (308) Provision for doubtful accounts
Loss on property and equipment–net (9,273) (85) (9,358)Losses on property, plant, equipment and intangibleassets
Other - net 9,738 (2,711) 7,027 Other - net
(20,056) (691,251) Total other losses
Financial income (loss):
Interest income 9,153 55 9,208 Interest income
Dividends received 34,626 7 34,633 Dividends received
Interest expense (23,207) (1,617) (24,824) Interest expense
6,124 6,124 Other financial income
4,569 25,141 Total financial income
Gain on investments–net 45,856 (45,856)
87,967 87,967 Equity in earnings of associates and joint ventures
12,004 12,004Gains on disposal and remeasurements of investments insubsidiaries, associates and joint ventures
Total other-expenses (604,767)
Income before income taxes and equity inearnings of associated companies
311,112 68,527 379,639 Profit before tax
Income taxes (94,333) (2,815) (97,148) Income tax expense
Income before equity in earnings of associatedcompanies
216,779
Equity in earnings of associated companies 85,891 (85,891)
Net income 302,670 (20,179) 282,491 Net profit
Net income attributable to ITOCHU 280,297 (21,454) 258,843 Net profit attributable to ITOCHU
Net income attributable to the noncontrollinginterest
22,373 1,275 23,648 Net profit attributable to non-controlling interests
(Unit: Millions of Yen)
U.S. GAAP Adjustments IFRS
- 12 -
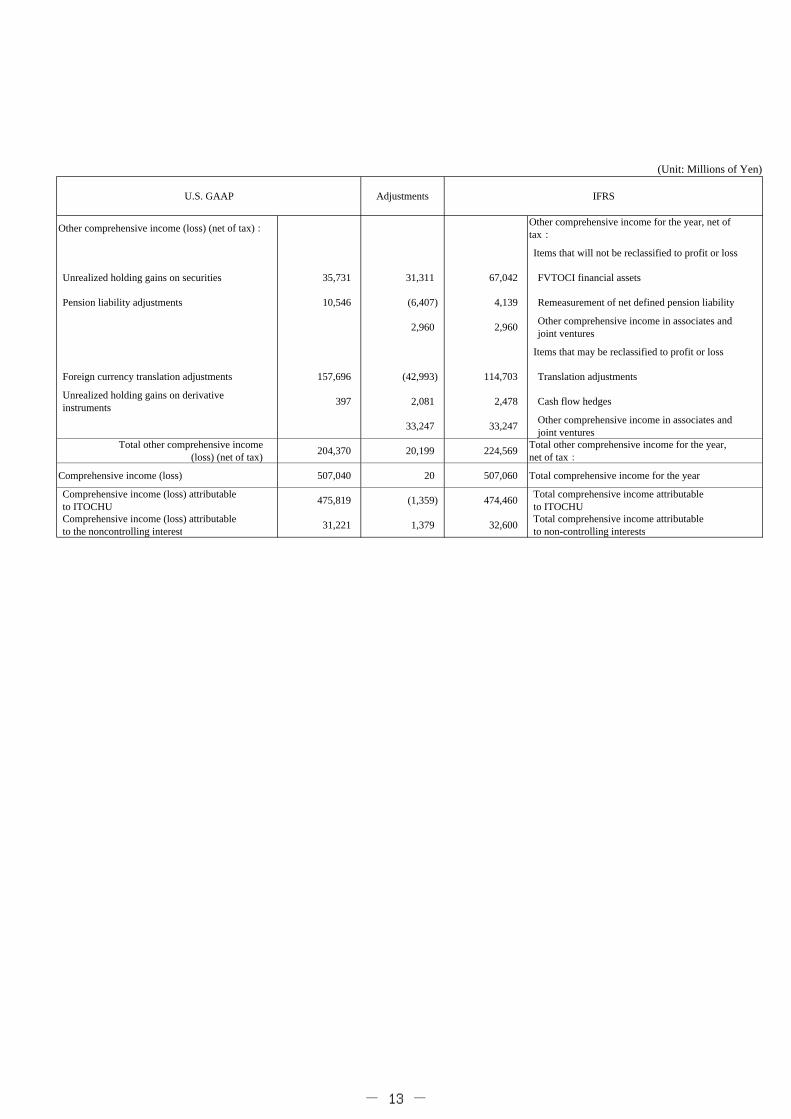
Other comprehensive income (loss) (net of tax):Other comprehensive income for the year, net oftax:
Items that will not be reclassified to profit or loss
Unrealized holding gains on securities 35,731 31,311 67,042 FVTOCI financial assets
Pension liability adjustments 10,546 (6,407) 4,139 Remeasurement of net defined pension liability
2,960 2,960Other comprehensive income in associates andjoint ventures
Items that may be reclassified to profit or loss
Foreign currency translation adjustments 157,696 (42,993) 114,703 Translation adjustments
Unrealized holding gains on derivativeinstruments
397 2,081 2,478 Cash flow hedges
33,247 33,247Other comprehensive income in associates andjoint ventures
Total other comprehensive income(loss) (net of tax)
204,370 20,199 224,569Total other comprehensive income for the year,net of tax:
Comprehensive income (loss) 507,040 20 507,060 Total comprehensive income for the year
Comprehensive income (loss) attributableto ITOCHU
475,819 (1,359) 474,460Total comprehensive income attributableto ITOCHU
Comprehensive income (loss) attributableto the noncontrolling interest
31,221 1,379 32,600Total comprehensive income attributableto non-controlling interests
(Unit: Millions of Yen)
U.S. GAAP Adjustments IFRS
- 13 -

Reconciliation of equity as of March 31, 2014
Assets
Cash and cash equivalents 653,332 407 653,739 Cash and cash equivalents
Time deposits 7,653 - 7,653 Time deposits
Short-term investments 4,536 (4,536)
Trade receivables 1,798,237 329,731 2,127,968 Trade receivables
103,019 103,019 Other current receivables
Due from associated companies 160,768 (160,768)
29,172 29,172 Other current financial assets
Inventories 749,927 (5,486) 744,441 Inventories
Advances to suppliers 79,130 15,430 94,560 Advances to suppliers
Prepaid expenses 52,061 (52,061)
Deferred tax assets 49,758 (49,758)
Other current assets 279,467 (200,483) 78,984 Other current assets
Total current assets 3,834,869 4,667 3,839,536 Total current assets
Investments in and advances toassociated companies
1,816,796 (1,816,796)
1,728,408 1,728,408Investments accounted for by theequity method
Other investments 575,510 (9,574) 565,936 Other investments
Other non-current receivables 150,735 (15,702) 135,033 Non-current receivables
125,255 125,255Non-current financial assets otherthan investments and receivables
Allowance for doubtful receivables (27,594) 27,594
Property and equipment, at cost 856,912 (109,248) 747,664 Property, plant and equipment
29,186 29,186 Investment property
194,934 194,934 Goodwill
245,312 245,312 Intangible assets
Prepaid pension cost 8,057 (8,057)
Deferred tax assets, non-current 20,906 42,187 63,093 Deferred tax assets
Other assets 612,249 (502,850) 109,399 Other non-current assets
Total non-current assets 4,013,571 (69,351) 3,944,220 Total non-current assets
Total assets 7,848,440 (64,684) 7,783,756 Total assets
(Unit: Millions of Yen)
U.S. GAAP Adjustments IFRS
- 14 -

Liabilities and Equity
Short-term debt 402,262 (402,262)
Current maturities of long-term debt 62,730 (62,730)
472,667 472,667Short-term debenturesand borrowings
Trade payables 1,545,928 116,045 1,661,973 Trade payables
70,942 70,942 Other current payables
Due to associated companies 41,526 (41,526)
Accrued expenses 189,646 (189,646)
15,788 15,788 Other current financial liabilities
Income taxes payable 36,389 (189) 36,200 Current tax liabilities
Advances from customers 89,181 16,995 106,176 Advances from customers
Deferred tax liabilities 1,056 (1,056)
Other current liabilities 214,256 33,325 247,581 Other current liabilities
Total current liabilities 2,582,974 28,353 2,611,327 Total current liabilities
Long-term debt, excluding currentmaturities
2,628,937 (2,628,937)
2,420,713 2,420,713Long-term debenturesand borrowings
103,279 103,279 Other non-current financial liabilities
Accrued retirement and severancebenefits
41,613 (41,613)
57,022 57,022Non-current liabilities for employeebenefits
Deferred tax liabilities, non-current 72,093 45,345 117,438 Deferred tax liabilities
74,440 74,440 Other non-current liabilities
Total non-current liabilities 2,742,643 30,249 2,772,892 Total non-current liabilities
Total liabilities 5,325,617 58,602 5,384,219 Total liabilities
Common stock 202,241 - 202,241 Common stock
Capital surplus 113,820 (765) 113,055 Capital surplus
Retained earnings 1,746,843 (380,985) 1,365,858 Retained earnings
Accumulated other comprehensiveincome (loss)
86,859 280,470 367,329 Other components of equity
Foreign currency translation adjustments
65,139 189,878 255,017 Translation adjustments
Pension liability adjustments (75,222) 75,222
Unrealized holding gains on securities
99,737 16,555 116,292 FVTOCI financial assets
Unrealized holding losses on derivative instruments
(2,795) (1,185) (3,980) Cash flow hedges
Treasury stock, at cost (2,800) - (2,800) Treasury stock
Total ITOCHU stockholders' equity 2,146,963 (101,280) 2,045,683 Total shareholders' equity
Noncontrolling interest 375,860 (22,006) 353,854 Non-controlling interests
Total equity 2,522,823 (123,286) 2,399,537 Total equity
Total liabilities and equity 7,848,440 (64,684) 7,783,756 Total liabilities and equity
U.S. GAAP Adjustments IFRS
(Unit: Millions of Yen)
- 15 -

Reconciliation of equity as of the end of March 31, 2013
Assets
Cash and cash equivalents 569,716 619 570,335 Cash and cash equivalents
Time deposits 7,120 - 7,120 Time deposits
Short-term investments 3,655 (3,655)
Trade receivables 1,696,415 383,638 2,080,053 Trade receivables
109,802 109,802 Other current receivables
Due from associated companies 194,449 (194,449)
36,191 36,191 Other current financial assets
Inventories 657,853 7,477 665,330 Inventories
Advances to suppliers 70,871 4,029 74,900 Advances to suppliers
Prepaid expenses 39,355 (39,355)
Deferred tax assets 47,810 (47,810)
Other current assets 268,939 (198,910) 70,029 Other current assets
Total current assets 3,556,183 57,577 3,613,760 Total current assets
Investments in and advances toassociated companies
1,645,568 (1,645,568)
1,571,263 1,571,263Investments accounted for by theequity method
Other investments 530,293 10,846 541,139 Other investments
Other non-current receivables 139,790 (37,360) 102,430 Non-current receivables
140,092 140,092Non-current financial assets otherthan investments and receivables
Allowance for doubtful receivables (35,929) 35,929
Property and equipment, at cost 804,255 (81,372) 722,883 Property, plant and equipment
36,958 36,958 Investment property
151,469 151,469 Goodwill
181,089 181,089 Intangible assets
Prepaid pension cost 223 (223)
Deferred tax assets, non-current 51,447 10,070 61,517 Deferred tax assets
Other assets 425,616 (349,715) 75,901 Other non-current assets
Total non-current assets 3,561,263 23,478 3,584,741 Total non-current assets
Total assets 7,117,446 81,055 7,198,501 Total assets
(Unit: Millions of Yen)
U.S. GAAP Adjustments IFRS
- 16 -

Liabilities and Equity
Short-term debt 435,880 (435,880)
Current maturities of long-term debt 46,664 (46,664)
498,816 498,816Short-term debenturesand borrowings
Trade payables 1,469,155 140,070 1,609,225 Trade payables
80,032 80,032 Other current payables
Due to associated companies 42,606 (42,606)
Accrued expenses 166,714 (166,714)
21,800 21,800 Other current financial liabilities
Income taxes payable 37,758 (17) 37,741 Current tax liabilities
Advances from customers 66,689 1,256 67,945 Advances from customers
Deferred tax liabilities 574 (574)
Other current liabilities 209,901 14,627 224,528 Other current liabilities
Total current liabilities 2,475,941 64,146 2,540,087 Total current liabilities
Long-term debt, excluding currentmaturities
2,447,868 (2,447,868)
2,282,067 2,282,067Long-term debenturesand borrowings
105,733 105,733 Other non-current financial liabilities
Accrued retirement and severancebenefits
36,804 (36,804)
69,118 69,118Non-current liabilities for employeebenefits
Deferred tax liabilities, non-current 44,214 27,015 71,229 Deferred tax liabilities
55,073 55,073 Other non-current liabilities
Total non-current liabilities 2,528,886 54,334 2,583,220 Total non-current liabilities
Total liabilities 5,004,827 118,480 5,123,307 Total liabilities
Common stock 202,241 - 202,241 Common stock
Capital surplus 113,408 (377) 113,031 Capital surplus
Retained earnings 1,501,428 (340,489) 1,160,939 Retained earnings
Accumulated other comprehensiveincome (loss)
(48,939) 294,411 245,472 Other components of equity
Foreign currency translation adjustments
(57,605) 200,371 142,766 Translation adjustments
Pension liability adjustments (87,373) 87,373
Unrealized holding gains on securities
99,018 5,691 104,709 FVTOCI financial assets
Unrealized holding losses on derivative instruments
(2,979) 976 (2,003) Cash flow hedges
Treasury stock, at cost (2,703) - (2,703) Treasury stock
Total ITOCHU stockholders' equity 1,765,435 (46,455) 1,718,980 Total shareholders' equity
Noncontrolling interest 347,184 9,030 356,214 Non-controlling interests
Total equity 2,112,619 (37,425) 2,075,194 Total equity
Total liabilities and equity 7,117,446 81,055 7,198,501 Total liabilities and equity
U.S. GAAP Adjustments IFRS
(Unit: Millions of Yen)
- 17 -

Reconciliation of equity as of April 1, 2012
Assets
Cash and cash equivalents 513,489 (664) 512,825 Cash and cash equivalents
Time deposits 5,173 - 5,173 Time deposits
Short-term investments 2,770 (2,770)
Trade receivables 1,653,412 291,730 1,945,142 Trade receivables
115,254 115,254 Other current receivables
Due from associated companies 159,348 (159,348)
36,652 36,652 Other current financial assets
Inventories 574,345 (4,483) 569,862 Inventories
Advances to suppliers 91,965 14,114 106,079 Advances to suppliers
Prepaid expenses 31,981 (31,981)
Deferred tax assets 48,755 (48,755)
Other current assets 298,848 (217,138) 81,710 Other current assets
Total current assets 3,380,086 (7,389) 3,372,697 Total current assets
Investments in and advances toassociated companies
1,395,351 (1,395,351)
1,345,464 1,345,464Investments accounted for by theequity method
Other investments 484,014 14,332 498,346 Other investments
Other non-current receivables 137,199 (50,876) 86,323 Non-current receivables
96,829 96,829Non-current financial assets otherthan investments and receivables
Allowance for doubtful receivables (42,087) 42,087
Property and equipment, at cost 707,933 (87,435) 620,498 Property, plant and equipment
33,570 33,570 Investment property
140,658 140,658 Goodwill
133,071 133,071 Intangible assets
Prepaid pension cost 67 (67)
Deferred tax assets, non-current 80,729 21,397 102,126 Deferred tax assets
Other assets 363,981 (305,408) 58,573 Other non-current assets
Total non-current assets 3,127,187 (11,729) 3,115,458 Total non-current assets
Total assets 6,507,273 (19,118) 6,488,155 Total assets
(Unit: Millions of Yen)
U.S. GAAP Adjustments IFRS
- 18 -

Liabilities and Equity
Short-term debt 415,268 (415,268)
Current maturities of long-term debt 35,700 (35,700)
451,618 451,618Short-term debenturesand borrowings
Trade payables 1,434,241 100,841 1,535,082 Trade payables
85,237 85,237 Other current payables
Due to associated companies 38,368 (38,368)
Accrued expenses 156,787 (156,787)
27,615 27,615 Other current financial liabilities
Income taxes payable 48,548 112 48,660 Current tax liabilities
Advances from customers 95,575 14,343 109,918 Advances from customers
Deferred tax liabilities 691 (691)
Other current liabilities 225,896 (22,609) 203,287 Other current liabilities
Total current liabilities 2,451,074 10,343 2,461,417 Total current liabilities
Long-term debt, excluding currentmaturities
2,259,717 (2,259,717)
2,084,800 2,084,800Long-term debenturesand borrowings
100,073 100,073 Other non-current financial liabilities
Accrued retirement and severancebenefits
64,304 (64,304)
83,976 83,976Non-current liabilities for employeebenefits
Deferred tax liabilities, non-current 36,037 11,995 48,032 Deferred tax liabilities
67,227 67,227 Other non-current liabilities
Total non-current liabilities 2,360,058 24,050 2,384,108 Total non-current liabilities
Total liabilities 4,811,132 34,393 4,845,525 Total liabilities
Common stock 202,241 - 202,241 Common stock
Capital surplus 112,370 (2,276) 110,094 Capital surplus
Retained earnings 1,296,265 (333,820) 962,445 Retained earnings
Accumulated other comprehensiveincome (loss)
(244,394) 289,227 44,833 Other components of equity
Foreign currency translation adjustments
(208,781) 208,781 - Translation adjustments
Pension liability adjustments (97,861) 97,861
Unrealized holding gains on securities
65,674 (18,094) 47,580 FVTOCI financial assets
Unrealized holding losses on derivative instruments
(3,426) 679 (2,747) Cash flow hedges
Treasury stock, at cost (2,685) - (2,685) Treasury stock
Total ITOCHU stockholders' equity 1,363,797 (46,869) 1,316,928 Total shareholders' equity
Noncontrolling interest 332,344 (6,642) 325,702 Non-controlling interests
Total equity 1,696,141 (53,511) 1,642,630 Total equity
Total liabilities and equity 6,507,273 (19,118) 6,488,155 Total liabilities and equity
U.S. GAAP Adjustments IFRS
(Unit: Millions of Yen)
- 19 -

1. Net profit attributable to ITOCHU and shareholders' equity
The major differences between U.S. GAAP and IFRSs are as follows:
Reconciliation of Net Profit Attributable to ITOCHU (Unit: Billions of Yen) Reconciliation of Consolidated Shareholders' Equity (Unit: Billions of Yen)
310.3 280.3 2,147.0 1,765.4 1,363.8
FVTOCI financial assets (*1) (25.1) (20.0) Measurement of nonmarketable securities (*4) + 72.4 + 75.1 + 62.9
Impairment (*2) (38.1) (0.6) Impairment & Deemed cost (*5) (97.4) (58.9) (60.0)
Tax effects associated with affiliates (*3) (4.6) (5.6) Tax effects associated with affiliates (*3) (55.0) (50.8) (39.3)
Others + 2.9 + 4.7 Others (21.3) (11.9) (10.5)
Adjustment Total (65.0) (21.5) Adjustment Total (101.3) (46.5) (46.9)
245.3 258.8 2,045.7 1,719.0 1,316.9
The major differences between U.S. GAAP and IFRSs are as follows:
*1 FVTOCI Financial Assets
*2 Impairment
*3 Tax Effects Associated with Investments in Affiliates
*4 Fair Value Measurement of Nonmarketable Equity Securities
*5 Deemed Cost
2.Operating Segment Information
Reconciliation of Net Profit Attributable to ITOCHU (Unit: Billions of Yen)
U.S. GAAP IFRS
32.5 24.0
43.4 35.9
74.1 44.5
16.7 12.1
57.5 50.8
76.3 63.8
9.8 14.2
310.3 245.3
Under IFRSs, the fair value is used to evaluate financial instruments classified as FVTOCI financial assets, which mainly consists of equity securities other thanaffiliates, regardless of whether an active market exists. Changes in the fair value are recognized in other comprehensive income, and net gains or losses on disposal andremeasurements are not recognized in profit or loss.
Differences between U.S. GAAP and IFRS (Fiscal Year Ended March 31, 2014)
Net income attributable to ITOCHU 〔U.S. GAAP〕
Total ITOCHU stockholders' equity〔U.S. GAAP〕
Net profit attributable to ITOCHU 〔IFRS〕
Total shareholders' equity〔IFRS〕
FY 2014 FY 2013 March 31, 2014 March 31, 2013 April 1, 2012
Textile (8.5)Decrease due to reclassifications of gains on disposal of equitysecurities other than affiliates into other comprehensive income, andimpairment losses arising due to GAAP differences
Under U.S. GAAP, if there are indications of the possibility of impairment for property, plant and equipment or intangible assets with service lives that can bedetermined, the amount surpassing the fair value is recognized as impairment of the assets, but only if a comparison of the carrying amount and the undiscounted futurecash flows of the assets shows that the carrying amount exceeds the undiscounted future cash flows.Under IFRSs, if there are indications of the possibility of impairment of assets, the amount by which the carrying amount of the assets exceeds the recoverable amount(the higher of value in use or fair value less costs to sell) is recognized as impairment of property, plant and equipment.Further, under U.S. GAAP, for impairment tests of goodwill, the fair value of reporting units and their carrying value including goodwill are compared. If the fair valueof reporting units is less than the carrying value of reporting units, the fair value of goodwill is calculated, and if the calculated fair value of goodwill is less than thecarrying value, the difference is recognized as impairment losses on goodwill.Under IFRSs, if the carrying value of cash-generating units including goodwill surpasses the recoverable amount, the amount by which it is surpassed is recognized asimpairment losses. For impairment losses arising in cash-generating units including goodwill, first goodwill is impaired, and if there is an amount remaining, impairmentlosses are recognized for other assets within cash-generating units.
Regarding the treatment of temporary differences associated with investments in affiliates, under U.S. GAAP, if there are deductible temporary differences arising frominvestments in associated companies, after judging the recoverability of the temporary differences, they are recognized in deferred tax assets. Meanwhile, under IFRSs,there is a difference because, if there are deductible temporary differences arising from investments in associated companies, they are recognized in deferred tax assetsonly if it is probable that the temporary differences will reverse in the foreseeable future and to the extent that taxable amount will be gained.
FVTOCI financial assets without active markets were recognized at cost under U.S. GAAP. However, at the date of transition, the financial assets were evaluated at fairvalue, and the effect of this has been recognized in other components of equity.
Electing to apply the exemption, the fair value of certain property, plant and equipment and investment property at the date of transition is used as the deemed cost.
FY2014Adjustments Major Items
Machinery (7.4)Decrease due to reclassifications of gains on disposal of equitysecurities other than affiliates into other comprehensive income
Metals & Minerals (29.6)Decrease due to impairment loss on mineral-resources-related business,arising due to GAAP differences
Energy & Chemicals (4.6)
Decrease due to reclassifications of gains on disposal of equitysecurities other than affiliates into other comprehensive income, and taxeffects associated with investments in affiliates, arising due to GAAPdifferences
Food (6.6)Decrease due to reclassifications of gains on disposal of equitysecurities other than affiliates into other comprehensive income
Total (65.0)
ICT, General Products & Realty (12.6)Decrease due to reclassifications of gains on disposal of equitysecurities other than affiliates into other comprehensive income, andimpairment losses arising due to GAAP differences
Others, Adjustments & Eliminations + 4.4 Increase due to reclassifications of amortization of actuarial loss arisingfrom employee benefits into other comprehensive income
- 20 -