annual financial report - university of pennsylvania
TRANSCRIPT

Annual Financial Report
2016-2017

Doors of Wisdom are never shut““
– Benjamin Franklin
1755

Content
0 2 FY 2017 Financial Review
34 Management Responsibilities for Financial Statements
35 Independent Auditor’s Report
36 Consolidated Statements of Financial Position
37 Consolidated Statements of Activities
38 Consolidated Statements of Cash Flows
39 Consolidated Notes to Financial Statements
73 Trustees of the University of Pennsylvania
74 Statutory Officers

2
Un
ive
rsit
y o
f P
en
nsy
lva
nia
FROM THE VICE PRESIDENT FOR FINANCE AND TREASURER
Fiscal Year 2017 was a banner year for the University of Pennsylvania as evidenced in extraordinary achievements and strong financial results. Among the financial highlights:
• Penn’s endowment returned a robust 14.3% in FY17 and total
endowment value increased to $12.2 billion from $10.7 billion
in FY16 as a result of strong equity market performance and
exemplary investment management.
• Net assets, a vital measure of current financial health, grew
$1.7 billion, or 12.0%, to end the year at $16.2 billion.

An
nu
al F
ina
ncia
l Re
po
rt 2016-2017
3
• Total contributions increased 12.2% to $438.9 million in FY17
as a result of tremendous generosity from our diverse network
of donors.
• Revenue grew significantly with patient care revenue and
other income both increasing by 7.2% and net tuition and
fees increasing by 3.9%. Sponsored research increased by a
notable 7.0% despite ongoing pressure in the federal funding
landscape.
Overall, Penn’s net assets from operating activities totaled
$297.5 million for FY17. This was $138.9 million below FY16’s
operating margin due to the negative impact of several one-time
accounting policy changes and reclassifications.
Highlighted in this review are the many accomplishments that
demonstrate Penn’s unwavering commitment to honoring the
principles of President Gutmann’s Penn Compact 2020: Inclusion,
Innovation, and Impact. A few examples are: the continued
growth of Financial Aid which supports increasing access to
all students regardless of their ability to pay, the opening of the
New College House that integrates knowledge among students in
a collaborative living space, and the opening of the Perry World
House which exemplifies our initiatives towards
engaging globally.
MARYFRANCES MCCOURTVice President for Finance and Treasurer

4
Un
ive
rsit
y o
f P
en
nsy
lva
nia
BALANCE SHEET AND NET ASSETS
Total assets grew 9.0% over the prior year to $23.1 billion while liabilities
increased 2.5% to $6.8 billion. Cash and cash equivalents decreased $154.8
million, or 13.7%, to $972.8 million as we reinvested excess working capital
into longer term investment vehicles to optimize earnings.
$2,396$2,421
$2,280$2,719
$2,654
$4,369$4,782
$5,154$6,203
$6,452
$9,283$10,800 $11,566 $12,262 $13,977
$1,941 $1,986 $2,190 $2,560 $2,703$2,813 $3,045 $3,318 $4,111 $4,132
FY 13 FY 14 FY 15 FY 16 FY 17
$20,000
$25,000
$15,000
$10,000
$5,000
$0
($5,000)
($10,000)
Cash, Receivables and Other AssetsFixed AssetsInvestmentsDebtPension and Other LiabilitiesNet Assets
BALANCE SHEET ($ in Millions)
Ass
ets
Liab
ilitie
s

An
nu
al F
ina
ncia
l Re
po
rt 2016-2017
5

6
Un
ive
rsit
y o
f P
en
nsy
lva
nia

An
nu
al F
ina
ncia
l Re
po
rt 2016-2017
7
CONSOLIDATED NET ASSETS
Net assets totaled $16.2 billion, an increase of $1.7 billion, or 12.0%, from FY16
primarily due to strong investment performance. Since FY13, consolidated net
assets have grown by 43.9%, impacted by favorable investment and operating
performance, strong fundraising efforts, and the integration of Lancaster
General Health (LGH) into the Health System.
$9.3 $10.4 $10.7 $10.5 $11.6
$2.0
$2.6$2.8 $4.0
$4.6
$11.3$13.0
$13.5$14.5
$16.2
FY 13 FY 14 FY 15 FY 16 FY 17
$12.0
$14.0
$16.0
$18.0
$4.0
$6.0
$8.0
$10.0
$2.0
$0.0
Health SystemAcademic
CONSOLIDATED NET ASSETS($ in Billions)

TUITION AND FEES/ STUDENT FINANCIAL AID
Tuition and student fee revenue increased 3.9% over FY16, from $903.1 million
to $937.9 million, representing 10.2% of FY17 total operating revenue. This total
is net of $333.6 million in undergraduate and graduate financial aid grants and
scholarships, which increased by $11.2 million, or 3.5%, over the prior fiscal year.
The Penn Compact 2020’s mission of Inclusion, Innovation, and Impact continues
to be a guiding principle at Penn. Year after year, access to a world-class Penn
education is expanded further to families of all income levels with Penn’s
commitment to meet 100% of a student’s determined financial need. To promote
inclusion and increased access, Penn provides grant-based undergraduate
financial aid packages and adheres to a need-blind admission policy, in which
admission decisions are not affected by a student’s ability to pay or application
for financial aid.
The average FY17 University grant-based freshman aid package was $46,982, an
increase of 39.8% over the average aid package of $33,608 in FY08, the year the
grant-based aid policy was announced.
Graduate programs at Penn are interdisciplinary with a focus on the integration of
knowledge across all 12 of Penn’s Schools. Penn offers 120 different graduate and
professional programs and attracts the most talented students from all over the world
with new fellowships, grants, and other programs. In addition, Penn is supported by
tremendous generosity from an expansive network of donors and remains committed
to providing substantial financial aid to our graduate and professional students. For
FY17, graduate and professional students and PhD candidates received $197.1 million
in grants, including teaching and research fellowships, $197.6 million in educational
loans and $1.8 million in work-study programs.
Penn’s student aid is primarily supported by operating funds providing 75.5%
with the remaining 24.5% coming from endowment income. Penn’s endowment
spending policy was created in FY09 to further our commitment to increasing
access. In FY17, the dual-payout rates were 5.3% for student financial aid and 5.0%
for all other uses. Over the past five years, total financial aid has increased by $36.7
million, or 19.0%.
8
Un
ive
rsit
y o
f P
en
nsy
lva
nia

$177$185
$196$206
$214
FY 13 FY 14 FY 15 FY 16 FY 17
$200
$225
$175
$150
$125
$100
$75
$50
$25
$0
Grants and Tuition Waivers*
UNDERGRADUATE FINANCIAL AID($ in Millions)
An
nu
al F
ina
ncia
l Re
po
rt 2016-2017
9
*These figures reflect a methodology change and are consistent with the trend reported from previous metrics.

10
Un
ive
rsit
y o
f P
en
nsy
lva
nia
ADMISSIONS
Student demand in FY17 increased 3.8% over FY16, with 40,413
prospective undergraduate students applying for admittance in the fall
of 2017. Of this applicant total, 3,757 were admitted and 65.4% of those
admitted chose to matriculate at Penn. FY17’s selectivity rate decreased
from 9.4% in FY16 to 9.3% in FY17, demonstrating Penn’s success in
attracting the most talented applicants.
Penn’s professional programs are also among the top-ranked in the
country. The Perelman School of Medicine consistently ranks among
the top five medical schools in the country as reported by U.S. News and
World Report while Penn Nursing was ranked as the best nursing school
in the world for the second year in a row by QS World University. Both
offer exemplary education and valuable clinical experiences in two of
the nation's best medical institutions, the Hospital of the University of
Pennsylvania and The Children's Hospital of Philadelphia. Additionally,
Penn Design graduate programs are ranked among the top 10 in the nation
according to the latest survey by DesignIntelligence, serving as a platform
for innovative research as well as community engagement.
63.2%
12.2%
65.2%
10.4%
64.3%
10.2%
67.8%
9.4%
65.4%
9.3%
FY 13 FY 14 FY 15 FY 16 FY 17
16.0%
14.0%
12.0%
10.0%
8.0%
80.0%
70.0%
60.0%
50.0%
40.0%
30.0%6.0%
FRESHMAN SELECTIVITY/YIELD
Matriculation Selectivity

An
nu
al F
ina
ncia
l Re
po
rt 2016-2017
11" Tell me and I forget, teach me and I may remember, involve me and I learn."
– Benjamin Franklin

12
Un
ive
rsit
y o
f P
en
nsy
lva
nia

An
nu
al F
ina
ncia
l Re
po
rt 2016-2017
13
OPERATING REVENUE
Total operating revenue increased by 7.2%, rising from $8.6 billion in FY16
to $9.2 billion in FY17.
FY17 OPERATING REVENUE BY SOURCE($9.2 Billion)
62.0%
9.3%
2.1%5.9%
10.2%
10.5% Tuition and FeesSponsored ProgramPatient ServicesInvestment IncomeContributions and Donor SupportAll Other
$797$817
$845
$903$938
$909$881
$910
$904$967
$3,287 $3,705$4,045
$5,320$5,703
$1,198 $1,207 $1,320 $1,449 $1,586
FY 13 FY 14 FY 15 FY 16 FY 17
$9,000
$10,000
$8,000
$7,000
$6,000
$5,000
$4,000
$3,000
$2,000
$1,000
$0
Tuition and FeesSponsored ProgramPatient ServicesAll Others
OPERATING REVENUE($ in Millions)
$6,191$6,610
$7,120
$8,576$9,194

14
Un
ive
rsit
y o
f P
en
nsy
lva
nia
SPONSORED PROGRAMS
GOVERNMENT AWARDS
INDUSTRY AND FOUNDATIONS AWARDS
Sponsored program revenue, comprised of funding from government and
private-sponsored grants and contracts, represented 10.5% of total operating
revenue and increased 7.0% from the prior fiscal year, from $904.3 million to
$967.2 million in FY17.
As one of the nation’s top research universities, the funding provided to Penn
is vital in generating advances in science, medicine, and other important
fields. Research dollars have allowed Penn Medicine to become a leader in
immunotherapy studies as evidenced in the August 2017 FDA approval of
a CAR T-cell therapy for treatment of patients up to 25 years old with acute
lymphoblastic leukemia. This remarkable breakthrough, developed by Dr. Carl
June and his team, will tremendously impact the lives of cancer patients.
In FY17, a total of $609.1 million, or 61.7%, of Sponsored Program awards came
from the federal government, the largest source of research funding for Penn. Of
the federal government funds, $484.0 million, or 79.5%, came from the National
Institutes of Health (NIH) with the Perelman School of Medicine among the top
three schools in grants awarded by NIH. Overall, total awards issued to Penn in
FY17 decreased by $24.9 million, or 2.5%.
Industry and foundations accounted for $177.1 million, or 18.0%, of total
sponsored program awards. Industry awards decreased 13.3% from $163.9
million in FY16 to $142.0 million in FY17. However, over the past five years,
awards in this category have more than doubled.

An
nu
al F
ina
ncia
l Re
po
rt 2016-2017
15
$909
FY 13 FY 14 FY 15 FY 16 FY 17
$900
$1,200
$600
$300
$0
RevenueAwards
SPONSORED PROGRAMS($ in Millions)
$802
$881 $891 $910$939
$904
$1,012$967 $987

16
Un
ive
rsit
y o
f P
en
nsy
lva
nia
CONTRIBUTIONS
INVESTMENT INCOME
OTHER REVENUE SOURCES
In FY17, the overwhelming generosity of Penn’s loyal supporters allowed for
the fulfillment of critical priorities at every School and Center. Contributions,
defined as new gifts and pledges, totaled $438.9 million, a $47.6 million, or
12.2%, increase from the FY16 total of $391.3 million. FY17 contributions were
comprised of $233.2 million to restricted endowment, $167.6 million to support
operations, $30.5 million towards capital, and $7.6 million to unrestricted
("quasi") endowment.
During FY17, Penn received 117 gifts of more than $1.0 million, with 49 of those
coming from first-time donors at that level. Contributions to The Penn Fund
increased 16.3% from $31.9 million to $37.1 million and annual giving increased
by 11.7% from $70.0 million to $78.2 million. Donors established 102 new
undergraduate scholarships.
Operating investment income, primarily endowment paid out in accordance
with Penn’s spending rule policy, increased by $101.3 million, or 23.0%, from
$439.4 million in FY16 to $540.7 million in FY17. The impact of a policy change
to apply the spending rule to all endowment funds contributed to $72.9 million
of this increase. The spending rule policy is described in more detail under the
Endowment section later in this report.
Other operating revenue sources for the Consolidated University totaled $851.1
million, representing 9.3% of total revenue. Other income increased 7.2% from
$577.7 million in FY16 to $619.2 million in FY17. Sales and services of auxiliary
enterprises increased by 1.4% from $118.6 million to $120.3 million in FY17
while independent operations decreased 1.2% to $78.0 million. Commonwealth
appropriations, which predominantly provides support for Penn’s School of
Veterinary Medicine, increased by 2.1%, from $32.9 million to $33.6 million in FY17.

An
nu
al F
ina
ncia
l Re
po
rt 2016-2017
17

18
Un
ive
rsit
y o
f P
en
nsy
lva
nia
$3,450 $3,670$3,893
$4,729$5,086
$315 $344 $366$453
$471
$2,131 $2,335 $2,464$2,958 $3,340
FY 13 FY 14 FY 15 FY 16 FY 17
$7,500
$10,000
$5,000
$2,500
$0
Compensation and Benefits
OPERATING EXPENSES($ in Millions)
$5,896$6,349
$6,723
$8,140
$8,897
Depreciation and Amortization
Other Operating Expenses

An
nu
al F
ina
ncia
l Re
po
rt 2016-2017
19
OPERATING EXPENSE
Total operating expenses increased by 9.3%, rising from $8.1 billion in
FY16 to $8.9 billion in FY17. Compensation and Benefits, the combination
of salary, wages, and employee fringe benefits is the largest expense
component, representing 57.2% of total operating expenses. Salaries and
wages increased 7.4%, from $3.7 billion in FY16 to $4.0 billion in FY17.
Employee benefits increased 8.0% to $1.1 billion in FY17. These increases
are primarily due to general wage increases and staffing increases
predominantly in the Perelman School of Medicine to support research.
Depreciation and amortization of $471.1 million, representing 5.3% of total
operating expenses, increased 4.1% over FY16. Interest on indebtedness
totaled $80.4 million, accounting for 0.9% of total operating expenses.
Interest expense increased 2.3% from FY16 to FY17, impacted by the
University’s new debt issuance of $178.4 million.
Other operating expenses, predominantly purchases of supplies and
services, increased 13.2%, from $2.9 billion in FY16 to $3.3 billion in FY17,
and represents 36.6% of total operating expense. Included here is the $86.3
million expense impact related to the decapitalization of library materials
that were previously capitalized and amortized over 10 years.
57.2%
5.3%
37.5%
Compensation and BenefitsDepreciation and AmortizationOther Operating Expenses
FY17 OPERATING EXPENSES BY SOURCE($8.9 Billion)

20
Un
ive
rsit
y o
f P
en
nsy
lva
nia
CAPITAL EXPENDITURES
Capital expenditures for the Consolidated University increased from $767.4
million in FY16 to $781.4 million in FY17.
In FY17, capital expenditures for the academic portion of the University totaled
$308.9 million, down from $336.3 million in FY16. Remarkable growth in
infrastructure took place around our campus, including both new construction
projects and the renovation of existing structures. In addition, funds provided
by the Century Bonds enabled cost-saving energy efficiency projects to be
completed or continued, including upgrades to HVAC and lighting in several
campus buildings.
Fall of 2016 brought forth the opening of the Perry World House and the New
College House at Hill Field, exemplifying both inclusion and impact at Penn.
The Perry World House, opened in September, 2016, demonstrates the impact
of engaging locally and globally. This state-of-the-art building is a global
policy research center positioned at the center of Penn’s campus. It serves
as an interdisciplinary space for international affairs across the University
and includes research labs, lecture halls, and areas for students and faculty to
collaborate and share their wide range of expertise. The New College House,
complete with a garden courtyard, green roofs, a lifted lawn, and a media center,
is a residential structure that provides 350 students with a shared community
living space while preserving and showcasing a vibrant green landscape. The
seven-story building is filled with interconnected spaces that offer students
continuous opportunities for learning and social engagement.
The Summer 2017 re-opening of the Hill College House also exemplifies
Penn’s commitment to inclusion and impact. Built in 1960, the internationally
recognized Hill College House has undergone an $80 million comprehensive
renovation begun in FY16 which includes new student lounges and seminar
rooms built around a central atrium overlooking a first floor dining room. The
contemporary new design provides a welcoming and modern residence and
strengthens the sense of community among students.

An
nu
al F
ina
ncia
l Re
po
rt 2016-2017
21
In FY17, construction continued on The Perelman Center for Political Science
and Economics (PCPSE), a building that will integrate the Political Science
Department, Department of Economics, and other related programs at the
School of Arts and Sciences. The PCPSE will be located in a new facility that
will combine a rehabilitation of an existing building at 133 S. 36th Street with
a significant addition to its north and will include a 120-seat auditorium,
classrooms, meeting rooms, and faculty offices.
These capital projects represent Penn’s fulfillment of the objectives outlined
in Penn Connects 2.0 (http://www.pennconnects.upenn.edu/growing_greener/
penn_connects_2.0.php), a land use and urban design campus plan that
advances Penn as a premier urban research university. Penn Connects promotes
sustainability and development initiatives including reinvestment in existing
buildings and infrastructure, reduction of energy demand, and creation of
pedestrian transportation modes with the least amount of environmental impact.
As later described in this report, UPHS invested $472.5 million in capital
projects highlighted by their new patient pavilion, a clinical facility with 500
private patient rooms and 50 operating and procedure rooms in a 1.5 million
square foot, 16-story facility.
$273
FY 13 FY 14 FY 15 FY 16 FY 17
$450
$600
$300
$150
$0
Academic
CAPITAL EXPENDITURES ($ in Millions)
$226 $234
$342
$266
$527
$336
$431
$309
$473
Health System

" An investment in knowledge pays the best interest"
– Benjamin Franklin
22
Un
ive
rsit
y o
f P
en
nsy
lva
nia

An
nu
al F
ina
ncia
l Re
po
rt 2016-2017
23
The University and UPHS have issued debt in order to fulfill strategic plans
for infrastructure expansion and maintenance projects. As these important
initiatives are fulfilled, the preservation of working capital is prioritized and
debt and liquidity levels are continuously monitored. Consolidated debt totaled
$2.7 billion in FY17, an increase of $142.5 million, or 5.6%, from FY16.
Capitalizing on FY17’s favorable interest rate environment, UPHS refinanced
existing debt with the $129.3 million PHEFA UPHS Series C of 2016 Revenue
Bonds, resulting in approximately $15.9 million in net present value savings
and closed in August, 2016. In addition, the University issued the $178.4 million
PHEFA University of Pennsylvania Series A of 2017 Revenue Bonds which
closed in January, 2017. Proceeds from this issuance were used to reimburse
costs in connection with various capital projects including construction of the
Perelman Center for Political Science and Economics and the Stephen A. Levin
Building, renovations including energy efficient HVAC upgrades in Stemmler
Hall and the Evans Building, and the Mod VII Chiller Plant Expansion.
Penn’s credit rating from Standard and Poor’s and Moody’s Investors Services is
AA+/Aa1 for the University and AA-/Aa3 for UPHS.
$0.9 $1.0$1.2
$1.6 $1.5
$1.0 $1.0 $1.0 $1.0 $1.2
FY 13 FY 14 FY 15 FY 16 FY 17
$2.5
$3.0
$2.0
$1.5
$1.0
$0.5
$0
Academic Debt
OUTSTANDING DEBT($ in Billions)
$1.9$2.0
$2.2
$2.6 $2.7
UPHS Debt
DEBT
24
Un
ive
rsit
y o
f P
en
nsy
lva
nia
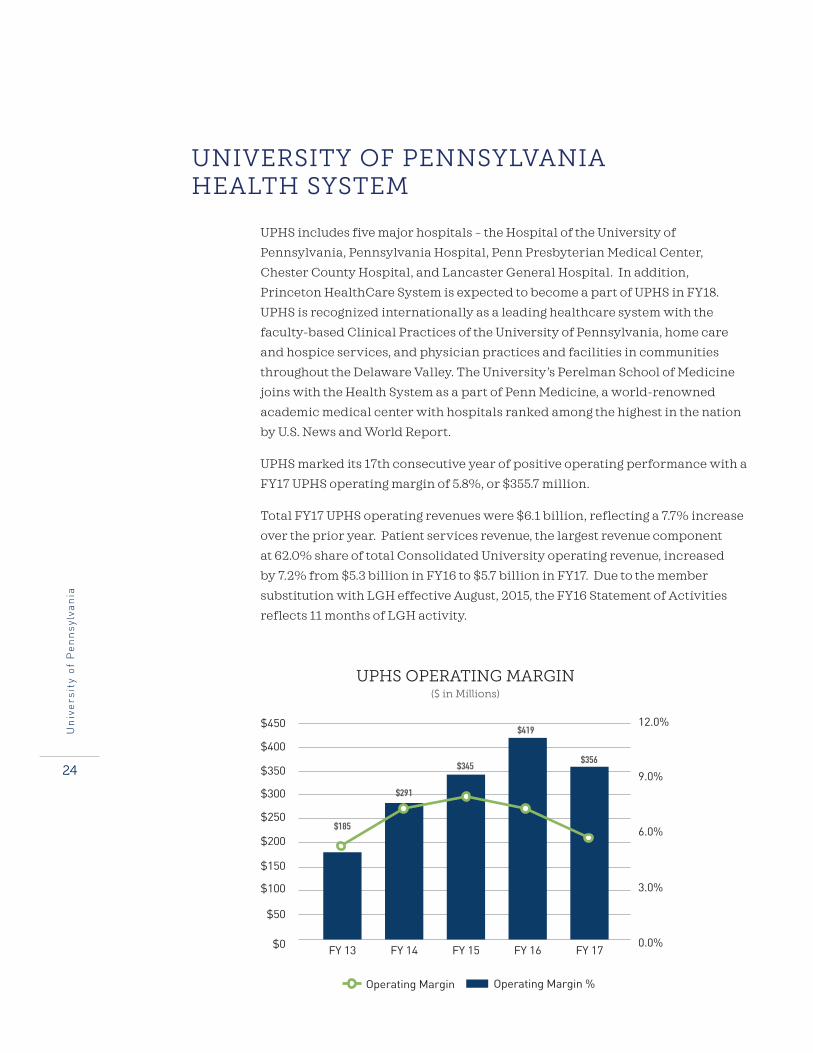
UNIVERSITY OF PENNSYLVANIA HEALTH SYSTEM
UPHS includes five major hospitals – the Hospital of the University of
Pennsylvania, Pennsylvania Hospital, Penn Presbyterian Medical Center,
Chester County Hospital, and Lancaster General Hospital. In addition,
Princeton HealthCare System is expected to become a part of UPHS in FY18.
UPHS is recognized internationally as a leading healthcare system with the
faculty-based Clinical Practices of the University of Pennsylvania, home care
and hospice services, and physician practices and facilities in communities
throughout the Delaware Valley. The University’s Perelman School of Medicine
joins with the Health System as a part of Penn Medicine, a world-renowned
academic medical center with hospitals ranked among the highest in the nation
by U.S. News and World Report.
UPHS marked its 17th consecutive year of positive operating performance with a
FY17 UPHS operating margin of 5.8%, or $355.7 million.
Total FY17 UPHS operating revenues were $6.1 billion, reflecting a 7.7% increase
over the prior year. Patient services revenue, the largest revenue component
at 62.0% share of total Consolidated University operating revenue, increased
by 7.2% from $5.3 billion in FY16 to $5.7 billion in FY17. Due to the member
substitution with LGH effective August, 2015, the FY16 Statement of Activities
reflects 11 months of LGH activity.
FY 13 FY 14 FY 15 FY 16 FY 17
$400
$450
$350
$250
$300
$200
$150
$100
$50
$0
9.0%
12.0%
6.0%
3.0%
0.0%
Operating Margin
UPHS OPERATING MARGIN($ in Millions)
$185
$291
$345$356
Operating Margin %
$419

An
nu
al F
ina
ncia
l Re
po
rt 2016-2017
25
Total adjusted admissions, defined as admissions adjusted for outpatient
activity, were higher than the prior year by 6.2%. Patient acuity, as measured
by case mix index (CMI), increased 1.6% over the prior year. Activity growth
in target outpatient programs such as chemotherapy, proton therapy, and
outpatient surgery contributed to the revenue growth.
UPHS operating expenses for FY17 were $5.8 billion, an increase of 9.5% over the
prior year.
Increase in unrestricted net assets for the Health System for FY17, including non-
operating revenue and realized/unrealized gain on investments, totaled $613.4
million. Excluding the $1.3 billion contribution recognized related to the FY16 LGH
member substitution, the increase in net assets outperformed prior year primarily
due to higher investment returns and a $154.1 million favorable pension and other
post-retirement benefit plan adjustment resulting from favorable market conditions.
FY17 Days Cash on Hand of 242 days was consistent with prior year while Debt-
to-Capitalization improved to 26.7%, from 30.5% in FY16.
UPHS capital expenditures for FY17 were $472.6 million, an increase of $41.5
million over the prior year. The increase in expenditures was primarily
attributable to the realization of some notable strategic projects including the
foundation and groundwork for the new patient pavilion. This clinical facility
will support Penn’s world-renowned researchers, clinicians, and faculty, and
will include 500 private patient rooms, 50 operating and procedure rooms, and
an Emergency Department. Also included in FY17 capital expenditures are the
Center for Advanced Cellular Therapeutics and the EPIC PennChart information
system project, a new electronic medical records system that was successfully
implemented across all Penn Medicine locations during FY17.
125,224
FY 13 FY 14 FY 15 FY 16 FY 17
250,000
300,000
200,000
150,000
100,000
50,000
0
Adjusted Admissions*
UPHS ADJUSTED AND INPATIENT ADMISSIONS
73,558
147,113
81,750
157,036
83,163
224,959
114,764
238,983
118,566
Inpatient Admissions
*Adjusted for outpatient activity

26
Un
ive
rsit
y o
f P
en
nsy
lva
nia
ENDOWMENT
The University of Pennsylvania’s endowment totaled $12.2 billion as
of June 30, 2017, an increase of $1.5 billion over the past year. Penn’s
endowment is comprised of over 7,000 individual endowment funds
benefiting the University’s schools, centers, and Health System.
The vast majority of Penn’s endowment is invested in the Associated
Investments Fund, a pooled investment vehicle in which the many
individual endowments and trusts hold shares or units. An Investment
Board appointed by the Trustees of the University oversees the investment
of the Associated Investment Fund (AIF). The University’s Office of
Investments is responsible for the day-to-day management of the AIF and
implements the policies approved by the Investment Board.
The purpose of Penn’s endowment is to provide stable and perpetual
support for the mission and programs of the University. Achieving this
objective requires an investment and spending program that supports
intergenerational equity. The AIF must provide substantial and stable
spending today, but it also must preserve purchasing power to provide
comparable resources to future generations. Penn seeks to resolve the
tension between these competing needs by investing in a diversified, equity-
oriented portfolio and by adhering to a disciplined spending rule that
smooths the annual impact of changes in AIF value on the operating budget.
1997 2002 2007 2012 2017
$12,000
$14,000
$10,000
$8,000
$6,000
$4,000
$2,000
$0
Value AIF Payout
$500
$600
$400
$300
$200
$100
$0
ENDOWMENT GROWTH AND AIF PAYOUT($ in Millions)

An
nu
al F
ina
ncia
l Re
po
rt 2016-2017
27
The University’s endowment spending policy balances the objectives of
maximizing budgetary support to endowed programs and maintaining
purchasing power of the endowment into perpetuity. The actual payout in
any given year is determined by a formula designed to smooth the impact of
short-term changes in the endowment’s value on spending distributions. The
spending rule target payout for FY17 was based on the sum of: (i) 70% of the
prior fiscal year distribution adjusted by an inflation factor; and (ii) 30% of the
lagged fiscal year-end fair value of the AIF, multiplied by 5.3% for financial aid
funds and 5.0% for all other funds.
Payouts from the endowment provided $492.4 million in budgetary support
to the University during FY17. Spending support from the AIF for University
operations has grown steadily over the past decade, increasing even through the
financial crisis. For the year ended June 30, 2017, spending distributions from
the AIF supported approximately 13% of the University’s academic operating
budget, up from less than 8% a decade ago.
The endowment supports a wide range of purposes across the institution, with
the significant majority of funds dedicated to instructional use, healthcare, and
student financial aid.
3.7%
51.7%
23.2%
17.9%
0.9% 2.6%
InstructionResearchAcademic Support
ENDOWMENT BY PURPOSEAs of June 30, 2017
Student AidHealth CareAll Other

28
Un
ive
rsit
y o
f P
en
nsy
lva
nia

An
nu
al F
ina
ncia
l Re
po
rt 2016-2017
29
AIF INVESTMENT PROGRAM
Penn builds its investment program around several simple tenets. First, in
order to achieve the high returns necessary to preserve purchasing power
after spending, the AIF is invested with a strong equity orientation. With the
exception of fixed income, Penn expects that all asset classes in which it invests
can earn equity-like returns over long periods of time. Second, Penn builds a
portfolio that is diversified across different fundamental drivers of return. The
University focuses on areas with the greatest inefficiencies across asset classes,
strategies, and geographies. Finally, Penn capitalizes upon the perpetual
nature of the University to invest with a long time horizon, creating a significant
advantage relative to the many market participants who must focus on near-
term certainty instead of long-term attractiveness when evaluating investments.
Penn has established a Strategic Asset Allocation (SAA), with investment class
target ranges which represent reasonable allocation ranges for the portfolio in
a normal environment. Portfolios within these ranges reflect the broad equity
orientation and diversification that Penn seeks. The SAA guidelines consist
of ranges rather than point targets to reflect the impossibility of knowing the
future investment opportunity set facing the University. As the portfolio evolves
towards the SAA ranges, Penn uses an Interim Policy Portfolio (IPP) to guide
asset allocation over shorter periods.
US EquitiesInternational EquitiesEmerging Markets
AIF ASSET ALLOCATIONas of June 30, 2017
Absolute ReturnPrivate EquityReal Estate
Natural ResourcesFixed Income/Cash
8.3%
12.8%
9.7%
29.0%
19.5%
6.4%
6.2%
8.1%

30
Un
ive
rsit
y o
f P
en
nsy
lva
nia
Penn revisits its asset allocation ranges and targets periodically to ensure that
they appropriately reflect both the University’s long-term investment needs and
the opportunity set facing Penn. The most recent review occurred in June, 2017.
The evolution of Penn’s asset allocation towards a stronger equity orientation,
greater diversification and more inefficient markets has been steady over time.
The AIF portfolio includes investments in illiquid funds, some of which
require Penn to make capital commitments that will be drawn down and
invested over a period of time. As of June 30, 2017, the AIF had $2.9 billion in
outstanding commitments to various limited partnerships. The AIF maintains a
conservative liquidity profile that can accommodate these commitments in both
normal environments and periods of market stress or dislocation.
41%
US Equities
PrivateEquity
RealEstate
NaturalResources
FixedIncome
International Equities
EmergingMarket Equities
AbsoluteReturn
40%
45%
35%
30%
25%
20%
15%
10%
5%
0%
1997
PENN’S PORTFOLIO DIVERSIFICATION OVER TIME
2007 2017
24%
8%10%
27%
13%
7%5%
10%
18%
29%
5%
20%
8%
4%6%
1%
6%
34%
16%
8%

An
nu
al F
ina
ncia
l Re
po
rt 2016-2017
31
“By failing to prepare, you are preparing to fail.”
– Benjamin Franklin

32
Un
ive
rsit
y o
f P
en
nsy
lva
nia
AIF PERFORMANCE
The AIF returned 14.3% in FY17, resulting in investment gains of $1.3 billion.
After spending, gifts, and other transfers, the AIF increased by $1.4 billion,
ending the fiscal year with a value of $10.9 billion. The broad endowment ended
the year at $12.2 billion, an increase of $1.5 billion.
FY17 was a very strong year for global equity markets. Penn’s equity-oriented
asset classes benefited from this backdrop. Outperformance relative to Penn’s
composite benchmark (a blend of asset class benchmarks) was driven by solid
returns across most assets classes, including notable relative performance in
the domestic and international developed foreign equity portfolios.
Over longer periods, Penn’s performance has consistently outpaced the
composite benchmark. Importantly, Penn’s long-term performance has
enabled the AIF to exceed its goal of maintaining purchasing power after
spending distributions.
14.3%
1 Year 3 Year 5 Year 10 Year 20 Year
12.0%
16.0%
8.0%
4.0%
0.0%
Penn
COMPARATIVE RETURNS
11.7%
6.6%
3.8%
10.2%
8.1%
6.0%4.9%
7.4%6.3%
Composite Benchmark

FUTURE OUTLOOK
Looking ahead to Fiscal Year 2018, Penn will build upon the many achievements
of FY17 and will continue to be dedicated to The Penn Compact 2020 ’s principles
of Inclusion, Innovation and Impact. With the guidance of our distinguished
Board of Trustees, overwhelming generosity of our donors, and the commitment
of our talented students, esteemed faculty, and dedicated staff, we are well-
positioned for continued success in FY18.
MaryFrances McCourt
Vice President for Finance and Treasurer
An
nu
al F
ina
ncia
l Re
po
rt 2016-2017
33

34
Un
ive
rsit
y o
f P
en
nsy
lva
nia
The University of Pennsylvania encompasses the academic University and the University of Pennsylvania Health System (UPHS). The academic University and UPHS have their own separate management with responsibility for their respective financial reporting.
The academic University oversees the process of consolidating UPHS’s information into the consolidated financial statements. Management of the academic University and UPHS is responsible for the integrity and objectivity of their respective portions of these financial statements and represents that, with respect to its financial information, the consolidated financial statements in this annual report have been prepared in conformity with generally accepted accounting principles.
The accompanying consolidated financial statements have been audited by the University’s independent auditors, Pricewaterhouse Coopers LLP. Their audit opinion, on the following page, expresses an informed judgment as to whether the consolidated financial statements, considered in their entirety, present fairly, in conformity with U.S. GAAP, the consolidated financial position and changes in net assets and cash flows. The independent auditors’ opinion is based on audit procedures described in their report, which include obtaining an understanding of systems, procedures and internal accounting controls, and performing tests and other audit procedures to provide reasonable assurance that the financial statements are neither materially misleading nor contain material errors.
The University maintains a system of internal controls over financial reporting, which is designed to provide a reasonable assurance to the University’s management and Boards of Trustees regarding the preparation of reliable published financial statements. Such controls are maintained by the establishment and communication of accounting and financial policies and procedures, by the selection and training of qualified personnel, and by an internal audit program designed to identify internal control weaknesses in order to permit management to take appropriate corrective action on a timely basis. There are, however, inherent limitations in the effectiveness of any system of internal control, including the possibility of human error and the circumvention of controls. Accordingly, even an effective internal control system can provide only reasonable assurance with respect to financial statement preparation. Furthermore, the effectiveness of the internal control system can change with circumstances.
The Board of Trustees of the academic University and the separate Board of Trustees of Penn Medicine, through their respective Audit and Compliance Committees comprised of trustees not employed by the University or UPHS, are responsible for engaging the independent auditors and meeting with management, internal auditors and the independent auditors to independently assess whether each is carrying out its responsibilities. Both the internal auditors and the independent auditors have full and free access to the respective Audit Committees.
Amy Gutmann Craig R. Carnaroli MaryFrances McCourt John Horn President Executive Vice President Vice President for Finance Comptroller and Treasurer
MANAGEMENT RESPONSIBILITIES FOR FINANCIAL STATEMENTS

An
nu
al F
ina
ncia
l Re
po
rt 2016-2017
35
PricewaterhouseCoopers LLP, Two Commerce Square, Suite 1800, 2001 Market Street, Philadelphia, PA 19013-7042 T: (267) 330 - 3000, F: (267) 330 - 3300, www.pwc.com/us
Report of Independent Auditors To the Trustees of the University of Pennsylvania: We have audited the accompanying consolidated financial statements of the University of Pennsylvania (the “University”), which comprise the consolidated statements of financial position as of June 30, 2017 and 2016, and the related consolidated statements of activities and of cash flows for the years then ended. Management's Responsibility for the Consolidated Financial Statements Management is responsible for the preparation and fair presentation of the consolidated financial statements in accordance with accounting principles generally accepted in the United States of America; this includes the design, implementation, and maintenance of internal control relevant to the preparation and fair presentation of consolidated financial statements that are free from material misstatement, whether due to fraud or error. Auditors' Responsibility Our responsibility is to express an opinion on the consolidated financial statements based on our audits. We conducted our audits in accordance with auditing standards generally accepted in the United States of America. Those standards require that we plan and perform the audit to obtain reasonable assurance about whether the consolidated financial statements are free from material misstatement. An audit involves performing procedures to obtain audit evidence about the amounts and disclosures in the consolidated financial statements. The procedures selected depend on our judgment, including the assessment of the risks of material misstatement of the consolidated financial statements, whether due to fraud or error. In making those risk assessments, we consider internal control relevant to the University’s preparation and fair presentation of the consolidated financial statements in order to design audit procedures that are appropriate in the circumstances, but not for the purpose of expressing an opinion on the effectiveness of the University’s internal control. Accordingly, we express no such opinion. An audit also includes evaluating the appropriateness of accounting policies used and the reasonableness of significant accounting estimates made by management, as well as evaluating the overall presentation of the consolidated financial statements. We believe that the audit evidence we have obtained is sufficient and appropriate to provide a basis for our audit opinion. Opinion In our opinion, the consolidated financial statements referred to above present fairly, in all material respects, the financial position of the University of Pennsylvania as of June 30, 2017 and 2016, and its changes in net assets and its cash flows for the years then ended in accordance with accounting principles generally accepted in the United States of America.
September 29, 2017

36
Un
ive
rsit
y o
f P
en
nsy
lva
nia
CONSOLIDATED STATEMENTS OF FINANCIAL POSITION Consolidated Statements of Financial Position
The accompanying notes are an integral part of these consolidated financial statements.
1
F
inan
cial
Rep
ort 2
016
- 201
7
University of Pennsylvania(in thousands)
June 30, 2017 June 30, 2016Assets
Cash and cash equivalents 972,818$ 1,127,602$ Accounts receivable, net 388,212 323,787 Patient receivables, net 696,591 646,878 Contributions receivable, net 241,352 242,849 Loans receivable, net 91,037 97,663 Other assets 263,850 279,887 Investments, at fair value 13,976,628 12,261,643 Property, plant and equipment, net 6,452,306 6,202,907
Total assets 23,082,794$ 21,183,216$
LiabilitiesAccounts payable 242,260$ 237,835$ Accrued expenses and other liabilities 1,993,775 1,788,359 Deferred income 215,613 210,331 Deposits, advances and agency funds 150,336 162,719 Federal student loan advances 82,009 80,796 Accrued retirement benefits 1,448,418 1,630,133 Debt obligations 2,702,950 2,560,454
Total liabilities 6,835,361 6,670,627
Net assetsUnrestricted 9,466,538 8,447,469 Temporarily restricted 3,108,053 2,629,729 Permanently restricted 3,672,842 3,435,391
16,247,433 14,512,589 Total liabilities and net assets 23,082,794$ 21,183,216$
The accompanying notes are an integral part of these consolidated financial statements.

An
nu
al F
ina
ncia
l Re
po
rt 2016-2017
37
CONSOLIDATED STATEMENTSOF ACTIVITIES
Consolidated Statements of Activities
The accompanying notes are an integral part of these consolidated financial statements.
2
F
inan
cial
Rep
ort 2
016
- 201
7
University of Pennsylvaniafor the years ended June 30, 2017 and 2016(in thousands)
2017 2016
UnrestrictedRevenue and other support:
Tuition and fees, net 937,868$ 903,076$ Commonwealth appropriations 33,606 32,927 Sponsored programs 967,189 904,337 Contributions and donor support 194,539 201,488 Investment income 540,679 439,405 Net patient service revenue 5,702,819 5,319,743 Sales and services of auxiliary enterprises 120,265 118,629 Other income 619,183 577,691 Independent operations 78,040 79,024
9,194,188 8,576,320 Expenses:
Compensation and benefits 5,086,246 4,728,829 Depreciation and amortization 471,093 452,748 Interest on indebtedness 80,421 78,634 Other operating expenses 3,258,969 2,879,776
8,896,729 8,139,987
Increase in net assets from operations 297,459 436,333
Nonoperating revenue, net gains, reclassifications and other:Return on investments, net of amounts classified as operating revenue 465,613 (229,472) Pension, OPEB and other, net 221,164 (326,234) Contributions and donor support for capital related activities 34,833 1,413,635
Total nonoperating revenue, net gains, reclassifications and other 721,610 857,929
Increase in unrestricted net assets 1,019,069 1,294,262
Temporarily RestrictedContributions 159,146 202,633 Return on investments, net 735,228 (82,844) Net assets released from restrictions (416,050) (516,775)
Increase (decrease) in temporarily restricted net assets 478,324 (396,986)
Permanently RestrictedContributions 203,286 136,471 Return on investments, net 34,165 (12,178)
Increase in permanently restricted net assets 237,451 124,293
Increase in net assets from nonoperating and restricted revenue, net gains, reclassifications and other 1,437,385 585,236
Increase in total net assets 1,734,844 1,021,569
Net assets, beginning of year 14,512,589 13,491,020
Net assets, end of year 16,247,433$ 14,512,589$
The accompanying notes are an integral part of these consolidated financial statements.

38
Un
ive
rsit
y o
f P
en
nsy
lva
nia
CONSOLIDATED STATEMENTS OF CASH FLOW
Consolidated Statements of Cash Flows
The accompanying notes are an integral part of these consolidated financial statements.
F
inan
cial
Rep
ort 2
016
- 201
7
3
University of Pennsylvaniafor the years ended June 30, 2017 and 2016(in thousands)
2017 2016Cash flows from operating activities:
Increase in net assets 1,734,844$ 1,021,569$ Adjustment to reconcile increase in net assets to
net cash provided by operating activities:Depreciation and amortization 471,387 452,748 Provision for bad debts 201,231 222,591 (Gain) loss on investments, net (1,358,190) 223,085 Loss on disposal of property, plant and equipment 87,153 4,562 Donated equipment (937) (341) Proceeds from split-interest agreements designated for operations 22,515 22,508 Receipt of contributed securities (113,317) (49,593) Proceeds from contributed securities 29,436 18,112 Receipt of contributions designated for the acquisition of
long-lived assets and long-term investment (177,858) (1,507,309) Pension, OPEB and other, net (221,164) 321,672 Changes in operating assets and liabilities:
Patient, accounts and loans receivable (308,636) (300,276) Contributions receivable 914 29,298 Other assets 6,905 (16,797) Accounts payable, accrued expenses and accrued retirement benefits 51,591 31,433 Deposits, advances and agency funds (12,789) 46,737 Deferred income 5,282 40,232
Net cash provided by operating activities 418,367 560,231
Cash flows from investing activities:Purchase of investments (7,879,448) (8,217,553) Proceeds from sale of investments 7,682,436 8,293,026 Purchase of property, plant and equipment (781,421) (767,373) Cash acquired in Lancaster General Hospital (LGH) membership substitution - 97,307
Net cash used by investing activities (978,433) (594,593)
Cash flows from financing activities:Proceeds from contributions received designated for the
acquisition of long-lived assets and long-term investment 179,000 220,594 Proceeds from contributed securities received designated for the
acquisition of long-lived assets and long-term investment 83,278 30,338 Federal student loan advances 1,213 447 Repayment of long-term debt (58,509) (103,366) Proceeds from issuances of long-term debt 200,300 79,967
Net cash provided by financing activities 405,282 227,980 Net (decrease) increase in cash and cash equivalents (154,784) 193,618 Cash and cash equivalents, beginning of year 1,127,602 933,984 Cash and cash equivalents, end of year 972,818$ 1,127,602$
Supplemental disclosure of cash flow information:Cash paid for interest, net of amounts capitalized 79,944$ 81,108$ Contributed securities received 113,317 49,593 Increase in accrued property, plant and equipment 32,301 18,572 Assets acquired in LGH membership substitution - 1,984,574 Liabilities assumed in LGH membership substitution - 696,689 Contribution received in LGH membership substitution - 1,287,885
The accompanying notes are an integral part of these consolidated financial statements.

CONSOLIDATED NOTES TO FINANCIAL STATEMENTS
An
nu
al F
ina
ncia
l Re
po
rt 2016-2017
39
Consolidated Notes to Financial Statements
F
inan
cial
Rep
ort 2
016
– 20
17
4
1. Significant Accounting Policies Organization The University of Pennsylvania (the University), located in Philadelphia, Pennsylvania, is an independent, nonsectarian, not-for-profit institution of higher learning founded in 1740. The University Academic Component (Academic Component) provides educational services, primarily for students at the undergraduate, graduate, professional and postdoctoral levels and performs research, training and other services under grants, contracts and similar agreements with sponsoring organizations, primarily departments and agencies of the United States Government. The University also operates an integrated health care delivery system, the University of Pennsylvania Health System (UPHS). The University is a tax-exempt organization under Section 501(c) (3) of the Internal Revenue Code. Basis of Presentation The consolidated financial statements have been prepared on the accrual basis of accounting and include the accounts of the University and its subsidiaries, over which the University has a controlling financial interest or exercises control. All material transactions between the University and its subsidiaries are eliminated in consolidation. Investments in subsidiaries over which the University has the ability to exercise significant influence are reported using the equity method of accounting. Other investments in subsidiaries are reported using the cost method of accounting. The net assets of the University are classified and reported as follows:
Unrestricted - Net assets that are not subject to donor-imposed restrictions.
Temporarily restricted - Net assets that are subject to legal or donor-imposed restrictions that will be met by actions of the University and/or the passage of time. These net assets include gifts donated for specific purposes and appreciation on permanent endowment, which is restricted by Pennsylvania law on the amounts that may be expended in a given year.
Permanently restricted – The original value of donor restricted net assets, the use of which is limited to investment and can only be appropriated for expenditure by the University in accordance with the Pennsylvania Uniform Principal and Income Act (Pennsylvania Act).
Expenses are reported as a decrease in unrestricted net assets. Gains and losses on investments are reported as increases or decreases in unrestricted net assets unless their use is restricted by explicit donor stipulation or by law. Donor-restricted resources intended for the acquisition or construction of long-lived assets are initially reported as temporarily restricted net assets and released from restrictions from temporarily restricted net assets to unrestricted net assets when the asset is placed in service or in accordance with donor-specified terms.
Expirations of temporary restrictions on contributions and investment income, reported as Net assets released from restrictions, and the corresponding amounts are included in the Consolidated Statements of Activities as follows (in thousands):
Temporarily Restricted Net Assets 2017 2016
Net assets released from restrictions (416,050)$ (516,775)$
Unrestricted Net Assets 2017 2016
Contributions and donor support 118,077$ 125,241$
Investment income 263,140 241,766
Contributions and donor support for capital related activit ies 34,833 149,768
Net assets released from restrictions 416,050$ 516,775$

CONSOLIDATED NOTES TO FINANCIAL STATEMENTS
40
Un
ive
rsit
y o
f P
en
nsy
lva
nia
Consolidated Notes to Financial Statements
F
inan
cial
Rep
ort 2
016
- 201
7
5
Gains or losses associated with investment activities are included in Return on investments, net. Gains or losses associated with property, plant and equipment disposals are included in Other operating expenses. Gains or losses associated with all other activities, such as debt retirements and pension and postretirement plan actuarial valuation adjustments are reported in Pension, Other post-retirement employee benefits (OPEB) and other, net. Certain prior period amounts have been reclassified to conform to the current year’s presentation due primarily to the adoption, as of June 30, 2017, of the standard on Clarifying When a Not-for-Profit Entity That Is a General Partner or a Limited Partner Should Consolidate a For-Profit Limited Partnership or Similar Entity, issued by the Financial Accounting Standards Board (FASB) in January 2017. The standard allows not-for-profit entities that have elected the fair value option to deconsolidate investments in limited partnerships and similar entities and report them at fair value. The standard was applied retrospectively. Fair Value The University values certain financial and non-financial assets and liabilities by applying the FASB pronouncement on Fair Value Measurements. The pronouncement defines fair value and establishes a framework for measuring fair value that includes a hierarchy that categorizes and prioritizes the sources used to measure and disclose fair value. Fair value is defined as the price that would be received to sell an asset or paid to transfer a liability in an orderly transaction between market participants at the measurement date (an exit price). The hierarchy is broken down into three levels based on inputs that market participants would use in valuing the asset or liability and are developed based on market data obtained from sources independent of the University as follows:
Level 1: Unadjusted quoted market prices in active markets for identical assets or liabilities. Level 2: Unadjusted quoted prices in active markets for similar assets or liabilities, unadjusted
quoted prices for identical or similar assets or liabilities in markets that are not active, or inputs other than quoted prices that are observable.
Level 3: Unobservable inputs for the asset or liability. Inputs broadly refer to the assumptions that market participants use to make valuation decisions, including assumptions about risk. Inputs may include price information, volatility statistics, specific and broad credit data, liquidity statistics and other factors. The University is required by the pronouncement to maximize the use of observable inputs (Levels 1 and 2) and minimize the use of unobservable inputs (Level 3). The University considers observable data to be that market data which is readily available, regularly distributed or updated, reliable and verifiable, not proprietary and provided by independent sources that are actively involved in the relevant market. The categorization of a financial instrument within the hierarchy is based upon the pricing transparency of the instrument and does not necessarily correspond to the University's perceived risk of that instrument. Assets and liabilities are disclosed in the Consolidated Notes to Financial Statements within the hierarchy based on the lowest (or least observable) input that is significant to the measurement. The University’s assessment of the significance of an input requires judgment, which may affect the valuation and categorization within the fair value hierarchy. The fair value of assets and liabilities using Level 3 inputs are generally determined by using pricing models or discounted cash flow methods, which all require significant management judgment or estimation. As a practical expedient, the University is permitted to estimate the fair value of an investment in an investment company at the measurement date using the reported net asset value (NAV). Adjustment is required if the University expects to sell the investment at a value other than NAV or if the NAV is not calculated in accordance with US generally accepted accounting principles (US GAAP). The University holds investments in its portfolio which are generally valued based on the most current NAV. This amount represents fair value of these investments at June 30, 2017 and 2016. Investments reported at NAV, as a practical expedient, are not included within levels 1, 2, or 3 in the fair value hierarchy.
CONSOLIDATED NOTES TO FINANCIAL STATEMENTS
An
nu
al F
ina
ncia
l Re
po
rt 2016-2017
41
Consolidated Notes to Financial Statements
F
inan
cial
Rep
ort 2
016
– 20
17
6
The University performs additional procedures including due diligence reviews on its investments in investment companies and other procedures with respect to the capital account or NAV provided to ensure conformity with US GAAP. The University has assessed factors including, but not limited to, managers’ compliance with the Fair Value Measurement standard, price transparency and valuation procedures in place. Cash and Cash Equivalents Cash equivalents include short-term, highly liquid investments and are carried at cost which approximates fair value. Unrestricted short-term investments available for current operations with maturities of three months or less when purchased are classified as cash equivalents. Investments, at Fair Value The majority of the University's investments are held in the Associated Investments Fund (AIF). The AIF is invested in accordance with the investment policies set out by an Investment Board which has been appointed by the Trustees of the University of Pennsylvania (the Trustees). The Office of Investments is responsible for the day-to-day management of the AIF including identifying, selecting and monitoring a variety of external investment managers to implement the strategic asset allocation set forth by the Investment Board. The AIF may include marketable and not readily marketable securities that it intends to hold for an indefinite period of time. The University also holds other investments which are not invested in the AIF due to various restrictions. The majority of these investments are in highly liquid short-term and equity type investments. Changes in the fair value of investments are reported in Return on investments, net in the Consolidated Statements of Activities. The following is a summary of the investments held in the AIF by asset allocation as well as investment risk: Short-Term Short-term investments include cash equivalents and fixed income investments with maturities of less than one year. Short-term investments are valued using observable market data and are categorized as Level 1 based on quoted market prices in active markets. The majority of these short-term investments are held in a US Treasury money market account. Equity Equity investments consist of direct holdings of public securities in managed accounts as well as exchange traded funds, commingled funds and limited partnerships. The securities held in managed accounts, along with exchange traded funds are generally valued based on quoted market prices in active markets obtained from exchange or dealer markets for identical assets, and are accordingly categorized as Level 1. Commingled funds and limited partnerships are valued at NAV. Debt Debt investments consist of direct holdings of securities in managed accounts and limited partnerships. Securities such as US Treasuries, held in managed accounts, are valued based on quoted market prices in active markets and are categorized as Level 1. Securities such as corporate bonds, high yield bonds and bank loans, also held in managed accounts, are valued based on quoted market prices or dealer or broker quotations and are categorized as Level 2 or in the cases where inputs are unobservable as Level 3. Limited partnership interests are valued at NAV. Absolute Return Absolute return investments are made up of allocations to limited partnerships. The fund managers of limited partnerships invest in a variety of securities, based on the strategy of the fund, which may or may not be quoted in an active market. Illiquid investments, if any, are generally designated as a side pocket by hedge fund managers and may be valued based on an appraised value, discounted cash flow, industry comparables or some other method. Limited partnership interests are valued at NAV.

CONSOLIDATED NOTES TO FINANCIAL STATEMENTS
42
Un
ive
rsit
y o
f P
en
nsy
lva
nia
Consolidated Notes to Financial Statements
F
inan
cial
Rep
ort 2
016
- 201
7
7
Real Estate Investments in real estate are primarily in the form of close-ended limited partnership interests. The fund managers of limited partnerships primarily invest in private investments for which there is no readily determinable market value. The fund manager may value the underlying private investments based on an appraised value, discounted cash flow, industry comparables or some other method. These limited partnership investments are valued at NAV. Real estate investments also include an open-ended real estate investment trust valued at NAV. Private Equity Investments in private equity are in the form of close-ended limited partnership interests. The fund managers of limited partnerships primarily invest in private investments for which there is no readily determinable market value. The fund manager may value the underlying private investments based on an appraised value, discounted cash flow, industry comparables or some other method. These limited partnership investments are valued at NAV.
Natural Resources Investments in natural resources are made up of limited partnership interests and securities in managed accounts. The limited partnership fund managers primarily invest in private investments for which there is no readily determinable market value. The fund manager may value the underlying private investments based on an appraised value, discounted cash flow, industry comparables or some other method. These limited partnership investments are valued at NAV. The University directly holds the securities held in the managed accounts through a custodial relationship. The securities held in the managed accounts are generally valued based on quoted market prices in active markets obtained from exchange or dealer markets for identical assets, and are accordingly categorized as Level 1.
Derivatives The University, in the normal course of business, utilizes derivative financial instruments in connection with its investment activity. Derivatives utilized by the University include futures, options, swaps and forward currency contracts and are reflected at fair value following the definition of Level 1 and 2 assets and liabilities as previously described. Investments in derivative contracts are subject to foreign exchange and equity price risks that can result in a loss of all or part of an investment. In addition, the University is also subject to additional counterparty risk should its counterparties fail to meet the terms of their contracts. Investment Risks The University’s investing activities expose it to a variety of risks, including market, credit and liquidity risks and attempts to identify, measure and monitor risk through various mechanisms including risk management strategies and credit policies. Market risk is the potential for changes in the fair value of the University’s investment portfolio. Commonly used categories of market risk include currency risk (exposure to exchange rate differences between functional currency relative to other foreign currencies), interest rate risk (changes to prevailing interest rates or changes in expectations of futures rates) and price risk (changes in market value other than those related to currency or interest rate risk, including the use of NAV provided). Credit risk is the risk that one party to a financial investment will cause a financial loss for the other party by failing to discharge an obligation (counterparty risk). Liquidity risk is the risk that the University will not be able to meet its obligations associated with financial liabilities.

CONSOLIDATED NOTES TO FINANCIAL STATEMENTS
An
nu
al F
ina
ncia
l Re
po
rt 2016-2017
43
Consolidated Notes to Financial Statements
F
inan
cial
Rep
ort 2
016
– 20
17
8
Endowment The University’s endowment consists of 6,126 donor-restricted permanent or term endowment funds and 881 unrestricted endowment funds established by management for a variety of purposes. The University reports all endowment investments at fair value. The majority of the endowment funds of the University have been pooled in the University’s AIF, which is invested in equities, bonds, hedge funds, natural resources, private equity and real estate limited partnerships. The endowment funds not pooled in the AIF are primarily invested in equities and bonds. The Commonwealth of Pennsylvania has not adopted the Uniform Management of Institutional Funds Act (UMIFA) or the Uniform Prudent Management of Institutional Funds Act (UPMIFA). Rather, the Pennsylvania Act governs the investment, use and management of the University’s endowment funds. The Pennsylvania Act does not require the preservation of the fair value of a donor’s original gift as of the gift date of a donor-restricted endowment fund, absent explicit donor stipulations to the contrary. However, based on its interpretation of the Pennsylvania Act and relevant accounting literature, the University classifies as permanently restricted net assets for reporting purposes: (i) the original value of gifts donated to the permanent endowment; (ii) the original value of subsequent gifts to the permanent endowment; and (iii) accumulations to the permanent endowment made in accordance with the direction of the applicable donor gift instrument at the time the accumulation is added to the fund. The remaining portion of the donor-restricted endowment fund that is not classified in permanently restricted net assets is classified as temporarily restricted net assets until those amounts are appropriated for expenditure by the University. The Pennsylvania Act allows a nonprofit to elect to appropriate for expenditure between 2% and 7% of the endowment fair value, determined at least annually and averaged over a period of three or more preceding years. In accordance with the Pennsylvania Act, the University has elected to adopt and follow an investment policy seeking a total return for the investments held by the AIF, whether the return is derived from appreciation of capital or earnings and distributions with respect to capital or both. The endowment spending policy which the Board of Trustees has elected to govern the expenditure of funds invested in the AIF is designed to manage annual spending levels and is independent of the cash yield and appreciation of investments for the year. For Fiscal Year 2017, the spending rule target payout was based on the sum of: (i) 70% of the prior fiscal year distribution adjusted by an inflation factor; and (ii) 30% of the prior fiscal year-end fair value of the AIF, lagged one year, multiplied by 5.3% for financial aid funds and 5.0% for all other funds. The payout or allocation to operations exceeded actual income, net of expenses and net of income permanently reinvested, by $485,860,000 in 2017 and by $365,366,000 in 2016. Effective for Fiscal Year 2018, the University revised its spending rule formula to align the target spending rate for both the financial aid and non-financial aid endowments at 5.0%.
Property, Plant and Equipment
Property, plant and equipment (‘PPE’) is reported net of related depreciation. Donated PPE is reported based on estimated fair value at the date of acquisition. Capital leases are categorized as buildings or equipment and are reflected at the lower of the net present value of the minimum lease payments or the fair value of the leased asset at the inception of the lease. All other PPE is reported at cost. Depreciation is computed on the straight-line method over the estimated useful lives of the assets or the shorter of the lease term or estimated useful life of the asset for capital lease assets. Contributions of library materials as well as rare books and other collectibles, are not recorded for financial statement presentation, while purchases are recorded as Other operating expenses on the Consolidated Statement of Activities in the period acquired.
Split-Interest Agreements
The University’s split-interest agreements with donors consist of irrevocable charitable remainder trusts, charitable gift annuities, pooled income funds, perpetual trusts and charitable lead trusts. Assets are invested and payments are made to donors and/or other beneficiaries in accordance with the respective agreements.

CONSOLIDATED NOTES TO FINANCIAL STATEMENTS
44
Un
ive
rsit
y o
f P
en
nsy
lva
nia
Consolidated Notes to Financial Statements
F
inan
cial
Rep
ort 2
016
- 201
7
9
The University recognizes assets contributed to charitable remainder trusts, charitable gift annuities and pooled income funds, where it serves as trustee, at fair value, recognizes a liability to the beneficiaries based on the present value of the estimated future payments to beneficiaries to be made over the estimated remaining life of those beneficiaries using current market rates at the date of the contribution, and recognizes the difference as contribution revenue. Subsequently, the trust assets, invested in equity and debt securities, are measured at fair value at quoted market prices, and are categorized as Level 1, with the changes reported as an adjustment to Investments, at fair value on the Consolidated Statements of Financial Position and Return on investments, net on the Consolidated Statements of Activities. Liabilities to beneficiaries are revalued based on current market rates, and are categorized as Level 2, with the changes reported as an adjustment to Liabilities associated with investments on the Consolidated Statements of Financial Position and Return on investments, net on the Consolidated Statements of Activities. Charitable remainder trust assets, where the University does not serve as trustee, are initially valued using the current fair value of the underlying assets, using observable market inputs based on its beneficial interest in the trust, discounted to a single present value using current market rates at the date of the contribution. The initially contributed assets are categorized as Level 3, and reported as Investments, at fair value on the Consolidated Statements of Financial Position and Contribution revenue on the Consolidated Statements of Activities. Subsequent valuation follows this same approach with changes in fair value reported as an adjustment to Investments, at fair value on the Consolidated Statements of Financial Position and Return on investments, net on the Consolidated Statements of Activities. The primary unobservable input used in the fair value measurement of the Charitable remainder trust assets is the discount rate. Significant fluctuation in the discount rates utilized in this calculation could result in a material change in fair value. Perpetual trust assets are initially valued at the current fair value of the underlying assets using observable market inputs based on its beneficial interest in the trust. The initially contributed assets are categorized as Level 3 and are reported as Investments, at fair value on the Consolidated Statements of Financial Position and as Contribution revenue on the Consolidated Statements of Activities. Subsequent valuation follows this same approach with changes in fair value reported as an adjustment to Investments, at fair value on the Consolidated Statements of Financial Position and Return on investments, net on the Consolidated Statements of Activities. The primary unobservable inputs used in the fair value measurement of the perpetual trust assets are the underlying securities held by the trust. Significant fluctuation in the market value of these underlying securities could result in a material change in fair value. The University reports charitable lead trust assets by discounting future cash flows using current market rates at the measurement date, matched to the payment period of the agreement. The initially contributed assets are categorized as Level 3, and reported as Investments, at fair value on the Consolidated Statements of Financial Position and as Contribution revenue on the Consolidated Statements of Activities. Subsequent valuation follows this same approach with changes in fair value reported as an adjustment to Investments, at fair value on the Consolidated Statements of Financial Position and Return on investments, net on the Consolidated Statements of Activities. The primary unobservable input used in the fair value measurement of the Charitable lead trust assets is the discount rate. Significant fluctuation in the discount rates utilized in this calculation could result in a material change in fair value. Income Taxes The University is a tax exempt organization under Section 501 (c) (3) of the Internal Revenue Code. Most of its activities and income are related to its exempt purposes and are exempt from federal and state income taxes. None of its activities and income is subject to Pennsylvania income tax. Unrelated activities and income, including certain sales of healthcare related products and services and certain sales of computer hardware and software, are subject to federal “Unrelated Business Income Tax.” The University regularly evaluates its tax position and does not believe it has any uncertain tax positions that require disclosure or adjustment to the consolidated financial statements.

CONSOLIDATED NOTES TO FINANCIAL STATEMENTS
An
nu
al F
ina
ncia
l Re
po
rt 2016-2017
45
Consolidated Notes to Financial Statements
F
inan
cial
Rep
ort 2
016
– 20
17
10
Tuition and Fees The University maintains a policy of offering qualified undergraduate applicants admission to the University without regard to financial circumstance. This policy provides financial aid to eligible students in the form of direct grants and employment during the academic year. The University maintains an aid program whereby any qualified undergraduate student with demonstrated financial need receives an aid package which predominantly includes grants and a work-study award. Students may still borrow at their discretion to supplement their aid packages. Tuition and fees have been reduced by certain grants and scholarships in the amount of $333,582,000 in 2017 and $322,367,000 in 2016.
Sponsored Programs The University receives grant and contract revenue from governmental and private sources. In 2017 and 2016, grant and contract revenue earned from governmental sources totaled $713,113,000 and $696,148,000, respectively. The University generally recognizes revenue associated with the direct and the applicable indirect costs of sponsored programs as the related costs are incurred. The University negotiates its federal indirect rate with its cognizant federal agency. Indirect costs recovered on federally-sponsored programs are generally based on predetermined reimbursement rates which are stated as a percentage and distributed based on the modified total direct costs incurred. Indirect costs recovered on all other grants and contracts are based on rates negotiated with the respective sponsors. Funds received for sponsored research activity are subject to audit. Based upon information currently available, management believes that any liability resulting from such audits will not materially affect the financial position or operations of the University.
Contributions Unrestricted Contributions and donor support includes net assets released as a result of corresponding expenditures which met donor imposed restrictions. Contributions, including unconditional promises to donate cash and other assets, are recognized as revenue in the period received and are reported as increases in the appropriate net asset category based on donor restrictions. Contributions designated for the acquisition of long-lived assets and long-term investment are reported in Nonoperating revenue, net gains, reclassifications and other. The University reports unconditional pledges at fair value by discounting future cash flows using current market rates at the measurement date, ranging from 2.00% to 3.28%, matched to the payment period of the agreement, and accordingly categorizes these assets as Level 3. The primary unobservable input used in the fair value measurement of the University's Contributions receivable is the discount rate. Significant fluctuation in the discount rates utilized in this calculation could result in a material change.
Net Patient Service Revenue Net patient service revenue is derived from UPHS patient services and is accounted for at established rates on the accrual basis in the period the service is provided. Patient service revenue is net of charity care and community services. Certain revenue received from third-party payors is subject to audit and retroactive adjustment. Any changes in estimates under these contracts are recorded in operations currently.
Use of Estimates The preparation of financial statements in conformity with accounting principles generally accepted in the United States requires management to make estimates and assumptions that affect the reported amounts of assets and liabilities and disclosure of contingent assets and liabilities at the date of the financial statements and the reported amounts of revenue and expenses during the reporting period. Actual results could differ from those estimates. Recent Authoritative Pronouncements In May 2014, the FASB issued a standard on Revenue from Contracts with Customers. This standard implements a single framework for recognition of all revenue earned from customers. This framework ensures that entities appropriately

CONSOLIDATED NOTES TO FINANCIAL STATEMENTS
46
Un
ive
rsit
y o
f P
en
nsy
lva
nia
Consolidated Notes to Financial Statements
F
inan
cial
Rep
ort 2
016
- 201
7
11
reflect the consideration to which they expect to be entitled in exchange for goods and services by allocating transaction price to identified performance obligations and recognizing revenue as performance obligations are satisfied. Qualitative and quantitative disclosures are required to enable users of financial statements to understand the nature, amount, timing, and uncertainty of revenue and cash flows arising from contracts with customers. The standard is effective for fiscal years beginning after December 15, 2017. University management is evaluating the impact this will have on the consolidated financial statements beginning in Fiscal Year 2019. In August 2016, the FASB issued a standard on the Presentation of Financial Statements of Not-for-Profit Entities. The new guidance requires improved presentation and disclosures to help not-for-profits provide more relevant information about their resources to donors, grantors, creditors and other users. The standard is effective for fiscal years beginning after December 15, 2017. University management is evaluating the impact this will have on the consolidated financial statements beginning in Fiscal Year 2019. In February 2016, the FASB issued a standard on Leases. This standard requires lessees to recognize assets and liabilities for the rights and obligations created by leases with terms in excess of 12 months. The recognition, measurement, and presentation of expenses and cash flows arising from a lease will primarily depend on its classification as a finance or operating lease. The accounting by lessors remains largely unchanged. This standard is effective for fiscal years beginning after December 15, 2018. University management is evaluating the impact this will have on the consolidated financial statements beginning in Fiscal Year 2020. In March 2017, the FASB issued a standard on Improving the Presentation of Net Periodic Pension Cost and Net Periodic Postretirement Benefit Cost. Presently, net benefit cost is reported as an employee cost within Increase in net assets from operations (or capitalized into assets when appropriate.) This standard requires the bifurcation of net benefit cost, as follows: service cost will continue to be reported in Compensation and benefits, while the remaining components of net benefit cost will be reported in Pension, OPEB and other, net. This standard is effective for fiscal years beginning after December 15, 2019. However, University management plans to early adopt this standard for Fiscal Year 2018 and estimates that the retrospective impact will result in an increase to Net assets from operations of $45,798,000 for the year ended June 30, 2017.
2. University of Pennsylvania Health System - Summarized Financial and Related Information The Trustees formed Penn Medicine, the governance structure which oversees the activities of UPHS and the University of Pennsylvania Perelman School of Medicine (PSOM). The governing body operates, oversees and coordinates the academic, research and clinical missions of Penn Medicine.
UPHS is comprised of the following operating entities: Clinical Practices of the University of Pennsylvania; Clinical Care Associates; Hospital of the University of Pennsylvania; Penn Presbyterian Medical Center; Pennsylvania Hospital of the University of Pennsylvania Health System; Chester County Hospital and Health System; Wissahickon Hospice of the University of Pennsylvania Health System; Franklin Casualty Insurance Company, a wholly owned Risk Retention Group; and, Quaker Insurance Company Ltd., a wholly owned offshore captive insurance company, (collectively referred to as RRG/Captive). In August 2015, through a membership substitution, Lancaster General Health (LGH) became a part of UPHS. Throughout the year, certain transactions (primarily billings for allocations of common costs, physicians’ salaries and benefits, certain purchased services and support for PSOM) are conducted between UPHS and the University. Nonoperating, net, as shown below, includes transfers from UPHS to the University of $180,632,000 and $159,055,000 in 2017 and 2016, respectively, to further the research and educational activities of PSOM and $0 and $1,748,000 in 2017 and 2016, respectively, for other activities. In addition, UPHS recognized operating expenses of $19,351,000 and $20,648,000 in 2017 and 2016, respectively, to support academic operating activities in the clinical departments of PSOM.

CONSOLIDATED NOTES TO FINANCIAL STATEMENTS
An
nu
al F
ina
ncia
l Re
po
rt 2016-2017
47
Consolidated Notes to Financial Statements
F
inan
cial
Rep
ort 2
016
– 20
17
12
The effect of all these transactions is included in the following summarized financial information of UPHS as of and for the years ended June 30, 2017 and 2016 (in thousands):
2017 2016Net patient service revenue 5,903,582$ 5,545,187$ Provision for bad debt (193,651) (218,621) Net patient service revenue less bad debts 5,709,931 5,326,566 Other revenue 428,721 375,249Total expenses (5,783,002) (5,282,693)Excess of revenue over expenses from operations 355,650 419,122 Nonoperating, net 306,274 843,161Increase in net assets 661,924$ 1,262,283$
Total current assets 1,481,230$ 1,522,213$ Assets whose use is limited:
Held by trustees 116,085 66,596RRG/ Captive 195,982 177,873Donor restricted and other 581,629 538,122Designated 2,303,595 2,009,628
Property and equipment, net 3,309,820 3,082,914Investments and other assets 962,164 933,134
Total assets 8,950,505$ 8,330,480$
Total current liabilities 876,636$ 808,518$ Long-term debt, net of current portion 1,451,816 1,482,176Other liabilities 1,938,223 2,017,880
Total liabilit ies 4,266,675$ 4,308,574$
Net assetsUnrestricted 4,093,287$ 3,479,899$ Temporarily restricted 406,073 367,159Permanently restricted 184,470 174,848
Total net assets 4,683,830$ 4,021,906$ Total liabilities and net assets 8,950,505$ 8,330,480$
Net Patient Service Revenue
Net Patient Service Revenue (‘NPSR’), net of contractual allowances and discounts, is as follows for the years ended June 30, 2017 and 2016 (in thousands):
2017 2016
Third Party Payors 5,798,498$ 5,378,831$
Self-Pay 105,084 166,356
Total All Payors 5,903,582$ 5,545,187$
NPSR for the years ended June 30, 2017 and 2016 is derived from the following payors:
2017 2016
Medicare (including Managed Medicare) 30% 30%
Medicaid (including Managed Medicaid) 12% 11%
Managed Care 32% 29%
Independence Blue Cross (IBC) 20% 23%
Commercial 4% 4%
Self Pay 2% 3%
100% 100%

CONSOLIDATED NOTES TO FINANCIAL STATEMENTS
48
Un
ive
rsit
y o
f P
en
nsy
lva
nia
Consolidated Notes to Financial Statements
F
inan
cial
Rep
ort 2
016
- 201
7
13
UPHS has agreements with the following third-party payors that provide for payments at amounts that differ from its established rates:
Inpatient acute care services and outpatient services rendered to Medicare program beneficiaries are paid at prospectively determined rates. These rates vary according to a patient classification system that is based on clinical, diagnostic, and other factors. Inpatient psychiatric services and medical education costs related to Medicare beneficiaries are paid based on a cost reimbursement methodology. UPHS is reimbursed for cost reimbursable items at a tentative rate with final settlement determined after submission of annual cost reports by each hospital and audits thereof by the Medicare fiscal intermediary.
Inpatient and outpatient services rendered to Medicaid program beneficiaries are paid at prospectively determined rates. Additional amounts are allocated to each hospital for training residents and serving a disproportionate indigent population.
Laws and regulations governing the Medicare and Medicaid programs are extremely complex and subject to interpretation. As a result, there is at least a reasonable possibility that recorded estimates will change by a material amount in the near term.
During 2017, UPHS and IBC reached agreement on terms of a five-year agreement. Payments made for inpatient services provided to IBC traditional and managed care subscribers are effected on a per case rate basis for most services. Payment for outpatient services is principally based upon negotiated fee schedules. Hospital and physician rates also provide for annual inflationary increases. In addition, incentives are paid for high performance with regard to clinical outcomes and patient quality. The agreement continues unless terminated by the parties. During 2015, UPHS and Aetna reached agreement on terms of a new five-year agreement. The terms of the agreement provide payments for inpatient hospital services on a per case rate basis. Payments for outpatient services continue to be predominantly based upon negotiated fee schedules.
UPHS also has reimbursement agreements with certain commercial insurance carriers, health maintenance organizations and preferred provider organizations. The basis for reimbursement under these agreements includes prospectively determined rates per discharge, discounts from established charges and prospectively determined per diem rates.
Charity Care UPHS provides services to patients, who meet certain criteria under its charity care policy, without charge or at amounts less than UPHS’ established rates. Because UPHS does not pursue collections, such amounts have been excluded from NPSR. UPHS estimates the costs of providing charity care services based on data derived from a combination of UPHS’ cost accounting system and the ratio of costs to charges. Of the Total expenses reported above by UPHS, an estimated $16,134,000 and $16,282,000 were incurred as a result of providing services to charity patients for the years ended June 30, 2017 and 2016, respectively. Provision for Bad Debt The provision for bad debt is based on management’s assessment of expected net collections considering economic conditions, historical experience, trends in health care coverage and other collection indicators. Included in this assessment are patients who do not have health insurance or do not meet the criteria to qualify for UPHS’ charity care policy. UPHS pursues collection of these amounts, however certain amounts are deemed to be uncollectible. Periodically throughout the year, management assesses the adequacy of the allowances for uncollectible accounts based upon historical write-off experience by payor category, including not covered by insurance, and history of cash collections. The results of this review are then used to make any modifications to the provision for bad debt to establish an appropriate allowance for uncollectible accounts. No significant modifications were made for Fiscal Years 2017 or 2016. After satisfaction of

CONSOLIDATED NOTES TO FINANCIAL STATEMENTS
An
nu
al F
ina
ncia
l Re
po
rt 2016-2017
49
Consolidated Notes to Financial Statements
F
inan
cial
Rep
ort 2
016
– 20
17
14
amounts due from insurance and reasonable efforts to collect from patients have been exhausted, UPHS follows established guidelines for placing certain past-due patient balances with collection agencies, subject to terms of certain restrictions on collection efforts as determined by UPHS. Account receivables are written off after collection efforts have been followed in accordance with UPHS’ policy. UPHS’ allowances for uncollectible accounts totaled $225,244,000 and $220,700,000 at June 30, 2017 and 2016, respectively. LGH Membership Substitution Effective August 1, 2015, UPHS and LGH entered into an affiliation agreement whereby UPHS became the sole corporate member of LGH. LGH operates three hospitals in South Central Pennsylvania, including Lancaster General Hospital, a 533-bed general acute care hospital, Women & Babies Hospital, a 98-bed facility specializing in women’s health and maternity services, and Lancaster Rehabilitation Hospital, a 59-bed rehabilitation hospital, as well as 14 outpatient centers, 3 urgent care sites, and a physician practice network with nearly 200 primary care and specialty practices at 40 practice sites. No consideration was exchanged for the net assets contributed and costs are expensed as incurred. UPHS recorded non-operating contribution income of $1,287,885,000 in fiscal year 2016 reflecting the fair value of the contributed net assets of LGH on August 1, 2015, of which, $11,289,000 and $12,729,000 were recorded in temporarily restricted and permanently restricted net assets, respectively. Total fair value of assets, liabilities and net assets contributed by LGH and its subsidiaries at August 1, 2015 were as follows (in thousands):
August 1, 2015Cash and cash equivalents 97,307$ Patients accounts receivable, net 99,793 Prepaid expenses and other current assets 56,839 Assets limited as to use 160,855 Property, plant and equipment, net 702,845 Other assets 866,935
Total assets acquired 1,984,574$
Accounts payable and accrued expense 28,668$ Accrued compensation and related benefits 269,072 Estimated third-party settlements 12,484 Long-term debt 306,703 Other liabilities 79,762
Total liabilities assumed 696,689$
Unrestricted 1,263,867$ Temporarily restricted 11,289 Permanently restricted 12,729
Total net assets 1,287,885$ Total liabilities and net assets 1,984,574$
Definitive Agreement with Princeton HealthCare System On December 13, 2016, UPHS signed a definitive agreement whereby Princeton Healthcare System (‘PHS’) will become part of UPHS. PHS is a comprehensive healthcare provider located in central New Jersey that principally includes the University Medical Center of Princeton, a general acute care hospital facility in Plainsboro, New Jersey, with 231 inpatient beds (plus 14 newborn bassinets), and Princeton House Behavioral Health, which includes a 110 bed inpatient facility in Princeton, New Jersey, and four additional outpatient locations. PHS includes approximately 1,200 physicians on staff

CONSOLIDATED NOTES TO FINANCIAL STATEMENTS
50
Un
ive
rsit
y o
f P
en
nsy
lva
nia
Consolidated Notes to Financial Statements
F
inan
cial
Rep
ort 2
016
- 201
7
15
and employs approximately 3,200 people. In 2016, the PHS had approximately $461 million in revenue. The agreement is contingent upon agreed upon closing conditions, including final approval by state and federal authorities. No consideration will be exchanged for the net assets to be contributed. UPHS will record non-operating contribution income reflecting the fair value of the contributed net assets of PHS as of the date of the transaction. As of September 29, 2017, the fair value of the contributed net assets of PHS has not been finalized. A summary of selected data from the audited financial statements of PHS for the years ended December 31, 2016 and 2015 is as follows (in thousands):
2016 2015Total operating revenue 460,973$ 437,331$ Total operating expense 462,788 438,067
Operating loss (1,815)$ (736)$ Nonoperating gain 10,992 7,734
Increase in unrestricted net assets 9,177$ 6,998$ A summary of selected balance sheet data from the audited financial statements of PHS at book value is as follows (in thousands):
December 31, 2016 December 31, 2015Total assets 748,740$ 746,847$ Total liabilit ies 429,407 435,533 Total net assets 319,333 311,314
The data presented above is based on historical information and does not reflect the impact, if any, of fair value adjustments, aligning accounting policies or other transaction related costs or impacts.
3. Accounts Receivable The major components of receivables, net of allowances for doubtful accounts of $17,980,000 and $15,209,000 at June 30, 2017 and 2016, respectively, are as follows (in thousands):
2017 2016
Sponsored research 137,675$ 123,735$ Malpractice 100,167 91,350 Student 13,193 12,798Trade 53,272 44,318Investment income 4,032 3,843Other 79,873 47,743
Total Accounts receivable 388,212$ 323,787$
Accounts receivable are reported at their net realizable value.

CONSOLIDATED NOTES TO FINANCIAL STATEMENTS
An
nu
al F
ina
ncia
l Re
po
rt 2016-2017
51
Consolidated Notes to Financial Statements
F
inan
cial
Rep
ort 2
016
– 20
17
16
4. Loans Receivable Loans receivable, and related allowances for doubtful accounts, consist of the following at June 30, 2017 and 2016 (in thousands):
Receivable Allowance
Student Loans:
Federally-sponsored 67,221$ 67,221$
Other 15,847 2,936$ 12,911
Total Student loans 83,068$ 2,936$ 80,132$
Other 11,136 231 10,905
Total 94,204$ 3,167$ 91,037$
Receivable Allowance
Student Loans:
Federally-sponsored 72,836$ 72,836$
Other 17,612 3,803$ 13,809
Total Student loans 90,448$ 3,803$ 86,645$
Other 11,247 229 11,018
Total 101,695$ 4,032$ 97,663$
2017
2016
Net
Net
Loans receivable primarily consists of student loans. Student loans include federally-sponsored student loans and donor-restricted student loans with mandated interest rates and repayment terms. The federally-sponsored student loans represent amounts due from current and former students under various Federal Government funded loan programs, including Perkins and other health professional programs offered to graduate and undergraduate students. Loans disbursed under these programs are able to be assigned to the Federal Government upon default by the borrower, and therefore, no related allowance is considered necessary. Funding received under these programs is ultimately refundable to the Federal Government in the event the University no longer participates and accordingly is reported as a liability in Federal student loan advances in the Consolidated Statements of Financial Position. Determination of the fair value of student loans receivable is not practicable. Loans receivable are reported at their net realizable value. The University regularly assesses the adequacy of the allowances for credit losses of its loans by performing ongoing evaluations, including such factors as aging, differing economic risks associated with each loan category, financial condition of specific borrowers, economic environment in which the borrowers operate, level of delinquent loans, value of collateral and existence of guarantees or indemnifications.

CONSOLIDATED NOTES TO FINANCIAL STATEMENTS
52
Un
ive
rsit
y o
f P
en
nsy
lva
nia
Consolidated Notes to Financial Statements
F
inan
cial
Rep
ort 2
016
- 201
7
17
5. Contributions Receivable A summary of contributions receivable at June 30, 2017 and 2016, is as follows (in thousands):
2017 2016
Unconditional promises expected to be collected in:
Less than one year 108,885$ 118,920$
One year to five years 144,626 134,532
Over five years 36,588 38,853
290,099 292,305
Less: Discount (17,187) (16,107)
Less: Allowances for doubtful amounts (31,560) (33,349)Total Contributions receivable, net 241,352$ 242,849$
At June 30, 2017 and 2016, the University has outstanding unrecorded conditional promises to give, including non-legally binding bequests, of $303,926,000 and $300,919,000, respectively. When they become unconditional promises to give or are received in cash, they will be recorded and generally will be restricted for operations, endowment and capital projects as stipulated by the donors. 6. Investments, at Fair Value A summary of investments, including the AIF, measured at fair value in accordance with the Fair Value Measurements standard, as of June 30, 2017 and June 30, 2016 is as follows (in thousands):
Assets Level 1 Level 2 Level 3Investments at
NAV 2017
Short-term 983,371$ 983,371$ Equity:
US equities 772,121 31$ 952,865$ 1,725,017 International equities 462,289 1,052,689 1,514,978 Emerging market equities 128,217 971,792 1,100,009
Total Equity 1,362,627 31 2,977,346 4,340,004 Debt:
US treasuries 1,292,532 44,756 1,337,288 Corporate bonds 1,615 159,760 105,049 266,424 High yield 142 142
Total Debt 1,294,147 204,516 105,191 1,603,854 Split-interest agreements 74,469 396,029$ 470,498 Absolute return 2,912,273 2,912,273 Real estate 60 696,563 696,623 Private equity 10,814 2,197,350 2,208,164 Natural resources 237,864 4,036 514,778 756,678 Derivative instruments 2,399 251 2,650 Other 2,513 2,513
Total assets 3,954,877$ 208,894$ 409,356$ 9,403,501$ 13,976,628$

CONSOLIDATED NOTES TO FINANCIAL STATEMENTS
An
nu
al F
ina
ncia
l Re
po
rt 2016-2017
53
Consolidated Notes to Financial Statements
F
inan
cial
Rep
ort 2
016
– 20
17
18
Assets Level 1 Level 2 Level 3Investments at
NAV 2016
Short-term 761,129$ 761,129$ Equity:
US equities 885,134 870,155$ 1,755,289 International equities 371,481 784,298 1,155,779 Emerging market equities 105,645 829,904 935,549
Total Equity 1,362,260 2,484,357 3,846,617 Debt:
US treasuries 1,112,101 64,229$ 1,176,330 Corporate bonds 1,614 181,937 103,860 287,411 High yield 439 439
Total Debt 1,113,715 246,166 104,299 1,464,180 Split-interest agreements 71,722 400,045$ 471,767 Absolute return 2,834,622 2,834,622 Real estate 1,090 668,095 669,185 Private equity 8,697 1,570,942 1,579,639 Natural resources 297,708 331,702 629,410 Derivative instruments 2,555 2,555 Other 2,539 2,539
Total assets 3,606,534$ 249,811$ 411,281$ 7,994,017$ 12,261,643$ Included in Short-term investments is $19,440,000 and $59,386,000 of amounts held by trustees under indenture and escrow agreements at June 30, 2017 and 2016, respectively. At June 30, 2017 and 2016, Short-term investments include $59,705,000 and $39,905,000, respectively, of outstanding receivables from trading activities. At June 30, 2017 and 2016, Short-term investments include $44,196,000 and $145,893,000, respectively, of outstanding payables from trading activities. As of June 30, 2017 and 2016 there were no transfers between Level 1 and 2. Liabilities related to equity short positions of $197,681,000 and $94,462,000 at June 30, 2017 and 2016, respectively, are reported in Accrued expenses and other liabilities on the Consolidated Statements of Financial Position. These liabilities are valued using observable market data and are categorized as Level 1 based on quoted market prices in active markets. The University has made investments in various long-lived partnerships and, in other cases, has entered into contractual agreements that may limit its ability to initiate redemptions due to notice periods, lock-ups and gates. The University has also made commitments to various limited partnerships. The University expects these funds to be called over the next 5 years. The total amount of unfunded commitments is $2,868,015,000 which represents 26.2% of the AIF value as of June 30, 2017.
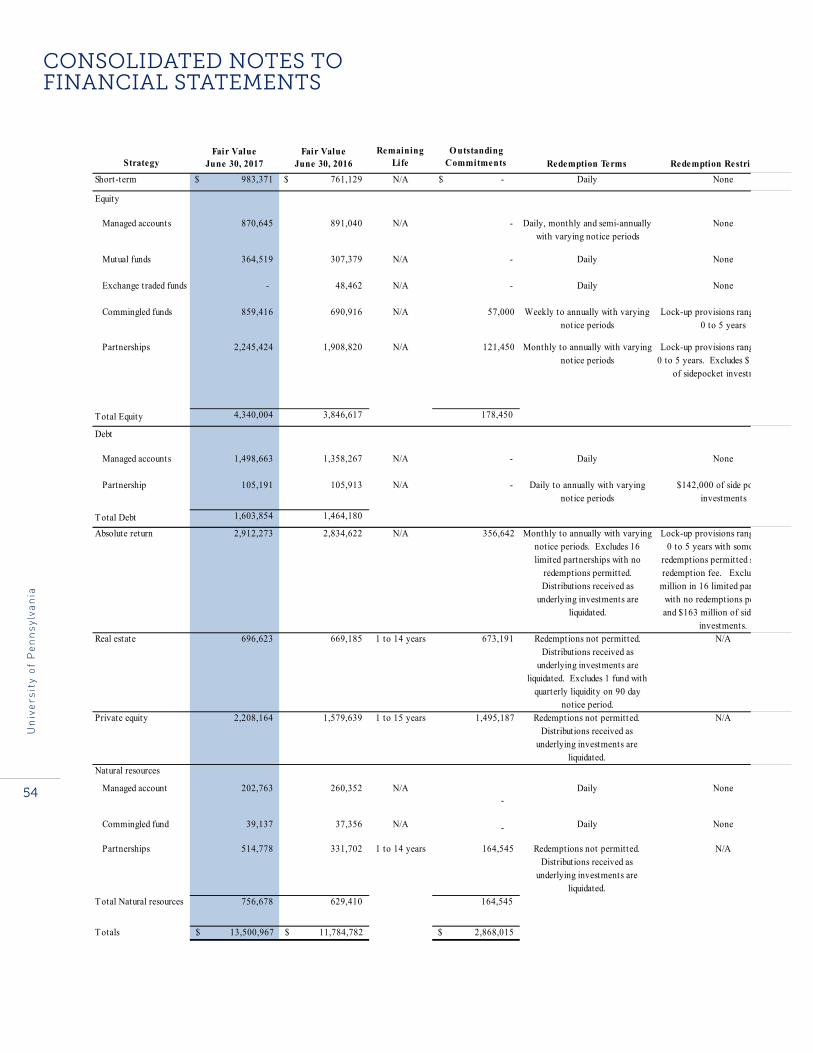
CONSOLIDATED NOTES TO FINANCIAL STATEMENTS
54
Un
ive
rsit
y o
f P
en
nsy
lva
nia
Consolidated Notes to Financial Statements
F
inan
cial
Rep
ort 2
016
- 201
7
19
Details on the fair value, remaining estimated life, outstanding commitments, current redemption terms and restrictions by strategy and type of investment are provided below (in thousands):
Fair ValueJune 30, 2017
Fair ValueJune 30, 2016 Redemption Terms Redemption Restrictions
Short-term $ 983,371 $ 761,129 N/A -$ Daily None
Equity
Managed accounts 870,645 891,040 N/A - Daily, monthly and semi-annually with varying notice periods
None
Mutual funds 364,519 307,379 N/A - Daily None
Exchange traded funds - 48,462 N/A - Daily None
Commingled funds 859,416 690,916 N/A 57,000 Weekly to annually with varying notice periods
Lock-up provisions ranging from 0 to 5 years
2,245,424 1,908,820 121,450 Lock-up provisions ranging from 0 to 5 years. Excludes $13 million
of sidepocket investments.
Total Equity 4,340,004 3,846,617 178,450
Debt
Managed accounts 1,498,663 1,358,267 N/A - Daily None
Partnership 105,191 105,913 N/A - Daily to annually with varying notice periods
$142,000 of side pocket investments
Total Debt 1,603,854 1,464,180
Absolute return 2,912,273 2,834,622 N/A 356,642 Monthly to annually with varying notice periods. Excludes 16 limited partnerships with no
redemptions permitted. Distributions received as
underlying investments are liquidated.
Lock-up provisions ranging from 0 to 5 years with some earlier
redemptions permitted subject to redemption fee. Excludes $300
million in 16 limited partnerships with no redemptions permitted and $163 million of side pocket
investments.Real estate 696,623 669,185 1 to 14 years 673,191 Redemptions not permitted.
Distributions received as underlying investments are
liquidated. Excludes 1 fund with quarterly liquidity on 90 day
notice period.
N/A
Private equity 2,208,164 1,579,639 1 to 15 years 1,495,187 Redemptions not permitted. Distributions received as
underlying investments are liquidated.
N/A
Natural resources
Managed account 202,763 260,352 N/A-
Daily None
Commingled fund 39,137 37,356 N/A - Daily None
Partnerships 514,778 331,702 1 to 14 years 164,545 Redemptions not permitted. Distributions received as
underlying investments are liquidated.
N/A
Total Natural resources 756,678 629,410 164,545
Totals 13,500,967$ 11,784,782$ 2,868,015$
Monthly to annually with varying notice periods
StrategyRemaining
LifeO utstanding
Commitments
Partnerships N/A

CONSOLIDATED NOTES TO FINANCIAL STATEMENTS
An
nu
al F
ina
ncia
l Re
po
rt 2016-2017
55
Consolidated Notes to Financial Statements
F
inan
cial
Rep
ort 2
016
– 20
17
20
Included in Level 1 Split-interest agreement investments above are readily marketable assets invested by the University separately from the AIF where the University serves as trustee with an aggregate fair value of $74,469,000 and $71,722,000 at June 30, 2017 and 2016, respectively. Level 3 Split-interest agreement investments are managed and invested outside of the University by external trustees. Invested in the AIF with an aggregate fair value of $155,291,000 and $141,294,000 at June 30, 2017 and 2016, respectively, is a perpetual trust managed by an external trustee who has delegated investment decisions to the University. The University invests the assets of this trust in accordance with its Endowment Policy.
Included in Split-interest agreements are amounts held to meet legally mandated annuity reserves of $28,532,000 and $29,815,000 as of June 30, 2017 and 2016, respectively, as required by the laws of the following states where certain individual donors reside: California, New Jersey and New York. A summary of Level 3 assets included in Split-interest agreements, where the University is not trustee, measured at fair value, as of June 30, 2017 and 2016 is as follows (in thousands):
2017 2016Charitable remainder trusts 15,991$ 11,113$ Charitable lead trusts 92,590 113,449Perpetual trusts 287,448 275,483
Total 396,029$ 400,045$ Changes to the reported amounts of Split-interest agreements measured at fair value using unobservable (Level 3) inputs as of June 30, 2017 and 2016 are as follows (in thousands):
Charitable Remainder
TrustsCharitable
Lead TrustsPerpetual
Trusts Total
June 30, 2016 11,113$ 113,449$ 275,483$ 400,045$
Net realized gains 516 516
Net unrealized gains 252 338 16,191 16,781
Acquisit ions 4,626 1,340 2,229 8,195
Liquidations (22,537) (6,971) (29,508)
June 30, 2017 15,991$ 92,590$ 287,448$ 396,029$
Charitable Remainder
TrustsCharitable
Lead TrustsPerpetual
Trusts Total
June 30, 2015 10,966$ 129,445$ 275,971$ 416,382$
Net realized gains 4,486 4,486
Net unrealized gains/ (losses) 289 6,534 (12,269) (5,446)
Acquisit ions 7,296 7,296
Liquidations (142) (22,530) (1) (22,673)
June 30, 2016 11,113$ 113,449$ 275,483$ 400,045$

CONSOLIDATED NOTES TO FINANCIAL STATEMENTS
56
Un
ive
rsit
y o
f P
en
nsy
lva
nia
Consolidated Notes to Financial Statements
F
inan
cial
Rep
ort 2
016
- 201
7
21
The following tables set forth the fair value, related gains (losses) and notional amounts of the University’s derivative instruments by contract type as of June 30, 2017 and 2016 (in thousands):
2017
Notional Amount
Gross Derivative
Assets
Gross Derivative Liabilities
Derivative Losses
Foreign currency contracts 299,533$ 251$ 7,976$ (5,459)$
Futures contracts (348,650) 2,399 (62,062)
Swaps
Total (49,117)$ 2,650$ 7,976$ (67,521)$
2016
Notional Amount
Gross Derivative
Assets
Gross Derivative Liabilities
Derivative Gains
Foreign currency contracts 63,747$ 2,555$ 637$ 2,245$
Futures contracts (142,605) 361 21,592
Swaps 2,558
Total (78,858)$ 2,555$ 998$ 26,395$ The notional amount is representative of the volume and activity of the respective derivative type during the years ended June 30, 2017 and 2016.
Gross derivatives assets and liabilities are shown in Investments, at fair value and Accrued expenses and other liabilities on the Consolidated Statements of Financial Position, respectively. Derivative gains (losses) are shown in Return on investments, net on the Consolidated Statements of Activities, in the appropriate net asset classification. A summary of the University’s total investment return for the years ended June 30, 2017 and 2016 is presented below (in thousands):
2017 2016
AIF investment income 80,745$ 52,748$ AIF realized and unrealized gains (losses) 1,294,544 (171,975)Return on AIF 1,375,289 (119,227)Other investment gains (losses) 137,256 (7,628)
Total Return on investments 1,512,545$ (126,855)$
7. Endowment The composition and changes to the amount of the University’s endowment at June 30, 2017 are as follows (in thousands):
UnrestrictedTemporarily
RestrictedPermanently
Restricted Total
Donor-restricted endowment funds 2,641,506$ 3,640,350$ 6,281,856$
Quasi-endowment funds 5,931,351$ 5,931,351
June 30, 2017 5,931,351$ 2,641,506$ 3,640,350$ 12,213,207$

CONSOLIDATED NOTES TO FINANCIAL STATEMENTS
An
nu
al F
ina
ncia
l Re
po
rt 2016-2017
57
Consolidated Notes to Financial Statements
F
inan
cial
Rep
ort 2
016
– 20
17
22
Q uasi
Unrestricted Temporarily Permanently Total
Net assets, June 30, 2016 5,161,319$ 2,143,305$ 3,410,740$ 10,715,364$
Investment return:
Investment income, net of expenses 39,871 47,824 149 87,844
Gains, realized and unrealized 707,411 684,311 16,702 1,408,424
Total investment return 747,282 732,135 16,851 1,496,268
New gifts 11,623 29,980 201,970 243,573
Allocation of endowment assets for expenditure (485,860) (485,860)
Other investment allocation (6,559) (6,559)
T ransfers to create board designated funds 245,471 245,471
Other transfers (8,141) 2,302 10,789 4,950
Released from restriction 266,216 (266,216)
Net assets, June 30, 2017 5,931,351$ 2,641,506$ 3,640,350$ 12,213,207$
Donor Restricted
The composition and changes to the amount of the University’s endowment as of June 30, 2016 are as follows (in thousands):
UnrestrictedTemporarily
RestrictedPermanently
Restricted Total
Donor-restricted endowment funds 2,143,305$ 3,410,740$ 5,554,045$
Quasi-endowment funds 5,161,319$ 5,161,319
June 30, 2016 5,161,319$ 2,143,305$ 3,410,740$ 10,715,364$
Q uasi
Unrestricted Temporarily Permanently Total
Net assets, June 30, 2015 4,412,620$ 2,442,269$ 3,278,680$ 10,133,569$
Investment return:
Investment income, net of expenses 5,568 8,530 295 14,393
Other income
Losses, realized and unrealized (77,769) (93,489) (12,312) (183,570)
Total investment return (72,201) (84,959) (12,017) (169,177)
New gifts 34,573 17,366 124,741 176,680
Allocation of endowment assets for expenditure (365,366) (365,366)
Other investment allocation (5,956) (5,956)
T ransfers to create board designated funds 138,348 138,348
Other transfers (32,509) 11,119 6,607 (14,783)
LGH membership substitution 806,451 2,869 12,729 822,049
Released from restriction 245,359 (245,359)
Net assets, June 30, 2016 5,161,319$ 2,143,305$ 3,410,740$ 10,715,364$
Donor Restricted
The fair value of certain permanently restricted endowment funds is less than the original donated value by $81,000 and $6,106,000 as of June 30, 2017 and 2016, respectively, and is reflected as a reduction of Temporarily restricted assets.

CONSOLIDATED NOTES TO FINANCIAL STATEMENTS
58
Un
ive
rsit
y o
f P
en
nsy
lva
nia
Consolidated Notes to Financial Statements
F
inan
cial
Rep
ort 2
016
- 201
7
23
8. Property, Plant and Equipment, net
The components of PPE at June 30, 2017 and 2016 are as follows (in thousands):
Estimated Useful Life in years 2017 2016
Land and land improvements N/A to 20 366,960$ 369,758$
Buildings and fixed equipment 5 to 50 8,426,732 8,129,199
Moveable equipment and other 4 to 20 1,942,076 2,202,886
Construction-in-progress 590,926 653,532
11,326,694 11,355,375
Less: Accumulated depreciation (4,874,388) (5,152,468)Property, plant and equipment, net 6,452,306$ 6,202,907$
The University recorded $470,716,000 and $451,227,000 of depreciation expense for the years ended June 30, 2017 and 2016, respectively. Effective July 1, 2016, the University elected to revise its policy to expense library materials. Previously capitalized library materials were expensed. As a result, library materials amount to $0 and $86,260,000 at June 30, 2017 and 2016, respectively. The University capitalized $11,272,000 and $12,008,000 of interest costs for the years ended June 30, 2017 and 2016, respectively. The University has conditional asset retirement obligations of $23,332,000 and $21,646,000 as of June 30, 2017 and 2016, respectively, which primarily relate to asbestos contained in buildings and underground steam distribution piping and are included within Accrued expenses and other liabilities in the Consolidated Statements of Financial Position.
9. Split-Interest Agreements Changes in the value of assets, liabilities and net assets pursuant to split-interest agreements as of June 30, 2017 and 2016 are as follows (in thousands): 2017 Assets Liabilities Net AssetsJune 30, 2016 471,768$ (47,424)$ 424,344$
New contributions 9,647 (2,403) 7,244Investment income 1,556 (1,470) 86Realized and unrealized gain, net 22,672 22,672Payments and settlements (35,145) 7,081 (28,064)Actuarial adjustment (3,295) (3,295)Net change (1,270) (87) (1,357)
June 30, 2017 470,498$ (47,511)$ 422,987$
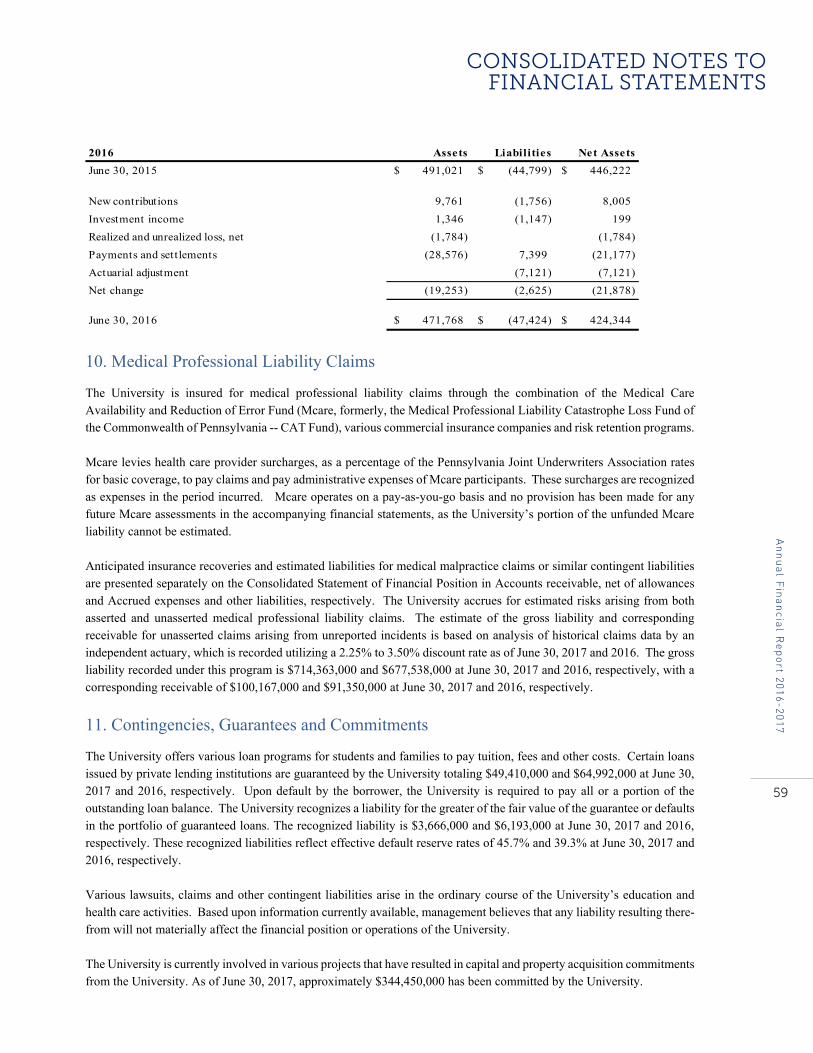
CONSOLIDATED NOTES TO FINANCIAL STATEMENTS
An
nu
al F
ina
ncia
l Re
po
rt 2016-2017
59
Consolidated Notes to Financial Statements
F
inan
cial
Rep
ort 2
016
– 20
17
24
2016 Assets Liabilities Net AssetsJune 30, 2015 491,021$ (44,799)$ 446,222$
New contributions 9,761 (1,756) 8,005Investment income 1,346 (1,147) 199Realized and unrealized loss, net (1,784) (1,784)Payments and settlements (28,576) 7,399 (21,177)Actuarial adjustment (7,121) (7,121)Net change (19,253) (2,625) (21,878)
June 30, 2016 471,768$ (47,424)$ 424,344$
10. Medical Professional Liability Claims The University is insured for medical professional liability claims through the combination of the Medical Care Availability and Reduction of Error Fund (Mcare, formerly, the Medical Professional Liability Catastrophe Loss Fund of the Commonwealth of Pennsylvania -- CAT Fund), various commercial insurance companies and risk retention programs. Mcare levies health care provider surcharges, as a percentage of the Pennsylvania Joint Underwriters Association rates for basic coverage, to pay claims and pay administrative expenses of Mcare participants. These surcharges are recognized as expenses in the period incurred. Mcare operates on a pay-as-you-go basis and no provision has been made for any future Mcare assessments in the accompanying financial statements, as the University’s portion of the unfunded Mcare liability cannot be estimated. Anticipated insurance recoveries and estimated liabilities for medical malpractice claims or similar contingent liabilities are presented separately on the Consolidated Statement of Financial Position in Accounts receivable, net of allowances and Accrued expenses and other liabilities, respectively. The University accrues for estimated risks arising from both asserted and unasserted medical professional liability claims. The estimate of the gross liability and corresponding receivable for unasserted claims arising from unreported incidents is based on analysis of historical claims data by an independent actuary, which is recorded utilizing a 2.25% to 3.50% discount rate as of June 30, 2017 and 2016. The gross liability recorded under this program is $714,363,000 and $677,538,000 at June 30, 2017 and 2016, respectively, with a corresponding receivable of $100,167,000 and $91,350,000 at June 30, 2017 and 2016, respectively.
11. Contingencies, Guarantees and Commitments The University offers various loan programs for students and families to pay tuition, fees and other costs. Certain loans issued by private lending institutions are guaranteed by the University totaling $49,410,000 and $64,992,000 at June 30, 2017 and 2016, respectively. Upon default by the borrower, the University is required to pay all or a portion of the outstanding loan balance. The University recognizes a liability for the greater of the fair value of the guarantee or defaults in the portfolio of guaranteed loans. The recognized liability is $3,666,000 and $6,193,000 at June 30, 2017 and 2016, respectively. These recognized liabilities reflect effective default reserve rates of 45.7% and 39.3% at June 30, 2017 and 2016, respectively. Various lawsuits, claims and other contingent liabilities arise in the ordinary course of the University’s education and health care activities. Based upon information currently available, management believes that any liability resulting there-from will not materially affect the financial position or operations of the University. The University is currently involved in various projects that have resulted in capital and property acquisition commitments from the University. As of June 30, 2017, approximately $344,450,000 has been committed by the University.

CONSOLIDATED NOTES TO FINANCIAL STATEMENTS
60
Un
ive
rsit
y o
f P
en
nsy
lva
nia
Consolidated Notes to Financial Statements
F
inan
cial
Rep
ort 2
016
- 201
7
25
12. Pension and Other Postretirement Benefit Costs Retirement benefits are principally provided to employees through contributory defined contribution plans. The Academic Component’s policy with respect to its contribution is to provide up to 9% of eligible employees’ salaries, while the UPHS contribution can be up to 6.5%. The University’s contributions to these plans amounted to $176,023,000 and $159,857,000 as of June 30, 2017 and 2016, respectively. The University also has non-contributory defined benefit pension plans. Benefits under the plans generally are based on the employee’s years of service and compensation during the years preceding retirement. Contributions to the plans are made in amounts necessary to at least satisfy the minimum required contributions as specified in the Internal Revenue Service Code and related regulations. The Academic Component’s plan was frozen to new full-time entrants effective July 1, 2000. UPHS’ non-LGH plan was frozen to new entrants effective July 1, 2010; the benefit accruals for all participants of the LGH plan were frozen effective June 30, 2013. Additionally, the University provides certain healthcare and life insurance benefits (Other Postretirement Employee Benefits or OPEB) for retired employees. Only a limited number of employees may become eligible for such benefits if they reach retirement age while working for the University. These and similar benefits for active and certain retired employees are provided through insurance contracts. The University uses a measurement date of June 30 for its defined benefit pension and OPEB plans. Change in Plan Assets/ Obligation and Funded Status
The funded status of the plans is measured as the difference between the plan assets at fair value and the projected benefit obligation (PBO) for Pension Benefits or accumulated postretirement benefit obligation (APBO) for Other Postretirement Benefits. The resulting net liability is recorded in Accrued retirement benefits on the Statements of Financial Position. The following shows changes in the benefit obligation, plan assets and funded status (in thousands):
Other Pension Postretirement
2017 Benefits Benefits TotalChange in Plan Assets
Fair value of plan assets, beginning of year 2,082,315$ 379,925$ 2,462,240$ University contributions 128,454 25,800 154,254Benefits paid by University 8,899 8,899Plan participants' contributions 160 7,293 7,453Benefits paid from fund (79,043) (19,918) (98,961)Benefits paid outside of fund (9,609) (9,609)Retiree drug subsidy 179 179Actual return on assets 239,431 52,154 291,585Fair value of plan assets, end of year 2,371,317$ 444,723$ 2,816,040$
Change in Benefit Obligation
Benefit obligation, beginning of year (PBO/APBO) 3,165,114$ 920,401$ 4,085,515$ Service cost 75,092 32,454 107,546Interest cost 130,172 35,796 165,968Plan participants' contributions 160 7,293 7,453Plan amendments (1,749) (1,749)Retiree drug subsidy 179 179Net actuarial (gain)/loss (28,827) (47,877) (76,704)Transfers (3,285) (3,285)Benefits paid from fund (79,043) (19,918) (98,961)Benefits paid outside of fund (9,609) (9,609)Benefit obligation, end of year (PBO/APBO) 3,262,668$ 913,685$ 4,176,353$
Funded status, liability at end of year 891,351$ 468,962$ 1,360,313$ Other retirement programs 88,105Accrued retirement benefits 1,448,418$
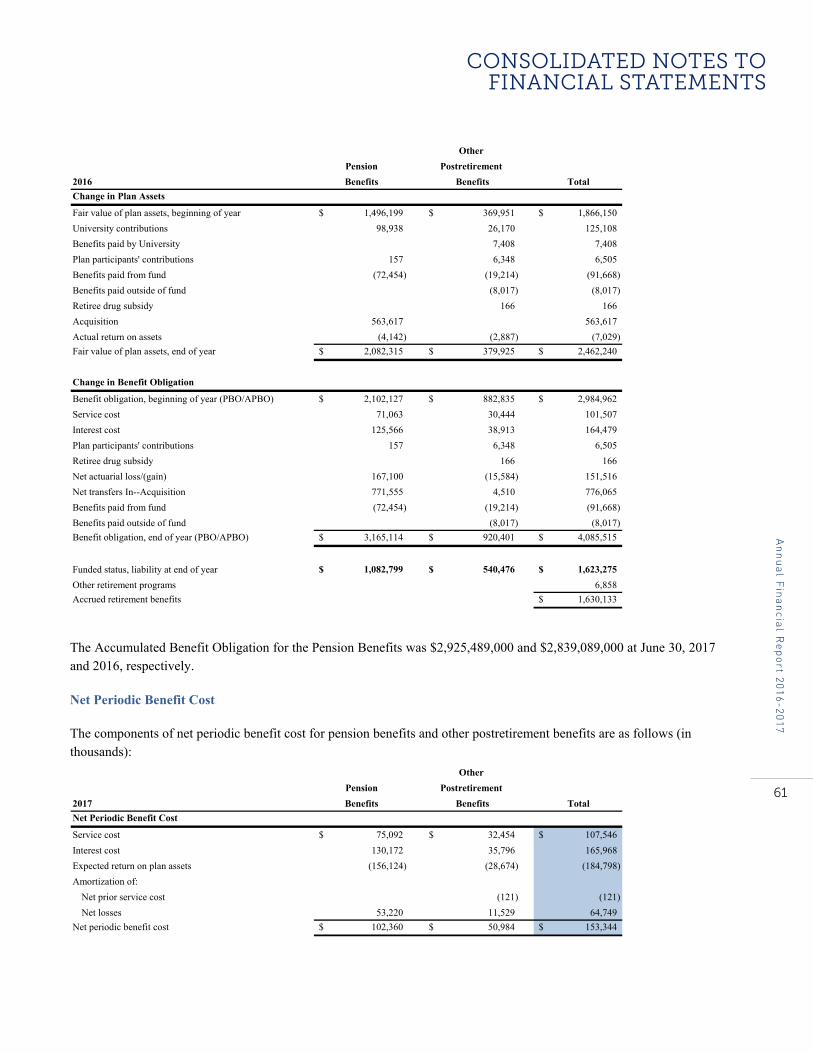
CONSOLIDATED NOTES TO FINANCIAL STATEMENTS
An
nu
al F
ina
ncia
l Re
po
rt 2016-2017
61
Consolidated Notes to Financial Statements
F
inan
cial
Rep
ort 2
016
– 20
17
26
Other Pension Postretirement
2016 Benefits Benefits TotalChange in Plan Assets
Fair value of plan assets, beginning of year 1,496,199$ 369,951$ 1,866,150$ University contributions 98,938 26,170 125,108Benefits paid by University 7,408 7,408Plan participants' contributions 157 6,348 6,505Benefits paid from fund (72,454) (19,214) (91,668)Benefits paid outside of fund (8,017) (8,017)Retiree drug subsidy 166 166Acquisition 563,617 563,617Actual return on assets (4,142) (2,887) (7,029)Fair value of plan assets, end of year 2,082,315$ 379,925$ 2,462,240$
Change in Benefit Obligation
Benefit obligation, beginning of year (PBO/APBO) 2,102,127$ 882,835$ 2,984,962$ Service cost 71,063 30,444 101,507Interest cost 125,566 38,913 164,479Plan participants' contributions 157 6,348 6,505Retiree drug subsidy 166 166Net actuarial loss/(gain) 167,100 (15,584) 151,516Net transfers In--Acquisition 771,555 4,510 776,065Benefits paid from fund (72,454) (19,214) (91,668)Benefits paid outside of fund (8,017) (8,017)Benefit obligation, end of year (PBO/APBO) 3,165,114$ 920,401$ 4,085,515$
Funded status, liability at end of year 1,082,799$ 540,476$ 1,623,275$ Other retirement programs 6,858Accrued retirement benefits 1,630,133$ The Accumulated Benefit Obligation for the Pension Benefits was $2,925,489,000 and $2,839,089,000 at June 30, 2017 and 2016, respectively. Net Periodic Benefit Cost
The components of net periodic benefit cost for pension benefits and other postretirement benefits are as follows (in thousands):
Other Pension Postretirement
2017 Benefits Benefits TotalNet Periodic Benefit Cost
Service cost 75,092$ 32,454$ 107,546$ Interest cost 130,172 35,796 165,968Expected return on plan assets (156,124) (28,674) (184,798)Amortization of:
Net prior service cost (121) (121)Net losses 53,220 11,529 64,749
Net periodic benefit cost 102,360$ 50,984$ 153,344$

CONSOLIDATED NOTES TO FINANCIAL STATEMENTS
62
Un
ive
rsit
y o
f P
en
nsy
lva
nia
Consolidated Notes to Financial Statements
F
inan
cial
Rep
ort 2
016
- 201
7
27
2016Net Periodic Benefit Cost
Service cost 71,063$ 30,444$ 101,507$ Interest cost 125,566 38,913 164,479Expected return on plan assets (151,147) (28,190) (179,337)Amortization of:
Net prior service cost (108) (108)Net losses 36,436 11,720 48,156
Net periodic benefit cost 81,918$ 52,779$ 134,697$ Unrestricted Net Assets The University recorded the following year-end valuation adjustments to its Pension and Other Postretirement Benefit Plans in Pension, OPEB and Other, net in the Consolidated Statements of Activities (in thousands):
Other Pension Postretirement
2017 Benefits Benefits TotalUnrestricted Net Assets
Net actuarial loss 738,829$ 177,325$ 916,154$ Net prior service cost (3,469) (3,469)Total 738,829$ 173,856$ 912,685$
Adjustment to unrestricted net assets (gain)/loss (165,352)$ (84,517)$ (249,869)$ 2016Unrestricted Net Assets
Net actuarial loss 904,181$ 261,456$ 1,165,637$ Net prior service cost (1,702) (1,702)Total 904,181$ 259,754$ 1,163,935$
Adjustment to unrestricted net assets (gain)/loss 285,950$ 3,882$ 289,832$ The estimated amount that will be amortized from Unrestricted Net Assets into net periodic benefit cost in 2018 is as follows (in thousands):
Other Pension PostretirementBenefits Benefits
Amortization of prior service credit -$ (323)$ Amortization of net losses 40,078 5,972 Actuarial Assumptions
The expected long-term rate of return on plan assets is management’s best estimate of the average investment return expected to be received on the assets invested in the plan over the benefit period. The expected long-term rate of return on plan assets has been established by considering historical and future expected returns of the asset classes invested in by the pension trust, and the allocation strategy currently in place among those classes.

CONSOLIDATED NOTES TO FINANCIAL STATEMENTS
An
nu
al F
ina
ncia
l Re
po
rt 2016-2017
63
Consolidated Notes to Financial Statements
F
inan
cial
Rep
ort 2
016
– 20
17
28
Weighted-Average Assumptions Used to
Determine Benefit Obligations at Year End 2017 2016 2017 2016
Discount rate 4.19% 4.17% 4.00% 3.95%
Salary increase 2.91% 3.94% N/A N/A
Weighted-Average Assumptions Used to
Determine Net Periodic Benefit Cost
Discount rate 4.23% 4.53% 3.95% 4.45%
Expected long-term return on plan assets 7.52% 7.50% 7.50% 7.50%
Salary increase 3.82% 3.94% N/A N/A
Assumed Health Care Cost Trend Rates
Initial trend rate N/A N/A 6.54% 5.51%
Ultimate trend rate N/A N/A 4.70% 4.70%
Fiscal year end that ultimate trend rate is reached N/A N/A 2037 2023
Pension Benefits Other Postretirement Benefits
Assumed health care cost trend rates have a significant effect on the amounts reported for the Other postretirement benefits. A one-percentage-point change in assumed health care trend rates would have the following effects on Other postretirement benefits (in thousands):
1-Percentage 1-PercentagePoint Increase Point Decrease
2017
Effect on total of service and interest cost 14,607$ (10,999)$ Effect on APBO 170,709 (133,252)
Plan Assets The principal investment objectives for the pension and other postretirement benefits plans are to ensure the availability of funds to pay pension benefits as they become due under a broad range of future economic scenarios, to maximize long-term investment returns with an acceptable level of risk based on the pension obligations, and to invest the pension trust in a diversified manner. The University’s Office of Investments is responsible for the day-to-day management of the investments of the pension and other postretirement benefits. The investments are made in accordance with policies set out by the Investment Board which has been appointed by the Trustees. The pension and other postretirement benefit investments are similar in nature to those investments discussed in Notes 1 and 6 – Investments, at Fair Value. However, the actual allocations to specific investments within each asset class may vary due to certain restrictions imposed by investment managers and ERISA regulations.

CONSOLIDATED NOTES TO FINANCIAL STATEMENTS
64
Un
ive
rsit
y o
f P
en
nsy
lva
nia
Consolidated Notes to Financial Statements
F
inan
cial
Rep
ort 2
016
- 201
7
29
A summary of plan assets, measured at fair value, as of June 30, 2017 and 2016, is as follows (in thousands): Pension Benefits:
Assets Level 1 Level 2 Level 3Investments
at NAV 2017
Short-term 121,646$ 121,646$
Equity:
US equities 284,518 178,754$ 463,272
International equities 125,750 239,604 365,354
Emerging market equities 45,327 132,157 177,484
Debt:
US treasuries 241,530 8,577$ 250,107
Corporate bonds 67,783 154,745 222,528
Absolute return 457,776 457,776
Real estate 43,298 43,298
Private equity 97,601 97,601
Natural resources 92,926 1,353 77,935 172,214
Derivative instruments:
Forward currency contracts 68 68
Total assets 911,697$ 77,781$ -$ 1,381,870$ 2,371,348$
Liabilities Level 1 Level 2 Level 3Investments
at NAV 2017
Derivative instruments 31$ 31$
Total liabilit ies -$ 31$ -$ -$ 31$
Assets Level 1 Level 2 Level 3Investments
at NAV 2016
Short-term 124,576$ 124,576$
Equity:
US equities 262,763 133,428$ 396,191
International equities 101,543 214,627 316,170
Emerging market equities 38,354 108,440 146,794
Debt:
US treasuries 170,169 15,495$ 185,664
Corporate bonds 76,153 155,004 231,157
Absolute return 432,563 432,563
Real estate 26,415 26,415
Private equity 57,854 57,854
Natural resources 106,154 59,000 165,154
Derivative instruments:
Forward currency contracts 8 8
Total assets 803,559$ 91,656$ -$ 1,187,331$ 2,082,546$
Liabilities Level 1 Level 2 Level 3Investments
at NAV 2016
Derivative instruments 231$ 231$
Total liabilit ies -$ 231$ -$ -$ 231$

CONSOLIDATED NOTES TO FINANCIAL STATEMENTS
An
nu
al F
ina
ncia
l Re
po
rt 2016-2017
65
Consolidated Notes to Financial Statements
F
inan
cial
Rep
ort 2
016
– 20
17
30
Other Postretirement Benefits:
Assets Level 1 Level 2 Level 3Investments
at NAV 2017
Short-term 36,651$ 36,651$
Equity:
US equities 15,751 57,364$ 73,115
International equities 7,189 76,747 83,936
Emerging market equities 13,647 32,985 46,632
Debt:
US treasuries 18,977 18,977
Corporate bonds 372$ 10,071 10,443
Absolute return 114,904 114,904
Real estate 8,732 8,732
Private equity 16,853 16,853
Natural resources 29,617 587 4,263 34,467
Derivative instruments:
Forward currency contracts 24 24
Total 121,832$ 983$ -$ 321,919$ 444,734$
Liabilities Level 1 Level 2 Level 3Investments
at NAV 2017
Derivative instruments 11$ 11$
Total -$ 11$ -$ -$ 11$
Assets Level 1 Level 2 Level 3Investments
at NAV 2016
Short-term 25,412$ 25,412$
Equity:
US equities 13,783 40,185$ 53,968
International equities 6,157 66,952 73,109
Emerging market equities 11,466 27,328 38,794
Debt:
US treasuries 26,436 26,436
Corporate bonds 623$ 10,207 10,830
Absolute return 98,905 98,905
Real estate 3,653 3,653
Private equity 14,544 14,544
Natural resources 33,249 1,101 34,350
Derivative instruments:
Forward currency contracts 3 3
Total 116,503$ 626$ -$ 262,875$ 380,004$
Liabilities Level 1 Level 2 Level 3Investments
at NAV 2016
Derivative instruments 79$ 79$
Total -$ 79$ -$ -$ 79$

CONSOLIDATED NOTES TO FINANCIAL STATEMENTS
66
Un
ive
rsit
y o
f P
en
nsy
lva
nia
Consolidated Notes to Financial Statements
F
inan
cial
Rep
ort 2
016
- 201
7
31
As of June 30, 2017, the University has unfunded commitments to limited partnerships totaling $310,651,000, which are expected to be called over the next 5 years. Transfers between leveled assets are based on the actual date of the event which caused the transfer. As of June 30, 2017 and 2016 there were no transfers between Level 1 and 2.
Allocation of Plan Assets Target 2017 2016 Target 2017 2016Short-term 0.0% 5.1% 6.0% 0.0% 8.2% 6.7%Equity:
US equities 15.9% 19.5% 19.0% 13.0% 16.4% 14.2%International equities 16.7% 15.4% 15.2% 19.0% 18.9% 19.2%Emerging markets equities 7.4% 7.5% 7.0% 10.0% 10.5% 10.2%
Debt:US treasuries 21.3% 10.6% 8.9% 10.0% 4.3% 7.0%Corporate bonds 0.0% 9.4% 11.1% 0.0% 2.3% 2.9%
Absolute return 23.0% 19.3% 20.8% 29.0% 25.8% 26.0%Real estate 2.1% 1.8% 1.3% 3.0% 2.0% 1.0%Private equity 4.6% 4.1% 2.8% 5.0% 3.8% 3.8%Natural resources 9.0% 7.3% 7.9% 11.0% 7.8% 9.0%Total 100.0% 100.0% 100.0% 100.0% 100.0% 100.0%
Pension Benefits O ther Postretirement Benefits
Cash Flows & Estimated Future Benefit Payments (in thousands):
University contributions for the year ending:
June 30, 2016 98,938$ 26,170$
June 30, 2017 128,454 25,800
June 30, 2018 105,060 22,866
Benefits paid from outside of the fund for the year ending:
June 30, 2016 N/A 8,017$
June 30, 2017 N/A 9,609
June 30, 2018 N/A 9,083
Plan participants' contributions for the year ending:
June 30, 2016 157$ 6,348$
June 30, 2017 160 7,293
June 30, 2018 165 7,128
Other Postretirement BenefitsPension Benefits
Benefits Payments in Total (in thousands):
Other PostretirementBenefits before Medicare Medicare Part D
Actual benefit payments for the year ending: Pension Benefits Part D Subsidy SubsidyJune 30, 2016 72,454$ 27,231$ 166$ June 30, 2017 79,043 29,527 179
Expected benefit payments for the year ending (Unaudited):June 30, 2018 92,411$ 25,423$ 213$ June 30, 2019 99,773 27,378 224 June 30, 2020 108,161 29,505 234 June 30, 2021 117,411 31,751 242 June 30, 2022 126,852 33,801 249 June 30, 2023 to June 30, 2027 783,486 199,903 1,333

CONSOLIDATED NOTES TO FINANCIAL STATEMENTS
An
nu
al F
ina
ncia
l Re
po
rt 2016-2017
67
Consolidated Notes to Financial Statements
F
inan
cial
Rep
ort 2
016
– 20
17
32
13. Debt Obligations Debt obligations at June 30, 2017 and 2016 are as follows (in thousands):
Effective Interest Rate at
Final Maturity June 30, 2017 2017 2016
Academic Component:Fixed rate debt obligations:
The Trustees of the University of Pennsylvania Series 2012 Taxable Bonds 09/2112 4.67% 300,000$ 300,000$ Pennsylvania Higher Educational Facilities Authority (PHEFA)
Series A of 2017 revenue bonds 08/2046 2.26% - 3.72% 178,395 Series A of 2016 revenue bonds 08/2041 0.61% - 2.93% 169,635 169,635 Series A of 2015 revenue bonds 10/2045 0.64% - 2.99% 200,985 205,670 Series B of 2015 revenue bonds 10/2038 0.64% - 3.38% 163,795 165,150 Series C of 2015 revenue bonds 10/2035 3.68% 8,020 8,020 Series A of 2011 revenue bonds 09/2021 2.92% - 3.68% 11,125 14,495 Series of 2010 revenue bonds 09/2033 3.99% - 4.15% 16,935 16,935 Series B of 2009 revenue bonds 09/2020 3.30% - 3.99% 8,570 10,575 Series C of 2009 revenue bonds 09/2019 3.30% - 3.70% 11,635 15,105
Other loans 05/2031 1.00% - 3.00% 914 736 Variable rate debt obligations:
PHEFA Series of 1990 revenue bonds 12/2020 1.10% 6,500 6,500 Washington County Authority Series of 2004 07/2034 0.85% 53,400 55,500
Total Academic Component outstanding bonds payable 1,129,909 968,321 Unamortized original issue premiums/discounts and cost of issuance, net 78,304 67,743 Total Academic Component debt obligations 1,208,213$ 1,036,064$ UPHS:
Fixed rate debt obligations:Lancaster County Hospital Authority (LCHA)
Series A of 2016 revenue bonds 08/2042 0.66% - 3.25% 168,585$ 173,310$ Series B of 2016 revenue bonds 08/2046 1.43% - 3.22% 128,050 128,050
PHEFASeries C of 2016 revenue bonds 08/2041 0.50% - 3.08% 129,290 Series A of 2015 revenue bonds 08/2045 0.77% - 4.00% 324,855 357,565 Series A of 2012 revenue bonds 08/2042 1.66% - 4.08% 136,950 136,950 Series A of 2011 revenue bonds 08/2042 4.95% - 5.88% 123,400 Series A of 2009 revenue bonds 08/2021 4.00% - 4.91% 43,110 43,515 Series B of 2008 revenue bonds 08/2037 5.65% - 6.00% 52,000 52,000
Lancaster General Hospital 2015 Taxable Note 08/2022 2.66% 75,211 77,553 Build to suit lease, net of related interest Various N/A 123,013 123,070 Mortgages, notes and capital leases Various Various 23,443 25,021
Variable rate debt obligations:LCHA Series A of 2012 revenue bonds 08/2041 1.58% 23,375 23,925 PHEFA Series A of 2014 revenue bonds 08/2045 0.89% 100,000 100,000 PHEFA Series A of 2008 revenue bonds 08/2037 1.09% 69,995 69,995
Total UPHS outstanding bonds payable 1,397,877 1,434,354 Unamortized original issue premiums/discounts and cost of issuance, net 96,860 90,036 Total UPHS debt obligations 1,494,737 1,524,390 Total University debt obligations 2,702,950$ 2,560,454$

CONSOLIDATED NOTES TO FINANCIAL STATEMENTS
68
Un
ive
rsit
y o
f P
en
nsy
lva
nia
Consolidated Notes to Financial Statements
F
inan
cial
Rep
ort 2
016
- 201
7
33
Contractual maturities of debt obligations and build-to-suit lease payments are as follows (in thousands):
Academic Component University
Fiscal YearBond and O ther
Loan O bligationsBond and O ther
Loan O bligationsBuild-to-Suit Lease
Payments Total Total2018 13,176$ 42,349$ 10,496$ 52,845$ 66,021$ 2019 19,458 91,548 10,742 102,290 121,748 2020 16,540 41,261 10,992 52,253 68,793 2021 27,490 43,218 11,249 54,467 81,957 2022 18,356 50,656 11,512 62,168 80,524 Thereafter 1,034,889 1,005,832 157,415 1,163,247 2,198,136 Total Principal 1,129,909 1,274,864 212,406 1,487,270 2,617,179
Unamortized net premium/discounts and cost of issuance, net 78,304 96,860 96,860 175,164 Build-to-suit lease related interest (89,393) (89,393) (89,393)
Total debt obligation 1,208,213$ 1,371,724$ 123,013$ (a) 1,494,737$ 2,702,950$
(a) Present value of future lease payments
UPHS
The University has letters of credit with various financial institutions to secure certain self-insured liabilities in the amount of $8,081,000 and $21,925,000 at June 30, 2017 and 2016, respectively. These letters of credit have evergreen provisions for automatic renewal. There have been no draws under these letters of credit.
Academic Component
On January 19, 2017, Pennsylvania Higher Educational Facilities Authority (PHEFA) issued Series A of 2017 revenue bonds (PHEFA 2017A bonds) with an aggregate principal amount of $178,395,000. The proceeds were used to fund or reimburse the University for the cost of various capital projects. Interest on the PHEFA 2017A bonds is fixed with coupons ranging between 4.00% to 5.00%. On April 28, 2016, PHEFA issued Series A of 2016 refunding revenue bonds (PHEFA 2016A bonds) with an aggregate principal amount of $169,635,000. The proceeds were used to fund an escrow which will be used to refund $7,600,000 from the PHEFA Series B of 2009 revenue bonds, $33,110,000 from PHEFA Series of 2010 revenue bonds and $117,310,000 from PHEFA Series A of 2011 revenue bonds. The refunded bonds were legally defeased, and as such, are no longer included among the University’s reported liabilities. Interest on the PHEFA 2016A bonds is fixed with coupons ranging between 2.25% and 5.25%. As a result of the legal defeasance of debt associated with the issuance of PHEFA 2016A bonds, the University reported a loss on early extinguishment of debt in Pension, OPEB and other, net on the Consolidated Statements of Activities in the amount of $24,556,000 for the year ended June 30, 2016. The University has variable rate debt in the amount of $59,900,000 which is subject to optional tender by the holders upon seven days’ notice. These bonds are reflected in the table above based on original scheduled maturities. In the event that the University receives notice of any optional tender on its variable rate demand bonds, the purchase price will be repaid from the remarketing of the bonds. However, in the event that the entire remarketing effort were to fail, the University would have the general obligation to purchase the bonds. On June 14, 2016, the University entered into a five year agreement with a financial institution, whereby the institution has agreed to provide a line of credit in the amount of $100,000,000 for general purposes of the University. The University pays a fee annually on the unused amount of the line of credit. As of June 30, 2017, there have been no draws under the agreement.

CONSOLIDATED NOTES TO FINANCIAL STATEMENTS
An
nu
al F
ina
ncia
l Re
po
rt 2016-2017
69
Consolidated Notes to Financial Statements
F
inan
cial
Rep
ort 2
016
– 20
17
34
UPHS The Lancaster County Hospital Authority (LCHA) Revenue Bonds and PHEFA Revenue Bonds are secured by master notes issued under the UPHS Master Trust Indenture (MTI). The MTI and related agreements contain certain restrictive covenants which limit the issuance of additional indebtedness, and among other things, require UPHS to meet an annual debt service coverage requirement of “income available for debt service” (excess of revenue over expenses plus depreciation, amortization, interest expense and extraordinary items) at an amount equal to 110% of the annual debt service requirements. If the coverage requirement for a particular year is not met, within six months of the close of that fiscal year, UPHS must retain the services of a consultant to make recommendations to improve the coverage requirement. UPHS must also implement the recommendations of the consultant to the extent that they can be feasibly implemented. UPHS will not be considered to be in default of the provisions of the MTI so long as UPHS has sufficient cash flow to pay total operating expenses and debt service for the fiscal year. In both 2017 and 2016, UPHS met its debt service coverage requirement under the MTI. Additionally, UPHS has pledged its gross revenues to secure its obligation under the MTI. On August 25, 2016, PHEFA issued Series C of 2016 Health System refunding revenue bonds (PHEFA UPHS 2016C bonds) with an aggregate principal amount of $129,290,000. The proceeds were used to fund an escrow which will be used to refund $123,400,000 from PHEFA UPHS Series A of 2011 bonds. The refunded PHEFA UPHS Series A of 2011 bonds were legally defeased, and as such, are no longer included among UPHS’s reported liabilities. Interest on the PHEFA UPHS 2016C bonds is fixed with coupons ranging between 2.00% to 5.00%. As a result of the legal defeasance of debt associated with the issuance of PHEFA UPHS 2016C bonds, UPHS reported a loss on early extinguishment of debt in Pension, OPEB and other, net on the Consolidated Statements of Activities in the amount of $27,947,000 for the year ended June 30, 2017. On April 7, 2016, LCHA issued Series A of 2016 Health System revenue bonds (LCHA UPHS 2016A bonds) with an aggregate principal amount of $173,310,000. The proceeds were used to fund an escrow which will be used to refund $33,450,000 from LCHA Lancaster General Hospital (LGH) Series A of 2007 bonds and $82,510,000 from LCHA LGH Series B of 2012 bonds. In addition to the refunding, the bonds provided $65,890,000 proceeds used to fund or reimburse UPHS for the cost of various capital projects. The refunded LCHA LGH Series A of 2007 and LCHA LGH Series B of 2012 bonds were legally defeased, and as such, are no longer included among UPHS’s reported liabilities. Interest on the LCHA UPHS 2016A bonds is fixed with coupons ranging between 3.00% to 5.00%. On April 7, 2016, LCHA issued Series B of 2016 Health System revenue bonds (LCHA UPHS 2016B bonds) with an aggregate principal amount of $128,050,000. The proceeds were used to fund an escrow which will be used to refund $30,465,000 from PHEFA UPHS Series A of 2009 bonds and $26,600,000 from PHEFA UPHS Series A of 2011 bonds. In addition to the refunding, the bonds provided $81,110,000 proceeds used to fund or reimburse UPHS for the cost of various capital projects. The refunded PHEFA UPHS Series A of 2009 and PHEFA UPHS Series A of 2011 bonds were legally defeased, and as such, are no longer included among UPHS’s reported liabilities. Interest on the LCHA UPHS 2016B bonds is fixed with coupons ranging from 4.00% to 5.00%. As a result of the legal defeasance of debt associated with the issuance of LCHA UPHS 2016A and 2016B bonds, UPHS reported a loss on early extinguishment of debt in Pension, OPEB and other, net on the Consolidated Statements of Activities in the amount of $22,366,000 for the year ended June 30, 2016. UPHS has variable rate debt in the amount of $69,995,000 which is subject to optional tender by the holders upon seven days’ notice. These bonds are reflected in the debt obligations maturity table above based on original scheduled maturities. In the event that UPHS receives notice of any optional tender on its variable rate demand bonds, the purchase price will be repaid from the remarketing of the bonds. However, in the event that the entire remarketing effort were to fail, UPHS has in place a renewable direct pay letter of credit issued by Bank of America with an expiration date of April

CONSOLIDATED NOTES TO FINANCIAL STATEMENTS
70
Un
ive
rsit
y o
f P
en
nsy
lva
nia
Consolidated Notes to Financial Statements
F
inan
cial
Rep
ort 2
016
- 201
7
35
15, 2018. In the event that the letter of credit cannot be drawn upon, UPHS would have the general obligation to purchase the bonds. On April 13, 2016, UPHS entered into a three year agreement with a financial institution, whereby the institution has agreed to provide a line of credit in the amount of $100,000,000 for general purposes of UPHS. UPHS pays a fee annually on the unused amount of the line of credit. As of June 30, 2017, there have been no draws under the agreement. Interest Rate Swap Agreements The University enters into interest rate swap agreements to synthetically modify the interest rate terms of its long term debt portfolio. These agreements are not entered into for trading or speculative purposes. Fair value of these agreements is determined by obtaining quotes from Goldman Sachs Mitsui Marine Derivative Products, L.P. (GSMMDP) and Merrill Lynch, respectively, which are based on the income approach, using observable market data to discount future net payment streams and accordingly considers this to be a Level 2 measurement. The quotes provided also represent the amount the University would accept or be required to pay to transfer the agreement to GSMMDP and Merrill Lynch, respectively, or exit price as defined by the Fair Value Measurements standard. The University also takes into account the risk of nonperformance. The following table summarizes the terms of the University’s interest rate swap agreements (in thousands):
Academic Component
Notional Amounts $ 101,950 $ 23,375 $ 69,995 $ 24,800 $ 24,800
Trade Date 11/6/2007 6/28/2006 10/24/2007 7/15/2009 1/7/2010
Maturity Date 7/1/2034 7/1/2041 1/1/2038 8/15/2023 8/15/2023
Rates:Receive 67% of 1-Month
LIBOR 70% of 1-month
LIBOR 67% of 1-Month
LIBOR 3.184% 2.902%
Pay 3.573% 3.980% 3.755% SIFMA index SIFMA index
UPHS
The following tables summarize the fair value of the interest rate swap agreements, not designated as hedging instruments, as of June 30, 2017 and 2016, and the related gains and (losses) on the interest rate swap agreements, both realized and unrealized, for the years ended June 30, 2017 and 2016 (in thousands): Consolidated Statements of Position Line Item 2017 2016
Asset interest rate swaps
UPHS Other assets 2,635$ 4,844$ Total Asset interest rate swaps 2,635$ 4,844$
Liability interest rate swaps
Academic Component Accrued expenses and other liabilit ies 21,929$ 31,491$
UPHS Accrued expenses and other liabilit ies 7,524 12,694 Total Liability interest rate swaps 29,453$ 44,185$
Consolidated Statements of Activities Line Item 2017 2016
Academic Component Return on investments, net 6,424$ (11,986)$
UPHS Return on investments, net (767) 673 Total 5,657$ (11,313)$

CONSOLIDATED NOTES TO FINANCIAL STATEMENTS
An
nu
al F
ina
ncia
l Re
po
rt 2016-2017
71
Consolidated Notes to Financial Statements
F
inan
cial
Rep
ort 2
016
– 20
17
36
14. Net Assets
The major components of net assets at June 30, 2017 and 2016 are as follows (in thousands):
2017 Unrestricted Total
General operating 3,482,264$ 267,246$ 3,749,510$
Sponsored programs 42,749 42,749
Capital 84,411 84,411
Student loans 10,174 1,291 17,152$ 28,617
Planned giving agreements 113,599 15,340 128,939
Endowment 5,931,351 2,641,506 3,640,350 12,213,207
Total 9,466,538$ 3,108,053$ 3,672,842$ 16,247,433$
2016 Unrestricted Total
General operating 3,226,035$ 264,047$ 3,490,082$
Sponsored programs 49,838 49,838
Capital 86,959 86,959
Student loans 10,277 16,933$ 27,210
Planned giving agreements 135,418 7,718 143,136
Endowment 5,161,319 2,143,305 3,410,740 10,715,364
Total 8,447,469$ 2,629,729$ 3,435,391$ 14,512,589$
Temporarily restricted
Permanently restricted
Permanently restricted
Temporarily restricted
15. Operating Leases The University leases research labs, office space and equipment under operating leases expiring through December 2037. Rental expense for the years ended June 30, 2017 and 2016 totaling $99,417,000 and $93,903,000, respectively, is included in the accompanying Consolidated Statements of Activities.
At June 30, 2017, future minimum lease payments under existing operating leases were as follows (in thousands):
2018 87,429$ 2019 70,506 2020 63,157 2021 55,978 2022 49,070 Thereafter 341,301 Total Minimum lease payments 667,441$

CONSOLIDATED NOTES TO FINANCIAL STATEMENTS
72
Un
ive
rsit
y o
f P
en
nsy
lva
nia
Consolidated Notes to Financial Statements
F
inan
cial
Rep
ort 2
016
- 201
7
37
16. Functional Classification of Expenditures Expenses for the years ended June 30, 2017 and 2016 are categorized on a functional basis as follows (in thousands):
2016
Compensation and benefits
Depreciation and amortization
Interest on indebtedness
O ther operating expense Total Total
Instruction 860,218$ 62,800$ 4,613$ 412,755$ 1,340,386$ 1,253,965$ Research 417,924 41,467 21,551 321,347 802,289 746,560 Hospital and physician
practices 3,303,965 277,961 48,337 2,137,650 5,767,913 5,269,391 Auxiliary enterprises 35,550 32,265 4,120 88,930 160,865 141,315 Other educational activities 132,497 14,511 750 37,046 184,804 196,844 Student services 55,849 - 145 43,067 99,061 86,629 Academic support 39,395 16,407 321 124,235 180,358 81,013 Management and general 233,063 20,182 405 35,297 288,947 294,230 Independent operations 7,785 5,500 179 58,642 72,106 70,040 Total 5,086,246$ 471,093$ 80,421$ 3,258,969$ 8,896,729$ 8,139,987$
2017
Operation and maintenance of PPE and depreciation are allocated to functional classifications based on square footage. Interest expense is allocated to the functional classifications of the activity that directly benefited from the proceeds of the debt.
17. Subsequent Events
The University has evaluated subsequent events for the period from June 30, 2017 through September 29, 2017, the date the consolidated financial statements were issued.

An
nu
al F
ina
ncia
l Re
po
rt 2016-2017
73
TRUSTEES OF THE UNIVERSITY OF PENNSYLVANIA
As of June 30, 2017
David L. Cohen, Esq., L’81, ChairMr. Robert M. Levy, WG’74, Vice Chair
TRUSTEES
Mrs. Bonnie Miao Bandeen, C’80, WG’85Allan C. Bell, Esq., C’81Scott L. Bok, Esq., C’81, W’81, L’84Mrs. Judith L. Bollinger, WG’81Mr. David Brush, C’82Mr. Alberto J. Chamorro, W’78 Mr. James G. Dinan, W’81Mrs. Lee Spelman Doty, W’76Mrs. Connie K. Duckworth, WG’79Mr. David Ertel, W’87, WG’88Mr. Christopher H. FranklinMrs. Sarah Fuller, CW’71Mr. Michael F. Gerber, C’95Perry Golkin, Esq., W’74, WG’74, L’78Mr. Joel M. Greenblatt, W’79, WG’80Mr. James H. Greene, Jr., W’72Dr. Amy Gutmann, Ex Officio Dr. Janet F. HaasMr. Andrew R. Heyer, W’79, WG’79Osagie O. Imasogie, Esq., GL’85James C. Johnson, Esq., C’74, L’77Mr. Robert S. Kapito, W’79Mr. Michael J. Kowalski, W’74Susanna E. Lachs, Esq., CW’74, ASC’76Mrs. Andrea Berry Laporte, Nu’69Mr. William P. Lauder, W’83Mr. Charles B. Leitner III, C’81M. Claire Lomax, Esq., C’84
Dr. Deborah Marrow, CW’70, Gr’78Dr. Patricia Martin, M’85Mr. Marc F. McMorris, C’90, WG’94Mr. Kenneth D. Moelis, W’80, WG’81Mr. Ofer Nemirovsky, EE’79, W’79Mr. Daniel S. Och, W’82Mr. Dhananjay M. Pai, W’83Mr. Simon D. Palley, WG’83Mrs. Cheryl Peisach, W’87Mr. Richard C. Perry, W’77Mrs. Julie Beren Platt, C’79Mr. Michael J. Price, W’79 Mr. Andrew S. Rachleff, W’80Mr. Ramanan Raghavendran, ENG’89, W’89, LPS’15Mrs. Ann Reese, CW’74Mr. Marc J. Rowan, W’84, WG’85Mr. Theodore E. Schlein, C’86Mrs. Julie Breier Seaman, C’86Mr. John P. Shoemaker, C’87Amb. Martin J. Silverstein, GL’08Mr. Robert M. Stavis, EAS’84, W’84Mr. Richard VagueMrs. Jill Topkis Weiss, C’89, WG’93Mr. Mark B. Werner, C’80Hon. Tom Wolf, Ex Officio
EMERITUS
Mrs. Madlyn K. Abramson, Ed’57, GEd’60Gilbert F. Casellas, Esq., L’77Mrs. Susan W. CatherwoodDr. Gloria Twine Chisum, Gr’60, Hon’94Mr. L. John Clark, W’63, WG’68
Mr. Robert A. Fox, C’52Mr. Stephen J. Heyman, W’59Mr. Jon M. Huntsman, W’59, Hon’96Mr. Paul K. Kelly, C’62, WG’64Mr. James J. Kim, W’59, G’61, Gr’63Mr. Leonard A. Lauder, W’54Paul S. Levy, Esq., L’72Mr. Robert P. Levy, C’52Mr. William L. Mack, W’61Mr. A. Bruce Mainwaring, C’47Mr. Howard S. Marks, W’67Mr. Edward J. Mathias, C’64Ms. Andrea Mitchell, CW’67Mr. Paul F. Miller, Jr., W’50, Hon’81Mr. John B. Neff, Hon’84Mr. Russell E. Palmer, Hon’84Mr. Ronald O. Perelman, W’64, WG’66Mr. Egbert L. J. Perry, CE’76, WG’78, GCE’79Mr. James S. Riepe, W’65, WG’67, Hon’10Mrs. Katherine Stein Sachs, CW’69Mrs. Adele K. Schaeffer, CW’55Mr. Alvin V. Shoemaker, W’60, Hon’95Dr. Krishna P. Singh, GME’69, Gr’72Dr. P. Roy Vagelos, C’50, Hon’99Mr. George A. Weiss, W’65, Hon’14Dr. Charles K. Williams II, Gr’78, Hon’97Mr. Paul Williams, W’67 Mr. Mark O. Winkelman, WG’73
HONORARY
John G. Harkins, Jr., Esq., C’53, L’58Mrs. Margaret R. Mainwaring, Ed’47, Hon’85

74
Un
ive
rsit
y o
f P
en
nsy
lva
nia
STATUTORY OFFICERSAs of June 30, 2017
PRESIDENT Dr. Amy Gutmann
PROVOST Dr. Vincent Price
EXECUTIVE VICE PRESIDENT Mr. Craig R. Carnaroli
EXECUTIVE VICE PRESIDENT OF THE UNIVERSITY OF PENNSYLVANIA FOR THE HEALTH SYSTEM AND DEAN,SCHOOL OF MEDICINE Dr. J. Larry Jameson
SENIOR VICE PRESIDENT AND GENERAL COUNSEL OF THE UNIVERSITY OF PENNSYLVANIA AND THE UNIVERSITY OF PENNSYLVANIA HEALTH SYSTEM Wendy S. White, Esq,
VICE PRESIDENT FOR BUDGET AND MANAGEMENT ANALYSIS Ms. Bonnie Gibson
VICE PRESIDENT FOR BUSINESS SERVICES Ms. Marie Witt
VICE PRESIDENT AND CHIEF OF STAFF Mr. Gregory Rost
VICE PRESIDENT FOR DEVELOPMENT AND ALUMNI RELATIONS Mr. John H. Zeller
VICE PRESIDENT FOR FINANCE AND TREASURER Ms. MaryFrances McCourt
VICE PRESIDENT FOR GOVERNMENT AND COMMUNITY AFFAIRS Mr. Jeffrey Cooper
VICE PRESIDENT FOR HUMAN RESOURCES Dr. John J. Heuer
VICE PRESIDENT FOR INFORMATION TECHNOLOGY AND UNIVERSITY CHIEF INFORMATION OFFICER Mr. Thomas H. Murphy
VICE PRESIDENT FOR INSTITUTIONAL AFFAIRS Ms. Joann Mitchell
VICE PRESIDENT FOR PUBLIC SAFETY Ms. Maureen Rush
VICE PRESIDENT FOR FACILITIES AND REAL ESTATE SERVICES Ms. Anne Papageorge
VICE PRESIDENT AND SECRETARY OF THE UNIVERSITY Ms. Leslie Laird Kruhly
COMPTROLLER Mr. John Horn

CONSOLIDATED NOTES TO FINANCIAL STATEMENTS
An
nu
al F
ina
ncia
l Re
po
rt 2016-2017
75
University of Pennsylvania Nondiscrimination Statement
The University of Pennsylvania values diversity and seeks talented students, faculty and staff from diverse backgrounds. The University of Pennsylvania does not discriminate on the basis of race, color, sex, sexual orientation, gender identity, religion, creed, national or ethnic origin, citizenship status, age, disability, veteran status or any other legally protected class status in the administration of its admissions, financial aid, educational or athletic programs, or other University-administered programs or in its employment practices. Questions or complaints regarding this policy should be directed to the Executive Director of the Office of Affirmative Action and Equal Opportunity Programs, Sansom Place East, 3600 Chestnut Street, Suite 228, Philadelphia, PA 19104-6106; or (215) 898-6993 (Voice). (1/1/2009)
The 2016/2017 Annual Financial Report was produced by the Office of the VP for Finance and Treasurer Special thanks to:
Mary Ellen LovejoySuzanne ArcariRussell DiLeoSteve PredjulekCheryl Williamson
Design by www.7ate9-Design.com This report can be viewed online atwww.finance.upenn.edu/vpfinance