annual financial reportmanagement’s discussion and analysis (unaudited) 7 – 18 basic financial...
TRANSCRIPT

colorado housing and finance authority
annual financial reportDecember 31, 2018 and 2017
homeownership
business finance
rental housing
COLORADO HOUSING AND FINANCE AUTHORITY – Annual Financial Report Table of Contents
Page(s) EXECUTIVE LETTER (Unaudited) 1 – 3 INDEPENDENT AUDITOR’S REPORT 4 – 6 MANAGEMENT’S DISCUSSION AND ANALYSIS (Unaudited) 7 – 18
BASIC FINANCIAL STATEMENTS 19 – 23
Statement of Net Position 20 Statement of Revenues, Expenses and Changes in Net Position 21 Statement of Cash Flows 22 – 23
NOTES TO BASIC FINANCIAL STATEMENTS 24 – 76 REQUIRED SUPPLEMENTAL INFORMATION (Unaudited) 77 – 79
Schedules of Selected Pension Information 78 Schedules of Selected OPEB Information 79
SUPPLEMENTAL INFORMATION 80 – 89
1. Combining Schedule – Statement of Net Position 81 2. Combining Schedule – Statement of Revenues, Expenses and Changes in Net Position 82 3. Combining Schedule – Statement of Cash Flows 83 – 84 4. Schedule of Adjusted Net Worth 85 5. Schedule of Other Assets 86 6. Liquid Asset Requirement Calculation for Issuers 87 7. Capital Requirement Calculation for Issuer 88 8. Schedule of Insurance Requirement 89
HUD REPORTING 90 – 94
Independent Auditor’s Report on Compliance With Requirements That Could Have a Direct and Material Effect on Each Major HUD Program and on Internal Control Over Compliance Based on an Audit in Accordance With the HUD Consolidated Audit Guide 91 – 92 Independent Auditor’s Report on Internal Control over Financial Reporting and on Compliance and Other Matters Based on an Audit of Financial Statements Performed in Accordance with Government Auditing Standards 93 – 94

executive letter (unaudited)

2
Message from Cris White, Executive Director and CEO March 28, 2019 CHFA was proud to invest $2.4 billion into our mission in 2018. This investment supported affordable housing and community development throughout Colorado, as detailed below, and was estimated to spur $4.2 billion in economic activity statewide. Overall in 2018, CHFA supported:
• 8,355 Colorado households in obtaining home purchase loans, mortgage refinance loans, or mortgage credit certificates;
• the development or preservation of 40 affordable rental housing projects, supporting a total of 5,136 rental housing units; and
• 748 businesses and nonprofits with our capital access and business finance programs, which combined supported 4,287 jobs.
Homeownership CHFA invested $2.1 billion in first mortgage home loans in 2018, setting a record for highest annual production. Additionally, enrollment in statewide CHFA-sponsored homebuyer education classes remained strong with 13,022 households served. The need for CHFA’s programs that promote responsible, affordable homeownership is apparent. The median single-family home price in Colorado was $365,000, representing a 56 percent increase compared to five years ago. The median loan amount of CHFA homeownership customers was $257,050. Rental housing CHFA invested $277.2 million in multifamily loans and awarded $42.9 million in federal and state Low Income Housing Tax Credits to support the development or preservation of affordable rental housing properties. This will result in the development or preservation of 5,136 units throughout Colorado. Affordable rental housing continues to be a much-needed option in communities statewide. Colorado’s median rent remains high at $1,381, while 50 percent of all Colorado renters are housing cost-burdened, paying more than 30 percent of their household income towards rent. Business finance To support businesses and nonprofits throughout Colorado, CHFA invested $48.9 million through our business finance programs. CHFA-administered programs that provide access to capital, the Cash Collateral Support (CCS) and Colorado Credit Reserve (CCR) programs, both strengthened businesses statewide last year. CCS leveraged $18.9 million in private-sector financing and CCR leveraged $20.3 million. Community Impact Fund To help CHFA achieve its mission, our Community Impact Fund (CIF) remained an important resource. The total available CIF cash balance at the end of 2018 was $48.2 million. During the year, $76.5 million was contributed to the fund and $79.7 million was deployed to homeownership and rental housing programs, which supported 4,900 single family borrowers and the development or preservation of 492 affordable rental housing units. In addition, $8.8 million in CIF funding has been committed to support future projects. CIF has become an established, flexible source of funding that gives CHFA unique opportunities to further our investment in our mission.

3
CHFA’s investment into our mission manifests in the lives of those we serve—homeowners, renters, business owners, and Colorado’s workforce—and we continue to work towards ways to strengthen Colorado in the years to come.
Cris A. White Executive Director and CEO

independent auditor’s report

Independent Auditor’s Report The Board of Directors Colorado Housing and Finance Authority Report on the Financial Statements We have audited the accompanying financial statements of Colorado Housing and Finance Authority (the Authority) as of and for the years ended December 31, 2018 and 2017, and the related notes to the financial statements, which collectively comprise the Authority’s basic financial statements as listed in the table of contents. Management’s Responsibility for the Financial Statements Management is responsible for the preparation and fair presentation of these financial statements in accordance with accounting principles generally accepted in the United States of America; this includes the design, implementation and maintenance of internal control relevant to the preparation and fair presentation of financial statements that are free from material misstatement, whether due to fraud or error. Auditor’s Responsibility Our responsibility is to express an opinion on these financial statements based on our audits. We conducted our audits in accordance with auditing standards generally accepted in the United States of America and the standards applicable to financial audits contained in Government Auditing Standards, issued by the Comptroller General of the United States. Those standards require that we plan and perform the audit to obtain reasonable assurance about whether the financial statements are free from material misstatement. An audit involves performing procedures to obtain audit evidence about the amounts and disclosures in the financial statements. The procedures selected depend on the auditor’s judgment, including the assessment of the risks of material misstatement of the financial statements, whether due to fraud or error. In making those risk assessments, the auditor considers internal control relevant to the entity’s preparation and fair presentation of the financial statements in order to design audit procedures that are appropriate in the circumstances, but not for the purpose of expressing an opinion on the effectiveness of the entity’s internal control. Accordingly, we express no such opinion. An audit also includes evaluating the appropriateness of accounting policies used and the reasonableness of significant accounting estimates made by management, as well as evaluating the overall presentation of the financial statements. We believe that the audit evidence we have obtained is sufficient and appropriate to provide a basis for our audit opinion. Opinion In our opinion, the financial statements referred to above present fairly, in all material respects, the respective financial position of the Colorado Housing and Finance Authority as of December 31, 2018 and 2017, the respective changes in financial position and cash flows thereof for the years then ended in accordance with accounting principles generally accepted in the United States of America.
5
Emphasis of a Matter—Adoption of a Standard As explained in Note 1 to the financial statements, the Authority adopted Governmental Accounting Standards Board (GASB) Statement No. 75, Accounting and Financial Reporting for Postemployment Benefits Other Than Pensions (OPEB), which resulted in the Authority restating net position for recognition of the Authority’s OPEB-related activity incurred prior to January 1, 2018. Our opinion is not modified with respect to this matter. Other Matters Required Supplementary Information Accounting principles generally accepted in the United States of America require that the management’s discussion and analysis and the schedules of selected pension and OPEB information, as listed in the table of contents, be presented to supplement the basic financial statements. Such information, although not a part of the basic financial statements, is required by the Governmental Accounting Standards Board, who considers it to be an essential part of financial reporting for placing the basic financial statements in an appropriate operational, economic or historical context. We have applied certain limited procedures to the required supplementary information in accordance with auditing standards generally accepted in the United States of America, which consisted of inquiries of management about the methods of preparing the information and comparing the information for consistency with management’s responses to our inquiries, the basic financial statements, and other knowledge we obtained during our audit of the basic financial statements. We do not express an opinion or provide any assurance on the information because the limited procedures do not provide us with sufficient evidence to express an opinion or provide any assurance. Supplementary and Other Information Our audit was conducted for the purpose of forming opinions on the financial statements that collectively comprise the Authority’s basic financial statements. The executive letter and the supplementary information, as listed in the table of contents, are presented for purposes of additional analysis and are not a required part of the basic financial statements. The supplementary information is the responsibility of management and was derived from and relates directly to the underlying accounting and other records used to prepare the basic financial statements. Such information has been subjected to the auditing procedures applied in the audit of the basic financial statements and certain additional procedures, including comparing and reconciling such information directly to the underlying accounting and other records used to prepare the basic financial statements, or to the basic financial statements themselves, and other additional procedures in accordance with auditing standards generally accepted in the United States of America. In our opinion, the supplementary information is fairly stated, in all material respects, in relation to the basic financial statements as a whole. The executive letter has not been subjected to the auditing procedures applied in the audit of the basic financial statements, and accordingly, we do not express an opinion or provide any assurance on it. Other Reporting Required by Government Auditing Standards In accordance with Government Auditing Standards, we have also issued our report dated March 28, 2019, on our consideration of the Authority’s internal control over financial reporting and on our tests of its compliance with certain provisions of laws, regulations, contracts, and grant agreements and other matters. The purpose of that report is solely to describe the scope of our testing of internal control over financial reporting and compliance and the results of that testing, and not to provide an opinion on the effectiveness of the Authority’s internal control over financial reporting or on compliance. That report is an integral part of an audit performed in accordance with Government Auditing Standards in considering the Authority’s internal control over financial reporting and compliance.
Denver, Colorado March 28, 2019
6

management’s discussion and analysis (unaudited)
Management’s Discussion and Analysis
(unaudited)
8
This section of the Colorado Housing and Finance Authority’s (the Authority) annual financial report presents management’s discussion and analysis of the financial position and results of operations as of and for the years ended December 31, 2018 and 2017. This information is being presented to provide additional information regarding the activities of the Authority and to meet the disclosure requirements of Government Accounting Standards Board (GASB) Statement No. 34, Basic Financial Statements – and Management’s Discussion and Analysis – for State and Local Governments. The Authority is a body corporate and political subdivision of the State of Colorado (the State), that finances affordable housing, business and economic growth opportunities for residents and businesses of Colorado. Its dual mission is to increase the availability of affordable, decent and accessible housing for lower- and moderate-income Coloradans, and to strengthen the state’s economy by providing financial assistance to businesses. Established by the Colorado General Assembly in 1973, the Authority raises funds through the public and private sale of bonds and notes, which are not obligations of the State. As a self-sustaining organization, the Authority’s operating revenues come from loan and investment income, program administration fees, loan servicing fees and gains on sales of loans. The Authority receives no tax appropriations, and its net revenues are reinvested in its programs and used to support bond ratings. The Authority participates in the Government National Mortgage Association (Ginnie Mae) Mortgage Backed Securities (MBS) Programs. Through the MBS Programs, Ginnie Mae guarantees securities that are issued by the Authority and that are backed by pools of mortgage loans. Ginnie Mae securities, which can be held or sold, carry the full faith and credit guaranty of the United States government. Holders of the securities receive a “pass-through” of the principal and interest payments on a pool of mortgage loans, less amounts required to cover servicing costs and Ginnie Mae guaranty fees. The Ginnie Mae guaranty ensures that the holder of the security issued by the Authority receives the timely payment of scheduled monthly principal and any unscheduled recoveries of principal on the underlying mortgage loans, plus interest at the rate provided for in the securities. All loans pooled under the Ginnie Mae MBS Programs are either insured by the Federal Housing Administration or are guaranteed by the United States Department of Agriculture Rural Development or the Veterans Administration. The Authority also participates in the Federal National Mortgage Association (Fannie Mae) Mortgage Backed Securities (MBS) and Whole Loan Commitment Programs. Fannie Mae is a Government-Sponsored Enterprise with a public mission to provide stability in and to increase the liquidity of the residential mortgage market for homebuyers. The Authority is a Fannie Mae Seller/Servicer, either selling whole loans to Fannie Mae for cash or swapping pooled loans for mortgage-backed securities (MBS) issued by Fannie Mae, which securities can be held or sold. The Authority also participates in the Federal Home Loan Mortgage Corporation (Freddie Mac) Whole Loan Commitment Program. Freddie Mac is a Government-Sponsored Enterprise with a public mission to provide liquidity, stability and affordability to the nation’s housing market. The Authority is a Freddie Mac Seller/Servicer, selling whole loans to Freddie Mac for cash. Overview of the Financial Statements The basic financial statements consist of the Statement of Net Position, the Statement of Revenues, Expenses and Changes in Net Position, the Statement of Cash Flows and the notes thereto. The Authority follows enterprise fund accounting, whereby changes in net position are reported as soon as the underlying event giving rise to the change occurs regardless of the timing of related cash flows. The financial statements offer information about the Authority’s activities and operations. The Statement of Net Position includes all of the Authority’s assets and liabilities, presented in order of liquidity, along with deferred outflows and deferred inflows. The resulting net position presented in these statements is displayed as invested in capital assets, restricted or unrestricted. Net position is restricted when its use is subject to external limits such as bond indentures, legal agreements or statutes. Net position is unrestricted when there are no external limits on its use. The unrestricted net position is, however, formally designated for specific purposes by the Authority’s Board of Directors each year.

Management’s Discussion and Analysis
(unaudited)
9
All of the Authority’s current year revenues and expenses are recorded in the Statement of Revenues, Expenses and Changes in Net Position. This statement measures the activities of the Authority’s operations over the past year and presents the resulting change in net position. The final required financial statement is the Statement of Cash Flows. The primary purpose of this statement is to provide information about the Authority’s cash receipts and cash payments during the reporting period. This statement reports cash receipts, cash payments and net changes in cash resulting from operating, noncapital financing, capital and related financing and investing activities. The statement provides information regarding the sources and uses of cash and the change in the cash balance during the reporting period. The notes to the financial statements provide additional information that is essential for a full understanding of the information provided in the financial statements. Required and other supplementary information is presented following the notes to financial statements to provide selected pension and Other Post Employment Benefit (OPEB) information and other supplemental information, such as combining schedules for the Authority’s programs. These programs are explained in greater detail below. Programs General programs – Insured and uninsured single family and multifamily loans have been made by the Authority using funds in its General Fund designated as the Community Impact Fund (CIF). Within the CIF resides the Authority’s Housing Opportunity Fund or "HOF Program." Under the HOF Program, the Authority makes fixed interest rate loans and provides interest rate subsidies to nonprofit and for profit developers in support of rental housing facilities targeted to support affordable rental housing. The Authority also makes loans to support its single family program, including down payment assistance loans, within the fund. All HOF loans must conform to standard Authority due diligence processes and underwriting criteria, unless waived in accordance with the Authority’s standard process, and are secured by either first or second mortgages on real estate. Loan terms on HOF loans may range up to 40 years. Single Family programs – Under its Single Family Mortgage Programs, the Authority may purchase mortgage loans for single-family residential dwellings from qualified originating Mortgage Lenders, or may, under certain programs, provide loans directly to individual borrowers. The Authority presently acquires mortgage loans under its Non-Qualified Single Family Mortgage Program (taxable) and its Qualified Single Family Mortgage Program (tax exempt). Loans made under the qualified program are subject to certain income and purchase price limits. The Authority permits eligible borrowers under its Non-Qualified Single Family Mortgage Program to meet certain income limits which are generally somewhat higher than the limits permitted for a Qualified Single Family Mortgage Program. There is no limit imposed by the Authority on prior home ownership or limit on the purchase price of a residence which may be acquired with the proceeds of a loan under the Non-Qualified Single Family Mortgage Program, although all such mortgage loans must meet any applicable loan limit. Proceeds of a mortgage loan under the Non-Qualified Single Family Mortgage Program can be used under the Authority's refinancing programs to refinance existing Mortgage Loans. Multifamily Lending Programs – The Multifamily Lending programs provide financing to sponsors of affordable rental housing properties. Financing options include construction to permanent loans, permanent-only loans, acquisition loans, acquisition/rehabilitation loans and, in certain circumstances, refinancing of existing debt. Other financing structures may be considered, based upon the property characteristics and sub-market due diligence, as well as the demonstrated experience and financial capacity of the sponsor. The mortgages originated under the multifamily loan programs include a combination of insured and uninsured mortgages. The Authority is a Tier I lender under FHA's Section 542(c) of the Housing and Community Development Act of 1992, as amended, which provides insurance on multifamily loans and is a credit enhancement mechanism available only to qualified housing and finance agencies acting as the mortgage lender.
Management’s Discussion and Analysis
(unaudited)
10
Business Finance Programs – The Authority originates uninsured loans as part of its direct business loan programs, including the Direct Loan Program, the Non-Profit Real Estate Loan Program, the U.S. Small Business Administration 504 Program, the Rural Loan Program, the Rural Development Loan Program (RDLP) and the RENEW Program. These business loans must meet certain economic development or job creation/retention objectives and are made to Colorado businesses to provide long-term, fixed rate financing for real estate and equipment. The uninsured direct business loans are generally secured by a first lien on the assets financed, are made in amounts up to 90% of the lesser of cost or appraised value of the collateral, are fully amortizing over terms of up to thirty years for real estate loans and seven years for equipment, and generally require guarantees from principals of the business having a 20% or greater ownership interest. A guaranty is also required from the operating company if different from the Borrower. Some of the Authority's small business loans may carry credit enhancement by an agency or instrumentality of the United States under an insurance program requiring payment of not less than 50% of the principal amount of such mortgage in the event of default. Direct small business loans insured to date have utilized the USDA Rural Development guarantee programs.

Management’s Discussion and Analysis
(unaudited)
11
Financial Highlights
The following financial highlights section refers to the Authority’s consolidated financial statements. The reader of this management’s discussion and analysis section is encouraged to also review the Authority’s combining schedules within the supplementary information section of this 2018 financial report. Condensed Summary of Net Position (in thousands of dollars)
As of December 31, 2018 2017 2016
Assets
Cash 158,853$ 159,957$ 161,081$
Investments 824,935 704,495 537,674
Loans receivable, net 1,009,960 1,023,103 1,039,324
Loans receivable held for sale 214,557 149,694 128,425
Capital assets, net 13,887 14,194 4,441
Other assets 66,874 47,934 58,317
Total assets 2,289,066 2,099,377 1,929,262
Deferred outflows of resources
Accumulated increase in fair value of hedging derivatives 54,733 81,942 95,952
Pension and OPEB contributions and investment earnings 7,101 7,404 6,507
Refundings of debt 4,088 3,657 5,741
Total deferred outflows of resources 65,922 93,003 108,200
Liabilities
Bonds, notes payable and short-term debt 1,596,816 1,466,672 1,340,147
Derivative instruments and related borrowings 71,087 92,156 118,072
Net pension and OPEB liability - proportionate share 31,646 32,535 25,185
Other liabilities 175,523 177,601 184,462
Total liabilities 1,875,072 1,768,964 1,667,866
Deferred inflows of resources
Accumulated decrease in fair value of hedging derivatives 5,698 6,367 4,830
Pension and OPEB investment differences 6,728 49 296
Total deferred inflows of resources 12,426 6,416 5,126
Net position
Investment in capital assets, net of related debt 2,789 2,800 4,441
Restricted primarily by bond indentures 158,709 160,817 155,022
Unrestricted 305,992 253,383 205,007
Total net position 467,490$ 417,000$ 364,470$
Management’s Discussion and Analysis
(unaudited)
12
Statement of Net Position
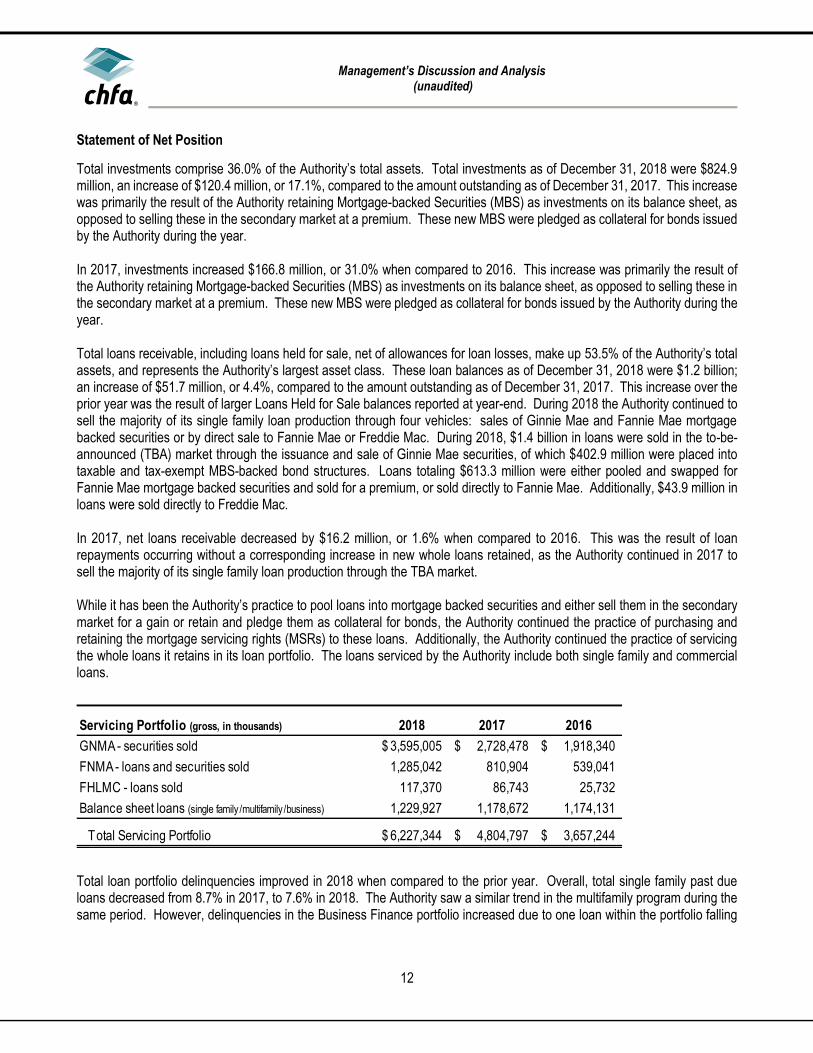
Total investments comprise 36.0% of the Authority’s total assets. Total investments as of December 31, 2018 were $824.9 million, an increase of $120.4 million, or 17.1%, compared to the amount outstanding as of December 31, 2017. This increase was primarily the result of the Authority retaining Mortgage-backed Securities (MBS) as investments on its balance sheet, as opposed to selling these in the secondary market at a premium. These new MBS were pledged as collateral for bonds issued by the Authority during the year.
In 2017, investments increased $166.8 million, or 31.0% when compared to 2016. This increase was primarily the result of the Authority retaining Mortgage-backed Securities (MBS) as investments on its balance sheet, as opposed to selling these in the secondary market at a premium. These new MBS were pledged as collateral for bonds issued by the Authority during the year. Total loans receivable, including loans held for sale, net of allowances for loan losses, make up 53.5% of the Authority’s total assets, and represents the Authority’s largest asset class. These loan balances as of December 31, 2018 were $1.2 billion; an increase of $51.7 million, or 4.4%, compared to the amount outstanding as of December 31, 2017. This increase over the prior year was the result of larger Loans Held for Sale balances reported at year-end. During 2018 the Authority continued to sell the majority of its single family loan production through four vehicles: sales of Ginnie Mae and Fannie Mae mortgage backed securities or by direct sale to Fannie Mae or Freddie Mac. During 2018, $1.4 billion in loans were sold in the to-be-announced (TBA) market through the issuance and sale of Ginnie Mae securities, of which $402.9 million were placed into taxable and tax-exempt MBS-backed bond structures. Loans totaling $613.3 million were either pooled and swapped for Fannie Mae mortgage backed securities and sold for a premium, or sold directly to Fannie Mae. Additionally, $43.9 million in loans were sold directly to Freddie Mac. In 2017, net loans receivable decreased by $16.2 million, or 1.6% when compared to 2016. This was the result of loan repayments occurring without a corresponding increase in new whole loans retained, as the Authority continued in 2017 to sell the majority of its single family loan production through the TBA market. While it has been the Authority’s practice to pool loans into mortgage backed securities and either sell them in the secondary market for a gain or retain and pledge them as collateral for bonds, the Authority continued the practice of purchasing and retaining the mortgage servicing rights (MSRs) to these loans. Additionally, the Authority continued the practice of servicing the whole loans it retains in its loan portfolio. The loans serviced by the Authority include both single family and commercial loans.
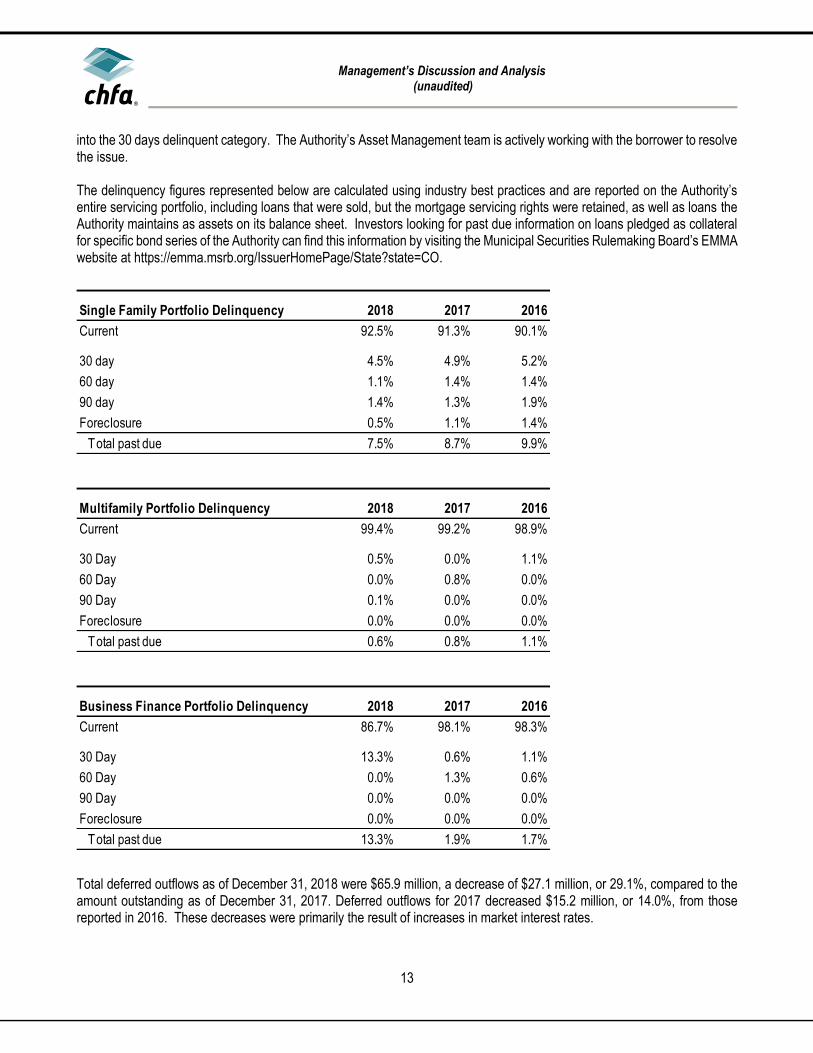
Total loan portfolio delinquencies improved in 2018 when compared to the prior year. Overall, total single family past due loans decreased from 8.7% in 2017, to 7.6% in 2018. The Authority saw a similar trend in the multifamily program during the same period. However, delinquencies in the Business Finance portfolio increased due to one loan within the portfolio falling
Servicing Portfolio (gross, in thousands) 2018 2017 2016
GNMA - securities sold 3,595,005$ 2,728,478$ 1,918,340$
FNMA - loans and securities sold 1,285,042 810,904 539,041
FHLMC - loans sold 117,370 86,743 25,732
Balance sheet loans (single family /multifamily /business) 1,229,927 1,178,672 1,174,131
Total Servicing Portfolio 6,227,344$ 4,804,797$ 3,657,244$
Management’s Discussion and Analysis
(unaudited)
13
into the 30 days delinquent category. The Authority’s Asset Management team is actively working with the borrower to resolve the issue. The delinquency figures represented below are calculated using industry best practices and are reported on the Authority’s entire servicing portfolio, including loans that were sold, but the mortgage servicing rights were retained, as well as loans the Authority maintains as assets on its balance sheet. Investors looking for past due information on loans pledged as collateral for specific bond series of the Authority can find this information by visiting the Municipal Securities Rulemaking Board’s EMMA website at https://emma.msrb.org/IssuerHomePage/State?state=CO.
Total deferred outflows as of December 31, 2018 were $65.9 million, a decrease of $27.1 million, or 29.1%, compared to the amount outstanding as of December 31, 2017. Deferred outflows for 2017 decreased $15.2 million, or 14.0%, from those reported in 2016. These decreases were primarily the result of increases in market interest rates.
Single Family Portfolio Delinquency 2018 2017 2016
Current 92.5% 91.3% 90.1%
30 day 4.5% 4.9% 5.2%
60 day 1.1% 1.4% 1.4%
90 day 1.4% 1.3% 1.9%
Foreclosure 0.5% 1.1% 1.4%
Total past due 7.5% 8.7% 9.9%
Multifamily Portfolio Delinquency 2018 2017 2016
Current 99.4% 99.2% 98.9%
30 Day 0.5% 0.0% 1.1%
60 Day 0.0% 0.8% 0.0%
90 Day 0.1% 0.0% 0.0%
Foreclosure 0.0% 0.0% 0.0%
Total past due 0.6% 0.8% 1.1%
Business Finance Portfolio Delinquency 2018 2017 2016
Current 86.7% 98.1% 98.3%
30 Day 13.3% 0.6% 1.1%
60 Day 0.0% 1.3% 0.6%
90 Day 0.0% 0.0% 0.0%
Foreclosure 0.0% 0.0% 0.0%
Total past due 13.3% 1.9% 1.7%
Management’s Discussion and Analysis
(unaudited)
14
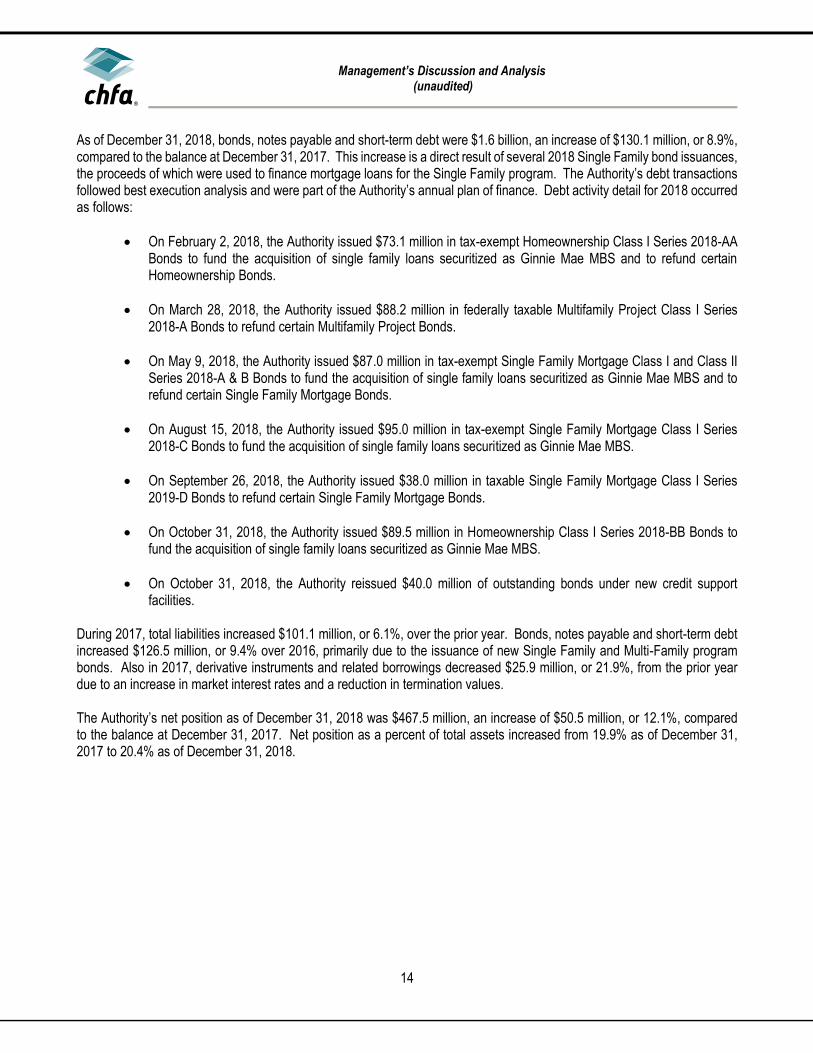
As of December 31, 2018, bonds, notes payable and short-term debt were $1.6 billion, an increase of $130.1 million, or 8.9%, compared to the balance at December 31, 2017. This increase is a direct result of several 2018 Single Family bond issuances, the proceeds of which were used to finance mortgage loans for the Single Family program. The Authority’s debt transactions followed best execution analysis and were part of the Authority’s annual plan of finance. Debt activity detail for 2018 occurred as follows:
• On February 2, 2018, the Authority issued $73.1 million in tax-exempt Homeownership Class I Series 2018-AA Bonds to fund the acquisition of single family loans securitized as Ginnie Mae MBS and to refund certain Homeownership Bonds.
• On March 28, 2018, the Authority issued $88.2 million in federally taxable Multifamily Project Class I Series 2018-A Bonds to refund certain Multifamily Project Bonds.
• On May 9, 2018, the Authority issued $87.0 million in tax-exempt Single Family Mortgage Class I and Class II Series 2018-A & B Bonds to fund the acquisition of single family loans securitized as Ginnie Mae MBS and to refund certain Single Family Mortgage Bonds.
• On August 15, 2018, the Authority issued $95.0 million in tax-exempt Single Family Mortgage Class I Series 2018-C Bonds to fund the acquisition of single family loans securitized as Ginnie Mae MBS.
• On September 26, 2018, the Authority issued $38.0 million in taxable Single Family Mortgage Class I Series 2019-D Bonds to refund certain Single Family Mortgage Bonds.
• On October 31, 2018, the Authority issued $89.5 million in Homeownership Class I Series 2018-BB Bonds to fund the acquisition of single family loans securitized as Ginnie Mae MBS.
• On October 31, 2018, the Authority reissued $40.0 million of outstanding bonds under new credit support facilities.
During 2017, total liabilities increased $101.1 million, or 6.1%, over the prior year. Bonds, notes payable and short-term debt increased $126.5 million, or 9.4% over 2016, primarily due to the issuance of new Single Family and Multi-Family program bonds. Also in 2017, derivative instruments and related borrowings decreased $25.9 million, or 21.9%, from the prior year due to an increase in market interest rates and a reduction in termination values. The Authority’s net position as of December 31, 2018 was $467.5 million, an increase of $50.5 million, or 12.1%, compared to the balance at December 31, 2017. Net position as a percent of total assets increased from 19.9% as of December 31, 2017 to 20.4% as of December 31, 2018.

Management’s Discussion and Analysis
(unaudited)
15
Condensed Summary of Revenues, Expenses and Changes in Net Position (in thousands of dollars)
For the years ended December 31, 2018 2017 2016
Interest income and expense:
Interest on loans receivable 55,876$ 55,777$ 63,648$
Interest on investments 23,962 17,068 14,472
Interest on debt (66,597) (56,033) (53,367)
Net interest income 13,241 16,812 24,753
Other operating income (loss):
Gain on sale of loans 83,817 106,788 86,527
Investment derivative activity gain 780 3,143 2,651
Net increase (decrease) in the fair value of investments 3,093 5,950 (5,032)
Other revenues 41,151 41,110 29,504
Total other operating income 128,841 156,991 113,650
Total operating income 142,082 173,803 138,403
Operating expenses:
Salaries and related benefits 26,211 27,515 22,207
General operating 61,870 92,395 90,306
Depreciation 1,038 684 932
Provision for loan losses 261 698 (180)
Total operating expenses 89,380 121,292 113,265
Net operating income 52,702 52,511 25,138
Nonoperating expenses:
Federal grant receipts 140,231 137,126 129,405
Federal grant payments (140,231) (137,126) (129,405)
Gain (loss) on sale of capital assets 18 19 (702)
Total nonoperating income and expenses, net 18 19 (702)
Change in net position 52,720 52,530 24,436
Net position:
Beginning of year 417,000 364,470 340,034
Restatement due to GASB 75 (2,230) -
End of year 467,490$ 417,000$ 364,470$

Management’s Discussion and Analysis
(unaudited)
16
Revenues, Expenses and Changes in Net Position
As reflected in the Statement of Revenues, Expenses and Changes in Net Position, the change in net position in 2018 was $190 thousand or 0.4% more than the results at December 31, 2017. The increase in net position compared to the prior year was primarily composed of the following:
− A $3.6 million decrease in net interest income. This decrease is primarily the result of higher interest on debt. During 2018 the Authority recognized a one-time adjustment to the deferred refunding portion of deferred outflows related to hedging activity for certain swaps nearing their option dates. A portion of the deferred outflows was being reported in error and the elimination of the incorrect balance was recognized by recording a charge to interest expense. Additionally, interest on debt increased as a result of the issuance of new bonds during the year. This increase was offset by an increase in interest on investments from new MBS being held as collateral for bonds issued during the year.
− A $28.2 million decrease in other operating income as a result of the following:
• $23.0 million decrease in gain on sale of loans. This change was driven by a decrease in the amount of single family loans being pooled into MBS and sold through the TBA market at a premium. While the total number of loans pooled into MBS during 2018 increased over 2017 levels, a greater number of those MBS were not sold at a premium in 2018, but rather held at par as collateral for bonds. Additionally, the MBS that were sold through the TBA market generally earned a lower premium than MBS sold in the prior year. Year-over-year growth in Single Family loan sale volume is depicted in the table below.
• $2.4 million decrease in investment derivative activity
• $2.9 million decrease in fair value of investments
− A $31.9 million decrease in total operating expenses due almost entirely to decreases in down payment assistance grants provided to borrowers by the authority.
During 2017, total operating income increased by $35.4 million, or 25.6%, compared to 2016. The following contributed to the increase:
− Interest on loans receivable decreased by $7.9 million as a result of higher loan prepayments without a corresponding increase in new loan production retained.
− Interest on investments increased by $2.6 million as a result of new program MBS being added to the balance sheet.
− Interest expense related to debt increased by $2.7 million due to an increase in the amount of bonds outstanding at the end of 2017.
− Gain on sale of loans increased $20.3 million due to increased loan activity related to the down payment assistance programs offered by the Authority in 2017.
Single Family Loans Sold (in thousands) 2018 2017 2016
GNMA 1,406,158$ 1,444,972$ 972,252$
FNMA 613,261 408,157 269,039
FHLMC 43,993 69,746 25,455
Total Single Family Loans Sold 2,063,412$ 1,922,875$ 1,266,746$

Management’s Discussion and Analysis
(unaudited)
17
− The fair value of investments and investment derivative activity collectively increased by $11.5 million due primarily to changes in market rates during 2017.
− Other revenues increased $11.6 million due primarily to higher servicing fee income collected.
Total operating expenses in 2017 increased $8.0 million, or 7.1%, compared to 2016. The increase was primarily due to expenses related to the down payment assistance grants and pension related expenses.
The federal grant receipts/payments consisted primarily of pass-through amounts related to the Authority’s role as a contract administrator of the U.S. Department of Housing and Urban Development’s Section 8 subsidy program. Under the Section 8 subsidy program, tenants pay 30% of their income toward rent and the balance is paid by federal subsidy
A review of select revenue and expense accounts depicts the growth the Authority has experienced over the past few years. Much of this growth is the result of increases in the Authority’s single family loan production volume, the majority of which is ultimately sold for a premium in the secondary market.
Gain on sale represents the gain recognized on the sale of single family loans in the secondary market at a premium. The all other revenues/fees category is primarily made up of PBCA, LIHTC and conduit transaction fees.
Amounts reported in salaries and related benefits include entries related to GASB Statement No. 68 pension expense and GASB Statement No. 75 OPEB expense. These amounts totaled $3.9 million, $8.4 million and $1.9 million for fiscal years, 2018, 2017 and 2016, respectively.
Management’s Discussion and Analysis
(unaudited)
18
Economic Factors and Next Year’s Budget
The 2019 Budget was developed to provide desired products and services while maintaining financially responsible practices. While the Authority has been able to keep pace with the significant increase in loan volume, we remain cautious about the state economy over the next several years. During 2019, the Authority’s consolidated net interest revenue is projected to increase over amounts reported as of December 31, 2018. The Authority’s loan portfolios are projected to increase in size in 2019 due to the continued efforts to add loans and investment securities to the balance sheet. Related debt is also projected to increase in 2019, but the result should be a net increase to net interest revenue overall. A contributor to this change is that the Authority anticipates adding over $400 million in new loans and investment securities to the balance sheet as a result of single family and multifamily lending operations. Pressure on tax credit equity pricing and strong demand for affordable rental housing throughout the state are increasing the need for multifamily financing products and services. This being the case, the Authority is working to enhance its product offerings and increase its presence and visibility within the multifamily financing space. We believe this will result in an increase in the pipeline of multifamily loans the Authority finances in the years to come. The Authority also expects business finance production to continue to generate fee income through the Authority’s lending activities. Securitizing single family loan production and selling the securities for their market premiums is projected to continue to be the major Single Family program model in 2019. The budget reflects a ‘purchase and sell’ model for 83% of the $2.3 billion in budgeted Single Family loan production. The remaining 17% is budgeted to be bond-financed in an effort to continue rebuilding the Authority’s loan portfolio, providing future net interest revenue. The 2019 budget projects single family production to increase when compared to the 2018 results, as demand for the Authority’s down payment assistance (DPA) in the form of grants and second mortgages remains high. The Authority’s operating expenses are projected to increase slightly over amounts reported for 2018. This slight increase will reside primarily within the Authority’s salaries and related benefits and general operating categories and is due to budgeted merit increases, modest staffing increases, increases in health insurance premium expense, and increases in spending on technology resources. Certain of the matters contained in this management’s discussion and analysis about our future performance, including, without limitation, future revenues, earnings, strategies, prospects, consequences and all other statements that are not purely historical constitute “forward-looking statements” within the meaning of the Private Securities Litigation Reform Act of 1995. Such forward-looking statements are subject to risks and uncertainties, which could cause actual results to differ materially from those anticipated. Such statements are based on management’s beliefs as well as assumptions made by and information currently available to management. Readers are cautioned not to place undue reliance on these forward-looking statements in making any investment decisions with regards to our securities. Forward-looking statements made in this discussion apply only as of the date of these financial statements. While we may elect to update forward-looking statements from time to time, we specifically disclaim any obligation to do so, even in light of new information or future events, unless otherwise required by applicable laws. Requests for Information This financial report is designed to provide a general overview of the Authority’s finances. Questions concerning the information provided in this report or other financial information should be addressed to the Controller/Director, Accounting at Colorado Housing and Finance Authority, 1981 Blake Street, Denver, Colorado 80202 (303-297-2432 or toll free, 800-877-2432).

basic financial statements
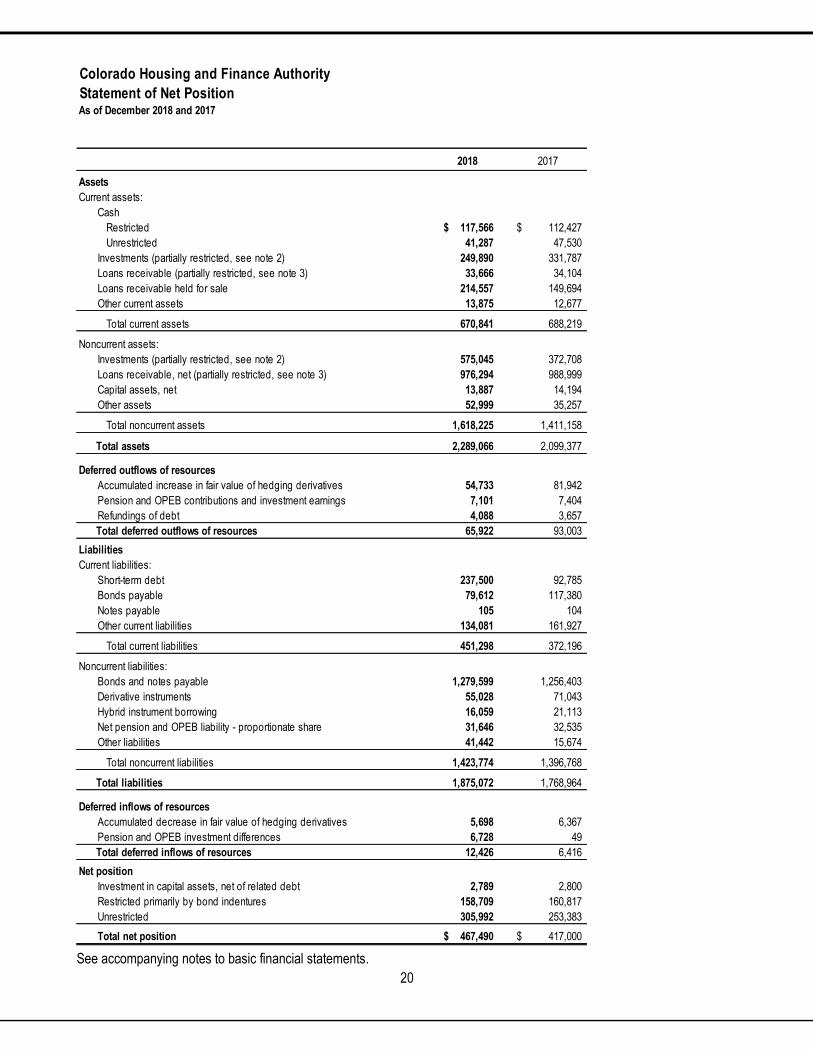
20
See accompanying notes to basic financial statements.
Colorado Housing and Finance Authority
Statement of Net Position
2018 2017
Assets
Current assets:
Cash
Restricted 117,566$ 112,427$
Unrestricted 41,287 47,530
Investments (partially restricted, see note 2) 249,890 331,787
Loans receivable (partially restricted, see note 3) 33,666 34,104
Loans receivable held for sale 214,557 149,694
Other current assets 13,875 12,677
Total current assets 670,841 688,219
Noncurrent assets:
Investments (partially restricted, see note 2) 575,045 372,708
Loans receivable, net (partially restricted, see note 3) 976,294 988,999
Capital assets, net 13,887 14,194
Other assets 52,999 35,257
Total noncurrent assets 1,618,225 1,411,158
Total assets 2,289,066 2,099,377
Deferred outflows of resources
Accumulated increase in fair value of hedging derivatives 54,733 81,942
Pension and OPEB contributions and investment earnings 7,101 7,404
Refundings of debt 4,088 3,657
Total deferred outflows of resources 65,922 93,003
Liabilities
Current liabilities:
Short-term debt 237,500 92,785
Bonds payable 79,612 117,380
Notes payable 105 104
Other current liabilities 134,081 161,927
Total current liabilities 451,298 372,196
Noncurrent liabilities:
Bonds and notes payable 1,279,599 1,256,403
Derivative instruments 55,028 71,043
Hybrid instrument borrowing 16,059 21,113
Net pension and OPEB liability - proportionate share 31,646 32,535
Other liabilities 41,442 15,674
Total noncurrent liabilities 1,423,774 1,396,768
Total liabilities 1,875,072 1,768,964
Deferred inflows of resources
Accumulated decrease in fair value of hedging derivatives 5,698 6,367
Pension and OPEB investment differences 6,728 49
Total deferred inflows of resources 12,426 6,416
Net position
Investment in capital assets, net of related debt 2,789 2,800
Restricted primarily by bond indentures 158,709 160,817
Unrestricted 305,992 253,383
Total net position 467,490$ 417,000$
As of December 2018 and 2017

21
See accompanying notes to basic financial statements.
Colorado Housing and Finance Authority
Statement of Revenues, Expenses and Changes in Net Position
(in thousands of dollars)
2018 2017
Interest income and expense:
Interest on loans receivable 55,876$ 55,777$
Interest on investments 23,962 17,068
Interest on debt (66,597) (56,033)
Net interest income 13,241 16,812
Other operating income:
Gain on sale of loans 83,817 106,788
Investment derivative activity gain 780 3,143
Net increase in the fair value of investments 3,093 5,950
Other revenues 41,151 41,110
Total other operating income 128,841 156,991
Total operating income 142,082 173,803
Operating expenses:
Salaries and related benefits 26,211 27,515
General operating 61,870 92,395
Depreciation 1,038 684
Provision for loan losses 261 698
Total operating expenses 89,380 121,292
Net operating income 52,702 52,511
Nonoperating income and expenses:
Federal grant receipts 140,231 137,126
Federal grant payments (140,231) (137,126)
Gain (loss) on sale of capital assets 18 19
Total nonoperating income and expenses 18 19
Change in net position 52,720 52,530
Net position:
Beginning of year 417,000 364,470
Restatement due to GASB 75 (2,230) -
End of year 467,490$ 417,000$
For the years ended December 2018 and 2017

22
Continued on the next page
Colorado Housing and Finance Authority
Statement of Cash Flows
(in thousands of dollars)
2018 2017
Cash flows from operating activities:
Principal payments received on loans receivable
and receipts from dispositions of other real estate owned 851,650$ 665,834$
Interest payments received on loans receivable 56,330 56,699
Payments for loans receivable (2,332,571) (2,091,449)
Receipts from sales of Ginnie Mae securities 1,512,737 1,527,338
Receipts from rental operations 5 4
Receipts from other revenues 41,198 41,241
Payments for salaries and related benefits (29,616) (19,740)
Payments for goods and services (91,124) (99,834)
All other, net 257 8,216 -
Net cash provided by operating activities 8,866 88,309
Cash flows from noncapital financing activities:
Net increase in short-term debt 144,715 31,780
Proceeds from issuance of bonds 474,334 374,281
Receipts from federal grant programs 156,231 137,906
Payments for federal grant programs (140,231) (137,127)
Principal paid on bonds (497,254) (281,824)
Principal paid on notes payable (103) (102)
Interest rate swap activity, net 12,523 (1,651)
Interest paid on short-term debt (3,131) (1,118)
Interest rate swap settlements (21,173) (34,827)
Interest paid on bonds (40,745) (22,240)
Interest paid on notes payable (416) (11) -
Net cash provided by noncapital financing activities 84,750 65,067
Cash flows from capital and related financing activities:
Purchase of capital assets (713) (10,419)
Net cash used in capital and related financing activities (713) (10,419)
Cash flows from investing activities:
Proceeds from maturities and sales of investments 3,059,065 2,548,640
Purchase of investments (3,176,384) (2,709,511)
Income received from investments 23,312 16,790
Net cash used in capital and related financing activities (94,007) (144,081)
Net decrease in cash (1,104) (1,124)
Cash at beginning of year 159,957 161,081
Cash at end of year 158,853$ 159,957$
Restricted 117,566$ 112,427$
Unrestricted 41,287 47,530
Cash, end of year 158,853$ 159,957$
For the years ended December 2018 and 2017

23
See accompanying notes to basic financial statements.
Colorado Housing and Finance Authority
Statement of Cash Flows (continued)
For the years ended December 2018 and 2017
(in thousands of dollars)
2018 2017
Reconciliation of operating income to net cash
provided by operating activities:
Net operating income 52,702$ 52,511$
Adjustments to reconcile operating income to
net cash provided by operating activities:
Depreciation expense 1,038 684
Amortization and fair value adjustments of service release premiums 9,412 25,290
Proportionate share of net pension expense 3,862 6,207
Amortization of derivatives related borrowings (6,272) (5,573)
Provision for loan losses 261 698
Interest on investments (23,962) (17,068)
Interest on debt 72,869 61,607
Unrealized gain on investment derivatives (780) (3,143)
Unrealized gain on investments (3,093) (5,950)
Loss on sale of REO 113 88
Gain on sale of loans receivable held for sale (83,817) (106,788)
Changes in assets and liabilities:
Loans receivable and other real estate owned 22,291 76,345
Accrued interest receivable on loans and investments 454 922
Other assets (18,288) 8,158
Accounts payable and other liabilities (17,924) (5,679)
Net cash provided by operating activities 8,866$ 88,309$

notes to basic financial statements
Notes to Basic Financial Statements
(tabular dollar amounts are in thousands)
25
1) Organization and Summary of Significant Accounting Policies (a) Authorizing Legislation and Reporting Entity Authorizing Legislation - The Colorado Housing and Finance Authority (the Authority) is a body corporate and a political subdivision of the State of Colorado (the State) established pursuant to the Colorado Housing and Finance Authority Act, Title 29, Article 4, Part 7 of the Colorado Revised Statutes (the Statutes), as amended (the Act). The Authority is not a state agency and is not subject to administrative direction by the State. The governing body of the Authority is its Board of Directors (the Board). Operations of the Authority commenced in 1974. The Authority is not a component unit of the State or any other entity.
The Authority was created for the purpose of making funds available to assist private enterprise and governmental entities in providing housing facilities for lower- and moderate-income families. Under the Act, the Authority is also authorized to finance projects and working capital loans to industrial and commercial enterprises (both for-profit and nonprofit) of small and moderate size.
In 1992, Colorado voters approved an amendment to the State Constitution, Article X, Section 20, which, among other things, imposes restrictions on increases in revenue and expenditures of state and local governments (known as the Taxpayer Bill of Rights or TABOR). In the opinion of its bond counsel, the Authority is a “special purpose authority”, not part of the “State” under C.R.S. 24-77-102(15) and (16), and not a “district” as defined in TABOR and is therefore exempt from its provisions.
In 2001, the Colorado state legislature repealed the limitation on the amount of debt that the Authority can issue as well as removed the moral obligation of the State on future debt issues of the Authority. The bonds, notes and other obligations of the Authority do not constitute debt of the State. Lending and Housing Programs – The Authority accounts for its lending and operating activities in the following groups:
General Program – The General Program is the Authority’s primary operating program. It accounts for assets, liabilities, revenues and expenses not directly attributable to a bond program. Most of the bond resolutions of the programs permit the Authority to make cash transfers to the general accounts after establishing reserves required by the bond resolutions. The general accounts financially support the bond programs when necessary. The general accounts include proprietary loan programs developed by the Authority to meet the needs of low- and moderate-income borrowers not served by traditional lending programs. The general accounts also include administrative activities related to the federal government’s Section 8 housing assistance payments program. Single Family Program – The Single Family Program includes bonds issued and assets pledged for payment of the bonds under the related indentures. Loans acquired under this program with the proceeds of single family bond issues include Federal Housing Administration (FHA), conventional, United States Department of Agriculture (USDA) Rural Development, Rural Economic and Community Development Department (RD), and Veterans Administration (VA) loans made under various loan programs. Multifamily/Business Program – The Multifamily/Business Program includes bonds issued and assets pledged for payment of the bonds under the related indentures. Loans acquired under this program with the proceeds of multifamily and business (sometimes referred to as project) bond issues include loans made for the purchase, construction or rehabilitation of multifamily rental housing. In addition, business loans are made to both for-profit and nonprofit organizations primarily for the purpose of acquisition or expansion of their facilities or for the purchase of equipment.
Notes to Basic Financial Statements
(tabular dollar amounts are in thousands)
26
(b) Basis of Accounting The Authority presents its financial statements in accordance with United States Generally Accepted Accounting Principles (U.S. GAAP) as established by the Governmental Accounting Standards Board (GASB). For financial purposes, the Authority is considered a special-purpose government engaged in business-type activities. The financial statements are prepared using the economic resources measurement focus and the accrual basis of accounting. Under the accrual basis, revenues are recognized when earned, and expenses are recorded when incurred. All significant intra-entity transactions have been eliminated.
(c) Summary of Significant Accounting Policies Estimates – The preparation of financial statements in conformity with U.S. GAAP requires management to make estimates and assumptions that affect the reported amounts of assets, liabilities, deferred outflows and deferred inflows and disclosure of contingent assets and liabilities at the date of the financial statements and the reported amounts of revenue and expenses during the reported period. Significant estimates to the Authority’s financial statements include the allowance for loan losses and fair value estimates. Actual results could differ from those estimates. Cash and Restricted Cash – The Authority’s cash and cash equivalents are represented by cash on hand and demand deposits held in banks. Restricted cash includes payments received on pledged assets and used for the payment of bonds under the related indenture agreements. Also included in restricted cash are escrow balances, payments in process and various government deposits. Restricted Assets – Amounts related to Single Family and Multifamily/Business Programs are considered restricted and are detailed in the supplemental schedules. Restricted assets are held for the benefit of respective bondholders and accounted for by program. Certain other assets are held on behalf of various governmental housing initiatives or regulations. Investments – Noncurrent investments of the Authority, representing those investments which are held as reserves under indenture or other restrictions, are reported at either amortized cost or fair value based on values obtained from third-party pricing services. The values are based on quoted market prices when available or on adjusted value in relation to observable prices on similar investments. Money market investments are reported at amortized cost. Investment amounts related to Single Family and Multifamily/Business Programs are considered restricted and are detailed in the supplemental schedules. Loans Receivable – Mortgage loans receivable are reported at their unpaid principal balance net of an allowance for estimated loan losses. Loans related to Single Family and Multifamily/Business Programs are considered restricted and are detailed in the supplemental schedules. Loans Receivable Held for Sale – Loans originated or acquired and intended for sale in the secondary market are carried at the lower of cost or fair value. Gains and losses on loan sales (sales proceeds minus carrying value) are reported as other operating income. Allowance for Loan Losses – The allowance for loan losses is a reserve against current operations based on management's estimate of expected loan losses. Management’s estimate considers such factors as the payment history of the loans, the projected cash flows of the borrowers, estimated value of the collateral, subsidies, guarantees, mortgage insurance, historical loss experience for each loan type, additional guarantees provided by the borrowers and economic conditions. Based on review of these factors, a total reserve amount is calculated and a provision is made against current operations to reflect the estimated balance. Troubled Debt Restructuring – A restructuring of a debt constitutes a troubled debt restructuring if the creditor for economic or legal reasons related to the debtor’s financial difficulties grants a concession to the debtor that it would not otherwise consider. Whatever the form of concession granted by the creditor to the debtor in a troubled debt restructuring, the creditor’s

Notes to Basic Financial Statements
(tabular dollar amounts are in thousands)
27
objective is to make the best of a difficult situation. That is, the creditor expects to obtain more cash or other value from the debtor, or to increase the probability of receipt, by granting the concession than by not granting it. Interest income is recognized using the new interest rate after restructuring, which approximates the effective interest rate. Additional information is disclosed in the loans receivable note. See note 3. Capital Assets – Capital assets are defined by the Authority as assets with an initial, individual cost of $10 thousand or greater. Capital assets are depreciated or amortized using the straight-line method over their estimated useful lives, which are 30 years for buildings and from 3 to 10 years for furniture and equipment. Other Assets – Other asset balances as of December 31, 2018 and 2017, were $53.0 million and $35.3 million, respectively. Included in these amounts are mortgage servicing rights of $50.2 million and $31.6 million as of December 31, 2018 and 2017, respectively, related to loans sold by the Authority for which the Authority retained the mortgage servicing. These mortgage servicing rights are reported at the lower of cost or fair value. The Authority recorded fair market value adjustments of $837 thousand and $7.7 million on mortgage servicing rights as of December 31, 2018 and 2017, respectively. The adjustments are reported in general operating expense on the Statement of Revenues, Expenses and Changes in Net Position. Bonds – Bonds payable are general and limited obligations of the Authority, and are not a debt or liability of the State or any subdivisions thereof. Each bond issue is secured, as described in the applicable trust indenture, by all revenues, moneys, investments, mortgage loans, and other assets in the accounts of the program. Virtually all of the Authority’s loans and investments are pledged as security for the bonds. The provisions of the applicable trust indentures require or allow for redemption of bonds through the use of unexpended bond proceeds and excess funds accumulated primarily through prepayment of mortgage loans and program certificates. All outstanding bonds are subject to redemption at the option of the Authority, in whole or in part at any time after certain dates, as specified in the respective series indentures. The Authority issues fixed rate and variable rate bonds. The rate on the fixed rate bonds is set at bond closing. The variable rate bonds bear interest at either a monthly or a weekly rate until maturity or earlier redemption. For bonds that pay weekly rates, the remarketing agent for each bond issue establishes the weekly rate according to each indenture’s remarketing agreement. The weekly rates are communicated to the various bond trustees for preparation of debt service payments. The weekly rate, as set by the remarketing agent, allows the bonds to trade in the secondary market at a price equal to 100% of the principal amount of the bonds outstanding, with each rate not exceeding maximum rates permitted by law. The Authority has variable rate demand bonds that have Stand-by Purchase Agreements (SBPA), which state that the issuer of the SBPA will purchase the bonds in the event the remarketing agent is unsuccessful in marketing the bonds. In this event, the interest rate paid by the Authority will be calculated using a defined rate from the SBPA. If the bonds remain unsold for a period of 90 days, they are deemed to be “bank bonds” and the Authority is required to repurchase the bonds from the SBPA issuer. The timing of this repurchase, or term out, will vary by issuer from two to five years. Bond Discounts and Premiums – Discounts and premiums on bonds payable are amortized to interest expense over the lives of the respective bond issues using the effective interest method. Debt Refundings – For current refundings and advance refundings resulting in defeasance of debt, the difference between the reacquisition price and the net carrying amount of the old debt is deferred and amortized as a component of interest expense over the remaining life of the old or new debt, whichever is shorter. The difference is amortized using the effective interest method, with the exception of the amount relating to deferred loss on terminated interest rate swap hedging relationships, which is amortized on a straight-line basis. The deferred refunding amounts are classified as a component of deferred outflows on the Statement of Net Position.
Notes to Basic Financial Statements
(tabular dollar amounts are in thousands)
28
Derivative Instruments – Derivative instruments, as defined in GASB No. 53, Accounting and Financial Reporting for Derivative Instruments, are measured on the Statement of Net Position at fair value. Changes in fair value for those derivative instruments that meet the criteria for hedging instruments under GASB No. 53 are reported as deferred inflows and outflows. Changes in fair value of investment derivative instruments, which are ineffective derivative instruments, are reported within investment derivative activity loss starting in the period of change. Derivative Instruments – Interest Rate Swap Agreements – The Authority enters into interest rate swap agreements (swap) with rated swap counterparties in order to (1) provide lower cost fixed rate financing for its loan production needs through synthetic fixed rate structures and (2) utilize synthetic fixed rate structures with refunding bonds in order to generate cash flow savings. The interest differentials to be paid or received under such swaps are recognized as an increase or decrease in interest expense of the related bond liability. The Authority enters into fixed payor swaps, where it pays a fixed interest rate in exchange for receiving a variable interest rate from the counterparty. The variable interest rate may be based on either a taxable or tax-exempt index. By entering into a swap agreement, the Authority hedges its interest rate exposure on the associated variable rate bonds. The Authority’s interest rate swaps are generally considered to be hedging derivative instruments under GASB No. 53. However, certain interest rate swaps have been deemed ineffective and are classified as investment derivative instruments. Additional information about the swap agreements is provided in note 8. Derivative Instruments – Forward Sales Contracts – Forward sales of mortgage backed securities within the To-Be-Announced market are utilized to hedge changes in fair value of mortgage loan inventory and commitments to purchase mortgage loans at fixed rates. At December 31, 2018, the Authority had executed 107 forward sales transactions with a $473 million notional amount with nine counterparties with concentrations and ratings (Standard and Poor’s/Moody’s Investors Service) as shown in note 8. The forward sales will all settle by March 21, 2019. These contracts are considered investment derivative instruments and carry a fair value of $1.2 million as of December 31, 2018. Hybrid Instrument Borrowings – Hybrid instrument borrowings represent cash premiums received on interest rate swaps that had a fair value other than zero at the date of execution, generally because the fixed rates were different from market rates at that date. Interest expense is imputed on these borrowings, which are reported at amortized cost. Net Pension Liability – For purposes of measuring the net pension liability, deferred outflows of resources and deferred inflows of resources related to pensions, pension expense, information about the fiduciary net position of the Public Employee’s Retirement Association of Colorado (PERA) pension plan and additions to/deductions from PERA’s fiduciary net position have been determined on the same basis as they are reported by PERA. For this purpose, benefit payments (including refunds of employee contributions) are recognized when due and payable in accordance with the benefit terms. Post Employment Benefits Other than Pension – For purposes of measuring the net OPEB liability, deferred outflows of resources and deferred inflows of resources related to OPEB, and OPEB expense, information about the fiduciary net position of the Benefits Plan and additions to/deductions from the plan fiduciary net position have been determined on the same basis as they are reported by PERA. For this purpose, PERA recognizes benefit payments when due and payable in accordance with the benefit terms. Other Liabilities – The major other liabilities are as follows:
• Servicing escrow: The net amount of collected escrow funds currently being held on behalf of borrowers to pay future obligations of property taxes and insurance premiums due on real properties. The Authority has a corresponding asset that is recorded in restricted cash.
• Deferred Low Income Housing Tax Credit (LIHTC) Income: Compliance monitoring fees collected in advance on multifamily properties that have been awarded low-income housing tax credits to be used over a 15-year period. These fees cover the ongoing cost the Authority incurs to certify that these properties remain low-income compliant during the 15-year period and continue to be eligible to use the tax credits awarded.

Notes to Basic Financial Statements
(tabular dollar amounts are in thousands)
29
• Compensated Absences: Employees accrue paid time off at a rate based on length of service. Employees may accrue and carry over a maximum of 150% of their annual paid time off benefit. The liability for compensated absences is based on current salary rates and is reported in the Statement of Net Position.
• FFB Program: Certificates of Participation of multi-family loans are sold to Federal Financing Bank (FFB) and entitles FFB to a portion of interest and 100% of principal received from participated mortgage loans. The Authority has a corresponding asset that is recorded in loans receivable.
Classification of Revenues and Expenses – The Authority distinguishes operating revenues and expenses from nonoperating items. Operating revenues and expenses generally result from providing services in connection with the Authority’s ongoing operations. The principal operating revenues of the Authority are interest income on loans, gain on sale of loans and investment income. The Authority also recognizes revenues from rental operations and other revenues, which include loan servicing fees and other administrative fees. Operating expenses include interest expense, administrative expenses, depreciation, and the provision for loan losses. All revenues and expenses not meeting this definition are reported as nonoperating revenues and expenses. The Authority’s nonoperating revenues and expenses consist primarily of pass-through amounts related to the Authority’s role as a contract administrator of the U.S. Department of Housing and Urban Development’s Section 8 subsidy program. Under the Section 8 subsidy program, tenants pay 30% of their income toward rent and the balance is paid to the Authority by federal subsidy. New Accounting Principles – As of December 31, 2018, GASB issued Statement No. 75, Accounting and Financial Reporting for Postemployment Benefits Other Than Pensions, which is effective for financial statements for periods beginning after June 15, 2017. This Statement replaces the requirements of Statements No. 45, Accounting and Financial Reporting by Employers for Postemployment Benefits Other Than Pensions, as amended, and No. 57, OPEB Measurements by Agent Employers and Agent Multiple-Employer Plans, for OPEB. The scope of this Statement addresses accounting and financial reporting for OPEB that is provided to the employees of state and local governmental employers. This Statement establishes standards for recognizing and measuring liabilities, deferred outflows of resources, deferred inflows of resources, and expense/expenditures. For defined benefit OPEB, this Statement identifies the methods and assumptions that are required to be used to project benefit payments, discount projected benefit payments to their actuarial present value, and attribute that present value to periods of employee service. Note disclosure and required supplementary information requirements about defined benefit OPEB also are addressed. This Statement was implemented by the Authority in 2018 and resulted in reporting a new OPEB liability, with associated deferred inflows and outflows of resources, thus reducing previously reported net position as of December 31, 2017 by $2.2 million. With respect to the comparative information as of and for the year ended December 31, 2017, the balances could not be restated as information required to adopt the standard was not available to the Authority. More on this new statement can be found in footnote 12. GASB issued Statement No. 86 Certain Debt Extinguishment Issues, which is effective for reporting periods beginning after June 15, 2017. The primary object of this Statement is to improve consistency in accounting and financial reporting for in-substance defeasance of debt by providing guidance for transactions in which cash and other monetary assets acquired with only existing resources – resources other than the proceeds of refunding debt – are placed in an irrevocable trust for the sole purpose of extinguishing debt. This Statement also improves accounting and financial reporting for prepaid insurance on debt that is extinguished and notes to the financial statements for debt that is defeased in substance. This Statement was applicable to the Authority in 2018; however, no such transactions were required to be reported in the Authority’s financial statements during the year. Future Accounting Principles – GASB issued Statement No. 84, Fiduciary Activities. The objective of this Statement is to improve guidance regarding the identification of fiduciary activities for accounting and financial reporting purposes and how those activities should be reported. This Statement establishes criteria for identifying fiduciary activities of all state and local governments. The focus of the criteria generally is on (1) whether a government is controlling the assets of the fiduciary

Notes to Basic Financial Statements
(tabular dollar amounts are in thousands)
30
activity and (2) the beneficiaries with whom a fiduciary relationship exists. Separate criteria are included to identify fiduciary component units and postemployment benefit arrangements that are fiduciary activities. An activity meeting the criteria should be reported in a fiduciary fund in the basic financial statements. Governments with activities meeting the criteria should present a statement of fiduciary net position and a statement of changes in fiduciary net position. An exception to that requirement is provided for a business-type activity that normally expects to hold custodial assets for three months or less. This Statement describes four fiduciary funds that should be reported, if applicable: (1) pension (and other employee benefit) trust funds, (2) investment trust funds, (3) private-purpose trust funds, and (4) custodial funds. Custodial funds generally should report fiduciary activities that are not held in a trust or equivalent arrangement that meets specific criteria. As the Authority does not currently participate in fiduciary activities subject to this Statement, no impact to Authority’s financial statements is anticipated at this time. The requirements of this Statement are effective for reporting periods beginning after December 15, 2018. Earlier application is encouraged. GASB issued Statement No. 87 Leases, which is effective for reporting periods beginning after December 15, 2019. The objective of this Statement is to better meet the informational needs of financial statement users by improving accounting and financial reporting for leases by governments. This Statement increases the usefulness of a governments’ financial statements by requiring the recognition of certain lease assets and liabilities for leases that previously were classified as operating leases and recognized as inflows of resources or outflows of resources based on the payment provisions of the contract. It establishes a single model for lease accounting based on the foundational principle that leases are financings of the right to use an underlying asset. Under this Statement, a lessee is required to recognize a lease liability and an intangible right-to-use lease asset, and a lessor is required to recognize a lease receivable and a deferred inflow or resources, thereby enhancing the relevance and consistency of information about governments’ leasing activities. This Statement will be applicable to the Authority in 2020; however, the financial impact of the applicability of Statement No. 87 on the Authority’s financial statements has not yet been determined. GASB issued Statement No. 88 Certain Disclosures Related to Debt, Including Direct Borrowings and Direct Placements, which is effective for reporting periods beginning after June 15, 2018. The primary objective of this Statement is to improve the information that is disclosed in the notes to government financial statements related to debt, including direct borrowings and direct placements. Is also clarifies which liabilities governments should include when disclosing information related to debt. This Statement defines debt for debt purposes of disclosure in notes to financial statements as a liability that arises from a contractual obligation to pay cash (or other assets that may be used in lieu of cash) in one or more payments to settle an amount that is fixed at the date the contractual obligation is established. This Statement requires that additional essential information related to debt be disclosed in notes to financial statements, including unused lines of credit; assets pledged as collateral for the debt; and terms specified in debt agreements related to significant events of default with finance-related consequences, significant termination events with finance-related consequences, and significant subjective acceleration clauses. For notes to financial statements related to debt, this Statement also requires that existing and additional information be provided for direct borrowings and direct placements of debt separately from other debt. This Statement will be applicable to the Authority in 2019; however, the impact of the applicability of Statement No. 88 on the Authority’s financial statements, and footnotes therein, has not yet been determined. GASB issued Statement No. 89 Accounting for Interest Cost Incurred Before the End of a Construction Period, which is effective for reporting periods beginning after December 15, 2019. The primary objectives of this statements are (1) to enhance the relevance and comparability of information about capital assets and the cost of borrowing for a reporting period and (2) to simplify accounting for interest cost incurred before the end of a construction period. This Statement establishes accounting requirements for interest cost incurred before the end of a construction period. Such
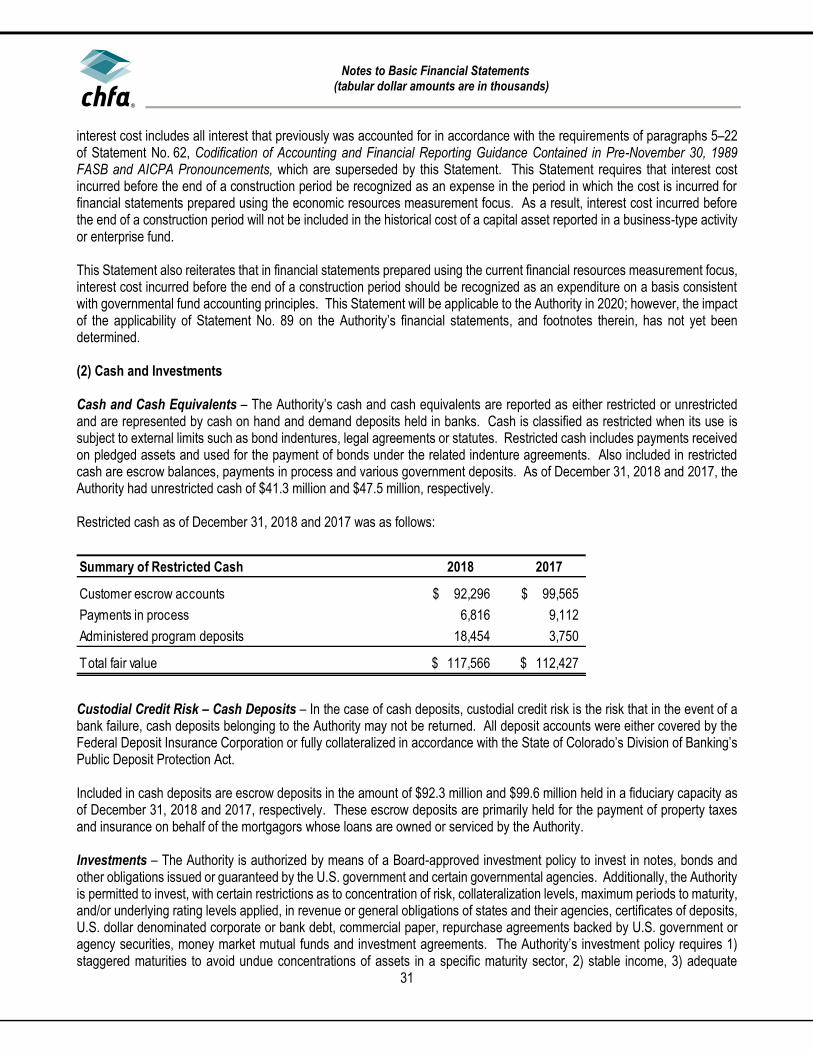
Notes to Basic Financial Statements
(tabular dollar amounts are in thousands)
31
interest cost includes all interest that previously was accounted for in accordance with the requirements of paragraphs 5–22 of Statement No. 62, Codification of Accounting and Financial Reporting Guidance Contained in Pre-November 30, 1989 FASB and AICPA Pronouncements, which are superseded by this Statement. This Statement requires that interest cost incurred before the end of a construction period be recognized as an expense in the period in which the cost is incurred for financial statements prepared using the economic resources measurement focus. As a result, interest cost incurred before the end of a construction period will not be included in the historical cost of a capital asset reported in a business-type activity or enterprise fund. This Statement also reiterates that in financial statements prepared using the current financial resources measurement focus, interest cost incurred before the end of a construction period should be recognized as an expenditure on a basis consistent with governmental fund accounting principles. This Statement will be applicable to the Authority in 2020; however, the impact of the applicability of Statement No. 89 on the Authority’s financial statements, and footnotes therein, has not yet been determined. (2) Cash and Investments Cash and Cash Equivalents – The Authority’s cash and cash equivalents are reported as either restricted or unrestricted and are represented by cash on hand and demand deposits held in banks. Cash is classified as restricted when its use is subject to external limits such as bond indentures, legal agreements or statutes. Restricted cash includes payments received on pledged assets and used for the payment of bonds under the related indenture agreements. Also included in restricted cash are escrow balances, payments in process and various government deposits. As of December 31, 2018 and 2017, the Authority had unrestricted cash of $41.3 million and $47.5 million, respectively. Restricted cash as of December 31, 2018 and 2017 was as follows:
Custodial Credit Risk – Cash Deposits – In the case of cash deposits, custodial credit risk is the risk that in the event of a bank failure, cash deposits belonging to the Authority may not be returned. All deposit accounts were either covered by the Federal Deposit Insurance Corporation or fully collateralized in accordance with the State of Colorado’s Division of Banking’s Public Deposit Protection Act. Included in cash deposits are escrow deposits in the amount of $92.3 million and $99.6 million held in a fiduciary capacity as of December 31, 2018 and 2017, respectively. These escrow deposits are primarily held for the payment of property taxes and insurance on behalf of the mortgagors whose loans are owned or serviced by the Authority. Investments – The Authority is authorized by means of a Board-approved investment policy to invest in notes, bonds and other obligations issued or guaranteed by the U.S. government and certain governmental agencies. Additionally, the Authority is permitted to invest, with certain restrictions as to concentration of risk, collateralization levels, maximum periods to maturity, and/or underlying rating levels applied, in revenue or general obligations of states and their agencies, certificates of deposits, U.S. dollar denominated corporate or bank debt, commercial paper, repurchase agreements backed by U.S. government or agency securities, money market mutual funds and investment agreements. The Authority’s investment policy requires 1) staggered maturities to avoid undue concentrations of assets in a specific maturity sector, 2) stable income, 3) adequate
Summary of Restricted Cash 2018 2017
Customer escrow accounts 92,296$ 99,565$
Payments in process 6,816 9,112
Administered program deposits 18,454 3,750
Total fair value 117,566$ 112,427$

Notes to Basic Financial Statements
(tabular dollar amounts are in thousands)
32
liquidity to meet operations and debt service obligations and 4) diversification to avoid overweighting in any one type of security. The Authority is also subject to permissible investments as authorized by Title 24, Article 75, Part 6 of the Statues. Permissible investments pursuant to the Statutes are either identical to or less restrictive than the Authority’s investment policy. In addition, each of the trust indentures established under the Authority’s bond programs contains requirements as to permitted investments of bond fund proceeds, which may be more or less restrictive than the Authority’s investment policy. These investments are included in the disclosures below under State and political subdivision obligations. General Program investments of $106.0 million include investments pledged as of December 31, 2018 as follows: $80.9 million in Ginnie Mae securities pledged as collateral to the Federal Home Loan Bank of Topeka (FHLB) line of credit and Colorado Local Government Liquid Asset Trust (COLOTRUST) investments of Rural Development Loan Program (RDLP), RDLP II and RDLP V in the amounts of $799 thousand, $381 thousand and $510 thousand, respectively; each pledged as collateral for the RDLP notes payable and $80 thousand of investments pledged as collateral for private placement bonds. General Program investments of $38.3 million include investments pledged as of December 31, 2017 as follows: $25.9 million in Ginnie Mae securities pledged as collateral to the Federal Home Loan Bank of Topeka (FHLB) line of credit and Colorado Local Government Liquid Asset Trust (COLOTRUST) investments of Rural Development Loan Program (RDLP), RDLP II and RDLP V in the amounts of $715 thousand, $552 thousand and $282 thousand, respectively; each pledged as collateral for the RDLP notes payable and $328 thousand of investments pledged as collateral for private placement bonds. All Single Family and Multifamily/Business Program investments, which total $719.0 million and $666.1 million as of December 31, 2018 and 2017, respectively, are restricted under bond indentures or other debt agreements, or otherwise pledged as collateral for borrowings. These amounts are detailed in the supplemental schedules. Interest Rate Risk – Interest rate risk is the risk that changes in interest rates will adversely affect the fair value of an investment. Except for the money market mutual fund investments, substantially all of the Authority’s investments are subject to this risk. As of December 31, 2018, the Authority had the following investment maturities:
Less More
Investment Type Than 1 1-5 6-10 Than 10 Total
External investment pool $ 8,466 $ - $ - $ - $ 8,466
Investment agreements - uncollateralized 42,920 - - - 42,920
Money market mutual fund 78,238 - - - 78,238
Repurchase agreement 10,008 - - - 10,008
U.S. government agencies 110,258 13,398 - 560,960 684,616
U.S. Treasury - 506 - 181 687
Total $ 249,890 $ 13,904 $ - $ 561,141 $ 824,935
Investment Maturities (In Years)

Notes to Basic Financial Statements
(tabular dollar amounts are in thousands)
33
As of December 31, 2017, the Authority had the following investment maturities:
Credit Risk – The following table provides credit ratings of the Authority’s investments as determined by Standard and Poor’s and/or Moody’s Investors Service.
Investment agreements meet the requirements of the rating agency providing the rating on the related debt issue and of the Board’s investment policy. The Board’s investment policy states that the Authority is empowered to invest in any security that is a revenue or general obligation of any political subdivision. The credit rating at the time of purchase must be rated in one of its two highest rating categories by one or more nationally recognized organizations, which regularly rate such obligations and concentration limits may not exceed more than 20% of the investment portfolio.
Less More
Investment Type Than 1 1-5 6-10 Than 10 Total
External investment pool $ 7,629 $ - $ - $ - $ 7,629
Investment agreements - uncollateralized 49,294 - - 16,977 66,271
Money market mutual fund 212,223 - - - 212,223
Repurchase agreement 5,944 - - 4,506 10,450
U.S. government agencies 25,932 25,161 - 325,351 376,444
U.S. Treasury 30,765 532 - 181 31,478
Total $ 331,787 $ 25,693 $ - $ 347,015 $ 704,495
Investment Maturities (In Years)
2018 2017
Investment Type Rating Total Rating Total
External investment pool AAAm/Aaa 8,466$ AAAm 7,629$
Investment agreements - uncollateralized AA+/Aa2 29,289 AA+/Aa2 34,488
Investment agreements - uncollateralized AA+/A1 - AA+/A1 580
Investment agreements - uncollateralized AA/Aa2 - AA/Aa2 15,680
Investment agreements - uncollateralized AA-/A1 - AA-/A1 2,395
Investment agreements - uncollateralized AA-/Aa2 1,243 AA-/Aa2 -
Investment agreements - uncollateralized A+/Aa2 - A+/Aa2 5,500
Investment agreements - uncollateralized A+/Aa3 5,500 A+/Aa3 -
Investment agreements - uncollateralized A/A1 6,429 A/A1 -
Investment agreements - uncollateralized A/A2 - A/A2 7,628
Investment agreements - uncollateralized BBB+/Baa1 459 BBB+/Baa1 -
Money market mutual fund AAAm/Aaa 78,238 AAAm/Aaa 212,223
Repurchase agreements AA+/Aaa 10,008 AA+/Aaa 10,450
U.S. government agencies AA+/Aaa 684,616 AA+/Aaa 376,444
U.S. Treasury AA+/Aaa 687 AA+/Aaa 31,478
Total 824,935$ 704,495$
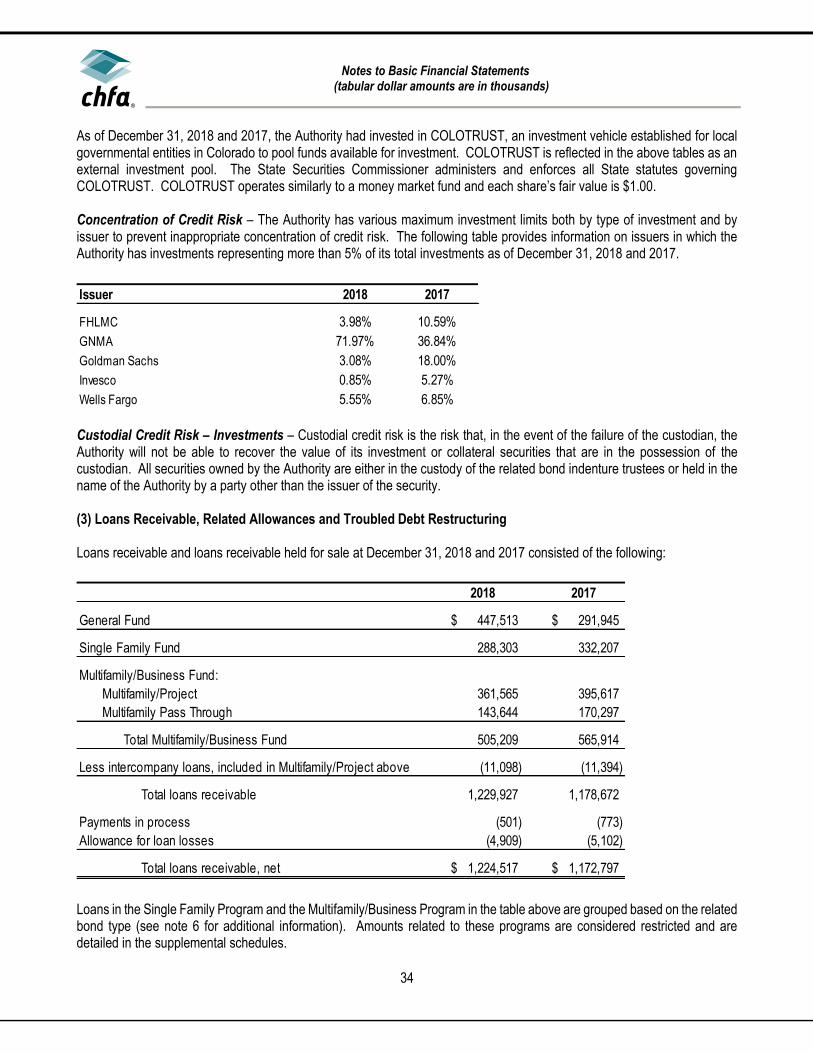
Notes to Basic Financial Statements
(tabular dollar amounts are in thousands)
34
As of December 31, 2018 and 2017, the Authority had invested in COLOTRUST, an investment vehicle established for local governmental entities in Colorado to pool funds available for investment. COLOTRUST is reflected in the above tables as an external investment pool. The State Securities Commissioner administers and enforces all State statutes governing COLOTRUST. COLOTRUST operates similarly to a money market fund and each share’s fair value is $1.00. Concentration of Credit Risk – The Authority has various maximum investment limits both by type of investment and by issuer to prevent inappropriate concentration of credit risk. The following table provides information on issuers in which the Authority has investments representing more than 5% of its total investments as of December 31, 2018 and 2017.
Custodial Credit Risk – Investments – Custodial credit risk is the risk that, in the event of the failure of the custodian, the Authority will not be able to recover the value of its investment or collateral securities that are in the possession of the custodian. All securities owned by the Authority are either in the custody of the related bond indenture trustees or held in the name of the Authority by a party other than the issuer of the security. (3) Loans Receivable, Related Allowances and Troubled Debt Restructuring Loans receivable and loans receivable held for sale at December 31, 2018 and 2017 consisted of the following:
Loans in the Single Family Program and the Multifamily/Business Program in the table above are grouped based on the related bond type (see note 6 for additional information). Amounts related to these programs are considered restricted and are detailed in the supplemental schedules.
Issuer 2018 2017
FHLMC 3.98% 10.59%
GNMA 71.97% 36.84%
Goldman Sachs 3.08% 18.00%
Invesco 0.85% 5.27%
Wells Fargo 5.55% 6.85%
2018 2017
General Fund 447,513$ 291,945$
Single Family Fund 288,303 332,207
Multifamily/Business Fund:
Multifamily/Project 361,565 395,617
Multifamily Pass Through 143,644 170,297
Total Multifamily/Business Fund 505,209 565,914
Less intercompany loans, included in Multifamily/Project above (11,098) (11,394)
Total loans receivable 1,229,927 1,178,672
Payments in process (501) (773)
Allowance for loan losses (4,909) (5,102)
Total loans receivable, net 1,224,517$ 1,172,797$
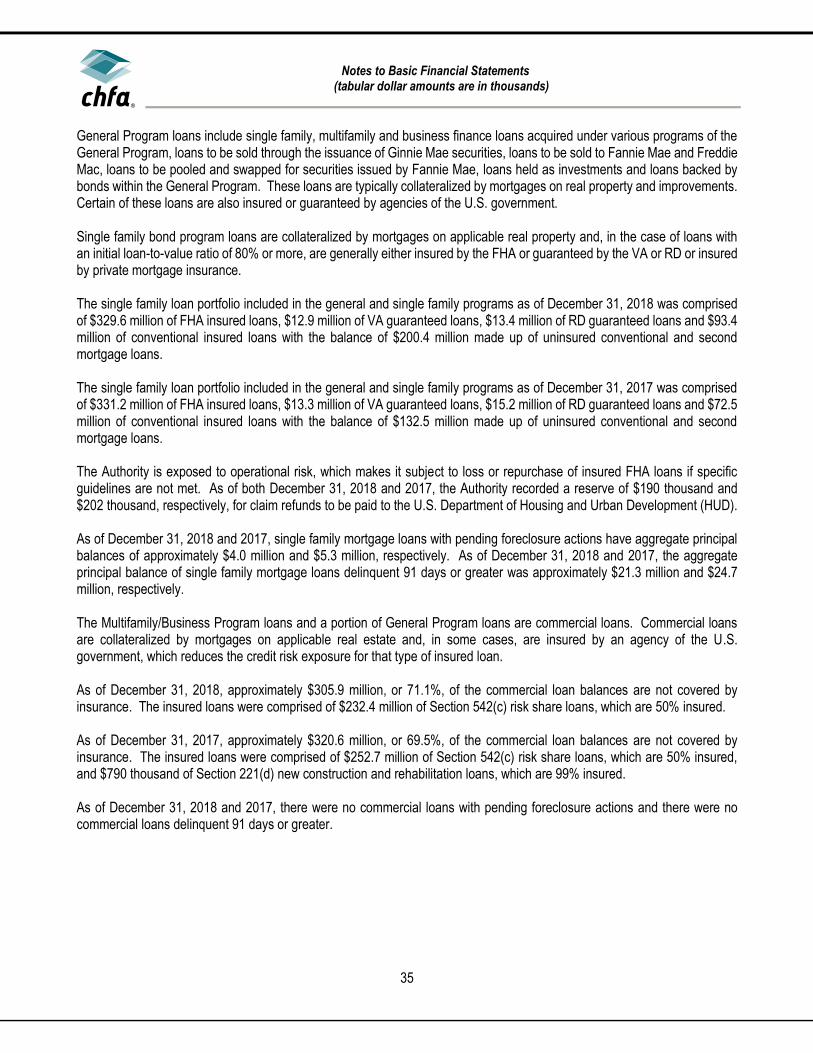
Notes to Basic Financial Statements
(tabular dollar amounts are in thousands)
35
General Program loans include single family, multifamily and business finance loans acquired under various programs of the General Program, loans to be sold through the issuance of Ginnie Mae securities, loans to be sold to Fannie Mae and Freddie Mac, loans to be pooled and swapped for securities issued by Fannie Mae, loans held as investments and loans backed by bonds within the General Program. These loans are typically collateralized by mortgages on real property and improvements. Certain of these loans are also insured or guaranteed by agencies of the U.S. government. Single family bond program loans are collateralized by mortgages on applicable real property and, in the case of loans with an initial loan-to-value ratio of 80% or more, are generally either insured by the FHA or guaranteed by the VA or RD or insured by private mortgage insurance. The single family loan portfolio included in the general and single family programs as of December 31, 2018 was comprised of $329.6 million of FHA insured loans, $12.9 million of VA guaranteed loans, $13.4 million of RD guaranteed loans and $93.4 million of conventional insured loans with the balance of $200.4 million made up of uninsured conventional and second mortgage loans. The single family loan portfolio included in the general and single family programs as of December 31, 2017 was comprised of $331.2 million of FHA insured loans, $13.3 million of VA guaranteed loans, $15.2 million of RD guaranteed loans and $72.5 million of conventional insured loans with the balance of $132.5 million made up of uninsured conventional and second mortgage loans. The Authority is exposed to operational risk, which makes it subject to loss or repurchase of insured FHA loans if specific guidelines are not met. As of both December 31, 2018 and 2017, the Authority recorded a reserve of $190 thousand and $202 thousand, respectively, for claim refunds to be paid to the U.S. Department of Housing and Urban Development (HUD). As of December 31, 2018 and 2017, single family mortgage loans with pending foreclosure actions have aggregate principal balances of approximately $4.0 million and $5.3 million, respectively. As of December 31, 2018 and 2017, the aggregate principal balance of single family mortgage loans delinquent 91 days or greater was approximately $21.3 million and $24.7 million, respectively. The Multifamily/Business Program loans and a portion of General Program loans are commercial loans. Commercial loans are collateralized by mortgages on applicable real estate and, in some cases, are insured by an agency of the U.S. government, which reduces the credit risk exposure for that type of insured loan. As of December 31, 2018, approximately $305.9 million, or 71.1%, of the commercial loan balances are not covered by insurance. The insured loans were comprised of $232.4 million of Section 542(c) risk share loans, which are 50% insured. As of December 31, 2017, approximately $320.6 million, or 69.5%, of the commercial loan balances are not covered by insurance. The insured loans were comprised of $252.7 million of Section 542(c) risk share loans, which are 50% insured, and $790 thousand of Section 221(d) new construction and rehabilitation loans, which are 99% insured. As of December 31, 2018 and 2017, there were no commercial loans with pending foreclosure actions and there were no commercial loans delinquent 91 days or greater.
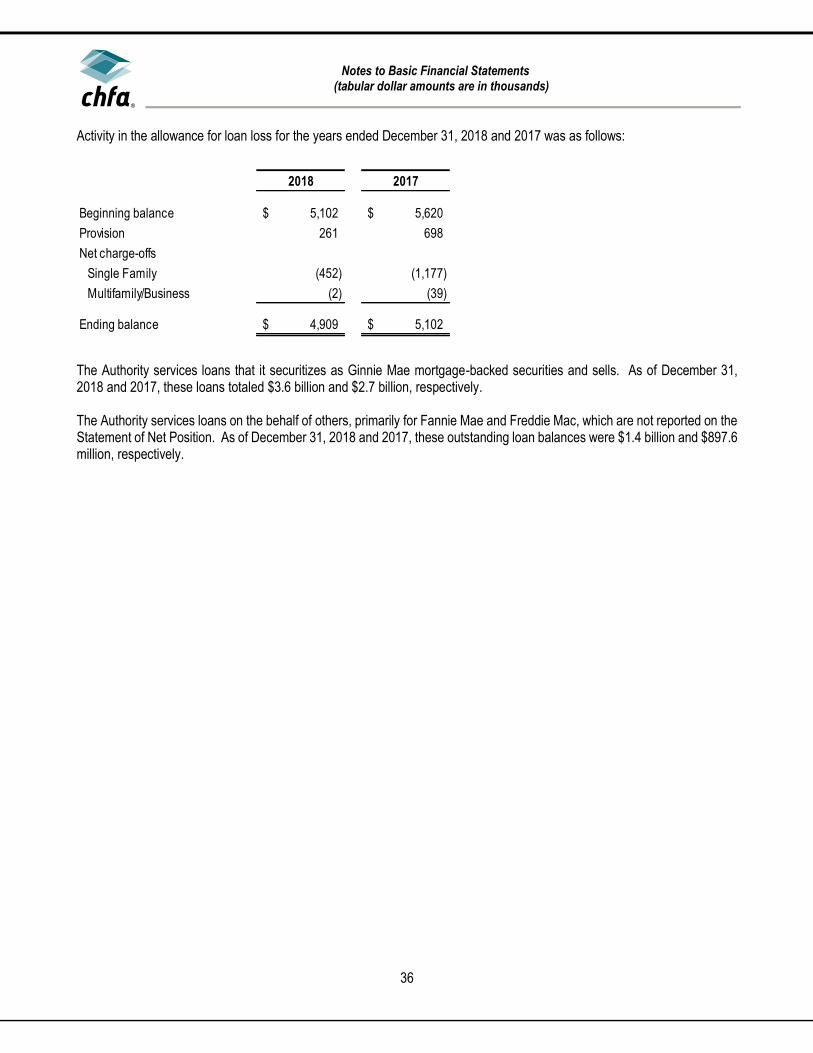
Notes to Basic Financial Statements
(tabular dollar amounts are in thousands)
36
Activity in the allowance for loan loss for the years ended December 31, 2018 and 2017 was as follows:
The Authority services loans that it securitizes as Ginnie Mae mortgage-backed securities and sells. As of December 31, 2018 and 2017, these loans totaled $3.6 billion and $2.7 billion, respectively. The Authority services loans on the behalf of others, primarily for Fannie Mae and Freddie Mac, which are not reported on the Statement of Net Position. As of December 31, 2018 and 2017, these outstanding loan balances were $1.4 billion and $897.6 million, respectively.
2018 2017
Beginning balance 5,102$ 5,620$
Provision 261 698
Net charge-offs
Single Family (452) (1,177)
Multifamily/Business (2) (39)
Ending balance 4,909$ 5,102$
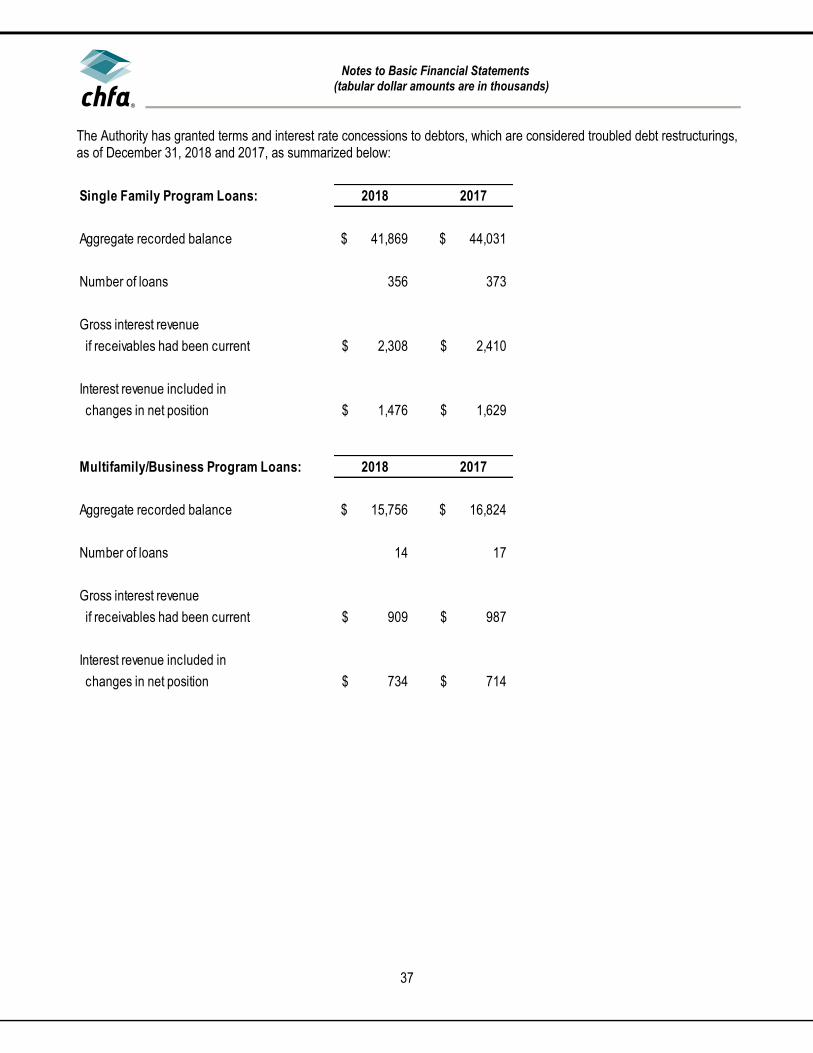
Notes to Basic Financial Statements
(tabular dollar amounts are in thousands)
37
The Authority has granted terms and interest rate concessions to debtors, which are considered troubled debt restructurings, as of December 31, 2018 and 2017, as summarized below:
Single Family Program Loans: 2018 2017
Aggregate recorded balance 41,869$ 44,031$
Number of loans 356 373
Gross interest revenue
if receivables had been current 2,308$ 2,410$
Interest revenue included in
changes in net position 1,476$ 1,629$
Multifamily/Business Program Loans: 2018 2017
Aggregate recorded balance 15,756$ 16,824$
Number of loans 14 17
Gross interest revenue
if receivables had been current 909$ 987$
Interest revenue included in
changes in net position 734$ 714$
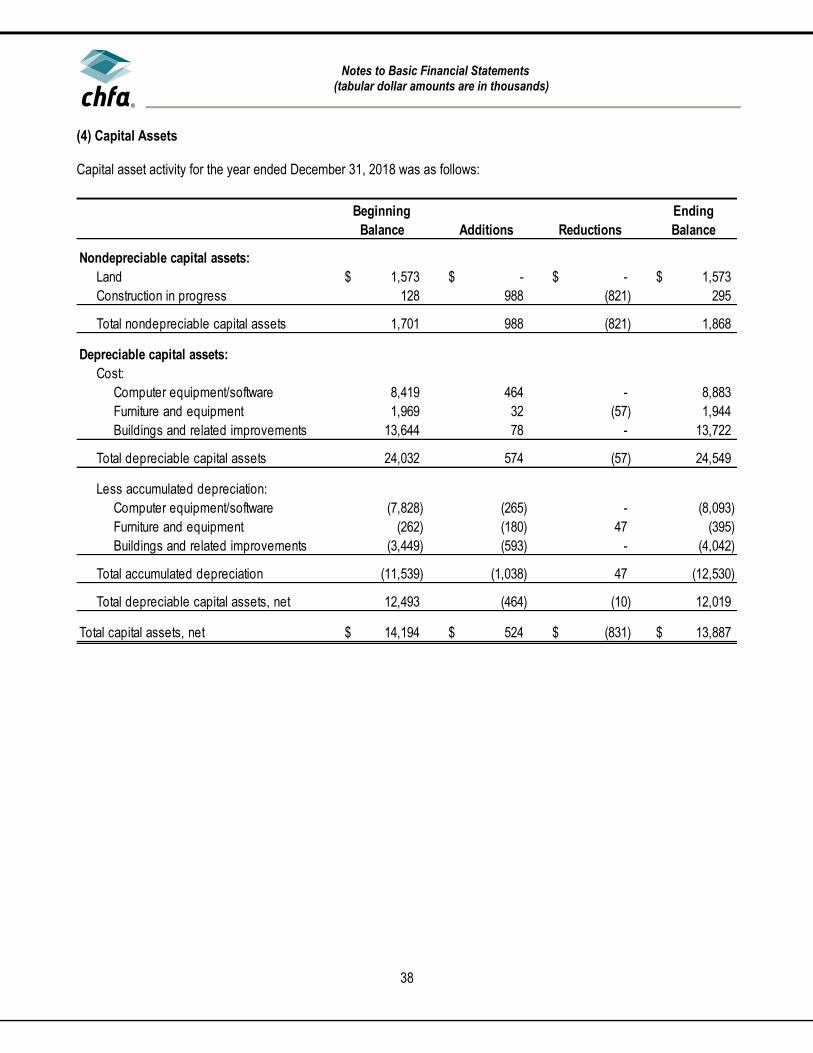
Notes to Basic Financial Statements
(tabular dollar amounts are in thousands)
38
(4) Capital Assets Capital asset activity for the year ended December 31, 2018 was as follows:
Beginning
Balance Additions Reductions
Ending
Balance
Nondepreciable capital assets:
Land 1,573$ -$ -$ 1,573$
Construction in progress 128 988 (821) 295
Total nondepreciable capital assets 1,701 988 (821) 1,868
Depreciable capital assets:
Cost:
Computer equipment/software 8,419 464 - 8,883
Furniture and equipment 1,969 32 (57) 1,944
Buildings and related improvements 13,644 78 - 13,722
Total depreciable capital assets 24,032 574 (57) 24,549
Less accumulated depreciation:
Computer equipment/software (7,828) (265) - (8,093)
Furniture and equipment (262) (180) 47 (395)
Buildings and related improvements (3,449) (593) - (4,042)
Total accumulated depreciation (11,539) (1,038) 47 (12,530)
Total depreciable capital assets, net 12,493 (464) (10) 12,019
Total capital assets, net 14,194$ 524$ (831)$ 13,887$

Notes to Basic Financial Statements
(tabular dollar amounts are in thousands)
39
Capital asset activity for the year ended December 31, 2017 was as follows:
(5) Short-Term Debt The Authority has an agreement with the FHLB for collateralized borrowings in an amount not to exceed the lending limit internally established by the FHLB, which is 40% of the Authority’s total assets, or $915.6 million. Amounts drawn under the agreement bear interest at the same rates charged by the FHLB to its member banks and are collateralized by certain mortgage loans and investments. As of December 31, 2018 and 2017, the Authority had $212.5 million and $92.8 million of short-term debt outstanding with the FHLB, respectively. The Authority also has a revolving, unsecured, commercial bank line of credit agreement for borrowings of up to $50.0 million. Amounts drawn under the agreement bear interest fixed at a spread above the one week or one-month LIBOR rate. This line of credit agreement terminates on October 1, 2019. The Authority pays an unused line fee, payable in arrears on the first business day after each calendar quarter. The fee is based upon the average daily unused amount of the line of credit computed on the basis of a 360-day year. As of December 31, 2018 and 2017, there was an outstanding balance of $25.0 million and $0, respectively. Borrowings under these agreements are used to support the Authority’s various lending programs, to purchase loans to be sold through the issuance and sale of Ginnie Mae and Fannie Mae securities and activities related to the Authority’s private activity bond volume cap preservation program. There are no commitment fees associated with these agreements.

Notes to Basic Financial Statements
(tabular dollar amounts are in thousands)
40
Short-term debt activity for the years ended December 31, 2018 and 2017 was as follows:
(6) Bonds, Notes Payable and Other Liabilities The Authority issues bonds and notes payable to finance its lending programs. Proceeds from long-term debt of the Single Family and Multifamily/Business bonds are used for funding of single family, multifamily and business loans. Long-term debt of the General Program (including notes payable) is used to finance single family and business loans. The aggregate principal amounts of bonds and notes payable outstanding as of December 31, 2018 and 2017 are shown in the table on the following pages. Interest is payable semiannually unless otherwise noted. Interest rates on variable rate debt reset on a weekly or monthly basis. At December 31, 2018, these rates ranged from 1.66% to 2.55%. At December 31, 2017, these rates ranged from 1.35% to 2.14%.
2018 2017
Beginning balance 92,785$ 61,005$
Additions 7,110,492 5,350,885
Reductions (6,965,777) (5,319,105)
Ending balance 237,500$ 92,785$
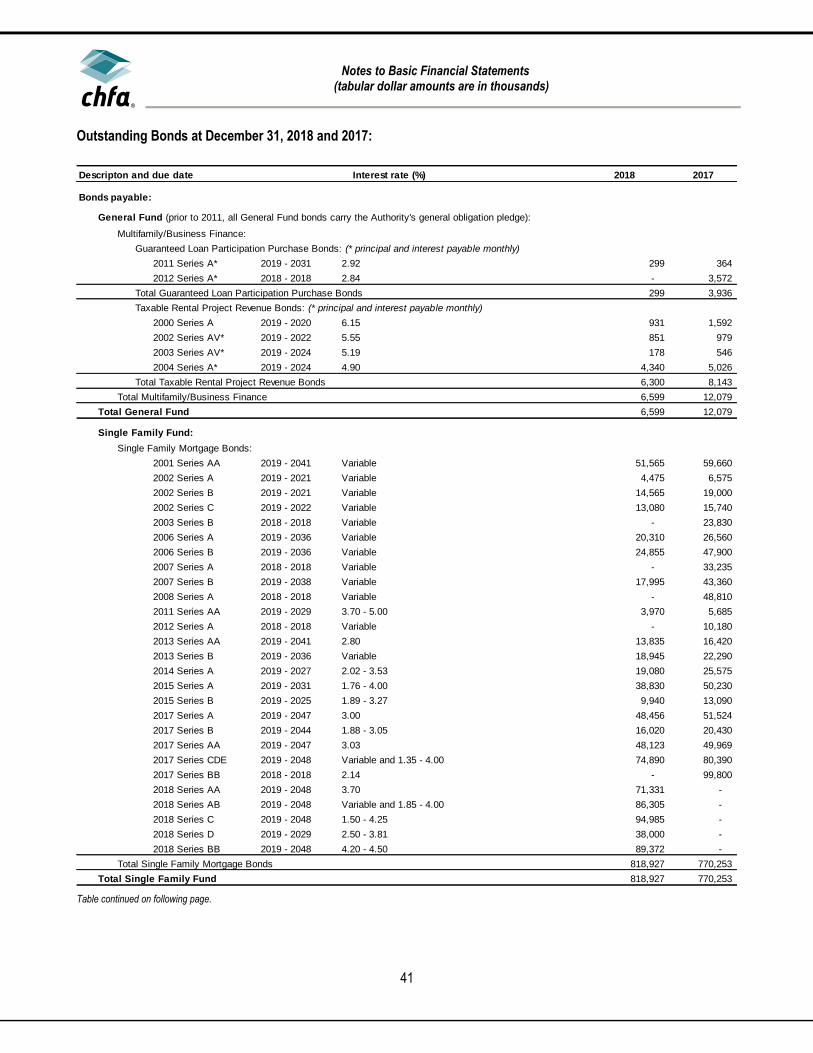
Notes to Basic Financial Statements
(tabular dollar amounts are in thousands)
41
Outstanding Bonds at December 31, 2018 and 2017:
Table continued on following page.
Descripton and due date Interest rate (%) 2018 2017
Bonds payable:
General Fund (prior to 2011, all General Fund bonds carry the Authority's general obligation pledge):
Multifamily/Business Finance:
Guaranteed Loan Participation Purchase Bonds: (* principal and interest payable monthly)
2011 Series A* 2019 - 2031 2.92 299 364
2012 Series A* 2018 - 2018 2.84 - 3,572
Total Guaranteed Loan Participation Purchase Bonds 299 3,936
Taxable Rental Project Revenue Bonds: (* principal and interest payable monthly)
2000 Series A 2019 - 2020 6.15 931 1,592
2002 Series AV* 2019 - 2022 5.55 851 979
2003 Series AV* 2019 - 2024 5.19 178 546
2004 Series A* 2019 - 2024 4.90 4,340 5,026
Total Taxable Rental Project Revenue Bonds 6,300 8,143
Total Multifamily/Business Finance 6,599 12,079
Total General Fund 6,599 12,079
Single Family Fund:
Single Family Mortgage Bonds:
2001 Series AA 2019 - 2041 Variable 51,565 59,660
2002 Series A 2019 - 2021 Variable 4,475 6,575
2002 Series B 2019 - 2021 Variable 14,565 19,000
2002 Series C 2019 - 2022 Variable 13,080 15,740
2003 Series B 2018 - 2018 Variable - 23,830
2006 Series A 2019 - 2036 Variable 20,310 26,560
2006 Series B 2019 - 2036 Variable 24,855 47,900
2007 Series A 2018 - 2018 Variable - 33,235
2007 Series B 2019 - 2038 Variable 17,995 43,360
2008 Series A 2018 - 2018 Variable - 48,810
2011 Series AA 2019 - 2029 3.70 - 5.00 3,970 5,685
2012 Series A 2018 - 2018 Variable - 10,180
2013 Series AA 2019 - 2041 2.80 13,835 16,420
2013 Series B 2019 - 2036 Variable 18,945 22,290
2014 Series A 2019 - 2027 2.02 - 3.53 19,080 25,575
2015 Series A 2019 - 2031 1.76 - 4.00 38,830 50,230
2015 Series B 2019 - 2025 1.89 - 3.27 9,940 13,090
2017 Series A 2019 - 2047 3.00 48,456 51,524
2017 Series B 2019 - 2044 1.88 - 3.05 16,020 20,430
2017 Series AA 2019 - 2047 3.03 48,123 49,969
2017 Series CDE 2019 - 2048 Variable and 1.35 - 4.00 74,890 80,390
2017 Series BB 2018 - 2018 2.14 - 99,800
2018 Series AA 2019 - 2048 3.70 71,331 -
2018 Series AB 2019 - 2048 Variable and 1.85 - 4.00 86,305 -
2018 Series C 2019 - 2048 1.50 - 4.25 94,985 -
2018 Series D 2019 - 2029 2.50 - 3.81 38,000 -
2018 Series BB 2019 - 2048 4.20 - 4.50 89,372 -
Total Single Family Mortgage Bonds 818,927 770,253
Total Single Family Fund 818,927 770,253

Notes to Basic Financial Statements
(tabular dollar amounts are in thousands)
42
Descripton and due date Interest rate (%) 2018 2017
Multifamily/Business Fund:
Multifamily/Project Bonds: (* principal and interest payable quarterly on some of the bonds)
2000 Series A 2019 - 2030 Variable 4,625 5,480
2002 Series C 2018 - 2018 Variable - 15,045
2003 Series A 2018 - 2018 Variable - 26,225
2004 Series A 2018 - 2018 Variable - 11,230
2005 Series A 2018 - 2018 Variable - 17,215
2005 Series B 2019 - 2040 Variable 3,205 12,015
2006 Series A 2019 - 2036 Variable 14,200 33,480
2007 Series B 2019 - 2038 Variable 46,445 47,135
2008 Series A 2019 - 2029 Variable 17,145 17,210
2008 Series B 2019 - 2052 Variable 148,540 150,950
2008 Series C 2019 - 2038 Variable 2,950 13,035
2009 Series A 2019 - 2041 Variable 8,610 17,610
2012 Series A 2019 - 2051 2.75 - 4.50 9,895 10,045
2012 Series B 2019 - 2054 2.55 - 4.20 16,575 16,805
2013 Series A 2019 - 2023 Variable 1,615 2,675
2013 Series I 2019 - 2044 3.20 11,194 18,012
2016 Series A 2019 - 2041 1.47 - 4.00 11,045 11,375
2016 Series I 2019 - 2056 3.45 5,131 12,500
2016 Series II 2019 - 2056 0.90 - 3.00 18,000 18,000
2016 Series III 2019 - 2052 3.10 3,443 3,492
2016 Series IV 2019 - 2056 3.13 6,494 12,365
2016 Series V 2019 - 2045 3.40 39,847 42,975
2017 Series I 2019 - 2057 3.85 10,178 13,577
2017 Series II 2019 - 2057 1.15 - 3.76 14,100 14,100
2017 Series III 2019 - 2057 3.75 9,400 9,400
2017 Series A 2019 - 2019 1.55 7,950 7,950
2017 Series IV 2019 - 2057 3.64 26,000 26,000
2018 Series A 2019 - 2040 Variable & 2.25 - 3.90 83,200 -
Total Multifamily/Project Bonds 519,787 585,901
Total Multifamily/Business Fund 519,787 585,901
Total bonds payable 1,345,313 1,368,233
Premiums classified as bonds payable
Bond premiums - unamortized 13,140 4,687
Bonds payable, net 1,358,453 1,372,920
Notes payable 863 967
Bonds and notes payable, net 1,359,316$ 1,373,887$
Current:
Bonds payable 79,612 117,380
Notes payable 105 104
Noncurrent:
Bonds and notes payable 1,279,599 1,256,403
Total 1,359,316$ 1,373,887$
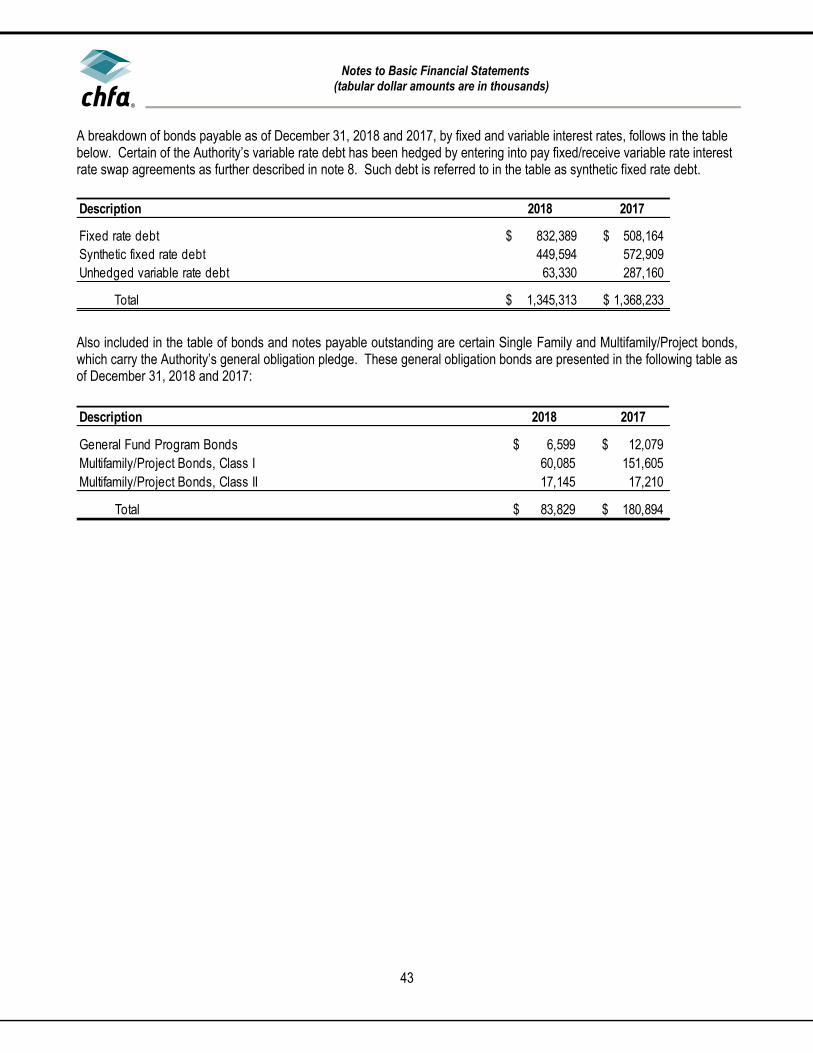
Notes to Basic Financial Statements
(tabular dollar amounts are in thousands)
43
A breakdown of bonds payable as of December 31, 2018 and 2017, by fixed and variable interest rates, follows in the table below. Certain of the Authority’s variable rate debt has been hedged by entering into pay fixed/receive variable rate interest rate swap agreements as further described in note 8. Such debt is referred to in the table as synthetic fixed rate debt.
Also included in the table of bonds and notes payable outstanding are certain Single Family and Multifamily/Project bonds, which carry the Authority’s general obligation pledge. These general obligation bonds are presented in the following table as of December 31, 2018 and 2017:
Description 2018 2017
Fixed rate debt 832,389$ 508,164$
Synthetic fixed rate debt 449,594 572,909
Unhedged variable rate debt 63,330 287,160
Total 1,345,313$ 1,368,233$
Description 2018 2017
General Fund Program Bonds 6,599$ 12,079$
Multifamily/Project Bonds, Class I 60,085 151,605
Multifamily/Project Bonds, Class II 17,145 17,210
Total 83,829$ 180,894$

Notes to Basic Financial Statements
(tabular dollar amounts are in thousands)
44
Standby Purchase Agreements provide liquidity support on variable rate bonds that are remarketed weekly. The liquidity/commitment fees vary by agreement and are based on a percentage of the outstanding bond balance, payable monthly or quarterly. If the liquidity agreements expire or the renewal or replacement efforts are unsuccessful for the liquidity agreements and the bonds are mandatorily redeemed, the bond’s principal portion of the debt service requirements would increase by the respective amounts for the respective years as presented in the following schedule of providers and maturities as of December 31, 2018. During 2018 and 2017, the Authority renewed or replaced expiring liquidity facilities of $369 thousand and $0, respectively. Liquidity fees for the years ended December 31, 2018 and 2017 were $2.4 million and $3.4 million, respectively. A schedule of providers and maturities is presented below, as of December 31, 2018:
The following provides the terms of the debt service requirements that would result if the SBPA commitments were to be exercised (bank bond rate, accelerated payment schedule, and lien): (1) (a) Bank Rate: for the first 90 days following the purchase date, the "Base Rate", for any day, a per annum rate to the highest of (a) the Federal Fund
Rate plus 2.00%, (b) the prime rate plus 1.00%, (c) the LIBOR Rate plus 2.00%, and (d) seven and one-half percent (7.50%), then from and after the ninety-first (91st) day, the Base Rate plus 1.00% per annum.
(b) Term out provisions: three hundred sixty-six (366) days following the earlier of (x) the Purchase Date, or (y) the last day of the Purchase Period. Semiannual Principal payment due the date that is the earlier of (x) the five year anniversary of the related Purchase Date, or (y) the five year
anniversary of the last day of the Purchase Period. (2) (a) Bank Rate: One-Month LIBOR plus 2.00%.
(b) Term out provisions: repayments due 366 days following the purchase date in equal semiannual installments until fifth anniversary of the purchase date.
(3) (a) Bank Rate: for the first 90 days following the purchase date, the "Base Rate", which equals the highest of (i) the prime rate plus 2.50%, (ii) the Fed funds rate plus 3.00% and (iii) 8.00%; then for the period 91-180 days following the purchase date, the Base Rate plus 1.00%; then
for the period 181 days and higher following the purchase date, the Base Rate plus 2.00%. (b) Term out provisions: repayments due on the first business day of February, May, August or November on or following 90 days following purchase
date and thereafter quarterly on each such dates in equal installments to the third anniversary of such purchase date. Class I lien. (4) (a) Bank Rate: for the first 60 days following the purchase date, the "Base Rate”, for any day, a per annum rate to the highest of (i) prime rate plus
2.00%, (ii) the Federal Fund Rate plus 3.00%, (iii) the One Month LIBOR Rate plus 3.00%, (iv) the SIFMA Rate plus 3.00%, and (v) six and one-half percent (6.50%), then from and after the ninety-first (91st) day, the Base Rate plus 1.00% per annum.
(b) Term out provisions: repayments due 366 days following the Purchase date in quarterly installments to the fifth anniversary of purchase date.
Liquidity
Expiration
Bank of
America (1) FHLB (2)
Royal Bank of
Canada (3)
Sumitomo
MBC (4) Grand Total
2019 -$ 17,710$ 46,740$ -$ 64,450$
2020 - 45,165 - - 45,165
2021 67,645 299,100 - 36,565 403,310
Total 67,645$ 361,975$ 46,740$ 36,565$ 512,925$

Notes to Basic Financial Statements
(tabular dollar amounts are in thousands)
45
The following table presents the detail of bonds, notes payable and certain other liabilities that include current and noncurrent activity for the year ended December 31, 2018:
The following table presents the detail of bonds, notes payable and certain other liabilities that include current and noncurrent activity for the year ended December 31, 2017:
Beginning Ending
Description Balance Additions Reductions Balance Current Noncurrent
Bonds payable 1,368,233$ 474,334$ (497,254)$ 1,345,313$ 78,842$ 1,266,471$
Bond premiums - unamortized 4,687 8,978 (525) 13,140 770 12,370
Total bonds payable 1,372,920 483,312 (497,779) 1,358,453 79,612 1,278,841
Notes payable 967 - (104) 863 105 758
Unearned revenue 3,855 1,817 (491) 5,181 345 4,836
Other liabilities 12,326 25,166 (471) 37,021 415 36,606
Total other liabilities 16,181 26,983 (962) 42,202 760 41,442
Total 1,390,068$ 510,295$ (498,845)$ 1,401,518$ 80,477$ 1,321,041$
Beginning Ending
Description Balance Additions Reductions Balance Current Noncurrent
Bonds payable 1,275,776$ 374,281$ (281,824)$ 1,368,233$ 116,981$ 1,251,252$
Bond premiums - unamortized 2,297 2,622 (232) 4,687 399 4,288
Total bonds payable 1,278,073 376,903 (282,056) 1,372,920 117,380 1,255,540
Notes payable 1,069 - (102) 967 104 863
Unearned revenue 3,267 1,050 (462) 3,855 257 3,598
Other liabilities 8,633 4,081 (388) 12,326 250 12,076
Total other liabilities 11,900 5,131 (850) 16,181 507 15,674
Total 1,291,042$ 382,034$ (283,008)$ 1,390,068$ 117,991$ 1,272,077$

Notes to Basic Financial Statements
(tabular dollar amounts are in thousands)
46
Bonds and notes payable sinking fund installments and contractual maturities subsequent to December 31, 2018, using rates in effect as of December 31, 2018, are as follows:
(7) Conduit Debt Obligation The Authority has issued certain conduit bonds, the proceeds of which were made available to various developers and corporations for rental housing and commercial purposes. Other conduit proceeds were made available to the State of Colorado for the Colorado Unemployment Insurance Trust Fund, these conduit bonds were fully redeemed during 2017. The bonds are payable solely from amounts received by the trustees. The faith and credit of the Authority is not pledged for the payment of the principal or interest on the bonds. Accordingly, these obligations are excluded from the Authority's financial statements. As of December 31, 2018 and 2017, the aggregate principal amount of conduit debt outstanding totaled $934.7 million and $674.4 million, respectively.
(8) Derivative Instruments The Authority reports derivative instruments at fair value. The fair value of all derivatives is reported on the Statement of Net Position as a derivative instrument at the end of the year. If an interest rate hedge is considered ineffective, it is referred to as an investment derivative and the change in fair value is reported on the Statement of Revenues, Expenses and Changes in Net Position as investment derivative activity loss. The annual changes in the fair value of effective hedging derivative instruments are reported as deferred inflows and outflows, as appropriate, on the Statement of Net Position. Swaps Transactions – The Authority has entered into pay fixed, receive variable interest rate swaps in order to (1) provide lower cost fixed rate financing for its production needs through synthetic fixed rate structures and (2) utilize synthetic fixed rate structures with refunding bonds in order to generate cash flow savings. The objective of the swaps is to hedge interest rate risk. The fair values take into consideration the prevailing interest rate environment and the specific terms and conditions of each swap. All fair values were estimated using the zero-coupon discounting method. This method calculates the future payments required by the swap, assuming that the current forward rates implied by the yield curve are the market’s best estimate of
Years Ending
December 31, Principal Interest Principal Interest Principal Interest Principal Interest
2019 598$ 325$ 46,137$ 23,615$ 32,107$ 14,447$ 105$ 9$
2020 333 288 46,567 23,041 7,972 14,124 90 8
2021 - 278 46,762 22,410 8,297 13,969 57 7
2022 851 274 21,825 21,632 8,562 13,806 58 6
2023 - 231 19,705 21,124 8,547 13,622 58 6
2024 - 2028 4,518 115 98,325 97,402 23,960 65,370 195 19
2029 - 2033 299 26 68,225 84,865 39,735 59,420 133 12
2034 - 2038 - - 74,610 76,637 80,870 54,759 140 6
2039 - 2043 - - 75,640 67,276 22,440 44,656 27 -
2044 - 2048 - - 321,131 49,016 56,287 37,045 - -
2049 - 2053 - - - - 157,308 27,678 - -
2054 - 2058 - - - - 73,702 8,625 - -
Total 6,599$ 1,537$ 818,927$ 487,018$ 519,787$ 367,521$ 863$ 73$
General Fund Single Family Multifamily / Business Notes Payable
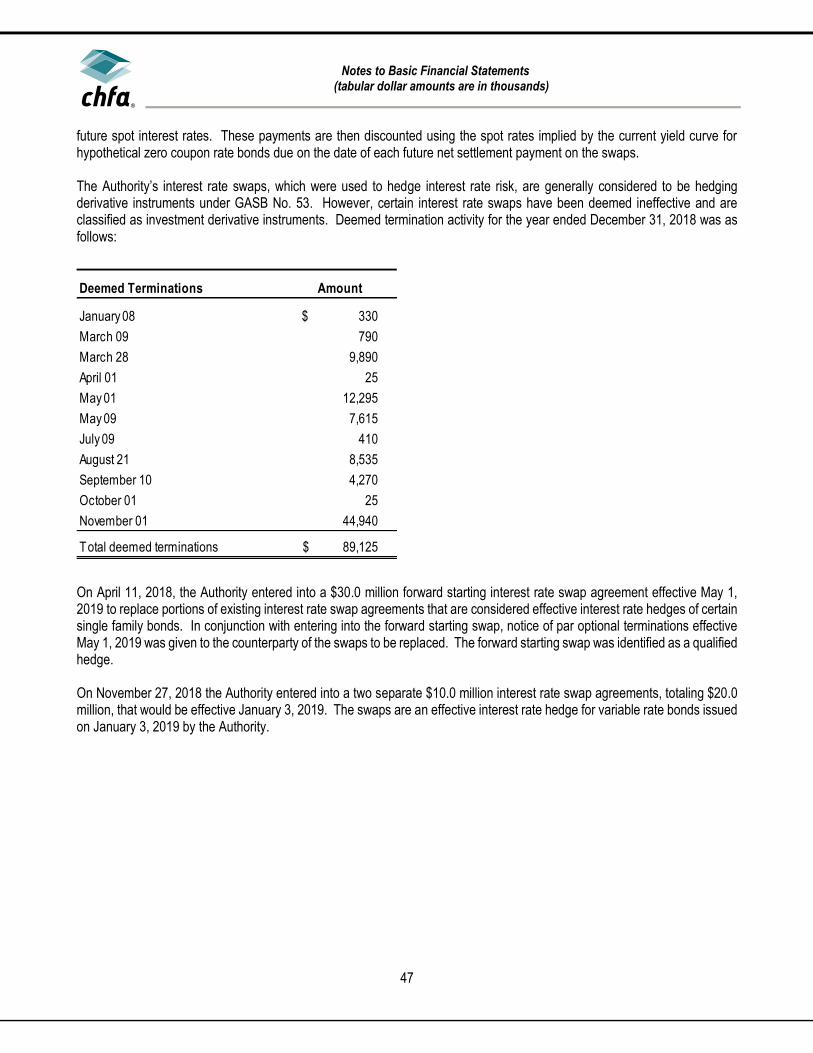
Notes to Basic Financial Statements
(tabular dollar amounts are in thousands)
47
future spot interest rates. These payments are then discounted using the spot rates implied by the current yield curve for hypothetical zero coupon rate bonds due on the date of each future net settlement payment on the swaps. The Authority’s interest rate swaps, which were used to hedge interest rate risk, are generally considered to be hedging derivative instruments under GASB No. 53. However, certain interest rate swaps have been deemed ineffective and are classified as investment derivative instruments. Deemed termination activity for the year ended December 31, 2018 was as follows:
On April 11, 2018, the Authority entered into a $30.0 million forward starting interest rate swap agreement effective May 1, 2019 to replace portions of existing interest rate swap agreements that are considered effective interest rate hedges of certain single family bonds. In conjunction with entering into the forward starting swap, notice of par optional terminations effective May 1, 2019 was given to the counterparty of the swaps to be replaced. The forward starting swap was identified as a qualified hedge. On November 27, 2018 the Authority entered into a two separate $10.0 million interest rate swap agreements, totaling $20.0 million, that would be effective January 3, 2019. The swaps are an effective interest rate hedge for variable rate bonds issued on January 3, 2019 by the Authority.
Deemed Terminations Amount
January 08 330$
March 09 790
March 28 9,890
April 01 25
May 01 12,295
May 09 7,615
July 09 410
August 21 8,535
September 10 4,270
October 01 25
November 01 44,940
Total deemed terminations 89,125$

Notes to Basic Financial Statements
(tabular dollar amounts are in thousands)
48
Deemed termination activity for the year ended December 31, 2017 was as follows:
On October 5, 2017, in anticipation of a refunding of certain single family bonds, the Authority entered into an amended and restated swap confirmation affecting an existing interest rate swap agreement totaling $40.0 million that was considered an effective interest rate hedge. Under the terms of the restated confirmation, the notional amount of the swap will be reduced to $25.0 million on May 1, 2018 with a new on-market fixed payer rate, a change to the floating rate received, and amended par optional termination rights. The amended swap will remain an effective interest rate hedge. On November 1, 2017, the Authority entered into a $50.0 million forward starting interest rate swap agreement effective May 1, 2019 to replace portions of existing interest rate swap agreements that are considered effective interest rate hedges of certain single family bonds. In conjunction with entering into the forward starting swap, notice of par optional terminations effective May 1, 2019 was given to the counterparty of the swaps to be replaced. The forward starting swap was identified as a qualified hedge. A summary of interest rate swaps for the years ended December 31, 2018 and 2017 was as follows:
Trigger: The variable rate received on these swaps is 68% of the one-month LIBOR, if LIBOR is equal to or greater than 3.5%. The variable rate received on these swaps is SIFMA plus a spread if the one-month LIBOR is less than 3.5%. See further discussion in the basis risk section below. Par Optional Termination Right: Certain swaps contain a cancellation clause that provides the Authority the option to cancel a certain amount of the swaps on certain dates. The Authority may cancel the optional termination amount for no payment
Deemed Terminations Amount
April 01 75$
May 01 11,110
June 07 595
June 23 4,395
July 19 25,000
October 01 4,120
October 31 12,555
November 01 23,535
Total deemed terminations 81,385$
2018 2017
Summary of Interest Rate Swaps Fair Value Fair Value
Par optional termination right with trigger (432)$ 5,990$
Par optional termination right 2,600 4,252
T rigger 2,828 4,607
Plain 48,831 58,472
Total fair value 53,827$ 73,321$

Notes to Basic Financial Statements
(tabular dollar amounts are in thousands)
49
(callable at par). The optional termination dates coincide with the debt service dates on the associated hedged bonds payable. These dates and amounts are provided in the table below. Detail of Outstanding Interest Rate Swaps – The key terms, including the fair values and counterparty credit ratings of the outstanding swaps as of December 31, 2018, are shown in the table below. Except as discussed under amortization risk below, the Authority’s swap agreements contain scheduled reductions to outstanding notional amounts that are expected to approximately follow scheduled or anticipated reductions in the associated bonds payable. Based on the standard swap agreement, payments are settled on a net basis. The Authority enters into master netting arrangements with each of its swap counterparties. All of the agreements provide for the netting of the value of assets and liability positions of all transactions with the respective counterparty. There are no other significant transactions with these counterparties outside of these swap agreements, such that the aggregate amount of liabilities included in the master netting arrangements is equal to the net fair value of the swaps. Outstanding Swaps at December 31, 2018 and 2017:
Table continued on following page.
Current
Notional Effective Termination
Fixed
Rate Variable Rate Embedded
Optional
Termination
Optional
Termination
Counterparty
Rating 2018 Change in 2017
Swap Series Amount Date Date Paid Received * Options Date, at Par Amount S&P/Moody's Fair Value ** Fair Value Fair Value **
Single Family:
Investment derivatives (includes overhedged portion of interest rate swaps):
2001AA-1 **** 15,000 12/1/2009 11/1/2038 4.4850% Trigger, SIFMA + .15% or 68% LIBOR *** 11/1/2019 all remaining A / A2 (887) (312) (575)
2002A-3 **** 365 12/4/2008 11/1/2021 4.7490% Trigger, SIFMA + .05% or 68% LIBOR A / A2 14 6 8
2002C-3 **** 7,795 12/4/2008 5/1/2022 4.4220% Trigger, SIFMA + .15% or 68% LIBOR A / A2 342 (265) 607
2006A-3 18,945 1/18/2006 11/1/2036 4.3129% Trigger, SIFMA + .15% or 68% LIBOR *** 5/1/2019 18,577 A+ / Aa3 108 (373) 481
2006B-3 52,315 7/26/2006 11/1/2036 4.5445% Trigger, SIFMA + .15% or 68% LIBOR *** 5/1/2019 51,208 A+ / Aa3 340 (806) 1,146
2006C-2 (D) 2,265 12/20/2006 11/1/2034 4.2884% Trigger, SIFMA + .05% or 68% LIBOR *** 11/1/2019 all remaining A+ / Aa3 37 21 16
2007A-2 42,760 5/9/2007 11/1/2037 4.1530% Trigger, SIFMA + .15% or 68% LIBOR *** 5/1/2019 42,035 A+ / Aa3 222 (793) 1,015
2007B-2 29,135 10/18/2007 5/1/2038 4.5075% Trigger, SIFMA + .15% or 68% LIBOR *** 5/1/2019 28,773 A+ / Aa3 186 11 175
2012A-1 **** 9,505 12/2/2008 11/1/2021 4.1600% Trigger, SIFMA + .05% or 68% LIBOR A / A2 (185) 23 (208)
2012A-2 (SPV) - 6/4/2008 5/1/2038 4.4140% 65% LIBOR + .10% *** A+ / Aa2 - (165) 165
Total 178,085 177 (2,653) 2,830
Hedging derivatives:
2001AA-2 **** 36,565 12/4/2008 5/1/2031 4.6000% Trigger, SIFMA + .05% or 68% LIBOR 0 A / A2 2,328 (908) 3,236
2001AA-3 - 12/2/2008 5/1/2018 5.5260% Trigger, SIFMA + .05% or 68% LIBOR 0 A / A2 - (7) 7
2002A-3 **** 4,475 12/4/2008 11/1/2021 4.7490% Trigger, SIFMA + .05% or 68% LIBOR 0 A / A2 39 (106) 145
2002B-3 **** 14,565 12/4/2008 11/1/2021 4.5060% Trigger, SIFMA + .05% or 68% LIBOR 0 A / A2 177 (292) 469
2002C-3 **** 13,775 12/4/2008 5/1/2022 4.4220% Trigger, SIFMA + .15% or 68% LIBOR 0 A / A2 113 (230) 343
2003B-2 - 10/29/2008 5/1/2028 4.9380% LIBOR + .05% *** AA- / A2 - (218) 218
2006A-3 19,615 1/18/2006 11/1/2036 4.3129% Trigger, SIFMA + .15% or 68% LIBOR *** 5/1/2019 19,233 A+ / Aa3 498 (624) 1,122
2006B-2 16,700 7/26/2006 11/1/2034 4.1951% Trigger, SIFMA + .05% or 68% LIBOR *** 5/1/2019 16,700 A+ / Aa3 305 (405) 710
2006B-3 8,155 7/26/2006 11/1/2036 4.5445% Trigger, SIFMA + .15% or 68% LIBOR *** 5/1/2019 7,982 A+ / Aa3 643 (917) 1,560
2006C-2 (D) 18,945 12/20/2006 11/1/2034 4.2884% Trigger, SIFMA + .05% or 68% LIBOR *** 11/1/2019 all remaining A+ / Aa3 (2,149) (393) (1,756)
2007A-2 - 5/9/2007 11/1/2037 4.1530% Trigger, SIFMA + .15% or 68% LIBOR *** A+ / Aa3 - (1,517) 1,517
2007B-2 17,995 10/18/2007 5/1/2038 4.5075% Trigger, SIFMA + .15% or 68% LIBOR *** 5/1/2019 17,772 A+ / Aa3 641 (1,299) 1,940
2008A-1 - 6/4/2008 5/1/2038 5.4450% LIBOR + .05% *** A+ / Aa2 - (363) 363
2008A-2 - 6/4/2008 11/1/2027 4.5960% LIBOR + .05% *** AA- / Aa2 - (338) 338
2012A-2 (SPV) 25,000 5/1/2018 5/1/2038 2.3230% LIBOR * 70% *** 11/1/2021 2,660 A+ / Aa2 3 (271) 274
2018B-2 21,235 5/9/2018 11/1/2041 4.1530% Trigger, SIFMA + .15% or 68% LIBOR *** 5/1/2019 42,035 A+ / Aa3 (376) (376) -
2019B-1 10,000 1/3/2019 5/1/2028 2.9675% LIBOR AA- / Aa2 348 348 -
2019B-2 10,000 1/3/2019 5/1/2042 3.7575% LIBOR *** 5/1/2025 10,000 AA- / Aa2 318 318 -
Forward swap 30,000 5/1/2019 11/1/2041 2.6000% LIBOR * 70% *** 5/1/2022 28,275 AA- / A2 523 523 -
Forward swap 50,000 5/1/2019 11/1/2037 2.4300% LIBOR * 70% *** 11/1/2022 6,075 A+ / Aa2 445 445 -
Total 297,025 3,856 (6,630) 10,486
Total Single Family 475,110 4,033 (9,283) 13,316

Notes to Basic Financial Statements
(tabular dollar amounts are in thousands)
50
(*) SIFMA is the Securities Industry Financial Markets Association Municipal Swap Index. LIBOR is the London Interbank Offered Rate. (**) All fair values include the effect of any related embedded option. (***) Par optional termination right. (****) Swaps for which cash premiums were received in the amount of $73.4 million in 2008. The outstanding unamortized balance of the premium is reported on the Statement of Net Position as hybrid instrument borrowings. (SPV) Counterparty operates as a special-purpose vehicle.
Current
Notional Effective Termination
Fixed
Rate Variable Rate Embedded
Optional
Termination
Optional
Termination
Counterparty
Rating 2018 Change in 2017
Swap Series Amount Date Date Paid Received * Options Date, at Par Amount S&P/Moody's Fair Value ** Fair Value Fair Value **
Multifamily:
Investment derivatives (includes overhedged portion of interest rate swaps):
2002A-1 **** 4,300 11/21/2008 10/1/2022 5.1000% SIFMA + .15% A / A2 273 (175) 448
2002C-2 **** - 11/21/2008 10/1/2032 5.1240% Trigger, SIFMA + .15% or 68% LIBOR *** A / A2 - (365) 365
2002C-4 **** - 11/21/2008 10/1/2032 5.0440% Trigger, SIFMA + .05% or 68% LIBOR *** A / A2 - 599 (599)
2003A **** 8,485 11/21/2008 10/1/2023 6.0350% SIFMA + .05% A / A2 (11) (11) -
2005B-2 (B) 2,585 9/1/2006 10/1/2038 4.5270% SIFMA + .15% *** 10/1/2021 2,324 A+ / Aa3 173 (82) 255
2007B-2 (D) **** 4,240 12/3/2008 4/1/2028 4.6510% SIFMA + .15% *** 4/1/2023 3,835 A / A2 412 (163) 575
2008A-2 **** 6,395 12/3/2008 4/1/2043 4.4540% SIFMA + .15% *** 4/1/2019 6,340 A / A2 30 (198) 228
2008C-3 **** 3,645 12/3/2008 10/1/2038 4.3400% SIFMA + .05% *** 4/1/2019 3,231 A / A2 22 (97) 119
2009A-1 **** 4,270 6/24/2009 10/1/2041 4.7900% SIFMA + .05% *** 4/1/2024 3,608 A / A2 614 (718) 1,332
2013A **** 2,760 11/21/2008 10/1/2023 6.0350% SIFMA + .05% A / A2 292 (34) 326
Total 36,680 1,805 (1,244) 3,049
Hedging derivatives:
2000A-1 **** 3,045 11/21/2008 10/1/2020 5.2350% SIFMA + .05% A / A2 69 (141) 210
2002C-2 **** - 11/21/2008 10/1/2032 5.1240% Trigger, SIFMA + .15% or 68% LIBOR *** - A / A2 - 1,128 (1,128)
2003A **** - 11/21/2008 10/1/2023 6.0350% SIFMA + .05% A / A2 - (40) 40
2005B-2 (B) 2,415 9/1/2006 10/1/2038 4.5270% SIFMA + .15% *** 10/1/2021 2,196 A+ / Aa3 111 (73) 184
2006A-1 **** 5,115 12/3/2008 4/1/2027 5.7100% LIBOR + .05% *** A / A2 (638) (41) (597)
2006A-1 (F) 9,085 12/1/2006 10/1/2036 5.3420% LIBOR + .05% *** 4/1/2021 8,040 A+ / Aa3 482 (357) 839
2007B-1 **** 8,400 12/3/2008 4/1/2038 5.6400% LIBOR + .05% *** 4/1/2022 all remaining A / A2 (579) (121) (458)
2007B-1 (G) 6,790 10/1/2007 4/1/2028 5.2200% LIBOR + .05% *** 10/1/2022 6,190 A+ / Aa3 582 (275) 857
2008A-1 **** 7,620 12/3/2008 4/1/2029 5.1300% LIBOR + .05% *** 4/1/2019 all remaining A / A2 (442) (73) (369)
2008B (a) **** 104,870 12/3/2008 10/1/2044 5.1722% LIBOR AA- / A2 32,218 (6,608) 38,826
2008B (b) **** 43,670 12/3/2008 3/1/2047 5.2071% LIBOR AA- / A2 15,741 (3,084) 18,825
2008C-3 **** 2,950 12/3/2008 10/1/2038 4.3400% SIFMA + .05% *** 4/1/2019 3,269 A / A2 18 (85) 103
2009A-1 **** 8,540 6/24/2009 10/1/2041 4.7900% SIFMA + .05% *** 4/1/2024 7,507 A / A2 155 329 (174)
2013A **** 1,615 11/21/2008 10/1/2023 6.0350% SIFMA + .05% A / A2 (99) 103 (202)
2018A-2 33,455 4/1/2018 4/1/2040 3.1450% LIBOR *** 4/1/2025 22,185 AA- / Aa2 371 371 -
Total 237,570 47,989 (8,967) 56,956
Total Multifamily 274,250 49,794 (10,211) 60,005
Total 749,360$ 53,827$ (19,494)$ 73,321$
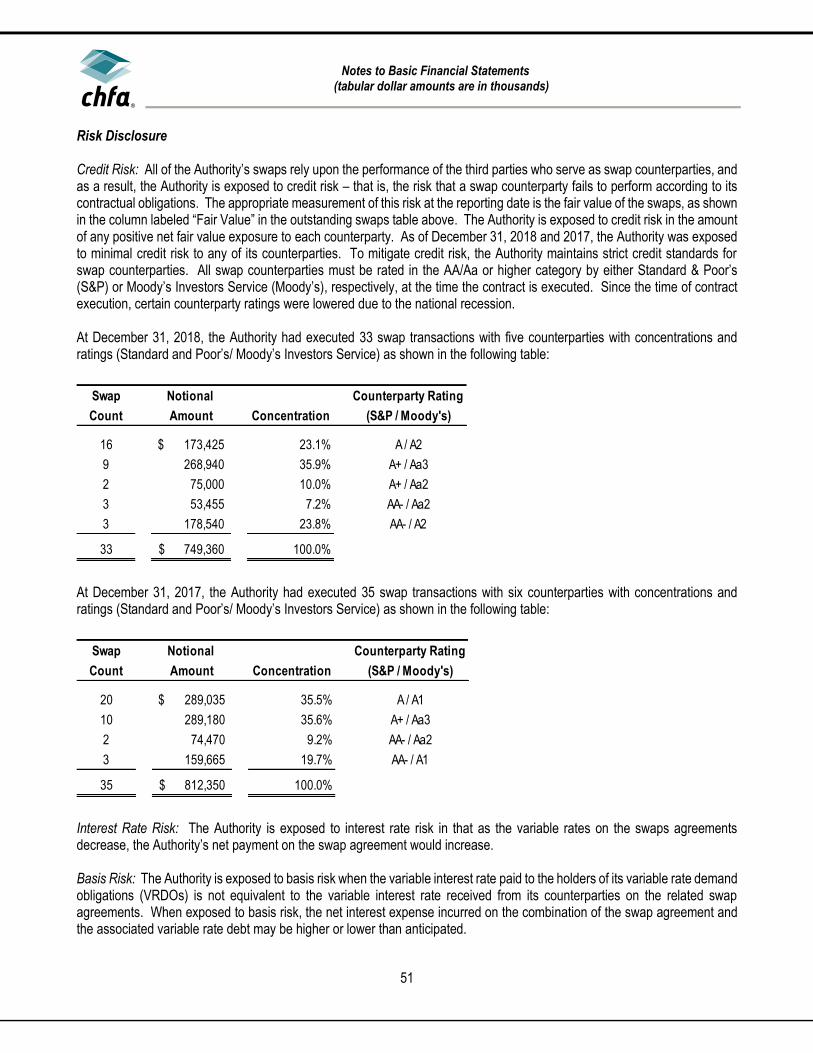
Notes to Basic Financial Statements
(tabular dollar amounts are in thousands)
51
Risk Disclosure Credit Risk: All of the Authority’s swaps rely upon the performance of the third parties who serve as swap counterparties, and as a result, the Authority is exposed to credit risk – that is, the risk that a swap counterparty fails to perform according to its contractual obligations. The appropriate measurement of this risk at the reporting date is the fair value of the swaps, as shown in the column labeled “Fair Value” in the outstanding swaps table above. The Authority is exposed to credit risk in the amount of any positive net fair value exposure to each counterparty. As of December 31, 2018 and 2017, the Authority was exposed to minimal credit risk to any of its counterparties. To mitigate credit risk, the Authority maintains strict credit standards for swap counterparties. All swap counterparties must be rated in the AA/Aa or higher category by either Standard & Poor’s (S&P) or Moody’s Investors Service (Moody’s), respectively, at the time the contract is executed. Since the time of contract execution, certain counterparty ratings were lowered due to the national recession. At December 31, 2018, the Authority had executed 33 swap transactions with five counterparties with concentrations and ratings (Standard and Poor’s/ Moody’s Investors Service) as shown in the following table:
At December 31, 2017, the Authority had executed 35 swap transactions with six counterparties with concentrations and ratings (Standard and Poor’s/ Moody’s Investors Service) as shown in the following table:
Interest Rate Risk: The Authority is exposed to interest rate risk in that as the variable rates on the swaps agreements decrease, the Authority’s net payment on the swap agreement would increase. Basis Risk: The Authority is exposed to basis risk when the variable interest rate paid to the holders of its variable rate demand obligations (VRDOs) is not equivalent to the variable interest rate received from its counterparties on the related swap agreements. When exposed to basis risk, the net interest expense incurred on the combination of the swap agreement and the associated variable rate debt may be higher or lower than anticipated.
Swap Notional Counterparty Rating
Count Amount Concentration (S&P / Moody's)
16 173,425$ 23.1% A / A2
9 268,940 35.9% A+ / Aa3
2 75,000 10.0% A+ / Aa2
3 53,455 7.2% AA- / Aa2
3 178,540 23.8% AA- / A2
33 749,360$ 100.0%
Swap Notional Counterparty Rating
Count Amount Concentration (S&P / Moody's)
20 289,035$ 35.5% A / A1
10 289,180 35.6% A+ / Aa3
2 74,470 9.2% AA- / Aa2
3 159,665 19.7% AA- / A1
35 812,350$ 100.0%
Notes to Basic Financial Statements
(tabular dollar amounts are in thousands)
52
The Authority’s tax-exempt variable rate bond interest payments are substantially equivalent to the SIFMA rate (plus a trading spread). Certain tax-exempt swaps, as indicated in the table above, contain a trigger feature in which the Authority receives a rate indexed on SIFMA should LIBOR be less than a predetermined level (the trigger level, 3.5%), or a rate pegged at a percentage of LIBOR should LIBOR be equal to or greater than the predetermined trigger level. For these swaps, the Authority would be negatively exposed to basis risk during the time period it is receiving the rate based on a percentage of LIBOR should the relationship between LIBOR and SIFMA converge. The Authority’s taxable variable rate bond interest payments are substantially equivalent to LIBOR (plus a trading spread) and are reset on a weekly basis. The Authority is receiving one-month LIBOR (plus a trading spread) or LIBOR flat for all of its taxable swaps and therefore is only exposed to basis risk to the extent that the Authority’s bonds diverge from their historic trading relationship with LIBOR. Termination Risk: The Authority’s swap agreements do not contain any out-of-the-ordinary termination events that would expose it to significant termination risk. In keeping with market standards, the Authority or the counterparty may terminate each swap if the other party fails to perform under the terms of the contract. In addition, the swap documents allow either party to terminate in the event of a significant loss of creditworthiness. If at the time of the termination a swap has a negative value, the Authority would be liable to the counterparty for a payment equal to the fair value of such swap. There are certain termination provisions relevant to the Authority’s counterparties operating as special-purpose vehicles (SPV) with a terminating structure. In the case of certain events, including the credit downgrade of the SPV or the failure of the parent company to maintain certain collateral levels, the SPV would be required to wind up its business and terminate all of its outstanding transactions with all clients, including the Authority. All such terminations would be at mid-market pricing. In the event of such termination, the Authority would be exposed to the risk of market re-entry and the cost differential between the mid-market termination and the offered price upon re-entry. Rollover Risk: The Authority is exposed to rollover risk only on swaps that mature or may be terminated at the counterparty’s option prior to the maturity of the associated debt. As of December 31, 2018 and 2017, the Authority was not exposed to rollover risk. Amortization Risk: The Authority is exposed to amortization risk in the event that the swap amortization schedules fail to match the actual amortization of the underlying bonds as a result of loan prepayments, which significantly deviate from expectations. If prepayments are significantly higher than anticipated, the Authority would have the option of reinvesting or recycling the prepayments, or calling unhedged bonds. Alternatively, if the Authority chose to call bonds associated with the swap, the Authority could elect an early termination of the related portions of the swap at a potential cost to the Authority. If prepayments are significantly lower than anticipated and the associated bonds remained outstanding longer than the relevant portion of the swap, the Authority could experience an increase in its exposure to unhedged variable rate bonds. Alternatively, the Authority could choose to enter into a new swap or an extension of the existing swap. If interest rates are higher at the time of entering into a new swap or swap extension, such action would result in an increased cost to the Authority. Collateral Requirements: As of December 31, 2018 and 2017, swaps with a fair value of $51.8 million and $69.1 million, respectively, require the Authority to post collateral in the event that the underlying Class I bond rating drops below Aa3 as issued by Moody’s Investor Service or AA- as issued by Standard & Poor’s. Collateral requirements range up to 100% of the fair value of the swap depending on the bond rating. Over collateralization is required for investments posted in lieu of cash. At December 31, 2018 and 2017, the ratings of bonds subject to collateral requirements exceed the levels specified in the swap agreements.
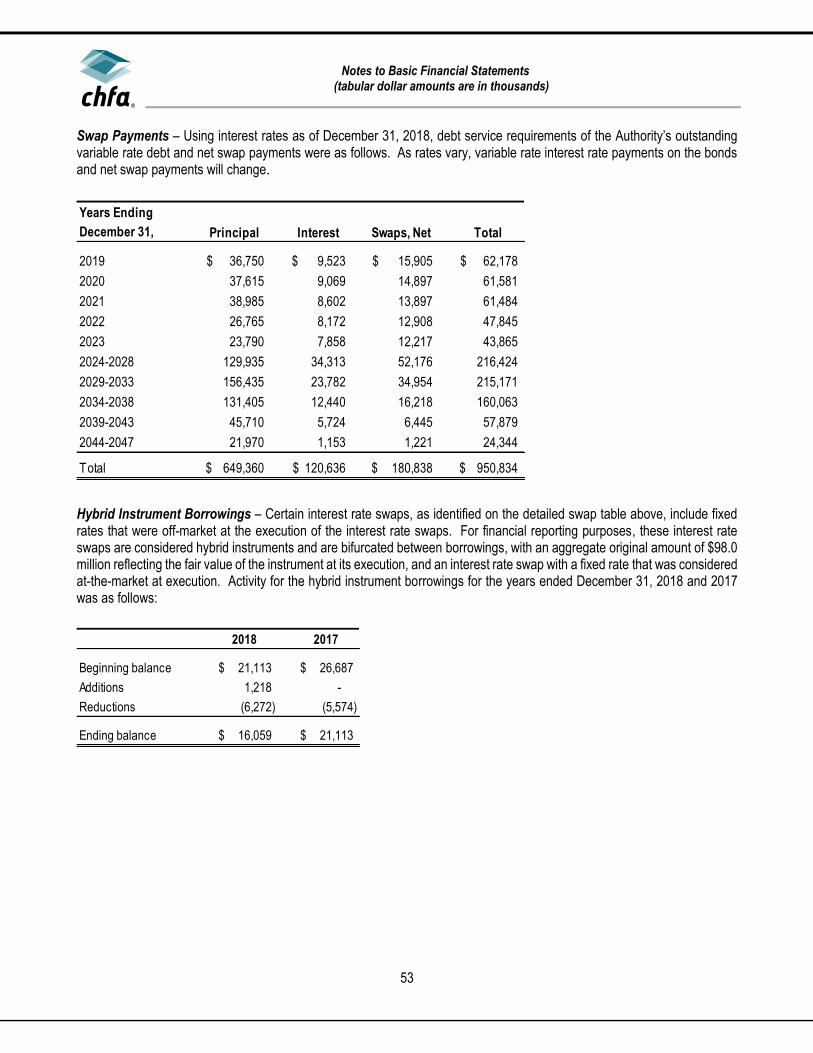
Notes to Basic Financial Statements
(tabular dollar amounts are in thousands)
53
Swap Payments – Using interest rates as of December 31, 2018, debt service requirements of the Authority’s outstanding variable rate debt and net swap payments were as follows. As rates vary, variable rate interest rate payments on the bonds and net swap payments will change.
Hybrid Instrument Borrowings – Certain interest rate swaps, as identified on the detailed swap table above, include fixed rates that were off-market at the execution of the interest rate swaps. For financial reporting purposes, these interest rate swaps are considered hybrid instruments and are bifurcated between borrowings, with an aggregate original amount of $98.0 million reflecting the fair value of the instrument at its execution, and an interest rate swap with a fixed rate that was considered at-the-market at execution. Activity for the hybrid instrument borrowings for the years ended December 31, 2018 and 2017 was as follows:
Years Ending
December 31, Principal Interest Swaps, Net Total
2019 36,750$ 9,523$ 15,905$ 62,178$
2020 37,615 9,069 14,897 61,581
2021 38,985 8,602 13,897 61,484
2022 26,765 8,172 12,908 47,845
2023 23,790 7,858 12,217 43,865
2024-2028 129,935 34,313 52,176 216,424
2029-2033 156,435 23,782 34,954 215,171
2034-2038 131,405 12,440 16,218 160,063
2039-2043 45,710 5,724 6,445 57,879
2044-2047 21,970 1,153 1,221 24,344
Total 649,360$ 120,636$ 180,838$ 950,834$
2018 2017
Beginning balance 21,113$ 26,687$
Additions 1,218 -
Reductions (6,272) (5,574)
Ending balance 16,059$ 21,113$
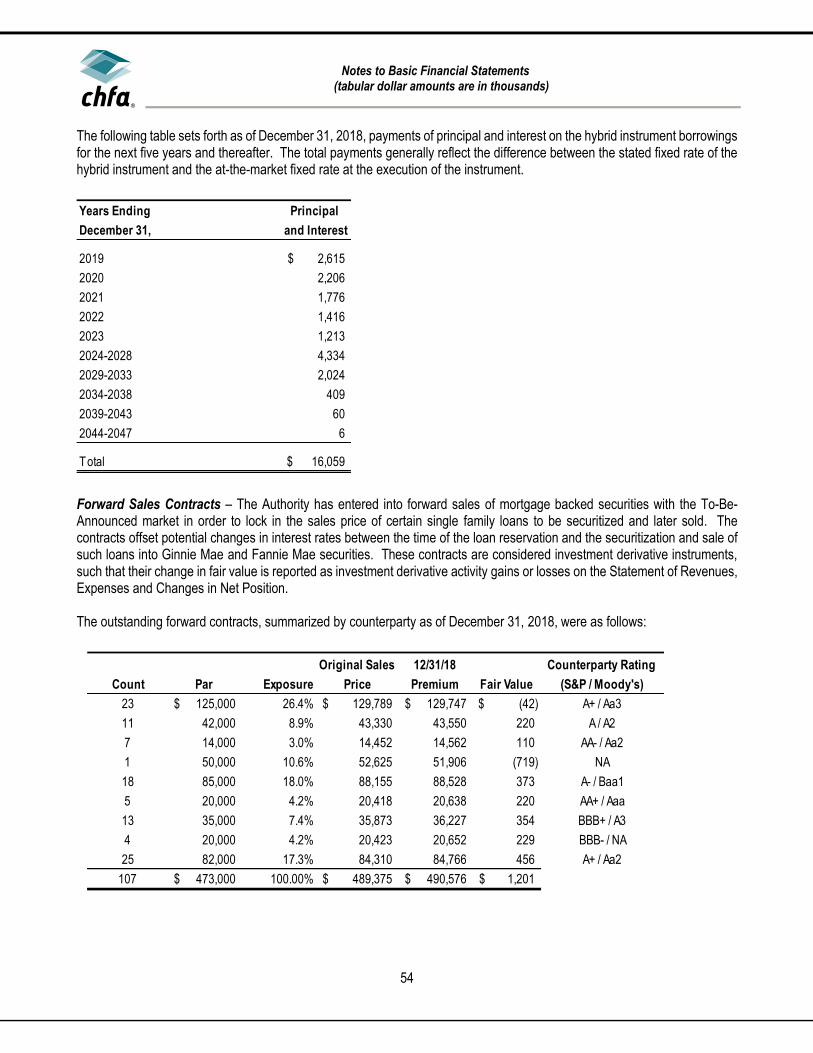
Notes to Basic Financial Statements
(tabular dollar amounts are in thousands)
54
The following table sets forth as of December 31, 2018, payments of principal and interest on the hybrid instrument borrowings for the next five years and thereafter. The total payments generally reflect the difference between the stated fixed rate of the hybrid instrument and the at-the-market fixed rate at the execution of the instrument.
Forward Sales Contracts – The Authority has entered into forward sales of mortgage backed securities with the To-Be-Announced market in order to lock in the sales price of certain single family loans to be securitized and later sold. The contracts offset potential changes in interest rates between the time of the loan reservation and the securitization and sale of such loans into Ginnie Mae and Fannie Mae securities. These contracts are considered investment derivative instruments, such that their change in fair value is reported as investment derivative activity gains or losses on the Statement of Revenues, Expenses and Changes in Net Position. The outstanding forward contracts, summarized by counterparty as of December 31, 2018, were as follows:
Years Ending Principal
December 31, and Interest
2019 2,615$
2020 2,206
2021 1,776
2022 1,416
2023 1,213
2024-2028 4,334
2029-2033 2,024
2034-2038 409
2039-2043 60
2044-2047 6
Total 16,059$
Count Par Exposure
Original Sales
Price
12/31/18
Premium Fair Value
Counterparty Rating
(S&P / Moody's)
23 125,000$ 26.4% 129,789$ 129,747$ (42)$ A+ / Aa3
11 42,000 8.9% 43,330 43,550 220 A / A2
7 14,000 3.0% 14,452 14,562 110 AA- / Aa2
1 50,000 10.6% 52,625 51,906 (719) NA
18 85,000 18.0% 88,155 88,528 373 A- / Baa1
5 20,000 4.2% 20,418 20,638 220 AA+ / Aaa
13 35,000 7.4% 35,873 36,227 354 BBB+ / A3
4 20,000 4.2% 20,423 20,652 229 BBB- / NA
25 82,000 17.3% 84,310 84,766 456 A+ / Aa2
107 473,000$ 100.00% 489,375$ 490,576$ 1,201$

Notes to Basic Financial Statements
(tabular dollar amounts are in thousands)
55
The outstanding forward contracts, summarized by counterparty as of December 31, 2017, were as follows:
Summary A summary of derivative instruments activity for the years ended December 31, 2018 and 2017 is as follows:
(9) Debt Refundings On February 28, 2018, the Authority issued the Homeownership Class I Series 2018AA Bonds in the aggregate principal amount of $73.1 million. The entire proceeds of the bonds were used to refund a portion of the Authority’s Homeownership Class Series 2017BB Bonds. The refunding was for the purpose of recycling the volume cap utilized for the issuance of the refunded 2017BB bonds. On May 9, 2018, the Authority issued Single Family Mortgage 2018 Series A, 2018 Series B-1 and 2018 Series B-2 Bonds in the aggregate principal amount of $87.5 million. Proceeds totaling $21.2 million of the bonds were used to refund the Authority’s Single Family Mortgage 2007 Series A-2 Bonds. The refunding resulted in a reduction of the projected interest rate on the refunded bonds, including any associated interest rate swaps outstanding on the refunded bonds as well as any swaps entered into in connection with the refunding bonds. Additionally, proceeds totaling $24.5 million of the bonds were used to refund a portion of the Authority’s Homeownership Class Series 2017BB Bonds. The refunding was for the purpose of recycling the volume cap utilized for the issuance of the refunded 2017BB bonds. On September 26, 2018, the Authority issued Federally Taxable Single Family Mortgage Class I Bonds 2018 Series D in the aggregate principal amount of $38.0 million. The entire proceeds of the bonds were used to refund all or a portion of the Authority’s Single Family Mortgage 2003 Series B-1, 2003 Series B-2, 2008 Series A-1 and 2008 Series A-2 Bonds. The
Count Par Exposure
Original Sales
Price
12/31/17
Premium Fair Value
Counterparty Rating
(S&P / Moody's)
23 97,000$ 23.9% 101,855$ 101,554$ (301)$ A+ / Aa3
14 34,000 8.4% 35,712 35,550 (162) A / A1
7 7,000 1.7% 7,434 7,399 (35) AA- / Aa2
23 94,000 23.2% 99,201 98,575 (626) A- / Baa1
1 45,000 11.1% 47,925 47,173 (752) AA+ / Aaa
27 67,000 16.5% 70,462 70,200 (262) BBB+ / A3
25 62,000 15.2% 64,975 64,835 (140) AA- / Aa2
120 406,000$ 100.00% 427,564$ 425,286$ (2,278)$
2018 2017
Hedging Investments Hedging Investments
Swaps Swaps Forwards Total Swaps Swaps Forwards Total
Fair value, beginning 67,442$ 5,879$ (2,278)$ 71,043$ 83,365$ 10,398$ (2,378)$ 91,385$
Settlements (9,566) (5,335) 2,278 (12,623) (20,363) (8,890) 2,378 (26,875)
Change in fair value (6,031) 1,438 1,201 (3,392) 4,440 4,371 (2,278) 6,533
Fair value, ending 51,845$ 1,982$ 1,201$ 55,028$ 67,442$ 5,879$ (2,278)$ 71,043$
Notes to Basic Financial Statements
(tabular dollar amounts are in thousands)
56
refunding resulted in a reduction of the projected interest rate on the refunded bonds, including the associated interest rate swaps outstanding on the refunded bonds. On March 28, 2018, the Authority issued Federally Taxable, Federally Multifamily/Project 2018 Series A-1 and 2018 Series A-2 Bonds in the aggregate principal amount of $91.3 million. The entire proceeds of the bonds were used to refund all or a portion of the Multifamily/Project Bonds 2003 Series A-1, 2003 Series A-2, 2004 Series A-1, 2005 Series A-1, 2005 Series B-1, 2006 Series A-1 and 2008 Series C-1. The refunding resulted in a reduction of the projected interest rate on the refunded bonds, including the associated interest rate swaps outstanding on the refunded bonds. On July 19, 2017, the Authority issued Federally Taxable Single Family Mortgage 2017 Series A Bonds in the aggregate principal amount of $52.0 million. Proceeds totaling $27.7 million of the bonds were used to refund a portion of the Authority’s Taxable Single Family Mortgage 2007 Series B-1 and 2007 Series B-3 Bonds. The refunding resulted in a reduction of the projected interest rate on the refunded bonds, including the associated interest rate swaps outstanding on the refunded bonds. On July 19, 2017, the Authority issued Federally Taxable Single Family Mortgage 2017 Series B-1 and 2017 Series B-2 Bonds in the aggregate principal amount of $20.9 million. The entire proceeds of the bonds were used to refund a portion of the Authority’s Taxable Single Family Mortgage 2007 Series B-1 Bonds. The refunding resulted in a reduction of the projected interest rate on the refunded bonds, including the associated interest rate swaps outstanding on the refunded bonds. On October 31, 2017, the Authority issued Single Family Mortgage 2017 Series D and 2017 Series E Bonds in the aggregate principal amount of $30.4 million. The entire proceeds of the bonds were used to refund a portion of the Authority’s Single Family Mortgage 2012 Series A-2 Bonds. The refunding resulted in a reduction of the projected interest rate on the refunded bonds, including any associated interest rate swaps outstanding on the refunded bonds as well as any swaps entered into in connection with the refunding bonds. (10) Fair Value Measurement The Authority categorizes its fair value measurements within the fair value hierarchy established by generally accepted accounting principles. The hierarchy is based on the valuation inputs used to measure the fair value of the assets and liabilities and gives the highest priority to Level 1 measurements and the lowest priority to Level 3 measurements. These measurements are described as follows: Level 1 – Unadjusted quoted prices for identical instruments in active markets. Level 2 – Quoted prices for similar instruments in active markets; quoted prices for identical or similar instruments in markets that are not active; and model-derived valuations in which all significant inputs are observable. Level 3 – Valuations derived from valuation techniques in which significant inputs are unobservable.

Notes to Basic Financial Statements
(tabular dollar amounts are in thousands)
57
The Authority has the following recurring fair value measurements as of December 31, 2018:
Investments and derivative instruments classified as Level 2 are valued using either bid evaluation or a matrix-based pricing technique. Bid evaluations are typically based on market quotations, yields, maturities, call features and ratings. Matrix pricing is used to value securities based on a securities’ relationship to benchmark quoted prices. As of December 31, 2018 the Authority held investments totaling $52.9 million that were not subject to the leveling hierarchy, these investments consisted of private, guaranteed investment contracts categorized as either investment agreements or repurchase agreements. Additionally, the Authority held investments in money market mutual funds and in an external governmental investment pool totaling $78.2 million and $8.5 million, respectively, which were not subject to the leveling hierarchy.
Quoted
Prices in
Active Significant
Markets for Other Significant
Identical Observable Unobservable
Assets Inputs Inputs
12/31/2018 (Level 1) (Level 2) (Level 3)
Investments by fair value level
U.S. government agencies 684,616$ 39,973$ 644,643$ -$
U.S. Treasuries 687 506 181 -
Total investments by fair value level 40,479$ 644,824$ -$
Other investments not subject to the leveling hierarchy
Investment agreements - uncollaterlized 42,920
Repurchase agreements 10,008
Money market mutual funds 78,238
External investment pools 8,466
Total investments 824,935$
Derivative instuments
Forward sale agreements 1,201$ 1,201$ -$
Hedging and investment derivatives 53,827 53,827 -
Total derivative instruments 55,028$ -$ 55,028$ -$
Fair Value Measurements Using

Notes to Basic Financial Statements
(tabular dollar amounts are in thousands)
58
The Authority has the following recurring fair value measurements as of December 31, 2017:
Investments and derivative instruments classified as Level 2 are valued using either bid evaluation or a matrix-based pricing technique. Bid evaluations are typically based on market quotations, yields, maturities, call features and ratings. Matrix pricing is used to value securities based on a securities’ relationship to benchmark quoted prices. As of December 31, 2017 the Authority held investments totaling $76.7 million that were not subject to the leveling hierarchy, these investments consisted of private, guaranteed investment contracts categorized as either investment agreements or repurchase agreements. Additionally, the Authority held investments in money market mutual funds and in an external governmental investment pool totaling $212.2 million and $7.6 million, respectively, which were not subject to the leveling hierarchy. (11) Restricted and Unrestricted Net Position The amounts restricted for the Single Family bond programs and the Multifamily/Business bond programs are for the payment of principal, redemption premium, if any, and interest, including net swap payments, on all outstanding single family and multifamily/business bond issues, in the event that no other funds are legally available for such payments. Such assets are segregated within the Single Family and Multifamily/Business bond programs and are held in cash, loans receivable and investments.
Quoted
Prices in
Active Significant
Markets for Other Significant
Identical Observable Unobservable
Assets Inputs Inputs
12/31/2017 (Level 1) (Level 2) (Level 3)
Investments by fair value level
U.S. government agencies 376,444$ 55,239$ 321,205$ -$
U.S. Treasuries 31,478 181 31,297 -
Total investments by fair value level 55,420$ 352,502$ -$
Other investments not subject to the leveling hierarchy
Investment agreements - uncollaterlized 66,271
Repurchase agreements 10,450
Money market mutual funds 212,223
External investment pools 7,629
Total investments 704,495$
Derivative instuments
Forward sale agreements (2,278)$ (2,278)$ -$
Hedging and investment derivatives 73,321 73,321 -
Total derivative instruments 71,043$ -$ 71,043$ -$
Fair Value Measurements Using

Notes to Basic Financial Statements
(tabular dollar amounts are in thousands)
59
The Board may authorize the withdrawal of all or part of this restricted balance if (1) updated cash flow projections indicate that adequate resources will exist after any withdrawal to service the outstanding debt, subject to approval by the bond trustee and the rating agency review; (2) the Authority determines that such funds are needed for the implementation or maintenance of any duly adopted program of the Authority; and (3) no default exists in the payment of the principal, redemption premium, if any, or interest on such bonds. The Board has designated certain amounts of the unrestricted net position of the General Programs as of December 31, 2018 and 2017, for various purposes, as indicated in the following table. These designations of net position are not binding, and can be changed by the Board.
Unrestricted Net Position for the years ended December 31, 2018 and 2017:
(12) Retirement Plans (a) Summary of Significant Accounting Policies Pensions – The Authority participates in the Local Government Division Trust Fund (LGDTF), a cost-sharing multiple-employer defined benefit pension fund administered by the Public Employees’ Retirement Association of Colorado (PERA). The net pension liability, deferred outflows of resources and deferred inflows of resources related to pensions, pension expense, information about the fiduciary net position and additions to/deductions from the fiduciary net position of the LGDTF have been determined using the economic resources measurement focus and the accrual basis of accounting. For this purpose, benefit payments (including refunds of employee contributions) are recognized when due and payable in accordance with the benefit terms. Investments are reported at fair value. During the 2018 legislative session, the Colorado General Assembly passed significant pension reform through Senate Bill (SB) 18-200: Concerning Modifications To the Public Employees’ Retirement Association Hybrid Defined Benefit Plan Necessary to Eliminate with a High Probability the Unfunded Liability of the Plan Within the Next Thirty Years. Governmental accounting standards require the net pension liability and related amounts of the LGDTF for financial reporting purposes be measured using the plan provisions in effect as of the LGDTF’s measurement date of December 31, 2017. As such, the following disclosures do not include the changes to plan provisions required by SB 18-200 with the exception of the section titled Changes between the measurement date of the net pension liability and December 31, 2018. (b) General Information about the Pension Plan Plan description – Eligible employees of the Authority are provided with pensions through the LGDTF. Plan benefits are specified in Title 24, Article 51 of the Colorado Revised Statutes (C.R.S.), administrative rules set forth at 8 C.C.R. 1502-1, and applicable provisions of the federal Internal Revenue Code. Colorado State law provisions may be amended from time
2018 2017
Designations:
Housing lending program 210,101$ 170,191$
Commerical lending program 7,179 6,821
General operating and working capital reserves 29,471 28,837
Debt reserves 59,241 47,534
Total general programs unrestricted net position 305,992$ 253,383$

Notes to Basic Financial Statements
(tabular dollar amounts are in thousands)
60
to time by the Colorado General Assembly. PERA issues a publicly available comprehensive annual financial report that can be obtained at www.copera.org/investments/pera-financial-reports. Benefits provided – PERA provides retirement, disability and survivor benefits. Retirement benefits are determined by the amount of service credit earned and/or purchased, highest average salary, the benefit structure(s) under which the member retires, the benefit option selected at retirement, and age at retirement. Retirement eligibility is specified in tables set forth at C.R.S. § 24-51-602, 604, 1713, and 1714. The lifetime retirement benefit for all eligible retiring employees under the PERA Benefit Structure is the greater of the:
• Highest average salary multiplied by 2.5% and then multiplied by years of service credit
• The value of the retiring employee’s member contribution account plus a 100% match on eligible amounts as of the retirement date. This amount is then annuitized into a monthly benefit based on life expectancy and other actuarial factors.
In all cases the service retirement benefit is limited to 100% of highest average salary and also cannot exceed the maximum benefit allowed by federal Internal Revenue Code. Members may elect to withdraw their member contribution accounts upon termination of employment with all PERA employers; waiving rights to any lifetime retirement benefits earned. If eligible, the member may receive a match of either 50% or 100% on eligible amounts depending on when contributions were remitted to PERA, the date employment was terminated, whether five years of service credit has been obtained and the benefit structure under which contributions were made. Benefit recipients who elect to receive a lifetime retirement benefit are generally eligible to receive post-retirement cost-of-living adjustments (COLAs), referred to as annual increases in the C.R.S. Benefit recipients under the PERA benefit structure who began eligible employment before January 1, 2007 receive an annual increase of 2%, unless PERA has a negative investment year, in which case the annual increase for the next three years is the lesser of 2% or the average of the Consumer Price Index for Urban Wage Earners and Clerical Workers (CPI-W) for the prior calendar year. Benefit recipients under the PERA benefit structure who began eligible employment after January 1, 2007 receive an annual increase of the lesser of 2% or the average CPI-W for the prior calendar year, not to exceed 10% of PERA’s Annual Increase Reserve for the LGDTF. Disability benefits are available for eligible employees once they reach five years of earned service credit and are determined to meet the definition of disability. The disability benefit amount is based on the retirement benefit formula shown above considering a minimum of 20 years of service credit, if deemed disabled. Survivor benefits are determined by several factors, which include the amount of earned service credit, highest average salary of the deceased, the benefit structure(s) under which service credit was obtained, and the qualified survivor(s) who will receive the benefits.
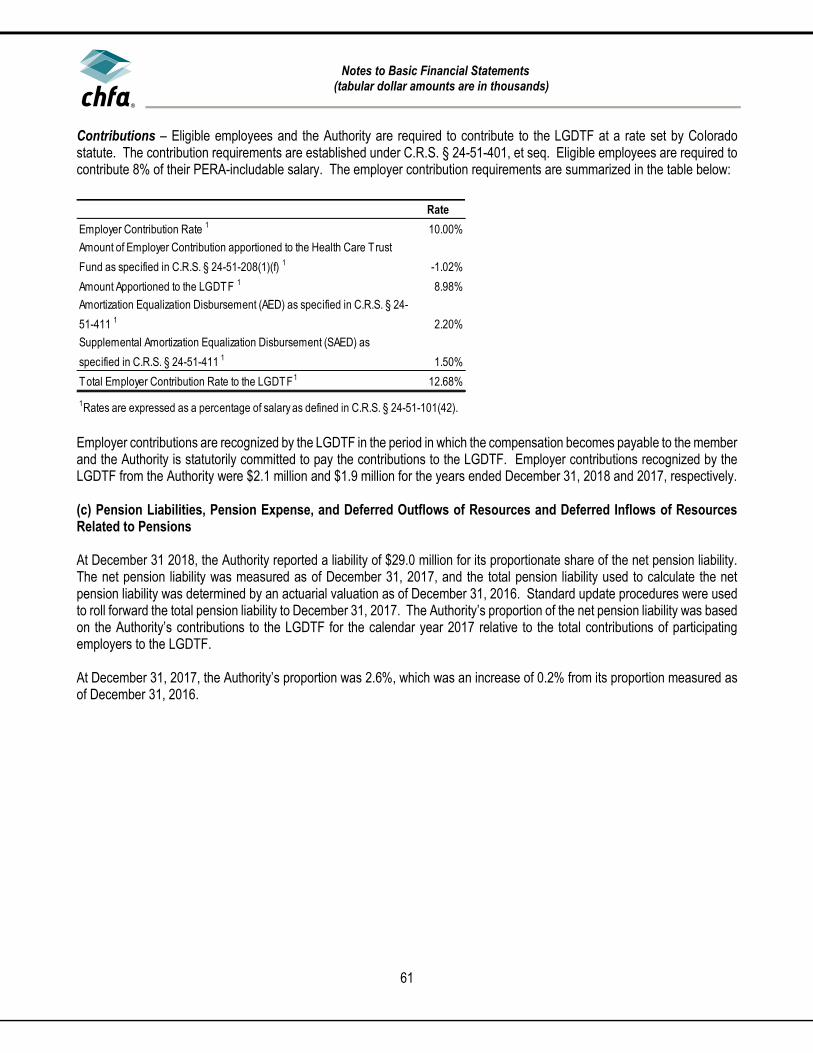
Notes to Basic Financial Statements
(tabular dollar amounts are in thousands)
61
Contributions – Eligible employees and the Authority are required to contribute to the LGDTF at a rate set by Colorado statute. The contribution requirements are established under C.R.S. § 24-51-401, et seq. Eligible employees are required to contribute 8% of their PERA-includable salary. The employer contribution requirements are summarized in the table below:
Employer contributions are recognized by the LGDTF in the period in which the compensation becomes payable to the member and the Authority is statutorily committed to pay the contributions to the LGDTF. Employer contributions recognized by the LGDTF from the Authority were $2.1 million and $1.9 million for the years ended December 31, 2018 and 2017, respectively. (c) Pension Liabilities, Pension Expense, and Deferred Outflows of Resources and Deferred Inflows of Resources Related to Pensions At December 31 2018, the Authority reported a liability of $29.0 million for its proportionate share of the net pension liability. The net pension liability was measured as of December 31, 2017, and the total pension liability used to calculate the net pension liability was determined by an actuarial valuation as of December 31, 2016. Standard update procedures were used to roll forward the total pension liability to December 31, 2017. The Authority’s proportion of the net pension liability was based on the Authority’s contributions to the LGDTF for the calendar year 2017 relative to the total contributions of participating employers to the LGDTF. At December 31, 2017, the Authority’s proportion was 2.6%, which was an increase of 0.2% from its proportion measured as of December 31, 2016.
Rate
Employer Contribution Rate 1 10.00%
Amount of Employer Contribution apportioned to the Health Care Trust
Fund as specified in C.R.S. § 24-51-208(1)(f) 1 -1.02%
Amount Apportioned to the LGDTF 1 8.98%
Amortization Equalization Disbursement (AED) as specified in C.R.S. § 24-
51-411 1 2.20%
Supplemental Amortization Equalization Disbursement (SAED) as
specified in C.R.S. § 24-51-411 1 1.50%
Total Employer Contribution Rate to the LGDTF1 12.68%
1Rates are expressed as a percentage of salary as defined in C.R.S. § 24-51-101(42).

Notes to Basic Financial Statements
(tabular dollar amounts are in thousands)
62
For the year ended December 31, 2018, the Authority recognized pension expense of $3.8 million. At December 31, 2018, the Authority reported deferred outflows of resources and deferred inflows of resources related to pensions from the following sources:
The $2.2 million reported as deferred outflows of resources related to pensions, resulting from contributions subsequent to the measurement date, will be recognized as a reduction of the net pension liability in the year ended December 31, 2019. Other amounts reported as deferred outflows of resources and deferred inflows of resources related to pensions will be recognized in pension expense as follows:
Deferred Outflow
of Resources
Deferred Inflow
of Resources
Difference between expected and actual experience 964$ -$
Change of assumptions or other inputs 151 -
Net difference between projected and actual earnings on
pension plan investments 1,905 6,692
Changes in proportion and differences between contributions
recognized and proportionate share of contributions 1,514 -
Contributions subsequent to the measurement date 2,203 n/a
Total 6,737$ 6,692$
Years Ending
December 31, Pension Expense
2019 1,710$
2020 (552)
2021 (1,643)
2022 (1,673)
2023 -
Thereafter -

Notes to Basic Financial Statements
(tabular dollar amounts are in thousands)
63
Actuarial assumptions – The total pension liability in the December 31, 2016 actuarial valuation was determined using the following actuarial cost method, actuarial assumptions and other inputs:
Healthy mortality assumptions for active members reflect the RP-2014 White Collar Employee Mortality Table, a table specifically developed for actively working people. To allow for an appropriate margin of improved mortality prospectively, the mortality rates incorporate a 70% factor applied to male rates and a 55% factor applied to female rates. Healthy, post-retirement mortality assumptions reflect the RP-2014 Healthy Annuitant Mortality Table, adjusted as follows:
• Males: Mortality improvement projected to 2018 using the MP-2015 projection scale, a 73% factor applied to rates for ages less than 80, a 108% factor applied to rates for ages 80 and above, and further adjustments for credibility.
• Females: Mortality improvement projected to 2020 using the MP-2015 projection scale, a 78% factor applied to rates for ages less than 80, a 109% factor applied to rates for ages 80 and above, and further adjustments for credibility.
For disabled retirees, the mortality assumption was changed to reflect 90% of the RP-2014 Disabled Retiree Mortality Table. The actuarial assumptions used in the December 31, 2016, valuations were based on the results of the 2016 experience analysis for the periods January 1, 2012, through December 31, 2015, as well as, the October 28, 2016, actuarial assumptions workshop and were adopted by the PERA Board during the November 18, 2016, Board meeting. The long-term expected return on plan assets is reviewed as part of regular experience studies prepared every four or five years for PERA. Recently, this assumption has been reviewed more frequently. The most recent analyses were outlined in presentations to PERA’s Board on October 28, 2016. Several factors were considered in evaluating the long-term rate of return assumption for the LGDTF, including long-term historical data, estimates inherent in current market data, and a log-normal distribution analysis in which best-estimate ranges of expected future real rates of return (expected return, net of investment expense and inflation) were developed by the investment consultant for each major asset class. These ranges were combined to produce the long-term expected rate of return by weighting the expected future real rates of return by the target asset allocation percentage and then adding expected inflation.
Actuarial cost method Entry age
Price inflation 2.40%
Real wage growth 1.10%
Wage inflation 3.50%
Salary increases, including wage inflation 3.50% - 10.45%
Long-term investment rate of return, net of pension
plan investment expenses, including price inflation 7.25%
Discount Rate 7.25%
Post-retirement benefit increases:
PERA benefit structure hired prior to 1/1/07 2.00%
PERA benefit structure hired after 12/31/06
(ad hoc, substantively automatic) Financed by the Annual Increase Reserve

Notes to Basic Financial Statements
(tabular dollar amounts are in thousands)
64
As of the most recent adoption of the long-term expected rate of return by the PERA Board, the target asset allocation and best estimates of geometric real rates of return for each major asset class are summarized in the following table:
In setting the long-term expected rate of return, projections employed to model future returns provide a range of expected long-term returns that, including expected inflation, ultimately support a long-term expected rate of return assumption of 7.25%. Discount rate – The discount rate used to measure the total pension liability was 7.25%. The projection of cash flows used to determine the discount rate applied the actuarial cost method and assumptions shown above. In addition, the following methods and assumptions were used in the projection of cash flows:
• Total covered payroll for the initial projection year consists of the covered payroll of the active membership present on the valuation date and the covered payroll of future plan members assumed to be hired during the year. In subsequent projection years, total covered payroll was assumed to increase annually at a rate of 3.50%.
• Employee contributions were assumed to be made at the current member contribution rate. Employee contributions for future plan members were used to reduce the estimated amount of total service costs for future plan members.
• Employer contributions were assumed to be made at rates equal to the fixed statutory rates specified in law and effective as of the measurement date, including current and estimated future AED and SAED, until the Actuarial Value Funding Ratio reaches 103%, at which point, the AED and SAED will each drop 0.50% every year until they are zero. Additionally, estimated employer contributions included reductions for the funding of the AIR and retiree health care benefits. For future plan members, employer contributions were further reduced by the estimated amount of total service costs for future plan members not financed by their member contributions.
• Employer contributions and the amount of total service costs for future plan members were based upon a process used by the plan to estimate future actuarially determined contributions assuming an analogous future plan member growth rate.
• The AIR balance was excluded from the initial fiduciary net position, as, per statute, AIR amounts cannot be used to pay benefits until transferred to either the retirement benefits reserve or the survivor benefits reserve, as appropriate.
30 Year Expected Geometric
Asset Class Target Allocation Real rate of Return *
U.S. Equity – Large Cap 21.20% 4.30%
U.S. Equity – Small Cap 7.42% 4.80%
Non U.S. Equity – Developed 18.55% 5.20%
Non U.S. Equity – Emerging 5.83% 5.40%
Core Fixed Income 19.32% 1.20%
High Yield 1.38% 4.30%
Non U.S. Fixed Income - Developed 1.84% 0.60%
Emerging Market Debt 0.46% 3.90%
Core Real Estate 8.50% 4.90%
Opportunity Fund 6.00% 3.80%
Private Equity 8.50% 6.60%
Cash 1.00% 0.20%
Total 100.00%
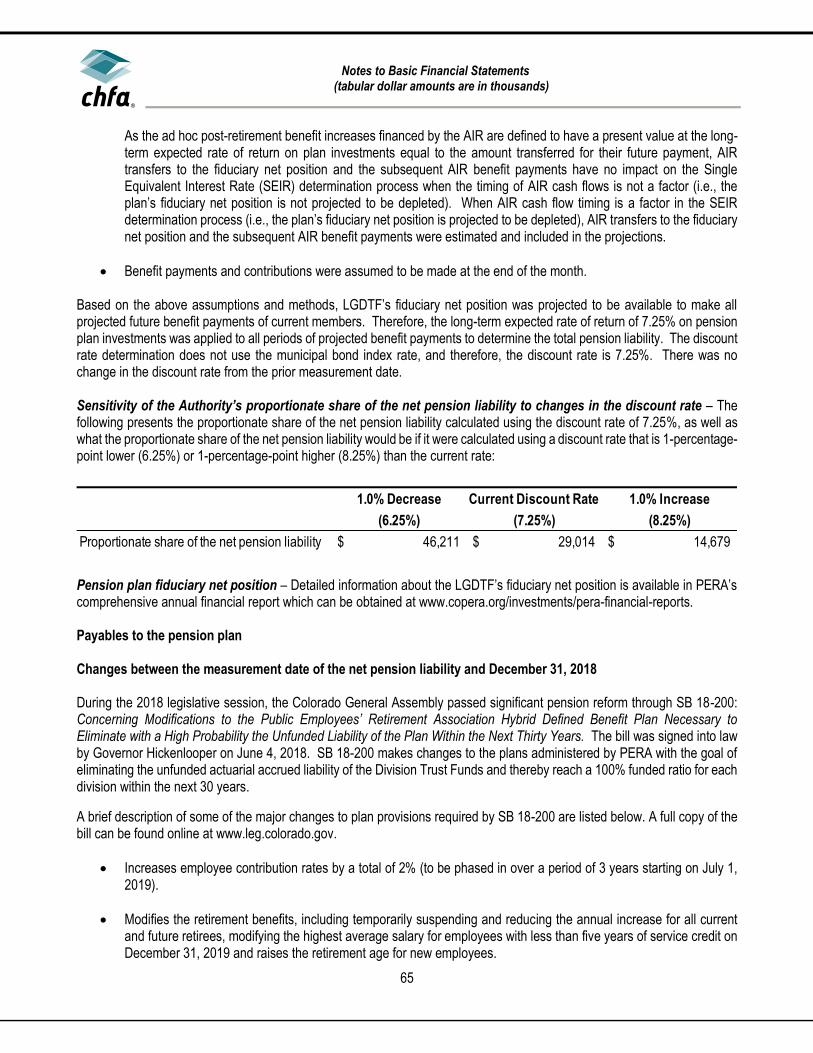
Notes to Basic Financial Statements
(tabular dollar amounts are in thousands)
65
As the ad hoc post-retirement benefit increases financed by the AIR are defined to have a present value at the long-term expected rate of return on plan investments equal to the amount transferred for their future payment, AIR transfers to the fiduciary net position and the subsequent AIR benefit payments have no impact on the Single Equivalent Interest Rate (SEIR) determination process when the timing of AIR cash flows is not a factor (i.e., the plan’s fiduciary net position is not projected to be depleted). When AIR cash flow timing is a factor in the SEIR determination process (i.e., the plan’s fiduciary net position is projected to be depleted), AIR transfers to the fiduciary net position and the subsequent AIR benefit payments were estimated and included in the projections.
• Benefit payments and contributions were assumed to be made at the end of the month. Based on the above assumptions and methods, LGDTF’s fiduciary net position was projected to be available to make all projected future benefit payments of current members. Therefore, the long-term expected rate of return of 7.25% on pension plan investments was applied to all periods of projected benefit payments to determine the total pension liability. The discount rate determination does not use the municipal bond index rate, and therefore, the discount rate is 7.25%. There was no change in the discount rate from the prior measurement date. Sensitivity of the Authority’s proportionate share of the net pension liability to changes in the discount rate – The following presents the proportionate share of the net pension liability calculated using the discount rate of 7.25%, as well as what the proportionate share of the net pension liability would be if it were calculated using a discount rate that is 1-percentage-point lower (6.25%) or 1-percentage-point higher (8.25%) than the current rate:
Pension plan fiduciary net position – Detailed information about the LGDTF’s fiduciary net position is available in PERA’s comprehensive annual financial report which can be obtained at www.copera.org/investments/pera-financial-reports. Payables to the pension plan Changes between the measurement date of the net pension liability and December 31, 2018 During the 2018 legislative session, the Colorado General Assembly passed significant pension reform through SB 18-200: Concerning Modifications to the Public Employees’ Retirement Association Hybrid Defined Benefit Plan Necessary to Eliminate with a High Probability the Unfunded Liability of the Plan Within the Next Thirty Years. The bill was signed into law by Governor Hickenlooper on June 4, 2018. SB 18-200 makes changes to the plans administered by PERA with the goal of eliminating the unfunded actuarial accrued liability of the Division Trust Funds and thereby reach a 100% funded ratio for each division within the next 30 years.
A brief description of some of the major changes to plan provisions required by SB 18-200 are listed below. A full copy of the bill can be found online at www.leg.colorado.gov.
• Increases employee contribution rates by a total of 2% (to be phased in over a period of 3 years starting on July 1, 2019).
• Modifies the retirement benefits, including temporarily suspending and reducing the annual increase for all current and future retirees, modifying the highest average salary for employees with less than five years of service credit on December 31, 2019 and raises the retirement age for new employees.
1.0% Decrease Current Discount Rate 1.0% Increase
(6.25%) (7.25%) (8.25%)
Proportionate share of the net pension liability 46,211$ 29,014$ 14,679$
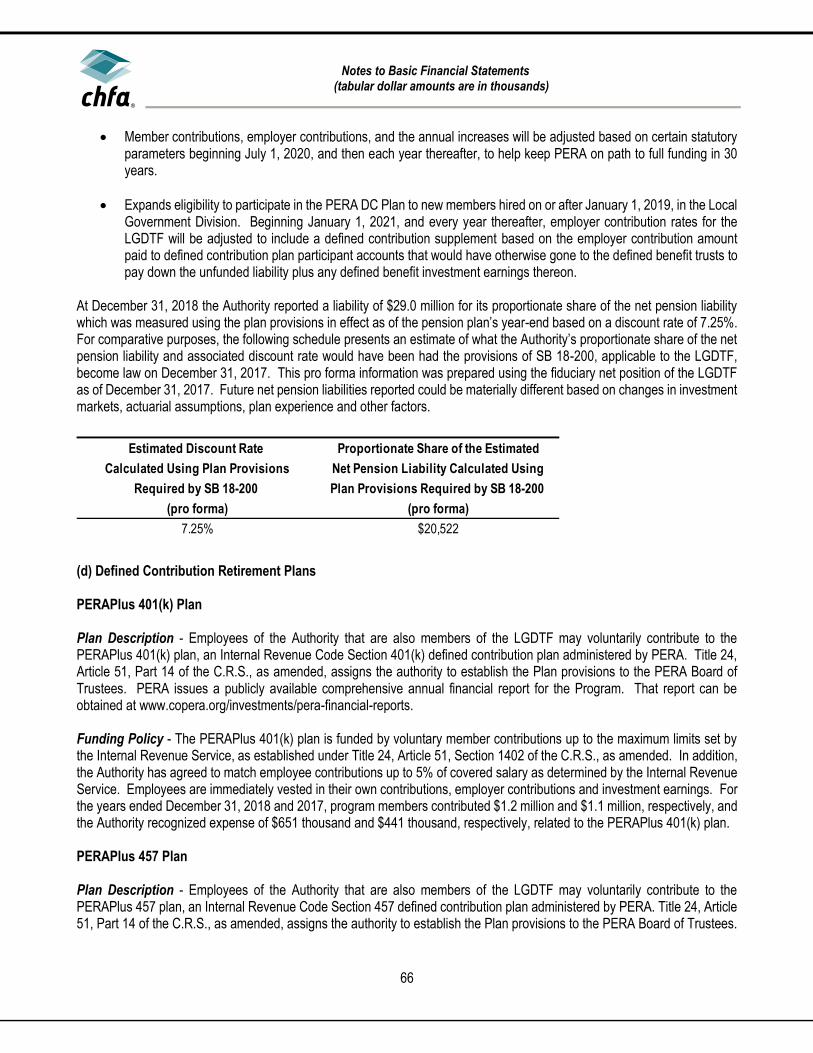
Notes to Basic Financial Statements
(tabular dollar amounts are in thousands)
66
• Member contributions, employer contributions, and the annual increases will be adjusted based on certain statutory parameters beginning July 1, 2020, and then each year thereafter, to help keep PERA on path to full funding in 30 years.
• Expands eligibility to participate in the PERA DC Plan to new members hired on or after January 1, 2019, in the Local Government Division. Beginning January 1, 2021, and every year thereafter, employer contribution rates for the LGDTF will be adjusted to include a defined contribution supplement based on the employer contribution amount paid to defined contribution plan participant accounts that would have otherwise gone to the defined benefit trusts to pay down the unfunded liability plus any defined benefit investment earnings thereon.
At December 31, 2018 the Authority reported a liability of $29.0 million for its proportionate share of the net pension liability which was measured using the plan provisions in effect as of the pension plan’s year-end based on a discount rate of 7.25%. For comparative purposes, the following schedule presents an estimate of what the Authority’s proportionate share of the net pension liability and associated discount rate would have been had the provisions of SB 18-200, applicable to the LGDTF, become law on December 31, 2017. This pro forma information was prepared using the fiduciary net position of the LGDTF as of December 31, 2017. Future net pension liabilities reported could be materially different based on changes in investment markets, actuarial assumptions, plan experience and other factors.
(d) Defined Contribution Retirement Plans PERAPlus 401(k) Plan Plan Description - Employees of the Authority that are also members of the LGDTF may voluntarily contribute to the PERAPlus 401(k) plan, an Internal Revenue Code Section 401(k) defined contribution plan administered by PERA. Title 24, Article 51, Part 14 of the C.R.S., as amended, assigns the authority to establish the Plan provisions to the PERA Board of Trustees. PERA issues a publicly available comprehensive annual financial report for the Program. That report can be obtained at www.copera.org/investments/pera-financial-reports. Funding Policy - The PERAPlus 401(k) plan is funded by voluntary member contributions up to the maximum limits set by the Internal Revenue Service, as established under Title 24, Article 51, Section 1402 of the C.R.S., as amended. In addition, the Authority has agreed to match employee contributions up to 5% of covered salary as determined by the Internal Revenue Service. Employees are immediately vested in their own contributions, employer contributions and investment earnings. For the years ended December 31, 2018 and 2017, program members contributed $1.2 million and $1.1 million, respectively, and the Authority recognized expense of $651 thousand and $441 thousand, respectively, related to the PERAPlus 401(k) plan. PERAPlus 457 Plan Plan Description - Employees of the Authority that are also members of the LGDTF may voluntarily contribute to the PERAPlus 457 plan, an Internal Revenue Code Section 457 defined contribution plan administered by PERA. Title 24, Article 51, Part 14 of the C.R.S., as amended, assigns the authority to establish the Plan provisions to the PERA Board of Trustees.
Estimated Discount Rate Proportionate Share of the Estimated
Calculated Using Plan Provisions Net Pension Liability Calculated Using
Required by SB 18-200 Plan Provisions Required by SB 18-200
(pro forma) (pro forma)
7.25% $20,522

Notes to Basic Financial Statements
(tabular dollar amounts are in thousands)
67
PERA issues a publicly available comprehensive annual financial report for the Program. That report can be obtained at www.copera.org/investments/pera-financial-reports. Funding Policy - The PERAPlus 457 plan is funded by voluntary member contributions up to the maximum limits set by the Internal Revenue Service, as established under Title 24, Article 51, Section 1402 of the C.R.S., as amended. The Authority does not match employee contributions. Employees are immediately vested in their own contributions and investment earnings. For the years ended December 31, 2018 and 2017, program members contributed $87 thousand and $63 thousand, respectively. (e) Other Post-Employment Benefits Defined Benefit Other Post Employment Benefit (OPEB) Plan Summary of Significant Accounting Policies OPEB - The Authority participates in the Health Care Trust Fund (HCTF), a cost-sharing multiple-employer defined benefit OPEB fund administered PERA. The net OPEB liability, deferred outflows of resources and deferred inflows of resources related to OPEB, OPEB expense, information about the fiduciary net position and additions to/deductions from the fiduciary net position of the HCTF have been determined using the economic resources measurement focus and the accrual basis of accounting. For this purpose, benefits paid on behalf of health care participants are recognized when due and/or payable in accordance with the benefit terms. Investments are reported at fair value. General Information about the OPEB Plan Plan description - Eligible employees of the Authority are provided with OPEB through the HCTF. The HCTF is established under Title 24, Article 51, Part 12 of the Colorado Revised Statutes (C.R.S.), as amended. Colorado State law provisions may be amended from time to time by the Colorado General Assembly. Title 24, Article 51, Part 12 of the C.R.S., as amended, sets forth a framework that grants authority to the PERA Board to contract, self-insure, and authorize disbursements necessary in order to carry out the purposes of the PERACare program, including the administration of the premium subsidies. Colorado State law provisions may be amended from time to time by the Colorado General Assembly. PERA issues a publicly available comprehensive annual financial report that can be obtained at www.copera.org/investments/pera-financial-reports. Benefits provide - The HCTF provides a health care premium subsidy to eligible participating PERA benefit recipients and retirees who choose to enroll in one of the PERA health care plans, however, the subsidy is not available if only enrolled in the dental and/or vision plan(s). The health care premium subsidy is based upon the benefit structure under which the member retires and the member’s years of service credit. For members who retire having service credit with employers in the Denver Public Schools (DPS) Division and one or more of the other four Divisions (State, School, Local Government and Judicial), the premium subsidy is allocated between the HCTF and the Denver Public Schools Health Care Trust Fund (DPS HCTF). The basis for the amount of the premium subsidy funded by each trust fund is the percentage of the member contribution account balance from each division as it relates to the total member contribution account balance from which the retirement benefit is paid. C.R.S. § 24-51-1202 et seq. specifies the eligibility for enrollment in the health care plans offered by PERA and the amount of the premium subsidy. The law governing a benefit recipient’s eligibility for the subsidy and the amount of the subsidy differs slightly depending under which benefit structure the benefits are calculated. All benefit recipients under the PERA benefit structure and all retirees under the DPS benefit structure are eligible for a premium subsidy, if enrolled in a health care plan under PERACare. Upon the death of a DPS benefit structure retiree, no further subsidy is paid.

Notes to Basic Financial Statements
(tabular dollar amounts are in thousands)
68
Enrollment in the PERACare is voluntary and is available to benefit recipients and their eligible dependents, certain surviving spouses, and divorced spouses and guardians, among others. Eligible benefit recipients may enroll into the program upon retirement, upon the occurrence of certain life events, or on an annual basis during an open enrollment period. OPEB Benefit Structure - The maximum service-based premium subsidy is $230 per month for benefit recipients who are under 65 years of age and who are not entitled to Medicare; the maximum service-based subsidy is $115 per month for benefit recipients who are 65 years of age or older or who are under 65 years of age and entitled to Medicare. The basis for the maximum service-based subsidy, in each case, is for benefit recipients with retirement benefits based on 20 or more years of service credit. There is a 5% reduction in the subsidy for each year less than 20. The benefit recipient pays the remaining portion of the premium to the extent the subsidy does not cover the entire amount. For benefit recipients who have not participated in Social Security and who are not otherwise eligible for premium-free Medicare Part A for hospital-related services, C.R.S. § 24-51-1206(4) provides an additional subsidy. According to the statute, PERA cannot charge premiums to benefit recipients without Medicare Part A that are greater than premiums charged to benefit recipients with Part A for the same plan option, coverage level, and service credit. Currently, for each individual PERACare enrollee, the total premium for Medicare coverage is determined assuming plan participants have both Medicare Part A and Part B and the difference in premium cost is paid by the HCTF or the DPS HCTF on behalf of benefit recipients not covered by Medicare Part A. Contributions - Pursuant to Title 24, Article 51, Section 208(1)(f) of the C.R.S., as amended, certain contributions are apportioned to the HCTF. PERA-affiliated employers of the State, School, Local Government, and Judicial Divisions are required to contribute at a rate of 1.02% of PERA-includable salary into the HCTF. Employer contributions are recognized by the HCTF in the period in which the compensation becomes payable to the member and the Authority is statutorily committed to pay the contributions. Employer contributions recognized by the HCTF from the Authority were $168 thousand and $149 thousand for the years ended December 31, 2018 and 2017. OPEB Liabilities, OPEB Expense, and Deferred Outflows of Resources and Deferred Inflows of Resources Related to OPEB At December 31, 2018 the Authority reported a liability of $2.6 million for its proportionate share of the net OPEB liability. The net OPEB liability for the HCTF was measured as of December 31, 2017, and the total OPEB liability used to calculate the net OPEB liability was determined by an actuarial valuation as of December 31, 2016. Standard update procedures were used to roll-forward the total OPEB liability to December 31, 2017. The Authority’s proportion of the net OPEB liability was based on the Authority’s contributions to the HCTF for the calendar year 2017 relative to the total contributions of participating employers to the HCTF. At December 31, 2017, the Authority’s proportion was 0.20%, which was an increase of 0.02% from its proportion measured as of December 31, 2016.

Notes to Basic Financial Statements
(tabular dollar amounts are in thousands)
69
For the year ended December 31, 2018 the Authority recognized OPEB expense of $72 thousand. At December 31, 2018, the Authority reported deferred outflows of resources and deferred inflows of resources related to OPEB from the following sources:
The $164 thousand reported as deferred outflows of resources related to OPEB, resulting from contributions subsequent to the measurement date, will be recognized as a reduction of the net OPEB liability in the year ended December 31, 2019. Other amounts reported as deferred outflows of resources and deferred inflows of resources related to OPEB will be recognized in OPEB expense as follows:
Deferred Outflow
of Resources
Deferred Inflow
of Resources
Difference between expected and actual experience 10$ -$
Change of assumptions or other inputs - -
Net difference between projected and actual earnings on
pension plan investments - 35
Changes in proportion and differences between contributions
recognized and proportionate share of contributions 190 1
Contributions subsequent to the measurement date 164 n/a
Total 364$ 36$
Years Ending
December 31, Pension Expense
2019 30$
2020 30
2021 30
2022 30
2023 39
Thereafter 3

Notes to Basic Financial Statements
(tabular dollar amounts are in thousands)
70
Actuarial assumptions - The total OPEB liability in the December 31, 2016 actuarial valuation was determined using the following actuarial cost method, actuarial assumptions and other inputs:
Calculations are based on the benefits provided under the terms of the substantive plan in effect at the time of each actuarial valuation and on the pattern of sharing of costs between employers of each fund to that point. Health care cost trend rates reflect the change in per capita health costs over time due to factors such as medical inflation, utilization, plan design, and technology improvements. For the PERA benefit structure, health care cost trend rates are needed to project the future costs associated with providing benefits to those PERACare enrollees not eligible for premium-free Medicare Part A. Health care cost trend rates for the PERA benefit structure are based on published annual health care inflation surveys in conjunction with actual plan experience (if credible), building block models and heuristics developed by health plan actuaries and administrators, and projected trends for the Federal Hospital Insurance Trust Fund (Medicare Part A premiums) provided by the Centers for Medicare & Medicaid Services. Effective December 31, 2016, the health care cost trend rates for Medicare Part A premiums were revised to reflect the current expectation of future increases in rates of inflation applicable to Medicare Part A premiums.
Actuarial cost method Entry age
Price inflation 2.40%
Real wage growth 1.10%
Wage inflation 3.50%
Salary increases, including wage inflation 3.50% in aggregate
Long-term investment rate of return, net of pension
plan investment expenses, including price inflation 7.25%
Discount Rate 7.25%
Health care cost trend rates
PERA benefit structure:
Service-based premium subsidy 0.00%
PERACare Medicare plans 5.00%
Medicare Part A premiums 3.00% for 2017,
gradually rising to 4.25% in 2023
DPS benefit structure:
Service-based premium subsidy 0.00%
PERACare Medicare plans N/A
Medicare Part A premiums N/A
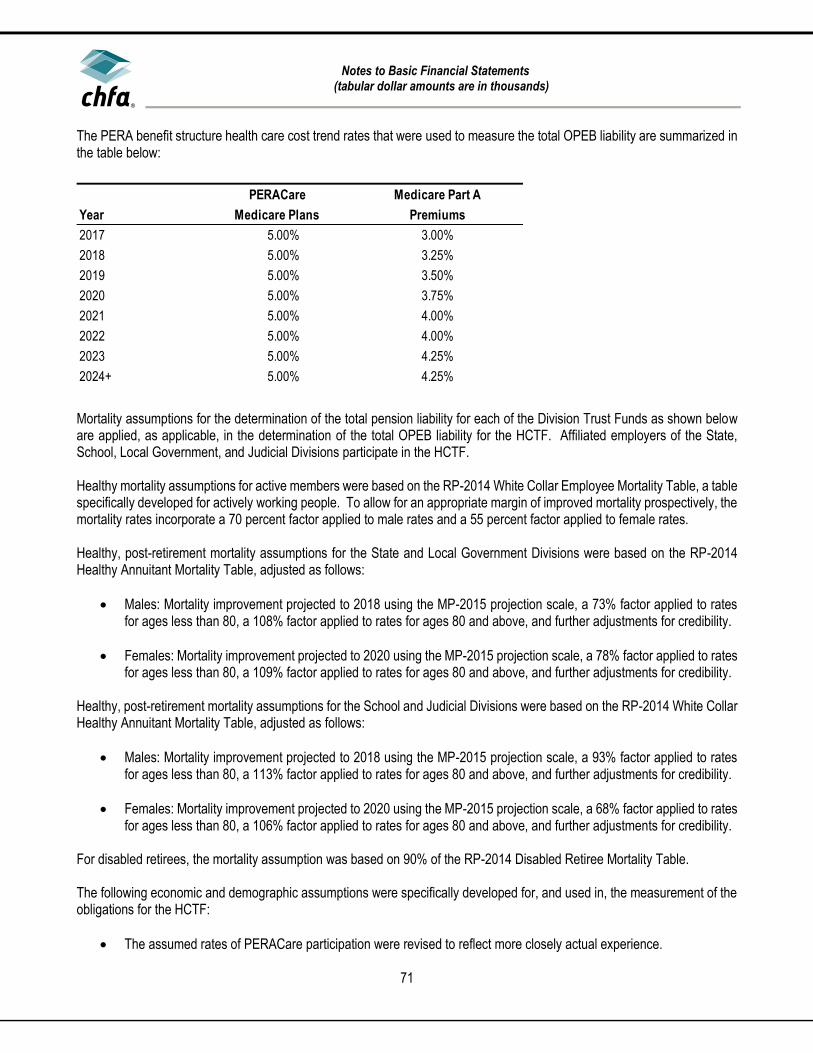
Notes to Basic Financial Statements
(tabular dollar amounts are in thousands)
71
The PERA benefit structure health care cost trend rates that were used to measure the total OPEB liability are summarized in the table below:
Mortality assumptions for the determination of the total pension liability for each of the Division Trust Funds as shown below are applied, as applicable, in the determination of the total OPEB liability for the HCTF. Affiliated employers of the State, School, Local Government, and Judicial Divisions participate in the HCTF. Healthy mortality assumptions for active members were based on the RP-2014 White Collar Employee Mortality Table, a table specifically developed for actively working people. To allow for an appropriate margin of improved mortality prospectively, the mortality rates incorporate a 70 percent factor applied to male rates and a 55 percent factor applied to female rates. Healthy, post-retirement mortality assumptions for the State and Local Government Divisions were based on the RP-2014 Healthy Annuitant Mortality Table, adjusted as follows:
• Males: Mortality improvement projected to 2018 using the MP-2015 projection scale, a 73% factor applied to rates for ages less than 80, a 108% factor applied to rates for ages 80 and above, and further adjustments for credibility.
• Females: Mortality improvement projected to 2020 using the MP-2015 projection scale, a 78% factor applied to rates for ages less than 80, a 109% factor applied to rates for ages 80 and above, and further adjustments for credibility.
Healthy, post-retirement mortality assumptions for the School and Judicial Divisions were based on the RP-2014 White Collar Healthy Annuitant Mortality Table, adjusted as follows:
• Males: Mortality improvement projected to 2018 using the MP-2015 projection scale, a 93% factor applied to rates for ages less than 80, a 113% factor applied to rates for ages 80 and above, and further adjustments for credibility.
• Females: Mortality improvement projected to 2020 using the MP-2015 projection scale, a 68% factor applied to rates for ages less than 80, a 106% factor applied to rates for ages 80 and above, and further adjustments for credibility.
For disabled retirees, the mortality assumption was based on 90% of the RP-2014 Disabled Retiree Mortality Table. The following economic and demographic assumptions were specifically developed for, and used in, the measurement of the obligations for the HCTF:
• The assumed rates of PERACare participation were revised to reflect more closely actual experience.
PERACare Medicare Part A
Year Medicare Plans Premiums
2017 5.00% 3.00%
2018 5.00% 3.25%
2019 5.00% 3.50%
2020 5.00% 3.75%
2021 5.00% 4.00%
2022 5.00% 4.00%
2023 5.00% 4.25%
2024+ 5.00% 4.25%

Notes to Basic Financial Statements
(tabular dollar amounts are in thousands)
72
• Initial per capita health care costs for those PERACare enrollees under the PERA benefit structure who are expected to attain age 65 and older ages and are not eligible for premium-free Medicare Part A benefits were updated to reflect the change in costs for the 2017 plan year.
• The percentages of PERACare enrollees who will attain age 65 and older ages and are assumed to not qualify for premium-free Medicare Part A coverage were revised to more closely reflect actual experience.
• The percentage of disabled PERACare enrollees who are assumed to not qualify for premium-free Medicare Part A coverage were revised to reflect more closely actual experience.
• Assumed election rates for the PERACare coverage options that would be available to future PERACare enrollees who will qualify for the “No Part A Subsidy” when they retire were revised to more closely reflect actual experience.
• Assumed election rates for the PERACare coverage options that will be available to those current PERACare enrollees, who qualify for the “No Part A Subsidy” but have not reached age 65, were revised to more closely reflect actual experience.
• The health care cost trend rates for Medicare Part A premiums were revised to reflect the then-current expectation of future increases in rates of inflation applicable to Medicare Part A premiums.
• The rates of PERAcare coverage election for spouses of eligible inactive members and future retirees were revised to more closely reflect actual experience.
• The assumed age differences between future retirees and their participating spouses were revised to reflect more closely actual experience.
The actuarial assumptions used in the December 31, 2016, valuations were based on the results of the 2016 experience analysis for the periods January 1, 2012, through December 31, 2015, as well as, the October 28, 2016, actuarial assumptions workshop and were adopted by the PERA Board during the November 18, 2016, Board meeting. In addition, certain actuarial assumptions pertaining to per capita health care costs and their related trends are analyzed and reviewed by PERA’s actuary, as needed. The long-term expected return on plan assets is reviewed as part of regular experience studies prepared every four or five years for PERA. Recently, this assumption has been reviewed more frequently. The most recent analyses were outlined in presentations to PERA’s Board on October 28, 2016. Several factors were considered in evaluating the long-term rate of return assumption for the HCTF, including long-term historical data, estimates inherent in current market data, and a log-normal distribution analysis in which best-estimate ranges of expected future real rates of return (expected return, net of investment expense and inflation) were developed for each major asset class. These ranges were combined to produce the long-term expected rate of return by weighting the expected future real rates of return by the target asset allocation percentage and then adding expected inflation.
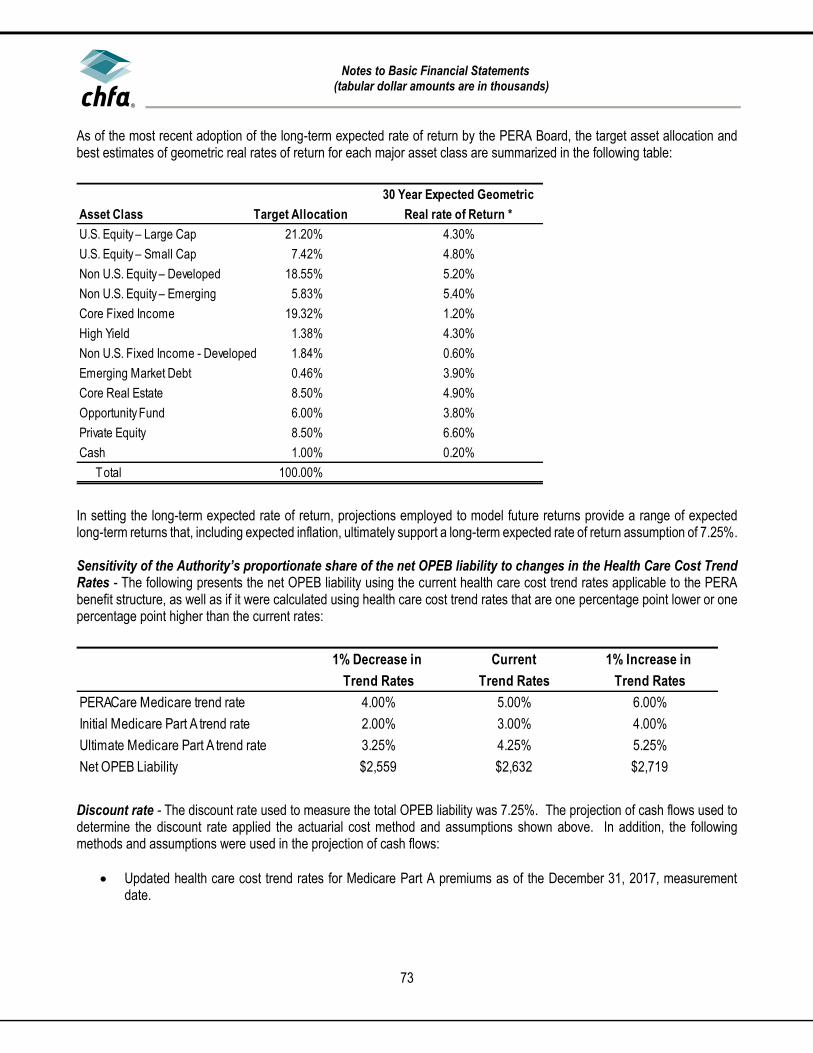
Notes to Basic Financial Statements
(tabular dollar amounts are in thousands)
73
As of the most recent adoption of the long-term expected rate of return by the PERA Board, the target asset allocation and best estimates of geometric real rates of return for each major asset class are summarized in the following table:
In setting the long-term expected rate of return, projections employed to model future returns provide a range of expected long-term returns that, including expected inflation, ultimately support a long-term expected rate of return assumption of 7.25%. Sensitivity of the Authority’s proportionate share of the net OPEB liability to changes in the Health Care Cost Trend Rates - The following presents the net OPEB liability using the current health care cost trend rates applicable to the PERA benefit structure, as well as if it were calculated using health care cost trend rates that are one percentage point lower or one percentage point higher than the current rates:
Discount rate - The discount rate used to measure the total OPEB liability was 7.25%. The projection of cash flows used to determine the discount rate applied the actuarial cost method and assumptions shown above. In addition, the following methods and assumptions were used in the projection of cash flows:
• Updated health care cost trend rates for Medicare Part A premiums as of the December 31, 2017, measurement date.
30 Year Expected Geometric
Asset Class Target Allocation Real rate of Return *
U.S. Equity – Large Cap 21.20% 4.30%
U.S. Equity – Small Cap 7.42% 4.80%
Non U.S. Equity – Developed 18.55% 5.20%
Non U.S. Equity – Emerging 5.83% 5.40%
Core Fixed Income 19.32% 1.20%
High Yield 1.38% 4.30%
Non U.S. Fixed Income - Developed 1.84% 0.60%
Emerging Market Debt 0.46% 3.90%
Core Real Estate 8.50% 4.90%
Opportunity Fund 6.00% 3.80%
Private Equity 8.50% 6.60%
Cash 1.00% 0.20%
Total 100.00%
1% Decrease in Current 1% Increase in
Trend Rates Trend Rates Trend Rates
PERACare Medicare trend rate 4.00% 5.00% 6.00%
Initial Medicare Part A trend rate 2.00% 3.00% 4.00%
Ultimate Medicare Part A trend rate 3.25% 4.25% 5.25%
Net OPEB Liability $2,559 $2,632 $2,719
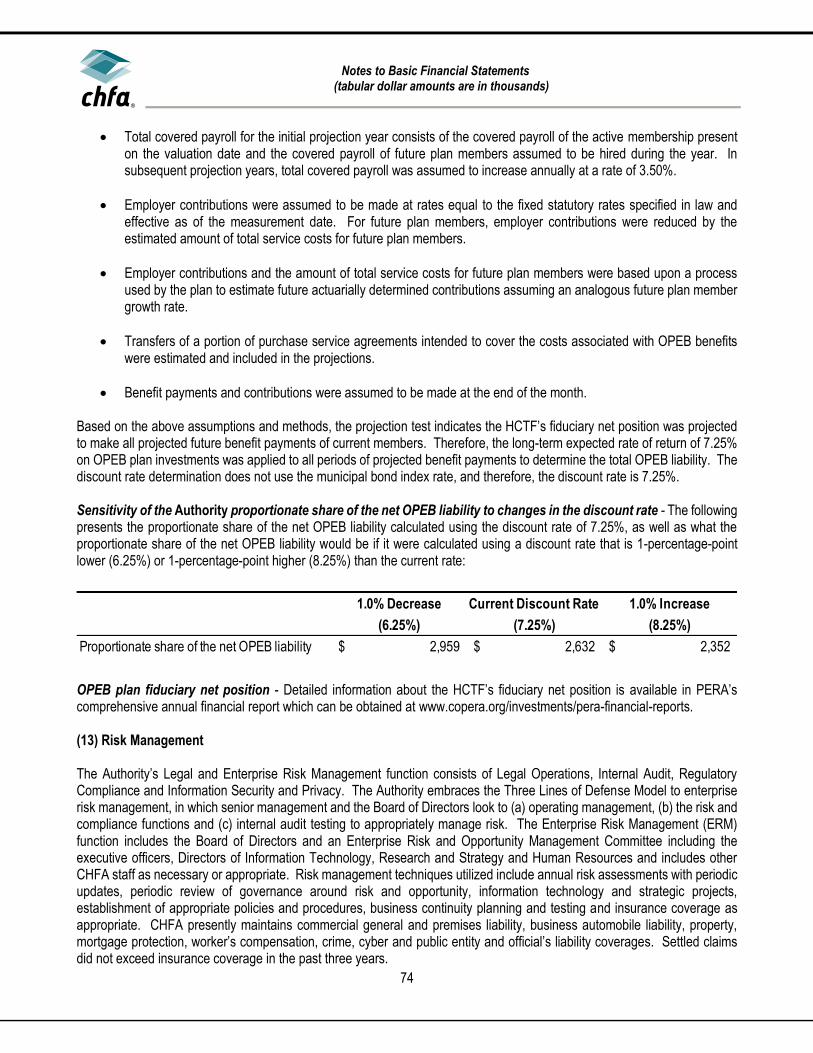
Notes to Basic Financial Statements
(tabular dollar amounts are in thousands)
74
• Total covered payroll for the initial projection year consists of the covered payroll of the active membership present on the valuation date and the covered payroll of future plan members assumed to be hired during the year. In subsequent projection years, total covered payroll was assumed to increase annually at a rate of 3.50%.
• Employer contributions were assumed to be made at rates equal to the fixed statutory rates specified in law and effective as of the measurement date. For future plan members, employer contributions were reduced by the estimated amount of total service costs for future plan members.
• Employer contributions and the amount of total service costs for future plan members were based upon a process used by the plan to estimate future actuarially determined contributions assuming an analogous future plan member growth rate.
• Transfers of a portion of purchase service agreements intended to cover the costs associated with OPEB benefits were estimated and included in the projections.
• Benefit payments and contributions were assumed to be made at the end of the month.
Based on the above assumptions and methods, the projection test indicates the HCTF’s fiduciary net position was projected to make all projected future benefit payments of current members. Therefore, the long-term expected rate of return of 7.25% on OPEB plan investments was applied to all periods of projected benefit payments to determine the total OPEB liability. The discount rate determination does not use the municipal bond index rate, and therefore, the discount rate is 7.25%. Sensitivity of the Authority proportionate share of the net OPEB liability to changes in the discount rate - The following presents the proportionate share of the net OPEB liability calculated using the discount rate of 7.25%, as well as what the proportionate share of the net OPEB liability would be if it were calculated using a discount rate that is 1-percentage-point lower (6.25%) or 1-percentage-point higher (8.25%) than the current rate:
OPEB plan fiduciary net position - Detailed information about the HCTF’s fiduciary net position is available in PERA’s comprehensive annual financial report which can be obtained at www.copera.org/investments/pera-financial-reports. (13) Risk Management The Authority’s Legal and Enterprise Risk Management function consists of Legal Operations, Internal Audit, Regulatory Compliance and Information Security and Privacy. The Authority embraces the Three Lines of Defense Model to enterprise risk management, in which senior management and the Board of Directors look to (a) operating management, (b) the risk and compliance functions and (c) internal audit testing to appropriately manage risk. The Enterprise Risk Management (ERM) function includes the Board of Directors and an Enterprise Risk and Opportunity Management Committee including the executive officers, Directors of Information Technology, Research and Strategy and Human Resources and includes other CHFA staff as necessary or appropriate. Risk management techniques utilized include annual risk assessments with periodic updates, periodic review of governance around risk and opportunity, information technology and strategic projects, establishment of appropriate policies and procedures, business continuity planning and testing and insurance coverage as appropriate. CHFA presently maintains commercial general and premises liability, business automobile liability, property, mortgage protection, worker’s compensation, crime, cyber and public entity and official’s liability coverages. Settled claims did not exceed insurance coverage in the past three years.
1.0% Decrease Current Discount Rate 1.0% Increase
(6.25%) (7.25%) (8.25%)
Proportionate share of the net OPEB liability 2,959$ 2,632$ 2,352$
Notes to Basic Financial Statements
(tabular dollar amounts are in thousands)
75
(14) Related-Party Transactions As of the year ended December 31, 2018, the Authority had allocated Federal and State Low Income Housing Tax Credits in the amount of $8.8 million to housing projects in which the Fort Collins Housing Authority (FCHA) is the general partner. Federal tax credits are provided annually for each of ten years and State tax credits are provided annually for each of six years. In addition, the Authority has three outstanding loans with the FCHA. As of December 31, 2018 and 2017, the unpaid principal balance on the loans was $4.1 million and $4.2 million, respectively. The Executive Director of the FCHA is a member of the Authority’s Board. As of the year ended December 31, 2018, the Authority had allocated Federal Low Income Housing Tax Credits in the amount of $3.6 million to housing projects in which the Grand Junction Housing Authority (GJHA) is the general partner. The allocated tax credits will be provided annually for each of ten years. In addition, the Authority has three outstanding loans with the GJHA. As of December 31, 2018 and 2017, the unpaid principal balance on the loans totaled $5.2 million and $4.9 million, respectively. The Executive Director of the GJHA is a member of the Authority’s Board. As of the year ended December 31, 2018, the Authority has four outstanding loans with the HACL. As of December 31, 2018 and 2017, the unpaid principal balance on the loans totaled $5.6 million and $5.7 million, respectively. The Executive Director of the HACL was a member of the Authority’s Board at the time these loans were made. (15) Commitments and Contingencies The Authority had outstanding commitments to make or acquire single family and multifamily/business loans of $339.8 million and $43.9 million, respectively, as of December 31, 2018. The Authority had outstanding commitments to make or acquire single family and multifamily/business loans of $282.7 million and $33.6 million, respectively, as of December 31, 2017. There are a limited number of claims or suits pending against the Authority arising in the Authority’s ordinary course of business. In the opinion of the Authority’s management and counsel, any losses that might result from these claims and suits are either covered by insurance or, to the extent not covered by insurance, would not have a material adverse effect on the Authority’s financial position. The Authority participates in the Ginnie Mae Mortgage Backed Securities (MBS) Programs. Through the MBS Programs, Ginnie Mae guarantees securities that are issued by the Authority and backed by pools of mortgage loans. If a borrower fails to make a timely payment on a mortgage loan, the Authority must advance its own funds to ensure that the security holders receive timely payment. All loans pooled under the Ginnie Mae MBS Program are either insured by the FHA or are guaranteed by the VA or RD. The Authority assesses the overall risk of loss on loans that it may be required to repurchase and advances funds to repurchase the loans as necessary. Advances are recovered as claims are processed or loans are modified. The Authority repurchased $41.5 million and $39.3 million of these loans in 2018 and 2017, respectively. Claims, recoveries and proceeds from re-pooled, modified loans substantially reimburse the Authority over time. The Authority also participates in the Whole Loan Sales and Mortgage-Backed Securities (MBS) programs with Fannie Mae. Through the consideration of Whole Loan Sales to Fannie Mae, the Authority receives cash for mortgages. Through the MBS program, the Authority swaps loans for securities issued by Fannie Mae. Whole Loans Sales are serviced by the Authority in an Actual/Actual remittance method and the MBS loans are serviced by the Authority in a Schedule/Schedule remittance method. Under the Schedule/Schedule method if a borrower fails to make a timely payment on a MBS mortgage loan, the Authority must advance its own funds to ensure that the security holders receive timely payment. The Authority assesses the overall risk of loss on loans that it may be required to repurchase and repurchases the loans as necessary. The Authority repurchased $0 and $492 thousand of these loans in 2018 and 2017, respectively. The Authority did not have any repurchase obligations as of December 31, 2018.

Notes to Basic Financial Statements
(tabular dollar amounts are in thousands)
76
The Authority also participates in the Whole Loan Sales program with Freddie Mac. Through the consideration of Whole Loan Sales to Freddie Mac, the Authority receives cash for mortgages. Whole Loans Sales are serviced by the Authority in a Schedule/Actual remittance method. Under the Schedule/Actual method if a borrower fails to make a timely payment on a mortgage loan, the Authority must advance its own funds to ensure that the interest is current. The Authority assesses the overall risk of loss on loans that it may be required to repurchase and repurchases the loans as necessary. The Authority did not repurchase any Freddie Mac loans in 2018 or 2017. The Authority did not have any repurchase obligations as of December 31, 2018. (16) Subsequent Events On November 15, 2018 the Authority’s Board of Directors authorized the issuance and sale of Single Family Mortgage Class I Bonds 2019 Series A, B and C. Pricing of the bonds took place on November 27, 2018 and the bond transaction officially closed on January 3, 2019. The bonds consist of fixed and adjustable rate bonds in a par amount of $102.9 million. The proceeds of the 2019 ABC Bonds were used to purchase Ginnie Mae Mortgage Backed Securities (GNMA MBS) and associated 2nd mortgages. The GNMA MBS consisted of qualified tax-exempt loans. To stretch limited private activity bond (PAB) volume cap, the bonds were issued as taxable and tax-exempt series. The 2019 A, B-1 and C series bonds are fixed rate bonds and the 2019 B-2 Bonds are adjustable rate bonds. The adjustable rate bonds are backed by a Barclays Standby Bond Purchase Agreement (SBPA). With the issuance of the adjustable rate bonds, the Authority entered into interest rate swap contracts totaling $20.0 million to hedge the adjustable interest rates. The swaps were priced on the same day as the bonds, November 27, 2018, and were effective on the bond closing date of January 3, 2019.

required supplemental information (unaudited)

78
Colorado Housing and Finance Authority
Schedule of the Authority's Share of Net Pension Liability
Last 10 Fiscal Years*
(in thousands of dollars)
2014 2015 2016 2017
Proportion of the net pension
liability 2.16% 2.29% 2.41% 2.61%
Proportionate share of
net pension liability 19,360$ 25,185$ 32,535$ 29,015$
Covered-employee payroll 11,857$ 12,984$ 14,091$ 14,974$
Proportionate share of the net pension
liability as a percentage of its
covered-employee payroll 163.28% 193.97% 230.89% 193.77%
Plan fiduciary net position as a
percentage of the total pension
plan liability 80.72% 76.87% 73.65% 79.37%
* This schedule is intended to show information for 10 years. Additional years will be displayed
as they become available.
Colorado Housing and Finance Authority
Schedule of Authority Contributions
Local Government Division Trust Fund
Last 10 Fiscal Years*
(in thousands of dollars)
2014 2015 2016 2017
Contractually required contribution 1,504$ 1,646$ 1,787$ 1,899$
Contributions in relation to the
contractually required contribution 1,504 1,646 1,787 1,899
Contribution deficiency -$ -$ -$ -$
Covered-employee payroll 11,857$ 12,984$ 14,091$ 14,974$
Contributions as a percentage of
covered-employee payroll 12.68% 12.68% 12.68% 12.68%
* This schedule is intended to show information for 10 years. Additional years will be displayed
as they become available.

79
Colorado Housing and Finance Authority
Schedule of the Authority's Share of Net OPEB Liability
Last 10 Fiscal Years*
(in thousands of dollars)
2016 2017
Proportion of the net OPEB
liability 0.18% 0.20%
Proportionate share of
net OPEB liability 2,398$ 2,632$
Covered-employee payroll 14,091$ 14,974$
Proportionate share of the net OPEB
liability as a percentage of its
covered-employee payroll 17.02% 17.57%
Plan fiduciary net position as a
percentage of the total OPEB
plan liability 16.72% 17.53%
* This schedule is intended to show information for 10 years. Additional years will be displayed
as they become available.
Colorado Housing and Finance Authority
Schedule of Authority Contributions
Health Care Trust Fund
Last 10 Fiscal Years*
(in thousands of dollars)
2016 2017
Contractually required contribution 144$ 153$
Contributions in relation to the
contractually required contribution 144 153
Contribution deficiency -$ -$
Covered-employee payroll 14,091$ 14,974$
Contributions as a percentage of
covered-employee payroll 1.02% 1.02%
* This schedule is intended to show information for 10 years. Additional years will be displayed
as they become available.

supplemental information

81
Colorado Housing and Finance Authority
Combining Schedule - Statement of Net Position
(with summarized financial information for December 31, 2017)
(in thousands of dollars)
General Single Multifamily/ Summarized
Programs Family Business Eliminations 2018 2017
Assets
Current assets:
Cash (Note 2)
Restricted 117,566$ -$ -$ -$ 117,566$ 112,427$
Unrestricted 41,287 - - - 41,287 47,530
Investments (Note 2) 89,434 91,856 68,600 - 249,890 331,787
Loans receivable (Note 3) 7,691 9,574 16,771 (370) 33,666 34,104
Loans receivable held for sale (Note 3) 214,557 - - - 214,557 149,694
Accrued interest receivable 4,015 3,592 1,149 (37) 8,719 8,030
Other assets 5,134 - 22 - 5,156 4,647
Due (to) from other programs (9,818) 6,069 3,749 - - -
Total current assets 469,866 111,091 90,291 (407) 670,841 688,219
Noncurrent assets:
Investments (Note 2) 3,394 528,524 43,127 - 575,045 372,708
Loans receivable, net (Note 3) 223,031 277,635 486,356 (10,728) 976,294 988,999
Capital assets - nondepreciable (Note 4) 1,868 - - - 1,868 1,701
Capital assets - depreciable, net (Note 4) 12,019 - - - 12,019 12,493
Other real estate owned, net 182 227 400 - 809 789
Other assets 52,190 - - - 52,190 34,468
Total noncurrent assets 292,684 806,386 529,883 (10,728) 1,618,225 1,411,158
Total assets 762,550 917,477 620,174 (11,135) 2,289,066 2,099,377
Deferred outflows of resources
Accumulated increase in fair value of hedging derivatives - 4,986 49,747 - 54,733 81,942
Pension and OPEB contributions and investment earnings 7,101 - - - 7,101 7,404
Refundings of debt - 2,724 1,364 - 4,088 3,657
Total deferred outflows of resources 7,101 7,710 51,111 - 65,922 93,003
Liabilities
Current liabilities:
Short-term debt (Note 5) 237,500 - - - 237,500 92,785
Bonds payable (Note 6) 598 46,866 32,148 - 79,612 117,380
Notes payable (Note 6) 105 - - - 105 104
Accrued interest payable 152 4,802 4,598 (37) 9,515 9,855
Federally assisted program advances 554 - - - 554 647
Accounts payable and other liabilities 115,605 204 8,203 - 124,012 151,425
Total current liabilities 354,514 51,872 44,949 (37) 451,298 372,196
Noncurrent liabilities:
Bonds payable (Note 6) 6,001 784,505 488,335 - 1,278,841 1,255,540
Derivative instruments 1,201 4,034 49,793 - 55,028 71,043
Derivatives related borrowing - 10,022 6,037 - 16,059 21,113
Net pension and OPEB liability - proportionate share 31,646 - - - 31,646 32,535
Notes payable (Note 6) 11,856 - - (11,098) 758 863
Other liabilities (Note 6) 41,442 - - - 41,442 15,674
Total noncurrent liabilities 92,146 798,561 544,165 (11,098) 1,423,774 1,396,768
Total liabilities 446,660 850,433 589,114 (11,135) 1,875,072 1,768,964
Deferred inflows of resources
Accumulated decrease in fair value of hedging derivatives - 3,021 2,677 - 5,698 6,367
Pension and OPEB investment differences 6,728 - - - 6,728 49
Total deferred inflows of resources 6,728 3,021 2,677 - 12,426 6,416
Net position
Investment in capital assets, net of related debt 13,887 - - (11,098) 2,789 2,800
Restricted primarily by bond indentures 7,482 71,733 79,494 - 158,709 160,817
Unrestricted (Note 11) 294,894 - - 11,098 305,992 253,383
Total net position 316,263$ 71,733$ 79,494$ -$ 467,490$ 417,000$
As of December 31, 2018

82
Colorado Housing and Finance Authority
Combining Schedule - Statement of Revenues, Expenses and Changes in Net Position
For the year ended December 31, 2018
(with summarized financial information for the year ended December 31, 2017)
(in thousands of dollars)
General Single Multifamily/ Summarized
Program Family Business Eliminations 2018 2017
Interest income and expense:
Interest on loans receivable 13,430$ 14,822$ 28,063$ (439)$ 55,876$ 55,777$
Interest on investments 1,203 19,022 3,737 - 23,962 17,068
Interest on debt (4,463) (41,322) (21,251) 439 (66,597) (56,033)
Net interest income 10,170 (7,478) 10,549 - 13,241 16,812
Other operating income (loss):
Loan servicing income 29,284 - (7) - 29,277 24,253
Gain on sale of loans 83,817 - - - 83,817 106,788
Investment derivative activity gain (loss) (3,479) 3,088 1,171 - 780 3,143
Net increase (decrease) in the fair value
of investments (1,372) 5,677 (1,212) - 3,093 5,950
Other revenues 11,878 (14) 10 - 11,874 16,857
Total other operating income 120,128 8,751 (38) - 128,841 156,991
Total operating income 130,298 1,273 10,511 - 142,082 173,803
Operating expenses:
Salaries and related benefits 26,211 - - - 26,211 27,515
General operating 56,750 4,212 908 - 61,870 92,395
Depreciation 1,038 - - - 1,038 684
Provision for losses 619 (70) (288) - 261 698
Total operating expenses 84,618 4,142 620 - 89,380 121,292
Net operating income 45,680 (2,869) 9,891 - 52,702 52,511
Nonoperating income and expenses:
Federal grant receipts 140,231 - - - 140,231 137,126
Federal grant payments (140,231) - - - (140,231) (137,126)
Gain on sale of capital assets 18 - - - 18 19
Total nonoperating income and expenses, net 18 - - - 18 19
Income before transfers 45,698 (2,869) 9,891 - 52,720 52,530
Transfers from (to) other programs 9,275 1,309 (10,584) - - -
Change in net position 54,973 (1,560) (693) - 52,720 52,530
Net position:
Beginning of year 263,520 73,293 80,187 - 417,000 364,470
Restatement due to GASB 75 (2,230) - - - (2,230) -
End of year 316,263$ 71,733$ 79,494$ -$ 467,490$ 417,000$
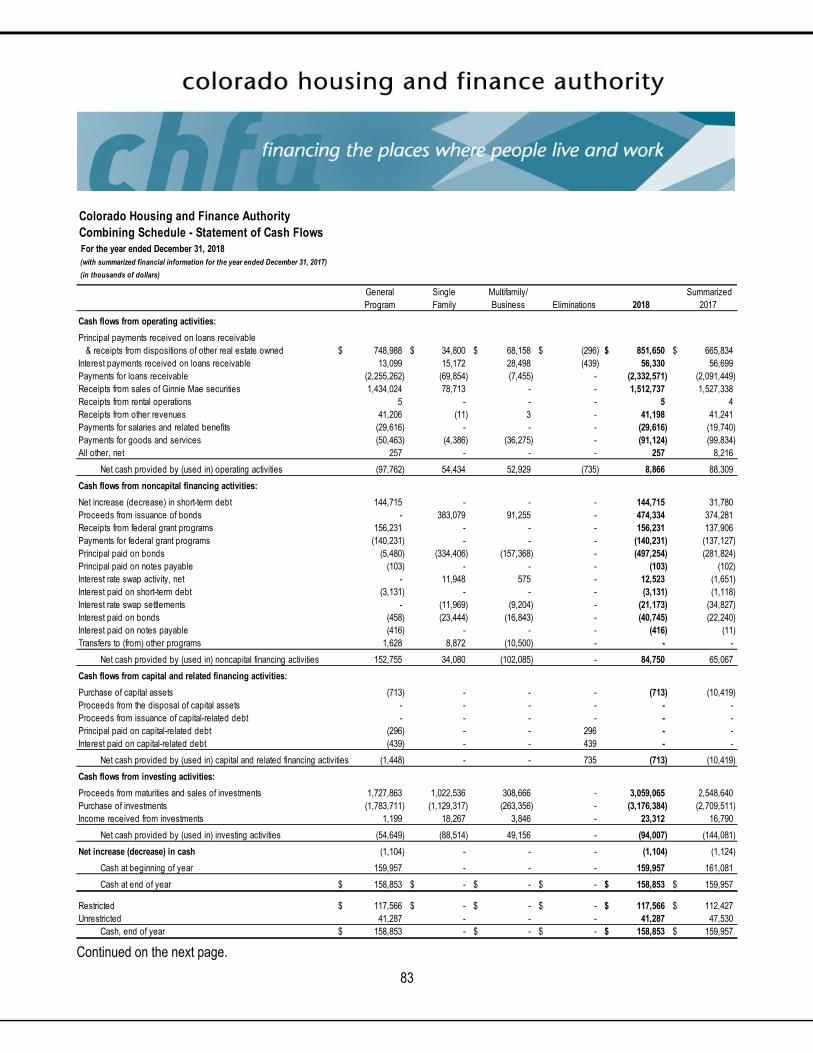
83
Continued on the next page.
Colorado Housing and Finance Authority
Combining Schedule - Statement of Cash Flows
For the year ended December 31, 2018
(with summarized financial information for the year ended December 31, 2017)
(in thousands of dollars)
General Single Multifamily/ Summarized
Program Family Business Eliminations 2018 2017
Cash flows from operating activities:
Principal payments received on loans receivable
& receipts from dispositions of other real estate owned $ 748,988 $ 34,800 $ 68,158 $ (296) $ 851,650 $ 665,834
Interest payments received on loans receivable 13,099 15,172 28,498 (439) 56,330 56,699
Payments for loans receivable (2,255,262) (69,854) (7,455) - (2,332,571) (2,091,449)
Receipts from sales of Ginnie Mae securities 1,434,024 78,713 - - 1,512,737 1,527,338
Receipts from rental operations 5 - - - 5 4
Receipts from other revenues 41,206 (11) 3 - 41,198 41,241
Payments for salaries and related benefits (29,616) - - - (29,616) (19,740)
Payments for goods and services (50,463) (4,386) (36,275) - (91,124) (99,834)
All other, net 257 - - - 257 8,216 - - - - -
Net cash provided by (used in) operating activities (97,762) 54,434 52,929 (735) 8,866 88,309
Cash flows from noncapital financing activities:
Net increase (decrease) in short-term debt 144,715 - - - 144,715 31,780
Proceeds from issuance of bonds - 383,079 91,255 - 474,334 374,281
Receipts from federal grant programs 156,231 - - - 156,231 137,906
Payments for federal grant programs (140,231) - - - (140,231) (137,127)
Principal paid on bonds (5,480) (334,406) (157,368) - (497,254) (281,824)
Principal paid on notes payable (103) - - - (103) (102)
Interest rate swap activity, net - 11,948 575 - 12,523 (1,651)
Interest paid on short-term debt (3,131) - - - (3,131) (1,118)
Interest rate swap settlements - (11,969) (9,204) - (21,173) (34,827)
Interest paid on bonds (458) (23,444) (16,843) - (40,745) (22,240)
Interest paid on notes payable (416) - - - (416) (11)
Transfers to (from) other programs 1,628 8,872 (10,500) - - - - - - - -
Net cash provided by (used in) noncapital financing activities 152,755 34,080 (102,085) - 84,750 65,067
Cash flows from capital and related financing activities:
Purchase of capital assets (713) - - - (713) (10,419)
Proceeds from the disposal of capital assets - - - - - -
Proceeds from issuance of capital-related debt - - - - - -
Principal paid on capital-related debt (296) - - 296 - -
Interest paid on capital-related debt (439) - - 439 - -
Net cash provided by (used in) capital and related financing activities (1,448) - - 735 (713) (10,419)
Cash flows from investing activities:
Proceeds from maturities and sales of investments 1,727,863 1,022,536 308,666 - 3,059,065 2,548,640
Purchase of investments (1,783,711) (1,129,317) (263,356) - (3,176,384) (2,709,511)
Income received from investments 1,199 18,267 3,846 - 23,312 16,790
Net cash provided by (used in) investing activities (54,649) (88,514) 49,156 - (94,007) (144,081)
Net increase (decrease) in cash (1,104) - - - (1,104) (1,124)
Cash at beginning of year 159,957 - - - 159,957 161,081
Cash at end of year $ 158,853 $ - $ - $ - $ 158,853 $ 159,957
Restricted $ 117,566 $ - $ - $ - $ 117,566 $ 112,427
Unrestricted 41,287 - - - 41,287 47,530
Cash, end of year $ 158,853 - $ - $ - $ 158,853 $ 159,957

84
Colorado Housing and Finance Authority
Combining Schedule - Statement of Cash Flows (continued)
For the year ended December 31, 2018
(with summarized financial information for the year ended December 31, 2017)
(in thousands of dollars)
General Single Multifamily/ Summarized
Program Family Business Eliminations 2018 2017
Reconciliation of operating income to net cash
provided by (used in) operating activities:
Net operating income $ 45,680 $ (2,869) $ 9,891 $ - $ 52,702 $ 52,511
Adjustments to reconcile operating income (loss) to
net cash provided by (used in) operating activities:
Depreciation expense 1,038 - - - 1,038 684
Amortization and fair value adjustments of service release premiums 9,412 - - - 9,412 25,290
Proportionate share of net pension and OPEB expense 3,862 - - - 3,862 6,207
Amortization of imputed debt associated with swaps - (2,224) (4,048) - (6,272) (5,573)
Provision for losses 619 (70) (288) - 261 698
Interest on investments (1,203) (19,022) (3,737) - (23,962) (17,068)
Interest on debt 4,463 43,546 25,299 (439) 72,869 61,607
Unrealized (gain) loss on investment derivatives 3,479 (3,088) (1,171) - (780) (3,143)
Unrealized (gain) loss on investments 1,372 (5,677) 1,212 - (3,093) (5,950)
(Gain) loss on sale of REO 109 14 (10) - 113 88
Gain on sale of loans (83,817) - - - (83,817) (106,788)
Changes in assets and liabilities:
Loans receivable and other real estate owned (81,771) 43,645 60,713 (296) 22,291 76,345
Accrued interest receivable on loans and investments (331) 350 435 - 454 922
Other assets (18,289) 1 - - (18,288) 8,158
Accounts payable and other liabilities 17,615 (172) (35,367) - (17,924) (5,679)
Net cash provided by (used in) operating activities $ (97,762) $ 54,434 $ 52,929 $ (735) $ 8,866 $ 88,309

85
A. Adjusted net worth calculation:
Net position per statement of
net position at end of
reporting period 467,490$
Less:
Itemized unacceptable assets
1. Other assets 57,346$
2.
3.
Total unacceptable assets 57,346
Adjusted net worth 410,144$
B. Required net worth calculation:
Unpaid principal balance (UPB) of
securities outstanding 3,595,005$
(Note: number of pools = 626)
Plus:
Outstanding balance of available
commitment authority and
pools funded 448,969
Total outstanding portfolio, commitment
authority and pools funded 4,043,974$
Required net worth 16,654$
C. Excess net worth 393,490$
(Adjusted net worth - required net worth)
(in thousands of dollars)
Colorado Housing and Finance Authority
Schedule of Adjusted Net Worth
At December 31, 2018

86
Colorado Housing and Finance Authority
Schedule of Other Assets
At December 31, 2018
A. Accrued interest income 8,719$
B. Deferred debt cost of issuance -
C. Other real estate owned 809
Total other asset included in adjusted net worth 9,528$
D. Other assets excluded from adjusted net worth 57,346
Total current and noncurrent other assets 66,874$
(in thousands of dollars)

87
Colorado Housing and Finance Authority
Liquid Asset Requirement Calculation for Issuers
At December 31, 2018
(in thousands of dollars)
A. Liquid asset calculation:
Required net worth (Schedule of Adjusted Net Worth, section B) 16,654$
Acceptable liquid assets
1. Unrestricted cash 41,287$
2.
3.
4.
5.
6.
Total liquid assets 41,287$
B. Required liquid asset:
Meets requirements?
Single family issuer liquidity requirement 3,595$ Yes / No
(Greater of $1 million or 0.10% of outstanding
single family securities)

88
Colorado Housing and Finance Authority
Capital Requirement Calculation for Issuer
At December 31, 2018
(in thousands of dollars)
A. Capital requirement for depository institutions: not applicable to CHFA
Tier 1 capital $
Total capital $
Risk-based assets $
Total assets $
T ier 1 capital/total assets %
Tier 1 capital/risk-based assets %
Total capital/risk-based assets %
Meets requirement?
5% of tier 1 capital/total assets $ Yes / No
6% of tier 1 capital/risk-based assets $ Yes / No
10% of total capital/risk-based assets $ Yes / No
B. Capital requirement for nondepository institutions:
Total adjusted net worth $ 410,144
Total assets $ 2,289,066
Meets requirement?
Total adjusted net worth/total assets 17.92 % Yes / No

89
The Authority certifies that it is in good standing with FHA, Fannie Mae and Freddie Mac, and has not been the subject of any adverse actions.
Colorado Housing and Finance Authority
Schedule of Insurance Requirement
At December 31, 2018
A. Identification of affiliated Ginnie Mae Issuers
Affiliated Ginnie Mae issuers: None
B. Required insurance calculation:
Servicing portfolio:
Ginnie Mae 3,595,005$
Fannie Mae 1,285,042
Freddie Mac 117,370
Conventional (other) 1,231,634
Total servicing portfolio 6,229,051$
Required fidelity bond coverage 6,754$
Required mortgage servicing errors and omissions coverage 6,754$
C. Verification of insurance coverage:
Fidelity bond coverage at end of reporting period 10,000$
Mortgage servicing errors and omissions
coverage at end of reporting period 10,000$
D. Excess insurance coverage:
Fidelity bond coverage 3,246$
Required mortgage servicing errors
and omissions coverage 3,246$
E. Policies contain the required elements
Fidelity bond coverage Yes / No
Mortgage servicing errors and omissions coverage Yes / No
(in thousands of dollars)

hud reporting

Independent Auditor’s Report on Compliance With Requirements That Could Have a Direct and Material Effect on the Major HUD Program
and on Internal Control Over Compliance Based on an Audit in Accordance With the Consolidated Audit Guide for Audits of HUD Programs
The Board of Directors Colorado Housing and Finance Authority Report on Compliance for the Major HUD Program We have audited Colorado Housing and Finance Authority’s (the Authority) compliance with the compliance requirements described in the Consolidated Audit Guide for Audits of HUD Programs (the Audit Guide) that could have a direct and material effect on the Authority’s major U.S. Department of Housing and Urban Development (HUD) program for the year ended December 31, 2018. The Authority’s major HUD program and the related direct and material compliance requirements are as follows:
Name of Major HUD Program Direct and Material
Compliance Requirements Government National Mortgage Association
issuers of mortgage-backed securities Federal financial reports
Eligibility to issue mortgage-backed securities Review of custodial documents Review of monthly accounting reports and
quarterly submissions Securities marketing and trading practices Adjusted net worth Capital, liquid asset and insurance requirement
Management’s Responsibility Management is responsible for compliance with the requirements of laws, regulations, contracts and grants applicable to its HUD programs. Auditor’s Responsibility Our responsibility is to express an opinion on compliance for the Authority’s major HUD program based on our audit of the compliance requirements referred to above. We conducted our audit of compliance in accordance with auditing standards generally accepted in the United States of America; the standards applicable to financial audits contained in Government Auditing Standards, issued by the Comptroller General of the United States; and the Audit Guide. Those standards and the Audit Guide require that we plan and perform the audit to obtain reasonable assurance about whether noncompliance with the compliance requirements referred to above that could have a direct and material effect on a major HUD program occurred. An audit includes examining, on a test basis, evidence about the Authority’s compliance with those requirements and performing such other procedures as we considered necessary in the circumstances. We believe that our audit provides a reasonable basis for our opinion on compliance for the major HUD program. However, our audit does not provide a legal determination of the Authority’s compliance.
91
Opinion on the Major HUD Program In our opinion, based on our audit, the Authority complied, in all material respects, with the compliance requirements referred to above that could have a direct and material effect on the major HUD program for the year ended December 31, 2018. Report on Internal Control Over Compliance Management of the Authority is responsible for establishing and maintaining effective internal control over compliance with the compliance requirements referred to above. In planning and performing our audit of compliance, we considered the Authority’s internal control over compliance with the requirements that could have a direct and material effect on the major HUD program to determine the auditing procedures that are appropriate in the circumstances for the purpose of expressing an opinion on compliance for the major HUD program and to test and report on internal control over compliance in accordance with the Audit Guide, but not for the purpose of expressing an opinion on the effectiveness of internal control over compliance. Accordingly, we do not express an opinion on the effectiveness of the Authority’s internal control over compliance. A deficiency in internal control over compliance exists when the design or operation of a control over compliance does not allow management or employees, in the normal course of performing their assigned functions, to prevent, or detect and correct, noncompliance with a compliance requirement of a HUD program on a timely basis. A material weakness in internal control over compliance is a deficiency, or combination of deficiencies, in internal control over compliance, such that there is a reasonable possibility that material noncompliance with a compliance requirement of a HUD program will not be prevented, or detected and corrected, on a timely basis. A significant deficiency in internal control over compliance is a deficiency, or a combination of deficiencies, in internal control over compliance with a compliance requirement of a HUD program that is less severe than a material weakness in internal control over compliance, yet important enough to merit attention by those charged with governance. Our consideration of internal control over compliance was for the limited purpose described in the first paragraph of this section and was not designed to identify all deficiencies in internal control over compliance that might be material weaknesses or significant deficiencies. We did not identify any deficiencies in internal control over compliance that we consider to be material weaknesses. However, material weaknesses may exist that have not been identified. The purpose of this report on internal control over compliance is solely to describe the scope of our testing of internal control over compliance and the results of that testing based on the requirements of the Audit Guide. Accordingly, this report is not suitable for any other purpose.
Denver, Colorado March 28, 2019
92

Report on Internal Control Over Financial Reporting and on Compliance and Other Matters Based on an Audit of Financial
Statements Performed in Accordance With Government Auditing Standards
Independent Auditor’s Report
The Board of Directors Colorado Housing and Finance Authority We have audited, in accordance with the auditing standards generally accepted in the United States of America and the standards applicable to financial audits contained in Government Auditing Standards, issued by the Comptroller General of the United States, the financial statements of the Colorado Housing and Finance Authority (the Authority) as of and for the year ended December 31, 2018, and the related notes to the financial statements, which collectively comprise the Authority’s basic financial statements, and have issued our report thereon dated March 28, 2019, which included an emphasis-of-a-matter paragraph relating to the adoption of an accounting standard. Internal Control Over Financial Reporting In planning and performing our audit of the financial statements, we considered the Authority’s internal control over financial reporting (internal control) to determine the audit procedures that are appropriate in the circumstances for the purpose of expressing our opinion on the financial statements, but not for the purpose of expressing an opinion on the effectiveness of the Authority’s internal control. Accordingly, we do not express an opinion on the effectiveness of the Authority’s internal control. A deficiency in internal control exists when the design or operation of a control does not allow management or employees, in the normal course of performing their assigned functions, to prevent, or detect and correct, misstatements on a timely basis. A material weakness is a deficiency, or a combination of deficiencies, in internal control, such that there is a reasonable possibility that a material misstatement of the entity’s financial statements will not be prevented, or detected and corrected, on a timely basis. A significant deficiency is a deficiency, or a combination of deficiencies, in internal control that is less severe than a material weakness, yet important enough to merit attention by those charged with governance. Our consideration of internal control was for the limited purpose described in the first paragraph of this section and was not designed to identify all deficiencies in internal control that might be material weaknesses or significant deficiencies. Given these limitations, during our audit we did not identify any deficiencies in internal control that we consider to be material weaknesses. However, material weaknesses may exist that have not been identified.
93

Compliance and Other Matters As part of obtaining reasonable assurance about whether the Authority’s financial statements are free from material misstatement, we performed tests of its compliance with certain provisions of laws, regulations, contracts and grant agreements, noncompliance with which could have a direct and material effect on the determination of financial statement amounts. However, providing an opinion on compliance with those provisions was not an objective of our audit, and accordingly, we do not express such an opinion. The results of our tests disclosed no instances of noncompliance or other matters that are required to be reported under Government Auditing Standards. Purpose of This Report The purpose of this report is solely to describe the scope of our testing of internal control and compliance and the results of that testing, and not to provide an opinion on the effectiveness of the entity’s internal control or on compliance. This report is an integral part of an audit performed in accordance with Government Auditing Standards in considering the Authority’s internal control and compliance. Accordingly, this communication is not suitable for any other purpose.
Denver, Colorado March 28, 2019
94


denver
1981 Blake Street Denver, Colorado 80202
303.297.chfa (2432) 800.877.chfa (2432)
www.chfainfo.com
western slope
348 Main Street Grand Junction, Colorado 81501
970.241.2341 800.877.8450
With respect to its programs, services, activities, and employment practices, Colorado Housing and Finance Authority does not discriminate on the basis of race, color, religion, sex, age, national origin, disability, or any other protected classification under federal, state, or local law. Requests for reasonable accommodation, the provision of auxiliary aids, or any complaints alleging violation of this nondiscrimination policy should be directed to the Nondiscrimination Coordinator, 1.800.877.2432, TDD/TTY 800.659.2656, CHFA, 1981 Blake Street, Denver, Colorado 80202-1272, available weekdays 8:00am to 5:00pm.
Prepared by: CHFA Accounting Division