annual financial report - hif.com.au · 2 health insurance fund of australia annual financial...
TRANSCRIPT

Annual Financial Report30 June 2018
ACN 128 302 161

HEALTH INSURANCE FUND OF AUSTRALIA ANNUAL FINANCIAL REPORT 2018
ContentsCorporate information 1
Directors’ report 2
Auditor’s independence declaration 9
Statement of profit or loss and other comprehensive income 10
Statement of financial position 11
Statement of changes in equity 12
Statement of cash flows 13
Notes to the financial statements 14
Directors’ declaration 49
Independent audit report 50

HEALTH INSURANCE FUND OF AUSTRALIA ANNUAL FINANCIAL REPORT 20181
Directors
R. Homsany (Chairman)
G. N. Gibson (Managing Director)
S.V. BlakeM. A. DudleyH. D. Zafer
Company secretary
K. L. J. Garvey
Registered office and principal place of business
100 Stirling Street
Perth, Western Australia
Solicitor
DLA Piper (Australia)Level 31,
152 - 158 St Georges Terrace
Perth, Western Australia
Banker
Commonwealth Bank of Australia300 Murray Street
Perth, Western Australia
External auditor
Deloitte Touche TohmatsuTower 2, Brookfield Place,
123 St Georges Terrace
Perth, Western Australia
Internal auditor
PricewaterhouseCoopersBrookfield Place,
125 St Georges Terrace
Perth, Western Australia
Appointed actuary
R. Davies PricewaterhouseCoopers
One International Towers,
Watermans Quay
Sydney, New South Wales

HEALTH INSURANCE FUND OF AUSTRALIA ANNUAL FINANCIAL REPORT 20182
Mr Homsany was appointed to the Board in June 2010. Mr Homsany is ExecutiveVice President, Australia of Mega Uranium Ltd, a TSX listed company and is anexperienced corporate lawyer having been admitted as a solicitor for over 20 years.Mr Homsany is also the principal of Cardinals Lawyers and Consultants. Previously he was Partner, Corporate and Commercial, of DLA Phillips Fox (now DLA Piper) and prior to that was a partner of Gadens Lawyers. Mr Homsany has also worked for an ASX top 50-listed internationally diversified resources company in operations, risk management and corporate. Mr Homsany is a Certified Practising Accountant (CPA)
with CPA Australia, a fellow of the Financial Services Institute of Australasia (FINSIA)and a member of the Australian Institute of Company Directors. Mr Homsany has aCommerce Degree and Honours Degree in Law from the University of WesternAustralia and a Graduate Diploma in Finance and Investment from FINSIA. MrHomsany has significant board experience with public listed companies including asChairman of ASX listed Redstone Resources Ltd and TSX-V listed Central Iron OreLimited, and as Executive Chairman of ASX listed Toro Energy Ltd. Mr Homsany is a member of the Audit and Risk Committee and Chairman of the Nomination and Remuneration Committee.
Mr R. HomsanyLLB (Hons), BCom,
Grad Dip App Fin & Inv
Chairman
Mr Gibson is Chief Executive Officer and Managing Director, is a Certified PractisingAccountant (CPA) with CPA Australia and a Graduate member of the AustralianInstitute of Company Directors. Mr Gibson was appointed by the Board in 2009. MrGibson commenced with the Company in 2004 as Commercial Manager when itoperated as an incorporated association under the Associations Incorporation Act1987 (WA). In 2005, Mr Gibson was appointed Chief Executive Officer during which time Mr Gibson managed the Company’s re-registration as a private health insurer in 2008 and transfer of
incorporation (from an association to a company) in 2009, at which time Mr Gibson was appointed Managing Director. Before joining the Company, Mr Gibson worked as an Area Business Manager for Australia’s then largest private hospital operator Affinity Health Ltd after serving in senior finance and commercial roles for a number of publicly listed companies involved in mining, infrastructure, manufacturing and industrial services. Mr Gibson also gainedexperience in the public sector as a senior lecturer in finance, accounting andcommerce.
Mr G. N. GibsonBBus, Grad Dip Ed,
CPA, GAICD
Executive Director
Ms Blake was appointed to the Board in September 2016. Ms Blake has significantexperience as a consultant in building marketing strategies for clients, including infinancial and professional services, utility, government, retail, hospitality, nongovernment and member-based organisations. Ms Blake has held senior marketing leadership positions in several organisations, involving national promotions and communications strategy
and product development, and lectured in marketing and professional practice at Curtin University, and she is a former partner at strategy consulting firm Black House. Ms Blake is the founding director of Glue Marketing Consulting, a firm specialising in marketing, brand and digital communication and channel strategy development. Ms Blake is a Councillor of Scotch College and is Chairman of the College’s Risk Committee.
Ms S. V. Blake MMkt, Grad Dip Comm,
BComm Mkt & PR
Non-executive Director
DIRECTORS’ REPORT30 June 2018
The board of directors (Board) of Health Insurance Fund of Australia Limited (Company) submit herewith theDirectors’ report for the year ended 30 June 2018 in accordance with the Corporations Act 2001 (Cth).
Information about the DirectorsThe directors of the Company (Directors) during or since the end of the year ended 30 June 2018 are:

HEALTH INSURANCE FUND OF AUSTRALIA ANNUAL FINANCIAL REPORT 20183
Mr Dudley is an Associate of CPA Australia, an Associate of the Australian and NewZealand Institute of Insurance, an Associate of the Australian Institute of Management and a member of the Australian Institute of Company Directors. Mr Dudley was elected to the Board in 2007 and was appointed Chairman in 2008. Mr Dudley has extensive senior management experience in the financial services industry in Australia and New Zealand spanning over three decades. Mr Dudley was the Managing Director of financial planning and accounting services
provider Pinnacle Planners until it was sold in late 2012. He currently holds directorships in private companies involved in private investment, property development and theoperation of child care facilities. Mr Dudley has served as a member of the FinanceCommittee of the Board of Newman College and Chairman of The Financial Planning Association of AMP Australia. Mr Dudley is a member of the Audit and Risk Committee.
Mr M. A. DudleyBCom, BEcon
Non-executive Director
Mr Zafer was appointed to the Board in February 2012. Mr Zafer is a Fellow of theAustralian Institute of Company Directors. Mr Zafer has more than 18 years experience in general and indemnity insurance. In the last 10 years, Mr Zafer has been involved in the financial, superannuation and trustee services sectors. Mr Zafer joined the Guild Group of companies in 1994 and was elected Chairman in 1999, a role he held until 2011 when he took up the Deputy Chair role. The Guild Group of companies includes an insurance company, two superannuation funds, a trustee
services company and a wholly owned insurance law firm. In addition, Mr Zafer also made contributions serving Western Australian state government boards, not for profit organisations, university committees, community boards and at different times, as Vice President and National Councillor of the Pharmacy Guild of Australia and President of its Western Australian branch. Mr Zafer is Chairman of the Audit and Risk Committee and a member of the Nomination and Remuneration Committee.
Mr H. D. ZaferMPS PhCh,
MRPharmS, FAICD
Non-executive Director
Current term as Director ends:
24 October 2018
DIRECTORS’ REPORT30 June 2018
The Directors held office during the whole of the year ended 30 June 2018.
Company Secretary
Ms K. L. J. Garvey LLB, BA, MAICD is an experienced corporate and commercial lawyer and is presently LegalCounsel at Mega Uranium Ltd, a Senior Associate at Cardinals Lawyers and Consultants and Company Secretaryof Central Iron Ore Limited, a TSX-V listed company. Prior to that Ms Garvey spent several years with internationallaw firm DLA Phillips Fox (now DLA Piper) in corporate advisory and commercial. Ms Garvey is a member of theAustralian Institute of Company Directors.

HEALTH INSURANCE FUND OF AUSTRALIA ANNUAL FINANCIAL REPORT 2018
DIRECTORS’ REPORT30 June 2018
4
Principal Activities
The principal activity of the Company is the provision, as an underwriter, of private health insurance in Australia by operating as a registered private health insurer in accordance with the Private Health Insurance Act 2007 (Cth) (Act). Private health insurance provided by the Company includes coverage for Australian citizens and permanent residents who are entitled to Medicare benefits under Complying Health Insurance Products (CHIP) for:
– Hospital treatment - inpatient and day patient services
– Hospital treatment - in the home services
– General treatment (extras) – ancillary health services (including dental, optical, physiotherapy and chiropractic).
Collectively, these categories of health insurance are health insurance business as this term is defined in the Act or in the rules referred to in the Act.
The Company provides, as an underwriter, non-CHIP private health insurance to overseas visitors who temporarily reside in Australia, including Temporary Skill Shortage visa holders. The Company also provides travel and pet insurance under agency agreements with third party underwriters.
The Company’s principal activities include providing present and future Contributors (as that term is defined in the Company’s constitution) and their dependents access to a wide range of competitively priced healthcare treatments and services that are intended to be used to support healthy lives and lifestyles.
Objectives
The Company’s enduring purpose is to help present and future contributors to the fund operated by the Company and their dependents (Members) lead healthy lives. This will be achieved by:
– Providing access to relevant and high-quality healthcare facilities, providers, treatments and services
– Informing Members about their health cover and relevant healthcare issues
– Providing attractive benefits and rebates
– Keeping Members’ premiums affordable and competitive
– Delivering the highest standards of service.
Members who are covered under a CHIP issued by the Company are the Company’s intended beneficiaries.
The Company’s objectives involve:
– Growing the Member base to acquire benefits of size and scale for the benefit of Members
– Gaining greater prominence, relevance and reputation amongst Members, consumers, government, regulators and other stakeholders in the community as the most trusted insurer in Australia
– Growing long term relationships with key healthcare providers and other stakeholders.
The Company leverages its membership of stakeholder groups, including the Australian Health Services Alliance Ltd for purchasing the services and accessing the facilities of private hospitals and a limited number of general treatment benefits, and HAMB Systems Ltd for core transaction processing services and accessing beneficial electronic and digital information, technology and communications solutions.
The Company’s vision is to be the most trusted health insurer in Australia.
To support its purpose and vision, the Company believes it is critical to remain with its core values of Agility, Care and Innovation.

HEALTH INSURANCE FUND OF AUSTRALIA ANNUAL FINANCIAL REPORT 2018
DIRECTORS’ REPORT30 June 2018
5
Performance Measures
The Company measures its performance in many ways, including by measuring, monitoring and analysing:
– Growth, size and composition of its Member base
– Member loyalty, effort, experience and satisfaction
– How motivated Members are to recommend the Company
– Member acquisition and retention and the related costs
– Cost and effort to serve Members
– Growth in premium income, claim benefit outlays and out-of-pockets
– Ratio of claim benefit outlays to premium income
– Capital adequacy and solvency strength
– Efficiency and effectiveness in consuming financial and non-financial resources
– Income contributed from activities other than from core health insurance business.
The Company also measures its performance by monitoring its governance and enterprise-wide risk management frameworks and its ability, using capital and the gearing of its operational resources, to support the Company’s strategy and key objectives of performance and development whilst building financial resilience and sustainability.
Financial Results
Profit / (loss)
The consolidated profit for the year ended 30 June 2018 was $1.9 million compared to a consolidated loss of ($2.5 million) in 2017. Premium revenue for the year was $174.4 million compared to $169.1 million in 2017, an increase of 3.1%.
On 1 April 2018, the Company increased Members’ premiums by a weighted average 5.35% which exceeded the industry weighted average increase. The relatively higher premium increases this year was necessary to keep pace with the Company’s claims experience and to correct margins in certain market segments.
The loss in the prior year reflected the Company’s consumption of capital for higher claims incurred resulting from the Company’s investment in prior years in higher Member growth. The higher claims incurred that resulted from the higher growth in Members was attributable to the higher utilisation of services rather than a significant increase in average cost per service.
Comprehensive income
Consolidated total comprehensive income for the year was $1.9 million compared to ($2.5 million) in 2017. Thisyear, the Directors of the Company adopted the Directors’estimate of fair value at 30 June 2018 of the carrying values of its commercial properties.
Claims incurred and underwriting
Net claims incurred was $157.1 million compared to $156.4 million in 2017, an increase of 0.5%. The relativelylower growth rate in the claims incurred when compared to the 3.1% increase in premium revenue was due mainlyto the relatively lesser number of policyholders covered during the year.
Underlying this year’s claims incurred, of which 73.1% is Hospital Treatment policies related, was a (0.3%)decrease in the number of hospital claims assessed, a 3.5% increase in medical claims and a (0.4%) decrease inextras claims.
The slightly increased net claims incurred that resulted from higher utilisation of services by a reduced number of policyholders resulted in the Company applying 90.1% of this year’s premium revenue to the net claims incurred,compared to 92.5% in 2017. This was the main driver of the underwriting result of $4.3 million (2.5%) including claims handling and acquisition costs, compared to ($0.6 million) ((0.3%)) in 2017.
Capital management
The Company’s capital management policy and a capital management plan (CMP) guide management’s practicesto ensure that the Company has enough capital to support the risks it undertakes and to meet its liabilities, including in the event of adverse circumstances.
The CMP is aligned to the Board’s risk appetite which evolves through regular reviews. The reviews involveassessing the required levels of internal risk capital and related trigger points and action plans.
The Company’s Investment Policy contains investment rules and guidelines to ensure the appropriate investment of the Company’s available financial and non-financial assets and that those investments are aligned with its risk appetite and profile.
The Company has a suitable pricing philosophy to support its profitability targets and the associated impact on its capital.

HEALTH INSURANCE FUND OF AUSTRALIA ANNUAL FINANCIAL REPORT 2018
DIRECTORS’ REPORT30 June 2018
6
Risk management
The Company’s risk management capability is supported by the operation of an enterprise-wide risk management framework that among other uses, involves the Board using it to monitor and inform itself on an ongoing basis about the Company’s level of exposure (if any) to the key risks and the effectiveness of risk management processes and practices of management and of the organisation.
Investment income and fair value gains / (losses)
The Company’s investment income for the 2018 year was $3.2 million compared to $3.7 million in 2017. This was a relatively good result considering the further deterioration in term deposit interest rates over the previous 12 months.
The fair value (unrealised) gains on financial assets (i.e. the Company’s portfolio of investments) at fair value was $1.41 million compared to the fair value (unrealised) gains of $0.45 million in 2017, an increase of 212%. This was a very good result considering (generally) the performance of capital values over the previous 12 months.
Overheads
The total overheads for the year were $20.6 million (11.8% of premium revenue) compared to $20.4 million (12.1% of premium revenue) in 2017. The main driver of the slight increase in the cost of overheads was the $0.9 million increase in other operating expenses, offset against decreases of $0.5 million in acquisition expenses and $0.2 million in claims handling expense. Acquisition costs fell from 6.3% of premium revenue to 5.9% after an increase in deferred acquisition costs of $0.8 million.
Other operating expenses for the year were $7.5 million compared to $6.6 million in 2017. The main driver of the13.1% increase in these expenses was the $0.5 million increase in employee benefit expenses, $0.2 millionincrease in agents’ commission and $0.2 million increase in information technology expenses to upgrade and maintain core computer software and systems.
Review of Operations
Member growth
The Company’s Member base declined by (3.6%) compared to a decline of (1.5%) in 2017 and 0.5% net growth in the industry. The Company’s strategy to develop as a national health insurer continues to be
successful, resulting in the proportion of the Company’s total Member base from non-traditional markets (states/territories other than Western Australia) at 30 June 2018 being 42% compared to 41% 12 months earlier.
Affordability
On 1 April 2018, the Minister for Health approved a weighted average 5.35% increase to Members’ premiums, compared to a 3.95% weighted average increase for the industry (including the Company). The Company’s increase this year reflects the need to keep pace with the growth in net claims incurred that resulted from increased prices charged by health providers and suppliers and increased service and treatment utilisation that resulted from the Company’s strong Member growth in previous years, and to correct certain product prices in some of the markets in which the Company operates.
Over the last nine (9) years, since the Government has been announcing the annual average increase (effective1 April) by insurer and for the industry, the Company has kept its cumulative annual weighted average premium increases to below the cumulative annual weighted average increases for the industry. When considering the value of money over time for the same period, the Company’s Members, on average, are paying 1.9% less than the industry average increases.
Choice and convenience
The Company’s strong stance on choice aligns with consumer preference for them to remain in control when it comes to choosing their health cover and their service provider. This means that Members retain the freedom to choose any level of hospital and/or extras cover from the Company’s generous range of covers and go to their family health provider without being financially disadvantaged.
Personalised service and convenience
The Company’s priority is to develop its culture, people and processes to ensure Members get access to service-delivery from friendly, qualified, skilled and experienced staff when and in the form, they want it.
The Company does not operate physical branch networks which it regards as cost-prohibitive and remains focussed on building a virtual Member experience model that provides access to relevant and smart digital transaction processing and communication solutions, including self-service options. The Company believes that its Members benefit fromcost savings resulting in a higher allocation of available reserves for new and improved benefits and lower, moreaffordable premiums.

HEALTH INSURANCE FUND OF AUSTRALIA ANNUAL FINANCIAL REPORT 2018
DIRECTORS’ REPORT30 June 2018
7
Investments
The Company’s investments performed satisfactorily considering the negative impact of a further weakening in term deposit interest rates during the year. Returns from fixed interest funds and bank term deposits progressively deteriorated over the year as the official cash rate was held by the Reserve Bank of Australia at 1.50% (since August 2016). Income from investments of $3.2 million in 2018 declined when compared to the $3.7 million earned in 2017. The Company achieved a $1.41 million fair value gain on financial assets at fair value in 2018 compared to a $0.45 million in 2017.
The Company’s portfolio of investments (excluding cash and cash equivalents) increased from $82.2 million at 30 June 2017 to $85.8 million at 30 June 2018, an increase of 4.3% for the year. However, at 30 June 2018 the Company held $11.4 million cash and cash equivalents compared to $15.7 million at 30 June 2017, because the Company re-set the distribution of the funds under management within the permitted bands set out in its Investment Policy with a view to improving the returns from those invested funds.
Property
Although the Company experienced interest from third parties, it was unable to secure another tenant for a portion of its head office premises at 100 Stirling Street, Perth. The Company continues to work with a commercial property agent to pursue prospective tenants for the vacant areas of those premises.
The Company owns a commercial property at 60 - 62 Stirling Street, Perth to earn commercial rent. A new lease was successfully negotiated with the incumbent tenant to extend their occupancy for three years from 1 April 2018 and to take up the remaining, previously untenanted, areas of the property. This property was fully tenanted as at 30 June 2018.
Other Developments
Electronic transaction processing and communications
During the year, the Company continued to focus on developing new and innovative digital workflow andcommunications solutions to improve Member experience, including a refreshed website, and enhanced core software and workflow integration to improve efficiency and effectiveness, and to enhance the clarity of health insurance and policy related information.
Code of conduct
The Company subscribes to the Australian private health insurance industry’s peak representative body, Private Healthcare Australia. The Company subscribes
to and complies with the PHA’s Code of Conduct (Code) and is audited regularly. The Company remains compliant with the Code.
Significant Changes in State of Affairs
There were no significant changes in the state of affairs of the Company during the year ended 30 June 2018.
Significant Matters or Circumstances after 30 June 2018
No matters or circumstances have arisen since 30 June 2018 which significantly affected or may significantly affect the operations of the Company, the results of those operations or the state of affairs of the Company in future years.
Environmental Regulations
The Company’s operations are not subject to any particular environmental regulation under a law of the Commonwealth or of a State or Territory.
The Company is certified NOCO2 by the Carbon Reduction Institute Pty Ltd. Certification confirms theCompany’s financial contribution, by purchasing carbon offsets, towards reducing carbon emissions.
Indemnification of Officers and Auditors
During the year ended 30 June 2018, the Company paid a premium in respect of a contract insuring the Directors, Secretary and all Executive Officers of the Company and of any related body corporate of the Company against a liability incurred as such by a Director, Secretary or Executive Officer to the extent permitted by the Corporations Act 2001 (Cth). The contract of insurance prohibits disclosure of the nature of the liability and the amount of the premium.
To the extent permitted by law, the Company has agreed to indemnify its Auditor, Deloitte Touche Tohmatsu (Deloitte), as part of the terms of its audit engagement agreement (Engagement) against certain claims by third parties arising from the audit work as that term is defined in the Engagement (for an unspecified amount). No payment has been made to indemnify Deloitte during or since the financial year ended 30 June 2018.
The Company has not, during or since the financial year ended 30 June 2018, indemnified or agreed to indemnify an Officer or Auditor of the Company or of any related body corporate against a liability incurred as such an Officer or Auditor.

HEALTH INSURANCE FUND OF AUSTRALIA ANNUAL FINANCIAL REPORT 2018
DIRECTORS’ REPORT30 June 2018
8
Directors’ Meetings
The following table sets out the number of Directors’ meetings (including meetings of committees established bythe Directors) held during the year ended 30 June 2018 and the number of meetings attended by each Director(including committee meetings attended by them as committee members). During the year ended 30 June 2018,nine (9) Board meetings, four (4) Audit and Risk Committee meetings and two (2) Nomination and RemunerationCommittee meetings were held.
Auditor’s Independence Declaration to the Directors of Health Insurance Fund of Australia Limited
The Company has obtained an independence declaration from the Auditor, Deloitte, which is set out on thefollowing page and forms part of this Directors’ report for the year ended 30 June 2018.
Signed in accordance with a resolution of the Directors.
R. HomsanyChairman
Perth, 26 September 2018
Directors Board of DirectorsAudit and
Risk CommitteeNomination and
Remuneration Committee
Held Attended Held Attended Held Attended
Ms S. V. Blake 9 9 — — — —
Mr M. A. Dudley 9 9 4 4 — —
Mr G. N. Gibson 9 9 — — — —
Mr R. Homsany 9 8 4 3 2 2
Mr H. D. Zafer 9 9 4 4 2 2

HEALTH INSURANCE FUND OF AUSTRALIA ANNUAL FINANCIAL REPORT 20189
Liability limited by a scheme approved under Professional Standards Legislation.
Member of Deloitte Touche Tohmatsu Limited
-11-
Board of Directors Health Insurance Fund of Australia Limited 100 Stirling Street PERTH WA 6000
26 September 2018
Dear Board Members
Health Insurance Fund of Australia Limited
In accordance with section 307C of the Corporations Act 2001, I am pleased to provide the following declaration of independence to the directors of Health Insurance Fund of Australia Limited.
As lead audit partner for the audit of the financial statements of Health Insurance Fund of Australia Limited for the financial year ended 30 June 2018, I declare that to the best of my knowledge and belief, there have been no contraventions of:
(i) the auditor independence requirements of the Corporations Act 2001 in relation to the audit;and
(ii) any applicable code of professional conduct in relation to the audit.
Yours sincerely
DELOITTE TOUCHE TOHMATSU
John Sibenaler Partner Chartered Accountant
Deloitte Touche Tohmatsu ABN 74 490 121 060
Tower 2 Brookfield Place 123 St Georges Terrace Perth WA 6000 GPO Box A46 Perth WA 6837 Australia
Tel: +61 8 9365 7000 Fax: +61 8 9365 7001 www.deloitte.com.au

HEALTH INSURANCE FUND OF AUSTRALIA ANNUAL FINANCIAL REPORT 201810
CONSOLIDATED HEALTH INSURANCE FUND OF AUSTRALIA
Note2018
$2017
$2018
$2017
$
Premium revenue 5 174,388,065 169,149,786 174,388,065 169,149,786
Net claims incurred 8 (157,140,980) (156,379,064) (157,140,980) (156,379,064)
Movement in unexpired risk liability 22 208,163 414,809 208,163 414,809
Acquisition expenses 15 (10,261,588) (10,716,444) (10,261,588) (10,716,444)
Claims handling expenses 9 (2,889,630) (3,047,993) (2,889,630) (3,047,993)
Underwriting result 4,304,030 (578,906) 4 ,304,030 (578,906)
Investment income 6 3,174,189 3,695,429 3 ,174,189 3,695,414
Fair value gains on financial assets at fair value through profit or loss
1,409,494 452,170 1,409,494 452,170
Other income 7 489,435 590,042 489,435 590,146
Other operating expenses 9a (7,458,388) (6,594,116) (7,456,854) (6,593,358)
Result of operating activities 1,918,760 (2,435,381) 1,920,294 (2,434,534)
Finance costs 9b (41,584) (47,548) (41,518) ( 47,480)
Profit / (Loss) before income tax 1,877,176 (2,482,929) 1,878,776 (2,482,014)
Income tax benefit / (expense) 10 - 275 - -
PROFIT / (LOSS) FOR THE YEAR 1,877,176 (2,482,654) 1,878,776 (2,482,014)
Other comprehensive income - - - -
TOTAL COMPREHENSIVE INCOME FOR THE YEAR
1,877,176 (2,482,654) 1,878,776 (2,482,014)
The above statement of profit or loss and other comprehensive income should be read in conjunction with the accompanying notes.
HEALTH INSURANCE FUND OF AUSTRALIA LTD AND ITS CONTROLLED ENTITY
STATEMENT OF PROFIT OR LOSS AND OTHER COMPREHENSIVE INCOMEFor the year ended 30 June 2018
HEALTH INSURANCE FUND OF AUSTRALIA ANNUAL FINANCIAL REPORT 201811
CONSOLIDATED HEALTH INSURANCE FUND OF AUSTRALIA
Note2018
$2017
$2018
$2017
$
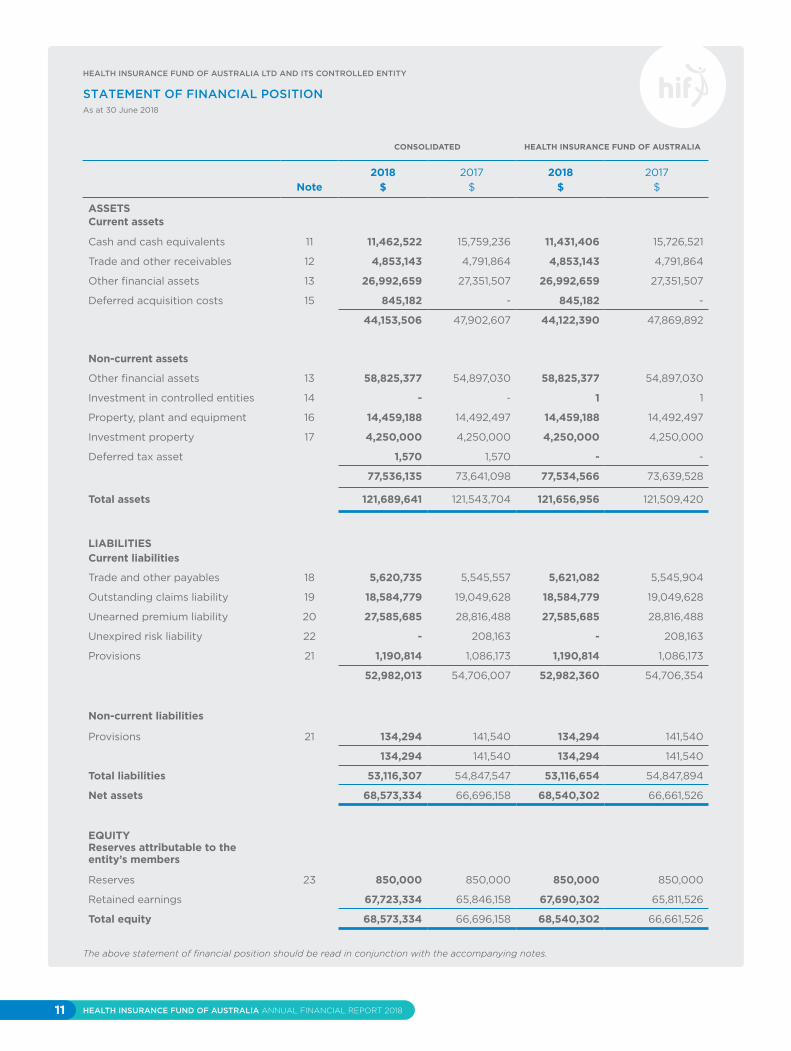
ASSETSCurrent assets
Cash and cash equivalents 11 11,462,522 15,759,236 11,431,406 15,726,521
Trade and other receivables 12 4,853,143 4,791,864 4,853,143 4,791,864
Other financial assets 13 26,992,659 27,351,507 26,992,659 27,351,507
Deferred acquisition costs 15 845,182 - 845,182 -
44,153,506 47,902,607 44,122,390 47,869,892
Non-current assets
Other financial assets 13 58,825,377 54,897,030 58,825,377 54,897,030
Investment in controlled entities 14 - - 1 1
Property, plant and equipment 16 14,459,188 14,492,497 14,459,188 14,492,497
Investment property 17 4,250,000 4,250,000 4,250,000 4,250,000
Deferred tax asset 1,570 1,570 - -
77,536,135 73,641,098 77,534,566 73,639,528
Total assets 121,689,641 121,543,704 121,656,956 121,509,420
LIABILITIESCurrent liabilities
Trade and other payables 18 5,620,735 5,545,557 5,621,082 5,545,904
Outstanding claims liability 19 18,584,779 19,049,628 18,584,779 19,049,628
Unearned premium liability 20 27,585,685 28,816,488 27,585,685 28,816,488
Unexpired risk liability 22 - 208,163 - 208,163
Provisions 21 1,190,814 1,086,173 1,190,814 1,086,173
52,982,013 54,706,007 52,982,360 54,706,354
Non-current liabilities
Provisions 21 134,294 141,540 134,294 141,540
134,294 141,540 134,294 141,540
Total liabilities 53,116,307 54,847,547 53,116,654 54,847,894
Net assets 68,573,334 66,696,158 68,540,302 66,661,526
EQUITY Reserves attributable to the entity’s members
Reserves 23 850,000 850,000 850,000 850,000
Retained earnings 67,723,334 65,846,158 67,690,302 65,811,526
Total equity 68,573,334 66,696,158 68,540,302 66,661,526
The above statement of financial position should be read in conjunction with the accompanying notes.
HEALTH INSURANCE FUND OF AUSTRALIA LTD AND ITS CONTROLLED ENTITY
STATEMENT OF FINANCIAL POSITIONAs at 30 June 2018

HEALTH INSURANCE FUND OF AUSTRALIA ANNUAL FINANCIAL REPORT 201812
CONSOLIDATEDREVALUATION
RESERVERETAINEDEARNINGS
TOTAL
$ $ $
At 1 July 2016 - 68,328,812 68,328,812
Fair value revaluation of land and buildings 850,000 - 850,000
Loss for the year - (2,482,654) (2,482,654)
Total comprehensive income for the year 850,000 (2,482,654) (1,632,654)
At 30 June 2017 850,000 65,846,158 66,696,158
Profit for the year - 1,877,176 1,877,176
Total comprehensive income for the year - 1,877,176 1,877,176
At 30 June 2018 850,000 67,723,334 68,573,334
HEALTH INSURANCE FUND OF AUSTRALIAREVALUATION
RESERVERETAINEDEARNINGS
TOTAL
$ $ $
At 1 July 2016 - 68,293,540 68,293,540
Fair value revaluation of land and buildings 850,000 - 850,000
Loss for the year - (2,482,014) (2,482,014)
Total comprehensive income for the year 850,000 (2,482,014) (1,632,014)
At 30 June 2017 850,000 65,811,526 66,661,526
Profit for the year - 1,878,776 1,878,776
Total comprehensive income for the year - 1,878,776 1,878,776
At 30 June 2018 850,000 67,690,302 68,540,302
The above statement of changes in equity should be read in conjunction with the accompanying notes.
HEALTH INSURANCE FUND OF AUSTRALIA LTD AND ITS CONTROLLED ENTITY
STATEMENT OF CHANGES IN EQUITYFor the year ended 30 June 2018

HEALTH INSURANCE FUND OF AUSTRALIA ANNUAL FINANCIAL REPORT 201813
CONSOLIDATED HEALTH INSURANCE FUND OF AUSTRALIA
Note2018
$2017
$2018
$2017
$
Cash flows from operating activities
Premiums received 173,227,795 174,576,748 173,227,795 174,576,748
Interest and unit distributions received 3,124,811 3,692,036 3,124,811 3,692,021
Other income received 91,317 249,934 91,317 248,390
Amounts paid to the Risk Equalisation Special Account
(17,409,986) (17,080,880) (17,409,986) (17,080,880)
Rent received 355,913 364,294 355,913 364,294
Claims paid (139,428,144) (139,404,872) (139,428,144) (139,404,872)
Ambulance Levy (657,764) (656,304) (657,764) (656,304)
Interest and other finance payments (666,254) (790,230) (666,188) (790,162)
Payments to suppliers and employees (20,114,335) (18,965,170) (20,112,802) (18,962,408)
Net cash (used in) / generated by operating activities
24 (1,476,647) 1,985,556 (1,475,048) 1,986,826
Cash flows from investing activities
Payments to acquire financial assets (28,657,032) (17,444,353) (28,657,032) (17,444,353)
Proceeds from sale of financial assets 26,497,027 7,033,836 26,497,027 7,033,836
Payments for property, plant and equipment (756,880) (312,853) (756,880) (312,853)
Proceeds from disposal of property, plant and equipment
96,818 - 96,818 -
Net cash flows used in investing activities
(2,820,067) (10,723,370) (2,820,067) (10,723,370)
Net cash flows from / (used in) financing activities
- - - -
Net decrease in cash and cash equivalents
(4,296,714) (8,737,814) (4,295,115) (8,736,544)
Cash and cash equivalents at beginning of period
15,759,236 24,497,050 15,726,521 24,463,065
Cash and cash equivalents at end of period 11,462,522 15,759,236 11,431,406 15,726,521
The above statement of cash flows should be read in conjunction with the accompanying notes.
HEALTH INSURANCE FUND OF AUSTRALIA LTD AND ITS CONTROLLED ENTITY
STATEMENT OF CASH FLOWSFor the year ended 30 June 2018

HEALTH INSURANCE FUND OF AUSTRALIA ANNUAL FINANCIAL REPORT 201814
Summary of significant accounting policies
a) General information
Health Insurance Fund of Australia Limited (the Company) is a company limited by guarantee incorporated in Australia. The address of its registered office and principal place of business is disclosed in the corporate information on page 3. The principal activities of the Company and its subsidiaries (the Group) are described in the Directors’ Report on page 6.
b) Application of new and revised Accounting Standards
b.1) Standards and Interpretations adopted in the current yearThe Company has adopted all of the new and revised Standards and Interpretations issued by the Australian Accounting Standards Board that are relevant to their operations and are effective for the current financial reporting period beginning 1 July 2017.
The following new and revised Standards and Interpretations have been adopted in the current period:
– AASB 1048 Interpretation of Standards
– AASB 2016-1 Amendments to Australian Accounting Standards – Recognition of Deferred Tax Assets for Unrealised Losses
– AASB 2016-2 Amendments to Australian Accounting Standards – Disclosure Initiative: Amendments to AASB 107
– AASB 2017-2 Amendments to Australian Accounting Standards – Further Annual Improvements 2014 - 2016 Cycle
The impact of the adoption of these Standards and Interpretation did not have a material impact on the Company.
b.2) Standards and Interpretations in issue not yet adopted
At the date of authorisation of the financial statements, the Standards and Interpretations listed below were in issue but not yet effective. The potential impact of the adoption of these Standards and Interpretations is still being evaluated by the Group.
1
STANDARD / INTERPRETATIONEFFECTIVE FOR ANNUAL REPORTING PERIODS BEGINNING ON OR AFTER
EXPECTED TO BE INITIALLY APPLIED IN THE FINANCIAL YEAR ENDING
AASB 9 Financial Instruments and relevant amending standards 1 January 2018 30 June 2019
AASB 15 Revenue from Contracts with Cusomers and relevant amending standards 1 January 2018 30 June 2019
AASB 16 Leases 1 January 2019 30 June 2020
AASB 17 Insurance Contracts 1 January 2021 30 June 2022
AASB 1058 Income of Not-for-Profit Entities and relevant amending standards 1 January 2019 30 June 2020
AASB 2014-10 Amendments to Australian Accounting Standards – Sale or Contribution of Assets between an Investor and its Associate or Joint Venture and relevant amending standards
1 January 2018 30 June 2019
AASB 2016-6 Amendments to Australian Accounting Standards – Applying AASB 9 Financial Instruments with AASB 4 Insurance Contracts
1 January 2018 30 June 2019
AASB 2017-1 Amendments to Australian Accounting Standards – Transfers of Investment Property, Annual Improvements 2014 - 2016 Cycle and Other Amendments
1 January 2018 30 June 2019
AASB 2017-3 Amendments to Australian Accounting Standards - Clarifications to AASB 4 1 January 2018 30 June 2019
AASB 2018-1 Amendments to Australian Accounting Standards - Annual Improvements 2015 - 2017 Cycle 1 January 2019 30 June 2020
AASB 2018-2 Amendments to Australian Accounting Standards - Plan Amendment, Curtailment or Settlement 1 January 2019 30 June 2020
HEALTH INSURANCE FUND OF AUSTRALIA LTD AND ITS CONTROLLED ENTITY
NOTES TO THE FINANCIAL STATEMENTS30 June 2018

HEALTH INSURANCE FUND OF AUSTRALIA ANNUAL FINANCIAL REPORT 201815
Summary of significant accounting policies (continued)
b) Application of new and revised accounting standards (continued)
b.2 Standards and Interpretations in issue not yet adopted (continued)At the date of authorisation of the financial statements the following IASB Standards and IFRIC Interpretations were also in issue but not yet effective, although Australian equivalent Standards and interpretations have not yet been issued.
c) Statement of compliance
These financial statements are general purpose financial statements which have been prepared in accordance with the Corporations Act 2001, Accounting Standards and Interpretations, and comply with other requirements of the law.
The financial statements comprise the consolidated financial statements of the Group and Company. For the purposes of preparing the consolidated financial statements, the Company is a not for profit entity.
Accounting Standards include Australian Accounting Standards. Compliance with Australian Accounting Standards ensures that the financial statements and notes of the Company and the Group comply with International Financial Reporting Standards (IFRS).
The financial statements were authorised for issue by the directors on 26 September 2018.
d) Basis of preparation
The consolidated financial statements have been prepared in accordance with Australian Accounting Standards, other authoritative pronouncements of the Australian Accounting Standards Board and requirements of the Australian Prudential Regulation Authority (APRA).
These financial statements have been prepared on a historical cost basis, except for land and buildings and financial assets at fair value through profit and loss, which have been measured at fair value, as explained in the accounting policies below.
All amounts are presented in Australian dollars, which is the Group’s functional currency, unless otherwise noted. Historical cost is generally based on the fair value of the consideration given in exchange for assets.
e) Basis of consolidation
The consolidated financial statements incorporate the financial statements of the Company and the entity controlled by the Company. Control is achieved when the Company:
– has power over the investee; – is exposed, or has rights, to variable returns from its involvement with the investee; and – has the ability to use its power to affect its returns.
The Company reassesses whether or not it controls an investee if facts and circumstances indicate that there are changes to one or more of the three elements of control listed above.
Consolidation of a subsidiary begins when the Company obtains control over the subsidiary and ceases when the Company loses control of the subsidiary. Specifically, income and expenses of a subsidiary acquired or disposed of during the year are included in the consolidated statement of profit or loss and other comprehensive income from the date the Company gains control until the date when the Company ceases to control the subsidiary.
When necessary, adjustments are made to the financial statements of subsidiaries to bring their accounting policies into line with the Group’s accounting policies.
All intragroup assets and liabilities, equity, income, expenses and cash flows relating to transactions between members of the Group are eliminated in full on consolidation.
1
STANDARD / INTERPRETATIONEFFECTIVE FOR ANNUAL REPORTING PERIODS BEGINNING ON OR AFTER
EXPECTED TO BE INITIALLY APPLIED IN THE FINANCIAL YEAR ENDING
None currently
HEALTH INSURANCE FUND OF AUSTRALIA LTD AND ITS CONTROLLED ENTITY
NOTES TO THE FINANCIAL STATEMENTS30 June 2018

HEALTH INSURANCE FUND OF AUSTRALIA ANNUAL FINANCIAL REPORT 201816
HEALTH INSURANCE FUND OF AUSTRALIA LTD AND ITS CONTROLLED ENTITY
NOTES TO THE FINANCIAL STATEMENTS30 June 2018
1 Summary of significant accounting policies (continued)
f) Revenue recognition
Revenue is recognised to the extent that it is probable that the economic benefits will flow to the entity and the revenue can be reliably measured. The following specific recognition criteria must also be met before revenue is recognised:
Premium revenue
Premium revenue comprises amounts charged to the policyholders, excluding taxes collected on behalf of third parties.
Premium revenue is recognised from the attachment date, over the period of contract on a daily basis. Where time does not approximate the pattern of risk, previous claims experience is used to derive the incidence of risk.
The proportion of premium received or receivable not earned at the reporting date is recognised in the balance sheet as an unearned premium liability.
Interest
Revenue is recognised as interest accrues using the effective interest method. This is a method of calculating the amortised cost of a financial asset and allocating the interest income over the relevant period using the effective interest rate, which is the rate that exactly discounts estimated future cash receipts through the expected life of the financial asset to the net carrying amount of the financial asset.
Rental income
Rental income from operating leases is recognised on a straight-line basis over the term of the relevant lease.
g) Claims expense
Claims expense represents payment for claims and the movement in outstanding claims liabilities [Note 1(l)].
h) Risk Equalisation Special Account levies / recoveries
Under the provisions of the Private Health Insurance Act 2007 (Cth), all health insurers must participate in the Risk Equalisation Special Account (RESA). The RESA shares a proportion of the hospital claims of all persons aged 55 years and over and those persons with claims in excess of $50,000 in the current and preceding three quarters, amongst all health insurers based upon the number of policy holders. Individual health insurers are required to pay in to the RESA or receive a payment from the RESA for the difference between their proportional share and their actual claims paid.
The amounts payable to and receivable from the Risk Equalisation Special Account are determined by the Australian Prudential Regulation Authority (APRA) after the end of each quarter. Estimated provisions for amounts payable and income receivable are recognised on an accrual basis.
i) Acquisition costs
Acquisition costs incurred in obtaining health insurance contracts are deferred and recognised as assets where they can be reliably measured and where it is probable that they will give rise to premium revenue that will be recognised in the income statement in subsequent reporting periods.
Deferred acquisition costs (DAC) includes commission paid to intermediaries and other direct costs incurred in relation to the acquisition or renewal of health insurance contracts. Acquisition costs incurred are amortised in accordance with the expected pattern of the incidence of risk under the health insurance contracts to which they relate. This pattern of amortisation corresponds to the earning pattern of the corresponding premium revenue.
j) Unearned premium liabilities
Unearned premium liability is determined by apportioning the premium written over the period of the policy from date of attachment of risk.

HEALTH INSURANCE FUND OF AUSTRALIA ANNUAL FINANCIAL REPORT 201817
Summary of significant accounting policies (continued)
k) Unexpired risk liability
Liability adequacy testing is performed in order to recognise any deficiencies in the income statement arising from the carrying amount of the unearned premium liability less any related deferred acquisition costs (DAC) and intangible assets not meeting the estimated future claims under current health insurance contracts.
Liability adequacy testing is performed at the level of a portfolio of contracts that are subject to broadly similar risks and are managed together as a single portfolio.
If the present value of the expected future cash flows relating to future claims plus the anticipated administration costs attributable to processing the claims and additional risk margin to reflect the inherent uncertainty in the central estimate, exceeds the unearned premium liability less related intangible assets and related DAC, then the shortfall is first offset against related DAC and then to the extent necessary a separate unexpired risk liability is recognised.
l) Outstanding claims liability
The liability for outstanding claims is measured as the central estimate of the present value of future projected claims payments and associated claims handling costs in respect of claims reported but not yet paid, claims incurred but not reported (IBNR) and claims incurred but not enough reported (IBNER).
Standard actuarial methods are applied to assess the net central estimate of outstanding claims liabilities. Features and trends of claim experience including claim frequencies, average claim sizes and individual claim estimates are analysed and assumptions about the future are selected.
A risk margin is added to the central estimate in determining the outstanding claims liabilities. The risk margin is designed to increase the probability of the outstanding claims liabilities proving ultimately to be adequate.
m) Financial assets at fair value through profit or loss
(i) Financial assets backing health insurance liabilities
Assets backing health insurance liabilities are segregated from other assets.
Financial assets are held to back health insurance liabilities on the basis that these assets are valued at fair value in the balance sheet, and consist of liquid and high quality investments such as cash and fixed income securities.
The management of financial assets and health insurance liabilities are closely monitored to ensure that investments are appropriate, given the expected pattern of future cash flows arising from health insurance liabilities.
Financial assets backing health insurance liabilities are designated at fair value through profit or loss. Initial recognition is at cost and subsequent measurement is at fair value in the statement of financial position with any resultant unrealised profits and losses recognised in the income statement.
(ii) Determination of fair value
Fair value for the various types of financial assets is determined as follows:
(a) Cash and term deposits - at face value of the amounts deposited;(b) Unlisted securities - based on redemption value per unit as reported by the fund managers using valuation techniques.
Such valuation techniques include the use of recent arm’s length transactions, reference to other instruments that have substantially the same characteristics, discounted cash flow analysis or any other valuation technique that provides a reliable estimate of prices obtained in actual market transactions.
1
HEALTH INSURANCE FUND OF AUSTRALIA LTD AND ITS CONTROLLED ENTITY
NOTES TO THE FINANCIAL STATEMENTS30 June 2018

HEALTH INSURANCE FUND OF AUSTRALIA ANNUAL FINANCIAL REPORT 201818
Summary of significant accounting policies (continued)
m) Financial assets at fair value through profit or loss (continued)
(iii) Recognition and de-recognition
All purchases and sales of financial assets that require delivery of the asset within the time frame established by regulation or market convention are recognised at trade date, being the date on which the Group commits to buy or sell the asset. In cases where the period between trade and settlement exceeds this time frame, the transaction is recognised at settlement date.
Financial assets are de-recognised when the rights to receive future cash flows from the assets have expired, or have been transferred, and the Group has transferred substantially all risks and rewards of ownership.
n) Impairment of financial assets
The Group assesses at each balance sheet date whether a financial asset or group of financial assets is impaired.
(i) Financial assets carried at cost
If there is objective evidence that an impairment loss has been incurred on an unquoted equity instrument that is not carried at fair value (because its fair value cannot be reliably measured), the amount of the loss is measured as the difference between the asset’s carrying amount and the present value of estimated future cash flows, discounted at the current market rate of return for a similar financial asset.
o) Property, plant and equipment
Property, plant and equipment, excluding buildings and freehold land, are depreciated over their estimated useful lives using the reducing balance and straight line methods. Buildings are depreciated on a straight line basis to write off the net cost or revalued amount over their expected useful lives. Depreciation rates are as follows:
The gain or loss on disposal is calculated as the difference between the carrying amount of the asset at the time of disposal and the net proceeds on disposal.
Buildings and freehold land are valued using the revaluation model whereby measurement subsequent to initial recognition is at fair value at the date of the latest revaluation less any subsequent accumulated depreciation and accumulated impairment losses.
Every third year the valuations are based on external property valuation reports. In the intervening years, valuations are based on management estimates. All properties are valued simultaneously.
When a revaluation increases the carrying value of a property, the increase is credited directly to equity under the heading of revaluation reserve. However, an increase is recognised in profit or loss to the extent that it reverses a revaluation decrease of the same asset previously recognised in the income statement.
When an asset’s carrying amount is decreased as a result of a revaluation, the decrease is recognised in the income statement. However, any decrease is debited directly to equity under the heading of revaluation reserve to the extent of any credit balance existing in the revaluation reserve in respect of that asset. Any remaining balance on the revaluation reserve is credited to retained earnings when the corresponding property is de- recognised.
Properties in the course of construction for administrative purposes, or for purposes not yet determined, are carried at cost, less any recognised impairment loss. Cost includes professional fees. Depreciation of these assets, on the same basis as other property assets, commences when the assets are ready for their intended use.
Freehold buildings 2.5%
Office furniture and equipment 5%-33.3%
Motor vehicles 20%
1
HEALTH INSURANCE FUND OF AUSTRALIA LTD AND ITS CONTROLLED ENTITY
NOTES TO THE FINANCIAL STATEMENTS30 June 2018

HEALTH INSURANCE FUND OF AUSTRALIA ANNUAL FINANCIAL REPORT 201819
HEALTH INSURANCE FUND OF AUSTRALIA LTD AND ITS CONTROLLED ENTITY
NOTES TO THE FINANCIAL STATEMENTS30 June 2018
Summary of significant accounting policies (continued)
p) Cash and cash equivalents
Cash and short term deposits comprise cash at bank and in hand and short term deposits with an original maturity of three months or less.
For the purposes of the cash flow statement, cash and cash equivalents consist of cash and cash equivalents as defined above, net of outstanding bank overdrafts.
q) Receivables
Trade receivables, which generally have 15-30 day terms, are recognised and carried at original invoice amount less an allowance for any uncollectible amounts.
Amounts due from policyholders and intermediaries are initially recognised at fair value, being the amounts due. They are subsequently measured at fair value which is approximated by taking the initially recognised amount and reducing it for impairment as appropriate.
An allowance for doubtful debts is made when there is objective evidence that the entity will not be able to collect the debts. Financial difficulties of the debtor, default payments or debts more than 90 days overdue are considered objective evidence of doubtful debts. Bad debts are written off when identified. Amounts due under the Federal Government Rebate Incentives Scheme are stated at the net amount expected to be collected.
r) Taxation
(i) Income tax
In accordance with Section 50 - 30 of the Income Tax Assessment Act 1997 (Cth), the income of the Company is exempt from income tax. The profit of the controlled entity, which is included in the consolidated statements of the Company, has been determined after providing for taxation expense at 30% of the controlled entity’s pre-tax operating profit, adjusted for exempt income and non-deductible expenses.
(ii) Deferred tax
Deferred tax is provided in full, using the Balance Sheet approach, on temporary differences arising between the tax bases of assets and liabilities and their carrying amounts in the statement of financial position.Deferred tax assets and liabilities are recognised at the tax rates expected to apply when the assets are recovered or liabilities are settled. Deferred tax assets are recognised to the extent that it is probable that future taxable profit will be available against which the temporary differences can be utilised.
Current and deferred taxes attributable to amounts recognised directly in equity are recognised in equity.
(iii) Goods and services tax
Revenue, expenses and assets are recognised net of the amount of goods and services tax (GST). Receivables and payables are stated inclusive of GST. The net amount of GST recoverable from, or payable to, the tax authority is included as part of receivables and payables.
Cash flows are included in the statement of cash flow on a gross basis. Commitments and contingencies are disclosed net of the amount of GST recoverable from, or payable to, the taxation authority.
s) Impairment of assets
Assets that have an indefinite useful life are not subject to amortisation and are tested annually for impairment. Assets are reviewed for impairment whenever events or changes in circumstances indicate that the carrying amount of the assets may not be recoverable.
1

HEALTH INSURANCE FUND OF AUSTRALIA ANNUAL FINANCIAL REPORT 201820
Summary of significant accounting policies (continued)
s) Impairment of assets (continued)
An impairment loss is recognised for the amount by which the asset’s carrying amount exceeds its recoverable amount. Any resultant write-down is recognised as an expense in the reporting period in which it occurs, unless the asset had previously been revalued, in which case the previous revaluation is written back with any excess being expensed.
The recoverable amount is the higher of an asset’s fair value, less direct selling costs, and its value in use. In assessing the value-in-use of assets, the relevant cash flows are discounted to their present value using a discount rate that reflects current market assessments of the time value of money and the risks specific to the asset or company of assets.
For the purpose of assessing impairment, assets are grouped at the lowest levels for which there are separately identifiable operational cash flows (cash generating units).
t) Payables
Trade payables and other payables are carried at amortised costs and represent liabilities for goods and services provided to the Group prior to the end of the financial year that are unpaid and arise when the Group becomes obliged to make future payments in respect of the purchase of these goods and services. Payables, generally have 15 - 30 day terms.
u) Employee benefits
Provision is made for employee entitlement benefits accumulated as a result of employees rendering services up to the reporting date. These benefits include wages and salaries, annual leave, rostered days off and long service leave and they are measured at their nominal value, except the liability for long service leave which is measured as the present value of the expected payments to be made in respect of services provided by employees up to the reporting date.
Liabilities arising in respect of wages and salaries, annual leave, sick leave and any other employee benefits expected to be settled within twelve months of the reporting date are measured at their nominal amounts based on remuneration rates which are expected to be paid when the liability is settled. All other employee benefit liabilities are measured at the present value of the estimated future cash outflow to be made in respect of services provided by employees up to the reporting date. In determining the present value of future cash outflows, the market yield as at the reporting date on national government bonds, which have terms to maturity approximating the terms of the related liability, are used.
Payments to defined contribution retirement benefit plans are recognised as an expense when employees have rendered service entitling them to the contributions.
v) Leasing
Leases are classified as finance leases whenever the terms of the lease transfer substantially all the risks and rewards of ownership to the lessee. All other leases are classified as operating leases.
Rental income from operating leases is recognised on a straight-line basis over the term of the relevant lease. Initial direct costs incurred in negotiating and arranging an operating lease are added to the carrying amount of the leased asset and recognised on a straight-line basis over the lease term.
1
HEALTH INSURANCE FUND OF AUSTRALIA LTD AND ITS CONTROLLED ENTITY
NOTES TO THE FINANCIAL STATEMENTS30 June 2018

HEALTH INSURANCE FUND OF AUSTRALIA ANNUAL FINANCIAL REPORT 201821
1
HEALTH INSURANCE FUND OF AUSTRALIA LTD AND ITS CONTROLLED ENTITY
NOTES TO THE FINANCIAL STATEMENTS30 June 2018
Summary of significant accounting policies (continued)
w) Investment property
Investment properties are properties held to earn rentals and/or for capital appreciation (including property under construction for such purposes). Investment properties are measured initially at its cost, including transaction costs. Subsequent to initial recognition, investment properties are measured at fair value. Gains and losses arising from changes in the fair value of investment properties are included in profit or loss in the period in which they arise.
An investment property is derecognised upon disposal or when the investment property is permanently withdrawn from use and no future economic benefits are expected from the disposal. Any gain or loss arising on derecognition of the property (calculated as the difference between the net disposal proceeds and the carrying amount of the asset) is included in profit or loss in the period in which the property is derecognised.
Estimates and judgements are made by the Group to arrive at certain key asset and liability amounts disclosed in the financial statements. These estimates and judgements are continually being evaluated and are based on historical experience and other factors, including expectations of future events that are believed to be reasonable under the circumstances. The key areas of significant judgement and the methodologies used to determine key assumptions are set out below. Uncertainty over estimate of claims expense provision arising from health insurance contractsActuarial estimates are obtained after analysis of past claims experience. From these analyses, models of the claim payment process can be established and used to project future payments on claims outstanding at the balance date.
The estimates of outstanding claims obtained in this manner are estimates in the sense that there is a degree of uncertainty as to the difference which will ultimately arise between the estimates and the final result of the experience. This uncertainty arises from four sources:
(a) the nature of the claims process is not fully understood, it might be that none of the valuation models used is an entirely accurate representation of reality;(b) there are components of randomness in the claims process, it is not possible to estimate the parameters of that process with complete precision even if complete confidence were felt in the nature of the model;(c) any erroneous data will similarly have introduced uncertainties into the estimates of those parameters;(d) even if the parameters could be estimated with precision, it would not be possible to predict outstanding claims with the same precision because of the random component in future experience.
Errors associated with (b) and (d) can be quantified in a formal way (estimation and statistical errors). However a large part of the uncertainty is associated with (a) (model specification error), and it is not possible to quantify this component.
The investigation and application of different models to the data is intended to reduce the model specification error, although the extent to which this is achieved is unknown.
The initial estimates obtained from the calculations are central estimates in the sense that they incorporate no deliberate bias towards over or under estimation. By definition, the estimates are intended to have about an even chance of ultimately turning out to be sufficient.
The nature of health insurance claims is such that the actual value of the liabilities is unknown because claims experience is subject to random fluctuations. The amount of the claim liability cannot be estimated with certainty. Also it is very difficult to determine the central estimate with a reasonable degree of precision. For this reason the inherent uncertainty in the central estimate must also be considered.
The provisions adopted in the Company’s accounts are greater than the central estimate and the difference is referred to as a prudential margin. The prudential margin allows for some part of the uncertainties in the claim process and it also ensures that as far as possible that the surplus is not released until it is reasonably certain that the surplus is real.
The estimated liability for outstanding claims has been calculated after allowing for expenses associated with administering claims during the run-off period. Given the short weighted mean term of the liability (less than two months) no explicit allowances have been made for inflation and discounting.
Actuarial methods and assumptions
All actuarial methods and assumptions are discussed in Note 3.
2 Critical accounting estimates and judgements
HEALTH INSURANCE FUND OF AUSTRALIA ANNUAL FINANCIAL REPORT 201822
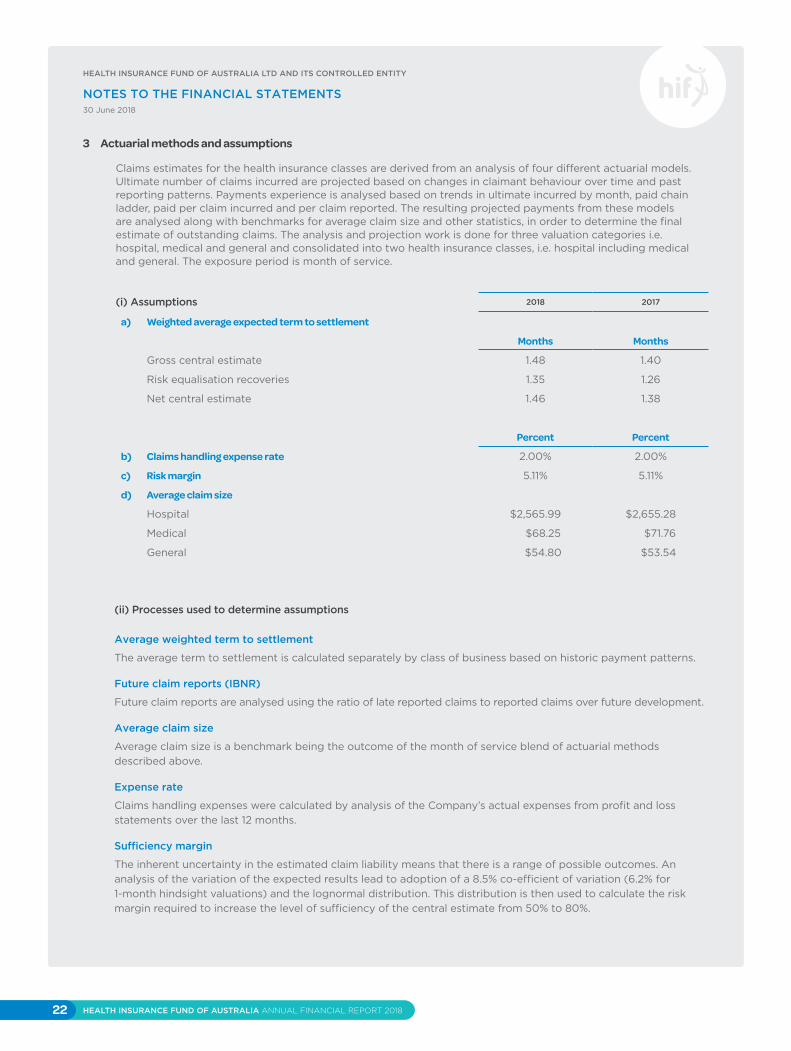
Actuarial methods and assumptions
Claims estimates for the health insurance classes are derived from an analysis of four different actuarial models. Ultimate number of claims incurred are projected based on changes in claimant behaviour over time and past reporting patterns. Payments experience is analysed based on trends in ultimate incurred by month, paid chain ladder, paid per claim incurred and per claim reported. The resulting projected payments from these models are analysed along with benchmarks for average claim size and other statistics, in order to determine the final estimate of outstanding claims. The analysis and projection work is done for three valuation categories i.e. hospital, medical and general and consolidated into two health insurance classes, i.e. hospital including medical and general. The exposure period is month of service.
(i) Assumptions
3
2018 2017
a) Weighted average expected term to settlement
Months Months
Gross central estimate 1.48 1.40
Risk equalisation recoveries 1.35 1.26
Net central estimate 1.46 1.38
Percent Percent
b) Claims handling expense rate 2.00% 2.00%
c) Risk margin 5.11% 5.11%
d) Average claim size
Hospital $2,565.99 $2,655.28
Medical $68.25 $71.76
General $54.80 $53.54
(ii) Processes used to determine assumptions
Average weighted term to settlement
The average term to settlement is calculated separately by class of business based on historic payment patterns.
Future claim reports (IBNR)
Future claim reports are analysed using the ratio of late reported claims to reported claims over future development.
Average claim size
Average claim size is a benchmark being the outcome of the month of service blend of actuarial methods described above.
Expense rate
Claims handling expenses were calculated by analysis of the Company’s actual expenses from profit and loss statements over the last 12 months.
Sufficiency margin
The inherent uncertainty in the estimated claim liability means that there is a range of possible outcomes. An analysis of the variation of the expected results lead to adoption of a 8.5% co-efficient of variation (6.2% for 1-month hindsight valuations) and the lognormal distribution. This distribution is then used to calculate the risk margin required to increase the level of sufficiency of the central estimate from 50% to 80%.
HEALTH INSURANCE FUND OF AUSTRALIA LTD AND ITS CONTROLLED ENTITY
NOTES TO THE FINANCIAL STATEMENTS30 June 2018

HEALTH INSURANCE FUND OF AUSTRALIA ANNUAL FINANCIAL REPORT 201823
Actuarial methods and assumptions (continued)
(iii) Sensitivity analysis - insurance contracts
The Company conducts sensitivity analyses to quantify the exposure risk of changes in the key underlying variables and assumptions, as described above. The movement in any key variable will impact the performance and equity of the Company.
The tables below describe how a change in each assumption will affect the insurance liabilities and hence the profit / (loss) and the equity both gross and net of risk equalisation.
3
Variable Impact of movement in variable
Average weighted term to settlement Does not directly affect the insurance liabilities.
Average claim sizesAverage claim size is determined by the valuation, see above, and is used as a benchmark. Hence it is not sensitivity tested.
Adopted reporting ratesUsed to determine the level of claims incurred but not reported (IBNR). An increase or decrease in lodgements have a corresponding impact on claims expense.
Incurred cost in latest two service months
A change in the ultimate claims cost incurred for the most recent two service months will have a disproprtionate impact on the outstanding claims amount due to the claim payments made to date.
Sufficiency marginAn increase or decrease in the coefficient of variation has a corresponding impact on the sufficiency margin and hence on the actuarial provision.
Claims handling expensesAn increase or decrease in the expense rate assumption has acorresponding impact on claims expense.
Impact of changes in key variables
INCREASE / (DECREASE) IN PROFIT AND EQUITY ($)
2018 2017
Variable Movement in variable
Gross of risk equalisation
Net of risk equalisation
Gross of risk equalisation
Net of risk equalisation
Adopted reporting rates 1% decrease1% increase
13,220( 13,315)
15,189(15,299)
13,857(13,942)
15,928(16,026)
Incurred cost of latest two service months
1% decrease1% increase
248,899(248,899)
285,984(285,984)
268,366(268,366)
308,482(308,482)
Sufficiency margin 1% decrease1% increase
125,555( 125,555)
144,262(144,262)
121,664(121,664)
139,851(139,851)
Claims management expenses
1% decrease1% increase
111,749(111,749)
128,399(128,399)
108,235(108,235)
124,414(124,414)
HEALTH INSURANCE FUND OF AUSTRALIA LTD AND ITS CONTROLLED ENTITY
NOTES TO THE FINANCIAL STATEMENTS30 June 2018

HEALTH INSURANCE FUND OF AUSTRALIA ANNUAL FINANCIAL REPORT 201824
Risk management
The Group’s financial condition and operating activities are affected by a number of key financial risks including interest rate risk, credit risk, market risk, liquidity risk and fiscal risk and non-financial risks including insurance risk, compliance risk and operational risk. The Group’s policies and procedures in respect of managing financial and insurance risks are set out in this note.
a) Corporate governance framework
The Board of Directors of the Company is responsible for the corporate governance of the Group. The Board of Directors of the Company determines the Group’s overall risk appetite and approves the management strategies, policies and practices to ensure that risks, including compliance risks, are identified and managed within the context of this appetite.
Audit and Risk Committee
The Audit and Risk Committee is a committee of the Board of Directors of the Company. PricewaterhouseCoopers, the Company’s outsourced internal auditor, operates under a charter adopted by the Board. It is the Board’s responsibility to ensure that an effective internal control framework exists within the Group. This includes internal controls to deal with both the effectiveness and efficiency of significant business processes, together with the safeguarding of assets, the maintenance of proper accounting records, the reliability of financial information as well as non-financial considerations such as the benchmarking of operational key performance indicators.
The Audit and Risk Committee is responsible for:
(1) monitoring the Risk Management Plan;(2) reviewing the audit plans of the internal and external auditor;(3) monitoring and appraising the activities of the internal and external auditor;(4) recommending the appointment of the external auditor, and reviewing and recommending the adoption of the statutory accounts to the Board.
Board
The Board is responsible for determining investment policy and reviewing investment performance, having regard to advice from the Audit and Risk Committee. The Board utilises specialised investment management services for the management of the investment portfolio.
Nomination and Remuneration Committee
The Nomination and Remuneration Committee is a committee of the Board of Directors of the Company. The Nomination and Remuneration Committee is responsible for succession planning and for reviewing performance and compensation arrangements for the directors and key management personnel.
The Board is responsible for ensuring that management’s objectives and activities are aligned with the expectations and risks identified by the Board. The Board has a number of mechanisms in place to ensure this is achieved. In addition to the establishment of the Committees referred to above, these mechanisms include the following:
(1) approval of the strategic agenda, which encompasses the Group’s vision, mission and strategy, that is designed to meet stakeholders’ needs and manage business risk;(2) implementation of operating plans and budgets by management and monitoring of progress against budget by the Board which includes the establishment and monitoring of key performance indicators (both financial and non-financial) for all significant business processes.
b) Capital management framework
Capital comprises the total equity as reflected in the balance sheet. The Company operates within the regulatory environment established by the Private Health Insurance Act 2007 (Cth) (the “Act”). The regulatory body for the Private Health Insurance industry is the Australian Prudential Regulation Authority (APRA). The Company is subject to the Solvency and Capital Adequacy Standards applied by the Act and regulated by APRA. The Company is required to submit quarterly returns to APRA as well as an annual audited return that is used to establish whether the Company complies with the standards. The Company has exceeded the required Solvency and Capital Adequacy reserves throughout the year, except for a period between 30 September 2017 and 10 November 2017 when the Company mistakenly relied, in part, upon an indirectly held demand deposit (Colonial First State Premium Cash Fund) to satisfy the Solvency Standard.
4
HEALTH INSURANCE FUND OF AUSTRALIA LTD AND ITS CONTROLLED ENTITY
NOTES TO THE FINANCIAL STATEMENTS30 June 2018
HEALTH INSURANCE FUND OF AUSTRALIA ANNUAL FINANCIAL REPORT 201825
Risk management (continued)
The Company makes use of the Financial Condition Report (FCR) prepared by its Appointed Actuary to inform the Board of Directors about decisions on capital management issues. The FCR is a medium term projection of the overall financial position of the business under a variety of economic and operating scenarios, allowing for new business. The FCR considers a number of key performance indicators in addition to solvency and capital requirements. The FCR enables the Company to assess a range of risks to which the business is exposed, their evolution over time, and the impact of the mitigating actions that might be taken.
Other tools the Company utilises to manage its capital requirements are the annual premium submission to the Department of Health, forecasts, the annual budget and monthly management accounts. The annual premium submission considers the financial impact of the Company’s plans over the next two years and the impact on capital adequacy and solvency. The annual premium submission, which is reviewed by the Company’s Appointed Actuary, is approved by the Minister for Health.
c) Insurance risk - health insurance
The Company’s insurance activities primarily involve the underwriting of risks and claim management. The Company employs a disciplined approach to underwriting and risk management that emphasises maximising member benefits rather than a premium, volume or market share oriented approach.
(i) Risk management objectives and policies for mitigating insurance risk
The risk management activities include prudent underwriting, pricing, acceptance and management of risk process, together with claim management, reserving and investment. The objective of these disciplines is to enhance the financial performance of the Company’s overall health insurance operations.
The key policies in place to mitigate risks arising from writing health insurance contracts include the following:
(a) the maintenance and use of management information systems that provide up-to-date, reliable data on the risks to which the business is exposed at any point in time;(b) the use of actuarial models based on historical data to calculate premiums and monitor claims patterns;(c) the mix of assets invested in is matched to the term of the insurance liabilities to maximise the investment performance;(d) the diversification of business over two classes of insurance and a large number of uncorrelated individual risks seeks to reduce variability in loss experience.
(ii) Terms and conditions of health insurance business
The terms and conditions attaching to health insurance contracts affect the level of insurance risk accepted by the Company. There are no special terms and conditions in any non-standard contracts that have a material impact on the financial statements.
(iii) Concentration of insurance risk
The Company’s exposure is concentrated in Western Australia where 57% of its policy holders reside. This concentration risk will change as the Company expands its business in other States and Territories.
(iv) Claims management and claims provisioning risks
The Company’s approach to determining the outstanding claims liability is set out in Note 3. The Company’s Appointed Actuary determines the Company’s outstanding claims liability, that is reported at balance date, using approved actuarial methodology.
d) Risk equalisation risk
The Australian Prudential Regulation Authority (APRA) administers the Risk Equalisation Special Account (RESA) in terms of the Private Health Insurance Act 2007 (Cth). All private health insurance funds in Australia are required to submit their quarterly eligible claims data to APRA for inclusion in an age based and high cost claims pool. The pool is divided by the total number of single equivalent units (SEU’s) across all funds. The SEU rate is then applied to the number of SEU’s in the fund and compared to the fund’s actual risk equalisation eligible claims for the quarter. Each fund then either contributes their shortfall to or receives a payment for their surplus from the RESA. This arrangement spreads the risk of high cost claims and higher claiming older members across all funds in each defined RESA jurisdiction in Australia.
e) Financial risks
With regards to credit risk, liquidity risk and interest rate risk management, refer to note 27.
4
HEALTH INSURANCE FUND OF AUSTRALIA LTD AND ITS CONTROLLED ENTITY
NOTES TO THE FINANCIAL STATEMENTS30 June 2018

HEALTH INSURANCE FUND OF AUSTRALIA ANNUAL FINANCIAL REPORT 201826
Premium revenue5
CONSOLIDATED AND HEALTH INSURANCE FUND OF AUSTRALIA
Hospital Tables
General Tables
Total
Premium revenue has been determined after including
2018 premium revenue
Premiums received including Federal Government rebates 120,293,356 52,934,439 173,227,795
+/- premiums in arrears 61,943 31,210 93,153
+/- unearned premium liability 600,843 619,641 1,220,484
+/- amount receivable from the Federal Government Rebate Incentives Scheme (106,484) (46,883) (153,367)
Total premium revenue 120,849,658 53,538,407 174,388,065
2017 premium revenue
Premiums received including Federal Government rebates 119,776,182 54,800,566 174,576,748
+/- premiums in arrears (6,097) (10,927) (17,024)
+/- unearned premium liability (4,216,401) (1,365,653) (5,582,054)
+/- amount receivable from the Federal Government Rebate Incentives Scheme 118,121 53,994 172,115
Total premium revenue 115,671,805 53,477,980 169,149,786
Investment income (net)6
CONSOLIDATEDHEALTH INSURANCE FUND
OF AUSTRALIA
2018 $
2017 $
2018 $
2017 $
Investment income 3,174,189 3,695,429 3,174,189 3,695,414
Investment income includes interest income and distribution income from unit trust investments.
Other income7
CONSOLIDATEDHEALTH INSURANCE FUND
OF AUSTRALIA
2018 $
2017 $
2018 $
2017 $
Profit from sale of property, plant and equipment 29,902 - 29,902
-
Reversal of impairment - 115,106 - 115,106
Rental revenue 355,913 364,294 355,913 364,294
Other revenue 103,620 110,642 103,620 110,747
489,435 590,042 489,435 590,146
HEALTH INSURANCE FUND OF AUSTRALIA LTD AND ITS CONTROLLED ENTITY
NOTES TO THE FINANCIAL STATEMENTS30 June 2018

HEALTH INSURANCE FUND OF AUSTRALIA ANNUAL FINANCIAL REPORT 201827
Net Claims incurred8
CONSOLIDATED AND HEALTH INSURANCE FUND OF AUSTRALIA
Current Year $
Prior Years $
Total $
2018
Gross claims expense
Gross claims incurred - undiscounted 142,836,366 (3,927,839) 138,908,527
Discount movement - - -
142,836,366 (3,927,839) 138,908,527
Ambulance Levies 657,230 - 657,230
Risk equalisation expense
Risk equalisation expense - undiscounted 18,365,974 (790,751) 17,575,223
Discount movement - - -
18,365,974 (790,751) 17,575,223
Net claims incurred 161,859,570 (4,718,590) 157,140,980
2017
Gross claims expense
Gross claims incurred - undiscounted 142,021,452 (2,917,302) 139,104,150
Discount movement - - -
142,021,452 (2,917,302) 139,104,150
Ambulance Levies 658,081 - 658,081
Risk equalisation revenue
Risk equalisation revenue - undiscounted 18,085,958 (1,469,126) 16,616,832
Discount movement - - -
18,085,958 (1,469,126) 16,616,832
Net claims incurred 160,765,491 (4,386,428) 156,379,064
Current year amounts relate to risks borne in the current financial year. Prior period amounts relate to a reassessment of the risks borne in all previous financial years.
The Company values are the same as the consolidated values.
HEALTH INSURANCE FUND OF AUSTRALIA LTD AND ITS CONTROLLED ENTITY
NOTES TO THE FINANCIAL STATEMENTS30 June 2018

HEALTH INSURANCE FUND OF AUSTRALIA ANNUAL FINANCIAL REPORT 201828
Other expenses9
CONSOLIDATEDHEALTH INSURANCE FUND
OF AUSTRALIA
2018 $
2017 $
2018 $
2017 $
a) Other operating expenses
Commission 1,049,395 817,153 1,049,395 817,153
Information technology 1,424,380 1,234,852 1,424,380 1,234,852
Depreciation 723,274 746,857 723,274 746,857
Post-employment benefits 818,524 781,733 818,524 781,733
Other employee benefits 9,806,019 9,383,762 9,806,019 9,383,762
Legal fees 47,252 131,444 45,719 130,685
Postage and telephone 465,219 477,246 465,218 477,246
Printing and stationery 125,377 116,009 125,377 116,009
Rental and property expenses 605,080 544,819 605,080 544,819
Advertising 4 ,113,780 3,885,097 4,113,780 3,885,035
Other expenses 1,651,818 1,496,899 1,651,818 1,496,962
20,830,118 19,615,871 20,828,584 19,615,113
Reclassification to deferred acquisition costs (10,759,340) (10,309,744) (10,759,340) (10,309,744)
Reclassification to claims handling expenses (2,612,390) (2,712,011) (2,612,390) (2,712,011)
7,458,388 6,594,116 7,456,854 6,593,358
b) Finance costs
Financial charges and taxes 666,254 790,230 666,188 790,162
Reclassification to deferred acquisition costs (347,430) (406,700) (347,430) (406,700)
Reclassification to claims handling expenses (277,240) (335,982) (277,240) (335,982)
41,584 47,548 41,518 47,480
HEALTH INSURANCE FUND OF AUSTRALIA LTD AND ITS CONTROLLED ENTITY
NOTES TO THE FINANCIAL STATEMENTS30 June 2018

HEALTH INSURANCE FUND OF AUSTRALIA ANNUAL FINANCIAL REPORT 201829
Income tax10
CONSOLIDATEDHEALTH INSURANCE FUND
OF AUSTRALIA
2018 $
2017 $
2018 $
2017 $
Income tax expense
Deferred tax - (275) - -
Total tax (benefit) / expense charged to profit or loss - (275) - -
Reconciliation between net profit before tax and tax expense
Profit / (Loss) before income tax expense 1,877,176 (2,482,929) 1,878,776 (2,482,014)
Tax at the Australian tax rate of 30% (2017: 30%)
563,153 (744,879) 563,633 (744,604)
Exempt income of parent entity (563,633) 744,604 (563,633) 744,604
Deferred tax asset not recognised on loss insubsidiary
480 - - -
Tax charge / (benefit) for the year - (275) - -
Cash and cash equivalents11
Cash on hand 1,000 629 1,000 629
Cash at bank and on call 11,307,691 7,655,446 11,276,575 7,622,731
Short-term deposits 153,831 8,103,161 153,831 8,103,161
11,462,522 15,759,236 11,431,406 15,726,521
Receivables12
Current
Premiums in arrears 313,440 220,101 313,440 220,101
Investment income receivable 156,860 107,482 156,860 107,482
Amounts due from the Federal Government Rebate Incentives Scheme
3,358,430 3,511,797 3,358,430 3,511,797
Other amounts receivable 1,024,413 952,484 1,024,413 952,484
4,853,143 4,791,864 4,853,143 4,791,864
HEALTH INSURANCE FUND OF AUSTRALIA LTD AND ITS CONTROLLED ENTITY
NOTES TO THE FINANCIAL STATEMENTS30 June 2018

HEALTH INSURANCE FUND OF AUSTRALIA ANNUAL FINANCIAL REPORT 201830
Other financial assets 13
CONSOLIDATEDHEALTH INSURANCE FUND
OF AUSTRALIA
2018 $
2017 $
2018 $
2017 $
Current
Term deposits 26,992,659 27,351,507 26,992,659 27,351,507
Non-current
Investments in unit trusts 58,825,377 54,897,030 58,825,377 54,897,030
The group holds investments in unit trusts carried at fair value through profit or loss (FVTPL).
Investments in controlled entities14
CONSOLIDATEDHEALTH INSURANCE FUND
OF AUSTRALIA
2018 $
2017 $
2018 $
2017 $
Health Insurance Australia Pty Ltd - - 1 1
- - 1 1
The subsidiary company is 100% owned by Health Insurance Fund of Australia Limited. The subsidiary company changed its name from HIF Financial Services Pty Ltd to Health Insurance Australia Pty Ltd on 20 February 2017.
Deferred acquisition costs15
CONSOLIDATEDHEALTH INSURANCE FUND
OF AUSTRALIA
2018 $
2017 $
2018 $
2017 $
Deferred acquisition costs at 1 July - - - -
Acquisition costs deferred 11,106,770 10,716,444 11,106,770 10,716,444
Recognised in income statement (10,261,588) (10,716,444) (10,261,588) (10,716,444)
Deferred acquisition costs at 30 June 845,182 - 845,182 -
HEALTH INSURANCE FUND OF AUSTRALIA LTD AND ITS CONTROLLED ENTITY
NOTES TO THE FINANCIAL STATEMENTS30 June 2018

HEALTH INSURANCE FUND OF AUSTRALIA ANNUAL FINANCIAL REPORT 201831
Property, plant and equipment16
CONSOLIDATEDHEALTH INSURANCE FUND
OF AUSTRALIA
2018 $
2017 $
2018 $
2017 $
Land at fair value 3,000,000 3,000,000 3,000,000 3,000,000
Buildings at fair value 10,559,283 10,544,978 10,559,283 10,544,978
Less: accumulated depreciation 649,358 394,978 649,358 394,978
12,909,925 13,150,000 12,909,925 13,150,000
Office furniture and equipment - at cost 4,222,980 3,765,876 4,222,980 3,765,876
Less: accumulated depreciation 2,940,124 2,549,150 2,940,124 2,549,150
1,282,856 1,216,726 1,282,856 1,216,726
Motor vehicles - at cost 325,423 249,988 325,423 249,988
Less: accumulated depreciation 59,016 124,217 59,016 124,217
266,407 125,771 266,407 125,771
Total property, plant and equipment 14,459,188 14,492,497 14,459,188 14,492,497
The basis of valuation for land and buildings is the fair value based on existing use. The Company’s Board of Directors is of the opinion that this basis provides a reasonable estimate of the recoverable amount. There was a revaluation of the Company’s freehold land and buildings in June 2017. The valuation was based on the fair market value of the property at that date by reference to several methodologies including summation method, capitalisation method and comparable rate method and was conducted in accordance with independent valuation standards. The valuation was performed by Andrew Buchanan of Knight Frank Australia Pty Ltd who is a Certified Practising Valuer (Licensed Valuer # 44366). Management does not believe that the fair market value of the properties has changed materially since the June 2017 valuation.The historic cost of the revalued land and buildings was $2,068,152.
HEALTH INSURANCE FUND OF AUSTRALIA LTD AND ITS CONTROLLED ENTITY
NOTES TO THE FINANCIAL STATEMENTS30 June 2018

HEALTH INSURANCE FUND OF AUSTRALIA ANNUAL FINANCIAL REPORT 201832
Property, plant and equipment (continued)16
Land &
Buildings $
Office Furniture & Equipment
$
Motor
Vehicles $
Total $
Reconciliation of property, plant and equipment 2018 - consolidated
Carrying amount at 1 July 2017 13,150,000 1,216,725 125,772 14,492,497
Revaluation - - - -
Additions 14,305 468,011 274,564 756,880
Disposals - - (66,916) (66,916)
Depreciation expense (254,380) (401,881) (67,012) (723,273)
Carrying amount at 30 June 2018 12,909,925 1,282,855 266,408 14,459,188
Reconciliation of property, plant and equipment 2017 - consolidated
Carrying amount at 1 July 2016 12,441,679 1,343,946 175,770 13,961,395
Revaluation 965,106 - - 965,106
Additions 4,547 308,306 - 312,853
Disposals - - - -
Depreciation expense (261,332) (435,527) (49,998) (746,857)
Carrying amount at 30 June 2017 13,150,000 1,216,725 125,772 14,492,497
Reconciliation of property, plant and equipment 2018 - Health Insurance Fund of Australia
Carrying amount at 1 July 2017 13,150,000 1,216,725 125,772 14,492,497
Revaluation - - - -
Additions 14,305 468,011 274,564 756,880
Disposals - - (66,916) (66,916)
Depreciation expense (254,380) (401,881) (67,012) (723,273)
Carrying amount at 30 June 2018 12,909,925 1,282,855 266,408 14,459,188
Reconciliation of property, plant and equipment 2017 - Health Insurance Fund of Australia
Carrying amount at 1 July 2016 12,441,679 1,343,946 175,770 13,961,395
Revaluation 965,106 - - 965,106
Additions 4,547 308,306 - 312,853
Disposals - - - -
Depreciation expense (261,332) (435,527) (49,998) (746,857)
Carrying amount at 30 June 2017 13,150,000 1,216,725 125,772 14,492,497
HEALTH INSURANCE FUND OF AUSTRALIA LTD AND ITS CONTROLLED ENTITY
NOTES TO THE FINANCIAL STATEMENTS30 June 2018

HEALTH INSURANCE FUND OF AUSTRALIA ANNUAL FINANCIAL REPORT 201833
Investment property17
CONSOLIDATEDHEALTH INSURANCE FUND
OF AUSTRALIA
2018 $
2017 $
2018 $
2017 $
Fair value
Completed investment property 4,250,000 4,250,000 4,250,000 4,250,000
Balance at beginning of year 4,250,000 4,164,060 4,250,000 4,164,060
Additions - - - -
Revaluation - 85,940 - 85,940
Balance at end of year 4,250,000 4,250,000 4,250,000 4,250,000
All of the Group’s investment property is held under freehold interests.
The fair value of the Group’s investment property as at 30 June 2017 has been arrived at on the basis of a valuation carried out in June 2017 by Andrew Buchanan of Knight Frank Australia Pty Ltd who is an independent valuer not related to the Group. Mr Buchanan is a member of the Institute of Valuers of Australia, and has appropriate qualifications and recent experience in the valuation of properties in the relevant location.
The valuation was based on the fair market value of the property at that date by reference to several methodologies including summation method, capitalisation method and comparable rate method and was conducted in accordance with independent valuation standards. In estimating the fair value of the properties, the highest and best use of the property is its current use. Management does not believe that the fair market value of the properties has changed materially since the June 2017 valuation.
Trade and other payables18
CONSOLIDATEDHEALTH INSURANCE FUND
OF AUSTRALIA
2018 $
2017 $
2018 $
2017 $
Amounts due to the Risk Equalisation Special Account 4,480,442 4,369,973 4,480,442 4,369,973
Trade payables 783,640 656,735 783,986 657,081
Other creditors 356,653 518,849 356,654 518,850
5,620,735 5,545,557 5,621,082 5,545,904
The average credit period on purchases is 30 days. No interest is charged on the trade payables for the first 30 days from the date of the invoice.
HEALTH INSURANCE FUND OF AUSTRALIA LTD AND ITS CONTROLLED ENTITY
NOTES TO THE FINANCIAL STATEMENTS30 June 2018

HEALTH INSURANCE FUND OF AUSTRALIA ANNUAL FINANCIAL REPORT 201834
Outstanding claims liability19
CONSOLIDATEDHEALTH INSURANCE FUND
OF AUSTRALIA
2018 $
2017 $
2018 $
2017 $
a) Outstanding claims liability
Central estimate (A) 14,181,882 13,748,354 14,181,882 13,748,354
Claims handling costs (B) 244,311 236,736 244,311 236,736
Risk margin (C) 737,352 714,398 737,352 714,398
Gross outstanding claims liability 15,163,545 14,699,488 15,163,545 14,699,488
Outstanding claims payable 3,421,234 4,350,140 3,421,234 4,350,140
Outstanding claims liability 18,584,779 19,049,628 18,584,779 19,049,628
Gross claims incurred - undiscounted
(A)+(B)+(C) 15,163,545 14,699,488 15,163,545 14,699,488
b) Reconciliation of movement in gross outstanding claims liability
Brought forward (D) 14,699,488 14,857,116 14,699,488 14,857,116
Effect of changes in assumptions (1,537,259) (1,710,226) (1,537,259) (1,710,226)
Increase in claims incurred /recoveries anticipated over the year
15,163,545 14,699,488 15,163,545 14,699,488
Incurred claims recognised inincome statement (E) 13,626,286 12,989,261 13,626,286 12,989,261
Claim payments/recoveries duringthe year (F) 13,162,229 13,146,889 13,162,229 13,146,889
Carried forward (D)+(E)+(F) 15,163,545 14,699,488 15,163,545 14,699,488
c) Claims development tables
The claims development table is not required where uncertainty about amount and timing is typically resolved within one year. As greater than 99.9% of the Company’s claims are resolved within one year, the claims development table has not been included.
d) Risk margins
Uncertainty was analysed for each portfolio taking into account potential uncertainties relating to the actuarial models and assumptions, the data quality, the health insurance environment and the impact of legislative reform.
As the Company is a single portfolio comprising two correlated classes of risk, no allowance is made for diversification when setting the risk margin. The risk margin applied to increase the level of adequacy of the central estimate to 80% is 5.1%
HEALTH INSURANCE FUND OF AUSTRALIA LTD AND ITS CONTROLLED ENTITY
NOTES TO THE FINANCIAL STATEMENTS30 June 2018

HEALTH INSURANCE FUND OF AUSTRALIA ANNUAL FINANCIAL REPORT 201835
Unearned premium liability20
CONSOLIDATEDHEALTH INSURANCE FUND
OF AUSTRALIA
2018 $
2017 $
2018 $
2017 $
Unearned premium liability at beginning of the period 28,816,488 23,240,014 28,816,488 23,240,014
Deferral of premiums on contracts paid in the period 27,585,685 28,816,488 27,585,685 28,816,488
Earning of premiums paid in previous periods
(28,816,488)
(23,240,014) (28,816,488)
(23,240,014)
Unearned premium liability at the end of the period 27,585,685 28,816,488 27,585,685 28,816,488
Provisions for employee entitlements 21
CONSOLIDATEDHEALTH INSURANCE FUND
OF AUSTRALIA
2018 $
2017 $
2018 $
2017 $
Current
Annual leave 613,641 553,491 613,641 553,491
Long service leave 577,173 532,682 577,173 532,682
1,190,814 1,086,173 1,190,814 1,086,173
Non-current
Long service leave 134,294 141,540 134,294 141,540
HEALTH INSURANCE FUND OF AUSTRALIA LTD AND ITS CONTROLLED ENTITY
NOTES TO THE FINANCIAL STATEMENTS30 June 2018

HEALTH INSURANCE FUND OF AUSTRALIA ANNUAL FINANCIAL REPORT 201836
Unexpired risk liability22
CONSOLIDATEDHEALTH INSURANCE FUND
OF AUSTRALIA
2018 $
2017 $
2018 $
2017 $
(a) Unexpired risk liability
Unexpired risk liability opening balance 208,163 622,972 208,163 622,972
Release of unexpired risk liability inthe period (208,163) (414,809) (208,163) (414,809)
Unexpired risk liability closing balance - 208,163 - 208,163
(b) Calculation of deficiency
Contributions in advance (CIA)
Unearned premium liability 27,585,685 28,816,488 27,585,685 28,816,488
Less: related deferred acquisition costs 845,182 - 845,182 -
26,740,503 28,816,488 26,740,503 28,816,488
Future claims* 26,049,796 28,185,856 26,049,796 28,185,856
Risk margin 690,707 838,795 690,707 838,795
26,740,503 29,024,651 26,740,503 29,024,651
Unexpired risk liability - CIA - 208,163 - 208,163
Constructive obligation (CO)
Unearned premium liability 137,997,438 135,356,134 137,997,438 135,356,134
Less: related deferred acquisition costs 4,228,022 - 4,228,022 -
133,769,416 135,356,134 133,769,416 135,356,134
Future claims* 129,192,052 131,217,769 129,192,052 131,217,769
Risk margin 3,425,511 3,904,966 3,425,511 3,904,966
132,617,563 135,122,735 132,617,563 135,122,735
Unexpired risk liability - CO - - - -
Unexpired risk liability - CIA and CO - 208,163 - 208,163
* Central estimate of present value of expected future cash flows arising from future claims including risk equalisation and policy handling expenses
The liability adequacy test identified a surplus (2017: deficit) for the combined portfolio of Hospital and General contracts that are subject to broadly similar risks that are managed together as a single portfolio. The process for determining the overall risk margin of 3.0%, is based on a coefficient of variation of 4.5% at 75% level of sufficiency.
The related deferred acquisition costs were recognised in the current year only to the extent of the surplus and were not recognised in the prior year due to the deficit.
As health insurance contracts have no end date, unlike a general insurance contract, health funds are obliged to keep offering and renewing their products to members thus giving rise to a constructive obligation. The constructive obligation is required to be included when performing the liability adequacy test to determine the unexpired risk liability. It is generally recognised that whilst health insurance contracts have no end date, a health fund will be able to alter its product’s prices at least annually (from 1 April), thus limiting the impact of the constructive obligation.
HEALTH INSURANCE FUND OF AUSTRALIA LTD AND ITS CONTROLLED ENTITY
NOTES TO THE FINANCIAL STATEMENTS30 June 2018

HEALTH INSURANCE FUND OF AUSTRALIA ANNUAL FINANCIAL REPORT 201837
Reserves23
CONSOLIDATEDHEALTH INSURANCE FUND
OF AUSTRALIA
2018 $
2017 $
2018 $
2017 $
Reserves comprise revaluation of:
Land and buildings 850,000 850,000 850,000 850,000
The land and buildings revaluation reserve arises on the revaluation of land and buildings. When revalued land or buildings are sold, the portion of the properties revaluation reserve that relates to that asset, and that is effectively realised, is transferred directly to retained earnings.
Reconciliation of net cash provided by operating activities to profit or loss24
CONSOLIDATEDHEALTH INSURANCE FUND
OF AUSTRALIA
2018 $
2017 $
2018 $
2017 $
Net profit / (loss) from ordinary activities after tax
1,877,176 (2,482,654) 1,878,776 (2,482,014)
Adjustments for:
Depreciation 723,274 746,855 723,274 746,855
Profit on sale of property, plant and equipment (29,902) - (29,902) -
Fair value gains on financial assets (1,409,494) (452,170) (1,409,494) (452,170)
Reversal of impairment - (115,106) - (115,106)
1,161,054 (2,303,075) 1,162,654 (2,302,436)
Increase in deferred acquisition costs (845,182) - (845,182) -
(Decrease) / Increase in unearned premium liability
(1,230,803) 5,576,474 (1,230,803) 5,576,474
Decrease in unexpired risk liability (208,163) (414,809) (208,163) (414,809)
(Increase) / Decrease in contributions in arrears (93,340) 17,089 (93,340) 17,089
Decrease in outstanding claims (464,848) (482,727) (464,848) (482,727)
Increase in employee entitlements 97,396 51,628 97,396 51,628
Increase in other assets - (275) - -
Decrease / (Increase) in other debtors 81,438 (109,891) 81,438 (111,541)
Increase / (Decrease) in creditors 75,178 (345,464) 75,178 (343,459)
Increase in interest receivable (49,378) (3,393) (49,378) (3,393)
Net cash (used in) / generated by operating activities
(1,476,647) 1,985,556 (1,475,048) 1,986,826
HEALTH INSURANCE FUND OF AUSTRALIA LTD AND ITS CONTROLLED ENTITY
NOTES TO THE FINANCIAL STATEMENTS30 June 2018
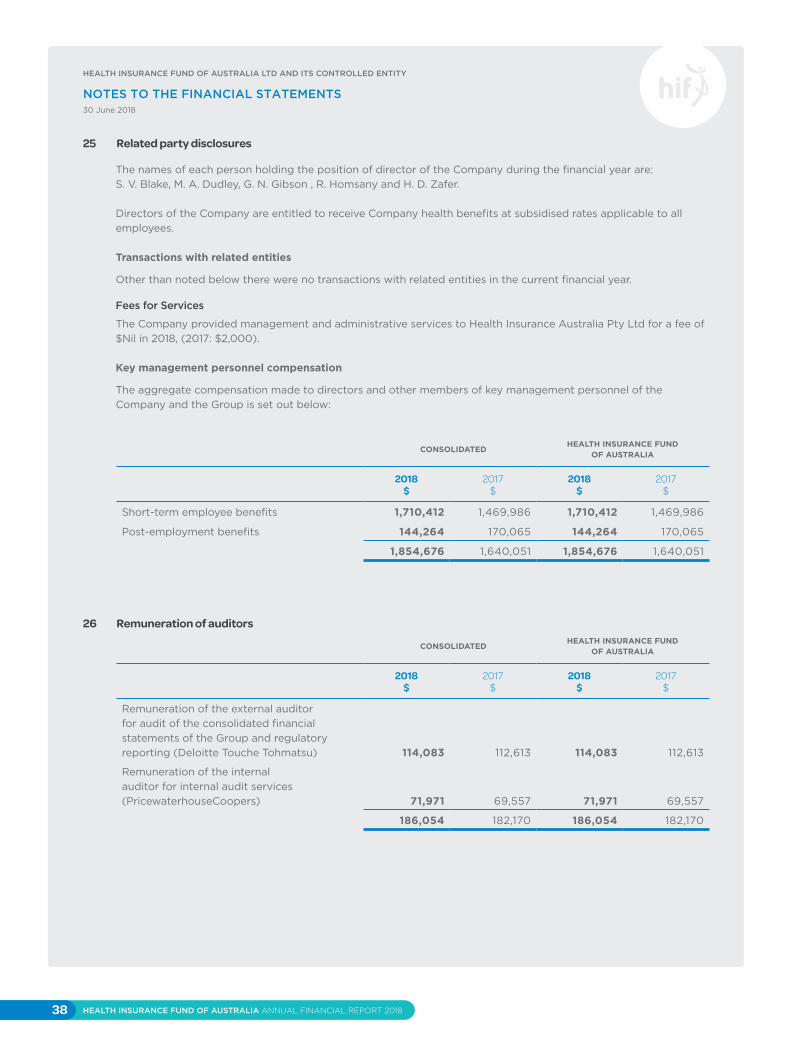
HEALTH INSURANCE FUND OF AUSTRALIA ANNUAL FINANCIAL REPORT 201838
Related party disclosures25
CONSOLIDATEDHEALTH INSURANCE FUND
OF AUSTRALIA
2018 $
2017 $
2018 $
2017 $
Short-term employee benefits 1,710,412 1,469,986 1,710,412 1,469,986
Post-employment benefits 144,264 170,065 144,264 170,065
1,854,676 1,640,051 1,854,676 1,640,051
The names of each person holding the position of director of the Company during the financial year are:S. V. Blake, M. A. Dudley, G. N. Gibson , R. Homsany and H. D. Zafer.
Directors of the Company are entitled to receive Company health benefits at subsidised rates applicable to all employees.
Transactions with related entities
Other than noted below there were no transactions with related entities in the current financial year.
Fees for Services
The Company provided management and administrative services to Health Insurance Australia Pty Ltd for a fee of $Nil in 2018, (2017: $2,000).
Key management personnel compensation
The aggregate compensation made to directors and other members of key management personnel of the Company and the Group is set out below:
Remuneration of auditors26
CONSOLIDATEDHEALTH INSURANCE FUND
OF AUSTRALIA
2018 $
2017 $
2018 $
2017 $
Remuneration of the external auditor for audit of the consolidated financial statements of the Group and regulatory reporting (Deloitte Touche Tohmatsu) 114,083 112,613 114,083 112,613
Remuneration of the internal auditor for internal audit services (PricewaterhouseCoopers) 71,971 69,557 71,971 69,557
186,054 182,170 186,054 182,170
HEALTH INSURANCE FUND OF AUSTRALIA LTD AND ITS CONTROLLED ENTITY
NOTES TO THE FINANCIAL STATEMENTS30 June 2018

HEALTH INSURANCE FUND OF AUSTRALIA ANNUAL FINANCIAL REPORT 201839
Financial instruments27
a) Financial risk
The Group is exposed to a number of forms of financial risk, the most significant being market risk. This section provides an explanation of the other aspects in which the Group is affected by financial risks.
(i) Market risk
The Group takes on exposure to market risks including, fair value risk, interest risk and price risk. Market risks arise from open positions in interest rates and equity products, all of which are exposed to general and specific market movements. The market risks that the Group primarily faces are equity risk and interest rate risk, due to the nature of its investments and liabilities.
Investment activity for the Group is undertaken in accordance with an investment policy established by the Board of Directors. The policy stipulates cash flow requirements, liquidity management, authorised investments and maximums, composition of portfolio, performance benchmarks and credit structure.
At 30 June, the Group had the following mix of financial assets exposed to equities price risk:
CONSOLIDATEDHEALTH INSURANCE FUND
OF AUSTRALIA
2018 $
2017 $
2018 $
2017 $
Financial assets
Investment in unit trusts 58,825,377 54,897,030 58,825,377 54,897,030
The unit trusts primarily invest in companies listed on the Australian Stock Exchange (ASX).At 30 June, if the S&P/ASX 300 Index had moved, as illustrated in the table below, with all other variables held constant, post tax profit/equity would have been affected as follows:
POST TAX PROFIT/EQUITY HIGHER/(LOWER)
CONSOLIDATEDHEALTH INSURANCE FUND
OF AUSTRALIA
2018 $
2017 $
2018 $
2017 $
+ 10% S&P/ASX 300 Index 2,511,284 2,194,587 2,511,284 2,194,587
- 10% S&P/ASX 300 Index (2,511,284) (2,194,587) (2,511,284) (2,194,587)
HEALTH INSURANCE FUND OF AUSTRALIA LTD AND ITS CONTROLLED ENTITY
NOTES TO THE FINANCIAL STATEMENTS30 June 2018

HEALTH INSURANCE FUND OF AUSTRALIA ANNUAL FINANCIAL REPORT 201840
Financial instruments (continued)27
(ii) Interest rate risk
The Group manages its exposure to interest rate risk through a diversified portfolio of investments including property and equity investments in addition to interest bearing assets. The interest bearing assets are further diversified in type and duration.
At balance date, the Group had the following mix of financial assets and liabilities exposed to Australian variable interest rate risk:
CONSOLIDATEDHEALTH INSURANCE FUND
OF AUSTRALIA
2018 $
2017 $
2018 $
2017 $
Financial assets
Cash and cash equivalents 11,462,522 15,759,236 11,431,406 15,726,521
Term deposits 26,992,659 27,351,507 26,992,659 27,351,507
38,455,181 43,110,743 38,424,065 43,078,028
At 30 June, if interest rates had moved, as illustrated in the table below, with all other variables held constant, post tax profit and hence equity would have been affected as follows:
POST TAX PROFIT/EQUITY HIGHER/(LOWER)
CONSOLIDATEDHEALTH INSURANCE FUND
OF AUSTRALIA
2018 $
2017 $
2018 $
2017 $
+ 1.0% (100 basis points) 721,677 760,619 721,366 760,292
- 0.5% (50 basis points) (360,839) (380,310) (360,683) (380,146)
The movements in profit/equity are due to higher/lower interest income from variable rate cash and term deposit balances.
(iii) Liquidity risk
The Company is exposed to daily calls on its available cash resources from policy claims. Liquidity risk is the risk that payment of obligations may not be met in a timely manner at a reasonable cost. The Company’s Board sets limits on the minimum proportion of maturing funds available to meet such calls and to cover claims at unexpected levels of demand.
The following table reflects all contractually fixed pay-offs and receivables for settlement, repayments and interest resulting from recognised financial assets and liabilities at 30 June 2018. The undiscounted cash flows for the respective upcoming fiscal years are presented. Cash flows for financial assets and liabilities without fixed amount or timing are based on the conditions existing at 30 June 2018.
HEALTH INSURANCE FUND OF AUSTRALIA LTD AND ITS CONTROLLED ENTITY
NOTES TO THE FINANCIAL STATEMENTS30 June 2018

HEALTH INSURANCE FUND OF AUSTRALIA ANNUAL FINANCIAL REPORT 201841
Financial instruments (continued)27
Maturity analysis of financial assets and liabilities based on management’s expectations
The risk implied from the values shown in the table below, reflects a balanced view of cash inflows and outflows. Payables and other financial liabilities mainly originate from the ongoing operations of the Group such as overhead expenses and investments in working capital. To monitor existing financial assets and liabilities as well as to enable an effective controlling of future risks, the Group has established comprehensive risk reporting covering its various business units that reflects expectations of management of expected settlement of financial assets and liabilities. The financial assets at fair value through profit and loss categorised as maturing in less than or equal to 3 months have been categorised as such because there is no maturity date, however, they are disclosed as non current assets on the Statement of Financial Position as it is the intention to hold these investments for greater than 12 months.
Consolidated Year ended 30 June 2018
≤ 3 months
$
>3-6 months
$
>6-12 months
$
>1-5 years
$
>5 years
$
Total
$
Financial assets
Cash and cash equivalents 11,462,522 - - - - 11,462,522
Term deposits 18,149,519 - - - 27,149,519
Receivables 4,696,283 - - - - 4,696,283
Financial assets at fair value through profit or loss - - - - 58,825,377
83,984,182 18,149,519 102,133,701
Financial liabilities
Payables - - - - (5,620,734)
Net maturity 18,149,519 - - - 96,512,967
Year ended 30 June 2017
Financial assets
Cash and cash equivalents 15,759,236 - - - - 15,759,236
Term deposits 9,990,897 17,468,092 - - - 27,458,989
Receivables 4,684,382 - - - - 4,684,382
Financial assets at fair value through profit or loss - - - - 54,897,030
85,331,545 17,468,092 - - - 102,799,637
Financial liabilities
Payables - - - - (5,545,557)
Net maturity 79,785,988 17,468,092 - - - 97,254,080
HEALTH INSURANCE FUND OF AUSTRALIA LTD AND ITS CONTROLLED ENTITY
NOTES TO THE FINANCIAL STATEMENTS30 June 2018

HEALTH INSURANCE FUND OF AUSTRALIA ANNUAL FINANCIAL REPORT 201842
Financial instruments (continued)27
Health Insurance Fund of Australia Year ended 30 June 2018
≤ 3 months
$
>3-6 months
$
>6-12 months
$
>1-5 years
$
>5 years
$
Total
$
Financial assets
Cash and cash equivalents 11,431,406 - - - - 11,431,406
Term deposits 9,000,000 18,149,519 - - - 27,149,519
Receivables 4,696,283 - - - - 4,696,283
Held to maturity investments - - - - - -
Financial assets at fair value through profit or loss 58,825,377 - - - - 58,825,377
18,149,519 102,102,585
Financial liabilities
Payables - - - - (5,621,082)
Net maturity 78,331,984 18,149,519 - - - 96,481,503
Year ended 30 June 2017
Financial assets
Cash and cash equivalents 15,726,521 - - - - 15,726,521
Term deposits 9,990,897 17,468,092 - - - 27,458,989
Receivables 4,684,382 - - - - 4,684,382
Held to maturity investments - - - - - -
Financial assets at fair value through profit or loss 54,897,030 - - - -
54,897,030
85,298,830 17,468,092 - - - 102,766,922
Financial liabilities
Payables - - - - (5,545,904)
Net maturity 79,752,926 17,468,092 - - - 97,221,018
Maturity analysis of the Company’s undiscounted outstanding claims liability on insurance contracts is as follows:
≤ 3 months
$
>3-6 months
$
>6-12 months
$
>1-5 years
$
>5 years
$
Total
$
Year ended 30 June 2018 16,719,303 1,358,624 405,482 101,370 - 18,584,779
Year ended 30 June 2017 17,390,011 1,076,876 466,192 116,548 - 19,049,627
Fair value
The methods for estimating fair value are outlined in Note 1m) Financial assets at fair value through profit or loss.
HEALTH INSURANCE FUND OF AUSTRALIA LTD AND ITS CONTROLLED ENTITY
NOTES TO THE FINANCIAL STATEMENTS30 June 2018

HEALTH INSURANCE FUND OF AUSTRALIA ANNUAL FINANCIAL REPORT 201843
Financial instruments (continued)27
Liquidity and interest risk tables
Consolidated 2018
Note
Floating interest
rate $
Fixed interest maturing in:
Non interest bearing
$
Total $
1 year or less
$
1 to 5 years
$
Financial assets
Cash and cash equivalents 11 11,461,522 - - 1 ,000 11,462,522
Term deposits 13 26,992,659 - - 26,992,659
Contributions in arrears 12 - - - 313,440 313,440
Other receivables 12 - - - 4,382,843 4,382,843
Investment income receivable 12 - - - 156,860 156,860
Financial assets at fair value through profit and loss 13
- - - 58,825,377 58,825,377
11,461,522 26,992,659 - 63,679,520 102,133,701
Weighted average interest rate
1.75% 2.43%
Financial liabilities
Payables 18 - - - (5,620,735) (5,620,735)
- - - (5,620,735) (5,620,735)
Net financial assets 11,461,522 26,992,659 - 58,058,785 96,512,966
Consolidated 2017
Note
Floating interest
rate $
Fixed interest maturing in:
Non interest bearing
$
Total $
1 year or less
$
1 to 5 years
$
Financial assets
Cash and cash equivalents 11 15,758,607 - - 629 15,759,236
Term deposits 13 - 27,351,507 - - 27,351,507
Contributions in arrears 12 - - - 220,101 220,101
Other receivables 12 - - - 4,464,281 4,464,281
Investment income receivable 12 - - - 107,482 107,482
Financial assets at fair value through profit and loss 13 - - - 54,897,030 54,897,030
15,758,607 27,351,507 - 59,689,522 102,799,636
Weighted average interest rate
1.70% 2.52%
Financial liabilities
Payables 18 - - - (5,545,557) (5,545,557)
- - - (5,545,557) (5,545,557)
Net financial assets 15,758,607 27,351,507 - 54,143,965 97,254,080
HEALTH INSURANCE FUND OF AUSTRALIA LTD AND ITS CONTROLLED ENTITY
NOTES TO THE FINANCIAL STATEMENTS30 June 2018

HEALTH INSURANCE FUND OF AUSTRALIA ANNUAL FINANCIAL REPORT 201844
Financial instruments (continued)27
Liquidity and interest risk tables
Health Insurance Fund of Australia 2018
Note
Floating interest
rate $
Fixed interest maturing in:
Non interest bearing
$
Total $
1 year or less
$
1 to 5 years
$
Financial assets
Cash and cash equivalents 11 11,430,406 - - 1,000 11,431,406
Term deposits 13 26,992,659 - - 26,992,659
Contributions in arrears 12 - - - 313,440 313,440
Other receivables 12 - - - 4,382,843 4,382,843
Investment income receivable 12 - - - 156,860 156,860
Financial assets at fair value through profit and loss 13
- - - 58,825,377 58,825,377
11,430,406 26,992,659 - 63,679,520 102,102,585
Weighted average interest rate
1.75% 2.43%
Financial liabilities
Payables 18 - - - (5,621,082) (5,621,082)
- - - (5,621,082) (5,621,082)
Net financial assets 11,430,406 26,992,659 - 58,058,438 96,481,503
Health Insurance Fund of Australia 2017
Note
Floating interest
rate $
Fixed interest maturing in:
Non interest bearing
$
Total $
1 year or less
$
1 to 5 years
$
Financial assets
Cash and cash equivalents 11 15,725,892 - - 629 15,726,521
Term deposits 13 27,351,507 - - 27,351,507
Contributions in arrears 12 - - - 220,101 220,101
Other receivables 12 - - - 4,464,281 4,464,281
Investment income receivable 12 - - - 107,482 107,482
Financial assets at fair value through profit and loss 13 - - - 54,897,030 54,897,030
15,725,892 27,351,507 - 59,689,522 102,766,922
Weighted average interest rate
1.70% 2.52%
Financial liabilities
Payables 18 - - - (5,545,904) (5,545,904)
- - - (5,545,904) (5,545,904)
Net financial assets 15,725,892 27,351,507 - 54,143,618 97,221,018
HEALTH INSURANCE FUND OF AUSTRALIA LTD AND ITS CONTROLLED ENTITY
NOTES TO THE FINANCIAL STATEMENTS30 June 2018

HEALTH INSURANCE FUND OF AUSTRALIA ANNUAL FINANCIAL REPORT 201845
Financial instruments (continued)27
b) Credit risk
The credit risk on financial assets of the Group is generally the carrying amount, net of any provisions for doubtful debts. Credit risk is mitigated by close management review of outstanding amounts which are regularly followed up and collected.
The table below provides information regarding the credit risk exposure of the Group at 30 June 2018 by classifying assets according to the Standard and Poors credit ratings of the counterparties. AAA is the highest possible rating. Assets that fall outside the range of AAA to BBB are classified as speculative grade.The Group manages credit risk by setting investment limits based on counterparty credit ratings and the duration of investments. The compliance with these limits is reported to the Company’s Board of Directors on a monthly basis.
Year ended 30 June 2018
AAA $
AA $
A $
BBB $
Not rated $
Total $
Consolidated
Cash and cash equivalents - 11,461,522 - - 1,000 11,462,522
Term deposits - 26,992,659 - - - 26,992,659
Receivables 3,358,430 156,860 - - 1,337,853 4,853,143
Financial assets at fair value through profit or loss - - - - 58,825,377 58,825,377
Total 3,358,430 38,611,041 - - 60,164,230 102,133,701
Year ended 30 June 2017
Consolidated
Cash and cash equivalents 7,951,239 7,807,368 - - 629 15,759,236
Term deposits - 27,351,507 - - - 27,351,507
Receivables 3,511,797 107,482 - - 1,172,585 4,791,863
Financial assets at fair value through profit or loss - - - - 54,897,030 54,897,030
Total 11,463,036 35,266,357 - - 56,070,244 102,799,636
The AAA rated receivables reflected above are due from Medicare Australia, a body administered and managed by the Federal Government. The Group’s policy does not permit investment in any security rated below Standard and Poors’ long-term A rating.
c) Currency risk
All financial assets and liabilities of the Group are denominated in Australian dollars.
HEALTH INSURANCE FUND OF AUSTRALIA LTD AND ITS CONTROLLED ENTITY
NOTES TO THE FINANCIAL STATEMENTS30 June 2018

HEALTH INSURANCE FUND OF AUSTRALIA ANNUAL FINANCIAL REPORT 201846
Financial instruments (continued)27
Reconciliation of net financial assets to net assets
CONSOLIDATEDHEALTH INSURANCE FUND
OF AUSTRALIA
Note 2018 $
2017 $
2018 $
2017 $
Net financial assets 27a) 96,512,966 97,254,080 96,481,503 97,221,018
Investment in controlled entities 14 - - 1 1
Deferred acquisition costs 15 845,182 - 845,182 -
Property, plant and equipment 16 14,459,188 14,492,497 14,459,188 14,492,497
Investment property 17 4,250,000 4,250,000 4,250,000 4,250,000
Deferred tax asset 1,570 1,570 - -
Current liabilities 19,20,21 (47,361,278) (49,160,451) (47,361,278) (49,160,451)
Non-current liabilities 21 (134,294) (141,540) (134,294) (141,540)
Net assets per the balance sheet 68,573,334 66,696,157 68,540,302 66,661,526
Year ended 30 June 2018 Level 1 $
Level 2 $
Level 3 $
Total $
Financial assets at fair value through profit or loss - 58,825,377 - 58,825,377
Year ended 30 June 2017 Level 1 $
Level 2 $
Level 3 $
Total $
Financial assets at fair value through profit or loss - 54,897,030 - 54,897,030
Net fair value of financial assets and liabilities per the balance sheet
The net fair value of financial assets and liabilities approximate their carrying value.
Fair value measurements recognised in the consolidated statement of financial position
The following table provides an analysis of financial instruments that are measured subsequent to initial recognition at fair value, grouped into levels 1 to 3 based on the degree to which the fair value is observable.
– Level 1 fair value measurements are those derived from quoted prices (unadjusted) in active markets for identical assets or liabilities.
– Level 2 fair value measurements are those derived from inputs other than quoted prices included within Level 1 that are observable for the asset or liability, either directly (i.e. as prices) or indirectly (i.e. derived from prices).
– Level 3 fair value measurements are those derived from valuation techniques that include inputs for the asset or liability that are not based on observable market data (unobservable inputs).
HEALTH INSURANCE FUND OF AUSTRALIA LTD AND ITS CONTROLLED ENTITY
NOTES TO THE FINANCIAL STATEMENTS30 June 2018

HEALTH INSURANCE FUND OF AUSTRALIA ANNUAL FINANCIAL REPORT 201847
Financial instruments (continued)27
Financial assets / financial liabilities
Fair value as atFair value hierarchy
Valuation technique(s)
and key input(s)
Significant unobservable
input(s)
Relationship of unobservable inputs to fair
value30 June 2018
$30 June 2017
$
Other financial
assets - unit trusts
58,825,377 54,897,030 Level 2 Stated at the redemption price quoted by the trust managers as at the
reporting date.
N/A N/A
There were no transfers between Level 1 and 2 in the period.
Fair value of the Group’s financial assets and financial liabilities that are measured at fair value on a recurring basis
Some of the Group’s financial assets and financial liabilities are measured at fair value at the end of each reportingperiod. The following table gives information about how the fair values of these financial assets and financial liabilities are determined (in particular, the valuation technique(s) and inputs used).
HEALTH INSURANCE FUND OF AUSTRALIA LTD AND ITS CONTROLLED ENTITY
NOTES TO THE FINANCIAL STATEMENTS30 June 2018

HEALTH INSURANCE FUND OF AUSTRALIA ANNUAL FINANCIAL REPORT 201848
Operating lease arrangements28
Operating lease receivables relates to both of the two properties owned by the Group. 60 - 62 Stirling Street, Perth, has a lease term of 3 years, which ends on 31 March 2021. The lessee does not have an option to purchase the property at the expiry of the lease period. Ground level of 100 Stirling Street, Perth, has a lease term of 7 years, which ends on 14 December 2021. The lessee does not have an option to purchase the property at the expiry of the lease period. The property rental income earned by the Group from its properties, which are leased out under operating leases, amounted to $355,913 (2017 $364,294). Direct operating expenses arising on the investment property in the period amounted to $170,933 (2017: $166,775).
Subsequent events29
There has not arisen in the interval between 30 June 2018 and the date of this report, any item, transaction or event of a material and unusual nature likely, in the opinion of the Board of Directors of the Company, to effect significantly the operations of the Group, the results of its operation, or the state of affairs of the Group in future years, other than the matters disclosed in this report.
Non-cancellable operating lease receivables
Consolidated Health Insurance Fund of Australia
2018 $
2017 $
2018 $
2017 $
Not later than 1 year 331,054 67,543 331,054 67,543
Later than 1 year and not longer than 5 years 886,390 88,461 886,390 88,461
Later than 5 years - - - -
1,217,444 156,004 1,217,444 156,004
HEALTH INSURANCE FUND OF AUSTRALIA LTD AND ITS CONTROLLED ENTITY
NOTES TO THE FINANCIAL STATEMENTS30 June 2018

HEALTH INSURANCE FUND OF AUSTRALIA ANNUAL FINANCIAL REPORT 201849
Health Insurance Fund Of Australia Limited Directors’ Declaration
The Directors declare that in the Directors’ opinion: (a) there are reasonable grounds to believe that the company will be able to pay its debts as and when they become due and payable; (b) the attached financial statements and notes thereto are in accordance with the Corporations Act 2001, including compliance with accounting standards and giving a true and fair view of the financial position and performance of the company and the group; (c) the financial statements and notes thereto are in compliance with International Financial Reporting Standards issued by the International Accounting Standards Board, as stated in note 1 (c).
Signed in accordance with a resolution of the Directors made pursuant to s.295(5) of theCorporations Act 2001 (Cth).
On behalf of the Directors
R HomsanyDirector Perth, 26 September 2018

HEALTH INSURANCE FUND OF AUSTRALIA ANNUAL FINANCIAL REPORT 201850Liability limited by a scheme approved under Professional Standards Legislation.
Member of Deloitte Touche Tohmatsu Limited
-50-
Opinion
We have audited the accompanying financial report of Health Insurance Fund of Australia Limited (the “Company”, and its subsidiaries (the “Group”) which comprises the consolidated statement of financial position as at 30 June 2018, the consolidated statement of profit or loss and other comprehensive income, the consolidated statement of changes in equity and the consolidated statement of cash flows for the year then ended, and notes to the financial statements including a summary of significant accounting policies and the directors declaration.
In our opinion, the accompanying financial report of the Group is in accordance with the Corporations Act 2001, including:
(i) giving a true and fair view of the Groups financial position as at 30 June 2018 and of itsfinancial performance for the year then ended; and
(ii) complying with Australian Accounting Standards and the Corporations Regulations 2001.
Basis for Opinion
We conducted our audit in accordance with Australian Auditing Standards. Our responsibilities under those standards are further described in the Auditor’s Responsibilities for the Audit of the Financial Report section of our report. We are independent of the Group in accordance with the auditor independence requirements of the Corporations Act 2001 and the ethical requirements of the Accounting Professional and Ethical Standards Board’s APES 110 Code of Ethics for Professional Accountants (the Code) that are relevant to our audit of the financial report in Australia. We have also fulfilled our other ethical responsibilities in accordance with the Code.
We confirm that the independence declaration required by the Corporations Act 2001, which has been given to the directors of the Group, would be in the same terms if given to the directors as at the time of this auditor’s report.
We believe that the audit evidence we have obtained is sufficient and appropriate to provide a basis for our opinion.
Deloitte Touche Tohmatsu ABN 74 490 121 060
Tower 2 Brookfield Place 123 St Georges Terrace Perth WA 6000 GPO Box A46 Perth WA 6837 Australia
Tel: +61 8 9365 7000 Fax: +61 8 9365 7001 www.deloitte.com.au Independent Auditor’s Report to the
members of Health Insurance Fund of Australia Limited

HEALTH INSURANCE FUND OF AUSTRALIA ANNUAL FINANCIAL REPORT 201851
-51-
Other Information
The directors are responsible for the other information. The other information comprises the information included in the annual report but does not include the financial report and our auditor’s report thereon.
Our opinion on the financial report does not cover the other information and we do not express any form of assurance conclusion thereon.
In connection with our audit of the financial report, our responsibility is to read the other information and, in doing so, consider whether the other information is materially inconsistent with the financial report or our knowledge obtained in the audit or otherwise appears to be materially misstated. If, based on the work we have performed, we conclude that there is a material misstatement of this other information; we are required to report that fact. We have nothing to report in this regard.
Responsibilities of the Directors for the Financial Report
The directors of the Group are responsible for the preparation of the financial report that gives a true and fair view in accordance with Australian Accounting Standards and the Corporations Act 2001 and for such internal control as the directors determine is necessary to enable the preparation of the financial report that gives a true and fair view and is free from material misstatement, whether due to fraud or error.
In preparing the financial report, the directors are responsible for assessing the Group’s ability to continue as a going concern, disclosing, as applicable, matters related to going concern and using the going concern basis of accounting unless the directors either intend to liquidate the Group or to cease operations, or have no realistic alternative but to do so.
Auditor’s Responsibilities for the Audit of the Financial Report
Our objectives are to obtain reasonable assurance about whether the financial report as a whole is free from material misstatement, whether due to fraud or error, and to issue an auditor’s report that includes our opinion. Reasonable assurance is a high level of assurance, but is not a guarantee that an audit conducted in accordance with the Australian Auditing Standards will always detect a material misstatement when it exists. Misstatements can arise from fraud or error and are considered material if, individually or in the aggregate, they could reasonably be expected to influence the economic decisions of users taken on the basis of this financial report.
As part of an audit in accordance with the Australian Auditing Standards, we exercise professional judgement and maintain professional scepticism throughout the audit. We also:
Identify and assess the risks of material misstatement of the financial report, whether due to fraudor error, design and perform audit procedures responsive to those risks, and obtain audit evidencethat is sufficient and appropriate to provide a basis for our opinion. The risk of not detecting amaterial misstatement resulting from fraud is higher than for one resulting from error, as fraudmay involve collusion, forgery, intentional omissions, misrepresentations, or the override ofinternal control.

HEALTH INSURANCE FUND OF AUSTRALIA ANNUAL FINANCIAL REPORT 201852
-5 -
Obtain an understanding of internal control relevant to the audit in order to design auditprocedures that are appropriate in the circumstances, but not for the purpose of expressing anopinion on the effectiveness of the Group’s internal control.
Evaluate the appropriateness of accounting policies used and the reasonableness of accountingestimates and related disclosures made by the directors.
Conclude on the appropriateness of the directors’ use of the going concern basis of accountingand, based on the audit evidence obtained, whether a material uncertainty exists related to eventsor conditions that may cast significant doubt on the Group’s ability to continue as a going concern.If we conclude that a material uncertainty exists, we are required to draw attention in our auditor’sreport to the related disclosures in the financial report or, if such disclosures are inadequate, tomodify our opinion. Our conclusions are based on the audit evidence obtained up to the date ofour auditor’s report. However, future events or conditions may cause the Group to cease tocontinue as a going concern.
Evaluate the overall presentation, structure and content of the financial report, including thedisclosures, and whether the financial report represents the underlying transactions and events ina manner that achieves fair presentation.
Obtain sufficient appropriate audit evidence regarding the financial information of the entities orbusiness activities within the Group to express an opinion on the financial report. We areresponsible for the direction, supervision and performance of the Group’s audit. We remain solelyresponsible for our audit opinion.
We communicate with the directors regarding, among other matters, the planned scope and timing of the audit and significant audit findings, including any significant deficiencies in internal control that we identify during our audit.
We also provide the directors with a statement that we have complied with relevant ethical requirements regarding independence, and to communicate with them all relationships and other matters that may reasonably be thought to bear on our independence, and where applicable, related safeguards.
DELOITTE TOUCHE TOHMATSU
John Sibenaler Partner Chartered Accountants Perth, 26 September 2018
