annual financial report 31 december 2018 - scentre group · annual financial report scentre group...
TRANSCRIPT

Scentre Group Limited ABN 66 001 671 496
Annual Financial Report
31 December 2018

Annual Financial Report
SCENTRE GROUP
For the Financial Year ended 31 December 2018
Contents1 Joint Chairman and Chief Executive Officer Letter to Securityholders2 2018 Results Overview3 Directors’ Report30 Independent Auditor’s Report 33 Income Statement34 Statement of Comprehensive Income35 Balance Sheet36 Statement of Changes in Equity37 Cash Flow Statement38 Notes to the Financial Statements73 Directors’ Declaration74 Corporate Governance Statement81 Investor Relations83 Members’ Information84 Directory

SCENTRE GROUP ANNUAL FINANCIAL REPORT 2018 // PAGE 1
Joint Chairman and Chief Executive Officer Letter to Securityholders
Dear Securityholder
We are pleased to provide this Annual Financial Report of our Group’s performance in 2018.
Scentre Group was established in 2014 and our purpose has remained constant ever since: ‘creating extraordinary places, connecting and enriching communities’. Our purpose has guided our culture and decision-making as we have grown our business into an extraordinary platform of 41 Westfield living centres which is now the 15th largest entity on the ASX by market capitalisation.
Our financial performance for the year ended 31 December 2018 was strong with Funds From Operations (FFO) of $1.3 billion representing 25.24 cents per security, up 3.9% and a distribution of 22.16 cents per security, up 2%. Statutory profit for the period was $2.3 billion including a revaluation uplift of $1.1 billion. Scentre Group has total assets of $39.1 billion and assets under management of $54.2 billion.
During the year, we successfully completed more than $1.1 billion of developments and added more than 106,000 sqm to our living centre portfolio through projects at Westfield Plenty Valley in Melbourne; Westfield Carousel in Perth; Westfield Coomera on Queensland’s Gold Coast, our first greenfield centre; Westfield Kotara in Newcastle; and Westfield Tea Tree Plaza in Adelaide. Each of these developments has enhanced the customer experience and contributed to high levels of customer advocacy. The Group commenced the redevelopment of Westfield Newmarket in Auckland in 2018 and is on track to complete this in late 2019, creating another extraordinary place for our customers to connect, gather, experience and shop.
Our purpose encapsulates how we create a long-term sustainable business that satisfies the needs of diverse stakeholders including our people, securityholders, partners, suppliers, customers and communities.
The connection between purpose, people and performance is critical for our business as we continue to rise to the challenge of meeting dynamic customer expectations.
Our organisational culture is led from the top and we engage with our people on the most important issues for our business in many ways. Board members meet regularly with key members of the leadership team, participate in asset tours of our centres and attend development openings where possible. Our people engage directly with the leadership team on issues that matter to them in informal and formal ways including ‘Team Talks’ which are broadcast live and accessible to all. We host live broadcasts from major development openings to bring our people closer to the latest ‘extraordinary place’ we have created. As CEO, Peter has a direct engagement program that includes meetings with new employees every quarter and lunches with new parents and their children to keep them connected to the workplace whilst on parental leave.
We continue to make progress on our vision to be the place where talent thrives. Our focus on leadership and diversity and inclusion has contributed to high levels of employee engagement. Last measured in 2017, at 88% our engagement level places us in the top 2% of high performing companies globally. Our next survey will be conducted in 2019 yet we know our engagement remains robust from a series of important measures. For example, our retention rates are high and of those that do leave us, 89% say they would recommend Scentre Group as a place to work.
Diversity of experience and perspective is a recognised driver of a sustainable, high performance culture and during the year three new executives from outside the Group were appointed to executive leadership positions. This includes Chief Strategy and Business Development Officer, Cynthia Whelan, Director of Technology, Richard Webby and Director of Corporate Affairs, Alexis Lindsay. In January 2019, Mark Bloom advised us of his retirement from the role of Chief Financial Officer (CFO) which will take effect at our April meeting and we will pay tribute to his leadership then. Elliott Rusanow will succeed Mark as CFO upon his retirement. We are pleased to advise that Cynthia and Elliott will be recognised as Executive Key Management Personnel from 2019.
We describe our 41 centres as ‘living centres’ because they are extraordinary places where our customers come to gather and socialise, be entertained, dine, access services and experiences and shop. Our ability to curate a product, service and experience offer that meets customers’ expectations is what sets us apart and enables us to deliver annual sales of $24 billion, high levels of customer advocacy and annual customer visitation of 535 million, up 5 million. This consistently high visitation is unrivalled.
These factors explain why our occupancy has remained strong at 99.3%. Extraordinary retail partners who understand their customers want to be located in extraordinary places that enjoy high visitation. We continue to work closely with our retail partners to help them better understand the value of physical stores and the role they play in attracting and retaining customers, building brands and influencing in-store and on-line sales.
As we deliver on our purpose, we do so with a responsible, sustainable business mindset. We want our customers to regard us as an essential part of their communities. During the year, we launched a new community grants and recognition program called Westfield Local Heroes. Our 117 inaugural Westfield Local Heroes each received a grant of $10,000, totalling $1.17 million, to further their vital work in addressing social needs in our local communities. We will launch the second year of the program in March 2019.
Retail continues to be a dynamic sector and the Board, management and our people are working hard to keep abreast of issues that may affect the Group. Given Scentre Group’s leadership position in the sector, the pre-eminent quality of our living centres and management’s focus on adapting to the constantly evolving retail landscape and delivering a superior customer experience which drives strong visitation and customer advocacy, our long-term view for the business is positive.
We would like to thank you for your ongoing support of Scentre Group.
We also thank our people for their commitment during 2018 and contributing to this year’s financial results. Our purpose will continue to guide our execution in the year ahead as we keep creating extraordinary living centres that play an integral role in our customers’ lives.
Brian Schwartz AM Peter Allen Chairman Chief Executive Officer
PAGE 2
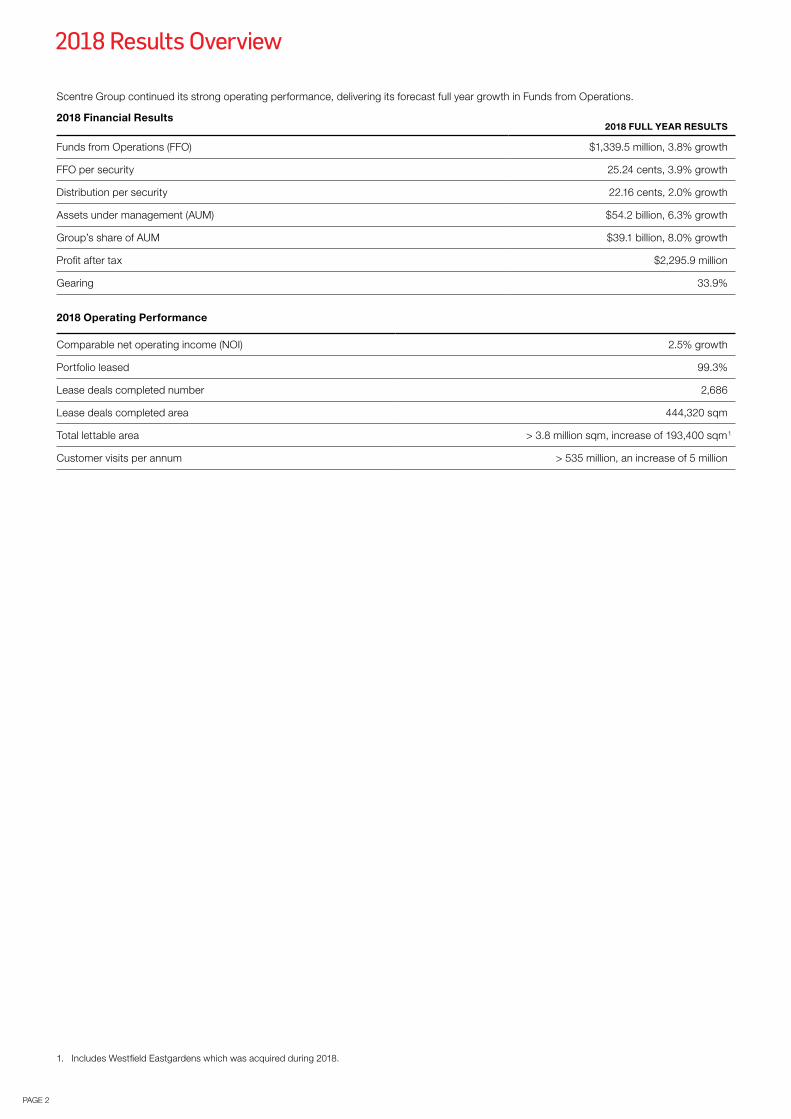
Scentre Group continued its strong operating performance, delivering its forecast full year growth in Funds from Operations.
2018 Financial Results2018 FULL YEAR RESULTS
Funds from Operations (FFO) $1,339.5 million, 3.8% growth
FFO per security 25.24 cents, 3.9% growth
Distribution per security 22.16 cents, 2.0% growth
Assets under management (AUM) $54.2 billion, 6.3% growth
Group’s share of AUM $39.1 billion, 8.0% growth
Profit after tax $2,295.9 million
Gearing 33.9%
2018 Operating Performance
Comparable net operating income (NOI) 2.5% growth
Portfolio leased 99.3%
Lease deals completed number 2,686
Lease deals completed area 444,320 sqm
Total lettable area > 3.8 million sqm, increase of 193,400 sqm 1
Customer visits per annum > 535 million, an increase of 5 million
2018 Results Overview
1. Includes Westfield Eastgardens which was acquired during 2018.

SCENTRE GROUP ANNUAL FINANCIAL REPORT 2018 // PAGE 3
Directors’ Report
This Directors’ report provides information on the structure of our business, our financial performance for the period 1 January 2018 to 31 December 2018 (Financial Year), our strategies and prospects and the key risks that face Scentre Group (Group or SCG).
Scentre Group is structured as a stapled entity: a combination of a share in Scentre Group Limited (Company) and a unit in each of Scentre Group Trust 1, Scentre Group Trust 2 and Scentre Group Trust 3 which are stapled and trade together as one security on the Australian Securities Exchange (ASX). For accounting purposes, the Company is the parent entity of the Group. This report covers the Company and its controlled entities for the Financial Year.
1. OPERATING AND FINANCIAL REVIEWWe own and operate the pre-eminent retail property portfolio in Australia and New Zealand, with interests in 41 centres including 16 of the top 25 centres in Australia and 4 of the top 5 centres in New Zealand. We have an exclusive, continuing and royalty free licence to use the Westfield brand in Australia and New Zealand for our existing portfolio and any new centres in Australia and New Zealand which meet certain agreed characteristics.
Australia & New Zealand Portfolio
Centres SCG share of AUM
41 $39.1bn1
Brisbane
Canberra
Melbourne
Adelaide
$1.3bn
1 WHOLLY OWNED1 JOINT VENTURE
2centres
2 WHOLLY OWNED4 JOINT VENTURES
6centres
15centres
7 WHOLLY OWNED8 JOINT VENTURES
Auckland
Christchurch
5centres
NZ$1.3bn
5 JOINT VENTURES
7centres
1 WHOLLY OWNED6 JOINT VENTURES
3centres
3 JOINT VENTURES
3centres
2 WHOLLY OWNED1 JOINT VENTURE
$2.1bn
Perth
$1.4bn
$5.7bn
$20.3bn
Sydney
$6.3bn
Our real estate portfolio is well positioned and resilient with assets under management valued at $54.2 billion (SCG: $39.1 billion). We have continued to evolve our premium portfolio of retail centres into ‘living’ centres, reflecting the Group’s capabilities to curate a unique mix of products and services that meet the changing needs and expectations of our customers and set new industry benchmarks in our markets of operation.
We have achieved this scale through our integrated platform. We have expertise in and manage every aspect of our portfolio – from design and construction through to strategic development, asset management and operations including leasing, brandmedia and customer experience – allowing us to achieve the scale of our portfolio while creating efficiencies and positioning us to deliver strong financial results.
As at 31 Dec 2018 Total
Centres 41
Gross Lettable Area (sqm) 3.8m
SCG share of AUM $39.1bn
JV Partner share of AUM $15.1bn
Assets Under Management (AUM) $54.2bn
1. Includes construction in progress and assets held for redevelopment.
Australia & New Zealand Portfolio
Centres SCG share of AUM
41 $39.1bn1
Brisbane
Canberra
Melbourne
Adelaide
$1.3bn
1 WHOLLY OWNED1 JOINT VENTURE
2centres
2 WHOLLY OWNED4 JOINT VENTURES
6centres
15centres
7 WHOLLY OWNED8 JOINT VENTURES
Auckland
Christchurch
5centres
NZ$1.3bn
5 JOINT VENTURES
7centres
1 WHOLLY OWNED6 JOINT VENTURES
3centres
3 JOINT VENTURES
3centres
2 WHOLLY OWNED1 JOINT VENTURE
$2.1bn
Perth
$1.4bn
$5.7bn
$20.3bn
Sydney
$6.3bn

Directors’ Report (continued)
PAGE 4
Financial ResultsOur primary reporting measure is Funds from Operations (FFO) which is a widely recognised measure of performance of real estate investment groups.
Profit after tax, funds from operations and distribution for the period (i)
For the 12 months ended 31 December Note2018
$million2017
$million
Net property income 1,833.0 1,794.8 Net project and management income 131.4 125.5 Overheads (85.9) (88.6)Net financing costs (499.4) (481.9)Interest on other financial liabilities (35.6) (35.0)Mark to market of derivatives and property linked notes (187.2) (230.6)Net modification gain on refinanced borrowing facilities 9.9 – Exchange differences (including amounts transferred from foreign currency translation reserve) on realisation of net investment in foreign operations 0.7 0.8 Gain in respect of capital transactions 40.1 0.0 Property revaluations 1,147.7 3,216.8 Tax expense (58.8) (70.4)Profit after tax 2,295.9 4,231.4 Adjusted for:– Property revaluations 2(v) (1,147.7) (3,216.8)– Amortisation of tenant allowances 2(iii) 67.8 53.8 – Net fair value loss/(gain) and associated credit risk on currency derivatives that do not qualify
for hedge accounting 11 30.4 (5.6)– Exchange differences (including amounts transferred from foreign currency translation
reserve) on realisation of net investment in foreign operations 11 (0.7) (0.8)– Net fair value loss on interest rate hedges that do not qualify for hedge accounting 12 133.6 158.4 – Net modification gain on refinanced borrowing facilities 12 (9.9) – – Net fair value loss on other financial liabilities 12 23.2 77.8 – Gain in respect of capital transactions 2(v) (40.1) (0.0)– Deferred tax expense/(benefit) 2(v) (1.8) 4.8 – Funds from operations attributable to external non controlling interests (ii) (11.2) (12.8)FFO (iii) 1,339.5 1,290.2 Less: amount retained (164.1) (136.0)Dividend/distributions 1,175.4 1,154.2
(i) The Group’s income and expenses have been prepared on a proportionate basis. The proportionate basis presents the net income from equity accounted entities on a gross basis.
(ii) Funds from operations attributable to external non controlling interests of $11.2 million (31 December 2017: $12.8 million) consists of profit after tax attributable to external non controlling interests of $8.7 million (31 December 2017: $13.5 million) adjusted for non-FFO items of +$2.5 million (31 December 2017: -$0.7 million).
(iii) A key measure of the financial performance of the Group is FFO. FFO is a widely recognised measure of the performance of real estate investment groups by the property industry and is a useful measure of operating performance.
The Group’s measure of FFO is based upon the National Association of Real Estate Investment Trusts’ (NAREIT, a US industry body) definition, adjusted to reflect the Group’s profit after tax and non controlling interests reported in accordance with the Australian Accounting Standards and International Financial Reporting Standards.
The Group’s FFO excludes property revaluations of consolidated and equity accounted property investments, unrealised currency gains/losses, net fair value gains or losses on interest rate hedges and other financial liabilities, gains or losses on modification of borrowing facilities, deferred tax, gains/losses from capital transactions and amortisation of tenant allowances from the reported profit after tax and non controlling interests.
2018
cents2017 cents
FFO per security (iv) 25.24 24.29 Dividend/distribution per security 22.16 21.73
(iv) In calculating the FFO per security 5,307,143,233 (31 December 2017: 5,311,595,241) weighted average number of securities was used.

SCENTRE GROUP ANNUAL FINANCIAL REPORT 2018 // PAGE 5
Financial performanceProfit after tax for the year was $2,295.9 million including property revaluations of $1.1 billion. These revaluations were underpinned by the completion of developments, net property income growth and improvement in capitalisation rates for high quality assets.
FFO was $1,339.5 million (FY17: $1,290.2 million) being FFO per security of 25.24 cents, in line with market guidance and reflecting an increase of 3.9% per security.
Distributions per security for the 12 months ended 31 December 2018 were 22.16 cents, representing 2.0% growth on the prior year (FY17: 21.73 cents) with a payout ratio of 87.8% of FFO. The distribution for the 6 months ended 31 December 2018 will be paid to securityholders on 28 February 2019.
Return on contributed equity (ROCE) was 12.72% (FY17: 12.28%).
Our Purpose, Strategy and Key DriversOur purpose: “Creating extraordinary places, connecting and enriching communities”.
During the year, we focused on:
– Customer experience;
– Our people;
– Asset management and development; and
– Capital management
Key highlights
Customer experience and retail productProviding exceptional customer experiences
We seek to create a customer centric culture where customer needs are central to our strategic and operational decisions.
Core to our business is:
‘know the customer’
’listen to the customer’
’design for the customer’ and
‘engage with the customer’
Our focus is on connecting with our customers by providing superior experiences. Experiences range from centre ambience, retailer mix to food, leisure and entertainment precincts and digital connectivity.
Curating a diverse, engaging and constantly evolving product mix.
Our focus is on delivering long term sustainable growth through the ability to curate an exceptional, diverse product mix and deliver extraordinary retail, lifestyle and entertainment experiences.
We actively manage our tenancy mix and seek to minimise vacancies by assessing demand by category and implementing planned precinct strategies.
– Active curation of retail, services and experiences to meet customer expectations
– Introduced 437 new brands to the portfolio, and 317 existing brands grew their store network
– More than 35% of the stores across our portfolio are experienced-based offerings
– Across the five developments we opened during the year, more than half of the new stores offer experiences which can only be consumed onsite, including dining, entertainment, health, fitness and beauty services
– Improved ease of customer parking through continued rollout of ticketless parking
– Launched ‘Westfield Local Heroes’ a new community recognition and grants program
Build true retailer partnerships
We strive to be at the forefront of the retail property industry by developing and leading a partnership model centred on “end to end” retail solutions.
Our peopleBe the place that talent can thrive
– Employer of Choice for Gender Equality citation from the Workplace Gender Equality Agency (WGEA)
– 100% retention of key executive talent identified for critical roles
– Increased female representation at the senior executive level (General Manager and above) from 22% to 26.5%, at the upper range of our 2018 target of 25% – 27%

Directors’ Report (continued)
PAGE 6
Key highlights
Asset management and developmentOur operating strategy is to own and operate the pre-eminent retail property portfolio in Australia and New Zealand.
Our portfolio comprises 41 centres including 16 of the top 25 centres in Australia and 4 of the top 5 centres in New Zealand.
We concentrate on intensively managing our centres with an emphasis on delivering an optimal mix of retailers, maximising the sales productivity of retailers at each centre and providing superior experiences for our customers.
We look to grow property income through the active curation of retail, services and experience as well as contractual annual rent escalations.
Our asset management capabilities are strengthened by the scale, quality and geographic diversification of our portfolio providing us with a unique operating platform to attract and engage with high-demand retailers and generate new income opportunities.
We own a number of our centres in joint ventures and seek to grow contractual property management income through joint venture partnerships.
– Delivered comparable NOI growth of 2.5%
– Maintained portfolio occupancy to >99% leased
– AUM increased to $54.2 billion (SCG share: $39.1 billion), driven by NOI growth, value creation from completed redevelopments and improved market capitalisation rates for high quality retail property
– $24.0 billion (moving annual turnover or MAT) total portfolio in-store retailer sales
– In-store sales productivity for specialty retailers (< 400sqm) of $11,245 sales per sqm
We seek to deliver long-term sustainable growth by strategically investing in our portfolio, allowing us to adapt to the next generation of retail.
One of our competitive advantages is our integrated development, design and construction platform.
Our objective is to generate incremental property income and create value through our long term development pipeline.
We also aim to generate project income through developments for our joint venture partners.
In line with our purpose: ‘creating extraordinary places, connecting and enriching communities’, during the year, we continued to invest in the redevelopment of our centres for the benefit of our customers and retailers and to deliver attractive long-term total returns to our securityholders.
– Opened $1.1 billion (SCG share: $810 million) of redevelopments at Westfield Plenty Valley, Carousel, Coomera, Kotara and Tea Tree Plaza, adding more than 106,000 sqm
– Commenced the NZ$790 million (SCG share: NZ$400 million) redevelopment of Westfield Newmarket, which will create the leading lifestyle and premium fashion destination in New Zealand
– Acquired a 50% share in Westfield Eastgardens for $720 million
– Successfully bid for Sydney’s Barangaroo Central retail component
– Revaluation gains for the portfolio of $1.1 billion
Capital managementActively manage our capital structure
We seek to optimise our capital structure through the disciplined management of capital, funding and liquidity to deliver long-term sustainable growth in securityholder returns.
– New and extended bank loan facilities of $3.8 billion
– Issued €500 million ($800 million) of long term bonds
– At 31 December 2018, gearing was 33.9% and the average debt maturity was 4.4 years
– Maintained a high level of interest rate hedging of 69% at 31 December 2018
OutlookThe Group forecasts FFO growth for the 12 months ending 31 December 2019 of approximately 3%.
The distribution for 2019 is forecast to be 22.60 cents per security.
Matters subsequent to the end of the yearNo events have occurred since the end of the year which would significantly affect the operations of the Group.
RisksAs part of our corporate strategy we look at risk from a number of perspectives: global risk trends, social and environmental risks and retail property specific risks. These risks are subject to continuous assessment and review.
As a property group involved in the design, development, management and operation of retail shopping centres, we face a number of operational risks which have the potential to affect the achievement of our targeted financial outcomes.
A number of important strategic risks and how we manage and monitor such risks are outlined below.
Risk Management FrameworkScentre Group is exposed to a range of financial and non-financial risks arising from its operations. Accordingly, our Risk Management Policy and Framework outlines the process for identifying, assessing, controlling, reviewing and reporting on risk. The Framework is applied by the various business units within the Group in order to identify, assess and manage the risks which may impact our ability to meet our business objectives. This is done for all major projects, within each business unit on a six monthly basis and annually at a corporate level.
The Board determines the overall risk appetite for the Group and has approved strategies, policies and procedures to ensure that key risks are identified and managed.
Identified risks are subject to ongoing assessment and review. The result is a Corporate Risk Profile, which provides a detailed analysis of the major risks in our business and how we manage those risks.
There may be other risks and uncertainties which we do not currently consider material, or of which the Group is currently unaware, which may also affect of the Group. The nature and potential impact of these risks may change over time.

SCENTRE GROUP ANNUAL FINANCIAL REPORT 2018 // PAGE 7
External RisksOur financial results may be affected by an economic downturn that creates challenging operating conditionsWe focus on the geographic diversity of our centres, creating high quality assets and intensively managing those assets to maximise long term revenue, delivering a strong balance sheet with gearing within our stated target and ensuring access to capital/debt funding sources.
Regulatory changes may impact our business model which is based on the long-term ownership of assetsWhilst Australia and New Zealand provide politically stable environments, our operations are impacted by evolving government regulations and international standards. To mitigate this risk, we engage with industry and government on policy areas and reform.
Business RisksProperty Ownership RisksAs a long-term owner of property, with a significant portion of our earnings derived from retail rental income, we are exposed to changes in consumer sentiment or shopping preferences, including the emergence of alternative retail channels. In addition, anchor tenants occupy a significant portion of the total GLA of our centres. Our strategy is to focus on creating and owning leading retail destinations across Australia and New Zealand, investing to improve the quality of the portfolio and adapting to the next generation of retail. The intensive management of our portfolio is aimed at driving the sales productivity of retailers and to provide superior experiences to consumers. We explore new income and investment opportunities including expanding media and advertising revenues, digital, car parking and infrastructure services. We view the emergence of digital technology as an important element in better connecting the retailer and our centres with the consumer.
Property Management and Development RisksAs we derive a significant portion of our income from property management activities, our financial performance will depend in part on the continued redevelopment and growth of our centres. To mitigate this risk, we have disciplined decision-making processes to take advantage of opportunities to deliver appropriate risk related returns. With development capabilities that include all elements of development, design, construction and project leasing, we have a pipeline of redevelopment and expansion opportunities within our existing portfolio and we remain focused on creating the right product in the right location.
Financial RisksFinancing RisksAs the real estate investment and development industry is highly capital intensive, our ability to access debt funding at an appropriate price, and to repay principal and interest on our debt, is a key risk. We manage our exposure through: established treasury risk management policies; diverse funding sources with staggered debt maturities and appropriate levels of interest rate hedging. Further information relating to financial risk management is detailed in Note 22 to the Financial Statements.
Operational RisksWorkplace Health and Safety (WH&S) RisksA WH&S incident may have a long-term impact on our employees, contractors or broader community. To mitigate this risk, we have a strong workplace health and safety culture, with comprehensive workplace health and safety programs overseen by dedicated risk and security personnel.
Security and Emergency Management RisksUnexpected catastrophes could occur that place customers, employees and contractors in physical danger. In seeking to exceed the community’s expectations we engage with government agencies and specialists to address known security and operational concerns; we have dedicated risk and security personnel; we have embedded safety by design programs; and we have rehearsed security response plans for each of our centres.
IT Systems, Data, Cyber and Business ContinuityThere is a risk that we are subject to a cyber-attack or privacy breach, fail to comply with regulatory obligations or suffer a failure or outage of a critical business system. To mitigate this risk we have standards, policies and systems to address cyber and privacy associated risks; invested in appropriate cyber security and disaster recovery systems and personnel and maintain an effective compliance program. Additionally, we have disaster recovery and business continuity plans that are reviewed and tested annually.
Sustainability RisksClimate ChangeAs a long-term owner of real estate, we regularly review the potential for impact from climate change. In managing this risk we are focused on: reducing the cost volatility of utility services through investing in programs to reduce energy, water and waste; reviewing alternate energy sources; enhancing the resilience of our assets to potential business interruptions associated with climate change; and partnering with key stakeholders to address their future requirements.
People and CultureThere is a risk that we are unable to attract and retain the talent required to execute our strategies. We recognise the following principles as key contributors to attracting and retaining talent: creating a workforce that is reflective of the communities in which we operate; recognising that diversity in the workforce is a key contributor to the success of our business; creating an inclusive culture that supports employees at all stages of their career and encourages employees to succeed to the best of their ability. We have a number of workplace initiatives to support these principles.
CommunityWe are exposed to changes in consumer sentiment or shopping preferences. Our customers and retail partners, and the communities we serve, are at the heart of our business. This means curating living centres which our communities are proud to call their own. As the local hubs of our trade areas we have a unique opportunity to enrich the social wellbeing of our local regions. Our commitment to true community engagement ensures we are delivering our purpose of creating extraordinary places, connecting and enriching communities.
EnvironmentOur focus is on ensuring that through recycling of waste we reduce our impact on landfill and through reduction in water and electricity usage, along with our investment in alternate energy, we reduce our environmental footprint.
2. SUSTAINABILITYEnvironmental laws and regulations in force in the various jurisdictions in which we operate are applicable to areas of our operations and in particular to our development, construction and shopping centre management activities. We have in place procedures to identify and comply with such requirements including complying with the conditions of relevant authority consents and approvals and obtaining any necessary licences.
Our compliance procedures are regularly reviewed and audited and their application closely monitored and our approach to sustainability risks is outlined above.
Our Sustainability Report will be published in the first quarter of 2019 and will be available on our website.
3. DIVIDENDS/DISTRIBUTIONSA distribution of 11.08 cents per Scentre Group security was paid on 31 August 2018. This distribution was an aggregate distribution from Scentre Group Trust 1 and Scentre Group Trust 2.
A dividend/distribution of 11.08 cents per Scentre Group security will be paid on 28 February 2019. This dividend/distribution is an aggregate dividend from the Company and a distribution from Scentre Group Trust 1, Scentre Group Trust 2 and Scentre Group Trust 3.
The breakdown of the component parts of the distribution, including dividends determined by the Company, are set out in Note 8 of the Financial Statements and in summary form on page 81 of this Annual Financial Report.

Directors’ Report (continued)
PAGE 8
4. DIRECTORS AND SECRETARIES4.1 Board Membership and QualificationsThe members of the Scentre Group Board and their qualifications, experience and responsibilities are set out below.
Brian Schwartz AMIndependent Non-Executive ChairmanChair of the Nomination CommitteeAge 66In a career with Ernst & Young Australia spanning more than 25 years, he rose to the positions of Chairman (1996 – 1998) and then CEO of the firm from 1998 to 2004. From 2005 to 2009, Brian was the CEO of Investec Bank (Australia) Limited. Brian is a director on the board of Guardian Early Learning Group company, part of Partners Group, a global private markets investment manager, and was most recently appointed as the new Chair of the Centennial Park and Moore Park Trust. He is a fellow of the Australian Institute of Company Directors and the Institute of Chartered Accountants. Brian was previously Chairman of Insurance Australia Group Limited, Deputy Chairman of Westfield Corporation, Deputy Chairman of Football Federation Australia Limited and a Director of Brambles Limited.
Peter AllenExecutive Director/Chief Executive OfficerAge 57Prior to the establishment of Scentre Group in 2014, Peter was an executive Director and Chief Financial Officer of Westfield Group. Peter joined Westfield in 1996 and between 1998 and 2004 was Westfield’s CEO of the United Kingdom/Europe and responsible for establishing Westfield’s presence in the United Kingdom. Peter is Chairman of the Shopping Centre Council of Australia and a Director of the Victor Chang Cardiac Research Institute. He is a member of the President’s Council of the Art Gallery of NSW and is a member of the Property Male Champions of Change.
Andrew HarmosIndependent Non-Executive DirectorChair of the Human Resources CommitteeMember of the Nomination CommitteeAge 59Andrew is one of the founding directors of Harmos Horton Lusk Limited, an Auckland based specialist corporate legal advisory firm, where he specialises in takeover advice and structuring, securities offerings, company acquisitions and disposals and strategic Board and transaction advice. Andrew holds a Bachelor of Commerce and a Bachelor of Laws (Honours) from The University of Auckland. He is a Director of AMP Limited, AMP Life Limited, The National Mutual Life Association of Australasia Limited and Elevation Capital Management Limited. He chairs the Risk Committee of AMP Limited and the Audit Committees of AMP Life Limited and The National Mutual Life Association of Australasia Limited. Andrew was formerly Chairman of the New Zealand Stock Exchange and a Trustee of the Arts Foundation of New Zealand.
Michael IhleinIndependent Non-Executive DirectorChair of the Audit and Risk CommitteeMember of the Nomination CommitteeAge 63Mike is a highly experienced corporate and finance executive with a long career with Coca-Cola Amatil Limited (and related companies) where he was Managing Director, Poland (1995 – 1997) and Chief Financial Officer and Executive Director (1997 – 2004). Mike joined Brambles as Chief Financial Officer and Executive Director in March 2004 and held the position of Chief Executive Officer from July 2007 until his retirement in November 2009. Mike holds a Bachelor of Business Studies (Accounting) from the University of Technology, Sydney. He is currently a Director of CSR Limited and Snowy Hydro Limited, and is also a Fellow of the Australian Institute of Company Directors, CPA Australia and the Financial Services Institute of Australasia. Mike was formerly a Director of Murray Goulburn Co-operative Co. Limited, from 2012 to 2017.
Carolyn Kay, Independent Non-Executive DirectorIndependent Non-Executive DirectorMember of the Audit and Risk CommitteeAge 57Carolyn has had more than 30 years of experience in the finance sector as an executive and non-executive director. In addition, Carolyn has been and remains a non-executive director of enterprises across a broad range of industries. She is currently a member of the Future Fund Board of Guardians and a non-executive director of the Australia-China Council. In the not for profit sector, Carolyn is also a non-executive director of the General Sir John Monash Foundation. As an executive Carolyn worked as a banker and lawyer at Morgan Stanley, JP Morgan and Linklaters & Paines in London, New York and Australia. Carolyn holds Bachelor Degrees in Law and Arts (University of Melbourne), a Graduate Diploma in Management (AGSM) and is a Fellow of the Australian Institute of Company Directors. She was awarded a Centenary Medal for services to Australian society in business leadership.
Aliza KnoxIndependent Non-Executive DirectorMember of the Human Resources CommitteeAge 58Aliza has more than three decades of broad international marketing and management experience. She holds an MBA in Marketing (Honors) from New York University-Leonard N. Stern, School of Business, and a B.A., Applied Mathematics and Economics (Magna Cum Laude) from Brown University. Aliza is currently the Head of Asia for Cloudflare Inc. Her previous roles include Chief Operating Officer at Unlockd, Vice President, Asia Pacific at Twitter from 2012 to 2017, Managing Director of Commerce and Online Sales & Operations for Asia Pacific at Google Asia Pacific Pte. Ltd. from 2007 to 2012, Senior Vice President, Commercial Solutions and Global Product Platforms at Visa International (from 2002 to 2007) and Senior Vice President, International Wireless and Global Expansion Asian Focus at Charles Schwab Corporation (from 1999 to 2001). Aliza was also a non-executive Director of InvoCare from 2011 to 2015, a member of the supervisory board of GfK from 2014 to 2017, a member of ANZ’s International Technology and Digital Business Advisory Panel from 2015 to 2017 and a non-executive Director of Singapore Post Limited from August 2013 to July 2018.

SCENTRE GROUP ANNUAL FINANCIAL REPORT 2018 // PAGE 9
Steven Lowy AMNon-Executive DirectorAge 56Steven Lowy is the non-executive Chairman of OneMarket Limited. He was previously an executive director of the global shopping centre company Westfield Corporation serving as co-Chief Executive Officer for many years prior to the sale of Westfield in June 2018. He is a director of the Lowy Institute. He has served as Chairman of Football Federation Australia Limited, President of the Board of Trustees of the Art Gallery of New South Wales, Chairman of the Victor Chang Cardiac Research Institute and Presiding Officer of the NSW Police Force Associate Degree in Policing Practice Board of Management. He holds a Bachelor of Commerce (Honours) from the University of New South Wales.
Steven is retiring as a non-executive Director at the conclusion of the Group’s AGM on 4 April 2019.
Margaret SealeIndependent Non-Executive DirectorMember of the Audit and Risk CommitteeMember of the Human Resources CommitteeAge 58Margie has more than 25 years’ experience in senior executive roles in Australia and overseas, including in the consumer goods, health and global publishing sectors, in sales and marketing, and in the successful transition of traditional business models to digital environments. Immediately prior to her non-executive career, Margie was Managing Director of Random House Australia and New Zealand and President, Asia Development for Random House globally. She is currently a non-executive director of Telstra Corporation Limited and Australian Pacific (Holdings) Pty Limited, and was most recently appointed director of Westpac Banking Corporation. Margie has previously served on the boards of Penguin Random House Australia Pty Ltd (as a non-executive director and then Chair), the Australian Publishers’ Association, Bank of Queensland Limited, Ramsay Health Care Limited, Chief Executive Women (chairing its Scholarship Committee), the Powerhouse Museum and the Sydney Writers’ Festival. In 2015, Margie founded philanthropic literary travel company Ponder & See, which funds writers’ festivals and writers through creating literary trips or experiences for interested readers. She donates funds and time to create, organise and lead the trips.
Margie was recently appointed a non-executive Director of Westpac Banking Corporation which takes effect on 1 March 2019.
4.2 Directors’ Relevant InterestsThe relevant interests of each Director in Scentre Group securities as at the date of this report are shown below.
Director
Number ofStapled
Securities
Brian Schwartz 165,861Peter Allen 4,517,326Andrew Harmos 80,795Michael Ihlein 33,048Carolyn Kay 57,000Aliza Knox 60,400Steven Lowy 216,467,389Margaret Seale 56,750
No Director holds options over any issued or unissued Scentre Group securities. No options over any issued or unissued stapled securities have been issued to the Directors. None of the Directors hold debentures of Scentre Group.
None of the non-executive Directors are party to or entitled to a benefit under a contract which confers a right to call for, or be delivered, interests or securities in the Group.
Details of the performance rights held by the CEO are set out in the Remuneration Report.
4.3 Directors’ attendance at meetingsThe number of Board and Committee meetings held and attended by each Director during the Financial Year are detailed below.
Director
Board1Audit and Risk
Committee2Human Resources
CommitteeNomination Committee
Held Attended Held Attended Held Attended Held Attended
Brian Schwartz 11 11 – – – – 6 6Peter Allen 11 11 – – – – – –Andrew Harmos 11 11 – – 5 5 6 6Michael Ihlein 11 11 5 5 – – 6 6Carolyn Kay 11 11 5 5 – – – –Aliza Knox 11 11 – – 5 5 – –Steven Lowy 11 10 – – – – – –Margaret Seale 11 11 5 5 5 5 – –
1. The Board meets in person at least 6 times per year. 7 meetings in person were held in 2018. Intervening meetings comprise operational updates and are conducted by telephone.
2. Directors also attend meetings of Committees of which they are not a member. The Chairman of the Board typically attends meetings of the Audit and Risk Committee. This attendance is not reflected in the table above.
3. The Committees are comprised of the following non-executive Directors: Nomination Committee: Brian Schwartz (Chair), Andrew Harmos and Michael Ihlein; Audit and Risk Committee: Michael Ihlein (Chair), Carolyn Kay and Margaret Seale; and Human Resources Committee: Andrew Harmos (Chair), Aliza Knox and Margaret Seale.

Directors’ Report (continued)
PAGE 10
4.4 Directors’ directorships of other listed companiesDetails of all directorships of other listed entities held by each Director in the 3 years immediately before 31 December 2018 are as follows:
Director Company Date appointed Date resigned
Brian Schwartz Scentre Management Limited* 6 May 2009 ContinuingRE1 Limited* 30 June 2014 ContinuingRE2 Limited* 30 June 2014 ContinuingInsurance Australia Group Limited 1 January 2005 31 March 2016Westfield America Management Limited^ 6 May 2009 7 June 2018Westfield Corporation Limited^ 8 April 2014 7 June 2018
Peter Allen Scentre Management Limited* 25 May 2011 ContinuingRE1 Limited* 12 August 2010 ContinuingRE2 Limited* 12 August 2010 Continuing
Andrew Harmos Scentre Management Limited* 30 June 2014 ContinuingRE1 Limited* 21 December 2010 ContinuingRE2 Limited* 21 December 2010 ContinuingAMP Limited 1 June 2017 Continuing
Michael Ihlein Scentre Management Limited* 30 June 2014 ContinuingRE1 Limited* 21 December 2010 ContinuingRE2 Limited* 21 December 2010 ContinuingCSR Limited 7 July 2011 ContinuingMG Unit Trust 3 July 2015 27 October 2017
Carolyn Kay Scentre Management Limited* 24 February 2016 ContinuingRE1 Limited* 24 February 2016 ContinuingRE2 Limited* 24 February 2016 ContinuingBrambles Limited 21 August 2006 23 October 2018
Aliza Knox Scentre Management Limited* 7 May 2015 ContinuingRE1 Limited* 7 May 2015 ContinuingRE2 Limited* 7 May 2015 Continuing
Steven Lowy Scentre Management Limited* 28 June 1989 ContinuingRE1 Limited* 12 August 2010 ContinuingRE2 Limited* 12 August 2010 ContinuingWestfield America Management Limited^ 20 February 1996 7 June 2018Westfield Corporation Limited^ 28 November 2013 7 June 2018OneMarket Limited 12 December 2017 Continuing
Margaret Seale Scentre Management Limited* 24 February 2016 ContinuingRE1 Limited* 24 February 2016 ContinuingRE2 Limited* 24 February 2016 ContinuingRamsay Health Care Limited 28 April 2015 31 October 2018Telstra Corporation Limited 7 May 2012 ContinuingBank of Queensland Limited 21 January 2014 28 June 2018
Notes:
* Scentre Group comprises the Company, Scentre Group Trust 1 (SGT1), Scentre Group Trust 2 (SGT2) and Scentre Group Trust 3 (SGT3). The responsible entity of SGT1 is Scentre Management Limited. The responsible entity of SGT2 is RE1 Limited and the responsible entity of SGT3 is RE2 Limited. Scentre Management Limited is also the responsible entity of Carindale Property Trust, a listed managed investment scheme (ASX:CDP).
^ Westfield Corporation comprised Westfield Corporation Limited, Westfield America Trust and WFD Trust (ASX:WFD). The responsible entity of each scheme was Westfield America Management Limited.
4.5 SecretariesAs at the date of this report, the Company had the following Secretaries:
Ms Maureen McGrathMs Maureen McGrath was appointed General Counsel, Compliance and Secretariat of Scentre Group in June 2014. Prior to the establishment of Scentre Group, Ms McGrath was General Counsel, Corporate and Compliance, Westfield Group. She holds a Bachelor of Laws and a Bachelor of Jurisprudence from the University of New South Wales. Ms McGrath is a Fellow of the Governance Institute of Australia and a Member of the Australian Institute of Company Directors.
Mr Paul GiugniMr Paul Giugni was appointed General Counsel of Scentre Group in June 2014. Prior to the establishment of Scentre Group, Mr Giugni was General Counsel, Australia and New Zealand, Westfield Group. He joined Westfield Group in September 1998 and holds a Bachelor of Economics and a Bachelor of Laws (Honours) from the University of Sydney. Prior to joining Westfield Group, Mr Giugni was a solicitor at Freehill Hollingdale and Page (now Herbert Smith Freehills).

SCENTRE GROUP ANNUAL FINANCIAL REPORT 2018 // PAGE 11
5. OPTIONSNo options were issued by the Company during or since the end of the Financial Year and no Director or member of the senior executive team holds options over issued or unissued Scentre Group stapled securities.
Details of the performance rights held by the executive Key Management Personnel are set out in the Remuneration Report.
6. INDEMNITIES AND INSURANCE PREMIUMSSubject to the following, no indemnity was given or insurance premium paid during or since the end of the Financial Year for a person who is or has been an officer or auditor of the Group.
The Company’s Constitution provides that a person who is or has been a Director or Secretary of the Company may be indemnified by the Company against liabilities incurred by the person in that capacity and for all legal costs incurred in defending or resisting (or otherwise in connection with) proceedings in which the person becomes involved because of that capacity. The indemnity does not apply to the extent that the Company is forbidden by statute to indemnify the person or the indemnity would, if given, be made void by statute.
The Group has paid premiums for directors’ and officers’ liability insurance in respect of Directors, Secretaries and Executive Officers of the Group as permitted by the Corporations Act 2001. The terms of the insurance policy prohibit disclosure of details of the nature of the liabilities covered by, and the amounts of the premiums payable under, that insurance policy.
In addition, each Director has entered into a Deed of Indemnity and Access which provides for indemnity against liability as a Director, except to the extent of indemnity under an insurance policy or where prohibited by statute. The deed also entitles the Director to access Company documents and records, subject to undertakings as to confidentiality.
To the extent permitted by law, the Company has agreed to indemnify its auditors, Ernst & Young, as part of the standard terms of its audit engagement against claims by third parties arising from the audit (for an unspecified amount). No payment with respect to such indemnity has been made to Ernst & Young during or since the Financial Year.
7. AUDIT7.1 Audit and Risk CommitteeAs at the date of this report, the Company had an Audit and Risk Committee of the Board of Directors.
7.2 Non-Audit Services and Audit IndependenceDuring the year Ernst and Young, the Group’s auditor, has provided certain non-audit services to the Group.
Details of the amount paid to the auditor, which includes amounts paid for non-audit services, are set out in Note 36 to the Financial Statements. The Board is satisfied that the provision of non-audit services by the auditor during the Financial Year is compatible with the general standard of independence for auditors imposed by the Corporations Act 2001. Furthermore, the provision of non-audit services by the auditor during the Financial Year did not compromise the independence requirements under the Corporations Act 2001 because:
– the Group’s Non-Audit Services Protocol sets out the categories of non-audit services that the auditor may or may not undertake. Those categories of permitted services remain subject to the overriding principle that a non-audit service may not be provided in circumstances where it would be detrimental to the actual or perceived independence of the statutory auditor;
– the Non-Audit Services Protocol provides a mechanism by which approval for non-audit services proposed to be performed by the auditor is required to be given prior to the provision of such non-audit services, providing an appropriate review point for independence issues prior to engagement;
– under the Non-Audit Services Protocol, the auditor is required to report as to its compliance with the terms of the Protocol and, in all instances, confirm the position that the independence of Ernst & Young as statutory auditor has been maintained; and
– the auditor has provided an Auditor’s Independence Declaration to the Board declaring that there has been no contravention of the auditor independence requirements of the Corporations Act 2001 or of any applicable code of professional conduct.
7.3 Auditor’s Independence Declaration to the Directors of Scentre Group Limited
Auditor’s Independence Declaration to the Directors of Scentre Group LimitedAs lead auditor for the audit of Scentre Group Limited for the financial year ended 31 December 2018, I declare to the best of my knowledge and belief, there have been:
(a) no contraventions of the auditor independence requirements of the Corporations Act 2001 in relation to the audit; and
(b) no contraventions of any applicable code of professional conduct in relation to the audit.
This declaration is in respect of Scentre Group Limited and the entities it controlled during the financial year.
Ernst & Young Megan Wilson Partner
Sydney, 20 February 2019
Liability limited by a scheme approved under Professional Standards Legislation.

Directors’ Report (continued)
PAGE 12
8. REMUNERATION REPORT Dear Securityholders
On behalf of the Scentre Group Board, I am pleased to introduce the 2018 remuneration report.
The report aims to provide you with an understanding of our remuneration strategy and 2018 outcomes for our key management personnel (KMP). At our 2019 Annual General Meeting (AGM) to be held on 4 April 2019, we will seek your support for this report.
The year in reviewWhile there were no changes to our remuneration framework during the year, we continued to review our remuneration strategy and performance hurdles. We have, effective 2019, reduced the potential maximum opportunity on vesting for the ROCE measure of our long term at risk remuneration (LTAR) from 150% to 125%, to equate to the maximum vesting potential under the development return hurdle. This change also responds to feedback from securityholders and proxy advisers.
Our remuneration strategy and framework are described in section 8.3 of this report, and the Board believes that these continue to achieve our desired objectives.
The Committee actively monitors the performance of our executive KMP and senior leadership team throughout the year. Our people and culture are key to delivering the Group’s strategy, and we believe that having a diverse and engaged workforce contributes to strong performance.
Our executive KMP and senior leadership team are responsible for actively promoting the Group’s culture, are expected to live the Group’s values, our DNA, and continued to advance the Group’s strategic agenda during 2018.
Our real estate portfolio is well positioned and resilient with assets under management valued at $54.2 billion. We have continued to evolve our premium portfolio of retail centres into ‘living’ centres, reflecting the Group’s capabilities to curate a unique mix of products and services that meet the changing needs and expectations of our customers and set new industry benchmarks in our markets of operation. Our ownership interests of $39.1 billion comprise 41 Westfield-branded living centres, each of which is integral to the communities it serves and with a strong franchise value and ability to attract the world’s leading brands. We have achieved this significant scale through our integrated platform, with a portfolio of strong businesses including: design and construction, development, retail operations and management, parking, and media and advertising. We are able to offer a wide range of career opportunities and have continued to attract and retain a talented and diverse workforce.
Key highlights for the year include:
– Funds from operation (FFO) of $1,339.5 million (25.24 cents per security, 3.9% growth)
– Opening $1.1 billion (SCG share: $810 million) of redevelopments at Westfield Plenty Valley, Carousel, Coomera, Kotara and Tea Tree Plaza, adding more than 106,000 sqm
– Commencing the NZ$790 million (SCG share: NZ$400 million) redevelopment of Westfield Newmarket, which will create the leading lifestyle and premium fashion destination in New Zealand
– Actively curating our retail, services and experiences to meet customer expectations
– Achieving an Employer of Choice for Gender Equality citation from the Workplace Gender Equality Agency (WGEA)
– 100% retention of key executive talent identified for critical roles
– Increasing female representation at the senior executive level (General Manager and above) from 22% to 26.5% at the upper range of our 2018 target of 25% – 27%
In determining remuneration outcomes, the Board assesses a number of factors. For our executive KMP, short term at risk remuneration (STAR) was paid at a range of 73.9% to 80.8% of maximum after the Board’s consideration of the achievement of financial measures including FFO and project profits and a number of qualitative outcomes including risk management, retailer partnerships and customer experience.
The Board considers that these outcomes are fair and reflect the performance of our executive KMP.
Additionally, the 2016 LTAR incentive was tested in December 2018. Both the ROCE hurdle and the development return hurdle vested at a 110% of target as a result of the strong performance against FFO over a 3 year period in combination with no increase in issued equity and the success of our redevelopment of Westfield Chermside in Queensland. Further details of the LTAR hurdles and vesting are set out in section 8.4 of this report.
The year aheadThe Group is now in its fifth full year of operation, led by our CEO, Peter Allen, with over 20 years of service with Scentre Group and previously Westfield Group.
While another year of strong results for the Group has been delivered, there has been no increase to the fixed remuneration, STAR or LTAR (at grant) opportunity for our executive KMP.
Peter and our CFO, Mark Bloom, have not had an increase in fixed remuneration since the Group was established in 2014 and our COO, Greg Miles, has not had an increase in fixed remuneration since his appointment in 2015.
No changes are proposed to non-executive Director base fees for 2019. However, the fees for Committee members of the Human Resources Committee (excluding the chair) will increase by increments of $5,000 in each of the next 2 years to equate to Committee fees for members of the Audit and Risk Committee, and reflective of the increasing workload and time commitment required of the Committee.
We are also pleased that our Chief Strategy Officer, Cynthia Whelan, has, effective February 2019, been appointed as our first female executive KMP.
As a Board we continue to set targets which reflect our focus on delivering returns to investors and long term sustainable business performance. We also recognise that underpinning the success of the Group is our people and that our investment in them, and continuing to foster a positive culture, leads to better business outcomes.
Andrew Harmos Chairman, Human Resources Committee
Contents Page
8.1 Key Management Personnel 148.2 Key Questions 158.3 Remuneration philosophy and link to business strategy 168.4 Remuneration outcomes and the link between
performance and reward 188.5 Executive KMP 2018 actual remuneration
(non-statutory) 228.6 Executive KMP statutory remuneration 238.7 Remuneration governance framework 258.8 Executive KMP service agreements 288.9 Non-executive Director fees 29

SCENTRE GROUP ANNUAL FINANCIAL REPORT 2018 // PAGE 13
SUMMARY: HOW PERFORMANCE IS LINKED TO REMUNERATION OUTCOMES
EXECUTIVE KMP: REMUNERATION MIX
The remuneration mix for our executive KMP is weighted towards at risk remuneration (expressed as a % of available maximum at grant)
▼
Executive At risk remuneration% delivered as
performance rights
CEO 75% 49%
Chief Financial Officer 28.5%13%30%28.5%
Chief Operating Officer 32%12%29%27%
At Risk
At Risk
At Risk
At Risk
Chief Executive Officer 38%11%26%25%
■ Fixed ■ LTAR■ STAR – Deferred equity■ STAR – Cash component
SHORT TERM AT RISK REMUNERATION (STAR) OUTCOMES
The KPIs for our executive KMP are aligned to the delivery of our purpose and strategic priorities
The FY18 STAR outcome (which assesses 2018 performance) for our executive KMP (% of maximum) was CEO: 80.8%, CFO: 79.1% and COO: 73.9%
▼ FINANCIAL PERFORMANCE
FFO % increase per security
2015 2016 2017 2018 2015 2016 2017 2018
1,100
1,150
1,200
1,250
1,300
1,350
1,400
1,339.53.9%1,290.2
4.25%1,237.63.2%
1,199.2 11.4
11.83.5%
12.34.1%
10.5
11.0
11.5
12.0
12.5
13.0
12.73.6%
FFO of 25.24 cents per security (3.9% growth)
Comparable NOI growth of 2.5%
Biggest development year to date by number, floorspace and geography
– $1.1 billion of completed developments (SCG share: $810 million)
– Added more than 106,000 sqm in GLA
– Developments across 5 states: Perth (Carousel), Adelaide (Tea Tree Plaza), Melbourne (Plenty Valley), Newcastle (Kotara) and the Gold Coast (Coomera, our first greenfield development)
Distribution growth of 2.0% from 2017
Project profits of $85.3 million
CUSTOMER AND RETAIL PARTNERSHIPS
Net Promoter Score of 28% up 4%
Reputation Score increased by 2.8%
PEOPLE, CULTURE AND INNOVATION
Increased female representation at the senior executive level (General Manager and above) up from 22% to 26.5%
Launched an innovation sprint with one incubation (WhatsMine) out of test phase
LONG TERM AT RISK REMUNERATION (LTAR) OUTCOMES
Granted in 2016 and measured at the end of 2018
ROCE (75% weighting): Maximum vesting opportunity 150%. Vested at 110%
Development return hurdle (25% weighting): referable to Westfield Chermside. Maximum vesting opportunity 125%. Vested at 110%
▼ ROCE of 12.79% was achieved under the 2016 LTAR
Development return hurdle: The $355 million redevelopment of Westfield Chermside was successfully completed in 2017 setting a new benchmark for creating extraordinary retail and lifestyle destinations
– Minimum development return of 7.0%, with target return in excess of minimum
– 105% of target return achieved
– Value creation of $0.8 billion
– Sales of $1 billion per annum
OTHER REMUNERATION OUTCOMES ▼ There are no increases in the fixed remuneration, STAR or LTAR (at grant) opportunities for our executive KMP
On review of the ROCE and development return hurdles, the potential maximum opportunity on vesting for the ROCE measure has been reduced from 150% to 125%

Directors’ Report (continued)
PAGE 14
8.1 Key Management PersonnelThis report explains our approach to the remuneration of our Key Management Personnel (KMP). KMP are those individuals having the authority and responsibility for planning, directing and controlling the activities of Scentre Group, either directly or indirectly. They include non-executive Directors, the CEO and those senior executives considered executive KMP. For the year ended 31 December 2018, KMP were:
Name Position
Executive DirectorPeter Allen Chief Executive Officer
Senior ExecutivesMark Bloom Chief Financial Officer Greg Miles Chief Operating Officer Non-Executive DirectorsBrian Schwartz ChairmanAndrew Harmos Director Michael Ihlein DirectorCarolyn Kay DirectorAliza Knox Director Steven Lowy Director Margaret Seale Director

SCENTRE GROUP ANNUAL FINANCIAL REPORT 2018 // PAGE 15
8.2 Key Questions
Questions Further information
Remuneration in 2018
1. How is the Group’s 2018 performance reflected in this year’s remuneration outcomes?
2018 financial highlights and people and customer highlights appear in a number of sections.
– The Committee Chairman’s letter
– Summary on page 13
– Section 8.4
2. What changes were made to the remuneration framework in 2018?
No changes were made.
3. Are any changes planned for 2019?
We have reduced the potential maximum opportunity on vesting for the ROCE measure under the LTAR from 150% to 125%.
Section 8.7
Remuneration framework
4. What is the remuneration framework?
Remuneration comprises fixed and at risk remuneration. Section 8.3
5. Who do we benchmark against? From 2017, in addition to the A-REIT sector and ASX 30, we have included the ASX 30, excluding the “Big 4” banks, Rio Tinto and BHP, as a reference point to compare remuneration levels for our executives.
Section 8.3
6. What proportion of the remuneration is at risk?
The 2018 at risk (i.e. the short term at risk (STAR) and long term at risk (LTAR)) proportion of maximum remuneration measured at grant date was: CEO – 75%, CFO – 71.5% and COO – 73%.
Section 8.3
7. Are there any clawback or cancellation provisions for at risk remuneration?
Yes. The plans contain provisions for the lapsing of all unvested awards in a number of circumstances.
Section 8.7
8. Does the Group have a minimum securityholding requirement?
Yes. Executive KMP and non-executive Directors are required to maintain a minimum holding of securities.
Section 8.7
At risk remuneration
9. Are any STAR payments deferred? Yes. 30% of the actual STAR awarded is delivered as performance rights, which vest after 3 years.
Section 8.3 andsection 8.7
10. Are STAR payments capped? Yes. The potential maximum STAR for executive KMP is capped at 150% of their fixed remuneration.
Section 8.3
11. What are the performance measures for the LTAR?
The LTAR hurdles are:
– A Return on Contributed Equity (ROCE) hurdle with a 75% weighting (ROCE will be assessed by reference to ROCE in year 3).
– A development return hurdle with a 25% weighting (measured at the end of year 3).
Section 8.4 andsection 8.7
12. Does the LTAR have re-testing? No. If full qualification for awards is not achieved, there is no provision for re-testing the hurdles.
Section 8.7
13. Is the size of LTAR grants increased in light of performance conditions?
The number of rights which vest is based on a graduated scale dependent on performance against metrics set at the time of grant. Actual performance can result in a decrease to zero or an increase in the number of securities that can be delivered on vesting, subject to a cap.
Section 8.4 and section 8.7
14. Can participants hedge their unvested awards?
No. Participants are prohibited from hedging awards. Section 8.7
15. Does Scentre Group buy securities or issue new securities to satisfy vesting?
Where rights are settled with securities, the Group acquires the securities on-market and transfers the securities to executives.
Section 8.7
16. Is the CEO grant of performance rights subject to securityholder approval?
Yes. The grant of 2018 performance rights to the CEO was approved at the 2018 AGM and approval for the grant of 2019 performance rights to the CEO will be sought at the AGM on 4 April 2019.
Section 8.7
17. Are distributions paid during the vesting period?
No. However, the number of rights allocated is determined using the face value of Scentre Group securities, adjusted for the estimated value (based on the Group’s published 1 year forecast) of distributions that may be paid on stapled securities during the vesting period. No adjustments are made in relation to actual distributions paid.
Section 8.7

Directors’ Report (continued)
PAGE 16
8.3 Remuneration philosophy and link to business strategy
Objectives
Attract and retain the best talent Fairly reward our people Align the interests of our peoplewith securityholders
Remuneration element Performance conditions Alignment with strategy and performance
Fixed remunerationBase salary (inclusive of superannuation).Fixed remuneration is targeted at the 75th percentile of our comparator group.
▼ Considerations include: the scope and complexity of the role, the individual’s experience, knowledge and skills, individual performance and market benchmarking.
▼ Fixed remuneration is set at market competitive levels to attract and retain key talent.
At r
isk
rem
uner
atio
n
Th
e va
lue
of
rig
hts
gra
nte
d u
nd
er t
he
STA
R a
nd
LTA
R in
crea
ses
or
de
crea
ses
dep
end
ing
on
th
e se
curi
ty p
rice
At risk remuneration
Short term at risk remuneration (STAR)
Rewards current year performance.
70% of the actual STAR is paid in cash at the end of the year.
30% of the actual STAR is delivered as performance rights which vest after 3 years, creating a longer term and retention focus.
Our STAR is structured as annual at risk remuneration. That is underperformance and failure to achieve KPIs results in a reduction of rewards under the STAR.
▼ Financial measures
CEO: 65%, CFO: 70% and COO: 65%
Financial measures incorporate the following metrics:
– FFO
– Project profits
– Development starts
– Leasing metrics
– Capital management
Non-financial measures
CEO: 35%, CFO: 30% and COO: 35%
A balance of measures that underpin the growth and sustainability of our business including customer experience, retailer partnerships, community engagement, risk management, safety, diversity and inclusion and organisational capabilities including innovation.
For FY18, KPIs included specific metrics focused on the customer.
Further details of the STAR performance measures are at section 8.4.
▼ The STAR provides differentiation of pay for performance based on business and individual performance outcomes.
Performance conditions are designed to support the financial and strategic direction of the Group, with clearly defined KPIs that are measurable ensuring appropriate differentiation of reward for performance.
Non-financial measures include discretionary elements (ranging from 20% – 25%) for evaluation by the Board. The Board has discretion to apply judgement when approving the final performance outcomes. Failure to achieve KPIs results in a reduction of rewards under the STAR.
At risk remuneration
Long term at risk remuneration (LTAR)
Rewards long term sustainable performance.
Delivered as performance rights which vest in two tranches at the end of year 3 and year 4 if the performance hurdles are achieved.
▼ Development return hurdle (25% weighting)
ROCE hurdle (75% weighting)
Further details of the LTAR performance conditions are at sections 8.4 and 8.7.
▼ The LTAR ensures a strong link to the long-term performance of the Group, the creation of securityholder value and acts as a retention tool.
ROCE is an important long-term measure of how the senior management team generates returns on securityholder equity through a combination of improving earnings and capital management.
The development program is a significant driver of growth for the Group through adding to the scale and enhancing the quality of our portfolio. The development return hurdle is linked to long term securityholder value as it is assessed against actual incremental income yields generated through the completion of major developments (over $50 million).

SCENTRE GROUP ANNUAL FINANCIAL REPORT 2018 // PAGE 17
When is remuneration earned and received?
Fixed Remuneration
100% of fixed pay awarded in cash
At
risk
Rem
un
erat
ion
STAR Performance period (1 year). 70% awarded in cash
30% of total STAR award deferred in the form of performance rights (subject to 3-year service requirement)
LTAR 25% of award based on a development return hurdle (performance measured at the end of year 3)
75% of award based on ROCE hurdle (performance measured at the end of year 3)
50% of LTAR award (subject to performance/service requirements) vests at the end of year 3
50% of LTAR award (subject to performance/service requirements) vests at the end of year 4
Year 1 Year 2 Year 3 Year 4
Executive KMP remuneration The remuneration mix for our executive KMP is weighted towards at risk remuneration. The potential maximum STAR (as a percentage of fixed remuneration) for each of our executive KMP is 150%. The LTAR (at grant, as a percentage of fixed remuneration) for our executive KMP is CEO: 155%, CFO: 100% and COO: 120%.
The tables below show each of the components as a percentage of maximum remuneration at grant for our executive KMP for 2018. The actual amount delivered under the STAR and LTAR depends on the level of achievement of the performance measures.
Chief Financial Officer 28.5%13%30%28.5%
Chief Operating Officer 32%12%29%27%
At Risk
At Risk
At Risk
At Risk
Chief Executive Officer 38%11%26%25%
■ Fixed ■ LTAR■ STAR – Deferred equity■ STAR – Cash component
In addition to the traditional A-REIT sector and ASX 30, in our benchmarking we have considered the ASX30, excluding the “Big 4” banks, RIO Tinto and BHP, as a reference point by which to compare remuneration levels for our executives. We believe that this continues to reflect the changing nature of our business, our size and strategic agenda including our desire to attract and be competitive in the market for talent from the broader ASX30. This is evidenced by recent appointments from outside the A-REIT sector including our Chief Strategy Officer, Director, Technology and Director, Communications who came from the telecommunications, media networks and banking sectors.

Directors’ Report (continued)
PAGE 18
8.4 Remuneration outcomes and the link between performance and rewardScentre Group is the 15th largest listed entity on the ASX by market capitalisation with assets under management of $54.2 billion (SCG share: $39.1 billion). Our ownership interests comprise 41 Westfield-branded living centres (including 16 of the top 25 centres in Australia and 4 of the top 5 centres in New Zealand) each of which is integral to the communities it serves and with a strong franchise value and ability to attract the world’s leading brands.
We have achieved this scale through our integrated platform, with a strong portfolio of businesses. Our construction business is one of the largest commercial construction businesses in Australia and our design business in one of the largest multi-disciplined firms. We are also one of the largest car park operators in Australia.
(a) FY18 highlights include
Customer Experience and Retail Product
– Active curation of retail, services and experiences to meet customer expectations
– Introduced 437 new brands to the portfolio, and 317 existing brands grew their store network
– More than 35% of the stores across our portfolio are experience-based offerings
– Across the five developments we opened during the year, more than half of the new stores offer experiences which can only be consumed onsite, including dining, entertainment, health, fitness and beauty services
– Improved ease of customer parking through continued rollout of ticketless parking
– Launched ‘Westfield Local Heroes’, a new community recognition and grants program
Our People
– Increased female representation at the senior executive level (General Manager and above) to 26.5% at the upper end of our 2018 target of 25% – 27%
– 100% retention of key executive talent identified for critical roles
– Employer of Choice for Gender Equality citation from WGEA
Asset Management and Development
– Opened $1.1 billion (SCG share: $810 million) of redevelopments at Westfield Plenty Valley, Westfield Carousel, Westfield Coomera, Westfield Kotara and Westfield Tea Tree Plaza during 2018, adding more than 106,000 sqm
– Commenced the NZ$790 million (SCG share: NZ$400 million) redevelopment of Westfield Newmarket, which will create the leading lifestyle and premium fashion destination in New Zealand
– Acquired a 50% share in Westfield Eastgardens for $720 million
– Successfully bid for Sydney’s Barangaroo Central retail component
– Revaluation gains for the portfolio of $1.1 billion
Capital Management
– New and extended bank loan facilities of $3.8 billion
– Issued €500 million ($800 million) of long term bonds
– At 31 December 2018, gearing was 33.9% and the average debt maturity was 4.4 years
– Maintained a high level of interest rate hedging of 69% at 31 December 2018
(b) Financial measuresThe following table represents business performance outcomes and security price since the establishment of the Group in 2014.
Five year performance FY18 FY17 FY16 FY15 FY14*
Funds from Operations (FFO) A$m 1,339.5 1,290.2 1,237.6 1,199.2 577.9FFO per security cents 25.24 24.29 23.30 22.58 10.88Distribution per security cents 22.16 21.73 21.30 20.90 10.20Security price (at 31 December) A$ 3.90 4.19 4.64 4.19 3.50Distribution payout ratio** % 87.8 89.5 91.4 92.6 93.8Return on contributed equity (ROCE) % 12.72 12.28 11.80 11.40 11.00Comparable net operating income (NOI) growth % 2.5 2.75 2.9 2.6 2.4Incremental GLA sqm 106,550 38,000 50,700 42,386 44,149Group’s share of incremental GLA sqm 70,150 35,500 36,450 25,949 44,149Assets under management (AUM) A$b 54.2 51.0 45.7 42.1 40.9Group’s share of AUM A$b 39.1 36.2 32.3 30.1 29.3Profit A$m 2,287.2 4,217.9 2,990.5 2,707.8 1,281.2Gearing % 33.9 32.1 33.3 33.3 34.9
* 6 months to 31 December 2014. The Group was established on 30 June 2014.
** As announced in August 2017, the Group extended its practice to grow distributions at a lower rate than earnings growth until reaching a distribution payment ratio of 85% of FFO.

SCENTRE GROUP ANNUAL FINANCIAL REPORT 2018 // PAGE 19
Key financial metrics which are aligned to the STAR and LTAR outcomes for the executive KMP are FFO and ROCE. FFO is a key financial measure to drive returns to securityholders and ROCE is an important long term measure of how the senior executive team generates returns on securityholder equity through a combination of improving earnings and capital management.
The charts below show growth in FFO and ROCE since 2015, being the first full year of operation of the Group.
Funds From Operations (FFO) % increase per security Return on Contributed Equity (ROCE) %
2015 2016 2017 2018 2015 2016 2017 2018
1,100
1,150
1,200
1,250
1,300
1,350
1,400
1,339.53.9%1,290.2
4.25%1,237.63.2%
1,199.2 11.4
11.83.5%
12.34.1%
10.5
11.0
11.5
12.0
12.5
13.0
12.73.6%
(c) Total returnsThe Group is included in the S&P/ASX A-REIT Index and the S&P/ASX 200 Index.
The Chart below shows the Group’s relative performance (on a daily basis) against those indices (1 July 2014 to 31 December 2018).
S&P/ASX 200 IndexS&P/ASX 200 A-REIT Index
Scentre Group
Jul-1
4A
ug-1
4S
ep-1
4O
ct-1
4N
ov-1
4D
ec-1
4Ja
n-15
Feb-
15M
ar-1
5A
pr-1
5M
ay-1
5Ju
n-15
Jul-1
5A
ug-1
5S
ep-1
5O
ct-1
5N
ov-1
5D
ec-1
5Ja
n-16
Feb-
16M
ar-1
6A
pr-1
6M
ay-1
6Ju
n-16
Jul-1
6A
ug-1
6S
ep-1
6O
ct-1
6N
ov-1
6D
ec-1
6Ja
n-17
Feb-
17M
ar-1
7A
pr-1
7M
ay-1
7Ju
n-17
Jul-1
7A
ug-1
7S
ep-1
7O
ct-1
7N
ov-1
7D
ec-1
7Ja
n-18
Feb-
18M
ar-1
8A
pr-1
8M
ay-1
8Ju
n-18
Jul-1
8A
ug-1
8S
ep-1
8O
ct-1
8N
ov-1
8D
ec-1
8
90
100
110
120
130
140
150
160
170
180
190
(d) CEO remuneration comparativesThe charts below shows our CEO’s remuneration as compared to FFO (cents per security) and ROCE (%) from 2015 being the first year of full operation for the Group to 2018. The compound annual growth rate in FFO in this period was 3.8% and for ROCE was 3.7%.
2015 2016 2017 2018 2015 2016 2017 2018
02468
101214161820 26
25
24
23
22
21
20
CEO Remuneration $m* FFO (Cents per Security) CEO Remuneration $m* ROCE (%)
02468
101214161820 13.0
12.5
12.0
11.5
11.0
10.5
10.0
■ Total Compensation■ Base Salary■ FFO
■ Total Compensation■ Base Salary■ ROCE
* In 2015, retention awards issued by the prior Westfield Group, with a value of $11,363,652 on vesting.
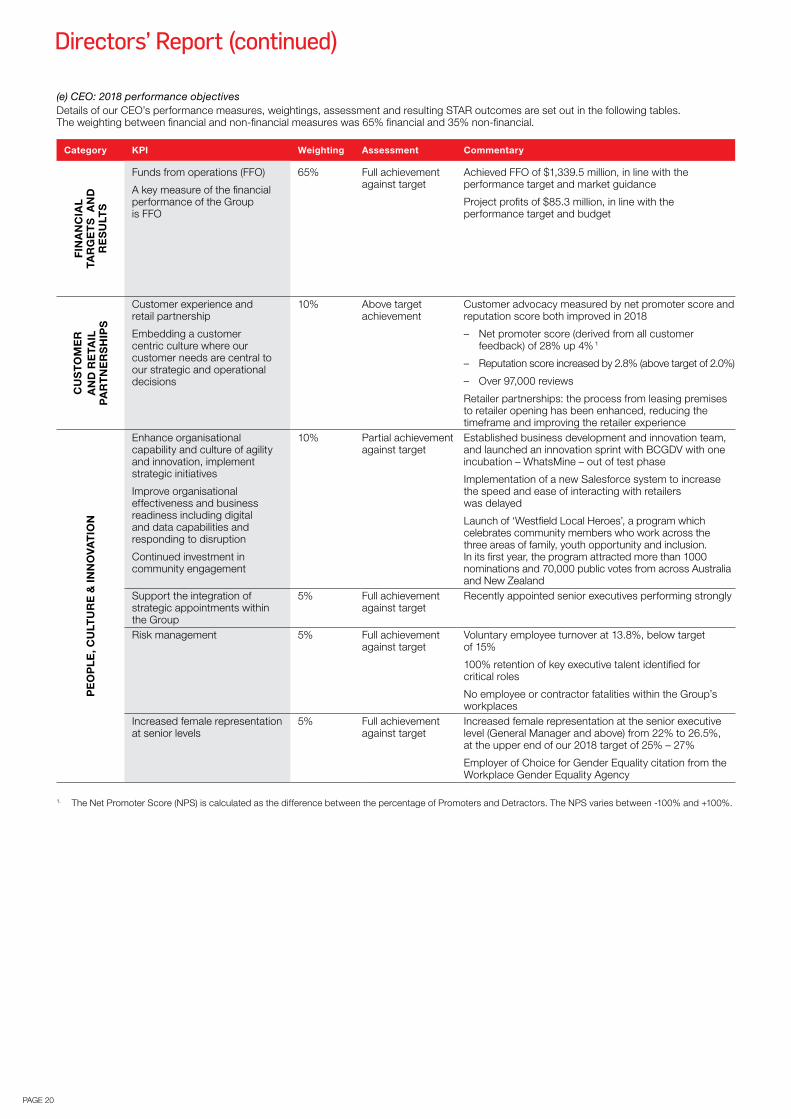
Directors’ Report (continued)
PAGE 20
(e) CEO: 2018 performance objectivesDetails of our CEO’s performance measures, weightings, assessment and resulting STAR outcomes are set out in the following tables. The weighting between financial and non-financial measures was 65% financial and 35% non-financial.
Category KPI Weighting Assessment Commentary
FIN
AN
CIA
L TA
RG
ET
S A
ND
R
ES
ULT
S
Funds from operations (FFO)
A key measure of the financial performance of the Group is FFO
65% Full achievement against target
Achieved FFO of $1,339.5 million, in line with the performance target and market guidance
Project profits of $85.3 million, in line with the performance target and budget
CU
ST
OM
ER
A
ND
RE
TAIL
P
AR
TN
ER
SH
IPS
Customer experience and retail partnership
Embedding a customer centric culture where our customer needs are central to our strategic and operational decisions
10% Above target achievement
Customer advocacy measured by net promoter score and reputation score both improved in 2018
– Net promoter score (derived from all customer feedback) of 28% up 4% 1
– Reputation score increased by 2.8% (above target of 2.0%)
– Over 97,000 reviews
Retailer partnerships: the process from leasing premises to retailer opening has been enhanced, reducing the timeframe and improving the retailer experience
PE
OP
LE
, CU
LTU
RE
& IN
NO
VA
TIO
N
Enhance organisational capability and culture of agility and innovation, implement strategic initiatives
Improve organisational effectiveness and business readiness including digital and data capabilities and responding to disruption
Continued investment in community engagement
10% Partial achievement against target
Established business development and innovation team, and launched an innovation sprint with BCGDV with one incubation – WhatsMine – out of test phase
Implementation of a new Salesforce system to increase the speed and ease of interacting with retailers was delayed
Launch of ‘Westfield Local Heroes’, a program which celebrates community members who work across the three areas of family, youth opportunity and inclusion. In its first year, the program attracted more than 1000 nominations and 70,000 public votes from across Australia and New Zealand
Support the integration of strategic appointments within the Group
5% Full achievement against target
Recently appointed senior executives performing strongly
Risk management 5% Full achievement against target
Voluntary employee turnover at 13.8%, below target of 15%
100% retention of key executive talent identified for critical roles
No employee or contractor fatalities within the Group’s workplaces
Increased female representation at senior levels
5% Full achievement against target
Increased female representation at the senior executive level (General Manager and above) from 22% to 26.5%, at the upper end of our 2018 target of 25% – 27%
Employer of Choice for Gender Equality citation from the Workplace Gender Equality Agency
1. The Net Promoter Score (NPS) is calculated as the difference between the percentage of Promoters and Detractors. The NPS varies between -100% and +100%.

SCENTRE GROUP ANNUAL FINANCIAL REPORT 2018 // PAGE 21
(f) CFO and COO performance objectives 1
The weighting between financial and non-financial measures for the CFO was 70% financial and 30% non-financial and for the COO 65% financial and 35% non-financial.
The CFO achieved target for financial measures in relation to FFO and treasury and financial management. Performance against measures for investor stakeholder engagement was assessed at partial achievement against target. Performance against measures relating to people and organisational capability and innovation were also assessed at partial achievement against target.
The COO achieved target for financial measures in relation to FFO, commencement of new developments and continuation of the development pipeline. Performance against meeting time, leasing and financial metrics for completed developments was assessed at partial achievement against target. Performance against metrics relating to customer experience was assessed at above target. Performance against people and organisational capability was assessed at partial achievement against target.
(g) 2018 STAR outcomesThe actual 2018 STAR outcome for the CEO is as follows.
Executive Year
STAR maximum
$
Actual STARgranted
$ $ Cash component Deferred equity $
Actual STAR (as a % of maximum)
STAR notachieved
(as a % of maximum)
Peter Allen 2018 3,000,000 2,422,500 1,695,750 (70%) 726,750 (30%) 80.8 19.22017 3,000,000 2,486,250 1,740,375 (70%) 745,875 (30%) 82.9 17.1
The actual 2018 STAR outcomes for the CFO and COO are as follows.
Executive
STAR maximum
$
Actual STARgranted
$ $ Cash component Deferred equity $
Actual STAR (as a % of maximum)
STAR notachieved
(as a % of maximum)
Mark Bloom 2018 1,650,000 1,305,000 913,500 (70%) 391,500 (30%) 79.1 20.92017 1,650,000 1,341,250 938,875 (70%) 402,375 (30%) 81.3 18.7
Greg Miles 2018 2,250,000 1,662,500 1,163,750 (70%) 498,750 (30%) 73.9 26.12017 2,250,000 1,706,250 1,194,375 (70%) 511,875 (30%) 75.8 24.2
(h) 2016 LTAR outcomesPerformance rights were granted to executives in 2016 under the Group’s 2016 LTAR plan. The first tranche vested in December 2018. The second tranche will vest in December 2019. The 2016 LTAR had two hurdles: ROCE and a development return hurdle both measured at the end of year 3 (2018). The mechanics of the LTAR plan are described in section 8.7.
ROCE hurdle (75% weighting)The ROCE hurdle enables the Board to reward management performance having regard to the level of returns generated on securityholder equity through a combination of improving earnings and capital management. The Group’s ROCE is calculated by applying FFO for the relevant financial year as a percentage of the Group’s weighted average contributed equity during the year.
FFO growth over the 3 year period in combination with no increase in issued equity resulted in the ROCE hurdle vesting at 110%. The Group commenced a buy-back during the year. However, given the size of the buy-back (0.14%), there was no meaningful impact (positive or negative) on the ROCE calculation.
ROCE achieved for the 2016 LTAR was 12.79%. Adjusted for the additional retained earnings resulting from the change in our distribution payment ratio, ROCE for 2018 was 12.72% which remained within (and had no impact on) the graduated scale of vesting at 110%.
The ROCE hurdle was adjusted to take into account the changed distribution payment ratio from 2018 onwards.
Since 2015, being the first full year of operation for the Group, ROCE has increased from 11.4% to 12.72%.
Development return hurdle (25% weighting)The development return hurdle is designed to measure the actual incremental yield that has been generated through the completion of major developments (over $50 million) compared to Board approved feasibilities. The major development commenced in 2016 was Westfield Chermside in Queensland.
The $355 million redevelopment of Westfield Chermside was successfully completed in 2017. The development set a new benchmark for creating extraordinary retail and lifestyle destinations with value creation of $0.8 billion from the redevelopment. Westfield Chermside is now the 5th most productive centre in Australia by moving annual turnover. It is the largest centre in Queensland and continues to grow visitations in excess of 18 million per annum. Chermside is the only Brisbane shopping centre with international mini-majors H&M, Zara, Uniqlo and Sephora under the one roof.
Westfield Chermside received global industry recognition for its design, having been shortlisted in the “Shopping – Completed Buildings” category of the 2018 World Architecture Festival.
1. As announced on 29 January 2019, Mark Bloom will retire from his role as CFO at the Group’s AGM on 4 April 2019.

Directors’ Report (continued)
PAGE 22
The outcome of the 2016 LTAR (measured at the end of 2018) is as follows.
ROCE Target (100% vesting) What was achieved % Vested % Weighting
12.50 – 12.59 % 12.79% 110 75
Development return hurdle (yield) Target What was achieved % Vested % Weighting
Minimum development return of 7% with target
in excess of minimum 105% of target return 110 25
The ROCE hurdle had a cap of 150% vesting (at 13.2% or above). Achievement below 12.50% would have resulted in a reduction of the percentage of vesting. If ROCE was 12.19% or below, the level of vesting would have been zero.
The development return hurdle had a cap of 125% vesting. Vesting increased by 5% for every incremental 0.2% above target yield, with a cap of 125% vesting. Achievement below forecast yield would have resulted in a reduction of the percentage of vesting with vesting being reduced by 10% for each incremental 0.2% lower than target yield until 85% of the target yield. If the development return was below 85% of target yield, the level of vesting would have been zero.
(i) 2018 LTAR hurdlesFor 2018, the performance hurdles remained as ROCE (75% weighting) and a development return hurdle (25% weighting). The mechanics of the LTAR are described in section 8.7.
For 2018 (measured in 2020), there is one major development for the purposes of the development return hurdle, being Westfield Newmarket in Auckland.
8.5 Executive KMP 2018 actual remuneration (non-statutory)The table below sets out the remuneration paid to, or vested for, our executive KMP. The numbers in this table differ from those shown in section 8.6 (executive KMP statutory remuneration) primarily due to differences in the accounting treatment of share based payments. The table in section 8.6 includes an apportioned accounting value for all unvested at risk STAR and LTAR rights on issue during the year (some of which remain subject to satisfaction of performance hurdles and service conditions and may not ultimately vest). Further details of the accounting treatment of awards are set out in Note 30 to the financial statements.
While the cash amount received by an executive in any one year may vary above or below statutory remuneration, this does not impact the financial position of the Group as all performance rights are amortised over their life.
The table below shows the market value of the performance rights under the STAR and LTAR plans for rights that vested for the benefit of our executive KMP in 2018, including where awarded in prior periods. The value of the rights increases or decreases depending on movement in the security price. Also included is the movement in the market value of these rights since the date of grant.
The table below presents:
– Fixed remuneration
– Cash STAR: the cash bonus earned in 2018 under the STAR
– Deferred STAR: the value of the deferred STAR from prior years that vested in 2018 and satisfied by the delivery of Group securities. The STAR is subject to a 3 year vesting period
– LTAR: the value of LTARs from prior years that vested in 2018 and satisfied by the delivery of Group securities. This includes for our CEO and CFO the vesting of rights that were granted in 2014, 2015 and 2016. Our COO was appointed in November 2015. 2018 represents the first year of vesting under the 2016 LTAR.
Year
Short term benefits
SCG share based payments
Cash valuebefore
movement in market
value
Movement in market value
$
Total cashvalue
$
DeferredSTAR LTAR
Fixedremuneration (i)
$
CashSTAR (ii)
$
Othershort term
benefits (iii)
$
Marketvalue at
grant$
Marketvalue at
grant$
Executive KMPPeter Allen 2018 2,000,000 1,695,750 102,692 795,806 4,138,571 8,732,819 438,969 9,171,788
2017 2,000,000 1,740,375 (12,692) 942,501 3,087,801 7,757,985 1,146,179 8,904,164Mark Bloom 2018 1,100,000 913,500 22,635 452,517 1,387,530 3,876,182 164,475 4,040,657
2017 1,100,000 938,875 31,096 412,343 1,158,385 3,640,699 463,100 4,103,799Greg Miles 2018 1,500,000 1,163,750 (21,058) – 1,357,100 3,999,792 (22,409) 3,977,383
2017 1,500,000 1,194,375 36,634 – 347,245 3,078,254 15,541 3,093,795
(i) Base salary is inclusive of statutory superannuation benefits.(ii) 70% of the STAR is delivered in cash and 30% as performance rights.(iii) Comprising annual leave and long service leave entitlements.

SCENTRE GROUP ANNUAL FINANCIAL REPORT 2018 // PAGE 23
8.6 Executive KMP statutory remunerationThe table below sets out the 2018 statutory remuneration for our executive KMP. As noted above, this table includes an apportioned accounting value for all unvested STAR and LTAR rights granted prior to or in 2018 (some of which remain subject to satisfaction of performance hurdles and service conditions and may not ultimately vest). Further details of the accounting treatment of awards are set out in Note 30 to the financial statements.
Year
Short term benefits Share based payments (iii)
Other long term benefits
$
Termination Benefits
$
Total remuneration
$
Fixedremuneration (i)
$Cash STAR
$
Othershort term
benefits (ii)
$Cash
$Equity
$
Executive KMPPeter Allen 2018 2,000,000 1,695,750 102,692 – 3,937,901 – – 7,736,343
2017 2,000,000 1,740,375 (12,692) 123,904 3,589,310 – – 7,440,897Mark Bloom 2018 1,100,000 913,500 22,635 – 1,434,232 – – 3,470,367
2017 1,100,000 938,875 31,096 55,757 1,288,173 – – 3,413,901Greg Miles 2018 1,500,000 1,163,750 (21,058) – 2,013,967 – – 4,656,659
2017 1,500,000 1,194,375 36,634 – 1,350,488 – – 4,081,497
(i) Fixed remuneration is inclusive of statutory superannuation benefits.(ii) Comprising annual leave and long service leave entitlements.(iii) Refer to the tables below for details of rights held by executive KMP under the equity-linked plans.
(a) Participation in the STAR plan: CEO, CFO and COOThe following table details performance rights held by our executive KMP under the STAR plan.
Effective date of grant No. Granted Vesting Date % Vested
Fair Value at Grant (i)
$
Market value as at
31 Dec 2018 (ii)
$
Executive KMPPeter Allen 1 Jan 2016 194,099 14 Dec 2018 100% 685,169 N/A (ii)
1 Jan 2017 205,419 16 Dec 2019 – 762,104 801,1341 Jan 2018 201,152 15 Dec 2020 – 742,251 784,493
Total 1,585,627
Mark Bloom 1 Jan 2016 110,370 14 Dec 2018 100% 389,606 N/A (ii)
1 Jan 2017 105,127 16 Dec 2019 – 390,021 409,9951 Jan 2018 108,515 15 Dec 2020 – 400,420 423,209
Total 833,204
Greg Miles 1 Jan 2017 133,925 16 Dec 2019 – 496,862 522,3081 Jan 2018 138,045 15 Dec 2020 – 509,386 538,376
Total 1,060,684
(i) The fair value of the rights granted under the STAR plan is calculated using the Black Scholes option pricing methodology. Fair value is also calculated on the assumption that the executive remains employed with the Group for the full period of vesting.
(iii) The market value as at 31 December 2018 is based on the closing price of Scentre Group securities of $3.90. Market value as at 31 December 2018 is not included for rights that vested on 14 December 2018.

Directors’ Report (continued)
PAGE 24
(b) Participation in the LTAR plan: CEO, CFO and COOThe following table details performance rights held by our executive KMP under the LTAR plan.
Effective date of grant No. Granted
No of rights vested post
measurement of hurdles Vesting Date % Vested
Fair Valueat Grant (i)
$
Market valueas at
31 Dec 2018 (ii)
$
Peter Allen 1 Jul 2014 (iii) 209,627 209,627 14 Dec 2018 100 490,728 N/A (ii)
1 Jan 2015 474,608 510,204 (iv) 14 Dec 2018 107.5 (iv) 1,328,902 (iv) N/A (ii)
1 Jan 2016 380,587 418,646 (v) 14 Dec 2018 110 (v) 1,343,472 (v) N/A (ii)
397,691 437,461 (v) 16 Dec 2019 110 (v) 1,332,265 (v) 1,706,0981 Jan 2017 389,357 N/A 16 Dec 2019 – 1,444,514 1,518,492
406,476 N/A 15 Dec 2020 – 1,434,860 1,585,2561 Jan 2018 418,014 N/A 15 Dec 2020 – 1,542,472 1,630,255
436,733 N/A 15 Dec 2021 – 1,532,933 1,703,259Total 8,143,360
Mark Bloom 1 Jul 2014 (iii) 94,331 94,331 14 Dec 2018 100 220,824 N/A (ii)
1 Jan 2015 149,413 160,619 (iv) 14 Dec 2018 107.5 (iv) 418,356 (iv) N/A (ii)
1 Jan 2016 119,815 131,796 (v) 14 Dec 2018 110 (v) 422,947 (v) N/A (ii)
125,199 137,719 (v) 16 Dec 2019 110 (v) 419,417 (v) 537,1041 Jan 2017 114,122 N/A 16 Dec 2019 – 423,393 445,076
119,139 N/A 15 Dec 2020 – 420,561 464,6421 Jan 2018 148,328 N/A 15 Dec 2020 – 547,330 578,479
154,969 N/A 15 Dec 2021 – 543,941 604,379Total 2,629,680
Greg Miles 1 Jul 2014 (vi) 52,258 (vii) 52,258 (vii) 14 Dec 2018 N/A 184,993 N/A (ii)
1 Jan 2015 (vi) 46,161 (vii) 46,161 (vii) 14 Dec 2018 N/A 163,410 N/A (ii)
50,775 (vii) 50,775 (vii) 16 Dec 2019 N/A 171,112 198,0231 Jan 2016 211,437 232,581 (v) 14 Dec 2018 110 (v) 746,373 (v) N/A (ii)
220,940 243,034 (v) 16 Dec 2019 110 (v) 740,149 (v) 947,8331 Jan 2017 201,391 N/A 16 Dec 2019 – 747,161 785,425
210,246 N/A 15 Dec 2020 – 742,168 819,9591 Jan 2018 242,718 N/A 15 Dec 2020 – 895,629 946,600
253,586 N/A 15 Dec 2021 – 890,087 988,985Total 4,686,825
(i) The fair value of the rights issued under the LTAR plan is calculated using the Black Scholes option pricing methodology. Fair value is also calculated on the assumption that the executive remains employed with the Group for the full period of vesting and that the relevant performance hurdles under the LTAR plan are satisfied. The fair value of rights (issued prior to the establishment of the Group in 2014) at grant date has been maintained since the value of the rights on issue immediately before the commencement of deferred trading of the securities of the Group and Westfield Corporation was the same as immediately after that date.
(ii) The market value as at 31 December 2018 is based on the closing price of Scentre Group securities of $3.90. Market value as at 31 December 2018 is not included for rights that vested on 14 December 2018.
(iii) With an effective commencement date of 1 January 2014.(iv) The 2015 LTAR vested at 107.5% for exceeding the ROCE hurdle.(v) The 2016 LTAR vested at 110% for exceeding both the ROCE hurdle and development return hurdle.(vi) Greg Miles held a number of performance rights issued by the former Westfield Group and Westfield Corporation. To the extent that those outstanding rights
were not satisfied by Westfield Corporation prior to his return to Australia, Scentre Group assumed the liability of the unvested proportion of those performance rights. These rights will be satisfied by the delivery of Scentre Group securities on vesting. The effective grant date of those rights was 1 January 2016. However, the vesting period will be assessed by reference to the original grant date of the rights. Vesting is not subject to any specific performance hurdles.
(vii) Represents the proportion of rights the liability of which was assumed by Scentre Group.

SCENTRE GROUP ANNUAL FINANCIAL REPORT 2018 // PAGE 25
8.7 Remuneration governance framework
Securityholders
BoardResponsible for setting and overseeing the implementation of the remuneration policy
▼ ▼
Human Resources Committee
Assists the Board by overseeing human resources policies and remuneration practices to ensure executives are rewarded fairly and responsibly having regard to the performance of Scentre Group.
The Committee is responsible for oversight of, and where appropriate makes recommendations to the Board on:
– Remuneration policies and practices affecting the Group.
– Remuneration packages for the executive KMP. The Committee also reviews the CEO’s recommendations on the remuneration packages for the senior executive team.
– The Group’s equity linked performance plans.
– Succession planning policies in relation to the senior executive team.
– Policies that promote and support equal opportunity and diversity within the Group.
– Termination entitlements of executive KMP and other members of the senior executive team.
– Fees for non-executive Directors.
The Committee is comprised of 3 independent non-executive Directors: Andrew Harmos (Chairman), Aliza Knox and Margaret Seale.
▼
External Advisers
The Committee is authorised to utilise the services of specialist human resources and remuneration consultants to provide advice regarding:
– Senior executive remuneration levels.
– Market trends and benchmarking.
– Human resources policies.
– Succession planning.
– Learning and organisational development.
Protocols have also been established for the engagement of remuneration consultants and the provision of remuneration recommendations free of undue influence from management.
▼
Management
Makes recommendations to the Committee regarding the Group’s remuneration and human resources policies and framework.
▼
During 2018 the Committee utilised the services of KPMG–3dc to provide services relating to remuneration trends and stakeholder engagement. No remuneration recommendations were made by KPMG–3dc.
(a) Minimum securityholdingOur executive KMP and non-executive Directors are required to maintain a minimum holding of securities.
Executive KMP are required to maintain a minimum holding of securities that is at least a one-time multiple of their fixed remuneration (before tax). New executive KMP have 3 years to meet the requirement from the date of appointment. Each of the executive KMP met the requirement at all times during the year. Performance rights are not included in the calculation of the minimum holding of securities.
To underpin the alignment of Directors and securityholders, non-executive Directors are required to maintain a minimum holding of securities equal to one year’s base board fees. Non-executive Directors have 3 years from the introduction of the policy in 2016 to meet this requirement.
(b) Performance rights plan: Governance(i) STAR plan: key elementsElement Description
What is the purpose of the STAR plan? The purpose of the STAR plan is to reward executives against the achievement of KPIs. Each executive’s KPIs are set annually with the purpose of motivating that executive to achieve performance objectives which will contribute to the short and longer term success of the Group.
Who is eligible to participate in the STAR plan?
The STAR is a broader based plan than the LTAR. Executive KMP, other members of the senior executive team and high performing executives participate in the STAR plan.
What is the maximum STAR opportunity as a percentage of fixed remuneration?
The maximum STAR opportunity for each executive KMP is 150% of fixed remuneration.
Potential maximum STARs will only be awarded in exceptional circumstances where an executive has significantly exceeded their KPIs.
How is the STAR delivered? For senior executives in the STAR, 70% of the STAR is paid in cash with the balance (30%) delivered as performance rights which are eligible to vest at the end of year 3. There are no additional performance hurdles.
What are the STAR performance measures?
KPIs are established each year under a performance review and development system. KPIs are designed to measure both financial and non-financial performance. The objectives vary according to the role of the executive and typically relate to development, construction, retail management, corporate or strategic targets.
Non-financial objectives include measures that underpin the growth and sustainability of our business including customer experience, retailer partnerships, community engagement, risk management, safety, diversity and inclusion and organisational capabilities including innovation.
How is performance against KPIs assessed?
The actual STAR awarded to an executive in respect of a financial year is determined by reference to the performance of the executive against the agreed KPIs, the corporate performance of the Group and any other aspect of the executive’s performance which is considered relevant in the context of the review.
What are the performance weightings? Performance weightings for the executive KMP are as follows:
Financial Non-financial
CEO 65% 35%CFO 70% 30%COO 65% 35%

Directors’ Report (continued)
PAGE 26
(ii) LTAR plan: key elementsElement Description
What is the purpose of the LTAR plan? The LTAR plan is designed to encourage and reward superior performance by members of the senior executive team emphasising the strategic leadership role of that team. Through the LTAR plan, participants are provided with a benefit aligned with the interests of securityholders.
Through a combination of performance hurdles (which are determined annually by the Board) and a 3 – 4 year vesting period, the Group aims to incentivise achievement of targeted objectives and assist in the retention of the executive KMP and other members of the senior executive team for an extended period.
Who is eligible to participate in the LTAR plan?
Only members of the senior executive team participate in the LTAR plan.
What is the LTAR grant opportunity as a percentage of fixed remuneration?
CEO 155%CFO 100%COO 120%
What were the 2018 LTAR performance hurdles?
For 2018, the performance hurdles were:Development return hurdle (25% weighting)The development return hurdle is designed to measure the actual incremental yield that has been generated through the completion of major developments (over $50 million) compared to Board approved feasibilities.
Major developments that commenced in 2018 have Board approved feasibilities including the annual impact of the forecast incremental NOI. The forecast 2020 incremental NOI for these projects will be aggregated and a yield calculated based on the Board approved development cost for the projects.
At the end of 2020, the actual incremental NOI from these projects will be aggregated and a yield calculated based on the actual development cost. These two yields will then be compared and, based on a graduated table, the percentage of LTAR that will vest will be calculated. The hurdle will be achieved at 100% if the forecast yield is met. The hurdle allows for incremental increases and decreases depending on actual achieved yield.
Achievement below forecast yield will result in a reduction of the percentage of vesting. Vesting will be reduced by 10% for each incremental 0.2% lower than target yield until 85% of the target yield. Where the development return is below 85% of target yield, there will be zero vesting. Vesting will increase by 5% for every incremental 0.2% above target yield, with a cap of 125% vesting.
ROCE hurdle (75% weighting)The ROCE hurdle enables the Board to reward the performance of management having regard to the level of returns generated on securityholder equity through a combination of improving earnings and capital management.
The Group’s ROCE is calculated by applying FFO for the relevant financial year as a percentage of the Group’s weighted average contributed equity during the year.
The ROCE hurdle operates on a graduated scale which is approved by the Board prior to awards being granted under the plan. Performance against the ROCE hurdle will be measured by reference to ROCE achieved in year three of the vesting period. Achievement of the ROCE component of the 2018 LTAR will be measured at the end of 2020 and published in the 2020 annual report. The Group does not publish details of the ROCE hurdle prior to the year in which it is tested (year 3) as this would result in the disclosure of commercially sensitive information in connection with the Group’s forecast of growth in FFO and the amount of contributed equity.
The hurdle will be achieved at 100% if the target ROCE is met. Again, the hurdle allows for incremental increases or decreases depending on actual achieved ROCE.
Achievement below target ROCE will result in a reduction of the percentage of vesting. A 0.3% reduction below target ROCE will result in 50% vesting with any greater reduction resulting in zero vesting.
A 0.7% increase in ROCE will result in vesting at the cap of 150%. From 2019, this cap has reduced to 125%.
What was the level of vesting? Both hurdles will be measured at the end of year 3 (2020).What performance/vesting period applies to the LTAR awards?
The awards issued under the LTAR plan are confirmed at the end of the vesting period in 2 tranches with 50% vesting at the end of year 3 and 50% at the end of year 4.
How is performance against the LTAR hurdles assessed?
Vesting in relation to a particular hurdle will occur if the measures in relation to that hurdle are achieved. Actual performance against the hurdles which apply determines the final number of awards the executive will receive at the end of the vesting period. If full qualification for awards is not achieved, there is no provision in the plan for re-testing those hurdles in subsequent years.
Can the LTAR hurdles be adjusted? Yes. The Board reserves the right to adjust performance hurdles under the LTAR plan to reflect the impact of any capital transaction occurring during the performance period (for example: a significant equity issue or the sale or joint venture of a material part of the portfolio).
Will the 2019 LTAR hurdles change from 2018?
For 2019, the LTAR hurdles remain the same as for 2018. However, for 2019 we have reduced the potential maximum opportunity on vesting for the ROCE measure from 150% to 125%.

SCENTRE GROUP ANNUAL FINANCIAL REPORT 2018 // PAGE 27
(iii) STAR and LTAR: Deferred equityThe Group’s Performance Rights Plan governs the grant of deferred equity under the STAR plan and LTAR plans. The common features are outlined below.
Element Description
Are there common rules under the STAR plan and LTAR plan?
Yes. The Group’s Performance Rights Plan governs the grants of awards of deferred equity under the STAR plan and the LTAR plan. Having a common set of rules enables the grant of deferred equity under those plans to be administered on a consistent basis across participating executives.
What are the mechanics of the Performance Rights Plan?
Under the Performance Rights Plan, on maturity, the executive is entitled to receive, at the election of Scentre Group and for no further consideration, either:
– one Scentre Group security for each performance right; or
– a cash payment to the same value.
The relevant common features of both plans are as follows:
– based on principles and remuneration bands approved by the Board, participating executives earn the opportunity to participate in a plan and are informed of a dollar amount in relation to their participation at the beginning of each financial year in which they are offered participation.
– the number of rights to be allocated is determined using the face value of Scentre Group securities, adjusted for the estimated value (based on the Group’s published 1 year forecast) of distributions that may be paid on stapled securities during the vesting period.
– assuming the executive remains employed by the Group through the vesting period and any applicable performance hurdles are satisfied, the executive will receive either Scentre Group securities or a cash pay-out equal to the capital value of the securities represented by the rights. The maximum level of vesting under the LTAR plan is described in “What were the 2018 LTAR performance hurdles?”.
Are distributions paid during the vesting period?
Participants in the Performance Rights Plan only receive distributions on securities following vesting. As noted above, the number of rights to be allocated is determined using the face value of Scentre Group securities, adjusted for the estimated value (based on the Group’s published 1 year forecast) of distributions that may be paid on stapled securities during the vesting period. No adjustments are made in relation to actual distributions paid.
How are securities delivered under the STAR and LTAR?
Where rights are settled with securities, the Group acquires the securities on-market and transfers the securities to executives.
Is the CEO grant of performance rights subject to securityholder approval?
Yes. Approval for the grant of 2019 performance rights to the CEO will be sought at the AGM on 4 April 2019.
Can retention awards be issued without hurdles?
No. All STARs and LTARs issued by the Group are subject to performance hurdles.
What happens if an executive KMP leaves the Group?
These arrangements are described in section 8.8.
What happens if there is a change of control?
Performance rights do not vest automatically as a consequence of a control transaction or a corporate restructuring. In relation to control transactions, the Board retains the discretion to accelerate the vesting date for rights issued under the plans in such circumstances.
Are there any clawback or malus provisions for at risk remuneration?
The plans contain provisions for the lapsing of unvested rights in several circumstances including if an executive engages in any act or omission constituting serious misconduct or where the Group forms the opinion, based on reasonable grounds, that the executive has committed any fraud, dishonesty or defalcation in relation to the Group.
Are there any other forfeiture events? Unvested performance rights will also lapse in the event of a participant:
– resigning or being terminated for cause;
– becoming bankrupt or committing an act of bankruptcy; or
– failing to comply with a “Competition and Confidentiality Condition” (being standard confidentiality, non-compete and non-solicitation conditions).
What is the hedging policy? Participants in the plans are prohibited from entering into hedging arrangements in respect of unvested rights (or rights the subject of a holding lock) in any plan.

Directors’ Report (continued)
PAGE 28
8.8 Executive KMP service agreementsThe service agreements for each executive KMP are, in each case, a continuing arrangement inherited from the Westfield Group and date from September 2009. The terms outlined below apply to each executive KMP.
Service Agreement Term
Contract term No fixed termNotice period by employee and employer
Employee: 3 monthsEmployer: 1 month
Details of any post employment restraints
Where permitted by law, the Group imposes a further requirement that, following retirement, the executive complies with certain continuing non-compete obligations which, if not satisfied, will result in forfeiture of all unvested rights
Set out below is a summary of termination payments and treatment of the STAR and LTAR on an executive KMP leaving the Group’s employment. These provisions apply to each executive KMP. The provisions of the service agreements are subject to the Corporations Act 2001. In certain circumstances, payment of the entitlements summarised below may require the approval of securityholders.
Event Termination payment Treatment of STAR (cash) Treatment of STAR and LTAR (deferred equity)
Resignation and termination for cause
– Accrued statutory entitlements
– Payment of a pro-rata bonus for the relevant year may be considered in exceptional circumstances
– All unvested entitlements under the Group’s performance rights plan are forfeited, without payment, on termination
Redundancy or termination by the Group (other than for cause)
– Accrued statutory entitlements
– Redundancy between 12 and 24 months fixed remuneration depending on the length of service of the executive plus one month’s salary in lieu of notice
– Pro-rata performance bonus to the date of termination
– Where redundancy or termination occurs more than one year prior to the end of the relevant performance period, a pro-rata vesting applies up to the date of termination. Awards of performance rights which have less than one year to the end of the relevant performance period vest in full (excluding any rights which lapsed because of a failure to satisfy a performance hurdle). Rights that have been granted for less than 6 months lapse
Death or permanent disability
– Accrued statutory entitlements
– Pro-rata performance bonus to the date of termination
– Full vesting of outstanding performance rights (excluding any rights which lapsed because of a failure to satisfy a performance hurdle)
Retirement(provided an executive has reached the age of 55 years or the aggregate of the age of the participant and the number of years in service is equal to or greater than 70 and, in each case, the executive has at least 5 years continuous service)
– Accrued statutory entitlements
– The Board retains the discretion to pay up to 12 months fixed remuneration in recognition of past services rendered
– Pro-rata performance bonus to the date of termination
– The executive will continue in the plans until the date of vesting in respect of performance rights granted at least 6 months prior to the date of termination (excluding any rights which lapsed because of a failure to satisfy a performance hurdle)
– In circumstances where continued participation in the plan is not permitted under the terms of the plan, the executive is entitled to a cash payment from the Group equivalent to the amount that would have been received had the executive been permitted to continue in the plan

SCENTRE GROUP ANNUAL FINANCIAL REPORT 2018 // PAGE 29
8.9 Non-executive Director FeesThe remuneration of the non-executive Directors is determined by the Board (within a total limit set by securityholders) acting on recommendations made by the Human Resources Committee. In making recommendations to the Board, the Human Resources Committee considers advice from independent consultants and advisers on trends in non-executive director remuneration.
The aggregate pool available for payment of fees to non-executive Directors is currently $3.5 million, as approved by securityholders at the Annual General Meeting of the Company held on 25 May 2011. At the date of this report, actual aggregate fees are $2,258,250.
Non-executive Director remuneration comprises a base fee (which is inclusive of superannuation guarantee contributions) and where relevant, a Committee fee, with a higher fee for the role of Committee chair. Reimbursement is made for out of pocket expenses. No other bonuses or benefits are paid either during the tenure of a non-executive Director or on retirement. Non-executive Directors do not participate in the Group’s STAR or LTAR plans.
Board fees ChairmanNon-Executive
Director
Board $717,500 $210,125
Committee FeesCommittee
ChairCommittee
member
Audit and Risk Committee $60,000 $40,000Human Resources Committee $60,000 $30,000Nomination Committee $15,000 $10,000
The base Board fee paid to the Chairman is inclusive of Committee fees. The Chairman is also Chair of the Nomination Committee for which he does not receive a Committee Chair fee. The fees paid to the non-executive Directors for 2018 are set out below.
Year Total Fees
Non-executive DirectorBrian Schwartz 2018 717,500
2017 700,000Andrew Harmos 2018 280,125
2017 265,000Michael Ihlein 2018 280,125
2017 275,000Carolyn Kay 2018 250,125
2017 245,000Aliza Knox 2018 240,125
2017 235,000Steven Lowy 2018 210,125
2017 205,000Margaret Seale 2018 280,125
2017 275,000
There is no increase to base board fees for 2019. The fees paid to Committee members (excluding the Chair) of the Human Resources Committee have been increased. The increase of $10,000 is to take effect over a two-year period ($5,000 per year) commencing 1 January 2019 to be commensurate to fees paid to Committee members of the Audit and Risk Committee and reflective of the increasing workload and time commitment required of the Committee. The membership of the Board Committees is described in section 4 of the Directors’ Report.
9. ASIC DISCLOSURESRoundingThe Company is of a kind referred to in ASIC Corporations (Rounding in Financial/Directors’ Reports) Instrument 2016/191. Accordingly, the amounts shown in the Directors’ Report, the Financial Statements and Notes to the Financial Statements have been rounded to the nearest tenth of a million dollars, unless otherwise indicated. Amounts shown as 0.0 represent amounts less than $50,000 that have been rounded down.
Synchronisation of financial yearCarindale Property Trust is a consolidated entity of the Company and has a financial year ending on 30 June. By an order dated 27 June 2005 made by the Australian Securities and Investments Commission, the Directors of the Company have been relieved from compliance with the requirement to ensure that the financial year of Carindale Property Trust coincides with the financial year of the Company.
10. ASX LISTINGASX reserves the right (but without limiting its absolute discretion) to remove Scentre Group Limited, Scentre Group Trust 1, Scentre Group Trust 2 and Scentre Group Trust 3 from the official list of the ASX if any of the shares or units comprising those stapled securities cease to be stapled together, or any equity securities are issued by a Scentre Group entity which are not stapled to the equivalent securities in the other entities.
This report is made in accordance with a resolution of the Board of Directors and is signed for and on behalf of the Directors.
Brian Schwartz AM Michael Ihlein Chairman Director
20 February 2019

PAGE 30
Independent Auditor’s Report TO THE SHAREHOLDERS OF SCENTRE GROUP LIMITED
Report on the Audit of the Financial Report
OpinionWe have audited the financial report of Scentre Group Limited (the Company) and its subsidiaries (collectively the Group), which comprises the consolidated balance sheet as at 31 December 2018, the consolidated income statement, the consolidated statement of comprehensive income, the consolidated statement of changes in equity and the consolidated cash flow statement for the year then ended, notes comprising a summary of significant accounting policies and other explanatory information and the Directors’ Declaration.
In our opinion, the accompanying financial report of the Group is in accordance with the Corporations Act 2001, including:
(i) giving a true and fair view of the Group’s consolidated financial position as at 31 December 2018 and of its consolidated financial performance for the year ended on that date; and
(ii) complying with Australian Accounting Standards and the Corporations Regulations 2001.
Basis for OpinionWe conducted our audit in accordance with Australian Auditing Standards. Our responsibilities under those standards are further described in the Auditor’s Responsibilities for the Audit of the Financial Report section of our report. We are independent of the Group in accordance with the auditor independence requirements of the Corporations Act 2001 and the ethical requirements of the Accounting Professional and Ethical Standards Board’s APES110 Code of Ethics for Professional Accountants (the Code) that are relevant to our audit of the financial report in Australia. We have also fulfilled our other ethical responsibilities in accordance with the Code.
We believe that the audit evidence we have obtained is sufficient and appropriate to provide a basis for our opinion.
Key Audit MattersKey audit matters are those matters that, in our professional judgment, were of most significance in our audit of the financial report of the current year. These matters were addressed in the context of our audit of the financial report as a whole, and in forming our opinion thereon, but we do not provide a separate opinion on these matters. For each matter below, our description of how our audit addressed the matter is provided in that context.
We have fulfilled the responsibilities described in the Auditor’s Responsibilities for the Audit of the Financial Report section of our report, including in relation to these matters. Accordingly, our audit included the performance of procedures designed to respond to our assessment of the risks of material misstatement of the financial report. The results of our audit procedures, including the procedures performed to address the matters below, provide the basis for our audit opinion on the accompanying financial report.
1. Shopping Centre Investment Property Portfolio – Carrying values and revaluations
Why significant How our audit addressed the key audit matter
The Group holds economic interests in shopping centre investment properties which are carried at a fair value of $39.1 billion at 31 December 2018. These include shopping centres recorded directly in the consolidated statement of financial position as investment properties and indirectly through equity accounted investments as disclosed in Note 2 of the financial report. Collectively they represent 96% of total assets.
Fair values were determined by the Group at the end of the reporting period with changes in fair value recognised in the income statement.
We considered this to be a key audit matter as property valuations are based upon a number of assumptions, such as capitalisation rates, market rent, occupancy levels, re-leasing and capital expenditure, which are judgmental in nature. Minor changes in certain assumptions can lead to significant changes in the valuation.
Note 3 of the financial report discloses the sensitivity of these valuations to changes in key assumptions.
Note 3 of the financial report describes the accounting policy for these assets.
Our audit procedures included the following:
– We assessed the effectiveness of the Group’s controls over the leasing process and associated tenancy reports which are used as source data in the property valuations by testing a sample of the relevant controls.
– We assessed key net income, lease expiry and vacancy assumptions adopted in the valuation to the actual net income, lease expiry profile and vacancy levels of the underlying asset in considering the reasonableness of the assumptions adopted in the valuation, including re-leasing and capital expenditure requirement assumptions. Where available we corroborated these assumptions to supporting lease documentation or external market data.
– We involved our real estate valuation specialists to assist with:
– the assessment of capitalisation rates adopted across the portfolio; and
– the review and assessment of the property valuation for a sample of properties based on size, geographical location and other property valuation specific risk factors.
– Where relevant we assessed the reasonableness of comparable transactions utilised by the Group in the valuation process.
– We assessed the qualifications, competence and objectivity of the external valuers used by the Group.
– We evaluated the suitability of the valuation methodology used across the portfolio and tested the valuation reports for mathematical accuracy.
Independent Auditor’s Report TO THE SHAREHOLDERS OF SCENTRE GROUP LIMITED

SCENTRE GROUP ANNUAL FINANCIAL REPORT 2018 // PAGE 31
2. Property Development and Project Management Revenues
Why significant How our audit addressed the key audit matter
The Group recognised $430 million of property development and project management revenue for the year ended 31 December 2018.
As set out in Note 2, property development and project management revenue is recognised on a percentage of completion basis as construction progresses. The percentage of completion is determined based on the proportion of contract costs incurred to date and the estimated costs to complete.
Contractual arrangements may give rise to uncertain positions which are factored into the estimated costs to complete and percentage completion. These arrangements require consideration at each balance sheet date as to management’s view of the most probable outcome and reliability with which an outcome can be quantified.
The determination of the costs to complete impacts the value and timing of revenue and profit recognised over the life of the project, and it is an estimate that requires significant judgment.
Our audit procedures included the following:
– We assessed the effectiveness of the Group’s controls and processes for accumulating property development and project management costs, for estimating costs to complete of development projects and for revenue recognition.
We selected a sample of projects based on size and significance and performed the following:
– Conducted a visit to the project site or reviewed management reporting and held discussions with corporate and development executives to understand the progress of developments, any material scope variations and risks and opportunities against feasibility reports.
– Inspected initial approved project feasibility reports and assessed the assumptions used in forecasting project revenues and cost estimates to contracts and supplier cost estimates.
– Reviewed ongoing project feasibility reports against budget and historical performance to evaluate the reasonableness of changes to feasibility revenue and cost assumptions. Where material changes to revenue and cost assumptions occurred, we agreed changes to contract variations and estimated costs to complete analysis.
– Obtained quantity surveyor reports to benchmark costs to date, percentage completion and costs to complete assumptions.
– Assessed the recoverability of project development spend by comparing project costs to complete against expected billings.
– Confirmed inputs to the revenue calculation are appropriate and recalculated the revenue recognised in accordance with the recognition criteria set out in Australian Accounting Standards.
– Reviewed contract terms in order to understand if there are any specific contractual obligations that would impact revenue recognition under AASB 15 Revenue from Contracts with Customers.
– We also evaluated payments made after the reporting date in order to assess whether costs were accrued in the correct reporting period.
Information other than the Financial Report and Auditor’s ReportThe Directors are responsible for the other information. The other information comprises the information in the Group’s Annual Report for the year ended 31 December 2018, but does not include the financial report and the auditor’s report thereon.
Our opinion on the financial report does not cover the other information and we do not express any form of assurance conclusion thereon, with the exception of the Remuneration Report and our related assurance opinion.
In connection with our audit of the financial report, our responsibility is to read the other information and, in doing so, consider whether the other information is materially inconsistent with the financial report or our knowledge obtained in the audit or otherwise appears to be materially misstated. If, based upon the work we have performed, we conclude that there is a material misstatement of this other information, we are required to report that fact. We have nothing to report in this regard.
Responsibilities of the Directors for the Financial reportThe Directors of the Company are responsible for the preparation of the financial report that gives a true and fair view in accordance with Australian Accounting Standards and the Corporations Act 2001 and for such internal control as the Directors determine is necessary to enable the preparation of the financial report that gives a true and fair view and is free from material misstatement, whether due to fraud or error.
In preparing the financial report, the Directors are responsible for assessing the Group’s ability to continue as a going concern, disclosing, as applicable, matters related to going concern and using the going concern basis of accounting unless the Directors either intend to liquidate the Group or cease operations, or have no realistic alternative but to do so.
PAGE 32
Auditor’s Responsibilities for the Audit of the Financial ReportOur objectives are to obtain reasonable assurance about whether the financial report as a whole is free from material misstatement, whether due to fraud or error, and to issue an auditor’s report that includes our opinion. Reasonable assurance is a high level of assurance, but is not a guarantee that an audit conducted in accordance with Australian Auditing Standards will always detect a material misstatement when it exists. Misstatements can arise from fraud or error and are considered material if, individually or in the aggregate, they could reasonably be expected to influence the economic decisions of users taken on the basis of this financial report.
As part of an audit in accordance with Australian Auditing Standards, we exercise professional judgment and maintain professional scepticism throughout the audit. We also:
– Identify and assess the risks of material misstatement of the financial report, whether due to fraud or error, design and perform audit procedures responsive to those risks, and obtain audit evidence that is sufficient and appropriate to provide a basis for our opinion. The risk of not detecting a material misstatement resulting from fraud is higher than for one resulting from error, as fraud may involve collusion, forgery, intentional omissions, misrepresentations, or the override of internal control.
– Obtain an understanding of internal control relevant to the audit in order to design audit procedures that are appropriate in the circumstances, but not for the purpose of expressing an opinion on the effectiveness of the entity’s internal control.
– Evaluate the appropriateness of accounting policies used and the reasonableness of accounting estimates and related disclosures made by the Directors.
– Conclude on the appropriateness of the Directors’ use of the going concern basis of accounting in the preparation of the financial report. We also conclude, based on the audit evidence obtained, whether a material uncertainty exists related to events and conditions that may cast significant doubt on the entity’s ability to continue as a going concern. If we conclude that a material uncertainty exists, we are required to draw attention in the auditor’s report to the disclosures in the financial report about the material uncertainty or, if such disclosures are inadequate, to modify the opinion on the financial report. However, future events or conditions may cause an entity to cease to continue as a going concern.
– Evaluate the overall presentation, structure and content of the financial report, including the disclosures, and whether the consolidated financial report represents the underlying transactions and events in a manner that achieves fair presentation.
– Obtain sufficient appropriate audit evidence regarding the financial information of the entities or business activities within the Group to express an opinion on the financial report. We are responsible for the direction, supervision and performance of the audit of the Group. We remain solely responsible for our audit opinion.
We communicate with the Directors regarding, among other matters, the planned scope and timing of the audit and significant audit findings, including any significant deficiencies in internal control that we identify during our audit.
We are also required to provide the Directors with a statement that we have complied with relevant ethical requirements regarding independence, and to communicate with them all relationships and other matters that may reasonably be thought to bear on our independence, and where applicable, related safeguards.
From the matters communicated to the Directors, we determine those matters that were of most significance in the audit of the financial report of the current year and are therefore the key audit matters. We describe these matters in our auditor’s report unless law or regulation precludes public disclosure about the matter or when, in extremely rare circumstances, we determine that a matter should not be communicated in our report because the adverse consequences of doing so would reasonably be expected to outweigh the public interest benefits of such communication.
Report on the Remuneration Report
Opinion on the Remuneration ReportWe have audited the Remuneration Report included in pages 12 to 29 of the Directors’ Report for the year ended 31 December 2018.
In our opinion, the Remuneration Report of Scentre Group Limited for the year ended 31 December 2018, complies with section 300A of the Corporations Act 2001.
ResponsibilitiesThe Directors of the Company are responsible for the preparation and presentation of the Remuneration Report in accordance with section 300A of the Corporations Act 2001. Our responsibility is to express an opinion on the Remuneration Report, based on our audit conducted in accordance with Australian Auditing Standards.
Ernst & Young Megan Wilson Partner
Sydney, 20 February 2019Liability limited by a scheme approved under Professional Standards Legislation.
Independent Auditor’s Report (continued)

SCENTRE GROUP ANNUAL FINANCIAL REPORT 2018 // PAGE 33
Note31 Dec 18
$million31 Dec 17
$million
Revenue Property revenue 2,149.2 2,098.3 Property development and construction revenue 429.7 315.3 Property management income 56.2 56.0
2,635.1 2,469.6
Share of after tax profits of equity accounted entitiesProperty revenue 209.2 212.7 Property revaluations 87.2 160.1 Property expenses, outgoings and other costs (49.1) (50.4)Net interest income/(expense) 0.1 (1.5)Tax expense (12.5) (14.7)
5(a) 234.9 306.2
Expenses Property expenses, outgoings and other costs (476.3) (465.8)Property development and construction costs (344.4) (235.2)Property management costs (10.1) (10.6)Overheads (85.9) (88.6)
(916.7) (800.2)
Interest income 3.1 3.2 Currency gain/(loss) 11 (29.7) 6.4 Financing costs 12 (685.1) (754.8)Gain in respect of capital transactions 13 40.1 0.0 Property revaluations 1,060.5 3,056.7 Profit before tax 2,342.2 4,287.1 Tax expense 6(a) (46.3) (55.7)Profit after tax for the period 2,295.9 4,231.4
Profit after tax for the period attributable to:– Members of Scentre Group 2,287.2 4,217.9 – External non controlling interests 8.7 13.5 Profit after tax for the period 2,295.9 4,231.4
cents cents
Basic earnings per stapled security attributable to members of Scentre Group 10(a) 43.10 79.41 Diluted earnings per stapled security attributable to members of Scentre Group 10(a) 42.97 79.18
Income Statement

FOR THE YEAR ENDED 31 DECEMBER 2018
PAGE 34
FOR THE YEAR ENDED 31 DECEMBER 2018
31 Dec 18$million
31 Dec 17$million
Profit after tax for the period 2,295.9 4,231.4
Other comprehensive income
Movement in foreign currency translation reserve (i)
– Realised and unrealised differences on the translation of investment in foreign operations and asset hedging derivatives which qualify for hedge accounting 26.1 (27.6)
– Accumulated exchange differences transferred from foreign currency translation reserve on realisation of net investment in foreign operations (0.7) (0.8)
Total comprehensive income for the period 2,321.3 4,203.0
Total comprehensive income attributable to:– Members of Scentre Group (ii) 2,312.6 4,189.5 – External non controlling interests 8.7 13.5 Total comprehensive income for the period 2,321.3 4,203.0
(i) This may be subsequently transferred to the profit and loss. In relation to the foreign currency translation reserve, the portion relating to the foreign operations held by SGT1, SGT2 and SGT3 may be transferred to the profit and loss depending on how the foreign operations are sold.
(ii) Total comprehensive income attributable to members of Scentre Group comprises $195.0 million (31 December 2017: $126.5 million) attributable to SGL members and $2,117.6 million (31 December 2017: $4,063.0 million) attributable to SGT1, SGT2 and SGT3 members.
Total comprehensive income attributable to members of SGT1, SGT2 and SGT3 consists of profit after tax for the period of $2,093.2 million (31 December 2017: $4,090.4 million), realised and unrealised differences on the translation of investment in foreign operations and asset hedging derivatives which qualify for hedge accounting of $25.1 million (31 December 2017: loss of $26.6 million) and accumulated exchange differences transferred from foreign currency translation reserve on realisation of net investment in foreign operations of $0.7 million (31 December 2017: $0.8 million).
Statement of Comprehensive Income

SCENTRE GROUP ANNUAL FINANCIAL REPORT 2018 // PAGE 35
Note31 Dec 18
$million31 Dec 17
$million
Current assetsCash and cash equivalents 14(a) 206.1 174.0 Trade debtors 36.2 28.0 Derivative assets 17(a) 221.6 35.6 Receivables 242.9 191.2 Other current assets 65.8 60.2 Total current assets 772.6 489.0
Non current assetsInvestment properties 3 36,044.8 33,493.6 Equity accounted investments 5(b) 2,966.2 2,622.2 Derivative assets 17(a) 892.2 604.2 Plant and equipment 44.6 33.3 Deferred tax assets 6(b) 54.8 51.1 Other non current assets 99.8 122.2 Total non current assets 40,102.4 36,926.6 Total assets 40,875.0 37,415.6
Current liabilitiesTrade creditors 327.2 282.2 Payables and other creditors 793.2 788.3 Interest bearing liabilities 15 1,945.5 1,595.1 Tax payable 14.5 30.2 Derivative liabilities 17(b) 12.3 8.9 Total current liabilities 3,092.7 2,704.7
Non current liabilitiesPayables and other creditors 27.6 25.6 Interest bearing liabilities 15 12,697.6 10,728.6 Other financial liabilities 16 696.9 673.7 Deferred tax liabilities 6(c) 107.7 108.3 Derivative liabilities 17(b) 386.7 393.4 Total non current liabilities 13,916.5 11,929.6 Total liabilities 17,009.2 14,634.3 Net assets 23,865.8 22,781.3
Equity attributable to members of Scentre GroupContributed equity 18(b) 10,465.1 10,495.2 Reserves 19 108.7 86.6 Retained profits 20 13,063.9 11,952.1 Total equity attributable to members of Scentre Group 23,637.7 22,533.9
Equity attributable to external non controlling interestsContributed equity 75.9 81.5 Retained profits 152.2 165.9 Total equity attributable to external non controlling interests 228.1 247.4 Total equity 23,865.8 22,781.3
Balance SheetAS AT 31 DECEMBER 2018

FOR THE YEAR ENDED 31 DECEMBER 2018
PAGE 36
FOR THE YEAR ENDED 31 DECEMBER 2018
ContributedEquity
$millionReserves
$million
RetainedProfits
$million
31 Dec 18Total
$million
ContributedEquity
$millionReserves
$million
RetainedProfits
$million
31 Dec 17Total
$million
Changes in equity attributable to members of Scentre GroupBalance at the beginning of the period, as reported 10,495.2 86.6 11,952.1 22,533.9 10,495.2 115.3 8,876.7 19,487.2 – Impact of changes in accounting standards (i) (ii) – – (10.3) (10.3) – – – – Adjusted balance at the beginning of the period 10,495.2 86.6 11,941.8 22,523.6 10,495.2 115.3 8,876.7 19,487.2 – Profit after tax for the period (iii) – – 2,287.2 2,287.2 – – 4,217.9 4,217.9 – Other comprehensive income (iii) (iv) – 25.4 – 25.4 – (28.4) – (28.4)Transactions with owners in their capacity as owners– Buy-back and cancellation of securities
and associated costs (30.1) – – (30.1) – – – – – Movement in employee share plan
benefits reserve – (3.3) – (3.3) – (0.3) – (0.3)– Dividends/distributions paid or provided for – – (1,165.1) (1,165.1) – – (1,142.5) (1,142.5)Closing balance of equity attributable to members of Scentre Group 10,465.1 108.7 13,063.9 23,637.7 10,495.2 86.6 11,952.1 22,533.9
Changes in equity attributable to external non controlling interestsBalance at the beginning of the period 81.5 – 165.9 247.4 88.3 – 178.9 267.2 Profit after tax for the period attributable to external non controlling interests (iii) – – 8.7 8.7 – – 13.5 13.5 Distribution paid or provided for – – (10.8) (10.8) – – (12.6) (12.6)Decrease in external non controlling interest (5.6) – (11.6) (17.2) (6.8) – (13.9) (20.7)Closing balance of equity attributable to external non controlling interests 75.9 – 152.2 228.1 81.5 – 165.9 247.4 Total equity 10,541.0 108.7 13,216.1 23,865.8 10,576.7 86.6 12,118.0 22,781.3
(i) The Group has adopted AASB 15 Revenue from Contracts with Customers on a modified retrospective basis. This resulted in a charge of $2.9 million to retained profits as at 1 January 2018, being the cumulative effect on initial application of the standard (refer to Note 1(c)). The comparative results for the year ended 31 December 2017 are not restated as permitted by the standard.
(ii) The Group has adopted AASB 9 Financial Instruments. This resulted in a charge of $7.4 million to retained profits as at 1 January 2018, being the cumulative effect on initial application of the standard (refer to Note 1(c)). The comparative results for the year ended 31 December 2017 are not restated as permitted by the standard.
(iii) Total comprehensive income for the period amounts to $2,321.3 million (31 December 2017: $4,203.0 million).(iv) Movement in reserves attributable to members of SGT1, SGT2 and SGT3 comprises realised and unrealised differences on the translation of investment in
foreign operations and asset hedging derivatives which qualify for hedge accounting of $25.1 million (31 December 2017: loss of $26.6 million) and accumulated exchange differences transferred from foreign currency translation reserve on realisation of net investment in foreign operations of $0.7 million (31 December 2017: $0.8 million).
Statement of Changes in Equity

SCENTRE GROUP ANNUAL FINANCIAL REPORT 2018 // PAGE 37
Note31 Dec 18
$million31 Dec 17
$million
Cash flows from operating activitiesReceipts in the course of operations (including Goods and Services Tax (GST)) 2,940.8 2,792.8 Payments in the course of operations (including GST) (930.9) (900.9)Dividends/distributions received from equity accounted entities 102.3 102.4 Net operating cash flows retained by equity accounted entities 23.4 23.9 Income and withholding taxes paid (66.6) (44.6)GST paid (244.9) (215.8)Payments of financing costs (excluding interest capitalised) (504.5) (512.0)Interest received 3.1 3.2 Net cash flows from operating activities – proportionate (i) 1,322.7 1,249.0 Less: net operating cash flows retained by equity accounted entities (23.4) (23.9)Net cash flows from operating activities 14(b) 1,299.3 1,225.1
Cash flows from investing activitiesCapital expenditure on property investments (749.0) (664.1)Acquisition of property investments (774.0) – Proceeds from the disposition of assets 90.6 369.9 Payments relating to the disposition of assets (29.5) – Acquisition of listed securities (15.8) (20.0)Net outflows for investments in equity accounted entities (167.3) (31.8)Purchase of plant and equipment (27.1) (20.6)Financing costs capitalised to qualifying development projects and construction in progress (43.0) (24.4)Settlement of currency derivatives hedging the repatriation of foreign sales proceeds – (15.1)Net cash flows used in investing activities (1,715.1) (406.1)
Cash flows from financing activitiesBuy-back of securities and associated costs (30.1) – Net proceeds from interest bearing liabilities 15(c) 1,652.7 769.9 Repayment of other financial liabilities 28 – (416.6)Dividends/distributions paid (1,165.1) (1,142.5)Distributions paid by controlled entities to external non controlling interests (11.8) (13.1)Net cash flows from/(used in) financing activities 445.7 (802.3)
Net increase in cash and cash equivalents held 29.9 16.7 Add opening cash and cash equivalents brought forward 174.0 159.0 Effects of exchange rate changes on opening cash and cash equivalents brought forward 2.2 (1.7)Cash and cash equivalents at the end of the period (ii) 14(a) 206.1 174.0
(i) Proportionate cash flows from operating activities includes total operating cash flows from consolidated and equity accounted entities.(ii) Cash and cash equivalents comprises cash of $206.1 million (31 December 2017: $174.0 million) net of bank overdraft of nil (31 December 2017: nil).
Cash Flow Statement

FOR THE YEAR ENDED 31 DECEMBER 2018
PAGE 38
Note Description Page
1 Basis of preparation of the Financial Report 39
Operational results, assets and liabilities2 Segment reporting 403 Investment properties 434 Details of shopping centre investments 444(a) – Australia 454(b) – New Zealand 465 Details of equity accounted investments 466 Taxation 477 Significant items 488 Dividends/distributions 489 Net tangible asset backing 4910 Earnings per security 49
Financing and capital management11 Currency gain/(loss) 5012 Financing costs 5013 Gain in respect of capital transactions 5114 Cash and cash equivalents 5115 Interest bearing liabilities 5216 Other financial liabilities 5417 Derivative assets and liabilities 5418 Contributed equity 5519 Reserves 5620 Retained profits 5621 Capital risk management 5722 Financial risk management 5723 Interest rate risk management 5724 Exchange rate risk management 6125 Credit risk management 6326 Liquidity risk management 6327 Financial covenants 6328 Fair value of financial assets and liabilities 64
Other disclosures29 Other significant accounting policies 6530 Share based payments 6631 Lease commitments 6832 Capital expenditure commitments 6833 Contingent liabilities 6834 Parent company 6935 Subsidiaries 6936 Auditor’s remuneration 7037 Superannuation commitments 7038 Related party disclosures 7039 Details and remuneration of Key Management Personnel 7140 Details of material and significant entities 72
Index of Notes to the Financial StatementsFOR THE YEAR ENDED 31 DECEMBER 2018

SCENTRE GROUP ANNUAL FINANCIAL REPORT 2018 // PAGE 39
NOTE 1 BASIS OF PREPARATION OF THE FINANCIAL REPORT(a) Corporate informationThis financial report of Scentre Group (Group), comprising Scentre Group Limited (Parent Company) and its controlled entities, for the year ended 31 December 2018 was approved in accordance with a resolution of the Board of Directors of the Parent Company.
The nature of the operations and principal activities of the Group are described in the Directors’ Report.
(b) Accounting for the GroupScentre Group was established on 30 June 2014 by the stapling of securities of each of the Parent Company, Scentre Group Trust 1 (SGT1), Scentre Group Trust 2 (SGT2) and Scentre Group Trust 3 (SGT3). The securities trade as one security on the Australian Securities Exchange (ASX) under the code SCG. The stapling transaction is referred to as the “Merger”.
As a result of the securities being stapled and therefore cannot be traded separately, this financial report has been prepared based on a business combination of the Parent Company, SGT1, SGT2 and SGT3. The Parent Company for accounting purposes has control of SGT1, SGT2 and SGT3 and accordingly consolidates SGT1, SGT2 and SGT3 and their respective controlled entities.
(c) Statement of ComplianceThis financial report complies with Australian Accounting Standards and International Financial Reporting Standards issued by the International Accounting Standards Board. The accounting policies adopted are consistent with those of the previous financial year except that the Group has adopted the following new or amended standards which became applicable on 1 January 2018:
– AASB 15 Revenue from Contracts with Customers
Impact of adoption
The Group’s property development and construction revenue comprises Construction, Design and Development fees earned from Design and Construction Agreements (D&C Agreements) with third parties. In previous reporting periods, the Group recognised revenue on a percentage of completion basis for each service provided. Percentage of completion was determined based on the proportion of contract costs incurred to date and the estimated costs to complete for each service. Accordingly, the various services provided under the D&C Agreements were treated as distinct performance obligations and revenues were recognised based on their separately determined percentage of completion.
Under AASB 15, the Group continues to recognise revenue on a percentage of completion basis determined on the proportion of contract costs incurred to date and the estimated costs to complete. However, the Group will account for all services provided under the D&C Agreements as a single performance obligation, the services being part of a series of distinct goods and services that are substantially integrated with the same pattern of transfer. Accordingly, property development and construction revenue will be recognised based on the percentage of completion for that single performance obligation.
In previous reporting periods, the Group also recognised property management revenue from Management Agreements with third parties as services were provided. This is similar to revenue recognition requirements under AASB 15.
The Group has adopted AASB 15 from 1 January 2018 on a modified retrospective basis. Comparative results are not restated as permitted by the standard. The cumulative effect on initial application was a charge of $2.9 million to opening retained profits, an increase in contract liability (included in payables and other creditors on the balance sheet) of $4.1 million and an increase in deferred tax assets of $1.2 million at 1 January 2018. In addition, the impact of adopting this standard has resulted in an increase in net property development and construction income of $1.8 million (including an increase in property development and construction revenue of $16.7 million) offset by tax expense of $0.6 million, for the year ended 31 December 2018.
– AASB 9 Financial Instruments
Impact of adoption
This standard includes new requirements for classification and measurement, impairment and hedge accounting of financial instruments compared with the requirements of AASB 139 Financial Instruments: Recognition and Measurement.
The Group has adopted AASB 9 and related amendments from 1 January 2018. Comparative results are not restated as permitted by the standard. The cumulative effect on initial application of AASB 9 is a charge to opening retained profits and a decrease in trade and other receivables of $7.4 million as at 1 January 2018. This difference arises from the increase in provision for trade and other receivables.
(i) Classification and measurement
Financial assets previously held at fair value continue to be measured at fair value. Trade and other receivables are held to collect contractual cash flows and these contractual cash flows are solely payments of principal and interest. These receivables continue to be measured at amortised cost. The impact of the classification of financial instruments under AASB 9 was immaterial.
The Group has floating rate borrowing facilities that have been refinanced during previous financial periods. Under AASB 9, the accounting for the modification of a financial liability that has not resulted in derecognition, requires an adjustment to the amortised cost of the liability, with any gain or loss being recognised immediately in the income statement. Under the previous standard AASB 139, the gain or loss would have been recognised over the remaining life of the borrowing by adjusting the effective interest rate. The Group has assessed that the cumulative gain on initial application is immaterial.
(ii) Impairment
Under AASB 9, the Group’s accounting for impairment losses for financial assets is fundamentally changed, by replacing AASB 139’s incurred loss approach with a forward-looking expected credit loss (ECL) approach. The Group has applied the simplified approach and recorded lifetime expected losses on trade and other receivables. The revised methodology for calculation of impairment of trade and other receivables resulted in an additional loss allowance of $7.4 million as at 1 January 2018.
(iii) Hedge accounting
As the Group did not have any hedge relationships that are designated as effective hedges in place as at 31 December 2017, there is no impact from the application of hedging requirements on the financial statements.
The Group has also adopted the following amendments to and clarification of interpretations of, accounting standards:
– AASB 2016-5 Amendments to Australian Accounting Standards – Classification and Measurement of Share-based Payment Transactions
– AASB 2017-1 Amendments to Australian Accounting Standards – Transfers of Investment Property, Annual Improvements 2014-2016 Cycle and Other Amendments
– AASB Interpretation 22 Foreign Currency Transactions and Advance Consideration
For the financial period, the adoption of these amended standards had no impact on the financial statements of the Group.
Certain Australian Accounting Standards and Interpretations have recently been issued or amended but are not yet effective and have not been adopted by the Group for the year ended 31 December 2018. The impact of these new standards or amendments to the standards (to the extent relevant to the Group) and interpretations is as follows:
– AASB 16 Leases (effective from 1 January 2019)
This standard contains requirements about lease classification and recognition, measurement and presentation and disclosures of leases for lessees and lessors. This standard is not expected to have a significant financial impact on the financial statements on application.
Notes to the Financial Statements

Notes to the Financial StatementsFOR THE YEAR ENDED 31 DECEMBER 2018
PAGE 40
NOTE 1 BASIS OF PREPARATION OF THE FINANCIAL REPORT (CONTINUED) (c) Statement of Compliance (continued) – AASB 2017-7 Amendments to Australian Accounting Standards
– Long-term Interests in Associates and Joint Ventures (effective 1 January 2019)
This amends AASB 128 Investments in Associates and Joint Ventures to clarify that an entity is required to account for long-term interests in an associate or joint venture (which in substance form part of the net investment in the associate or joint venture but to which the equity method is not applied), using AASB 9 Financial Instruments before applying the loss allocation and impairment requirements in AASB 128. This amendment is not expected to have a significant impact on the financial statements on application.
– AASB 2018-1 Amendments to Australian Accounting Standards – Annual Improvements 2015-2017 Cycle (effective 1 January 2019)
The amendments clarify certain requirements in:
(i) AASB 3 Business Combinations and AASB 11 Joint Arrangements – previously held interest in a joint operation;
(ii) AASB 112 Income Taxes – income tax consequences of payments on financial instruments classified as equity; and
(iii) AASB 123 Borrowing Costs – borrowing costs eligible for capitalisation.
These amendments are not expected to have a significant impact on the financial statements on application.
– AASB Interpretation 23 Uncertainty over Income Tax Treatments, and relevant amending standards (effective 1 January 2019)
The Interpretation clarifies the application of the recognition and measurement criteria in AASB 112 Income Taxes when there is uncertainty over income tax treatments. This standard is not expected to have a significant impact on the financial statements on application.
– AASB 2014-10 Amendments to Australian Accounting Standards – Sale or Contribution of Assets between an Investor and its Associate or Joint Venture (effective from 1 January 2022)
This amends AASB 10 – Consolidated Financial Statements and AASB 128 – Investments in Associates and Joint Ventures to address an inconsistency between the requirements of AASB 10 and AASB 128 in dealing with the sale or contribution of assets between an investor and its associate or joint venture. This amendment is not expected to have a significant impact on the financial statements on application.
(d) Basis of AccountingThis financial report is a general purpose financial report, which has been prepared in accordance with the requirements of the Corporations Act 2001 (Corporations Act), Australian Accounting Standards and other authoritative pronouncements of the Australian Accounting Standards Board. This financial report has also been prepared on a historical cost basis, except for investment properties, investment properties within equity accounted investments, derivative financial instruments, financial assets at fair value through profit and loss and other financial liabilities. The carrying values of recognised assets and liabilities that are hedged with fair value hedges and are otherwise carried at cost, are adjusted to record changes in the fair values attributable to the risks that are being hedged.
This financial report is presented in Australian dollars.
(e) Significant accounting judgements, estimates and assumptionsThe preparation of this financial report requires management to make judgements, estimates and assumptions. Management continually evaluates its judgements and estimates in relation to assets, liabilities, contingent liabilities, revenue and expenses. Management bases its judgements and estimates on historical experience and other various factors it believes to be reasonable under the circumstances, the results of which form the basis of the carrying values of assets and liabilities that are not readily apparent from other sources.
Further details of the nature of these assumptions and conditions may be found in the relevant notes to the financial statements, in particular, Note 2: Segment reporting, Note 3: Investment properties, Note 4: Details of shopping centre investments, Note 28: Fair value of financial assets and liabilities and Note 29: Other significant accounting policies. Actual results may differ from these estimates under different assumptions and conditions and may materially affect the Group’s financial results or its financial position in future periods.
(f) Comparative informationWhere applicable, certain comparative figures are restated in order to comply with the current period’s presentation of the financial statements.
(g) RoundingIn accordance with ASIC Corporations (Rounding in Financial/Directors’ Reports) Instrument 2016/191, the amounts shown in this financial report have been rounded to the nearest tenth of a million dollars, unless otherwise indicated. Amounts shown as 0.0 represent amounts less than $50,000 that have been rounded down.
NOTE 2 SEGMENT REPORTINGThe Group’s operational segments comprise the property investment and property management and construction segments.
(a) Property investmentsProperty investments segment includes net property income from shopping centres. A geographic analysis of net property investment income is also provided.
(b) Property management and constructionProperty management and construction segment includes external fee income from third parties, primarily property management and development fees, and associated business expenses.
Transactions such as the change in fair value of financial instruments, impact of currency hedging, interest income, financing costs, property revaluations, taxation, gain/(loss) and financing costs in respect of capital transactions and overheads are not allocated to the above segments but are included in order to facilitate a reconciliation to the Group’s net profit attributable to its members.
The Group’s operating segment income and expenses as well as the details of segment assets have been prepared on a proportionate format. The proportionate format presents the net income from and net assets in equity accounted properties on a gross format whereby the underlying components of net income and net assets are disclosed separately as revenues and expenses, assets and liabilities. The Group’s liabilities are managed on a consolidated basis rather than by operational segments.
The proportionate format is used by management in assessing and understanding the performance and results of operations of the Group as it allows management to observe and analyse revenue and expense results and trends on a portfolio-wide basis. The assets underlying both the consolidated and the equity accounted components of the statutory income statement are similar (that is, Australian and New Zealand shopping centres), all centres are under common management and therefore the drivers of their results are similar. Accordingly, management considers that the proportionate format provides a more useful way to understand the performance of the portfolio as a whole than the statutory format.
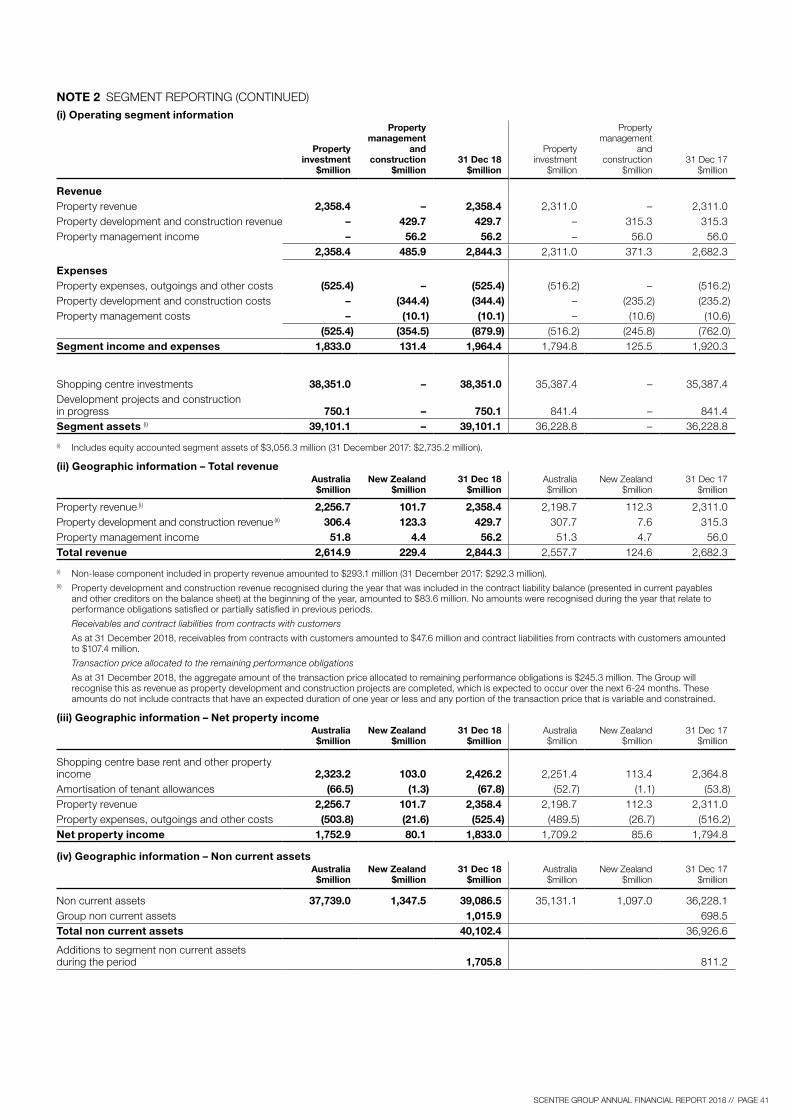
SCENTRE GROUP ANNUAL FINANCIAL REPORT 2018 // PAGE 41
NOTE 2 SEGMENT REPORTING (CONTINUED)(i) Operating segment information
Property investment
$million
Property management
and construction
$million31 Dec 18
$million
Property investment
$million
Property management
and construction
$million31 Dec 17
$million
Revenue Property revenue 2,358.4 – 2,358.4 2,311.0 – 2,311.0 Property development and construction revenue – 429.7 429.7 – 315.3 315.3 Property management income – 56.2 56.2 – 56.0 56.0
2,358.4 485.9 2,844.3 2,311.0 371.3 2,682.3
ExpensesProperty expenses, outgoings and other costs (525.4) – (525.4) (516.2) – (516.2)Property development and construction costs – (344.4) (344.4) – (235.2) (235.2)Property management costs – (10.1) (10.1) – (10.6) (10.6)
(525.4) (354.5) (879.9) (516.2) (245.8) (762.0)Segment income and expenses 1,833.0 131.4 1,964.4 1,794.8 125.5 1,920.3
Shopping centre investments 38,351.0 – 38,351.0 35,387.4 – 35,387.4 Development projects and construction in progress 750.1 – 750.1 841.4 – 841.4 Segment assets (i) 39,101.1 – 39,101.1 36,228.8 – 36,228.8
(i) Includes equity accounted segment assets of $3,056.3 million (31 December 2017: $2,735.2 million).
(ii) Geographic information – Total revenueAustralia$million
New Zealand$million
31 Dec 18$million
Australia$million
New Zealand$million
31 Dec 17$million
Property revenue (i) 2,256.7 101.7 2,358.4 2,198.7 112.3 2,311.0 Property development and construction revenue (ii) 306.4 123.3 429.7 307.7 7.6 315.3 Property management income 51.8 4.4 56.2 51.3 4.7 56.0 Total revenue 2,614.9 229.4 2,844.3 2,557.7 124.6 2,682.3
(i) Non-lease component included in property revenue amounted to $293.1 million (31 December 2017: $292.3 million).(ii) Property development and construction revenue recognised during the year that was included in the contract liability balance (presented in current payables
and other creditors on the balance sheet) at the beginning of the year, amounted to $83.6 million. No amounts were recognised during the year that relate to performance obligations satisfied or partially satisfied in previous periods.
Receivables and contract liabilities from contracts with customers
As at 31 December 2018, receivables from contracts with customers amounted to $47.6 million and contract liabilities from contracts with customers amounted to $107.4 million.
Transaction price allocated to the remaining performance obligations
As at 31 December 2018, the aggregate amount of the transaction price allocated to remaining performance obligations is $245.3 million. The Group will recognise this as revenue as property development and construction projects are completed, which is expected to occur over the next 6-24 months. These amounts do not include contracts that have an expected duration of one year or less and any portion of the transaction price that is variable and constrained.
(iii) Geographic information – Net property incomeAustralia$million
New Zealand$million
31 Dec 18$million
Australia$million
New Zealand$million
31 Dec 17$million
Shopping centre base rent and other property income 2,323.2 103.0 2,426.2 2,251.4 113.4 2,364.8 Amortisation of tenant allowances (66.5) (1.3) (67.8) (52.7) (1.1) (53.8)Property revenue 2,256.7 101.7 2,358.4 2,198.7 112.3 2,311.0 Property expenses, outgoings and other costs (503.8) (21.6) (525.4) (489.5) (26.7) (516.2)Net property income 1,752.9 80.1 1,833.0 1,709.2 85.6 1,794.8
(iv) Geographic information – Non current assetsAustralia$million
New Zealand$million
31 Dec 18$million
Australia$million
New Zealand$million
31 Dec 17$million
Non current assets 37,739.0 1,347.5 39,086.5 35,131.1 1,097.0 36,228.1 Group non current assets 1,015.9 698.5 Total non current assets 40,102.4 36,926.6
Additions to segment non current assets during the period 1,705.8 811.2

Notes to the Financial StatementsFOR THE YEAR ENDED 31 DECEMBER 2018
PAGE 42
NOTE 2 SEGMENT REPORTING (CONTINUED)(v) Reconciliation of segment informationThe Group’s operating segment income and expenses as well as the details of segment assets have been prepared on a proportionate format. The composition of the Group’s consolidated and equity accounted details are provided below:
Consolidated$million
Equity Accounted
$million31 Dec 18
$millionConsolidated
$million
Equity Accounted
$million31 Dec 17
$million
Revenue Property revenue 2,149.2 209.2 2,358.4 2,098.3 212.7 2,311.0 Property development and construction revenue 429.7 – 429.7 315.3 – 315.3 Property management income 56.2 – 56.2 56.0 – 56.0
2,635.1 209.2 2,844.3 2,469.6 212.7 2,682.3
ExpensesProperty expenses, outgoings and other costs (476.3) (49.1) (525.4) (465.8) (50.4) (516.2)Property development and construction costs (344.4) – (344.4) (235.2) – (235.2)Property management costs (10.1) – (10.1) (10.6) – (10.6)
(830.8) (49.1) (879.9) (711.6) (50.4) (762.0)Segment income and expenses 1,804.3 160.1 1,964.4 1,758.0 162.3 1,920.3 Overheads (85.9) (88.6)Interest income 3.3 3.5 Currency gain/(loss) (29.7) 6.4 Financing costs (685.2) (756.6)Gain in respect of capital transactions 40.1 0.0 Property revaluations 1,147.7 3,216.8 Tax expense – current (60.6) (65.6)Tax benefit/(expense) – deferred 1.8 (4.8)External non controlling interests (8.7) (13.5)Net profit attributable to members of the Group (i) 2,287.2 4,217.9
(i) Net profit attributable to members of the Group was $2,287.2 million (31 December 2017: $4,217.9 million). Net profit after tax for the year which includes profit attributable to external non controlling interests of $8.7 million (31 December 2017: $13.5 million) was $2,295.9 million (31 December 2017: $4,231.4 million).
Consolidated$million
Equity Accounted
$million31 Dec 18
$millionConsolidated
$million
Equity Accounted
$million31 Dec 17
$million
Shopping centre investments 35,522.6 2,828.4 38,351.0 32,761.5 2,625.9 35,387.4 Development projects and construction in progress 522.2 227.9 750.1 732.1 109.3 841.4 Segment assets 36,044.8 3,056.3 39,101.1 33,493.6 2,735.2 36,228.8 Cash and cash equivalents 206.1 7.8 213.9 174.0 2.6 176.6 Deferred tax assets 54.8 – 54.8 51.1 – 51.1 Receivables on currency derivatives 920.2 – 920.2 394.4 – 394.4 Other assets 682.9 9.4 692.3 680.3 4.8 685.1 Total assets 37,908.8 3,073.5 40,982.3 34,793.4 2,742.6 37,536.0
Interest bearing liabilities– Current 1,945.0 – 1,945.0 1,594.5 – 1,594.5 – Non current 12,657.7 – 12,657.7 10,687.9 – 10,687.9 Finance lease liabilities 40.4 0.4 40.8 41.3 19.2 60.5 Other financial liabilities 696.9 – 696.9 673.7 – 673.7 Deferred tax liabilities 107.7 69.3 177.0 108.3 63.1 171.4 Payables on currency derivatives 55.7 – 55.7 140.8 – 140.8 Other liabilities 1,505.8 37.6 1,543.4 1,387.8 38.1 1,425.9 Total liabilities 17,009.2 107.3 17,116.5 14,634.3 120.4 14,754.7 Net assets 20,899.6 2,966.2 23,865.8 20,159.1 2,622.2 22,781.3

SCENTRE GROUP ANNUAL FINANCIAL REPORT 2018 // PAGE 43
NOTE 2 SEGMENT REPORTING (CONTINUED)
Accounting PoliciesRevenue recognitionRevenue is recognised to the extent that it is probable that the economic benefits will flow to the Group and can be reliably measured.
LeasesRental income from investment properties is accounted for on a straight line basis over the lease term. Contingent rental income is recognised as income in the period in which it is earned. If not received at balance date, revenue is reflected on the balance sheet as a receivable and carried at its recoverable amount.
Certain tenant allowances that are classified as lease incentives are recorded as part of investment properties and amortised over the term of the lease. The amortisation is recorded against property revenue.
Revenue from contracts with customersProperty development and construction revenue comprises Construction, Design and Development fees earned from Design and Construction Agreements (D&C Agreements) with third parties. The Group accounts for all services provided under the D&C Agreements as a single performance obligation, the services being part of a series of distinct goods and services that are substantially integrated with the same pattern of transfer, and revenue is recognised based on the percentage of completion for that single performance obligation. Percentage of completion is determined based on the proportion of contract costs incurred to date and the estimated contract costs to complete. Accordingly, significant judgments and estimates are made in determining (i) variable consideration which may be included in the transaction price; (ii) costs incurred to date that reflects the Group’s progress in satisfying its performance obligations under the contract; and (iii) the total contract costs.
Differences between amounts recognised as revenue and amounts billed to customers are recognised as contract assets or liabilities on the balance sheet. Progress billings to customers include charges for work completed, materials and/or goods delivered (which may include uninstalled materials and/or goods) or expenditure incurred. Amounts billed to customers are usually due within 10 days.
Property management revenue from third parties is recognised as services are provided.
Recoveries of outgoings from lessees are recognised as services are provided.
Revenue from the sale of properties is recognised when the buyer obtains control of the asset. Control is transferred when the buyer has the ability to direct the use of and substantially obtain the economic benefits from the asset.
All other revenues are recognised as services are provided.
ExpensesCosts to obtain or fulfil a contract with customersThe Group recognises as an asset the incremental costs of obtaining a contract with a customer and all costs of fulfilling a contract, if the Group expects to recover those costs. Capitalised costs are amortised, with the expense recognised on a systemic basis that depicts the transfer of goods and services to customers. An impairment loss is recognised if the carrying amount of the asset exceeds the remaining amount of consideration the Group expects to receive less costs that have not yet been recognised as expenses.
All other expenses are brought to account on an accruals basis.
31 Dec 18$million
31 Dec 17$million
NOTE 3 INVESTMENT PROPERTIES
Shopping centre investments 35,522.6 32,761.5 Development projects and construction in progress 522.2 732.1 Total investment properties 36,044.8 33,493.6
Movement in total investment propertiesBalance at the beginning of the year 33,493.6 29,872.3 Acquisition of properties 774.0 – Disposal of properties (5.8) (146.6)Redevelopment costs 722.5 713.0 Net revaluation increment 1,060.5 3,056.7 Retranslation of foreign operations – (1.8)Balance at the end of the year (i) 36,044.8 33,493.6
(i) The fair value of investment properties at the end of the year of $36,044.8 million (31 December 2017: $33,493.6 million) comprises investment properties at market value of $36,004.4 million (31 December 2017: $33,452.3 million) and ground leases included as finance leases of $40.4 million (31 December 2017: $41.3 million).

Notes to the Financial StatementsFOR THE YEAR ENDED 31 DECEMBER 2018
PAGE 44
NOTE 3 INVESTMENT PROPERTIES (CONTINUED)
Accounting PoliciesInvestment propertiesThe Group’s investment properties include shopping centre investments, development projects and construction in progress.
(i) Shopping centre investmentsThe Group’s shopping centre investment properties represent completed centres comprising freehold and leasehold land, buildings and leasehold improvements.
Land and buildings are considered as having the function of an investment and therefore are regarded as a composite asset, the overall value of which is influenced by many factors, the most prominent being income yield, rather than by the diminution in value of the building content due to effluxion of time. Accordingly, the buildings and all components thereof, including integral plant and equipment, are not depreciated.
Initially, shopping centre investment properties are measured at cost including transaction costs. Subsequent to initial recognition, the Group’s portfolio of shopping centre investment properties are stated at fair value. Gains and losses arising from changes in the fair values of shopping centre investment properties are included in the income statement in the year in which they arise. Any gains or losses on the sale of an investment property are recognised in the income statement in the year of sale.
At each reporting date, the carrying value of the portfolio of shopping centre investment properties is assessed by the Directors and where the carrying value differs materially from the Directors’ assessment of fair value, an adjustment to the carrying value is recorded as appropriate.
The Directors’ assessment of fair value of each shopping centre takes into account the latest independent valuations generally prepared annually, with updates taking into account any changes in capitalisation rate, underlying income and valuations of comparable centres. In determining the fair value, the capitalisation of net income method and the discounting of future cash flows to their present value have been used, which are based upon assumptions and judgements in relation to future rental income, capitalisation rate and make reference to market evidence of transaction prices for similar properties.
(ii) Development projects and construction in progressThe Group’s development projects and construction in progress include costs incurred for the current and future redevelopment and expansion of new and existing shopping centre investments, and are classified as inventories when intended for sale to third parties. Development projects and construction in progress include capitalised construction and development costs, payments and advances to contractors and where applicable, borrowing costs incurred on qualifying developments.
The Directors’ assessment of fair value of each development project and construction in progress that meets the definition of an investment property, takes into account the expected costs to complete, the stage of completion, expected underlying income and yield of the developments. From time to time, during a development, the Directors may commission an independent valuation of the development project. On completion, the development projects are reclassified to shopping centre investments and an independent valuation is obtained.
Independent valuations are conducted in accordance with guidelines set by the International Valuation Standards Committee for Australian and New Zealand properties.
It is the Group’s policy to appoint a number of qualified independent valuers and that no individual valuer is appointed to appraise an individual property for greater than three consecutive years. The following qualified independent valuers were appointed by the Group to carry out property appraisals for the current financial year:
Australian shopping centres New Zealand shopping centres
– CBRE Valuations Pty Limited – CBRE Limited
– CIVAS (NSW) Pty Limited (Colliers International) – Colliers International New Zealand Limited
– Cushman & Wakefield Pty Ltd – Jones Lang La Salle Limited
– Jones Lang LaSalle Advisory Services Pty Ltd
– Knight Frank Australia Pty Ltd
– Urbis Valuations Pty Ltd
The determination of a property valuation is judgemental. The key assumptions in the valuation are the estimated capitalisation rate and net operating income. Movements in capitalisation rate for each property would result in changes to the fair value. For example, an increase in capitalisation rate would result in a decrease in the fair value of the properties while a decrease in capitalisation rate would result in an increase in the fair value of the properties.
Refer to Notes 4(a) and 4(b) for a summary of the capitalisation rate for the property portfolio.
Note31 Dec 18
$million31 Dec 17
$million
NOTE 4 DETAILS OF SHOPPING CENTRE INVESTMENTS
Consolidated Australian shopping centres (a) 35,522.6 32,761.5 Total consolidated shopping centres 35,522.6 32,761.5
Equity accounted Australian shopping centres (a) 1,617.5 1,522.8 Equity accounted New Zealand shopping centres (b) 1,210.9 1,103.1 Total equity accounted shopping centres 2,828.4 2,625.9
38,351.0 35,387.4

SCENTRE GROUP ANNUAL FINANCIAL REPORT 2018 // PAGE 45
NOTE 4 DETAILS OF SHOPPING CENTRE INVESTMENTS (CONTINUED)(a) Shopping centre investments – Australia
Australian shopping centres
OwnershipInterest
31 Dec 18%
OwnershipInterest
31 Dec 17%
Carrying Amount
31 Dec 18$million
RetailCapitalisation
Rates31 Dec 18
%
Carrying Amount
31 Dec 17$million
RetailCapitalisation
Rates31 Dec 17
%
AUSTRALIAN CAPITAL TERRITORYBelconnen 100.0 C 100.0 C 935.0 5.50% 935.0 5.50%Woden 50.0 C 50.0 C 353.0 5.50% 350.0 5.50%
NEW SOUTH WALESBondi Junction 100.0 C 100.0 C 3,293.4 4.13% 3,143.6 4.25%Burwood 100.0 C 100.0 C 1,105.2 5.00% 1,095.2 5.00%Chatswood 100.0 C 100.0 C 1,397.1 4.50% 1,367.1 4.50%Eastgardens (i) 50.0 C – – 720.0 4.25% – –Hornsby 100.0 C 100.0 C 1,095.2 5.25% 1,095.2 5.25%Hurstville 50.0 C 50.0 C 440.0 5.25% 437.5 5.25%Kotara (ii) 100.0 C 100.0 C 1,095.0 5.00% 815.0 5.75%Liverpool 50.0 C 50.0 C 560.1 5.25% 550.1 5.25%Miranda 50.0 C 50.0 C 1,310.5 4.38% 1,270.5 4.50%Mt Druitt 50.0 E 50.0 E 332.5 5.50% 315.0 5.50%Parramatta 50.0 C 50.0 C 1,103.8 4.50% 1,034.3 4.75%Penrith 50.0 C 50.0 C 756.5 4.75% 750.0 4.75%Sydney (iii) 100.0 C 100.0 C 5,360.8 4.11% 5,027.4 4.12%Tuggerah 100.0 C 100.0 C 805.0 5.38% 785.0 5.50%Warringah Mall 50.0 C 50.0 C 937.5 5.00% 930.0 5.00%
QUEENSLANDCarindale (iv) 50.0 C 50.0 C 814.3 5.00% 813.6 5.25%Chermside 100.0 C 100.0 C 2,838.5 4.13% 2,615.0 4.50%Coomera (ii) 50.0 C – – 222.5 5.50% – –Garden City 100.0 C 100.0 C 1,730.0 4.75% 1,705.0 4.75%Helensvale 50.0 C 50.0 C 237.5 5.75% 237.5 5.75%North Lakes 50.0 C 50.0 C 490.0 5.00% 475.0 5.00%
SOUTH AUSTRALIAMarion 50.0 C 50.0 C 737.5 5.13% 737.5 5.25%Tea Tree Plaza (ii) 50.0 E 50.0 E 410.0 5.38% 400.3 5.50%West Lakes 50.0 C 50.0 C 247.5 6.00% 245.0 6.00%VICTORIAAirport West 50.0 C 50.0 C 213.7 5.75% 213.5 5.75%Doncaster 50.0 C 50.0 C 1,210.0 4.50% 1,200.0 4.50%Fountain Gate 100.0 C 100.0 C 2,285.0 4.13% 2,090.0 4.50%Geelong 50.0 C 50.0 C 266.5 5.65% 265.0 5.75%Knox 50.0 C 50.0 C 577.5 5.50% 576.5 5.50%Plenty Valley (ii) 50.0 C 50.0 C 263.0 5.25% 261.0 5.25%Southland 50.0 E 50.0 E 875.0 4.62% 807.5 5.00%
WESTERN AUSTRALIACarousel (ii) 100.0 C 100.0 C 1,475.0 5.00% 1,080.0 5.50%Stirling 100.0 C 100.0 C 331.0 6.25% 331.0 6.25%Whitford City 50.0 C 50.0 C 315.0 5.75% 330.0 5.75%Total Australian portfolio 37,140.1 4.71% (v) 34,284.3 4.86% (v)
Consolidated 35,522.6 32,761.5 Equity accounted 1,617.5 1,522.8 Total Australian portfolio 37,140.1 34,284.3
C Consolidated – Centres which are held through controlled entities or are held directly and jointly as tenants in common and are treated as joint operations. For joint operations, the contractual arrangements establish that the parties share all the liabilities, obligations, costs and expenses in their ownership proportion. The allocation of revenue and expenses is based on the ownership interest in the joint arrangement.
E Equity Accounted – Centres held through a separate vehicle with joint control are treated as a joint venture and accounted for under the equity method of accounting.(i) Property acquired during the year.(ii) Developments completed during the year.(iii) Sydney comprises Sydney Central Plaza, the Sydney City retail complex and office towers. As at 31 December 2018, the weighted average capitalisation rate of
Sydney was 4.31%, comprising retail 4.11% (Sydney City 4.0% and Sydney Central Plaza 4.5%) and office 4.92%. As at 31 December 2017, the weighted average capitalisation rate of Sydney was 4.32%, comprising retail 4.12% (Sydney City 4.0% and Sydney Central Plaza 4.5%) and office 4.95%.
(iv) Carindale Property Trust (CPT) has a 50% interest in this shopping centre. As at 31 December 2018, the Group has a 59.6% interest in CPT (31 December 2017: 56.6%).(v) Weighted average capitalisation rate including non-retail assets.

Notes to the Financial StatementsFOR THE YEAR ENDED 31 DECEMBER 2018
PAGE 46
NOTE 4 DETAILS OF SHOPPING CENTRE INVESTMENTS (CONTINUED)(b) Shopping centre investments – New Zealand
New Zealand shopping centres
OwnershipInterest
31 Dec 18%
OwnershipInterest
31 Dec 17%
Carrying Amount
31 Dec 18NZ$million
RetailCapitalisation
Rates31 Dec 18
%
Carrying Amount
31 Dec 17NZ$million
RetailCapitalisation
Rates31 Dec 17
%
Albany 51.0 E 51.0 E 308.0 5.88% 301.4 5.88%Manukau 51.0 E 51.0 E 219.3 6.38% 189.0 7.00%Newmarket (i) 51.0 E 51.0 E 141.7 6.63% 141.8 6.63%Riccarton 51.0 E 51.0 E 334.1 6.25% 316.2 6.50%St Lukes 51.0 E 51.0 E 265.2 6.25% 265.2 6.25%Total New Zealand portfolio 1,268.3 6.24% (ii) 1,213.6 6.39% (ii)
Exchange rate 1.0474 1.1002 Total New Zealand portfolio in A$ 1,210.9 1,103.1
Equity accounted 1,210.9 1,103.1 Total New Zealand portfolio 1,210.9 1,103.1
E Equity Accounted – Centres held through a separate vehicle with joint control are treated as a joint venture and accounted for under the equity method of accounting.(i) Property currently under redevelopment.(ii) Weighted average capitalisation rate including non-retail assets.
NOTE 5 DETAILS OF EQUITY ACCOUNTED INVESTMENTS31 Dec 18
$million31 Dec 17
$million
(a) Share of equity accounted entities’ net profit and comprehensive incomeShare of after tax profit of equity accounted entities 234.9 306.2 Other comprehensive income/(loss) (i) 27.1 (36.4)Share of total comprehensive income of equity accounted entities 262.0 269.8
(i) Relates to the net exchange difference on translation of equity accounted foreign operations.
(b) Share of equity accounted entities’ assets and liabilitiesThe Group’s equity accounted investments of $2,966.2 million (31 December 2017: $2,622.2 million) comprise investments in joint ventures in Australia and New Zealand represented by equity of $2,165.0 million (31 December 2017: $2,021.9 million) and interest bearing loans of $801.2 million (31 December 2017: $600.3 million). Inter-entity interest charges on the loans amounted to $24.0 million (31 December 2017: $20.9 million).
(c) Equity accounted entities economic interest
Name of investments Type of equity Balance date
Economic interest
31 Dec 18 31 Dec 17
Australian investments (i)
Mt Druitt (ii) Trust units 30 Jun 50.0% 50.0%Southland (ii) Trust units 30 Jun 50.0% 50.0%Tea Tree Plaza (ii) Trust units 30 Jun 50.0% 50.0%
New Zealand investments (i) (iii)
Albany Shares 31 Dec 51.0% 51.0%Manukau Shares 31 Dec 51.0% 51.0%Newmarket Shares 31 Dec 51.0% 51.0%Riccarton Shares 31 Dec 51.0% 51.0%St Lukes Shares 31 Dec 51.0% 51.0%
(i) All equity accounted property partnerships, trusts and companies operate solely as retail property investors.(ii) Notwithstanding that the financial year of these investments ends on 30 June, the consolidated financial statements have been made out so as to include the
accounts for a period coinciding with the financial year of the Parent Company being 31 December.(iii) Under the Shareholders’ Agreement, the Group and GIC, Singapore’s sovereign wealth fund, each has two representatives in the Shareholders’ Committee
with voting power in proportion to each shareholder’s shareholding. While the Group has a 51% interest in these entities, 75% of the votes is required to pass a resolution. Accordingly, the Group’s 51% interest in these investments is accounted for using the equity accounted method.

SCENTRE GROUP ANNUAL FINANCIAL REPORT 2018 // PAGE 47
31 Dec 18$million
31 Dec 17$million
NOTE 6 TAXATION
(a) Tax expenseCurrent tax expense – underlying operations (51.0) (53.9)Deferred tax benefit/(expense) 4.7 (1.8)
(46.3) (55.7)
The prima facie tax on profit before tax is reconciled to the income tax expense provided in the financial statements as follows:Profit before income tax 2,342.2 4,287.1 Less: Trust income not taxable for the Group – tax payable by members (2,204.6) (4,203.8)
137.6 83.3 Prima facie tax expense at 30% (41.3) (25.0)Benefit from utilisation of capital losses from prior years 24.5 – Tax on inter-entity transactions (32.8) (36.8)Deferred tax release on New Zealand capital transactions – 6.7 Other 3.3 (0.6)Tax expense (46.3) (55.7)
(b) Deferred tax assetsProvisions and accruals 54.8 51.1
54.8 51.1
(c) Deferred tax liabilitiesTax effect of book value in excess of the tax cost base of investment properties 44.1 42.0 Other timing differences 63.6 66.3
107.7 108.3
Accounting PoliciesTaxationThe Group comprises taxable and non taxable entities. Income tax expense is only recognised in respect of taxable entities.
(i) Taxable and non taxable entities of the GroupThe Parent Company and its Australian resident wholly owned subsidiaries have formed a tax consolidated group. The Parent Company has entered into tax funding arrangements with its Australian resident wholly owned subsidiaries, pursuant to which each subsidiary has agreed to pay or receive a tax equivalent amount based on the net taxable amount or loss of the subsidiary at the current tax rate. The tax consolidated group has applied the modified separate taxpayer approach in determining the appropriate amount of current taxes to allocate to each entity.
SGT1 and SGT2 are not liable for Australian income tax provided that members are presently entitled to the income of each Trust as determined in accordance with its constitution. The members of each Trust are taxable on their share of the taxable income of each Trust.
SGT3 is treated as a company for Australian tax purposes and accordingly is a taxable entity.
The Group’s New Zealand resident entities are subject to New Zealand tax.
(ii) Accounting for income taxCurrent income tax assets and liabilities are measured at the amount expected to be recovered from or paid to the tax authorities, calculated using the tax rates and tax laws enacted or substantively enacted at the reporting date in the countries where the Group operates and generates taxable income. Current income tax relating to items recognised directly in equity is recognised in equity and not in the income statement.
Deferred tax is provided on temporary differences between the tax bases of assets and liabilities and their carrying amounts for financial reporting purposes at the reporting date. Deferred tax assets and liabilities are measured at the tax rates that are expected to apply when the asset is realised or the liability is settled, based on tax rates (and tax laws) that have been enacted or substantively enacted at the reporting date. Deferred tax relating to items recognised in other comprehensive income or directly in equity is recognised in other comprehensive income or directly in equity and not the income statement.

Notes to the Financial StatementsFOR THE YEAR ENDED 31 DECEMBER 2018
PAGE 48
Note31 Dec 18
$million31 Dec 17
$million
NOTE 7 SIGNIFICANT ITEMS
The following significant items are relevant in explaining the financial performance of the business:Property revaluations 1,060.5 3,056.7 Equity accounted property revaluations 87.2 160.1 Net fair value gain/(loss) and associated credit risk on currency derivatives that do not qualify for hedge accounting 11 (30.4) 5.6 Exchange differences (including amounts transferred from foreign currency translation reserve) on realisation of net investment in foreign operations 11 0.7 0.8 Net fair value loss on interest rate hedges that do not qualify for hedge accounting 12 (133.6) (158.4)Net modification gain on refinanced borrowing facilities 12 9.9 – Net fair value loss on other financial liabilities 12 (23.2) (77.8)Gain in respect of capital transactions 13 40.1 0.0 Deferred tax benefit/(expense) 6(a) 4.7 (1.8)Equity accounted deferred tax expense (2.9) (3.0)
NOTE 8 DIVIDENDS/DISTRIBUTIONS
(a) Final dividend/distributions for the yearDividend/distributions in respect of the 6 months to 31 December 2018Parent Company: 2.96 cents per share (31 December 2017: 2.35 cents per share) (i) 157.0 124.8 SGT1: 3.40 cents per unit (31 December 2017: 2.60 cents per unit) 180.3 138.1 SGT2: 4.60 cents per unit (31 December 2017: 5.92 cents per unit) 244.0 314.5 SGT3: 0.12 cents per unit (31 December 2017: nil) (i) 6.4 – Scentre Group 11.08 cents per stapled security (31 December 2017: 10.87 cents per stapled security) 587.7 577.4
(i) Dividends to be paid/paid by the Parent Company and distributions to be paid/paid by SGT3 are franked at the corporate tax rate of 30%.
Interim dividend/distributions of 11.08 cents were paid on 31 August 2018. Final dividend/distributions will be paid on 28 February 2019. The record date for the final dividends/distributions was 5pm, 14 February 2019. The Group does not operate a Distribution Reinvestment Plan.
31 Dec 18$million
31 Dec 17$million
(b) Dividends/distributions paid during the yearDividend/distributions in respect of the 6 months to 30 June 2018Parent Company: nil (30 June 2017: nil) – – SGT1: 3.34 cents per unit (30 June 2017: 4.15 cents per unit) 177.2 220.4 SGT2: 7.74 cents per unit (30 June 2017: 6.71 cents per unit) 410.5 356.4 SGT3: nil (30 June 2017: nil) – – Dividend/distributions in respect of the 6 months to 31 December 2017Parent Company: 2.35 cents per share (31 December 2016: 2.70 cents per share) (i) 124.8 143.4 SGT1: 2.60 cents per unit (31 December 2016: 3.45 cents per unit) 138.1 183.3 SGT2: 5.92 cents per unit (31 December 2016: 4.33 cents per unit) 314.5 230.0 SGT3: nil (31 December 2016: 0.17 cents per unit) (i) – 9.0
1,165.1 1,142.5
(i) Dividends paid by the Parent Company and distributions paid by SGT3 are franked at the corporate tax rate of 30%.
(c) Franking credit balance of the GroupAs at 31 December 2018, franking credits available for use in future distributions amount to $113.3 million (31 December 2017: $132.3 million).

SCENTRE GROUP ANNUAL FINANCIAL REPORT 2018 // PAGE 49
31 Dec 18$
31 Dec 17$
NOTE 9 NET TANGIBLE ASSET BACKING
Net tangible asset backing per security 4.46 4.24
Net tangible asset backing per security is calculated by dividing total equity attributable to stapled security holders of the Group by the number of securities on issue. The number of securities used in the calculation of the consolidated net tangible asset backing is 5,304,295,769 (31 December 2017: 5,311,595,241).
31 Dec 18cents
31 Dec 17cents
NOTE 10 EARNINGS PER SECURITY
(a) Summary of earnings per securityBasic earnings per stapled security attributable to members of Scentre Group 43.10 79.41 Diluted earnings per stapled security attributable to members of Scentre Group 42.97 79.18 Basic earnings per SGL share 3.66 2.40 Diluted earnings per SGL share 3.64 2.39
(b) Income and security dataThe following reflects the income data used in the calculations of basic and diluted earnings per stapled security:
31 Dec 18$million
31 Dec 17$million
Earnings used in calculating basic earnings per stapled security (i) (ii) 2,287.2 4,217.9 Adjustment to earnings on options which are considered dilutive – – Earnings used in calculating diluted earnings per stapled security 2,287.2 4,217.9
(i) Refer to the income statement for details of the profit after tax attributable to members of the Group.(ii) Comprises net profit attributable to SGL of $194.0 million (31 December 2017: $127.5 million) and net profit attributable to members of SGT1, SGT2 and SGT3 of
$2,093.2 million (31 December 2017: $4,090.4 million).
31 Dec 18$million
31 Dec 17$million
Earnings used in calculating basic earnings per SGL share 194.0 127.5 Adjustment to earnings on options which are considered dilutive – – Earnings used in calculating diluted earnings per SGL share 194.0 127.5
The following reflects the security data used in the calculations of basic and diluted earnings per stapled security:
31 Dec 18Number ofsecurities
31 Dec 17Number of
securities
Weighted average number of ordinary securities used in calculating basic earnings per stapled security 5,307,143,233 5,311,595,241 Weighted average number of potential employee performance rights which, if securities were issued, would be dilutive (iii) 15,960,855 15,076,608 Adjusted weighted average number of ordinary securities used in calculating diluted earnings per stapled security 5,323,104,088 5,326,671,849
(iii) As at 31 December 2018, 10,973,955 (31 December 2017: 10,951,853) actual employee performance rights were on hand.
(c) Conversions, calls, subscription, issues or buy-back after 31 December 2018There have been no conversions to, calls of, subscriptions for, issuance of new or potential ordinary securities or buy-back of securities since the reporting date and before the completion of this report.
Accounting PoliciesEarnings per securityBasic earnings per security is calculated as net profit attributable to members divided by the weighted average number of ordinary securities. Diluted earnings per security is calculated as net profit attributable to members adjusted for any profit recognised in the period in relation to dilutive potential ordinary securities, divided by the weighted average number of ordinary securities and dilutive potential ordinary securities.

Notes to the Financial StatementsFOR THE YEAR ENDED 31 DECEMBER 2018
PAGE 50
31 Dec 18$million
31 Dec 17$million
NOTE 11 CURRENCY GAIN/(LOSS)Net fair value gain/(loss) and associated credit risk on currency derivatives that do not qualify for hedge accounting (30.4) 5.6 Exchange differences (including amounts transferred from foreign currency translation reserve) on realisation of net investment in foreign operations 0.7 0.8
(29.7) 6.4
Accounting PoliciesTranslation of foreign currency transactionsForeign currency transactions are converted to Australian dollars at exchange rates ruling at the date of those transactions. Amounts payable and receivable in foreign currency at balance date are translated to Australian dollars at exchange rates ruling at that date. Exchange differences arising on the settlement of or on translating amounts payable or receivable in foreign currency at rates different from those at which they were translated on initial recognition, are recognised in the income statement in the period in which they arise, except where hedge accounting is applied.
Refer to Notes 17 and 19 for other items included in currency gain/(loss).
31 Dec 18$million
31 Dec 17$million
NOTE 12 FINANCING COSTS
Gross financing costs (excluding net fair value gain/(loss) on interest rate hedges that do not qualify for hedge accounting) (543.3) (505.8)Financing costs capitalised to qualifying development projects and construction in progress 43.0 24.4 Financing costs (500.3) (481.4)Net fair value loss on interest rate hedges that do not qualify for hedge accounting (133.6) (158.4)Net modification gain on refinanced borrowing facilities 9.9 – Finance leases interest expense (2.3) (2.2)Interest expense on other financial liabilities (35.6) (35.0)Net fair value loss on other financial liabilities (23.2) (77.8)
(685.1) (754.8)
Accounting PoliciesFinancing costsFinancing costs include interest, amortisation of discounts or premiums relating to borrowings and other costs incurred in connection with the arrangement of borrowings. Financing costs are expensed as incurred unless they relate to a qualifying asset. A qualifying asset is an asset which generally takes more than 12 months to get ready for its intended use or sale. In these circumstances, the financing costs are capitalised to the cost of the asset. Where funds are borrowed by the Group for the acquisition or construction of a qualifying asset, the financing costs are capitalised.
Refer to Note 17 for other items included in financing costs.

SCENTRE GROUP ANNUAL FINANCIAL REPORT 2018 // PAGE 51
31 Dec 18$million
31 Dec 17$million
NOTE 13 GAIN IN RESPECT OF CAPITAL TRANSACTIONS
Asset dispositions and capital costs– proceeds from asset dispositions 90.6 149.0 – less: carrying value of assets disposed and other capital costs (50.5) (149.0)Gain in respect of capital transactions 40.1 0.0
NOTE 14 CASH AND CASH EQUIVALENTS
(a) Components of cash and cash equivalentsCash 206.1 174.0 Bank overdrafts – – Total cash and cash equivalents 206.1 174.0
(b) Reconciliation of profit after tax to net cash flows from operating activitiesProfit after tax 2,295.9 4,231.4 Property revaluations (1,060.5) (3,056.7)Share of equity accounted profit in excess of dividends/distributions received (132.6) (203.8)Deferred tax expense/(benefit) (4.7) 1.8 Net fair value loss/(gain) and associated credit risk on currency derivatives 30.4 (5.6)Exchange differences (including amounts transferred from foreign currency translation reserve) on realisation of net investment in foreign operations (0.7) (0.8)Net fair value loss on interest rate hedges that do not qualify for hedge accounting 133.6 158.4 Net modification gain on refinanced borrowing facilities (9.9) – Net fair value loss on other financial liabilities 23.2 77.8 Gain from capital transactions (40.1) 0.0 Decrease in working capital attributable to operating activities 64.7 22.6 Net cash flows from operating activities 1,299.3 1,225.1
Accounting PoliciesCash and cash equivalentsCash and cash equivalents on the balance sheet comprise cash at bank and on hand and short term deposits with an original maturity of 90 days or less that are readily convertible to known amounts of cash and which are subject to an insignificant risk of changes in value. Cash and cash equivalents are measured at amortised cost using the effective interest rate method, reduced by impairment losses. Interest income and impairment losses (if any) are recognised in the income statement.
For the purposes of the cash flow statement, cash and cash equivalents includes cash on hand and at bank, short term money market deposits and bank accepted bills of exchange readily converted to cash net of bank overdrafts. Bank overdrafts are carried at the principal amount.

Notes to the Financial StatementsFOR THE YEAR ENDED 31 DECEMBER 2018
PAGE 52
31 Dec 18$million
31 Dec 17$million
NOTE 15 INTEREST BEARING LIABILITIES
CurrentUnsecuredCommercial paper and uncommitted facilities– A$ denominated 729.9 979.6 Notes payable – € denominated – 614.9 – US$ denominated 1,064.7 – – A$ denominated 150.4 – Finance leases 0.5 0.6
1,945.5 1,595.1
Non currentUnsecuredBank loans – A$ denominated 2,350.0 828.0 – NZ$ denominated 771.0 595.7 Notes payable – € denominated 4,430.8 3,425.1 – US$ denominated 2,981.3 3,649.6 – £ denominated 1,448.2 1,384.3 – A$ denominated 430.6 581.7 Finance leases 39.9 40.7 SecuredBank loans and mortgages– A$ denominated 245.8 223.5
12,697.6 10,728.6 Total interest bearing liabilities 14,643.1 12,323.7
The Group maintains a range of interest bearing liabilities. The sources of funding are spread over various counterparties to minimise credit risk and the terms of the instruments are negotiated to achieve a balance between capital availability and the cost of debt. Refer to Note 23 for details relating to fixed rate debt and derivatives which hedge floating rate liabilities.
31 Dec 18$million
31 Dec 17$million
(a) Summary of financing facilitiesCommitted financing facilities available to the Group:Total financing facilities at the end of the year 16,556.4 14,891.9 Total interest bearing liabilities (14,643.1) (12,323.7)Total bank guarantees (59.1) (62.4)Available financing facilities 1,854.2 2,505.8 Cash 206.1 174.0 Financing resources available at the end of the year 2,060.3 2,679.8
These facilities comprise fixed and floating rate notes and both secured and unsecured interest only floating rate facilities. Certain facilities are also subject to negative pledge arrangements which require the Group to comply with specific minimum financial and non-financial requirements. These facilities exclude the property linked notes liability of $696.9 million (31 December 2017: $673.7 million). Amounts which are denominated in foreign currencies are translated at exchange rates ruling at balance date.

SCENTRE GROUP ANNUAL FINANCIAL REPORT 2018 // PAGE 53
NOTE 15 INTEREST BEARING LIABILITIES (CONTINUED)
Maturity Date
Committed financing facilities
31 Dec 18$million
Totalinterestbearing
liabilities31 Dec 18
$million
Committedfinancingfacilities
31 Dec 17$million
Totalinterestbearing
liabilities31 Dec 17
$million
(b) Maturity profile of financing facilities and interest bearing liabilitiesYear ending December 2018 (i) – – 615.5 1,595.1 Year ending December 2019 (i) 1,215.7 1,945.5 1,311.8 1,211.8 Year ending December 2020 1,887.2 1,267.9 2,167.9 1,824.4 Year ending December 2021 2,410.3 1,968.2 2,590.7 1,498.3 Year ending December 2022 2,005.1 1,181.0 2,423.5 723.5 Year ending December 2023 2,813.8 2,556.2 2,080.8 1,768.9 Year ending December 2024 2,159.8 1,659.8 922.9 922.9 Year ending December 2025 1,779.7 1,779.7 1,409.2 1,409.2 Year ending December 2026 724.7 724.7 692.7 692.7 Year ending December 2027 710.4 710.4 640.9 640.9 Year ending December 2028 814.5 814.5 0.6 0.6 Due thereafter 35.2 35.2 35.4 35.4
16,556.4 14,643.1 14,891.9 12,323.7
Total financing facilities and interest bearing liabilities are comprised of:Unsecured notes payable – € (ii) Jul 20 to Apr 28 4,430.8 4,430.8 4,040.0 4,040.0 Unsecured notes payable – US$ (ii) Nov 19 to Mar 27 4,046.0 4,046.0 3,649.6 3,649.6 Unsecured notes payable – £ (ii) Apr 22 to Jul 26 1,448.2 1,448.2 1,384.3 1,384.3 Unsecured notes payable – A$ Oct 19 to Jul 22 581.0 581.0 581.7 581.7 Unsecured bank loan facilities Mar 20 to Sep 25 5,750.0 3,121.0 4,950.0 1,423.7 Unsecured commercial paper and uncommitted facility (i) – 729.9 – 979.6 Secured bank loans and mortgages Aug 20 260.0 245.8 245.0 223.5 Finance leases 40.4 40.4 41.3 41.3
16,556.4 14,643.1 14,891.9 12,323.7
(i) Drawings on the Group’s commercial paper program and uncommitted facilities are in addition to the Group’s committed facilities and are classified as current interest bearing liabilities. These drawings may be refinanced by non current unsecured bank loan facilities.
(ii) The €, US$ and £ denominated notes payables are economically hedged using cross currency swaps with the same principal values to convert into A$ payables.
The Group consolidates Carindale Property Trust and the borrowings in this trust are secured by a mortgage over the trust’s interest in Westfield Carindale and sundry property. The recorded fair value of Westfield Carindale and sundry property is $828.5 million (31 December 2017: $813.6 million) compared to borrowings of $245.8 million (31 December 2017: $223.5 million).
31 Dec 18$million
31 Dec 17$million
(c) Movements in interest bearing liabilities and currency derivatives hedging borrowings in foreign currency, arising from financing activitiesBalance at the beginning of the year 12,070.1 11,340.0 Net proceeds from interest bearing liabilities 1,652.7 769.9 Effects of exchange rate changes and fair value loss/(gains) on currency derivatives 55.8 (39.8)Balance at the end of the year (i) 13,778.6 12,070.1
(i) Comprises total interest bearing liabilities of $14,643.1 million (31 December 2017: $12,323.7 million) less net receivables on currency derivatives hedging borrowings in foreign currency of $864.5 million (31 December 2017: $253.6 million) as disclosed in Note 17.
Accounting PoliciesInterest bearing liabilitiesInterest bearing liabilities are recognised initially at the fair value of the consideration received less any directly attributable transaction costs. Subsequent to initial recognition, interest bearing liabilities are recorded at amortised cost using the effective interest rate method.
Interest bearing liabilities are classified as current liabilities where the liability has been drawn under a financing facility which expires within one year. Amounts drawn under financing facilities which expire after one year are classified as non current.
Financing costs for interest bearing liabilities are recognised as an expense on an accruals basis.
The fair value of the Group’s interest bearing borrowings as disclosed in Note 28 are determined as follows:
– Fair value of quoted notes and bonds is based on price quotations at the reporting date.
– The fair value of unquoted instruments, loans from banks, finance leases and other non current financial liabilities is estimated by discounting future cash flows using rates that approximate the Group’s borrowing rate at the balance date, for debt with similar maturity, credit risk and terms.

Notes to the Financial StatementsFOR THE YEAR ENDED 31 DECEMBER 2018
PAGE 54
31 Dec 18$million
31 Dec 17$million
NOTE 16 OTHER FINANCIAL LIABILITIESProperty linked notes 696.9 673.7
696.9 673.7
The Property Linked Notes (Notes) are designed to provide returns based on the economic performance of certain Westfield Australian super regional and regional shopping centres. When the Notes were originally issued, these centres were: Parramatta, Hornsby and Burwood in Sydney, Southland in Melbourne, Tea Tree Plaza in Adelaide and Belconnen in the Australian Capital Territory (collectively the Westfield centres). The return under the Notes is based on a proportional interest, in respect of the relevant Westfield centre, as specified in the Note (Reference Property Interest). Redemption events under the Notes include non performance events by the Issuer, changes in tax laws and sale of the relevant Westfield centre. The Notes may also be redeemed at a Review Date.
The redemption value of a Note is effectively calculated as the market value of the Note holder’s Reference Property Interest at the date of redemption and the final coupon (if applicable). The Notes were initially recorded at fair value and are subsequently remeasured at fair value each reporting period. The fair value of the Notes is determined by reference to the fair value of the relevant Westfield centre with the gains or losses recorded through the income statement. Accordingly, the gains or losses recorded through the income statement are directly related to the revaluation of the relevant Westfield centre. On redemption, the obligation to pay the amount due on the Notes can, in certain circumstances, be satisfied by the transfer of the underlying Reference Property Interest to the Note holder. The Notes are subordinated to all other secured and unsecured debt of the Group. The Notes are guaranteed (on a subordinated basis) by the Parent Company and RE1 Limited as responsible entity of SGT2.
In the prior year, $416.6 million of the Notes were repaid and terminated. The review dates for the remaining Notes linked to Parramatta, Southland and Hornsby are 31 December 2021, 2022 and 2023, respectively. The coupon on the remaining Notes is payable quarterly on 15 March, 15 June, 15 September and 15 December each year for as long as the Notes remain outstanding.
Accounting PoliciesOther financial liabilitiesOther financial liabilities pertain to property linked notes. Where there is a minimum distribution entitlement and/or the redemption terms include the settlement for cash on redemption, the instrument is classified as a financial liability and is designated as fair value through the income statement.
The fair value of property linked notes is determined by reference to the fair value of the underlying linked property investments.
31 Dec 18$million
31 Dec 17$million
NOTE 17 DERIVATIVE ASSETS AND LIABILITIES(a) Derivative assetsCurrentReceivables on currency derivatives hedging borrowings in foreign currency 220.3 35.6 Receivables on interest rate derivatives 1.3 –
221.6 35.6
Non currentReceivables on currency derivatives hedging borrowings in foreign currency 699.9 358.8 Receivables on interest rate derivatives 192.3 245.4
892.2 604.2
(b) Derivative liabilitiesCurrentPayables on interest rate derivatives 12.3 8.9
12.3 8.9
Non currentPayables on currency derivatives hedging borrowings in foreign currency 55.7 140.8 Payables on interest rate derivatives 331.0 252.6
386.7 393.4
The Group presents the fair value mark to market of its derivative assets and derivative liabilities on a gross basis. However, certain derivative assets and liabilities are subject to legally enforceable master netting arrangements. As at 31 December 2018, when these netting arrangements are applied to the derivative portfolio, derivative assets of $1,113.8 million would be reduced by $364.5 million to the net amount of $749.3 million and derivative liabilities of $399.0 million would be reduced by $364.5 million to the net amount of $34.5 million. As at 31 December 2017, derivative assets of $639.8 million would be reduced by $369.6 million to the net amount of $270.2 million and derivative liabilities of $402.3 million would be reduced by $369.6 million to the net amount of $32.7 million.

SCENTRE GROUP ANNUAL FINANCIAL REPORT 2018 // PAGE 55
NOTE 17 DERIVATIVE ASSETS AND LIABILITIES (CONTINUED)
Accounting PoliciesDerivative financial instrumentsThe Group utilises derivative financial instruments, including forward exchange contracts, interest rate options and currency and interest rate swaps to manage the risks associated with foreign currency and interest rate fluctuations. Such derivative financial instruments are recognised at fair value.
The Group has set defined policies and implemented a comprehensive hedging program to manage interest and exchange rate risks. Derivative instruments are transacted to achieve the economic outcomes in line with the Group’s treasury policy and hedging program. Derivative instruments are not transacted for speculative purposes. Accounting standards require detailed compliance with documentation, designation and effectiveness parameters before a derivative financial instrument is deemed to qualify for hedge accounting treatment. As these requirements are not met, derivative instruments, other than any currency derivatives that hedge net investments in foreign operations, are deemed not to qualify for hedge accounting and changes in fair value are recorded in the income statement.
Gains or losses arising on the movements in the fair value of currency derivatives which hedge net investments in foreign operations are recognised in the foreign currency translation reserve. Where a currency derivative, or portion thereof, is deemed an ineffective hedge for accounting purposes, gains or losses thereon are recognised in the income statement. On disposal of a net investment in foreign operations, the cumulative gains or losses recognised previously in the foreign currency translation reserve are transferred to the income statement.
The fair value of derivatives has been determined with reference to market observable inputs for contracts with similar maturity profiles. The valuation is a present value calculation which incorporates interest rate curves, foreign exchange spot and forward rates, option volatilities and the credit quality of all counterparties.
31 Dec 18Number ofsecurities
31 Dec 17Number ofsecurities
NOTE 18 CONTRIBUTED EQUITY
(a) Number of securities on issueBalance at the beginning of the year 5,311,595,241 5,311,595,241 Buy-back and cancellation of securities (7,299,472) – Balance at the end of the year (i) 5,304,295,769 5,311,595,241
(i) The number of securities on issue as at 31 December 2018 was 5,316,997,206 (31 December 2017: 5,324,296,678). The Scentre Executive Option Plan Trust holds 12,701,437 (31 December 2017: 12,701,437) securities in the Group, which have been consolidated and eliminated in accordance with accounting standards.
Holders of Scentre Group stapled securities have the right to receive declared dividends from the Parent Company and distributions from SGT1, SGT2 and SGT3 and, in the event of winding up the Parent Company, SGT1, SGT2 and SGT3, to participate in the proceeds from the sale of all surplus assets in proportion to the number of and amounts paid up on stapled securities held.
Holders of stapled securities can vote their shares and units in accordance with the Corporations Act, either in person or by proxy, at a meeting of any of the Parent Company, SGT1, SGT2 and SGT3 (as the case may be).
31 Dec 18$million
31 Dec 17$million
(b) Amount of contributed equity attributable to members of Scentre GroupBalance at the beginning of the year 10,495.2 10,495.2 Buy-back and cancellation of securities and associated costs (30.1) – Balance at the end of the year (i) 10,465.1 10,495.2
(i) Comprises contributed equity attributable to SGL of $673.3 million (31 December 2017: $674.4 million) and contributed equity attributable to members of SGT1, SGT2 and SGT3 of $9,791.8 million (31 December 2017: $9,820.8 million).
Accounting PoliciesContributed equityIssued and paid up capital is recognised at the fair value of the consideration received by the Group. Any transaction costs arising from the issue of ordinary securities are recognised directly in equity as a reduction of the proceeds received.

Notes to the Financial StatementsFOR THE YEAR ENDED 31 DECEMBER 2018
PAGE 56
31 Dec 18$million
31 Dec 17$million
NOTE 19 RESERVES
Total reserves of the GroupForeign currency translation reserve 98.1 72.7 Employee share plan benefits reserve 10.6 13.9 Balance at the end of the year (i) 108.7 86.6
Movement in foreign currency translation reserveThe foreign currency translation reserve is used to record net exchange differences arising from the translation of the net investments, including qualifying hedges, in foreign controlled and equity accounted entities.Balance at the beginning of the year 72.7 101.1 Foreign exchange movement– realised and unrealised differences on the translation of investment in foreign operations and asset
hedging derivatives which qualify for hedge accounting (ii) 26.1 (27.6)– accumulated exchange differences transferred from foreign currency translation reserve on realisation
of net investment in foreign operations (0.7) (0.8)Balance at the end of the year 98.1 72.7
(i) Comprises reserves attributable to SGL of $10.5 million (31 December 2017: $12.8 million) and reserves attributable to members of SGT1, SGT2 and SGT3 of $98.2 million (31 December 2017: $73.8 million).
(ii) Comprises net exchange gain on translation of foreign operations of $26.1 million (31 December 2017: loss of $33.9 million) and net realised and unrealised gain on asset hedging derivatives which qualify for hedge accounting of nil (31 December 2017: $6.3 million).
Accounting PoliciesTranslation of accounts of foreign operationsThe functional and presentation currency of the Parent Company and its Australian subsidiaries is Australian dollars. The functional currency of the New Zealand entities is New Zealand dollars. The presentation currency of the overseas entities is Australian dollars to enable the consolidated financial statements of the Group to be reported in a common currency.
The balance sheets of foreign subsidiaries and equity accounted investments are translated at exchange rates ruling at balance date and the income statement of foreign subsidiaries and equity accounted investments are translated at average exchange rates for the period. Exchange differences arising on translation of the interests in foreign operations are taken directly to the foreign currency translation reserve.
Refer to Note 17 for other items included in foreign currency translation reserve.
Note31 Dec 18
$million31 Dec 17
$million
Movement in employee share plan benefits reserveThe employee share plan benefits reserve is used to record the value of share based payments provided to employees as part of their remuneration.Balance at the beginning of the year 13.9 14.2 – movement in equity settled share based payment (3.3) (0.3)Balance at the end of the year 10.6 13.9
NOTE 20 RETAINED PROFITSMovement in retained profits attributable to members of Scentre GroupBalance at the beginning of the year, as reported 11,952.1 8,876.7 Impact of changes in accounting standards 1(c) (10.3) – Adjusted balance at the beginning of the year 11,941.8 8,876.7 Profit after tax for the period 2,287.2 4,217.9 Dividends/distributions paid 8(b) (1,165.1) (1,142.5)Balance at the end of the year (i) 13,063.9 11,952.1
(i) Comprises retained profits attributable to SGL of $201.0 million (31 December 2017: $139.4 million) and retained profits attributable to members of SGT1, SGT2 and SGT3 of $12,862.9 million (31 December 2017: $11,812.7 million).
SCENTRE GROUP ANNUAL FINANCIAL REPORT 2018 // PAGE 57
NOTE 21 CAPITAL RISK MANAGEMENTThe Group seeks to manage its capital requirements to maximise value to members through the mix of debt and equity funding, while ensuring that Group entities:
– comply with capital and distribution requirements of their constitutions and/or trust deeds;
– comply with capital requirements of relevant regulatory authorities;
– maintain strong investment grade credit ratings; and
– continue to operate as going concerns.
The Group assesses the adequacy of its capital requirements, cost of capital and gearing (i.e. debt/equity mix) as part of its broader strategic plan. The Group continuously reviews its capital structure to ensure:
– sufficient funds and financing facilities, on a cost effective basis, are available to implement the Group’s property development and business acquisition strategies;
– financing facilities for unforeseen contingencies are maintained; and
– dividends/distributions to members are maintained within the stated distribution policy.
The Group is able to alter its capital mix by issuing new stapled securities and hybrid securities, establishing a distribution reinvestment plan, electing to have the distribution reinvestment underwritten, adjusting the amount of distributions paid to members, activating a security buy-back program, divesting assets or adjusting the timing of capital expenditure for its property redevelopment pipeline.
The Group also protects its equity in assets by taking out insurance.
NOTE 22 FINANCIAL RISK MANAGEMENTThe Group’s principal financial instruments comprise cash, receivables, payables, interest bearing liabilities, other financial liabilities and derivative financial instruments.
The Group manages its exposure to key financial risks in accordance with the Group’s treasury risk management policies. These policies have been established to manage the key financial risks such as interest rate, foreign exchange, counterparty credit and liquidity.
The Group’s treasury risk management policies are established to identify and analyse the risks faced by the Group, to set appropriate risk limits and controls to monitor risks and adherence to limits. Risk management policies and systems are reviewed regularly to reflect changes in market conditions and the Group’s activities. The Group through its training and procedures, has developed a control environment in which relevant treasury and finance personnel understand their roles and obligations in respect of the Group’s treasury management objectives.
The Group has an established Board approved risk management framework including policies, procedures, limits and allowed types of derivative financial instruments. The Audit and Risk Committee reviews and oversees management’s compliance with these policies, procedures and limits. The Audit and Risk Committee is assisted in its oversight role by the Group’s Executive Risk Management Committee.
The Group uses different methods to measure and manage different types of risks to which it is exposed. These include monitoring levels of exposure to interest rates, foreign exchange, liquidity and credit risk. The Group enters into derivative financial instruments, principally interest rate swaps, interest rate options, cross currency swaps, forward exchange contracts and currency options. The purpose of these transactions is to manage the interest rate and currency risks arising from the Group’s operations, cash flows, interest bearing liabilities and its net investments in foreign operations. The Group seeks to deal only with creditworthy counterparties and these assessments are regularly reviewed. Liquidity risk is monitored through the use of future rolling cash flow forecasts.
NOTE 23 INTEREST RATE RISK MANAGEMENTThe Group is exposed to interest rate risk on its borrowings and derivative financial instruments. This risk is managed by the Group by maintaining an appropriate mix between fixed and floating rate interest bearing liabilities. Fixed rate debt is achieved either through fixed rate debt funding or through the use of derivative financial instruments in accordance with a Board approved policy. These activities are evaluated regularly to determine that the Group is not exposed to interest rate movements that could adversely impact its ability to meet its financial obligations and to comply with its borrowing covenants.

Notes to the Financial StatementsFOR THE YEAR ENDED 31 DECEMBER 2018
PAGE 58
NOTE 23 INTEREST RATE RISK MANAGEMENT (CONTINUED)Summary of interest rate positions at balance dateThe Group has interest rate risk on borrowings which are typically floating rate debt or notional borrowings entered into under currency derivatives. The exposures at reporting date together with the interest rate risk management transactions are as follows:
(a) Interest payable and receivable exposures
Note31 Dec 18
$million31 Dec 17
$million
Principal amounts of all interest bearing liabilities and derivative liabilities:Interest bearing liabilities 15 14,643.1 12,323.7 Share of equity accounted entities’ interest bearing liabilities 2(v) 0.4 19.2 Cross currency swaps– A$ 24(b) 8,998.3 8,781.4 Total interest bearing liabilities 23,641.8 21,124.3
Principal amounts of all interest bearing assets and derivative assets:Cross currency swaps– £800.0 million (31 December 2017: £800.0 million) 24(b) 1,448.2 1,384.3 – US$2,850.0 million (31 December 2017: US$2,850.0 million) 24(b) 4,046.0 3,649.6 – €2,700.0 million (31 December 2017: €2,600.0 million) 24(b) 4,395.2 3,996.9 Cash and cash equivalents 2(v) 213.9 176.6 Total interest bearing assets 10,103.3 9,207.4
Principal amounts of net interest bearing liabilities 13,538.5 11,916.9
Principal amounts of fixed interest rate liabilities:Fixed rate debt– A$ 23(b) 580.0 580.0 – £800.0 million (31 December 2017: £800.0 million) 23(b) 1,448.2 1,384.3 – US$2,850.0 million (31 December 2017: US$2,850.0 million) 23(b) 4,046.0 3,649.6 – €2,700.0 million (31 December 2017: €2,200.0 million) 23(b) 4,395.2 3,382.0 Fixed rate derivatives– A$ 23(b) 8,297.3 8,678.5 – NZ$510.0 million (31 December 2017: NZ$500.0 million) 23(b) 486.9 454.5 Interest rate options– NZ$70.0 million (31 December 2017: NZ$70.0 million) 23(c) 66.8 63.6 Principal amounts on which interest rate payable exposure has been hedged 19,320.4 18,192.5
Principal amounts of fixed interest rate assets:Fixed rate derivatives– A$ 23(b) 150.0 150.0 – £800.0 million (31 December 2017: £800.0 million) 23(b) 1,448.2 1,384.3 – US$2,850.0 million (31 December 2017: US$2,850.0 million) 23(b) 4,046.0 3,649.6 – €2,700.0 million (31 December 2017: €2,200.0 million) 23(b) 4,395.2 3,382.0 Principal amounts on which interest rate receivable exposure has been hedged 10,039.4 8,565.9
Principal amounts of net interest bearing liabilities hedged by fixed rate debt and derivatives 9,281.0 9,626.6
At 31 December 2018, the Group has hedged 69% of its net interest bearing liabilities by way of fixed rate borrowings, interest rate swaps and interest rate options of varying durations. The remaining 31% is exposed to floating rates on a principal payable of $4,257.5 million, at an average interest rate of 3.4%, including margin (31 December 2017: 81% hedged with floating exposure on a principal payable of $2,290.3 million at an average interest rate of 3.1%). Changes to the fair value of derivatives due to interest rate movements are set out in Notes 23(b) and 23(c).
Interest rate sensitivityThe sensitivity of interest expense to changes in the floating exposure interest rate is proportional. An increase or decrease in interest rates of 100 basis points would increase or decrease interest expense by $42.6 million (31 December 2017: $22.9 million) for each year thereafter.

SCENTRE GROUP ANNUAL FINANCIAL REPORT 2018 // PAGE 59
NOTE 23 INTEREST RATE RISK MANAGEMENT (CONTINUED)Summary of interest rate positions at balance date (continued)(b) Fixed rate debt and interest rate swapsNotional principal or contract amounts and contracted rates of the Group’s fixed rate debt and interest rate swaps:
Interest rate swaps Fixed rate borrowings Interest rate swaps Fixed rate borrowings
Fixed rate debt andswaps contracted asat the reporting dateand outstanding at
31 Dec 18Notional principal amount million
31 Dec 18
Averagerate
31 Dec 18
Principal amountmillion
31 Dec 18Average
rateincluding
margin
31 Dec 17Notional principal amount
million
31 Dec 17
Averagerate
31 Dec 17
Principal amount
million
31 Dec 17Average
rateincluding
margin
A$ payable31 December 2017 – – – – A$(8,678.5) 2.88% A$(580.0) 4.71%31 December 2018 A$(8,297.3) 2.86% A$(580.0) 4.71% A$(8,265.0) 2.86% A$(580.0) 4.71%31 December 2019 A$(8,035.4) 2.81% A$(430.0) 4.60% A$(7,755.0) 2.82% A$(430.0) 4.60%31 December 2020 A$(6,523.4) 2.84% A$(430.0) 4.60% A$(6,245.0) 2.85% A$(430.0) 4.60%31 December 2021 A$(6,071.5) 2.87% A$(30.0) 5.96% A$(5,795.0) 2.88% A$(30.0) 5.96%31 December 2022 A$(5,059.6) 2.83% – – A$(4,785.0) 2.84% – – 31 December 2023 A$(3,785.8) 2.83% – – A$(3,515.0) 2.84% – – 31 December 2024 A$(2,767.9) 2.84% – – A$(2,500.0) 2.86% – – 31 December 2025 A$(1,500.0) 2.94% – – A$(1,500.0) 2.94% – – 31 December 2026 A$(500.0) 2.74% – – A$(500.0) 2.74% – –
NZ$ payable31 December 2017 – – – – NZ$(500.0) 3.28% – – 31 December 2018 NZ$(510.0) 3.08% – – NZ$(410.0) 3.24% – – 31 December 2019 NZ$(530.0) 3.14% – – NZ$(430.0) 3.31% – – 31 December 2020 NZ$(430.0) 3.21% – – NZ$(380.0) 3.28% – – 31 December 2021 NZ$(350.0) 3.14% – – NZ$(300.0) 3.22% – – 31 December 2022 NZ$(300.0) 3.09% – – NZ$(250.0) 3.17% – – 31 December 2023 NZ$(200.0) 3.15% – – NZ$(200.0) 3.15% – – 31 December 2024 NZ$(150.0) 3.18% – – NZ$(150.0) 3.18% – – 31 December 2025 NZ$(50.0) 3.29% – – NZ$(50.0) 3.29% – –
A$ receivable31 December 2017 – – – – A$150.0 3.05% – – 31 December 2018 A$150.0 3.05% – – A$150.0 3.05% – –
£ receivable/(payable) 31 December 2017 – – – – £800.0 3.13% £(800.0) 3.13%31 December 2018 £800.0 3.13% £(800.0) 3.13% £800.0 3.13% £(800.0) 3.13%31 December 2019 £800.0 3.13% £(800.0) 3.13% £800.0 3.13% £(800.0) 3.13%31 December 2020 £800.0 3.13% £(800.0) 3.13% £800.0 3.13% £(800.0) 3.13%31 December 2021 £800.0 3.13% £(800.0) 3.13% £800.0 3.13% £(800.0) 3.13%31 December 2022 £400.0 3.88% £(400.0) 3.88% £400.0 3.88% £(400.0) 3.88%31 December 2023 £400.0 3.88% £(400.0) 3.88% £400.0 3.88% £(400.0) 3.88%31 December 2024 £400.0 3.88% £(400.0) 3.88% £400.0 3.88% £(400.0) 3.88%31 December 2025 £400.0 3.88% £(400.0) 3.88% £400.0 3.88% £(400.0) 3.88%
US$ receivable/(payable) 31 December 2017 – – – – US$2,850.0 3.01% US$(2,850.0) 3.01%31 December 2018 US$2,850.0 3.01% US$(2,850.0) 3.01% US$2,850.0 3.01% US$(2,850.0) 3.01%31 December 2019 US$2,100.0 3.23% US$(2,100.0) 3.23% US$2,100.0 3.23% US$(2,100.0) 3.23%31 December 2020 US$2,100.0 3.23% US$(2,100.0) 3.23% US$2,100.0 3.23% US$(2,100.0) 3.23%31 December 2021 US$1,600.0 3.50% US$(1,600.0) 3.50% US$1,600.0 3.50% US$(1,600.0) 3.50%31 December 2022 US$1,600.0 3.50% US$(1,600.0) 3.50% US$1,600.0 3.50% US$(1,600.0) 3.50%31 December 2023 US$1,600.0 3.50% US$(1,600.0) 3.50% US$1,600.0 3.50% US$(1,600.0) 3.50%31 December 2024 US$1,600.0 3.50% US$(1,600.0) 3.50% US$1,600.0 3.50% US$(1,600.0) 3.50%31 December 2025 US$500.0 3.75% US$(500.0) 3.75% US$500.0 3.75% US$(500.0) 3.75%31 December 2026 US$500.0 3.75% US$(500.0) 3.75% US$500.0 3.75% US$(500.0) 3.75%

Notes to the Financial StatementsFOR THE YEAR ENDED 31 DECEMBER 2018
PAGE 60
NOTE 23 INTEREST RATE RISK MANAGEMENT (CONTINUED)Summary of interest rate positions at balance date (continued)(b) Fixed rate debt and interest rate swaps (continued)
Interest rate swaps Fixed rate borrowings Interest rate swaps Fixed rate borrowings
Fixed rate debt andswaps contracted asat the reporting dateand outstanding at
31 Dec 18Notional principal amount million
31 Dec 18
Averagerate
31 Dec 18
Principal amountmillion
31 Dec 18Average
rateincluding
margin
31 Dec 17Notional principal amount
million
31 Dec 17
Averagerate
31 Dec 17
Principal amount
million
31 Dec 17Average
rateincluding
margin
€ receivable/(payable) 31 December 2017 – – – – €2,200.0 2.07% €(2,200.0) 2.07%31 December 2018 €2,700.0 2.01% €(2,700.0) 2.01% €2,200.0 2.07% €(2,200.0) 2.07%31 December 2019 €2,700.0 2.01% €(2,700.0) 2.01% €2,200.0 2.07% €(2,200.0) 2.07%31 December 2020 €2,100.0 2.16% €(2,100.0) 2.16% €1,600.0 2.29% €(1,600.0) 2.29%31 December 2021 €2,100.0 2.16% €(2,100.0) 2.16% €1,600.0 2.29% €(1,600.0) 2.29%31 December 2022 €2,100.0 2.16% €(2,100.0) 2.16% €1,600.0 2.29% €(1,600.0) 2.29%31 December 2023 €1,100.0 2.02% €(1,100.0) 2.02% €600.0 2.25% €(600.0) 2.25%31 December 2024 €500.0 1.75% €(500.0) 1.75% – – – – 31 December 2025 €500.0 1.75% €(500.0) 1.75% – – – – 31 December 2026 €500.0 1.75% €(500.0) 1.75% – – – – 31 December 2027 €500.0 1.75% €(500.0) 1.75% – – – –
The Group’s interest rate swaps do not meet the accounting requirements to qualify for hedge accounting treatment. Changes in fair value have been reflected in the income statement as a component of interest expense. At 31 December 2018, the aggregate fair value is a payable of $149.7 million (31 December 2017: payable of $15.0 million). The change in fair value for the year ended 31 December 2018 was a loss of $134.7 million (31 December 2017: loss of $158.8 million).
Fair value sensitivity31 Dec 18
$million31 Dec 17
$million
The sensitivity of fair value of interest rate swaps to changes in interest rates is as follows:Interest ratemovement
(Increase)/decreasein interest expense
-2.0% 190.0 59.3
-1.0% 89.9 25.7
-0.5% 42.0 10.2
0.5% (32.7) (4.2)
1.0% (120.0) (5.2)
2.0% (183.8) 0.3
The assumed movement in basis points for the interest rate sensitivity analysis is based on the current observable market environment.
All fixed rate borrowings are carried at amortised cost, therefore increases or decreases arising from changes in fair value have not been recorded in these financial statements.
(c) Interest rate optionsNotional principal and contracted rates of the Group’s interest rate options:
Interest rate options Interest rate options
Interest rate options contractedand outstanding as at thereporting date
31 Dec 18
Maturity
31 Dec 18Notional principalamountmillion
31 Dec 18
Averagestrikerates
31 Dec 17
Maturity
31 Dec 17Notional principalamount
million
31 Dec 17
Averagestrikerates
NZ$ payable collar Jan 19 NZ$(70.0) 3.39% / 5.25% Jan 19 NZ$(70.0) 3.39% / 5.25%
The Group’s interest rate options do not meet the accounting requirements to qualify for hedge accounting treatment. Changes in fair value have been reflected in the income statement as a component of interest expense. At 31 December 2018, the aggregate fair value is nil (31 December 2017: payable of $1.1 million). The change in fair value for the year ended 31 December 2018 was a gain of $1.1 million (31 December 2017: gain of $0.3 million).
The sensitivity of the fair value of interest rate options to changes in interest rates is insignificant.

SCENTRE GROUP ANNUAL FINANCIAL REPORT 2018 // PAGE 61
NOTE 24 EXCHANGE RATE RISK MANAGEMENTThe Group is exposed to exchange rate risk on its foreign currency earnings, its distribution and its foreign currency denominated shopping centre assets and other assets. The Group manages these exposures by entering into foreign currency derivative instruments and by borrowing in foreign currencies.
Summary of foreign currency balance sheet positions at balance date(a) Foreign currency exposuresThe Group’s foreign currency exposures at reporting date together with the foreign currency risk management transactions which have been entered into to manage these exposures are as follows:
Note31 Dec 18
million31 Dec 17
million
Foreign currency net investmentsNew Zealand DollarNZ$ net assets NZ$1,378.1 NZ$1,192.7 NZ$ borrowings NZ$(808.1) NZ$(676.9)NZ$ denominated net assets NZ$570.0 NZ$515.8
US DollarUS$ net assets US$0.4 US$0.6 US$ borrowings US$(2,850.0) US$(2,850.0)US$ cross currency swaps 24(b) US$2,850.0 US$2,850.0 US$ denominated net assets US$0.4 US$0.6
British Pound£ borrowings £(800.0) £(800.0)£ cross currency swaps 24(b) £800.0 £800.0£ denominated net assets – –
Euro€ net assets – €0.2 € borrowings €(2,700.0) €(2,600.0)€ cross currency swaps 24(b) €2,700.0 €2,600.0 € denominated net assets – €0.2
The Group’s foreign currency net assets are subject to exchange rate risk. Gains and losses arising from translation of the Group’s foreign currency denominated net assets, and, where applicable, associated hedging instruments, where the Group has satisfied the accounting requirements to qualify for hedge accounting treatment, are reflected in the foreign currency translation reserve.
Where the Group does not satisfy the hedge accounting requirements, the changes in fair value are reflected in the income statement as either foreign currency gains or losses as appropriate.
Foreign currency sensitivity31 Dec 18
$million31 Dec 17
$million
The sensitivity of NZ$ denominated net assets to changesin the year end A$/NZ$1.0474 rate (31 December 2017: 1.1002)is as follows:
A$/NZ$Currency
movement
Gain/(loss) toforeign currency
translation reserve
- 20 cents 128.4 104.2
- 10 cents 57.4 46.9
- 5 cents 27.3 22.3
+ 5 cents (24.8) (20.4)
+ 10 cents (47.4) (39.1)
+ 20 cents (87.3) (72.1)
The assumed currency movement for the foreign currency sensitivity analysis is based on the current observable market environment.
The sensitivity of US$, £ and € denominated net assets to changes in exchange rates is insignificant.

Notes to the Financial StatementsFOR THE YEAR ENDED 31 DECEMBER 2018
PAGE 62
NOTE 24 EXCHANGE RATE RISK MANAGEMENT (CONTINUED)(b) Cross currency swaps in respect of the Group’s foreign currency assets and liabilitiesThe Group has transacted cross currency swaps in respect of its foreign currency assets and liabilities outstanding at reporting date. These contracts do not qualify as hedges of net investments in foreign operations.
Cross currency swaps contracted as at the reporting date and outstanding at
Weighted average exchange rate Amount receivable/(payable) million
31 Dec 18 31 Dec 17 31 Dec 18 31 Dec 18 31 Dec 17 31 Dec 17
US$Contracts to receive US$ and pay A$ 31 December 2017 – 0.8157 – – A$(3,493.7) US$2,850.031 December 2018 0.8157 0.8157 A$(3,493.7) US$2,850.0 A$(3,493.7) US$2,850.031 December 2019 0.7925 0.7925 A$(2,650.0) US$2,100.0 A$(2,650.0) US$2,100.031 December 2020 0.7925 0.7925 A$(2,650.0) US$2,100.0 A$(2,650.0) US$2,100.031 December 2021 0.7995 0.7995 A$(2,001.2) US$1,600.0 A$(2,001.2) US$1,600.031 December 2022 0.7995 0.7995 A$(2,001.2) US$1,600.0 A$(2,001.2) US$1,600.031 December 2023 0.7995 0.7995 A$(2,001.2) US$1,600.0 A$(2,001.2) US$1,600.031 December 2024 0.7995 0.7995 A$(2,001.2) US$1,600.0 A$(2,001.2) US$1,600.031 December 2025 0.7666 0.7666 A$(652.3) US$500.0 A$(652.3) US$500.031 December 2026 0.7666 0.7666 A$(652.3) US$500.0 A$(652.3) US$500.0
£Contracts to receive £ and pay A$ 31 December 2017 – 0.5311 – – A$(1,506.2) £800.0 31 December 2018 0.5311 0.5311 A$(1,506.2) £800.0 A$(1,506.2) £800.0 31 December 2019 0.5311 0.5311 A$(1,506.2) £800.0 A$(1,506.2) £800.0 31 December 2020 0.5311 0.5311 A$(1,506.2) £800.0 A$(1,506.2) £800.0 31 December 2021 0.5311 0.5311 A$(1,506.2) £800.0 A$(1,506.2) £800.0 31 December 2022 0.5491 0.5491 A$(728.5) £400.0 A$(728.5) £400.0 31 December 2023 0.5491 0.5491 A$(728.5) £400.0 A$(728.5) £400.0 31 December 2024 0.5491 0.5491 A$(728.5) £400.0 A$(728.5) £400.0 31 December 2025 0.5491 0.5491 A$(728.5) £400.0 A$(728.5) £400.0
€Contracts to receive € and pay A$ 31 December 2017 – 0.6876 – – A$(3,781.5) €2,600.0 31 December 2018 0.6753 0.6870 A$(3,998.4) €2,700.0 A$(3,202.3) €2,200.0 31 December 2019 0.6753 0.6870 A$(3,998.4) €2,700.0 A$(3,202.3) €2,200.0 31 December 2020 0.6710 0.6857 A$(3,129.5) €2,100.0 A$(2,333.3) €1,600.0 31 December 2021 0.6710 0.6857 A$(3,129.5) €2,100.0 A$(2,333.3) €1,600.0 31 December 2022 0.6710 0.6857 A$(3,129.5) €2,100.0 A$(2,333.3) €1,600.0 31 December 2023 0.6605 0.6903 A$(1,665.4) €1,100.0 A$(869.2) €600.0 31 December 2024 0.6280 – A$(796.2) €500.0 – – 31 December 2025 0.6280 – A$(796.2) €500.0 – – 31 December 2026 0.6280 – A$(796.2) €500.0 – – 31 December 2027 0.6280 – A$(796.2) €500.0 – –
At 31 December 2018, none of the above described foreign currency derivatives qualify for hedge accounting treatment. Changes in fair value have been reflected in the income statement. At 31 December 2018, the aggregate fair value is a receivable of $864.5 million (31 December 2017: $253.6 million). The change in fair value for the year ended 31 December 2018 was a gain of $610.9 million (31 December 2017: loss of $37.0 million).
The foreign currency receivable exposures above are matched to the foreign currency borrowings disclosed in Note 15, therefore the income statement is not affected by any movements in exchange rates in relation to these net positions.

SCENTRE GROUP ANNUAL FINANCIAL REPORT 2018 // PAGE 63
NOTE 25 CREDIT RISK MANAGEMENTThe Group’s credit risk arises from financial assets such as cash and cash equivalents, trade and other receivables and favourable derivative financial instruments. Credit risk refers to the risk that a counterparty will default on its contractual obligations resulting in a financial loss to the Group.
The Group considers a financial asset to be in default when contractual payments are 90 days past due. However, in certain cases, the Group may also consider a financial asset to be in default when internal or external information indicates that the Group is unlikely to receive the outstanding contractual amounts in full before taking into account any credit enhancements held by the Group.
For cash and derivative instruments with banks and other financial institutions, credit limits have been established to ensure that the Group deals only with approved counterparties and that counterparty concentration risk is addressed and the risk of loss is mitigated. Counterparty exposure is measured as the aggregate of all obligations of any single legal entity or economic entity to the Group, after allowing for appropriate set offs which are legally enforceable. A maximum credit limit is allocated to each counterparty based on its credit rating. The counterparty credit risk associated with investment instruments is assessed based on its outstanding face value.
In accordance with the Group’s policy, credit risk in respect of cash and derivative financial instruments is spread among a number of creditworthy counterparties within specified limits. The Group had 24% (31 December 2017: 22%) of its aggregate credit risk spread over two counterparties each with an S&P long term rating of AA- or higher. The remainder is spread over counterparties each with less than 10% of the aggregate credit risk and with an S&P long term rating of BBB+ or higher.
For trade and other receivables, there are no significant concentrations of credit risk. The Group also obtains security deposits from tenants in the form of cash or bank guarantees which can be called upon if the tenant is in default under the terms of the lease contract.
The maximum exposure to credit risk at balance date is the aggregate of the carrying amounts of financial assets as disclosed in Note 28.
NOTE 26 LIQUIDITY RISK MANAGEMENTThe Group undertakes active liquidity and funding risk management to enable it to have sufficient funds available to meet its financial obligations as and when they fall due, working capital and expected committed capital expenditure requirements. The Group prepares and monitors rolling forecasts of liquidity requirements on the basis of expected cash flow.
Interest bearing liabilities, financing facilities and their respective maturity profiles are disclosed in Note 15. The maturity profiles of the principal amounts of interest bearing liabilities including aggregate future estimated nominal interest and the estimated future nominal cashflows of derivative financial instruments are set out below:
31 Dec 18$million
31 Dec 17$million
Interest bearing liabilities and interestDue within one year (2,329.5) (1,923.1)Due between one year and five years (8,034.9) (6,243.4)Due after five years (6,003.1) (5,759.6)
(16,367.5) (13,926.1)
Comprising:– principal amounts of current and non current interest bearing liabilities (14,643.1) (12,323.7)– aggregate future estimated nominal interest (1,724.4) (1,602.4)
(16,367.5) (13,926.1)
Derivatives inflows/(outflows)Due within one year 78.2 (122.7)Due between one year and five years (115.5) (380.9)Due after five years 278.1 27.2
240.8 (476.4)
Contingent liabilities are set out in Note 33 and are not included in the amounts shown above.
NOTE 27 FINANCIAL COVENANTSThe Group is required to comply with certain financial covenants in respect of its unsecured borrowing facilities and bond offerings. The major financial covenants are summarised as follows:
a) Leverage ratio (net debt to net assets)
– shall not exceed 65%
b) Secured debt ratio (secured debt to total assets)
– shall not exceed 40% (and not exceed 45% on certain facilities)
c) Interest cover ratio (EBITDA to interest expense excluding gains or losses from mark to market)
– at least 1.5 times
d) Unencumbered leverage ratio (unencumbered assets to unsecured debt)
– at least 150% (and at least 125% on certain facilities)
At and during the years ended 31 December 2018 and 2017, the Group was in compliance with all the above financial covenants.

Notes to the Financial StatementsFOR THE YEAR ENDED 31 DECEMBER 2018
PAGE 64
NOTE 28 FAIR VALUE OF FINANCIAL ASSETS AND LIABILITIESSet out below is a comparison by category of carrying amounts and fair values of the Group’s financial instruments.
Fair valueHierarchy
Fair value Carrying amount
31 Dec 18$million
31 Dec 17$million
31 Dec 18$million
31 Dec 17$million
Consolidated assetsCash and cash equivalents 206.1 174.0 206.1 174.0 Trade and other receivables (i) (iii) 279.1 219.2 279.1 219.2Derivative assets (ii) Level 2 1,113.8 639.8 1,113.8 639.8
Consolidated liabilitiesTrade and other payables (i) 1,148.0 1,096.1 1,148.0 1,096.1 Interest bearing liabilities (ii)
– Fixed rate debt Level 2 10,656.5 9,421.8 10,506.1 9,040.8 – Floating rate debt Level 2 4,136.4 3,284.6 4,137.0 3,282.9 Other financial liabilities (ii) Level 3 696.9 673.7 696.9 673.7 Derivative liabilities (ii) Level 2 399.0 402.3 399.0 402.3
(i) These financial assets and liabilities are not subject to interest rate risk and the fair value approximates carrying amount.(ii) These financial assets and liabilities are subject to interest rate and market risks, the basis of determining the fair value is set out in the fair value hierarchy below.(iii) Loss allowance for trade and other receivables amounted to $25.9 million as at 31 December 2018. This includes $7.4 million of opening balance adjustment from
the adoption of AASB 9 effective 1 January 2018 and $0.1 million increase in loss allowance recognised in the income statement during the period.
Determination of fair valueThe Group uses the following hierarchy for determining and disclosing the fair value of a financial instrument. The valuation techniques comprise:
Level 1: the fair value is calculated using quoted (unadjusted) prices in active markets for identical assets or liabilities.
Level 2: the fair value is estimated using inputs other than quoted prices that are observable, either directly (as prices) or indirectly (derived from prices).
Level 3: the fair value is estimated using inputs that are not based on observable market data.
In assessing the fair value of the Group’s financial instruments, consideration is given to available market data and if the market for a financial instrument changes then the valuation technique applied will change accordingly.
During the year, there were no transfers between Level 1, Level 2 and Level 3 fair value measurements.
Property linked notes (i)
31 Dec 18$million
Property linked notes (i)
31 Dec 17$million
Level 3 fair value movementBalance at the beginning of the year 673.7 1,012.5 Repayment of other financial liabilities – (416.6)Net fair value loss included in financing costs in the income statement 23.2 77.8 Balance at the end of the year 696.9 673.7
(i) The fair value of the property linked notes has been determined by reference to the fair value of the relevant Westfield shopping centres (refer to Note 16).
Investment properties are considered Level 3, refer to Note 3: Investment Properties and Note 4: Details of shopping centre investments for relevant fair value disclosures.

SCENTRE GROUP ANNUAL FINANCIAL REPORT 2018 // PAGE 65
NOTE 29 OTHER SIGNIFICANT ACCOUNTING POLICIES(a) Consolidation and classificationThis consolidated financial report comprises the financial statements and notes to the financial statements of the Parent Company, and each of its controlled entities which includes SGT1, SGT2 and SGT3 from the date the Parent Company obtained control and until such time control ceased. The Parent Company and Subsidiaries are collectively referred to as the economic entity known as the Group. Where entities adopt accounting policies which differ from those of the Parent Company, adjustments have been made so as to achieve consistency within the Group.
In preparing the consolidated financial statements all inter-entity transactions and balances, including unrealised profits arising from intra-group transactions, have been eliminated in full. Unrealised losses are eliminated unless costs cannot be recovered.
i) Synchronisation of Financial YearBy an order dated 27 June 2005, made by the Australian Securities and Investments Commission (ASIC) pursuant to subsection 340(1) of the Corporations Act, the Directors of the Parent Company have been relieved from compliance with subsection 323D(3) of the Corporations Act insofar as that subsection requires them to ensure the financial year of the controlled entity Carindale Property Trust (CPT), coincides with the financial year of the Parent Company.
Notwithstanding that the financial year of CPT ends on 30 June, the consolidated financial statements have been prepared so as to include the accounts for a period coinciding with the financial year of the Parent Company being 31 December.
ii) Joint arrangementsJoint operationsThe Group has significant co-ownership interests in a number of properties through unincorporated joint ventures. These interests are held directly and jointly as tenants in common. The Group has the rights to the individual assets and obligations arising from these interests and recognises its share of the net assets, liabilities, revenues and expenses of the operation.
Joint venturesThe Group has significant co-ownership interests in a number of properties through property partnerships or trusts. These joint ventures are accounted for using the equity method of accounting.
The Group and its joint ventures use consistent accounting policies. Investments in joint ventures are carried in the consolidated balance sheet at cost plus post-acquisition changes in the Group’s share of net assets of the joint ventures. The consolidated income statement reflects the Group’s share of the results of operations of the joint ventures.
iii) Controlled entitiesWhere an entity either began or ceased to be a controlled entity during the reporting period, the results are included only from the date control commenced or up to the date control ceased. Non controlling interests are shown as a separate item in the consolidated financial statements.
(b) GoodwillGoodwill on acquisition is initially measured at cost being the excess of the cost of the business combination over the acquirer’s interest in the net fair value of the identifiable assets, liabilities and contingent liabilities. Following initial recognition, goodwill is measured at cost less any accumulated impairment losses and is not amortised.
(c) Goods and Services Tax (GST)Revenues, expenses and assets are recognised net of the amount of GST except where the GST incurred on the purchase of goods and services is not recoverable from the tax authority, in which case the GST is recognised as part of the cost of acquisition of the asset or as part of the expense item as applicable. Receivables and payables are stated with the amounts of GST included.
The net amount of GST payable or receivable to government authorities is included as part of receivables or payables on the balance sheet.
Cash flows are included in the cash flow statement on a gross basis and the GST component of cash flows arising from investing and financing activities, which is recoverable from, or payable to, the taxation authority is classified as operating cash flow.
Commitments and contingencies are disclosed net of the amount of GST recoverable from, or payable to, the taxation authority.
(d) Other financial instrumentsThe accounting policies adopted in relation to other material financial instruments are detailed as follows:
i) Trade and other receivablesTrade and other receivables are held to collect contractual cash flows and these contractual cash flows are solely payments of principal and interest. At initial recognition, these are measured at fair value.
Trade and other receivables are subsequently measured at amortised cost using the effective interest rate method, reduced by impairment losses. Interest income and impairment losses are recognised in the income statement. The receivable is written off when there is no reasonable expectation of recovering the contractual cash flows. Any gain or loss on derecognition is also recognised in the income statement.
In assessing for impairment under AASB 9, the Group assesses on a forward-looking basis the expected credit losses associated with its financial assets carried at amortised cost. For trade receivables, the Group applies the simplified approach permitted by the standard, which requires lifetime expected losses to be recognised from initial recognition of the receivables.
To measure the expected credit losses, trade debtors and other receivables have been grouped based on shared credit risk characteristics and the days past due. The expected loss rates are based on outstanding balances, days past their due date and the corresponding historical credit losses experienced. Historical loss rates are adjusted to reflect current and forward looking information on macroeconomic factors (including GDP) affecting the ability of customers to settle their debts.
In assessing for impairment in prior years prior to the adoption of AASB 9, collectability of trade and other receivables was reviewed on an ongoing basis. Individual debts that are determined to be uncollectible are written off when identified. An impairment provision for doubtful debts is recognised when there is evidence that the Group will not be able to collect the receivable.
ii) Trade and other payablesTrade and other payables are carried at amortised cost and due to their short term nature they are not discounted. They represent liabilities for goods and services provided to the Group prior to the end of the financial year that are unpaid and arise when the Group becomes obliged to make future payments in respect of the purchase of these goods and services. The amounts are unsecured and are usually paid within 60 days.
(e) Recoverable amount of assetsAt each reporting date, the Group assesses whether there is any indication that an asset may be impaired. Where an indicator of the impairment exists, the Group makes an estimate of recoverable amount. Where the carrying amount of an asset exceeds its recoverable amount, the asset is considered impaired and is written down to its recoverable amount.

Notes to the Financial StatementsFOR THE YEAR ENDED 31 DECEMBER 2018
PAGE 66
Note
Numberof rights
31 Dec 18
Numberof rights
31 Dec 17
NOTE 30 SHARE BASED PAYMENTS
(a) Rights over Scentre Group stapled securities (i)
– Performance rights – STAR 30(b)(i) 3,638,973 4,289,143 – Performance rights – LTAR 30(b)(ii) 7,334,982 6,662,710
10,973,955 10,951,853
(i) The exercise price for these rights is nil.
(b) Equity settled share based payments(i) Performance rights – STAR – Equity settled over Scentre Group stapled securities (Performance rights – STAR)
Numberof rights
31 Dec 18
Numberof rights
31 Dec 17
Movement in Performance rights – STARBalance at the beginning of the year 4,289,143 4,769,399 Rights issued during the year 1,971,912 2,030,484 Rights exercised during the year (2,110,228) (2,325,919)Rights forfeited during the year (511,854) (184,821)Balance at the end of the year 3,638,973 4,289,143
Vesting profile
Fair value granted$million
31 Dec 18
Number ofrights at (i)
31 Dec 18
Fair value granted$million
31 Dec 17
Number ofrights at (i)
31 Dec 17
2018 – – 7.5 2,302,179 2019 6.7 1,790,086 7.4 1,986,964 2020 6.8 1,848,887 – –
13.5 3,638,973 14.9 4,289,143
(i) The exercise price for these rights is nil.
Accounting PoliciesPerformance rights – STARThe Performance rights – STAR is a plan in which senior executives and high performing employees participate. The fair value of the rights issued is measured at each grant date using a Black Scholes option pricing model. The inputs include the Group’s 10 day volume weighted average security price prior to the grant date, the risk free interest rate, expected volatility and expected dividend yield during the vesting period. Expected volatility is based on the historical security price volatility over the past 3 years. Executives are not able to call for early exercise of the rights, however there are provisions in the plan to allow for early vesting at the discretion of the Board. Vesting conditions such as the number of employees remaining in service is taken into account in determining the total amortisation for each reporting period. The terms of the Performance rights – STAR are described in section 8.7 of the Directors’ Report.
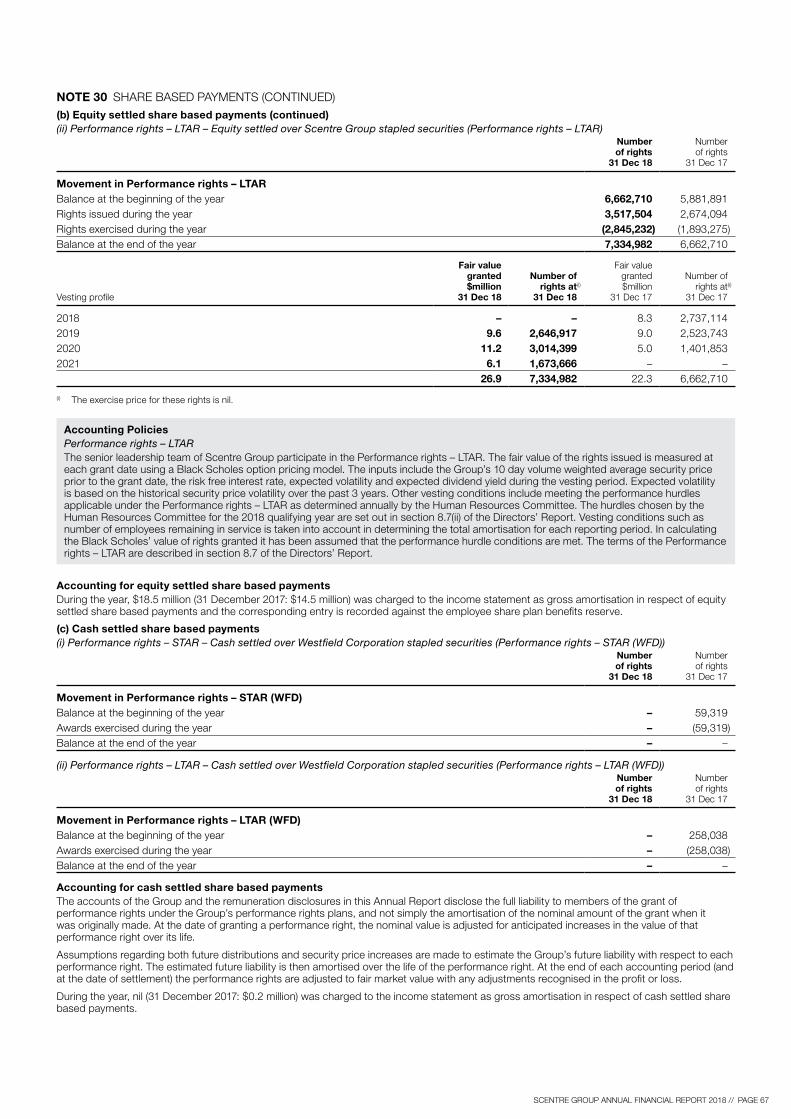
SCENTRE GROUP ANNUAL FINANCIAL REPORT 2018 // PAGE 67
NOTE 30 SHARE BASED PAYMENTS (CONTINUED)(b) Equity settled share based payments (continued)(ii) Performance rights – LTAR – Equity settled over Scentre Group stapled securities (Performance rights – LTAR)
Numberof rights
31 Dec 18
Numberof rights
31 Dec 17
Movement in Performance rights – LTARBalance at the beginning of the year 6,662,710 5,881,891 Rights issued during the year 3,517,504 2,674,094 Rights exercised during the year (2,845,232) (1,893,275)Balance at the end of the year 7,334,982 6,662,710
Vesting profile
Fair value granted$million
31 Dec 18
Number ofrights at (i)
31 Dec 18
Fair value granted$million
31 Dec 17
Number ofrights at (i)
31 Dec 17
2018 – – 8.3 2,737,114 2019 9.6 2,646,917 9.0 2,523,743 2020 11.2 3,014,399 5.0 1,401,853 2021 6.1 1,673,666 – –
26.9 7,334,982 22.3 6,662,710
(i) The exercise price for these rights is nil.
Accounting PoliciesPerformance rights – LTARThe senior leadership team of Scentre Group participate in the Performance rights – LTAR. The fair value of the rights issued is measured at each grant date using a Black Scholes option pricing model. The inputs include the Group’s 10 day volume weighted average security price prior to the grant date, the risk free interest rate, expected volatility and expected dividend yield during the vesting period. Expected volatility is based on the historical security price volatility over the past 3 years. Other vesting conditions include meeting the performance hurdles applicable under the Performance rights – LTAR as determined annually by the Human Resources Committee. The hurdles chosen by the Human Resources Committee for the 2018 qualifying year are set out in section 8.7(ii) of the Directors’ Report. Vesting conditions such as number of employees remaining in service is taken into account in determining the total amortisation for each reporting period. In calculating the Black Scholes’ value of rights granted it has been assumed that the performance hurdle conditions are met. The terms of the Performance rights – LTAR are described in section 8.7 of the Directors’ Report.
Accounting for equity settled share based paymentsDuring the year, $18.5 million (31 December 2017: $14.5 million) was charged to the income statement as gross amortisation in respect of equity settled share based payments and the corresponding entry is recorded against the employee share plan benefits reserve.
(c) Cash settled share based payments(i) Performance rights – STAR – Cash settled over Westfield Corporation stapled securities (Performance rights – STAR (WFD))
Numberof rights
31 Dec 18
Numberof rights
31 Dec 17
Movement in Performance rights – STAR (WFD)Balance at the beginning of the year – 59,319 Awards exercised during the year – (59,319)Balance at the end of the year – –
(ii) Performance rights – LTAR – Cash settled over Westfield Corporation stapled securities (Performance rights – LTAR (WFD))Numberof rights
31 Dec 18
Numberof rights
31 Dec 17
Movement in Performance rights – LTAR (WFD)Balance at the beginning of the year – 258,038 Awards exercised during the year – (258,038)Balance at the end of the year – –
Accounting for cash settled share based paymentsThe accounts of the Group and the remuneration disclosures in this Annual Report disclose the full liability to members of the grant of performance rights under the Group’s performance rights plans, and not simply the amortisation of the nominal amount of the grant when it was originally made. At the date of granting a performance right, the nominal value is adjusted for anticipated increases in the value of that performance right over its life.
Assumptions regarding both future distributions and security price increases are made to estimate the Group’s future liability with respect to each performance right. The estimated future liability is then amortised over the life of the performance right. At the end of each accounting period (and at the date of settlement) the performance rights are adjusted to fair market value with any adjustments recognised in the profit or loss.
During the year, nil (31 December 2017: $0.2 million) was charged to the income statement as gross amortisation in respect of cash settled share based payments.

Notes to the Financial StatementsFOR THE YEAR ENDED 31 DECEMBER 2018
PAGE 68
31 Dec 18$million
31 Dec 17$million
NOTE 31 LEASE COMMITMENTS
Operating lease receivablesThe following is prepared on a proportionate basis which includes both consolidated and equity accounted lease commitments.
Substantially all of the property owned and leased by the Group is leased to third party retailers. Lease terms vary between retailers and some leases include percentage rental payments based on sales revenue.
Future minimum rental revenues under non cancellable operating property leases:Due within one year 1,635.2 1,535.2Due between one and five years 4,088.9 3,899.3Due after five years 2,135.1 2,100.2
7,859.2 7,534.7
These amounts do not include percentage rentals which may become receivable under certain leases on the basis of retailer sales in excess of stipulated minimums and do not include recovery of outgoings.
31 Dec 18$million
31 Dec 17$million
NOTE 32 CAPITAL EXPENDITURE COMMITMENTS
The following is prepared on a proportionate basis which includes both consolidated and equity accounted capital expenditure commitments.
Estimated capital expenditure committed at balance date but not provided for in relation to development projects:Due within one year 223.4 547.4 Due between one and five years 17.0 374.4
240.4 921.8
NOTE 33 CONTINGENT LIABILITIES
The following is prepared on a proportionate basis which includes both consolidated and equity accounted contingent liabilities.
Performance guarantees 79.9 91.1 79.9 91.1
Entities of Scentre Group have provided guarantees in respect of certain Westfield Corporation Limited joint venture operations in the United Kingdom. Under the Restructure and Merger Implementation Deed, the entities of Scentre Group and Westfield Corporation have cross indemnified each other for any claims that may be made or payment that may be required under such guarantees. On 7 June 2018, Unibail-Rodamco-Westfield acquired the entities of Westfield Corporation, including Westfield Corporation Limited.
The Group’s obligation in respect of performance guarantees may be called on at anytime dependant upon the performance or non performance of certain third parties.
From time to time, in the normal course of business, the Group is involved in lawsuits. The Directors believe that the ultimate outcome of such pending litigation will not materially affect the results of operations or the financial position of the Group.

SCENTRE GROUP ANNUAL FINANCIAL REPORT 2018 // PAGE 69
31 Dec 18$million
31 Dec 17$million
NOTE 34 PARENT COMPANY
The Parent Company financial information is presented in accordance with the amendments to the Corporations Regulations 2001 and the Corporations Amendment Regulations 2010 (No. 6). Summary data of the Parent Company is disclosed as follows:
(a) AssetsCurrent assets 977.5 978.5Non current assets 4,808.2 4,762.3 Total assets 5,785.7 5,740.8
(b) LiabilitiesCurrent liabilities 1,663.5 1,680.1Non current liabilities 55.0 54.8 Total liabilities 1,718.5 1,734.9
(c) EquityContributed equity 370.0 371.1 Employee share plan benefits reserve 3.0 3.0 Asset revaluation reserve 3,587.6 3,542.7 Reserves (i) 157.6 140.1 Retained profits (51.0) (51.0)Total equity 4,067.2 4,005.9
(d) Comprehensive incomeProfit after tax for the period 142.6 108.3 Other comprehensive income 44.9 294.2 Total comprehensive income for the period 187.5 402.5
(e) Contingent liabilitiesGuaranteed borrowings of controlled entities (ii) 14,774.7 12,420.7 Total contingent liabilities 14,774.7 12,420.7
(i) The Directors of the Parent Company approved the transfer of $142.6 million of the Parent Company’s profit for the 2018 financial year to reserves. In 2017, the Directors of the Parent Company approved the transfer of $108.3 million of the Parent Company’s profit for the 2017 financial year to reserves.
(ii) The Parent Company has entered into guarantee arrangements with SGT1, SGT2, SGT3 and a number of associated finance subsidiaries on a joint and several basis covering the Group’s banking facilities and debt issuances. Under the arrangements, the Parent Company is guaranteed by, and is guarantor to SGT1, SGT2, SGT3 and the finance subsidiaries.
NOTE 35 SUBSIDIARIESFinancial information of SGT1 and SGT2 are provided below as they have material non controlling interests:
Scentre Group Trust 1As at 31 December 2018, SGT1 held current assets of $0.4 billion, non current assets of $20.2 billion, current liabilities of $3.0 billion and non current liabilities of $8.1 billion (31 December 2017: current assets of $1.0 billion, non current assets of $18.8 billion, current liabilities of $2.3 billion and non current liabilities of $8.6 billion).
As at 31 December 2018, the total equity held by SGT1 was $9.5 billion (31 December 2017: $8.9 billion).
The profit after tax for the period was $962.0 million and total comprehensive income was $974.0 million (31 December 2017: profit after tax for the period was $1,886.3 million and total comprehensive income was $1,870.0 million). The revenue for the period was $616.7 million (31 December 2017: $590.6 million).
Scentre Group Trust 2As at 31 December 2018, SGT2 held current assets of $0.2 billion, non current assets of $19.1 billion, current liabilities of $1.1 billion and non current liabilities of $4.6 billion (31 December 2017: current assets of $0.1 billion, non current assets of $17.3 billion, current liabilities of $2.0 billion and non current liabilities of $2.2 billion).
As at 31 December 2018, the total equity held by SGT2 was $13.6 billion (31 December 2017: $13.2 billion).
The profit after tax for the period was $1,129.6 million and total comprehensive income was $1,141.6 million (31 December 2017: profit after tax for the period was $2,205.1 million and total comprehensive income was $2,189.6 million). The revenue for the period was $580.0 million (31 December 2017: $543.2 million).

Notes to the Financial StatementsFOR THE YEAR ENDED 31 DECEMBER 2018
PAGE 70
31 Dec 18$000
31 Dec 17$000
NOTE 36 AUDITOR’S REMUNERATION
Amounts received or due and receivable by the auditor of the Parent Company and any other entity in the Group for:– Audit or review of the financial reports 2,935 3,035– Assurance and compliance services 920 662– Technical accounting advice and services (i) 30 270
3,885 3,967
Amounts received or due and receivable by affiliates of the auditor of the Parent Company for:– Audit or review of the financial reports 260 288 – Assurance and compliance services – 8
260 296 4,145 4,263
(i) These amounts represent non-audit services provided by the auditor.
NOTE 37 SUPERANNUATION COMMITMENTSThe Group sponsors accumulation style superannuation funds to provide retirement benefits to its employees. There are no unfunded liabilities in respect of these superannuation funds and plans. The Group does not sponsor defined benefits style superannuation funds and plans.
NOTE 38 RELATED PARTY DISCLOSURESInformation required to be disclosed concerning relationships, transactions and balances with related parties of the Group is set out in this Note unless disclosed elsewhere in this financial report.
Nature of relationship with related partiesKey Management Personnel of the entityRefer to Note 39 and the Remuneration Report in the Directors’ Report for details of Key Management Personnel.
Other Related PartiesLFG Services Pty Limited and The Lowy Institute for International Policy (LFG), their related entities and other entities controlled by members of the Lowy family are considered to be related parties of the Group. This is due to LFG being under the control or significant influence of Mr Steven Lowy, a non-executive Director of the Group.
Transactions and their terms and conditions with related partiesTransactions with Key Management Personnel of the entityRefer to Note 39 and the Remuneration Report in the Directors’ Report for remuneration of Key Management Personnel.
Transactions with Other Related PartiesThe Group has an agreement with LFG to provide office space and other services. The Group charged LFG $3,180,208 (31 December 2017: $2,001,870) for the lease of office space and other services on commercial arm’s length terms.
There were no amounts payable to or receivable from LFG as at 31 December 2018 (31 December 2017: nil).
No provision for doubtful debts has been recognised or bad debts incurred with respect to amounts payable or receivable from LFG for the year ended 31 December 2018 (31 December 2017: nil).
The Group has established protocols governing transactions with related parties which are monitored and reviewed by the Audit and Risk Committee.
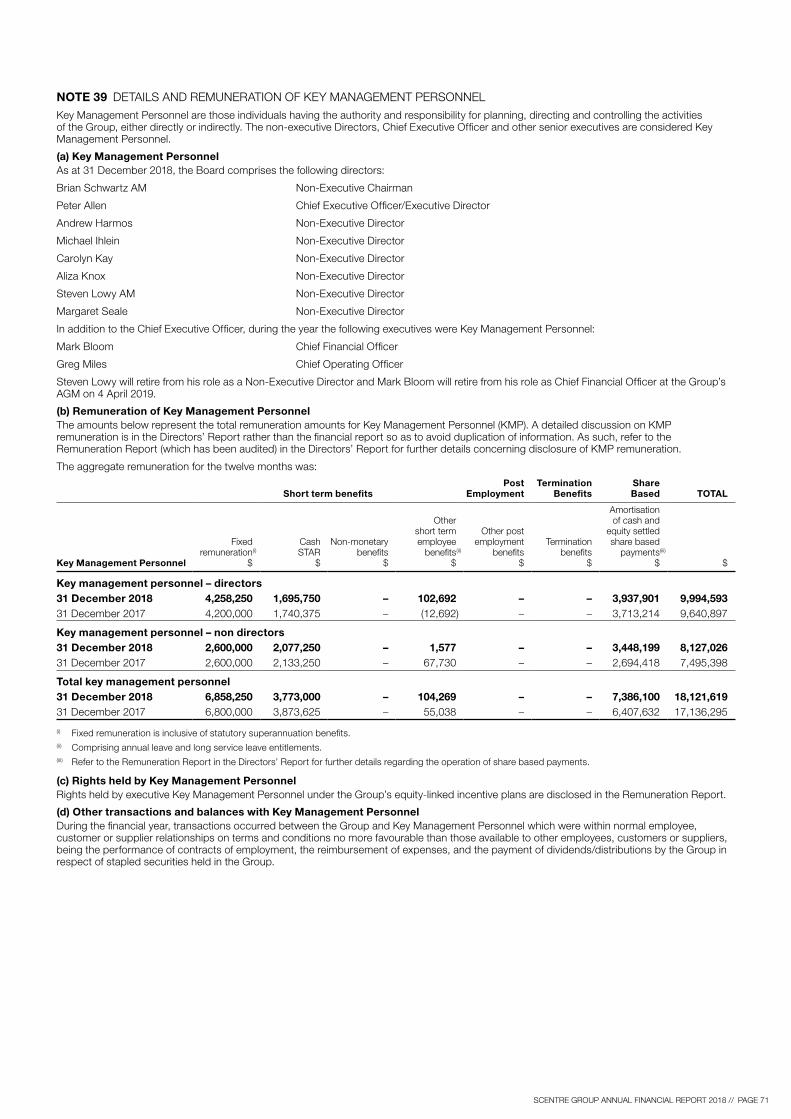
SCENTRE GROUP ANNUAL FINANCIAL REPORT 2018 // PAGE 71
NOTE 39 DETAILS AND REMUNERATION OF KEY MANAGEMENT PERSONNELKey Management Personnel are those individuals having the authority and responsibility for planning, directing and controlling the activities of the Group, either directly or indirectly. The non-executive Directors, Chief Executive Officer and other senior executives are considered Key Management Personnel.
(a) Key Management PersonnelAs at 31 December 2018, the Board comprises the following directors:
Brian Schwartz AM Non-Executive Chairman
Peter Allen Chief Executive Officer/Executive Director
Andrew Harmos Non-Executive Director
Michael Ihlein Non-Executive Director
Carolyn Kay Non-Executive Director
Aliza Knox Non-Executive Director
Steven Lowy AM Non-Executive Director
Margaret Seale Non-Executive Director
In addition to the Chief Executive Officer, during the year the following executives were Key Management Personnel:
Mark Bloom Chief Financial Officer
Greg Miles Chief Operating Officer
Steven Lowy will retire from his role as a Non-Executive Director and Mark Bloom will retire from his role as Chief Financial Officer at the Group’s AGM on 4 April 2019.
(b) Remuneration of Key Management PersonnelThe amounts below represent the total remuneration amounts for Key Management Personnel (KMP). A detailed discussion on KMP remuneration is in the Directors’ Report rather than the financial report so as to avoid duplication of information. As such, refer to the Remuneration Report (which has been audited) in the Directors’ Report for further details concerning disclosure of KMP remuneration.
The aggregate remuneration for the twelve months was:
Short term benefitsPost
EmploymentTermination
BenefitsShareBased TOTAL
Key Management Personnel
Fixedremuneration (i)
$
CashSTAR
$
Non-monetarybenefits
$
Othershort termemployee
benefits (ii)
$
Other postemployment
benefits $
Termination benefits
$
Amortisationof cash and
equity settledshare based
payments (iii)
$ $
Key management personnel – directors31 December 2018 4,258,250 1,695,750 – 102,692 – – 3,937,901 9,994,593 31 December 2017 4,200,000 1,740,375 – (12,692) – – 3,713,214 9,640,897
Key management personnel – non directors31 December 2018 2,600,000 2,077,250 – 1,577 – – 3,448,199 8,127,026 31 December 2017 2,600,000 2,133,250 – 67,730 – – 2,694,418 7,495,398
Total key management personnel31 December 2018 6,858,250 3,773,000 – 104,269 – – 7,386,100 18,121,619 31 December 2017 6,800,000 3,873,625 – 55,038 – – 6,407,632 17,136,295
(i) Fixed remuneration is inclusive of statutory superannuation benefits.(ii) Comprising annual leave and long service leave entitlements.(iii) Refer to the Remuneration Report in the Directors’ Report for further details regarding the operation of share based payments.
(c) Rights held by Key Management PersonnelRights held by executive Key Management Personnel under the Group’s equity-linked incentive plans are disclosed in the Remuneration Report.
(d) Other transactions and balances with Key Management PersonnelDuring the financial year, transactions occurred between the Group and Key Management Personnel which were within normal employee, customer or supplier relationships on terms and conditions no more favourable than those available to other employees, customers or suppliers, being the performance of contracts of employment, the reimbursement of expenses, and the payment of dividends/distributions by the Group in respect of stapled securities held in the Group.

Notes to the Financial StatementsFOR THE YEAR ENDED 31 DECEMBER 2018
PAGE 72
NOTE 40 DETAILS OF MATERIAL AND SIGNIFICANT ENTITIES31 Dec 18 – Interest 31 Dec 17 – Interest
Name of entity
Beneficial (i) Consolidatedor Equity
accounted %
Beneficial (i) Consolidated or Equity
accounted %
ParentCompany
%
Scentre Group
%
ParentCompany
%
Scentre Group
%
ENTITIES INCORPORATED IN AUSTRALIAParent Company Scentre Group Limited 100.0 100.0 100.0 100.0 100.0 100.0 Consolidated Controlled Entities Scentre Group Trust 1 – 100.0 100.0 – 100.0 100.0 Scentre Group Trust 2 – 100.0 100.0 – 100.0 100.0 Scentre Group Trust 3 – 100.0 100.0 – 100.0 100.0 Scentre Finance (Aust) Limited 100.0 100.0 100.0 100.0 100.0 100.0 Scentre Limited 100.0 100.0 100.0 100.0 100.0 100.0
ENTITIES INCORPORATED IN NEW ZEALANDConsolidated Controlled Entities RE (NZ) Finance Limited – 100.0 100.0 – 100.0 100.0 RE (NZ) Finance No. 2 Limited – 100.0 100.0 – 100.0 100.0 Scentre NZ Holdings Limited – 100.0 100.0 – 100.0 100.0 SCG1 Finance (NZ) Limited – 100.0 100.0 – 100.0 100.0 SCG1 Finance (NZ) No. 2 Limited – 100.0 100.0 – 100.0 100.0
(i) Beneficial interest in underlying controlled and equity accounted entities reflects the Parent Company being Scentre Group Limited and its subsidiaries (excluding SGT1, SGT2 and SGT3) and Scentre Group’s ownership interest as determined under International Financial Reporting Standards (IFRS).

SCENTRE GROUP ANNUAL FINANCIAL REPORT 2018 // PAGE 73
Directors’ Declaration
The Directors of Scentre Group Limited (Company) declare that:
(a) in the Directors’ opinion, there are reasonable grounds to believe that the Company will be able to pay its debts as and when they become due and payable;
(b) in the Directors’ opinion, the Financial Statements and notes thereto are in accordance with the Corporations Act 2001, including:
(i) complying with accounting standards and regulations in accordance with section 296 of the Corporations Act 2001;
(ii) giving a true and fair view of the financial position as at 31 December 2018 and the performance of the consolidated entity for the year ended on that date in accordance with section 297 of the Corporations Act 2001;
(iii) the International Financial Reporting Standards issued by the International Accounting Standards Board; and
(c) they have been provided with the declarations required by section 295A of the Corporations Act 2001.
Made on 20 February 2019 in accordance with a resolution of the Board of Directors.
Brian Schwartz AM Michael Ihlein Chairman Director
20 February 2019
FOR THE YEAR ENDED 31 DECEMBER 2018

PAGE 74
IntroductionScentre Group (i) is committed to ensuring that its policies and practices reflect a high standard of corporate governance. During 2018, the Group’s corporate governance framework remained consistent with the ASX Corporate Governance Council’s Corporate Governance Principles and Recommendations (published in 2014) (Principles and Recommendations).
Our governance framework is outlined in the diagram below. Our corporate governance documentation, including this statement and the charters and policies referred to in it, are available in the corporate governance section on our website www.scentregroup.com/About-Us/Corporate-Governance. This corporate governance statement was approved by the Scentre Group Board and is current as at 20 February 2019.
GOVERNANCE FRAMEWORK
Board Committees
Key Management Committees
Board of DirectorsChief Executive Officer
NominationCommittee
Executive Risk Management Committee Executive Committee Treasury Finance
Committee
Human ResourcesCommittee
Delegation
Audit and RiskCommittee
Delegated authority
The Board comprises seven non-executive Directors and one executive Director (being the Chief Executive Officer (CEO)/Managing Director). The period of office (ii) held by, and the independence status of, each Director is set out below.
Name Position Held Last elected or re-elected at an AGMIndependent
(Y/N)
Brian Schwartz Non-Executive Chairman 5 May 2016: Standing for re-election at 2019 AGM YPeter Allen CEO/Executive Director N/A NAndrew Harmos Non-Executive Director 5 April 2017 YMichael Ihlein Non-Executive Director 5 May 2016: Standing for re-election at 2019 AGM YCarolyn Kay Non-Executive Director 5 April 2018 YAliza Knox Non-Executive Director 5 April 2017 YSteven Lowy Non-Executive Director 5 May 2016: Retiring at the end of the 2019 AGM NMargaret Seale Non-Executive Director 5 April 2018 Y
Our governance practices, as against the 8 central principles of the Principles and Recommendations, are outlined below.
Corporate Governance Statement
(i) Scentre Group is a stapled entity comprising Scentre Group Limited, Scentre Group Trust 1, Scentre Group Trust 2 and Scentre Group Trust 3. The Boards of Scentre Group Limited, Scentre Management Limited (as responsible entity of Scentre Group Trust 1), RE1 Limited (as responsible entity of Scentre Group Trust 2) and RE2 Limited (as responsible entity of Scentre Group Trust 3) are identical. Each Board has adopted a common Board Charter which sets out the objectives and responsibilities of the Scentre Group Board. Each Board Committee operates as one “Scentre Group” Committee.
(ii) Scentre Group was established on 30 June 2014. Prior to that date, Scentre Group Limited and Scentre Management Limited formed part of the prior Westfield Group and the appointment dates of Mr Schwartz (6 May 2009), Mr Allen (25 May 2011) and Mr Lowy (28 June 1989) pre-date the establishment of Scentre Group. Mr Harmos and Mr Ihlein were both appointed to Scentre Group Limited and Scentre Management Limited on 30 June 2014 (the appointment date to RE1 Limited and RE2 Limited, which formed part of the prior Westfield Retail Trust, was 21 December 2010). Ms Knox was appointed to each board on 7 May 2015 and Ms Kay and Ms Seale on 24 February 2016.

SCENTRE GROUP ANNUAL FINANCIAL REPORT 2018 // PAGE 75
PRINCIPLE 1: LAY SOLID FOUNDATIONS FOR MANAGEMENT AND OVERSIGHT1.1 Responsibilities of Board and managementThe Board is responsible for overseeing the effective management and operation of the Group. The Board seeks to ensure that the business objectives of the Group are aligned with the expectations of securityholders and that the operations of the Group are effectively managed in a manner that is focused on those business objectives, as well as meeting all regulatory and ethical requirements.
The number of, and attendance at, Board and Committee meetings during the year is set out in the Directors’ Report.
Board CharterThe Board Charter sets out the primary objectives of the Board and the practices and processes the Board has adopted to discharge its responsibilities including the matters reserved for the Board and the delegation of authority to the CEO and other senior executives, including the limits on the execution of that authority by those officers.
This framework ensures accountability and a balance of authority by clearly defining the respective roles and responsibilities of the Board and the senior executive team. In turn, this enables the Board to maintain its focus on strategic guidance while exercising effective oversight of the Group.
Key responsibilities of the Board are to:
– define the Group’s purpose and setting the strategic objectives of the Group;
– instil the Group’s culture and values;
– approve and monitor key budgets, business plans, financial statements, financial policies and financial reporting;
– establish, promote and maintain proper processes and controls and to maintain the integrity of financial accounting, financial records and reporting;
– develop and implement key corporate policies, procedures and controls as necessary to ensure appropriate standards of accountability, risk management and corporate governance and responsibility;
– oversee the adequacy of managerial resources to ensure there is adequate depth of resources and appropriate succession planning;
– monitor the performance of senior executives and the implementation of strategy;
– approve proposals for major new investments, capital expenditure and capital management initiatives as proposed by management;
– ensure that securityholders receive high quality, relevant and accurate information in a timely manner and that investors generally are able to trade in Scentre Group’s securities in a market which is efficient, competitive and informed;
– determine and adopt distribution policies; and
– oversee compliance with our legal and regulatory obligations.
Board CommitteesThe Board delegates certain responsibilities to standing Committees which operate in accordance with charters approved by the Board. There are three standing Board Committees: the Audit and Risk Committee, the Human Resources Committee and the Nomination Committee.
Membership and the number of, and attendance at, Committee meetings during the year is set out in the Directors’ Report. All Directors have a standing invitation to attend meetings of the Audit and Risk Committee and Human Resources Committee.
The roles and responsibilities of the Committees are outlined in this statement.
The Chair of each Committee reports to the Board at the Board’s next meeting on any matters arising from the Committee’s duties and responsibilities. The Board also receives copies of the minutes of all Committee meetings. This ensures that all Directors have oversight of, as well as the opportunity to discuss matters being considered by, the Committees.
Delegation to ManagementDay to day management of the Group’s business and operations is delegated by the Board to management through the CEO and is subject to the agreed authority limits applicable to the senior executive team.
The CEO is assisted by the Chief Financial Officer (CFO) and Chief Operating Officer (COO) and other members of the Executive Committee.
The CEO together with the Executive Committee is responsible to the Board for the development and implementation of strategy and the overall management and performance of the Group.
The CEO reports regularly to the Board on the progress being made by the Group in all aspects of the business including customer experience, retail partnerships, developments, capital markets and potential new business opportunities.
The CFO also provides comprehensive reports on the Group’s financial performance and other relevant matters such as the Group’s gearing and liquidity.
1.2 New appointments/Re-election of DirectorsAppropriate checks are undertaken before a new candidate is recommended to the Board for appointment. These include checks as to the candidate’s experience, educational qualifications, character, criminal record and bankruptcy history which are carried out by an external consultant.
As noted at 2.1 ‘Structure of the Board and role of the Nomination Committee’, the Board, on the recommendation of the Nomination Committee, determines if it will endorse a Director retiring under the Company’s constitution or Listing Rules for re-election.
1.3 Written agreements with DirectorsNew Directors receive a letter of appointment which sets out the key terms and conditions of their appointment.
The letter of appointment clearly defines the role of Directors, including expectations in terms of independence, participation, time commitment and continuous development. Directors are required to disclose, on an ongoing basis, circumstances that may affect, or be perceived to affect, their ability to exercise independent judgment so that the Board can determine independence on a regular basis. The letter also provides that if a Director ceases to be a Director of Scentre Group Limited for any reason, they must also resign as a Director of Scentre Management Limited, RE1 Limited and RE2 Limited.
Procedures are also set out by which Directors are able to take independent, professional advice at the Group’s expense. Directors are encouraged to direct any enquiries or requests for additional information to the Company Secretary, who will facilitate a response to the query and/or provide the Director with the requested information. Directors also have access to key members of the senior executive team, who regularly attend Board meetings to make presentations.
1.4 Role of the Company SecretaryThe Company Secretary is directly accountable to the Board, through the Chairman, on all matters relating to the proper functioning of the Board and its Committees. The Company Secretary works with the Chairman, the Board and the Board Committees and is responsible for ensuring the smooth running of the Board and Board Committees and that all governance matters are properly addressed. All Directors have access to the Company Secretary for the purpose of obtaining information or advice.
1.5 DiversityThe Board is committed to ensuring that it continues to include directors with an appropriate mix of skills, knowledge, experience and diversity, including gender, and diversity of thought and approach. The Board currently comprises eight Directors, seven of whom are non-executive Directors. In terms of gender representation, we currently have three women on our Board representing 38%, which exceeds the 30% Club’s target of 30% female representation on a board.
Our aspiration is to create a workforce reflective of the communities in which we operate and key to this is our diversity and inclusion strategy. We believe that a diverse and engaged workforce contributes to strong business performance and we seek to provide an inclusive and supportive working environment that recognises and leverages all the ways we are different. Our commitment is to a workplace where everyone is comfortable to “bring their whole self to work”.
We continue to embed our diversity and inclusion initiatives and empower our people to own and drive our diversity and inclusion strategy. During the year we also sought to expand the impact of our diversity and inclusion strategy by engaging with our business partners and providers to align them with our strategy and our diversity and inclusion initiatives.
We continue with our strong support for gender equality and a culture which supports all employees at all stages of their careers and have maintained recognition as an Employer of Choice for Gender Equality

Corporate Governance Statement (continued)
PAGE 76
by the Workplace Gender Equality Agency (WGEA). In terms of our workforce, during the year 43% of new hires were females and 65% of promotions across the business were females.
We also saw the average tenure for females grow at a greater rate than males. Since 2015, the average tenure for females has increased from 5.4 years to 6.1 years (males 6.1 years to 6.4 years). In short, we are recruiting more women than are leaving the business and are retaining women for longer.
At the Executive Committee level, there were 2 new appointments of senior females with the percentage of females across all levels of management (at 31 December 2018) being 41% (2017: 41%). During the year, we achieved 26.5% representation of females at the senior executive level (General Manager and above), up from 22% and at the upper range of our 2018 target of 25 – 27%.
We are also pleased that our CSO, Cynthia Whelan, has recently been appointed as our first female executive KMP.
Across our workforce at 31 December 2018, the representation of men and women was 46% and 54% respectively.
Increasing gender diversity at the senior executive level remains a KPI for our CEO, Peter Allen, with a target of 30% by 2021. Peter is also continuing in his role as a WGEA Pay Equity Ambassador and as a Property Male Champion of Change.
We have a number of executive working groups (including in relation to gender equality) to assist in making recommendations, developing and implementing diversity and inclusion initiatives within the areas of their particular focus. Underpinning the purpose of each group is inclusion and respecting and supporting diversity. Each Group is sponsored by a senior executive and overseen by our Diversity and Inclusion Council.
The purpose and key achievements of the working groups are outlined below.
Diversity and Inclusion Council
What we achieved in 2018
Executive SponsorsKPIs in performance and reward scorecards in relation to D&I initiatives
D&I Champions of Change
Gender CulturalCapability
ReconciliationAction Plan LGBTI Mental Health
and WellnessDomestic and
Family Violence All Abilities
Gender– This group continues to provide support for increased representation of females in executive
and leadership roles– During the year, we participated in the Property Council of Australia’s (PCA) Women in Leadership
program (3 mentors and 3 mentees)– We celebrated the outstanding achievements of women in our business as part of International
Women’s Day’s #PressforProgress– As part of the PCA’s Girls in Property week, we hosted 250 Year 10 girls to raise awareness
about careers in the property industry– We showcased Westfield Sydney to the Catholic Teachers’ Association to show opportunities
for students, particularly girls, in our casual recruitment program– We formalised twice-yearly pay equity reviews to ensure equitable allocation of salary and
bonuses across genders
Cultural capability– Established during the year, this
group focuses on ways we can create a workforce reflective of the cultural diversity of our communities
– We continued to acknowledge and celebrate Harmony Day
– Cultural events of significance activated in our centres included Matariki in New Zealand, Lunar New Year, Diwali, Ramadan and Eid Al Fitr
Mental Health and Wellness– The goal of the working group is to support
our people to have balanced lives and healthy minds
– We continued to campaign for awareness of mental health to de-stigmatise discussion of mental health
– We recognise and promoted ‘R U OK’ day – Our employees were encouraged to
participate in the ‘R U OK’ Holidays Helpers campaign during the Christmas Period
Domestic and Family Violence– The objectives of this group include raising
awareness, removing stigma and developing support mechanisms
– We completed our first White Ribbon accreditation survey, and, in November, our centres and employees supported White Ribbon Day to help raise awareness to stop violence against women
– We conducted a month long internal communications campaign centred on awareness and prevention of domestic and family violence
All Abilities– We established our All
Abilities Working Group to explore ways to identify and remove barriers to the inclusion and advancement of people of all abilities
Reconciliation Action Plan (RAP)– The purpose of our RAP working group is to explore ways to increase participation
of Aboriginal and Torres Strait Islander people in our workforce– We placed 8 trainees in our Indigenous employment program as part of our ongoing
relationships with Aboriginal Employment Strategy and AFL Sports Ready– Our centre activations as part of the “Because of Her, We Can” theme for NAIDOC
week were held nationwide. We were selected by Reconciliation Australia to be one of 5 out of 1,000+ organisations to showcase our RAP actions which we believed best exemplified the 3 pillars of “Relationship, Respect and Opportunities”
– As part of our RAP we registered with Supply Nation, a portal for indigenously owned service providers
LGBTI– The goal of our LGBTI working group is to
ensure people from the LGBTI community feel comfortable and safe to be themselves at work at all times
– During the year, we achieved bronze status at the Australian Workplace Equality Index awards
– We celebrated IDAHOBIT Day and Wear It Purple Day to further embed inclusion for employees from our LGBTI community
– We increased the number of LGBTI Allies during the year from 174 to 323
Underpinning our commitment to diversity and inclusion are our awareness and education initiatives
Awareness and education initiatives

SCENTRE GROUP ANNUAL FINANCIAL REPORT 2018 // PAGE 77
We continued to roll out our Inclusive Management Program (IMP), to provide our managers with skills to hold inclusive conversations with their people at key times across the employment cycle.
We launched an IMP Alumni program with a focus on diversity of thought, unconscious bias, psychological safety and embedding inclusion.
Our Champions of Change continue to support and disseminate our diversity and inclusion initiatives across the business.
1.6 Board self-assessment and performanceThe Board undertakes an annual assessment and review of its performance. As a review was facilitated by an external consultant in 2017, the 2018 review was conducted by our Chairman, Brian Schwartz, who presented the results of the review to the Board.
Overall the results of the review were positive, which follows the results from the external review. Matters considered in the Board survey included an assessment of the performance of the Board, its Committees and Directors’ individually, the composition and skills set of the Board, succession planning, the Board’s relationship with management and the type and quality of the information provided to the Board.
1.7 Process for evaluating the performance of senior executivesWe have an established process of objective setting and performance review for all employees, which is conducted on an annual basis. Senior executives have well defined objectives which are discussed and agreed at the commencement of each financial year. Each executive’s Key Performance Indicators (KPIs) are set annually with the purpose of motivating that executive to achieve performance objectives which will contribute to the short and longer term success of the Group.
KPIs are established each year under a performance and development system. KPIs are designed to measure both financial and non-financial performance and we use a balance of measures that underpin the growth and sustainability of our business. Our remuneration philosophy and link to business strategy is outlined in our Remuneration Report.
During 2018, each member of the senior executive team, including the CEO, was subject to a performance review as described above. Details of the performance criteria against which the CEO were assessed for 2018 are set out in the Remuneration Report.
Written employment agreements are in place for senior executives, further details of which are set out in the Remuneration Report.
PRINCIPLE 2: STRUCTURE THE BOARD TO ADD VALUE2.1 Structure of the Board and role of the Nomination CommitteeThe membership of the Board is reviewed by the full Board (following consultation with, and recommendations by, the Nomination Committee), having regard to the ongoing and evolving needs of our business.
Board renewal and succession planning is a central component of our overall governance program. The Board is committed to ensuring that it draws on a combination of executive and non-executive members with exceptional track records and reputations at the highest levels of business and commerce generally.
Nomination CommitteeThe role of the Nomination Committee includes supporting and making recommendations to the Board on the selection and appointment of Directors who are able to meet the needs of the Group presently and in the future. The Committee also facilitates the ongoing evaluation and review of the performance and effectiveness of the Board and the Directors.
The responsibilities of the Nomination Committee include:
– having regard to the strategic direction of the Group, assessing periodically the skills of current Board members against the collective skill set required by the Board to competently discharge the Board’s duties;
– regularly reviewing and making recommendations to the Board regarding the structure, size, diversity and composition (including the balance of skills, knowledge and experience) of the Board and reviewing the effectiveness of the Board;
– identifying suitable candidates (executive and non-executive) to fill Board vacancies as and when they arise and nominating candidates for approval of the Board;
– annually reviewing the performance of the Board; and
– ensuring the existence of proper succession planning processes and plans for the Board (including, in conjunction with the Human Resources Committee, the CEO).
No member of the Committee participates in a review of their own performance or nomination for re-election.
The Board, on the recommendation of the Nomination Committee, determines if it will endorse a Director retiring under the Company’s constitution or Listing Rules, for re-election. The notice of meeting for our AGM will provide information that is material to a decision whether or not to support the re-election of a Director.
Recommendations regarding future appointment of additional Directors are made by the Nomination Committee and considered by the Board having regard to:
– the assessment made on the skill set required to discharge the responsibilities of the Board compared with the skills currently represented on the Board;
– the current strategic direction of the Group and the consequent need to consider skills which may be required in the future; and
– the suitability of available candidates identified in the context of a detailed description of the role and capabilities required for a particular appointment.
Recommendations made by the Nomination Committee are considered by the Board, which retains an unfettered discretion on the appointment of a Director to fill a casual vacancy or act as an additional Director, prior to the formal election of that Director by the securityholders at the AGM.
The Nomination Committee may retain the services of external recruitment specialists to help identify potential candidates for appointment to the Board.
Once a candidate is identified, the Nomination Committee with the assistance of external consultants where required, conducts appropriate background and reference checks before the candidate is appointed to the Board or put forward to securityholders for election.
2.2 Board Skills MatrixThe Board is committed to ensuring that it continues to include directors who bring an appropriate mix of skills, knowledge, experience, expertise and diversity to Board decision making.
The Board currently comprises eight Directors, seven of whom are non-executive Directors. Details of the Directors’ biographies, including their qualifications, are set out in the Directors’ Report. In terms of gender representation, we currently have three women on our Board representing 38%, which exceeds the 30% Club’s target of 30% female representation on a board.
The Board, with the Nomination Committee, actively work together in assessing the ongoing succession planning and renewal program for the Board. In terms of defining the Board’s requirements for new Directors, consideration is given to the skills, experience and background of existing board members, the Group’s strategy and any identified new skills required to supplement the Board’s capabilities. Having regard to the strategic direction of the Group, the Nomination Committee also works with external advisors in assessing potential new directors and skills.

Corporate Governance Statement (continued)
PAGE 78
The Nomination Committee has actively been reviewing the need for additional property specific skills on the Board, particularly in light of Steven Lowy retiring at the AGM on 4 April 2019, and expects to make a recommendation to the Board in the near future.
The Board skills matrix set out below describes the combined skills, experience and expertise presently represented on the Board.
0 1 2 3 4 5 6 7 8
Scentre Group Board Skills MatrixSkillset
Number of Board Members
Leadership – organisational, including senior executive leadership experience
Strategy – experience in developing and implementing strategic business plans
Financial acumen – senior experience in finance, including in financial accounting and reporting
Real estate – experience in real estate management, leasing, development, design and construction
Retail and consumer marketing – experience in retail (including physical and digital) and in customer service and management strategies
Capital management – senior experience in capital management strategies, corporate finance, capital markets and funds management
Governance – experience with governance in the listed sector
Human resources – senior experience in people management and human resources policy
Innovation – experience in transforming business models and processes including in relation to technology and digital platforms
■ Primary skillset ■ Secondary skillset
2.3 Directors’ IndependenceThe Board regularly assesses the independence of each Director in accordance with the terms of the Board Charter, the interests they have disclosed and such other factors as the Board determines are appropriate to take into account.
In making this determination the Board assesses if Directors are:
– independent of management; and
– free of any interest, position or association that might influence or reasonably be perceived to influence, in a material respect, their capacity to bring an independent judgement to bear on issues before the Board.
In general, a non-executive Director will not be regarded as an independent director if that Director:
– is a substantial securityholder of Scentre Group or an officer of, or otherwise associated directly with, a substantial securityholder of Scentre Group;
– is, or within the last three years had been, employed in an executive capacity by any member of Scentre Group;
– is, or within the last three years had been, a partner or a senior management executive with audit responsibilities of a firm which has acted in the capacity of statutory auditor of any member of the Group;
– is, or within the last three years had been, a partner, director or senior employee of a material professional adviser to any member of the Group;
– is, or within the last three years had been, a principal, senior employee or associate of a material supplier to, or material customer of, any member of the Group;
– has a material contractual relationship with any member of the Group other than as a Director of the Board;
– has any interest or business or other relationship which could materially interfere with the Director’s ability to act in the best interests of the Group and independently of management;
– has close family ties with any person who falls within any of the categories described above; or
– has been a Director of Scentre Group for such a period that their independence may have been compromised.
2.4 Independent DirectorsThe following non-executive Directors are considered independent: Mr Brian Schwartz, Mr Andrew Harmos, Mr Michael Ihlein, Ms Carolyn Kay, Ms Aliza Knox and Ms Margaret Seale.
2.5 Chairperson and IndependenceThe Chairman, Mr Brian Schwartz, is an independent non-executive Director.
2.6 Induction and ongoing educationNew Directors participate in an induction program. This includes briefings with the CEO, CFO and COO and other members of the senior executive team to provide new Directors with a deeper understanding of the main issues, strategic direction and material risks of each key business unit within the Group. As part of the program, Directors are given access to the external and internal auditors. Directors are also provided with all relevant corporate governance materials and policies.
We recognise that developing industry and corporate knowledge is an ongoing process. Regular briefing sessions to the Board and Board Committees are conducted on a number of topics including:
– The Group’s core operations including trends in international and domestic retail;
– Legal and regulatory developments including health and safety laws, competition laws, corporate governance principles, tax and accounting changes; and
– Emerging and disruptive business models, technologies including cyber threats and security.
Directors are also given the opportunity for site visits to our centres to better understand our operations. During the year, the Board also visited New Zealand with senior executives to tour a number of our centres including the NZ$790 million redevelopment of Westfield Newmarket in Auckland.

SCENTRE GROUP ANNUAL FINANCIAL REPORT 2018 // PAGE 79
PRINCIPLE 3: ACT ETHICALLY AND RESPONSIBLY3.1 Codes of ConductDirectors’ Code of ConductThe Directors’ Code of Conduct outlines the responsibilities of our Directors in maintaining our commitment to high standards of ethical conduct.
As part of the Code of Conduct, Directors are required to undertake, amongst other things, to: always act fairly, honestly and with integrity in all matters relating to the Group; perform their duties to the best of their ability; never act in a manner which is likely to harm the reputation of the Group and always abide by applicable laws.
Scentre Group ValuesWe refer to our values as our “DNA” which is the cultural blueprint for our organisational behaviour. We are committed to high standards of ethical conduct and actively promote a diverse and inclusive culture where employees are encouraged to succeed to the best of their ability.
During the year we evolved our DNA to ensure that our values continue to reflect the standards to guide not only how we work together but how we engage with our stakeholders and the broader community.
Our DNA is expressed as:
– We put the customer first
– We act with integrity
– We strive for excellence
– We succeed together
– We are constantly curious
– We create a positive legacy
Employee HandbookOur core principles are supplemented by the Employee Handbook which is provided to all employees at the time of joining the Group. The handbook outlines, among other matters, the high standards of personal conduct and ethical behaviour expected of all employees. Employees are required to affirm our Code of Conduct on an annual basis.
Compliance ManualsCompliance manuals have been developed to provide guidance to employees on the laws applicable in the jurisdiction in which they work and the standards of conduct and the procedures to be adopted to comply with those laws. Management seminars are also conducted on an ongoing basis to help employees understand the legal requirements with which the Group must comply.
Whistleblower PolicyWe have a whistleblower policy to ensure that any concerns regarding unethical, unlawful or improper conduct can be raised without fear of reprisal. Employees are encouraged to report any genuine matter or behaviour that they honestly believe contravenes our code of conduct, our policies or the law. We continue to monitor proposed changes to whistleblower laws to ensure that our policies and practices continue to operate effectively.
PRINCIPLE 4: SAFEGUARD INTEGRITY IN CORPORATE REPORTING4.1 Audit and Risk CommitteeThe primary role of the Audit and Risk Committee is to oversee and monitor the integrity of consolidated financial reports and statements of the listed entities within the Group, and our systems of risk management, internal controls and legal compliance.
All members of the Committee are independent non-executive Directors, financially literate with significant relevant financial and/or accounting experience and a significant understanding of the Group’s business. Members of the Committee have a sound understanding of the Group’s structure, internal controls and typical transactions which enable them to assess the risks faced by the Group.
The objective of the Committee is to assist the Board in fulfilling its corporate governance responsibilities by:
(a) monitoring and reviewing:
– the accuracy, integrity and reliability of financial reports and statements of listed entities of the Group;
– the effectiveness of the Group’s internal control environment including the systems of internal controls, risk management and legal compliance;
– the objectivity and effectiveness of the internal audit function; and
– the independence, objectivity and effectiveness of the external audit function;
(b) overseeing the processes for:
– identifying and managing significant risks faced by the Group;
– the Group’s compliance with applicable laws and regulations; and
– implementing appropriate and adequate control, monitoring and reporting systems; and
(c) making recommendations to the Board in relation to the appointment of the external auditors and approving the remuneration and terms of their engagement.
The Committee is assisted in its role and responsibilities by the Executive Risk Management Committee, details of which are outlined below. The Committee is also assisted by the independent assurance function provided by the Business Review and Audit department (internal auditors) and our external auditors.
Assessment of material economic, environmental and social sustainability risks forms part of the Group’s Enterprise Risk Management Framework.
The Committee, on an annual basis, reviews the appropriateness of the Enterprise Risk Management Policy and the Enterprise Risk Management Framework and our control systems. The Committee undertook such a review during the year.
The Audit and Risk Committee also monitors regulatory developments in relation to the audit regime, the role of audit and risk committees generally and how such developments may impact our corporate governance.
Our external auditor is Ernst & Young. The Committee meets with the external auditor at least twice each year without management being present to review the adequacy of existing external audit arrangements and the scope of the external audit. The lead audit partner is required to rotate after 5 years.
The internal audit function is overseen by the Audit and Risk Committee. The Director, Risk and Internal Audit attends all meetings of the Audit and Risk Committee and reports on a regular basis as to the adequacy and effectiveness of the internal audit function. The Committee meets with the Director, Risk and Internal Audit at least twice a year, without management being present.
Non-Audit Services ProtocolThe Non-Audit Services Protocol is designed to ensure that the external auditor carries out the statutory audit function in a manner which is, at all times, demonstrably independent of the Group.
The Protocol sets out key requirements in the relationship between the external auditor and the Group and defines the scope and value of the non-audit services which could be provided by the external auditor, without impacting on the actual or perceived independence of the external auditor.
Executive Risk Management CommitteeRisk oversight is a key function of our Executive Committee and while that Committee continues to have oversight of business risks, during the year we enhanced our risk management processes by establishing a dedicated Executive Risk Management Committee The purpose of the Executive Risk Management Committee is to assist and support the Board and the Audit and Risk Committee in its oversight of the Group’s systems of risk management and internal control.
Membership of the Committee comprises the CEO, CFO, COO, CSO, the Director, Risk and Internal Audit, the General Counsel and the Director, Security.

Corporate Governance Statement (continued)
PAGE 80
4.2 CEO and CFO declarationsThe CEO and CFO are required to confirm in writing to the Board, at the time the financial statements of the Group are being considered for approval by the Board, that in all material respects:
– the financial statements present a true and fair view;
– that this assertion is founded on a sound system of financial risk management and internal compliance and control which implements the policies adopted by the Board; and
– that the Group’s financial risk management and internal compliance and control systems are operating efficiently and effectively in all material respects in relation to financial reporting risks.
The Board receives regular reports from management and the Audit and Risk Committee on areas where there are considered to be significant business risks and on the management of those risks. The internal audit function also monitors these risks and reports to the Audit and Risk Committee.
4.3 External auditor attendance at AGMThe lead audit partner of Ernst & Young attends our AGM and is available to answer questions on the Group’s financial statements and the conduct of the audit.
PRINCIPLE 5: MAKE TIMELY AND BALANCED DISCLOSURE5.1 Continuous Disclosure and Communications PolicyWe are committed to providing securityholders with comprehensive, timely and equal access to information about our activities to enable them to make informed investment decisions.
Our Continuous Disclosure and Communications Policy underlines our commitment to ensuring that securityholders and the market are provided with high quality, relevant and accurate information regarding its activities in a timely manner and that investors are able to trade in Scentre Group securities in a market which is efficient, competitive and informed as well as ensuring that market participants have an equal opportunity to review and assess information disclosed by the Group.
Our policy includes a vetting and authorisation process to ensure that all disclosures are factual, do not omit material matters and are expressed in a clear and objective manner. The policy also outlines how we identify and disseminate information to securityholders and the market generally.
PRINCIPLE 6: RESPECT THE RIGHTS OF SECURITYHOLDERS6.1 Corporate websiteWe monitor and continue to utilise a broad range of communication approaches including direct communications with securityholders, publication of all relevant company information in the Investor section of the scentregroup.com website, as well as access to market briefings via webcasting and teleconferencing facilities.
Our corporate website forms a key part of our communication platform to securityholders and the broader investment community. A section of this website is dedicated to securityholders. Current and past media releases, investor presentations and interim and full year financial reports are available for review on the website. These announcements, presentations and reports continue to be posted on the corporate website immediately after they have been released to the market.
The website also contains an overview of the Group, our structure and history and biographical details of our Directors.
6.2 Investor relations programWe have developed an investor engagement program for engaging with securityholders, debt investors, and broader investment community. The aim of this program is for investors and other stakeholders to understand our business, financial performance and prospects as well as our governance structure.
6.3 Annual General MeetingOur AGM represents a key opportunity for securityholders to meet the Board and ask questions of the Directors. Securityholders who are not able to attend the AGM in person may appoint proxies to represent them at the meeting. Key members of the senior executive team, including the CEO, COO and CFO, are present and available to answer questions.
The AGM is webcast live from our corporate website. Copies of the addresses delivered by the Chairman and CEO to the AGMs are released to the ASX and posted to the website. A summary of the meeting and the outcome of voting on items of business before the meeting are released to the ASX and posted to the corporate website as soon as they are available following completion of the AGM. These announcements are archived and searchable on the corporate website.
6.4 Electronic communicationsSecurityholders may elect to receive all or some of the Group’s communications, including the annual report, electronically.
Our registry provides securityholders with the option to update their details electronically via their website.
PRINCIPLE 7: RECOGNISE AND MANAGE RISKWe adopt a rigorous approach to understanding and managing our business risks at both the Board level and through our Audit and Risk Committee. There is a discussion of our approach to risk under Principle 4 and in the Directors’ Report on page 6.
PRINCIPLE 8: REMUNERATE FAIRLY AND RESPONSIBLY8.1 Human Resources CommitteeThe objective of the Committee is to assist the Board in establishing appropriate human resources strategies including remuneration policies and practices which:
– enable the Group to attract and retain executives who will create sustainable value for securityholders and other stakeholders;
– fairly and responsibly reward executives, having regard to the performance of the Group and the executive and the external compensation environment; and
– appropriately align the interests of executives with securityholders.
The Committee is responsible for oversight of, and where appropriate makes recommendations to the Board on:
– remuneration policies and practices affecting the Group;
– remuneration packages for the executive KMP. The Committee also reviews the CEO’s recommendations on the remuneration packages for the senior executive team;
– the Group’s equity linked performance plans;
– succession planning policies in relation to the senior executive team;
– policies that promote and support equal opportunity and diversity within the Group;
– termination entitlements of executive KMP and other members of the senior executive team; and
– fees for non-executive Directors.
Our remuneration philosophy and framework and further details on the role of the Committee are set out in the Remuneration Report.

SCENTRE GROUP ANNUAL FINANCIAL REPORT 2018 // PAGE 81
Scentre Group is listed on the Australian Securities Exchange (ASX) under the code “SCG” and as an ADR under code “SCTRY”.
Please visit our website at www.scentregroup.com/investors for a variety of investor information.
Scentre Group securitiesA Scentre Group stapled security comprises:
– 1 Scentre Group Limited share
– 1 Scentre Group Trust 1 unit
– 1 Scentre Group Trust 2 unit
– 1 Scentre Group Trust 3 unit
and trade together as one security.
Scentre Group Website – About Scentre Group
– News
– Centres
– Investor Information
Electronic InformationBy becoming an electronic investor and registering your email address, you can receive via email, news, notifications and announcements, dividend/distribution statements, taxation statements and annual reports.
Secure Access to Your Securityholding OnlineYou can go to www.scentregroup.com/investors to access your securityholding information by clicking on ‘My SCG Securities’ as well as extensive information on the Group including the latest press releases, results announcements, presentations and more.
To view your securityholding, you will need your Holder Number (SRN/HIN) and will be asked to verify your registered postcode (inside Australia) or your country of residence (outside Australia).
Phone – you can confirm your holding balance, request forms and access distribution and trading information by phoning:
1300 730 458 or call +61 3 9946 4471 (outside Australia) then, pressing 1. You will be asked to enter your Holder Number (SRN/HIN).
Scentre Group Distribution DetailsYour interim distribution will be paid at the end of August and your final distribution paid at the end of February. Details of the 2018 year distributions are provided in the table to the right. To ensure timely receipt of your distribution, please consider the following:
Direct CreditYou can receive your distribution payment efficiently and safely by having it direct credited to your bank account. If you wish to register for direct credit, please complete the form and return it to the registry. This form can be downloaded from www.scentregroup.com/investors/security-holder-forms or by phoning our Registry on 1300 730 458 (Please have your Holder Number (SRN/HIN) available to quote). Alternatively, you can update your details directly online at www.scentregroup.com/investors and by clicking on “My SCG Securities”.
Ordinary Securities (Cents per Security)
* Dividends/distributions for the year ended 31 December 2018 22.16
Dividend/distribution for the six months ended 30 June 2018 paid on 31 August 2018 11.08
Dividend in respect of a Scentre Group Limited share NilDistribution in respect of a Scentre Group Trust 1 unit 3.34Distribution in respect of a Scentre Group Trust 2 unit 7.74Distribution in respect of a Scentre Group Trust 3 unit Nil
Dividend/distribution for the six months ended 31 December 2018 to be paid on 28 February 2019 11.08
Dividend in respect of a Scentre Group Limited share 2.96Distribution in respect of a Scentre Group Trust 1 unit 3.40Distribution in respect of a Scentre Group Trust 2 unit 4.60Distribution in respect of a Scentre Group Trust 3 unit 0.12
Note: The Group does not operate a distribution reinvestment plan.
Tax File Number (TFN)You are not required by law to provide your Tax File Number (TFN), Australian Business Number (ABN) or Exemption.
However, if you do not provide your TFN, ABN or Exemption, withholding tax at the highest marginal rate, currently 49% for Australian resident members, may be deducted from distributions paid to you. If you have not supplied this information and wish to do so, please advise our Registry or your sponsoring broker.
Alternatively, you can update your details directly online at www.scentregroup.com/investors and by clicking on “My SCG Securities”.
Annual Tax Statement and 2019 Tax GuideThe Annual Tax Statement and Tax Guide are dispatched to securityholders in July each year.
Investor Relations

PAGE 82
Investor Relations (continued)
Unpresented Cheques & Unclaimed FundsScentre Group is required to remit to the NSW Office of State Revenue amounts greater than $100 held in an account that has been inactive for at least 6 years. If you believe you have unpresented cheques please contact the Registry which will be able to check the records and assist you in recovering any funds. Record checks can be made for the prior 7 years. For any enquiries beyond 7 years, you will need to contact the NSW Office of State Revenue (www.osr.nsw.gov.au) to check for unclaimed money.
Australian Capital Gains Tax ConsiderationsA Scentre Group stapled security comprises four separate assets for capital gains tax purposes. For capital gains tax purposes you need to apportion the cost of each stapled security and the proceeds on sale of each stapled security over the separate assets that make up the stapled security. This apportionment should be done on a reasonable basis. One possible method of apportionment is on the basis of the relative Net Tangible Assets (NTAs) of the individual entities.
These are set out by entity in the table below.
Relative Net Tangible Assets (NTA) of entities in Scentre Group 30 Jun 18 31 Dec 18
Scentre Group Limited 3.44% 3.74%Scentre Group Trust 1 38.52% 38.93%Scentre Group Trust 2 57.96% 57.24%Scentre Group Trust 3 0.08% 0.09%
American Depositary Receipts (ADR)Scentre Group has an established ADR program providing a tradeable security in the United States.
Details of the ADR program are available on our website at www.scentregroup.com/investors/american-depositary-receipts/
Contact DetailsAll changes of name, address, tax file number, payment instructions and document requests should be directed to the Registry or alternatively, you can update your details directly online at www.scentregroup.com/investors and by clicking on “My SCG Securities”.
Principal Share Registry Computershare Investor Services Pty Limited Level 4, 60 Carrington Street Sydney NSW 2000 GPO Box 2975 Melbourne VIC 3001 Telephone: +61 3 9946 4471 Enquiries: 1300 730 458 Facsimile: +61 3 9473 2500 E-mail: [email protected] Website: www.computershare.com
All other queries should be directed to Scentre Group Investor Relations:
Level 30, 85 Castlereagh Street Sydney NSW 2000, Australia GPO Box 4004Sydney NSW 2001 Telephone: +61 2 9358 7877Email: [email protected] Website: www.scentregroup.com/investors
Investor FeedbackIf you have any complaints or feedback, please direct these in writing to Scentre Group Investor Relations at GPO Box 4004, Sydney NSW 2001.
Scentre Group CalendarFebruary
– 20 Feb 2019: Full-year results released
– 28 Feb 2019: Payment Distribution for 6 months ending December
March
– Annual Financial Reports for Scentre Group Trust 1, Scentre Group Trust 2 and Scentre Group Trust 3 released
April
– 4 Apr 2019: Scentre Group Limited: Annual General Meeting
May
– 1st Quarter Update
July
– Annual Tax Statements released
August
– Half-year results released
– Payment of Distribution for the 6 months ending June
November
– 3rd Quarter Update
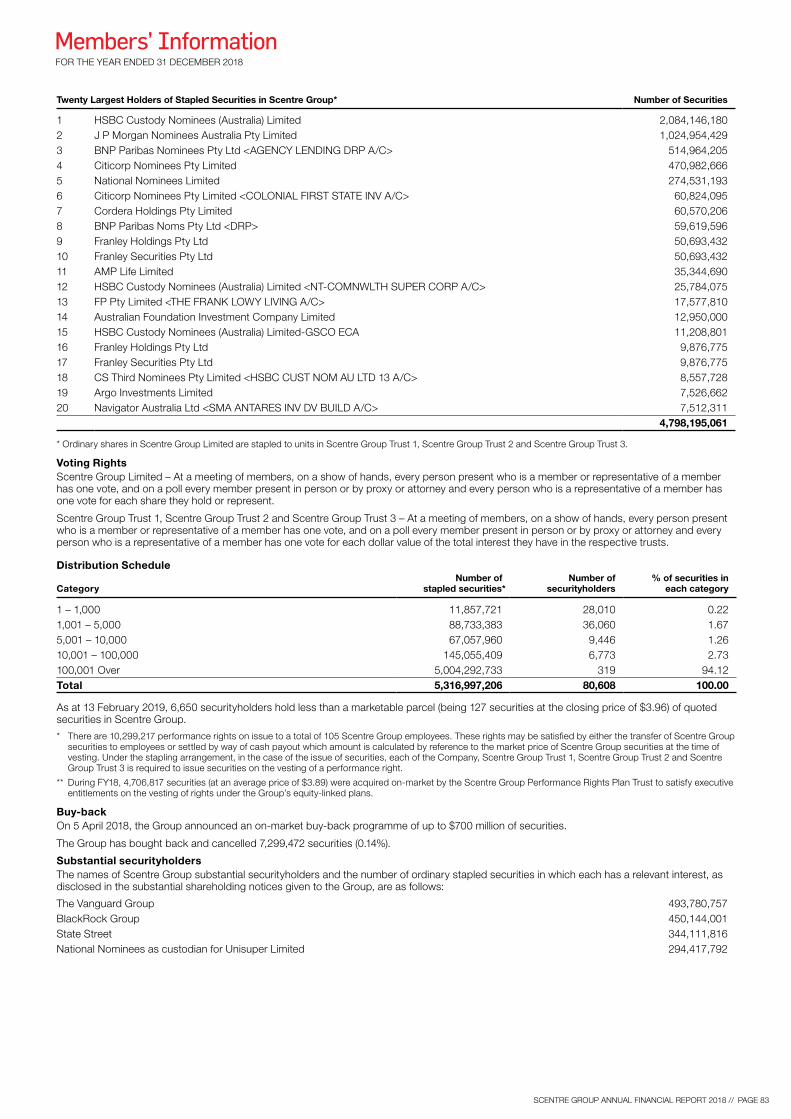
SCENTRE GROUP ANNUAL FINANCIAL REPORT 2018 // PAGE 83
Twenty Largest Holders of Stapled Securities in Scentre Group* Number of Securities
1 HSBC Custody Nominees (Australia) Limited 2,084,146,1802 J P Morgan Nominees Australia Pty Limited 1,024,954,4293 BNP Paribas Nominees Pty Ltd <AGENCY LENDING DRP A/C> 514,964,2054 Citicorp Nominees Pty Limited 470,982,6665 National Nominees Limited 274,531,1936 Citicorp Nominees Pty Limited <COLONIAL FIRST STATE INV A/C> 60,824,0957 Cordera Holdings Pty Limited 60,570,2068 BNP Paribas Noms Pty Ltd <DRP> 59,619,5969 Franley Holdings Pty Ltd 50,693,43210 Franley Securities Pty Ltd 50,693,43211 AMP Life Limited 35,344,69012 HSBC Custody Nominees (Australia) Limited <NT-COMNWLTH SUPER CORP A/C> 25,784,07513 FP Pty Limited <THE FRANK LOWY LIVING A/C> 17,577,81014 Australian Foundation Investment Company Limited 12,950,00015 HSBC Custody Nominees (Australia) Limited-GSCO ECA 11,208,80116 Franley Holdings Pty Ltd 9,876,77517 Franley Securities Pty Ltd 9,876,77518 CS Third Nominees Pty Limited <HSBC CUST NOM AU LTD 13 A/C> 8,557,72819 Argo Investments Limited 7,526,66220 Navigator Australia Ltd <SMA ANTARES INV DV BUILD A/C> 7,512,311
4,798,195,061
* Ordinary shares in Scentre Group Limited are stapled to units in Scentre Group Trust 1, Scentre Group Trust 2 and Scentre Group Trust 3.
Voting RightsScentre Group Limited – At a meeting of members, on a show of hands, every person present who is a member or representative of a member has one vote, and on a poll every member present in person or by proxy or attorney and every person who is a representative of a member has one vote for each share they hold or represent.
Scentre Group Trust 1, Scentre Group Trust 2 and Scentre Group Trust 3 – At a meeting of members, on a show of hands, every person present who is a member or representative of a member has one vote, and on a poll every member present in person or by proxy or attorney and every person who is a representative of a member has one vote for each dollar value of the total interest they have in the respective trusts.
Distribution Schedule
CategoryNumber of
stapled securities*Number of
securityholders% of securities in
each category
1 – 1,000 11,857,721 28,010 0.221,001 – 5,000 88,733,383 36,060 1.675,001 – 10,000 67,057,960 9,446 1.2610,001 – 100,000 145,055,409 6,773 2.73100,001 Over 5,004,292,733 319 94.12Total 5,316,997,206 80,608 100.00
As at 13 February 2019, 6,650 securityholders hold less than a marketable parcel (being 127 securities at the closing price of $3.96) of quoted securities in Scentre Group.
* There are 10,299,217 performance rights on issue to a total of 105 Scentre Group employees. These rights may be satisfied by either the transfer of Scentre Group securities to employees or settled by way of cash payout which amount is calculated by reference to the market price of Scentre Group securities at the time of vesting. Under the stapling arrangement, in the case of the issue of securities, each of the Company, Scentre Group Trust 1, Scentre Group Trust 2 and Scentre Group Trust 3 is required to issue securities on the vesting of a performance right.
** During FY18, 4,706,817 securities (at an average price of $3.89) were acquired on-market by the Scentre Group Performance Rights Plan Trust to satisfy executive entitlements on the vesting of rights under the Group’s equity-linked plans.
Buy-backOn 5 April 2018, the Group announced an on-market buy-back programme of up to $700 million of securities.
The Group has bought back and cancelled 7,299,472 securities (0.14%).
Substantial securityholdersThe names of Scentre Group substantial securityholders and the number of ordinary stapled securities in which each has a relevant interest, as disclosed in the substantial shareholding notices given to the Group, are as follows:
The Vanguard Group 493,780,757BlackRock Group 450,144,001State Street 344,111,816National Nominees as custodian for Unisuper Limited 294,417,792
Members’ InformationFOR THE YEAR ENDED 31 DECEMBER 2018

PAGE 84
Directory
Scentre GroupScentre Group LimitedABN 66 001 671 496
Scentre Group Trust 1ARSN 090 849 746(responsible entity Scentre Management LimitedABN 41 001 670 579, AFS Licence No 230329)
Scentre Group Trust 2ARSN 146 934 536(responsible entity RE1 LimitedABN 80 145 743 862, AFS Licence No 380202)
Scentre Group Trust 3ARSN 146 934 652(responsible entity RE2 LimitedABN 41 145 744 065, AFS Licence No 380203)
Registered OfficeLevel 3085 Castlereagh StreetSydney NSW 2000Telephone: +61 2 9358 7000Facsimile: +61 2 9028 8500
New Zealand OfficeLevel 2, Office Tower277 BroadwayNewmarket, Auckland 1023Telephone: +64 9 978 5050Facsimile: +64 9 978 5070
SecretariesMaureen T McGrathPaul F Giugni
AuditorErnst & Young200 George StreetSydney NSW 2000
Investor InformationScentre GroupLevel 3085 Castlereagh StreetSydney NSW 2000Telephone: +61 2 9358 7877Facsimile: +61 2 9358 7881E-mail: [email protected]: www.scentregroup.com/investors
Principal Share RegistryComputershare Investor Services Pty LimitedLevel 4, 60 Carrington StreetSydney NSW 2000GPO Box 2975Melbourne VIC 3001Telephone: +61 3 9946 4471Enquiries: 1300 730 458Facsimile: +61 3 9473 2500E-mail: [email protected]: www.computershare.com
ADR RegistryBNY Mellon Shareowner ServicesPO Box 505000Louisville, KY 40233-5000USAUS Domestic Calls (toll free): 1 888 BNY ADRS or 1888 269 2377International Calls: +1 201 680 6825Email: [email protected]: www.mybnymdr.comCode: SCTRY
ListingAustralian Securities Exchange – SCG
Websitewww.scentregroup.com

DESIGN: MONCHOCREATIVE.COM.AU
The papers used in the production of this year’s Scentre Group reports are produced using environmentally responsible papers
produced from well managed forests.