annual environmental report cwmf, 2008 · 2015-04-08 · the annual environmental report is...
TRANSCRIPT
Comhairle Contae an Chláir
Clare County Council
Central Waste Management Facility, Ballyduffbeg, Inagh, County Clare.
Annual Environmental Report
2014
Prepared by: Transportation, Environment, Water and Emergency Services Directorate, Clare County
Council.

1. TABLE OF CONTENTS
1.0 Contents
2.0 Introduction
2.1 Background 4
2.2 Reporting Period 4
2.3 Waste Activities Carried Out at the Central Waste Management Facility 4
3.0 Materials/Waste transported on/off site
3.1 Quantity of Disposed Waste 4
3.2 Waste Received in Civic Amenity Site for Offsite Landfill 4
3.3 Details of Waste Received in the Civic Amenity Area for Recycling/Recovery 5
3.4 Leachate Quantities 6
3.5 Landfill Gas Management January to December 2014 9
3.6 Resource and Energy Consumption Summary 9
4.0 Summary of Monitoring and Emissions
4.1 General 10
4.2 Landfill Gas 10
4.3 Landfill Gas Flare 10
4.4 Dust 11
4.5 Noise 12
4.6 Surface Water, Groundwater and Leachate 12
4.6.1 Surface Water 12
4.6.2 Groundwater 16
4.6.3 Leachate 22
4.7 Biological and Ecological Monitoring 27
4.8 Summary Details re EPA Site Visits/Audits During 2014 27
5.0 Works programme 2014-2015
5.1 Report of Development Works for 2014 28
5.2 Proposed Development Works 2015 28
5.3 Progress to Site Restoration 28
5.4 Site Survey and Remaining Void Capacity 28
6.0 Financial Aspects
6.1 Annual Budget and Operating Costs 29
6.2 Portion of Gate Fees for Environmental Improvement Projects 29
6.3 Review of Environmental Liabilities 29
7.0 Review
7.1 Nuisance Controls 30
7.1.1 Litter Control 30
7.1.2 Birds 30
7.1.3 Vermin 30
7.0 Review (cont’d)
7.1.4 Fires 31
7.1.5 Vehicles 31
7.1.6 Odours 32
7.1.7 Dust 31
7.1.8 Visual Intrusion 31
7.1.9 Noise 31
7.1.10 Complaints Register 31
7.2 Landfill Environmental Management Plan 32
7.3 Programme of Public Information 32
7.4 Management and Staffing Structure 33
7.5 Environmental Incidents and Complaints 33
7.6 Waste Reduction and Recovery 34
7.7 Report on Biodegradable Waste/Diversion From Landfill 34
7.8 Report on Progress in Meeting the Requirements of the Landfill Directive 35
7.9 Statement on the Achievement of the Waste Acceptance and Treatment
Obligations of the Waste Licence
35
7.10 Statement of Compliance with Relevant Updates of the Regional Waste
Management Plan
35
7.11 Updates/Amendments to the Odour Management Plan 35
8.0
Appendices
8.1 Licensed Activities at CWMF
8.2 Water Balance Calculation
8.3 Management Structure
8.4 Summary of Incident Reports
8.5 Monitoring Point Location Map
8.6 List of Site Standard Operating Procedures Prepared/Revised During 2014
8.7 Gas Survey Returns for 2014
8.8 PRTR Returns for 2014

2. INTRODUCTION
2.1 Background
The Environmental Protection Agency granted Clare County Council a Waste Licence for the Central Waste
Management Facility (CWMF) located at Ballyduff Beg, Inagh, County Clare, on 13th June 2001 (W0109-01). A
revised licence was issued in March 2010 (W0109-02).
Landfilling commenced at the site on the 30th
September 2002 and ceased on an interim basis on the 26th
November
2011 on completion of filling of the last constructed cell (cell 13). The Annual Environmental Report is prepared in
compliance with Condition 2.3 of the licence.
2.2 Reporting Period
This report covers the period January 1st
to December 31st
2014.
2.3 Waste Activities carried out at CWMF.
Waste activities at the CWMF are restricted to those outlined in “Part 1, Activities Licensed” of W0109-02. These
are reproduced in Appendix 8.1 of this report.
The Civic Amenity Site provides recycling receptacles for the collection and recycling of various recyclable waste
streams, the materials accepted are detailed in Table 3.1. The Civic Amenity Site remains in operation.
Small quantities of municipal waste were accepted from householders in the civic amenity site during the year. The
waste was removed from site by a third party waste contractor and brought to their facility for further processing
for offsite landfill and/or diversion to waste-to-energy facilities.
A composting facility was developed in 2006 to accept and treat green waste from domestic customers only. The
green waste is composted in an aerated static pile and the mature compost is used within the site as a soil
conditioner. The facility has diverted a total of 2,825t of domestic green waste from landfill between 2006 and the
end of 2014. This facility remains in operation.
3. MATERIALS/WASTE TRANSPORTED ON/OFF SITE
3.1 Quantity of disposed waste
No waste was accepted for onsite landfill during the year. Small quantities of household waste were accepted for
offsite landfill (see Section 3.2).
3.2 Waste Received in the Civic Amenity Area for offsite landfill
Residual (landfill) waste from householders and small commercial outlets is loaded into a hopper in the civic
amenity site. The waste is moved into a sealed container by means of a static compactor. The container is
uncoupled from the compactor and moved off site when full, normally twice per week. A total of 956 tonnes of

Page 5 of 56
residual waste was accepted from householders in 2014, inclusive of mattresses and other bulky waste items and
environmental cleanup material.
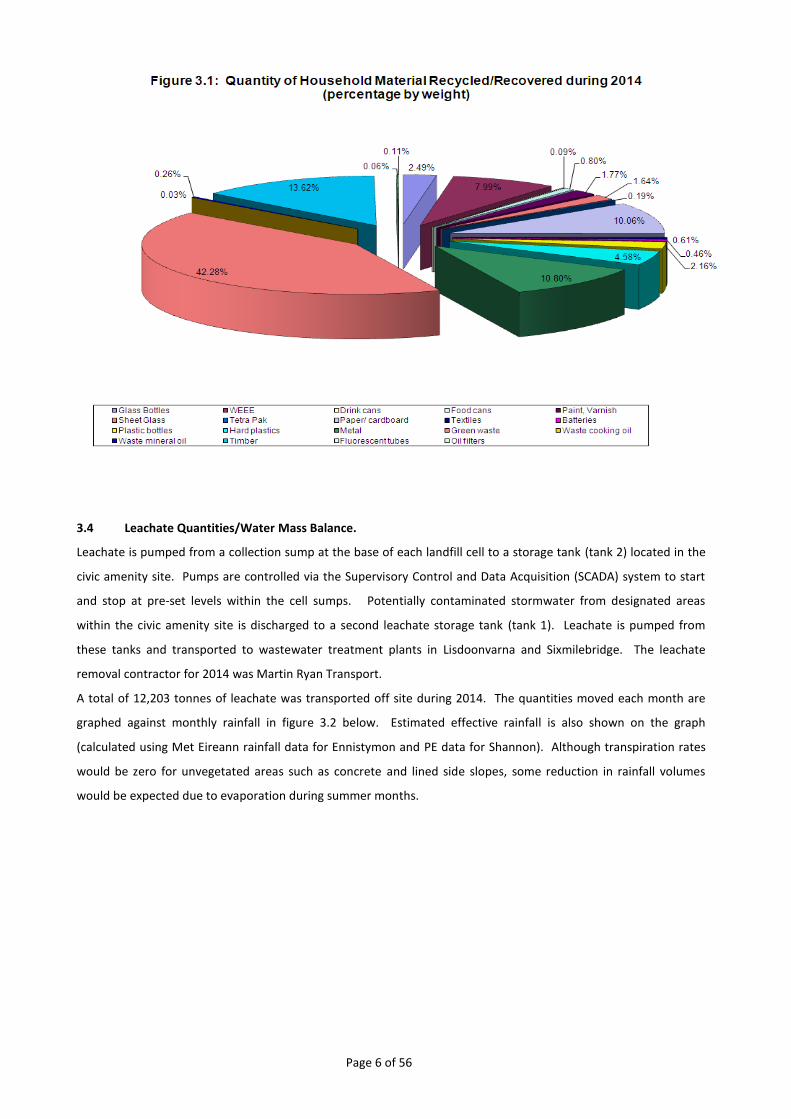
3.3 Waste Received in the Civic Amenity Area for Recovery
Various receptacles are provided within the CA site for collection of recyclable waste. The waste streams and
tonnages received during the year for recycling are shown in Table 3.1 and in figure 3.1. The collection of waste
electrical and electronic equipment (WEEE) commenced on August 13th
2005. All WEEE is stored on site prior to
collection by the nominated contractor.
Green waste composting commenced in January 2006, using aerated static pile technique to process domestic
green waste received directly in the CWMF CA site and also green waste brought from Lisdeen, Ennis and Shannon
CA sites. Exhaust air from the aerated static pile is drawn through a woodchip biofilter to protect against odours.
The compost is turned regularly and compost temperature is recorded. The finished product is tested in accordance
with the requirements of W01090-02. Approximately 2,875 tonnes of green waste has been recovered to date. The
compost product is used mainly as a soil conditioner within the site.
Hard plastics have been accepted at the facility for recovery since mid 2008.
In early 2009, construction & demolition waste from domestic customers was accepted with the agreement of the
Agency. This material was used in the construction of haul roads within the operational landfill. With the closure of
the landfill, there was no further use for this material within the site and this waste stream is no longer accepted.
TABLE 3.1: QUANTITY (TONNES) OF MATERIALS RECYCLED/RECOVERED IN 2014
Material Quantity Material Quantity Material Quantity
Glass Bottles 28 Textiles 6.9 Waste mineral oil 2.9
WEEE 90 Batteries (all) 7.16 Timber 153
Food cans 9 Plastic bottles 24.2 Fluorescent tubes 0.7
Beverage cans 1 Hard plastics 51.5 Oil filters 1.3
Sheet Glass 18 Metal 121.3 Paint, Varnish 19.9
Tetra Pak 2.1 Green waste 475
Total (tonnes)
1123.3 Paper/ cardboard 113 Waste cooking oil 0.4
Page 6 of 56
3.4 Leachate Quantities/Water Mass Balance.
Leachate is pumped from a collection sump at the base of each landfill cell to a storage tank (tank 2) located in the
civic amenity site. Pumps are controlled via the Supervisory Control and Data Acquisition (SCADA) system to start
and stop at pre-set levels within the cell sumps. Potentially contaminated stormwater from designated areas
within the civic amenity site is discharged to a second leachate storage tank (tank 1). Leachate is pumped from
these tanks and transported to wastewater treatment plants in Lisdoonvarna and Sixmilebridge. The leachate
removal contractor for 2014 was Martin Ryan Transport.
A total of 12,203 tonnes of leachate was transported off site during 2014. The quantities moved each month are
graphed against monthly rainfall in figure 3.2 below. Estimated effective rainfall is also shown on the graph
(calculated using Met Eireann rainfall data for Ennistymon and PE data for Shannon). Although transpiration rates
would be zero for unvegetated areas such as concrete and lined side slopes, some reduction in rainfall volumes
would be expected due to evaporation during summer months.

Page 7 of 56
Fig. 3.2: Monthly Rainfall and Leachate Levels, 2014:
The volume of leachate tankered each month provides a rough estimate of volume of leachate generated. In 2014,
as the graph shows, unusually heavy rainfall occurred between January and mid March. Volumes tankered had
been reduced slightly in December 2013 due in part to the holiday season and also to restrictions imposed by the
WWTP’s at that time. As a result of the reduction in transport for December 2013, cell levels increased significantly
at the start of 2014. A total of 127 loads (3640 tonnes) had to be tankered from the site between January and
February 2014. Cell leachate levels also rose above the 1m licence limit during January 2014. Incident reports were
submitted for these exceedences.
Annual leachate and rainfall volumes from 2003 to 2014 are shown in fig. 3.3 and 3.4. The graphs show that the
volume of leachate increased with the development of new landfill cells up to 2008/2009. Volumes reduced after
2009 in part due to lower annual rainfall and also as a result of the implementation of active leachate reduction
measures pursued under Objective 3 of the Facility EMS. These measures included i) the installation of rainflaps on
all side slopes adjoining the active cell to minimise infiltration of clean rainwater into the waste body; ii) during
2010, kerbing was installed along the civic amenity site lower road to minimise overflow of clean rainwater from the
road onto the leachate collection area, a problem which had previously occurred during extreme rainfall events; iii)
in October 2011, with the approval of the EPA, modifications were made to the storm drains at the upper level of
the civic amenity site, diverting rainfall from this area to the stormwater lagoon. The upper CA site drains
previously discharged to the leachate-holding tank. Leachate volumes from the lower CA site were further reduced
by diversion of clean runoff away from the vehicle storage area and by reducing its size. Further modifications were
proposed for 2014 but have not yet been implemented due to possible future relocation of some of the lower levels
skips.
0
500
1000
1500
2000
2500
0
20
40
60
80
100
120
140
160
180
200
220
240
260
280
Jan Feb Mar Apr May Jun Jul Aug Sep Oct Nov Dec
Leach
ate (to
nn
es)
Rai
nfa
ll (t
ota
l an
d e
ffe
ctiv
e)
(mm
)
Monthly Rainfall and Leachate Volumes January to December 2014
Total Rainfall (Ennistymon Station) Total Leachate Tankered

Page 8 of 56
A monthly water balance calculation for the site is attached in Appendix 8.2. This calculation resulted in a
theoretical leachate volume of 11,179m3 (tonnes) for 2014 based on a total rainfall figure of 1,533m
3 from
Ennistymon Rainfall Station (effective rainfall estimated at 957mm using Shannon PE data). The actual leachate
volume tankered offsite in 2014 was 12,203 tonnes, which is 9% over the estimate. This increase is most likely due
to reduced leachate movements during December 2013, with a resultant build up in the cells, combined with the
excessive rainfall levels of January and February 2014. The water balance calculation assumes an infiltration rate of
10% over capped areas.
0
200
400
600
800
1,000
1,200
1,400
1,600
1,800
0
5,000
10,000
15,000
20,000
25,000
30,000
2006 2007 2008 2009 2010 2011 2012 2013 2014
Rain
fall (mm
)
Leac
hat
e (m
3)
Figure 3.4: Summary of Annual Leachate and Rainfall Volumes, 2006 to 2014(No. of cells filled or part-filled by end of each year is also shown on graph)
Total Annual Leachate (m3) Total rainfall Ennistymon (mm)
8 cells 9.3
cells
10.5
cells
11.4
cells
12 cells
13
cells
Landfill closed Dec'11
13 cells filled
and lined
13 cells filled
and lined
Page 9 of 56
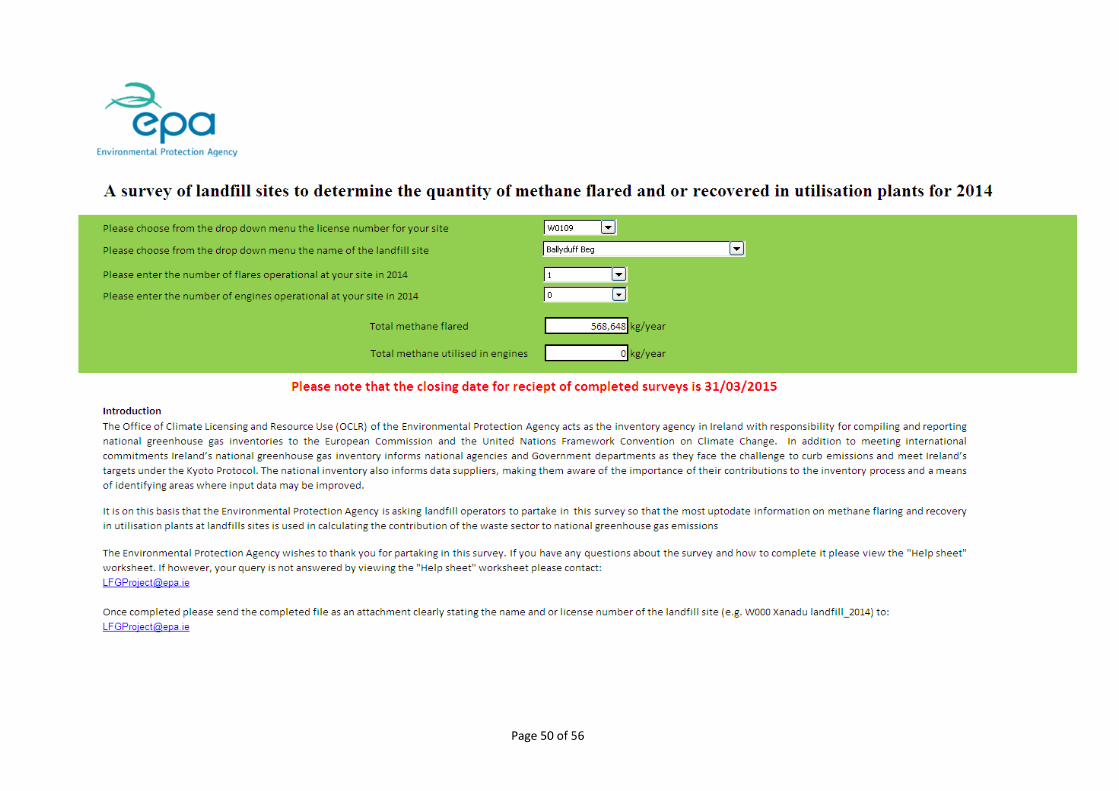
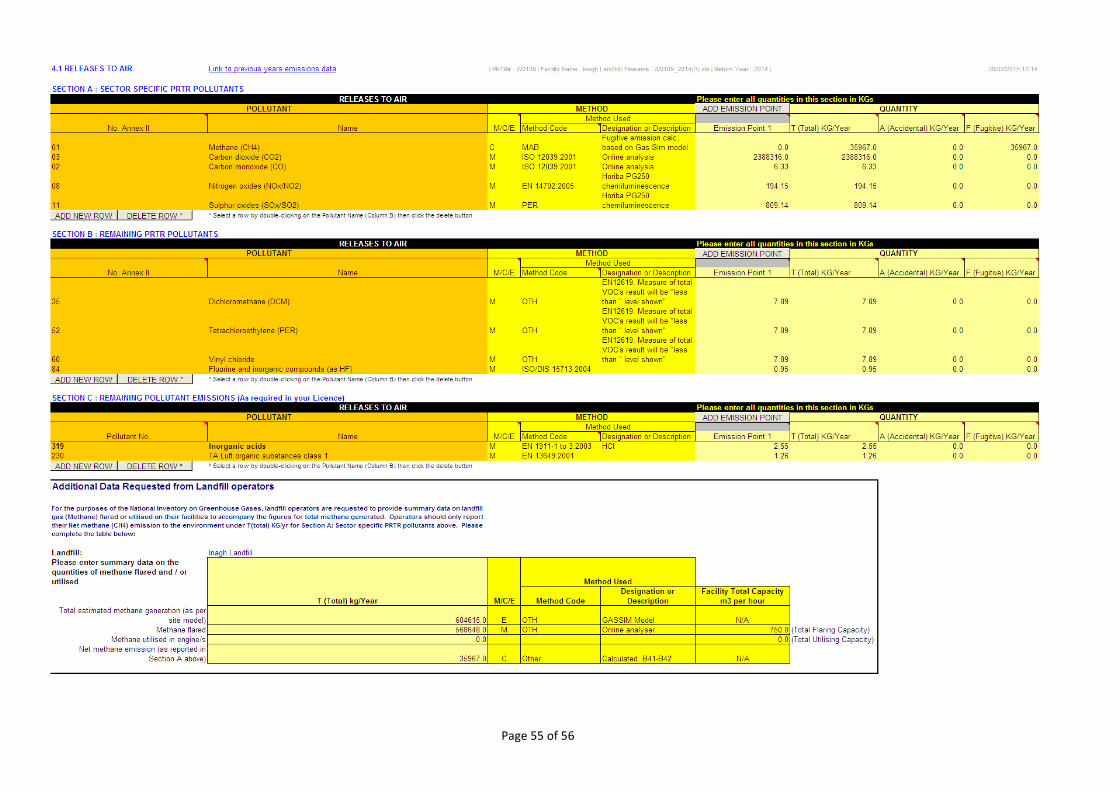
3.5 Landfill Gas Management, January to December 2014
During 2014, a total of 568,648kg of methane was flared in the site enclosed flare from thirteen permanently
capped cells, five in phase one (cells 1, 2, 3, 4 and 5), four in phase two (cells 6, 7, 8 and 9) and four in phase 3 (cells
10, 11, 12 and 13). All gas extraction has been via capped cells since lining works on the last cell (cell 13) were
completed in mid-January 2012. The final gas piping arrangement was in place by August 2012, on completion of
earthworks on the cell 13 top slope. Gas is drawn around the site via a ring main system. Five manifolds are in
place for measuring gas well levels and controlling suction for cells 1 to 11. The method of measurement and
control was changed for cell 12 and 13 wells, with the manifold system replaced by a system of separate control
valves at each well.
Because landfill gas rates vary due to differential decomposition of the waste, the level of methane generation in
each waste cell fluctuates, decreasing over time as the waste biodegrades. Extraction must be regulated so as to
optimise methane concentration and minimise oxygen levels in the landfill gas. This is done by regular gas field
monitoring. Monitoring is supported by pressure checks on wells to ensure that all wells are under negative
pressure and that there are no blockages in gas lines. Maintaining the integrity of the pipe network and freeing
blocked lines is an essential element of effective gas management.
Flare downtime totalled 15 hours during the year, mainly due to essential servicing/maintenance. The service
company used is Irish Biotech Systems Ltd (IBSL).
An application was submitted to ESB Networks during 2009 for a grid connection for an engine with the total
generating capacity of 1MW. A connection agreement offer was received in 2010, with a cost of close to 1m euro.
The high cost of the grid connection and the early closure of the landfill has caused Clare county Council to reassess
the economic value of this project. The possibility of using a smaller engine is still under consideration. Alternative
uses of the landfill gas are also being considered.
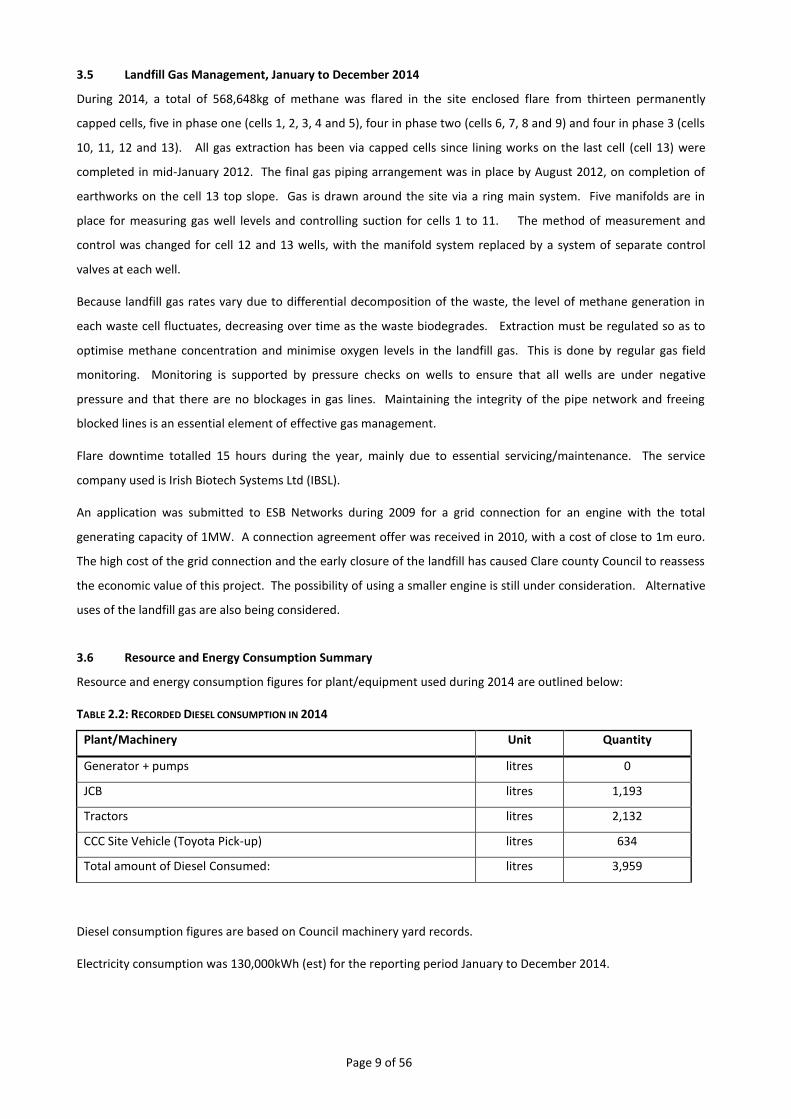
3.6 Resource and Energy Consumption Summary
Resource and energy consumption figures for plant/equipment used during 2014 are outlined below:
TABLE 2.2: RECORDED DIESEL CONSUMPTION IN 2014
Plant/Machinery Unit Quantity
Generator + pumps litres 0
JCB litres 1,193
Tractors litres 2,132
CCC Site Vehicle (Toyota Pick-up) litres 634
Total amount of Diesel Consumed: litres 3,959
Diesel consumption figures are based on Council machinery yard records.
Electricity consumption was 130,000kWh (est) for the reporting period January to December 2014.
Page 10 of 56
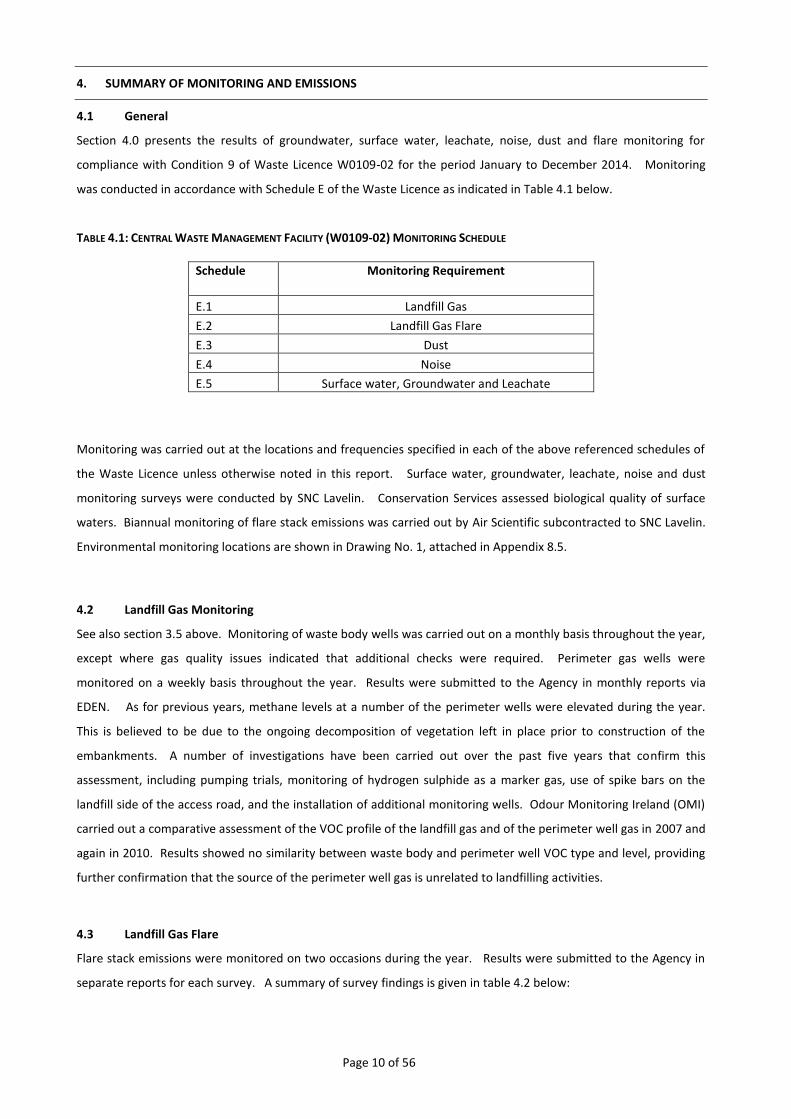
4. SUMMARY OF MONITORING AND EMISSIONS
4.1 General
Section 4.0 presents the results of groundwater, surface water, leachate, noise, dust and flare monitoring for
compliance with Condition 9 of Waste Licence W0109-02 for the period January to December 2014. Monitoring
was conducted in accordance with Schedule E of the Waste Licence as indicated in Table 4.1 below.
TABLE 4.1: CENTRAL WASTE MANAGEMENT FACILITY (W0109-02) MONITORING SCHEDULE
Schedule Monitoring Requirement
E.1 Landfill Gas
E.2 Landfill Gas Flare
E.3 Dust
E.4 Noise
E.5 Surface water, Groundwater and Leachate
Monitoring was carried out at the locations and frequencies specified in each of the above referenced schedules of
the Waste Licence unless otherwise noted in this report. Surface water, groundwater, leachate, noise and dust
monitoring surveys were conducted by SNC Lavelin. Conservation Services assessed biological quality of surface
waters. Biannual monitoring of flare stack emissions was carried out by Air Scientific subcontracted to SNC Lavelin.
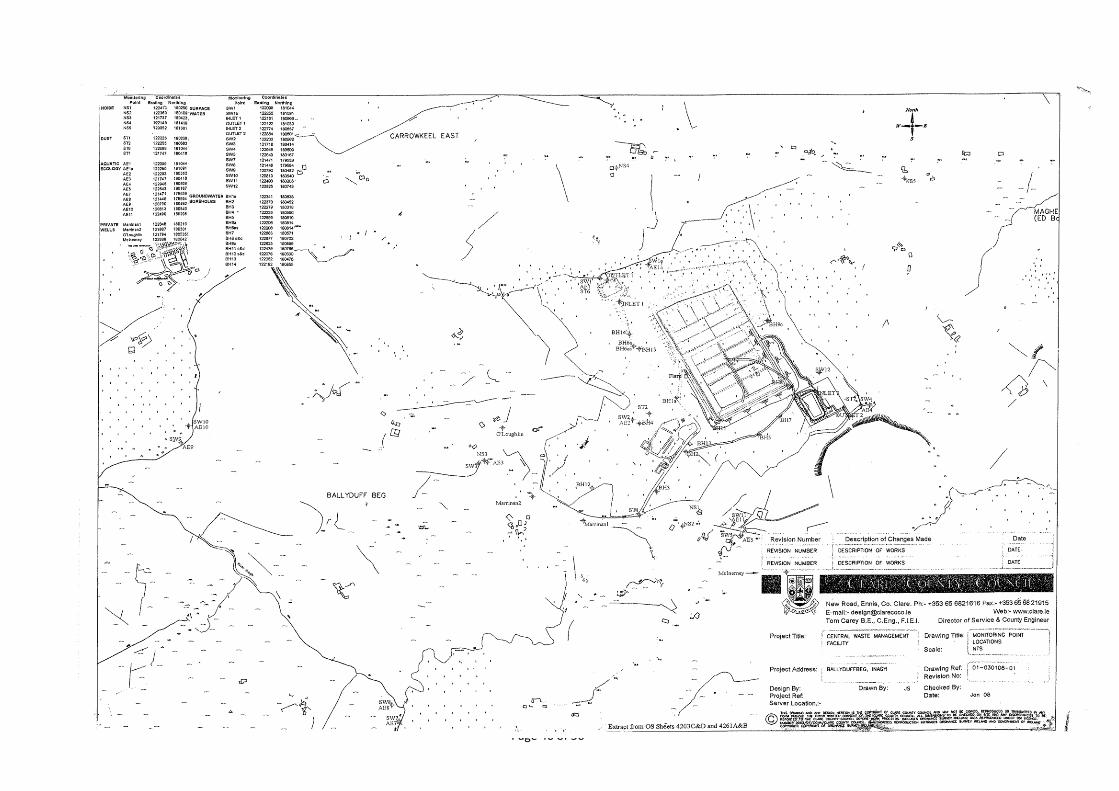
Environmental monitoring locations are shown in Drawing No. 1, attached in Appendix 8.5.
4.2 Landfill Gas Monitoring
See also section 3.5 above. Monitoring of waste body wells was carried out on a monthly basis throughout the year,
except where gas quality issues indicated that additional checks were required. Perimeter gas wells were
monitored on a weekly basis throughout the year. Results were submitted to the Agency in monthly reports via
EDEN. As for previous years, methane levels at a number of the perimeter wells were elevated during the year.
This is believed to be due to the ongoing decomposition of vegetation left in place prior to construction of the
embankments. A number of investigations have been carried out over the past five years that confirm this
assessment, including pumping trials, monitoring of hydrogen sulphide as a marker gas, use of spike bars on the
landfill side of the access road, and the installation of additional monitoring wells. Odour Monitoring Ireland (OMI)
carried out a comparative assessment of the VOC profile of the landfill gas and of the perimeter well gas in 2007 and
again in 2010. Results showed no similarity between waste body and perimeter well VOC type and level, providing
further confirmation that the source of the perimeter well gas is unrelated to landfilling activities.
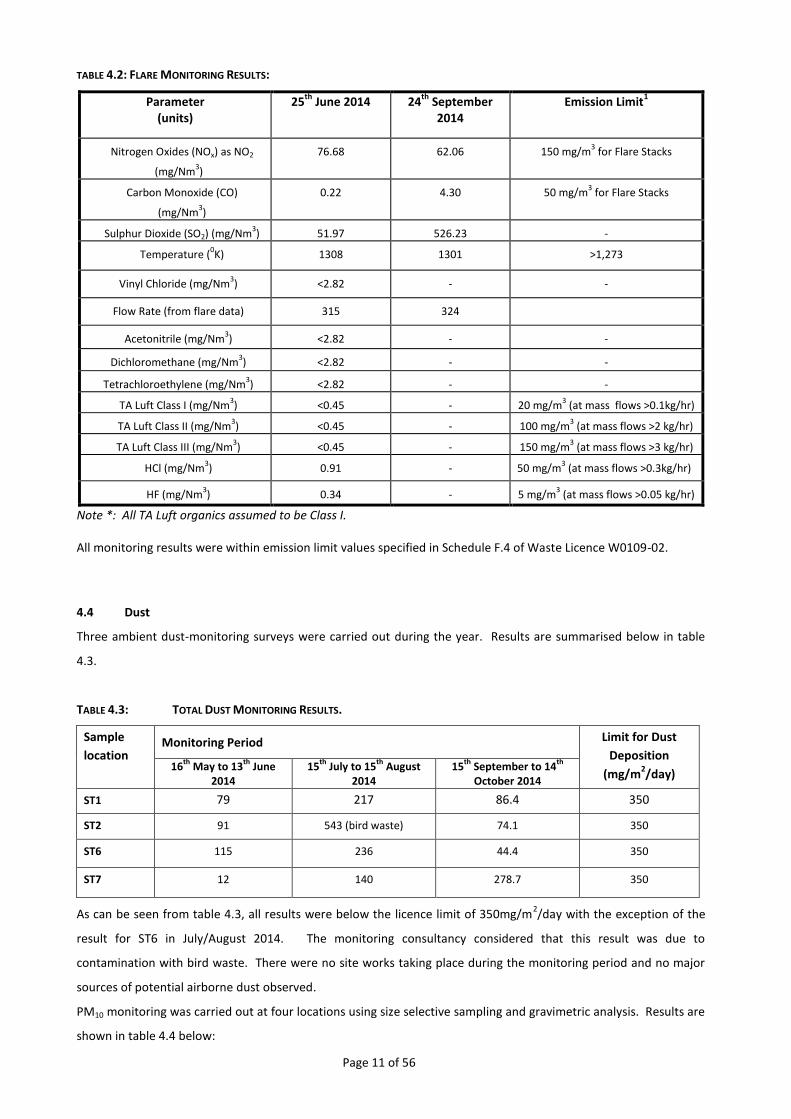
4.3 Landfill Gas Flare
Flare stack emissions were monitored on two occasions during the year. Results were submitted to the Agency in
separate reports for each survey. A summary of survey findings is given in table 4.2 below:
Page 11 of 56
TABLE 4.2: FLARE MONITORING RESULTS:
Parameter (units)
25th
June 2014 24th
September 2014
Emission Limit1
Nitrogen Oxides (NOx) as NO2
(mg/Nm3)
76.68 62.06 150 mg/m3 for Flare Stacks
Carbon Monoxide (CO)
(mg/Nm3)
0.22 4.30 50 mg/m3 for Flare Stacks
Sulphur Dioxide (SO2) (mg/Nm3) 51.97 526.23 -
Temperature (0K) 1308 1301 >1,273
Vinyl Chloride (mg/Nm3) <2.82 - -
Flow Rate (from flare data) 315 324
Acetonitrile (mg/Nm3) <2.82 - -
Dichloromethane (mg/Nm3) <2.82 - -
Tetrachloroethylene (mg/Nm3) <2.82 - -
TA Luft Class I (mg/Nm3) <0.45 - 20 mg/m
3 (at mass flows >0.1kg/hr)
TA Luft Class II (mg/Nm3) <0.45 - 100 mg/m
3 (at mass flows >2 kg/hr)
TA Luft Class III (mg/Nm3) <0.45 - 150 mg/m
3 (at mass flows >3 kg/hr)
HCl (mg/Nm3) 0.91 - 50 mg/m
3 (at mass flows >0.3kg/hr)
HF (mg/Nm3) 0.34 - 5 mg/m
3 (at mass flows >0.05 kg/hr)
Note *: All TA Luft organics assumed to be Class I.
All monitoring results were within emission limit values specified in Schedule F.4 of Waste Licence W0109-02.
4.4 Dust
Three ambient dust-monitoring surveys were carried out during the year. Results are summarised below in table
4.3.
TABLE 4.3: TOTAL DUST MONITORING RESULTS.
Sample
location Monitoring Period Limit for Dust
Deposition
(mg/m2/day)
16th
May to 13th
June 2014
15th
July to 15th
August 2014
15th
September to 14th
October 2014
ST1 79 217 86.4 350
ST2 91 543 (bird waste) 74.1 350
ST6 115 236 44.4 350
ST7 12 140 278.7 350
As can be seen from table 4.3, all results were below the licence limit of 350mg/m2/day with the exception of the
result for ST6 in July/August 2014. The monitoring consultancy considered that this result was due to
contamination with bird waste. There were no site works taking place during the monitoring period and no major
sources of potential airborne dust observed.
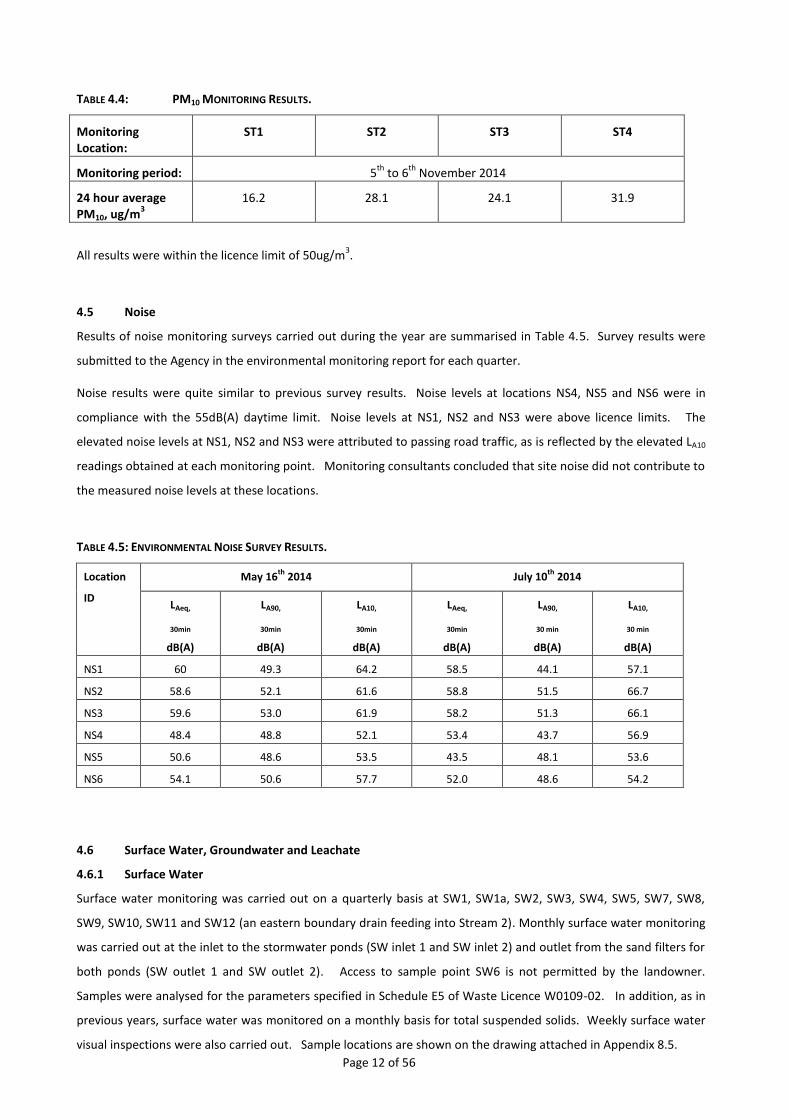
PM10 monitoring was carried out at four locations using size selective sampling and gravimetric analysis. Results are
shown in table 4.4 below:
Page 12 of 56
TABLE 4.4: PM10 MONITORING RESULTS.
Monitoring Location:
ST1 ST2 ST3 ST4
Monitoring period: 5th
to 6th
November 2014
24 hour average PM10, ug/m
3
16.2 28.1 24.1 31.9
All results were within the licence limit of 50ug/m3.
4.5 Noise
Results of noise monitoring surveys carried out during the year are summarised in Table 4.5. Survey results were
submitted to the Agency in the environmental monitoring report for each quarter.
Noise results were quite similar to previous survey results. Noise levels at locations NS4, NS5 and NS6 were in
compliance with the 55dB(A) daytime limit. Noise levels at NS1, NS2 and NS3 were above licence limits. The
elevated noise levels at NS1, NS2 and NS3 were attributed to passing road traffic, as is reflected by the elevated LA10
readings obtained at each monitoring point. Monitoring consultants concluded that site noise did not contribute to
the measured noise levels at these locations.
TABLE 4.5: ENVIRONMENTAL NOISE SURVEY RESULTS.
Location
ID
May 16th
2014 July 10th
2014
LAeq,
30min
dB(A)
LA90,
30min
dB(A)
LA10,
30min
dB(A)
LAeq,
30min
dB(A)
LA90,
30 min
dB(A)
LA10,
30 min
dB(A)
NS1 60 49.3 64.2 58.5 44.1 57.1
NS2 58.6 52.1 61.6 58.8 51.5 66.7
NS3 59.6 53.0 61.9 58.2 51.3 66.1
NS4 48.4 48.8 52.1 53.4 43.7 56.9
NS5 50.6 48.6 53.5 43.5 48.1 53.6
NS6 54.1 50.6 57.7 52.0 48.6 54.2
4.6 Surface Water, Groundwater and Leachate
4.6.1 Surface Water
Surface water monitoring was carried out on a quarterly basis at SW1, SW1a, SW2, SW3, SW4, SW5, SW7, SW8,
SW9, SW10, SW11 and SW12 (an eastern boundary drain feeding into Stream 2). Monthly surface water monitoring
was carried out at the inlet to the stormwater ponds (SW inlet 1 and SW inlet 2) and outlet from the sand filters for
both ponds (SW outlet 1 and SW outlet 2). Access to sample point SW6 is not permitted by the landowner.
Samples were analysed for the parameters specified in Schedule E5 of Waste Licence W0109-02. In addition, as in
previous years, surface water was monitored on a monthly basis for total suspended solids. Weekly surface water
visual inspections were also carried out. Sample locations are shown on the drawing attached in Appendix 8.5.
Page 13 of 56
Results for key parameters (ammonia, BOD and total suspended solids) are discussed in this report. Detailed
results of all surface water monitoring carried out during the year have previously been submitted to the Agency in
separate reports for each quarter.
Stormwater ponds at the site discharge to boundary streams which flow into the Inagh river. The Inagh River in the
vicinity of the landfill is assigned Good Status under the Water Framework Directive. Where applicable, surface
water monitoring results are compared with the limits for Good Status waters specified in the Surface Water
Regulations (SI 272 of 2009).
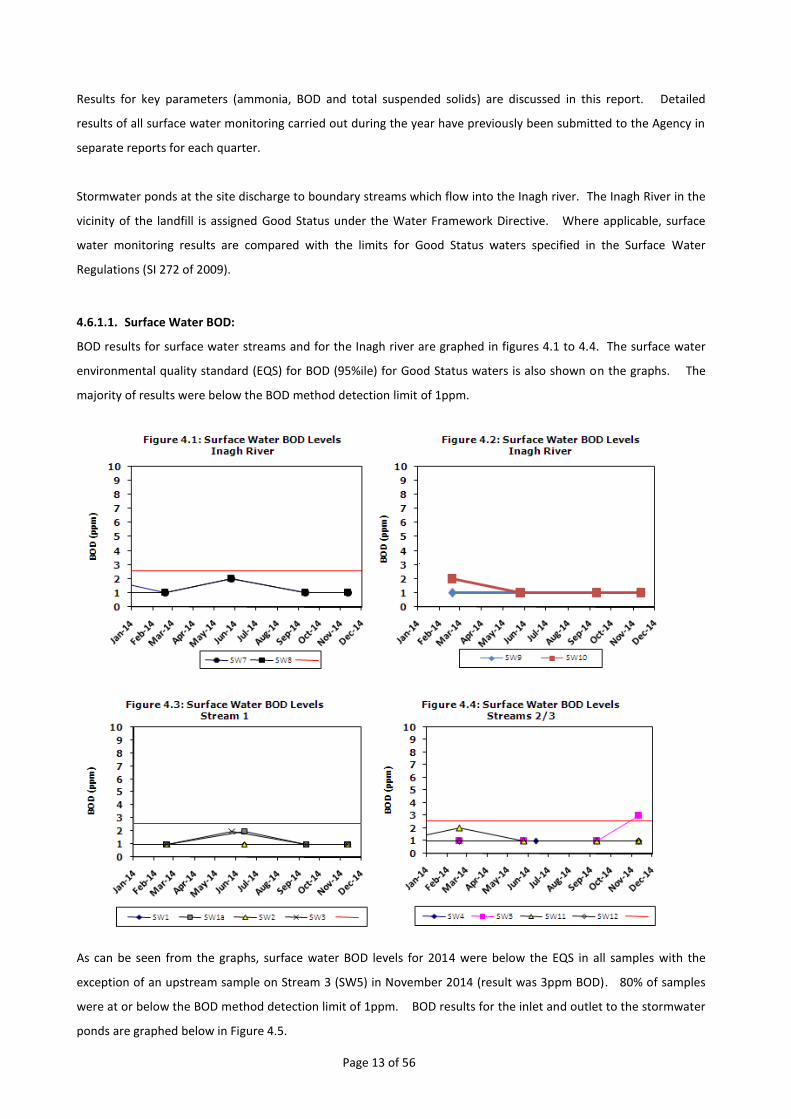
4.6.1.1. Surface Water BOD:
BOD results for surface water streams and for the Inagh river are graphed in figures 4.1 to 4.4. The surface water
environmental quality standard (EQS) for BOD (95%ile) for Good Status waters is also shown on the graphs. The
majority of results were below the BOD method detection limit of 1ppm.
As can be seen from the graphs, surface water BOD levels for 2014 were below the EQS in all samples with the
exception of an upstream sample on Stream 3 (SW5) in November 2014 (result was 3ppm BOD). 80% of samples
were at or below the BOD method detection limit of 1ppm. BOD results for the inlet and outlet to the stormwater
ponds are graphed below in Figure 4.5.

Page 14 of 56
With the exception of the result for the inlet to Pond 1 in December 2014, all results wete below the surface water
EQS. The result for the pond inlet sample was 4ppm. The outlet sample from this pond had a BOD result of 1ppm.
4.6.1.2 Surface Water Ammonia:
Surface water ammonia levels in Streams 1, 2 and 3 and in the Inagh river are graphed in figures 4.6 to 4.9.
With the exception of one ammonia result of 0.6ppm in September 2014 for SW1, all results were below the surface
water ammonia EQS of 0.14ppm (95%ile).
Page 15 of 56
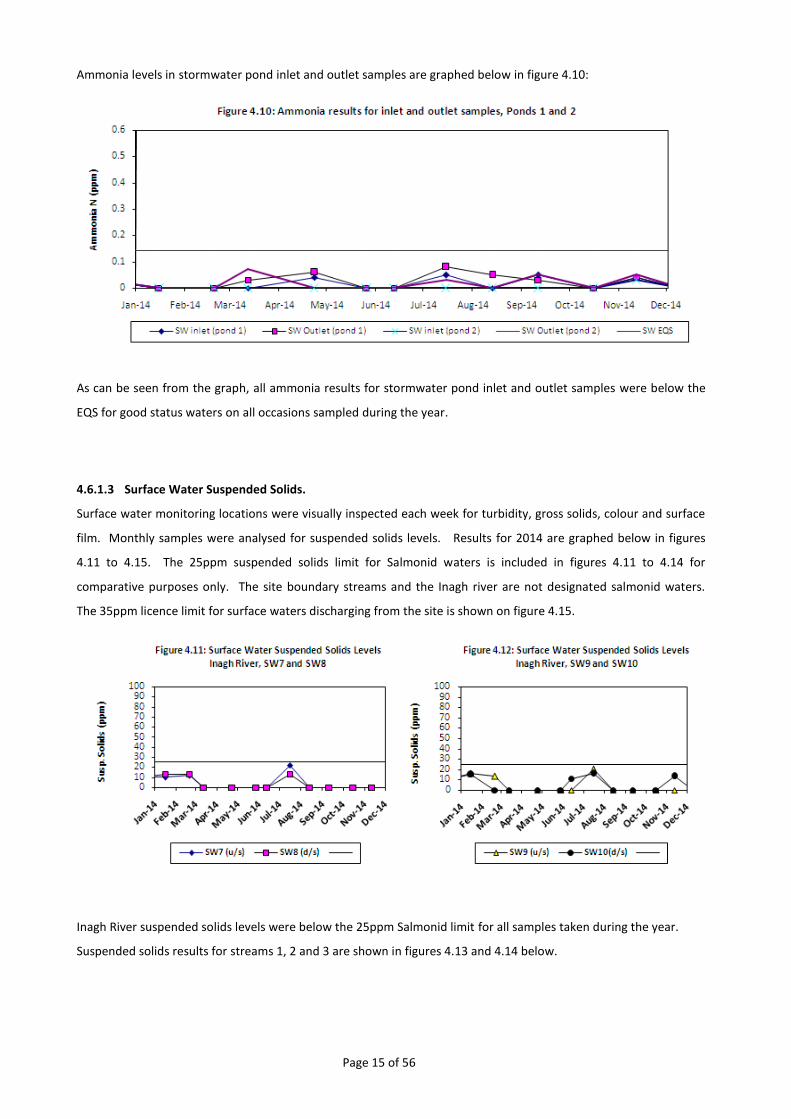
Ammonia levels in stormwater pond inlet and outlet samples are graphed below in figure 4.10:
As can be seen from the graph, all ammonia results for stormwater pond inlet and outlet samples were below the
EQS for good status waters on all occasions sampled during the year.
4.6.1.3 Surface Water Suspended Solids.
Surface water monitoring locations were visually inspected each week for turbidity, gross solids, colour and surface
film. Monthly samples were analysed for suspended solids levels. Results for 2014 are graphed below in figures
4.11 to 4.15. The 25ppm suspended solids limit for Salmonid waters is included in figures 4.11 to 4.14 for
comparative purposes only. The site boundary streams and the Inagh river are not designated salmonid waters.
The 35ppm licence limit for surface waters discharging from the site is shown on figure 4.15.
Inagh River suspended solids levels were below the 25ppm Salmonid limit for all samples taken during the year.
Suspended solids results for streams 1, 2 and 3 are shown in figures 4.13 and 4.14 below.

Page 16 of 56
As can be seen from figure 4.13, suspended solids levels were within the 25ppm limit for Salmonid waters on all
occasions sampled during the year.
Suspended solids levels at the outlet for stormwater ponds 1 and 2 are graphed below in figure 4.15. The 35ppm
licence limit is also shown on the graph.
All results were within the 35ppm suspended solids limit throughout the year with the exception of pond 1 in
September 2014, which had a measured suspended solids level of 50ppm. However, the sample was taken when
there was no discharge; the sample was taken from the base of the pipe and the monitoring consultants reported
that the result was not representative of the surface water discharge.
4.6.2 Groundwater
Groundwater monitoring was carried out on a monthly basis during the year at BH1a, BH2, BH3, BH4, BH5, BH6As
and BH6Ad, BH8, BH9, BH11, BH12s, BH12d, BH13, BH14 and BH15. Four private wells were also monitored.
Samples were analysed for the parameters and frequency specified in Schedule E5 of Waste Licence W0109-02.
Results for key parameters are summarised in this report. Detailed results of all groundwater monitoring carried
out during the year were previously submitted to the Agency.

Page 17 of 56
Where relevant limits exist, monitoring results are compared with the threshold levels specified in European
Communities Environmental Objectives (Groundwater) Regulations, 2010 (S.I. No 9 of 2010), as amended by . The
threshold levels given in columns 3 and/or 4 of Schedule 5 are used for comparison. These thresholds are annual
arithmetic mean levels. For groundwater metals, fluoride, cyanide and sulphate, only one result is available for
2014 as these parameters are monitored annually.
4.6.2.1 Groundwater pH:
Groundwater pH results from January to December 2014 are graphed below in figure 4.16. The original EPA Interim
Guidance Value range for pH (6.5 – 9.5) is shown on the graph for comparative purposes. Limits for pH are not
specified in the Groundwater Regulations.
Figure 4.16
As can be seen from Figure 4.16, pH results were within the upper and lower IGVs for all groundwater samples taken during the year.
4.6.2.2. Groundwater Conductivity:
Groundwater conductivity results for 2008 to 2014 are graphed in figures 4.17 and 4.18. The threshold value of
1,875us/cm (from S.I. 9, 2010, as amended) is shown on the graphs for comparative purposes (in ms/cm).

Page 18 of 56
There have been occasional problems in the past with elevated pH and conductivity levels in the area around BH6
(see previous AER’s). However, pH and conductivity levels at all wells were satisfactory for 2014.
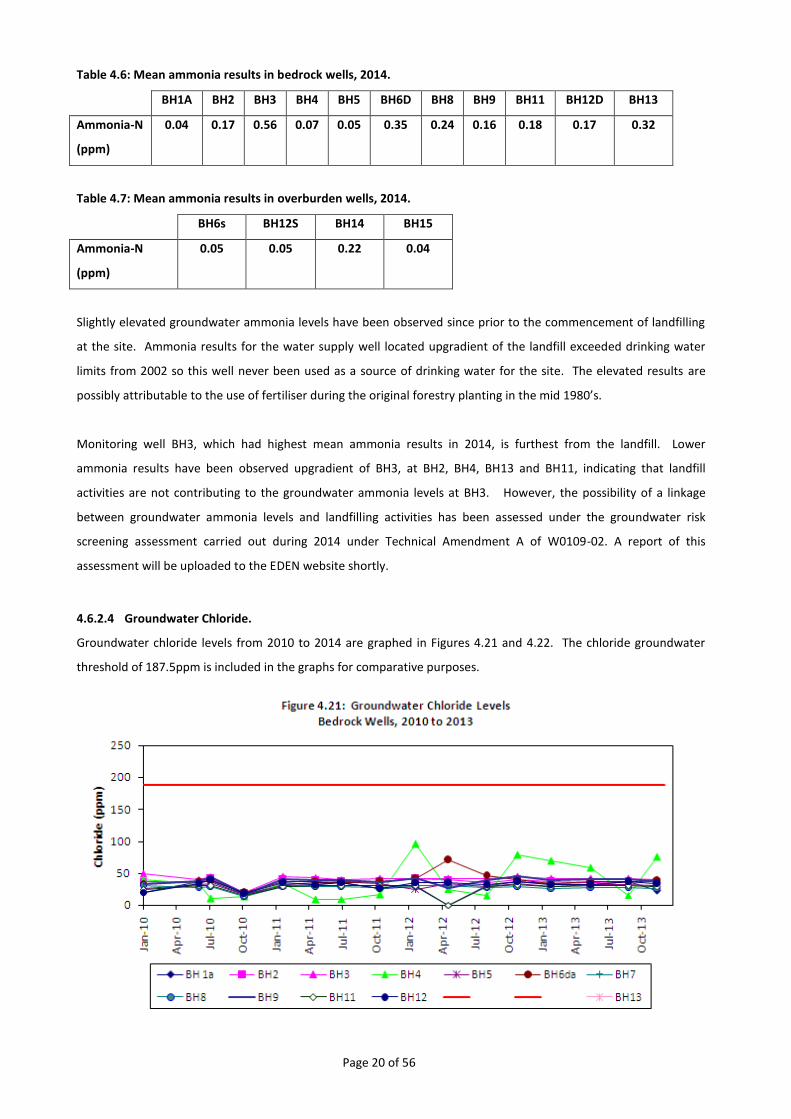
4.6.2.3 Groundwater Ammonia
Groundwater ammonia results for 2014 are graphed below in figures 4.19 and 4.20. The groundwater ammonia
threshold of 0.175ppm (from S.I.9, 2010) is also shown on the graphs.

Page 19 of 56
As can be seen from the graphs, ammonia results for monitoring wells BH3, BH6D, BH8, BH11, BH13 and BH14
exceeded the groundwater threshold of 0.175ppm (from SI 9, 2010). The threshold was marginally exceeded also at
BH2on occasion during the year. Ammonia results for bedrock wells BH5 and BH9 (upgradient) were consistently
below the threshold level, as were results for overburden wells BH6s, BH12s and BH15. Results for BH2 and BH4
were elevated above 0.175ppm on occasion during the year. Highest results were observed in BH3 with a mean of
0.56ppm for the year.
Mean results for all wells are shown below in tables 4.6 and 4.7.
Page 20 of 56
Table 4.6: Mean ammonia results in bedrock wells, 2014.
BH1A BH2 BH3 BH4 BH5 BH6D BH8 BH9 BH11 BH12D BH13
Ammonia-N
(ppm)
0.04 0.17 0.56 0.07 0.05 0.35 0.24 0.16 0.18 0.17 0.32
Table 4.7: Mean ammonia results in overburden wells, 2014.
BH6s BH12S BH14 BH15
Ammonia-N
(ppm)
0.05 0.05 0.22 0.04
Slightly elevated groundwater ammonia levels have been observed since prior to the commencement of landfilling
at the site. Ammonia results for the water supply well located upgradient of the landfill exceeded drinking water
limits from 2002 so this well never been used as a source of drinking water for the site. The elevated results are
possibly attributable to the use of fertiliser during the original forestry planting in the mid 1980’s.
Monitoring well BH3, which had highest mean ammonia results in 2014, is furthest from the landfill. Lower
ammonia results have been observed upgradient of BH3, at BH2, BH4, BH13 and BH11, indicating that landfill
activities are not contributing to the groundwater ammonia levels at BH3. However, the possibility of a linkage
between groundwater ammonia levels and landfilling activities has been assessed under the groundwater risk
screening assessment carried out during 2014 under Technical Amendment A of W0109-02. A report of this
assessment will be uploaded to the EDEN website shortly.
4.6.2.4 Groundwater Chloride.
Groundwater chloride levels from 2010 to 2014 are graphed in Figures 4.21 and 4.22. The chloride groundwater
threshold of 187.5ppm is included in the graphs for comparative purposes.
Figure 4.20
Figure 4.20

Page 21 of 56
As can be seen from the graphs, all groundwater chloride results significantly below the groundwater threshold
level of 187.5ppm.
4.6.2.5 Groundwater volatile and semi-volatile organic compounds
Groundwater samples were analysed for volatile and semi-volatile organic compounds in November 2014. Results
were below method detection limits for all samples (i.e. <1ppb).
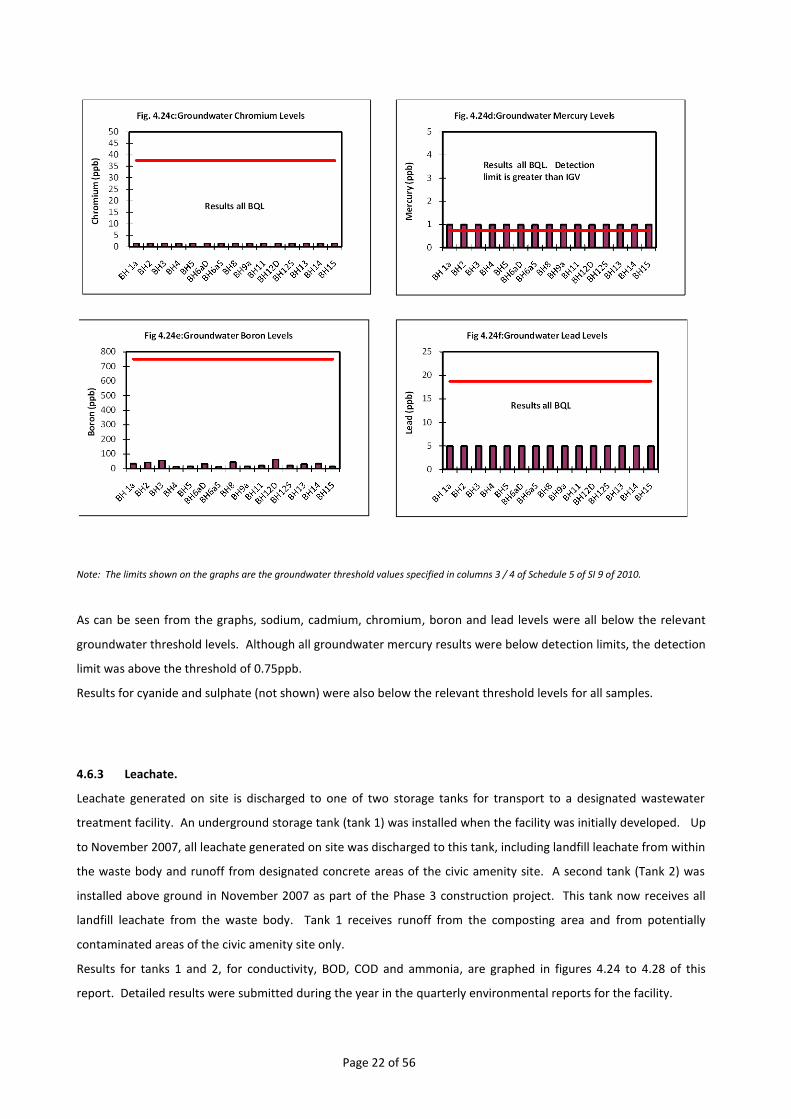
4.6.2.6 Groundwater metals levels:
Groundwater samples were analysed for metals in November 2014. Results are graphed below in figures 4.24a to
4.24f.
Figure 4.20
Figure 4.20
Figure 4.20
Figure 4.20
Page 22 of 56
Note: The limits shown on the graphs are the groundwater threshold values specified in columns 3 / 4 of Schedule 5 of SI 9 of 2010.
As can be seen from the graphs, sodium, cadmium, chromium, boron and lead levels were all below the relevant
groundwater threshold levels. Although all groundwater mercury results were below detection limits, the detection
limit was above the threshold of 0.75ppb.
Results for cyanide and sulphate (not shown) were also below the relevant threshold levels for all samples.
4.6.3 Leachate.
Leachate generated on site is discharged to one of two storage tanks for transport to a designated wastewater
treatment facility. An underground storage tank (tank 1) was installed when the facility was initially developed. Up
to November 2007, all leachate generated on site was discharged to this tank, including landfill leachate from within
the waste body and runoff from designated concrete areas of the civic amenity site. A second tank (Tank 2) was
installed above ground in November 2007 as part of the Phase 3 construction project. This tank now receives all
landfill leachate from the waste body. Tank 1 receives runoff from the composting area and from potentially
contaminated areas of the civic amenity site only.
Results for tanks 1 and 2, for conductivity, BOD, COD and ammonia, are graphed in figures 4.24 to 4.28 of this
report. Detailed results were submitted during the year in the quarterly environmental reports for the facility.
Page 23 of 56
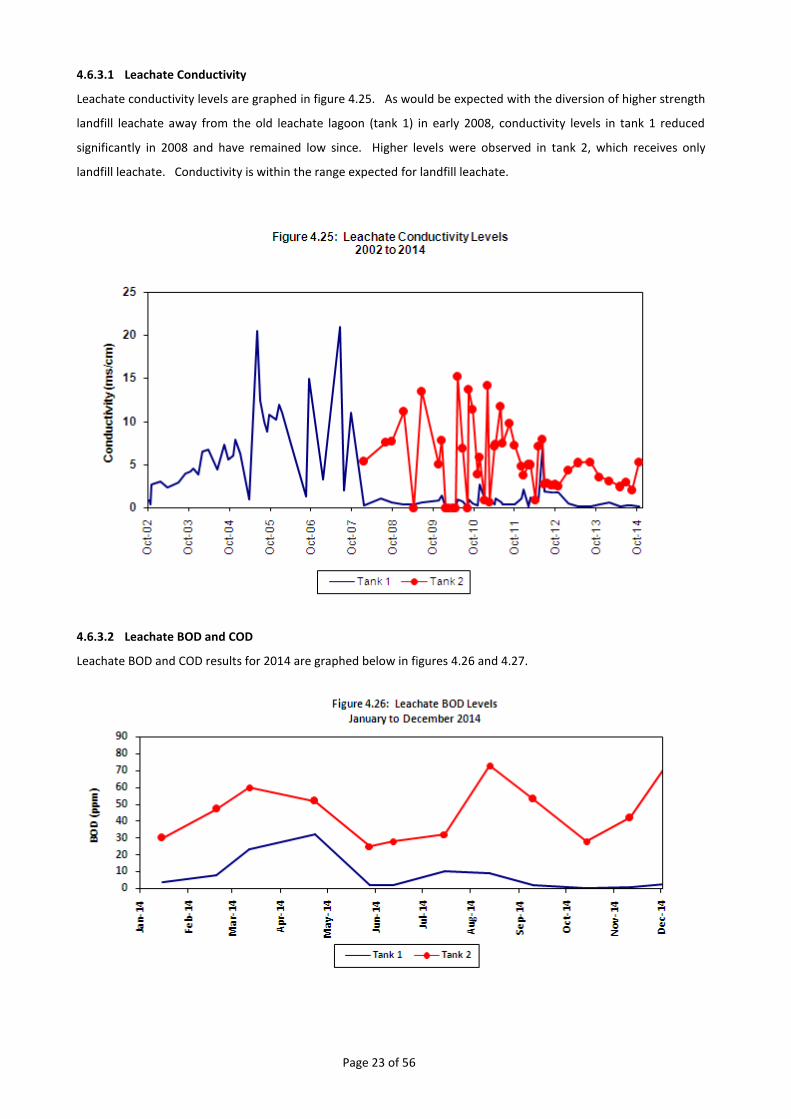
4.6.3.1 Leachate Conductivity
Leachate conductivity levels are graphed in figure 4.25. As would be expected with the diversion of higher strength
landfill leachate away from the old leachate lagoon (tank 1) in early 2008, conductivity levels in tank 1 reduced
significantly in 2008 and have remained low since. Higher levels were observed in tank 2, which receives only
landfill leachate. Conductivity is within the range expected for landfill leachate.
4.6.3.2 Leachate BOD and COD
Leachate BOD and COD results for 2014 are graphed below in figures 4.26 and 4.27.

Page 24 of 56
In
Results were as normal for this site, with higher BOD and COD concentrations observed in landfill leachate samples
(tank 2) in comparison to the civic amenity site runoff samples (tank 1). The leachate results (tank 2) were as
expected for landfill leachate.
The leachate BOD: COD ratio is a useful tool for assessing biodegradability. Ideal ratios should be in the region of
0.3 or greater. The BOD: COD ratio for landfill leachate (tank 2) from February 2009 to December 2014 is graphed
below in figure 4.28. The ratio remained below 0.3 throughout the monitoring period. It is possible that the
elevated ammonia levels in the leachate contribute to the COD reading whereas a nItrification inhibition step is
used to suppress the interference of ammonia in BOD measurement.
Page 25 of 56
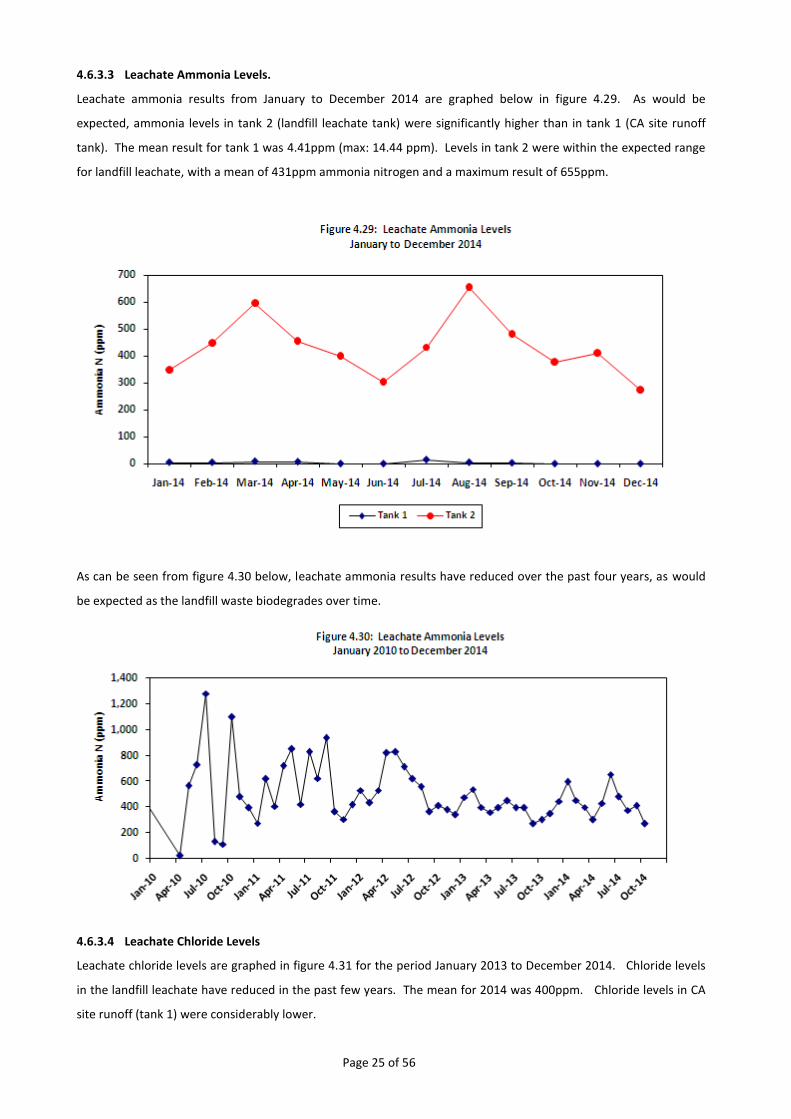
4.6.3.3 Leachate Ammonia Levels.
Leachate ammonia results from January to December 2014 are graphed below in figure 4.29. As would be
expected, ammonia levels in tank 2 (landfill leachate tank) were significantly higher than in tank 1 (CA site runoff
tank). The mean result for tank 1 was 4.41ppm (max: 14.44 ppm). Levels in tank 2 were within the expected range
for landfill leachate, with a mean of 431ppm ammonia nitrogen and a maximum result of 655ppm.
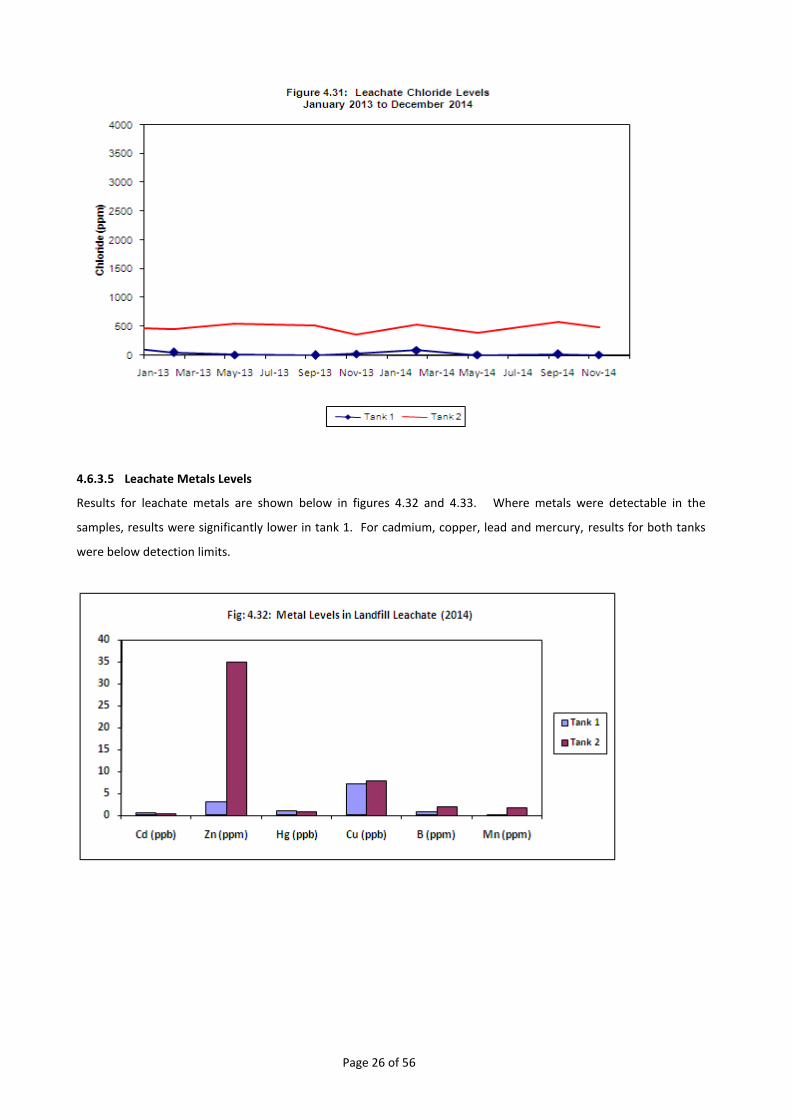
As can be seen from figure 4.30 below, leachate ammonia results have reduced over the past four years, as would
be expected as the landfill waste biodegrades over time.
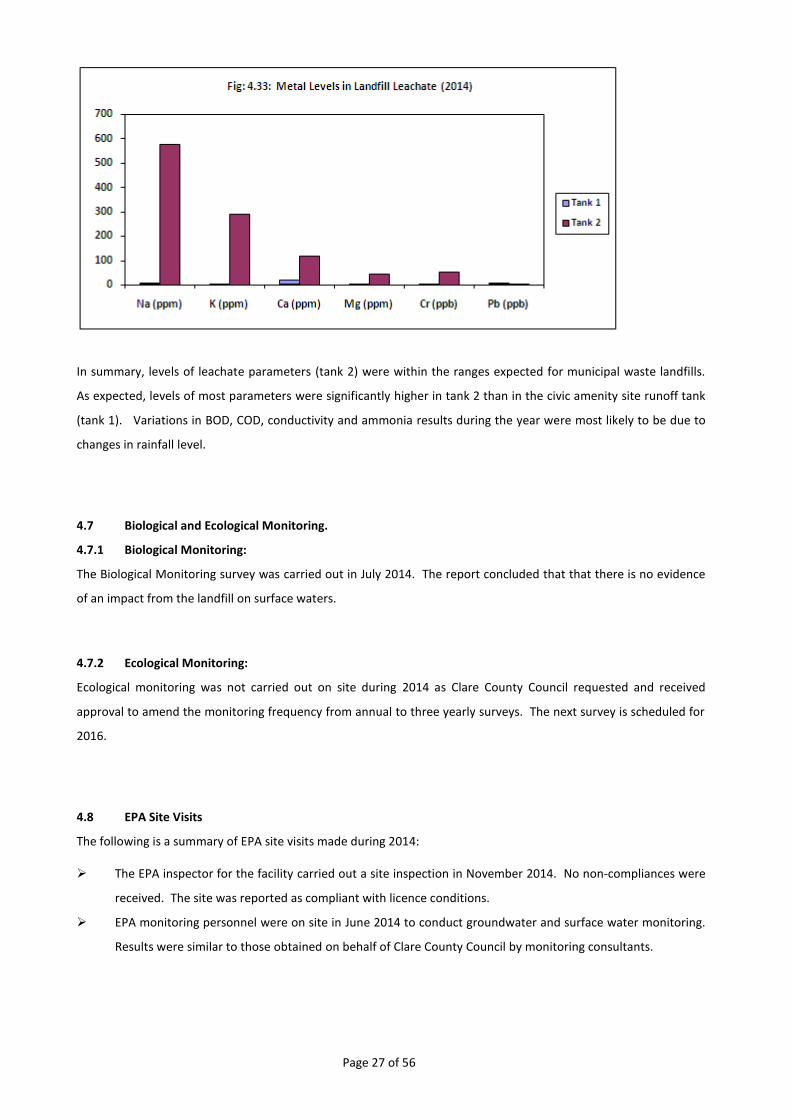
4.6.3.4 Leachate Chloride Levels
Leachate chloride levels are graphed in figure 4.31 for the period January 2013 to December 2014. Chloride levels
in the landfill leachate have reduced in the past few years. The mean for 2014 was 400ppm. Chloride levels in CA
site runoff (tank 1) were considerably lower.
Page 26 of 56
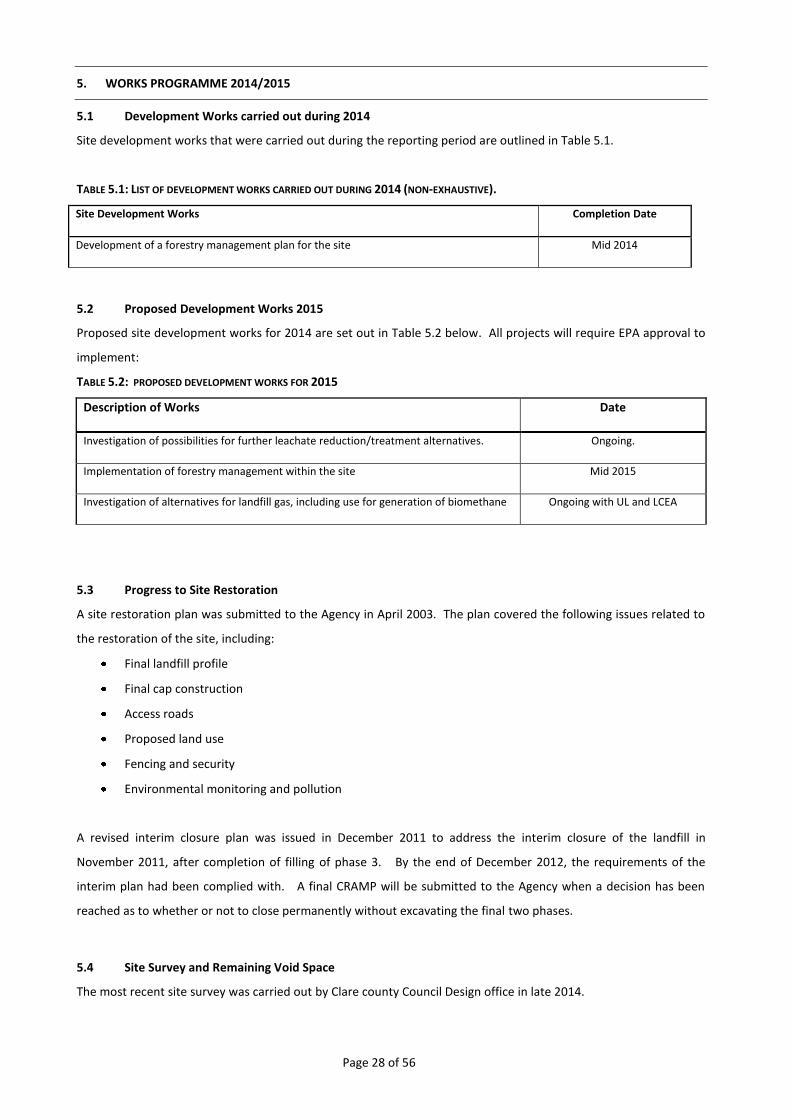
4.6.3.5 Leachate Metals Levels
Results for leachate metals are shown below in figures 4.32 and 4.33. Where metals were detectable in the
samples, results were significantly lower in tank 1. For cadmium, copper, lead and mercury, results for both tanks
were below detection limits.
Page 27 of 56
In summary, levels of leachate parameters (tank 2) were within the ranges expected for municipal waste landfills.
As expected, levels of most parameters were significantly higher in tank 2 than in the civic amenity site runoff tank
(tank 1). Variations in BOD, COD, conductivity and ammonia results during the year were most likely to be due to
changes in rainfall level.
4.7 Biological and Ecological Monitoring.
4.7.1 Biological Monitoring:
The Biological Monitoring survey was carried out in July 2014. The report concluded that that there is no evidence
of an impact from the landfill on surface waters.
4.7.2 Ecological Monitoring:
Ecological monitoring was not carried out on site during 2014 as Clare County Council requested and received
approval to amend the monitoring frequency from annual to three yearly surveys. The next survey is scheduled for
2016.
4.8 EPA Site Visits
The following is a summary of EPA site visits made during 2014:
The EPA inspector for the facility carried out a site inspection in November 2014. No non-compliances were
received. The site was reported as compliant with licence conditions.
EPA monitoring personnel were on site in June 2014 to conduct groundwater and surface water monitoring.
Results were similar to those obtained on behalf of Clare County Council by monitoring consultants.
Page 28 of 56
5. WORKS PROGRAMME 2014/2015
5.1 Development Works carried out during 2014
Site development works that were carried out during the reporting period are outlined in Table 5.1.
TABLE 5.1: LIST OF DEVELOPMENT WORKS CARRIED OUT DURING 2014 (NON-EXHAUSTIVE).
Site Development Works Completion Date
Development of a forestry management plan for the site Mid 2014
5.2 Proposed Development Works 2015
Proposed site development works for 2014 are set out in Table 5.2 below. All projects will require EPA approval to
implement:
TABLE 5.2: PROPOSED DEVELOPMENT WORKS FOR 2015
Description of Works Date
Investigation of possibilities for further leachate reduction/treatment alternatives. Ongoing.
Implementation of forestry management within the site Mid 2015
Investigation of alternatives for landfill gas, including use for generation of biomethane Ongoing with UL and LCEA
5.3 Progress to Site Restoration
A site restoration plan was submitted to the Agency in April 2003. The plan covered the following issues related to
the restoration of the site, including:
Final landfill profile
Final cap construction
Access roads
Proposed land use
Fencing and security
Environmental monitoring and pollution
A revised interim closure plan was issued in December 2011 to address the interim closure of the landfill in
November 2011, after completion of filling of phase 3. By the end of December 2012, the requirements of the
interim plan had been complied with. A final CRAMP will be submitted to the Agency when a decision has been
reached as to whether or not to close permanently without excavating the final two phases.
5.4 Site Survey and Remaining Void Space
The most recent site survey was carried out by Clare county Council Design office in late 2014.
Page 29 of 56
6. FINANCIAL ASPECTS
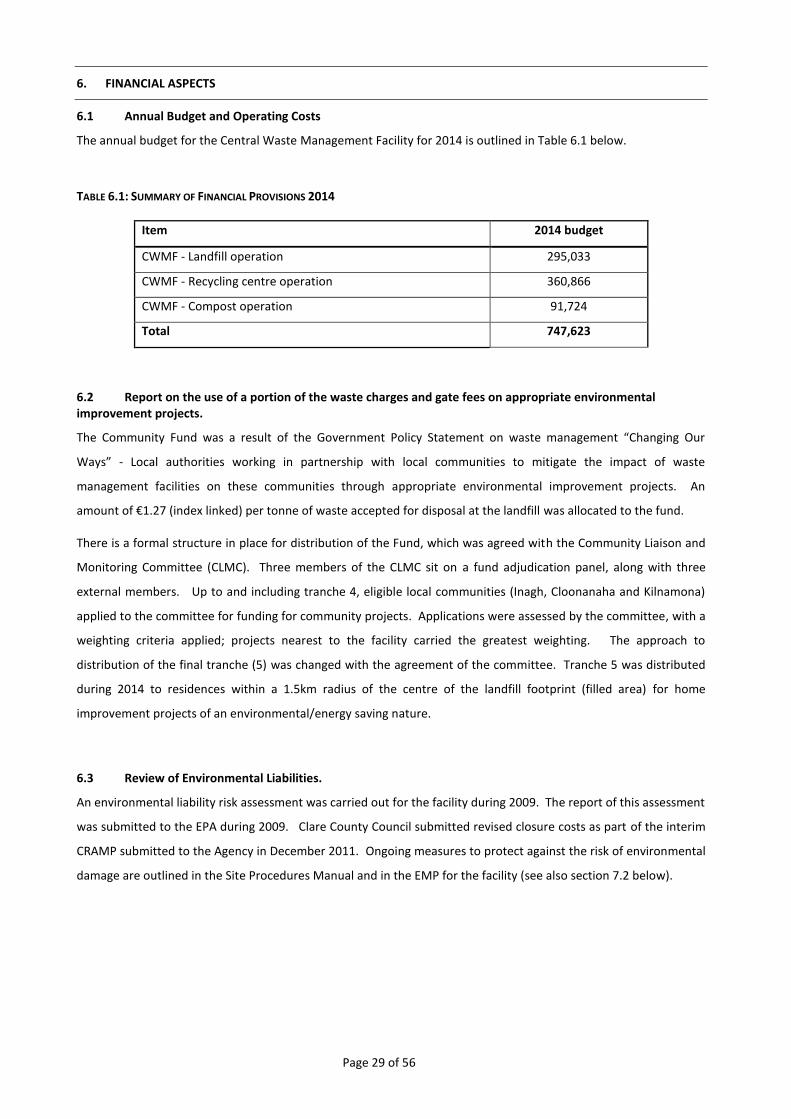
6.1 Annual Budget and Operating Costs
The annual budget for the Central Waste Management Facility for 2014 is outlined in Table 6.1 below.
TABLE 6.1: SUMMARY OF FINANCIAL PROVISIONS 2014
Item 2014 budget
CWMF - Landfill operation 295,033
CWMF - Recycling centre operation 360,866
CWMF - Compost operation 91,724
Total 747,623
6.2 Report on the use of a portion of the waste charges and gate fees on appropriate environmental improvement projects.
The Community Fund was a result of the Government Policy Statement on waste management “Changing Our
Ways” - Local authorities working in partnership with local communities to mitigate the impact of waste
management facilities on these communities through appropriate environmental improvement projects. An
amount of €1.27 (index linked) per tonne of waste accepted for disposal at the landfill was allocated to the fund.
There is a formal structure in place for distribution of the Fund, which was agreed with the Community Liaison and
Monitoring Committee (CLMC). Three members of the CLMC sit on a fund adjudication panel, along with three
external members. Up to and including tranche 4, eligible local communities (Inagh, Cloonanaha and Kilnamona)
applied to the committee for funding for community projects. Applications were assessed by the committee, with a
weighting criteria applied; projects nearest to the facility carried the greatest weighting. The approach to
distribution of the final tranche (5) was changed with the agreement of the committee. Tranche 5 was distributed
during 2014 to residences within a 1.5km radius of the centre of the landfill footprint (filled area) for home
improvement projects of an environmental/energy saving nature.
6.3 Review of Environmental Liabilities.
An environmental liability risk assessment was carried out for the facility during 2009. The report of this assessment
was submitted to the EPA during 2009. Clare County Council submitted revised closure costs as part of the interim
CRAMP submitted to the Agency in December 2011. Ongoing measures to protect against the risk of environmental
damage are outlined in the Site Procedures Manual and in the EMP for the facility (see also section 7.2 below).

Page 30 of 56
7. REVIEW
7.1 Nuisance Controls.
Controls are in place to minimise nuisance from litter, birds, vermin, fires, vehicles, odours, dust, visual intrusion
and noise associated with activities at the site. A complaints register is maintained at the facility, located in the site
administration office. Control measures are described below under separate headings for each nuisance type:
7.1.1 Litter Control
Daily litter inspections are still ongoing within the site. Loose material is gathered and disposed of regularly to keep the
site tidy. For main roads outside the facility boundary, periodic cleanups are arranged with the assistance of the
Area Roads staff. For health and safety reasons, this work must be carried out by a team under the supervision of
suitably trained staff.
7.1.2 Birds
Clare County Council employed Falcon Bird Control to control bird activities on site up to completion of earthworks on
the last filled cell, in July 2012. Bird control measures are no longer required at the facility.
7.1.3 Vermin
Curtin Pest Control is employed by Clare County Council to control vermin. The company carries out monthly
inspections on site and maintains a baiting programme to control rat or mice infestations. Details of the inspections
and baiting programme are kept on file at the facility.
7.1.4 Fires
Adequate fire fighting equipment capable of handling small outbreaks of fire is maintained on site. Site staff are
trained in the use of the equipment. In the event that a fire breaks out, it will be treated as an emergency and dealt
with immediately. The county Fire Brigade and the EPA will be contacted in the event of any fire incident.
7.1.5 Vehicles
All roads around the Civic Amenity area, the access roads to the flare and the old stormwater pond are tarred. Access
roads around the landfill footprint are stone-coated. Until the completion of earthworks on the last filled cell, these
roads were regularly cleaned and scraped with fresh stone applied as required. However as heavy vehicles no longer
access internal roads around the landfill area, the haul roads around the landfill footprint are not currently maintained
except for regular wetting to suppress dust during periods of prolonged dry weather.
7.1.6 Odours
Waste odours:
The landfill is closed. Small quantities of wet waste are accepted in the civic amenity site, for temporary storage in a
closed container prior to removal by a third party contractor. This container is closed and sealed at the end of every
Page 31 of 56
work shift and is removed from site twice per week. No odours have been detected by the odour patrol or by site staff
since November 2011.
Landfill Gas Odours:
The landfill is closed and capped. Landfill gas odours are controlled by continuous extraction from 70 gas wells located
at spaced intervals throughout the waste body. Potential odours from the main point sources (leachate riser pipes) are
controlled by means of specially-designed seals on the pipe ends combined with gas extraction from the pipes. Potential
odours from the wells at the weakest point where the wells exit the LDPE liner are controlled via outer rings containing
wetted bentonite clay. Odour Monitoring Ireland carried out surface VOC profile surveys on the landfill cap on one
occasion during 2014, after agreement was received to reduce the assessment frequency to once per annum. No
emissions were detected.
No odours were detected during 2014. Up to August 2014, daily odour patrols were carried out on-site and offsite by a
member of site staff accompanied by a Council employee based in the environment section in Ennis. The procedure was
modified in August 2014, with the approval of the Agency. Daily odour patrols are now carried out within the site only.
In the event that odours are detected on site, this will trigger a full off site patrol.
A monthly odour report is completed by site staff and retained on file in the administration office. This report provides
useful summary information in relation to odour performance and the effectiveness of the various odour control
measures employed at the facility.
7.1.7 Dust
Site access roads are water-sprayed in dry weather to suppress dust. Ambient dust monitoring is carried out three
times per annum at four boundary locations in accordance with the conditions of the waste licence. All results for
2014 were within the ambient dust limit of 350mg/m2 per day. See Section 4.4 for further details.
7.1.8 Visual Intrusion
The principal method of limiting visual intrusion is by the retention of a screening belt of trees around the site. The site
entrance and access roads are also landscaped to minimise visual intrusion. The earthen embankments surrounding the
landfill area to the east, west and north of the site were raised some years ago and new screening embankments were
constructed as part of the phase 3 development works. All embankments have been grassed and planted with Scots
Pine and Sitka Spruce.
7.1.9 Noise
Two noise surveys are carried out each year at noise sensitive locations adjacent to the facility. Results indicate that
noise generated by activities at the site complies with licence limits (see section 4.5 for further information).
7.1.10 Complaints Register
No complaints were received at the facility or via the EPA during 2014. The complaints register is located in the site
administration office. The register includes the name of the complainant, the nature of the complaint, the date of

Page 32 of 56
the complaint and the actions taken to remedy the complaint. The site manager signs off completed complaint
forms. The register is available for inspection by members of the public. See Section 7.5 for further details.
7.2 Landfill Environmental Management Plan
The site environmental management plan (EMP) was updated in 2010 to reflect changes in operation of the facility.
The schedule of objectives and targets for the 2010 version of the plan are summarised below. The EMP has since
been revised to take account of the landfill closure. A summary of interim objectives and targets for 2014 is
included in section 7.2.6. A revised five year EMP will be prepared in early 2015, taking into account longer term
objectives for the site. Three key objectives were identified under the 2014 EMP:
7.2.1. Objective 1: Reduce the tonnage of landfill leachate and civic amenity site runoff removed from the facility:
Leachate generated on site is tankered to wastewater treatment plants at Lisdoonvarna, Sixmilebridge and Limerick
Main Drainage plant for treatment. The most successful measure carried out to minimise leachate volumes when
the landfill was operational, was by means of installation of rainflaps on the side slopes of the active cells.
Measures to reduce leachate levels generated in the civic amenity site included:
Diversion of stormwater from the higher level of the civic amenity site to the stormwater pond from the
leachate lagoon.
Modifications to the abandoned vehicle storage area to divert clean runoff from the adjoining slope away
from leachate collection.
It was planned to investigate options for diversion of leachate from the lower civic amenity site area during 2014
but possible changes in future location of skips (on foot of a new tendering process) meant that no action was taken
on this objective during 2014. Further investigations will be made in 2015.
7.2.2. Objective 2: Investigate feasibility of converting landfill gas to compressed natural gas for use as heat or vehicle fuel
Clare County Council participated in a research proposal with the Centre for Biofuelling and Bioenergy to investigate
the feasibility of a project to covert landfill gas into compressed natural gas. Issues identified and informally
communicated to the Council included problems with volume of gas and the presence of contaminants. We are
awaiting further developments/formal report on this project. With the closure of the landfill in November 2011,
this objective has been shelved for the present.
7.2.3. Objective 3: Put in place a forestry management plan for the site
A forestry management plan is in place since mid-2014. LImited felling/tree thinning is expected to take place later
in 2015.
7.3 Programme of Public Information
The following information is held in the site office and in the Environment Section in Aras Contae an Chlair:
A copy of the waste licence and amendments.
All correspondence from the Agency relating to the facility.
Page 33 of 56
All correspondence from Clare County Council to the Agency relating to the facility.
Copies of quarterly monitoring reports.
Copies of annual environmental reports (AER).
Copy of all procedures relating to the facility.
Incident reporting files.
Complaints Register.
A community liaison and monitoring committee (CLMC) was established when the facility opened. The purpose of
the CLMC was to provide a forum for the local community to raise issues in relation to, and to receive regular
updates on, the operation of the facility. The committee consists of members of the local community and local
Councillors. While the landfill was operational, the CLMC met every one to two months in the Inagh National
School hall. When the landfill closed, the meeting frequency was reduced to quarterly. As the landfill has now
been closed for over two years, the meeting frequency was reviewed during 2014 and a revised frequency of twice
yearly meetings was agreed with the committee.
In addition to attending the CLMC meetings, Clare County Council personnel working at or associated with the site
are available to meet with members of the public and answer queries regarding the facility if requested.
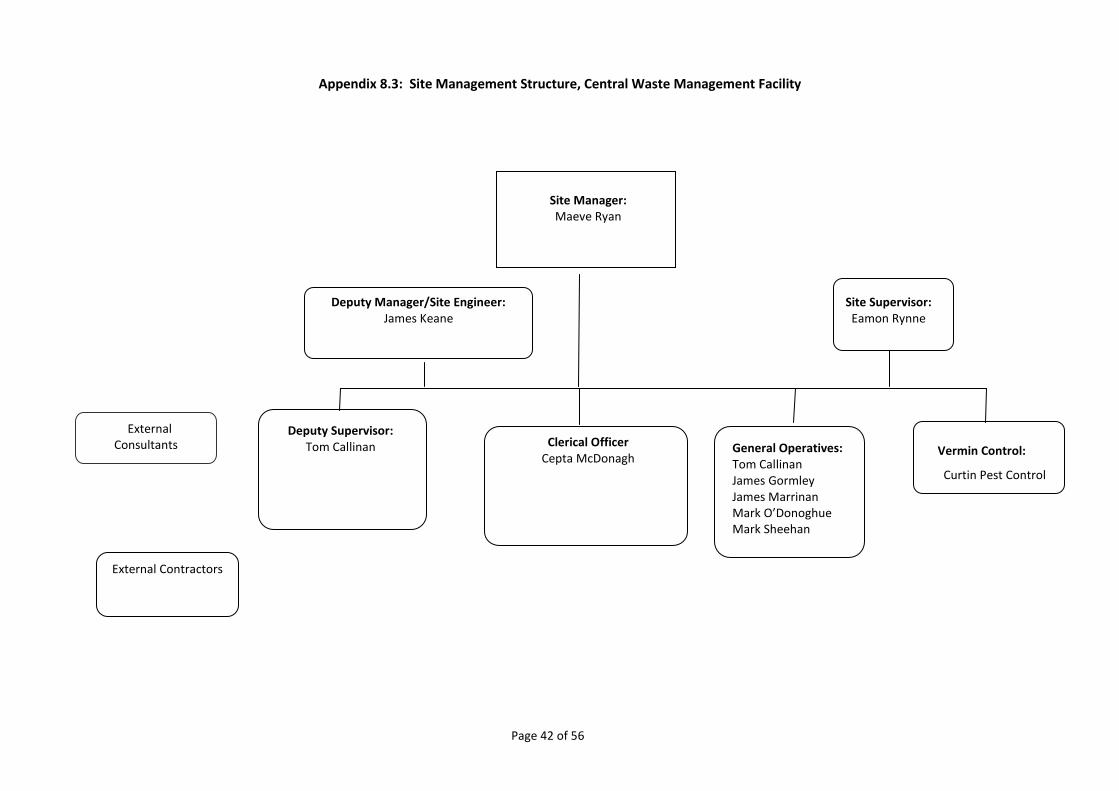
7.4 Management and Staffing Structure
The current management structure is outlined in the chart in Appendix 8.3.
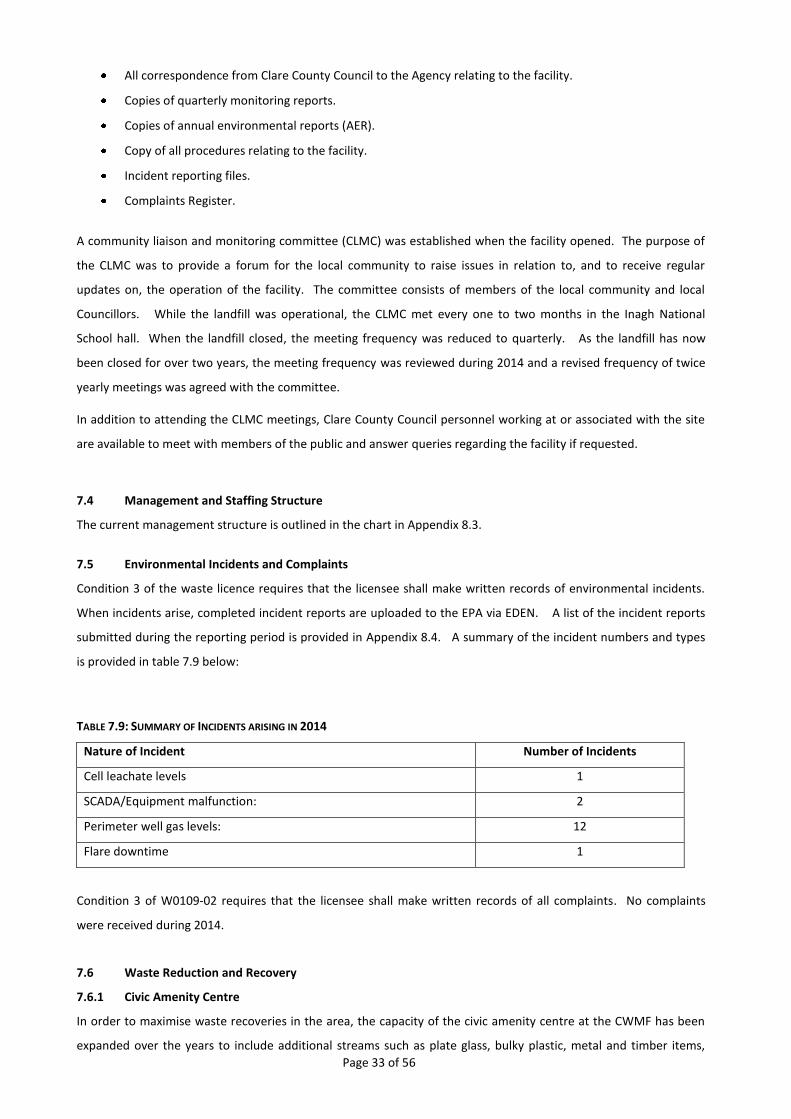
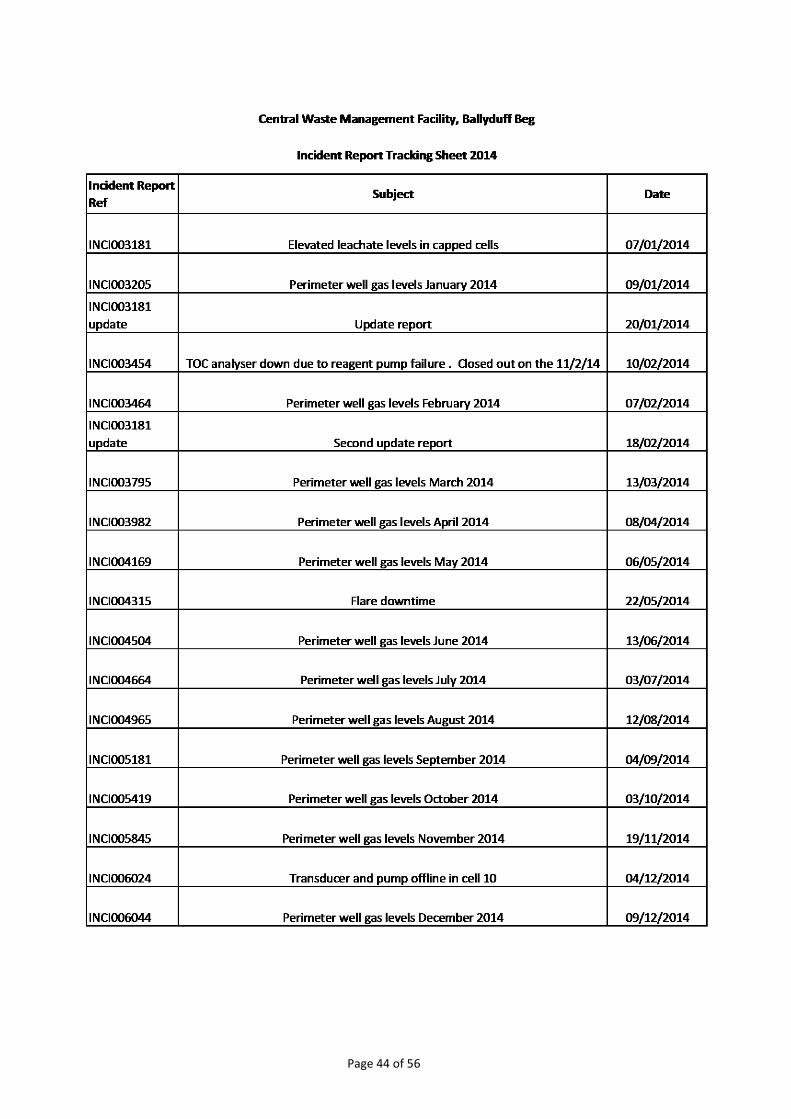
7.5 Environmental Incidents and Complaints
Condition 3 of the waste licence requires that the licensee shall make written records of environmental incidents.
When incidents arise, completed incident reports are uploaded to the EPA via EDEN. A list of the incident reports
submitted during the reporting period is provided in Appendix 8.4. A summary of the incident numbers and types
is provided in table 7.9 below:
TABLE 7.9: SUMMARY OF INCIDENTS ARISING IN 2014
Nature of Incident Number of Incidents
Cell leachate levels 1
SCADA/Equipment malfunction: 2
Perimeter well gas levels: 12
Flare downtime 1
Condition 3 of W0109-02 requires that the licensee shall make written records of all complaints. No complaints
were received during 2014.
7.6 Waste Reduction and Recovery
7.6.1 Civic Amenity Centre
In order to maximise waste recoveries in the area, the capacity of the civic amenity centre at the CWMF has been
expanded over the years to include additional streams such as plate glass, bulky plastic, metal and timber items,

Page 34 of 56
household green waste and household inert rubble. The list of materials now accepted at the facility is provided
below:
Cardboard and paper Tetrapaks
Plastic bottles Hard plastic
Glass bottles Sheet glass
Steel and aluminium cans Large metal items
Timber items Textiles
Disposable Light bulbs Fluorescent tubes and long-life bulbs
Waste engine oil Waste cooking oil
Car batteries Household and dry cell batteries
Paint/Varnish/pesticides etc WEEE
Household green waste
7.6.2 Composting Facility
Garden waste composting commenced in January 2006. Members of the public bring clean green waste (e.g. grass
cuttings, hedge trimmings, leaves) to the CWMF CA site. Green waste from the CA sites at Lisdeen, Shannon and
Ennis and from Clare County Council’s gardening and roads sections is brought to the CWMF site for composting.
The material is first processed on site to remove litter and other unsuitable items and to separate branches from
fines. Branches are chipped using a wood chipper. The chipped product is mixed with the green waste fines and
placed in the site augur mix, which loads the material by conveyor onto one of two aerated static piles. Air is
continuously drawn through the piles by means of an air blower to provide the oxygen needed to break down the
waste. The temperature of the static pile is monitored weekly to maintain optimum composting conditions. Each
pile is turned to ensure even decomposition. After approximately twelve weeks, a mature compost product is
formed. This product is mainly used within the site as a soil conditioner. Site compost is tested on a quarterly basis
in accordance with W0109-02. The CWMF has accepted approximately 2,875 tonnes of green waste for
composting since 2006. 475 tonnes* of green waste was received during 2014. This total is an estimate only as
green waste brought directly to the CWMF facility by private customers is not weighed.
7.7 Report on Biodegradable Waste Diversion from Landfill
With the interim closure of the landfill in November 2011, the BMW diversion target is not directly relevant to this
facility. The Council continues to promote composting by means of the Green Schools programme. Composters are
sold at each of the recycling centres. The CWMF CA site accepts green waste from householders for composting on
site. The waste enforcement section of Clare County Council continues its enforcement of the Food Waste
Regulations to ensure that commercial facilities carry out food waste separation at source. Acceptance of food
waste from domestic customers was rolled out at the facility in February 2015.
Note *: This is an approximate figure as green waste brought directly to the CWMF site by private customers is not weighed.
Page 35 of 56
7.8 Report on progress in meeting the requirements of the Landfill Directive
The landfill is closed. The civic amenity site continues to accept recyclable waste, including household hazardous
waste for offsite recycling/recovery and garden waste for onsite recovery. The site is managed in such a way as to
maximise recycling by the public. Customer use of the wet waste container is supervised by site staff to ensure as
far as possible that recyclable items are not placed in this container.
7.9 Statement on the achievement of the waste acceptance and treatment obligations of W0109-02.
The landfill is closed. Waste brought to the civic amenity site by domestic customers is monitored by site staff who
instruct and advise the public on appropriate disposal/recycling. A leaflet has been printed showing the various
streams that can be recycled at the facility. This leaflet is handed out at the pay kiosk by site staff.
7.10 Statement of compliance with relevant updates of the Regional Waste Management Plan.
The Regional Waste Management Plan was last updated in 2005. A draft revised plan has been published for
consultation. The Central Waste Management Facility remains compliant with the original Plan. Although the
landfill is closed, the site continues to provide recycling and recovery facilities for the general public for nineteen
different waste streams including household chemical waste, waste oil and other hazardous waste.
7.11 Updates/amendments to Odour Management Plan.
The Odour Management Plan (OMP) was reviewed and revised during 2014, with Agency agreement. The most
recent plan revision allows for elimination of the requirement for daily offsite odour patrols. These patrols were
carried out by a member of site staff accompanied by a member of staff from the Council’s environment section. A
revised odour patrol regime is now in place, with daily patrols carried out by site staff within the facility boundary.
Under the revised OMP, there is provision for offsite patrols to be carried out in the event of problems arising.

8. APPENDICES

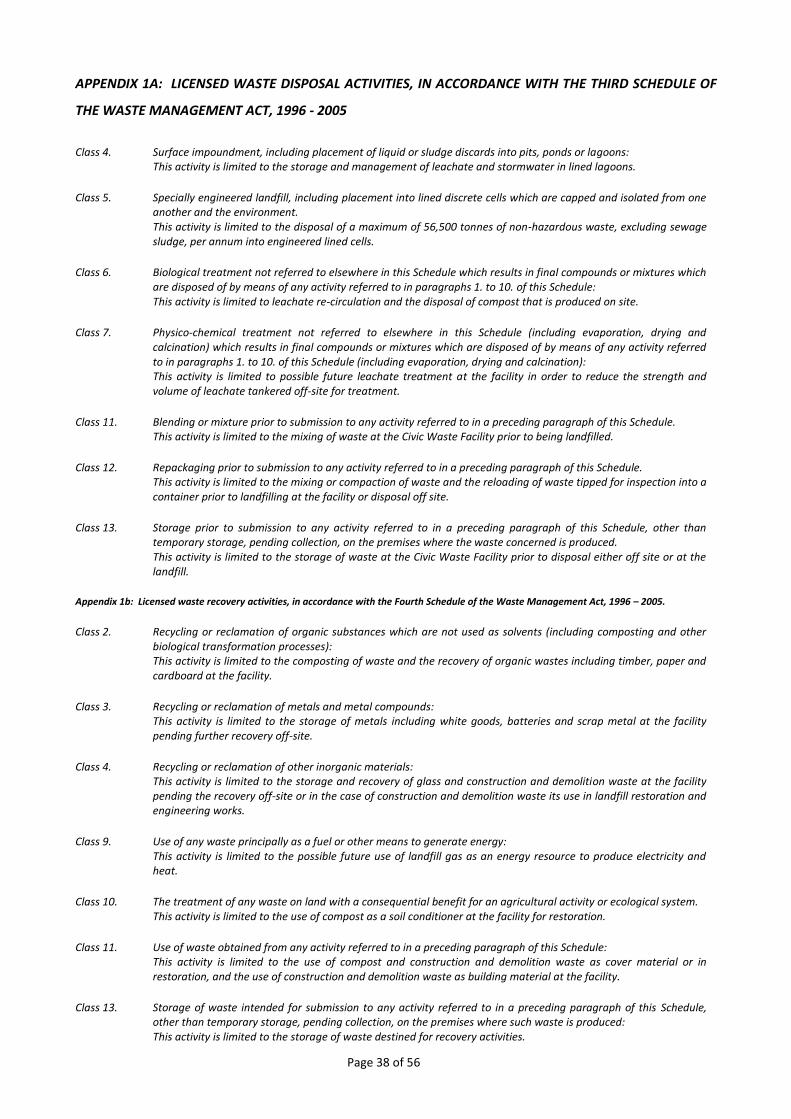
8.1 Licensed Activities at CWMF
Page 38 of 56
APPENDIX 1A: LICENSED WASTE DISPOSAL ACTIVITIES, IN ACCORDANCE WITH THE THIRD SCHEDULE OF
THE WASTE MANAGEMENT ACT, 1996 - 2005
Class 4. Surface impoundment, including placement of liquid or sludge discards into pits, ponds or lagoons: This activity is limited to the storage and management of leachate and stormwater in lined lagoons.
Class 5.
Specially engineered landfill, including placement into lined discrete cells which are capped and isolated from one another and the environment. This activity is limited to the disposal of a maximum of 56,500 tonnes of non-hazardous waste, excluding sewage sludge, per annum into engineered lined cells.
Class 6. Biological treatment not referred to elsewhere in this Schedule which results in final compounds or mixtures which are disposed of by means of any activity referred to in paragraphs 1. to 10. of this Schedule: This activity is limited to leachate re-circulation and the disposal of compost that is produced on site.
Class 7. Physico-chemical treatment not referred to elsewhere in this Schedule (including evaporation, drying and calcination) which results in final compounds or mixtures which are disposed of by means of any activity referred to in paragraphs 1. to 10. of this Schedule (including evaporation, drying and calcination): This activity is limited to possible future leachate treatment at the facility in order to reduce the strength and volume of leachate tankered off-site for treatment.
Class 11. Blending or mixture prior to submission to any activity referred to in a preceding paragraph of this Schedule. This activity is limited to the mixing of waste at the Civic Waste Facility prior to being landfilled.
Class 12. Repackaging prior to submission to any activity referred to in a preceding paragraph of this Schedule. This activity is limited to the mixing or compaction of waste and the reloading of waste tipped for inspection into a container prior to landfilling at the facility or disposal off site.
Class 13. Storage prior to submission to any activity referred to in a preceding paragraph of this Schedule, other than temporary storage, pending collection, on the premises where the waste concerned is produced. This activity is limited to the storage of waste at the Civic Waste Facility prior to disposal either off site or at the landfill.
Appendix 1b: Licensed waste recovery activities, in accordance with the Fourth Schedule of the Waste Management Act, 1996 – 2005.
Class 2. Recycling or reclamation of organic substances which are not used as solvents (including composting and other biological transformation processes): This activity is limited to the composting of waste and the recovery of organic wastes including timber, paper and cardboard at the facility.
Class 3. Recycling or reclamation of metals and metal compounds: This activity is limited to the storage of metals including white goods, batteries and scrap metal at the facility pending further recovery off-site.
Class 4. Recycling or reclamation of other inorganic materials: This activity is limited to the storage and recovery of glass and construction and demolition waste at the facility pending the recovery off-site or in the case of construction and demolition waste its use in landfill restoration and engineering works.
Class 9. Use of any waste principally as a fuel or other means to generate energy: This activity is limited to the possible future use of landfill gas as an energy resource to produce electricity and heat.
Class 10. The treatment of any waste on land with a consequential benefit for an agricultural activity or ecological system. This activity is limited to the use of compost as a soil conditioner at the facility for restoration.
Class 11. Use of waste obtained from any activity referred to in a preceding paragraph of this Schedule: This activity is limited to the use of compost and construction and demolition waste as cover material or in restoration, and the use of construction and demolition waste as building material at the facility.
Class 13. Storage of waste intended for submission to any activity referred to in a preceding paragraph of this Schedule, other than temporary storage, pending collection, on the premises where such waste is produced: This activity is limited to the storage of waste destined for recovery activities.

Page 39 of 56
8.2 Water Balance Calculation

Page 40 of 56
Page 41 of 56
8.3 Management Structure
Page 42 of 56
Appendix 8.3: Site Management Structure, Central Waste Management Facility
Site Manager: Maeve Ryan
Clerical Officer Cepta McDonagh
External Contractors
Vermin Control:
Curtin Pest Control
Deputy Supervisor:
Tom Callinan
External Consultants
Site Supervisor: Eamon Rynne
Deputy Manager/Site Engineer: James Keane
General Operatives: Tom Callinan James Gormley James Marrinan Mark O’Donoghue Mark Sheehan
Page 43 of 56
8.4 Summary Details of Incident Reports Issued During 2014
Page 44 of 56
Page 45 of 56
8.5 Monitoring Point Location Map
Page 46 of 56

Page 47 of 56
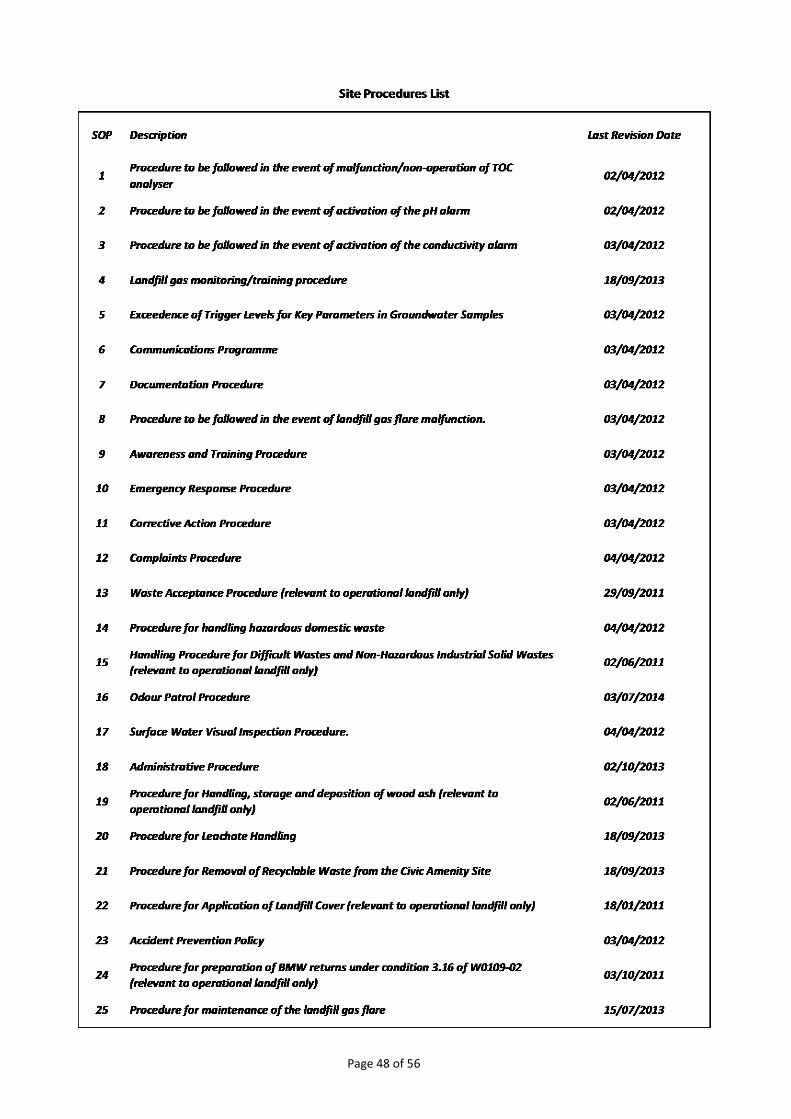
8.6 List of Site Standard Operating Procedures
Page 48 of 56
Page 49 of 56
8.7 Landfill Gas Survey Returns for 2014
Page 50 of 56

Page 51 of 56

Page 52 of 56
Page 53 of 56
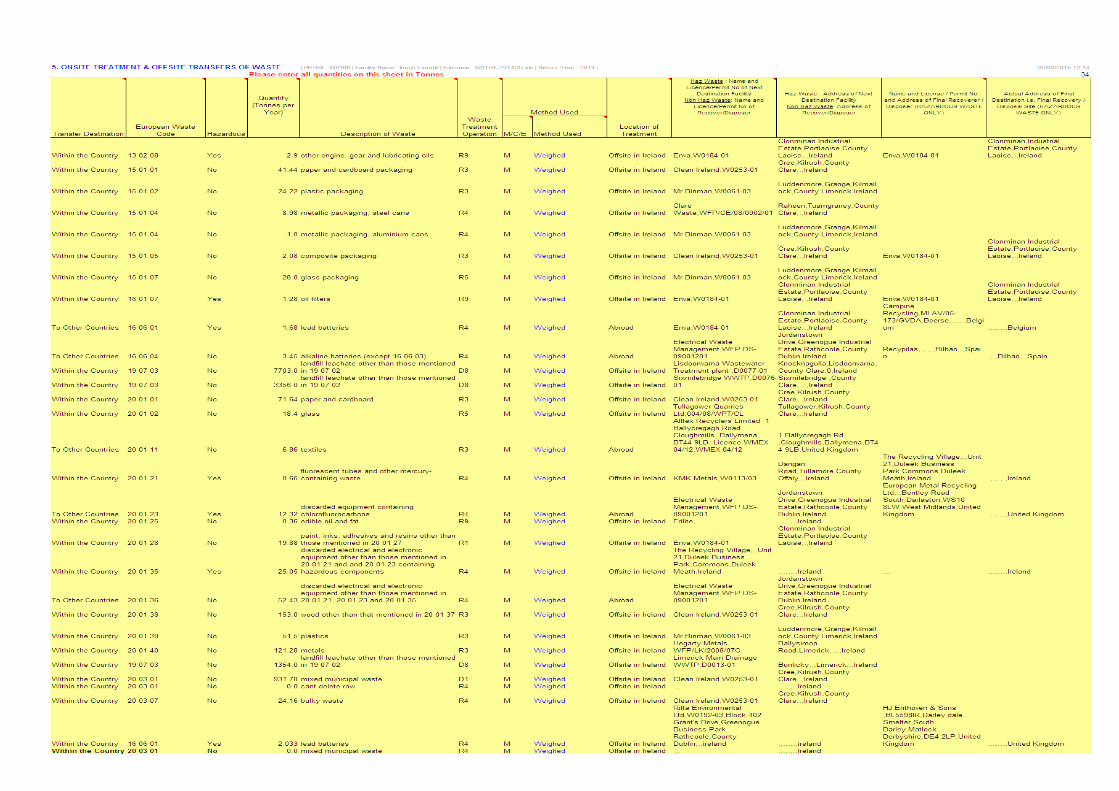
8.8 PRTR Returns for 2014

Page 54 of 56
Page 55 of 56
Page 56 of 56