annual economic value of tournament and non-tournament
TRANSCRIPT
Annual Economic Value of Tournament and Non-tournament Angling at Sam Rayburn Reservoir
by
Todd Driscoll, Jeremy Leitz, and Randy Myers
MANAGEMENT DATA SERIES No. 256
2010
Texas Parks and Wildlife Department Inland Fisheries Division 4200 Smith School Road
Austin, Texas 78944
i
ACKNOWLEDGEMENTS Funding for this study was provided through a Federal Aid in Sport Fish
Restoration Grant (F-30-R) to the Texas Parks and Wildlife Department (TPWD) and by the Jasper County Development District #1 (JCDD). Fred Barnett was the point of contact for JCDD and was instrumental to the success of this study. We are also grateful for the cooperation and participation of Get Reel Bass Anglers (Joe Murphy and Johnny McKee), Texas Forest Country Bass Circuit (John Salamone), Bass N Bucks (Dave and Tricia Concienne), Bass Champs (Jeff Welch), and Sealy Outdoors McDonald’s Big Bass Splash (Bob and Nicole Sealy), and all Sam Rayburn Reservoir anglers that returned economic questionnaires. Lakecaster editor Patty Lenderman provided tournament-related contacts and encouraged angler participation in this study. The authors appreciate assistance provided by TPWD colleagues: John Taylor provided assistance with consumer surplus analyses; Dan Ashe, Mike Ratcliff, Joe Moorhead, and Ray Lenderman assisted with over 7,000 individual mailings; and Craig Bonds and John Dennis provided helpful reviews of this report.
ii
EXECUTIVE SUMMARY
Sam Rayburn Reservoir has consistently provided high quality angling opportunities for multiple fish species and is regarded as a premier fishing destination in Texas. It is among the largest reservoirs in the southeastern United States at 111,422 acres and is located in a relatively rural area along the Texas-Louisiana border. The cities of Jasper (population = 7,276) and Lufkin (population = 33,522), Texas are within a 30-minute drive of the reservoir; the Houston, Texas metropolitan area is 130 miles to the southwest. Unlike many central and west Texas reservoirs, Sam Rayburn has not experienced drought-induced low water levels, which can negatively affect fisheries.
Demand for water in Texas is increasing with the state’s rapidly growing
human population. Inter-basin transfers of water from East Texas, including Sam Rayburn Reservoir, have been proposed to alleviate water deficits projected elsewhere in the state (TWDB 2006). Water transfer from Sam Rayburn Reservoir could yield a lower water level, which would negatively impact the reservoir’s fisheries. Therefore, it is vital to determine the economic value of angling at individual reservoirs such as Sam Rayburn so that angling interests are appropriately considered when compared to municipal, industrial, and agricultural water uses.
Largemouth bass tournaments comprise a substantial component of the
reservoir’s fishery. An estimated 52% of all Sam Rayburn Reservoir anglers participate in tournaments (Bohnsack and Ditton 1999). Tournaments at the reservoir vary greatly in magnitude, ranging from small, local club, single-day events with less than 50 participants to highly-publicized, multi-day events attracting thousands of anglers, including some from distant locations. Previous research concluded that tournaments have negligible effects on the largemouth bass population at Sam Rayburn Reservoir (Driscoll et al. 2007).
Angler expenditures for lodging, food, fuel, and tackle generate substantial
revenue for communities located near popular waters and support angling-related businesses and jobs. The economic contribution of tournament anglers at Sam Rayburn Reservoir relative to non-tournament anglers is unknown, and the type and location of expenditures likely differ between the two angler types. Quantifying these differences would allow local communities to identify and prioritize funds and activities to improve infrastructure and promote economic development associated with recreational angling.
The Jasper County Development District #1 donated funds for this study,
which was conducted by Texas Parks and Wildlife Department. From November 2007 to October 2008 a census of tournaments and a creel survey were conducted with Sam Rayburn Reservoir anglers completing questionnaires concerning their angling trips and expenditures. These data were used to
iii
determine 1) the total annual angling expenditures, recreational value, and economic impact of recreational angling, 2) the annual number of black bass tournaments and associated participants at Sam Rayburn Reservoir, and 3) the annual direct expenditures, recreational value, and economic impact of black bass tournaments. Expenditures were examined by location of expense (Jasper County, five other counties surrounding Sam Rayburn Reservoir, other counties in Texas, or out-of-state) and angler residence (local, nonlocal, or out-of-state).
The main findings of this study were:
• Total economic value of the fishery was estimated at US$47.1 million. • Angling expenditures totaled US$32.3 million for all angler types. • Angling expenditures for tournament anglers totaled US$23.7 million (73%
of all angler expenditures). The total economic value of tournament angling was US$31.0 million.
• Angling expenditures by tournament anglers resulted in US$39 million in
output to the state of Texas from direct, indirect, and induced effects. These impacts include US$12.8 million in labor income, US$23.6 million of value added, and 486 full- or part-time jobs.
• Angling expenditures for non-tournament anglers totaled US$8.6 million.
The total economic value of non-tournament angling was US$16.1 million. • Angling expenditures by non-tournament anglers resulted in US$13 million
in output to the state of Texas from direct, indirect, and induced effects. These impacts include US$4 million in labor income, US$8 million of value added, and 159 full- or part-time jobs.
• Annual angling days were 76,418 for tournament anglers and 119,856 for
non-tournament anglers. • 53% of tournament angling days were specifically to prepare (i.e., practice
days) for tournament events scheduled to occur within 30 days. • A total of 405 tournament events were held with 25,396 total participants.
Of these, 304 were conducted by “bass clubs” (<50 participants), 82 by “lower open organizations” (>50 participants with entry fee <US$130), and 18 by “upper open organizations” (>50 participants with entry fee >US$130).
• On average, “bass club” tournament anglers spent US$120 and US$86,
“lower open” tournament anglers spent US$165 and US$69, and “upper open” tournament anglers spent US$190 and US$88 per tournament and
iv
practice day, respectively. On average, non-tournament anglers spent US$68 per fishing day.
• Of all tournaments, The Sealy Outdoors McDonald’s Big Bass Splash 3-
day event had the most participants at 3,892 and accounted for the largest angling expenditure for a single event at US$6.3 million. Total economic value of the event was estimated at US$8.0 million.
• Average overall expenditure per tournament event was US$306,593 for
“upper opens”, US$109,419 for “lower opens”, and US$9,409 for “bass clubs”.
• Tournament anglers spent US$12.3 million (52% of total) in Jasper
County, US$7.1 million (30%) in the other five counties surrounding the reservoir, US$3.7 million (15%) elsewhere in Texas, and US$600,000 (2%) out-of-state.
• Including direct, indirect, and induced effects, expenditures by tournament
anglers resulted in US$16 million in output to Jasper County (US$5 million in labor income, US$9.5 million of value added, and 294 full- or part-time jobs) and US$10 million in output to the five other counties surrounding Sam Rayburn Reservoir (US$3 million in labor income, US$6 million of value added, and 153 full- or part-time jobs).
• A total of 70% of tournament anglers resided outside the local six-county
area and 13% were from out-of-state. These nonlocal tournament anglers accounted for 78% of the total tournament-related angling expenditures.
• Tournament anglers spent US$5.8 million for tournament entry fees,
US$5.2 million for automobile operation, and US$3.9 million for boat operation. These were the three highest categorical expenses for tournament anglers and accounted for 63% of all expenses incurred by tournament anglers.
• Non-tournament anglers spent US$4.1 million (48% of total) in Jasper
County, US$2.3 million (27%) in the other five counties surrounding the reservoir, US$1.7 million (20%) elsewhere in Texas, and US$400,000 (5%) out-of-state.
• Including direct, indirect, and induced effects, expenditures by non-
tournament anglers resulted in US$5 million in output to Jasper County (US$1.5 million in labor income, US$3 million of value added, and 87 full- or part-time jobs) and US$3 million in output to the five other counties surrounding Sam Rayburn Reservoir (US$1 million in labor income, US$1.9 million of value added, and 48 full- or part-time jobs).

v
• Of the non-tournament anglers, 41% were local, 45% resided in Texas but outside the local 6-county area, and 14% were from out-of-state.
• Non-tournament anglers spent US$2.3 million for automobile operation,
US$1.4 million for boat operation, and US$1.1 million for lodging. These three categories represented 56% of all non-tournament angler expenses.
vi
TABLE OF CONTENTS Acknowledgements...........................................................................................................i Executive summary.......................................................................................................... ii Introduction ..................................................................................................................... 1 Methods .......................................................................................................................... 2 Results ............................................................................................................................ 8 Discussion..................................................................................................................... 14 Literature cited .............................................................................................................. 19 Tables ...................................................................................................................... 22-35
Bass club events and participants (Table 1)....................................................... 22 Open tournaments and participants (Table 2) .................................................... 24 Bass club angler expenditures (Table 3) ............................................................ 25 Lower open tournament angler expenditures (Table 4)...................................... 26 Upper open tournament angler expenditures (Table 5)...................................... 27 Sealy Outdoors McDonalds Big Bass Splash
angler expenditures (Table 6) .......................................................................... 28 Tournament angler expenditures by categories (Table 7) .................................. 29 Tournament angler expenditures by residence (Table 8) ................................... 31 Economic value for tournament angling (Table 9) .............................................. 31 Non-tournament angler expenditures by categories (Table 10).......................... 32 Economic value for non-tournament angling (Table 11)..................................... 34 Expenditures by categories (all anglers combined) (Table 12)........................... 34 Economic value (all anglers combined) (Table 13)............................................. 35 Expenditures by residence (all anglers combined) (Table 14)............................ 35
Appendix A
Tournament angler questionnaire....................................................................... 36 Appendix B
Non-tournament angler questionnaire ................................................................ 43 Appendix C Individual results of five specific tournaments .................................................... 49
1
INTRODUCTION
Demand for water in Texas is rapidly increasing due to human population growth. The population of Texas is predicted to exceed 45 million people in 2060, more than double the 21 million present in 2000 (TWDB 2006). In 2060, the projected water demand of 21.6 million acre-feet will exceed the available supply of 14.6 million acre-feet (TWDB 2006). Based on input from 16 regional planning groups, the Texas Water Development Board prepares water use plans every five years that recommend water management strategies and projects to address projected deficits.
The East Texas region is projected to have sufficient supply to meet its
water demands in 2060. However, the majority of regions are projected to have water deficits. Inter-basin water transfers have been proposed to alleviate deficits in some regions (TWDB 2006). As water demand surpasses supply in other areas of the state, there will be increased pressure to transfer water out of the East Texas region, including Sam Rayburn Reservoir.
Angling activities make a substantial contribution to the economies of most
states. In 2006, 2.5 million anglers spent US$3.2 billion in Texas (USFWS 2006). Economic impact studies of angling at individual Texas reservoirs have been conducted to ensure that angling interests are appropriately considered when compared to municipal, industrial, and agricultural water uses (i.e., Schorr et al. 1995; Hunt et al. 1996; Thailing and Ditton 2000). Anderson et al. (2002a) estimated the annual economic value of recreational fishing at Sam Rayburn Reservoir to be US$15.1 million in 2001, but they concluded that value was underestimated because the study design inadequately represented contributions of black bass Micropterus spp. tournaments.
Black bass tournament angling is popular at Sam Rayburn Reservoir.
Anderson et al. (2002a) estimated 52% of all anglers at Sam Rayburn Reservoir participate in black bass tournaments compared to only 14% of all Texas anglers (Bohnsack and Ditton 1999). In 2008, over 300 bass tournaments were conducted at the reservoir with tournament angling (including practice trips) comprising 45% of black bass angling effort (Texas Parks and Wildlife Department, unpublished data). In 2001, direct expenditures associated with the Bass N Bucks tournament and the Texas BASS Federation State Championship tournament were US$237,724 and US$235,928, respectively (Anderson et al. 2002b; Anderson et al. 2002c). If 37 similar tournaments were conducted annually, direct expenditures from tournaments alone would exceed the annual direct expenditures Anderson et al. (2002a) estimated for all anglers. Annual economic contributions of black bass tournaments are needed to estimate economic impacts of all recreational angling at Sam Rayburn Reservoir.
Knowledge of economic contributions of tournament and non-tournament
anglers can improve local resource management. For example, when considering fisheries management activities that may decrease tournament frequency (e.g.,
2
restrictive length limits), the biological benefits to the fish population can be weighed against potential economic losses. Furthermore, local communities can use these estimates to better prioritize funds and activities that promote local economic development associated with recreational fishing.
We found only one study that estimated tournament anglers’ annual
expenditures at a reservoir (Dennis et al. 2006), and no studies have estimated the annual economic value and impact of tournaments. The significance of economic impact associated with tournaments is widely discussed at Sam Rayburn Reservoir but is unknown. Therefore, from November 2007 through October 2008 we estimated 1) the annual number of black bass tournaments and associated participants at Sam Rayburn Reservoir, 2) the annual direct expenditures, recreational value, and economic impact of black bass tournaments to local counties surrounding Sam Rayburn Reservoir and to Texas, and 3) the total annual direct expenditures, recreational value, and economic impact of recreational angling to local counties surrounding Sam Rayburn Reservoir and to Texas.
METHODS
Annual numbers of tournaments and participants A census of bass tournaments at Sam Rayburn Reservoir quantified total
number of tournament participants from November 2007 to October 2008. Because tournaments vary widely in terms of size, they were classified into two general types: bass club tournaments and open tournaments. Bass club tournaments were smaller (< 50 participants), non-profit events requiring a club membership for participation. Bass clubs were identified via Texas Parks and Wildlife Department roving creel surveys, the tournament permit database maintained by the U.S. Army Corps of Engineers (controlling authority at Sam Rayburn Reservoir), and lists of statewide bass club affiliates (i.e., Texas Association of Bass Clubs, Texas B.A.S.S. Federation). Bass clubs were contacted by e-mail or telephone regarding annual tournament participation at Sam Rayburn Reservoir and asked to provide the number of tournaments hosted and the number of anglers participating in each tournament. The average number of events and participants per event from responding clubs was used to estimate corresponding values for non-responding bass clubs.
Open tournaments were large events (> 50 participants) with few
restrictions on eligibility. These events were typically conducted by for-profit organizations that advertised event schedules and results to maximize participation. For most tournaments, event frequency and total number of anglers were retrieved from web sites and other publications (e.g., local newspapers and Lakecaster newsletter). Otherwise, tournament organizers were contacted and asked to report the number of anglers in each event.
3
Economic value of tournaments Typically, economic value of recreational angling is defined as the value, above direct expenditures, that anglers are willing to pay (Steinback 1999). Direct expenditures and consumer surplus (CS, willingness to pay above trip costs) of black bass tournament anglers was estimated via mail-out questionnaires. Names and addresses were collected from tournament anglers encountered during roving creel surveys and supplemental surveys at boat ramps, and five tournaments at Sam Rayburn Reservoir (one bass club tournament, three upper open tournaments, and the Sealy Outdoors McDonald’s Big Bass Splash [BBS]). Several lower open tournaments were asked to participate but declined.
Creel sampling consisted of stratified-random, non-uniform probability, roving surveys (Malvestuto et al. 1978; Malvestuto 1996). Surveys occurred on nine days per quarter for a total of 36 days during the study period. Sampling days were stratified by weekend (20 days sampled) and weekday (16 days sampled). Each survey day, approximately 33% of the reservoir (two of six creel sections) was randomly selected and sampled. To maximize angler contacts, creel sections were assigned seasonal, non-uniform probabilities derived from angler count data from 1999-2003. Only one name and address was recorded from each interviewed party. Supplemental surveys, at four of eight existing boat ramps, were conducted three days per quarter to obtain more angler names and addresses.
Each identified participant was mailed a questionnaire regarding
expenditures and willingness-to-pay (Appendix A) and a postage-paid return envelope within one month of the tournament. Reminder or thank you postcards were sent to survey participants 10-14 days after the first mailing. A second copy of the questionnaire was sent to each non-respondent two weeks after the postcard mailing. In the case of the Bass Champs tournament and BBS, tournament organizers conducted the mailing of our questionnaires (using their internal mailing lists) and no reminder cards were mailed. A random selection of 984 of the total 3,892 participants in BBS received questionnaires.
Reported angler expenditures were classified according to whether they
related to tournament practice trips (occurring <30 days prior to event) or to the tournament proper. Expenditures were further classified into 14 expense and four location categories. We assumed that direct expenditures for tournament angling parties would increase with tournament size, entry fees, and associated payback. Therefore, open tournaments were further classified by entry fee (< US$130/person, “lower open”; > US$130/person, “upper open”) and averages were calculated for bass club, lower open, and upper open anglers. Because BBS was a unique 3-day tournament with 3,892 participants, angler expenditures were estimated separately for this event. Total expenditures were estimated by tournament type and trip type (practice or tournament event) with the equation:
4
TCE = EXPD * PS * TL * TRIPS
where TCE = total expenditures by category (for each of 14) or location (for each of 4) EXPD = per person, per day average expenditure PS = average party size (people per vehicle) TL = average trip length (days) TRIPS = total estimated number of angler trips
Total trips were estimated by:
TRIPS(Practice) = (TP * PPCT) – (TT/2) or TRIPS(Tournament) = TP – TT/2
where TRIPS(Practice) = total practice trips TRIPS(Tournament) = total event trips TP = total estimated tournament participants PPCT = percent of tournament anglers that practiced TT = participants that traveled with another tournament angler Total annual expenditures for each tournament type were estimated either as the sum of expenses in the 14 expense categories, plus out-of-state expenses:
TAEC = TCE1 + TCE2 +……TCE14 + OS
or as the sum of expenses for the four location categories:
TAEL = TCEJ + TCEL + TCES + OS
where TAEC = total sum of the 14 categorical expenditures and OS OS = out-of-state expenditures
5
TAEL = total sum of expenditures for all locations TCEJ = Jasper County expenditures TCEL = expenditures in other 5 local counties TCES = expenditures elsewhere in Texas Total expenditures for each tournament type were added together to obtain annual expenditures for all tournaments combined.
Similar to methods of Loomis (2006), CS was estimated by asking if anglers would be willing to pay a specific monetary amount (from a predetermined range of potential bid values) above their actual tournament event trip expenses. Again, we expected that CS would predictably increase with higher entry fees and higher potential payback. Potential bid values used were US$10, US$30, US$50, US$75, US$100, US$150, US$200, US$300, and US$400 for bass club anglers; US$20, US$40, US$60, US$100, US$150, US$200, US$300, US$400, and US$500 for lower open anglers; and US$40, US$70, US$100, US$150, US$200, US$300, US$450, US$600, and US$800 for upper open and BBS anglers. We did not specifically estimate CS for tournament practice trips. We assumed that CS for practice trips was equal to that from the actual event trip minus the average tournament entry fee for each tournament type. Logistic regression was used to estimate the average CS (per person, per trip) for each tournament type. The response variable was angler response (yes or no) to the surplus question. The logistic equation was used to determine the bid value that 50% of anglers would accept (i.e., average CS). Total CS for each tournament type was estimated by:
TCS = DCS * TP
where TCS = total CS DCS = average per person, per trip CS TP = total participants for each tournament type.
Consumer surpluses from each tournament type were added together to obtain total tournament-related CS. Total tournament expenditures and total tournament-related CS were added to obtain total economic value of tournaments.
Economic value of non-tournament angling Names and addresses of non-tournament anglers were collected during the
roving creel surveys and surveys at boat ramps described earlier. All non-tournament anglers were sent a questionnaire (Appendix B); reminder postcards were sent if questionnaires were not returned within 10-14 days. A second
6
questionnaire was sent to non-respondents two weeks following the postcard mailing.
Categorical (14) and location (4) expenditures for non-tournament anglers
were estimated for local anglers (residence located in Jasper, Tyler, Angelina, Nacogdoches, San Augustine, or Sabine county), nonlocal anglers (residence elsewhere in Texas or out-of-state) and all anglers with the equation:
TCE = EXPD * TRIPS
where TCE = expenditures by category (for each of 14) or location (for each of 4) EXPD = per person, per day average expenditure TRIPS = total estimated number of one person, one day trips derived from creel surveys
Total annual expenditures by residence location were estimated by:
TAEC = TCE1 + TCE2 +……TCE14 + OS or
TAEL = TCEJ + TCEL + TCES + OS
where TAEC = total sum of the 14 categorical expenditures and OS OS = out-of-state expenditures TAEL = total sum of the location expenditures TCEJ = Jasper County expenditures TCEL = expenditures in other 5 local counties TCES = expenditures elsewhere in Texas Total expenditures for each residence location were added together to obtain annual expenditures for all non-tournament anglers.
We expected CS would predictably increase with the distance between an angler’s residence and Sam Rayburn Reservoir. Potential values were US$10, US$20, US$30, US$50, US$75, US$100, US$150, US$200, and US$250 for local anglers (residence within 60 miles of shoreline) and US$10, US$20, US$30, US$50, US$75, US$100, US$150, US$250, and US$350 for nonlocal anglers.
7
Logistic regression was used to estimate the average CS (per person, per trip) for each tournament type. Total CS by residence location was estimated by:
TCS = DCS/TL * TRIPS
where TCS = total CS DCS = average per person, per trip CS TL = average trip length TRIPS = total number of one person, one day trips Consumer surpluses for local and nonlocal anglers were added together to
obtain total non-tournament CS. Non-tournament expenditures and CS were added together to get total economic value of non-tournament angling.
Total economic value and economic impact of recreational angling The total economic value of recreational angling at Sam Rayburn Reservoir
was calculated as the sum of economic values of tournament and non-tournament angling. Total economic impact of fisheries exceeds expenditures due to circulation of expenditures in the local economy (Weithman 1999). Angler expenditures introduce a change in the output of goods and services and an economic multiplier is used to measure this change to regional economies. Angler expenditures ripple through the economy, increasing economic impact (Anderson et. al. 2002a). Direct impacts include the sales, income, and employment generated by initial purchases made by anglers; indirect impacts arise within industries supplying the directly-affected businesses (Steinback 1999). Induced impacts are economic activities generated by increased incomes as a result of angler expenditures (Anderson et al. 2002a). Total economic output at Sam Rayburn Reservoir (i.e, the sum of direct, indirect and induced impacts) was estimated using the input-output model developed by the Impact Analysis for Planning (IMPLAN) program (Olson and Lindall 1996).
The IMPLAN software describes the economic impact of fishing through
changes in total economic output, income, value added, and employment. Total output is the dollar value of goods and services produced to satisfy final demand, and inter-industry transactions needed to produce those goods and services. Final demand is the dollar value of purchases for final consumption. Value added is equivalent to the gross regional product or the value of total economic output minus input purchases. Therefore, value added is always less than total output, but greater than income (Anderson et al. 2002a).
Input-output IMPLAN models were created to estimate the economic output
of fishing at Sam Rayburn Reservoir. Separate models were created for tournament and non-tournament impacts: in Jasper County, in the surrounding five
8
counties, and in the state of Texas. Calculated impacts are considered conservative since 2004 IMPLAN data were used with survey data from 2007 and 2008. We assumed that dollar values in 2004, 2007, and 2008 were equal.
RESULTS
Survey response rate In all, 3,107 questionnaires were mailed to tournament and non-tournament
anglers. Of the 2,333 tournament mailings, 984 were for BBS, 862 for upper opens, 262 for lower opens, and 225 for club tournaments. Mailings for the BBS (n = 984) and Bass Champs (n = 537) tournaments were conducted by tournament organizers; no follow-up contact occurred and response rate was 15% for BBS and 22% for Bass Champs. The remainder of mailings (n = 1,586) included follow-up contact as necessary (i.e., reminder postcards or a second copy of the questionnaire) and the response rate was 56% (1,586 contacts, 48 undeliverable, 868 returned). The response rate of this set of mailings was similar among quarters (range, 53-60%), 53% for tournament anglers (812 mailings with follow-up contact as necessary, 26 undeliverable, 415 returned) and 60% for non-tournament anglers (774 mailings with follow-up contact as necessary, 22 undeliverable, 453 returned). These response rates, for mailings with follow-up contact, were within the range observed (46-72%) in four similar economic studies at other Texas reservoirs (Hunt et al. 1996; Dennis et al. 2006; Thailing and Ditton 2000; Anderson et al. 2002a).
Some anglers were confused by receipt of more than one questionnaire
over the duration of this study. Our intent was for anglers to report activity and expenditures for specified trips each time they received a questionnaire. Comments on returned questionnaires and discussions with anglers at the reservoir indicated some anglers returned a questionnaire for one angling trip, but discarded subsequent questionnaires seeking information about later trips. Dennis et al. (2006) speculated that similar confusion over multiple mailings may have lowered the response rate (46%) in their study; it likely affected our response rate as well.
Tournament anglers
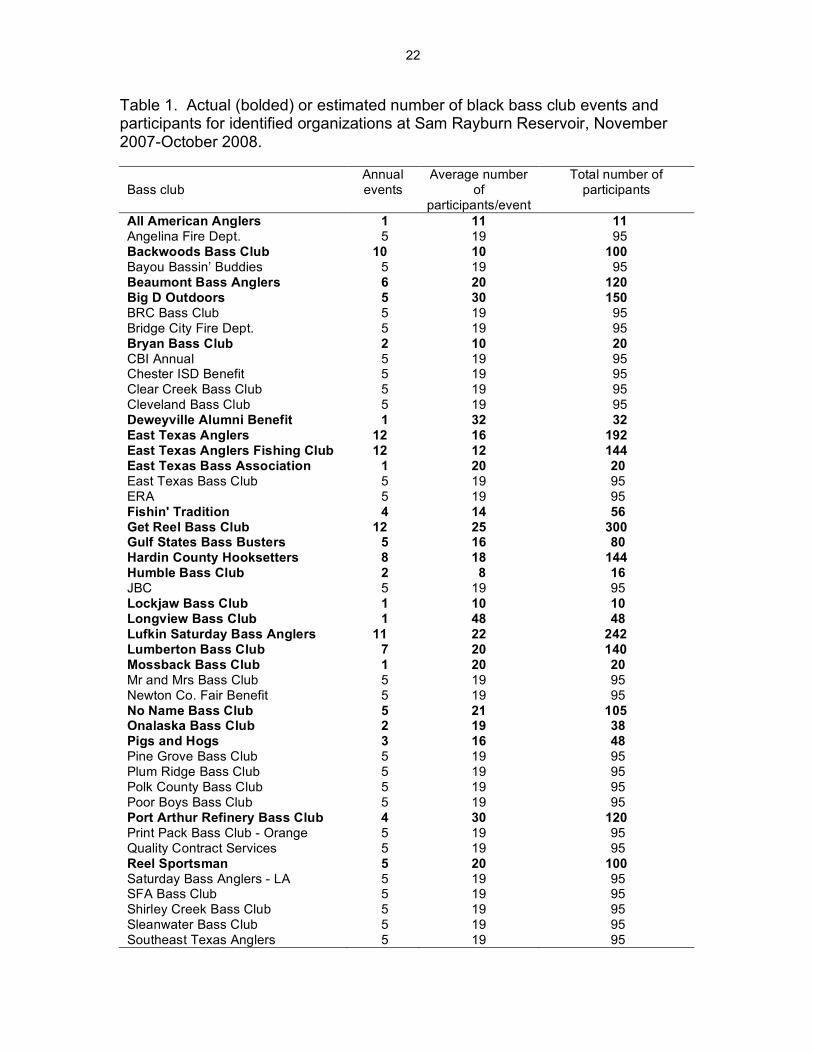
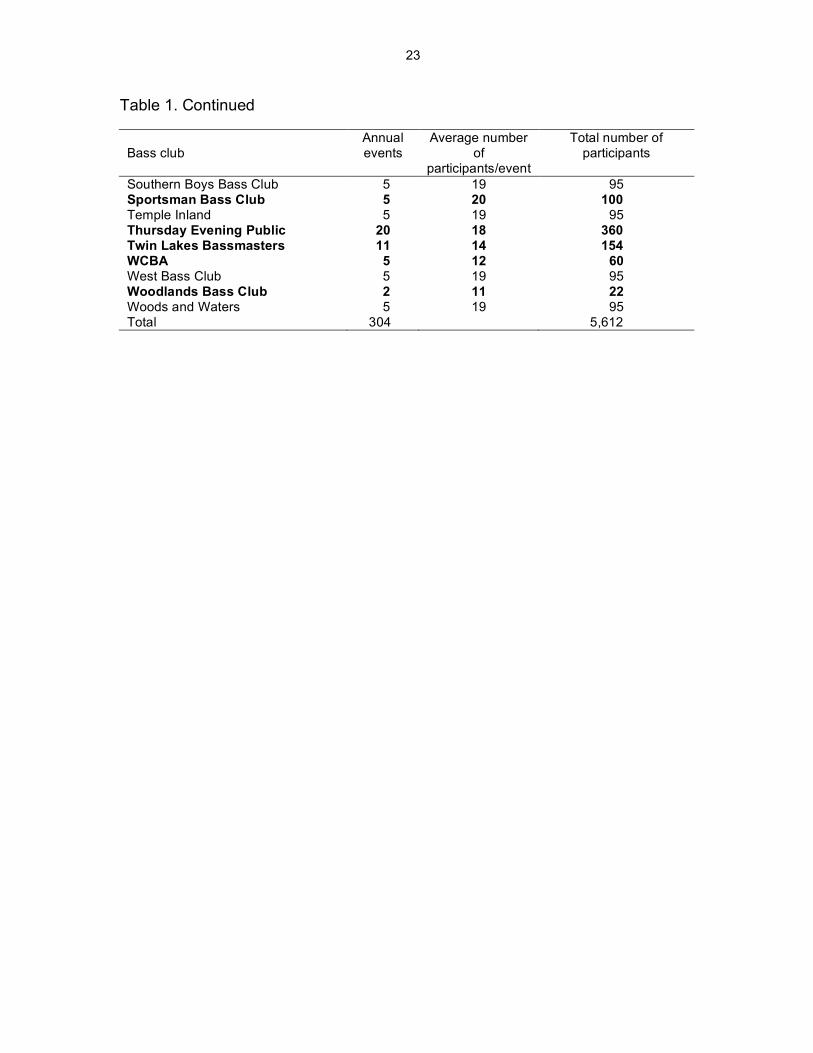
We identified 57 bass clubs conducting at least one event at Sam Rayburn Reservoir during the period November 2007 to October 2008 (Table 1). From 29 bass clubs reporting, average number of events was five (range 1-20) and average number of participants per event was 19 (range 8-48). Total estimated number of bass club events held during the period was 304 with 5,612 participants.
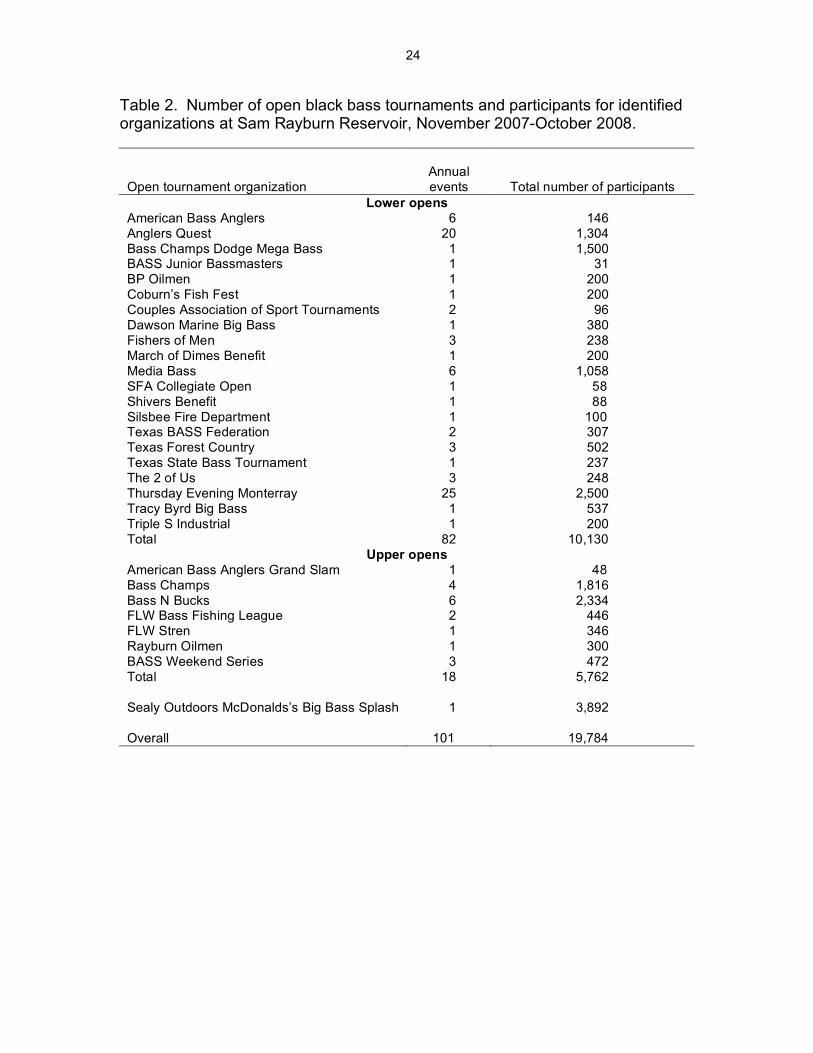
Twenty-one lower open organizations and seven upper open organizations conducted bass tournaments at Sam Rayburn Reservoir during the period (Table 2). The number of events held by each organization ranged from one to 25 for lower opens and from one to six for upper opens. The total number of participants
9
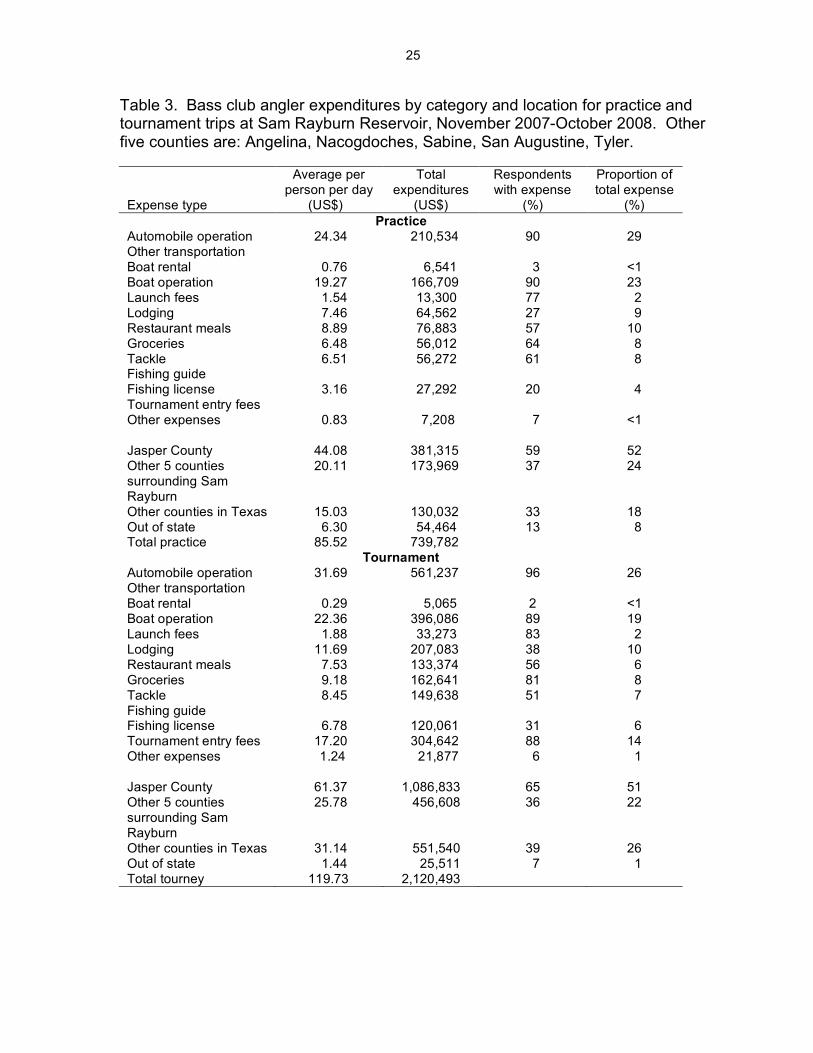
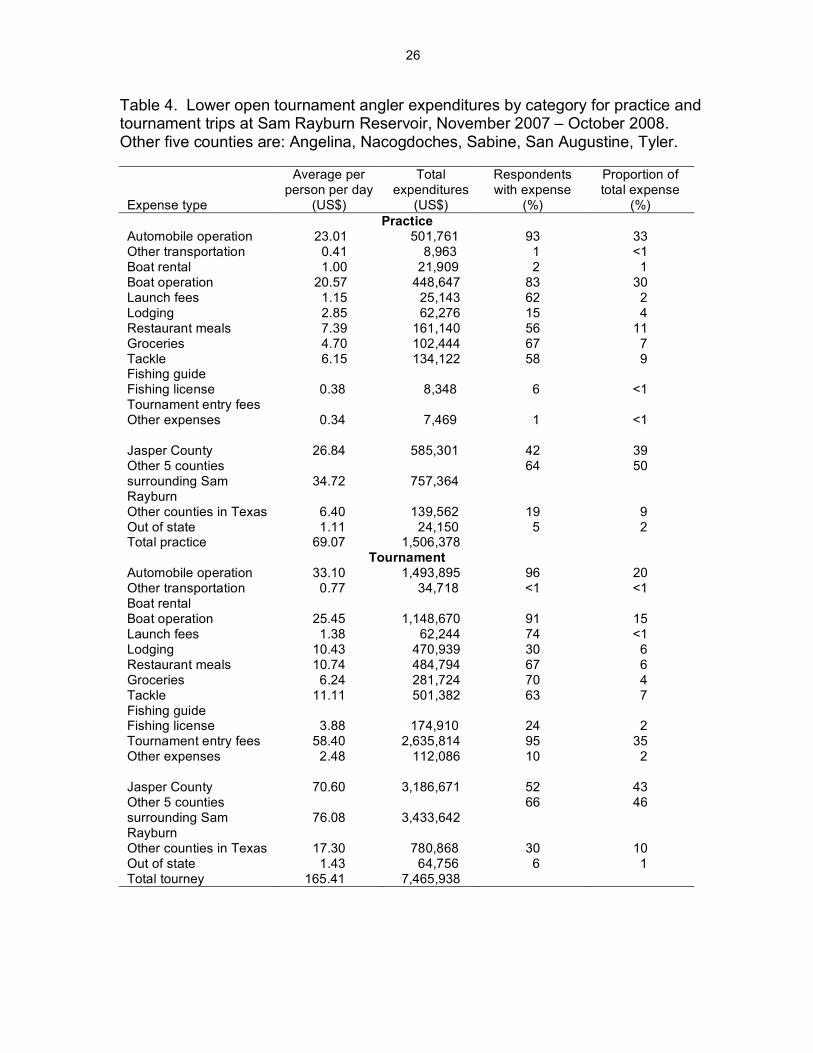
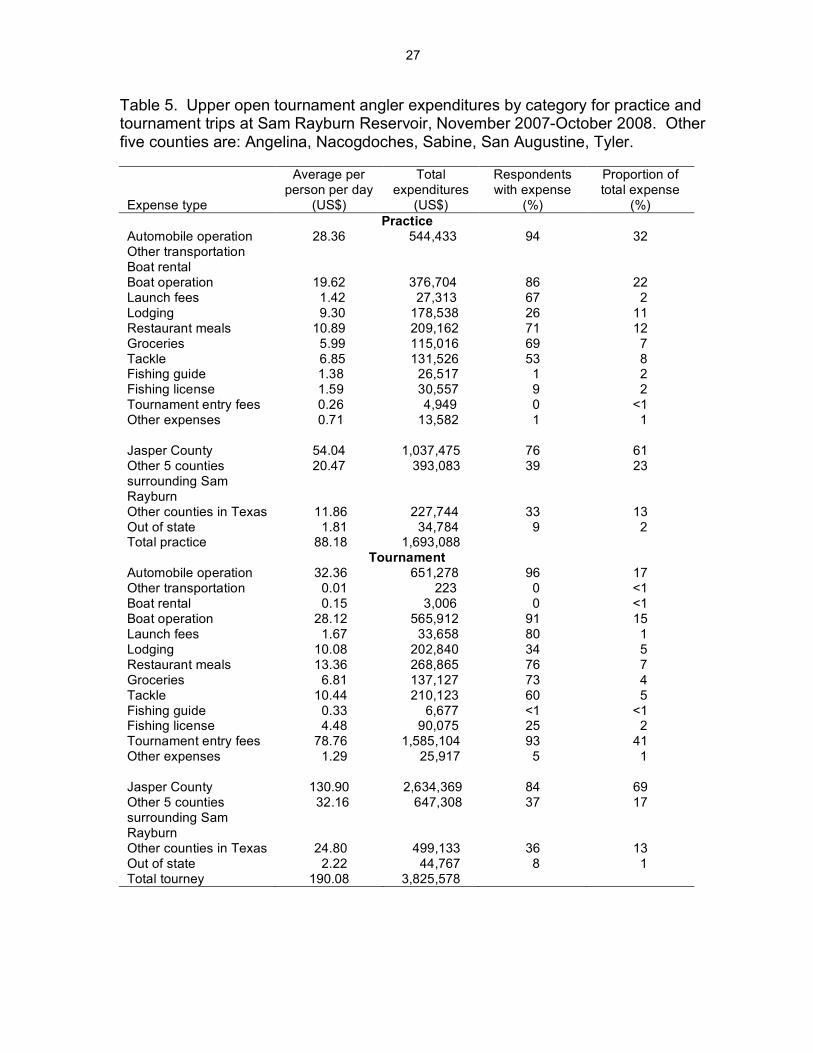
for the period, per organization, ranged from 31 to 2,500 for lower opens and 48 to 2,334 for upper opens. During the period, organizations held 82 lower open events with 10,130 total participants and 18 upper open events with 5,762 total participants. The BBS was a single, 3-day event with 3,892 participants (Table 2). Overall, we estimated that 405 tournaments were held with 25,396 total participants from November 2007 through October 2008. Bass club angler response rate was 59% (132 questionnaires returned). Forty-one percent of club anglers made one or more trips for practice; average trip length was 2.6 days and the average party size was 1.8 anglers. For tournament trips, average trip length was 2.0 days and average party size was 1.9 people. The average expenditure per person, per day, was US$86 for a practice trip and US$120 for a tournament trip (Table 3). Of the 5,612 bass club participants, 41% practiced (2,301) and 43% of those traveled together to practice (989). We estimated there were 1,807 annual practice trips associated with bass club tournaments in the period. For tournament trips, 36% (2,020) indicated that they traveled with another tournament angler, and total estimated annual number of tournament trips for bass club anglers was 4,602. Direct expenditures associated with bass club practice and tournament trips were US$739,782 and US$2,120,493, respectively (Table 3). Total direct expenditures for bass club anglers were US$2,860,275 (Tables 7 and 9). Lower open tournament angler response rate was 50% (130 questionnaires returned). Fifty-six percent of lower open anglers made one or more trips for practice; average trip length was 2.8 days and average party size was 1.8 anglers. For tournament trips, average trip length was 2.9 days and average party size was 2.0 people. The average expenditure per person, per day was US$69 for a practice trip and US$165 for a tournament trip (Table 4). Of the 10,130 lower open participants, 56% practiced (5,673) and 53% of those traveled together for practice (3,007) yielding an estimated 4,170 annual practice trips. For tournaments, 45% (4,559) indicated they traveled with another tournament angler, and total estimated annual number of tournament trips was 7,851. Direct expenditures associated with lower open practice and tournament trips were US$1,506,378 and US$7,465,938, respectively (Table 4). Total direct expenditures for lower open tournament anglers were US$8,972,317 (Tables 7 and 9). The response rate for upper open tournament anglers was 47% (270 questionnaires returned). Sixty-seven percent of upper open anglers made one or more trips for practice, average trip length was 3.3 days and the average party size was 2.0 anglers. For tournament trips, average trip length was 2.5 days and average party size 2.0 people. The average expenditure per person, per day was US$88 for a practice trip and US$190 for a tournament trip (Table 5). Of the 5,762 upper open participants, 67% practiced (3,860) and 52% of those traveled together for practice (2,007), which resulted in a total of 2,857 annual practice trips. For tournament trips, 60% (3,457) indicated that they traveled with another tournament angler, and total estimated annual number of tournament trips was 4,034. Direct expenditures associated with upper open practice and tournament trips were
10
US$1,693,088 and US$3,825,578, respectively (Table 5). Total direct expenditures for upper open anglers were US$5,518,667 (Tables 7 and 9).
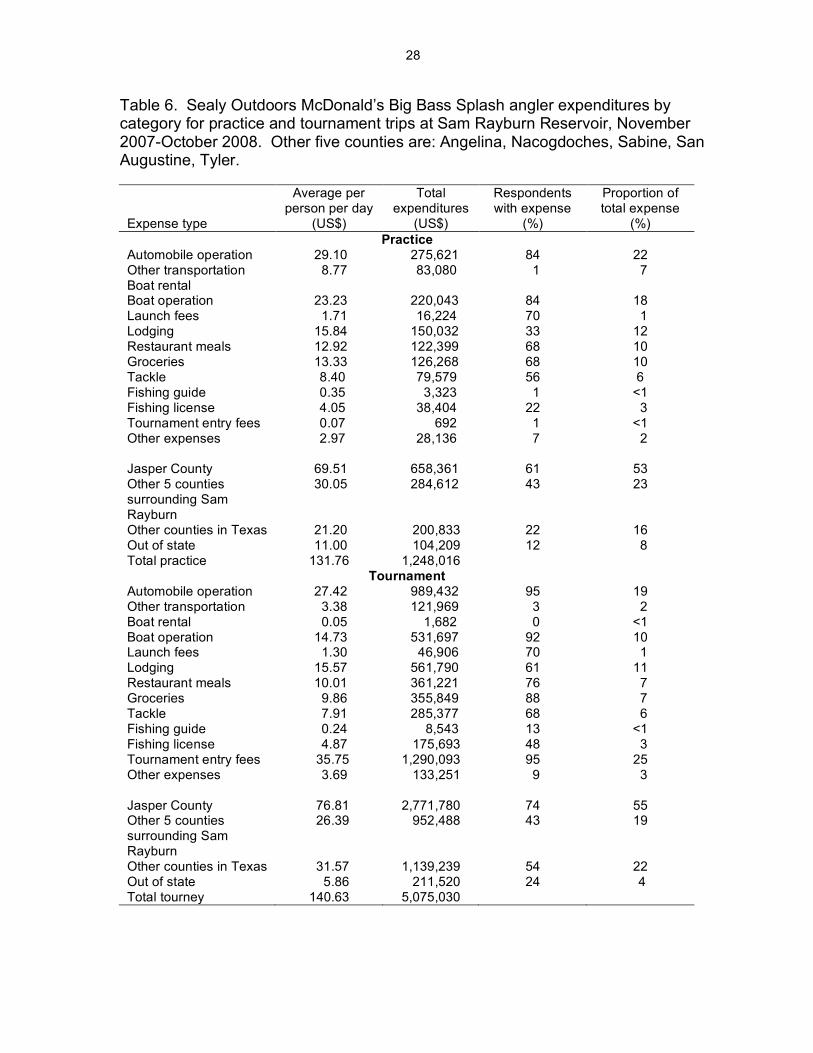
Forty percent of BBS anglers made one or more practice trips; average trip length was 3.4 days and average party size was 2.4 people. For tournament trips, average trip length was 4.3 days and average party size was 2.7 people. The average expenditure per person, per day was US$132 for a practice trip and US$141 for a tournament trip (Table 6). Of the 3,892 BBS participants, 40% practiced (1,557) and 51% of those traveled together for practice (794) yielding an estimate of 1,160 practice trips. For tournament trips, 40% (1,557) indicated that they traveled with another tournament angler, and total estimated number of tournament trips was 3,114. Direct expenditures associated with BBS practice and tournament trips were US$1,248,016 and US$5,075,030, respectively (Table 6). Total direct expenditures for BBS anglers were US$6,323,046 (Tables 7 and 9).
Expenses for automobile and boat operation were the most common (>84%
of respondents) and largest (>18% of all expenses) of the expenses associated with practice trips for all four tournament types. For bass club anglers during tournament trips, automobile and boat operation expenses remained most common (>89% of respondents) and largest (US$561,237 on automobile operation and US$396,086 on boat operation) (Table 3). For the other three tournament types, tournament entry fees were the largest expense (>25% of all expenses; range of total expenditures on entry fees was US$1,290,093-US$2,635,814) and about as commonly-reported as automobile expenses (both >93% of respondents).
Summing across all four tournament types, practice trip expenditures were
US$5,187,264 and tournament trip expenditures were US$18,487,039. For lower open tournaments, the amount spent in Jasper County was similar to the combined total expenditure in the other five counties surrounding Sam Rayburn Reservoir. For each of the other tournament types, and for both practice and tournament trips, more than 51% of the total expenditure was spent in Jasper County and more than 59% of respondents reported expenditures in Jasper County.
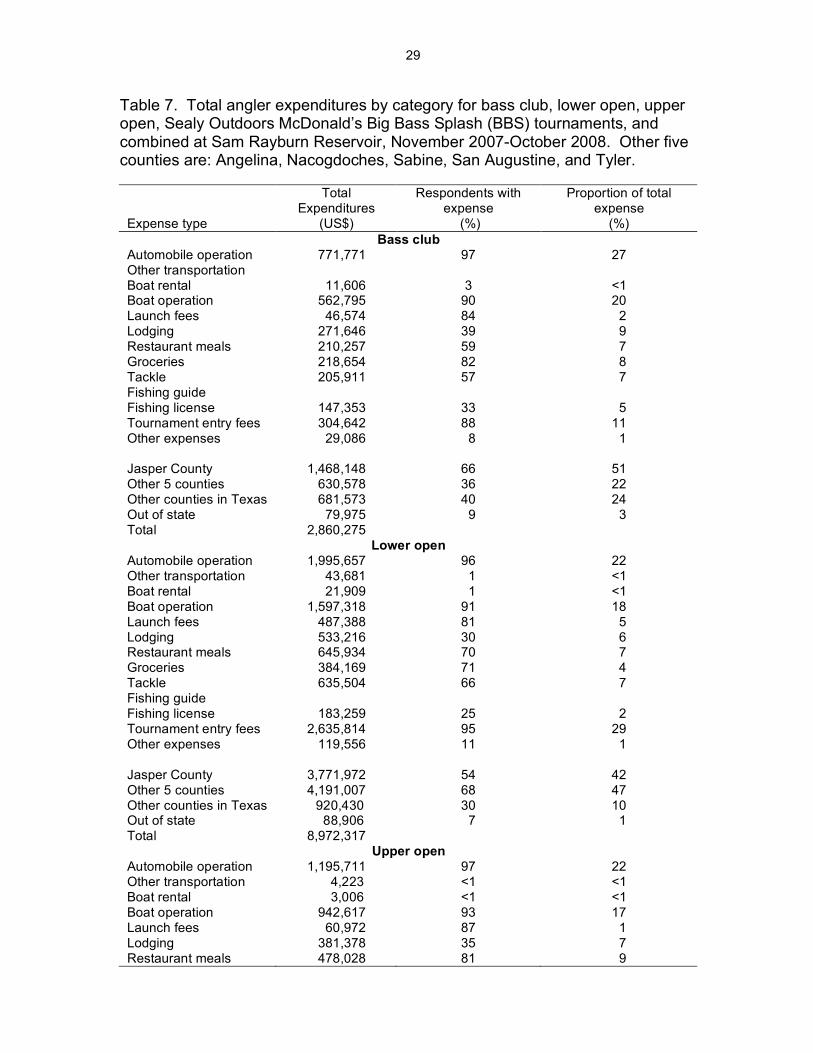
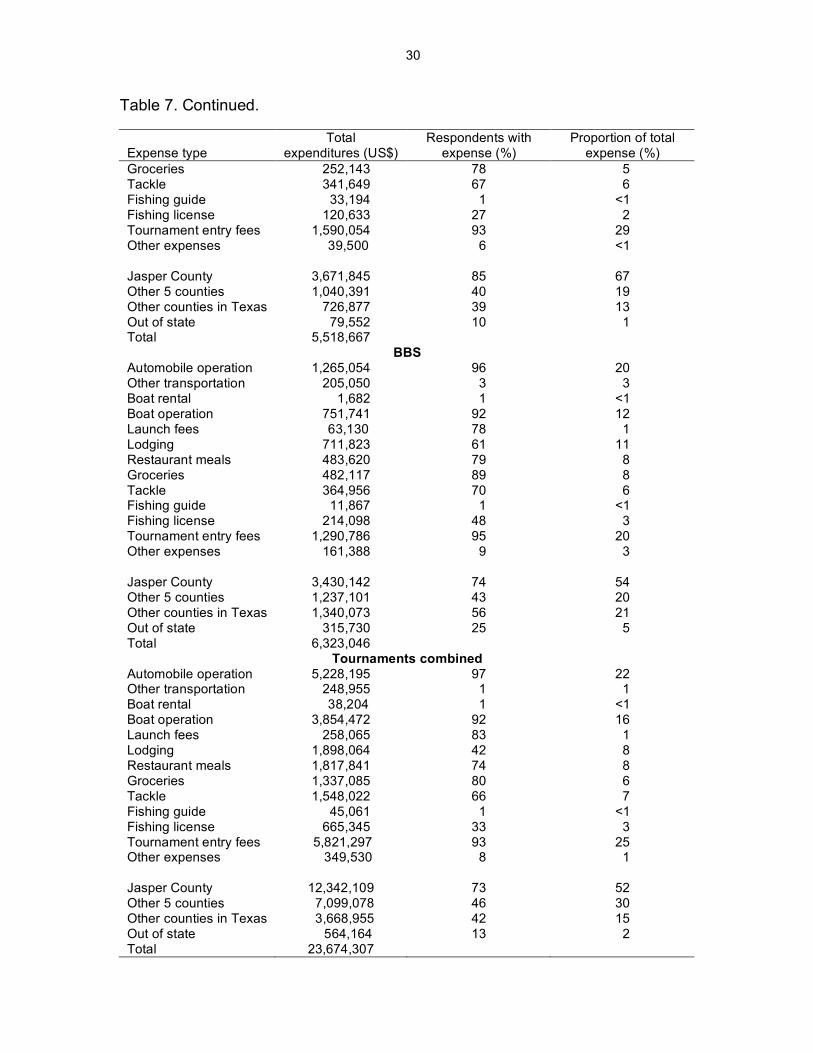
Tournament entry fees, automobile operation, and boat operation were the
three largest expenditure categories for lower open, upper open, and BBS tournaments when expenses for practice and tournament trips were combined (Table 7). For bass club tournaments, the largest expenditure was for automobile operation. Jasper County expenditures were more than 51% of total expenditure for all but lower open tournaments (42% in Jasper County, 47% in the other 5 counties surrounding Sam Rayburn Reservoir).
Per event, the BBS had the greatest expenditures (US$6,323,046), followed
by upper opens (US$306,593), lower opens (US$109,419), and bass clubs (US$9,409). For all tournaments combined, tournament entry fees (US$5,821,297), automobile operation (US$5,228,195), and boat operation (US$3,854,472) were the highest categorical expenses and collectively accounted for 63% of total expenses (Table 7). By location, Jasper County had the highest
11
expenditures (US$12,342,109; 52% of total expenses). Collectively, lower open tournaments had the greatest direct expenditures (US$8,972,317; N = 82), followed by the BBS (US$6,323,046; N = 1), upper opens (US$5,518,667; N = 18) and bass clubs (US$2,860,275; N = 304) (Tables 7 and 9).
Nonlocal anglers accounted for the majority of direct expenditures for all
tournament types (range 56-61%) (Table 8). Overall, 78% of tournament-related direct expenditures were spent by anglers not residing in the local area. Logistic regression indicated that average angler tournament event trip values for CS were US$106 for bass club anglers (Wald Χ2 = 15.5; df = 1; P < 0.0001; concordance = 0.76), US$293 for lower open anglers (Wald Χ2 = 21.8; df = 1; P < 0.0001; concordance = 0.82), US$296 for upper open anglers (Wald Χ2 = 20.8; df = 1; P < 0.0001; concordance = 0.73), and US$411 for BBS anglers (Wald Χ2 = 10.2; df = 1; P = 0.0014; concordance = 0.72). Total estimated CS for tournament event trips was US$594,872 for bass clubs (5,612 participants), US$2,968,090 for lower opens (10,130 participants), US$1,705,552 for upper opens (5,762 participants), and US$1,599,612 for the BBS (3,892 participants) (Table 9). Assuming CS for practice trips was equal to CS of event trips minus the average entry fee, average angler CS for practice trips were US$52 for bass club anglers, US$33 for lower open anglers, US$21 for upper open anglers, and US$79 for BBS anglers. Total estimated CS for tournament practice trips was US$119,652 for bass clubs (2,301 anglers practiced), US$187,209 for lower opens (5,673 practiced), US$81,060 for upper opens (3,860 practiced), and US$123,003 for the BBS (1,557 practiced) (Table 9). Economic value ranged from US$3,574,799 (bass clubs) to US$12,127,616 (lower opens).
Overall, we estimated that 405 tournaments were held from November 2007
to October 2008 with a total of 25,396 participants. The average length of practice and tournament angling days was 6.9 and 8.1 hours, respectively. Total annual angling hours associated with tournaments was 570,377 hours (279,504 practice and 290,873 event hours). Overall, practice trip expenditures were US$5,187,264 and event trip expenditures were US$18,487,039. Total direct expenditure associated with tournaments was estimated at US$23,674,305 and total economic value was US$31,053,355.
Tournament-associated direct expenditures produced more than US$39 million in output to the state, US$12.8 million in labor income, US$23.6 million of value added, and 486 full- or part-time jobs in Texas. Direct expenditures in Jasper County produced more than US$16 million in output to the state, US$5 million in labor income, US$9.5 million of value added, and 294 full- or part-time jobs in the county. In the other five surrounding counties (Tyler, Angelina, Nacogdoches, San Augustine, and Sabine), direct expenditures produced almost US$10 million in output to the state, US$3 million in labor income, US$6 million of value added, and 153 full- or part-time jobs in the region. The majority of impacts were recognized in tourism-related sectors of gas stations, recreational industries such as amusement attractions, food services and drinking places, hotels and motels, food and beverage stores, and real estate.
12
Non-tournament anglers Local angler response rate was 57% (241 questionnaires returned).
Average party size was 2.3 people and average trip length was 1.9 days. The estimated total number of angler trips (one person, one day) was 49,381. Creel surveys estimated that 41% of non-tournament anglers were local residents. Local anglers spent the most money on automobile operation (95% of respondents; 28% of expenses; US$734,436), boat operation (87% of respondents; 24% of expenses; US$633,976), and fishing licenses (33% of respondents; 12% of expenses; US$310,492) (Table 10). Most anglers also reported expenditures for groceries (74% of respondents) and tackle (65% of respondents). By location, expenditures were similar for Jasper County (US$1,259,080, 48% of respondents) and the other five counties surrounding Sam Rayburn Reservoir (US$1,094,664, 42% of respondents). Average expenditure per person, per day was US$53 and total direct expenditure was US$2,637,517 (Tables 10 and 11). For each local angler, CS was estimated at US$100 per trip or US$43 per day (Wald Χ2 = 37.9; df = 1; P < 0.0001; concordance = 0.76). Total CS for non-tournament anglers was US$2,612,733 (Table 11).
Response rate for nonlocal, Texas anglers was 58% (155 questionnaires
returned). Average party size was 2.6 people and average trip length was 3.7 days. Nonlocal anglers made an estimated 53,695 angling trips (one person, one day). Creel surveys estimated that 45% of non-tournament anglers were nonlocal, Texas residents. Expenditures were highest for automobile operation (US$1,199,563 or 28% of all expenses; 97% of respondents), boat operation (US$622,995 or 15% of all expenses; 87% of respondents), and lodging (US$600,675 or 14% of all expenses; 54% of respondents) (Table 10). Approximately 90% of nonlocal anglers also reported grocery expenditures. Expenditures were highest in Jasper County (US$1,916,649; 45% of respondents). Average expenditure per person, per day was US$79 and total direct expenditures were US$4,244,442 (Tables 10 and 11). Consumer surplus was estimated at US$292 per angler trip or US$112 per day) (Wald Χ2 = 16.1; df = 1; P < 0.0001; concordance = 0.76) and total CS was US$4,215,487 (Table 11).
Out-of-state anglers comprised 14% of non-tournament anglers and 68% of
these were from Louisiana. Response rate for out-of-state anglers was 60% (52 questionnaires returned). Average party size was 2.2 people, average trip length was 5.6 days, and total number of trips (one person, one day) was 16,660. Lodging expenditures were highest (US$390,085 or 23% of all expenses; 65% of respondents), followed by automobile operation (US$357,274 or 21% of all expenses; 92% of respondents) and restaurant meals (US$183,093 or 11% of all expenses; 73% of respondents) (Table 10). Other frequently reported expenses included groceries (80% of respondents) and boat operation (75% of respondents). Expenditures were highest in Jasper County (US$964,353; 57% of respondents). Average per person, per day expenditure was US$102 and total direct expenditure was US$1,703,047 (Tables 10 and 11). For each out-of-state angler, CS was estimated at US$224 per trip or US$40 per day (Wald Χ2 = 9; df = 1; P = 0.0023; concordance = 0.83). Total CS was US$662,848 (Table 11).
13
Overall, for non-tournament anglers, average party size was 2.4 people and average trip length was 3.0 days. Non-tournament anglers made 119,856 one-person, one-day trips to Sam Rayburn Reservoir. Given non-tournament angler average daily trip length was 6.1 hours, total annual non-tournament angling hours were 731,122. Expenses associated with automobile (US$2,183,691 or 28% of all expenses; 95% of respondents) and boat operation (US$1,418,201; or 18% of all expenses; 86% of respondents) were highest and most common, followed by lodging (US$902,932) and groceries (US$883,175) (Table 10). Expenditures in Jasper County were most common (58% of respondents) and higher (US$3,929,449 or 48% of expenses) than other locations. Average expenditure per person, per day was US$68 and total direct expenditure was US$8,204,883. Consumer surplus for all non-tournament anglers was US$166 per trip or US$56 per day (Wald Χ2 = 52.5; df = 1; P < 0.0001; concordance = 0.75). Total estimated CS was US$7,491,069 (Table 13). The total economic value of non-tournament angling was US$15,695,952.
Direct expenditures of non-tournament anglers produced more than US$13 million in output to the state, US$4 million in labor income, US$8 million of value added, and 159 full- or part-time jobs in Texas. In Jasper County, expenditures produced US$5 million in output to the state, US$1.5 million in labor income, US$3 million of value added, and 87 full- or part-time jobs in Texas. In the other five local counties (Tyler, Angelina, Nacogdoches, San Augustine, and Sabine), expenditures produced more than US$3 million in output to the state, US$1 million in labor income, US$1.9 million of value added, and 48 full- or part-time jobs in Texas. The majority of these impacts were recognized in tourism-related sectors of gas stations, amusement attractions such as recreational industries, food services and drinking places, hotels and motels, and food and beverage stores. Tournament/non-tournament comparison and overall
Tournament expenses exceeded non-tournament expenses for all categories except boat rental, fishing guide, and fishing license fees (Table 12). Tournament angler expenditures were higher than non-tournament angler expenditures for all four locations. Trends for both tournament and non-tournament expenditures were similar, with Jasper County expenditures highest, followed by expenditures in the other 5 counties surrounding Sam Rayburn Reservoir. Direct expenditures associated with tournaments (US$23,674,307) exceeded non-tournament expenditures (US$8,204,883) by a factor of 2.9, but CS for each group was similar (US$7,491,069 non-tournament; US$7,379,050 tournament) (Table 13). Economic value of tournament angling (US$31,053,357) was double that of non-tournament angling (US$15,695,952).
The largest expenditures, for tournament- and non-tournament anglers
combined, were related to automobile operation (24% of total expenses; US$7,411,886), tournament entry fees (19% of total expenses; US$5,821,297) and boat operation (17% of total expenses; US$5,272,673) (Table 12). Approximately 50% of the total direct expenditures were in Jasper County (US$16,271,558). For all recreational angling combined, total direct expenditures were US$31,879,190,
14
total CS was US$14,870,119, and total economic value was US$46,749,309 (Table 13). A total of 76% of the direct expenditures were from residents outside of the local area (Table 14).
DISCUSSION
Black bass tournament angling was very popular at Sam Rayburn Reservoir, as 85 different tournament organizations conducted 405 annual tournaments with 25,396 associated participants (average, 7.8 events and 488 participants per weekend), and total annual angling hours were 570,377. High tournament frequency was expected, given that 45% of black bass and 36% of total angling effort were tournament-related (Texas Parks and Wildlife Department, unpublished data). We could find only one other peer-reviewed study that estimated the annual number of black bass tournaments and angling hours at a reservoir. Dennis et al. (2006) identified 147 annual black bass tournaments that contributed 27,348 angling hours at O.H. Ivie Reservoir, Texas, which accounted for 20% of black bass fishing effort and 15% of total angling effort.
Although the annual number of bass club events (304) was much higher
than open tournaments (100), direct expenditures of bass club anglers were only 12% of the total tournament-related expenditures. Club events were much smaller (19 anglers/event) than open tournaments (159 anglers/event), which resulted in fewer total angling hours and less overall expenditure. However, individual club angler expenditures per day were similar to those of open tournament anglers, with the exception of tournament entry fees. Daily expenditures appeared to be independent of potential reward, as prize money at most bass club events was considerably lower than at open events. Conversely, total angling days associated with tournaments increased with higher entry fees and associated payback. The percent of anglers practicing as well as average length of practice increased from bass club to lower open to upper open anglers. A majority of tournament anglers at Sam Rayburn Reservoir seemed to prefer an intermediate level of event size, entry fee, and potential payback because the annual number of participants, expenditures, CS, and economic value were highest for lower open tournaments.
The three-day BBS tournament was unique in several ways. Although the
entry fee was similar to that of other open tournaments, the overall purse was US$560,000. Nearly all other tournaments at Sam Rayburn Reservoir have an overall purse of <US$70,000. First place in the BBS paid US$125,000 in cash and prizes, whereas most other tournaments pay < US$20,000. The large BBS purse attracted 3,892 anglers from 37 states and two foreign countries and was likely the largest black bass tournament in the U.S. in 2008. The BBS anglers also had a higher average party size and practiced for more days and spent more each practice day than other tournament anglers. As a result, the BBS event contributed 15% of the annual tournament participants, 27% of the annual tournament expenditures, and 20% of the overall angling expenditures.
15
Automobile and boat operation expenditures accounted for 38% of total tournament expenditures. Although both are common expenses for anglers, these costs were likely exacerbated by the relatively high average price of regular grade gasoline in Texas during the study period (US$3.26/gallon) (http://www.eia.doe.gov). By location, expenditures in Jasper County were highest (52% of total) and likely a result of existing infrastructure needed to host tournaments (i.e., lodging, large parking lots, and tournament weigh-in pavilion). To better recruit tournament-related expenditures, other local counties, cities, and local parks must have facilities available to accommodate large tournament events.
Our results indicated that tournament angling had positive effects on the
economy associated with the Sam Rayburn Reservoir fishery. Tournament angling contributed 73% of the annual direct expenditures and 66% of the economic value. Dennis et al. (2006) found that tournament anglers contributed only 14% of the annual expenditures at O.H. Ivie Reservoir, Texas. Tournament angling was responsible for 486 full- or part-time jobs in the state of Texas, with approximately 60% of those jobs in Jasper County. The majority of these jobs were in tourism-related sectors including hotels and motels, gasoline stations, and recreational industries. Local economic development groups can use this information to support increased funding and infrastructure to recruit tournaments (i.e., direct financial sponsorship, increased parking at boat ramps, additional motels and weigh-in pavilions). Consideration of economic impacts is essential to responsible fisheries management (Weithman 1999.) Coupled with biological information, high economic contributions of tournament angling can be incorporated into future management decisions regarding the largemouth bass fishery. In contrast to conclusions of Dennis et al. (2006), we suggest that potential benefits of more restrictive harvest regulations (e.g., increases in large fish abundance, fishing quality, and non-tournament angling effort and expenditures) may not be large enough to offset potential economic losses due to decreased tournament frequency, given the magnitude of tournament-related expenditures at Sam Rayburn reservoir.
Although the economic benefits of tournament angling were positive,
biological (i.e., increases in total angling effort and associated fish mortality) and social impacts (i.e., crowding at access points, conflict with non-tournament anglers) of high tournament angling effort could be potentially negative (Schramm et al. 1991). But, Driscoll et al. (2007) concluded that population-level biological impacts of tournaments at Sam Rayburn Reservoir were low, as only 5% of the largemouth bass population of legal length was retained by tournament anglers in one year, resulting in just a 2% reduction in population size. Non-tournament angler perceptions regarding negative effects of tournament angling on fishing quality are also relatively low. Anderson et al. (2002a) determined that only 25% of non-tournament anglers at Sam Rayburn Reservoir thought that tournament angling negatively affected fishing quality, compared to 39% of Texas anglers in a statewide survey (Ditton and Hunt 1996). Social conflict between tournament and non-tournament anglers occurs at Sam Rayburn Reservoir and we suggest most is due to crowding at access points and parking lots during weekends, when the
16
number of both angler types is highest. Although the U.S. Army Corps of Engineers has a tournament permitting system in place to minimize crowding, congestion at access points is common during peaks in tournament activity. Additional parking space could alleviate these issues.
Party size and trip length were similar for non-tournament and tournament
anglers, though annual angling hours totaled 28% more for non-tournament anglers. However, non-tournament anglers’ average daily expenditure was considerably lower than that of tournament anglers, even when entry fees are excluded from calculations. As a result of lower daily expenses, direct expenditures of non-tournament angling comprised only 27% of total expenditures. Ditton et al. (1992) suggested that angler specialization follows a continuum from least-specialized beginners to experienced anglers for whom fishing is a central life interest and that frequency of participation and incurred costs increase with specialization. A comparison by Wilde et al. (1998) of tournament and non-tournament anglers in Texas determined that tournament anglers were more specialized than non-tournament anglers, as they fished more frequently and had different motives (e.g., “to win a trophy or prize”; “to obtain a trophy fish”; “to develop my skills”; “for the challenge or sport”). Tournament anglers at Sam Rayburn Reservoir also appear more specialized, as evidenced by greater daily expenditures. Conversely, non-tournament anglers were more willing to pay higher trip expenses, as average CS for non-tournament anglers was considerably higher in proportion to direct expenditures (87%) than for tournament anglers (31%).
Economically, it is important to distinguish between expenditures of local
anglers and of nonlocal anglers. Expenditures by nonlocal anglers bring new money to the Sam Rayburn Reservoir area and have more economic impact than angling expenditures by local residents (Milon and Thunberg 1993). Angling at Sam Rayburn Reservoir had a regional attraction, apparently offering anglers opportunities not found at waters closer to their residence. Seventy percent of tournament anglers and 59% of non-tournament anglers resided outside the local six-county area; this included 13% of tournament anglers who were from out-of-state and 14% of non-tournament anglers who were from out-of-state. These nonresident anglers accounted for 76% of the overall direct expenditures (78% of tournament and 69% of non-tournament expenditures). Anglers were responsible for US$24,227,994 of new funds brought into the Sam Rayburn Reservoir area annually. These nonlocal expenditures were higher than those from other fisheries in East Texas (Toledo Bend Reservoir = US$16.2 million, Thailing and Ditton 2000; Lake Fork Reservoir = US$14.5 million, Chen et al. 2003).
We hoped to compare angling-related expenditures to other segments of
the economy in the Sam Rayburn Reservoir area, but other expenditure estimates were not available. However, we were able to estimate the proportion of annual lodging-related expenditures contributed by anglers in the northern half of Jasper County via local hotel tax revenues. We assumed no angling-related lodging for Sam Rayburn Reservoir occurred in the southern half of Jasper County (i.e., south
17
of the City of Jasper). Annual hotel tax revenues were US$290,324 for the City of Jasper (6% tax rate) and US$86,910 for the Jasper County Development District (7% tax rate). Applying a 6.5% hotel tax rate to the annual lodging expenditures of anglers in Jasper County (US$1,955,598), total angling-related hotel taxes were US$127,114. Thus, anglers contributed 34% of the annual lodging expenditures in northern Jasper County, and 70% of the angling-related expenditures were tournament-related.
Including angling trips specifically for tournament-related practice was
important to more accurately estimate both tournament-related and overall expenditures. Tournament practice trips accounted for 56% of all tournament-related trips, and tournament-related expenditures and overall expenditures would have been underestimated by 22% and 16%, respectively by excluding practice trips. To obtain accurate estimates, we suggest studies estimating specific contributions of tournament angling account for practice trips.
Anderson et al. (2002a) estimated the annual economic value of the
recreational fishery at Sam Rayburn Reservoir was US$15.1 million in 2001. Using the adjustments for inflation provided by Sahr (2009), this estimate was US$18.3 million in 2008. However, Anderson et al. (2002a) concluded that their study design did not adequately include tournament angling and suggested that overall angler expenditures were likely much higher than their estimate. We estimated the economic value was US$46.7 million and our results confirm the conclusion of Anderson et al. (2002a) that their study undervalued the fishery. Our estimate for Sam Rayburn Reservoir was similar to that reported by Thailing and Ditton (2000) for Toledo Bend Reservoir after adjusting for inflation (US$38.1 million; 2008 inflation-adjusted value of US$49.2 million) though Toledo Bend Reservoir has 31% more surface area. However, our estimate was lower than that reported by Hunt and Ditton (1996) for Lake Fork Reservoir (US$38.2 million; 2008 inflation-adjusted value of US$54.0 million) even though Sam Rayburn Reservoir has 4.2 times more surface area.
Our economic value estimate was conservative for two reasons. Although
we conducted a thorough census to estimate the total annual number of tournaments at Sam Rayburn Reservoir, we likely missed some bass club events that were not advertised. Similar to economic evaluations of other fisheries in Texas (Thailing et al. 2000; Anderson et al. 2002a; Chen et al. 2003), we did not include expenditures associated with the purchase of durable property (e.g., lakeside homes, vehicles, boats, and fishing equipment) because it is difficult to attribute these expenditures solely to the Sam Rayburn Reservoir fishery and to estimate associated depreciation of value.
The high economic value of the recreational fishery at Sam Rayburn
Reservoir reflects the importance of recreational fishing to local businesses dependent on the expenditures and to the anglers who obviously value fishing as a hobby or form of leisure. As human population growth increases and water demand exceeds supply in other parts of Texas, the incentive to transfer Sam
18
Rayburn Reservoir water to other watersheds will increase. The economic values associated with water will likely factor into future prioritization of water use in Texas. Conveying information on the economic value of recreational angling at Sam Rayburn Reservoir to stakeholders (e.g., local businesses, local and state governmental entities, anglers, and water authorities) will facilitate appropriate comparisons among competing water uses. Ideally, economic contributions of all forms of water recreation at Sam Rayburn Reservoir (e.g., angling, boating, camping, birding) are needed to properly prioritize water use, and future research should quantify non-angling recreation expenditures.
19
LITERATURE CITED
Anderson, D. K., R. B. Ditton, and C. O. Oh. 2002a. Characteristics, participation patterns, management preferences, expenditures, and economic impacts of Sam Rayburn Reservoir anglers. Texas A&M University Human Dimensions Research Laboratory, College Station.
Anderson, D. K., R. B. Ditton, and C. Oh. 2002b. The May 6, 2001 Bass N Bucks
fishing tournament: an analysis of participants’ characteristics, attitudes, expenditures, and economic impacts. Texas A&M University Human Dimensions Research Laboratory, College Station.
Anderson, D. K., R. B. Ditton, and C. Oh. 2002c. The 2002 Texas BASS
Federation State Championship fishing tournament: participants’ characteristics, attitudes, expenditures, and economic impacts. Texas A&M University Human Dimensions Research Laboratory, College Station.
Bohnsack, B. L., and R. B. Ditton. 1999. Demographics, participation, attitudes,
and management preferences of Texas anglers. Human Dimensions of Fisheries Research Laboratory, Texas A&M University, Report HD-611, College Station.
Chen, R. J., K. M. Hunt, and R. B. Ditton. 2003. Estimating the economic impacts
of a trophy largemouth bass fishery: issues and applications. North American Journal of Fisheries Management 23:835-844.
Dennis, J. A., T. Bradle, F. Janssen, R. A. Myers, J. W. Schlechte, T. O. Smith,
and J. B. Taylor. 2006. Annual expenditures of black bass tournament and non-tournament anglers at O. H. Ivie Reservoir, Texas. Proceedings of the Annual Conference Southeastern Association of Fish and Wildlife Agencies 60:188-193.
Ditton, R. B., D. K. Loomis, and S. Choi. 1992. Recreation specialization: re-
conceptualization from a social world’s perspective. Journal of Leisure Research 24:33–51.
Ditton, R. B., and K. M. Hunt. 1996. Demographics, participation, attitudes,
management preferences, and trip expenditures of Texas black bass anglers. Human Dimensions of Fisheries Research Laboratory, Texas A&M University, Report HD-607, College Station.
Driscoll, M. T., J. L. Smith, and R. A. Myers. 2007. Impact of tournaments on the
largemouth bass population at Sam Rayburn Reservoir, Texas. North American Journal of Fisheries Management 27:425-433.
Hunt, K. M., S. M. Poarch, and R. Riechers. 1996. Trip characteristics,
expenditures, and economic value of a trophy largemouth bass fishery:
20
Lake Fork Reservoir, Texas. Proceedings of the Annual Conference Southeastern Association of Fish and Wildlife Agencies 50:163-173.
Loomis, J. 2006. Use of survey data to estimate economic value and regional
economic effects of fishery improvements. North American Journal of Fisheries Management 26:301-307.
Malvestuto, S. P., W. D. Davies, and W. L. Shelton. 1978. An evaluation of the
roving creel survey with nonuniform probability sampling. Transactions of the American Fisheries Society 107:255–262.
Malvestuto, S. P. 1996. Sampling the recreational creel. Pages 591–624 in B. R.
Murphy and D. W. Willis, editors. Fisheries techniques, 2nd edition. American Fisheries Society, Bethesda, Maryland.
Milon, J. W., and E. Thunberg. 1993. A regional analysis of current and future
Florida resident participation in marine recreational fishing. FL-SG-112. Florida Sea Grant Program, Gainesville.
Olson, D., and S. Lindall. 1996. IMPLAN professional software, analysis, and data
guide. Minnesota IMPLAN Group, Stillwater, Minnesota. Sahr, R. 2009. Consumer price index (CPI) conversion factors 1774 to estimated
2019 to convert to dollars of 2008. Oregon State University, Corvallis. Available: http://oregonstate.edu/cla/polisci/faculty-research/sahr/cv2008.pdf. (January 2009).
Schorr, M. S., J. Sah, D. F. Schreiner, M. R. Meador, and L. G. Hill. 1995.
Regional economic impact of the lake Texoma (Oklahoma-Texas) striped bass fishery. Fisheries 20 (5):14-18.
Schramm, H. L., Jr., M. L. Armstrong, A. J. Fedler, N. A. Funicelli, D. M. Green, J.
L. Hahn, D. P. Lee, R. E. Manns, Jr., S. P. Quinn, and S. J. Waters. 1991. Sociological, economic, and biological aspects of competitive fishing. Fisheries 16(3):13–21.
Steinback, S. R. 1999. Regional economic impact assessments of recreational
fisheries: an application of the IMPLAN modeling system to marine party and charter boat fishing in Maine. North American Journal of Fisheries Management 19:724-736.
Thailing, C. E., and Ditton, R. B. 2000. Characteristics, participation patterns,
attitudes, management preferences, expenditures, and economic impacts of Toledo Bend Reservoir anglers: Texas and Louisiana. Texas A&M University Human Dimensions Research Laboratory. Report HD-616, College Station.
21
TWDB (Texas Water Development Board). 2006. Water for Texas 2007. 405 p. U.S. Department of the Interior, Fish and Wildlife Service, and U.S. Department of
Commerce, U.S. Census Bureau. 2006 national survey of fishing, hunting, and wildlife-associated recreation. 164 p.
Wilde, G. R., R. K. Riechers, and R. B. Ditton. 1998. Differences in attitudes,
fishing motives, and demographic characteristics between tournament and nontournament black bass anglers in Texas. North American Journal of Fisheries Management 18:422–431.
Weithman, A. S. 1999. Socioeconomic benefits of fisheries. Pages 193-213 in C.
C. Kohler and W. A. Hubert, editors. Inland fisheries management in North America, 2nd edition. American Fisheries Society, Bethesda, Maryland.
22
Table 1. Actual (bolded) or estimated number of black bass club events and participants for identified organizations at Sam Rayburn Reservoir, November 2007-October 2008.
Bass club
Annual events
Average number of
participants/event
Total number of participants
All American Anglers 1 11 11 Angelina Fire Dept. 5 19 95 Backwoods Bass Club 10 10 100 Bayou Bassin’ Buddies 5 19 95 Beaumont Bass Anglers 6 20 120 Big D Outdoors 5 30 150 BRC Bass Club 5 19 95 Bridge City Fire Dept. 5 19 95 Bryan Bass Club 2 10 20 CBI Annual 5 19 95 Chester ISD Benefit 5 19 95 Clear Creek Bass Club 5 19 95 Cleveland Bass Club 5 19 95 Deweyville Alumni Benefit 1 32 32 East Texas Anglers 12 16 192 East Texas Anglers Fishing Club 12 12 144 East Texas Bass Association 1 20 20 East Texas Bass Club 5 19 95 ERA 5 19 95 Fishin' Tradition 4 14 56 Get Reel Bass Club 12 25 300 Gulf States Bass Busters 5 16 80 Hardin County Hooksetters 8 18 144 Humble Bass Club 2 8 16 JBC 5 19 95 Lockjaw Bass Club 1 10 10 Longview Bass Club 1 48 48 Lufkin Saturday Bass Anglers 11 22 242 Lumberton Bass Club 7 20 140 Mossback Bass Club 1 20 20 Mr and Mrs Bass Club 5 19 95 Newton Co. Fair Benefit 5 19 95 No Name Bass Club 5 21 105 Onalaska Bass Club 2 19 38 Pigs and Hogs 3 16 48 Pine Grove Bass Club 5 19 95 Plum Ridge Bass Club 5 19 95 Polk County Bass Club 5 19 95 Poor Boys Bass Club 5 19 95 Port Arthur Refinery Bass Club 4 30 120 Print Pack Bass Club - Orange 5 19 95 Quality Contract Services 5 19 95 Reel Sportsman 5 20 100 Saturday Bass Anglers - LA 5 19 95 SFA Bass Club 5 19 95 Shirley Creek Bass Club 5 19 95 Sleanwater Bass Club 5 19 95 Southeast Texas Anglers 5 19 95
23
Table 1. Continued
Bass club
Annual events
Average number of
participants/event
Total number of participants
Southern Boys Bass Club 5 19 95 Sportsman Bass Club 5 20 100 Temple Inland 5 19 95 Thursday Evening Public 20 18 360 Twin Lakes Bassmasters 11 14 154 WCBA 5 12 60 West Bass Club 5 19 95 Woodlands Bass Club 2 11 22 Woods and Waters 5 19 95 Total 304 5,612
24
Table 2. Number of open black bass tournaments and participants for identified organizations at Sam Rayburn Reservoir, November 2007-October 2008.
Open tournament organization
Annual events
Total number of participants Lower opens
American Bass Anglers 6 146 Anglers Quest 20 1,304 Bass Champs Dodge Mega Bass 1 1,500 BASS Junior Bassmasters 1 31 BP Oilmen 1 200 Coburn’s Fish Fest 1 200 Couples Association of Sport Tournaments 2 96 Dawson Marine Big Bass 1 380 Fishers of Men 3 238 March of Dimes Benefit 1 200 Media Bass 6 1,058 SFA Collegiate Open 1 58 Shivers Benefit 1 88 Silsbee Fire Department 1 100 Texas BASS Federation 2 307 Texas Forest Country 3 502 Texas State Bass Tournament 1 237 The 2 of Us 3 248 Thursday Evening Monterray 25 2,500 Tracy Byrd Big Bass 1 537 Triple S Industrial 1 200 Total 82 10,130
Upper opens American Bass Anglers Grand Slam 1 48 Bass Champs 4 1,816 Bass N Bucks 6 2,334 FLW Bass Fishing League 2 446 FLW Stren 1 346 Rayburn Oilmen 1 300 BASS Weekend Series 3 472 Total 18 5,762 Sealy Outdoors McDonalds’s Big Bass Splash 1 3,892 Overall 101 19,784
25
Table 3. Bass club angler expenditures by category and location for practice and tournament trips at Sam Rayburn Reservoir, November 2007-October 2008. Other five counties are: Angelina, Nacogdoches, Sabine, San Augustine, Tyler.
Expense type
Average per person per day (US$)
Total expenditures
(US$)
Respondents with expense
(%)
Proportion of total expense
(%) Practice
Automobile operation 24.34 210,534 90 29 Other transportation Boat rental 0.76 6,541 3 <1 Boat operation 19.27 166,709 90 23 Launch fees 1.54 13,300 77 2 Lodging 7.46 64,562 27 9 Restaurant meals 8.89 76,883 57 10 Groceries 6.48 56,012 64 8 Tackle 6.51 56,272 61 8 Fishing guide Fishing license 3.16 27,292 20 4 Tournament entry fees Other expenses 0.83 7,208 7 <1 Jasper County 44.08 381,315 59 52 Other 5 counties surrounding Sam Rayburn
20.11 173,969 37 24
Other counties in Texas 15.03 130,032 33 18 Out of state 6.30 54,464 13 8 Total practice 85.52 739,782
Tournament Automobile operation 31.69 561,237 96 26 Other transportation Boat rental 0.29 5,065 2 <1 Boat operation 22.36 396,086 89 19 Launch fees 1.88 33,273 83 2 Lodging 11.69 207,083 38 10 Restaurant meals 7.53 133,374 56 6 Groceries 9.18 162,641 81 8 Tackle 8.45 149,638 51 7 Fishing guide Fishing license 6.78 120,061 31 6 Tournament entry fees 17.20 304,642 88 14 Other expenses 1.24 21,877 6 1 Jasper County 61.37 1,086,833 65 51 Other 5 counties surrounding Sam Rayburn
25.78 456,608 36 22
Other counties in Texas 31.14 551,540 39 26 Out of state 1.44 25,511 7 1 Total tourney 119.73 2,120,493
26
Table 4. Lower open tournament angler expenditures by category for practice and tournament trips at Sam Rayburn Reservoir, November 2007 – October 2008. Other five counties are: Angelina, Nacogdoches, Sabine, San Augustine, Tyler.
Expense type
Average per person per day
(US$)
Total expenditures
(US$)
Respondents with expense
(%)
Proportion of total expense
(%) Practice
Automobile operation 23.01 501,761 93 33 Other transportation 0.41 8,963 1 <1 Boat rental 1.00 21,909 2 1 Boat operation 20.57 448,647 83 30 Launch fees 1.15 25,143 62 2 Lodging 2.85 62,276 15 4 Restaurant meals 7.39 161,140 56 11 Groceries 4.70 102,444 67 7 Tackle 6.15 134,122 58 9 Fishing guide Fishing license 0.38 8,348 6 <1 Tournament entry fees Other expenses 0.34 7,469 1 <1 Jasper County 26.84 585,301 42 39 Other 5 counties surrounding Sam Rayburn
34.72 757,364 64 50
Other counties in Texas 6.40 139,562 19 9 Out of state 1.11 24,150 5 2 Total practice 69.07 1,506,378
Tournament Automobile operation 33.10 1,493,895 96 20 Other transportation 0.77 34,718 <1 <1 Boat rental Boat operation 25.45 1,148,670 91 15 Launch fees 1.38 62,244 74 <1 Lodging 10.43 470,939 30 6 Restaurant meals 10.74 484,794 67 6 Groceries 6.24 281,724 70 4 Tackle 11.11 501,382 63 7 Fishing guide Fishing license 3.88 174,910 24 2 Tournament entry fees 58.40 2,635,814 95 35 Other expenses 2.48 112,086 10 2 Jasper County 70.60 3,186,671 52 43 Other 5 counties surrounding Sam Rayburn
76.08 3,433,642 66 46
Other counties in Texas 17.30 780,868 30 10 Out of state 1.43 64,756 6 1 Total tourney 165.41 7,465,938
27
Table 5. Upper open tournament angler expenditures by category for practice and tournament trips at Sam Rayburn Reservoir, November 2007-October 2008. Other five counties are: Angelina, Nacogdoches, Sabine, San Augustine, Tyler.
Expense type
Average per person per day
(US$)
Total expenditures
(US$)
Respondents with expense
(%)
Proportion of total expense
(%) Practice
Automobile operation 28.36 544,433 94 32 Other transportation Boat rental Boat operation 19.62 376,704 86 22 Launch fees 1.42 27,313 67 2 Lodging 9.30 178,538 26 11 Restaurant meals 10.89 209,162 71 12 Groceries 5.99 115,016 69 7 Tackle 6.85 131,526 53 8 Fishing guide 1.38 26,517 1 2 Fishing license 1.59 30,557 9 2 Tournament entry fees 0.26 4,949 0 <1 Other expenses 0.71 13,582 1 1 Jasper County 54.04 1,037,475 76 61 Other 5 counties surrounding Sam Rayburn
20.47 393,083 39 23
Other counties in Texas 11.86 227,744 33 13 Out of state 1.81 34,784 9 2 Total practice 88.18 1,693,088
Tournament Automobile operation 32.36 651,278 96 17 Other transportation 0.01 223 0 <1 Boat rental 0.15 3,006 0 <1 Boat operation 28.12 565,912 91 15 Launch fees 1.67 33,658 80 1 Lodging 10.08 202,840 34 5 Restaurant meals 13.36 268,865 76 7 Groceries 6.81 137,127 73 4 Tackle 10.44 210,123 60 5 Fishing guide 0.33 6,677 <1 <1 Fishing license 4.48 90,075 25 2 Tournament entry fees 78.76 1,585,104 93 41 Other expenses 1.29 25,917 5 1 Jasper County 130.90 2,634,369 84 69 Other 5 counties surrounding Sam Rayburn
32.16 647,308 37 17
Other counties in Texas 24.80 499,133 36 13 Out of state 2.22 44,767 8 1 Total tourney 190.08 3,825,578
28
Table 6. Sealy Outdoors McDonald’s Big Bass Splash angler expenditures by category for practice and tournament trips at Sam Rayburn Reservoir, November 2007-October 2008. Other five counties are: Angelina, Nacogdoches, Sabine, San Augustine, Tyler.
Expense type
Average per person per day
(US$)
Total expenditures
(US$)
Respondents with expense
(%)
Proportion of total expense
(%) Practice
Automobile operation 29.10 275,621 84 22 Other transportation 8.77 83,080 1 7 Boat rental Boat operation 23.23 220,043 84 18 Launch fees 1.71 16,224 70 1 Lodging 15.84 150,032 33 12 Restaurant meals 12.92 122,399 68 10 Groceries 13.33 126,268 68 10 Tackle 8.40 79,579 56 6 Fishing guide 0.35 3,323 1 <1 Fishing license 4.05 38,404 22 3 Tournament entry fees 0.07 692 1 <1 Other expenses 2.97 28,136 7 2 Jasper County 69.51 658,361 61 53 Other 5 counties surrounding Sam Rayburn
30.05 284,612 43 23
Other counties in Texas 21.20 200,833 22 16 Out of state 11.00 104,209 12 8 Total practice 131.76 1,248,016
Tournament Automobile operation 27.42 989,432 95 19 Other transportation 3.38 121,969 3 2 Boat rental 0.05 1,682 0 <1 Boat operation 14.73 531,697 92 10 Launch fees 1.30 46,906 70 1 Lodging 15.57 561,790 61 11 Restaurant meals 10.01 361,221 76 7 Groceries 9.86 355,849 88 7 Tackle 7.91 285,377 68 6 Fishing guide 0.24 8,543 13 <1 Fishing license 4.87 175,693 48 3 Tournament entry fees 35.75 1,290,093 95 25 Other expenses 3.69 133,251 9 3 Jasper County 76.81 2,771,780 74 55 Other 5 counties surrounding Sam Rayburn
26.39 952,488 43 19
Other counties in Texas 31.57 1,139,239 54 22 Out of state 5.86 211,520 24 4 Total tourney 140.63 5,075,030
29
Table 7. Total angler expenditures by category for bass club, lower open, upper open, Sealy Outdoors McDonald’s Big Bass Splash (BBS) tournaments, and combined at Sam Rayburn Reservoir, November 2007-October 2008. Other five counties are: Angelina, Nacogdoches, Sabine, San Augustine, and Tyler.
Expense type
Total Expenditures
(US$)
Respondents with expense
(%)
Proportion of total expense
(%) Bass club
Automobile operation 771,771 97 27 Other transportation Boat rental 11,606 3 <1 Boat operation 562,795 90 20 Launch fees 46,574 84 2 Lodging 271,646 39 9 Restaurant meals 210,257 59 7 Groceries 218,654 82 8 Tackle 205,911 57 7 Fishing guide Fishing license 147,353 33 5 Tournament entry fees 304,642 88 11 Other expenses 29,086 8 1 Jasper County 1,468,148 66 51 Other 5 counties 630,578 36 22 Other counties in Texas 681,573 40 24 Out of state 79,975 9 3 Total 2,860,275
Lower open Automobile operation 1,995,657 96 22 Other transportation 43,681 1 <1 Boat rental 21,909 1 <1 Boat operation 1,597,318 91 18 Launch fees 487,388 81 5 Lodging 533,216 30 6 Restaurant meals 645,934 70 7 Groceries 384,169 71 4 Tackle 635,504 66 7 Fishing guide Fishing license 183,259 25 2 Tournament entry fees 2,635,814 95 29 Other expenses 119,556 11 1 Jasper County 3,771,972 54 42 Other 5 counties 4,191,007 68 47 Other counties in Texas 920,430 30 10 Out of state 88,906 7 1 Total 8,972,317
Upper open Automobile operation 1,195,711 97 22 Other transportation 4,223 <1 <1 Boat rental 3,006 <1 <1 Boat operation 942,617 93 17 Launch fees 60,972 87 1 Lodging 381,378 35 7 Restaurant meals 478,028 81 9
30
Table 7. Continued.
Expense type Total
expenditures (US$) Respondents with
expense (%) Proportion of total
expense (%) Groceries 252,143 78 5 Tackle 341,649 67 6 Fishing guide 33,194 1 <1 Fishing license 120,633 27 2 Tournament entry fees 1,590,054 93 29 Other expenses 39,500 6 <1 Jasper County 3,671,845 85 67 Other 5 counties 1,040,391 40 19 Other counties in Texas 726,877 39 13 Out of state 79,552 10 1 Total 5,518,667
BBS Automobile operation 1,265,054 96 20 Other transportation 205,050 3 3 Boat rental 1,682 1 <1 Boat operation 751,741 92 12 Launch fees 63,130 78 1 Lodging 711,823 61 11 Restaurant meals 483,620 79 8 Groceries 482,117 89 8 Tackle 364,956 70 6 Fishing guide 11,867 1 <1 Fishing license 214,098 48 3 Tournament entry fees 1,290,786 95 20 Other expenses 161,388 9 3 Jasper County 3,430,142 74 54 Other 5 counties 1,237,101 43 20 Other counties in Texas 1,340,073 56 21 Out of state 315,730 25 5 Total 6,323,046
Tournaments combined Automobile operation 5,228,195 97 22 Other transportation 248,955 1 1 Boat rental 38,204 1 <1 Boat operation 3,854,472 92 16 Launch fees 258,065 83 1 Lodging 1,898,064 42 8 Restaurant meals 1,817,841 74 8 Groceries 1,337,085 80 6 Tackle 1,548,022 66 7 Fishing guide 45,061 1 <1 Fishing license 665,345 33 3 Tournament entry fees 5,821,297 93 25 Other expenses 349,530 8 1 Jasper County 12,342,109 73 52 Other 5 counties 7,099,078 46 30 Other counties in Texas 3,668,955 42 15 Out of state 564,164 13 2 Total 23,674,307
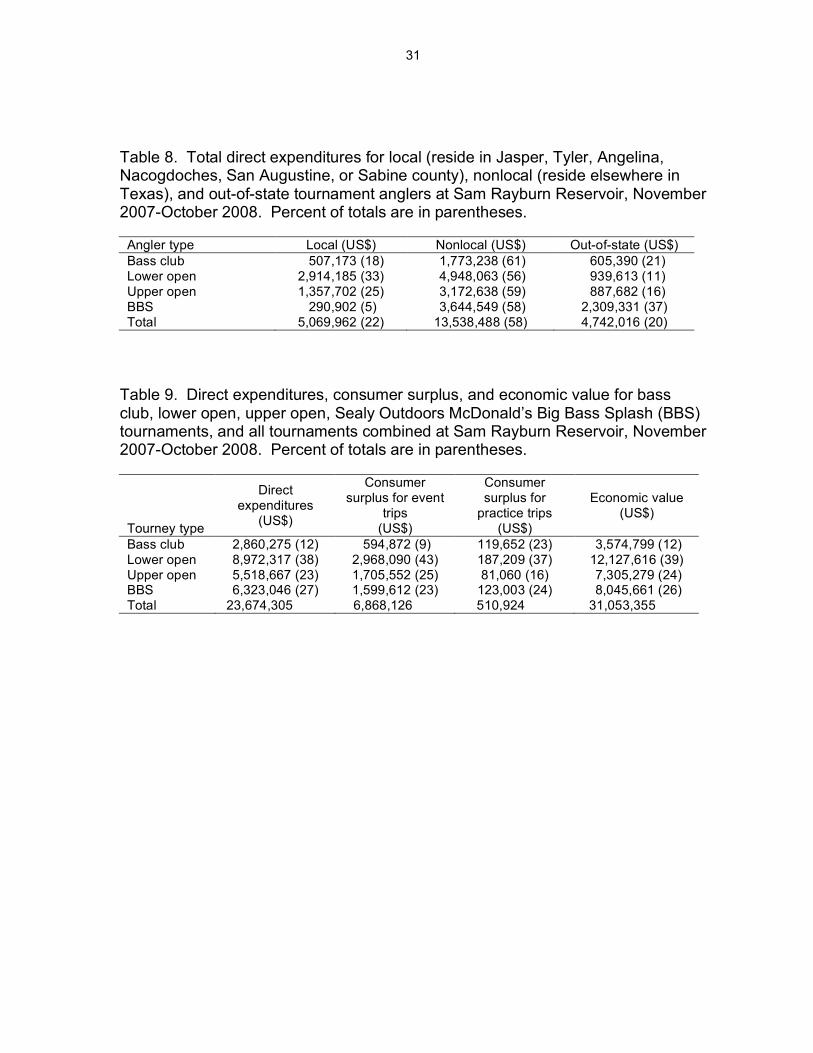
31
Table 8. Total direct expenditures for local (reside in Jasper, Tyler, Angelina, Nacogdoches, San Augustine, or Sabine county), nonlocal (reside elsewhere in Texas), and out-of-state tournament anglers at Sam Rayburn Reservoir, November 2007-October 2008. Percent of totals are in parentheses.
Angler type Local (US$) Nonlocal (US$) Out-of-state (US$) Bass club 507,173 (18) 1,773,238 (61) 605,390 (21) Lower open 2,914,185 (33) 4,948,063 (56) 939,613 (11) Upper open 1,357,702 (25) 3,172,638 (59) 887,682 (16) BBS 290,902 (5) 3,644,549 (58) 2,309,331 (37) Total 5,069,962 (22) 13,538,488 (58) 4,742,016 (20)
Table 9. Direct expenditures, consumer surplus, and economic value for bass club, lower open, upper open, Sealy Outdoors McDonald’s Big Bass Splash (BBS) tournaments, and all tournaments combined at Sam Rayburn Reservoir, November 2007-October 2008. Percent of totals are in parentheses.
Tourney type
Direct expenditures
(US$)
Consumer surplus for event
trips (US$)
Consumer surplus for
practice trips (US$)
Economic value (US$)
Bass club 2,860,275 (12) 594,872 (9) 119,652 (23) 3,574,799 (12) Lower open 8,972,317 (38) 2,968,090 (43) 187,209 (37) 12,127,616 (39) Upper open 5,518,667 (23) 1,705,552 (25) 81,060 (16) 7,305,279 (24) BBS 6,323,046 (27) 1,599,612 (23) 123,003 (24) 8,045,661 (26) Total 23,674,305 6,868,126 510,924 31,053,355
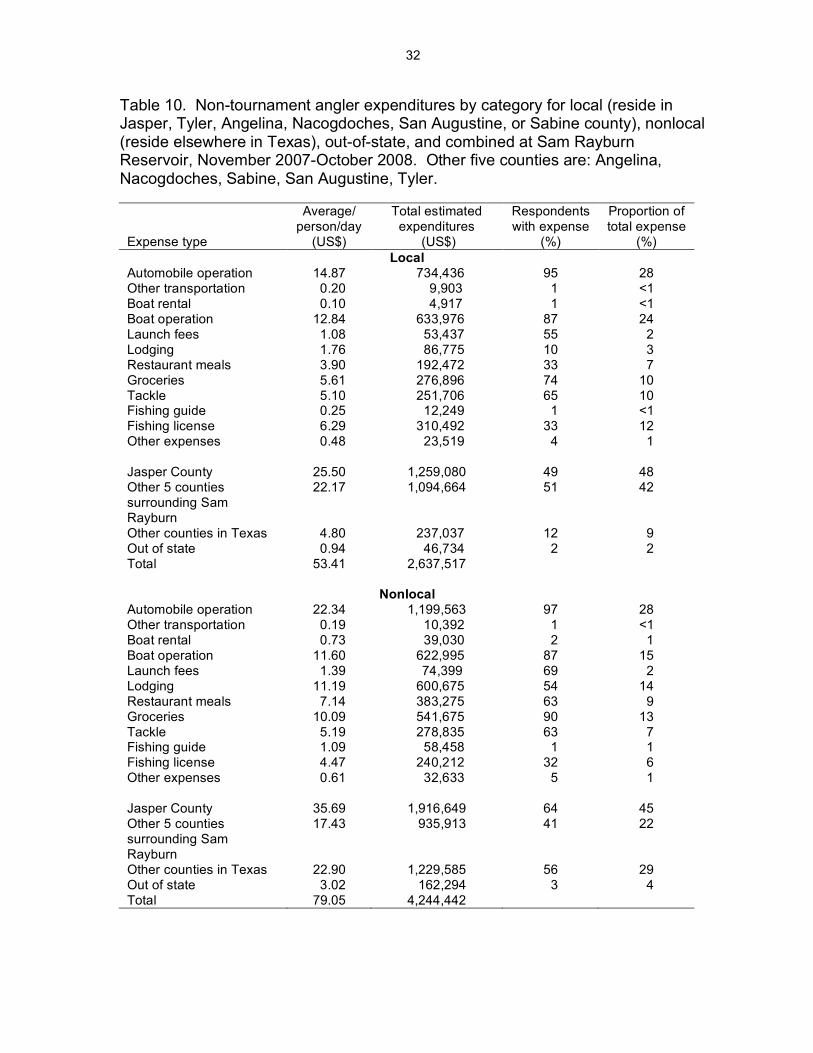
32
Table 10. Non-tournament angler expenditures by category for local (reside in Jasper, Tyler, Angelina, Nacogdoches, San Augustine, or Sabine county), nonlocal (reside elsewhere in Texas), out-of-state, and combined at Sam Rayburn Reservoir, November 2007-October 2008. Other five counties are: Angelina, Nacogdoches, Sabine, San Augustine, Tyler.
Expense type
Average/ person/day
(US$)
Total estimated expenditures
(US$)
Respondents with expense
(%)
Proportion of total expense
(%) Local
Automobile operation 14.87 734,436 95 28 Other transportation 0.20 9,903 1 <1 Boat rental 0.10 4,917 1 <1 Boat operation 12.84 633,976 87 24 Launch fees 1.08 53,437 55 2 Lodging 1.76 86,775 10 3 Restaurant meals 3.90 192,472 33 7 Groceries 5.61 276,896 74 10 Tackle 5.10 251,706 65 10 Fishing guide 0.25 12,249 1 <1 Fishing license 6.29 310,492 33 12 Other expenses 0.48 23,519 4 1 Jasper County 25.50 1,259,080 49 48 Other 5 counties surrounding Sam Rayburn
22.17 1,094,664 51 42
Other counties in Texas 4.80 237,037 12 9 Out of state 0.94 46,734 2 2 Total 53.41 2,637,517
Nonlocal Automobile operation 22.34 1,199,563 97 28 Other transportation 0.19 10,392 1 <1 Boat rental 0.73 39,030 2 1 Boat operation 11.60 622,995 87 15 Launch fees 1.39 74,399 69 2 Lodging 11.19 600,675 54 14 Restaurant meals 7.14 383,275 63 9 Groceries 10.09 541,675 90 13 Tackle 5.19 278,835 63 7 Fishing guide 1.09 58,458 1 1 Fishing license 4.47 240,212 32 6 Other expenses 0.61 32,633 5 1 Jasper County 35.69 1,916,649 64 45 Other 5 counties surrounding Sam Rayburn
17.43 935,913 41 22
Other counties in Texas 22.90 1,229,585 56 29 Out of state 3.02 162,294 3 4 Total 79.05 4,244,442
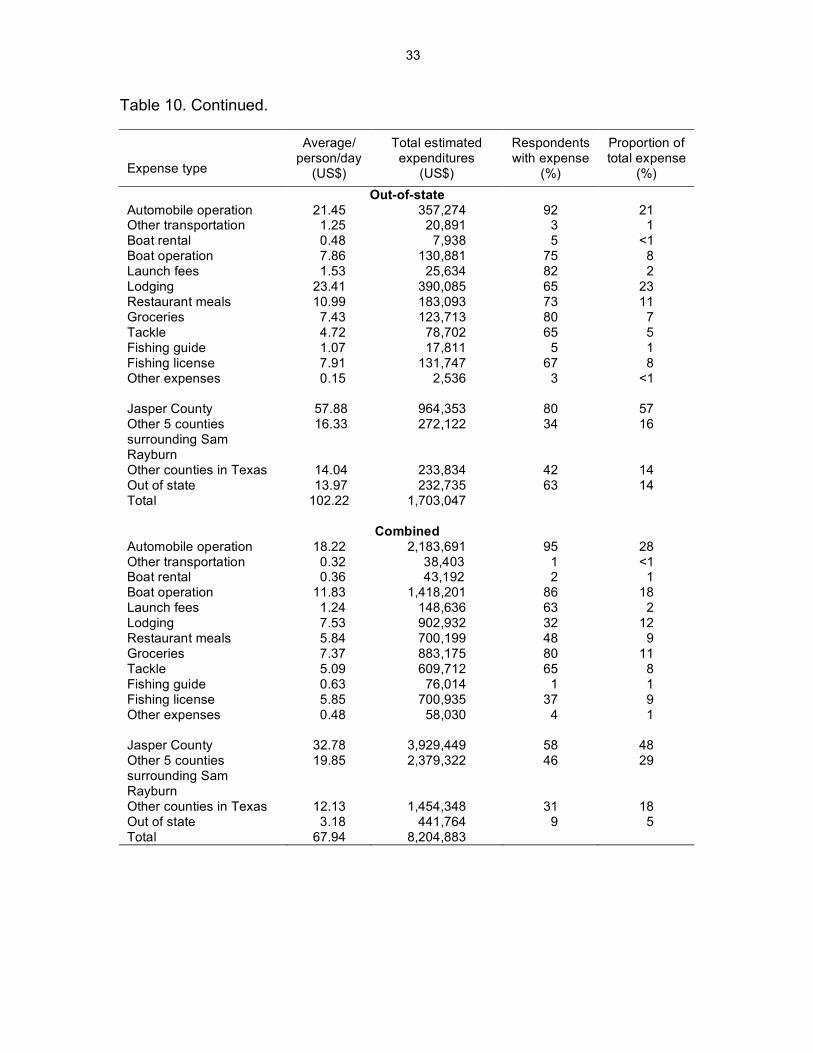
33
Table 10. Continued.
Expense type
Average/ person/day
(US$)
Total estimated expenditures
(US$)
Respondents with expense
(%)
Proportion of total expense
(%) Out-of-state
Automobile operation 21.45 357,274 92 21 Other transportation 1.25 20,891 3 1 Boat rental 0.48 7,938 5 <1 Boat operation 7.86 130,881 75 8 Launch fees 1.53 25,634 82 2 Lodging 23.41 390,085 65 23 Restaurant meals 10.99 183,093 73 11 Groceries 7.43 123,713 80 7 Tackle 4.72 78,702 65 5 Fishing guide 1.07 17,811 5 1 Fishing license 7.91 131,747 67 8 Other expenses 0.15 2,536 3 <1 Jasper County 57.88 964,353 80 57 Other 5 counties surrounding Sam Rayburn
16.33 272,122 34 16
Other counties in Texas 14.04 233,834 42 14 Out of state 13.97 232,735 63 14 Total 102.22 1,703,047
Combined Automobile operation 18.22 2,183,691 95 28 Other transportation 0.32 38,403 1 <1 Boat rental 0.36 43,192 2 1 Boat operation 11.83 1,418,201 86 18 Launch fees 1.24 148,636 63 2 Lodging 7.53 902,932 32 12 Restaurant meals 5.84 700,199 48 9 Groceries 7.37 883,175 80 11 Tackle 5.09 609,712 65 8 Fishing guide 0.63 76,014 1 1 Fishing license 5.85 700,935 37 9 Other expenses 0.48 58,030 4 1 Jasper County 32.78 3,929,449 58 48 Other 5 counties surrounding Sam Rayburn
19.85 2,379,322 46 29
Other counties in Texas 12.13 1,454,348 31 18 Out of state 3.18 441,764 9 5 Total 67.94 8,204,883
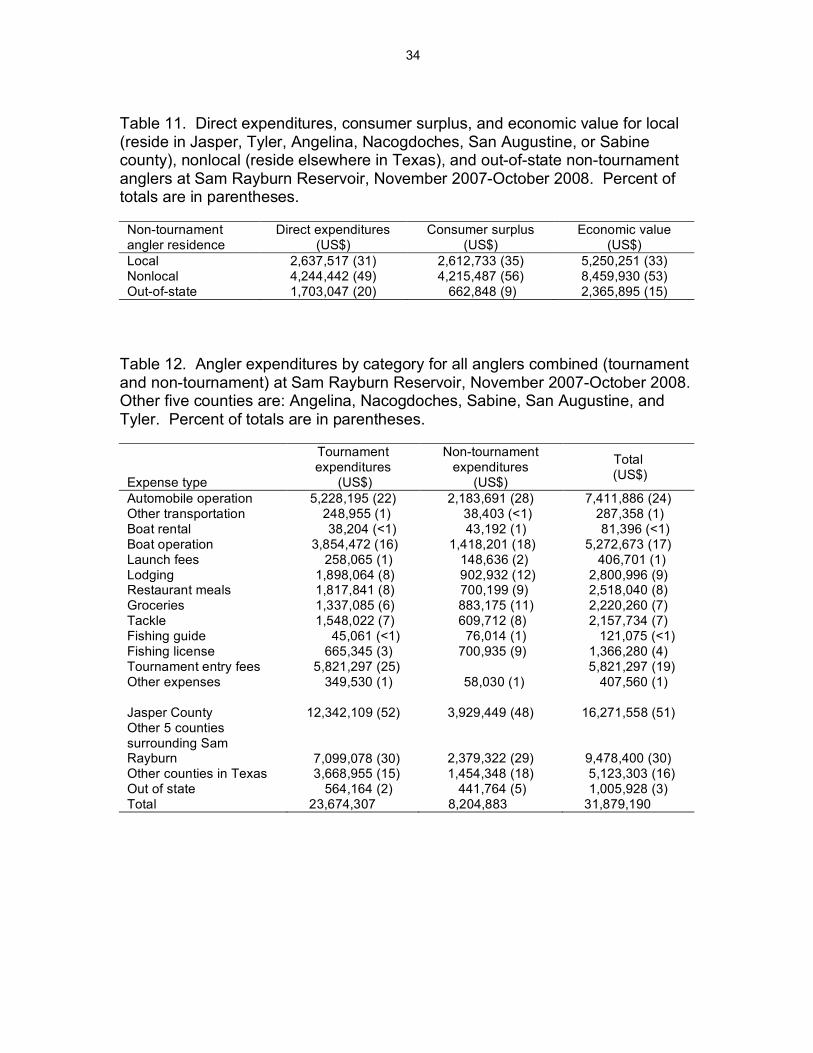
34
Table 11. Direct expenditures, consumer surplus, and economic value for local (reside in Jasper, Tyler, Angelina, Nacogdoches, San Augustine, or Sabine county), nonlocal (reside elsewhere in Texas), and out-of-state non-tournament anglers at Sam Rayburn Reservoir, November 2007-October 2008. Percent of totals are in parentheses.
Non-tournament angler residence
Direct expenditures (US$)
Consumer surplus (US$)
Economic value (US$)
Local 2,637,517 (31) 2,612,733 (35) 5,250,251 (33) Nonlocal 4,244,442 (49) 4,215,487 (56) 8,459,930 (53) Out-of-state 1,703,047 (20) 662,848 (9) 2,365,895 (15)
Table 12. Angler expenditures by category for all anglers combined (tournament and non-tournament) at Sam Rayburn Reservoir, November 2007-October 2008. Other five counties are: Angelina, Nacogdoches, Sabine, San Augustine, and Tyler. Percent of totals are in parentheses.
Expense type
Tournament expenditures
(US$)
Non-tournament expenditures
(US$)
Total (US$)
Automobile operation 5,228,195 (22) 2,183,691 (28) 7,411,886 (24) Other transportation 248,955 (1) 38,403 (<1) 287,358 (1) Boat rental 38,204 (<1) 43,192 (1) 81,396 (<1) Boat operation 3,854,472 (16) 1,418,201 (18) 5,272,673 (17) Launch fees 258,065 (1) 148,636 (2) 406,701 (1) Lodging 1,898,064 (8) 902,932 (12) 2,800,996 (9) Restaurant meals 1,817,841 (8) 700,199 (9) 2,518,040 (8) Groceries 1,337,085 (6) 883,175 (11) 2,220,260 (7) Tackle 1,548,022 (7) 609,712 (8) 2,157,734 (7) Fishing guide 45,061 (<1) 76,014 (1) 121,075 (<1) Fishing license 665,345 (3) 700,935 (9) 1,366,280 (4) Tournament entry fees 5,821,297 (25) 5,821,297 (19) Other expenses 349,530 (1) 58,030 (1) 407,560 (1) Jasper County 12,342,109 (52) 3,929,449 (48) 16,271,558 (51) Other 5 counties surrounding Sam Rayburn 7,099,078 (30)
2,379,322 (29)
9,478,400 (30) Other counties in Texas 3,668,955 (15) 1,454,348 (18) 5,123,303 (16) Out of state 564,164 (2) 441,764 (5) 1,005,928 (3) Total 23,674,307 8,204,883 31,879,190
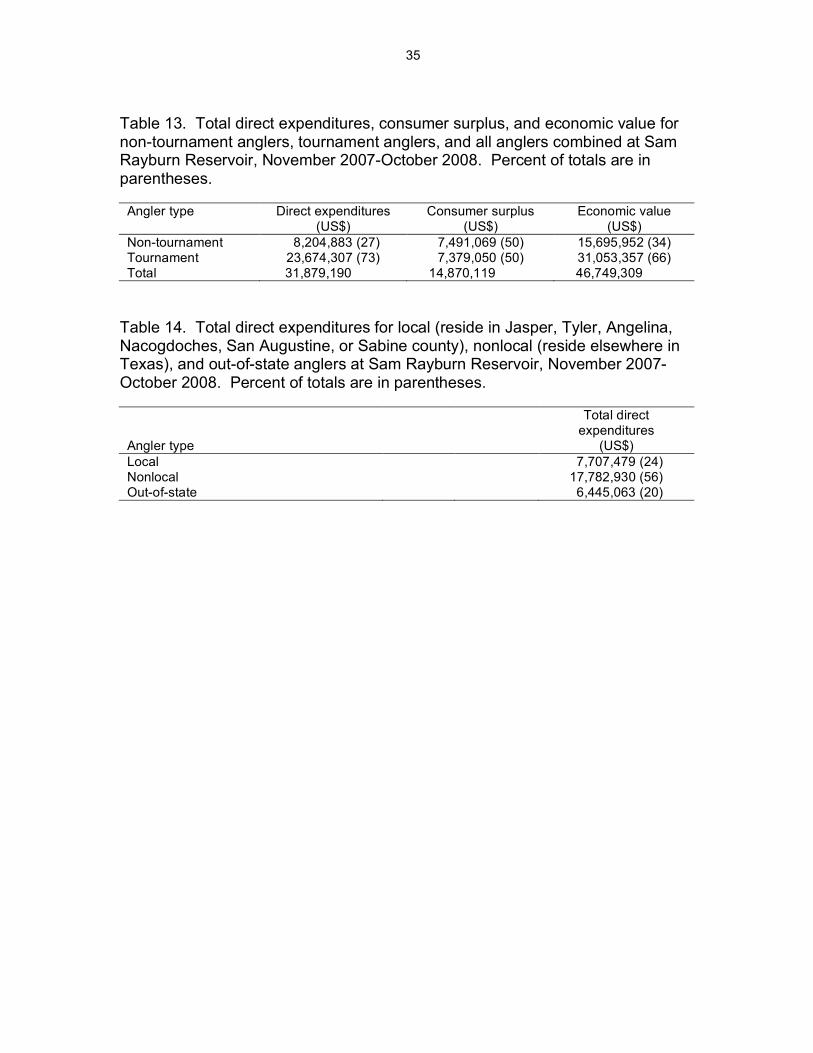
35
Table 13. Total direct expenditures, consumer surplus, and economic value for non-tournament anglers, tournament anglers, and all anglers combined at Sam Rayburn Reservoir, November 2007-October 2008. Percent of totals are in parentheses.
Angler type Direct expenditures (US$)
Consumer surplus (US$)
Economic value (US$)
Non-tournament 8,204,883 (27) 7,491,069 (50) 15,695,952 (34) Tournament 23,674,307 (73) 7,379,050 (50) 31,053,357 (66) Total 31,879,190 14,870,119 46,749,309
Table 14. Total direct expenditures for local (reside in Jasper, Tyler, Angelina, Nacogdoches, San Augustine, or Sabine county), nonlocal (reside elsewhere in Texas), and out-of-state anglers at Sam Rayburn Reservoir, November 2007-October 2008. Percent of totals are in parentheses.
Angler type
Total direct expenditures
(US$) Local 7,707,479 (24) Nonlocal 17,782,930 (56) Out-of-state 6,445,063 (20)
36
Appendix A. Tournament angler questionnaire.
Sam Rayburn Reservoir Tournament Angler
Survey
Texas Parks and Wildlife Department
Funded By
Jasper County Development District #1
37
Dear Angler: You recently participated in a bass tournament at Sam Rayburn. Enclosed is a questionnaire that is part of official research being conducted by Texas Parks and Wildlife concerning that tournament. As you probably know, demand for water continues to increase as the population and economy in Texas grow. Water is used for many things such as power generation, municipal or commercial use, agriculture, and recreation. Every five years, regional planning groups update recommendations regarding how the water resources of Texas will be allocated in the future. Information gained from this questionnaire will document the economic importance of tournaments at Sam Rayburn Reservoir and economic impacts to local communities. In the future, these values can be important information used by decision makers when addressing water allocation and fishery management issues. Your cooperation is extremely important to the completion of this research. Your answers will not be connected with your name and all information you provide will remain strictly confidential. Please take the time to complete this questionnaire and return it in the enclosed postage-paid envelope. If you should have any questions, please contact us by mail, e-mail or phone using information provided on the final page of the survey. Sincerely, Phil Durocher Director, Inland Fisheries
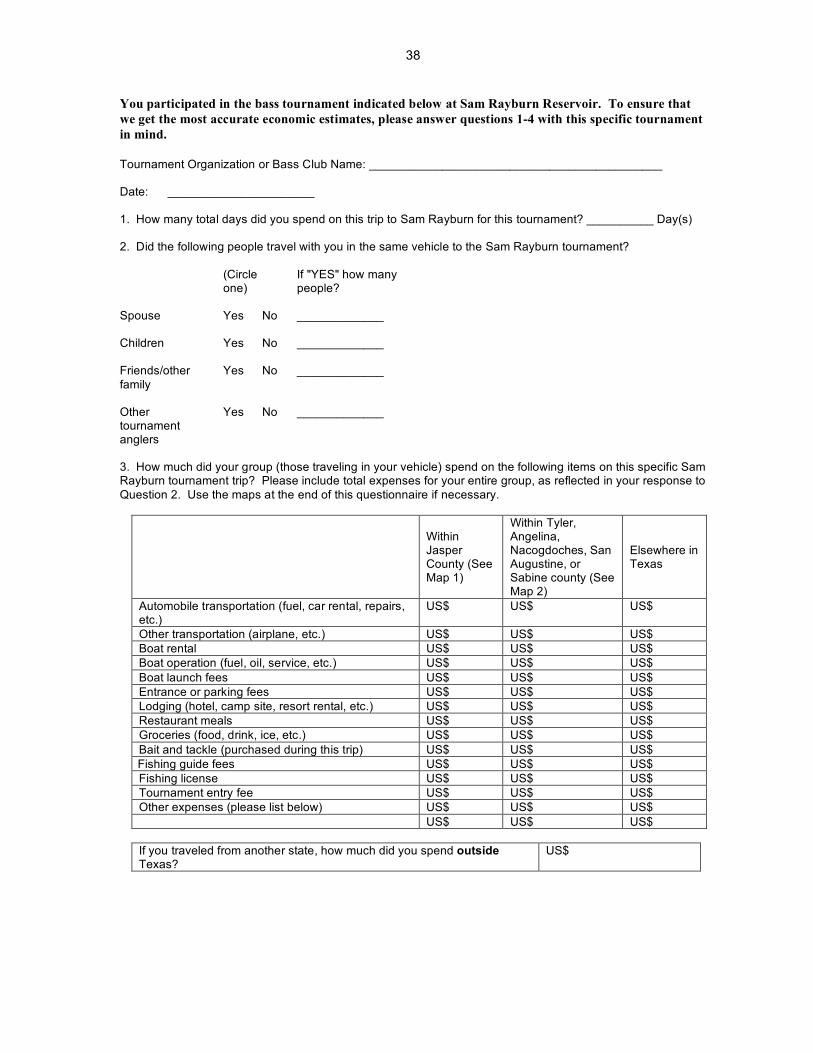
38
You participated in the bass tournament indicated below at Sam Rayburn Reservoir. To ensure that we get the most accurate economic estimates, please answer questions 1-4 with this specific tournament in mind. Tournament Organization or Bass Club Name: ____________________________________________ Date: ______________________ 1. How many total days did you spend on this trip to Sam Rayburn for this tournament? __________ Day(s) 2. Did the following people travel with you in the same vehicle to the Sam Rayburn tournament? (Circle
one) If "YES" how many people?
Spouse
Yes No _____________
Children
Yes No _____________
Friends/other family
Yes No _____________
Other tournament anglers
Yes No _____________
3. How much did your group (those traveling in your vehicle) spend on the following items on this specific Sam Rayburn tournament trip? Please include total expenses for your entire group, as reflected in your response to Question 2. Use the maps at the end of this questionnaire if necessary.
Within Jasper County (See Map 1)
Within Tyler, Angelina, Nacogdoches, San Augustine, or Sabine county (See Map 2)
Elsewhere in Texas
Automobile transportation (fuel, car rental, repairs, etc.)
US$ US$ US$
Other transportation (airplane, etc.) US$ US$ US$ Boat rental US$ US$ US$ Boat operation (fuel, oil, service, etc.) US$ US$ US$ Boat launch fees US$ US$ US$ Entrance or parking fees US$ US$ US$ Lodging (hotel, camp site, resort rental, etc.) US$ US$ US$ Restaurant meals US$ US$ US$ Groceries (food, drink, ice, etc.) US$ US$ US$ Bait and tackle (purchased during this trip) US$ US$ US$ Fishing guide fees US$ US$ US$ Fishing license US$ US$ US$ Tournament entry fee US$ US$ US$ Other expenses (please list below) US$ US$ US$ US$ US$ US$
If you traveled from another state, how much did you spend outside Texas?
US$
39
4. If the price of goods and services were to increase so this trip cost US$___________more than it did (sum of Question 3), would you have paid this additional cost rather than not have gone fishing on this trip?
Many anglers also spend considerable time practice fishing for tournaments. For study purposes, we are defining practice fishing as days spent specifically preparing for this tournament on separate trip(s) prior to your actual tournament trip. To ensure that we get the most accurate economic estimates, please answer questions 5-7 with days solely attributed to practice fishing for this specific tournament in mind. If no separate trips were taken, please skip to Question #8. 5. How many total days, NOT including the days you reported in Question 1, did you spend practice fishing at Sam Rayburn prior to the trip for this tournament? ____________Day(s) 6. Did the following people travel with you in the same vehicle on the practice days you reported in Question 5? (Circle
one) If "YES" how many people?
If “YES” how many practice days
Spouse
Yes No
Children
Yes No
Friends/other family
Yes No
Other tournament anglers
Yes No
40
7. How much did your group (those traveling in your vehicle) spend on the following items on the practice days you reported in Question 5? Please include total expenses for your entire group, as reflected in your response to Question 6. Use the maps at the end of this questionnaire if necessary.
Within Jasper County (See Map 1)
Within Tyler, Angelina, Nacogdoches, San Augustine, or Sabine county (See Map 2)
Elsewhere in Texas
Automobile transportation (fuel, car rental, repairs, etc.)
US$ US$ US$
Other transportation (airplane, etc.) US$ US$ US$ Boat rental US$ US$ US$ Boat operation (fuel, oil, service, etc.) US$ US$ US$ Boat launch fees US$ US$ US$ Entrance or parking fees US$ US$ US$ Lodging (hotel, camp site, resort rental, etc.) US$ US$ US$ Restaurant meals US$ US$ US$ Groceries (food, drink, ice, etc.) US$ US$ US$ Bait and tackle (purchased during this trip) US$ US$ US$ Fishing guide fees US$ US$ US$ Fishing license US$ US$ US$ Other expenses (please list below) US$ US$ US$ US$ US$ US$
If you traveled from another state, how much did you spend outside Texas?
US$
8. Overall, how satisfied are you with tournament fishing at Sam Rayburn? (Circle one) Not at all Satisfied Slightly Satisfied Moderately Satisfied Very Satisfied Extremely Satisfied
1 2 3 4 5 9. If you selected NOT AT ALL SATISFIED with tournament fishing at Sam Rayburn in Question #8, please explain why. ______________________________________________________________________________________ ______________________________________________________________________________________ ______________________________________________________________________________________
41
10. Do you have access to the Internet? (Circle one).
Yes No If YES, we are increasingly using the Internet as another way to communicate with anglers. Would you be willing to provide us with your e-mail address to receive a copy of the economic study results? (Circle one).
Yes (If Yes, what is your e-mail? ________________________________________________) No
11. Did the person to whom this survey was addressed complete the survey? (Circle one)
Yes No
12. What is the zip code of your permanent residence__________________________ 13. Please use this space to provide us with any comments you may have.
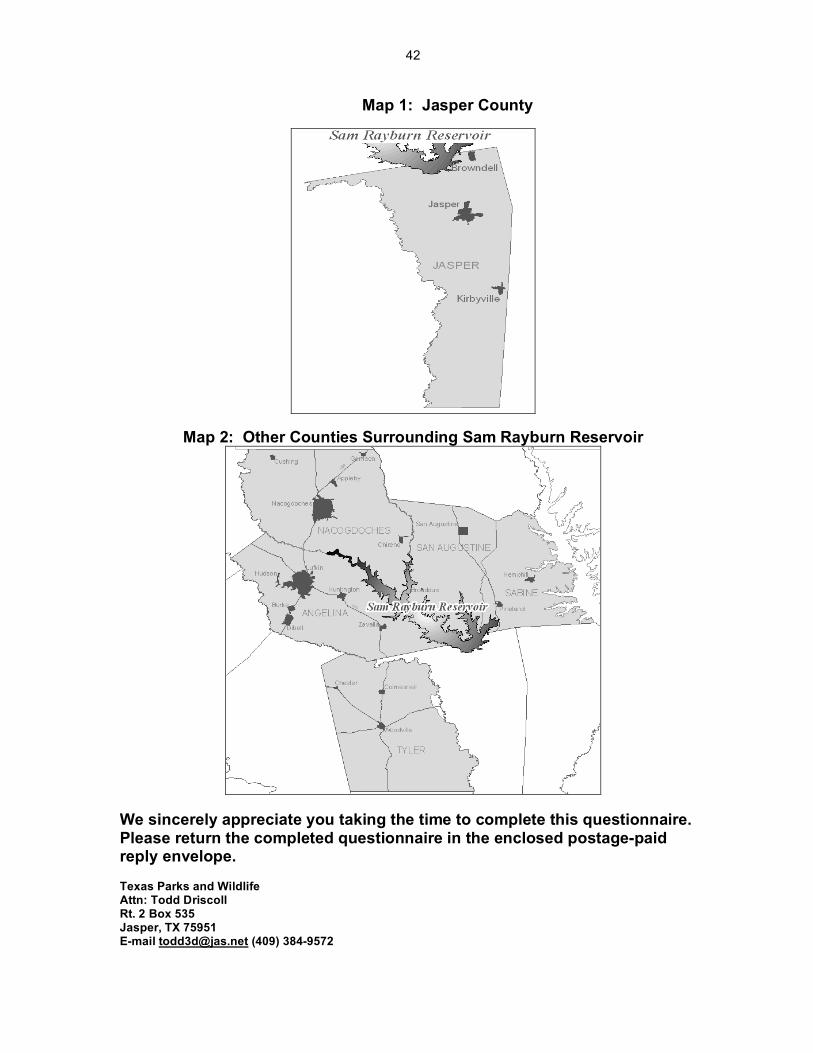
42
Map 1: Jasper County
Map 2: Other Counties Surrounding Sam Rayburn Reservoir
We sincerely appreciate you taking the time to complete this questionnaire. Please return the completed questionnaire in the enclosed postage-paid reply envelope. Texas Parks and Wildlife Attn: Todd Driscoll Rt. 2 Box 535 Jasper, TX 75951 E-mail [email protected] (409) 384-9572

43
Appendix B. Non-tournament angler questionnaire.
Sam Rayburn Reservoir Angler Survey
Texas Parks and Wildlife Department
Funded By
Jasper County Development District #1
44
Dear Angler: As you probably know, demand for water continues to increase as the population and economy of Texas grow. Water is used for many things such as power generation, municipal or commercial use, agriculture, and recreation. Every five years, regional planning groups update recommendations regarding how the water resources of Texas will be allocated in the future. Information gained from this questionnaire will document the economic importance of recreational angling at Sam Rayburn Reservoir and economic impacts to local communities. In the future, these values can be important information used by decision makers when addressing water allocation and fishery management issues. During a fishing trip you were asked by one of our Texas Parks and Wildlife Inland Fisheries staff to participate in the economic research we are conducting at Sam Rayburn Reservoir. Enclosed is a questionnaire that has only been issued to a sample of Sam Rayburn Reservoir anglers. Your cooperation is extremely important to the completion of this research. Your answers will not be connected with your name and all information you provide will remain strictly confidential. Please take the time to complete this questionnaire and return it in the enclosed postage-paid envelope. If you should have any questions, please contact us by mail, e-mail or phone using information provided on the final page of the survey. Sincerely,
Phil Durocher Director, Inland Fisheries
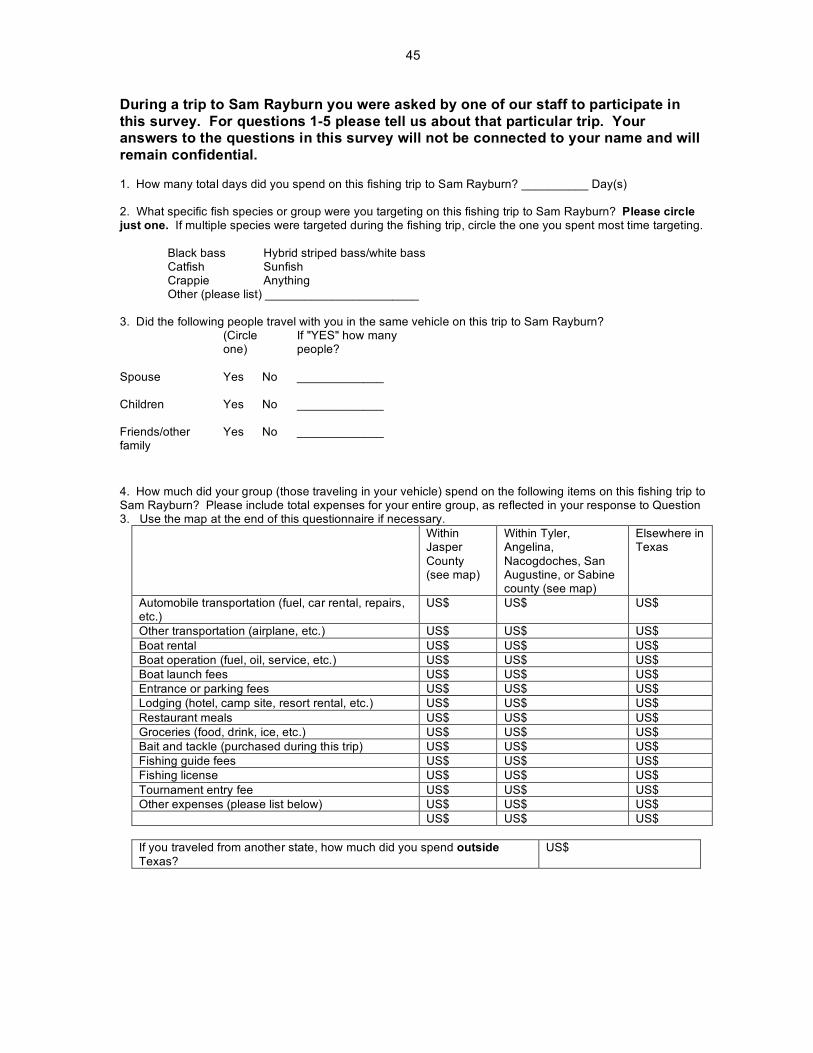
45
During a trip to Sam Rayburn you were asked by one of our staff to participate in this survey. For questions 1-5 please tell us about that particular trip. Your answers to the questions in this survey will not be connected to your name and will remain confidential. 1. How many total days did you spend on this fishing trip to Sam Rayburn? __________ Day(s) 2. What specific fish species or group were you targeting on this fishing trip to Sam Rayburn? Please circle just one. If multiple species were targeted during the fishing trip, circle the one you spent most time targeting. Black bass Hybrid striped bass/white bass Catfish Sunfish Crappie Anything Other (please list) _______________________ 3. Did the following people travel with you in the same vehicle on this trip to Sam Rayburn? (Circle
one) If "YES" how many people?
Spouse
Yes No _____________
Children
Yes No _____________
Friends/other family
Yes No _____________
4. How much did your group (those traveling in your vehicle) spend on the following items on this fishing trip to Sam Rayburn? Please include total expenses for your entire group, as reflected in your response to Question 3. Use the map at the end of this questionnaire if necessary.
Within Jasper County (see map)
Within Tyler, Angelina, Nacogdoches, San Augustine, or Sabine county (see map)
Elsewhere in Texas
Automobile transportation (fuel, car rental, repairs, etc.)
US$ US$ US$
Other transportation (airplane, etc.) US$ US$ US$ Boat rental US$ US$ US$ Boat operation (fuel, oil, service, etc.) US$ US$ US$ Boat launch fees US$ US$ US$ Entrance or parking fees US$ US$ US$ Lodging (hotel, camp site, resort rental, etc.) US$ US$ US$ Restaurant meals US$ US$ US$ Groceries (food, drink, ice, etc.) US$ US$ US$ Bait and tackle (purchased during this trip) US$ US$ US$ Fishing guide fees US$ US$ US$ Fishing license US$ US$ US$ Tournament entry fee US$ US$ US$ Other expenses (please list below) US$ US$ US$ US$ US$ US$
If you traveled from another state, how much did you spend outside Texas?
US$
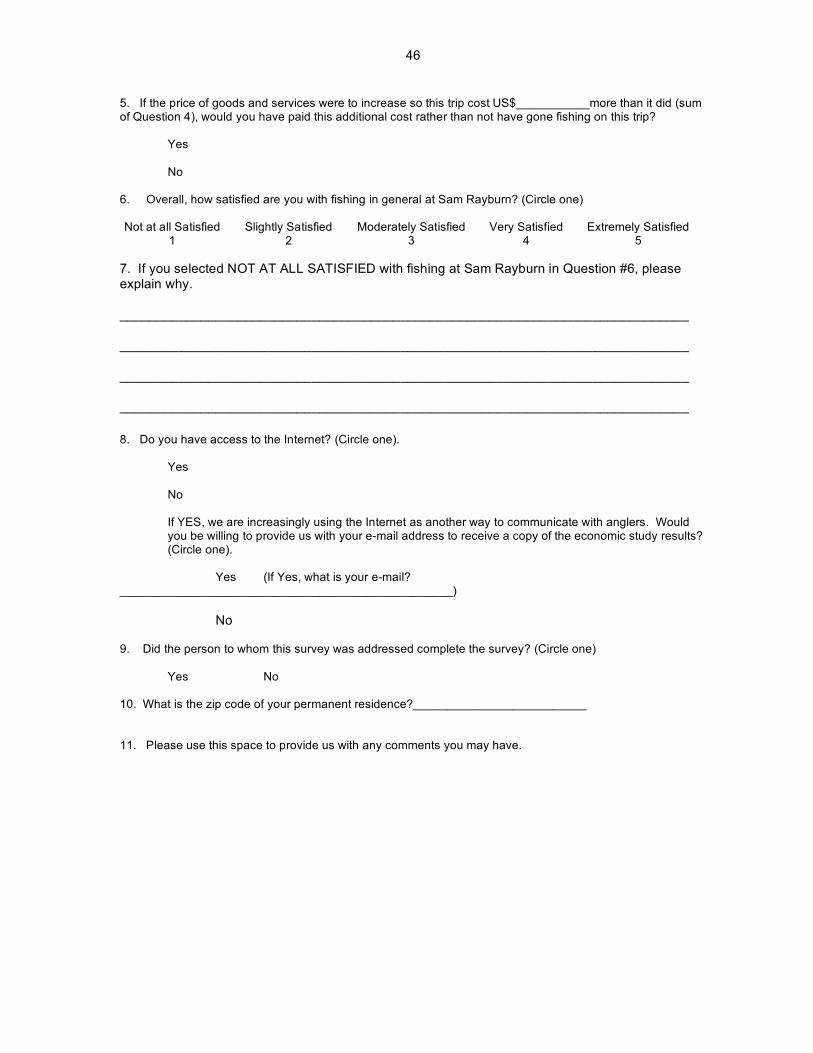
46
5. If the price of goods and services were to increase so this trip cost US$___________more than it did (sum of Question 4), would you have paid this additional cost rather than not have gone fishing on this trip? Yes No 6. Overall, how satisfied are you with fishing in general at Sam Rayburn? (Circle one) Not at all Satisfied Slightly Satisfied Moderately Satisfied Very Satisfied Extremely Satisfied
1 2 3 4 5 7. If you selected NOT AT ALL SATISFIED with fishing at Sam Rayburn in Question #6, please explain why. _____________________________________________________________________________ _____________________________________________________________________________ _____________________________________________________________________________ _____________________________________________________________________________ 8. Do you have access to the Internet? (Circle one).
Yes No If YES, we are increasingly using the Internet as another way to communicate with anglers. Would you be willing to provide us with your e-mail address to receive a copy of the economic study results? (Circle one).
Yes (If Yes, what is your e-mail? __________________________________________________) No 9. Did the person to whom this survey was addressed complete the survey? (Circle one)
Yes No
10. What is the zip code of your permanent residence?__________________________ 11. Please use this space to provide us with any comments you may have.
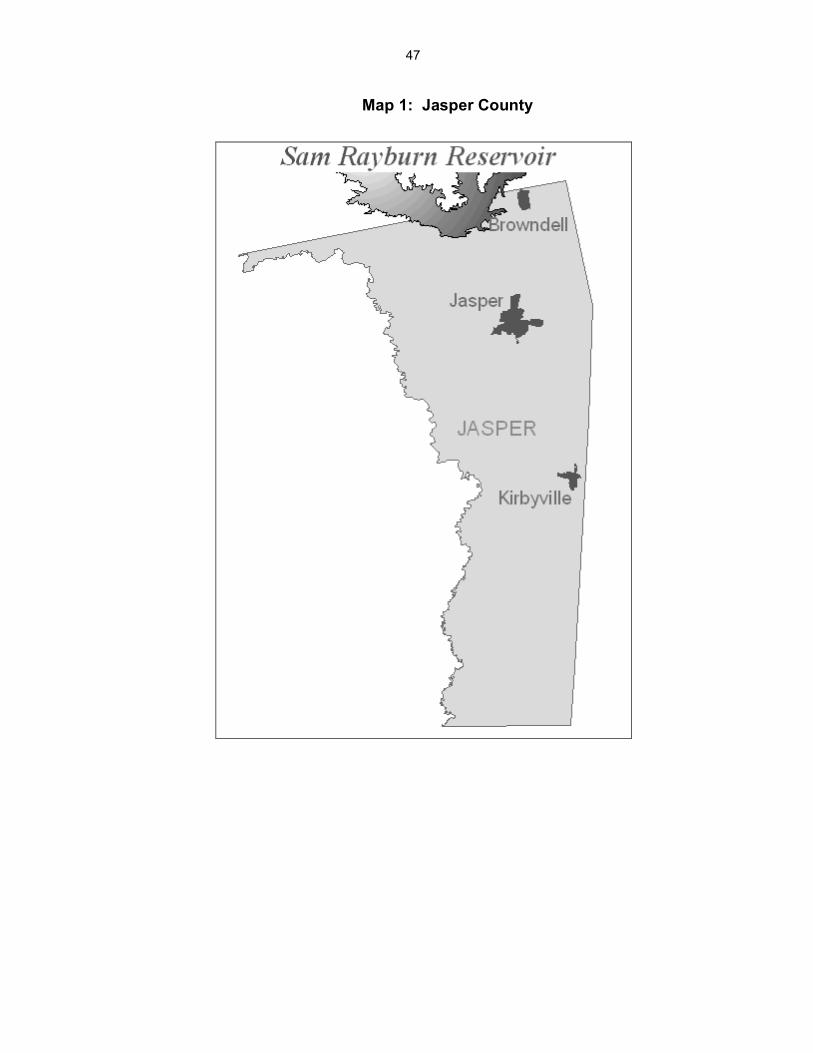
47
Map 1: Jasper County
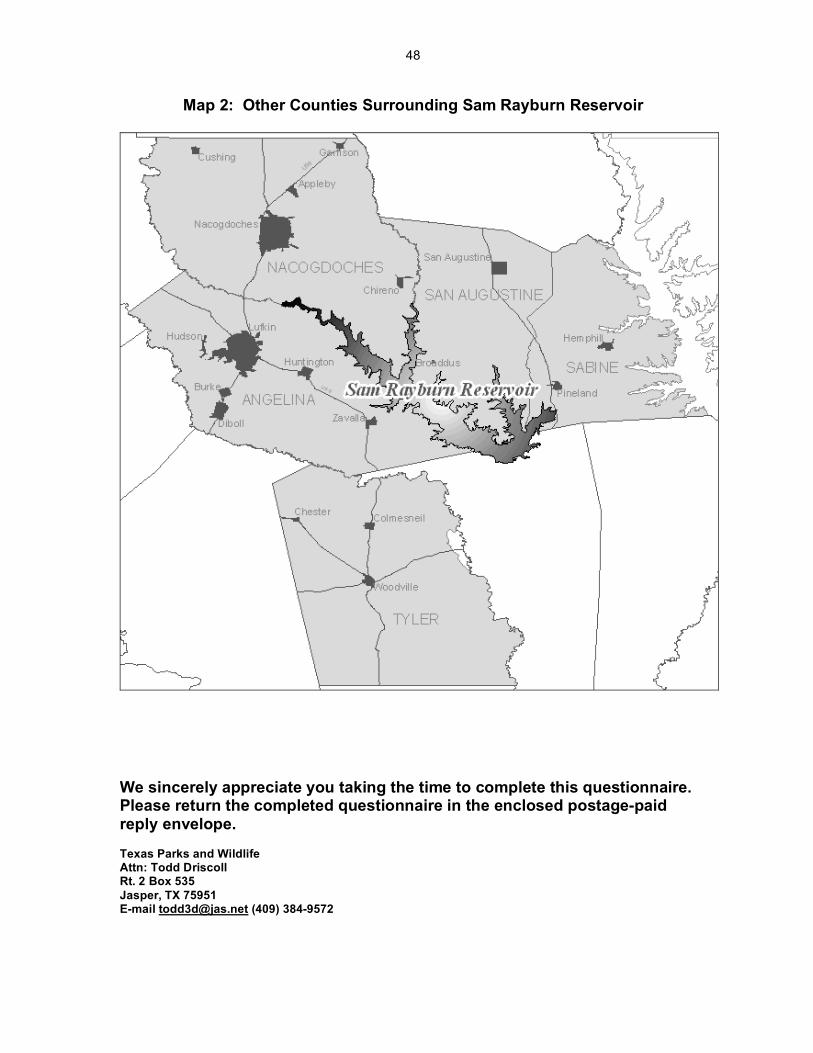
48
Map 2: Other Counties Surrounding Sam Rayburn Reservoir
We sincerely appreciate you taking the time to complete this questionnaire. Please return the completed questionnaire in the enclosed postage-paid reply envelope. Texas Parks and Wildlife Attn: Todd Driscoll Rt. 2 Box 535 Jasper, TX 75951 E-mail [email protected] (409) 384-9572
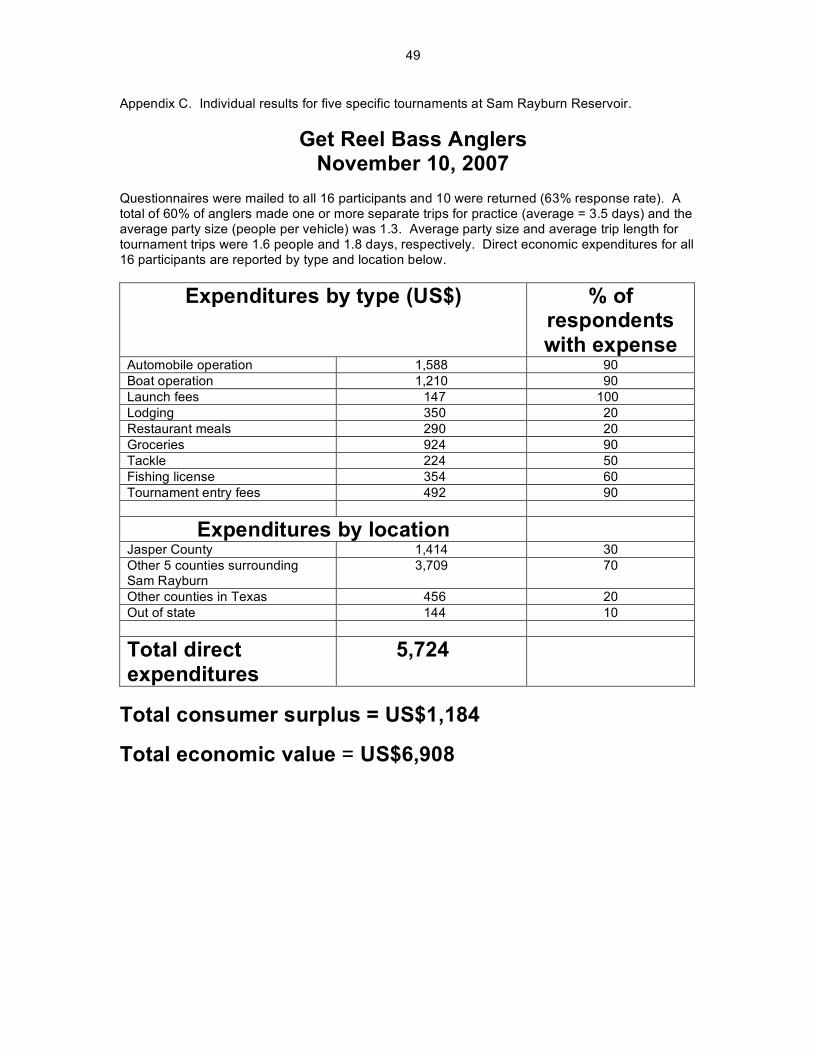
49
Appendix C. Individual results for five specific tournaments at Sam Rayburn Reservoir.
Get Reel Bass Anglers November 10, 2007
Questionnaires were mailed to all 16 participants and 10 were returned (63% response rate). A total of 60% of anglers made one or more separate trips for practice (average = 3.5 days) and the average party size (people per vehicle) was 1.3. Average party size and average trip length for tournament trips were 1.6 people and 1.8 days, respectively. Direct economic expenditures for all 16 participants are reported by type and location below.
Expenditures by type (US$) % of respondents with expense
Automobile operation 1,588 90 Boat operation 1,210 90 Launch fees 147 100 Lodging 350 20 Restaurant meals 290 20 Groceries 924 90 Tackle 224 50 Fishing license 354 60 Tournament entry fees 492 90
Expenditures by location
Jasper County 1,414 30 Other 5 counties surrounding Sam Rayburn
3,709 70
Other counties in Texas 456 20 Out of state 144 10
Total direct expenditures
5,724
Total consumer surplus = US$1,184
Total economic value = US$6,908
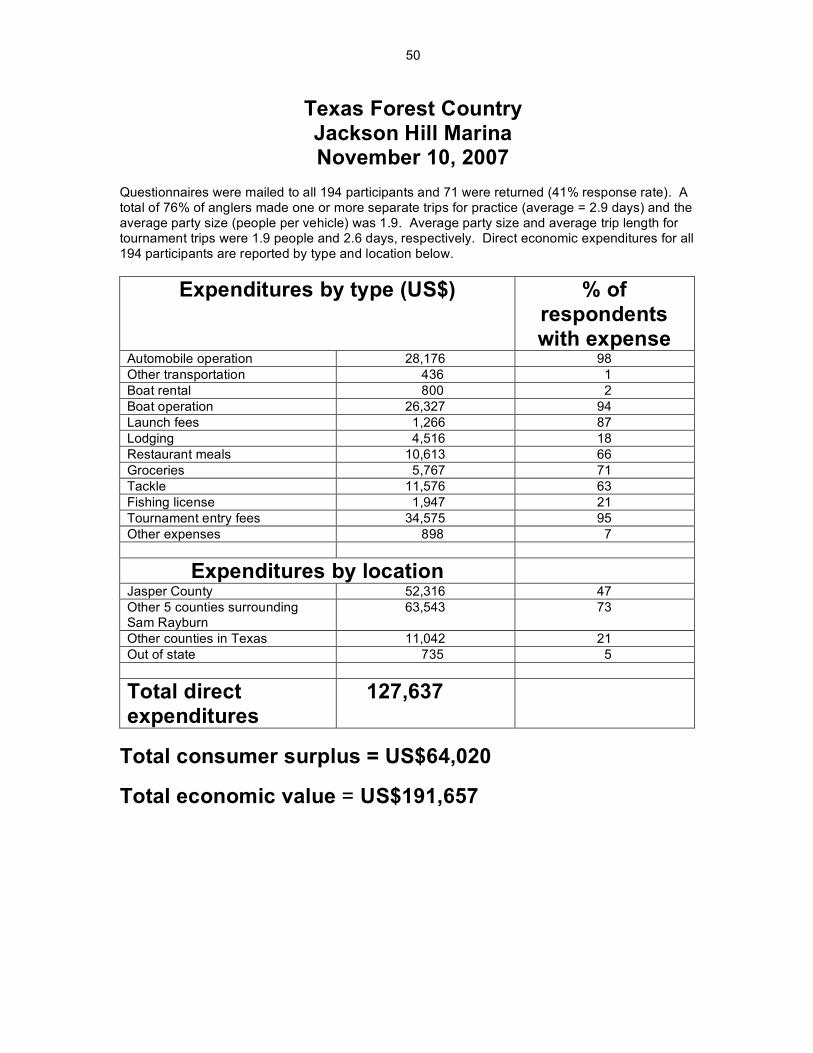
50
Texas Forest Country Jackson Hill Marina November 10, 2007
Questionnaires were mailed to all 194 participants and 71 were returned (41% response rate). A total of 76% of anglers made one or more separate trips for practice (average = 2.9 days) and the average party size (people per vehicle) was 1.9. Average party size and average trip length for tournament trips were 1.9 people and 2.6 days, respectively. Direct economic expenditures for all 194 participants are reported by type and location below.
Expenditures by type (US$) % of respondents with expense
Automobile operation 28,176 98 Other transportation 436 1 Boat rental 800 2 Boat operation 26,327 94 Launch fees 1,266 87 Lodging 4,516 18 Restaurant meals 10,613 66 Groceries 5,767 71 Tackle 11,576 63 Fishing license 1,947 21 Tournament entry fees 34,575 95 Other expenses 898 7
Expenditures by location
Jasper County 52,316 47 Other 5 counties surrounding Sam Rayburn
63,543 73
Other counties in Texas 11,042 21 Out of state 735 5
Total direct expenditures
127,637
Total consumer surplus = US$64,020
Total economic value = US$191,657
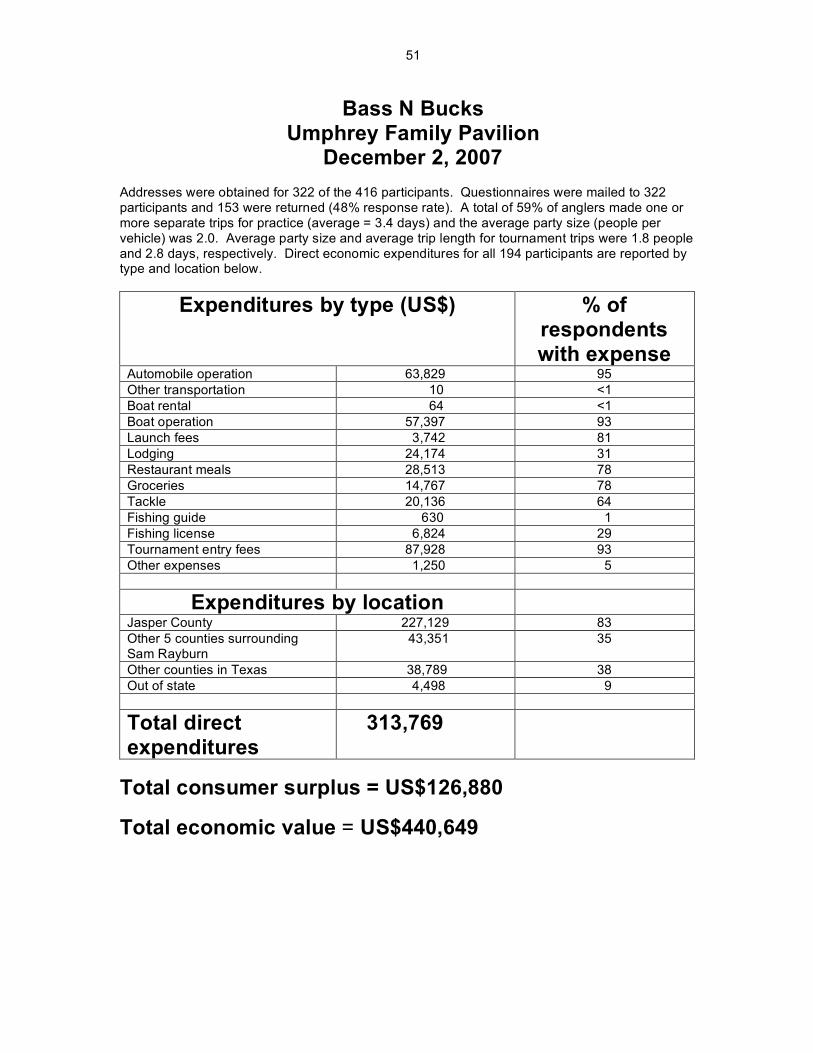
51
Bass N Bucks Umphrey Family Pavilion
December 2, 2007 Addresses were obtained for 322 of the 416 participants. Questionnaires were mailed to 322 participants and 153 were returned (48% response rate). A total of 59% of anglers made one or more separate trips for practice (average = 3.4 days) and the average party size (people per vehicle) was 2.0. Average party size and average trip length for tournament trips were 1.8 people and 2.8 days, respectively. Direct economic expenditures for all 194 participants are reported by type and location below.
Expenditures by type (US$) % of respondents with expense
Automobile operation 63,829 95 Other transportation 10 <1 Boat rental 64 <1 Boat operation 57,397 93 Launch fees 3,742 81 Lodging 24,174 31 Restaurant meals 28,513 78 Groceries 14,767 78 Tackle 20,136 64 Fishing guide 630 1 Fishing license 6,824 29 Tournament entry fees 87,928 93 Other expenses 1,250 5
Expenditures by location
Jasper County 227,129 83 Other 5 counties surrounding Sam Rayburn
43,351 35
Other counties in Texas 38,789 38 Out of state 4,498 9
Total direct expenditures
313,769
Total consumer surplus = US$126,880
Total economic value = US$440,649
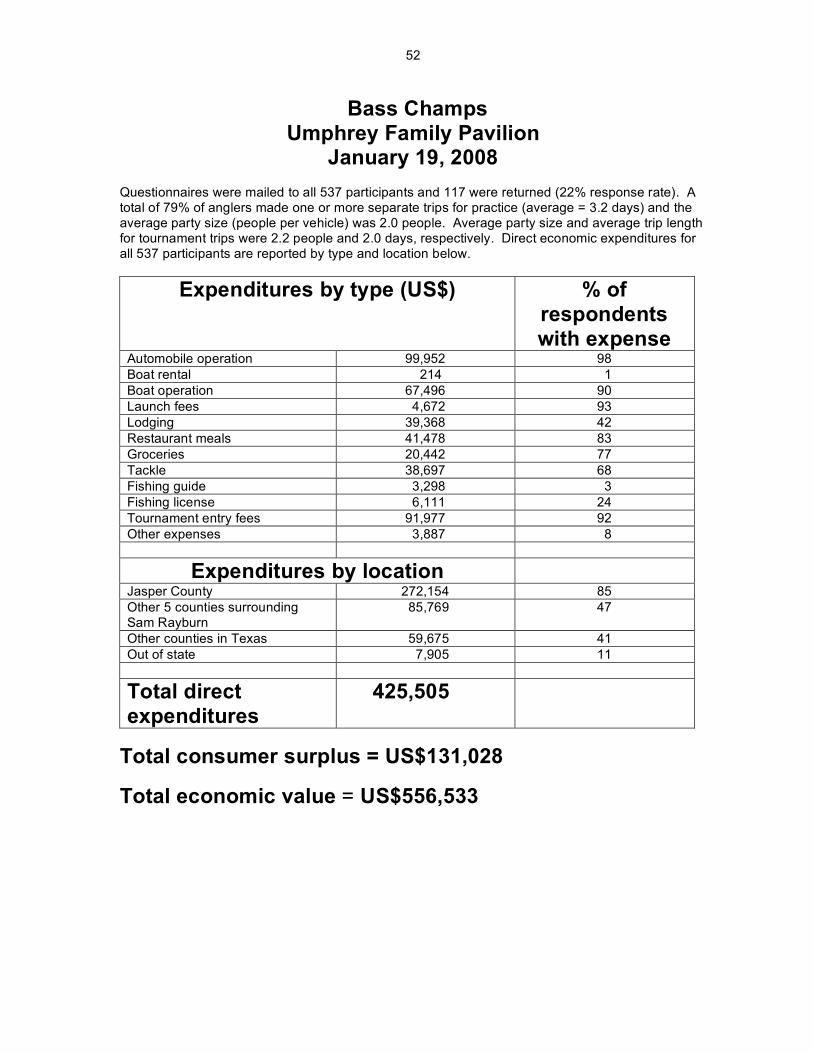
52
Bass Champs Umphrey Family Pavilion
January 19, 2008 Questionnaires were mailed to all 537 participants and 117 were returned (22% response rate). A total of 79% of anglers made one or more separate trips for practice (average = 3.2 days) and the average party size (people per vehicle) was 2.0 people. Average party size and average trip length for tournament trips were 2.2 people and 2.0 days, respectively. Direct economic expenditures for all 537 participants are reported by type and location below.
Expenditures by type (US$) % of respondents with expense
Automobile operation 99,952 98 Boat rental 214 1 Boat operation 67,496 90 Launch fees 4,672 93 Lodging 39,368 42 Restaurant meals 41,478 83 Groceries 20,442 77 Tackle 38,697 68 Fishing guide 3,298 3 Fishing license 6,111 24 Tournament entry fees 91,977 92 Other expenses 3,887 8
Expenditures by location
Jasper County 272,154 85 Other 5 counties surrounding Sam Rayburn
85,769 47
Other counties in Texas 59,675 41 Out of state 7,905 11
Total direct expenditures
425,505
Total consumer surplus = US$131,028
Total economic value = US$556,533
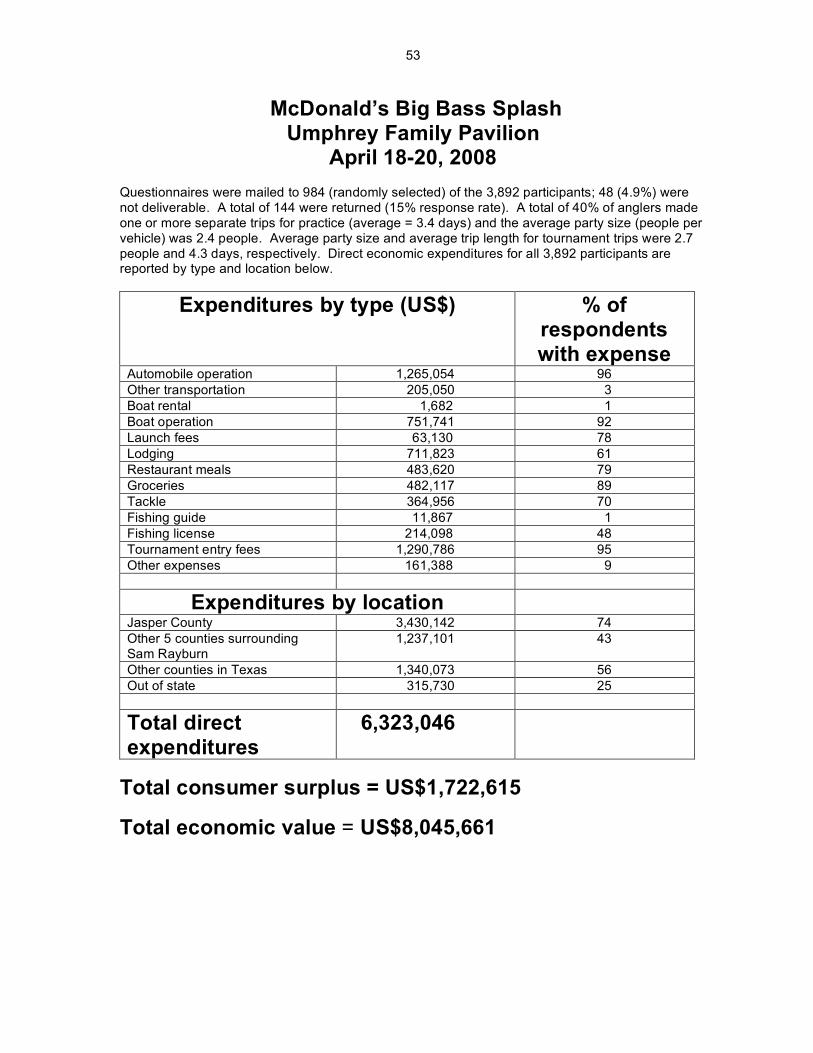
53
McDonald’s Big Bass Splash Umphrey Family Pavilion
April 18-20, 2008 Questionnaires were mailed to 984 (randomly selected) of the 3,892 participants; 48 (4.9%) were not deliverable. A total of 144 were returned (15% response rate). A total of 40% of anglers made one or more separate trips for practice (average = 3.4 days) and the average party size (people per vehicle) was 2.4 people. Average party size and average trip length for tournament trips were 2.7 people and 4.3 days, respectively. Direct economic expenditures for all 3,892 participants are reported by type and location below.
Expenditures by type (US$) % of respondents with expense
Automobile operation 1,265,054 96 Other transportation 205,050 3 Boat rental 1,682 1 Boat operation 751,741 92 Launch fees 63,130 78 Lodging 711,823 61 Restaurant meals 483,620 79 Groceries 482,117 89 Tackle 364,956 70 Fishing guide 11,867 1 Fishing license 214,098 48 Tournament entry fees 1,290,786 95 Other expenses 161,388 9
Expenditures by location
Jasper County 3,430,142 74 Other 5 counties surrounding Sam Rayburn
1,237,101 43
Other counties in Texas 1,340,073 56 Out of state 315,730 25
Total direct expenditures
6,323,046
Total consumer surplus = US$1,722,615
Total economic value = US$8,045,661

PWD RP T3200-1561 (4/10)
In accordance with Texas Depository Law, this publication is available at theTexas State Publications Clearinghouse and/or Texas Depository Libraries.