annual corporate governance review
TRANSCRIPT

ANNUAL CORPORATEGOVERNANCE REVIEW
> Annual Meetings> Shareholder Initiatives
> Proxy Contests
2011


2011ANNUAL CORPORATE
GOVERNANCE REVIEW> Annual Meetings
> Shareholder Initiatives> Proxy Contests

This page intentionally left blank.

> 3
CONTENTS
Executive Summary 4
Methodology 11
PART 1 — CORPORATE GOVERNANCE-RELATED SHAREHOLDER PROPOSALS AND SPONSORS
Figure 1 Corporate Governance Proposals Submitted – 2007 to 2011 (Chart) 14
Figure 2 Corporate Governance Proposals Voted On – 2007 to 2011 (Chart) 14
Figure 3 Corporate Governance Proposals Voted On – 2007 to 2011 (Table) 14
Figure 4 Sponsorship of Corporate Governance Proposals – 2010 and 2011 (Table) 15
Figure 5 Corporate Governance Shareholder Proposals – 2010 and 2011 (Chart) 16
Figure 6 Corporate Governance Proposals Withdrawn or Omitted vs. Voted On – 2010 and 2011 (Chart) 17
Figure 7 Sponsors of Corporate Governance Proposals – 2010 and 2011 (Chart) 18
PART 2 — PROPOSAL VOTING RESULTS
Figure 8 Summary Average Voting Results for Selected Proposals – 2011 (Table) 20
Figure 9 Votes for Selected Proposals Relating to Board Issues – 2007 to 2011 (Chart) 21
Figure 10 Votes for Proposals Relating to Antitakeover Provisions – 2007 to 2011 (Chart) 21
Figure 11 Votes for Selected Proposals Relating to Shareholder Rights – 2007 to 2011 (Chart) 21
Figure 12 Binding Bylaw Provisions – 2002 to 2011 (Chart) 22
Figure 13 Binding Bylaw Provisions – 2011 (Table) 22
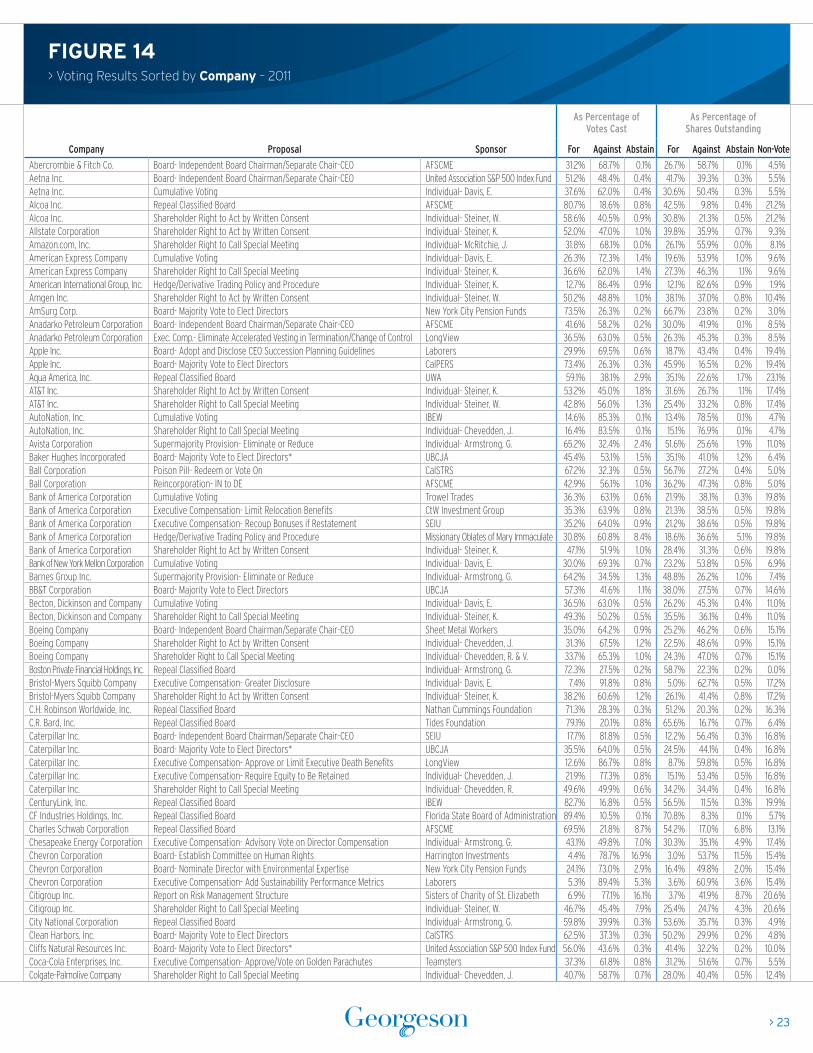
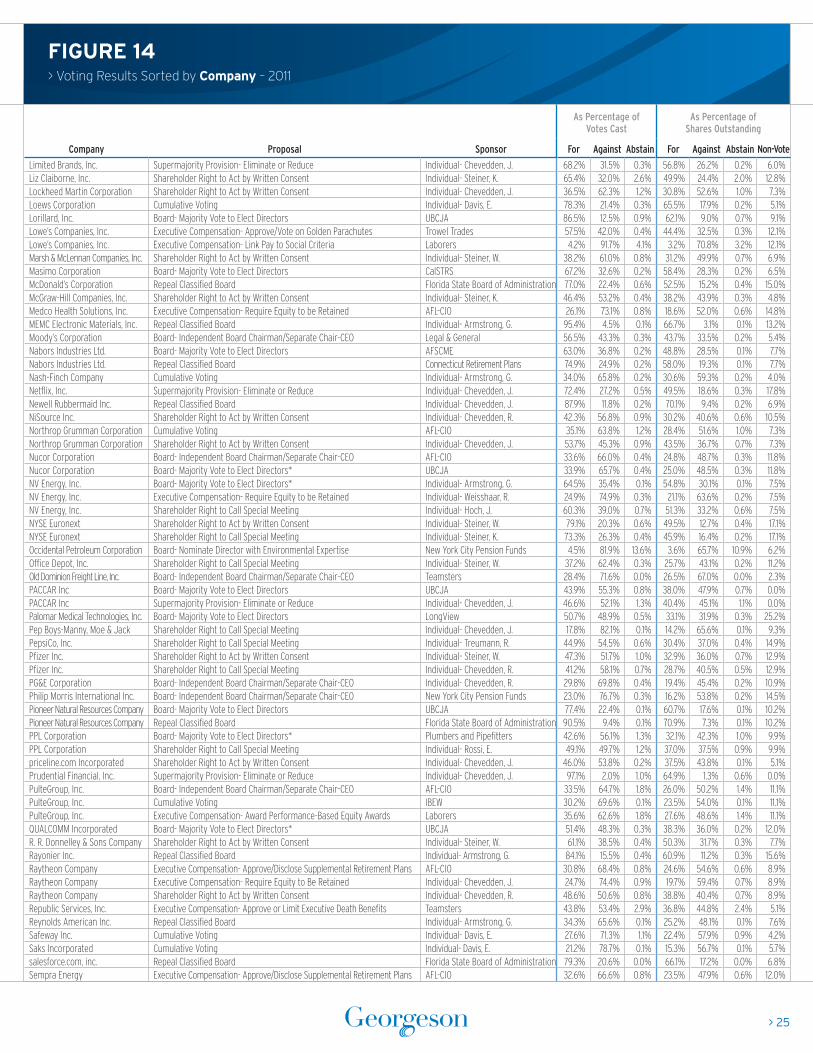
Figure 14 Voting Results Sorted by Company – 2011 (Table) 23
Figure 15 Voting Results Sorted by Proposal – 2011 (Table) 27
Figure 16 Voting Results Sorted by Sponsor – 2011 (Table) 31
PART 3 — SELECT SOCIAL RESOLUTIONS
Figure 17 Shareholder Proposals – Sustainability, Voting Results – 2011 (Table) 36
Figure 18 Shareholder Proposals – Political Contributions, Voting Results – 2011 (Table) 36
PART 4 — MANAGEMENT PROPOSAL – ADVISORY VOTE ON EXECUTIVE COMPENSATION
Figure 19 Voting Results for the S&P 500 Index – 2011 (Table) 38
PART 5 — MANAGEMENT PROPOSAL – REPEAL CLASSIFIED BOARD
Figure 20 Management Proposals – 2002 to 2011 (Chart) 46
Figure 21 Voting Results – 2011 (Table) 47
PART 6 — PROXY CONTESTS
Figure 22 Contested Solicitation Trend – 1981 to 2011 (Chart) 50
Figure 23 Contested Solicitations – 2011 (Table) 50

> 4
EXECUTIVE SUMMARY
The 2011 Proxy Season: Compensation and
Pay-for-Performance Dominate the Agenda
The past decade has been a whirlwind for corporate governance
in America. Since 2001, we have witnessed a myriad of scandals,
epic corporate failures and legislative and regulatory attempts
to prevent more of the same. Early on it was the failure of firms
such as Enron, WorldCom and Global Crossing. More recently, the
failure of financial stalwarts like Lehman Brothers, Bear Stearns
and AIG nearly pushed our markets to the brink of collapse.
These failures have ushered in a new era of shareholder activism
and corporate governance initiatives, including extensive
legislative reform efforts and new rules by the Securities and
Exchange Commission (SEC), the New York Stock Exchange
(NYSE) and the Financial Industry Regulatory Authority (FINRA).
While many of the proxy-related reforms have focused on
enhanced disclosure requirements (the SEC has approved
expansive new rules around director experience and
qualifications, board leadership structure, board risk oversight
responsibilities and Compensation Disclosure and Analysis
(CD&A) disclosure), new regulations have been put in place that
fundamentally shift what issues are considered by shareholder at
annual meetings in the United States.
The Arrival of Widespread Say-on-Pay Votes in U.S.
The most recent and, arguably, highest-profile change came
when President Obama signed into law the Dodd-Frank Wall
Street Reform and Consumer Protection Act (“Dodd-Frank”
or the “Act”). Although Dodd-Frank was enacted largely to
provide greater governmental oversight for the U.S. financial
services industry, the Act went beyond bank reform and
imposed substantial new requirements on publicly-traded
companies, particularly in the area of executive compensation.
More specifically, Dodd-Frank mandated that publicly traded
companies include an advisory (non-binding) resolution on
their ballots to approve executive compensation, known as
“say-on-pay.”
The new rule created a high level of angst for members of the
corporate community, many of whom feared that institutions
would be susceptible to “knee-jerk” reactions against high
executive compensation in the initial say-on-pay votes. However,
these fears turned out to be unfounded because, as the voting
results from the 2011 proxy season indicate, the vast majority of
companies emerged unscathed. Of the 1,200-plus companies
in our tracking range (Georgeson tracks companies in the S&P
1500 Composite Index that hold their annual meeting in the first
six months of the calendar year), only 25 (or 2 percent) received
less than a majority of votes cast in favor of their say-on-pay
resolution (and in the greater community, only 41 had “failed”
resolutions).1
Moreover, and likely much to the relief of companies, the
resolution appears to have had the positive impact of lowering
the level of withhold/against votes in director elections,
particularly against compensation committee members. In 2010,
Georgeson tracked 748 directors who received at least 15 percent
of votes cast withhold/against, including 317 directors who sat
on the compensation committee of their boards. This year, the
total number of directors who received greater than 15 percent
withhold/against votes fell to 549 (a decrease of 27 percent from
2010 and 47 percent over the past two years), and the number of
directors sitting on the compensation committee fell to only 271,
a decrease of 37 percent from 2010.
Strong voting results on say-on-pay and improved figures
relating to the election of directors are largely attributable to
two factors. First, many companies chose to enhance their
CD&A disclosure and provided shareholders with a clearer
understanding of their compensation philosophy, their current
compensation practices and the metrics that were used to make
their compensation decisions. Second, more companies engaged
in dialogue with their largest shareholders, either prior to or
at the outset of proxy season to gain a clearer understanding
of the factors their shareholders use to evaluate executive

> 5
compensation issues. Similarly, Georgeson found that companies
were more willing to engage with their largest holders in the
face of a negative recommendation from one of the major proxy
advisory firms on key proxy issues like say-on-pay, particularly
if the companies believed the advisory report was incomplete
or inaccurate. For example, one common topic for discussion
on say-on-pay vote recommendations related to the peer
groups used by the proxy advisory firms in their benchmarking
of relative pay, which often differed considerably from what
companies had used in their proxy disclosure. This proved to
be a useful point of engagement, because many of the larger
institutional investors disclosed that they did not rely heavily on
proxy advisory peer group analyses and that they would factor
the company’s viewpoint into their analyses. Others questioned
certain advisory firms’ narrow focus on total shareholder return
as the sole measure of company performance.
Georgeson’s findings of a sizable increase in shareholder
engagement are consistent with other reports within the
industry, including a study by the Investor Responsibility
S&P 1500 Withhold/Against Votes — 15% or Greater
2011: 549 directors at 254 companies
2010: 748 directors at 314 companies
2009: 1,027 directors at 378 companies
2008: 612 directors at 253 companies
2007: 543 directors at 250 companies
S&P 1500 Director Withhold/Against Votes
355 directors had withhold/against votes of 20% or greater
191 directors had withhold/against votes of 30% or greater
83 directors had withhold/against votes of 40% or greater
20 directors had withhold/against votes of 50% or greater
543
250
612
253
1,027
378
748
314
549
254
Dir
ecto
r W
ith
ho
ld/A
gai
nst
Vo
tes,
20
07
- 20
11N
um
ber
of
Wit
hh
old
/Ag
ain
st V
ote
s, 2
010
- 2
011
Director Withhold/Against Votes as % of Votes Cast
2010
2011
20% + 30% + 40% + 50% +
2007 2008 2009 2010 2011
355
565
317
132
41
191
83 20
0
100
200
300
400
500
600
700
800
900
1000
1100
0
100
200
300
400
500
600

> 6
EXECUTIVE SUMMARY
Research Center Institute on the state of engagement
between U.S. corporations and shareholders, which stated that
“engagement between issuers and investors is common and
increasing both in terms of frequency and subject areas.” 2
Georgeson believes that a strong dialogue between companies
and their shareholders is essential, and we encourage companies
to try and engage on a more frequent basis. In so doing,
Georgeson believes that issuers can minimize the possibility of
failed director elections, say-on-pay votes and other potential
surprises.
Say-When-on-Pay Votes Yield Consistent Results
As for the related issue of “say-when-on-pay” (or “say-on-
frequency”) to determine the frequency of the say-on-pay vote,
a majority of companies saw the early writing on the wall and
proposed annual votes on executive compensation (our research
shows that 66 percent of companies in the S&P 500 and 60
percent of companies in the S&P 1500 recommended that
shareholders adopt an annual approach). With most institutional
investors supporting annual votes on executive compensation
(there were a handful of larger institutions supporting
triennial votes), it came as no surprise that over 90 percent
of meetings for S&P 1500 and nearly 95 percent of meetings
for S&P 500 companies had the annual option receiving at
least a plurality of votes cast in favor. Moreover, Georgeson’s
research has shown that the minority of companies that had
their shareholders support an alternative option typically had
a special circumstance working in favor of that option. The
special circumstance varied by company but often included (i)
a large inside position; (ii) a dual-class voting structure with one
class (usually controlled) having supermajority voting rights;
(iii) a top-heavy institutional profile with one or more of the
larger holders supporting the triennial approach; or (iv) a large
retail component that either followed management or didn’t
vote at all.
It is worth noting that the say-on-frequency resolution is
required to be submitted to shareholders only once every six
years, although companies may choose to submit the resolution
more often. Some clients have asked us if support for a longer
period between votes could increase in the future, particularly as
investors become more comfortable with assessing a particular
company’s compensation practices. While there may be some
merit to that argument, we believe shareholders will continue to
opt for annual say-on-pay votes.
Governance-Related Shareholder Proposals Take a Back Seat
The number of governance-related shareholder proposals has
steadily declined over the past few years and continued to do
the same this year. In fact, the number of governance-related
proposals either submitted or voted on fell to the lowest levels
since the pre-Enron era. The number of shareholder proposals
submitted to companies fell to 417 resolutions, a decline of
over 21 percent from 2010. The number of resolutions that
came to a shareholder vote fell to just 240, a decline of nearly
30 percent from 2010. The substantial decline in resolutions
submitted and voted on did not come as a surprise because
Dodd-Frank addressed many of the activists’ compensation-
related concerns. These included: (i) requests for mandatory
say-on-pay requirements (53 resolutions voted on in 2010),
(ii) advisory votes on golden parachutes (a popular resolution
over the past decade and three resolutions voted on in 2010),
and (iii) mandatory clawback provisions (three resolutions
voted on in 2010).
While Dodd-Frank was certainly a contributing factor to the
overall decline in shareholder resolutions, it is not the only
factor. As the level of engagement between companies and
shareholders has increased considerably over the past few
years, companies have shown an increased willingness to make
changes to their governance practices. In addition, according to
recent statistics, the number of companies with anti-takeover

> 7
votes cast in favor. These results stand in stark contrast to those
outcomes for companies that had implemented a plurality
plus voting standard, where the average level of shareholder
support has largely remained the same over the past five years.
In fact, over the past five years the average level of support has
dropped one percentage point, from 45 percent in 2007 to 44
percent this year.
Investor Support for Special Meetings and Written
Consent Declines
Proposals seeking to provide shareholders with the right to
call special meetings or act by written consent continued to be
popular among activists again this year with 61 resolutions (29
special meeting resolutions and 32 written consent resolutions)
going to a shareholder vote. However, shareholder support
for these items declined for the first time since they were
introduced. For special meetings, the 29 resolutions that were
submitted to a vote of shareholders averaged 40 percent
of votes cast in favor, a decline of two percent from 2010.
Support for written consent resolutions fell six percent, from an
average of 54 percent of votes cast in favor in 2010 to just 48
percent in 2011.
Both of these types of resolutions are recent additions to the
annual meeting landscape (special meeting proposals started to
appear as a Rule 14a-8 resolution in 2007 and written consent in
2010), and voting results for newer resolutions often experience
periods of fluctuation before investors fully develop their
policies. However, corporations being proactive in responding
to shareholder concerns actually accounts for the variance.
According to Georgeson’s research, 21 of the 29 companies
that were subject to the special meeting resolution already
provided shareholders with the right to call a special meeting.
Nearly a majority of targeted companies had an established
threshold of 25 percent to call a special meeting (13 of the 29),
but a few had even lower standards, including four that had a
provisions, a common subject for shareholder resolutions,
has continued to fall: the percentage of S&P 500 companies
with classified boards dropped to 25 percent,3 and poison pills
fell to 11 percent.4 At the same time, the percentage of S&P
500 companies that have formally adopted majority voting in
uncontested director elections has risen to 77 percent 5 (up from
66 percent in 2007).6 The percentage of companies providing
shareholders with the right to call a special meeting is up to 51 7
(up from 34 percent in 2006).8 The percentage of companies
that allow shareholders to act by written consent is up to 28 9 (up
from 15 percent in 2008).10
Among the resolutions that appeared on proxy ballots,
board-related resolutions were the most popular this season,
accounting for over 25 percent of the governance proposals
voted on. Majority voting resolutions, considered by activists
to be the “missing link” in Dodd-Frank, accounted for exactly
half of the board-related resolutions, with 31 proposals going
to shareholder vote. Overall support for majority voting
shareholder proposals marginally increased from 2010,
averaging approximately 57 percent of votes cast in favor, up
1 percent from 2010. One point worth noting is the growing
disparity in the results of majority vote proposals between
those companies that have chosen to retain a “pure plurality”
voting standard and those that have adopted what is called a
“plurality plus” standard (whereby the company formally retains
a plurality voting standard but implements a board policy stating
that any director who receives more votes withheld than in
favor would be required to submit his or her resignation to the
board, subject to the board’s final decision as to whether to
accept the resignation). In 2007, support for majority voting
shareholder proposals at companies that had a pure plurality
voting standard averaged 57 percent of votes cast, with four
of the eight resolutions receiving greater than a majority of
votes cast. In 2011, that grew to 69 percent of votes cast with
14 of the 15 resolutions receiving greater than a majority of

> 8
EXECUTIVE SUMMARY
20 percent threshold and two for a 15 percent threshold. Similar
numbers appeared with written consent resolutions, with 26 of
the 32 companies targeted having special meeting provisions
in place, including 12 with a 25 percent threshold, six with a 20
percent threshold, three with a 15 percent threshold and four
with a 10 percent threshold. There was also one company who
provided shareholders with the right to call a special meeting at
a threshold higher than 25 percent.
Another contributing factor was ISS, one of the leading proxy
advisory firms, and its new policy on shareholder proposals
regarding shareholders’ right to act by written consent. In 2010,
ISS recommended in favor of written consent resolutions without
looking into other pro-shareholder governance practices that
a company may have implemented to address the underlying
concern of the potential for entrenched management and
shareholders’ ability to act outside of the annual meeting
process. However, after some companies and shareholders
expressed concerns about the negative consequences of
adopting written consent (particularly the potential for
disenfranchising minority stockholders), ISS adopted a case-by-
case approach that takes a handful of other factors into account.
The new policy allows ISS to recommend against a resolution
if companies have: (i) a formal majority voting standard in
uncontested director elections, (ii) an absence of a poison pill or
shareholder-approved poison pill, (iii) an annually-elected board,
and (iv) an “unfettered” right to call a special meeting with no
greater than a 10 percent threshold.
While a similar policy was not enacted for special meeting
resolutions, it is worth noting that ISS took a more lenient stance
in at least one case where the company had made a number of
pro-shareholder changes to its governance profile and already
had a 15 percent threshold to call a special meeting. Glass Lewis,
another prominent proxy advisory firm, has a similar — albeit
slightly more pro-shareholder — stance when evaluating these
shareholder proposals. It takes into account the following factors
(among others): (i) company size, (ii) company performance, (iii)
shareholder structure, (iv) the existence of other anti-takeover
provisions, (v) the opportunity for shareholder action outside
of the annual meeting cycle, and (vi) board responsiveness to
previous shareholder proposals.
With shareholder sentiment on these issues clearly in a state
of flux, companies are urged to remain vigilant of the trends.
The special meeting proposals being submitted ask companies
to adopt the measure with a 10 percent meeting threshold. Yet,
the results we have seen show that a majority of investors, while
generally supportive of the right, will not automatically vote for
the resolution if the company has already addressed the issue.
Shareholders have even been receptive to the inclusion of other
provisions, such as minimum holding periods, in the rule. Thus,
companies are encouraged to assess their own shareholder base,
engage with holders and respond to concerns as necessary.
Some Social Resolutions Pushing the Governance Agenda
Although Georgeson focuses its Review on governance
resolutions, we occasionally focus on “hot button” issues outside
the governance realm to the extent that these issues put
pressure on boards to respond quickly to a growing activist issue.
One of these issues relates to political contributions disclosure.
Shareholder activists have focused on political contributions
as a governance issue by questioning the appropriate use of
corporate assets. Proponents of these resolutions, which include
major labor unions and pension funds, believe that companies
should provide greater transparency and accountability in
their spending on and policies concerning political activities.
While some companies have implemented policies to disclose
contributions made directly to individual candidates, proponents
say these policies are incomplete. They argue that policies should
be expanded to include “direct and indirect political contributions
to candidates, political parties, political organizations or ballot

> 9
referendums; independent expenditures; or electioneering
communications on behalf of a federal, state or local candidate.” 11
The notion of providing detailed reports on political expenditures
has received increased attention, principally as a result of the
Supreme Court’s decision in Citizens United vs. Federal Election
Commission (2010), which lifted restrictions on political spending
by corporations and now allows corporations more latitude to
donate indirectly in support of or against certain candidates.
As a result, average support for the 40 resolutions we tracked
that ask for companies to “Report on Policies and Procedures
Contributions” (there are several different types of political
contribution resolutions) was just over 26 percent of votes cast
(relatively high for a social-based resolution), including a few that
received greater than 40 percent of votes.
With the next U.S. Presidential election less than one year
away, Georgeson believes that the issue of corporate political
contributions will continue to grow. There are groups, including
the Center for Political Accountability, that rate companies
according to their policies and reporting transparency, and
have gone so far as to draft model shareholder resolutions
for shareholder activists to use. Furthermore, Georgeson
expects the next round of popular resolutions to be similar
to those that were submitted by the American Federation of
State, County & Municipal Employees (AFSCME). The AFSCME
resolutions go beyond contributions to political candidates
and address contributions made to trade associations and
grassroots organizations that indirectly influence political
outcomes. Although activists’ efforts will likely focus on large cap
companies, Georgeson encourages all companies to assess their
vulnerability to these proposals, based on their current policies
and levels of disclosure, particularly in comparison to their
industry peer companies.
The Road Ahead
Undoubtedly, the growing pains of having to deal with say-on-
pay in the 2011 proxy season were challenging for companies
and investors alike. While some institutional investors went to
great lengths to develop detailed policies on say-on-pay, many
others had not fully developed specific guidelines on how to
assess overall compensation and translate it into a vote. Even
among those that have created detailed guidelines, we found
that the particular areas of focus differed (some institutional
investors expressed a greater interest in disclosure and looked
to understand a company’s compensation philosophy while
others reviewed a company’s performance and overall levels of
compensation). Also, some of the post-season feedback from
institutional investors indicates that their governance policies
are not yet fully settled and could result in more say-on-pay
against votes in 2012. With a high level of uncertainty for the
upcoming season, it is important for companies to engage their
largest investors early, to understand their investors’ approach
to evaluating compensation and to make changes as they deem
appropriate.
From a shareholder proposal standpoint, Georgeson expects
the number of proposals submitted to increase in 2012 for
several reasons. To begin with, as a result of the U.S. Court of
Appeals for the District of Columbia decision in July to vacate
the SEC’s “proxy access” rule (Rule 14a-11 of the Exchange Act of
1934), which would have required public companies to include
shareholder nominees for director in company proxy materials,
we expect activists to focus on “private ordering” (seeking proxy
access on a company-by-company basis, through the submission
of Rule 14a-8 resolutions). It is not yet clear how prevalent such
resolutions will be or which companies will be targeted. We
believe activists will focus on the weakest performers that lack
many of the “best practices” in corporate governance advocated
by the activists. We expect that the coming resolutions will focus
on the key elements of the vacated SEC rule which included
minimum percentage of and time periods for ownership.

> 10
In addition, Georgeson expects to see an increase in proposals
submitted by unions and pension funds, which now have a new
partner in the American Corporate Governance Institute (ACGI).
The ACGI, which describes itself as a “research and advisory
organization that seeks to contribute to improving corporate
governance and accountability in publicly traded companies,”
is headed by Lucian Bebchuk, a noted Harvard Law School
Professor and long time advocate of shareholder rights. This
past season, the ACGI worked with the Florida State Board of
Administration (FSBA) and the Nathan Cummings Foundation
to help identify potential targets for shareholder activism and
assisted in the drafting of shareholder proposal and handling
the no-action process at the SEC. With the ACGI’s help, the FSBA
and the Nathan Cummings Foundation submitted 14 shareholder
resolutions on declassifying boards, with 10 appearing on
corporate ballots and four either withdrawn or omitted.12
We expect that the ACGI will increase its efforts in the coming
year, in both the number of investor groups with which it works
and potentially the types of resolutions submitted.
The 2012 proxy season will be no less challenging than the last.
As always, the keys to coping with increasing demands are
knowing your shareholder base, engaging with its members
and maintaining the flexibility to change.
EXECUTIVE SUMMARY
1 ISS Corporate Services
2 Marc Goldstein, The State of Engagement Between U.S. Corporation and Shareholders, Investor Responsibility Research Center Institute (February 22, 2011).
3 FactSet SharkRepellent
4 Ibid.
5 Ibid.
6 Neal, Gerber & Eisenberg LLP (C. Allen), Study of Majority Voting in Director Elections, (November 2007).
7 FactSet SharkRepellent
8 ISS Corporate Services
9 FactSet SharkRepellent
10 ISS Corporate Services
11 Caterpillar Inc. 2011 proxy statement. www.sec.gov/Archives/edgar/data/18230/ 000001823011000247/def-14a_2011.htm.
12 Rosemary Lally, FSBA, Nathan Cummings Target Large Cap Holdouts with Classified Boards, Council of Institutional Investors: Council Governance Alert (April 21, 2011).

> 11
METHODOLOGY
Management and Shareholder Proposals
Georgeson independently surveyed companies that (1) are U.S. members of the S&P 1500 Supercomposite Index as of January 2011, and (2) that held annual meetings within the first six months of the calendar year. We obtained the number of votes that were cast for, against, or withheld, and abstentions, as well as the number of broker non-votes from publicly available sources.
We then calculated for each proposal: > The votes cast for and against as a percentage of shares voted in the quorum, and > The votes cast for and against as a percentage of the company’s total voting power.
Finally, we illustrated the trends in proposal sponsorship and graphed the voting results for major governance issues.
Contested Solicitations
Proxy contest information reflects Georgeson’s best effort to track the contested elections that have taken place during the 2011 calendar year. Our search criteria is not limited to any specific benchmark index (e.g., S&P 1500 companies) or part of the calendar year (e.g., first six months). Georgeson acted as a consultant in many of these contests.
For further information on how Georgeson defines “contested solicitation”, please refer to the footnote in Figure 23.
Other Notes
Georgeson’s data collection and calculation methodology ensure the accuracy and comparability of our statistics from company to company and from year to year. We thereby avoid the anomalies that result from companies’ and sponsors’ inconsistent treatment of abstentions and broker non-votes. Information on shareholder proposals withdrawn or omitted was gathered with the assistance of ISS Governance Analytics. Georgeson has collected and published statistics on corporate governance proposals since 1987, the year institutional investors first sponsored shareholder proposals. If you have any questions, please call us at (212) 440-9800 or e-mail us at [email protected].

This page intentionally left blank.

PART 1> Corporate Governance-Related Shareholder Proposals and Sponsors

> 14
FIGURE 2> Corporate Governance Proposals Voted On – 2007 to 2011
FIGURE 1> Corporate Governance Proposals Submitted – 2007 to 2011
Nu
mb
er o
f P
rop
osa
ls
2010 20112007 2008 2009 2010 20112007 2008 20090
100
200
300
400
500
600
700
Nu
mb
er o
f P
rop
osa
ls
0
100
200
300
400
587
531
417
665
652
371
342
240
375
339
Nu
mb
er o
f P
rop
osa
ls
2010 20112007 2008 2009 2010 20112007 2008 20090
100
200
300
400
500
600
700
Nu
mb
er o
f P
rop
osa
ls
0
100
200
300
400
587
531
417
665
652
371
342
240
375
339
Proposal Type 2007 % 2008 % 2009 % 2010 % 2011 %
Board-Related 99 26.4% 85 25.1% 80 21.6% 80 23.4% 62 25.8%
Executive Compensation 161 42.9% 132 38.9% 129 34.8% 116 33.9% 40 16.7%
Repeal Classified Board 26 6.9% 52 15.3% 43 11.6% 22 6.4% 33 13.8%
Special Meetings 17 4.5% 23 6.8% 51 13.7% 43 12.6% 29 12.1%
Cumulative Voting 22 5.9% 19 5.6% 28 7.5% 16 4.7% 22 9.2%
Supermajority Provision 19 5.1% 11 3.2% 14 3.8% 29 8.5% 13 5.4%
Reincorporation 3 0.8% 0 0.0% 15 4.0% 5 1.5% 2 0.8%
Poison Pills 17 4.5% 3 0.9% 2 0.5% 1 0.3% 1 0.4%
Other 11 2.9% 14 4.1% 9 2.4% 30 8.7% 38 15.8%
Total 375 100.0% 339 100.0% 371 100.0% 342 100.0% 240 100.0%
FIGURE 3> Corporate Governance Proposals Voted On – 2007 to 2011

> 15
FIGURE 4> Sponsorship of Governance Proposals – 2010 and 2011
2010 2011
Labor Unions 104 75
Amalg. Bank of New York’s Labor Oriented LongView Collective Inv. Fund (LongView) 6 8
American Federation of Labor and Congress of Industrial Organizations (AFL-CIO) 16 12
American Federation of State, County and Municipal Employees (AFSCME) 20 8
Communications Workers of America (CWA) 1 0
International Brotherhood of Electrical Workers (IBEW) 7 5
International Brotherhood of Teamsters (Teamsters) 2 4
Laborers’ International Union (Laborers) 18 9
Plumbers and Pipefitters 1 1
Service Employees International Union (SEIU) 5 4
Sheet Metal Workers 2 2
Trowel Trades S&P Index Fund 5 6
Unite Here 1 1
United Brotherhood of Carpenters and Joiners of America (UBCJA) 16 14
United Food and Commercial Workers 1 0
Utility Workers of America (UWA) 3 1
Public Pensions 30 22
California Public Employees’ Retirement System (CalPERS) 4 3
California State Teachers’ Retirement System (CalSTRS) 2 4
Connecticut Retirement Plans 3 1
Firefighters’ Pension System of the City of Kansas City 3 0
Florida State Board of Administration 1 6
Miami Firefighters’ Relief and Pension Fund 2 0
New York City Pension Funds 13 7
New York State Pension Funds 0 1
Philadelphia Public Employees Retirement System (PhiPERS) 2 0
Religious Organizations 14 6
Benedictine Sisters 1 0
Christian Brothers Investment Services (CBIS) 1 0
Maryknoll 2 0
Mercy Investment Program 1 0
Missionary Oblates of Mary Immaculate 0 1
Nathan Cummings Foundation 4 4
Sisters of Charity of St. Elizabeth 2 1
Sisters of the Holy Name of Jesus and Mary 1 0
Unitarian Universalist Association 2 0
Other Shareholder Groups 20 16
Association of Belltel Retirees 2 1
Boston Common Asset Management 1 0
Calvert Investment Management, Inc. 0 1
Christopher Reynolds Foundation 0 1
Clean Yield Asset Management 1 0
CtW Investment Group 0 1
Harrington Investments, Inc. 2 3
Legal and General 1 1
National Center for Public Policy Research 0 1
Needmor Fund 2 0
Norges Bank 1 0
Pax World Management Corp 1 0
Ram Trust 1 2
SNET Retirees Association 1 0
Stichting Pensioenfonds ABP 1 0
Tides Foundation 0 3
United Association S&P 500 Index Fund 3 2
Walden Asset Management 3 0
Individual Shareholders 162 120
Not Disclosed 12 1
Total 342 240

> 16
FIGURE 5> Corporate Governance Shareholder Proposals – 2010 and 2011
2010
2011
Other (38) 15.8%
Board-Related (62) 25.8%
Executive Compensation (40) 16.7%
Board-Related (80) 23.4%
Executive Compensation (116) 33.9%
Poison Pills (1) 0.4%
Cumulative Voting (22) 9.2%
Repeal Classified Board (33) 13.8%
Supermajority Provision (13) 5.4%
Special Meetings (29) 12.1%
Other (30) 8.7%
Poison Pills (1) 0.3%
Cumulative Voting (16) 4.7%
Repeal Classified Board (22) 6.4%
Reincorporation (5) 1.5%
Reincorporation (2) 0.8%
Supermajority Provision (29) 8.5%
Special Meetings (43) 12.6%

> 17
FIGURE 6> Corporate Governance Proposals Withdrawn or Omitted vs. Proposals Voted On – 2010 and 2011
2010
2011
Omitted or Withdrawn 35.6%
Proposals Voted On 64.4%
Omitted or Withdrawn 42.4%
Proposals Voted On 57.6%
Omitted or Withdrawn 35.6%
Proposals Voted On 64.4%
Omitted or Withdrawn 42.4%
Proposals Voted On 57.6%

> 18
FIGURE 7> Sponsors of Corporate Governance Proposals – 2010 and 2011
Public Pensions 9.2%
Religious Organizations 2.5%
Labor Unions 31.2%
Individual Shareholders 50.0%
Other Shareholder Groups 6.7%
Not Disclosed 0.4%
Public Pensions 8.8%
Religious Organizations 4.1%
Labor Unions 30.4%
Individual Shareholders 47.4%
Other Shareholder Groups 5.8%
Not Disclosed 3.5%
Public Pensions 9.2%
Religious Organizations 2.5%
Labor Unions 31.2%
Individual Shareholders 50.0%
Other Shareholder Groups 6.7%
Not Disclosed 0.4%
Public Pensions 8.8%
Religious Organizations 4.1%
Labor Unions 30.4%
Individual Shareholders 47.4%
Other Shareholder Groups 5.8%
Not Disclosed 3.5%
2010
2011

PART 2> Proposal Voting Results

> 20
FIGURE 8> Corporate Governance Proposals — Summary Average Voting Results for Selected Proposals, 2011 Annual Meeting Season
Proposal TypeResults
Available
As Percentage of Votes Cast As Percentage of Shares Outstanding
For Against Abstain For Against Abstain Non-Vote
Board-Related 62 of 62 43% 56% 1% 33% 42% 1% 10%
> Majority Vote to Elect Directors* 30 of 31 57% 42% 1% 44% 32% 0% 10%
>> Have>Implemented>a>Form>of>Majority>Voting* 15 of 16 44% 55% 1% 33% 41% 1% 11%
>> Have>Not>Implemented>a>Form>of>Majority>Voting 15 of 15 69% 30% 1% 55% 23% 0% 10%
> Independent Board Chairman/Separate Chair-CEO 22 of 22 32% 67% 1% 25% 50% 0% 11%
> Nominate Director with Environmental Expertise 3 of 3 20% 74% 6% 13% 54% 5% 11%
Executive Compensation 40 of 40 26% 72% 2% 19% 52% 2% 12%
> Require Equity to Be Retained 7 of 7 24% 75% 1% 18% 57% 1% 11%
> Award Performance-Based Equity Awards 4 of 4 35% 64% 1% 23% 42% 1% 17%
> Link Pay to Social Criteria 3 of 3 5% 89% 6% 4% 71% 5% 9%
> Advisory Vote on Director Compensation 3 of 3 18% 76% 6% 13% 55% 4% 13%
> Approve/Disclose Supplemental Retirement Plans 3 of 3 30% 69% 1% 22% 50% 1% 12%
> Approve/Limit Executive Death Benefits 3 of 3 28% 71% 1% 22% 53% 1% 9%
> Approve/Vote on Future Golden Parachutes 3 of 3 49% 50% 1% 39% 40% 1% 8%
> Eliminate Accelerated Vesting in Termination/ Change-of-Control
3 of 3 41% 58% 1% 31% 43% 1% 9%
Repeal Classified Board 33 of 33 77% 22% 1% 59% 17% 1% 11%
Shareholder Right to Act by Written Consent 32 of 32 48% 51% 1% 36% 39% 1% 10%
Shareholder Right to Call Special Meeting 29 of 29 40% 59% 1% 29% 43% 1% 12%
Cumulative Voting 22 of 22 33% 66% 1% 25% 50% 0% 11%
Eliminate or Reduce Supermajority Provision 13 of 13 62% 37% 1% 48% 30% 1% 7%
*Note: Because Wilshire Bancorp’s management recommended to vote for the shareholder proposal, their voting results were omitted.

> 21
FIGURE 9
Votes for Selected Proposals Relating to Board Issues – 2007 to 2011
Independent Board Chairman / Separate Chair-CEO
Majority Vote to Elect Directors
Eliminate Supermajority Provision
Repeal Classified Board
Shareholder Right to Act by Written Consent
Shareholder Right to Call Special Meeting
Votes for Proposals Relating to Antitakeover Provisions – 2007 to 2011
Votes for Selected Proposals Relating to Shareholder Rights – 2007 to 2011
FIGURE 10
FIGURE 11
35%
57%
27%
56%
32%
57%
25%
49%
28%
51%
20112007 2008 2009 20100%
10%
20%
30%
40%
50%
60%
48%
40%
2011
62%
77%
67%
68%
65%
67%
20112007 2008 2009 201070
%
68%
73%
69%
0%
55%
0%
47%
2007 2008 2009 2010
0%
49%
54%
43%
0%
10%
20%
30%
40%
50%
60%
70%
80%P
erce
nta
ge
of
Vo
tes
Cas
tP
erce
nta
ge
of
Vo
tes
Cas
tP
erce
nta
ge
of
Vo
tes
Cas
t
0%
10%
20%
30%
40%
50%
60%
35%
57%
27%
56%
32%
57%
25%
49%
28%
51%
20112007 2008 2009 20100%
10%
20%
30%
40%
50%
60%
48%
40%
2011
62%
77%
67%
68%
65%
67%
20112007 2008 2009 2010
70%
68%
73%
69%
0%
55%
0%
47%
2007 2008 2009 2010
0%
49%
54%
43%
0%
10%
20%
30%
40%
50%
60%
70%
80%
Per
cen
tag
e o
f V
ote
s C
ast
Per
cen
tag
e o
f V
ote
s C
ast
Per
cen
tag
e o
f V
ote
s C
ast
0%
10%
20%
30%
40%
50%
60%

> 22
FIGURE 12> Binding Bylaw Provisions – 2002 to 2011
4 5 8 9 13 12 17
2002 2003 2004 2005 2006 2007 2008
13 7
2009 2010
2
2011
Nu
mb
er o
f P
rop
osa
ls
18
16
14
12
10
0
2
4
6
8
Company Proposal SponsorState of Inc.
As Percentage of Votes Cast As Percentage of Shares Outstanding
For Against Abstain For Against Abstain Non-Vote
Chevron CorporationBoard- Establish Committee on Sustainability
Harrington Investments, Inc.
DE 4.4% 78.7% 16.9% 3.0% 53.7% 11.5% 15.4%
Google Inc.Board- Establish Committee on Sustainability
Harrington Investments, Inc.
DE 1.0% 95.0% 4.0% 0.9% 82.2% 3.4% 3.4%
FIGURE 13> Binding Bylaw Provisions – 2011
> 23
FIGURE 14> Voting Results Sorted by Company – 2011
As Percentage of Votes Cast
As Percentage of Shares Outstanding
Company Proposal Sponsor For Against Abstain For Against Abstain Non-Vote
Abercrombie & Fitch Co. Board- Independent Board Chairman/Separate Chair-CEO AFSCME 31.2% 68.7% 0.1% 26.7% 58.7% 0.1% 4.5%Aetna Inc. Board- Independent Board Chairman/Separate Chair-CEO United Association S&P 500 Index Fund 51.2% 48.4% 0.4% 41.7% 39.3% 0.3% 5.5%Aetna Inc. Cumulative Voting Individual- Davis, E. 37.6% 62.0% 0.4% 30.6% 50.4% 0.3% 5.5%Alcoa Inc. Repeal Classified Board AFSCME 80.7% 18.6% 0.8% 42.5% 9.8% 0.4% 21.2%Alcoa Inc. Shareholder Right to Act by Written Consent Individual- Steiner, W. 58.6% 40.5% 0.9% 30.8% 21.3% 0.5% 21.2%Allstate Corporation Shareholder Right to Act by Written Consent Individual- Steiner, K. 52.0% 47.0% 1.0% 39.8% 35.9% 0.7% 9.3%Amazon.com, Inc. Shareholder Right to Call Special Meeting Individual- McRitchie, J. 31.8% 68.1% 0.0% 26.1% 55.9% 0.0% 8.1%American Express Company Cumulative Voting Individual- Davis, E. 26.3% 72.3% 1.4% 19.6% 53.9% 1.0% 9.6%American Express Company Shareholder Right to Call Special Meeting Individual- Steiner, K. 36.6% 62.0% 1.4% 27.3% 46.3% 1.1% 9.6%American International Group, Inc. Hedge/Derivative Trading Policy and Procedure Individual- Steiner, K. 12.7% 86.4% 0.9% 12.1% 82.6% 0.9% 1.9%Amgen Inc. Shareholder Right to Act by Written Consent Individual- Steiner, W. 50.2% 48.8% 1.0% 38.1% 37.0% 0.8% 10.4%AmSurg Corp. Board- Majority Vote to Elect Directors New York City Pension Funds 73.5% 26.3% 0.2% 66.7% 23.8% 0.2% 3.0%Anadarko Petroleum Corporation Board- Independent Board Chairman/Separate Chair-CEO AFSCME 41.6% 58.2% 0.2% 30.0% 41.9% 0.1% 8.5%Anadarko Petroleum Corporation Exec. Comp.- Eliminate Accelerated Vesting in Termination/Change of Control LongView 36.5% 63.0% 0.5% 26.3% 45.3% 0.3% 8.5%Apple Inc. Board- Adopt and Disclose CEO Succession Planning Guidelines Laborers 29.9% 69.5% 0.6% 18.7% 43.4% 0.4% 19.4%Apple Inc. Board- Majority Vote to Elect Directors CalPERS 73.4% 26.3% 0.3% 45.9% 16.5% 0.2% 19.4%Aqua America, Inc. Repeal Classified Board UWA 59.1% 38.1% 2.9% 35.1% 22.6% 1.7% 23.1%AT&T Inc. Shareholder Right to Act by Written Consent Individual- Steiner, K. 53.2% 45.0% 1.8% 31.6% 26.7% 1.1% 17.4%AT&T Inc. Shareholder Right to Call Special Meeting Individual- Steiner, W. 42.8% 56.0% 1.3% 25.4% 33.2% 0.8% 17.4%AutoNation, Inc. Cumulative Voting IBEW 14.6% 85.3% 0.1% 13.4% 78.5% 0.1% 4.7%AutoNation, Inc. Shareholder Right to Call Special Meeting Individual- Chevedden, J. 16.4% 83.5% 0.1% 15.1% 76.9% 0.1% 4.7%Avista Corporation Supermajority Provision- Eliminate or Reduce Individual- Armstrong, G. 65.2% 32.4% 2.4% 51.6% 25.6% 1.9% 11.0%Baker Hughes Incorporated Board- Majority Vote to Elect Directors* UBCJA 45.4% 53.1% 1.5% 35.1% 41.0% 1.2% 6.4%Ball Corporation Poison Pill- Redeem or Vote On CalSTRS 67.2% 32.3% 0.5% 56.7% 27.2% 0.4% 5.0%Ball Corporation Reincorporation- IN to DE AFSCME 42.9% 56.1% 1.0% 36.2% 47.3% 0.8% 5.0%Bank of America Corporation Cumulative Voting Trowel Trades 36.3% 63.1% 0.6% 21.9% 38.1% 0.3% 19.8%Bank of America Corporation Executive Compensation- Limit Relocation Benefits CtW Investment Group 35.3% 63.9% 0.8% 21.3% 38.5% 0.5% 19.8%Bank of America Corporation Executive Compensation- Recoup Bonuses if Restatement SEIU 35.2% 64.0% 0.9% 21.2% 38.6% 0.5% 19.8%Bank of America Corporation Hedge/Derivative Trading Policy and Procedure Missionary Oblates of Mary Immaculate 30.8% 60.8% 8.4% 18.6% 36.6% 5.1% 19.8%Bank of America Corporation Shareholder Right to Act by Written Consent Individual- Steiner, K. 47.1% 51.9% 1.0% 28.4% 31.3% 0.6% 19.8%Bank of New York Mellon Corporation Cumulative Voting Individual- Davis, E. 30.0% 69.3% 0.7% 23.2% 53.8% 0.5% 6.9%Barnes Group Inc. Supermajority Provision- Eliminate or Reduce Individual- Armstrong, G. 64.2% 34.5% 1.3% 48.8% 26.2% 1.0% 7.4%BB&T Corporation Board- Majority Vote to Elect Directors UBCJA 57.3% 41.6% 1.1% 38.0% 27.5% 0.7% 14.6%Becton, Dickinson and Company Cumulative Voting Individual- Davis, E. 36.5% 63.0% 0.5% 26.2% 45.3% 0.4% 11.0%Becton, Dickinson and Company Shareholder Right to Call Special Meeting Individual- Steiner, K. 49.3% 50.2% 0.5% 35.5% 36.1% 0.4% 11.0%Boeing Company Board- Independent Board Chairman/Separate Chair-CEO Sheet Metal Workers 35.0% 64.2% 0.9% 25.2% 46.2% 0.6% 15.1%Boeing Company Shareholder Right to Act by Written Consent Individual- Chevedden, J. 31.3% 67.5% 1.2% 22.5% 48.6% 0.9% 15.1%Boeing Company Shareholder Right to Call Special Meeting Individual- Chevedden, R. & V. 33.7% 65.3% 1.0% 24.3% 47.0% 0.7% 15.1%Boston Private Financial Holdings, Inc. Repeal Classified Board Individual- Armstrong, G. 72.3% 27.5% 0.2% 58.7% 22.3% 0.2% 0.0%Bristol-Myers Squibb Company Executive Compensation- Greater Disclosure Individual- Davis, E. 7.4% 91.8% 0.8% 5.0% 62.7% 0.5% 17.2%Bristol-Myers Squibb Company Shareholder Right to Act by Written Consent Individual- Steiner, K. 38.2% 60.6% 1.2% 26.1% 41.4% 0.8% 17.2%C.H. Robinson Worldwide, Inc. Repeal Classified Board Nathan Cummings Foundation 71.3% 28.3% 0.3% 51.2% 20.3% 0.2% 16.3%C.R. Bard, Inc. Repeal Classified Board Tides Foundation 79.1% 20.1% 0.8% 65.6% 16.7% 0.7% 6.4%Caterpillar Inc. Board- Independent Board Chairman/Separate Chair-CEO SEIU 17.7% 81.8% 0.5% 12.2% 56.4% 0.3% 16.8%Caterpillar Inc. Board- Majority Vote to Elect Directors* UBCJA 35.5% 64.0% 0.5% 24.5% 44.1% 0.4% 16.8%Caterpillar Inc. Executive Compensation- Approve or Limit Executive Death Benefits LongView 12.6% 86.7% 0.8% 8.7% 59.8% 0.5% 16.8%Caterpillar Inc. Executive Compensation- Require Equity to Be Retained Individual- Chevedden, J. 21.9% 77.3% 0.8% 15.1% 53.4% 0.5% 16.8%Caterpillar Inc. Shareholder Right to Call Special Meeting Individual- Chevedden, R. 49.6% 49.9% 0.6% 34.2% 34.4% 0.4% 16.8%CenturyLink, Inc. Repeal Classified Board IBEW 82.7% 16.8% 0.5% 56.5% 11.5% 0.3% 19.9%CF Industries Holdings, Inc. Repeal Classified Board Florida State Board of Administration 89.4% 10.5% 0.1% 70.8% 8.3% 0.1% 5.7%Charles Schwab Corporation Repeal Classified Board AFSCME 69.5% 21.8% 8.7% 54.2% 17.0% 6.8% 13.1%Chesapeake Energy Corporation Executive Compensation- Advisory Vote on Director Compensation Individual- Armstrong, G. 43.1% 49.8% 7.0% 30.3% 35.1% 4.9% 17.4%Chevron Corporation Board- Establish Committee on Human Rights Harrington Investments 4.4% 78.7% 16.9% 3.0% 53.7% 11.5% 15.4%Chevron Corporation Board- Nominate Director with Environmental Expertise New York City Pension Funds 24.1% 73.0% 2.9% 16.4% 49.8% 2.0% 15.4%Chevron Corporation Executive Compensation- Add Sustainability Performance Metrics Laborers 5.3% 89.4% 5.3% 3.6% 60.9% 3.6% 15.4%Citigroup Inc. Report on Risk Management Structure Sisters of Charity of St. Elizabeth 6.9% 77.1% 16.1% 3.7% 41.9% 8.7% 20.6%Citigroup Inc. Shareholder Right to Call Special Meeting Individual- Steiner, W. 46.7% 45.4% 7.9% 25.4% 24.7% 4.3% 20.6%City National Corporation Repeal Classified Board Individual- Armstrong, G. 59.8% 39.9% 0.3% 53.6% 35.7% 0.3% 4.9%Clean Harbors, Inc. Board- Majority Vote to Elect Directors CalSTRS 62.5% 37.3% 0.3% 50.2% 29.9% 0.2% 4.8%Cliffs Natural Resources Inc. Board- Majority Vote to Elect Directors* United Association S&P 500 Index Fund 56.0% 43.6% 0.3% 41.4% 32.2% 0.2% 10.0%Coca-Cola Enterprises, Inc. Executive Compensation- Approve/Vote on Golden Parachutes Teamsters 37.3% 61.8% 0.8% 31.2% 51.6% 0.7% 5.5%Colgate-Palmolive Company Shareholder Right to Call Special Meeting Individual- Chevedden, J. 40.7% 58.7% 0.7% 28.0% 40.4% 0.5% 12.4%

> 24
FIGURE 14> Voting Results Sorted by Company – 2011
As Percentage of Votes Cast
As Percentage of Shares Outstanding
Company Proposal Sponsor For Against Abstain For Against Abstain Non-Vote
Comcast Corporation Board- Independent Board Chairman/Separate Chair-CEO AFL-CIO 19.8% 79.3% 0.9% 16.8% 67.2% 0.8% 4.8%Comcast Corporation Cumulative Voting Individual- Davis, E. 27.2% 72.6% 0.2% 23.1% 61.6% 0.1% 4.8%Consolidated Edison, Inc. Executive Compensation- Greater Disclosure Individual- Davis, E. 15.4% 82.4% 2.1% 8.2% 43.9% 1.1% 29.5%Corning Incorporated Shareholder Right to Call Special Meeting RAM Trust 47.5% 52.1% 0.4% 36.5% 40.0% 0.3% 11.2%CVS Caremark Corporation Shareholder Right to Act by Written Consent Individual- Steiner, W. 55.7% 42.3% 2.0% 43.9% 33.3% 1.6% 7.3%DaVita Inc. Shareholder Right to Act by Written Consent Individual- Steiner, K. 28.7% 71.1% 0.1% 24.4% 60.3% 0.1% 4.2%Dean Foods Company Executive Compensation- Establish Antitax Gross-up Policy LongView 42.3% 57.2% 0.6% 30.6% 41.4% 0.4% 13.7%Devon Energy Corporation Shareholder Right to Act by Written Consent Individual- Chevedden, J. 60.5% 39.2% 0.3% 47.6% 30.8% 0.2% 9.1%Dominion Resources, Inc. Board- Independent Board Chairman/Separate Chair-CEO Not Named 30.5% 68.5% 1.0% 20.2% 45.3% 0.7% 15.6%Dominion Resources, Inc. Executive Compensation- Approve/Disclose Supplemental Retirement Plans AFL-CIO 25.1% 73.7% 1.2% 16.6% 48.8% 0.8% 15.6%Dominion Resources, Inc. Shareholder Right to Act by Written Consent Individual- Chevedden, J. 45.8% 52.9% 1.3% 30.3% 35.0% 0.8% 15.6%Dow Chemical Company Shareholder Right to Act by Written Consent Individual- Steiner, K. 41.2% 56.9% 1.9% 32.3% 44.7% 1.5% 9.6%Duke Energy Corporation Board- Majority Vote to Elect Directors* UBCJA 37.0% 60.9% 2.1% 20.9% 34.4% 1.2% 27.8%E. I. du Pont de Nemours and Co. Shareholder Right to Call Special Meeting Individual- Steiner, W. 39.1% 60.3% 0.6% 25.9% 39.9% 0.4% 15.8%Eastman Chemical Company Supermajority Provision- Eliminate or Reduce Individual- Chevedden, R. 64.6% 35.1% 0.3% 51.1% 27.7% 0.3% 7.0%eBay Inc. Supermajority Provision- Eliminate or Reduce Individual- Chevedden, J. 63.8% 35.9% 0.2% 53.3% 30.0% 0.2% 6.1%Ecolab Inc. Supermajority Provision- Eliminate or Reduce Individual- Chevedden, J. 66.9% 32.6% 0.4% 53.4% 26.1% 0.3% 6.8%EOG Resources, Inc. Exec. Comp.- Eliminate Accelerated Vesting in Termination/Change of Control LongView 42.1% 57.1% 0.7% 36.3% 49.2% 0.6% 3.1%Equity Residential Cumulative Voting Trowel Trades 34.5% 65.4% 0.1% 30.3% 57.6% 0.1% 3.7%Equity Residential Executive Compensation- Link Pay to Social Criteria Laborers 3.6% 94.0% 2.3% 3.2% 82.7% 2.0% 3.7%Exxon Mobil Corporation Board- Independent Board Chairman/Separate Chair-CEO RAM Trust 31.0% 67.9% 1.2% 19.7% 43.1% 0.7% 17.9%FirstEnergy Corp. Board- Majority Vote to Elect Directors* Sheet Metal Workers 42.6% 56.3% 1.1% 32.7% 43.3% 0.8% 10.8%FirstEnergy Corp. Shareholder Right to Act by Written Consent Individual- Chevedden, R. 44.7% 53.8% 1.5% 34.4% 41.3% 1.2% 10.8%Ford Motor Company Eliminate Dual-Class Voting Rights Individual- Chevedden, R. & V. 31.4% 68.1% 0.5% 22.6% 49.1% 0.4% 18.9%Ford Motor Company Shareholder Right to Call Special Meeting Individual- Chevedden, J. 21.4% 78.2% 0.5% 15.4% 56.3% 0.3% 18.9%Franklin Street Properties Corp. Repeal Classified Board Individual- Armstrong, G. 72.5% 27.0% 0.4% 50.3% 18.8% 0.3% 17.8%Freeport-McMoRan Copper & Gold Inc. Board- Nominate Director with Environmental Expertise New York State Pension Funds 30.0% 67.3% 2.7% 20.3% 45.7% 1.8% 10.8%Frontier Communications Corp. Board- Independent Board Chairman/Separate Chair-CEO AFL-CIO 21.4% 77.1% 1.6% 10.6% 38.1% 0.8% 30.0%General Dynamics Corporation Shareholder Right to Call Special Meeting Individual- Chevedden, J. 38.6% 61.0% 0.4% 32.6% 51.4% 0.3% 6.7%General Electric Company Cumulative Voting Individual- Davis, E. 26.6% 72.4% 1.1% 15.4% 41.9% 0.6% 19.9%General Electric Company Executive Compensation- Award Performance-Based Equity Awards Trowel Trades 29.2% 69.7% 1.1% 16.9% 40.3% 0.6% 19.9%General Electric Company Executive Compensation- Withdraw Awards Individual- Hepburn, J. 7.3% 91.7% 1.0% 4.2% 53.0% 0.6% 19.9%Gentex Corporation Board- Majority Vote to Elect Directors Tides Foundation 80.4% 17.0% 2.6% 63.1% 13.3% 2.1% 12.8%Gentex Corporation Repeal Classified Board Christopher Reynolds Foundation 85.5% 14.3% 0.2% 70.4% 11.8% 0.1% 8.9%Goldman Sachs Group, Inc. Cumulative Voting Individual- Davis, E. 25.6% 74.2% 0.2% 18.2% 52.8% 0.1% 10.2%Goldman Sachs Group, Inc. Executive Compensation- Require Equity to Be Retained Harrington Investments 20.6% 79.0% 0.4% 14.7% 56.1% 0.3% 10.2%Goldman Sachs Group, Inc. Executive Compensation- Review Nathan Cummings Foundation 4.1% 92.2% 3.7% 2.9% 65.6% 2.6% 10.2%Goldman Sachs Group, Inc. Shareholder Right to Call Special Meeting Individual- McRitchie, J. 41.9% 57.9% 0.2% 29.8% 41.2% 0.1% 10.2%Google Inc. Board- Establish Committee on Sustainability Harrington Investments 1.0% 95.0% 3.9% 0.9% 82.2% 3.4% 3.4%Google Inc. Board- Report on Conflict of Interest Policy National Center for Public Policy Research 0.4% 96.0% 3.5% 0.4% 83.0% 3.1% 3.4%Google Inc. Supermajority Provision- Eliminate or Reduce Individual- Chevedden, J. 9.8% 90.2% 0.0% 8.4% 78.0% 0.0% 3.4%Graco Inc. Board- Majority Vote to Elect Directors CalPERS 70.6% 29.1% 0.3% 56.3% 23.2% 0.2% 10.0%Hansen Natural Corporation Board- Majority Vote to Elect Directors* Calvert Asset Management 48.1% 51.9% 0.1% 38.3% 41.3% 0.1% 6.0%Harley-Davidson, Inc. Executive Compensation- Approve or Limit Executive Death Benefits LongView 26.3% 72.7% 1.0% 19.7% 54.5% 0.7% 5.2%Helmerich & Payne, Inc. Repeal Classified Board Individual- Armstrong, G. 74.2% 25.5% 0.3% 58.9% 20.2% 0.2% 6.2%Home Depot, Inc. Cumulative Voting Individual- Davis, E. 41.4% 58.2% 0.4% 29.0% 40.8% 0.3% 15.0%Home Depot, Inc. Shareholder Right to Call Special Meeting Individual- Steiner, W. 52.6% 47.0% 0.4% 36.9% 33.0% 0.3% 15.0%Honeywell International Inc. Shareholder Right to Act by Written Consent Individual- Chevedden, J. 43.2% 56.0% 0.8% 34.1% 44.1% 0.6% 9.9%Honeywell International Inc. Shareholder Right to Call Special Meeting Individual- Kreutzer, J. 38.9% 59.9% 1.2% 30.7% 47.2% 0.9% 9.9%Hospitality Properties Trust Repeal Classified Board CalPERS 88.6% 10.9% 0.4% 68.6% 8.5% 0.3% 14.8%Hudson City Bancorp, Inc. Repeal Classified Board Nathan Cummings Foundation 75.9% 22.3% 1.8% 49.8% 14.6% 1.2% 15.0%IDACORP, Inc. Repeal Classified Board Individual- Armstrong, G. 84.4% 14.9% 0.7% 60.2% 10.6% 0.5% 14.6%International Business Machines Corp. Cumulative Voting Individual- Davis, E. 27.6% 71.3% 1.0% 17.8% 45.9% 0.7% 14.5%International Paper Company Shareholder Right to Act by Written Consent Individual- Steiner, W. 52.5% 46.7% 0.8% 38.3% 34.1% 0.6% 9.4%Interpublic Group of Companies, Inc. Shareholder Right to Call Special Meeting Individual- Steiner, K. 37.0% 62.7% 0.4% 30.0% 50.8% 0.3% 4.0%JPMorgan Chase & Co. Board- Independent Board Chairman/Separate Chair-CEO Individual- Chevedden, J. 11.9% 86.7% 1.4% 8.9% 64.8% 1.1% 9.0%JPMorgan Chase & Co. Shareholder Right to Act by Written Consent Individual- Chevedden, J. 49.0% 50.1% 0.9% 36.6% 37.5% 0.6% 9.0%Juniper Networks, Inc. Repeal Classified Board New York City Pension Funds 97.2% 2.4% 0.4% 78.0% 1.9% 0.3% 9.0%Kellogg Company Board- Majority Vote to Elect Directors* UBCJA 27.7% 72.0% 0.4% 21.8% 56.8% 0.3% 8.4%Kellogg Company Supermajority Provision- Eliminate or Reduce Individual- Chevedden, J. 43.2% 56.4% 0.3% 34.1% 44.6% 0.3% 8.4%Kohl’s Corporation Board- Adopt and Disclose CEO Succession Planning Guidelines Trowel Trades 23.8% 76.0% 0.1% 19.7% 62.7% 0.1% 4.8%Kohl’s Corporation Shareholder Right to Act by Written Consent Individual- Chevedden, J. 22.9% 76.9% 0.2% 18.9% 63.4% 0.2% 4.8%
> 25
FIGURE 14> Voting Results Sorted by Company – 2011
As Percentage of Votes Cast
As Percentage of Shares Outstanding
Company Proposal Sponsor For Against Abstain For Against Abstain Non-Vote
Limited Brands, Inc. Supermajority Provision- Eliminate or Reduce Individual- Chevedden, J. 68.2% 31.5% 0.3% 56.8% 26.2% 0.2% 6.0%Liz Claiborne, Inc. Shareholder Right to Act by Written Consent Individual- Steiner, K. 65.4% 32.0% 2.6% 49.9% 24.4% 2.0% 12.8%Lockheed Martin Corporation Shareholder Right to Act by Written Consent Individual- Chevedden, J. 36.5% 62.3% 1.2% 30.8% 52.6% 1.0% 7.3%Loews Corporation Cumulative Voting Individual- Davis, E. 78.3% 21.4% 0.3% 65.5% 17.9% 0.2% 5.1%Lorillard, Inc. Board- Majority Vote to Elect Directors UBCJA 86.5% 12.5% 0.9% 62.1% 9.0% 0.7% 9.1%Lowe’s Companies, Inc. Executive Compensation- Approve/Vote on Golden Parachutes Trowel Trades 57.5% 42.0% 0.4% 44.4% 32.5% 0.3% 12.1%Lowe’s Companies, Inc. Executive Compensation- Link Pay to Social Criteria Laborers 4.2% 91.7% 4.1% 3.2% 70.8% 3.2% 12.1%Marsh & McLennan Companies, Inc. Shareholder Right to Act by Written Consent Individual- Steiner, W. 38.2% 61.0% 0.8% 31.2% 49.9% 0.7% 6.9%Masimo Corporation Board- Majority Vote to Elect Directors CalSTRS 67.2% 32.6% 0.2% 58.4% 28.3% 0.2% 6.5%McDonald’s Corporation Repeal Classified Board Florida State Board of Administration 77.0% 22.4% 0.6% 52.5% 15.2% 0.4% 15.0%McGraw-Hill Companies, Inc. Shareholder Right to Act by Written Consent Individual- Steiner, K. 46.4% 53.2% 0.4% 38.2% 43.9% 0.3% 4.8%Medco Health Solutions, Inc. Executive Compensation- Require Equity to be Retained AFL-CIO 26.1% 73.1% 0.8% 18.6% 52.0% 0.6% 14.8%MEMC Electronic Materials, Inc. Repeal Classified Board Individual- Armstrong, G. 95.4% 4.5% 0.1% 66.7% 3.1% 0.1% 13.2%Moody’s Corporation Board- Independent Board Chairman/Separate Chair-CEO Legal & General 56.5% 43.3% 0.3% 43.7% 33.5% 0.2% 5.4%Nabors Industries Ltd. Board- Majority Vote to Elect Directors AFSCME 63.0% 36.8% 0.2% 48.8% 28.5% 0.1% 7.7%Nabors Industries Ltd. Repeal Classified Board Connecticut Retirement Plans 74.9% 24.9% 0.2% 58.0% 19.3% 0.1% 7.7%Nash-Finch Company Cumulative Voting Individual- Armstrong, G. 34.0% 65.8% 0.2% 30.6% 59.3% 0.2% 4.0%Netflix, Inc. Supermajority Provision- Eliminate or Reduce Individual- Chevedden, J. 72.4% 27.2% 0.5% 49.5% 18.6% 0.3% 17.8%Newell Rubbermaid Inc. Repeal Classified Board Individual- Chevedden, J. 87.9% 11.8% 0.2% 70.1% 9.4% 0.2% 6.9%NiSource Inc. Shareholder Right to Act by Written Consent Individual- Chevedden, R. 42.3% 56.8% 0.9% 30.2% 40.6% 0.6% 10.5%Northrop Grumman Corporation Cumulative Voting AFL-CIO 35.1% 63.8% 1.2% 28.4% 51.6% 1.0% 7.3%Northrop Grumman Corporation Shareholder Right to Act by Written Consent Individual- Chevedden, J. 53.7% 45.3% 0.9% 43.5% 36.7% 0.7% 7.3%Nucor Corporation Board- Independent Board Chairman/Separate Chair-CEO AFL-CIO 33.6% 66.0% 0.4% 24.8% 48.7% 0.3% 11.8%Nucor Corporation Board- Majority Vote to Elect Directors* UBCJA 33.9% 65.7% 0.4% 25.0% 48.5% 0.3% 11.8%NV Energy, Inc. Board- Majority Vote to Elect Directors* Individual- Armstrong, G. 64.5% 35.4% 0.1% 54.8% 30.1% 0.1% 7.5%NV Energy, Inc. Executive Compensation- Require Equity to be Retained Individual- Weisshaar, R. 24.9% 74.9% 0.3% 21.1% 63.6% 0.2% 7.5%NV Energy, Inc. Shareholder Right to Call Special Meeting Individual- Hoch, J. 60.3% 39.0% 0.7% 51.3% 33.2% 0.6% 7.5%NYSE Euronext Shareholder Right to Act by Written Consent Individual- Steiner, W. 79.1% 20.3% 0.6% 49.5% 12.7% 0.4% 17.1%NYSE Euronext Shareholder Right to Call Special Meeting Individual- Steiner, K. 73.3% 26.3% 0.4% 45.9% 16.4% 0.2% 17.1%Occidental Petroleum Corporation Board- Nominate Director with Environmental Expertise New York City Pension Funds 4.5% 81.9% 13.6% 3.6% 65.7% 10.9% 6.2%Office Depot, Inc. Shareholder Right to Call Special Meeting Individual- Steiner, W. 37.2% 62.4% 0.3% 25.7% 43.1% 0.2% 11.2%Old Dominion Freight Line, Inc. Board- Independent Board Chairman/Separate Chair-CEO Teamsters 28.4% 71.6% 0.0% 26.5% 67.0% 0.0% 2.3%PACCAR Inc Board- Majority Vote to Elect Directors UBCJA 43.9% 55.3% 0.8% 38.0% 47.9% 0.7% 0.0%PACCAR Inc Supermajority Provision- Eliminate or Reduce Individual- Chevedden, J. 46.6% 52.1% 1.3% 40.4% 45.1% 1.1% 0.0%Palomar Medical Technologies, Inc. Board- Majority Vote to Elect Directors LongView 50.7% 48.9% 0.5% 33.1% 31.9% 0.3% 25.2%Pep Boys-Manny, Moe & Jack Shareholder Right to Call Special Meeting Individual- Chevedden, J. 17.8% 82.1% 0.1% 14.2% 65.6% 0.1% 9.3%PepsiCo, Inc. Shareholder Right to Call Special Meeting Individual- Treumann, R. 44.9% 54.5% 0.6% 30.4% 37.0% 0.4% 14.9%Pfizer Inc. Shareholder Right to Act by Written Consent Individual- Steiner, W. 47.3% 51.7% 1.0% 32.9% 36.0% 0.7% 12.9%Pfizer Inc. Shareholder Right to Call Special Meeting Individual- Chevedden, R. 41.2% 58.1% 0.7% 28.7% 40.5% 0.5% 12.9%PG&E Corporation Board- Independent Board Chairman/Separate Chair-CEO Individual- Chevedden, R. 29.8% 69.8% 0.4% 19.4% 45.4% 0.2% 10.9%Philip Morris International Inc. Board- Independent Board Chairman/Separate Chair-CEO New York City Pension Funds 23.0% 76.7% 0.3% 16.2% 53.8% 0.2% 14.5%Pioneer Natural Resources Company Board- Majority Vote to Elect Directors UBCJA 77.4% 22.4% 0.1% 60.7% 17.6% 0.1% 10.2%Pioneer Natural Resources Company Repeal Classified Board Florida State Board of Administration 90.5% 9.4% 0.1% 70.9% 7.3% 0.1% 10.2%PPL Corporation Board- Majority Vote to Elect Directors* Plumbers and Pipefitters 42.6% 56.1% 1.3% 32.1% 42.3% 1.0% 9.9%PPL Corporation Shareholder Right to Call Special Meeting Individual- Rossi, E. 49.1% 49.7% 1.2% 37.0% 37.5% 0.9% 9.9%priceline.com Incorporated Shareholder Right to Act by Written Consent Individual- Chevedden, J. 46.0% 53.8% 0.2% 37.5% 43.8% 0.1% 5.1%Prudential Financial, Inc. Supermajority Provision- Eliminate or Reduce Individual- Chevedden, J. 97.1% 2.0% 1.0% 64.9% 1.3% 0.6% 0.0%PulteGroup, Inc. Board- Independent Board Chairman/Separate Chair-CEO AFL-CIO 33.5% 64.7% 1.8% 26.0% 50.2% 1.4% 11.1%PulteGroup, Inc. Cumulative Voting IBEW 30.2% 69.6% 0.1% 23.5% 54.0% 0.1% 11.1%PulteGroup, Inc. Executive Compensation- Award Performance-Based Equity Awards Laborers 35.6% 62.6% 1.8% 27.6% 48.6% 1.4% 11.1%QUALCOMM Incorporated Board- Majority Vote to Elect Directors* UBCJA 51.4% 48.3% 0.3% 38.3% 36.0% 0.2% 12.0%R. R. Donnelley & Sons Company Shareholder Right to Act by Written Consent Individual- Steiner, W. 61.1% 38.5% 0.4% 50.3% 31.7% 0.3% 7.7%Rayonier Inc. Repeal Classified Board Individual- Armstrong, G. 84.1% 15.5% 0.4% 60.9% 11.2% 0.3% 15.6%Raytheon Company Executive Compensation- Approve/Disclose Supplemental Retirement Plans AFL-CIO 30.8% 68.4% 0.8% 24.6% 54.6% 0.6% 8.9%Raytheon Company Executive Compensation- Require Equity to Be Retained Individual- Chevedden, J. 24.7% 74.4% 0.9% 19.7% 59.4% 0.7% 8.9%Raytheon Company Shareholder Right to Act by Written Consent Individual- Chevedden, R. 48.6% 50.6% 0.8% 38.8% 40.4% 0.7% 8.9%Republic Services, Inc. Executive Compensation- Approve or Limit Executive Death Benefits Teamsters 43.8% 53.4% 2.9% 36.8% 44.8% 2.4% 5.1%Reynolds American Inc. Repeal Classified Board Individual- Armstrong, G. 34.3% 65.6% 0.1% 25.2% 48.1% 0.1% 7.6%Safeway Inc. Cumulative Voting Individual- Davis, E. 27.6% 71.3% 1.1% 22.4% 57.9% 0.9% 4.2%Saks Incorporated Cumulative Voting Individual- Davis, E. 21.2% 78.7% 0.1% 15.3% 56.7% 0.1% 5.7%salesforce.com, inc. Repeal Classified Board Florida State Board of Administration 79.3% 20.6% 0.0% 66.1% 17.2% 0.0% 6.8%Sempra Energy Executive Compensation- Approve/Disclose Supplemental Retirement Plans AFL-CIO 32.6% 66.6% 0.8% 23.5% 47.9% 0.6% 12.0%

> 26
FIGURE 14> Voting Results Sorted by Company – 2011
As Percentage of Votes Cast
As Percentage of Shares Outstanding
Company Proposal Sponsor For Against Abstain For Against Abstain Non-Vote
Sempra Energy Executive Compensation- Link Pay to Social Criteria Laborers 6.0% 81.3% 12.6% 4.3% 58.5% 9.1% 12.0%Sempra Energy Shareholder Right to Act by Written Consent Individual- Chevedden, R. 36.8% 62.3% 0.9% 26.5% 44.8% 0.7% 12.0%Sherwin-Williams Company Board- Majority Vote to Elect Directors* UBCJA 38.9% 59.7% 1.3% 30.7% 47.1% 1.0% 6.5%SkyWest, Inc. Board- Majority Vote to Elect Directors Teamsters 77.5% 22.4% 0.1% 67.4% 19.5% 0.1% 7.4%Sonic Corp. Board- Independent Board Chairman/Separate Chair-CEO Laborers 36.4% 62.3% 1.3% 30.7% 52.6% 1.1% 7.6%Southwest Airlines Co. Supermajority Provision- Eliminate or Reduce Individual- Chevedden, J. 65.1% 34.6% 0.3% 53.5% 28.4% 0.2% 10.6%Spectra Energy Corp Board- Majority Vote to Elect Directors* UBCJA 47.1% 51.9% 1.0% 31.3% 34.4% 0.7% 16.5%Sprint Nextel Corporation Executive Compensation- Require Equity to Be Retained AFL-CIO 22.5% 75.2% 2.3% 17.0% 56.9% 1.7% 10.6%Sprint Nextel Corporation Supermajority Provision- Eliminate or Reduce Individual- Steiner, K. 78.0% 21.6% 0.4% 59.0% 16.3% 0.3% 10.6%St. Jude Medical, Inc. Repeal Classified Board Tides Foundation 93.9% 5.5% 0.6% 72.1% 4.2% 0.5% 11.2%Staples, Inc. Shareholder Right to Act by Written Consent Individual- Chevedden, J. 60.3% 39.5% 0.2% 48.4% 31.7% 0.1% 6.1%Stryker Corporation Shareholder Right to Call Special Meeting Individual- Cirulli, V. 30.2% 69.2% 0.6% 23.6% 54.1% 0.5% 10.7%Sunoco, Inc. Exec. Comp.- Eliminate Accelerated Vesting in Termination/Change of Control LongView 43.6% 52.7% 3.7% 29.5% 35.8% 2.5% 15.1%Superior Industries Intl., Inc. Board- Majority Vote to Elect Directors* New York City Pension Funds 44.5% 55.3% 0.1% 39.2% 48.7% 0.1% 0.0%Target Corporation Executive Compensation- Higher Peer Benchmarking AFSCME 29.5% 69.2% 1.3% 22.5% 52.8% 1.0% 10.4%TECO Energy, Inc. Repeal Classified Board Individual- Armstrong, G. 65.9% 32.7% 1.4% 43.4% 21.6% 0.9% 22.2%Telephone and Data Systems, Inc. Eliminate Dual-Class Voting Rights Individual- Steiner, K. 34.2% 65.6% 0.2% 30.8% 59.1% 0.2% 2.1%Tessera Technologies, Inc. Board- Majority Vote to Elect Directors New York City Pension Funds 78.3% 21.7% 0.0% 65.7% 18.2% 0.0% 9.4%Thermo Fisher Scientific Inc. Repeal Classified Board Florida State Board of Administration 86.7% 13.1% 0.2% 68.2% 10.3% 0.1% 5.8%Time Warner Inc. Shareholder Right to Act by Written Consent Individual- Steiner, W. 49.5% 50.2% 0.2% 40.1% 40.7% 0.2% 6.9%U.S. Bancorp Executive Compensation- Advisory Vote on Director Compensation Individual- Armstrong, G. 7.4% 88.8% 3.8% 5.2% 62.0% 2.6% 13.6%UMB Financial Corporation Repeal Classified Board Individual- Armstrong, G. 54.9% 44.7% 0.4% 47.0% 38.2% 0.4% 5.5%Union Pacific Corporation Board- Independent Board Chairman/Separate Chair-CEO Individual- Chevedden, J. 21.8% 77.9% 0.3% 17.3% 61.9% 0.2% 9.7%United Technologies Corporation Executive Compensation- Require Equity to Be Retained AFL-CIO 25.6% 73.9% 0.5% 19.7% 56.9% 0.4% 9.0%Verizon Communications Inc. Cumulative Voting IBEW 37.4% 61.1% 1.5% 23.5% 38.4% 0.9% 20.7%Verizon Communications Inc. Executive Compensation- Award Performance-Based Equity Awards Association of BellTel Retirees 31.0% 67.6% 1.4% 19.5% 42.4% 0.9% 20.7%Verizon Communications Inc. Shareholder Right to Call Special Meeting Individual- Steiner, K. 48.2% 50.5% 1.3% 30.2% 31.7% 0.8% 20.7%Vornado Realty Trust Board- Independent Board Chairman/Separate Chair-CEO Laborers 50.6% 49.2% 0.1% 42.9% 41.7% 0.1% 5.5%Vornado Realty Trust Board- Majority Vote to Elect Directors UBCJA 79.4% 20.5% 0.1% 67.2% 17.4% 0.1% 5.5%Vornado Realty Trust Repeal Classified Board Individual- Armstrong, G. 80.2% 19.7% 0.1% 67.9% 16.7% 0.1% 5.5%Vulcan Materials Company Board- Majority Vote to Elect Directors* UBCJA 44.0% 55.8% 0.2% 33.1% 42.0% 0.2% 10.7%Vulcan Materials Company Repeal Classified Board Individual- Armstrong, G. 65.0% 34.8% 0.3% 48.9% 26.2% 0.2% 10.7%Walgreen Co. Executive Compensation- Award Performance-Based Equity Awards Laborers 42.4% 57.1% 0.5% 28.1% 37.9% 0.4% 16.7%Walgreen Co. Shareholder Right to Call Special Meeting Individual- Chevedden, J. 44.1% 54.9% 1.0% 29.2% 36.4% 0.6% 16.7%Wal-Mart Stores, Inc. Shareholder Right to Call Special Meeting Individual- Steiner, W. 18.5% 81.3% 0.2% 15.5% 68.0% 0.2% 7.1%Walt Disney Company Executive Compensation- Prohibit Re-Testing in Long Term Incentive Plans Unite Here 29.2% 70.2% 0.6% 21.9% 52.6% 0.5% 11.1%Webster Financial Corporation Repeal Classified Board Individual- Armstrong, G. 66.0% 33.6% 0.4% 55.7% 28.4% 0.3% 8.9%WellPoint, Inc. Board- Independent Board Chairman/Separate Chair-CEO SEIU 44.0% 55.9% 0.1% 32.7% 41.6% 0.1% 6.0%WellPoint, Inc. Reincorporation- IN to DE AFSCME 34.4% 65.3% 0.3% 25.6% 48.6% 0.2% 6.0%WellPoint, Inc. Study Feasibility of Converting to Nonprofit Status Individual- Stone, R. 0.4% 98.7% 0.9% 0.3% 73.4% 0.7% 6.0%Wells Fargo & Company Board- Independent Board Chairman/Separate Chair-CEO SEIU 29.8% 69.8% 0.4% 22.8% 53.5% 0.3% 9.2%Wells Fargo & Company Cumulative Voting Trowel Trades 28.7% 70.4% 0.9% 22.0% 53.9% 0.7% 9.2%Wells Fargo & Company Executive Compensation- Advisory Vote on Director Compensation Individual- Armstrong, G. 4.8% 89.8% 5.4% 3.7% 68.7% 4.1% 9.2%Wells Fargo & Company Shareholder Right to Call Special Meeting Individual- Holton, G. 43.4% 56.2% 0.4% 33.2% 43.0% 0.3% 9.2%Western Union Company Repeal Classified Board Nathan Cummings Foundation 87.3% 12.7% 0.1% 72.5% 10.5% 0.1% 5.2%WGL Holdings, Inc. Cumulative Voting Individual- Davis, E. 35.6% 62.9% 1.5% 24.6% 43.4% 1.0% 19.7%Whirlpool Corporation Executive Compensation- Approve/Vote on Golden Parachutes AFL-CIO 51.6% 46.3% 2.1% 40.6% 36.5% 1.6% 7.6%Whirlpool Corporation Shareholder Right to Act by Written Consent Individual- Steiner, W. 48.0% 51.8% 0.2% 37.8% 40.8% 0.2% 7.6%Whole Foods Market, Inc. Board- Amend Bylaws to Allow Director Removal With or Without Cause LongView 47.0% 48.1% 4.8% 36.0% 36.8% 3.7% 11.8%Whole Foods Market, Inc. Board- Independent Board Chairman/Separate Chair-CEO Individual- McRitchie, J. 33.7% 66.2% 0.1% 25.8% 50.6% 0.1% 11.8%Wilshire Bancorp, Inc. Board- Majority Vote to Elect Directors* CalSTRS 88.8% 10.2% 1.0% 78.4% 9.0% 0.9% 0.0%Windstream Corp. Cumulative Voting IBEW 30.4% 68.3% 1.4% 16.6% 37.2% 0.7% 32.6%Wyndham Worldwide Corporation Repeal Classified Board Florida State Board of Administration 79.5% 20.4% 0.1% 69.4% 17.8% 0.1% 5.6%Zions Bancorporation Executive Compensation- Recoup Bonuses if Restatement Individual- Armstrong, G. 30.5% 55.0% 14.5% 25.6% 46.3% 12.2% 0.0%
* Issuer has implemented a form of majority voting.

> 27
FIGURE 15> Voting Results Sorted by Proposal – 2011
As Percentage of Votes Cast
As Percentage of Shares Outstanding
Company Proposal Sponsor For Against Abstain For Against Abstain Non-Vote
Apple Inc. Board- Adopt and Disclose CEO Succession Planning Guidelines Laborers 29.9% 69.5% 0.6% 18.7% 43.4% 0.4% 19.4%Kohl’s Corporation Board- Adopt and Disclose CEO Succession Planning Guidelines Trowel Trades 23.8% 76.0% 0.1% 19.7% 62.7% 0.1% 4.8%Whole Foods Market, Inc. Board- Amend Bylaws to Allow Director Removal With or Without Cause LongView 47.0% 48.1% 4.8% 36.0% 36.8% 3.7% 11.8%Chevron Corporation Board- Establish Committee on Human Rights Harrington Investments 4.4% 78.7% 16.9% 3.0% 53.7% 11.5% 15.4%Google Inc. Board- Establish Committee on Sustainability Harrington Investments 1.0% 95.0% 3.9% 0.9% 82.2% 3.4% 3.4%Abercrombie & Fitch Co. Board- Independent Board Chairman/Separate Chair-CEO AFSCME 31.2% 68.7% 0.1% 26.7% 58.7% 0.1% 4.5%Aetna Inc. Board- Independent Board Chairman/Separate Chair-CEO United Association S&P 500 Index Fund 51.2% 48.4% 0.4% 41.7% 39.3% 0.3% 5.5%Anadarko Petroleum Corporation Board- Independent Board Chairman/Separate Chair-CEO AFSCME 41.6% 58.2% 0.2% 30.0% 41.9% 0.1% 8.5%Boeing Company Board- Independent Board Chairman/Separate Chair-CEO Sheet Metal Workers 35.0% 64.2% 0.9% 25.2% 46.2% 0.6% 15.1%Caterpillar Inc. Board- Independent Board Chairman/Separate Chair-CEO SEIU 17.7% 81.8% 0.5% 12.2% 56.4% 0.3% 16.8%Comcast Corporation Board- Independent Board Chairman/Separate Chair-CEO AFL-CIO 19.8% 79.3% 0.9% 16.8% 67.2% 0.8% 4.8%Dominion Resources, Inc. Board- Independent Board Chairman/Separate Chair-CEO Not Named 30.5% 68.5% 1.0% 20.2% 45.3% 0.7% 15.6%Exxon Mobil Corporation Board- Independent Board Chairman/Separate Chair-CEO RAM Trust 31.0% 67.9% 1.2% 19.7% 43.1% 0.7% 17.9%Frontier Communications Corp. Board- Independent Board Chairman/Separate Chair-CEO AFL-CIO 21.4% 77.1% 1.6% 10.6% 38.1% 0.8% 30.0%JPMorgan Chase & Co. Board- Independent Board Chairman/Separate Chair-CEO Individual- Chevedden, J. 11.9% 86.7% 1.4% 8.9% 64.8% 1.1% 9.0%Moody’s Corporation Board- Independent Board Chairman/Separate Chair-CEO Legal & General 56.5% 43.3% 0.3% 43.7% 33.5% 0.2% 5.4%Nucor Corporation Board- Independent Board Chairman/Separate Chair-CEO AFL-CIO 33.6% 66.0% 0.4% 24.8% 48.7% 0.3% 11.8%Old Dominion Freight Line, Inc. Board- Independent Board Chairman/Separate Chair-CEO Teamsters 28.4% 71.6% 0.0% 26.5% 67.0% 0.0% 2.3%PG&E Corporation Board- Independent Board Chairman/Separate Chair-CEO Individual- Chevedden, R. 29.8% 69.8% 0.4% 19.4% 45.4% 0.2% 10.9%Philip Morris International Inc. Board- Independent Board Chairman/Separate Chair-CEO New York City Pension Funds 23.0% 76.7% 0.3% 16.2% 53.8% 0.2% 14.5%PulteGroup, Inc. Board- Independent Board Chairman/Separate Chair-CEO AFL-CIO 33.5% 64.7% 1.8% 26.0% 50.2% 1.4% 11.1%Sonic Corp. Board- Independent Board Chairman/Separate Chair-CEO Laborers 36.4% 62.3% 1.3% 30.7% 52.6% 1.1% 7.6%Union Pacific Corporation Board- Independent Board Chairman/Separate Chair-CEO Individual- Chevedden, J. 21.8% 77.9% 0.3% 17.3% 61.9% 0.2% 9.7%Vornado Realty Trust Board- Independent Board Chairman/Separate Chair-CEO Laborers 50.6% 49.2% 0.1% 42.9% 41.7% 0.1% 5.5%WellPoint, Inc. Board- Independent Board Chairman/Separate Chair-CEO SEIU 44.0% 55.9% 0.1% 32.7% 41.6% 0.1% 6.0%Wells Fargo & Company Board- Independent Board Chairman/Separate Chair-CEO SEIU 29.8% 69.8% 0.4% 22.8% 53.5% 0.3% 9.2%Whole Foods Market, Inc. Board- Independent Board Chairman/Separate Chair-CEO Individual- McRitchie, J. 33.7% 66.2% 0.1% 25.8% 50.6% 0.1% 11.8%AmSurg Corp. Board- Majority Vote to Elect Directors New York City Pension Funds 73.5% 26.3% 0.2% 66.7% 23.8% 0.2% 3.0%Apple Inc. Board- Majority Vote to Elect Directors CalPERS 73.4% 26.3% 0.3% 45.9% 16.5% 0.2% 19.4%Baker Hughes Incorporated Board- Majority Vote to Elect Directors* UBCJA 45.4% 53.1% 1.5% 35.1% 41.0% 1.2% 6.4%BB&T Corporation Board- Majority Vote to Elect Directors UBCJA 57.3% 41.6% 1.1% 38.0% 27.5% 0.7% 14.6%Caterpillar Inc. Board- Majority Vote to Elect Directors* UBCJA 35.5% 64.0% 0.5% 24.5% 44.1% 0.4% 16.8%Clean Harbors, Inc. Board- Majority Vote to Elect Directors CalSTRS 62.5% 37.3% 0.3% 50.2% 29.9% 0.2% 4.8%Cliffs Natural Resources Inc. Board- Majority Vote to Elect Directors* United Association S&P 500 Index Fund 56.0% 43.6% 0.3% 41.4% 32.2% 0.2% 10.0%Duke Energy Corporation Board- Majority Vote to Elect Directors* UBCJA 37.0% 60.9% 2.1% 20.9% 34.4% 1.2% 27.8%FirstEnergy Corp. Board- Majority Vote to Elect Directors* Sheet Metal Workers 42.6% 56.3% 1.1% 32.7% 43.3% 0.8% 10.8%Gentex Corporation Board- Majority Vote to Elect Directors Tides Foundation 80.4% 17.0% 2.6% 63.1% 13.3% 2.1% 12.8%Graco Inc. Board- Majority Vote to Elect Directors CalPERS 70.6% 29.1% 0.3% 56.3% 23.2% 0.2% 10.0%Hansen Natural Corporation Board- Majority Vote to Elect Directors* Calvert Asset Management 48.1% 51.9% 0.1% 38.3% 41.3% 0.1% 6.0%Kellogg Company Board- Majority Vote to Elect Directors* UBCJA 27.7% 72.0% 0.4% 21.8% 56.8% 0.3% 8.4%Lorillard, Inc. Board- Majority Vote to Elect Directors UBCJA 86.5% 12.5% 0.9% 62.1% 9.0% 0.7% 9.1%Masimo Corporation Board- Majority Vote to Elect Directors CalSTRS 67.2% 32.6% 0.2% 58.4% 28.3% 0.2% 6.5%Nabors Industries Ltd. Board- Majority Vote to Elect Directors AFSCME 63.0% 36.8% 0.2% 48.8% 28.5% 0.1% 7.7%Nucor Corporation Board- Majority Vote to Elect Directors* UBCJA 33.9% 65.7% 0.4% 25.0% 48.5% 0.3% 11.8%NV Energy, Inc. Board- Majority Vote to Elect Directors* Individual- Armstrong, G. 64.5% 35.4% 0.1% 54.8% 30.1% 0.1% 7.5%PACCAR Inc Board- Majority Vote to Elect Directors UBCJA 43.9% 55.3% 0.8% 38.0% 47.9% 0.7% 0.0%Palomar Medical Technologies, Inc. Board- Majority Vote to Elect Directors LongView 50.7% 48.9% 0.5% 33.1% 31.9% 0.3% 25.2%Pioneer Natural Resources Company Board- Majority Vote to Elect Directors UBCJA 77.4% 22.4% 0.1% 60.7% 17.6% 0.1% 10.2%PPL Corporation Board- Majority Vote to Elect Directors* Plumbers and Pipefitters 42.6% 56.1% 1.3% 32.1% 42.3% 1.0% 9.9%QUALCOMM Incorporated Board- Majority Vote to Elect Directors* UBCJA 51.4% 48.3% 0.3% 38.3% 36.0% 0.2% 12.0%Sherwin-Williams Company Board- Majority Vote to Elect Directors* UBCJA 38.9% 59.7% 1.3% 30.7% 47.1% 1.0% 6.5%SkyWest, Inc. Board- Majority Vote to Elect Directors Teamsters 77.5% 22.4% 0.1% 67.4% 19.5% 0.1% 7.4%Spectra Energy Corp Board- Majority Vote to Elect Directors* UBCJA 47.1% 51.9% 1.0% 31.3% 34.4% 0.7% 16.5%Superior Industries Intl., Inc. Board- Majority Vote to Elect Directors* New York City Pension Funds 44.5% 55.3% 0.1% 39.2% 48.7% 0.1% 0.0%Tessera Technologies, Inc. Board- Majority Vote to Elect Directors New York City Pension Funds 78.3% 21.7% 0.0% 65.7% 18.2% 0.0% 9.4%Vornado Realty Trust Board- Majority Vote to Elect Directors UBCJA 79.4% 20.5% 0.1% 67.2% 17.4% 0.1% 5.5%Vulcan Materials Company Board- Majority Vote to Elect Directors* UBCJA 44.0% 55.8% 0.2% 33.1% 42.0% 0.2% 10.7%Wilshire Bancorp, Inc. Board- Majority Vote to Elect Directors* CalSTRS 88.8% 10.2% 1.0% 78.4% 9.0% 0.9% 0.0%Chevron Corporation Board- Nominate Director with Environmental Expertise New York City Pension Funds 24.1% 73.0% 2.9% 16.4% 49.8% 2.0% 15.4%Freeport-McMoRan Copper & Gold Inc. Board- Nominate Director with Environmental Expertise New York State Pension Funds 30.0% 67.3% 2.7% 20.3% 45.7% 1.8% 10.8%Occidental Petroleum Corporation Board- Nominate Director with Environmental Expertise New York City Pension Funds 4.5% 81.9% 13.6% 3.6% 65.7% 10.9% 6.2%Google Inc. Board- Report on Conflict of Interest Policy National Center for Public Policy Research 0.4% 96.0% 3.5% 0.4% 83.0% 3.1% 3.4%

> 28
FIGURE 15> Voting Results Sorted by Proposal – 2011
As Percentage of Votes Cast
As Percentage of Shares Outstanding
Company Proposal Sponsor For Against Abstain For Against Abstain Non-Vote
Aetna Inc. Cumulative Voting Individual- Davis, E. 37.6% 62.0% 0.4% 30.6% 50.4% 0.3% 5.5%American Express Company Cumulative Voting Individual- Davis, E. 26.3% 72.3% 1.4% 19.6% 53.9% 1.0% 9.6%AutoNation, Inc. Cumulative Voting IBEW 14.6% 85.3% 0.1% 13.4% 78.5% 0.1% 4.7%Bank of America Corporation Cumulative Voting Trowel Trades 36.3% 63.1% 0.6% 21.9% 38.1% 0.3% 19.8%Bank of New York Mellon Corporation Cumulative Voting Individual- Davis, E. 30.0% 69.3% 0.7% 23.2% 53.8% 0.5% 6.9%Becton, Dickinson and Company Cumulative Voting Individual- Davis, E. 36.5% 63.0% 0.5% 26.2% 45.3% 0.4% 11.0%Comcast Corporation Cumulative Voting Individual- Davis, E. 27.2% 72.6% 0.2% 23.1% 61.6% 0.1% 4.8%Equity Residential Cumulative Voting Trowel Trades 34.5% 65.4% 0.1% 30.3% 57.6% 0.1% 3.7%General Electric Company Cumulative Voting Individual- Davis, E. 26.6% 72.4% 1.1% 15.4% 41.9% 0.6% 19.9%Goldman Sachs Group, Inc. Cumulative Voting Individual- Davis, E. 25.6% 74.2% 0.2% 18.2% 52.8% 0.1% 10.2%Home Depot, Inc. Cumulative Voting Individual- Davis, E. 41.4% 58.2% 0.4% 29.0% 40.8% 0.3% 15.0%International Business Machines Corp. Cumulative Voting Individual- Davis, E. 27.6% 71.3% 1.0% 17.8% 45.9% 0.7% 14.5%Loews Corporation Cumulative Voting Individual- Davis, E. 78.3% 21.4% 0.3% 65.5% 17.9% 0.2% 5.1%Nash-Finch Company Cumulative Voting Individual- Armstrong, G. 34.0% 65.8% 0.2% 30.6% 59.3% 0.2% 4.0%Northrop Grumman Corporation Cumulative Voting AFL-CIO 35.1% 63.8% 1.2% 28.4% 51.6% 1.0% 7.3%PulteGroup, Inc. Cumulative Voting IBEW 30.2% 69.6% 0.1% 23.5% 54.0% 0.1% 11.1%Safeway Inc. Cumulative Voting Individual- Davis, E. 27.6% 71.3% 1.1% 22.4% 57.9% 0.9% 4.2%Saks Incorporated Cumulative Voting Individual- Davis, E. 21.2% 78.7% 0.1% 15.3% 56.7% 0.1% 5.7%Verizon Communications Inc. Cumulative Voting IBEW 37.4% 61.1% 1.5% 23.5% 38.4% 0.9% 20.7%Wells Fargo & Company Cumulative Voting Trowel Trades 28.7% 70.4% 0.9% 22.0% 53.9% 0.7% 9.2%WGL Holdings, Inc. Cumulative Voting Individual- Davis, E. 35.6% 62.9% 1.5% 24.6% 43.4% 1.0% 19.7%Windstream Corp. Cumulative Voting IBEW 30.4% 68.3% 1.4% 16.6% 37.2% 0.7% 32.6%Ford Motor Company Eliminate Dual-Class Voting Rights Individual- Chevedden, R. & V. 31.4% 68.1% 0.5% 22.6% 49.1% 0.4% 18.9%Telephone and Data Systems, Inc. Eliminate Dual-Class Voting Rights Individual- Steiner, K. 34.2% 65.6% 0.2% 30.8% 59.1% 0.2% 2.1%Chevron Corporation Executive Compensation- Add Sustainability Performance Metrics Laborers 5.3% 89.4% 5.3% 3.6% 60.9% 3.6% 15.4%Chesapeake Energy Corporation Executive Compensation- Advisory Vote on Director Compensation Individual- Armstrong, G. 43.1% 49.8% 7.0% 30.3% 35.1% 4.9% 17.4%U.S. Bancorp Executive Compensation- Advisory Vote on Director Compensation Individual- Armstrong, G. 7.4% 88.8% 3.8% 5.2% 62.0% 2.6% 13.6%Wells Fargo & Company Executive Compensation- Advisory Vote on Director Compensation Individual- Armstrong, G. 4.8% 89.8% 5.4% 3.7% 68.7% 4.1% 9.2%Caterpillar Inc. Executive Compensation- Approve or Limit Executive Death Benefits LongView 12.6% 86.7% 0.8% 8.7% 59.8% 0.5% 16.8%Harley-Davidson, Inc. Executive Compensation- Approve or Limit Executive Death Benefits LongView 26.3% 72.7% 1.0% 19.7% 54.5% 0.7% 5.2%Republic Services, Inc. Executive Compensation- Approve or Limit Executive Death Benefits Teamsters 43.8% 53.4% 2.9% 36.8% 44.8% 2.4% 5.1%Dominion Resources, Inc. Executive Compensation- Approve/Disclose Supplemental Retirement Plans AFL-CIO 25.1% 73.7% 1.2% 16.6% 48.8% 0.8% 15.6%Raytheon Company Executive Compensation- Approve/Disclose Supplemental Retirement Plans AFL-CIO 30.8% 68.4% 0.8% 24.6% 54.6% 0.6% 8.9%Sempra Energy Executive Compensation- Approve/Disclose Supplemental Retirement Plans AFL-CIO 32.6% 66.6% 0.8% 23.5% 47.9% 0.6% 12.0%Coca-Cola Enterprises, Inc. Executive Compensation- Approve/Vote on Golden Parachutes Teamsters 37.3% 61.8% 0.8% 31.2% 51.6% 0.7% 5.5%Lowe’s Companies, Inc. Executive Compensation- Approve/Vote on Golden Parachutes Trowel Trades 57.5% 42.0% 0.4% 44.4% 32.5% 0.3% 12.1%Whirlpool Corporation Executive Compensation- Approve/Vote on Golden Parachutes AFL-CIO 51.6% 46.3% 2.1% 40.6% 36.5% 1.6% 7.6%General Electric Company Executive Compensation- Award Performance-Based Equity Awards Trowel Trades 29.2% 69.7% 1.1% 16.9% 40.3% 0.6% 19.9%PulteGroup, Inc. Executive Compensation- Award Performance-Based Equity Awards Laborers 35.6% 62.6% 1.8% 27.6% 48.6% 1.4% 11.1%Verizon Communications Inc. Executive Compensation- Award Performance-Based Equity Awards Association of BellTel Retirees 31.0% 67.6% 1.4% 19.5% 42.4% 0.9% 20.7%Walgreen Co. Executive Compensation- Award Performance-Based Equity Awards Laborers 42.4% 57.1% 0.5% 28.1% 37.9% 0.4% 16.7%Anadarko Petroleum Corporation Exec. Comp.- Eliminate Accelerated Vesting in Termination/Change of Control LongView 36.5% 63.0% 0.5% 26.3% 45.3% 0.3% 8.5%EOG Resources, Inc. Exec. Comp.- Eliminate Accelerated Vesting in Termination/Change of Control LongView 42.1% 57.1% 0.7% 36.3% 49.2% 0.6% 3.1%Sunoco, Inc. Exec. Comp.- Eliminate Accelerated Vesting in Termination/Change of Control LongView 43.6% 52.7% 3.7% 29.5% 35.8% 2.5% 15.1%Dean Foods Company Executive Compensation- Establish Antitax Gross-up Policy LongView 42.3% 57.2% 0.6% 30.6% 41.4% 0.4% 13.7%Bristol-Myers Squibb Company Executive Compensation- Greater Disclosure Individual- Davis, E. 7.4% 91.8% 0.8% 5.0% 62.7% 0.5% 17.2%Consolidated Edison, Inc. Executive Compensation- Greater Disclosure Individual- Davis, E. 15.4% 82.4% 2.1% 8.2% 43.9% 1.1% 29.5%Target Corporation Executive Compensation- Higher Peer Benchmarking AFSCME 29.5% 69.2% 1.3% 22.5% 52.8% 1.0% 10.4%Bank of America Corporation Executive Compensation- Limit Relocation Benefits CtW Investment Group 35.3% 63.9% 0.8% 21.3% 38.5% 0.5% 19.8%Equity Residential Executive Compensation- Link Pay to Social Criteria Laborers 3.6% 94.0% 2.3% 3.2% 82.7% 2.0% 3.7%Lowe’s Companies, Inc. Executive Compensation- Link Pay to Social Criteria Laborers 4.2% 91.7% 4.1% 3.2% 70.8% 3.2% 12.1%Sempra Energy Executive Compensation- Link Pay to Social Criteria Laborers 6.0% 81.3% 12.6% 4.3% 58.5% 9.1% 12.0%Walt Disney Company Executive Compensation- Prohibit Re-Testing in Long Term Incentive Plans Unite Here 29.2% 70.2% 0.6% 21.9% 52.6% 0.5% 11.1%Bank of America Corporation Executive Compensation- Recoup Bonuses if Restatement SEIU 35.2% 64.0% 0.9% 21.2% 38.6% 0.5% 19.8%Zions Bancorporation Executive Compensation- Recoup Bonuses if Restatement Individual- Armstrong, G. 30.5% 55.0% 14.5% 25.6% 46.3% 12.2% 0.0%Caterpillar Inc. Executive Compensation- Require Equity to Be Retained Individual- Chevedden, J. 21.9% 77.3% 0.8% 15.1% 53.4% 0.5% 16.8%Goldman Sachs Group, Inc. Executive Compensation- Require Equity to Be Retained Harrington Investments 20.6% 79.0% 0.4% 14.7% 56.1% 0.3% 10.2%Medco Health Solutions, Inc. Executive Compensation- Require Equity to Be Retained AFL-CIO 26.1% 73.1% 0.8% 18.6% 52.0% 0.6% 14.8%NV Energy, Inc. Executive Compensation- Require Equity to Be Retained Individual- Weisshaar, R. 24.9% 74.9% 0.3% 21.1% 63.6% 0.2% 7.5%Raytheon Company Executive Compensation- Require Equity to Be Retained Individual- Chevedden, J. 24.7% 74.4% 0.9% 19.7% 59.4% 0.7% 8.9%Sprint Nextel Corporation Executive Compensation- Require Equity to Be Retained AFL-CIO 22.5% 75.2% 2.3% 17.0% 56.9% 1.7% 10.6%United Technologies Corporation Executive Compensation- Require Equity to Be Retained AFL-CIO 25.6% 73.9% 0.5% 19.7% 56.9% 0.4% 9.0%

> 29
FIGURE 15> Voting Results Sorted by Proposal – 2011
As Percentage of Votes Cast
As Percentage of Shares Outstanding
Company Proposal Sponsor For Against Abstain For Against Abstain Non-Vote
Goldman Sachs Group, Inc. Executive Compensation- Review Nathan Cummings Foundation 4.1% 92.2% 3.7% 2.9% 65.6% 2.6% 10.2%General Electric Company Executive Compensation- Withdraw Awards Individual- Hepburn, J. 7.3% 91.7% 1.0% 4.2% 53.0% 0.6% 19.9%American International Group, Inc. Hedge/Derivative Trading Policy and Procedure Individual- Steiner, K. 12.7% 86.4% 0.9% 12.1% 82.6% 0.9% 1.9%Bank of America Corporation Hedge/Derivative Trading Policy and Procedure Missionary Oblates of Mary Immaculate 30.8% 60.8% 8.4% 18.6% 36.6% 5.1% 19.8%Ball Corporation Poison Pill- Redeem or Vote On CalSTRS 67.2% 32.3% 0.5% 56.7% 27.2% 0.4% 5.0%Ball Corporation Reincorporation- IN to DE AFSCME 42.9% 56.1% 1.0% 36.2% 47.3% 0.8% 5.0%WellPoint, Inc. Reincorporation- IN to DE AFSCME 34.4% 65.3% 0.3% 25.6% 48.6% 0.2% 6.0%Alcoa Inc. Repeal Classified Board AFSCME 80.7% 18.6% 0.8% 42.5% 9.8% 0.4% 21.2%Aqua America, Inc. Repeal Classified Board UWA 59.1% 38.1% 2.9% 35.1% 22.6% 1.7% 23.1%Boston Private Financial Holdings, Inc. Repeal Classified Board Individual- Armstrong, G. 72.3% 27.5% 0.2% 58.7% 22.3% 0.2% 0.0%C.H. Robinson Worldwide, Inc. Repeal Classified Board Nathan Cummings Foundation 71.3% 28.3% 0.3% 51.2% 20.3% 0.2% 16.3%C.R. Bard, Inc. Repeal Classified Board Tides Foundation 79.1% 20.1% 0.8% 65.6% 16.7% 0.7% 6.4%CenturyLink, Inc. Repeal Classified Board IBEW 82.7% 16.8% 0.5% 56.5% 11.5% 0.3% 19.9%CF Industries Holdings, Inc. Repeal Classified Board Florida State Board of Administration 89.4% 10.5% 0.1% 70.8% 8.3% 0.1% 5.7%Charles Schwab Corporation Repeal Classified Board AFSCME 69.5% 21.8% 8.7% 54.2% 17.0% 12.2% 7.7%City National Corporation Repeal Classified Board Individual- Armstrong, G. 59.8% 39.9% 0.3% 53.6% 35.7% 0.3% 4.9%Franklin Street Properties Corp. Repeal Classified Board Individual- Armstrong, G. 72.5% 27.0% 0.4% 50.3% 18.8% 0.3% 17.8%Gentex Corporation Repeal Classified Board Christopher Reynolds Foundation 85.5% 14.3% 0.2% 70.4% 11.8% 0.1% 8.9%Helmerich & Payne, Inc. Repeal Classified Board Individual- Armstrong, G. 74.2% 25.5% 0.3% 58.9% 20.2% 0.2% 6.2%Hospitality Properties Trust Repeal Classified Board CalPERS 88.6% 10.9% 0.4% 68.6% 8.5% 0.3% 14.8%Hudson City Bancorp, Inc. Repeal Classified Board Nathan Cummings Foundation 75.9% 22.3% 1.8% 49.8% 14.6% 1.2% 15.0%IDACORP, Inc. Repeal Classified Board Individual- Armstrong, G. 84.4% 14.9% 0.7% 60.2% 10.6% 0.5% 14.6%Juniper Networks, Inc. Repeal Classified Board New York City Pension Funds 97.2% 2.4% 0.4% 78.0% 1.9% 0.3% 9.0%McDonald’s Corporation Repeal Classified Board Florida State Board of Administration 77.0% 22.4% 0.6% 52.5% 15.2% 0.4% 15.0%MEMC Electronic Materials, Inc. Repeal Classified Board Individual- Armstrong, G. 95.4% 4.5% 0.1% 66.7% 3.1% 0.1% 13.2%Nabors Industries Ltd. Repeal Classified Board Connecticut Retirement Plans 74.9% 24.9% 0.2% 58.0% 19.3% 0.1% 7.7%Newell Rubbermaid Inc. Repeal Classified Board Individual- Chevedden, J. 87.9% 11.8% 0.2% 70.1% 9.4% 0.2% 6.9%Pioneer Natural Resources Company Repeal Classified Board Florida State Board of Administration 90.5% 9.4% 0.1% 70.9% 7.3% 0.1% 10.2%Rayonier Inc. Repeal Classified Board Individual- Armstrong, G. 84.1% 15.5% 0.4% 60.9% 11.2% 0.3% 15.6%Reynolds American Inc. Repeal Classified Board Individual- Armstrong, G. 34.3% 65.6% 0.1% 25.2% 48.1% 0.1% 7.6%salesforce.com, inc. Repeal Classified Board Florida State Board of Administration 79.3% 20.6% 0.0% 66.1% 17.2% 0.0% 6.8%St. Jude Medical, Inc. Repeal Classified Board Tides Foundation 93.9% 5.5% 0.6% 72.1% 4.2% 0.5% 11.2%TECO Energy, Inc. Repeal Classified Board Individual- Armstrong, G. 65.9% 32.7% 1.4% 43.4% 21.6% 0.9% 22.2%Thermo Fisher Scientific Inc. Repeal Classified Board Florida State Board of Administration 86.7% 13.1% 0.2% 68.2% 10.3% 0.1% 5.8%UMB Financial Corporation Repeal Classified Board Individual- Armstrong, G. 54.9% 44.7% 0.4% 47.0% 38.2% 0.4% 5.5%Vornado Realty Trust Repeal Classified Board Individual- Armstrong, G. 80.2% 19.7% 0.1% 67.9% 16.7% 0.1% 5.5%Vulcan Materials Company Repeal Classified Board Individual- Armstrong, G. 65.0% 34.8% 0.3% 48.9% 26.2% 0.2% 10.7%Webster Financial Corporation Repeal Classified Board Individual- Armstrong, G. 66.0% 33.6% 0.4% 55.7% 28.4% 0.3% 8.9%Western Union Company Repeal Classified Board Nathan Cummings Foundation 87.3% 12.7% 0.1% 72.5% 10.5% 0.1% 5.2%Wyndham Worldwide Corporation Repeal Classified Board Florida State Board of Administration 79.5% 20.4% 0.1% 69.4% 17.8% 0.1% 5.6%Citigroup Inc. Report on Risk Management Structure Sisters of Charity of St. Elizabeth 6.9% 77.1% 16.1% 3.7% 41.9% 8.7% 20.6%Alcoa Inc. Shareholder Right to Act by Written Consent Individual- Steiner, W. 58.6% 40.5% 0.9% 30.8% 21.3% 0.5% 21.2%Allstate Corporation Shareholder Right to Act by Written Consent Individual- Steiner, K. 52.0% 47.0% 1.0% 39.8% 35.9% 0.7% 9.3%Amgen Inc. Shareholder Right to Act by Written Consent Individual- Steiner, W. 50.2% 48.8% 1.0% 38.1% 37.0% 0.8% 10.4%AT&T Inc. Shareholder Right to Act by Written Consent Individual- Steiner, K. 53.2% 45.0% 1.8% 31.6% 26.7% 1.1% 17.4%Bank of America Corporation Shareholder Right to Act by Written Consent Individual- Steiner, K. 47.1% 51.9% 1.0% 28.4% 31.3% 0.6% 19.8%Boeing Company Shareholder Right to Act by Written Consent Individual- Chevedden, J. 31.3% 67.5% 1.2% 22.5% 48.6% 0.9% 15.1%Bristol-Myers Squibb Company Shareholder Right to Act by Written Consent Individual- Steiner, K. 38.2% 60.6% 1.2% 26.1% 41.4% 0.8% 17.2%CVS Caremark Corporation Shareholder Right to Act by Written Consent Individual- Steiner, W. 55.7% 42.3% 2.0% 43.9% 33.3% 1.6% 7.3%DaVita Inc. Shareholder Right to Act by Written Consent Individual- Steiner, K. 28.7% 71.1% 0.1% 24.4% 60.3% 0.1% 4.2%Devon Energy Corporation Shareholder Right to Act by Written Consent Individual- Chevedden, J. 60.5% 39.2% 0.3% 47.6% 30.8% 0.2% 9.1%Dominion Resources, Inc. Shareholder Right to Act by Written Consent Individual- Chevedden, J. 45.8% 52.9% 1.3% 30.3% 35.0% 0.8% 15.6%Dow Chemical Company Shareholder Right to Act by Written Consent Individual- Steiner, K. 41.2% 56.9% 1.9% 32.3% 44.7% 1.5% 9.6%FirstEnergy Corp. Shareholder Right to Act by Written Consent Individual- Chevedden, R. 44.7% 53.8% 1.5% 34.4% 41.3% 1.2% 10.8%Honeywell International Inc. Shareholder Right to Act by Written Consent Individual- Chevedden, J. 43.2% 56.0% 0.8% 34.1% 44.1% 0.6% 9.9%International Paper Company Shareholder Right to Act by Written Consent Individual- Steiner, W. 52.5% 46.7% 0.8% 38.3% 34.1% 0.6% 9.4%JPMorgan Chase & Co. Shareholder Right to Act by Written Consent Individual- Chevedden, J. 49.0% 50.1% 0.9% 36.6% 37.5% 0.6% 9.0%Kohl’s Corporation Shareholder Right to Act by Written Consent Individual- Chevedden, J. 22.9% 76.9% 0.2% 18.9% 63.4% 0.2% 4.8%Liz Claiborne, Inc. Shareholder Right to Act by Written Consent Individual- Steiner, K. 65.4% 32.0% 2.6% 49.9% 24.4% 2.0% 12.8%Lockheed Martin Corporation Shareholder Right to Act by Written Consent Individual- Chevedden, J. 36.5% 62.3% 1.2% 30.8% 52.6% 1.0% 7.3%Marsh & McLennan Companies, Inc. Shareholder Right to Act by Written Consent Individual- Steiner, W. 38.2% 61.0% 0.8% 31.2% 49.9% 0.7% 6.9%McGraw-Hill Companies, Inc. Shareholder Right to Act by Written Consent Individual- Steiner, K. 46.4% 53.2% 0.4% 38.2% 43.9% 0.3% 4.8%

> 30
FIGURE 15> Voting Results Sorted by Proposal – 2011
As Percentage of Votes Cast
As Percentage of Shares Outstanding
Company Proposal Sponsor For Against Abstain For Against Abstain Non-Vote
NiSource Inc. Shareholder Right to Act by Written Consent Individual- Chevedden, R. 42.3% 56.8% 0.9% 30.2% 40.6% 0.6% 10.5%Northrop Grumman Corporation Shareholder Right to Act by Written Consent Individual- Chevedden, J. 53.7% 45.3% 0.9% 43.5% 36.7% 0.7% 7.3%NYSE Euronext Shareholder Right to Act by Written Consent Individual- Steiner, W. 79.1% 20.3% 0.6% 49.5% 12.7% 0.4% 17.1%Pfizer Inc. Shareholder Right to Act by Written Consent Individual- Steiner, W. 47.3% 51.7% 1.0% 32.9% 36.0% 0.7% 12.9%priceline.com Incorporated Shareholder Right to Act by Written Consent Individual- Chevedden, J. 46.0% 53.8% 0.2% 37.5% 43.8% 0.1% 5.1%R. R. Donnelley & Sons Company Shareholder Right to Act by Written Consent Individual- Steiner, W. 61.1% 38.5% 0.4% 50.3% 31.7% 0.3% 7.7%Raytheon Company Shareholder Right to Act by Written Consent Individual- Chevedden, R. 48.6% 50.6% 0.8% 38.8% 40.4% 0.7% 8.9%Sempra Energy Shareholder Right to Act by Written Consent Individual- Chevedden, R. 36.8% 62.3% 0.9% 26.5% 44.8% 0.7% 12.0%Staples, Inc. Shareholder Right to Act by Written Consent Individual- Chevedden, J. 60.3% 39.5% 0.2% 48.4% 31.7% 0.1% 6.1%Time Warner Inc. Shareholder Right to Act by Written Consent Individual- Steiner, W. 49.5% 50.2% 0.2% 40.1% 40.7% 0.2% 6.9%Whirlpool Corporation Shareholder Right to Act by Written Consent Individual- Steiner, W. 48.0% 51.8% 0.2% 37.8% 40.8% 0.2% 7.6%Amazon.com, Inc. Shareholder Right to Call Special Meeting Individual- McRitchie, J. 31.8% 68.1% 0.0% 26.1% 55.9% 0.0% 8.1%American Express Company Shareholder Right to Call Special Meeting Individual- Steiner, K. 36.6% 62.0% 1.4% 27.3% 46.3% 1.1% 9.6%AT&T Inc. Shareholder Right to Call Special Meeting Individual- Steiner, W. 42.8% 56.0% 1.3% 25.4% 33.2% 0.8% 17.4%AutoNation, Inc. Shareholder Right to Call Special Meeting Individual- Chevedden, J. 16.4% 83.5% 0.1% 15.1% 76.9% 0.1% 4.7%Becton, Dickinson and Company Shareholder Right to Call Special Meeting Individual- Steiner, K. 49.3% 50.2% 0.5% 35.5% 36.1% 0.4% 11.0%Boeing Company Shareholder Right to Call Special Meeting Individual- Chevedden, R. & V. 33.7% 65.3% 1.0% 24.3% 47.0% 0.7% 15.1%Caterpillar Inc. Shareholder Right to Call Special Meeting Individual- Chevedden, R. 49.6% 49.9% 0.6% 34.2% 34.4% 0.4% 16.8%Citigroup Inc. Shareholder Right to Call Special Meeting Individual- Steiner, W. 46.7% 45.4% 7.9% 25.4% 24.7% 4.3% 20.6%Colgate-Palmolive Company Shareholder Right to Call Special Meeting Individual- Chevedden, J. 40.7% 58.7% 0.7% 28.0% 40.4% 0.5% 12.4%Corning Incorporated Shareholder Right to Call Special Meeting RAM Trust 47.5% 52.1% 0.4% 36.5% 40.0% 0.3% 11.2%E. I. du Pont de Nemours and Co. Shareholder Right to Call Special Meeting Individual- Steiner, W. 39.1% 60.3% 0.6% 25.9% 39.9% 0.4% 15.8%Ford Motor Company Shareholder Right to Call Special Meeting Individual- Chevedden, J. 21.4% 78.2% 0.5% 15.4% 56.3% 0.3% 18.9%General Dynamics Corporation Shareholder Right to Call Special Meeting Individual- Chevedden, J. 38.6% 61.0% 0.4% 32.6% 51.4% 0.3% 6.7%Goldman Sachs Group, Inc. Shareholder Right to Call Special Meeting Individual- McRitchie, J. 41.9% 57.9% 0.2% 29.8% 41.2% 0.1% 10.2%Home Depot, Inc. Shareholder Right to Call Special Meeting Individual- Steiner, W. 52.6% 47.0% 0.4% 36.9% 33.0% 0.3% 15.0%Honeywell International Inc. Shareholder Right to Call Special Meeting Individual- Kreutzer, J. 38.9% 59.9% 1.2% 30.7% 47.2% 0.9% 9.9%Interpublic Group of Companies, Inc. Shareholder Right to Call Special Meeting Individual- Steiner, K. 37.0% 62.7% 0.4% 30.0% 50.8% 0.3% 4.0%NV Energy, Inc. Shareholder Right to Call Special Meeting Individual- Hoch, J. 60.3% 39.0% 0.7% 51.3% 33.2% 0.6% 7.5%NYSE Euronext Shareholder Right to Call Special Meeting Individual- Steiner, K. 73.3% 26.3% 0.4% 45.9% 16.4% 0.2% 17.1%Office Depot, Inc. Shareholder Right to Call Special Meeting Individual- Steiner, W. 37.2% 62.4% 0.3% 25.7% 43.1% 0.2% 11.2%Pep Boys-Manny, Moe & Jack Shareholder Right to Call Special Meeting Individual- Chevedden, J. 17.8% 82.1% 0.1% 14.2% 65.6% 0.1% 9.3%PepsiCo, Inc. Shareholder Right to Call Special Meeting Individual- Treumann, R. 44.9% 54.5% 0.6% 30.4% 37.0% 0.4% 14.9%Pfizer Inc. Shareholder Right to Call Special Meeting Individual- Chevedden, R. 41.2% 58.1% 0.7% 28.7% 40.5% 0.5% 12.9%PPL Corporation Shareholder Right to Call Special Meeting Individual- Rossi, E. 49.1% 49.7% 1.2% 37.0% 37.5% 0.9% 9.9%Stryker Corporation Shareholder Right to Call Special Meeting Individual- Cirulli, V. 30.2% 69.2% 0.6% 23.6% 54.1% 0.5% 10.7%Verizon Communications Inc. Shareholder Right to Call Special Meeting Individual- Steiner, K. 48.2% 50.5% 1.3% 30.2% 31.7% 0.8% 20.7%Walgreen Co. Shareholder Right to Call Special Meeting Individual- Chevedden, J. 44.1% 54.9% 1.0% 29.2% 36.4% 0.6% 16.7%Wal-Mart Stores, Inc. Shareholder Right to Call Special Meeting Individual- Steiner, W. 18.5% 81.3% 0.2% 15.5% 68.0% 0.2% 7.1%Wells Fargo & Company Shareholder Right to Call Special Meeting Individual- Holton, G. 43.4% 56.2% 0.4% 33.2% 43.0% 0.3% 9.2%WellPoint, Inc. Study Feasibility of Converting to Nonprofit Status Individual- Stone, R. 0.4% 98.7% 0.9% 0.3% 73.4% 0.7% 6.0%Avista Corporation Supermajority Provision- Eliminate or Reduce Individual- Armstrong, G. 65.2% 32.4% 2.4% 51.6% 25.6% 1.9% 11.0%Barnes Group Inc. Supermajority Provision- Eliminate or Reduce Individual- Armstrong, G. 64.2% 34.5% 1.3% 48.8% 26.2% 1.0% 7.4%Eastman Chemical Company Supermajority Provision- Eliminate or Reduce Individual- Chevedden, R. 64.6% 35.1% 0.3% 51.1% 27.7% 0.3% 7.0%eBay Inc. Supermajority Provision- Eliminate or Reduce Individual- Chevedden, J. 63.8% 35.9% 0.2% 53.3% 30.0% 0.2% 6.1%Ecolab Inc. Supermajority Provision- Eliminate or Reduce Individual- Chevedden, J. 66.9% 32.6% 0.4% 53.4% 26.1% 0.3% 6.8%Google Inc. Supermajority Provision- Eliminate or Reduce Individual- Chevedden, J. 9.8% 90.2% 0.0% 8.4% 78.0% 0.0% 3.4%Kellogg Company Supermajority Provision- Eliminate or Reduce Individual- Chevedden, J. 43.2% 56.4% 0.3% 34.1% 44.6% 0.3% 8.4%Limited Brands, Inc. Supermajority Provision- Eliminate or Reduce Individual- Chevedden, J. 68.2% 31.5% 0.3% 56.8% 26.2% 0.2% 6.0%Netflix, Inc. Supermajority Provision- Eliminate or Reduce Individual- Chevedden, J. 72.4% 27.2% 0.5% 49.5% 18.6% 0.3% 17.8%PACCAR Inc Supermajority Provision- Eliminate or Reduce Individual- Chevedden, J. 46.6% 52.1% 1.3% 40.4% 45.1% 1.1% 0.0%Prudential Financial, Inc. Supermajority Provision- Eliminate or Reduce Individual- Chevedden, J. 97.1% 2.0% 1.0% 64.9% 1.3% 0.6% 0.0%Southwest Airlines Co. Supermajority Provision- Eliminate or Reduce Individual- Chevedden, J. 65.1% 34.6% 0.3% 53.5% 28.4% 0.2% 10.6%Sprint Nextel Corporation Supermajority Provision- Eliminate or Reduce Individual- Steiner, K. 78.0% 21.6% 0.4% 59.0% 16.3% 0.3% 10.6%
* Issuer has implemented a form of majority voting.
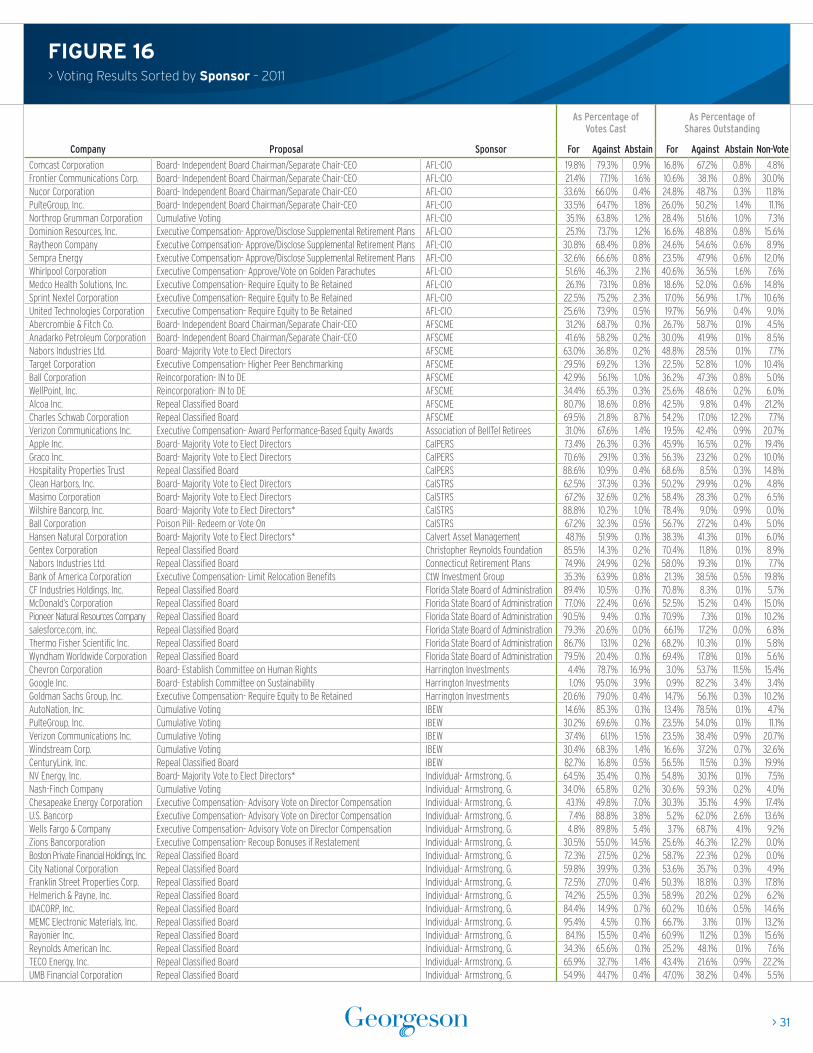
> 31
FIGURE 16> Voting Results Sorted by Sponsor – 2011
As Percentage of Votes Cast
As Percentage of Shares Outstanding
Company Proposal Sponsor For Against Abstain For Against Abstain Non-Vote
Comcast Corporation Board- Independent Board Chairman/Separate Chair-CEO AFL-CIO 19.8% 79.3% 0.9% 16.8% 67.2% 0.8% 4.8%Frontier Communications Corp. Board- Independent Board Chairman/Separate Chair-CEO AFL-CIO 21.4% 77.1% 1.6% 10.6% 38.1% 0.8% 30.0%Nucor Corporation Board- Independent Board Chairman/Separate Chair-CEO AFL-CIO 33.6% 66.0% 0.4% 24.8% 48.7% 0.3% 11.8%PulteGroup, Inc. Board- Independent Board Chairman/Separate Chair-CEO AFL-CIO 33.5% 64.7% 1.8% 26.0% 50.2% 1.4% 11.1%Northrop Grumman Corporation Cumulative Voting AFL-CIO 35.1% 63.8% 1.2% 28.4% 51.6% 1.0% 7.3%Dominion Resources, Inc. Executive Compensation- Approve/Disclose Supplemental Retirement Plans AFL-CIO 25.1% 73.7% 1.2% 16.6% 48.8% 0.8% 15.6%Raytheon Company Executive Compensation- Approve/Disclose Supplemental Retirement Plans AFL-CIO 30.8% 68.4% 0.8% 24.6% 54.6% 0.6% 8.9%Sempra Energy Executive Compensation- Approve/Disclose Supplemental Retirement Plans AFL-CIO 32.6% 66.6% 0.8% 23.5% 47.9% 0.6% 12.0%Whirlpool Corporation Executive Compensation- Approve/Vote on Golden Parachutes AFL-CIO 51.6% 46.3% 2.1% 40.6% 36.5% 1.6% 7.6%Medco Health Solutions, Inc. Executive Compensation- Require Equity to Be Retained AFL-CIO 26.1% 73.1% 0.8% 18.6% 52.0% 0.6% 14.8%Sprint Nextel Corporation Executive Compensation- Require Equity to Be Retained AFL-CIO 22.5% 75.2% 2.3% 17.0% 56.9% 1.7% 10.6%United Technologies Corporation Executive Compensation- Require Equity to Be Retained AFL-CIO 25.6% 73.9% 0.5% 19.7% 56.9% 0.4% 9.0%Abercrombie & Fitch Co. Board- Independent Board Chairman/Separate Chair-CEO AFSCME 31.2% 68.7% 0.1% 26.7% 58.7% 0.1% 4.5%Anadarko Petroleum Corporation Board- Independent Board Chairman/Separate Chair-CEO AFSCME 41.6% 58.2% 0.2% 30.0% 41.9% 0.1% 8.5%Nabors Industries Ltd. Board- Majority Vote to Elect Directors AFSCME 63.0% 36.8% 0.2% 48.8% 28.5% 0.1% 7.7%Target Corporation Executive Compensation- Higher Peer Benchmarking AFSCME 29.5% 69.2% 1.3% 22.5% 52.8% 1.0% 10.4%Ball Corporation Reincorporation- IN to DE AFSCME 42.9% 56.1% 1.0% 36.2% 47.3% 0.8% 5.0%WellPoint, Inc. Reincorporation- IN to DE AFSCME 34.4% 65.3% 0.3% 25.6% 48.6% 0.2% 6.0%Alcoa Inc. Repeal Classified Board AFSCME 80.7% 18.6% 0.8% 42.5% 9.8% 0.4% 21.2%Charles Schwab Corporation Repeal Classified Board AFSCME 69.5% 21.8% 8.7% 54.2% 17.0% 12.2% 7.7%Verizon Communications Inc. Executive Compensation- Award Performance-Based Equity Awards Association of BellTel Retirees 31.0% 67.6% 1.4% 19.5% 42.4% 0.9% 20.7%Apple Inc. Board- Majority Vote to Elect Directors CalPERS 73.4% 26.3% 0.3% 45.9% 16.5% 0.2% 19.4%Graco Inc. Board- Majority Vote to Elect Directors CalPERS 70.6% 29.1% 0.3% 56.3% 23.2% 0.2% 10.0%Hospitality Properties Trust Repeal Classified Board CalPERS 88.6% 10.9% 0.4% 68.6% 8.5% 0.3% 14.8%Clean Harbors, Inc. Board- Majority Vote to Elect Directors CalSTRS 62.5% 37.3% 0.3% 50.2% 29.9% 0.2% 4.8%Masimo Corporation Board- Majority Vote to Elect Directors CalSTRS 67.2% 32.6% 0.2% 58.4% 28.3% 0.2% 6.5%Wilshire Bancorp, Inc. Board- Majority Vote to Elect Directors* CalSTRS 88.8% 10.2% 1.0% 78.4% 9.0% 0.9% 0.0%Ball Corporation Poison Pill- Redeem or Vote On CalSTRS 67.2% 32.3% 0.5% 56.7% 27.2% 0.4% 5.0%Hansen Natural Corporation Board- Majority Vote to Elect Directors* Calvert Asset Management 48.1% 51.9% 0.1% 38.3% 41.3% 0.1% 6.0%Gentex Corporation Repeal Classified Board Christopher Reynolds Foundation 85.5% 14.3% 0.2% 70.4% 11.8% 0.1% 8.9%Nabors Industries Ltd. Repeal Classified Board Connecticut Retirement Plans 74.9% 24.9% 0.2% 58.0% 19.3% 0.1% 7.7%Bank of America Corporation Executive Compensation- Limit Relocation Benefits CtW Investment Group 35.3% 63.9% 0.8% 21.3% 38.5% 0.5% 19.8%CF Industries Holdings, Inc. Repeal Classified Board Florida State Board of Administration 89.4% 10.5% 0.1% 70.8% 8.3% 0.1% 5.7%McDonald’s Corporation Repeal Classified Board Florida State Board of Administration 77.0% 22.4% 0.6% 52.5% 15.2% 0.4% 15.0%Pioneer Natural Resources Company Repeal Classified Board Florida State Board of Administration 90.5% 9.4% 0.1% 70.9% 7.3% 0.1% 10.2%salesforce.com, inc. Repeal Classified Board Florida State Board of Administration 79.3% 20.6% 0.0% 66.1% 17.2% 0.0% 6.8%Thermo Fisher Scientific Inc. Repeal Classified Board Florida State Board of Administration 86.7% 13.1% 0.2% 68.2% 10.3% 0.1% 5.8%Wyndham Worldwide Corporation Repeal Classified Board Florida State Board of Administration 79.5% 20.4% 0.1% 69.4% 17.8% 0.1% 5.6%Chevron Corporation Board- Establish Committee on Human Rights Harrington Investments 4.4% 78.7% 16.9% 3.0% 53.7% 11.5% 15.4%Google Inc. Board- Establish Committee on Sustainability Harrington Investments 1.0% 95.0% 3.9% 0.9% 82.2% 3.4% 3.4%Goldman Sachs Group, Inc. Executive Compensation- Require Equity to Be Retained Harrington Investments 20.6% 79.0% 0.4% 14.7% 56.1% 0.3% 10.2%AutoNation, Inc. Cumulative Voting IBEW 14.6% 85.3% 0.1% 13.4% 78.5% 0.1% 4.7%PulteGroup, Inc. Cumulative Voting IBEW 30.2% 69.6% 0.1% 23.5% 54.0% 0.1% 11.1%Verizon Communications Inc. Cumulative Voting IBEW 37.4% 61.1% 1.5% 23.5% 38.4% 0.9% 20.7%Windstream Corp. Cumulative Voting IBEW 30.4% 68.3% 1.4% 16.6% 37.2% 0.7% 32.6%CenturyLink, Inc. Repeal Classified Board IBEW 82.7% 16.8% 0.5% 56.5% 11.5% 0.3% 19.9%NV Energy, Inc. Board- Majority Vote to Elect Directors* Individual- Armstrong, G. 64.5% 35.4% 0.1% 54.8% 30.1% 0.1% 7.5%Nash-Finch Company Cumulative Voting Individual- Armstrong, G. 34.0% 65.8% 0.2% 30.6% 59.3% 0.2% 4.0%Chesapeake Energy Corporation Executive Compensation- Advisory Vote on Director Compensation Individual- Armstrong, G. 43.1% 49.8% 7.0% 30.3% 35.1% 4.9% 17.4%U.S. Bancorp Executive Compensation- Advisory Vote on Director Compensation Individual- Armstrong, G. 7.4% 88.8% 3.8% 5.2% 62.0% 2.6% 13.6%Wells Fargo & Company Executive Compensation- Advisory Vote on Director Compensation Individual- Armstrong, G. 4.8% 89.8% 5.4% 3.7% 68.7% 4.1% 9.2%Zions Bancorporation Executive Compensation- Recoup Bonuses if Restatement Individual- Armstrong, G. 30.5% 55.0% 14.5% 25.6% 46.3% 12.2% 0.0%Boston Private Financial Holdings, Inc. Repeal Classified Board Individual- Armstrong, G. 72.3% 27.5% 0.2% 58.7% 22.3% 0.2% 0.0%City National Corporation Repeal Classified Board Individual- Armstrong, G. 59.8% 39.9% 0.3% 53.6% 35.7% 0.3% 4.9%Franklin Street Properties Corp. Repeal Classified Board Individual- Armstrong, G. 72.5% 27.0% 0.4% 50.3% 18.8% 0.3% 17.8%Helmerich & Payne, Inc. Repeal Classified Board Individual- Armstrong, G. 74.2% 25.5% 0.3% 58.9% 20.2% 0.2% 6.2%IDACORP, Inc. Repeal Classified Board Individual- Armstrong, G. 84.4% 14.9% 0.7% 60.2% 10.6% 0.5% 14.6%MEMC Electronic Materials, Inc. Repeal Classified Board Individual- Armstrong, G. 95.4% 4.5% 0.1% 66.7% 3.1% 0.1% 13.2%Rayonier Inc. Repeal Classified Board Individual- Armstrong, G. 84.1% 15.5% 0.4% 60.9% 11.2% 0.3% 15.6%Reynolds American Inc. Repeal Classified Board Individual- Armstrong, G. 34.3% 65.6% 0.1% 25.2% 48.1% 0.1% 7.6%TECO Energy, Inc. Repeal Classified Board Individual- Armstrong, G. 65.9% 32.7% 1.4% 43.4% 21.6% 0.9% 22.2%UMB Financial Corporation Repeal Classified Board Individual- Armstrong, G. 54.9% 44.7% 0.4% 47.0% 38.2% 0.4% 5.5%

> 32
FIGURE 16> Voting Results Sorted by Sponsor – 2011
As Percentage of Votes Cast
As Percentage of Shares Outstanding
Company Proposal Sponsor For Against Abstain For Against Abstain Non-Vote
Vornado Realty Trust Repeal Classified Board Individual- Armstrong, G. 80.2% 19.7% 0.1% 67.9% 16.7% 0.1% 5.5%Vulcan Materials Company Repeal Classified Board Individual- Armstrong, G. 65.0% 34.8% 0.3% 48.9% 26.2% 0.2% 10.7%Webster Financial Corporation Repeal Classified Board Individual- Armstrong, G. 66.0% 33.6% 0.4% 55.7% 28.4% 0.3% 8.9%Avista Corporation Supermajority Provision- Eliminate or Reduce Individual- Armstrong, G. 65.2% 32.4% 2.4% 51.6% 25.6% 1.9% 11.0%Barnes Group Inc. Supermajority Provision- Eliminate or Reduce Individual- Armstrong, G. 64.2% 34.5% 1.3% 48.8% 26.2% 1.0% 7.4%JPMorgan Chase & Co. Board- Independent Board Chairman/Separate Chair-CEO Individual- Chevedden, J. 11.9% 86.7% 1.4% 8.9% 64.8% 1.1% 9.0%Union Pacific Corporation Board- Independent Board Chairman/Separate Chair-CEO Individual- Chevedden, J. 21.8% 77.9% 0.3% 17.3% 61.9% 0.2% 9.7%Caterpillar Inc. Executive Compensation- Require Equity to Be Retained Individual- Chevedden, J. 21.9% 77.3% 0.8% 15.1% 53.4% 0.5% 16.8%Raytheon Company Executive Compensation- Require Equity to Be Retained Individual- Chevedden, J. 24.7% 74.4% 0.9% 19.7% 59.4% 0.7% 8.9%Newell Rubbermaid Inc. Repeal Classified Board Individual- Chevedden, J. 87.9% 11.8% 0.2% 70.1% 9.4% 0.2% 6.9%Boeing Company Shareholder Right to Act by Written Consent Individual- Chevedden, J. 31.3% 67.5% 1.2% 22.5% 48.6% 0.9% 15.1%Devon Energy Corporation Shareholder Right to Act by Written Consent Individual- Chevedden, J. 60.5% 39.2% 0.3% 47.6% 30.8% 0.2% 9.1%Dominion Resources, Inc. Shareholder Right to Act by Written Consent Individual- Chevedden, J. 45.8% 52.9% 1.3% 30.3% 35.0% 0.8% 15.6%Honeywell International Inc. Shareholder Right to Act by Written Consent Individual- Chevedden, J. 43.2% 56.0% 0.8% 34.1% 44.1% 0.6% 9.9%JPMorgan Chase & Co. Shareholder Right to Act by Written Consent Individual- Chevedden, J. 49.0% 50.1% 0.9% 36.6% 37.5% 0.6% 9.0%Kohl’s Corporation Shareholder Right to Act by Written Consent Individual- Chevedden, J. 22.9% 76.9% 0.2% 18.9% 63.4% 0.2% 4.8%Lockheed Martin Corporation Shareholder Right to Act by Written Consent Individual- Chevedden, J. 36.5% 62.3% 1.2% 30.8% 52.6% 1.0% 7.3%Northrop Grumman Corporation Shareholder Right to Act by Written Consent Individual- Chevedden, J. 53.7% 45.3% 0.9% 43.5% 36.7% 0.7% 7.3%priceline.com Incorporated Shareholder Right to Act by Written Consent Individual- Chevedden, J. 46.0% 53.8% 0.2% 37.5% 43.8% 0.1% 5.1%Staples, Inc. Shareholder Right to Act by Written Consent Individual- Chevedden, J. 60.3% 39.5% 0.2% 48.4% 31.7% 0.1% 6.1%AutoNation, Inc. Shareholder Right to Call Special Meeting Individual- Chevedden, J. 16.4% 83.5% 0.1% 15.1% 76.9% 0.1% 4.7%Colgate-Palmolive Company Shareholder Right to Call Special Meeting Individual- Chevedden, J. 40.7% 58.7% 0.7% 28.0% 40.4% 0.5% 12.4%Ford Motor Company Shareholder Right to Call Special Meeting Individual- Chevedden, J. 21.4% 78.2% 0.5% 15.4% 56.3% 0.3% 18.9%General Dynamics Corporation Shareholder Right to Call Special Meeting Individual- Chevedden, J. 38.6% 61.0% 0.4% 32.6% 51.4% 0.3% 6.7%Pep Boys-Manny, Moe & Jack Shareholder Right to Call Special Meeting Individual- Chevedden, J. 17.8% 82.1% 0.1% 14.2% 65.6% 0.1% 9.3%Walgreen Co. Shareholder Right to Call Special Meeting Individual- Chevedden, J. 44.1% 54.9% 1.0% 29.2% 36.4% 0.6% 16.7%eBay Inc. Supermajority Provision- Eliminate or Reduce Individual- Chevedden, J. 63.8% 35.9% 0.2% 53.3% 30.0% 0.2% 6.1%Ecolab Inc. Supermajority Provision- Eliminate or Reduce Individual- Chevedden, J. 66.9% 32.6% 0.4% 53.4% 26.1% 0.3% 6.8%Google Inc. Supermajority Provision- Eliminate or Reduce Individual- Chevedden, J. 9.8% 90.2% 0.0% 8.4% 78.0% 0.0% 3.4%Kellogg Company Supermajority Provision- Eliminate or Reduce Individual- Chevedden, J. 43.2% 56.4% 0.3% 34.1% 44.6% 0.3% 8.4%Limited Brands, Inc. Supermajority Provision- Eliminate or Reduce Individual- Chevedden, J. 68.2% 31.5% 0.3% 56.8% 26.2% 0.2% 6.0%Netflix, Inc. Supermajority Provision- Eliminate or Reduce Individual- Chevedden, J. 72.4% 27.2% 0.5% 49.5% 18.6% 0.3% 17.8%PACCAR Inc Supermajority Provision- Eliminate or Reduce Individual- Chevedden, J. 46.6% 52.1% 1.3% 40.4% 45.1% 1.1% 0.0%Prudential Financial, Inc. Supermajority Provision- Eliminate or Reduce Individual- Chevedden, J. 97.1% 2.0% 1.0% 64.9% 1.3% 0.6% 0.0%Southwest Airlines Co. Supermajority Provision- Eliminate or Reduce Individual- Chevedden, J. 65.1% 34.6% 0.3% 53.5% 28.4% 0.2% 10.6%PG&E Corporation Board- Independent Board Chairman/Separate Chair-CEO Individual- Chevedden, R. 29.8% 69.8% 0.4% 19.4% 45.4% 0.2% 10.9%FirstEnergy Corp. Shareholder Right to Act by Written Consent Individual- Chevedden, R. 44.7% 53.8% 1.5% 34.4% 41.3% 1.2% 10.8%NiSource Inc. Shareholder Right to Act by Written Consent Individual- Chevedden, R. 42.3% 56.8% 0.9% 30.2% 40.6% 0.6% 10.5%Raytheon Company Shareholder Right to Act by Written Consent Individual- Chevedden, R. 48.6% 50.6% 0.8% 38.8% 40.4% 0.7% 8.9%Sempra Energy Shareholder Right to Act by Written Consent Individual- Chevedden, R. 36.8% 62.3% 0.9% 26.5% 44.8% 0.7% 12.0%Caterpillar Inc. Shareholder Right to Call Special Meeting Individual- Chevedden, R. 49.6% 49.9% 0.6% 34.2% 34.4% 0.4% 16.8%Pfizer Inc. Shareholder Right to Call Special Meeting Individual- Chevedden, R. 41.2% 58.1% 0.7% 28.7% 40.5% 0.5% 12.9%Eastman Chemical Company Supermajority Provision- Eliminate or Reduce Individual- Chevedden, R. 64.6% 35.1% 0.3% 51.1% 27.7% 0.3% 7.0%Ford Motor Company Eliminate Dual-Class Voting Rights Individual- Chevedden, R. & V. 31.4% 68.1% 0.5% 22.6% 49.1% 0.4% 18.9%Boeing Company Shareholder Right to Call Special Meeting Individual- Chevedden, R. & V. 33.7% 65.3% 1.0% 24.3% 47.0% 0.7% 15.1%Stryker Corporation Shareholder Right to Call Special Meeting Individual- Cirulli, V. 30.2% 69.2% 0.6% 23.6% 54.1% 0.5% 10.7%Aetna Inc. Cumulative Voting Individual- Davis, E. 37.6% 62.0% 0.4% 30.6% 50.4% 0.3% 5.5%American Express Company Cumulative Voting Individual- Davis, E. 26.3% 72.3% 1.4% 19.6% 53.9% 1.0% 9.6%Bank of New York Mellon Corporation Cumulative Voting Individual- Davis, E. 30.0% 69.3% 0.7% 23.2% 53.8% 0.5% 6.9%Becton, Dickinson and Company Cumulative Voting Individual- Davis, E. 36.5% 63.0% 0.5% 26.2% 45.3% 0.4% 11.0%Comcast Corporation Cumulative Voting Individual- Davis, E. 27.2% 72.6% 0.2% 23.1% 61.6% 0.1% 4.8%General Electric Company Cumulative Voting Individual- Davis, E. 26.6% 72.4% 1.1% 15.4% 41.9% 0.6% 19.9%Goldman Sachs Group, Inc. Cumulative Voting Individual- Davis, E. 25.6% 74.2% 0.2% 18.2% 52.8% 0.1% 10.2%Home Depot, Inc. Cumulative Voting Individual- Davis, E. 41.4% 58.2% 0.4% 29.0% 40.8% 0.3% 15.0%International Business Machines Corp. Cumulative Voting Individual- Davis, E. 27.6% 71.3% 1.0% 17.8% 45.9% 0.7% 14.5%Loews Corporation Cumulative Voting Individual- Davis, E. 78.3% 21.4% 0.3% 65.5% 17.9% 0.2% 5.1%Safeway Inc. Cumulative Voting Individual- Davis, E. 27.6% 71.3% 1.1% 22.4% 57.9% 0.9% 4.2%Saks Incorporated Cumulative Voting Individual- Davis, E. 21.2% 78.7% 0.1% 15.3% 56.7% 0.1% 5.7%WGL Holdings, Inc. Cumulative Voting Individual- Davis, E. 35.6% 62.9% 1.5% 24.6% 43.4% 1.0% 19.7%Bristol-Myers Squibb Company Executive Compensation- Greater Disclosure Individual- Davis, E. 7.4% 91.8% 0.8% 5.0% 62.7% 0.5% 17.2%Consolidated Edison, Inc. Executive Compensation- Greater Disclosure Individual- Davis, E. 15.4% 82.4% 2.1% 8.2% 43.9% 1.1% 29.5%General Electric Company Executive Compensation- Withdraw Awards Individual- Hepburn, J. 7.3% 91.7% 1.0% 4.2% 53.0% 0.6% 19.9%

> 33
FIGURE 16> Voting Results Sorted by Sponsor – 2011
As Percentage of Votes Cast
As Percentage of Shares Outstanding
Company Proposal Sponsor For Against Abstain For Against Abstain Non-Vote
NV Energy, Inc. Shareholder Right to Call Special Meeting Individual- Hoch, J. 60.3% 39.0% 0.7% 51.3% 33.2% 0.6% 7.5%Wells Fargo & Company Shareholder Right to Call Special Meeting Individual- Holton, G. 43.4% 56.2% 0.4% 33.2% 43.0% 0.3% 9.2%Honeywell International Inc. Shareholder Right to Call Special Meeting Individual- Kreutzer, J. 38.9% 59.9% 1.2% 30.7% 47.2% 0.9% 9.9%Whole Foods Market, Inc. Board- Independent Board Chairman/Separate Chair-CEO Individual- McRitchie, J. 33.7% 66.2% 0.1% 25.8% 50.6% 0.1% 11.8%Amazon.com, Inc. Shareholder Right to Call Special Meeting Individual- McRitchie, J. 31.8% 68.1% 0.0% 26.1% 55.9% 0.0% 8.1%Goldman Sachs Group, Inc. Shareholder Right to Call Special Meeting Individual- McRitchie, J. 41.9% 57.9% 0.2% 29.8% 41.2% 0.1% 10.2%PPL Corporation Shareholder Right to Call Special Meeting Individual- Rossi, E. 49.1% 49.7% 1.2% 37.0% 37.5% 0.9% 9.9%Telephone and Data Systems, Inc. Eliminate Dual-Class Voting Rights Individual- Steiner, K. 34.2% 65.6% 0.2% 30.8% 59.1% 0.2% 2.1%American International Group, Inc. Hedge/Derivative Trading Policy and Procedure Individual- Steiner, K. 12.7% 86.4% 0.9% 12.1% 82.6% 0.9% 1.9%Allstate Corporation Shareholder Right to Act by Written Consent Individual- Steiner, K. 52.0% 47.0% 1.0% 39.8% 35.9% 0.7% 9.3%AT&T Inc. Shareholder Right to Act by Written Consent Individual- Steiner, K. 53.2% 45.0% 1.8% 31.6% 26.7% 1.1% 17.4%Bank of America Corporation Shareholder Right to Act by Written Consent Individual- Steiner, K. 47.1% 51.9% 1.0% 28.4% 31.3% 0.6% 19.8%Bristol-Myers Squibb Company Shareholder Right to Act by Written Consent Individual- Steiner, K. 38.2% 60.6% 1.2% 26.1% 41.4% 0.8% 17.2%DaVita Inc. Shareholder Right to Act by Written Consent Individual- Steiner, K. 28.7% 71.1% 0.1% 24.4% 60.3% 0.1% 4.2%Dow Chemical Company Shareholder Right to Act by Written Consent Individual- Steiner, K. 41.2% 56.9% 1.9% 32.3% 44.7% 1.5% 9.6%Liz Claiborne, Inc. Shareholder Right to Act by Written Consent Individual- Steiner, K. 65.4% 32.0% 2.6% 49.9% 24.4% 2.0% 12.8%McGraw-Hill Companies, Inc. Shareholder Right to Act by Written Consent Individual- Steiner, K. 46.4% 53.2% 0.4% 38.2% 43.9% 0.3% 4.8%American Express Company Shareholder Right to Call Special Meeting Individual- Steiner, K. 36.6% 62.0% 1.4% 27.3% 46.3% 1.1% 9.6%Becton, Dickinson and Company Shareholder Right to Call Special Meeting Individual- Steiner, K. 49.3% 50.2% 0.5% 35.5% 36.1% 0.4% 11.0%Interpublic Group of Companies, Inc. Shareholder Right to Call Special Meeting Individual- Steiner, K. 37.0% 62.7% 0.4% 30.0% 50.8% 0.3% 4.0%NYSE Euronext Shareholder Right to Call Special Meeting Individual- Steiner, K. 73.3% 26.3% 0.4% 45.9% 16.4% 0.2% 17.1%Verizon Communications Inc. Shareholder Right to Call Special Meeting Individual- Steiner, K. 48.2% 50.5% 1.3% 30.2% 31.7% 0.8% 20.7%Sprint Nextel Corporation Supermajority Provision- Eliminate or Reduce Individual- Steiner, K. 78.0% 21.6% 0.4% 59.0% 16.3% 0.3% 10.6%NYSE Euronext Shareholder Right to Act by Written Consent Individual- Steiner, W. 79.1% 20.3% 0.6% 49.5% 12.7% 0.4% 17.1%Alcoa Inc. Shareholder Right to Act by Written Consent Individual- Steiner, W. 58.6% 40.5% 0.9% 30.8% 21.3% 0.5% 21.2%Amgen Inc. Shareholder Right to Act by Written Consent Individual- Steiner, W. 50.2% 48.8% 1.0% 38.1% 37.0% 0.8% 10.4%CVS Caremark Corporation Shareholder Right to Act by Written Consent Individual- Steiner, W. 55.7% 42.3% 2.0% 43.9% 33.3% 1.6% 7.3%International Paper Company Shareholder Right to Act by Written Consent Individual- Steiner, W. 52.5% 46.7% 0.8% 38.3% 34.1% 0.6% 9.4%Marsh & McLennan Companies, Inc. Shareholder Right to Act by Written Consent Individual- Steiner, W. 38.2% 61.0% 0.8% 31.2% 49.9% 0.7% 6.9%Pfizer Inc. Shareholder Right to Act by Written Consent Individual- Steiner, W. 47.3% 51.7% 1.0% 32.9% 36.0% 0.7% 12.9%R. R. Donnelley & Sons Company Shareholder Right to Act by Written Consent Individual- Steiner, W. 61.1% 38.5% 0.4% 50.3% 31.7% 0.3% 7.7%Time Warner Inc. Shareholder Right to Act by Written Consent Individual- Steiner, W. 49.5% 50.2% 0.2% 40.1% 40.7% 0.2% 6.9%Whirlpool Corporation Shareholder Right to Act by Written Consent Individual- Steiner, W. 48.0% 51.8% 0.2% 37.8% 40.8% 0.2% 7.6%AT&T Inc. Shareholder Right to Call Special Meeting Individual- Steiner, W. 42.8% 56.0% 1.3% 25.4% 33.2% 0.8% 17.4%Citigroup Inc. Shareholder Right to Call Special Meeting Individual- Steiner, W. 46.7% 45.4% 7.9% 25.4% 24.7% 4.3% 20.6%E. I. du Pont de Nemours and Co. Shareholder Right to Call Special Meeting Individual- Steiner, W. 39.1% 60.3% 0.6% 25.9% 39.9% 0.4% 15.8%Home Depot, Inc. Shareholder Right to Call Special Meeting Individual- Steiner, W. 52.6% 47.0% 0.4% 36.9% 33.0% 0.3% 15.0%Office Depot, Inc. Shareholder Right to Call Special Meeting Individual- Steiner, W. 37.2% 62.4% 0.3% 25.7% 43.1% 0.2% 11.2%Wal-Mart Stores, Inc. Shareholder Right to Call Special Meeting Individual- Steiner, W. 18.5% 81.3% 0.2% 15.5% 68.0% 0.2% 7.1%WellPoint, Inc. Study Feasibility of Converting to Nonprofit Status Individual- Stone, R. 0.4% 98.7% 0.9% 0.3% 73.4% 0.7% 6.0%PepsiCo, Inc. Shareholder Right to Call Special Meeting Individual- Treumann, R. 44.9% 54.5% 0.6% 30.4% 37.0% 0.4% 14.9%NV Energy, Inc. Executive Compensation- Require Equity to Be Retained Individual- Weisshaar, R. 24.9% 74.9% 0.3% 21.1% 63.6% 0.2% 7.5%Apple Inc. Board- Adopt and Disclose CEO Succession Planning Guidelines Laborers 29.9% 69.5% 0.6% 18.7% 43.4% 0.4% 19.4%Sonic Corp. Board- Independent Board Chairman/Separate Chair-CEO Laborers 36.4% 62.3% 1.3% 30.7% 52.6% 1.1% 7.6%Vornado Realty Trust Board- Independent Board Chairman/Separate Chair-CEO Laborers 50.6% 49.2% 0.1% 42.9% 41.7% 0.1% 5.5%Chevron Corporation Executive Compensation- Add Sustainability Performance Metrics Laborers 5.3% 89.4% 5.3% 3.6% 60.9% 3.6% 15.4%PulteGroup, Inc. Executive Compensation- Award Performance-Based Equity Awards Laborers 35.6% 62.6% 1.8% 27.6% 48.6% 1.4% 11.1%Walgreen Co. Executive Compensation- Award Performance-Based Equity Awards Laborers 42.4% 57.1% 0.5% 28.1% 37.9% 0.4% 16.7%Equity Residential Executive Compensation- Link Pay to Social Criteria Laborers 3.6% 94.0% 2.3% 3.2% 82.7% 2.0% 3.7%Lowe’s Companies, Inc. Executive Compensation- Link Pay to Social Criteria Laborers 4.2% 91.7% 4.1% 3.2% 70.8% 3.2% 12.1%Sempra Energy Executive Compensation- Link Pay to Social Criteria Laborers 6.0% 81.3% 12.6% 4.3% 58.5% 9.1% 12.0%Moody’s Corporation Board- Independent Board Chairman/Separate Chair-CEO Legal & General 56.5% 43.3% 0.3% 43.7% 33.5% 0.2% 5.4%Whole Foods Market, Inc. Board- Amend Bylaws to Allow Director Removal With or Without Cause LongView 47.0% 48.1% 4.8% 36.0% 36.8% 3.7% 11.8%Palomar Medical Technologies, Inc. Board- Majority Vote to Elect Directors LongView 50.7% 48.9% 0.5% 33.1% 31.9% 0.3% 25.2%Caterpillar Inc. Executive Compensation- Approve or Limit Executive Death Benefits LongView 12.6% 86.7% 0.8% 8.7% 59.8% 0.5% 16.8%Harley-Davidson, Inc. Executive Compensation- Approve or Limit Executive Death Benefits LongView 26.3% 72.7% 1.0% 19.7% 54.5% 0.7% 5.2%Anadarko Petroleum Corporation Exec. Comp.- Eliminate Accelerated Vesting in Termination/Change of Control LongView 36.5% 63.0% 0.5% 26.3% 45.3% 0.3% 8.5%EOG Resources, Inc. Exec. Comp.- Eliminate Accelerated Vesting in Termination/Change of Control LongView 42.1% 57.1% 0.7% 36.3% 49.2% 0.6% 3.1%Sunoco, Inc. Exec. Comp.- Eliminate Accelerated Vesting in Termination/Change of Control LongView 43.6% 52.7% 3.7% 29.5% 35.8% 2.5% 15.1%Dean Foods Company Executive Compensation- Establish Antitax Gross-up Policy LongView 42.3% 57.2% 0.6% 30.6% 41.4% 0.4% 13.7%Bank of America Corporation Hedge/Derivative Trading Policy and Procedure Missionary Oblates of Mary Immaculate 30.8% 60.8% 8.4% 18.6% 36.6% 5.1% 19.8%Goldman Sachs Group, Inc. Executive Compensation- Review Nathan Cummings Foundation 4.1% 92.2% 3.7% 2.9% 65.6% 2.6% 10.2%

> 34
FIGURE 16> Voting Results Sorted by Sponsor – 2011
As Percentage of Votes Cast
As Percentage of Shares Outstanding
Company Proposal Sponsor For Against Abstain For Against Abstain Non-Vote
C.H. Robinson Worldwide, Inc. Repeal Classified Board Nathan Cummings Foundation 71.3% 28.3% 0.3% 51.2% 20.3% 0.2% 16.3%Hudson City Bancorp, Inc. Repeal Classified Board Nathan Cummings Foundation 75.9% 22.3% 1.8% 49.8% 14.6% 1.2% 15.0%Western Union Company Repeal Classified Board Nathan Cummings Foundation 87.3% 12.7% 0.1% 72.5% 10.5% 0.1% 5.2%Google Inc. Board- Report on Conflict of Interest Policy National Center for Public Policy Research 0.4% 96.0% 3.5% 0.4% 83.0% 3.1% 3.4%Philip Morris International Inc. Board- Independent Board Chairman/Separate Chair-CEO New York City Pension Funds 23.0% 76.7% 0.3% 16.2% 53.8% 0.2% 14.5%AmSurg Corp. Board- Majority Vote to Elect Directors New York City Pension Funds 73.5% 26.3% 0.2% 66.7% 23.8% 0.2% 3.0%Tessera Technologies, Inc. Board- Majority Vote to Elect Directors New York City Pension Funds 78.3% 21.7% 0.0% 65.7% 18.2% 0.0% 9.4%Superior Industries International, Inc. Board- Majority Vote to Elect Directors* New York City Pension Funds 44.5% 55.3% 0.1% 39.2% 48.7% 0.1% 0.0%Chevron Corporation Board- Nominate Director with Environmental Expertise New York City Pension Funds 24.1% 73.0% 2.9% 16.4% 49.8% 2.0% 15.4%Occidental Petroleum Corporation Board- Nominate Director with Environmental Expertise New York City Pension Funds 4.5% 81.9% 13.6% 3.6% 65.7% 10.9% 6.2%Juniper Networks, Inc. Repeal Classified Board New York City Pension Funds 97.2% 2.4% 0.4% 78.0% 1.9% 0.3% 9.0%Freeport-McMoRan Copper & Gold Inc. Board- Nominate Director with Environmental Expertise New York State Pension Funds 30.0% 67.3% 2.7% 20.3% 45.7% 1.8% 10.8%Dominion Resources, Inc. Board- Independent Board Chairman/Separate Chair-CEO Not Named 30.5% 68.5% 1.0% 20.2% 45.3% 0.7% 15.6%PPL Corporation Board- Majority Vote to Elect Directors* Plumbers and Pipefitters 42.6% 56.1% 1.3% 32.1% 42.3% 1.0% 9.9%Exxon Mobil Corporation Board- Independent Board Chairman/Separate Chair-CEO RAM Trust 31.0% 67.9% 1.2% 19.7% 43.1% 0.7% 17.9%Corning Incorporated Shareholder Right to Call Special Meeting RAM Trust 47.5% 52.1% 0.4% 36.5% 40.0% 0.3% 11.2%Caterpillar Inc. Board- Independent Board Chairman/Separate Chair-CEO SEIU 17.7% 81.8% 0.5% 12.2% 56.4% 0.3% 16.8%WellPoint, Inc. Board- Independent Board Chairman/Separate Chair-CEO SEIU 44.0% 55.9% 0.1% 32.7% 41.6% 0.1% 6.0%Wells Fargo & Company Board- Independent Board Chairman/Separate Chair-CEO SEIU 29.8% 69.8% 0.4% 22.8% 53.5% 0.3% 9.2%Bank of America Corporation Executive Compensation- Recoup Bonuses if Restatement SEIU 35.2% 64.0% 0.9% 21.2% 38.6% 0.5% 19.8%Boeing Company Board- Independent Board Chairman/Separate Chair-CEO Sheet Metal Workers 35.0% 64.2% 0.9% 25.2% 46.2% 0.6% 15.1%FirstEnergy Corp. Board- Majority Vote to Elect Directors* Sheet Metal Workers 42.6% 56.3% 1.1% 32.7% 43.3% 0.8% 10.8%Citigroup Inc. Report on Risk Management Structure Sisters of Charity of St. Elizabeth 6.9% 77.1% 16.1% 3.7% 41.9% 8.7% 20.6%Old Dominion Freight Line, Inc. Board- Independent Board Chairman/Separate Chair-CEO Teamsters 28.4% 71.6% 0.0% 26.5% 67.0% 0.0% 2.3%SkyWest, Inc. Board- Majority Vote to Elect Directors Teamsters 77.5% 22.4% 0.1% 67.4% 19.5% 0.1% 7.4%Republic Services, Inc. Executive Compensation- Approve or Limit Executive Death Benefits Teamsters 43.8% 53.4% 2.9% 36.8% 44.8% 2.4% 5.1%Coca-Cola Enterprises, Inc. Executive Compensation- Approve/Vote on Golden Parachutes Teamsters 37.3% 61.8% 0.8% 31.2% 51.6% 0.7% 5.5%Gentex Corporation Board- Majority Vote to Elect Directors Tides Foundation 80.4% 17.0% 2.6% 63.1% 13.3% 2.1% 12.8%C.R. Bard, Inc. Repeal Classified Board Tides Foundation 79.1% 20.1% 0.8% 65.6% 16.7% 0.7% 6.4%St. Jude Medical, Inc. Repeal Classified Board Tides Foundation 93.9% 5.5% 0.6% 72.1% 4.2% 0.5% 11.2%Kohl’s Corporation Board- Adopt and Disclose CEO Succession Planning Guidelines Trowel Trades 23.8% 76.0% 0.1% 19.7% 62.7% 0.1% 4.8%Bank of America Corporation Cumulative Voting Trowel Trades 36.3% 63.1% 0.6% 21.9% 38.1% 0.3% 19.8%Equity Residential Cumulative Voting Trowel Trades 34.5% 65.4% 0.1% 30.3% 57.6% 0.1% 3.7%Wells Fargo & Company Cumulative Voting Trowel Trades 28.7% 70.4% 0.9% 22.0% 53.9% 0.7% 9.2%Lowe’s Companies, Inc. Executive Compensation- Approve/Vote on Golden Parachutes Trowel Trades 57.5% 42.0% 0.4% 44.4% 32.5% 0.3% 12.1%General Electric Company Executive Compensation- Award Performance-Based Equity Awards Trowel Trades 29.2% 69.7% 1.1% 16.9% 40.3% 0.6% 19.9%BB&T Corporation Board- Majority Vote to Elect Directors UBCJA 57.3% 41.6% 1.1% 38.0% 27.5% 0.7% 14.6%Lorillard, Inc. Board- Majority Vote to Elect Directors UBCJA 86.5% 12.5% 0.9% 62.1% 9.0% 0.7% 9.1%PACCAR Inc Board- Majority Vote to Elect Directors UBCJA 43.9% 55.3% 0.8% 38.0% 47.9% 0.7% 0.0%Pioneer Natural Resources Company Board- Majority Vote to Elect Directors UBCJA 77.4% 22.4% 0.1% 60.7% 17.6% 0.1% 10.2%Vornado Realty Trust Board- Majority Vote to Elect Directors UBCJA 79.4% 20.5% 0.1% 67.2% 17.4% 0.1% 5.5%Baker Hughes Incorporated Board- Majority Vote to Elect Directors* UBCJA 45.4% 53.1% 1.5% 35.1% 41.0% 1.2% 6.4%Caterpillar Inc. Board- Majority Vote to Elect Directors* UBCJA 35.5% 64.0% 0.5% 24.5% 44.1% 0.4% 16.8%Duke Energy Corporation Board- Majority Vote to Elect Directors* UBCJA 37.0% 60.9% 2.1% 20.9% 34.4% 1.2% 27.8%Kellogg Company Board- Majority Vote to Elect Directors* UBCJA 27.7% 72.0% 0.4% 21.8% 56.8% 0.3% 8.4%Nucor Corporation Board- Majority Vote to Elect Directors* UBCJA 33.9% 65.7% 0.4% 25.0% 48.5% 0.3% 11.8%QUALCOMM Incorporated Board- Majority Vote to Elect Directors* UBCJA 51.4% 48.3% 0.3% 38.3% 36.0% 0.2% 12.0%Sherwin-Williams Company Board- Majority Vote to Elect Directors* UBCJA 38.9% 59.7% 1.3% 30.7% 47.1% 1.0% 6.5%Spectra Energy Corp Board- Majority Vote to Elect Directors* UBCJA 47.1% 51.9% 1.0% 31.3% 34.4% 0.7% 16.5%Vulcan Materials Company Board- Majority Vote to Elect Directors* UBCJA 44.0% 55.8% 0.2% 33.1% 42.0% 0.2% 10.7%Walt Disney Company Executive Compensation- Prohibit Re-Testing in Long Term Incentive Plans Unite Here 29.2% 70.2% 0.6% 21.9% 52.6% 0.5% 11.1%Aetna Inc. Board- Independent Board Chairman/Separate Chair-CEO United Association S&P 500 Index Fund 51.2% 48.4% 0.4% 41.7% 39.3% 0.3% 5.5%Cliffs Natural Resources Inc. Board- Majority Vote to Elect Directors* United Association S&P 500 Index Fund 56.0% 43.6% 0.3% 41.4% 32.2% 0.2% 10.0%Aqua America, Inc. Repeal Classified Board UWA 59.1% 38.1% 2.9% 35.1% 22.6% 1.7% 23.1%
* Issuer has implemented a form of majority voting.

PART 3> Select Social Resolutions

> 36
FIGURE 17> Shareholder Proposals – Sustainability, Voting Results – 2011
As Percentage of Votes Cast
As Percentage of Shares Outstanding
Company Proposal Sponsor For Against Abstain For Against Abstain Non-Vote
Boston Properties, Inc. Social- Issue Sustainability Report New York City Pension Funds 25.7% 51.0% 23.3% 22.6% 44.9% 20.5% 3.0%C.R. Bard, Inc. Social- Issue Sustainability Report Walden Asset Management 21.0% 55.2% 23.8% 17.4% 45.7% 19.8% 6.4%Emerson Electric Co. Social- Issue Sustainability Report Walden Asset Management 30.3% 59.6% 10.2% 23.4% 45.9% 7.8% 10.5%Gentex Corporation Social- Issue Sustainability Report Walden Asset Management 29.9% 49.2% 21.0% 24.6% 40.5% 17.3% 8.9%R. R. Donnelley & Sons Company Social- Issue Sustainability Report Domini Social Investments 24.9% 59.8% 15.3% 20.5% 49.2% 12.6% 7.7%SunTrust Banks, Inc. Social- Issue Sustainability Report Unitarian Universalist Association 20.5% 59.3% 20.2% 15.6% 45.2% 15.4% 9.3%Wal-Mart Stores, Inc. Social- Require Suppliers to Issue Sustainability Report New York City Pension Funds 1.9% 92.7% 5.4% 1.6% 77.5% 4.6% 7.1%
As Percentage of Votes Cast
As Percentage of Shares Outstanding
Company Proposal Sponsor For Against Abstain For Against Abstain Non-Vote
3M Company Political Contrib.- Report on Policies and Procedures Contributions Trillium Asset Management 31.6% 56.6% 11.8% 20.9% 37.5% 7.8% 15.6%Allstate Corporation Political Contrib.- Report on Policies and Procedures Contributions PhiPERS 32.8% 55.9% 11.3% 25.1% 42.7% 8.6% 9.3%Anadarko Petroleum Corporation Political Contrib.- Report on Policies and Procedures Contributions New York State Pension Funds 29.4% 47.8% 22.8% 21.2% 34.4% 16.4% 8.5%AT&T Inc. Political Contrib.- Report on Policies and Procedures Contributions New York City Pension Funds 26.7% 59.5% 13.8% 15.8% 35.3% 8.2% 17.4%Bank of America Corporation Political Contrib.- Report on Grassroots Lobbying AFSCME 27.4% 56.4% 16.2% 16.5% 34.0% 9.8% 19.8%BB&T Corporation Political Contrib.- Report on Policies and Procedures Contributions Laborers 27.9% 58.5% 13.6% 18.5% 38.7% 9.0% 14.6%Boeing Company Political Contrib.- Report on Policies and Procedures Contributions Newground Social Investment 19.2% 67.7% 13.2% 13.8% 48.7% 9.5% 15.1%Caterpillar Inc. Political Contrib.- Report on Policies and Procedures Contributions New York State Pension Funds 29.4% 55.4% 15.2% 20.3% 38.3% 10.5% 16.8%CenturyLink, Inc. Political Contrib.- Report on Policies and Procedures Contributions CWA 29.7% 55.7% 14.7% 20.3% 38.0% 10.0% 19.9%Charles Schwab Corporation Political Contrib.- Report on Policies and Procedures Contributions New York City Pension Funds 25.8% 57.4% 16.9% 21.5% 47.9% 14.1% 7.7%Citigroup Inc. Political Contrib.- Report on Policies and Procedures Contributions Firefighters’ Pension Sys. of Kansas City 21.1% 49.2% 29.7% 11.5% 26.7% 16.1% 20.6%ConocoPhillips Political Contrib.- Report on Grassroots Lobbying AFSCME 23.0% 64.2% 12.7% 16.9% 47.2% 9.3% 12.1%ConocoPhillips Political Contrib.- Report on Policies and Procedures Contributions Nathan Cummings Foundation 23.8% 64.4% 11.9% 17.5% 47.2% 8.7% 12.1%Coventry Health Care, Inc. Political Contrib.- Report on Policies and Procedures Contributions New York City Pension Funds 30.2% 38.0% 31.7% 25.8% 32.4% 27.1% 5.0%CVS Caremark Corporation Political Contrib.- Report on Policies and Procedures Contributions Green Century Capital Management 33.3% 52.0% 14.7% 26.2% 40.9% 11.6% 7.3%DTE Energy Company Political Contrib.- Report on Policies and Procedures Contributions New York City Pension Funds 23.8% 62.7% 13.4% 15.7% 41.4% 8.9% 13.0%EOG Resources, Inc. Political Contrib.- Report on Policies and Procedures Contributions Dominican Sisters of Hope 24.9% 61.1% 14.0% 21.5% 52.7% 12.0% 3.1%Express Scripts, Inc. Political Contrib.- Report on Policies and Procedures Contributions PhiPERS 25.9% 61.7% 12.4% 21.3% 50.7% 10.2% 6.7%Exxon Mobil Corporation Political Contrib.- Report on Policies and Procedures Contributions Laborers 20.3% 65.8% 13.9% 12.9% 41.8% 8.8% 17.9%Ford Motor Company Political Contrib.- Publish Contributions in Newspapers Individual- Davis, E. 3.9% 87.3% 8.8% 2.8% 62.9% 6.4% 18.9%Goldman Sachs Group, Inc. Political Contrib.- Report on Policies and Procedures Contributions Domini Social Investments 12.1% 75.4% 12.6% 8.6% 53.6% 8.9% 10.2%Halliburton Company Political Contrib.- Report on Policies and Procedures Contributions Trillium Asset Management 34.4% 39.6% 26.0% 24.8% 28.6% 18.7% 10.0%Home Depot, Inc. Political Contrib.- Report on Policies and Procedures Contributions NorthStar Asset Management 4.4% 83.2% 12.4% 3.1% 58.3% 8.7% 15.0%International Business Machines Corp. Political Contrib.- Report on Grassroots Lobbying AFSCME 23.3% 58.5% 18.2% 15.0% 37.7% 11.7% 14.5%International Business Machines Corp. Political Contrib.- Report on Policies and Procedures Contributions Walden Asset Management 26.2% 57.4% 16.4% 16.9% 37.0% 10.5% 14.5%JPMorgan Chase & Co. Political Contrib.- Report on Policies and Procedures Contributions Domini Social Investments 30.3% 50.7% 19.0% 22.6% 37.9% 14.2% 9.0%Lorillard, Inc. Political Contrib.- Report on Policies and Procedures Contributions New York State Pension Funds 40.2% 47.5% 12.3% 29.4% 34.8% 9.0% 7.7%Lowe’s Companies, Inc. Political Contrib.- Report on Policies and Procedures Contributions PhiPERS 29.9% 53.0% 17.1% 23.1% 40.9% 13.2% 12.1%National Oilwell Varco, Inc. Political Contrib.- Report on Policies and Procedures Contributions Nathan Cummings Foundation 29.2% 53.8% 16.9% 22.5% 41.5% 13.1% 5.9%Northrop Grumman Corporation Political Contrib.- Report on Policies and Procedures Contributions Mercy Investment Program 33.9% 55.2% 10.9% 27.4% 44.6% 8.8% 7.3%Occidental Petroleum Corporation Political Contrib.- Report on Policies and Procedures Contributions Green Century Capital Management 24.3% 55.0% 20.7% 19.5% 44.1% 16.6% 6.2%PepsiCo, Inc. Political Contrib.- Report on Policies and Procedures Contributions Walden Asset Management 9.6% 77.7% 12.7% 6.5% 52.7% 8.6% 14.9%Pfizer Inc. Political Contrib.- Publish Contributions in Newspapers Individual- Davis, E. 3.9% 81.2% 14.9% 2.7% 56.5% 10.4% 12.9%Prudential Financial, Inc. Political Contrib.- Report on Grassroots Lobbying AFSCME 6.8% 77.3% 15.9% 4.1% 47.2% 9.7% 5.8%R. R. Donnelley & Sons Company Political Contrib.- Report on Policies and Procedures Contributions New York State Pension Funds 44.2% 46.6% 9.2% 36.4% 38.3% 7.6% 7.7%Raytheon Company Political Contrib.- Report on Grassroots Lobbying AFSCME 21.2% 61.6% 17.1% 17.0% 49.2% 13.7% 8.9%Regions Financial Corporation Political Contrib.- Report on Policies and Procedures Contributions New York City Pension Funds 21.6% 55.9% 22.5% 15.5% 40.2% 16.2% 14.8%Sears Holdings Corporation Political Contrib.- Report on Policies and Procedures Contributions New York State Pension Funds 5.5% 93.3% 1.2% 4.9% 84.1% 1.1% 4.5%Southwestern Energy Company Political Contrib.- Report on Policies and Procedures Contributions Firefighters’ Pension Sys. of Kansas City 23.0% 60.6% 16.4% 18.4% 48.5% 13.1% 8.4%Sprint Nextel Corporation Political Contrib.- Report on Policies and Procedures Contributions New York City Pension Funds 41.0% 35.8% 23.2% 31.0% 27.1% 17.5% 10.6%State Street Corporation Political Contrib.- Report on Policies and Procedures Contributions Trillium Asset Management 36.1% 45.8% 18.1% 28.1% 35.7% 14.1% 6.3%Valero Energy Corporation Political Contrib.- Report on Policies and Procedures Contributions Nathan Cummings Foundation 26.4% 47.6% 26.0% 19.0% 34.2% 18.7% 12.2%Valero Energy Corporation Political Contrib.- Report on Policies and Procedures Contributions Unitarian Universalist Association 27.3% 51.1% 21.6% 19.6% 36.7% 15.5% 12.2%Wal-Mart Stores, Inc. Political Contrib.- Report on Policies and Procedures Contributions Firefighters’ Pension Sys. of Kansas City 12.6% 82.4% 5.0% 10.5% 68.9% 4.2% 7.1%WellCare Health Plans, Inc. Political Contrib.- Report on Policies and Procedures Contributions LongView 33.5% 45.3% 21.2% 27.5% 37.2% 17.4% 6.4%Windstream Corp. Political Contrib.- Report on Policies and Procedures Contributions CWA 36.7% 50.7% 12.6% 20.0% 27.6% 6.9% 32.6%
FIGURE 18> Shareholder Proposals – Political Contributions, Voting Results – 2011

PART 4> Management Proposal — Advisory Vote on Executive Compensation

> 38
As Percentage of Votes Cast As Percentage of Shares Outstanding
Company For Against Abstain For Against Abstain Non-Vote
3M Company 92.9% 6.6% 0.5% 61.6% 4.4% 0.3% 15.6%Abbott Laboratories 77.7% 21.7% 0.7% 55.4% 15.5% 0.5% 14.0%Abercrombie & Fitch Co. 55.9% 43.9% 0.2% 47.7% 37.5% 0.1% 4.5%Accenture plc 89.8% 9.6% 0.5% 65.1% 7.0% 0.4% 9.2%ACE Limited 77.2% 22.5% 0.3% 62.0% 18.0% 0.2% 2.4%Adobe Systems Incorporated 58.1% 40.3% 1.5% 44.4% 30.8% 1.2% 9.9%Advanced Micro Devices Inc. 93.7% 5.1% 1.2% 54.5% 3.0% 0.7% 19.0%AES Corporation 96.8% 2.9% 0.3% 81.0% 2.4% 0.3% 4.9%Aetna Inc. 71.1% 28.6% 0.3% 57.8% 23.2% 0.2% 5.5%AFLAC Incorporated 97.9% 1.6% 0.5% 80.8% 1.3% 0.4% 8.5%Agilent Technologies Inc. 95.5% 3.8% 0.8% 69.9% 2.8% 0.6% 12.8%Air Products & Chemicals Inc. 82.9% 14.4% 2.7% 64.9% 11.3% 2.1% 6.6%AK Steel Holding Corporation 86.2% 13.2% 0.6% 38.1% 5.8% 0.3% 28.9%Akamai Technologies, Inc. 87.5% 11.9% 0.7% 57.5% 7.8% 0.5% 18.8%Alcoa Inc. 83.3% 15.6% 1.1% 43.9% 8.2% 0.6% 21.2%Allegheny Technologies Incorporated 55.4% 43.9% 0.7% 44.9% 35.5% 0.6% 6.5%Allergan, Inc. 96.3% 3.4% 0.3% 79.2% 2.8% 0.2% 4.2%Allstate Corporation 57.0% 42.2% 0.7% 43.6% 32.3% 0.6% 9.3%Altera Corporation 94.9% 4.8% 0.4% 81.8% 4.1% 0.3% 5.6%Altria Group, Inc. 92.7% 6.7% 0.6% 57.1% 4.1% 0.4% 22.0%Amazon.com, Inc. 98.4% 1.4% 0.1% 80.8% 1.2% 0.1% 8.1%AMB Property Corporation 84.0% 16.0% 0.0% 74.7% 14.2% 0.0% 0.0%Ameren Corporation 91.6% 7.1% 1.3% 61.3% 4.8% 0.9% 15.7%American Electric Power Co. Inc. 93.9% 3.8% 2.2% 64.7% 2.6% 1.5% 15.0%American Express Company 83.5% 12.4% 4.2% 62.3% 9.2% 3.1% 9.6%American International Group, Inc. 97.5% 2.2% 0.3% 93.2% 2.1% 0.3% 1.9%American Tower Corporation 98.2% 1.8% 0.1% 79.9% 1.4% 0.0% 5.9%Ameriprise Financial, Inc. 88.1% 11.8% 0.1% 72.3% 9.6% 0.1% 5.9%AmerisourceBergen Corporation 94.5% 5.0% 0.5% 74.9% 4.0% 0.4% 8.3%Amgen Inc. 55.6% 43.6% 0.8% 42.2% 33.1% 0.6% 10.4%Amphenol Corporation 97.2% 2.6% 0.2% 88.0% 2.4% 0.1% 2.8%Anadarko Petroleum Corporation 78.5% 21.2% 0.3% 56.5% 15.3% 0.2% 8.5%Analog Devices, Inc. 81.3% 18.3% 0.4% 63.7% 14.3% 0.3% 6.4%AON Corporation 80.9% 19.0% 0.2% 68.3% 16.0% 0.2% 6.6%Apache Corporation 94.1% 5.2% 0.7% 73.2% 4.1% 0.5% 8.4%Apartment Investment and Management Company 96.8% 3.2% 0.0% 81.4% 2.7% 0.0% 5.8%Apple Inc. 98.1% 1.7% 0.3% 61.3% 1.0% 0.2% 19.4%Applied Materials Inc. 95.7% 4.0% 0.4% 69.6% 2.9% 0.3% 13.9%Assurant, Inc. 82.1% 17.7% 0.3% 67.5% 14.5% 0.2% 3.1%AT&T Inc. 91.8% 5.2% 3.0% 54.5% 3.1% 1.8% 17.4%Autodesk Inc. 84.3% 15.7% 0.1% 70.1% 13.0% 0.1% 6.0%AutoNation, Inc. 96.4% 1.8% 1.8% 88.7% 1.7% 1.7% 4.7%AvalonBay Communities, Inc. 96.0% 3.9% 0.2% 82.8% 3.3% 0.2% 3.5%Avery Dennison Corporation 75.4% 24.3% 0.3% 63.1% 20.3% 0.2% 5.6%Avon Products Inc. 91.2% 8.4% 0.4% 71.0% 6.5% 0.3% 5.5%Baker Hughes Incorporated 81.0% 17.9% 1.1% 62.5% 13.8% 0.9% 6.4%Ball Corporation 95.0% 4.6% 0.4% 80.1% 3.9% 0.4% 5.0%Bank of America Corporation 91.9% 7.0% 1.1% 55.4% 4.2% 0.7% 19.8%Bank of New York Mellon Corporation 79.1% 19.8% 1.1% 61.4% 15.4% 0.9% 6.9%Baxter International Inc. 92.2% 4.6% 3.2% 68.9% 3.5% 2.4% 9.3%BB&T Corporation 94.1% 4.3% 1.6% 62.3% 2.9% 1.0% 14.6%Becton, Dickinson and Company 94.6% 4.3% 1.1% 68.1% 3.1% 0.8% 11.0%Bed Bath & Beyond Inc. 74.9% 24.2% 0.8% 65.4% 21.2% 0.7% 4.2%Bemis Company, Inc. 93.0% 5.9% 1.0% 67.5% 4.3% 0.7% 11.1%Berkshire Hathaway Inc. 98.9% 0.8% 0.3% 68.8% 0.6% 0.2% 0.0%Best Buy Co. Inc. 96.7% 3.0% 0.3% 72.7% 2.3% 0.2% 12.5%Big Lots, Inc. 68.9% 30.9% 0.2% 54.6% 24.5% 0.2% 7.8%Biogen Idec Inc. 96.6% 3.2% 0.2% 78.7% 2.6% 0.1% 5.4%Boeing Co. 93.5% 5.2% 1.3% 67.3% 3.8% 0.9% 15.1%Boston Properties, Inc. 95.9% 3.7% 0.4% 84.4% 3.3% 0.4% 3.0%Boston Scientific Corporation 92.9% 6.7% 0.4% 74.9% 5.4% 0.3% 6.5%Bristol-Myers Squibb Company 93.8% 5.2% 1.0% 64.0% 3.5% 0.7% 17.2%
FIGURE 19> Management Proposal – Advisory Vote on Executive Compensation, Voting Results for the S&P 500 Index – 2011

> 39
FIGURE 19> Management Proposal – Advisory Vote on Executive Compensation, Voting Results for the S&P 500 Index – 2011
As Percentage of Votes Cast As Percentage of Shares Outstanding
Company For Against Abstain For Against Abstain Non-Vote
Broadcom Corporation 92.4% 7.5% 0.1% 57.4% 4.7% 0.1% 5.7%C.H. Robinson Worldwide, Inc. 98.2% 1.5% 0.3% 70.4% 1.1% 0.2% 16.3%C.R. Bard Inc. 77.3% 14.4% 8.4% 69.0% 12.8% 7.5% 0.0%Cablevision Systems Corporation 95.7% 1.5% 2.7% 88.8% 1.4% 2.5% 2.0%Cabot Oil & Gas Corporation 96.1% 3.8% 0.0% 82.2% 3.3% 0.0% 4.7%Cameron International Corporation 96.0% 3.7% 0.3% 80.5% 3.1% 0.3% 3.6%Capital One Financial Corporation 86.8% 13.0% 0.2% 65.4% 9.8% 0.2% 8.0%CarMax, Inc. 98.2% 1.5% 0.4% 79.4% 1.2% 0.3% 7.4%Carnival Corporation 96.0% 3.6% 0.5% 80.5% 3.0% 0.4% 2.0%Caterpillar Inc. 89.1% 10.3% 0.5% 61.5% 7.1% 0.4% 16.8%CB Richard Ellis Group, Inc. 96.7% 3.2% 0.1% 80.7% 2.7% 0.0% 4.9%CBS Corporation 86.8% 3.8% 9.4% 83.1% 3.6% 9.0% 2.8%Celgene Corporation 95.5% 4.0% 0.4% 69.8% 2.9% 0.3% 10.3%CenterPoint Energy, Inc. 95.3% 4.2% 0.5% 68.9% 3.1% 0.4% 13.9%CenturyLink, Inc. 83.3% 16.2% 0.5% 57.0% 11.0% 0.3% 19.9%Cephalon, Inc. 96.9% 2.8% 0.3% 76.9% 2.2% 0.3% 4.7%Cerner Corporation 98.4% 1.5% 0.2% 81.9% 1.2% 0.1% 9.1%CF Industries Holdings, Inc. 93.0% 6.2% 0.8% 73.6% 4.9% 0.6% 5.7%Charles Schwab Corporation 80.6% 19.1% 0.3% 67.3% 16.0% 0.2% 7.7%Chesapeake Energy Corporation 57.9% 41.6% 0.6% 40.7% 29.2% 0.4% 17.4%Chevron Corporation 96.8% 2.1% 1.1% 66.0% 1.5% 0.8% 15.4%Chipotle Mexican Grill, Inc. 94.0% 5.9% 0.1% 77.7% 4.9% 0.0% 10.8%Chubb Corporation 93.4% 4.9% 1.8% 72.8% 3.8% 1.4% 8.4%CIGNA Corp. 74.0% 25.7% 0.3% 55.6% 19.3% 0.2% 5.5%Cincinnati Financial Corporation 94.9% 4.3% 0.7% 70.1% 3.2% 0.5% 4.7%Citigroup Inc. 92.9% 6.0% 1.1% 50.5% 3.3% 0.6% 20.6%Citrix Systems, Inc. 97.6% 2.3% 0.1% 80.4% 1.9% 0.1% 5.6%Cliffs Natural Resources Inc. 93.1% 6.5% 0.4% 68.7% 4.8% 0.3% 10.0%CME Group Inc. 64.3% 35.6% 0.2% 44.6% 24.7% 0.1% 12.5%CMS Energy Corporation 96.2% 3.4% 0.4% 79.9% 2.8% 0.3% 7.2%Coca-Cola Company 95.9% 2.3% 1.9% 66.5% 1.6% 1.3% 13.2%Coca-Cola Enterprises, Inc. 94.2% 5.7% 0.1% 78.7% 4.7% 0.1% 5.5%Cognizant Technology Solutions Corporation 98.1% 1.0% 0.9% 80.2% 0.8% 0.8% 6.3%Colgate-Palmolive Company 94.6% 3.1% 2.4% 65.2% 2.1% 1.6% 12.4%Comcast Corporation 84.4% 15.5% 0.1% 71.6% 13.1% 0.1% 4.8%Comerica Incorporated 95.3% 4.3% 0.4% 76.1% 3.5% 0.3% 8.2%ConocoPhillips 58.5% 40.8% 0.8% 42.9% 29.9% 0.6% 12.1%CONSOL Energy Inc. 55.2% 43.6% 1.2% 46.5% 36.7% 1.0% 4.7%Consolidated Edison, Inc. 90.3% 7.8% 1.9% 48.0% 4.2% 1.0% 29.5%Constellation Energy Group, Inc. 38.0% 60.6% 1.4% 30.1% 47.9% 1.1% 7.4%Corning Incorporated 95.3% 3.8% 1.0% 73.2% 2.9% 0.7% 11.2%Costco Wholesale Corporation 98.4% 1.1% 0.5% 72.8% 0.8% 0.4% 12.7%Coventry Health Care, Inc. 79.8% 19.9% 0.3% 68.0% 16.9% 0.2% 5.0%Covidien plc 92.9% 6.7% 0.3% 75.8% 5.5% 0.3% 6.4%CSX Corporation 97.5% 1.9% 0.6% 71.0% 1.4% 0.4% 11.0%Cummins Inc. 90.0% 9.5% 0.5% 70.7% 7.5% 0.4% 8.9%CVS Caremark Corporation 91.4% 7.9% 0.8% 71.9% 6.2% 0.6% 7.3%Danaher Corporation 96.5% 3.2% 0.3% 80.8% 2.7% 0.3% 4.9%DaVita Inc. 82.9% 17.0% 0.1% 70.3% 14.4% 0.1% 4.2%Dean Foods Company 62.1% 36.8% 1.1% 44.9% 26.7% 0.8% 13.7%Deere & Co. 96.8% 1.9% 1.3% 71.5% 1.4% 1.0% 12.0%Denbury Resources Inc. 97.0% 2.5% 0.5% 83.0% 2.1% 0.4% 4.3%Dentsply International Inc. 88.8% 10.2% 1.0% 75.5% 8.7% 0.9% 6.3%Devon Energy Corporation 56.8% 42.8% 0.4% 44.7% 33.7% 0.3% 9.1%Diamond Offshore Drilling Inc. 98.4% 0.7% 0.9% 80.4% 0.6% 0.8% 8.2%DIRECTV 94.9% 3.8% 1.3% 74.1% 3.0% 1.0% 6.1%Discover Financial Services 95.5% 4.0% 0.4% 77.3% 3.3% 0.4% 7.0%Discovery Communications, Inc. 81.3% 18.2% 0.5% 72.6% 16.3% 0.4% 3.6%Dominion Resources Inc. 90.8% 5.4% 3.7% 60.2% 3.6% 2.5% 15.6%Dover Corporation 94.2% 5.5% 0.3% 75.9% 4.4% 0.2% 5.7%Dow Chemical Company 86.0% 12.7% 1.2% 67.5% 10.0% 1.0% 9.6%Dr. Pepper Snapple Group, Inc. 65.4% 32.0% 2.6% 53.6% 26.2% 2.1% 4.0%

> 40
FIGURE 19> Management Proposal – Advisory Vote on Executive Compensation, Voting Results for the S&P 500 Index – 2011
As Percentage of Votes Cast As Percentage of Shares Outstanding
Company For Against Abstain For Against Abstain Non-Vote
DTE Energy Company 91.5% 7.1% 1.4% 60.3% 4.7% 0.9% 13.0%Duke Energy Corporation 93.6% 5.5% 0.9% 52.9% 3.1% 0.5% 27.8%Dun & Bradstreet Corporation 86.8% 12.7% 0.5% 72.2% 10.6% 0.4% 5.9%E*TRADE Financial Corporation 97.3% 1.3% 1.3% 59.5% 0.8% 0.8% 19.2%E.I. DuPont de Nemours & Co. 97.3% 2.2% 0.5% 64.4% 1.4% 0.4% 15.8%Eastman Chemical Company 96.1% 3.6% 0.3% 76.0% 2.9% 0.2% 7.0%Eaton Corp. 93.0% 6.0% 1.0% 76.4% 4.9% 0.9% 7.3%eBay Inc. 73.3% 26.6% 0.1% 61.2% 22.2% 0.1% 6.1%Ecolab Inc. 97.5% 1.5% 1.0% 77.8% 1.2% 0.8% 6.8%Edison International 80.1% 19.0% 0.9% 59.2% 14.0% 0.6% 10.2%Edwards Lifesciences Corporation 95.4% 4.4% 0.2% 78.3% 3.6% 0.2% 7.4%El Paso Corporation 89.1% 4.7% 6.3% 66.9% 3.5% 4.7% 10.0%Eli Lilly and Company 87.5% 11.6% 0.9% 66.6% 8.9% 0.7% 10.2%EMC Corporation 98.0% 1.7% 0.3% 69.7% 1.2% 0.2% 12.7%Emerson Electric Co. 91.8% 4.0% 4.2% 70.8% 3.1% 3.3% 10.5%Entergy Corporation 96.4% 3.1% 0.4% 69.8% 2.3% 0.3% 8.2%EOG Resources, Inc. 61.2% 38.6% 0.2% 52.8% 33.3% 0.1% 3.1%EQT Corp. 93.6% 6.0% 0.4% 73.9% 4.7% 0.3% 10.9%Equifax Inc. 83.0% 16.5% 0.5% 61.9% 12.3% 0.4% 10.2%Equity Residential 97.9% 1.9% 0.2% 86.1% 1.7% 0.2% 3.7%Exelon Corporation 95.2% 3.4% 1.4% 58.8% 2.1% 0.9% 16.1%Expeditors International of Washington, Inc. 96.0% 3.6% 0.4% 77.0% 2.9% 0.3% 6.2%Express Scripts, Inc. 96.9% 2.6% 0.5% 79.7% 2.1% 0.4% 6.7%Exxon Mobil Corporation 66.5% 32.4% 1.1% 42.2% 20.6% 0.7% 17.9%F5 Networks Inc. 97.7% 2.2% 0.1% 76.8% 1.7% 0.0% 10.0%Fastenal Company 99.1% 0.6% 0.3% 77.0% 0.4% 0.3% 13.6%Fidelity National Information Services, Inc. 83.0% 16.6% 0.4% 67.6% 13.5% 0.3% 7.9%Fifth Third Bancorp 94.2% 5.2% 0.6% 71.0% 4.0% 0.5% 9.8%First Horizon National Corporation 96.0% 3.4% 0.6% 73.3% 2.6% 0.5% 12.8%First Solar, Inc. 85.2% 10.2% 4.5% 68.2% 8.2% 3.6% 4.7%FirstEnergy Corp. 94.4% 4.2% 1.3% 72.6% 3.3% 1.0% 10.8%Fiserv Inc. 93.7% 6.1% 0.2% 72.7% 4.7% 0.2% 11.4%FLIR Systems, Inc. 97.0% 2.1% 0.9% 77.9% 1.7% 0.7% 5.0%Flowserve Corporation 94.1% 2.0% 3.9% 77.2% 1.7% 3.2% 5.8%Fluor Corporation 75.5% 24.2% 0.3% 58.3% 18.7% 0.2% 10.2%FMC Corporation 93.9% 5.6% 0.5% 80.6% 4.8% 0.4% 5.3%FMC Technologies Inc. 98.9% 0.7% 0.3% 82.2% 0.6% 0.3% 3.6%Ford Motor Company 93.0% 6.6% 0.4% 67.0% 4.7% 0.3% 18.9%Fortune Brands, Inc. 92.3% 4.9% 2.9% 59.9% 3.2% 1.9% 21.2%Franklin Resources, Inc. 98.5% 0.9% 0.6% 76.7% 0.7% 0.5% 5.2%Freeport-McMoRan Copper & Gold Inc. 45.5% 53.9% 0.6% 30.8% 36.6% 0.4% 10.8%Frontier Communications Corporation 93.2% 5.8% 1.0% 46.0% 2.9% 0.5% 30.0%GameStop Corp. 78.9% 20.5% 0.5% 63.8% 16.6% 0.4% 7.4%Gannett Co., Inc. 73.7% 24.2% 2.1% 51.7% 17.0% 1.5% 15.2%Gap, Inc. 98.6% 1.3% 0.1% 81.7% 1.1% 0.0% 4.8%General Dynamics Corporation 85.8% 12.9% 1.3% 72.3% 10.9% 1.1% 6.7%General Electric Company 78.2% 20.2% 1.7% 45.2% 11.7% 1.0% 19.9%Genuine Parts Company 93.6% 3.1% 3.3% 71.0% 2.3% 2.5% 10.7%Genworth Financial, Inc. 94.6% 5.2% 0.2% 76.6% 4.2% 0.1% 9.7%Gilead Sciences Inc. 75.4% 24.3% 0.2% 57.6% 18.6% 0.2% 8.5%Goldman Sachs Group Inc. 72.9% 26.7% 0.4% 51.8% 19.0% 0.3% 10.2%Goodrich Corporation 94.7% 5.0% 0.3% 80.8% 4.3% 0.2% 5.5%Goodyear Tire & Rubber Company 79.4% 20.2% 0.4% 51.2% 13.0% 0.3% 15.6%Google Inc. 97.5% 2.4% 0.1% 84.3% 2.1% 0.1% 3.4%Halliburton Company 78.4% 20.4% 1.1% 56.6% 14.7% 0.8% 10.0%Harley-Davidson, Inc. 97.0% 2.6% 0.4% 72.7% 1.9% 0.3% 5.2%Hartford Financial Services Group, Inc. 83.1% 15.5% 1.5% 63.9% 11.9% 1.1% 9.7%Hasbro, Inc. 93.8% 5.8% 0.4% 76.9% 4.7% 0.3% 7.2%HCP, Inc. 95.5% 4.0% 0.4% 77.6% 3.3% 0.3% 9.4%Health Care REIT, Inc. 95.2% 4.4% 0.5% 69.0% 3.2% 0.3% 14.9%Helmerich & Payne Inc. 94.3% 1.7% 4.1% 74.7% 1.3% 3.2% 6.2%Hershey Company 98.5% 1.3% 0.2% 91.5% 1.2% 0.2% 3.2%

> 41
FIGURE 19> Management Proposal – Advisory Vote on Executive Compensation, Voting Results for the S&P 500 Index – 2011
As Percentage of Votes Cast As Percentage of Shares Outstanding
Company For Against Abstain For Against Abstain Non-Vote
Hess Corporation 87.2% 12.6% 0.2% 68.3% 9.9% 0.2% 6.7%Hewlett-Packard Company 48.2% 50.8% 1.0% 33.5% 35.3% 0.7% 10.7%Home Depot, Inc. 98.1% 1.5% 0.4% 68.8% 1.0% 0.3% 15.0%Honeywell International Inc. 90.5% 7.4% 2.1% 71.3% 5.8% 1.7% 9.9%Hormel Foods Corporation 97.5% 1.0% 1.5% 77.4% 0.8% 1.2% 7.6%Hospira, Inc. 96.0% 3.6% 0.4% 77.5% 2.9% 0.3% 7.2%Host Hotels & Resorts, Inc. 99.6% 0.4% 0.0% 87.8% 0.4% 0.0% 2.5%Hudson City Bancorp, Inc. 91.2% 6.7% 2.1% 59.8% 4.4% 1.4% 34.4%Humana Inc. 93.4% 4.4% 2.3% 75.2% 3.5% 1.8% 5.9%Huntington Bancshares Incorporated 92.2% 7.2% 0.6% 64.2% 5.0% 0.4% 18.2%Illinois Tool Works Inc. 97.2% 2.5% 0.3% 77.6% 2.0% 0.2% 9.0%Ingersoll-Rand plc 88.9% 10.5% 0.6% 66.9% 7.9% 0.4% 6.4%Integrys Energy Group, Inc. 91.0% 5.5% 3.5% 55.5% 3.4% 2.1% 19.2%Intel Corporation 95.4% 4.1% 0.5% 58.2% 2.5% 0.3% 19.9%IntercontinentalExchange, Inc. 94.4% 5.6% 0.1% 71.0% 4.2% 0.1% 4.9%International Business Machines Corporation 92.1% 6.9% 1.0% 59.3% 4.4% 0.6% 14.5%International Flavors & Fragrances Inc. 85.0% 12.4% 2.6% 70.7% 10.3% 2.2% 4.4%International Game Technology 81.8% 17.4% 0.8% 59.6% 12.7% 0.6% 11.8%International Paper Company 72.6% 26.7% 0.7% 53.0% 19.5% 0.5% 9.4%Interpublic Group of Companies, Inc. 97.5% 1.3% 1.1% 79.1% 1.1% 0.9% 4.0%Intuit Inc. 89.7% 9.8% 0.4% 77.2% 8.5% 0.4% 6.1%Intuitive Surgical Inc. 86.0% 13.9% 0.1% 65.2% 10.6% 0.1% 12.2%Invesco Ltd. 55.6% 44.2% 0.2% 44.7% 35.5% 0.1% 4.4%Iron Mountain Incorporated 99.4% 0.5% 0.0% 84.0% 0.4% 0.0% 8.2%ITT Corporation 91.3% 6.0% 2.6% 70.4% 4.7% 2.0% 7.8%J.C. Penney Company, Inc. 70.9% 27.5% 1.6% 59.4% 23.1% 1.3% 5.1%Jacobs Engineering Group Inc. 44.8% 53.7% 1.4% 32.2% 38.6% 1.0% 12.9%Janus Capital Group Inc. 40.1% 55.4% 4.5% 32.2% 44.4% 3.6% 7.7%Johnson & Johnson 60.1% 38.1% 1.8% 39.8% 25.3% 1.2% 16.1%Johnson Controls, Inc. 59.7% 36.0% 4.3% 47.9% 28.9% 3.5% 8.3%Joy Global Inc. 95.4% 3.9% 0.7% 76.6% 3.1% 0.6% 7.4%JPMorgan Chase & Co. 72.6% 26.8% 0.6% 54.3% 20.0% 0.5% 9.0%Juniper Networks, Inc. 91.7% 7.8% 0.5% 75.8% 6.4% 0.4% 6.6%Kellogg Company 97.2% 2.3% 0.5% 76.8% 1.8% 0.4% 8.4%KeyCorp 86.0% 13.2% 0.8% 67.2% 10.3% 0.6% 8.7%Kimberly-Clark Corporation 90.5% 8.0% 1.5% 62.8% 5.6% 1.0% 17.3%Kimco Realty Corporation 99.3% 0.6% 0.1% 85.2% 0.5% 0.1% 5.2%Kohl’s Corporation 98.1% 1.7% 0.2% 80.9% 1.4% 0.1% 4.8%Kraft Foods Inc. 80.0% 15.4% 4.6% 54.9% 10.6% 3.1% 14.8%Kroger Co. 96.8% 2.7% 0.5% 75.6% 2.1% 0.4% 7.6%L-3 Communications Holdings Inc. 60.5% 39.3% 0.2% 44.9% 29.2% 0.1% 9.1%Laboratory Corporation of America Holdings 98.1% 1.6% 0.3% 76.5% 1.3% 0.2% 7.5%Leggett & Platt, Incorporated 92.5% 7.3% 0.2% 70.0% 5.5% 0.2% 11.6%Lennar Corporation 90.3% 5.4% 4.3% 76.1% 4.6% 3.6% 8.8%Leucadia National Corp. 91.9% 7.4% 0.7% 70.3% 5.6% 0.5% 12.3%Lexmark International, Inc. 76.5% 22.8% 0.7% 61.2% 18.3% 0.6% 4.4%Life Technologies Corp. 93.7% 6.0% 0.3% 72.7% 4.7% 0.2% 7.6%Limited Brands, Inc. 61.8% 37.8% 0.4% 51.4% 31.5% 0.3% 6.0%Lincoln National Corporation 80.3% 19.3% 0.3% 61.4% 14.8% 0.3% 8.9%Lockheed Martin Corporation 65.5% 29.9% 4.6% 55.3% 25.2% 3.9% 7.3%Loews Corporation 98.4% 1.4% 0.2% 82.2% 1.2% 0.2% 5.6%Lorillard, Inc. 84.0% 15.8% 0.2% 61.5% 11.5% 0.1% 7.7%Lowe’s Companies, Inc. 94.9% 4.5% 0.6% 73.3% 3.5% 0.5% 12.1%LSI Corporation 93.4% 5.2% 1.4% 67.5% 3.7% 1.0% 13.4%M&T Bank Corporation 97.2% 1.9% 0.9% 77.1% 1.5% 0.7% 9.2%Macy’s, Inc. 78.1% 20.3% 1.6% 65.2% 16.9% 1.4% 4.6%Marathon Oil Corporation 70.5% 28.9% 0.6% 51.8% 21.2% 0.5% 9.6%Marriott International, Inc. 98.0% 1.6% 0.4% 76.0% 1.3% 0.3% 9.2%Marsh & McLennan Companies, Inc. 67.8% 25.8% 6.4% 55.4% 21.1% 5.2% 6.9%Masco Corporation 44.6% 55.2% 0.2% 37.3% 46.1% 0.1% 5.5%MasterCard Incorporated 93.9% 5.6% 0.4% 73.9% 4.4% 0.3% 4.3%Mattel, Inc. 91.4% 6.4% 2.2% 73.1% 5.1% 1.8% 5.9%
As Percentage of Votes Cast As Percentage of Shares Outstanding
Company For Against Abstain For Against Abstain Non-Vote
DTE Energy Company 91.5% 7.1% 1.4% 60.3% 4.7% 0.9% 13.0%Duke Energy Corporation 93.6% 5.5% 0.9% 52.9% 3.1% 0.5% 27.8%Dun & Bradstreet Corporation 86.8% 12.7% 0.5% 72.2% 10.6% 0.4% 5.9%E*TRADE Financial Corporation 97.3% 1.3% 1.3% 59.5% 0.8% 0.8% 19.2%E.I. DuPont de Nemours & Co. 97.3% 2.2% 0.5% 64.4% 1.4% 0.4% 15.8%Eastman Chemical Company 96.1% 3.6% 0.3% 76.0% 2.9% 0.2% 7.0%Eaton Corp. 93.0% 6.0% 1.0% 76.4% 4.9% 0.9% 7.3%eBay Inc. 73.3% 26.6% 0.1% 61.2% 22.2% 0.1% 6.1%Ecolab Inc. 97.5% 1.5% 1.0% 77.8% 1.2% 0.8% 6.8%Edison International 80.1% 19.0% 0.9% 59.2% 14.0% 0.6% 10.2%Edwards Lifesciences Corporation 95.4% 4.4% 0.2% 78.3% 3.6% 0.2% 7.4%El Paso Corporation 89.1% 4.7% 6.3% 66.9% 3.5% 4.7% 10.0%Eli Lilly and Company 87.5% 11.6% 0.9% 66.6% 8.9% 0.7% 10.2%EMC Corporation 98.0% 1.7% 0.3% 69.7% 1.2% 0.2% 12.7%Emerson Electric Co. 91.8% 4.0% 4.2% 70.8% 3.1% 3.3% 10.5%Entergy Corporation 96.4% 3.1% 0.4% 69.8% 2.3% 0.3% 8.2%EOG Resources, Inc. 61.2% 38.6% 0.2% 52.8% 33.3% 0.1% 3.1%EQT Corp. 93.6% 6.0% 0.4% 73.9% 4.7% 0.3% 10.9%Equifax Inc. 83.0% 16.5% 0.5% 61.9% 12.3% 0.4% 10.2%Equity Residential 97.9% 1.9% 0.2% 86.1% 1.7% 0.2% 3.7%Exelon Corporation 95.2% 3.4% 1.4% 58.8% 2.1% 0.9% 16.1%Expeditors International of Washington, Inc. 96.0% 3.6% 0.4% 77.0% 2.9% 0.3% 6.2%Express Scripts, Inc. 96.9% 2.6% 0.5% 79.7% 2.1% 0.4% 6.7%Exxon Mobil Corporation 66.5% 32.4% 1.1% 42.2% 20.6% 0.7% 17.9%F5 Networks Inc. 97.7% 2.2% 0.1% 76.8% 1.7% 0.0% 10.0%Fastenal Company 99.1% 0.6% 0.3% 77.0% 0.4% 0.3% 13.6%Fidelity National Information Services, Inc. 83.0% 16.6% 0.4% 67.6% 13.5% 0.3% 7.9%Fifth Third Bancorp 94.2% 5.2% 0.6% 71.0% 4.0% 0.5% 9.8%First Horizon National Corporation 96.0% 3.4% 0.6% 73.3% 2.6% 0.5% 12.8%First Solar, Inc. 85.2% 10.2% 4.5% 68.2% 8.2% 3.6% 4.7%FirstEnergy Corp. 94.4% 4.2% 1.3% 72.6% 3.3% 1.0% 10.8%Fiserv Inc. 93.7% 6.1% 0.2% 72.7% 4.7% 0.2% 11.4%FLIR Systems, Inc. 97.0% 2.1% 0.9% 77.9% 1.7% 0.7% 5.0%Flowserve Corporation 94.1% 2.0% 3.9% 77.2% 1.7% 3.2% 5.8%Fluor Corporation 75.5% 24.2% 0.3% 58.3% 18.7% 0.2% 10.2%FMC Corporation 93.9% 5.6% 0.5% 80.6% 4.8% 0.4% 5.3%FMC Technologies Inc. 98.9% 0.7% 0.3% 82.2% 0.6% 0.3% 3.6%Ford Motor Company 93.0% 6.6% 0.4% 67.0% 4.7% 0.3% 18.9%Fortune Brands, Inc. 92.3% 4.9% 2.9% 59.9% 3.2% 1.9% 21.2%Franklin Resources, Inc. 98.5% 0.9% 0.6% 76.7% 0.7% 0.5% 5.2%Freeport-McMoRan Copper & Gold Inc. 45.5% 53.9% 0.6% 30.8% 36.6% 0.4% 10.8%Frontier Communications Corporation 93.2% 5.8% 1.0% 46.0% 2.9% 0.5% 30.0%GameStop Corp. 78.9% 20.5% 0.5% 63.8% 16.6% 0.4% 7.4%Gannett Co., Inc. 73.7% 24.2% 2.1% 51.7% 17.0% 1.5% 15.2%Gap, Inc. 98.6% 1.3% 0.1% 81.7% 1.1% 0.0% 4.8%General Dynamics Corporation 85.8% 12.9% 1.3% 72.3% 10.9% 1.1% 6.7%General Electric Company 78.2% 20.2% 1.7% 45.2% 11.7% 1.0% 19.9%Genuine Parts Company 93.6% 3.1% 3.3% 71.0% 2.3% 2.5% 10.7%Genworth Financial, Inc. 94.6% 5.2% 0.2% 76.6% 4.2% 0.1% 9.7%Gilead Sciences Inc. 75.4% 24.3% 0.2% 57.6% 18.6% 0.2% 8.5%Goldman Sachs Group Inc. 72.9% 26.7% 0.4% 51.8% 19.0% 0.3% 10.2%Goodrich Corporation 94.7% 5.0% 0.3% 80.8% 4.3% 0.2% 5.5%Goodyear Tire & Rubber Company 79.4% 20.2% 0.4% 51.2% 13.0% 0.3% 15.6%Google Inc. 97.5% 2.4% 0.1% 84.3% 2.1% 0.1% 3.4%Halliburton Company 78.4% 20.4% 1.1% 56.6% 14.7% 0.8% 10.0%Harley-Davidson, Inc. 97.0% 2.6% 0.4% 72.7% 1.9% 0.3% 5.2%Hartford Financial Services Group, Inc. 83.1% 15.5% 1.5% 63.9% 11.9% 1.1% 9.7%Hasbro, Inc. 93.8% 5.8% 0.4% 76.9% 4.7% 0.3% 7.2%HCP, Inc. 95.5% 4.0% 0.4% 77.6% 3.3% 0.3% 9.4%Health Care REIT, Inc. 95.2% 4.4% 0.5% 69.0% 3.2% 0.3% 14.9%Helmerich & Payne Inc. 94.3% 1.7% 4.1% 74.7% 1.3% 3.2% 6.2%Hershey Company 98.5% 1.3% 0.2% 91.5% 1.2% 0.2% 3.2%

> 42
FIGURE 19> Management Proposal – Advisory Vote on Executive Compensation, Voting Results for the S&P 500 Index – 2011
As Percentage of Votes Cast As Percentage of Shares Outstanding
Company For Against Abstain For Against Abstain Non-Vote
McCormick & Company, Incorporated 97.6% 1.8% 0.6% 77.0% 1.4% 0.4% 9.3%McDonald’s Corporation 94.8% 4.6% 0.6% 64.6% 3.1% 0.4% 15.0%McGraw-Hill Companies, Inc. 94.5% 4.7% 0.8% 77.9% 3.9% 0.6% 4.8%Mead Johnson Nutrition Company 97.6% 2.0% 0.5% 77.5% 1.6% 0.4% 3.4%MeadWestvaco Corporation 92.9% 6.9% 0.2% 79.8% 5.9% 0.2% 5.7%Medco Health Solutions, Inc. 85.6% 14.0% 0.4% 61.0% 9.9% 0.3% 14.8%MEMC Electronic Materials, Inc. 81.1% 18.7% 0.2% 56.7% 13.1% 0.2% 13.2%Merck & Co., Inc. 93.8% 3.0% 3.3% 67.4% 2.1% 2.4% 12.1%MetLife, Inc. 98.0% 1.9% 0.1% 79.5% 1.6% 0.1% 3.3%MetroPCS Communications, Inc. 94.6% 1.2% 4.2% 81.7% 1.0% 3.6% 6.3%Molson Coors Brewing Company 100.0% 0.0% 0.0% 92.4% 0.0% 0.0% 0.2%Monsanto Company 64.9% 33.8% 1.3% 46.0% 23.9% 0.9% 11.0%Monster Worldwide, Inc. 84.7% 14.9% 0.4% 66.3% 11.7% 0.3% 6.3%Moody’s Corporation 96.7% 2.6% 0.8% 74.8% 2.0% 0.6% 5.4%Morgan Stanley 78.6% 20.9% 0.5% 62.9% 16.7% 0.4% 7.6%Motorola Mobility Holdings, Inc. 86.9% 12.4% 0.7% 63.8% 9.1% 0.5% 10.5%Motorola Solutions, Inc. 88.7% 11.1% 0.2% 68.6% 8.6% 0.2% 8.3%Murphy Oil Corporation 98.6% 1.4% 0.0% 78.0% 1.1% 0.0% 5.4%Mylan Inc. 63.2% 35.8% 0.9% 44.9% 25.5% 0.7% 11.8%Nabors Industries Ltd. 42.5% 57.3% 0.2% 32.9% 44.3% 0.2% 7.7%NASDAQ OMX Group, Inc. 94.9% 4.6% 0.5% 56.6% 2.7% 0.3% 6.0%National Oilwell Varco, Inc. 94.2% 5.1% 0.7% 72.6% 4.0% 0.5% 5.9%Netflix, Inc. 97.2% 2.7% 0.1% 66.5% 1.8% 0.1% 17.8%Newell Rubbermaid Inc. 88.0% 11.8% 0.2% 70.1% 9.4% 0.2% 6.9%Newfield Exploration Company 93.2% 6.8% 0.1% 79.7% 5.8% 0.1% 5.0%Newmont Mining Corporation 95.3% 3.2% 1.4% 65.6% 2.2% 1.0% 7.4%NextEra Energy, Inc 93.5% 5.2% 1.3% 62.4% 3.5% 0.9% 17.3%Nicor Inc. 89.0% 6.6% 4.4% 62.1% 4.6% 3.1% 14.6%NiSource, Inc. 95.6% 3.7% 0.7% 68.3% 2.6% 0.5% 10.5%Noble Corporation 58.3% 41.5% 0.2% 41.8% 29.8% 0.1% 9.0%Noble Energy, Inc. 88.1% 10.9% 1.1% 74.4% 9.2% 0.9% 4.7%Nordstrom, Inc. 97.2% 2.6% 0.3% 74.5% 2.0% 0.2% 8.3%Norfolk Southern Corporation 93.9% 5.2% 0.9% 67.1% 3.7% 0.6% 12.0%Northeast Utilities 95.2% 2.7% 2.1% 73.6% 2.1% 1.6% 7.0%Northern Trust Corporation 66.0% 32.6% 1.3% 54.7% 27.0% 1.1% 5.6%Northrop Grumman Corporation 71.2% 22.0% 6.8% 57.6% 17.8% 5.5% 7.3%Novellus Systems, Inc. 74.6% 22.5% 2.9% 60.8% 18.3% 2.3% 8.5%NRG Energy, Inc. 59.0% 37.6% 3.3% 47.0% 29.9% 2.6% 4.5%Nucor Corporation 91.0% 8.6% 0.4% 67.2% 6.3% 0.3% 11.8%NVIDIA Corporation 68.1% 31.9% 0.1% 46.5% 21.8% 0.0% 15.8%NYSE Euronext 83.1% 16.1% 0.8% 52.0% 10.0% 0.5% 17.1%Occidental Petroleum Corporation 90.3% 8.6% 1.1% 72.4% 6.9% 0.9% 6.2%Omnicom Group Inc. 84.3% 15.5% 0.2% 67.4% 12.4% 0.2% 6.7%ONEOK, Inc. 90.5% 7.1% 2.4% 70.1% 5.5% 1.8% 11.8%O’Reilly Automotive, Inc. 93.6% 4.2% 2.2% 77.7% 3.5% 1.9% 7.2%Owens-Illinois, Inc. 94.2% 5.2% 0.6% 75.6% 4.2% 0.5% 6.1%PACCAR Inc 97.3% 1.6% 1.1% 84.4% 1.4% 0.9% 0.0%Peabody Energy Corporation 95.2% 4.3% 0.4% 70.7% 3.2% 0.3% 8.8%People’s United Financial, Inc. 86.1% 13.3% 0.6% 56.2% 8.7% 0.4% 15.9%Pepco Holdings, Inc. 91.2% 7.0% 1.7% 46.8% 3.6% 0.9% 22.2%PepsiCo, Inc. 94.0% 4.5% 1.5% 63.7% 3.0% 1.0% 14.9%PerkinElmer, Inc. 78.8% 16.9% 4.3% 61.8% 13.2% 3.3% 9.1%Pfizer Inc. 55.4% 43.5% 1.1% 38.6% 30.3% 0.7% 12.9%PG&E Corporation 97.4% 2.2% 0.4% 63.4% 1.4% 0.2% 10.9%Philip Morris International Inc. 80.8% 18.9% 0.4% 56.7% 13.2% 0.3% 14.5%Pinnacle West Capital Corporation 94.2% 4.6% 1.2% 68.2% 3.3% 0.9% 11.5%Pioneer Natural Resources Company 94.9% 4.9% 0.1% 74.4% 3.9% 0.1% 10.2%Pitney Bowes Inc. 83.5% 16.0% 0.5% 59.6% 11.4% 0.3% 13.5%Plum Creek Timber Company, Inc. 96.2% 2.9% 0.9% 58.7% 1.8% 0.6% 24.6%PNC Financial Services Group, Inc. 95.5% 3.9% 0.6% 73.4% 3.0% 0.5% 8.2%PPG Industries, Inc. 97.5% 2.1% 0.4% 68.5% 1.5% 0.3% 11.1%PPL Corporation 57.7% 41.2% 1.1% 43.5% 31.0% 0.8% 9.9%

> 43
FIGURE 19> Management Proposal – Advisory Vote on Executive Compensation, Voting Results for the S&P 500 Index – 2011
As Percentage of Votes Cast As Percentage of Shares Outstanding
Company For Against Abstain For Against Abstain Non-Vote
Praxair Inc. 95.7% 4.1% 0.3% 75.0% 3.2% 0.2% 6.9%priceline.com Incorporated 96.4% 3.6% 0.0% 78.5% 2.9% 0.0% 5.1%Principal Financial Group, Inc. 97.1% 2.0% 1.0% 59.4% 1.2% 0.6% 5.8%Progress Energy Inc. 92.2% 6.1% 1.7% 50.2% 3.3% 0.9% 23.9%Progressive Corporation 97.7% 2.0% 0.2% 79.7% 1.7% 0.2% 6.0%Prudential Financial, Inc. 85.9% 13.4% 0.7% 52.4% 8.2% 0.4% 5.8%Public Service Enterprise Group Incorporated 95.5% 3.2% 1.2% 69.3% 2.3% 0.9% 12.8%Public Storage 99.4% 0.5% 0.1% 85.1% 0.5% 0.1% 4.8%PulteGroup, Inc. 75.8% 23.9% 0.3% 58.8% 18.5% 0.2% 11.1%QEP Resources, Inc. 64.8% 34.7% 0.5% 50.3% 26.9% 0.4% 6.2%QUALCOMM Incorporated 94.4% 4.9% 0.7% 70.3% 3.7% 0.5% 12.0%Quanta Services, Inc. 97.4% 2.4% 0.1% 72.1% 1.8% 0.1% 5.0%Quest Diagnostics Incorporated 92.4% 6.6% 1.0% 69.3% 5.0% 0.8% 6.5%R. R. Donnelley & Sons Company 71.0% 28.7% 0.3% 58.4% 23.6% 0.2% 7.7%RadioShack Corporation 94.9% 4.4% 0.7% 67.6% 3.1% 0.5% 10.6%Range Resources Corporation 90.7% 9.3% 0.1% 74.6% 7.6% 0.1% 6.5%Raytheon Company 93.3% 6.0% 0.7% 74.5% 4.8% 0.5% 8.9%Regions Financial Corporation 83.4% 15.8% 0.7% 60.0% 11.4% 0.5% 14.8%Republic Services Inc. 61.9% 37.0% 1.1% 52.0% 31.1% 0.9% 5.1%Reynolds American Inc. 92.3% 7.6% 0.1% 67.7% 5.6% 0.1% 7.6%Robert Half International Inc. 79.4% 18.7% 1.9% 64.6% 15.2% 1.5% 7.0%Rockwell Automation, Inc. 93.4% 2.4% 4.3% 63.4% 1.6% 2.9% 12.3%Rockwell Collins, Inc. 95.3% 3.5% 1.3% 69.0% 2.5% 0.9% 14.1%Roper Industries, Inc. 98.7% 0.7% 0.6% 82.6% 0.6% 0.5% 3.4%Ross Stores, Inc. 95.4% 4.2% 0.4% 81.4% 3.6% 0.3% 4.4%Rowan Companies, Inc. 73.9% 18.6% 7.4% 54.4% 13.7% 5.5% 6.0%Ryder System, Inc. 94.1% 5.7% 0.2% 77.7% 4.7% 0.2% 6.2%Safeway Inc. 52.8% 46.2% 1.0% 42.8% 37.5% 0.8% 4.2%SAIC, Inc. 94.5% 4.3% 1.3% 62.1% 2.8% 0.8% 10.0%salesforce.com, inc. 83.4% 16.6% 0.0% 69.5% 13.8% 0.0% 6.8%SanDisk Corporation 82.9% 16.2% 0.8% 57.8% 11.3% 0.6% 13.5%SCANA Corporation 91.5% 6.0% 2.5% 58.4% 3.8% 1.6% 27.6%Schlumberger Ltd. 98.2% 1.5% 0.2% 69.0% 1.1% 0.2% 7.3%Scripps Networks Interactive, Inc. 100.0% 0.0% 0.0% 98.5% 0.0% 0.0% 1.5%Sealed Air Corporation 98.4% 1.3% 0.3% 84.8% 1.1% 0.3% 5.0%Sears Holdings Corporation 99.2% 0.7% 0.1% 89.3% 0.7% 0.1% 4.5%Sempra Energy 74.8% 24.5% 0.7% 53.8% 17.6% 0.5% 12.0%Sherwin-Williams Company 95.2% 3.6% 1.2% 75.1% 2.9% 0.9% 6.5%Sigma-Aldrich Corporation 98.0% 1.6% 0.4% 78.9% 1.3% 0.4% 7.7%Simon Property Group, Inc. 97.1% 2.9% 0.0% 85.0% 2.5% 0.0% 3.4%SLM Corporation 97.8% 1.4% 0.8% 83.5% 1.2% 0.7% 4.0%Snap-On Incorporated 98.1% 1.6% 0.3% 83.6% 1.4% 0.2% 5.0%Southern Company 93.2% 5.4% 1.4% 50.8% 2.9% 0.8% 21.2%Southwest Airlines Co. 97.6% 2.2% 0.2% 80.1% 1.8% 0.2% 10.6%Southwestern Energy Company 96.2% 2.9% 0.9% 77.0% 2.3% 0.8% 10.5%Spectra Energy Corp 96.9% 2.1% 1.0% 64.3% 1.4% 0.7% 17.5%Sprint Nextel Corporation 85.0% 13.9% 1.1% 64.2% 10.5% 0.9% 10.6%St. Jude Medical, Inc. 94.3% 5.5% 0.2% 74.8% 4.3% 0.2% 8.7%Stanley Black & Decker, Inc. 38.8% 60.5% 0.7% 30.6% 47.7% 0.5% 9.0%Staples, Inc. 59.0% 40.9% 0.1% 47.3% 32.8% 0.1% 6.1%Starbucks Corporation 97.8% 2.0% 0.2% 71.4% 1.4% 0.1% 14.9%Starwood Hotels & Resorts Worldwide, Inc. 95.7% 3.8% 0.4% 76.6% 3.1% 0.4% 4.7%State Street Corporation 88.4% 10.5% 1.1% 68.9% 8.2% 0.8% 6.3%Stericycle, Inc. 97.8% 2.1% 0.1% 78.8% 1.7% 0.1% 8.6%Stryker Corp. 97.9% 1.5% 0.6% 76.5% 1.2% 0.4% 10.7%Sunoco, Inc. 84.6% 14.0% 1.4% 57.4% 9.5% 0.9% 15.1%SunTrust Banks, Inc. 97.1% 2.4% 0.5% 74.0% 1.9% 0.4% 9.3%T. Rowe Price Group, Inc. 97.9% 0.9% 1.3% 76.8% 0.7% 1.0% 11.1%Target Corporation 91.3% 7.7% 1.0% 69.6% 5.9% 0.8% 10.4%TECO Energy, Inc. 92.7% 6.0% 1.3% 61.1% 3.9% 0.9% 22.2%Tellabs, Inc. 92.7% 4.9% 2.4% 65.2% 3.4% 1.7% 12.4%Teradata Corporation 93.3% 6.5% 0.2% 70.5% 4.9% 0.2% 8.1%

> 44
FIGURE 19> Management Proposal – Advisory Vote on Executive Compensation, Voting Results for the S&P 500 Index – 2011
As Percentage of Votes Cast As Percentage of Shares Outstanding
Company For Against Abstain For Against Abstain Non-Vote
Teradyne, Inc. 97.2% 2.4% 0.3% 77.0% 1.9% 0.3% 10.2%Tesoro Corporation 88.7% 11.0% 0.3% 64.8% 8.1% 0.2% 13.9%Texas Instruments Incorporated 96.2% 3.0% 0.8% 74.0% 2.3% 0.6% 8.9%Textron Inc. 81.6% 15.9% 2.5% 62.9% 12.3% 2.0% 9.5%Thermo Fisher Scientific Inc. 98.7% 1.2% 0.2% 77.6% 0.9% 0.1% 5.8%Tiffany & Co. 97.3% 1.6% 1.1% 76.1% 1.3% 0.9% 5.7%Time Warner Cable Inc. 89.0% 10.8% 0.3% 72.8% 8.8% 0.2% 5.5%Time Warner Inc. 76.9% 22.4% 0.7% 62.3% 18.1% 0.6% 6.9%TJX Companies, Inc. 96.8% 3.0% 0.3% 81.8% 2.5% 0.2% 4.8%Torchmark Corporation 97.1% 2.6% 0.3% 76.6% 2.1% 0.3% 7.0%Total System Services Inc. 64.9% 34.6% 0.6% 47.1% 25.1% 0.4% 13.6%Travelers Companies, Inc. 80.0% 19.4% 0.7% 61.2% 14.8% 0.5% 9.2%Tyco International Ltd. 70.6% 26.5% 2.9% 52.8% 19.8% 2.1% 5.3%Tyson Foods, Inc. 88.7% 11.2% 0.1% 81.2% 10.2% 0.1% 2.9%U.S. Bancorp 93.4% 5.7% 0.9% 65.2% 4.0% 0.6% 13.6%Union Pacific Corporation 96.7% 3.1% 0.2% 76.8% 2.5% 0.2% 9.7%United Parcel Service, Inc. 90.8% 6.6% 2.5% 60.7% 4.4% 1.7% 3.5%United States Steel Corporation 65.9% 33.6% 0.4% 43.8% 22.4% 0.3% 12.1%United Technologies Corporation 97.1% 2.4% 0.5% 74.7% 1.9% 0.4% 9.0%UnitedHealth Group Incorporated 96.4% 2.8% 0.8% 77.8% 2.3% 0.7% 6.7%Unum Group 97.0% 3.0% 0.1% 80.1% 2.5% 0.1% 4.4%Urban Outfitters, Inc. 99.2% 0.8% 0.0% 83.2% 0.7% 0.0% 0.0%Valero Energy Corporation 67.5% 32.2% 0.3% 48.5% 23.1% 0.2% 12.2%Varian Medical Systems Inc. 96.2% 3.1% 0.7% 73.0% 2.4% 0.5% 8.8%Ventas Inc. 96.1% 2.4% 1.5% 84.3% 2.1% 1.3% 4.0%VeriSign, Inc. 98.2% 1.6% 0.3% 82.4% 1.3% 0.2% 7.2%Verizon Communications Inc. 90.7% 7.8% 1.4% 56.9% 4.9% 0.9% 20.7%VF Corporation 94.5% 5.1% 0.4% 77.4% 4.1% 0.4% 7.7%Viacom Inc. 86.5% 3.6% 9.9% 82.0% 3.4% 9.4% 3.3%Visa Inc. 97.9% 1.6% 0.5% 63.0% 1.0% 0.3% 11.3%Vornado Realty Trust 54.5% 45.5% 0.0% 46.2% 38.5% 0.0% 5.5%Vulcan Materials Company 94.2% 5.6% 0.2% 70.9% 4.2% 0.2% 10.7%W.W. Grainger, Inc. 97.1% 2.1% 0.8% 82.3% 1.8% 0.7% 5.2%Wal-Mart Stores, Inc. 98.8% 1.0% 0.2% 82.6% 0.8% 0.1% 7.1%Walt Disney Company 76.8% 22.7% 0.5% 57.6% 17.0% 0.3% 11.1%Washington Post Company 100.0% 0.0% 0.0% 100.0% 0.0% 0.0% 0.0%Waste Management, Inc. 96.9% 1.6% 1.5% 74.8% 1.2% 1.2% 12.5%Waters Corporation 95.3% 4.5% 0.1% 79.7% 3.8% 0.1% 4.3%Watson Pharmaceuticals, Inc. 95.3% 4.4% 0.4% 72.3% 3.3% 0.3% 8.7%WellPoint, Inc. 83.7% 16.2% 0.1% 62.3% 12.0% 0.1% 6.0%Wells Fargo & Company 96.5% 3.0% 0.5% 73.9% 2.3% 0.4% 9.2%Western Union Company 95.7% 4.2% 0.1% 79.5% 3.5% 0.1% 5.2%Weyerhaeuser Company 80.4% 19.1% 0.5% 64.1% 15.2% 0.4% 7.9%Whirlpool Corporation 96.7% 2.5% 0.8% 76.2% 1.9% 0.6% 7.6%Whole Foods Market, Inc. 97.2% 2.0% 0.8% 74.4% 1.6% 0.6% 11.8%Williams Companies, Inc. 95.8% 3.8% 0.4% 65.1% 2.6% 0.3% 15.3%Windstream Corporation 90.7% 8.3% 1.0% 49.4% 4.5% 0.6% 32.6%Wisconsin Energy Corporation 91.0% 7.6% 1.4% 67.4% 5.6% 1.1% 10.5%Wyndham Worldwide Corporation 87.4% 12.5% 0.1% 76.3% 11.0% 0.1% 5.6%Wynn Resorts, Limited 79.2% 20.6% 0.2% 66.5% 17.3% 0.2% 4.8%Xcel Energy Inc. 90.6% 5.5% 3.8% 59.4% 3.6% 2.5% 16.4%Xerox Corporation 79.2% 20.2% 0.6% 60.9% 15.5% 0.5% 10.7%XL Group plc 87.0% 12.9% 0.1% 75.4% 11.2% 0.1% 3.3%Yahoo! Inc. 69.4% 29.6% 1.0% 49.9% 21.3% 0.7% 12.2%Yum! Brands, Inc. 94.3% 5.5% 0.2% 66.5% 3.9% 0.2% 13.2%Zimmer Holdings, Inc. 62.8% 36.4% 0.8% 47.1% 27.3% 0.6% 9.9%Zions Bancorporation 96.4% 3.6% 0.0% 70.9% 2.6% 0.0% 10.5%

PART 5> Management Proposal — Repeal Classified Board

> 46
FIGURE 20> Management Proposal – Repeal Classified Board – 2002 to 2011
5 23
37
32
46
35
43
29
45
2002 2003 2004 2005 2006 2007 2008 2009 2010
36
2011
0
10
20
30
40
50
Nu
mb
er o
f P
rop
osa
ls

> 47
FIGURE 21> Management Proposal – Repeal Classified Board, Voting Results – 2011
As Percentage of Votes Cast As Percentage of Shares Outstanding
Company Vote RequirementMgmt. Rec.
For Against Abstain For Against Abstain Non-Vote
Abercrombie & Fitch Co. 75% of outstanding shares For 98.4% 1.5% 0.1% 88.5% 1.3% 0.1% 0.0%
Adobe Systems Incorporated Majority of outstanding shares For 99.3% 0.5% 0.2% 85.7% 0.4% 0.2% 0.0%
Allergan, Inc. Majority of outstanding shares For 99.5% 0.4% 0.1% 86.0% 0.3% 0.1% 0.0%
AmerisourceBergen Corporation Majority of outstanding shares For 99.4% 0.4% 0.2% 85.4% 0.4% 0.2% 1.6%
Avery Dennison Corporation Majority of outstanding shares For 99.0% 0.7% 0.4% 88.4% 0.6% 0.3% 0.0%
Avista Corporation 80% of outstanding shares For 98.0% 1.5% 0.5% 88.3% 1.4% 0.5% 0.0%
Barnes Group Inc. Two-thirds of outstanding shares Against 72.5% 26.3% 1.2% 55.1% 20.0% 0.9% 0.0%
Baxter International Inc. Two-thirds of outstanding shares For 89.2% 7.0% 3.8% 8.4% 0.7% 0.4% 0.0%
Biogen Idec Inc. Majority of outstanding shares For 99.2% 0.4% 0.4% 86.2% 0.3% 0.3% 0.0%
Capital One Financial Corporation 80% of outstanding shares For 99.5% 0.4% 0.1% 82.9% 0.4% 0.1% 0.0%
Danaher Corporation Majority of outstanding shares For 99.4% 0.4% 0.2% 88.1% 0.4% 0.2% 0.0%
DIRECTV Majority of outstanding shares For 99.6% 0.3% 0.1% 83.8% 0.3% 0.1% 0.0%
DTE Energy Company Majority of votes cast For 95.6% 2.8% 1.6% 75.5% 2.2% 1.3% 0.0%
Dun & Bradstreet Corporation 80% of outstanding shares For 98.9% 0.6% 0.6% 88.0% 0.5% 0.5% 0.0%
Eastman Chemical Company Majority of outstanding shares For 98.9% 0.7% 0.4% 85.2% 0.6% 0.4% 0.0%
Eaton Corp. Two-thirds of outstanding shares For 99.1% 0.7% 0.2% 81.4% 0.6% 0.2% 7.3%
Eli Lilly and Company 80% of outstanding shares For 84.9% 14.6% 0.5% 73.3% 12.6% 0.4% 0.0%
First Financial Bancorp. Two-thirds of outstanding shares For 99.0% 0.6% 0.3% 89.3% 0.6% 0.3% 0.0%
First Financial Bancorp. Majority of outstanding shares For 99.1% 0.5% 0.4% 89.3% 0.5% 0.3% 0.0%
First Niagara Financial Group, Inc. 80% of outstanding shares For 98.3% 1.3% 0.4% 87.4% 1.1% 0.3% 0.0%
Fluor Corporation 80% of outstanding shares For 99.0% 0.7% 0.3% 86.5% 0.6% 0.3% 0.0%
FTI Consulting, Inc. Majority of votes cast For 96.4% 3.5% 0.1% 87.7% 3.2% 0.1% 0.0%
Life Technologies Corp.* Majority of votes cast For 99.1% 0.7% 0.2% 76.9% 0.6% 0.2% 7.6%
MetLife, Inc. 75% of outstanding shares For 99.8% 0.1% 0.1% 84.3% 0.1% 0.0% 0.0%
National Oilwell Varco, Inc. Majority of outstanding shares For 99.5% 0.5% 0.1% 82.5% 0.4% 0.0% 0.0%
NVIDIA Corporation Two-thirds of outstanding shares For 99.6% 0.3% 0.1% 83.8% 0.2% 0.1% 0.0%
Principal Financial Group, Inc. 75% of outstanding shares For 98.6% 1.1% 0.2% 66.1% 0.8% 0.1% 0.0%
Red Robin Gourmet Burgers, Inc. Majority of votes cast None 91.0% 0.6% 8.4% 59.2% 0.4% 5.5% 20.9%
Reliance Steel & Aluminum Co. Majority of votes cast For 99.6% 0.3% 0.1% 91.5% 0.3% 0.1% 0.0%
Ross Stores, Inc. Two-thirds of outstanding shares For 98.5% 1.4% 0.0% 88.4% 1.3% 0.0% 0.0%
Skyworks Solutions, Inc. 80% of outstanding shares For 98.2% 1.5% 0.4% 83.0% 1.2% 0.3% 0.0%
Toll Brothers, Inc. Two-thirds of outstanding shares For 99.2% 0.2% 0.7% 86.2% 0.1% 0.6% 0.0%
Valero Energy Corporation 80% of outstanding shares For 98.2% 1.2% 0.6% 82.5% 1.0% 0.5% 0.0%
Visa Inc. Majority of outstanding shares For 99.4% 0.5% 0.1% 75.2% 0.4% 0.1% 0.0%
Watson Pharmaceuticals, Inc. Majority of outstanding shares For 99.6% 0.2% 0.2% 84.2% 0.2% 0.2% 0.0%
West Pharmaceutical Services, Inc. 80% of outstanding shares For 99.7% 0.3% 0.1% 90.0% 0.2% 0.0% 0.0%
* Combined proposal

This page intentionally left blank.

PART 6> Proxy Contests

> 50
FIGURE 22> Contested Solicitation Trend – 1981 to 2011
Company Dissident Contested Issues Winner
Ameron International Corporation Barington Group Director Dissident
Benihana Inc. Benihana of Tokyo, Inc. Vote against the proposed reclassification Dissident
Capital Gold Corporation Timmins Gold Corp. Vote against merger Pending
Cedar Fair, L.P. Q Funding III, L.P. Separate the roles of chairman and CEO, amend partnership agreement Split
Cedar Fair, L.P. Q Funding III, L.P. Amend partnership agreement Management
Cephalon, Inc. Valeant Pharmaceuticals International, Inc. Consent to remove and nominate directors Withdrawn
Cryo-Cell International, Inc. David I. Portnoy and affiliated entities Directors Dissident
Dynegy Inc. Seneca Capital Consent to remove and nominate directors Withdrawn
EMS Technologies, Inc. MMI Investments, L.P. Directors Withdrawn
Fisher Communications, Inc. FrontFour Master Fund, Ltd. Directors Split
Forest Laboratories, Inc. Carl C. Icahn and affiliated entities Directors Management
Leap Wireless International, Inc. Pentwater Capital Management LP Directors Settled
Mac-Gray Corporation TUC Investor Value Creation Group, LLC Directors Management
Mentor Graphics Corporation Carl C. Icahn and affiliated entities Directors Dissident
MPG Office Trust, Inc. Caspian Capital Advisors, LLC Directors Dissident
Myers Industries, Inc. GAMCO Asset Management Inc. Directors Management
National Technical Systems, Inc. Dr. Jack Lin Directors Management
Pulse Electronics Corporation Bel Fuse Inc. Directors Management
Putnam Municipal Opportunities Trust Karpus Investment Management Directors, vote against investment management agreement None1
Zoran Corporation Ramius Value and Opportunity Master Fund Ltd Consent to remove and nominate directors Split
FIGURE 23> Contested Solicitations – 2011*
Contested Solicitations 5-Year Moving Average
28
198
1
26
198
2
24
198
3
198
420
198
531
198
628
198
721
198
836
198
941
199
035
199
122
199
216 3
199
3
199
419
199
519
199
628
199
729
199
820
199
930
200
030
200
140
200
238
200
337
200
428
200
523
200
631
200
746
200
856
200
957
2010
35
2011
20N
um
ber
of C
on
test
ed S
olic
itatio
ns
0
10
20
30
40
50
60

> 51
FIGURE 23> Contested Solicitations – 2011*
1 None of the nominees received a sufficient number of votes to be elected; therefore, the incumbent directors/trustees will continue serving.
* Contested solicitations are defined as campaigns where dissidents distribute a separate proxy card. Also, only solicitation where materials were filed under Section 14 of the United States Securities Exchange Act of 1934 were included, so that the proxy fights in foreign jurisdictions were excluded.
** Other activist campaigns include publicized disputes where persons attempted to influence the results of a proxy solicitation without distributing opposition proxy material.
Other Activist Campaigns, 2011**
Company Dissident Contested Issues
Amazon.com, Inc. Calvert Investment Management, Inc. Vote for shareholder proposal
American Financial Group, Inc. Calvert Investment Management, Inc. Vote for shareholder proposal
Apple Inc. CalPERS Vote for shareholder proposal
Bob Evans Farms, Inc. Humane Society of the United States Vote for shareholder proposal
Chevron Corporation Trillium Asset Management, LLC Vote for shareholder proposal
Chevron Corporation Sisters of St. Francis of Philadelphia Vote for shareholder proposal
Community Health Systems, Inc. CtW Investment Group Withhold on directors
ConocoPhillips CalSTRS and Trillium Asset Management, LLC Vote for shareholder proposal
CPEX Pharmaceuticals, Inc. Mangrove Partners Fund, L.P. Against proposed acquisition
Duke Energy Corporation As You Sow Foundation Vote for shareholder proposal
Exxon Mobil Corporation As You Sow Foundation Vote for shareholder proposal
Gentex Corporation Walden Asset Management Vote for shareholder proposal
Hospitality Properties Trust CalPERS Vote for shareholder proposal
International Business Machines Corporation Walden Asset Management Vote for shareholder proposal
J.M. Smucker Company Trillium Asset Management, LLC and Calvert Investment Management, Inc. Vote for shareholder proposal
OM Group Jesuits Vote for shareholder proposal
PepsiCo, Inc. Walden Asset Management Vote for shareholder proposal
Smithfield Foods Inc. CalPERS Vote for shareholder proposal
Ultra Petroleum As You Sow Foundation Vote for shareholder proposal
Urban Outfitters, Inc. Calvert Investment Management, Inc. Vote for shareholder proposal
Verizon Communications Inc. Association of BellTel Retirees, Inc. Vote for shareholder proposal and vote against management proposals
Wal-Mart Stores, Inc. New York City Pension Funds Vote for shareholder proposal

This page intentionally left blank.


ANNUAL CORPORATEGOVERNANCE REVIEW
> Annual Meetings> Shareholder Initiatives
> Proxy Contests
2011