annual budget - nyandeni local municipality · table a9 : asset management multi year capital...
TRANSCRIPT
1
NYANDENI LOCAL MUNICIPALITY
Annual Budget
3 Year Plan: 2018/19 to 2021
2
TABLE OF CONTENTS
No Description Page
1 Table of Contents 2
2 Mayor’s Report 3-6
3 Budget Related Resolutions 7-13
4 The Budget 144.1 Executive Summary 14-16
4.2 Operating Revenue Framework 17-25
4.3 Operating Expenditure Framework 26-32
4.4 Capital Expenditure 33-36
4.5 Annual Budget Schedules 37-66
Supporting Documentation 67
5 Budget Process Overview 67-77
6 Alignment of Budget with Integrated Development Plan 78
7 Budget Related Policies Overview and Amendments 78
8 Budget Assumptions 79
9 Funding the Budget 80-81
10 Annual budgets and service delivery and budget implementation plans
– internal departments 82
11 Contracts having future budgetary implications 82
12 Legislation compliance 83-84
13 Other supporting documents 85-96
14 Municipal Manager’s quality certification 97
Draft Annual Budget 2018-19 to 2021 Page 3
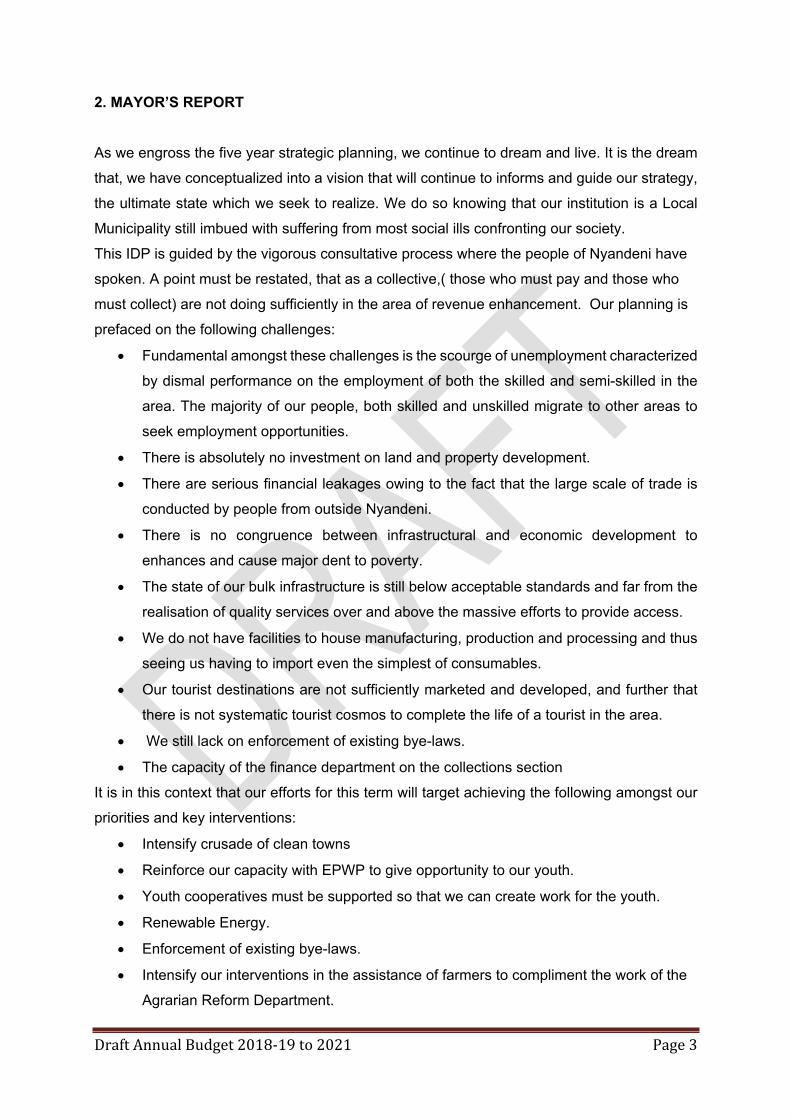
2. MAYOR’S REPORT
As we engross the five year strategic planning, we continue to dream and live. It is the dream
that, we have conceptualized into a vision that will continue to informs and guide our strategy,
the ultimate state which we seek to realize. We do so knowing that our institution is a Local
Municipality still imbued with suffering from most social ills confronting our society.
This IDP is guided by the vigorous consultative process where the people of Nyandeni have
spoken. A point must be restated, that as a collective,( those who must pay and those who
must collect) are not doing sufficiently in the area of revenue enhancement. Our planning is
prefaced on the following challenges:
Fundamental amongst these challenges is the scourge of unemployment characterized
by dismal performance on the employment of both the skilled and semi-skilled in the
area. The majority of our people, both skilled and unskilled migrate to other areas to
seek employment opportunities.
There is absolutely no investment on land and property development.
There are serious financial leakages owing to the fact that the large scale of trade is
conducted by people from outside Nyandeni.
There is no congruence between infrastructural and economic development to
enhances and cause major dent to poverty.
The state of our bulk infrastructure is still below acceptable standards and far from the
realisation of quality services over and above the massive efforts to provide access.
We do not have facilities to house manufacturing, production and processing and thus
seeing us having to import even the simplest of consumables.
Our tourist destinations are not sufficiently marketed and developed, and further that
there is not systematic tourist cosmos to complete the life of a tourist in the area.
We still lack on enforcement of existing bye-laws.
The capacity of the finance department on the collections section
It is in this context that our efforts for this term will target achieving the following amongst our
priorities and key interventions:
Intensify crusade of clean towns
Reinforce our capacity with EPWP to give opportunity to our youth.
Youth cooperatives must be supported so that we can create work for the youth.
Renewable Energy.
Enforcement of existing bye-laws.
Intensify our interventions in the assistance of farmers to compliment the work of the
Agrarian Reform Department.

Draft Annual Budget 2018-19 to 2021 Page 4
Provisioning of sufficient social amenities as an effort to provide access to services like
Banking, post services, police stations, and community halls.
Poor state of infrastructure, including roads and sewerage system. Vigour on the part
of maintenance for better quality of services.
Local Economic Development will be one of our key focal
This year as we mark the 100 years since the legend OR Tambo first saw the African sun. It is
proper to draw inspiration from the wise words of this African stalwart:
"We have…striven for seven decades to build one, common nationhood, with one destiny.
Our shared experience of collective sacrifices in the struggle for a common goal has knit us
together as one solid block of liberation. The comradeship that we have formed in the trenches
of freedom, transcending the barriers that the enemy sought to create, is a guarantee and a
precondition for our victory. But we need still to build on this achievement. All of us - workers,
peasants, students, priests, chiefs, traders, teachers, civil servants, poets, writers, men,
women and youth, black and white - must take our common destiny in our own hands."

Draft Annual Budget 2018-19 to 2021 Page 5
Below is the summarized Revenue & Expenditure MTERF 2018/2019
Current Year Revenue & Expenditure MTREF 2017-18
REVENUE & EXPENDITURE MTREF 2018/2019-2021
DESCRIPTION 2017/2018 2018/2019 2019/2020 2020/2021Own Revenue R 17,869,000 R 21,862,000 R 22,988,000 R 24,533,000
Transfer from
ReservesR 69,486,000 R 76,534,000 R 74, 172,000 R 73,425,000
Transfer Grants
(Operational Grants)R 253,218,000 R 259,523,000 R 277,609,000 R 287,586,000
TOTAL OPERATING REVENUE
R 340,573,000 R 357,919,000 R 374,769,000 R 385,544,000
Transfer Grants
(Capital Grants)R 86,718,000 R 96,269,000 R 80,597,000 R 75,649,000
TOTAL REVENUE R 427,291,000 R454,188,000 R 455,366,000 R 461,193,000
Salaries & Wages R 152,888,000 R 165,598,000 R 176,107,000 R 189,141,000
General Expenses R 106,544,000 R 96,337,000 R 101,001,000 R 97,691,000
Repairs &
Maintenance and
Bulk purchases
R 10,849,000 R 11,025,000 R 11,689,000 R 12,575,000
Depreciation and
Provisions for bad
debts
R 44,815,000 R 57,651,000 R 61,802,000 R 66,499,000
Transfers and grants
expenditureR 2,234,000 R 4,463,000 R 3,500,000 R 3,765,000
Capital Expenditure R 109,951,000 R 119,114,000 R 101,267,000 R 91,522,000
TOTAL EXPENDITURE
R 427,291,000 R 454,188,000 R 455,366,000 R 461,193,000
SURPLUS / (DEFICIT)
R 0 R 0 R 0 R 0
Draft Annual Budget 2018-19 to 2021 Page 6
The Operating Budget is funded from the following main sources:
• Own Revenue• Assessment Rates, Refuse removal
• Interest on investments
• Other Income such as DLTC & Registering Authority fees, Tender Fees, Rental of
Municipal Facilities, Traffic Fines, Commission Received, Building Plan Approval,
Hawker fees, Pound Fees, Cemetery Fees, Hall Hire fees etc.
• Operational Grants such as Equitable share, MIG Operational (to fund project
management administration costs), Finance Management Grant, Expanded Public Works
Programme, Integrated National Electrification Programme,
• Transfer from reserves; funding requested from reserves to fund the depreciation & debt
impairment provision together with some capital expenditures such as yellow plant
machinery, office buildings and other capital assets.
The capital budget is funded from Municipal Infrastructure grant, Small Town Revitalization
and Equitable share
Draft Annual Budget 2018-19 to 2021 Page 7
3. BUDGET RELATED RESOLUTIONS
Draft Annual Budget for 2018/19
3.1 Council resolves that the multi-year draft annual budget of capital and operating
expenditure for 2018/2019 and the indicated two outer years of 2019/2020 and 2020/2021
which has been tabled for public scrutiny, and be approved as set out by the following
amended tables:
Table A1 Budget summary
Table A2 : Budgeted financial performance (revenue and expenditure by standard
classification)
Table A3 : Budgeted financial performance (revenue and expenditure by
municipal vote)
Table A4 : Budget financial performance (revenue and expenditure)
Table A5 : Budgeted capital expenditure by vote and funding
Table A6 : Budgeted financial position
Table A7 : Budgeted cash flows
Table A8 : Cash backed reserves / accumulate surplus reconciliation
Table A9 : Asset management
Multi Year Capital Budget
3.2 Council resolves that multi-year capital appropriations by vote and associated funding
reflected in Table A5 be approved.
Property Rates and other Municipal Tax3.3. That, in terms of section 24 of the Local Government Municipal Property Rates Act, Act
6 of 2004, rates differentiating among the different categories of properties determined
by the actual use, the zoning and/or permitted use of properties, for property tax be
levied on market value of all rateable properties within the municipal area for the
financial year 1 July 2018 to 30 June 2019, provided that rebates, as indicated, on
application be allowed:
Draft Annual Budget 2018-19 to 2021 Page 8
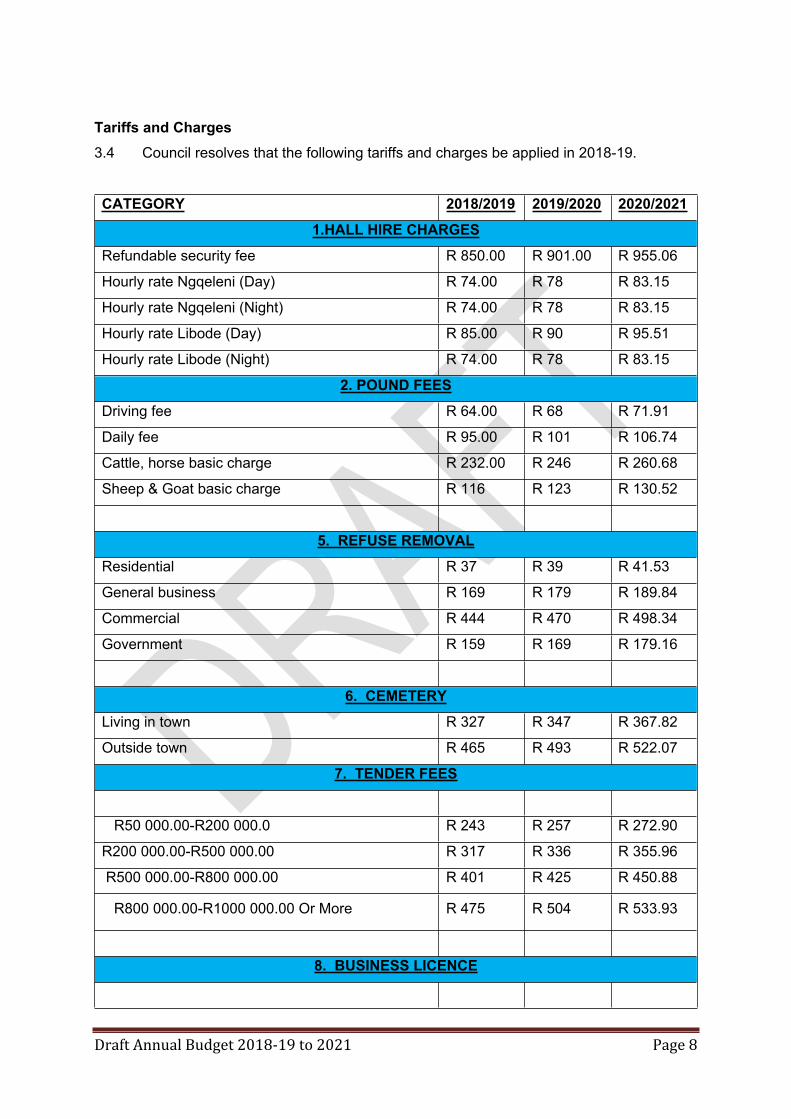
Tariffs and Charges3.4 Council resolves that the following tariffs and charges be applied in 2018-19.
CATEGORY 2018/2019 2019/2020 2020/20211.HALL HIRE CHARGES
Refundable security fee R 850.00 R 901.00 R 955.06
Hourly rate Ngqeleni (Day) R 74.00 R 78 R 83.15
Hourly rate Ngqeleni (Night) R 74.00 R 78 R 83.15
Hourly rate Libode (Day) R 85.00 R 90 R 95.51
Hourly rate Libode (Night) R 74.00 R 78 R 83.15
2. POUND FEESDriving fee R 64.00 R 68 R 71.91
Daily fee R 95.00 R 101 R 106.74
Cattle, horse basic charge R 232.00 R 246 R 260.68
Sheep & Goat basic charge R 116 R 123 R 130.52
5. REFUSE REMOVALResidential R 37 R 39 R 41.53
General business R 169 R 179 R 189.84
Commercial R 444 R 470 R 498.34
Government R 159 R 169 R 179.16
6. CEMETERYLiving in town R 327 R 347 R 367.82
Outside town R 465 R 493 R 522.07
7. TENDER FEES
R50 000.00-R200 000.0 R 243 R 257 R 272.90
R200 000.00-R500 000.00 R 317 R 336 R 355.96
R500 000.00-R800 000.00 R 401 R 425 R 450.88
R800 000.00-R1000 000.00 Or More R 475 R 504 R 533.93
8. BUSINESS LICENCE
Draft Annual Budget 2018-19 to 2021 Page 9
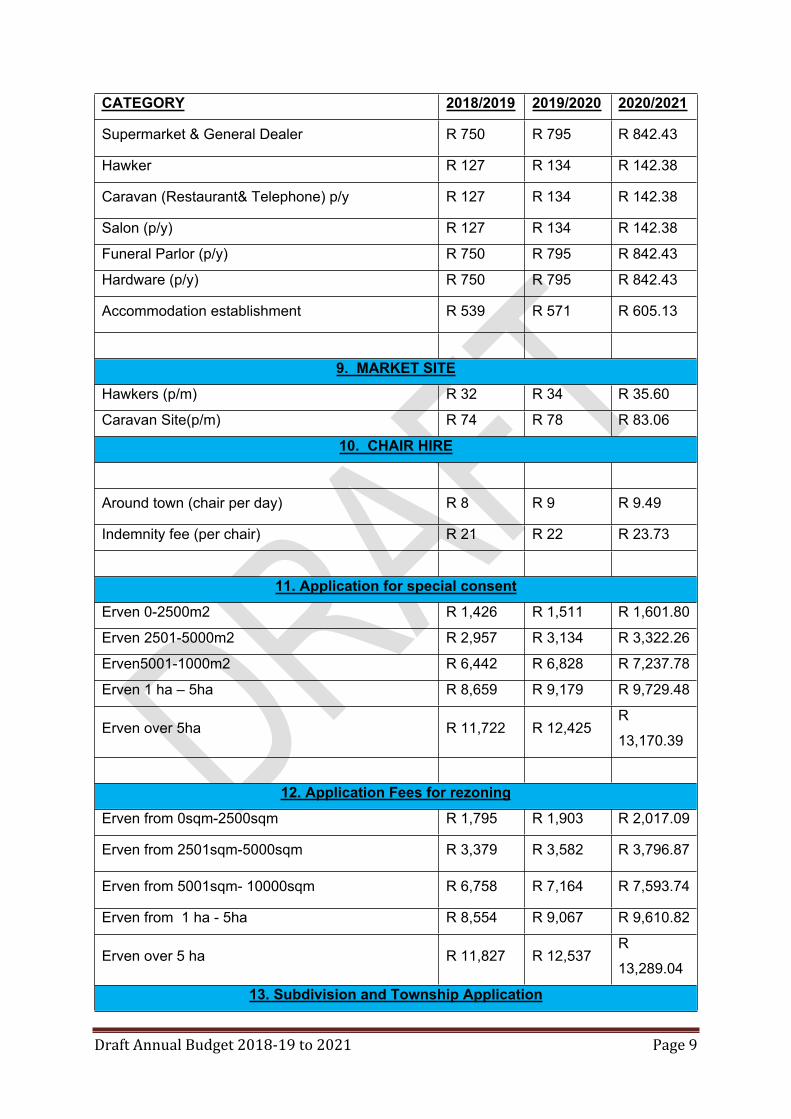
CATEGORY 2018/2019 2019/2020 2020/2021
Supermarket & General Dealer R 750 R 795 R 842.43
Hawker R 127 R 134 R 142.38
Caravan (Restaurant& Telephone) p/y R 127 R 134 R 142.38
Salon (p/y) R 127 R 134 R 142.38
Funeral Parlor (p/y) R 750 R 795 R 842.43
Hardware (p/y) R 750 R 795 R 842.43
Accommodation establishment R 539 R 571 R 605.13
9. MARKET SITEHawkers (p/m) R 32 R 34 R 35.60
Caravan Site(p/m) R 74 R 78 R 83.06
10. CHAIR HIRE
Around town (chair per day) R 8 R 9 R 9.49
Indemnity fee (per chair) R 21 R 22 R 23.73
11. Application for special consentErven 0-2500m2 R 1,426 R 1,511 R 1,601.80
Erven 2501-5000m2 R 2,957 R 3,134 R 3,322.26
Erven5001-1000m2 R 6,442 R 6,828 R 7,237.78
Erven 1 ha – 5ha R 8,659 R 9,179 R 9,729.48
Erven over 5ha R 11,722 R 12,425R
13,170.39
12. Application Fees for rezoningErven from 0sqm-2500sqm R 1,795 R 1,903 R 2,017.09
Erven from 2501sqm-5000sqm R 3,379 R 3,582 R 3,796.87
Erven from 5001sqm- 10000sqm R 6,758 R 7,164 R 7,593.74
Erven from 1 ha - 5ha R 8,554 R 9,067 R 9,610.82
Erven over 5 ha R 11,827 R 12,537R
13,289.04
13. Subdivision and Township Application

Draft Annual Budget 2018-19 to 2021 Page 10
CATEGORY 2018/2019 2019/2020 2020/2021 Erven 1-2 R 1,795 R 1,903 R 2,017.09
Erven 1-3 R 2,429 R 2,575 R 2,729.00
Erven 1-4 R 2,957 R 3,134 R 3,322.26
Erven 1-5 R 3,590 R 3,806 R 4,034.17
Erven 1-6 R 4,330 R 4,589 R 4,864.74
Erven 1-7 R 4,752 R 5,037 R 5,339.35
Erven 1-8 R 5,491 R 5,821 R 6,169.91
Erven 1-9 R 6,019 R 6,380 R 6,763.17
Erven 1-10 R 6,547 R 6,940 R 7,356.43
Erven more than 10 R 8,976 R 9,515R
10,085.43
14. Application for depature from building linesErven 0 – 5000m2 R 1,162 R 1,231 R 1,305.17
Erven 5001 –more R 1,690 R 1,791 R 1,898.43
Application for Removal of Restrictions R 8,342 R 8,843 R 9,373.52
Zoning Certificates R 127 R 134 R 142.38
Extension of time R 433 R 459 R 486.47
Town Planning Scheme CD R 232 R 246 R 261.03
Amendments to Existing subdivision R 1,795 R 1,903 R 2,017.09
Application for consolidation of Erven R 1,795 R 1,903 R 2,017.09
SG Diagram R 42 R 45 R 47.46
15. Building plans
Building Approval Fees per m2 R 32 R 34 R 35.60
Building plan fees:
A3 R 13 R 13 R 14.24
A2 R 18 R 19 R 20.17
A1 R 30 R 31 R 33.22
Approval fee for minor works(0-10m2):
Internal alterations per m2 R 18 R 19 R 20.10
External alteration per m2 R 14 R 15 R 15.42
Boundary walls R 634 R 672 R 711.91
Shelter: Carport per m2 R 19 R 20 R 21.36
Car wash per m2 R 14 R 15 R 15.42

Draft Annual Budget 2018-19 to 2021 Page 11
CATEGORY 2018/2019 2019/2020 2020/2021Braai area per m2 R 19 R 20 R 21.36
Temporary structure:
Wendy flats per m2 R 19 R 20R 21.27
Prefab per m2 R 19 R 20 R 21.36
Container p.a R 1,267 R 1,343 R 1,423.83
Caravans per p.a. R 634 R 672 R 711.91
Storage Facility p.a. R 1,267 R 1,343 R 1,423.83
Builders Shelter p.a. R 634 R 672 R 711.91
16. Libode eco parkEntrance fee per person R 10.00 R 10.56 R 11.19
Company events per day or night (06:00 - 18:00 or
18:01 - 06:00)R 1 500.00 R 1 584.00 R 1 672.70
Church events per day or night (06:00 - 18:00 or
18:01 - 06:00)R 1 200.00 R 1 267.20 R 1 338.16
Entertainment shows per day or night (06:00 -
18:00 or 18:01 - 06:00)R 2 000.00 R 2 112.00 R 2 230.27
Educational tours per day R 300.00 R 316.80 R 335.81
Photoshoot per day R 250.00 R 264.00 R 279.84
Toilet entrance fees R 2.00 R 2.11 R 2.24
17. Property ratesResidential Property R 0.0082 R 0.0082 R 0.0087
Businesses R 0.0122 R 0.0122 R 0.0129
Government1 R 0.0122 R 0.0122 R 0.0129
government2 R 0.0122 R 0.0122 R 0.0129
Agriculture1 R 0.0020 R 0.0022 R 0.0023
Agriculture2 R 0.0020 R 0.0022 R 0.0023
Institutions R 0.0122 R 0.0122 R 0.0129
Clinics R 0.0122 R 0.0122 R 0.0129
Hospital R 0.0122 R 0.0122 R 0.0129
Schools R 0.0122 R 0.0122 R 0.0129
Trading Stations R 0.0122 R 0.0122 R 0.0129
R 61 Road R 0.0020 R 0.0020 R 0.0021
N2 Road R 0.0020 R 0.0020 R 0.0021
18. Rates and services clearance certificate

Draft Annual Budget 2018-19 to 2021 Page 12
CATEGORY 2018/2019 2019/2020 2020/2021
Rates and refuse clearance certificate R 70.00 R 70.00 R 80.00
19. Sports field
Commercial & Professional use per day R 700.00 R 739.20 R 780.60
Amateur bodies, welfare and religious
organizations per dayR 400.00 R 422.40 R 446.05
Professional practice per day R 900.00 R 950.40 R 1 003.62
Amateur practice per day R 400.00 R 422.40 R 446.05
Special letting – music concerts/festival flairs etc R 1 700.00 R 1 795.20 R 1 895.73
Measurable Performance Objectives
3.5 Council resolves that the measurable performance objectives for revenue from each
source and for each vote reflect the budget.
Integrated Development Plan3.6 Council resolves to approve the implementation of the Integrated Development Plan.
Budget Related Polices 3.7 Council resolves that the following budget related polices be approved
Supply Chain Management
Asset Management
Credit Control and Debt Collection
Budget and IDP Policy
Bad debts write off
Rates policy
Tariff policy
Banking and investment policy
Indigent Policy
Expenditure management policy
Draft Annual Budget 2018-19 to 2021 Page 13
Cashflow 3.8 Council resolves that the projects identified for implementation are subject to funds
available from grants in respect of Equitable share, Integrated National Electrification
Programme,Finance Management Grant, Expanded Public Works Programme
Incentive Grant and Municipal Infrastructure Grant and Small Town Revitilisation.
4. THE BUDGET
This section contains an Executive Summary of the annual budget, highlighting the processes
and assumptions which lead to the compilation of the annual budget.
4.1 Executive SummaryThe budget process is governed by the Municipal Finance Management Act 56 of 2003
and the Municipal Systems Act 32 of 2000. The objective process is to ensure good
governance and accountability and enables the municipality to involve residents and other
stakeholders in the budgeting process.
In terms of Section 16 (1) and (2) of the Municipal Finance Management Act no 56 of 2003:
(1) The council of a municipality must for each financial year approve an annual budget for
the municipality before the start of that financial year.
(2) In order for the municipality to comply with subsection (1), the mayor of the municipality must table the annual budget at a council meeting at least 90 days before the start of the budget year.
In terms of Section 24 (1) and (2) of the Municipal Finance Management Act (MFMA) No
56, 2003:
“(1) The municipal council must at least 30 days before the start of the budget year consider
approval of the annual budget.
(2) An annual budget –
(a) must be approved before the start of the budget year;
(b) is approved by the adoption by the council of a resolution referred to in section
17(3)(a)(i); and
(c) must be approved together with the adoption of resolutions as may be necessary –
(i) imposing any municipal tax for the budget year;
(ii) setting any municipal tariffs for the budget year;
(iii) approving measurable performance objectives for revenue from each source and for
each vote in the budget;

Draft Annual Budget 2018-19 to 2021 Page 14
(iv) approving any changes to the municipality’s integrated development plan; and
(v) approving any changes to the municipality’s budget-related policies.”
The application of sound financial management principles for the compilation of the NLM’s
financial plan is essential and critical to ensure that the NLM remains financially viable and that
municipal services are provided sustainably, economically and equitably to all communities
The NLM’s business and service delivery priorities were reviewed as part of this year’s
planning and budget process. Where appropriate, funds were transferred from low- to high-
priority programmes so as to maintain sound financial stewardship.
The following budget principles and guidelines directly informed the compilation of the 2018/19
MTREF:
Intermediate service level standards were used to inform the measurable objectives,
targets and backlog eradication goals;
Tariff and property rate considerations should be affordable and should generally not
exceed inflation as measured by the CPI, except where there are price increases in the
inputs of services that are beyond the control of the municipality. In addition, tariffs
need to remain or move towards being cost reflective, and should take into account the
need to address infrastructure backlogs;
There will be no budget allocated to national and provincial funded projects unless the
necessary grants to the municipality are reflected in the national and provincial budget
and have been gazetted as required by the annual Division of Revenue Act;
National Treasury’s MFMA Circular No. 66 ,67,70 , 72, 74, 75,78, 79, 82,85,86,89 and 90
were used to guide the compilation of the 2018/19 MTREF.
In view of the aforementioned, the following table is a consolidated overview of the proposed
2018/19 Medium-term Revenue and Expenditure Framework:
Draft Annual Budget 2018-19 to 2021 Page 15
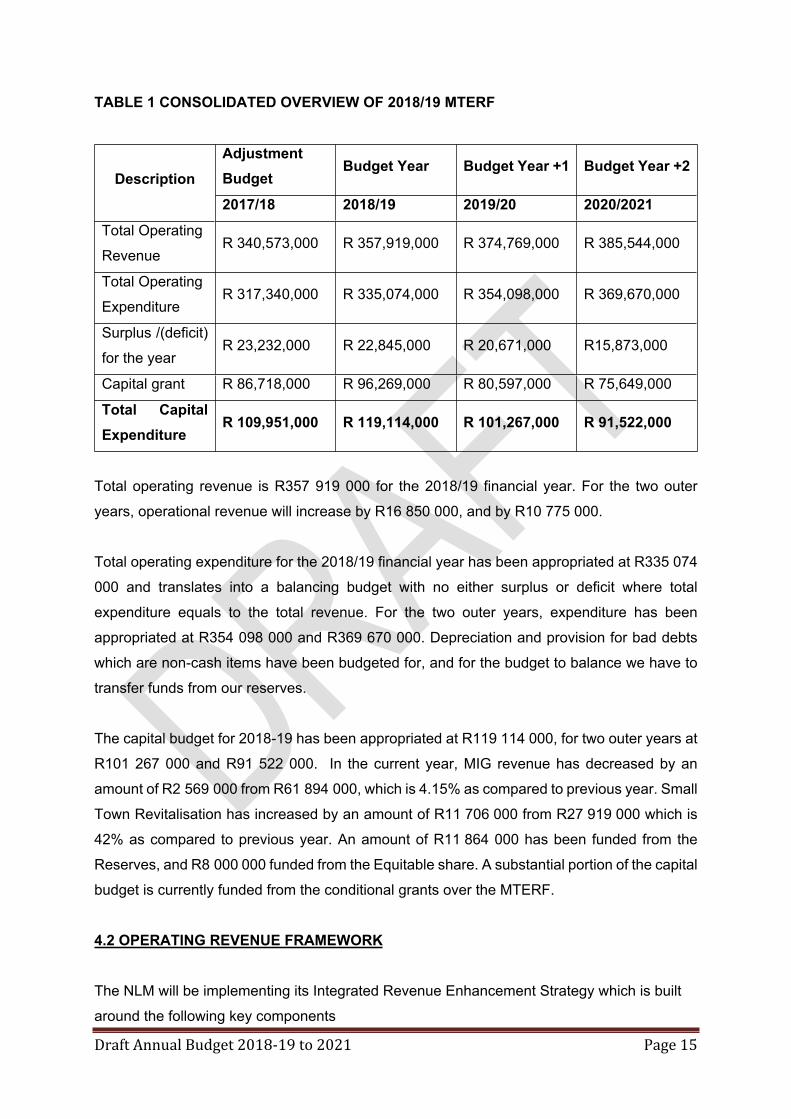
TABLE 1 CONSOLIDATED OVERVIEW OF 2018/19 MTERF
Adjustment Budget
Budget Year Budget Year +1 Budget Year +2Description
2017/18 2018/19 2019/20 2020/2021Total Operating
RevenueR 340,573,000 R 357,919,000 R 374,769,000 R 385,544,000
Total Operating
Expenditure R 317,340,000 R 335,074,000 R 354,098,000 R 369,670,000
Surplus /(deficit)
for the yearR 23,232,000 R 22,845,000 R 20,671,000 R15,873,000
Capital grant R 86,718,000 R 96,269,000 R 80,597,000 R 75,649,000
Total Capital Expenditure
R 109,951,000 R 119,114,000 R 101,267,000 R 91,522,000
Total operating revenue is R357 919 000 for the 2018/19 financial year. For the two outer
years, operational revenue will increase by R16 850 000, and by R10 775 000.
Total operating expenditure for the 2018/19 financial year has been appropriated at R335 074
000 and translates into a balancing budget with no either surplus or deficit where total
expenditure equals to the total revenue. For the two outer years, expenditure has been
appropriated at R354 098 000 and R369 670 000. Depreciation and provision for bad debts
which are non-cash items have been budgeted for, and for the budget to balance we have to
transfer funds from our reserves.
The capital budget for 2018-19 has been appropriated at R119 114 000, for two outer years at
R101 267 000 and R91 522 000. In the current year, MIG revenue has decreased by an
amount of R2 569 000 from R61 894 000, which is 4.15% as compared to previous year. Small
Town Revitalisation has increased by an amount of R11 706 000 from R27 919 000 which is
42% as compared to previous year. An amount of R11 864 000 has been funded from the
Reserves, and R8 000 000 funded from the Equitable share. A substantial portion of the capital
budget is currently funded from the conditional grants over the MTERF.
4.2 OPERATING REVENUE FRAMEWORK
The NLM will be implementing its Integrated Revenue Enhancement Strategy which is built
around the following key components

Draft Annual Budget 2018-19 to 2021 Page 16
National Treasury’s guidelines and macroeconomic policy;
The municipality’s Property Rates Policy approved in terms of the Municipal Property
Rates Act, 2004 (Act 6 of 2004) (MPRA);
The municipality’s Indigent Policy and rendering of free basic services; and
Tariff policy of the NLM.
Implementation of its Credit Control and Debt Collection policy and by-laws

Draft Annual Budget 2018-19 to 2021 Page 17

18
The following table is a summary of the 2018/19 MTREF (classified by main revenue source):
Table 2 Summary of revenue classified by main revenue source

Draft Annual Budget 2018-19 to 2021 Page 19

Draft Annual Budget 2018-19 to 2021 Page 20
TABLE 3 Percentage growth in revenue by main revenue source
DescriptionRef
Current Year 2017/182018/19 Medium Term Revenue & Expenditure Framework
R thousand 1Adjusted Budget
Increase/(decrease) %
Budget Year
Budget Year
2018/19
Increase/(decrease) %
Budget Year +1 2019/20
Increase/(decrease) %
Budget Year +2 2020/21
Increase/(decrease)%
Revenue By Source
Property rates 2 4 999 4 999 5 726 15% 6 138 7%
6 605 7.6%
Service charges -
electricity revenue 2 (2 153) (2 153)
–
–
–
Service charges - water
revenue 2
–
–
–
–
–
Service charges -
sanitation revenue 2
–
–
–
–
–
Service charges -
refuse revenue 2
210
210
277 31%
295 6.5%
313 6%
Service charges – other

Draft Annual Budget 2018-19 to 2021 Page 21
Rental of facilities and
equipment
42
42
45 7%
47 4%
50 6%
Interest earned -
external investments 8 000 8 000 8 300 4% 8 831 6.3%
9 396 6%
Interest earned -
outstanding debtors 1 270 1 270 1 233 (3%) 1 312 6.4%
1 396 6%
Dividends received
–
–
Fines, penalties and
forfeits
382
382
430 13%
457 6.2%
487 7%
Licences and permits 4 012 4 012 4 356 9% 4 635 6.4%
4 931 6%
Agency services
400
400
426 7%
453 6.3%
482 6%
Transfers and subsidies 253 218 253 218 259 523 2.4% 277 609 7%
287 586 4%
Other revenue 2
707
707 1 010 43%
755 (25%)
804 6%
Gains on disposal of
PPE 69 486 69 486 78 435 13% 70 358 (10%)
67 461 (4%)
Total Revenue (excluding capital transfers and contributions)
340 573 340 573 359 760 370 891 379 511

22
In line with the formats prescribed by the Municipal Budget and Reporting Regulations, capital
transfers and contributions are excluded from the operating statement, as inclusion of these
revenue sources would distort the calculation of the operating surplus/deficit.
Revenue generated from rates and services charges forms 2 percent of the revenue basket
for the NLM. In the 2018/19 financial year, revenue from rates and taxes total R7 632 180 or
2 per cent, and the figure exclude the revenue forgone.
In 2019/20 it shows an amount of R8 181 697, and in 2020/21 year shows an amount of R8
803 506. The revenue generated from rates and taxes has increased by 6 per cent in 2018/19,
for two outer years increased by 6 per constantly. The above mentioned rates and taxes
revenue for the 2018/19 -21 MTERF exclude revenue foregone arising from discounts and
rebates associated with the tariff policies of the Municipality. The revenue forgone for each
year shows an amount of R1 906 186, R2 043 431 and R2 198 732.
The Municipality will implement a new General Valuation roll from 1 July 2018. The new
General Valuation roll will be valid for a period of 5 years and it will be updated with
supplementary valuation rolls each year as per the requirements of Municipal Property Rates
Act. Upon implementing the Municipal Property Rates Act, the municipality has a Tariff Policy.
The tariff policy has considered the rebates for some of customers that may be regarded as
indigent.
Draft Annual Budget 2018-19 to 2021 Page 23
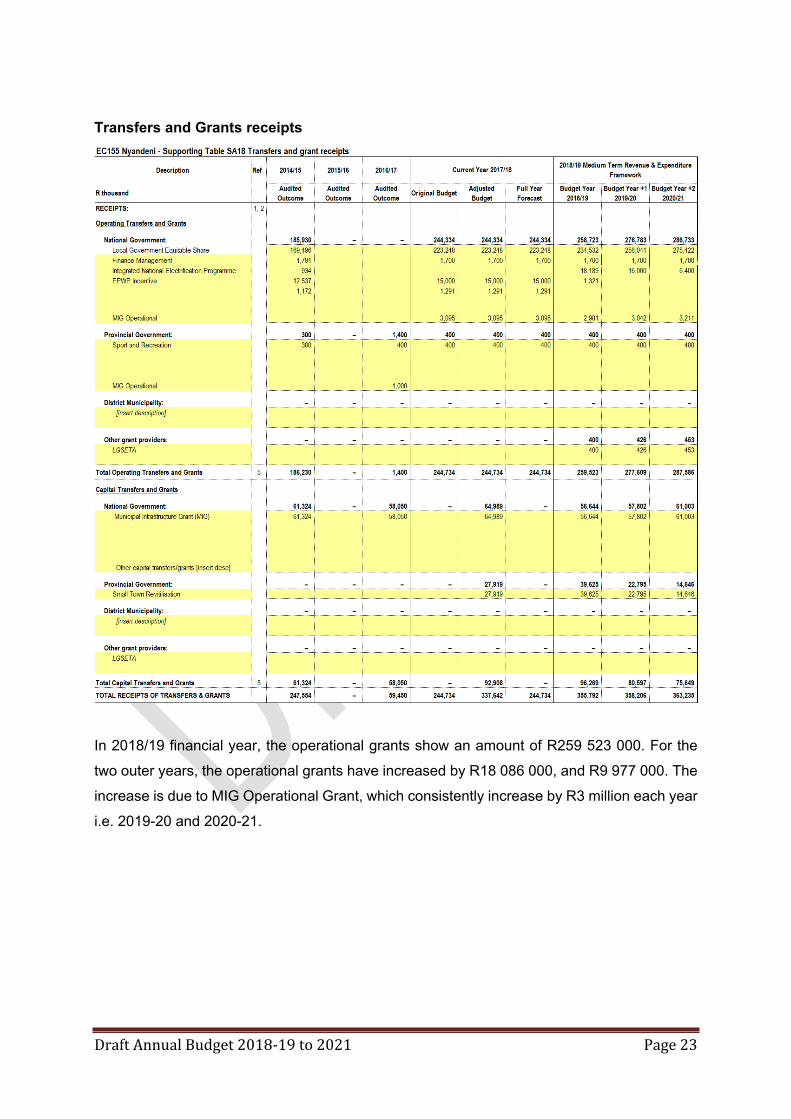
Transfers and Grants receipts
In 2018/19 financial year, the operational grants show an amount of R259 523 000. For the
two outer years, the operational grants have increased by R18 086 000, and R9 977 000. The
increase is due to MIG Operational Grant, which consistently increase by R3 million each year
i.e. 2019-20 and 2020-21.

Draft Annual Budget 2018-19 to 2021 Page 24
Table 5 Proposed rates to be levied for the 2018/19 financial year
RATES TARRIF
DETERMINATION OF TARIF AS PER CATERGORY AS FROM 1 JULY 2018-30 JUNE 2019
Property rates 2018/2019
Residential Property R 0.0082
Businesses R 0.0122
Government1 R 0.0122
government2 R 0.0122
Agriculture1 R 0.0020
Agriculture2 R 0.0020
Institutions R 0.0122
Clinics R 0.0122
Hospital R 0.0122
Schools R 0.0122
Trading Stations R 0.0122
R 61 Road R 0.0020
N2 Road R 0.0020

25
4.3 OPERATING EXPENDITURE FRAMEWORKThe NLM’s expenditure framework for the 2018/19 budget and MTREF is informed by the
following:
Funding of the budget over the medium-term as informed by Section 18 and 19 of the
MFMA;
Balanced budget constraint (operating expenditure should not exceed operating
revenue) unless there are existing uncommitted cash-backed reserves to fund any
deficit;
Strict adherence to the principle of no project plans no budget. If there is no business
plan no funding allocation can be made.
Also, there is a new reform i.e. MSCOA, which indicates that each line item, for each
to be budgeted, such a project should be in the Integrated Development Plan.
The following table is a high level summary of the 2018/19 budget and MTREF (classified per
main type of operating expenditure):

Draft Annual Budget 2018-19 to 2021 Page 26
(i) Employee Related Costs

Draft Annual Budget 2018-19 to 2021 Page 27
The three-year Salary and Wage Collective Agreement for the period 1 July 2015 to 30 June
2018 is coming to end on 30 June 2018. A new agreement has not been issued and for
purposes of preparing the draft budget the municipality took into consideration the agreement
that is coming to end in June 2018, when a new agreement is issued the budget will be adjusted
as such if the new agreement is issued before the adoption of the final budget. The following
was used in preparing the 2018/19 MTERF:
2018/19 Financial year – average CPI ( 6.4%) + 1 percent, that makes 7.4%
For the outer years the inflation rate based on average CPI plus 1per cent for 2020 and 2021
has been considered.
The cost associated with the remuneration of councilors is determined by the Minister of Co-
operative Governance and Traditional Affairs in accordance with the Remuneration of Public
Office Bearers Act, 1998 (Act 20 of 1998). The most recent proclamation in this regard has
been taken into account in compiling the NLM’s budget.
The overall amount of the Salaries and Wages is R165 598 000, and for two outer years, its
R176 106 000 (5.7%) and R189 141 000 (5.6%).
(ii) Depreciation & asset impairment & Debt impairment
Depreciation and Debt Impairment has been provided for at R57,6 million in 2018/19,
R57 million in 2019/20 and R62 million in 2020/21.
(iii)Contracted ServicesContracted services has been provided at R48 million
(iv)Transfers & Grants:An amount of R4, 9 million has been provided for free basic services in the form of Eskom
coupons and alternative energy.
(v) Materials and Other Bulk Purchases:This includes the repairs and maintenance. An amount of R12 138 093 is budgeted for in
2018-19. The budget has increased for two outer years to R13 million and R10 million. The
repairs and maintenance expenditure has increased by R1 289 000 which is 11% as
compared to previous year.
(vi)Other Expenditure

Draft Annual Budget 2018-19 to 2021 Page 28
General expenditures has been appropriated at R47, 3 million
The following table gives a breakdown of the main expenditure categories of the total operating
budget for the 2018/19 financial year.
PERCENTAGE ALLOCATION FOR 2018/2019 FINANCIAL YEAR.
EXPENDITURE ITEM EXPENDITURE PERCENTAGE %
Personnel expenditure 49%
General expenditure 30%
Repairs and Maintenance 4%
Provisions 17%
TOTAL % 100 %

29
4.4 CAPITAL EXPENDITUREEC155 Nyandeni - Table A5 Budgeted Capital Expenditure by vote, functional classification and funding
Vote Description Ref 2014/15 2015/16 2016/17 Current Year 2017/18 2018/19 Medium Term Revenue & Expenditure Framework
R thousand 1 Audited Outcome
Audited Outcome
Audited Outcome
Original Budget
Adjusted Budget
Full Year Forecast
Pre-audit outcome
Budget Year 2018/19
Budget Year +1 2019/20
Budget Year +2 2020/21
Capital expenditure - Vote Multi-year expenditure to be appropriated 2
Vote 1 - EXECUTIVE & COUNCIL
–
–
–
–
– –
– – – –
Vote 2 - FINANCE & ADMINISTRATION- CORPORATE SERVICES
–
–
–
–
– –
– – – –
Vote 3 - FINANCE & ADMINISTRATION - BUDGET & TREASURY
–
–
–
–
– –
– – – –
Vote 4 - PLANNING & DEVELOPMENT
–
–
–
–
– –
– – – –
Vote 5 - COMMUNITY & SOCIAL SERVICES
–
–
–
–
– –
– – – –
Vote 6 - HOUSING
–
–
–
–
– –
– – – –
Vote 7 - ROAD TRANSPORT
–
–
–
–
– –
–
23,110
20,869
13,341
Vote 8 - PUBLIC SAFETY
–
–
–
–
– –
– – – –
Vote 9 - HEALTH
–
–
–
–
– –
– – – –
Vote 10 - SPORT AND RECREATION
–
–
–
–
– –
– – – –
Vote 11 - ELECTRICITY
–
–
–
–
– –
– – – –
Vote 12 - WASTE MANAGEMENT
–
–
–
–
– –
–
16,515
1,926
1,305
Vote 13 - OTHER
–
–
–
–
– –
– – – –
Vote 14 - INTERNAL AUDIT
–
–
–
–
– –
– – – –
Vote 15 - [NAME OF VOTE 15]
–
–
–
–
– –
– – – –
Capital multi-year expenditure sub-total 7
–
– –
–
– –
–
39,625
22,795
14,646
Single-year expenditure to be appropriated 2
Vote 1 - EXECUTIVE & COUNCIL
–
735
–
–
100
100
– – – –

Draft Annual Budget 2018-19 to 2021 Page 30
Vote 2 - FINANCE & ADMINISTRATION- CORPORATE SERVICES
2,955
5,708
7,642
6,672
8,112
8,112
–
9,845
4,670
3,745
Vote 3 - FINANCE & ADMINISTRATION - BUDGET & TREASURY
6,324
–
2,491
–
– –
–
1,000
2,000
2,128
Vote 4 - PLANNING & DEVELOPMENT
–
–
–
–
20
20
– – – –
Vote 5 - COMMUNITY & SOCIAL SERVICES
488
9,239
–
8,000
– –
– – – –
Vote 6 - HOUSING
–
–
–
–
– –
– – – –
Vote 7 - ROAD TRANSPORT
64,654
69,115
69,251
82,999
94,725
94,725
–
68,644
71,802
71,003
Vote 8 - PUBLIC SAFETY
–
–
–
–
– –
– – – –
Vote 9 - HEALTH
–
–
–
–
– –
– – – –
Vote 10 - SPORT AND RECREATION
–
–
–
–
– –
– – – –
Vote 11 - ELECTRICITY
–
–
–
4,119
4,119
4,119
– – – –
Vote 12 - WASTE MANAGEMENT
–
–
259
11,600
2,875
2,875
– – – –
Vote 13 - OTHER
–
–
–
–
– –
– – – –
Vote 14 - INTERNAL AUDIT
–
–
–
–
– –
– – – –
Vote 15 - [NAME OF VOTE 15]
–
–
–
–
– –
– – – –
Capital single-year expenditure sub-total
74,421
84,797
79,643
113,391
109,951
109,951
–
79,489
78,472
76,877
Total Capital Expenditure - Vote
74,421
84,797
79,643
113,391
109,951
109,951
–
119,114
101,267
91,523 Capital Expenditure - Functional
Governance and administration 9,279
6,444
10,133
6,672
8,212 –
–
10,845
6,670
5,873
Executive and council 735
100
Finance and administration 9,279
5,708
10,133
6,672
8,112
10,845
6,670
5,873
Internal audit
Community and public safety 488
9,239
–
8,000
– –
– – – –
Community and social services 488
9,239
8,000
–
Sport and recreation Public safety Housing
Draft Annual Budget 2018-19 to 2021 Page 31
Health
Economic and environmental services 64,654
69,115
69,251
82,999
94,745 –
–
91,754
92,671
84,344
Planning and development 20
Road transport 64,654
69,115
69,251
82,999
94,725
91,754
92,671
84,344
Environmental protection
Trading services –
–
259
15,719
6,994 –
–
16,515
1,926
1,305
Energy sources 4,119
4,119
Water management Waste water management
Waste management 259
11,600
2,875
16,515
1,926
1,305
Other
Total Capital Expenditure - Functional 3 74,421
84,798
79,643
113,391
109,951 –
–
119,114
101,267
91,523
Funded by:
National Government 68,749
58,809
58,050
58,799
55,925
56,644
57,802
61,003
Provincial Government 32,919
30,794
39,625
22,795
14,646
District Municipality
Other transfers and grants 5,672
21,449
Transfers recognised - capital 4 74,421
80,258
58,050
91,718
86,718 –
–
96,269
80,597
75,649
Public contributions & donations 5 Borrowing 6
Internally generated funds 4,540
21,593
21,672
23,232
22,845
20,670
15,873
Total Capital Funding 7 74,421
84,798
79,643
113,391
109,951 –
–
119,114
101,267
91,523
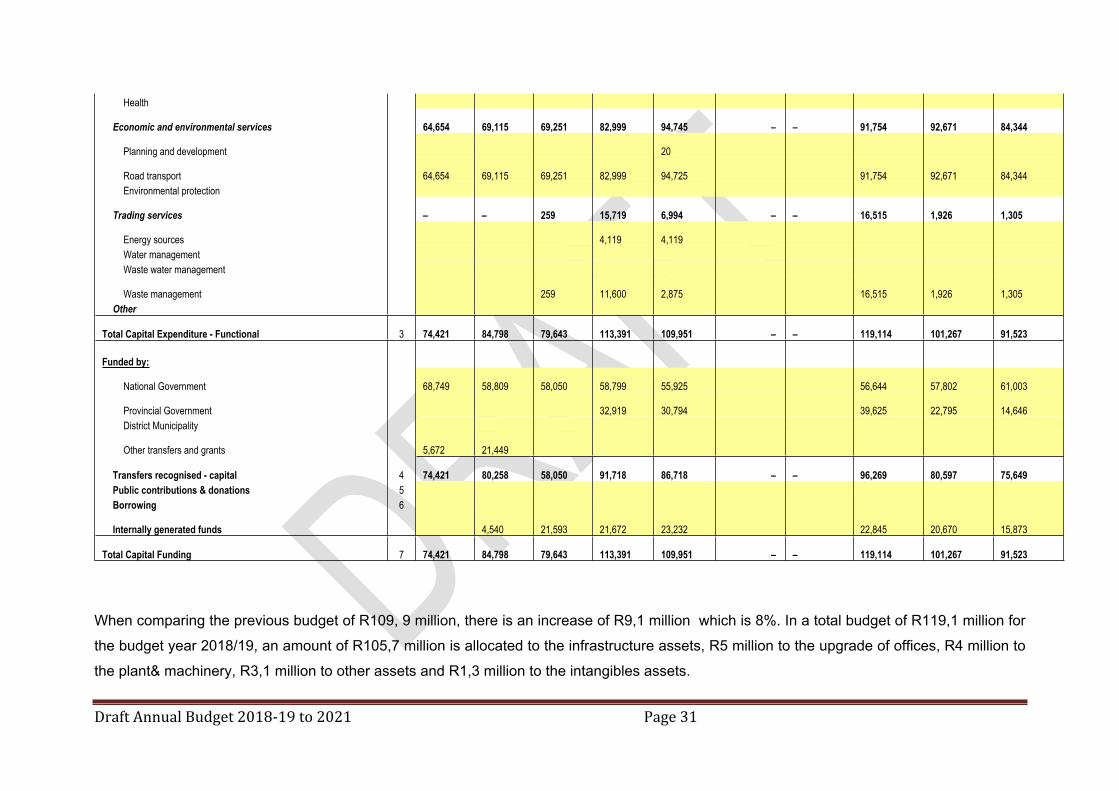
When comparing the previous budget of R109, 9 million, there is an increase of R9,1 million which is 8%. In a total budget of R119,1 million for
the budget year 2018/19, an amount of R105,7 million is allocated to the infrastructure assets, R5 million to the upgrade of offices, R4 million to
the plant& machinery, R3,1 million to other assets and R1,3 million to the intangibles assets.
Draft Annual Budget 2018-19 to 2021 Page 32
For the two outer years the there is a decrease to R101,2 million and R91,5 million.

33
4.5 ANNUAL BUDGET TABLES
4.5.1 Table A1: Budget summary
Draft Annual Budget 2018-19 to 2021 Page 34
Explanatory Notes
Table A1 is a budget summary and provides a concise overview of the NLM’s
budget from all of the major financial perspectives (operating, capital expenditure,
financial position, cash flow, and MFMA funding compliance).
The table provides an overview of the amounts approved by Council for operating
performance, resources deployed to capital expenditure, financial position, cash
and funding compliance, as well as the municipality’s commitment to eliminating
basic service delivery backlogs.
Financial management reforms emphasises the importance of the municipal budget
being funded. This requires the simultaneous assessment of the Financial
Performance, Financial Position and Cash Flow Budgets, along with the Capital
Budget. The Budget Summary provides the key information in this regard:

35
4.5.2 Table A2 : Budgeted financial performance (revenue and expenditure by standard classification)
Explanatory Notes
Table A2 is a view of the budgeted financial performance in relation to revenue and expenditure
per standard classification. The modified GFS standard classification divides the municipal
services into 15 functional areas. Municipal revenue, operating expenditure and capital
expenditure are then classified in terms if each of these functional areas which enables the
National Treasury to compile „whole of government‟ reports.

Draft Annual Budget 2018-19 to 2021 Page 36
4.5 3 Table A3 : Budgeted financial performance (revenue and expenditure by municipal vote)
Explanatory NotesTable A3 is a view of the budgeted financial performance in relation to the revenue and
expenditure per municipal vote. This table facilitates the view of the budgeted operating
performance in relation to the organisational structure of the NLM.

Draft Annual Budget 2018-19 to 2021 Page 37
4.5.4 Table A4 : Budget financial performance (revenue and expenditure)
Explanatory Notes:Total revenue (excluding capital transfers and contributions) is R357,9 million in 2018/19 and
escalates to R374,7 million by 2019/20 and to R385,5 million in 2020/21.

Draft Annual Budget 2018-19 to 2021 Page 38
4.5.5 Table A5 : Budgeted capital expenditure by vote and funding
Explanatory NotesWhen comparing the previous budget of R109,9 million, there is an increase of R9,2 million
which is 8%. For the two outer years the there is a decrease to R101,2 million and R91,5
million.

Draft Annual Budget 2018-19 to 2021 Page 39
4.5.6 Table A6 : Budgeted financial position
Explanatory Notes:Table A6 is consistent with international standards of good financial management practice, and
improves understandability for councillors and management of the impact of the budget on the
statement of financial position (balance sheet).
The municipality cash flow shows a positive position for 2018/19 where current assets reflect
an amount of R127,2 million.

Draft Annual Budget 2018-19 to 2021 Page 40
4.5.7 Table A7: Budgeted cash flows
Explanatory NotesThe budgeted cash flow statement is the first measurement in determining if the budget is
funded. It shows the expected level of cash in-flow versus cash out-flow that is likely to result
from the implementation of the budget. The cash flow of the municipality shows an increase
for the 2018/19 MTERF.
Draft Annual Budget 2018-19 to 2021 Page 41
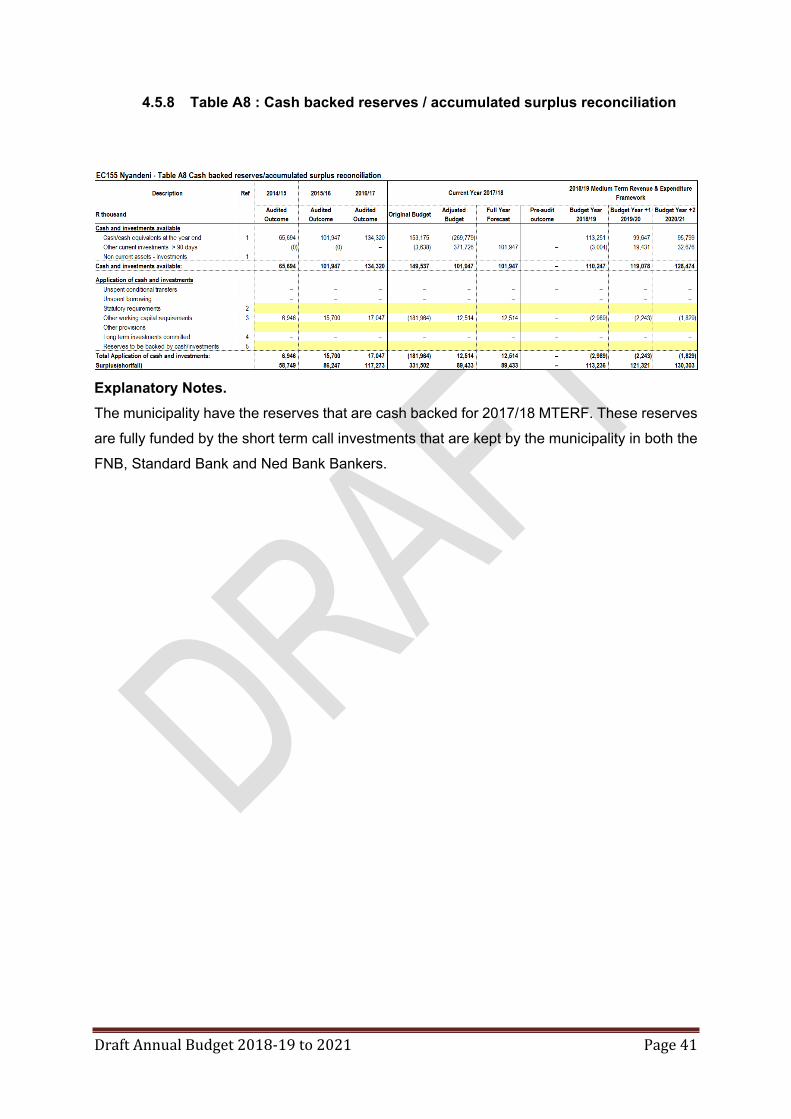
4.5.8 Table A8 : Cash backed reserves / accumulated surplus reconciliation
Explanatory Notes.The municipality have the reserves that are cash backed for 2017/18 MTERF. These reserves
are fully funded by the short term call investments that are kept by the municipality in both the
FNB, Standard Bank and Ned Bank Bankers.

42
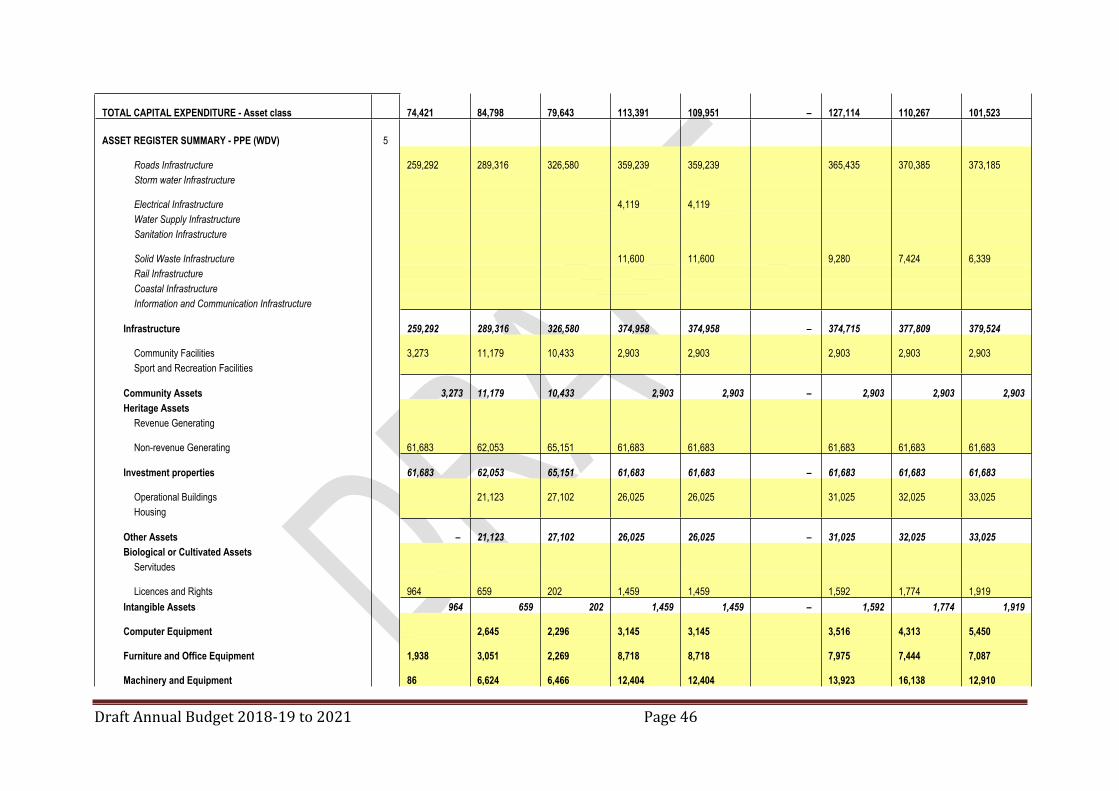
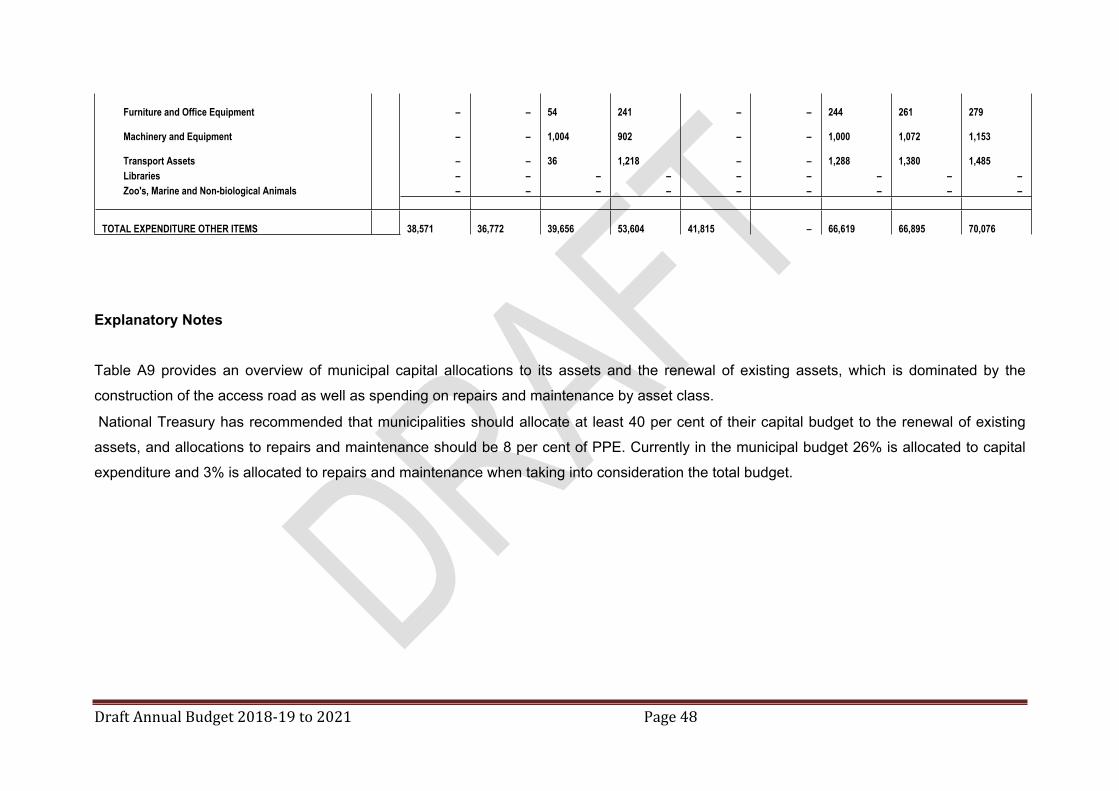
4.5.9 Table A9 : Asset management
EC155 Nyandeni - Table A9 Asset Management
Description Ref 2014/15 2015/16 2016/17 Current Year 2017/18 2018/19 Medium Term Revenue & Expenditure Framework
R thousand Audited Outcome
Audited Outcome
Audited Outcome
Original Budget
Adjusted Budget
Full Year Forecast
Budget Year 2018/19
Budget Year +1 2019/20
Budget Year +2 2020/21
CAPITAL EXPENDITURE
Total New Assets 1 74,421
84,798
79,643
74,591
73,276 –
119,114
101,267
91,523
Roads Infrastructure 64,568
63,766
68,427
50,799
53,925 –
81,797
86,651
83,269
Storm water Infrastructure – – – – – – – – –
Electrical Infrastructure – – – 4,119
4,119 – – – –
Water Supply Infrastructure – – – – – – – – – Sanitation Infrastructure – – – – – – – – –
Solid Waste Infrastructure – – – – – – 16,515
1,926
1,305
Rail Infrastructure – – – – – – – – – Coastal Infrastructure – – – – – – – – – Information and Communication Infrastructure – – – – – – – – –
Infrastructure 64,568
63,766
68,427
54,918
58,044 –
98,312
88,577
84,574
Community Facilities 488
9,239
259
8,000 – –
5,957
1,020
1,075
Sport and Recreation Facilities – – – – – – – – – Community Assets 488 9,239 259 8,000 – – 5,957 1,020 1,075 Heritage Assets – – – – – – – – –
Revenue Generating – – – – – – – – –
Non-revenue Generating – – – 5,000
7,000 –
5,000
1,000 –
Investment properties – – – 5,000 7,000 – 5,000 1,000 –
Operational Buildings 99
4,017
6,860 – – –
500
500 –
Housing – – – – – – – – – Other Assets 99 4,017 6,860 – – – 500 500 – Biological or Cultivated Assets – – – – – – – – –
Servitudes – – – – – – – – –

Draft Annual Budget 2018-19 to 2021 Page 43
Licences and Rights 919
180
64
800
1,100 –
1,300
500
500
Intangible Assets 919 180 64 800 1,100 – 1,300 500 500
Computer Equipment – – – 500
810 –
1,945
1,500
2,000
Furniture and Office Equipment 1,938
1,692
719
372
372 –
1,100
1,170
1,245
Machinery and Equipment 86
4,069
824
5,000
5,000 –
4,000
5,000 –
Transport Assets 6,324
1,835
2,491 –
950 –
1,000
2,000
2,128
Libraries – – – – – – – – – Zoo's, Marine and Non-biological Animals – – – – – – – – –
Total Renewal of Existing Assets 2 – – – 38,800
36,675 –
8,000
9,000
10,000
Roads Infrastructure – – – 16,300
25,000 –
8,000
9,000
10,000
Storm water Infrastructure – – – – – – – – – Electrical Infrastructure – – – – – – – – – Water Supply Infrastructure – – – – – – – – – Sanitation Infrastructure – – – – – – – – –
Solid Waste Infrastructure – – – 11,600
2,875 – – – –
Rail Infrastructure – – – – – – – – – Coastal Infrastructure – – – – – – – – – Information and Communication Infrastructure – – – – – – – – –
Infrastructure – – – 27,900
27,875 – 8,000 9,000
10,000
Community Facilities – – – 10,900
8,800 – – – –
Sport and Recreation Facilities – – – – – – – – –
Community Assets – – – 10,900 8,800 – – – –
Heritage Assets – – – – – – – – – Revenue Generating – – – – – – – – – Non-revenue Generating – – – – – – – – –
Investment properties – – – – – – – – – Operational Buildings – – – – – – – – – Housing – – – – – – – – –
Other Assets – – – – – – – – – Biological or Cultivated Assets – – – – – – – – –
Servitudes – – – – – – – – – Licences and Rights – – – – – – – – –

Draft Annual Budget 2018-19 to 2021 Page 44
Intangible Assets – – – – – – – – – Computer Equipment – – – – – – – – – Furniture and Office Equipment – – – – – – – – – Machinery and Equipment – – – – – – – – – Transport Assets – – – – – – – – – Libraries – – – – – – – – – Zoo's, Marine and Non-biological Animals – – – – – – – – –
Total Upgrading of Existing Assets 6 – – – – – – – – –
Roads Infrastructure – – – – – – – – – Storm water Infrastructure – – – – – – – – – Electrical Infrastructure – – – – – – – – – Water Supply Infrastructure – – – – – – – – – Sanitation Infrastructure – – – – – – – – – Solid Waste Infrastructure – – – – – – – – – Rail Infrastructure – – – – – – – – – Coastal Infrastructure – – – – – – – – – Information and Communication Infrastructure – – – – – – – – –
Infrastructure – – – – – – – – – Community Facilities – – – – – – – – – Sport and Recreation Facilities – – – – – – – – –
Community Assets – – – – – – – – – Heritage Assets – – – – – – – – –
Revenue Generating – – – – – – – – – Non-revenue Generating – – – – – – – – –
Investment properties – – – – – – – – – Operational Buildings – – – – – – – – – Housing – – – – – – – – –
Other Assets – – – – – – – – – Biological or Cultivated Assets – – – – – – – – –
Servitudes – – – – – – – – – Licences and Rights – – – – – – – – –
Intangible Assets – – – – – – – – – Computer Equipment – – – – – – – – – Furniture and Office Equipment – – – – – – – – – Machinery and Equipment – – – – – – – – – Transport Assets – – – – – – – – – Libraries – – – – – – – – – Zoo's, Marine and Non-biological Animals – – – – – – – – –

Draft Annual Budget 2018-19 to 2021 Page 45
Total Capital Expenditure 4
Roads Infrastructure 64,568
63,766
68,427
67,099
78,925 –
89,797
95,651
93,269
Storm water Infrastructure – – – – – – – – –
Electrical Infrastructure – – – 4,119
4,119 – – – –
Water Supply Infrastructure – – – – – – – – – Sanitation Infrastructure – – – – – – – – –
Solid Waste Infrastructure – – – 11,600
2,875 –
16,515
1,926
1,305
Rail Infrastructure – – – – – – – – – Coastal Infrastructure – – – – – – – – – Information and Communication Infrastructure – – – – – – – – –
Infrastructure 64,568
63,766
68,427
82,818
85,918 –
106,312
97,577
94,574
Community Facilities 488
9,239
259
18,900
8,800 –
5,957
1,020
1,075
Sport and Recreation Facilities – – – – – – – – –
Community Assets 488 9,239 259 18,900 8,800 – 5,957 1,020 1,075
Heritage Assets – – – – – – – – – Revenue Generating – – – – – – – – –
Non-revenue Generating – – – 5,000
7,000 –
5,000
1,000 –
Investment properties – – – 5,000 7,000 – 5,000 1,000 –
Operational Buildings 99
4,017
6,860 – – –
500
500 –
Housing – – – – – – – – – Other Assets 99 4,017 6,860 – – – 500 500 – Biological or Cultivated Assets – – – – – – – – –
Servitudes – – – – – – – – –
Licences and Rights 919
180
64
800
1,100 –
1,300
500
500
Intangible Assets 919 180 64 800 1,100 – 1,300 500 500
Computer Equipment – – – 500
810 –
1,945
1,500
2,000
Furniture and Office Equipment 1,938
1,692
719
372
372 –
1,100
1,170
1,245
Machinery and Equipment 86
4,069
824
5,000
5,000 –
4,000
5,000 –
Transport Assets 6,324
1,835
2,491 –
950 –
1,000
2,000
2,128
Libraries – – – – – – – – – Zoo's, Marine and Non-biological Animals – – – – – – – – –
Draft Annual Budget 2018-19 to 2021 Page 46
TOTAL CAPITAL EXPENDITURE - Asset class 74,421
84,798
79,643
113,391
109,951 –
127,114
110,267
101,523
ASSET REGISTER SUMMARY - PPE (WDV) 5
Roads Infrastructure 259,292
289,316
326,580
359,239
359,239
365,435
370,385
373,185
Storm water Infrastructure
Electrical Infrastructure 4,119
4,119
Water Supply Infrastructure Sanitation Infrastructure
Solid Waste Infrastructure 11,600
11,600
9,280
7,424
6,339
Rail Infrastructure Coastal Infrastructure Information and Communication Infrastructure
Infrastructure 259,292
289,316
326,580
374,958
374,958 –
374,715
377,809
379,524
Community Facilities 3,273
11,179
10,433
2,903
2,903
2,903
2,903
2,903
Sport and Recreation Facilities
Community Assets 3,273 11,179
10,433 2,903 2,903 – 2,903 2,903 2,903
Heritage Assets Revenue Generating
Non-revenue Generating 61,683
62,053
65,151
61,683
61,683
61,683
61,683
61,683
Investment properties 61,683
62,053
65,151
61,683
61,683 –
61,683
61,683
61,683
Operational Buildings 21,123
27,102
26,025
26,025
31,025
32,025
33,025
Housing
Other Assets – 21,123
27,102
26,025
26,025 –
31,025
32,025
33,025
Biological or Cultivated Assets Servitudes
Licences and Rights 964
659
202
1,459
1,459
1,592
1,774
1,919
Intangible Assets 964 659 202 1,459 1,459 – 1,592 1,774 1,919
Computer Equipment 2,645
2,296
3,145
3,145
3,516
4,313
5,450
Furniture and Office Equipment 1,938
3,051
2,269
8,718
8,718
7,975
7,444
7,087
Machinery and Equipment 86
6,624
6,466
12,404
12,404
13,923
16,138
12,910

Draft Annual Budget 2018-19 to 2021 Page 47
Transport Assets 6,324
9,233
9,394
8,452
8,452
7,762
7,210
7,896
Libraries Zoo's, Marine and Non-biological Animals
TOTAL ASSET REGISTER SUMMARY - PPE (WDV) 5 333,561
405,884
449,893
499,748
499,748 –
505,094
511,299
512,398
EXPENDITURE OTHER ITEMS
Depreciation 7 33,632
31,807
35,084
41,815
41,815 –
54,480
53,663
59,284
Repairs and Maintenance by Asset Class 3 4,938
4,964
4,572
11,789 – –
12,138
13,232
10,792
Roads Infrastructure 4,938
4,964
2,161
7,761 – –
8,000
8,798
6,025
Storm water Infrastructure – – – – – – – – –
Electrical Infrastructure – – 849
814 – –
500
536
577
Water Supply Infrastructure – – – – – – – – – Sanitation Infrastructure – – – – – – – – – Solid Waste Infrastructure – – – – – – – – – Rail Infrastructure – – – – – – – – – Coastal Infrastructure – – – – – – – – – Information and Communication Infrastructure – – – – – – – – –
Infrastructure 4,938 4,964 3,010 8,575 – – 8,500 9,334 6,602
Community Facilities – – – 143 – –
152
162
172
Sport and Recreation Facilities – – – – – – – – – Community Assets – – – 143 – – 152 162 172 Heritage Assets – – – – – – – – –
Revenue Generating – – – – – – – – – Non-revenue Generating – – – – – – – – –
Investment properties – – – – – – – – –
Operational Buildings – – 468
591 – –
842
902
971
Housing – – – – – – – – – Other Assets – – 468 591 – – 842 902 971 Biological or Cultivated Assets – – – – – – – – –
Servitudes – – – – – – – – – Licences and Rights – – – – – – – – –
Intangible Assets – – – – – – – – –
Computer Equipment – – – 118 – –
113
121
130
Draft Annual Budget 2018-19 to 2021 Page 48
Furniture and Office Equipment – – 54
241 – –
244
261
279
Machinery and Equipment – – 1,004
902 – –
1,000
1,072
1,153
Transport Assets – – 36
1,218 – –
1,288
1,380
1,485
Libraries – – – – – – – – – Zoo's, Marine and Non-biological Animals – – – – – – – – –
TOTAL EXPENDITURE OTHER ITEMS 38,571
36,772
39,656
53,604
41,815 –
66,619
66,895
70,076
Explanatory Notes
Table A9 provides an overview of municipal capital allocations to its assets and the renewal of existing assets, which is dominated by the
construction of the access road as well as spending on repairs and maintenance by asset class.
National Treasury has recommended that municipalities should allocate at least 40 per cent of their capital budget to the renewal of existing
assets, and allocations to repairs and maintenance should be 8 per cent of PPE. Currently in the municipal budget 26% is allocated to capital
expenditure and 3% is allocated to repairs and maintenance when taking into consideration the total budget.
49
SUPPORTING DOCUMENTS
5. Annual Budget Process Overview
5.1 Background
Integrated Development Planning is a process through which municipalities prepare a strategic
development plan which extends over a five-year period. The Integrated Development Plan
(IDP) is a product of the IDP process. The NLM IDP is the principal strategic planning
instrument which guides and informs all planning, budgeting, management and decision-
making processes in the municipality. Through Integrated Development Planning which
necessitates the involvement of all relevant stakeholders, a municipality:
Identifies its key development priorities;
Formulates a clear vision, mission and values;
Formulates appropriate strategies;
Develops the appropriate organisational structure and systems to realise the vision and
mission; and
Aligns resources with the developmental priorities.
In terms of the Systems Act, all municipalities have to undertake an IDP process to produce
IDPs. As the IDP is a legislative requirement it has a legal status and supersedes all other
plans that guide development at local government level.
In a nutshell, the IDP process entails an assessment of the existing level of development and
the identification of key development priorities. The vision and mission statements for the long-
term development flow from the aforesaid, with specific reference to critical developmental and
internal transformational needs. The development strategies and objectives will be directed at
bridging the gap between the existing level of development and the vision and mission. A very
critical phase of the IDP process is to link planning to the municipal budget (i.e. allocation of
internal or external funding to the identified projects); because this will ensure that the IDP
directs the development and implementation of projects.
Our responsibility as a sphere of government is to ensure that the quality of life of all who live
and work in Nyandeni is improved. We will continue to engage in both progressive and
meaningful discussions with our communities to shape a clear path from which governance
and development will draw guidance and direction. The council will continue to pursue and

Draft Annual Budget 2018-19 to 2021 Page 50
encourage community participation programmes, to ensure that our plans are in line with
community needs.
We have a responsibility to contribute to the process of transforming the lives of our people
from the conditions of abject poverty and underdevelopment. In our fight against poverty and
underdevelopment, we are committed to ensuring that equitable service delivery becomes the
norm in Nyandeni. For this reason NLM has to focus inter alia, on the following:
• Build sustainable communities by paying special attention to health education, service
delivery, human settlements, environment and safety;
• Develop infrastructure to equalise services upgrade and ensure accessibility and unity in
Nyandeni;
• Grow the economy to be linked with the national and provincial economies, empower the
people of the region and build required skills; and
• Developing and implementing integrated plans and strategies for economic and social
development; service delivery; infrastructure development; provision of basic services;
human development; safety and security; participatory governance; youth development;
women empowerment; building integrated and sustainable communities and protection of
the environment.
DEVELOPMENT OF THE INTEGRATED DEVELOPMENT PLANGuiding Principles
The development of the Integrated Development Plan(IDP) in terms of the Municipal Systems
Act was guided and informed by the following principles:
• It must support and work towards achieving the Vision, Mission, Values and the Strategic
Priorities of the NLM;
• Focus on service delivery in terms of the eradication of backlogs and the maintenance of
infrastructure;
• Address community priorities (needs) as identified in the 2018-2019 IDP priorities; and
• The review of the IDP focused on formulating measurable performance indicator targets
for five, three and one year. These targets informed the preparation of the multi-year
budgets, as well as the draft SDBIP.
The municipality adhered to the process plan for the review of the draft IDP and preparation
of the multi-year budget for 2018/19 to 2023.The IDP development and Budget preparation
has been done as per MSCOA requirements, which indicates that the municipality should
capture each projects with its objectives in the IDP and budget for those projects for a period
of five years.
Draft Annual Budget 2018-19 to 2021 Page 51
52
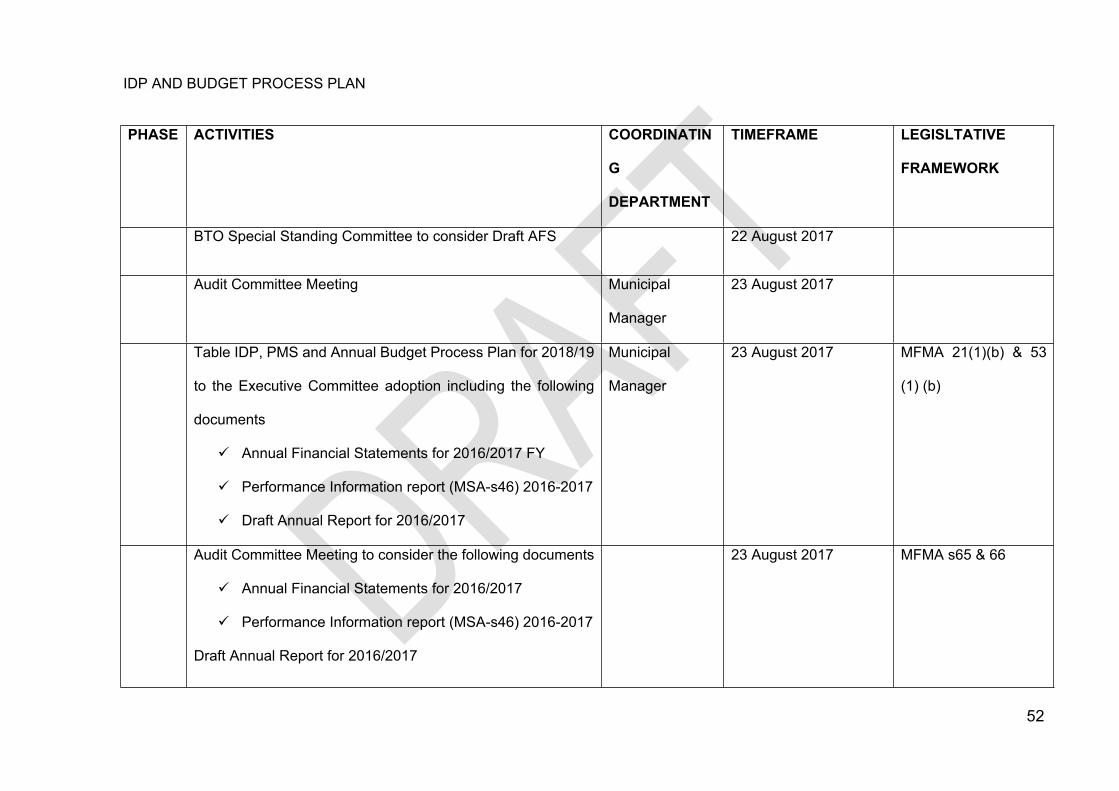
IDP AND BUDGET PROCESS PLAN
PHASE ACTIVITIES COORDINATIN
G
DEPARTMENT
TIMEFRAME LEGISLTATIVE
FRAMEWORK
BTO Special Standing Committee to consider Draft AFS 22 August 2017
Audit Committee Meeting Municipal
Manager
23 August 2017
Table IDP, PMS and Annual Budget Process Plan for 2018/19
to the Executive Committee adoption including the following
documents
Annual Financial Statements for 2016/2017 FY
Performance Information report (MSA-s46) 2016-2017
Draft Annual Report for 2016/2017
Municipal
Manager
23 August 2017 MFMA 21(1)(b) & 53
(1) (b)
Audit Committee Meeting to consider the following documents
Annual Financial Statements for 2016/2017
Performance Information report (MSA-s46) 2016-2017
Draft Annual Report for 2016/2017
23 August 2017 MFMA s65 & 66

Draft Annual Budget 2018-19 to 2021 Page 53
PHASE ACTIVITIES COORDINATIN
G
DEPARTMENT
TIMEFRAME LEGISLTATIVE
FRAMEWORK
Tabling of IDP & Annual Budget Process Plan, AFS &
Performance information report to Council for adoption
including the following documents
Annual Financial Statements for 2016/2017
Performance Information report (MSA-s46)
Annual Report for 2016/2017
Mayor 25 August 2017 MFMA 21(1)(b) & 53
(1) (b)
Printing of Annual Financial Statements and Annual
Performance Assessment Information Report and Draft
Annual Report for the year ending 30 June 2017
MM 29-31 August 2017 MFMA 126 (1) (a)
Submit Annual Financial Statements and Annual
Performance Assessment Information Report and Draft
Annual Report for the year
ending 30 June 2017 to Auditor General
Chief Financial
Officer, MM
31 August 2017 MFMA 126 (1) (a)
SEPTEMBER 2017
IDP Roll –Out Programme targeting Ward Committees & SM: Operations 8-9 September 2017 MSA S16 & 21
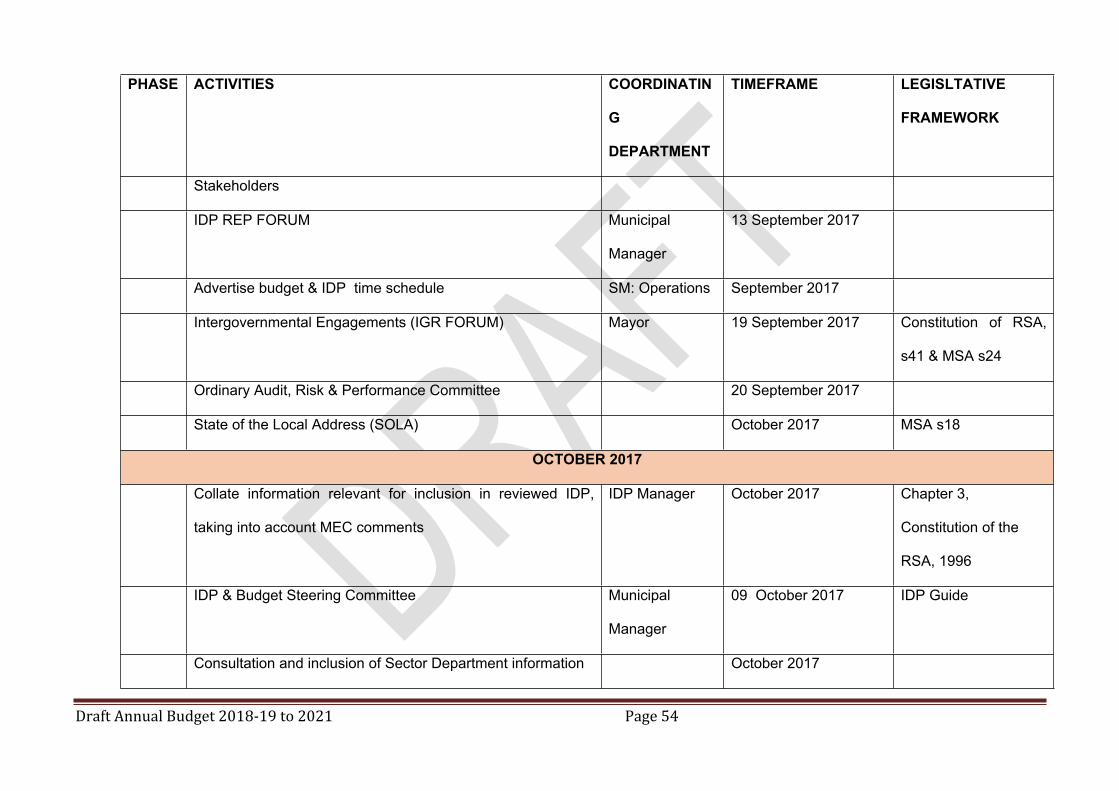
Draft Annual Budget 2018-19 to 2021 Page 54
PHASE ACTIVITIES COORDINATIN
G
DEPARTMENT
TIMEFRAME LEGISLTATIVE
FRAMEWORK
Stakeholders
IDP REP FORUM Municipal
Manager
13 September 2017
Advertise budget & IDP time schedule SM: Operations September 2017
Intergovernmental Engagements (IGR FORUM) Mayor 19 September 2017 Constitution of RSA,
s41 & MSA s24
Ordinary Audit, Risk & Performance Committee 20 September 2017
State of the Local Address (SOLA) October 2017 MSA s18
OCTOBER 2017
Collate information relevant for inclusion in reviewed IDP,
taking into account MEC comments
IDP Manager October 2017 Chapter 3,
Constitution of the
RSA, 1996
IDP & Budget Steering Committee Municipal
Manager
09 October 2017 IDP Guide
Consultation and inclusion of Sector Department information October 2017

Draft Annual Budget 2018-19 to 2021 Page 55
PHASE ACTIVITIES COORDINATIN
G
DEPARTMENT
TIMEFRAME LEGISLTATIVE
FRAMEWORK
to the IDP
Risk Committee Meeting 12 October 2017
Audit Committee Meeting 25 October 2017
Table first quarter performance report including financial
performance analysis report (s52(d) to Council
Mayor 31 October 2017 MFMA s52(d)
NOVEMBER 2017
Mayoral Imbizo’s to give service delivery feedback and get
community priority needs
13-17 November 2017 MSA s34 & s16
Management Retreat (Preparation of Council Legkotla) Municipal
Manager
20-21 November 2017
DECEMBER 2017
Special Exco Meeting 06 December 2017
Special Council Meeting 08 December 2017
JANUARY 2018
Convene Management Retreat to compile and finalize Mid- Municipal 12-13 January 2017 MFMA s72 (1) & 11
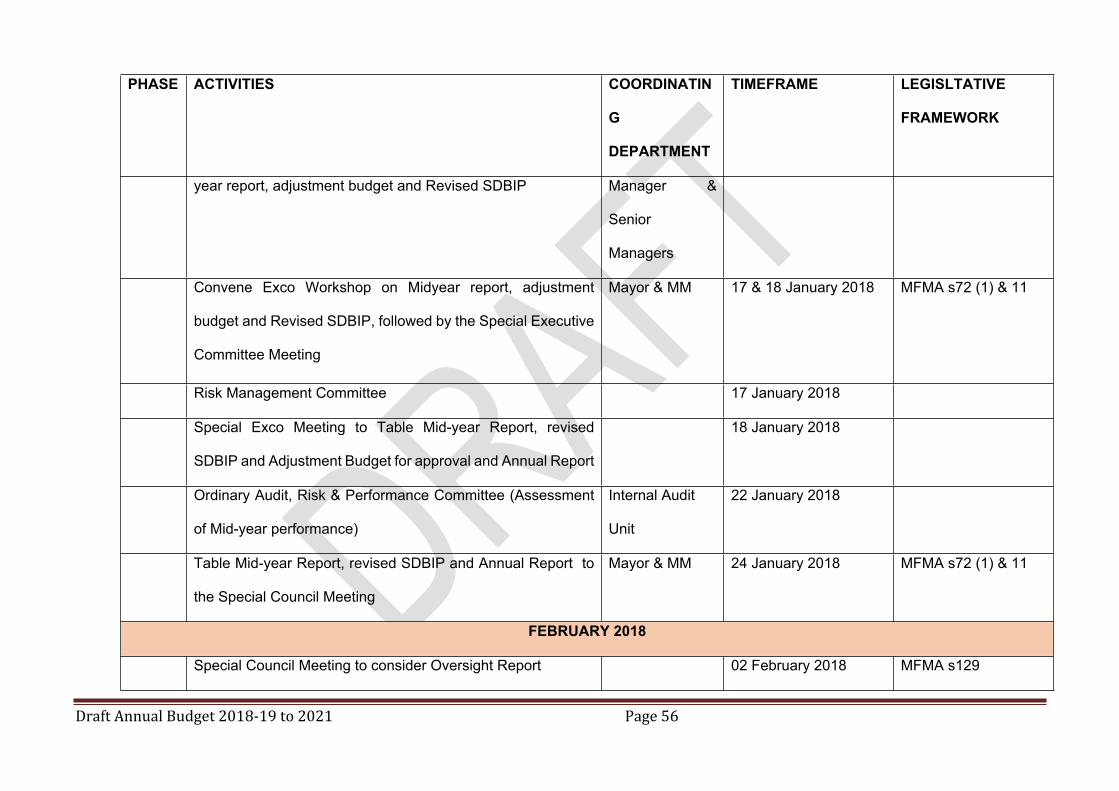
Draft Annual Budget 2018-19 to 2021 Page 56
PHASE ACTIVITIES COORDINATIN
G
DEPARTMENT
TIMEFRAME LEGISLTATIVE
FRAMEWORK
year report, adjustment budget and Revised SDBIP Manager &
Senior
Managers
Convene Exco Workshop on Midyear report, adjustment
budget and Revised SDBIP, followed by the Special Executive
Committee Meeting
Mayor & MM 17 & 18 January 2018 MFMA s72 (1) & 11
Risk Management Committee 17 January 2018
Special Exco Meeting to Table Mid-year Report, revised
SDBIP and Adjustment Budget for approval and Annual Report
18 January 2018
Ordinary Audit, Risk & Performance Committee (Assessment
of Mid-year performance)
Internal Audit
Unit
22 January 2018
Table Mid-year Report, revised SDBIP and Annual Report to
the Special Council Meeting
Mayor & MM 24 January 2018 MFMA s72 (1) & 11
FEBRUARY 2018
Special Council Meeting to consider Oversight Report 02 February 2018 MFMA s129

Draft Annual Budget 2018-19 to 2021 Page 57
PHASE ACTIVITIES COORDINATIN
G
DEPARTMENT
TIMEFRAME LEGISLTATIVE
FRAMEWORK
Approval of the Adjustment Budget CFO & MM 26 February 2018 MFMA s72 (1) & 11
IDP Strategic Planning MM 27 February 2018 – 02
March 2018
MARCH 2018
Ward Councilors Forum Mayor 15 March 2018
COUN
CIL
SITTIN
G
Presentation of Draft IDP, Annual Budget, Draft SDBIP, Tariffs
and budget related policies to the Executive Committee
Municipal
Manager & CFO
23 March 2018
Tabling of Draft IDP, Annual Budget, Draft SDBIP, Tariffs and
budget related policies to Council
Mayor 29 March 2018 MFMA s16 (2)
APRIL 2018
Risk Committee 05 April 2018
IDP Representative Forum Mayor 10 April 2018
Audit Committee 19 March 2018

Draft Annual Budget 2018-19 to 2021 Page 58
PHASE ACTIVITIES COORDINATIN
G
DEPARTMENT
TIMEFRAME LEGISLTATIVE
FRAMEWORK
Conduct IDP & Budget Public Hearings Mayor 16-20 April 2018
Special Executive Committee Meeting 20 April 2018
Table third quarter performance report including financial
performance analysis report to Council
Mayor 26 April 2018 MFMA s52(d)
MAY 2018
Council Policy Consultative Workshop 15 – 18 May 2018
Ordinary Exco Meeting 24 May 2018
Table Reviewed IDP, Annual Budget, Tariffs, Organizational
Structure and budget related policies for approval by Council
Mayor 30 May 2018 MFMA s24 (1)
JUNE 2018
Ordinary Audit, Risk & Performance Committee 21 June 2018
Special Exco Meeting to consider End of the Year Road Map
and Financial Related Reports
22 June 2018
Ordinary Council Meeting 28 June 2018

Draft Annual Budget 2018-19 to 2021 Page 59
PHASE ACTIVITIES COORDINATIN
G
DEPARTMENT
TIMEFRAME LEGISLTATIVE
FRAMEWORK
END

60
6 Alignment of Budget with Integrated Development Plan
The IDP, however, contains information on developmental needs submitted by the community
that may not be covered in the Budget. There should not be an expectation that everything
contained in the IDP is funded. There are numerous needs submitted that are not the
responsibility of the NLM, but that of either the National or Provincial governments. However,
these inputs will be analysed and discussed stakeholders such as government departments,
ward committees, CDW, NGO’s and private sector to refine what can be implemented. The
funding process is based on the priorities identified in the IDP, as shown in the relevant tables
in this document.
7 Budget Related Policies Overview and Amendments
Section 18 of the Municipal Finance Management Act(MFMA) states that the Budget can only
be funded by realistically anticipated revenue to be collected, and cash-backed accumulated
funds from previous years, which was not committed for other purposes. Furthermore, National
Treasury Circular 42 stipulates that the Budget be managed in a full accrual manner reflecting
a transparent budget and accounting system approach. The MFMA further requires the
municipality to adopt and implement a tariff policy. Council has approved for public participation
policies for main services provided by the municipality, which are attached as annexures to
this document. Council is required to adopt budgetary provisions based on realistic anticipated
revenue for the budget year from each revenue source as per the requirements of the MFMA
(Chapter 4,17 (1) (a) and (3) (b)).
The policies to be attached are as follows:
Supply Chain Management Policy
Cash Management & Investment Policy
Property Rates Policy
Tariff Policy
Bad debts & Write Off Policy
Credit Control and Debt Collection Policy
Asset management Policy
IDP & Budget Policy
Indigent Policy
Revenue Enhancement Strategy

Draft Annual Budget 2018-19 to 2021 Page 61
8 Budget Assumptions
8.1 National Treasury provided guidance in MFMA Circular No. 89 and 91 issued in terms of
Municipal Finance Management Act No. 56 of 2003 regarding inflation:-
2017/2018 2018/2019 2019/2020 2020/2021Fiscal Year
Estimate ForecastCPI Inflation 6.4% 7.2% 7.6% 7.6%
8.2 The inflation rate to be used for calculating wage increases
The South African Local Government Bargaining Council entered into a three-year Salary and
Wage Collective Agreement for the period 01 July 2015 to 30 June 2018. The preparation of
the 2017/18 MTREF constitutes implementation of the last year of the agreement which
municipalities must implement as follows:
2018/19 Financial Year – average CPI + 1 per cent
The previous years were:
2015/16 Financial Year – 7 per cent
2016/17 Financial Year – average CPI + 1 per cent
8.3 Municipalities are advised to structure their 2018/19 electricity tariffs based on the 9.4 per cent guideline.
8.4 Collection ratesIn accordance with relevant legislation and national directives, revenue recovery rates are
based on realistic and sustainable trends. Nyandeni Local Municipality’s collection rate
analytical review shows that the municipality has been collecting at an average of 38%.
However, the municipality has employed mechanism to improve collection rates, in this
instance, the municipality has budgeted to collect 86% of the billed amount each year. Also,
the debt collector has been sourced to further assist the municipality to improve the collection
of rates.

Draft Annual Budget 2018-19 to 2021 Page 62
9 Funding the Budget (including fiscal overview and sources of funding)
9.1 FUNDING OF THE CAPITAL BUDGETThe 2018/2019 capital budget amounts to R119,1 million, and for the two outer years its
R101,2 million and R91,5 million. It is predominantly funded through the MIG funding and Small
Town Revitilisation and Equitable share.
9.2 FUNDING OF THE OPERATING BUDGET
The Operating Budget is funded from the following main sources:
• Assessment Rates;
• Tariffs levied for Services, i.e. Refuse Collection;
• Other income and
• Operating Grants and Subsidies.
Assessment Rates. The Municipal Property Rates Act will be implemented on July 1 2018.
The assessment rates will be levied on both land and improvements value. In terms of section
46 of the Act, the market value of a property, if sold on the date of valuation in the open market
by a willing seller to a willing buyer, is to be realised in the valuation roll.
Income derived from services is mainly used to fund the cost rendering the service (both
operating and capital needs).
The total budget for the assessment rates is R7,6 million for the current year, and for two outer
years is R8,1 million and R8,8 million.
The income received in the form of the Equitable Share Grant is R234, 5 million and for the
two outer years is R256 million and R275, 4 million.

Draft Annual Budget 2018-19 to 2021 Page 63
Other Grants and subsidies are as follows:
Capital Grants are as follows:
Grant Name Financial Year AmountFMG 2018/19 R 1 700 000
INEP 2018/19 R18 189 000
EPWP 2018/19 R 1 321 000
LIBRARY SUBSIDIES 2018/19 R 400 000
LGSETA 2018/19 R 400 000
Grant Name Financial Year AmountMIG 2018/19 R59 625 000
STR 201819 R39 625 000

64
10 Annual budgets and service delivery and budget implementation plans– Internal departments
In terms of Section 53 (1) (c) (ii) of the Municipal Finance Management Act, the Service
Delivery and Budget Implementation Plan (SDBIP) is defined as a detailed plan approved by
the mayor of a municipality for implementing its delivery of municipal services and its annual
budget, and which must indicate the following –
(a) Monthly projections of –
(i) Revenue to be collected, by source, and
(ii) Operational and capital expenditure, by vote.
(b) Service delivery targets and performance indicators for each quarter, and
(c) Other matters prescribed.
The Honourable Mayor, in accordance with Section 53 of the MFMA, is expected to approve
the SDBIP within 28 days after the approval of the Budget. In addition, the Honourable Mayor
must ensure that the revenue and expenditure projections for each month and the service
delivery targets and performance indicators as set out in the SDBIP are made public within 14
days after its approval.
The SDBIP gives effect to the Integrated Development Plan and the Budget of the municipality.
It is an expression of the objectives of the Council in quantifiable outcomes which will be
implemented by the administration for the financial period from 1 July 2018 to 30 June 2019
(the financial year). It includes the service delivery targets and performance indicators for each
quarter, which should be linked to the performance agreements of senior management. It
therefore facilitates oversight of financial and non-financial performance of the municipality,
and allows the Municipal Manager to monitor the performance of the Section 56 Managers,
the Mayor/Council to monitor the performance of the Municipal Manager, and the community
to monitor the performance of the Council.
The SDBIP for the 2018/2019 financial year has been prepared for submission to Treasury.
11. Contracts having future budgetary implicationsIn terms of the NLM’s Supply Chain Management Policy, no contracts are awarded beyond
the medium-term revenue and expenditure framework (three years). In ensuring adherence to
this contractual time frame limitation, all reports submitted to either the Bid Evaluation and
Adjudication Committees must obtain formal financial comments from the Financial
Management Division of the Treasury Department.

Draft Annual Budget 2018-19 to 2021 Page 65
12. Legislation ComplianceCompliance with the MFMA implementation requirements have been substantially adhered to
through the following activities:
1. In year reporting
Reporting to National Treasury in electronic format was fully complied with on a monthly
basis. Section 71 reporting to the Mayor (within 10 working days) has progressively
improved and includes monthly published financial performance on the
NLM’s website.
2. Supply Chain Management
The procurement plans have been compiled for the projects that are above R200 000,
and will form part of the submissions to National Treasury. The measures will be put
into place to ensure that the Departments adhere to such procurement plans as to
enhance service delivery. Supply Chain Management Practitioners will be capacitated
to ensure that they comprehend with all the necessary compliance matters as
enshrined in the SCM Regulations and any relevant Circulars.
3. Cost Containment MeasuresWith reference to circular 82, the municipality will apply the stringent measures to
ensure that it complies with the circular, in order to minimise the costs in relation to
non-core functions, travel and accommodation, catering, and meetings.
4. Budget and Treasury Office The Budget and Treasury Office has been established in accordance with the MFMA.
5. Audit CommitteeAn Audit Committee has been established and is fully functional.
6. Service Delivery and Implementation Plan The detailed SDBIP document will finalised after adoption and approval of the
2018/19 MTREF in May 2018. It will be submitted to National Treasury.

Draft Annual Budget 2018-19 to 2021 Page 66
7. Annual Report Annual report is compiled in terms of the MFMA and National Treasury requirements
but there is still a need for improvement.
8. MFMA Training
The MFMA training is being implemented as there are staff members that have
enrolled in the Municipal Finance Certificate Programme
67
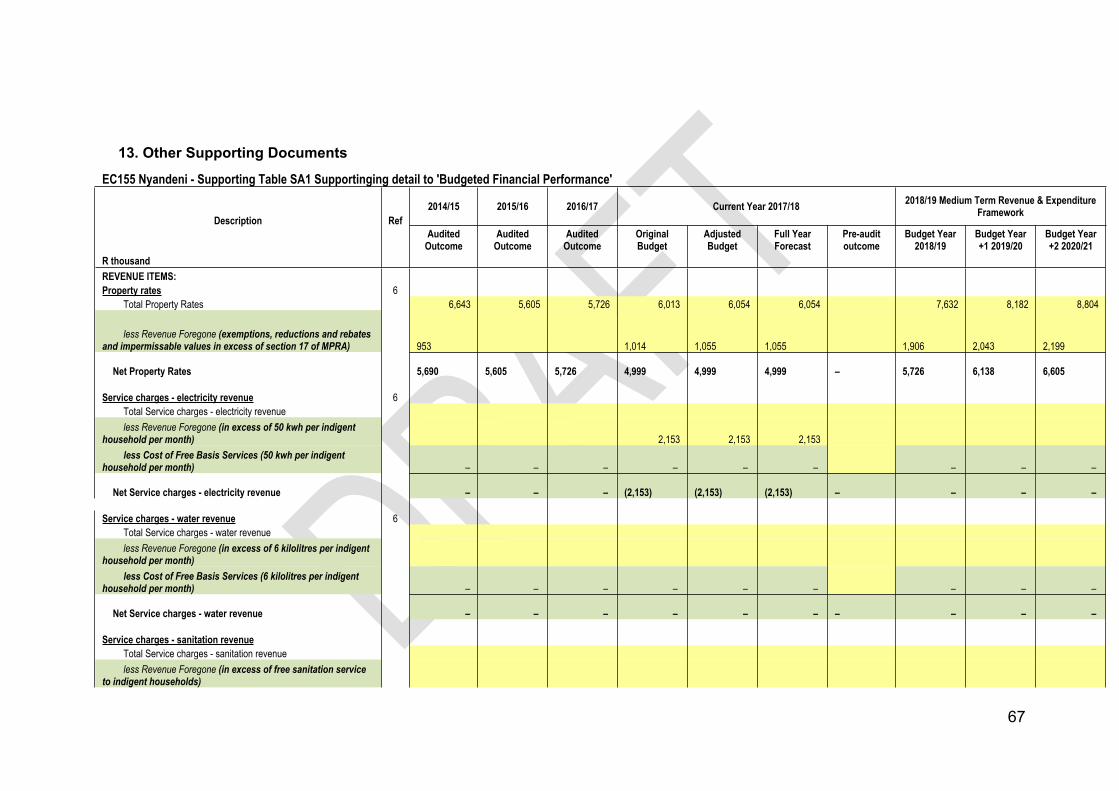
13. Other Supporting DocumentsEC155 Nyandeni - Supporting Table SA1 Supportinging detail to 'Budgeted Financial Performance'
2014/15 2015/16 2016/17 Current Year 2017/18 2018/19 Medium Term Revenue & Expenditure Framework
Description RefAudited
OutcomeAudited
OutcomeAudited
OutcomeOriginal Budget
Adjusted Budget
Full Year Forecast
Pre-audit outcome
Budget Year 2018/19
Budget Year +1 2019/20
Budget Year +2 2020/21
R thousand REVENUE ITEMS: Property rates 6
Total Property Rates 6,643 5,605 5,726 6,013 6,054 6,054 7,632 8,182 8,804
less Revenue Foregone (exemptions, reductions and rebates and impermissable values in excess of section 17 of MPRA)
953
1,014
1,055
1,055
1,906
2,043
2,199
Net Property Rates 5,690
5,605
5,726
4,999
4,999
4,999
–
5,726
6,138
6,605
Service charges - electricity revenue 6
Total Service charges - electricity revenue less Revenue Foregone (in excess of 50 kwh per indigent
household per month) 2,153 2,153 2,153 less Cost of Free Basis Services (50 kwh per indigent
household per month) – – – – – – – – –
Net Service charges - electricity revenue – – – (2,153)
(2,153)
(2,153)
– – – –
Service charges - water revenue 6
Total Service charges - water revenue less Revenue Foregone (in excess of 6 kilolitres per indigent
household per month) less Cost of Free Basis Services (6 kilolitres per indigent
household per month) – – – – – – – – –
Net Service charges - water revenue – – – – – – – – – –
Service charges - sanitation revenue
Total Service charges - sanitation revenue less Revenue Foregone (in excess of free sanitation service
to indigent households)

Draft Annual Budget 2018-19 to 2021 Page 68
less Cost of Free Basis Services (free sanitation service to indigent households) – – – – – – – – –
Net Service charges - sanitation revenue – – – – – – – – – –
Service charges - refuse revenue 6
Total refuse removal revenue 188
200
202
260
260
260
327
348
371
Total landfill revenue 0 0 less Revenue Foregone (in excess of one removal a week to
indigent households) 50
50
50
50
54
58
less Cost of Free Basis Services (removed once a week to indigent households) – – – – – – – – –
Net Service charges - refuse revenue 188
200
202
210
210
210
–
277
295
313
Other Revenue by source
Library fees 9 –
20
20
20
Plan fees 3
1
10,323
30
30
30
32
34
36
Other income(Cemetery fees,site rental and Eco-park fees) 155
0
120
36
36
78
83
88
Tender sales 368
541
299
299
299
400
426
453
Training-LGSETA 958
441 –
Vending & Hawking fees 34
69
Auction Sale 72 –
Fees earned 54
44
Commissions received 156 –
239
239
239
200
213
226
Fair value gain on short term investments 118
267
Donations received 10,904
36
36
Sundry income 3 28
48
48
Total 'Other' Revenue 1 1,928
12,295
10,323
707
707
707
–
710
755
804
EXPENDITURE ITEMS: Employee related costs

Draft Annual Budget 2018-19 to 2021 Page 69
Basic Salaries and Wages 2 92,149
105,285
66,538
85,011
84,964
92,837
97,961
105,213
Pension and UIF Contributions 6,632
13,792
13,792
14,812
15,909
17,086
Medical Aid Contributions 6,210
14,768
14,768
15,861
17,035
18,296
Overtime 6,632
6,007
6,007
6,452
6,929
7,442
Performance Bonus 5,698
783
783
841
904
970
Motor Vehicle Allowance 9,031
5,160
5,160
5,542
5,952
6,393
Cellphone Allowance
Housing Allowances 5,954
3,542
3,542
3,804
4,085
4,388
Other benefits and allowances 6,943
2,647
1,926
2,068
2,221
2,386
Payments in lieu of leave
Long service awards 219
219
235
252
271
Post-retirement benefit obligations 4 –
sub-total 5 92,149
105,285
113,638
131,929
131,161 –
–
142,453
151,249
162,444
Less: Employees costs capitalised to PPE
Total Employee related costs 1 92,149
105,285
113,638
131,929
131,161 –
–
142,453
151,249
162,444
Contributions recognised - capital
List contributions by contract
Total Contributions recognised - capital – – – – – – – – – –
Depreciation & asset impairment
Depreciation of Property, Plant & Equipment 33,632
31,807
35,084
41,815
41,815
54,480
58,403
62,842
Lease amortisation Capital asset impairment Depreciation resulting from revaluation of PPE 10
Total Depreciation & asset impairment 1 33,632
31,807
35,084
41,815
41,815 –
–
54,480
58,403
62,842

Draft Annual Budget 2018-19 to 2021 Page 70
Bulk purchases
Electricity Bulk Purchases 440
440
468
504
542
Water Bulk Purchases
Total bulk purchases 1 – – – 440
440 –
–
468
504
542
Transfers and grants
Cash transfers and grants – – – 4,324
6,855
2,234
–
4,098
3,107
3,343
Non-cash transfers and grants – – – 3,026
115 –
–
365
393
422
Total transfers and grants 1 – – – 7,350
6,970
2,234
–
4,463
3,500
3,765
Contracted services
Contracted services 497
1,600
53,787
49,141
48,765
41,581
Contracted services 50,415
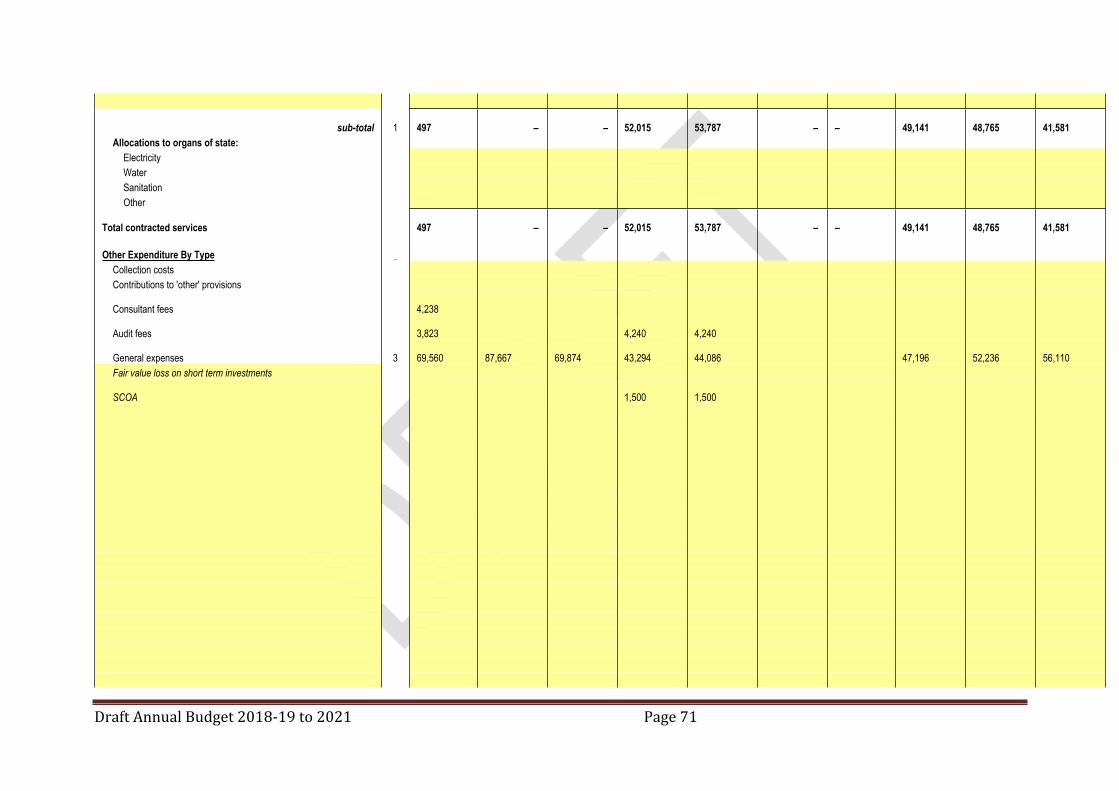
Draft Annual Budget 2018-19 to 2021 Page 71
sub-total 1 497 – –
52,015
53,787 –
–
49,141
48,765
41,581
Allocations to organs of state: Electricity Water Sanitation Other
Total contracted services 497 – –
52,015
53,787 –
–
49,141
48,765
41,581
Other Expenditure By Type
Collection costs Contributions to 'other' provisions
Consultant fees 4,238
Audit fees 3,823
4,240
4,240
General expenses 3 69,560
87,667
69,874
43,294
44,086
47,196
52,236
56,110
Fair value loss on short term investments
SCOA 1,500
1,500

Draft Annual Budget 2018-19 to 2021 Page 72
Total 'Other' Expenditure 1 77,621
87,667
69,874
49,034
49,826 –
–
47,196
52,236
56,110
Repairs and Maintenance by Expenditure Item 8
Employee related costs
Other materials 11,789
10,849
12,138
13,232
10,792
Contracted Services Other Expenditure
Total Repairs and Maintenance Expenditure 9 – – – 11,789
10,849 –
–
12,138
13,232
10,792

73