annual - thiess.com annual report2013.pdf · annual report 201 3. ... non-statutory special purpose...
TRANSCRIPT

ANNUAL
REPORT
2013

THIESS PTY LTD AND ITS CONTROLLED ENTITIES
NON-STATUTORY SPECIAL PURPOSE FINANCIAL REPORT
FOR THE YEAR ENDED 31 DECEmbER 2013
Managing Director’s Message 4
Directors’ report 6
Directors’ stateMent 9
consoLiDateD stateMent oF proFit or Loss 10
consoLiDateD stateMent oF FinanciaL position 11
consoLiDateD stateMent oF cash FLows 12
consoLiDateD stateMent oF coMprehensive incoMe 13
consoLiDateD stateMent oF changes in equity 14
notes to the FinanciaL stateMents 15
auDit report 42

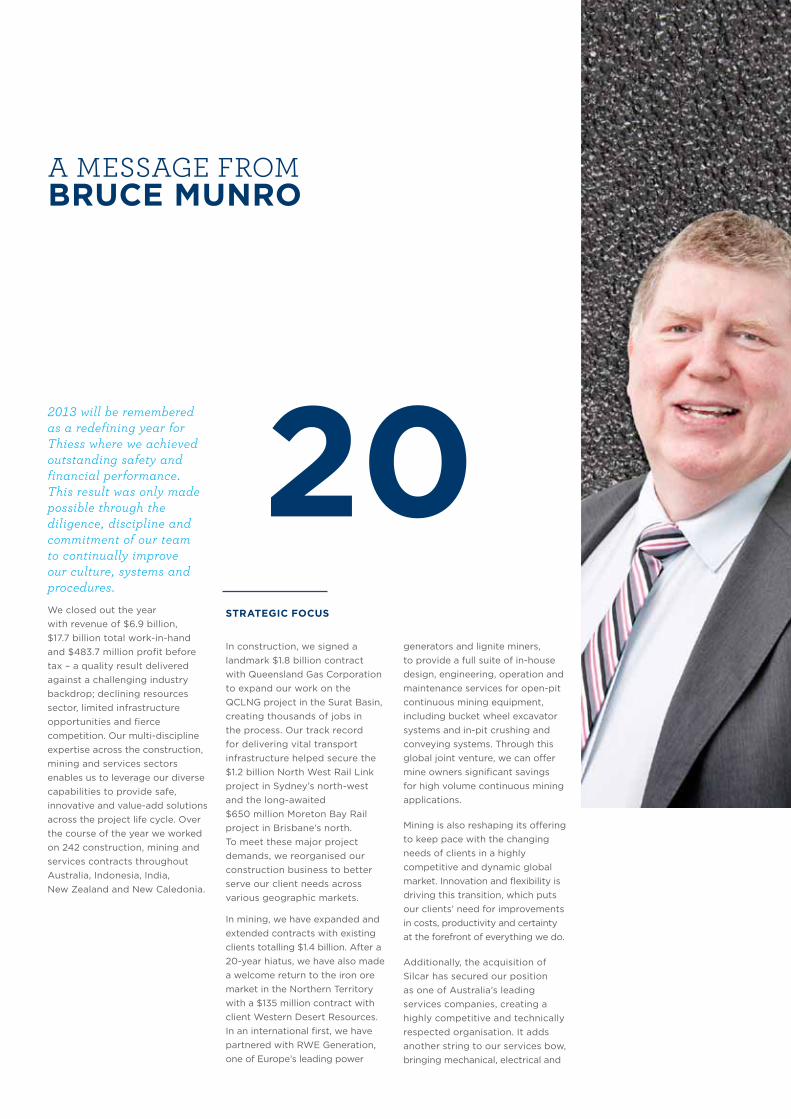
A messAge frombRUCE mUNRO
202013 will be remembered as a redefining year for Thiess where we achieved outstanding safety and financial performance. This result was only made possible through the diligence, discipline and commitment of our team to continually improve our culture, systems and procedures.We closed out the year with revenue of $6.9 billion, $17.7 billion total work-in-hand and $483.7 million profit before tax – a quality result delivered against a challenging industry backdrop; declining resources sector, limited infrastructure opportunities and fierce competition. Our multi-discipline expertise across the construction, mining and services sectors enables us to leverage our diverse capabilities to provide safe, innovative and value-add solutions across the project life cycle. Over the course of the year we worked on 242 construction, mining and services contracts throughout Australia, Indonesia, India, New Zealand and New Caledonia.
STRATEgIC FOCUS
In construction, we signed a landmark $1.8 billion contract with Queensland Gas Corporation to expand our work on the QCLNG project in the Surat Basin, creating thousands of jobs in the process. Our track record for delivering vital transport infrastructure helped secure the $1.2 billion North West Rail Link project in Sydney’s north-west and the long-awaited $650 million Moreton Bay Rail project in Brisbane’s north. To meet these major project demands, we reorganised our construction business to better serve our client needs across various geographic markets.
In mining, we have expanded and extended contracts with existing clients totalling $1.4 billion. After a 20-year hiatus, we have also made a welcome return to the iron ore market in the Northern Territory with a $135 million contract with client Western Desert Resources. In an international first, we have partnered with RWE Generation, one of Europe’s leading power
generators and lignite miners, to provide a full suite of in-house design, engineering, operation and maintenance services for open-pit continuous mining equipment, including bucket wheel excavator systems and in-pit crushing and conveying systems. Through this global joint venture, we can offer mine owners significant savings for high volume continuous mining applications.
Mining is also reshaping its offering to keep pace with the changing needs of clients in a highly competitive and dynamic global market. Innovation and flexibility is driving this transition, which puts our clients’ need for improvements in costs, productivity and certainty at the forefront of everything we do.
Additionally, the acquisition of Silcar has secured our position as one of Australia’s leading services companies, creating a highly competitive and technically respected organisation. It adds another string to our services bow, bringing mechanical, electrical and

5
13
“We have a great foundation for 2014 and beyond which enables us
to drive greater efficiencies through strategic procurement, greater
innovation and lean operations.”
industrial maintenance capability to Thiess, and strengthening our asset management and operations and management expertise.
We are now uniquely placed to offer clients a true whole-of-life solution that optimises long-term asset value while streamlining design and delivery.
Our safety result in 2013 was exceptional. The Recordable Injury Frequency Rate (RIFR) for the group of 3.4 is another record. This represents a 28 per cent reduction compared with our 2012 result and directly reflects the efforts of all Thiess employees across all levels of the organisation. Together we are contributing to a work environment focused on excellence. There is a real culture of safety growing within the business and we are confident with everyone’s commitment and ongoing hard work, this trend will continue to improve as we strive to achieve our goal of ‘everyone safe every day’.
FUTURE FOCUSED
We have a great foundation for 2014 and beyond which enables us to drive greater efficiencies through strategic procurement, greater innovation and leaner operations. We are recognising and taking advantage of the buying power of the Leighton Group, translating to lower costs. We also intend to partner more with other Leighton operating companies to secure Australia’s leading resources for major infrastructure projects.
More recently, we completed our staff survey which highlights strong levels of loyalty placing Thiess in the top 20 companies in Australia to work for. To further enhance our diversity agenda, we are committed to creating a culture of inclusion where everyone’s capability and great ideas can be harnessed.
It’s pleasing to see industry acknowledging the high standard Thiess sets across all of our projects with an impressive collection of international, national and state awards for our buildings, civil and
social infrastructure, as well as our reconciliation programs which are helping to ‘close the gap’.
We are also focused on gaining greater traction with our corporate social responsibility program – ‘Care’, where we increase our support and commitment to the communities in which we work and live. Our vision of ‘Creating a Brighter Future, Together’ embodies the spirit of leadership, innovation and partnerships and this extends not only to our operations but across all facets of our business.
Sustaining success in our competitive markets isn’t easy, or lucky. It’s the result of the valuable lessons we’ve learnt from overcoming the challenges of the previous few years. We’ve put in place more robust risk and design management, and project control capabilities, and will continue to develop and refine these functions in 2014 as we celebrate our 80th year of operations in Australia.
Bruce Munro
Ma
na
gin
g D
irec
to
r’s
Mes
sag
e

DIRECTORS’ REPORT
DIRECTORS
The directors of the Company at any time during or since the end of the financial year are:
Mr Bruce A Munro Managing Director Director since 15 August 2011
Mr Peter A Gregg Director since 4 February 2011
Ms Susan J Palmer Chief Financial Officer Director since 15 August 2011
Mr Hamish Tyrwhitt Director since 14 December 2011
PRINCIPAL ACTIvITIES
During the financial year there were no significant changes in the nature of the Consolidated Entity’s activities, which were construction, mining and services in Australia and selected international markets including New Zealand, Indonesia, New Caledonia and India.
CONSOLIDATED RESULT
The consolidated profit for the year attributed to the members of Thiess Pty Ltd was:
2013 $’000
2012 $’000
Restated
Net profit from ordinary activities after tax 323,158
327,182
Minority interest (110) (124)
Net profit after tax attributable to members of Thiess Pty Ltd 323,048
327,058
REvIEW OF OPERATIONS
The 2013 performance consolidates our position as a leading mining, construction and service provider. The Consolidated Entity delivered a net profit before tax of $483.7 million in a challenging environment with a declining resource sector, limited infrastructure opportunities and fierce competition. The focus on working capital and plant utilisation has strengthened the balance sheet.
The Group’s future prospects are underpinned by $17.6 billion of work in hand which has been supported by a number of recent awards and contract extensions.
Operating revenue Work in hand
$’000 $’000
Mining 2,209,548 11,859,862
Construction 3,805,570 3,992,659
Services 630,438 1,770,700
Other 20,794 26,742
6,666,350 17,649,963
DIvIDENDS
Dividends paid or declared by the Consolidated Entity to members in respect to the 2013 financial year was;
ORDINARY DIvIDENDS2013 2012
AmOUNT $’000 $’000
Date of payment: 30 January 2013 135,000 -
Dividend declared since the end of the financial year - $265 million paid 3rd March 2014.
STATE OF AFFAIRS
There were no significant changes in the state of affairs of the Consolidated Entity that occurred during the financial year under review.
The directors present their report, together with the consolidated financial report of the Consolidated Entity, being Thiess Pty Ltd (“the Company”) and its controlled entities (“the Group”).
THIESS PTY LTD AND ITS CONTROLLED ENTITIES NON-STATUTORY SPECIAL PURPOSE FINANCIAL REPORT FOR THE YEAR ENDED 31 DECEmbER 2013

77
ENvIRONmENTAL REgULATION
The Group is committed to ensuring that all of its projects employ environmentally responsible practices and, as a minimum, comply with all applicable environmental laws and regulations. We are focused on instilling a culture that seeks to go ‘beyond compliance’ to deliver positive environmental outcomes that add value to our projects and produce mutually beneficial outcomes for our clients, the environment and the communities in which we operate.
Our construction, mining and services businesses each maintain and operate under an Environmental Management System that is certified to the international standard ISO 14001. This system provides a framework for identifying and proactively managing potential environmental risks and places an emphasis on the continual improvement of our environmental performance. The system is the subject of regular internal auditing as well as being annually tested by an independent third party to ensure ongoing certification against the international standard.
During 2013 there were no prosecutions for breaches of environmental legislation or penalty infringement notices or fines from government against the Group.
The Group continues to work with our clients and the Environmental Protection Authority Victoria to address the pollution abatement notice issued in a prior year regarding the requirements for the ongoing management of acid sulphate soil at the Victorian Desalinisation Project. This work is progressing well and expected to be complete in early 2014.
HEALTH AND SAFETY
Over the past two years, enormous effort and energy has been applied through a multi-disciplinary approach to safety in our workplaces that has achieved a profound step change in our safety performance. Based on a critical shift in focus from lag to lead indicators, this approach has provided faster and more focused decision-making using trends and data, rather than incidents, to improve safety performance.
Our second two-day Safety Summit, held in August 2013, brought together more than 150 leaders. It allowed senior leaders to contribute, engage and commit to goals that will continue to drive our ongoing performance improvement. A key feature of the summit was the creation of a new set of lead indicators to address specific business stream objectives.
Over the past 12 months this approach has seen injury frequency rates drop by 28%, from 4.6 to 3.4 across the Group – the lowest ever in Thiess’ history.
2013 2012 2011
Recordable Injuries 203.6 339.5 504
Recordable Injury Frequency Rate 3.4 4.7 7.0
Lost Time Injuries 42.3 65.6 65.4
Lost Time Injury Frequency Rate 0.7 0.9 0.9
Lost Time Injury Severity Rate 14.8 9.3 15.5
Compliance with Leading Indicators 98% 85% 18%
Note: Joint arrangements percentage has been applied to all incident data
It is with great sadness that we report a fatality that occurred in our Indonesian operations in January 2013. The incident involved a timber cutter who was struck by a falling branch. The incident was thoroughly investigated by a team that included senior safety professionals and senior operational managers who worked with the site management team to fully understand the circumstances of the incident. The learnings from the investigation were shared across the organisation and industry through a range of internal and external forums.
During the year, the Group also entered into an enforceable undertaking in response to an incident that occurred on the Airport Link project in June 2011. This incident involved a worker who suffered injuries as a result of falling from height through a smoke duct opening. The Group also applied for another enforceable undertaking in response to a fatality on the Airport Link project in September 2011 where a worker became trapped under redundant steelwork. This enforceable undertaking is currently being considered by the Office of Fair and Safe Work Queensland.
The Group believes that enforceable undertakings provide a positive alternative to regulatory action. The undertakings benefit a wide industry audience through the development and sharing of safety controls, educational materials and or a greater
understanding of risk and safety management principals.
The Group also received a number of Improvement Notices during 2013. All notices received were formally closed out to the satisfaction of the regulator with no further action.
LEgAL ISSUES SUmmARY
Improvement Notices/mine
Directives
Prohibition Notices
Infringement Notices
OHS Convictions
Services 4 0 0 0
Construction 2 0 0 0
Australian Mining
11 0 0 0
International 0 0 0 0
Note: Joint arrangements percentage has been applied to this data
In 2014 the Group will continue to drive its leadership in safety and will further embed and enhance the strategies that have delivered significant improvements in 2012 and 2013. We will maintain our focus on developing safety leaders, clarifying expectations and giving our people the opportunity to design, own and drive safety performance. We believe that this approach improves morale commitment and job satisfaction, and gives us the chance to adapt central initiatives to the unique contexts within our business.
Dir
ect
or
s’ r
epo
rt

EvENT SUbSEQUENT TO bALANCE DATE
Dividends have been declared after 31 December 2013. The financial effect of the above transaction has not been brought to account in the financial statements for the year ended 31 December 2013.
No other items have arisen since the end of the financial year which significantly affected or may significantly affect the operations of the Consolidated Entity, the results of those operations, or the state of affairs of the Consolidated Entity in future financial year.
LIKELY DEvELOPmENTS
The Consolidated Entity will continue to concentrate on the significant opportunities in the construction, mining and services sectors, and international markets including Indonesia, New Zealand and India.
DIRECTORS’ bENEFITS
Since the end of the financial year no director of the Company has received or become entitled to receive any benefit by reason of a contract made by the Company, its controlled entities or a related body corporate with a director or with a firm of which the director is a member, or with an entity in which the director has a substantial financial interest.
INDEmNIFICATION OF OFFICERS
The Company has agreed under Clause 71.2 of its Constitution to indemnify the current and past Officers of the Company against all liabilities to another person and reasonable legal defence costs that may arise from their position as Officers of the Company and its controlled entities, except where the liability arises out of conduct involving a lack of good faith.
DIRECTORS’ REPORT CONTINUED
ROUNDINg OFF
As the Company is of a kind referred to in ASIC Class Order 98/100 dated 10 July 1998, the directors have chosen to round off amounts in the accompanying accounts to the nearest one thousand dollars in accordance with that Class Order, unless otherwise indicated.
Dated Sydney this 4th day of March 2014.
Signed in accordance with a resolution of the directors
BA Munro SJ Palmer Director Director

99
DIRECTORS’ DECLARATION
1. As detailed in the notes to the financial statements, the Consolidated Entity is not a reporting group as the Company and its significant Australian domiciled subsidiaries joined the Leighton Holdings Limited Deed of Cross Guarantee dated the 19th December 2013. Pursuant to ASIC Class order 98/1418 dated 13 August 1998, relief was granted to the Leighton Holdings Limited Class Order Companies from the Corporations Act 2001 requirements for preparation, audit and publication of the Consolidated Entity’s financial statements.
The directors of the Company have elected to prepare non-statutory special purpose financial statements for the period ending 31 December 2013.
(a) the financial statements and notes set out on pages 10 to 41, are in accordance with the basis of accounting as described in Note (a), so as to present fairly the financial position of the Consolidated Entity as at 31 December 2013 and of its performance, as represented by the results of its operations and its cash flows, for the year ended on that date; and
(b) there are reasonable grounds to believe that the Company will be able to pay its debts as and when they become due and payable.
2. Dated at Sydney this 4th day of March 2014.
Signed in accordance with a resolution of the directors.
BA Munro SJ Palmer Director Director
DIRECTORS’ STATEmENT
Dir
ect
or
s’ s
tat
eMen
t
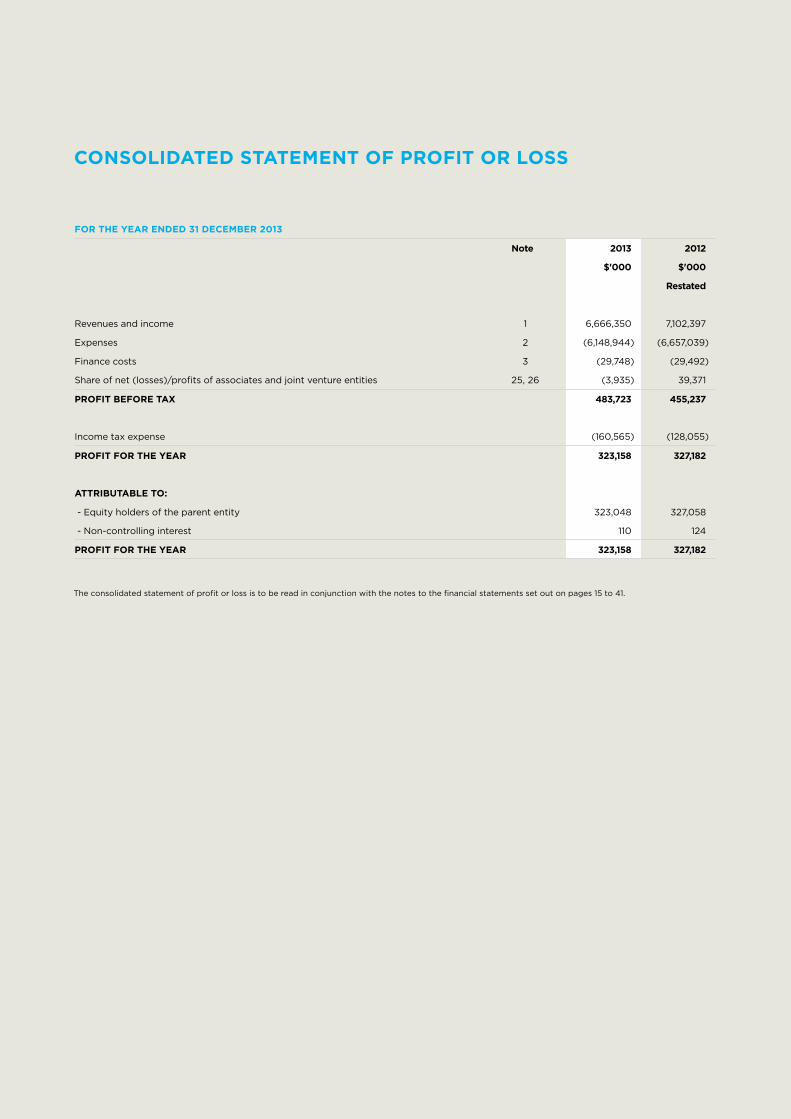
CONSOLIDATED STATEmENT OF PROFIT OR LOSS
FOR THE YEAR ENDED 31 DECEmbER 2013
Note 2013 2012
$'000 $'000
Restated
Revenues and income 1 6,666,350 7,102,397
Expenses 2 (6,148,944) (6,657,039)
Finance costs 3 (29,748) (29,492)
Share of net (losses)/profits of associates and joint venture entities 25, 26 (3,935) 39,371
PROFIT bEFORE TAX 483,723 455,237
Income tax expense (160,565) (128,055)
PROFIT FOR THE YEAR 323,158 327,182
ATTRIbUTAbLE TO:
- Equity holders of the parent entity 323,048 327,058
- Non-controlling interest 110 124
PROFIT FOR THE YEAR 323,158 327,182
The consolidated statement of profit or loss is to be read in conjunction with the notes to the financial statements set out on pages 15 to 41.
1111 11
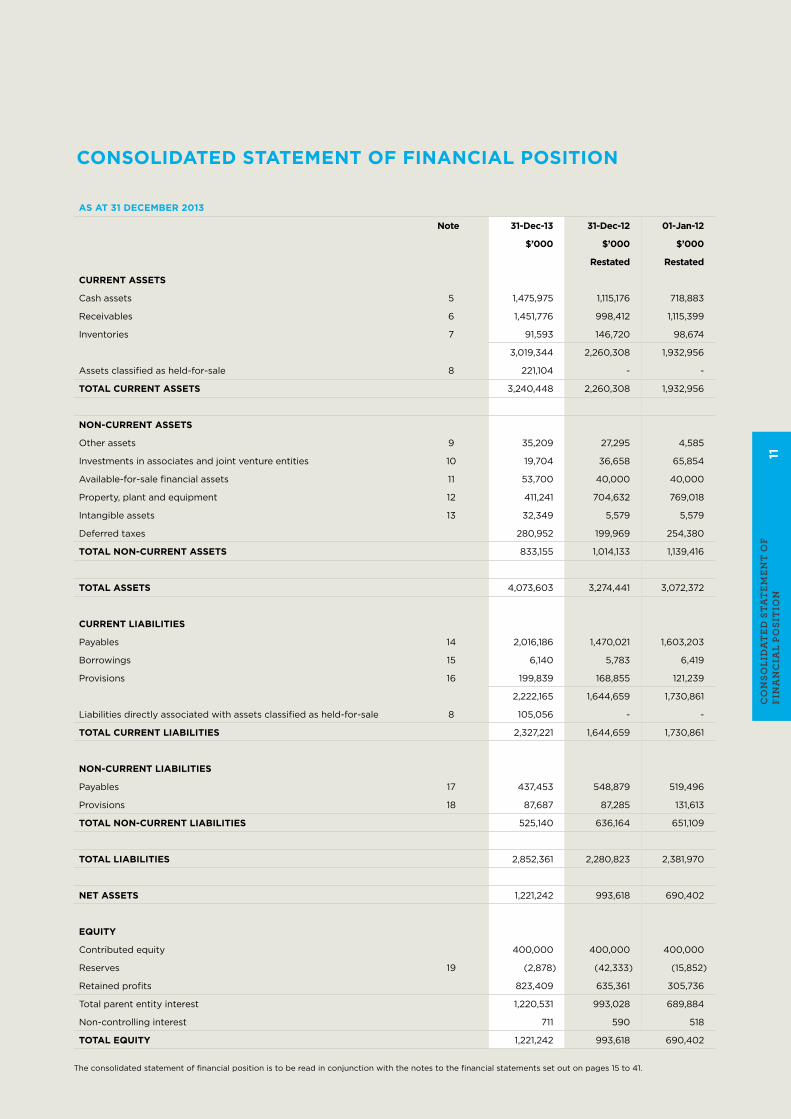
CONSOLIDATED STATEmENT OF FINANCIAL POSITION
AS AT 31 DECEmbER 2013
Note 31-Dec-13 31-Dec-12 01-Jan-12
$’000 $’000 $’000
Restated Restated
CURRENT ASSETS
Cash assets 5 1,475,975 1,115,176 718,883
Receivables 6 1,451,776 998,412 1,115,399
Inventories 7 91,593 146,720 98,674
3,019,344 2,260,308 1,932,956
Assets classified as held-for-sale 8 221,104 - -
TOTAL CURRENT ASSETS 3,240,448 2,260,308 1,932,956
NON-CURRENT ASSETS
Other assets 9 35,209 27,295 4,585
Investments in associates and joint venture entities 10 19,704 36,658 65,854
Available-for-sale financial assets 11 53,700 40,000 40,000
Property, plant and equipment 12 411,241 704,632 769,018
Intangible assets 13 32,349 5,579 5,579
Deferred taxes 280,952 199,969 254,380
TOTAL NON-CURRENT ASSETS 833,155 1,014,133 1,139,416
TOTAL ASSETS 4,073,603 3,274,441 3,072,372
CURRENT LIAbILITIES
Payables 14 2,016,186 1,470,021 1,603,203
Borrowings 15 6,140 5,783 6,419
Provisions 16 199,839 168,855 121,239
2,222,165 1,644,659 1,730,861
Liabilities directly associated with assets classified as held-for-sale 8 105,056 - -
TOTAL CURRENT LIAbILITIES 2,327,221 1,644,659 1,730,861
NON-CURRENT LIAbILITIES
Payables 17 437,453 548,879 519,496
Provisions 18 87,687 87,285 131,613
TOTAL NON-CURRENT LIAbILITIES 525,140 636,164 651,109
TOTAL LIAbILITIES 2,852,361 2,280,823 2,381,970
NET ASSETS 1,221,242 993,618 690,402
EQUITY
Contributed equity 400,000 400,000 400,000
Reserves 19 (2,878) (42,333) (15,852)
Retained profits 823,409 635,361 305,736
Total parent entity interest 1,220,531 993,028 689,884
Non-controlling interest 711 590 518
TOTAL EQUITY 1,221,242 993,618 690,402
co
nso
LiD
at
eD s
tat
eMen
t o
F Fi
na
nc
iaL
posi
tio
n
The consolidated statement of financial position is to be read in conjunction with the notes to the financial statements set out on pages 15 to 41.

CONSOLIDATED STATEmENT OF CASH FLOWS
FOR THE YEAR ENDED 31 DECEmbER 2013
Note 2013 2012
$’000 $’000
Restated
CASH FLOWS FROm OPERATINg ACTIvITIES
Cash receipts in the course of operations 7,168,107 6,995,529
Cash payments in the course of operations (6,028,577) (6,623,758)
Interest received 11,726 19,108
Income tax paid (72,066) (2,880)
Finance costs paid (29,748) (29,492)
NET CASH PROvIDED bY OPERATINg ACTIvITIES 28 1,049,442 358,507
CASH FLOWS FROm INvESTINg ACTIvITIES
Acquisition of subsidiaries, net of cash acquired 29 (19,929) -
Payment for property, plant and equipment and intangibles (451,477) (477,835)
Proceeds from sale of non-current assets 21,020 48,995
Increase in associates and joint venture entities 5,142 39,862
Proceeds from sale of associates - 160,604
Proceeds from sale of waste business - 172,519
NET CASH USED IN INvESTINg ACTIvITIES (445,244) (55,855)
CASH FLOWS FROm FINANCINg ACTIvITIES
Loans (to)/from related entities (193,943) 16,960
Proceeds from finance lease liability facilities 186,351 108,779
Proceeds from borrowings 15,671 -
Finance lease payments (106,730) (37,261)
Repayment of borrowings (14,380) -
Dividends paid (135,000) -
NET CASH (USED IN) / FROm FINANCINg ACTIvITIES (248,031) 88,478
NET INCREASE IN CASH HELD 356,167 391,130
CASH AT THE bEgINNINg OF THE YEAR 28 1,115,176 718,883
Effects of exchange rate fluctuations on the balances of cash held in foreign currencies 4,632 5,163
CASH AT THE END OF THE FINANCIAL YEAR 28 1,475,975 1,115,176
The consolidated statement of cash flows is to be read in conjunction with the notes to the financial statements set out on pages 15 to 41.

1313 13
CONSOLIDATED STATEmENT OF COmPREHENSIvE INCOmE
The consolidated statement of comprehensive income is to be read in conjunction with the notes to the financial statements set out on pages 15 to 41.
FOR THE YEAR ENDED 31 DECEmbER 2013
2013 2012
$’000 $’000
Restated
PROFIT FOR THE YEAR 323,158 327,182
Other comprehensive income
Items that may be subsequently reclassified to profit or loss:
Net movement in cash flow hedges net of tax 89 956
Net movement in investment reserve - (21,207)
Net fair value gain on available-for-sale assets 9,590 -
Non-controlling interest (140) (14)
Exchange difference on the translation of foreign operations 29,927 (6,277)
NET OTHER COmPREHENSIvE INCOmE/(EXPENSE) RECOgNISED DIRECTLY IN EQUITY 39,466 (26,542)
TOTAL COmPREHENSIvE INCOmE FOR THE YEAR 362,624 300,640
TOTAL COmPREHENSIvE INCOmE FOR THE YEAR ATTRIbUTAbLE TO:
- Equity holders of the consolidated entity 362,503 300,568
- Non-controlling interest 121 72
362,624 300,640
co
nso
LiD
at
eD s
tat
eMen
t o
F c
oM
preh
ensi
ve
inc
oM
e

CONSOLIDATED STATEmENT OF CHANgES IN EQUITY
* Consists of 400,000,000 fully paid ordinary shares, which carry the right to one vote per share and receive a dividend.
The consolidated statement of changes in equity is to be read in conjunction with the notes to the financial statements set out on pages 15 to 41.
FOR THE YEAR ENDED 31 DECEmbER 2013
Contributed equity *
Reserves Retained profit
Attributable to equity
holders
Non- controlling
interest
Total equity
$’000 $’000 $’000 $’000 $’000 $’000
bALANCE AT 1 JANUARY 2012 AS PREvIOUSLY REPORTED 400,000 (15,843) 305,737 689,894 518 690,412
Comprehensive income/(loss) for the year - (26,490) 327,058 300,568 72 300,640
Transferred from equity account reserve - - 2,566 2,566 - 2,566
RESTATED bALANCE AS AT 31 DECEmbER 2012 400,000 (42,333) 635,361 993,028 590 993,618
bALANCE AT 1 JANUARY 2013 400,000 (42,333) 635,361 993,028 590 993,618
Comprehensive income for the year - 39,455 323,048 362,503 121 362,624
Dividends - - (135,000) (135,000) - (135,000)
bALANCE AS AT 31 DECEmbER 2013 400,000 (2,878) 823,409 1,220,531 711 1,221,242

1515 15
NOTES TO THE FINANCIAL STATEmENTS
SUmmARY OF SIgNIFICANT ACCOUNTINg POLICIES
Thiess Pty Ltd is a Company domiciled in Australia and is a for-profit entity.
The Consolidated Entity is not a reporting group as the Company and its significant Australian domiciled subsidiaries joined the Leighton Holdings Limited Deed of Cross Guarantee dated the 19th December 2013. Pursuant to ASIC Class order 98/1418 dated 13 August 1998, relief was granted to the Leighton Holdings Limited Class Order Companies from the Corporations Act 2001 requirements for preparation, audit and publication of the Consolidated Entity’s financial statements.
The Financial Report has been prepared on a non-statutory special purpose basis.
The Financial Report was authorised for issue by the directors on 4th March 2014.
a) bASIS OF PREPARATION
The financial statements have been prepared in accordance with the recognition and measurement requirements specified by all Australian Accounting Standards and Interpretations, and the disclosure requirements of Accounting Standards AASB 101 ‘Presentation of Financial Statements’, AASB 107 ‘Statement of Cash Flows’, AASB 108 ‘Accounting Policies, Changes in Accounting Estimates and Errors’ and AASB 1054 ‘Australian Additional Disclosures’.
The Financial Report does not include the disclosure requirements of the following pronouncements having a material effect:
AASB 124 – Related Party Disclosures
AASB 7 – Financial Instruments: Disclosures
The Group has changed its accounting policies as a result of new and amended accounting standards which became effective for annual reporting periods beginning on or after 1 January 2013. AASB 10 ‘Consolidated Financial Statements’ (“AASB 10”) affected the Group’s principles of consolidation and AASB 11 ‘Joint Arrangements’ (“AASB 11”) resulted in the Group changing its accounting for some joint arrangements from the equity method to recognise the Group’s share of assets and liabilities and income and expense items.
Other new and amended accounting standards that apply for the first time to the 31 December 2013 reporting period include AASB 128 ‘Investments in Associates and Joint Ventures’ (2011), AASB 13 ‘Fair Value Measurement’, AASB 119 ‘Employee Benefits’ (September 2011), AASB 2011-8 ‘Amendments to Australian Accounting Standards arising from AASB 13’, AASB 2011-9 ‘Amendments to Australian Accounting Standards - Presentation of Items of Other Comprehensive Income’. While these standards introduced new disclosure requirements, they did not materially affect the Group’s accounting policies or any of the amounts recognised in the financial statements.
Except as noted above, the accounting policies set out below have been applied consistently to all periods presented in the Financial Report. The preparation of the Financial Report requires management to make judgements, estimates and assumptions that effect the application of policies and reported amounts of assets, liabilities, income and expenses. The estimates and associated assumptions are based on historical experience and various other factors that are believed to be reasonable under the circumstances, the results of which form the basis of making the judgements about carrying values of assets and liabilities that are not readily apparent from other sources. Actual results may differ from these estimates. The estimates and underlying assumptions are reviewed on an ongoing basis.
The Financial Statements have been prepared on an accruals basis and are based on historical costs modified by the revaluation of selected non-current assets and financial instruments for which the fair value basis of accounting has been applied.
Judgements made by management in the application of Australian Accounting Standards that have a significant effect on the Financial Report and estimates with a significant risk of material adjustment in the next year are as follows:
» estimation of projects forecast cost at completion
» assessment of projects on a percentage of completion basis, in particular with regard to accounting for variations, the timing of profit recognition and the amount of profit recognised;
» estimation of the economic life of property, plant and equipment;
» testing of assets for impairment; and
» determining the fair value of available-for-sale assets.
Note 23 contains detailed analysis of the foreign exchange exposure of the Consolidated Entity and risks in relation to foreign exchange movements.
no
tes
to
Fin
an
cia
L st
at
eMen
ts
NOTES CONTINUED
b) bASIS OF CONSOLIDATION
AASB 10 establishes a revised control model that applies to all entities. It replaces the consolidation requirements in AASB 127 Consolidated and Separate Financial Statements and AASB Interpretation 112 Consolidation – Special Purpose Entities. The revised control model broadens the situations when an entity is considered to be controlled by another entity and includes additional application guidance. Under AASB 10, the Group controls an entity when the Group is exposed to, or has rights to, variable returns from its involvement with the entity and has the ability to affect those returns through its power over the entity. The Group has reassessed its consolidation conclusions in light of the new control principles in AASB 10 and concluded that no changes are required. Accordingly, the adoption of AASB 10 has not resulted in any adjustments to the carrying amounts in the Financial Statements.
Investments in joint arrangements
AASB 11 replaces AASB 131 ‘Interests in Joint Ventures’ and AASB Interpretation 113 ‘Jointly - Controlled Entities – Non-monetary Contributions by Venturers’. AASB 11 uses the principle of control in AASB 10 to define joint control, and therefore the determination of whether joint control exists may change. In addition, AASB 11 removes the option to account for jointly-controlled entities using proportionate consolidation. Instead, accounting for a joint arrangement is dependent on the nature of the rights and obligations arising from the arrangement. Joint operations that give the venturers a right to the underlying assets and obligations for liabilities are accounted for by recognising the share of those assets and liabilities. Joint ventures that give the venturers a right to the net assets are accounted for using the equity method.
The adoption of AASB 11 has resulted in the Group changing its accounting policy to distinguish between accounting for joint arrangements as either a joint operation or as a joint venture. As a joint operation the Group accounts for its right to the underlying assets and obligations for liabilities by recognising the share of those assets and liabilities. As a joint venture the Group accounts for its interests using the equity method, where the interests are initially recognised in the consolidated statement of financial position at cost and adjusted thereafter to recognise the Group’s share of the post-acquisition profits or losses and movements in other comprehensive income in profit or loss and other comprehensive income respectively.
The adoption of AASB 11 has resulted in the Group determining that some joint arrangements that were previously accounted for using the equity method are to be accounted for as joint operations. As required by AASB 11, the change in policy has been applied retrospectively and, as a consequence, adjustments were recognised in the statement of Financial Position as of 1 January 2012. The Group has derecognised its related investments in joint ventures at the beginning of the earliest period presented being 1 January 2012, and has recognised its share of the assets and liabilities. The change in accounting policy had no impact on the Group’s net assets, items of equity, profit for the year.
The consolidated Financial Report incorporates the financial statements of Thiess Pty Ltd and entities controlled by Thiess Pty Ltd. Control is achieved where Thiess Pty Ltd has the power to govern the financial and operating policies of an entity to obtain benefits from its activities.
Impact on the Group’s historical financial statements on adoption of AASB 11
As a result of the adoption of AASB 11, certain amounts previously disclosed in the Group’s historical financial statements have been adjusted to reflect the retrospective impact of the change in accounting policy adopted from 1 January 2013.
The following tables summarise the adjustments made to the Group’s consolidated statement of profit or loss, consolidated Statement of Financial Position and consolidated statement of cash flows for the year ended 31 December 2012.

1717 17
NOTES CONTINUED
b) bASIS OF CONSOLIDATION (CONTINUED)
ImPACT ON PROFIT FOR THE YEAR ENDED 31 DECEmbER 2012 OF THE APPLICATION OF AASb 11
As at 31-Dec-12 as previously
reported
AASb 11 Adjustments
As at 31-Dec-12 as restated
$’000 $’000 $’000
Revenues and income 6,133,516 968,881 7,102,397
Expenses (5,489,833) (1,167,206) (6,657,039)
Finance costs (29,492) - (29,492)
Share of net losses of associates and joint venture entities (158,954) 198,325 39,371
Profit before tax 455,237 - 455,237
Income tax expense (128,055) - (128,055)
Profit for the year 327,182 - 327,182
ImPACT ON ASSETS, LIAbILITIES AND EQUITY AS AT 31 DECEmbER 2012 OF THE APPLICATION OF AASb 11
As at 31-Dec-12 as previously
reported
AASb 11 Adjustments
As at 31-Dec-12 as restated
$’000 $’000 $’000
Current assets 2,188,444 71,864 2,260,308
Non-current assets 988,963 25,170 1,014,133
Total assets 3,177,407 97,034 3,274,441
Current liabilities 1,547,934 96,725 1,644,659
Non-current liabilities 635,855 309 636,164
Total liabilities 2,183,789 97,034 2,280,823
Net assets 993,618 - 993,618
Equity 993,618 - 993,618
ImPACT ON CASH FLOWS FOR THE YEAR ENDED 31 DECEmbER 2012 ON THE APPLICATION OF AASb 11
As at 31-Dec-12 as previously
reported
AASb 11 Adjustments
As at 31-Dec-12 as restated
$’000 $’000 $’000
Net cash inflow from operating activities 949,310 (590,803) 358,507
Net cash outflow from investing activities (751,406) 695,551 (55,855)
Net cash inflow from financing activities 92,902 (4,424) 88,478
Net cash inflow 290,806 100,324 391,130
no
tes
to
Fin
an
cia
L st
at
eMen
ts

NOTES CONTINUED
c) bUSINESS COmbINATIONS
The acquisition method of accounting is used to account for all business combinations. The consideration for the acquisition of a controlled entity comprises the fair values of the assets transferred, the liabilities incurred and the equity interests issued by the Group. The consideration transferred also includes the fair value of any pre-existing equity interest in the controlled entity. Acquisition related costs are expensed as incurred. Identifiable assets acquired and liabilities assumed in a business combination are measured at their fair values at the acquisition date. On an acquisition-by-acquisition basis, the Group recognises any non-controlling interest in the acquiree either at fair value or at the non-controlling interest’s proportionate share of the acquiree’s net identifiable assets. The excess of the consideration transferred over the fair value of the Group’s share of the net identifiable assets acquired is recorded as goodwill. Where the consideration is less than the fair value of the net identifiable assets of the controlled entity acquired, the difference is recognised directly in the income statement as a gain on acquisition of a controlled entity.
d) REvENUE RECOgNITION
Revenue is measured at the fair value of the consideration received or receivable. Revenue is reduced for estimated customer returns, rebates and other similar allowances.
i. Construction contracts
When the outcome of a construction contract can be estimated reliably, revenue and costs are recognised by reference to the stage of completion of the contract activity at the end of the reporting period, measured based on the proportion of contract costs incurred for work performed to date relative to the estimated total contract costs, except where this would not be representative of the stage of completion. Variations in contract work, claims and incentive payments are included to the extent that the amount can be measured reliably and its receipt is considered probable.
When the outcome of a construction contract cannot be estimated reliably, contract revenue is recognised to the extent of contract costs incurred that it is probable will be recoverable. Contract costs are recognised as expenses in the period in which they are incurred. When it is probable that total contract costs will exceed total contract revenue, the expected loss is recognised as an expense immediately. When contract costs incurred to date plus recognised profits less recognised losses exceed progress billings, the surplus is shown as amounts due from customers for contract work.
For contracts where progress billings exceed contract costs incurred to date plus recognised profits less recognised losses, the surplus is shown as the amounts due to customers for contract work. Amounts received before the related work is performed are included in the statement of financial position, as a liability, as advances received. Amounts billed for work performed but not yet paid by the customer are included in the Statement of Financial Position under trade and other receivables.
ii. Revenue from mining, telecommunications, environmental and utilities services is recognised on an accruals basis.
iii. Interest revenue is recognised as it accrues.
iv. Dividends are recognised when declared.
e) INCOmE TAX
Income tax on profit for the year comprises current and deferred tax. Income tax expense is recognised in the profit or loss except to the extent that it relates to items recognised directly in equity, in which case it is recognised in equity. Current tax is expected tax payable on the taxable income for the year and any adjustment to tax payable in respect of previous years. The Consolidated Entity adopts the balance sheet liability method, providing for temporary differences between carrying amounts of assets and liabilities for financial reporting purposes and the amounts used for taxation purposes. The amount of deferred tax provided is based on the expected manner of realisation or settlement of the carrying amount of assets and liabilities.
Deferred tax assets are recognised for deductible temporary differences and unused tax losses only if it is probable that future taxable amounts will be available to utilise those temporary differences and losses.
i. Tax consolidation
The immediate parent, Leighton Holdings Limited, is the head entity in the tax-consolidated group comprising all the Australian wholly-owned subsidiaries. The tax-consolidated group has entered into a tax funding agreement that requires wholly-owned subsidiaries to make contributions to the head entity for current tax assets and liabilities occurring after implementation of tax consolidation. Under the tax funding agreement, contributions are calculated on a “stand-alone basis” so that the contributions are equivalent to the current tax balances generated by transactions entered into by the wholly-owned subsidiaries. The contributions are payable as set-out in the agreement and reflect the timing of the head entity’s obligation to make payments for tax liabilities to relevant authorities.
f) CASH ASSETS
Cash assets include cash on hand, cash at bank and funds on deposit. For the purpose of the statement of cash flows, cash includes cash on hand, cash at bank and short term deposits at call, net of outstanding overdrafts.
All cash assets are held with high credit quality financial institutions.
1919 19
NOTES CONTINUED
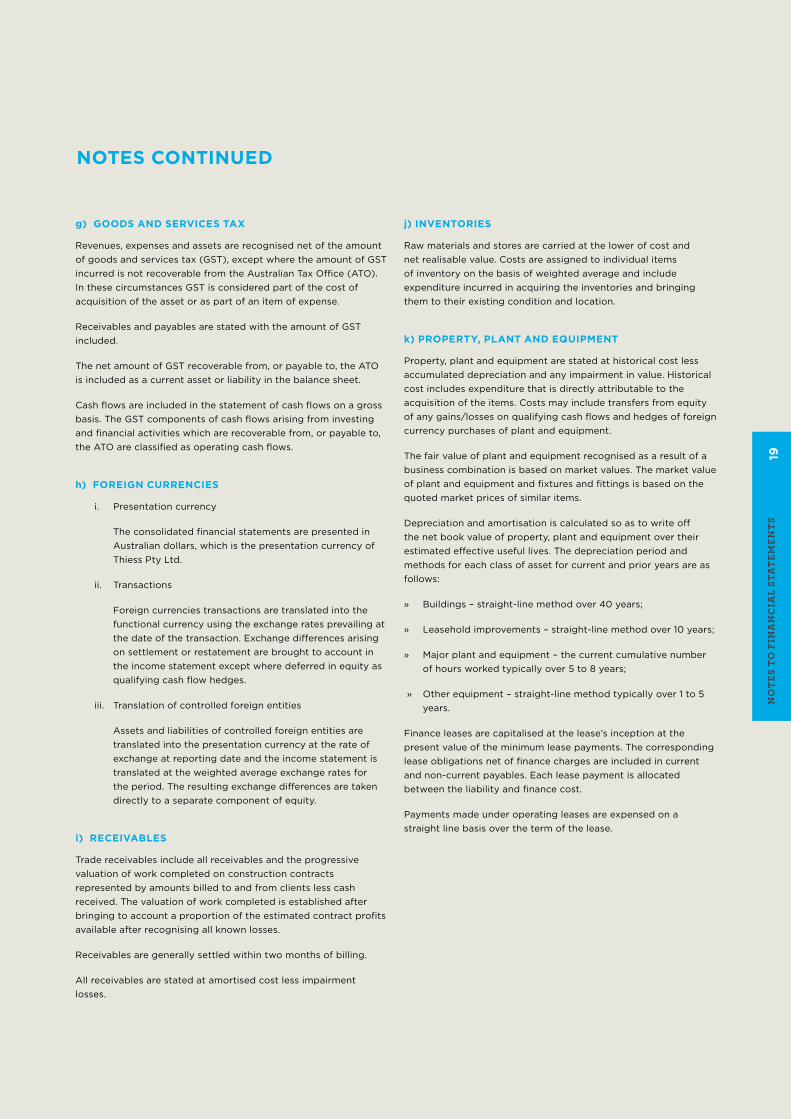
g) gOODS AND SERvICES TAX
Revenues, expenses and assets are recognised net of the amount of goods and services tax (GST), except where the amount of GST incurred is not recoverable from the Australian Tax Office (ATO). In these circumstances GST is considered part of the cost of acquisition of the asset or as part of an item of expense.
Receivables and payables are stated with the amount of GST included.
The net amount of GST recoverable from, or payable to, the ATO is included as a current asset or liability in the balance sheet.
Cash flows are included in the statement of cash flows on a gross basis. The GST components of cash flows arising from investing and financial activities which are recoverable from, or payable to, the ATO are classified as operating cash flows.
h) FOREIgN CURRENCIES
i. Presentation currency
The consolidated financial statements are presented in Australian dollars, which is the presentation currency of Thiess Pty Ltd.
ii. Transactions
Foreign currencies transactions are translated into the functional currency using the exchange rates prevailing at the date of the transaction. Exchange differences arising on settlement or restatement are brought to account in the income statement except where deferred in equity as qualifying cash flow hedges.
iii. Translation of controlled foreign entities
Assets and liabilities of controlled foreign entities are translated into the presentation currency at the rate of exchange at reporting date and the income statement is translated at the weighted average exchange rates for the period. The resulting exchange differences are taken directly to a separate component of equity.
i) RECEIvAbLES
Trade receivables include all receivables and the progressive valuation of work completed on construction contracts represented by amounts billed to and from clients less cash received. The valuation of work completed is established after bringing to account a proportion of the estimated contract profits available after recognising all known losses.
Receivables are generally settled within two months of billing.
All receivables are stated at amortised cost less impairment losses.
j) INvENTORIES
Raw materials and stores are carried at the lower of cost and net realisable value. Costs are assigned to individual items of inventory on the basis of weighted average and include expenditure incurred in acquiring the inventories and bringing them to their existing condition and location.
k) PROPERTY, PLANT AND EQUIPmENT
Property, plant and equipment are stated at historical cost less accumulated depreciation and any impairment in value. Historical cost includes expenditure that is directly attributable to the acquisition of the items. Costs may include transfers from equity of any gains/losses on qualifying cash flows and hedges of foreign currency purchases of plant and equipment.
The fair value of plant and equipment recognised as a result of a business combination is based on market values. The market value of plant and equipment and fixtures and fittings is based on the quoted market prices of similar items.
Depreciation and amortisation is calculated so as to write off the net book value of property, plant and equipment over their estimated effective useful lives. The depreciation period and methods for each class of asset for current and prior years are as follows:
» Buildings – straight-line method over 40 years;
» Leasehold improvements – straight-line method over 10 years;
» Major plant and equipment – the current cumulative number of hours worked typically over 5 to 8 years;
» Other equipment – straight-line method typically over 1 to 5 years.
Finance leases are capitalised at the lease’s inception at the present value of the minimum lease payments. The corresponding lease obligations net of finance charges are included in current and non-current payables. Each lease payment is allocated between the liability and finance cost.
Payments made under operating leases are expensed on a straight line basis over the term of the lease.
no
tes
to
Fin
an
cia
L st
at
eMen
ts

NOTES CONTINUED
l) ImPAIRmENT
Assets that have an indefinite useful life are not subject to amortisation and are tested annually for impairment. Assets that are subject to amortisation are reviewed for impairment whenever events or changes in circumstances indicate that the carrying amount may not be recovered. An impairment loss is recognised for the amount by which the assets carrying amount exceeds its recoverable amount. Any impairment is expensed in the reporting period in which it occurs.
Where a group of assets working together supports the generation of cash inflows, recoverable amount is assessed in relation to that group of assets.
An impairment loss in respect of goodwill is not reversed.
In respect of other assets, impairment losses recognised in prior periods are assessed at each reporting date for any indications that the loss has decreased or no longer exists.
An impairment loss is reversed if there has been a change in the estimates used to determine the recoverable amount.
An impairment loss is reversed only to the extent that the asset’s carrying amount does not exceed the carrying amount that would have been determined if no impairment loss had been recognised.
The Consolidated Entity has established an allowance for impairment that represents the estimate of incurred losses in respect of trade and other receivables. The main components of this allowance are a specific losses component that relates to individually significant exposures, and a collective loss component that relates to a group of similar assets in respect of losses that have been incurred but not yet identified.
m) INvESTmENTS AND OTHER FINANCIAL ASSETS
i. Investments in associates and joint venture entities
Interests in associates and joint venture entities are accounted for using the equity accounting principles. The Consolidated Entity’s share of profits or losses is recognised in the income statement, and the share of movement in reserves is recognised in reserves in the balance sheet.
ii. Interests in joint operations
A joint operation is a joint arrangement whereby the parties that have joint control of the arrangement have rights to the assets, and obligations for the liabilities, relating to the arrangement. Joint control is the contractually agreed sharing of control of an arrangement, which exists only when decisions about the relevant activities require unanimous consent of the parties sharing control.
When the Consolidated Entity undertakes its activities
under joint operations, the Consolidated Entity as a joint operator recognises in relation to its interest in a joint operation:
» its assets, including its share of any assets held jointly;
» its liabilities, including its share of any liabilities incurred jointly;
» its revenue from the sale of its share of the output arising from the joint operation;
» its share of the revenue from the sale of the output by the joint operation; and
» its expenses including its share of any expenses incurred jointly.
The Consolidated Entity accounts for the assets, liabilities, revenues and expenses relating to its interest in a joint operation in accordance with the AASBs applicable to the particular assets, liabilities, revenues and expenses.
When the Consolidated Entity transacts with a joint operation in which the Consolidated Entity is a joint operator (such as a sale or contribution of assets), the Consolidated Entity is considered to be conducting the transaction with the other parties to the joint operation, and gains and losses resulting from the transactions are recognised in the Consolidated Entity’s financial statements only to the extent of the other parties’ interests in the joint operation.
When the Consolidated Entity transacts with a joint operation in which the Consolidated Entity is a joint operator (such as a purchase of assets) the Consolidated Entity does not recognise its share of the gains and losses until it resells those assets to a third party.
iii Other investments
Available-for-sale assets are initially recognised at cost, being the fair value of the consideration given and including acquisition charges associated with the asset. After initial recognition available-for-sale assets are measured at fair value. Changes in fair value are recognised in the fair value reserve. The fair value of available-for-sale financial assets is determined by reference to their quoted market price for listed entities and internal valuations for unlisted entities.
When the asset is sold, collected, disposed or impaired, the cumulative gain or loss previously recorded in equity is included in the profit or loss.
2121 21
NOTES CONTINUED
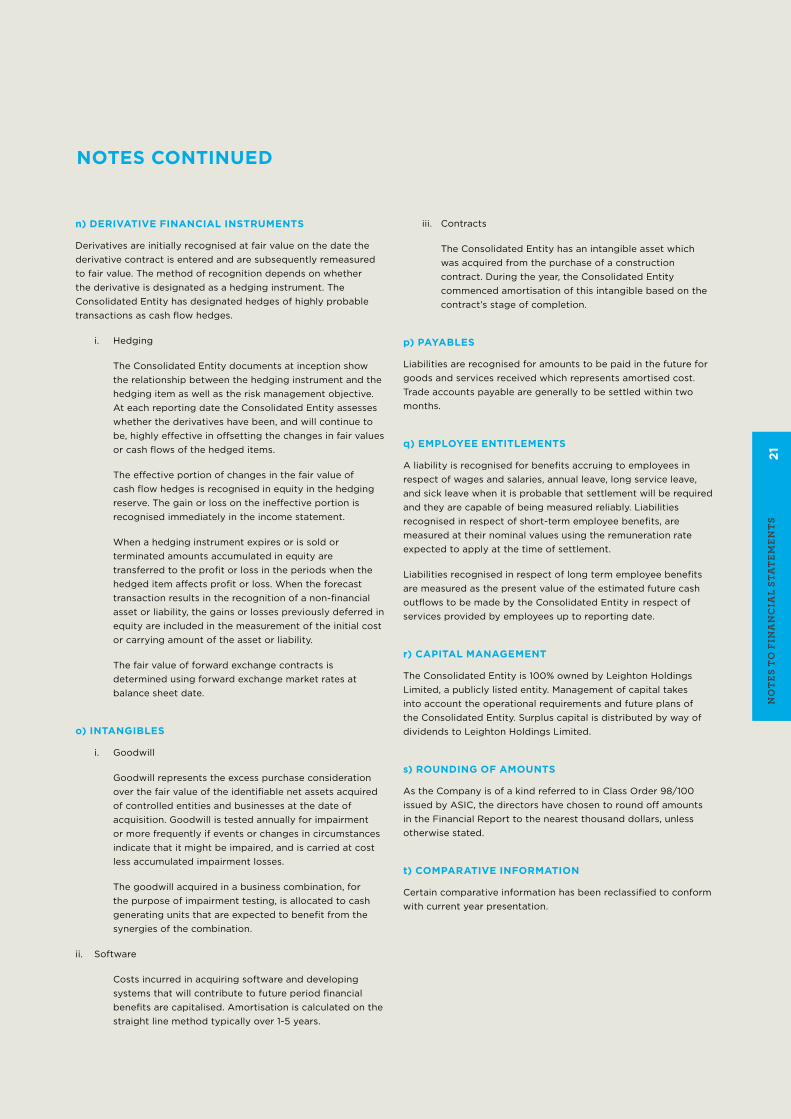
n) DERIvATIvE FINANCIAL INSTRUmENTS
Derivatives are initially recognised at fair value on the date the derivative contract is entered and are subsequently remeasured to fair value. The method of recognition depends on whether the derivative is designated as a hedging instrument. The Consolidated Entity has designated hedges of highly probable transactions as cash flow hedges.
i. Hedging
The Consolidated Entity documents at inception show the relationship between the hedging instrument and the hedging item as well as the risk management objective. At each reporting date the Consolidated Entity assesses whether the derivatives have been, and will continue to be, highly effective in offsetting the changes in fair values or cash flows of the hedged items.
The effective portion of changes in the fair value of cash flow hedges is recognised in equity in the hedging reserve. The gain or loss on the ineffective portion is recognised immediately in the income statement.
When a hedging instrument expires or is sold or terminated amounts accumulated in equity are transferred to the profit or loss in the periods when the hedged item affects profit or loss. When the forecast transaction results in the recognition of a non-financial asset or liability, the gains or losses previously deferred in equity are included in the measurement of the initial cost or carrying amount of the asset or liability.
The fair value of forward exchange contracts is determined using forward exchange market rates at balance sheet date.
o) INTANgIbLES
i. Goodwill
Goodwill represents the excess purchase consideration over the fair value of the identifiable net assets acquired of controlled entities and businesses at the date of acquisition. Goodwill is tested annually for impairment or more frequently if events or changes in circumstances indicate that it might be impaired, and is carried at cost less accumulated impairment losses.
The goodwill acquired in a business combination, for the purpose of impairment testing, is allocated to cash generating units that are expected to benefit from the synergies of the combination.
ii. Software
Costs incurred in acquiring software and developing systems that will contribute to future period financial benefits are capitalised. Amortisation is calculated on the straight line method typically over 1-5 years.
iii. Contracts
The Consolidated Entity has an intangible asset which was acquired from the purchase of a construction contract. During the year, the Consolidated Entity commenced amortisation of this intangible based on the contract’s stage of completion.
p) PAYAbLES
Liabilities are recognised for amounts to be paid in the future for goods and services received which represents amortised cost. Trade accounts payable are generally to be settled within two months.
q) EmPLOYEE ENTITLEmENTS
A liability is recognised for benefits accruing to employees in respect of wages and salaries, annual leave, long service leave, and sick leave when it is probable that settlement will be required and they are capable of being measured reliably. Liabilities recognised in respect of short-term employee benefits, are measured at their nominal values using the remuneration rate expected to apply at the time of settlement.
Liabilities recognised in respect of long term employee benefits are measured as the present value of the estimated future cash outflows to be made by the Consolidated Entity in respect of services provided by employees up to reporting date.
r) CAPITAL mANAgEmENT
The Consolidated Entity is 100% owned by Leighton Holdings Limited, a publicly listed entity. Management of capital takes into account the operational requirements and future plans of the Consolidated Entity. Surplus capital is distributed by way of dividends to Leighton Holdings Limited.
s) ROUNDINg OF AmOUNTS
As the Company is of a kind referred to in Class Order 98/100 issued by ASIC, the directors have chosen to round off amounts in the Financial Report to the nearest thousand dollars, unless otherwise stated.
t) COmPARATIvE INFORmATION
Certain comparative information has been reclassified to conform with current year presentation.
no
tes
to
Fin
an
cia
L st
at
eMen
ts

NOTES CONTINUED
Note 2013 2012
$’000 $’000
Restated
1 REvENUES AND INCOmE
Construction, mining, telecommunications, environmental and utilities services contracts 6,645,556 6,840,369
REvENUE FROm EXTERNAL CUSTOmERS 6,645,556 6,840,369
Income from related entities 5,298 3,667
Interest:
- Related entities 8,576 15,941
- Other entities 3,150 3,167
Net gains on disposal of property, plant and equipment 3,770 5,104
Net gains on disposal of other financial assets - 118,993
Net gains on disposal of waste business - 115,156
OTHER INCOmE 20,794 262,028
TOTAL REvENUES AND INCOmE 6,666,350 7,102,397
The Consolidated Entity’s share of revenue from associates and joint venture arrangements accounted for under the equity method is excluded from Revenues noted above and from the Income Statement in accordance with Australian Accounting Standards. Details of the Consolidated Entity’s share of joint arrangements revenues is provided as additional information below.
Revenue from external customers 6,645,556 6,840,369
Revenue from associates and joint ventures 214,282 431,309
TOTAL REvENUE FROm EXTERNAL CUSTOmERS, ASSOCIATES AND JOINT vENTURES 6,859,838 7,271,678
Other income 20,794 262,028
REvENUES FROm EXTERNAL CUSTOmERS, ASSOCIATES AND JOINT vENTURES
6,880,632 7,533,706
2 EXPENSES
Materials 1,049,272 1,287,916
Subcontractors 1,486,662 1,386,218
Plant 656,324 823,095
Labour* 2,181,576 2,305,967
Depreciation and amortisation 3 371,544 470,682
Impairments - 7,172
Operating lease payments 3 140,094 146,733
Technical advice 32,935 54,371
Sundry expenses 230,537 174,885
TOTAL EXPENSES 6,148,944 6,657,039
*Includes $112,548,257 (2012: $96,722,395) in contributions to defined contribution superannuation plans paid by the Consolidated Entity.

2323 23
NOTES CONTINUED
2013 2012
$’000 $’000
Restated
3 PROFIT bEFORE INCOmE TAX EXPENSE
Profit before income tax expense includes the following specific expenses:
Finance costs:
- Interest - related entities 9,287 15,024
- Interest - finance lease liabilities 20,179 14,070
- Interest - other 282 398
TOTAL FINANCE COSTS 29,748 29,492
Depreciation of:
- Buildings 47 79
- Plant and equipment 369,410 469,789
TOTAL DEPRECIATION 369,457 469,868
Amortisation of:
- Intangibles 1,081 35
- Leasehold improvements 1,006 779
TOTAL AmORTISATION 2,087 814
Amount charged to provisions: - employee entitlements 215,713 200,068
Operating lease rental expense: - minimum lease payments 140,094 146,733
Net foreign exchange loss / (gain) 4,268 (381)
Stock write-off 2,290 -
ImPAIRmENT OF:
- Investments accounted for using equity method - 4,415
- Property, plant and equipment - 2,757
TOTAL ImPAIRmENT - 7,172
4 AUDITOR’S REmUNERATION* $ $
AUDITOR OF THE COmPANY: DELOITTE AUSTRALIA
- Audit and review of financial reports 833,250 700,000
- Taxation services 22,500 21,000
- Control assurance services 98,670 -
- Other services 23,186 -
NETWORK FIRm OF THE COmPANY AUDITOR
- Audit and review of financial reports 145,815 118,135
AUDIT SERvICES: OTHER
- Audit and review of financial reports 75,093 172,500
* Rounded to the nearest dollar
no
tes
to
Fin
an
cia
L st
at
eMen
ts
NOTES CONTINUED
2013 2012
$’000 $’000
Restated
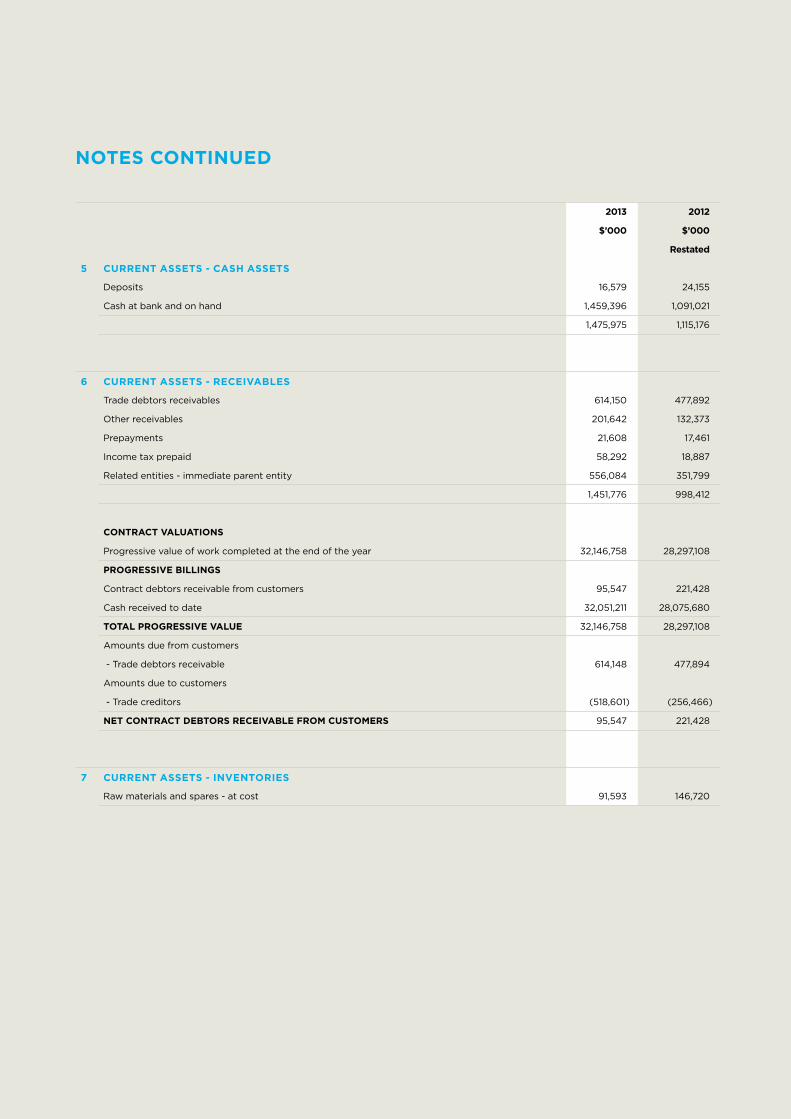
5 CURRENT ASSETS - CASH ASSETS
Deposits 16,579 24,155
Cash at bank and on hand 1,459,396 1,091,021
1,475,975 1,115,176
6 CURRENT ASSETS - RECEIvAbLES
Trade debtors receivables 614,150 477,892
Other receivables 201,642 132,373
Prepayments 21,608 17,461
Income tax prepaid 58,292 18,887
Related entities - immediate parent entity 556,084 351,799
1,451,776 998,412
CONTRACT vALUATIONS
Progressive value of work completed at the end of the year 32,146,758 28,297,108
PROgRESSIvE bILLINgS
Contract debtors receivable from customers 95,547 221,428
Cash received to date 32,051,211 28,075,680
TOTAL PROgRESSIvE vALUE 32,146,758 28,297,108
Amounts due from customers
- Trade debtors receivable 614,148 477,894
Amounts due to customers
- Trade creditors (518,601) (256,466)
NET CONTRACT DEbTORS RECEIvAbLE FROm CUSTOmERS 95,547 221,428
7 CURRENT ASSETS - INvENTORIES
Raw materials and spares - at cost 91,593 146,720

2525 25
NOTES CONTINUED
Note 2013 2012
$’000 $’000
Restated
ASSETS
Inventories - consumables 27,473 -
TOTAL CURRENT ASSETS 27,473 -
Property, plant and equipment 193,631 -
TOTAL NON-CURRENT ASSETS 193,631 -
TOTAL ASSETS 221,104 -
LIAbILITIES
Finance leases 105,056 -
TOTAL CURRENT LIAbILITIES 105,056 -
TOTAL LIAbILITIES 105,056 -
9 NON-CURRENT ASSETS - OTHER ASSETS
Receivable - related entities 5,004 4,441
Other assets 30,205 22,854
35,209 27,295
10 NON-CURRENT ASSETS - INvESTmENTS IN JOINT vENTURE ENTITIES
Joint venture entities 19,704 36,658
11 NON-CURRENT ASSETS - AvAILAbLE-FOR-SALE FINANCIAL ASSETS
Available- for-sale financial assets 23 e) 53,700 40,000
no
tes
to
Fin
an
cia
L st
at
eMen
ts
8 CURRENT ASSETS - ASSETS CLASSIFIED AS HELD-FOR-SALE
On 23 December 2013 PT Thiess Contractors Indonesia (“TCI”), a wholly owned subsidiary of Thiess Pty Limited, signed a Deed of Settlement and Termination Agreement (“STA”) with PT Arutmin Indonesia (“Arutmin”), for the sale of selected assets of TCI. As the sale is expected to be completed within one year from the reporting date, the selected assets and associated liabilities, as shown below, have been classified as held-for-sale at the reporting date.
The assets and associated liabilities are used to provide the TCI’s contract mining services to PT Arutmin Indonesia, the owners of the Senakin and Satui mines.

2013 2012
$’000 $’000
Restated
NOTES CONTINUED
12 NON-CURRENT ASSETS - PROPERTY, PLANT AND EQUIPmENT
LAND
Cost 188 1,688
bUILDINgS
Cost 644 2,957
Accumulated depreciation (118) (577)
526 2,380
LEASEHOLD ImPROvEmENTS
Cost 10,401 9,120
Accumulated depreciation (8,875) (7,855)
1,526 1,265
EQUIPmENT UNDER FINANCE LEASE
Cost 301,444 498,530
Accumulated amortisation (186,825) (194,232)
114,619 304,298
PLANT AND EQUIPmENT
Cost 1,321,204 1,592,518
Accumulated depreciation (1,026,822) (1,197,517)
294,382 395,001
TOTAL PROPERTY, PLANT AND EQUIPmENT 411,241 704,632
RECONCILIATION OF PROPERTY, PLANT AND EQUIPmENT CARRYINg vALUES
Land buildings Leasehold improvements
Plant and equipment
Lease plant and
equipment
Total property, plant and
equipment
$’000 $’000 $’000 $’000 $’000 $’000
CARRYINg AmOUNT AT THE bEgINNINg OF THE YEAR (RESTATED) 1,688 2,380 1,265 395,001 304,298 704,632
Transfer - - - (82,770) 82,770 -
Acquisition - - - 8,140 - 8,140
Additions - - 1,149 292,727 122,910 416,786
Disposals (1,500) (1,807) - (1,796) (202,255) (207,358)
Depreciation/amortisation expense - (47) (1,006) (256,914) (112,495) (370,462)
Assets classified as held for sale - - - (78,634) (114,997) (193,631)
Net foreign currency translation - - 118 18,628 34,388 53,134
CARRYINg AmOUNT AT THE END OF THE YEAR 188 526 1,526 294,382 114,619 411,241

2727 27
NOTES CONTINUED
13 NON-CURRENT ASSETS - INTANgIbLE ASSETS
goodwill Software and
contracts
Customers contracts
Total
$’000 $’000 $’000 $’000
YEAR ENDED 31 DECEmbER 2012
Opening net book amount as previously reported 5,579 35 - 5,614
Amortisation and impairment charge - (35) - (35)
Restated closing net book amount 5,579 - - 5,579
Cost 9,055 5,234 - 14,289
Accumulated amortisation and impairment (3,476) (5,234) - (8,710)
Restated net book amount 5,579 - - 5,579
no
tes
to
Fin
an
cia
L st
at
eMen
ts
YEAR ENDED 31 DECEmbER 2013
Opening net book amount 5,579 - - 5,579
Additions 21,118 - 6,733 27,851
Amortisation and impairment charge - - (1,081) (1,081)
Closing net book amount 26,697 - 5,652 32,349
Cost 30,173 5,234 6,733 42,140
Accumulated amortisation and impairment (3,476) (5,234) (1,081) (9,791)
Net book amount 26,697 - 5,652 32,349

2013 2012
$’000 $’000
Restated
NOTES CONTINUED
14 CURRENT LIAbILITIES - PAYAbLES
Trade creditors 1,683,899 1,286,484
Related entities 246,199 74,713
Joint venture entities 37,283 32,210
Finance lease liabilities 46,669 76,487
Financial liabilities carried at fair value through profit or loss 2,136 127
2,016,186 1,470,021
The Group leased items of equipment under finance leases. The average lease term is 5 years (2012: 5 years). The Group has options to purchase the equipment for a nominal amount at the end of the lease terms. The Group’s obligation under finance lease are secured by the lessors’ title to the leased assets. Interest rates underlying all obligations under finance leases are fixed at respective contract dates ranging from 2.3% to 5.6% (2012: 2.2% to 5.6%) per annum.
15 bORROWINgS
Unsecured loans 6,140 5,783
Insurance premium funding, repayable monthly, ending May 2014. Interest rate at 1.79%
16 CURRENT LIAbILITIES - PROvISIONS
Employee entitlements 199,839 168,855
17 NON-CURRENT LIAbILITIES - PAYAbLES
Trade creditors and accruals 116,116 73,380
Related entities 217,814 193,449
Finance lease liabilities 102,844 282,050
Financial liabilities carried at fair value through profit or loss 679 -
437,453 548,879
18 NON-CURRENT LIAbILITIES - PROvISIONS
Employee entitlements 87,687 87,285

2929 29
2013 2012
$’000 $’000
Restated
NOTES CONTINUED
19 RESERvES
Hedging reserve - cash flow hedges - (88)
Foreign currency translation reserve (11,353) (41,280)
Investment reserve 9,590 -
Equity reserve (1,115) (965)
(2,878) (42,333)
HEDgINg RESERvE - CASH FLOW HEDgES
Balance 1 January (88) (1,044)
Revaluation joint venture - gross 126 1,366
Deferred tax (38) (410)
- (88)
FOREIgN CURRENCY TRANSLATION RESERvE
Balance 1 January (41,280) (35,003)
Translation adjustment on overseas controlled entities’ financial statements 29,927 (6,277)
(11,353) (41,280)
INvESTmENT RESERvE
Balance 1 January - 21,207
Revaluation 13,700 -
Deferred tax (4,110) -
Disposals - (21,207)
9,590 -
EQUITY RESERvE
Balance 1 January (965) (1,003)
Translation adjustment (150) 38
(1,115) (965)
HEDgINg RESERvE
The cash flow hedging reserve represents the cumulative effective portion of gains or losses arising on changes in fair value of hedging instruments entered into for cash flow hedges. The cumulative gain or loss arising on changes in fair value of the hedging instruments that are recognised and accumulated under the cash flow hedging reserve will be reclassified to profit or loss only when the hedged transaction affects the profit or loss.
FOREIgN CURRENCY TRANSLATION RESERvE
Exchange differences arising on translation of the foreign controlled entities are taken to the foreign currency translation reserve. The reserve is recognised in profit and loss when the net investment is disposed of.
INvESTmENT RESERvE
The investment reserve is used to record the increases in reserves of associates and available-for-sale financial assets. During the year the Aquasure investment was revalued resulting in a net of tax increase of $9.6 million. (Refer to note 23 e).
During the prior period, the Sedgman investment was sold with the reserve being released to the profit or loss $18.6 million and retained earnings $2.6 million.
EQUITY RESERvE
The equity reserve accounts for the difference between the fair value of, and the elements paid or received for, equity transactions with non-controlling interests (minority shareholders).
no
tes
to
Fin
an
cia
L st
at
eMen
ts

2013 2012
$’000 $’000
Restated
NOTES CONTINUED
20 EmPLOYEE ENTITLEmENTS
Aggregate employee entitlements
- Current 199,839 168,855
- Non-current 87,687 87,285
287,526 256,140
Number of employees at year end 17,583 18,972
21 COmmITmENTS
CAPITAL EXPENDITURE COmmITmENTS
Capital expenditure contracted for but not provided for is as follows:
Property, plant and equipment payable:
- Within one year 29,344 105,851
- Later than one year and not later than five years 11,030 42,250
The Consolidated Entity leases plant and equipment used in contract mining, civil engineering activities and property for the purposes of office accommodation under operating leases. The average lease term is three to ten years.
CANCELLAbLE OPERATINg LEASE COmmITmENTS
Future operating lease rentals of property, plant and equipment payable:
- Within one year 175,214 151,035
- Later than one year and not later than five years 373,359 234,401
- Later than five years 50,701 57,167
599,274 442,603
22 bANK gUARANTEES, INSURANCE bONDS AND LETTERS OF CREDIT
Contingent liability under indemnities given on behalf of controlled entities and
joint ventures in respect of:
- Bank guarantees 654,418 794,934
- Insurance bonds 152,241 130,832
- Letters of credit 132,486 117,547

3131 31
NOTES CONTINUED
23 FINANCIAL RISK mANAgEmENT
a) Credit risk
Credit risk arises from cash assets, derivative financial instruments and deposits with banks and financial institutions as well as credit exposure to customers, including outstanding receivables and committed transactions. It represents the potential financial loss if counterparties fail to perform as contracted. Management has credit policies in place and the exposure to credit risk is monitored on an ongoing basis.
The Consolidated Entity minimises credit risk by undertaking transactions with a large number of customers and counterparties
in various countries. Concentration of credit risk on trade and term debtors exists in respect of the contracting business. As at reporting date, 27% of the Consolidated Entity’s trade debtors was owed by customers in the Asian segment (2012:19%).
The Consolidated Entity’s policy is to provide guarantees to wholly owned subsidiaries (refer Note 24) and as part of its operating activities. The Consolidated Entity does not hold collateral, nor does it securitise trade and other receivables. Credit risk is limited to the carrying value of the Consolidated Entity’s financial assets.
The ageing of trade debtors receivables assets at balance date was as follows:
Impairment gross
2013 2012 2013 2012
$’000 $’000 $’000 $’000
Past due 0-30 days - 200 35,456 16,327
Past due 31-60 days - - 3,622 11,303
Past due 61-90 days - - 1,382 12,889
Greater than 90 days 359 70 7,287 9,334
359 270 47,747 49,853
All other financial assets were not past due. The movement in the allowance for impairment in respect of trade receivables during the year was as follows:
2013 2012
$’000 $’000
Balance at the beginning of the year 776 479
(Net writeback)/impairment (48) 297
Balance at the end of the year 728 776
no
tes
to
Fin
an
cia
L st
at
eMen
ts

NOTES CONTINUED
23 FINANCIAL RISK mANAgEmENT (CONTINUED)
b) Liquidity risk
Prudent liquidity risk management implies maintaining sufficient cash, the availability of funding through an adequate amount of committed credit facilities and the ability to close out market positions. The Consolidated Entity aims at maintaining flexibility in funding to meet ongoing operational requirements, tender expenditure and small to medium opportunistic projects and investments by keeping committed credit facilities available.
The following table analyses the contractual maturities of the Consolidated Entity’s financial liabilities into the relevant maturity groupings based on the remaining period at the reporting date to the contractual maturity date. The amounts disclosed are the contractual, undiscounted cash flows comprising principal and interest repayments and excluding the impact of netting arrangements.
Average interest rate
Contractual cash flows
Less than 1 year
1 - 2 years 2 - 5 years
% $’000 $’000 $’000 $’000
2013
Trade creditors - 1,802,151 1,686,035 116,116 -
Finance lease liabilities 3.93 274,358 164,657 32,073 77,628
Related entities 4.93 234,015 - 234,015 -
Borrowing unsecured 1.79 6,250 6,250 - -
2,308,038 1,856,942 373,468 77,628
2012
Trade creditors - 1,359,991 1,286,611 73,380 -
Finance lease liabilities 3.27 396,945 89,273 78,309 229,363
Related entities 5.17 208,644 - 208,644 -
Borrowing unsecured 2.59 5,932 5,932 - -
1,971,512 1,381,816 360,333 229,363
c) Foreign currency risk
Foreign currency risk arises from commercial transactions and recognised assets and liabilities that are denominated in a currency that is not the entity’s functional currency. The Consolidated Entity is exposed to foreign currency risk principally through specific project revenue and expenditure and plant and equipment purchase commitments denominated in foreign currencies
To manage this risk, members of the Consolidated Entity enter into forward exchange contracts classified as cash flow hedges and states them at fair value. Changes in the fair value of cash flows hedges are recorded in equity to the extent that the hedge is deemed effective and until the hedged transaction occurs. Any ineffective portion is immediately recorded in the profit or loss.
The fair value of the forward exchange contracts outstanding as at 31 December 2013 was $2.8 million (31 December 2012: Nil).
3333 33
2013 2012
$’000 $’000
NOTES CONTINUED
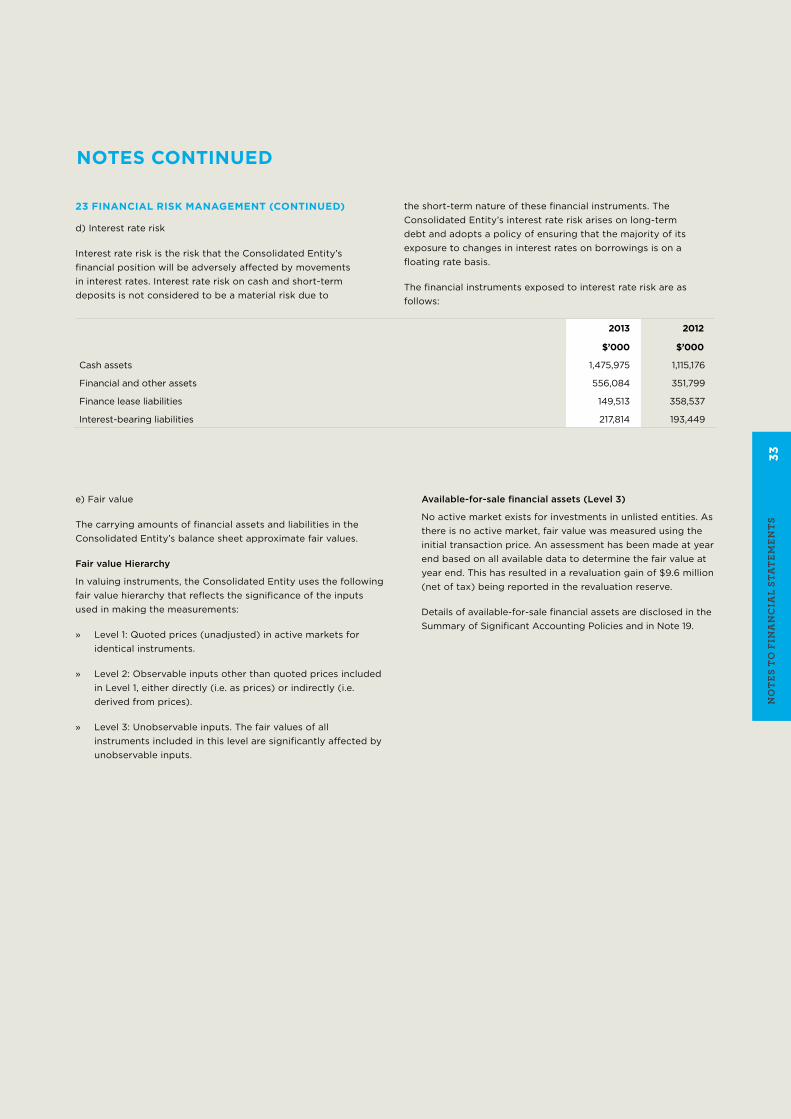
23 FINANCIAL RISK mANAgEmENT (CONTINUED)
d) Interest rate risk
Interest rate risk is the risk that the Consolidated Entity’s financial position will be adversely affected by movements in interest rates. Interest rate risk on cash and short-term deposits is not considered to be a material risk due to
the short-term nature of these financial instruments. The Consolidated Entity’s interest rate risk arises on long-term debt and adopts a policy of ensuring that the majority of its exposure to changes in interest rates on borrowings is on a floating rate basis.
The financial instruments exposed to interest rate risk are as follows:
e) Fair value
The carrying amounts of financial assets and liabilities in the Consolidated Entity’s balance sheet approximate fair values.
Fair value Hierarchy
In valuing instruments, the Consolidated Entity uses the following fair value hierarchy that reflects the significance of the inputs used in making the measurements:
» Level 1: Quoted prices (unadjusted) in active markets for identical instruments.
» Level 2: Observable inputs other than quoted prices included in Level 1, either directly (i.e. as prices) or indirectly (i.e. derived from prices).
» Level 3: Unobservable inputs. The fair values of all instruments included in this level are significantly affected by unobservable inputs.
Available-for-sale financial assets (Level 3)
No active market exists for investments in unlisted entities. As there is no active market, fair value was measured using the initial transaction price. An assessment has been made at year end based on all available data to determine the fair value at year end. This has resulted in a revaluation gain of $9.6 million (net of tax) being reported in the revaluation reserve.
Details of available-for-sale financial assets are disclosed in the Summary of Significant Accounting Policies and in Note 19.
Cash assets 1,475,975 1,115,176
Financial and other assets 556,084 351,799
Finance lease liabilities 149,513 358,537
Interest-bearing liabilities 217,814 193,449
no
tes
to
Fin
an
cia
L st
at
eMen
ts
NOTES CONTINUED
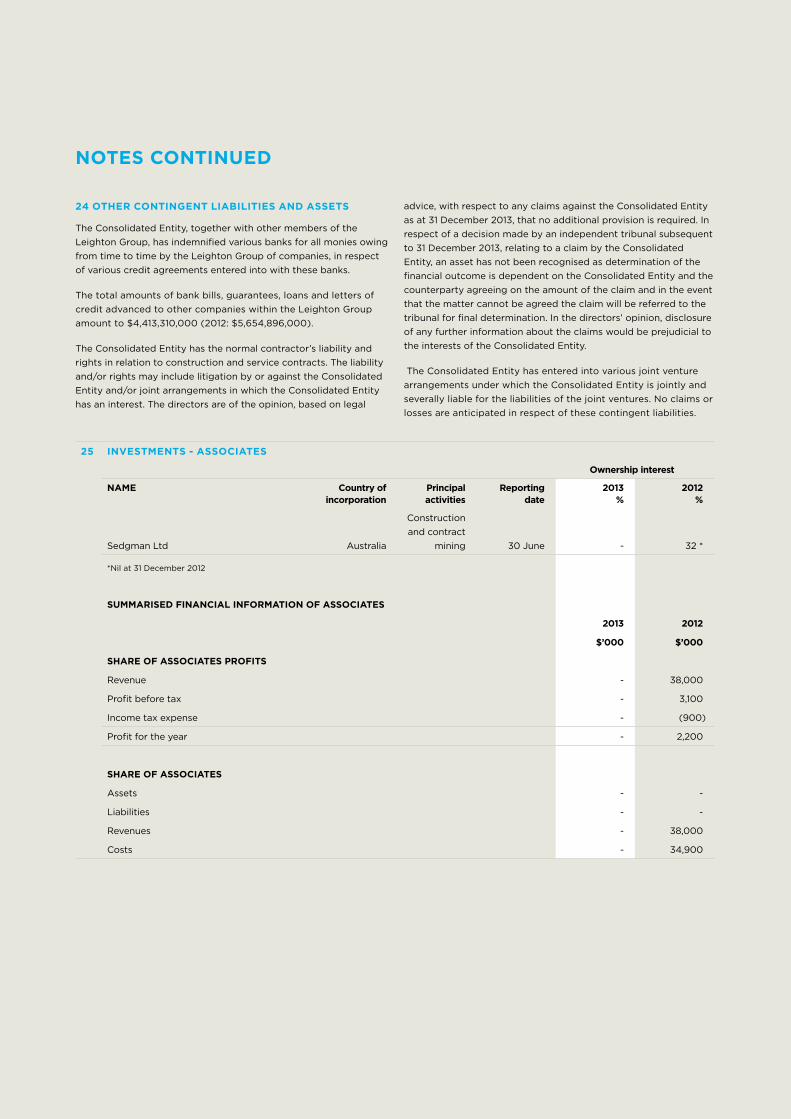
24 OTHER CONTINgENT LIAbILITIES AND ASSETS
The Consolidated Entity, together with other members of the Leighton Group, has indemnified various banks for all monies owing from time to time by the Leighton Group of companies, in respect of various credit agreements entered into with these banks.
The total amounts of bank bills, guarantees, loans and letters of credit advanced to other companies within the Leighton Group amount to $4,413,310,000 (2012: $5,654,896,000).
The Consolidated Entity has the normal contractor’s liability and rights in relation to construction and service contracts. The liability and/or rights may include litigation by or against the Consolidated Entity and/or joint arrangements in which the Consolidated Entity has an interest. The directors are of the opinion, based on legal
advice, with respect to any claims against the Consolidated Entity as at 31 December 2013, that no additional provision is required. In respect of a decision made by an independent tribunal subsequent to 31 December 2013, relating to a claim by the Consolidated Entity, an asset has not been recognised as determination of the financial outcome is dependent on the Consolidated Entity and the counterparty agreeing on the amount of the claim and in the event that the matter cannot be agreed the claim will be referred to the tribunal for final determination. In the directors’ opinion, disclosure of any further information about the claims would be prejudicial to the interests of the Consolidated Entity.
The Consolidated Entity has entered into various joint venture arrangements under which the Consolidated Entity is jointly and severally liable for the liabilities of the joint ventures. No claims or losses are anticipated in respect of these contingent liabilities.
25 INvESTmENTS - ASSOCIATES
Ownership interest
NAmE Country of incorporation
Principal activities
Reporting date
2013 %
2012 %
Sedgman Ltd Australia
Construction and contract
mining 30 June - 32 *
*Nil at 31 December 2012
SUmmARISED FINANCIAL INFORmATION OF ASSOCIATES
2013 2012
$’000 $’000
SHARE OF ASSOCIATES PROFITS
Revenue - 38,000
Profit before tax - 3,100
Income tax expense - (900)
Profit for the year - 2,200
SHARE OF ASSOCIATES
Assets - -
Liabilities - -
Revenues - 38,000
Costs - 34,900
3535 35
NOTES CONTINUED
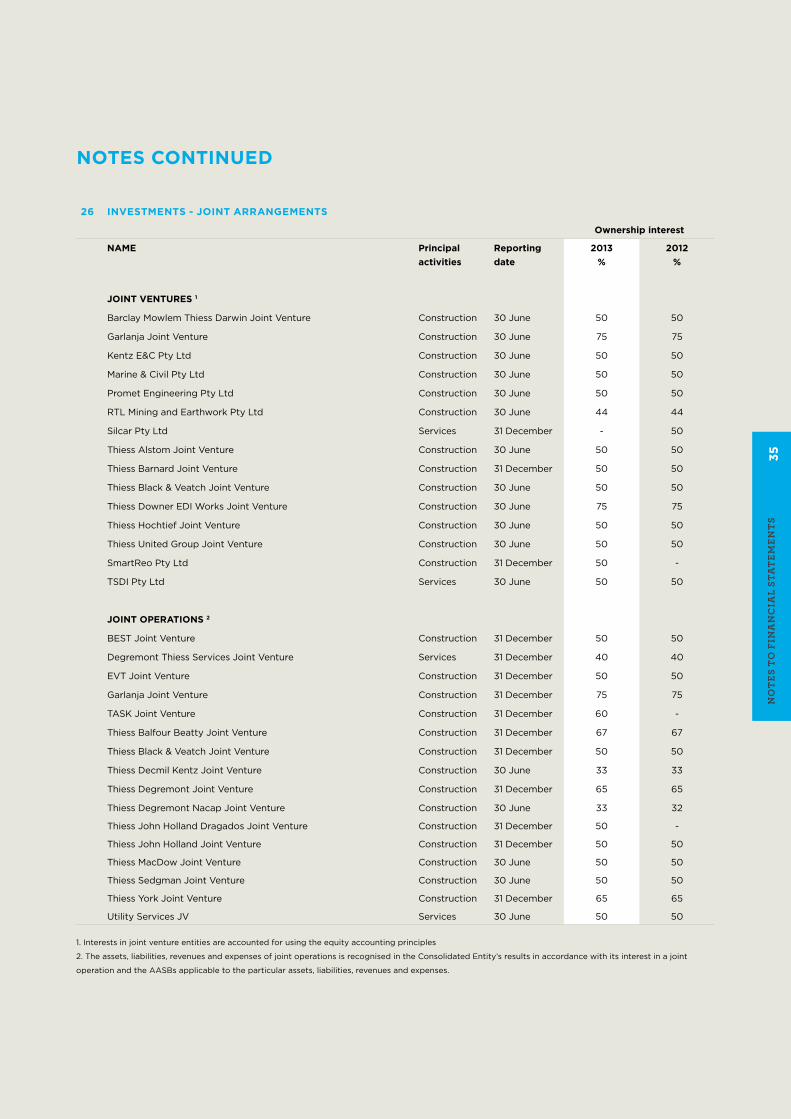
26 INvESTmENTS - JOINT ARRANgEmENTS
Ownership interest
NAmE Principal activities
Reporting date
2013%
2012 %
JOINT vENTURES 1
Barclay Mowlem Thiess Darwin Joint Venture Construction 30 June 50 50
Garlanja Joint Venture Construction 30 June 75 75
Kentz E&C Pty Ltd Construction 30 June 50 50
Marine & Civil Pty Ltd Construction 30 June 50 50
Promet Engineering Pty Ltd Construction 30 June 50 50
RTL Mining and Earthwork Pty Ltd Construction 30 June 44 44
Silcar Pty Ltd Services 31 December - 50
Thiess Alstom Joint Venture Construction 30 June 50 50
Thiess Barnard Joint Venture Construction 31 December 50 50
Thiess Black & Veatch Joint Venture Construction 30 June 50 50
Thiess Downer EDI Works Joint Venture Construction 30 June 75 75
Thiess Hochtief Joint Venture Construction 30 June 50 50
Thiess United Group Joint Venture Construction 30 June 50 50
SmartReo Pty Ltd Construction 31 December 50 -
TSDI Pty Ltd Services 30 June 50 50
JOINT OPERATIONS 2
BEST Joint Venture Construction 31 December 50 50
Degremont Thiess Services Joint Venture Services 31 December 40 40
EVT Joint Venture Construction 31 December 50 50
Garlanja Joint Venture Construction 31 December 75 75
TASK Joint Venture Construction 31 December 60 -
Thiess Balfour Beatty Joint Venture Construction 31 December 67 67
Thiess Black & Veatch Joint Venture Construction 31 December 50 50
Thiess Decmil Kentz Joint Venture Construction 30 June 33 33
Thiess Degremont Joint Venture Construction 31 December 65 65
Thiess Degremont Nacap Joint Venture Construction 30 June 33 32
Thiess John Holland Dragados Joint Venture Construction 31 December 50 -
Thiess John Holland Joint Venture Construction 31 December 50 50
Thiess MacDow Joint Venture Construction 30 June 50 50
Thiess Sedgman Joint Venture Construction 30 June 50 50
Thiess York Joint Venture Construction 31 December 65 65
Utility Services JV Services 30 June 50 50
1. Interests in joint venture entities are accounted for using the equity accounting principles
2. The assets, liabilities, revenues and expenses of joint operations is recognised in the Consolidated Entity’s results in accordance with its interest in a joint
operation and the AASBs applicable to the particular assets, liabilities, revenues and expenses.
no
tes
to
Fin
an
cia
L st
at
eMen
ts

2013 2012
$’000 $’000
Restated
NOTES CONTINUED
26 INvESTmENTS - JOINT ARRANgEmENTS (CONTINUED)
RESULTS OF JOINT vENTURE ENTITIES
The Consolidated Entity’s share of the joint venture entities results consist of:
Revenue 214,282 393,309
Expense (219,452) (350,165)
(Loss)/profit before tax (5,170) 43,144
Income tax expense/(benefit) 1,235 (5,973)
(Loss)/profit accounted for using the equity method (3,935) 37,171
STATEmENT OF FINANCIAL POSITION
The Consolidated Entity’s share of the joint venture entities assets and liabilities consist of:
Current assets 25,980 89,978
Non-current assets 28,290 15,913
Total assets 54,270 105,891
Current liabilities 57,704 98,906
Non-current liabilities 1,106 2,537
Total liabilities 58,810 101,443
Net (liabilities)/assets accounted for using the equity method (4,540) 4,448
mOvEmENTS IN CARRYINg AmOUNTS OF JOINT vENTURE ENTITIES
Carrying amount at the beginning of the year 4,448 15,071
Contributions paid to the joint venture entities 13,062 8,200
Share of joint venture entities’ net (loss)/profit (3,935) 37,171
Other (9,774) (6,177)
Drawings from the joint venture entities (8,341) (49,817)
Carrying amount at the end of the year (4,540) 4,448
REPRESENTED bY:
Joint venture receivable 32,743 36,658
Joint venture payable 37,283 32,210
(4,540) 4,448

3737 37
NOTES CONTINUED
27 THIESS PTY LTD AND CONTROLLED ENTITIES
All controlled entities carry on business in the country of incorporation except where noted.
Ownership interest
Note Place of incorporation
2013 %
2012%
Thiess Pty Ltd Queensland
CONTROLLED ENTITIES
Thiess Mining Maintenance Pty Ltd 1 Queensland 100 100
Thiess Services Pty Ltd Queensland 100 100
Subsidiary entities:
Thiess Services Limited New Zealand 100 100
Silcar Pty Ltd Victoria 100 50
Subsidiary entities:
Silcar Nouvelle-Caledonie SAS New Caledonia 100 50
Thiess Southland Pty Ltd New South Wales 100 100
Thiess Contractors (Malaysia) Sdn Bhd Malaysia 100 100
Ausindo Holdings Pte Ltd Singapore 100 100
Subsidiary entities:
PT Thiess Contractors Indonesia Indonesia 100 100
(owned 99% by Ausindo Holding Pte Ltd and 1% by Thiess Pty Ltd)
Subsidiary entities:
PT Cinere Serpong Jaya Indonesia 100 100
PT Ngawi Kertosono Jaya Indonesia 95 95
PT Solo Ngawi Jaya Indonesia 95 95
Thiess Contractors (PNG) Ltd Papua New Guinea 100 100
Thiess NZ Limited New Zealand 100 100
Hunter Valley Earthmoving Co Pty Ltd New South Wales 100 100
BOS Australia Pty Ltd Western Australia 100 100
Thiess NC New Caledonia 100 100
Thiess Mauritius Pty Ltd Mauritius 100 100
Subsidiary entities:
Thiess Minecs India Pvt Ltd India 90 90
Thiess Infraco Pty Ltd Queensland 100 100
Thiess India Pvt Ltd (owned 99% by Thiess Pty Ltd and 1% by Thiess Mauritius Pty Ltd)
India 100 100
1. Formerly Thiess Investments Pty Ltd
no
tes
to
Fin
an
cia
L st
at
eMen
ts
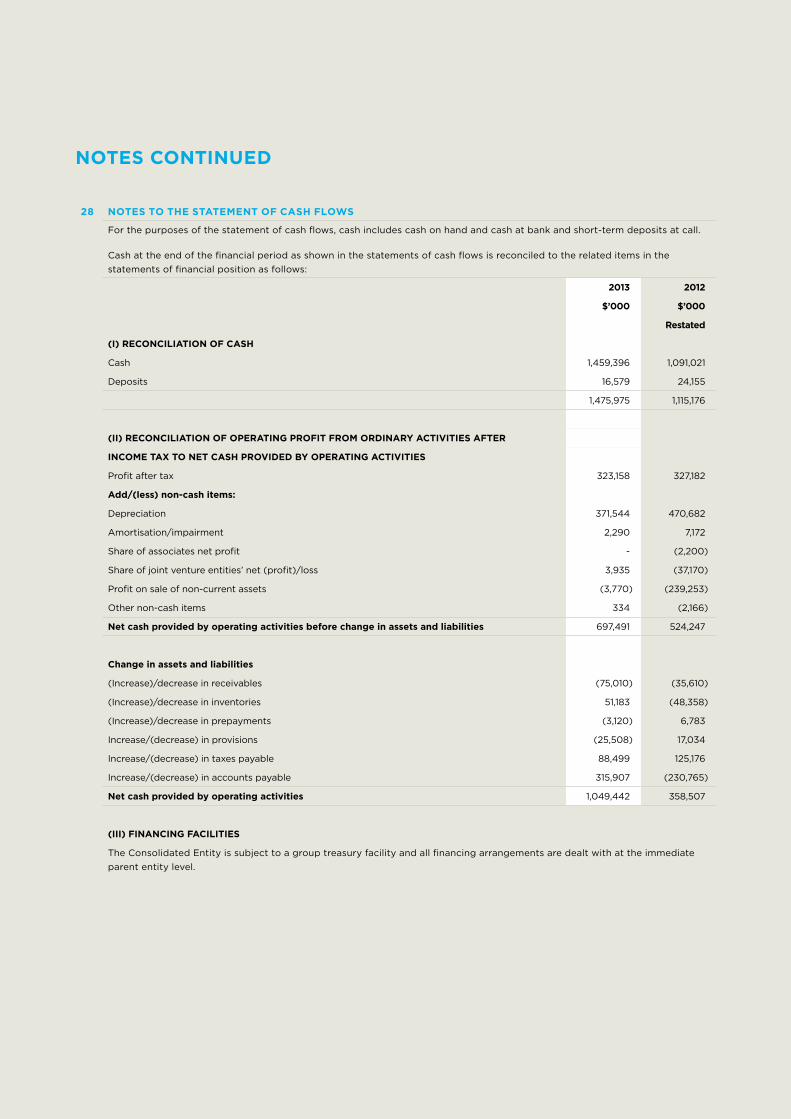
NOTES CONTINUED
28 NOTES TO THE STATEmENT OF CASH FLOWS
For the purposes of the statement of cash flows, cash includes cash on hand and cash at bank and short-term deposits at call.
Cash at the end of the financial period as shown in the statements of cash flows is reconciled to the related items in the statements of financial position as follows:
2013 2012
$’000 $’000
Restated
(I) RECONCILIATION OF CASH
Cash 1,459,396 1,091,021
Deposits 16,579 24,155
1,475,975 1,115,176
(II) RECONCILIATION OF OPERATINg PROFIT FROm ORDINARY ACTIvITIES AFTER
INCOmE TAX TO NET CASH PROvIDED bY OPERATINg ACTIvITIES
Profit after tax 323,158 327,182
Add/(less) non-cash items:
Depreciation 371,544 470,682
Amortisation/impairment 2,290 7,172
Share of associates net profit - (2,200)
Share of joint venture entities’ net (profit)/loss 3,935 (37,170)
Profit on sale of non-current assets (3,770) (239,253)
Other non-cash items 334 (2,166)
Net cash provided by operating activities before change in assets and liabilities 697,491 524,247
Change in assets and liabilities
(Increase)/decrease in receivables (75,010) (35,610)
(Increase)/decrease in inventories 51,183 (48,358)
(Increase)/decrease in prepayments (3,120) 6,783
Increase/(decrease) in provisions (25,508) 17,034
Increase/(decrease) in taxes payable 88,499 125,176
Increase/(decrease) in accounts payable 315,907 (230,765)
Net cash provided by operating activities 1,049,442 358,507
(III) FINANCINg FACILITIES
The Consolidated Entity is subject to a group treasury facility and all financing arrangements are dealt with at the immediate parent entity level.

3939 39
NOTES CONTINUED
29 ACQUISITIONS OF CONTROLLED ENTITIES AND bUSINESSES (CONTINUED)
On 29 July 2013 Thiess Services Pty Limited (“Thiess Services”), a controlled entity of the Company, acquired the remaining 50% interest in Silcar Pty Limited (“Silcar”) from Siemens Pty Limited (“Siemens”), for $1 taking its ownership interest to 100%. As a result of this purchase the Group has gained a controlling interest in Silcar.
The acquisition has been accounted for under the requirements of Accounting Standard AASB 3 Business Combinations as follows: the purchase consideration paid for Silcar was determined as $1; the acquisition date fair value of the Group’s previously held equity interest of 50% was nil; and the fair value of the identifiable net liabilities of Silcar acquired by the Group was $21.1 million resulting in recognition of goodwill of $21.1 million.
ACQUISITION OF SILCAR PTY LTD
12 months to December 2013
Carrying amounts
before acquisition
Fair value adjustments
Recognised values
$’000 $’000 $’000
CURRENT ASSETS
Trade and other receivables 104,777 - 104,777
Inventories 14,966 - 14,966
119,743 - 119,743
NON-CURRENT ASSETS
Property, plant and equipment 8,184 - 8,184
Deferred tax assets 15,746 230 15,976
23,930 230 24,160
CURRENT LIAbILITIES
Cash and cash equivalents (19,929) - (19,929)
Trade and other payables (83,617) (29,591) (113,208)
Provisions (20,189) - (20,189)
(123,735) (29,591) (153,326)
NON-CURRENT LIAbILITIES
Trade and other payables (20,000) 10,000 (10,000)
Provisions (1,695) - (1,695)
(21,695) 10,000 (11,695)
Net identifiable assets and liabilities (1,757) (19,361) (21,118)
Consideration paid or payable
Cash consideration paid -
Less net identifiable assets acquired (21,118)
Goodwill 21,118
Cash flow from acquisition
Cash consideration paid -
Cash acquired (19,929)
Net cash flow (19,929)
Voting rights
% of voting rights acquired 50%
% of total voting rights in the entity after the acquisition 100%
no
tes
to
Fin
an
cia
L st
at
eMen
ts

2013 2012
$’000 $’000
NOTES CONTINUED
CONSIDERATION RECEIvED
Consideration received in cash and cash equivalents - 172,498
Deferred sales proceeds - 6,621
- 179,119
bOOK vALUE OF ASSETS SOLD
Cash and cash equivalents - 63
Inventory - 312
Prepayments - 1,118
Property, plant and equipment - 65,690
Investments in related entities - 4,709
Trade and other payables - (439)
Provisions - (1,482)
Employees entitlements - (6,008)
Net assets disposed of - 63,963
Consideration received in cash and cash equivalents - 172,498
Less: Cash and cash equivalent balances disposed of - (63)
- 172,435
30 . DISPOSAL OF CONTROLLED ENTITIES AND bUSINESSES
On 28 September 2012, the Consolidated Entity disposed of its waste management business.

41
41 41
NOTES CONTINUED
31 RELATED PARTIES
Directors
The directors who held office as directors of Thiess Pty Ltd during the year ended 31 December 2013 were:
Mr Bruce A Munro (Managing Director)
Mr Peter A Gregg
Ms Susan J Palmer
Mr Hamish G Tyrwhitt
No director has entered into a material contract with the Consolidated Entity since the end of the previous financial year and there were no material contracts involving directors’ interests subsisting at period end.
ULTImATE PARENT ENTITY:
The immediate parent entity of Thiess Pty Ltd is Leighton Holdings Limited.
The ultimate Australian parent entity of Thiess Pty Ltd is Hochtief Australia Limited.
The parent entity of Hochtief Australia Limited is Hochtief AG incorporated in Germany.
The ultimate parent entity is Actividades des Construcción y Servicios SA incorporated in Spain.
32 EvENT SUbSEQUENT TO bALANCE DATE
Dividends have been declared after 31 December 2013. The financial effect of the above transaction has not been brought to account in the financial statements for the year ended 31 December 2013. There were no other material subsequent events noted.
no
tes
to
Fin
an
cia
L st
at
eMen
ts

Liability limited by a scheme approved under Professional Standards Legislation. Member of Deloitte Touche Tohmatsu Limited
Deloitte Touche Tohmatsu ABN 74 490 121 060 Riverside Centre Level 25 123 Eagle Street Brisbane QLD 4000 GPO Box 1463 Brisbane QLD 4001 Australia DX 115 Tel: +61 (0) 7 3308 7000 Fax: +61 (0) 7 3308 7001 www.deloitte.com.au
Independent Auditor’s Report to the Directors of Thiess Pty Ltd
We have audited the accompanying financial report, being a special purpose financial report, of Thiess Pty Ltd, which comprises the consolidated statement of financial position as at 31 December 2013, the consolidated statement of profit or loss, the consolidated statement of comprehensive income, the consolidated statement of cash flows and the consolidated statement of changes in equity for the year ended on that date, notes comprising a summary of significant accounting policies and other explanatory information, and the directors’ declaration of the consolidated entity, comprising the company and the entities it controlled at the year’s end or from time to time during the financial year as set out on pages 9 to 41. Directors’ Responsibility for the Financial Report The directors are responsible for the preparation and fair presentation of the financial report and have determined that the basis of preparation described in Note (a), is appropriate to meet the financial reporting requirements of the directors of Thiess Pty Ltd. The director’s responsibility also includes such internal control as the directors determine is necessary to enable the preparation and fair presentation of the financial report that is free from material misstatement, whether due to fraud or error. Auditor’s Responsibility Our responsibility is to express an opinion on the financial report based on our audit. We conducted our audit in accordance with Australian Auditing Standards. Those standards require that we comply with relevant ethical requirements relating to audit engagements and plan and perform the audit to obtain reasonable assurance whether the financial report is free from material misstatement. An audit involves performing procedures to obtain audit evidence about the amounts and disclosures in the financial report. The procedures selected depend on the auditor’s judgement, including the assessment of the risks of material misstatement of the financial report, whether due to fraud or error. In making those risk assessments, the auditor considers internal control relevant to the entity’s preparation and fair presentation of the financial report in order to design audit procedures that are appropriate in the circumstances, but not for the purpose of expressing an opinion on the effectiveness of the entity’s internal control. An audit also includes evaluating the appropriateness of accounting policies used and the reasonableness of accounting estimates made by the directors, as well as evaluating the overall presentation of the financial report. We believe that the audit evidence we have obtained is sufficient and appropriate to provide a basis for our audit opinion.
AUDIT REPORT

43
43 43
Opinion In our opinion, the financial report presents fairly, in all material respects, the financial position of Thiess Pty Ltd as at 31 December 2013 and its financial performance for the year then ended in accordance with the financial reporting requirements of the directors as described in Note (a). Basis of Accounting and Restriction on Distribution and Use Without modifying our opinion, we draw attention to Note (a) of the financial report, which describes the basis of accounting. The financial report has been prepared to assist Thiess Pty Ltd to meet the financial reporting requirements of the directors. As a result, the financial report may not be suitable for another purpose. Our report is intended solely for the directors of Thiess Pty Ltd and should not be distributed to or used by parties other than the directors of Thiess Pty Ltd. DELOITTE TOUCHE TOHMATSU Clive Mottershead Partner Chartered Accountants Melbourne, 4 March 2014
AUDIT REPORT CONTINUED
au
Dit
rep
or
t
