annual and season weight changes in a thirteen-lined
TRANSCRIPT

Journal of the Minnesota Academy of Science Journal of the Minnesota Academy of Science
Volume 33 Number 2 Article 6
1966
Annual and Season Weight Changes in a Thirteen-Lined Ground Annual and Season Weight Changes in a Thirteen-Lined Ground
Squirrel Population, Itasca State Park, Minnesota Squirrel Population, Itasca State Park, Minnesota
Bonnie M. Hohn University of Minnesota, St. Paul
William H. Marshall University of Minnesota, St. Paul
Follow this and additional works at: https://digitalcommons.morris.umn.edu/jmas
Part of the Zoology Commons
Recommended Citation Recommended Citation Hohn, B. M., & Marshall, W. H. (1966). Annual and Season Weight Changes in a Thirteen-Lined Ground Squirrel Population, Itasca State Park, Minnesota. Journal of the Minnesota Academy of Science, Vol. 33 No.2, 102-106. Retrieved from https://digitalcommons.morris.umn.edu/jmas/vol33/iss2/6
This Article is brought to you for free and open access by the Journals at University of Minnesota Morris Digital Well. It has been accepted for inclusion in Journal of the Minnesota Academy of Science by an authorized editor of University of Minnesota Morris Digital Well. For more information, please contact [email protected].

Annual and Seasonal Weight Changes in a Thirteen-lined Ground Squirrel Population, Itasca State Park, Minnesota
BONNIE M. HOHN and WILLIAM H. MARSHALL University of Minnesota, St. Paul
Abstract-The ecology of the thirteen-lined ground squirrel (Citel/us tridecem/ineotus) has been under investigation since 1954 on the grounds of the University of Minnesota Forestry and Biological Station located in Itasca State Park, Minnesota. Over the 11-year period, data hav~ been collected on individuals of this small, relatively isolated, population. Studies of population dynamics, movements, activity patterns, and weights have been stressed, chiefly during the three summer months of June, July, and August. In 1964, the senior author carried out field work for the entire season from April 30 to September 14.
This paper reports on the accumulated weight data for sex and age classes as obtained in a thirteen-lined ground squirrel ( Citellus tridecemlineatus) population in Itasca State Park over an 11-year period.
Live weights are more than simple quantitative measures. During the four to five month active season, the ground squirrel must recover from the stress of the hibernation period, undergo the rigors of reproduction, and prepare itself to again enter hibernation. The success of the individual in maintaining itself is thus influenced by
William H. Marshall, Director, Field Biology, University of Minnesota, attended the University of Hawaii and the University of California receiving bis B.S. degree in 1933. He earned the MF. and Ph.D. degrees from the University of Michigan in 1935 and 1942 respectively. Professional work includes positions with the U.S. Forest Service in Arkansas and New England as well as two years with the War Food Administration in Idaho. Prior to coming to the University of Minnesota, he worked as a Biologist with the U.S. Fish and Wildlife Service in Utah, Idaho, and Montana. In this region he carried out field research on waterfowl, small mammals, pine marten, and blue grouse. Since 1945 he has been Professor of Wildlife Management and has carried out research work, primarily at the Cloquet Forest Research Center on Ruffed Grouse and at the Lake Itasca Forestry and Biological Station on the ecology of amphibians, birds, and mammals. In 1965, he was appointed Director of Field Biology in the newly established College of Biological Sciences and is responsible for programs at the Itasca Biology Session and the Cedar Creek Natural History Area. He served as president of the Minnesota Academy of Science in 1954-5 and was a Fulbright Research Scholar in New Zealand during 1960-61.
Bonnie M. Hohn, Research assistant, Department of Entomology, Fisheries, and Wildlife, University of Minnesota, St. Paul. received her B.A. degree in zoology from Ohio Wesleyan University in 1963 and is completing work toward a M.S. degree at the University of Minnesota. She has carried out field research during the Lake Itasca Biology Sessions for three summers. In September, 1966, she will assume a position as an instructor in the Department of Biology, Mary Baldwin College, Staunton, Virginia. Her research and teaching interests are in field biology and vertebrate ecology.
The project has been carried out by several independent investigators and members of the Ecology of Terrestrial Vertebrates class taught by Dr. William H. Marshall and Dr. John R. Tester. The authors wish to express their appreciation to Miss Sharon M. Haggerty, Mr. Calvin H. Ryder, Dr. Richard E. Penney and the many students who participated in the project over the years. Field work by the senior author was supported by the National Science Foundation under terms of Summer Biological Research Grant No. GB 3390. Mr. Donald B. Siniff, biometrician at the Minnesota Museum of Natural History, gave us considerable assi51ance and advice in the statistical analyses.
102
this compressed period of activity and should be reflected in summer weight changes.
Squirrels were live-trapped in 6 x 6 x 15 inch National live traps using peanut butter and/or bread for bait. Individuals were toe-clipped for permanent identification and dye-marked with commercial hair dye for field observations. Live weights were obtained by weighing each squirrel on a triple beam balance while it was in a common cotton sock or flour sack. After returning the squirrel to the trap for later release, the sock or sack was weighed and its bulk subtracted from the original measurement. Weights were recorded to the nearest tenth of a gram and later rounded off to whole numbers for calculations. Though some individuals were weighed a number of times in one day, the general practice was to weigh individuals at recaptures, which occurred at one to four day intervals.
Results and Discussion During the course of 11 summers, weight data were
collected on 215 individual squirrels. Weight records involved from one to many captures of individuals during each year. Fifty-one squirrels were handled for two or more years, thus giving a series of weight records on known-age individuals. A summary of trapping dates and records for each year is given in Table 1 and the results aer presented by sex and age classes with a discussion of weight change phenomena.
Adult Males. This cohort represents the smallest number of individuals handled and the fewest number of weight records in most years. From the seasonal standpoint, the first important statistic is the weights at emergence. Weights of four adult males, collected shortly after emergence, on April 30, May 1, 2, and 3, 1964, were 125, 139, 149, and 178 grams. On April 22, 1965, two adult males were caught weighing 153 and 174 grams. The average for these six weights is 153 grams.
During most of the period of above-ground activity, weight gain in this age class is negligible, as shown in the weights for three one-year-old males with 14, 30, and 55 captures in three different years (Fig. 1). Adult males may, in fact, lose weight during the early part of the season as demonstrated by subject #0202.
Abrupt weight gains beginning in the latter part of July and extending into August have been noted in most
The Minnesota Academy of Science

Table I. Summary of Trapping Dates and Records by Sex and Age Class
Adult Adult Juvenile Juvenile Juveniles Dates i5 9 iS 9 unsexed
1954 June 15-July 9 3 5 2 3 5 1955 June 13-July 9 5 12 21 17 I 1956 June 11-July 11 .... . 3 10 5 3 24 1957 June 20-August 21 ... 4 7 12 10 0 1958 June 16-August 12 . . . 3 4 9 9 0 1959 June 15-July 15 2 4 10 6 I 1960 June 13-July 12 7 6 1 0 2 1961 June 12-July 11 6 11 4 3 0 1962 June 19-July 18 8 12 8 3 0 1963 June 22-July 20 2 8 10 9 8 1964 April 30-Sept. 14 4 9 24 18 3 1965 April 22- .......... . 2 6 ? ?
males trapped during these two months ( c.f. #0202 and #3202 in Fig. 1), and for several males trapped for a number of summers. Concurrent with this rapid change in weight, adult males became increasingly harder to trap and fewer observations of activity were noted. The last male trapped in 1964, on August 18, weighed 246 grams, a 3 8 % increase in body weight in 3-½ months. The biggest weight jump of 59 grams occurred during the 13-day period from July 22 to August 3.
Adult Females. The most complete records for adult females were collected in 1964 when trapping extended over the entire above-ground activity period. Weights for nine females first caught between April 30 and May 12 averaged 115 grams and ranged from 102 to 128 grams. It is felt that these figures closely approach weights of emergence since trapping was particularly intense on the study area during this two-week period. For six females first caught on May 11 and May 13, 1965, weights averaged 135 grams and ranged from 107 to 156 grams. These weights, as well as those for the males, compare closely with those reported by Beer (1962) and Gunderson ( 1964) for thirteen-lined ground squirrels trapped in the vicinity of the St. Paul campus and at the Cedar Creek Natural History Area, north of Anoka, Minnesota.
Weights for seven adult females known to have given birth to young in 1964 are plotted in Fig. 2. The weight changes can be broken down into three distinct periods: pre-parturition or gestation, parturition and post-parturition. The post-parturition period has two phases: nursing (30 days from June 2 to July 2) and post-weaning ( after July 2).
The rate of weight gain during the 28- to 30-day gestation period averaged three grams per day as expressed by linear regression. Marked drops in weight were noted at parturition. In the two instances in which females were weighed within 24 hours after parturition, weight losses were 39 and 42 grams.
Since parturition dates varied, the post-parturition regression was not started until all females had given birth to their litters. For the 30 days from June 2 fo July 2, weight gain was not essentially different from ze~o (.05 level). This period is when the young were in the burrows and dependent on the lactating female.
Journal of, Volume Thirty-three, No. 2, 1966
FIGURE I. Weight data for three one-year-old males.
260
.. : <>
~
280 PR [ _ ,,,nuAITIO'f ,,.
1
RTUAITIOr ,osT·P.UITURtT•ON
.· ·/ . :: .. ,/~ •• 220
~
%
~
~
.,.o ✓---/: .. I - • 120 1 -~ - .i . . 100 ; • : .
80
60
Y • 101.41 • ! .0<4 X Y• ll't .~a• 2.0,x
ACCUMUI.ATIVE DAYS Of' TAAPPlMG
10 20 30 •o ~o 60 10 80 90 100
MAY I MAY I~ JUN!. I ,1U t. f I~ JULY I AUGUST I
FIGURE 2. Weigh! changes in seven pregnant females - 1964.
PRE:·PARTURITiON PARTURITION POST-PARTURITION
no I I "' t t ,. A <t 200 a: <> z 180
~ 160 ,,,,,.-
~ 140 /
120 ~--' NUMBER OF DAYS
10 20
MAY I MAY 15
30 40 50
JUNE I
DATE
JUNE 15
80
, /
- 1964 two-yeor -otd
- - 1963 on•·y•ar-o!d
70 80
JULY I JULY 15
FIGURE 3. Weigh! darn for female No. 0115.
The second marked weight increase observed in these females occurred in July shortly after emergence of the young. The two grams per day rate here is based on only five individuals. Individual weight gain during this period is more marked for some females, but this is masked when weights are combined.
Figure 3 gives the weights for female #0115 for both years during which she was trapped as an adult. It is of interest to note that in the latter portion of both seasons, weight change was abrupt and subsequent gain was rapid.
When this record is compared with female #2100 (Fig. 4) trapped in 1957, 1958, and 1959, it is seen that a period of low weight gain is again followed by high weight gains in July and August, for 1957 and 1958. The fact that an abrupt rise in weight was not observed during the 1959 trapping season may indicate that · the chronology of weight change varies between years · depending on the physiological condition of the anima!:"as
103

22
a, 2 <t 18 a: C)
z 160 /
~ 140 C)
,;7_/ / '\ / / .. . \ _ _,, /
·. \ .,/.~-~-/. _..- • · ·· 1959 three-year-old \ ,' ,,,.-- · .. •· --- 1958 two-year-old 'v - 1957 one-year-old
; 12 NUMBER OF DAYS
110 0 10 20 30 40 50
JUNE 15 JULY I JULY 15 AUGUST
DATE
FIGURE 4. Weight data for female No. 2100.
related to the environmental conditions. Extended weight losses such as those observed for this female in 1959 and male #0202 in 1964 (Fig. I) probably reflect a negative metabolic balance that could have been caused by a number of adverse physiological or environmental factors.
Weights at last capture for seven females in 1964 averaged 209 grams with a range from 1 79 to 262 grams. In 1957, the only other year when trapping extended well into August, weights at last capture for six females averaged 219 grams with a range of from I 67 to 256 grams.
Juveniles . Considerably more weight data is available for juvenile squirrels as these were the most abundant and the more easily trapped age class each year. The mean weights at emergence for 13 litters with three or more individuals trapped and weighed on the same day ranged from 31 to 56 grams. The range of weights for the 65 individuals involved was from 29 to 67 grams. These data are subject to some error as a litter might well escape observation or trapping for several days after emergence.
The large numbers of weights for juvenile squirrels lend themselves well to regression analysis. From the data for 11 summers, five years were selected: 1955, 1957, 1958, 1963, and 1964. These years represent the five best years as determined by the length of the trapping period, the number of individuals, and the volume of weight data, so that an adequate sample was provided. The other years were usually deficient in one or more of these factors. Linear regression equations for these five years were computed for all data for each year with the exception of 1964. In this year, weights reached a plateau on the first of September and the regression equation was computed for data only to that date. The weights and regression equations for each year are plotted in Fig. 5. These equations show correlation coefficients close to 1.0 and daily weight increases of from 1.43 to 2.15 grams.
A major problem that concerned us was whether the observed differences in weight gain per day (slope) between years were real and not due to sampling variation. Tests for differences between slopes are usually done by
104
covariance analysis, but this could not be carried out on these data because a basic assumption of homogeneous variances between years ( which should be satisfied for covariance analysis) was not met. Also, there is an additional problem because the points from which these equations were derived are dependent, since in many instances individuals were weighed more than one time. Such dependence is not usually the case in standard regression analysis. To resolve these problems a subsample of one weight per individual was selected over a more homogeneous time period running from June 17 to July 31. Covariance analysis for differences in slopes of the subsamples showed that the observed yearly differences were significant ( .05 level) .
As can be seen in Table II, there is a considerable amount of variability in the rates of weight gain between juvenile males and females. In 1957 and 1963, the ju-
/
180 I 160
140
120
100
80
60
40
20
80
60
40
2
120
100
80
80
40
20
14
12
10
8
6
1964
: . ! . ~ .:.i
' r I ;
>
1963
"' Y • 13.lt + 1. 66X
1958
1957
Y• Zl.56•1 .43 X
NUM8£R OF DAYS 10 20 30 40 50 60
JUNE 15 JULY I JULY I~ AUGUST I AUGUST I~
DAT£
FIGURE 5. Juvenile weights and linear regression equations.
The Minnesota Academy of Science
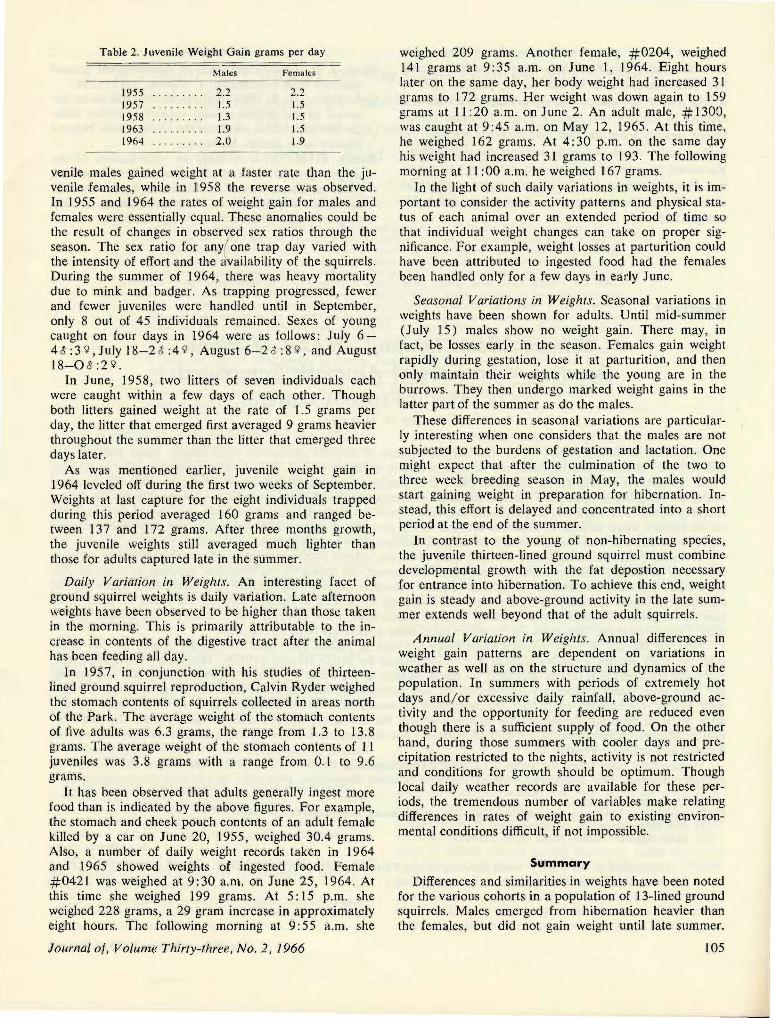
Table 2. Juvenile Weight Gain grams per day
Males Females
1955 . . . . . . . . . 2 .2 2.2 1957 1.5 1.5 1958 . . . . . . . . . 1.3 1.5 1963 . . . . . . . . . 1.9 1.5 1964 . . . . . . . . . 2.0 1.9
venile males gained weight at a faster rate than the juvenile iemales, while in 1958 the reverse was observed. In 1955 and 1964 the rates of weight gain for males and females were essentially equal. These anomalies could be the result of changes in observed sex ratios through the season. The sex ratio for any( one trap day varied with the intensity of effort and the availability of the squirrels. During the summer of 1964, there was heavy mortality due to mink and badger. As trapping progressed, fewer and fewer juveniles were handled until in September, only 8 out of 45 individuals remained. Sexes of young caught on four days in 1964 were as follows: July 6 -4i :39 ,July 18-2 t :4 9, August 6-2 & :8 9 , and August 18-0'3' :2 9.
In June, 1958, two litters of seven individuals each were caught within a few days of each other. Though both litters gained weight at the rate of 1.5 grams per day, the litter that emerged first averaged 9 grams heavier throughout the summer than the litter that emerged three days later.
As was mentioned earlier, juvenile weight gain in 1964 leveled off during the first two weeks of September. Weights at last capture for the eight individuals trapped during this period averaged 160 grams and ranged between 137 and 172 grams. After three months growth, the juvenile weights still averaged much lighter than those for adults captured late in the summer.
Daily Variation in Weights. An interesting facet of ground squirrel weights is daily variation. Late afternoon weights have been observed to be higher than those taken in the morning. This is primarily attributable to the increase in contents of the digestive tract after the animal has been feeding all day .
In 1957, in conjunction with his studies of thirteenlined ground squirrel reproduction, Calvin Ryder weighed the stomach contents of squirrels collected in areas north of the Park. The average weight of the stomach contents of five adults was 6.3 grams, the range from 1.3 to 13.8 grams. The average weight of the stomach contents of 11 juveniles was 3.8 grams with a range from 0.1 to 9.6 grams.
It has been observed that adults generally ingest more food than is indicated by the above figures. For example, the stomach and cheek pouch contents of an adult female killed by a car on June 20, 1955, weighed 30.4 grams. Also, a number of daily weight records taken in 1964 and l 965 showed weights of ingested food. Female #0421 was weighed at 9:30 a.m. on June 25, 1964. At this time she weighed 199 grams. At 5: 15 p.m. she weighed 228 grams, a 29 gram increase in approximately eight hours. The following morning at 9: 55 a.m. she
Journal of, Volume Thirty-three, No. 2, /966
weighed 209 grams. Another female, #0204, weighed 14 I grams at 9: 35 a.m. on June l, 1964. Eight hours later on the same day, her body weight had increased 31 grams to 172 grams. Her weight was down again to 159 grams at 11 : 20 a. m. on June 2. An ad ult male, # 1300, was caught at 9:45 a.m. on May 12, 1965. At this time, he weighed 162 grams. At 4:30 p.m. on the same day his weight had increased 31 grams to 193. The following morning at 11 : 00 a.m. he weighed 167 grams.
In the light of such daily variations in weights, it is important to consider the activity patterns and physical status of each animal over an extended period of time so that individual weight changes can take on proper significance. For example, weight losses at parturition could have been attributed to ingested food had the females been handled only for a few days in early June.
Seasonal Variations in Weights. Seasonal variations in weights have been shown for adults . Until mid-summer (July 15) males show no weight gain. There may, in fact, be losses early in the season. Females gain weight rapidly during gestation, lose it at parturition, and then only maintain their weights while the young are in the burrows. They then undergo marked weight gains in the latter part of the summer as do the males.
These differences in seasonal variations are particularly interesting when one considers that the males are not subjected to the burdens of gestation and lactation. One might expect that after the culmination of the two to three week breeding season in May, the males would start gaining weight in preparation for hibernation. Instead, this effort is delayed and concentrated into a short period at the end of the summer.
In contrast to the young of non-hibernating species, the juvenile thirteen-lined ground squirrel must combine developmental growth with the fat depostion necessary for entrance into hibernation. To achieve this end, weight gain is steady and above-ground activity in the late summer extends well beyond that of the adult squirrels.
Annual Variation in Weights. Annual differences in weight gain patterns are dependent on variations in weather as well as on the structure and dynamics of the population. In summers with periods of extremely hot days and / or excessive daily rainfall, above-ground activity and the opportunity for feeding are reduced even though there is a sufficient supply of food. On the other hand, during those summers with cooler days and precipitation restricted to the nights, activity is not restricted and conditions for growth should be optimum. Though local daily weather records are available for these periods, the tremendous number of variables make relating differences in rates of weight gain to existing environmental conditions difficult, if not impossible.
Summary
Differences and similarities in weights have been noted for the various cohorts in a population of 13-Iined ground squirrels. Males emerged from hibernation heavier than the females, but did not gain weight until late summer.
105

Pregnant females gained weight rapidly in May. After parturition little weight gain was observed until the young had been weaned. Late in the season, marked rises in weight similar to those of the males were observed in a number of females over several years. Juveniles gained weight steadily from the time they emerged and also remained active much longer in summer than the adults. Variations in rates of weight gain between years were real. Rates of weight gain for juvenile males and females were variable. Daily weight variations were attributable to ingested food.
Abstract
References BEER, J. R. 1962. Emergence of thirteen-lined ground
squirrels from hibernation. J. Mamm. 43 ( 1): 109. GUNDERSON, H. L. 1964. Natural history and social be
havior of the striped ground squirrel ( Citellus tridecemlineatus). Mss. on file at the Cedar Creek Natural History Area, Bethel, Minnesota.
RYDER, C. H. 1957. A study on reproduction of the striped ground squirrel ( Citellus tridecemlineatus), north of Itasca State Park. Research report no. 279 on file at the University of Minnesota Forestry and Biological Station, Itasca State Park, Minnesota.
Solvent Effects on the C-H Out-of-Plane
Bending Vibrations of Aromatic Compounds G. VAN BINST* AND EUGENIA A. DAVIS**
University of Minnesota
According to Groenewege ( 1956), the infrared spectra of benzene derivatives show intense bands between 670 and 900 cm-1 characteristic of either one isolated aromatic hydrogen or 2, 3, 4, 5, 6 neighboring aromatic hydrogens. These absorptions correspond to an out-of-plane C-H bending vibration during which all the neighboring hydrogen atoms are vibrating in phase, the other substituents remaining unmoved. The observed frequencies are the result of a coupling of the C-H vibration. In polycyclic and heterocyclic aromatic hydrocarbons, the same correlations are observed but are more difficult to establish because of the presence of many additional bands. The peri-condensed aromatic hydrocarbons, such as pyrene and its alkyl derivatives show complex spectra in this region.
To identify these bending bands we have tried to choose solvent effects as a selection criterion. We hope to learn something about the nature of solvent-hydrogen interactions, the nature of the hydrogen coupling in aromatic systems, and to further discriminate in the out-of-plane vibration spectral assignments. Since extraneous bands appear, especially in higher molecular weight compounds, we hope to be able to discard some of the bands as being other than out-of-plane vibrations, because many of these bands have a low intensity and a small or non-existent solvent shift. The out-of-plane vibrations on the other hand show a relatively large solvent shift.
Next, by the use of force constant calculations we wish to predict the bands that should appear in each molecule. We shall employ a method similar to one introduced by Milan Randii; ( 1960). However, by including several force constants that he has neglected we might be able to get better agreement between theory and experiment. We have done some preliminary calculations on our systems and the results are quite encouraging. Also, we have used similar calculations to predict the frequency of bands in different solvents. As a result of these calculations, we have been able to predict, for different solutes, the solvent dependence of the frequency shift. The frequency shift is measured with respect to the shift of benzene's out-of-plane band in the corresponding solvent, that is, we take benzene as a reference system.
Spectra have been taken for about 56 aromatic compounds in IO different solvents with carbon disulfide as the reference solvent. The compounds studied included benzene derivatives, polycyclic and heterocyclic compounds .
* Free University of Brussels. '!'* Communications should be addressed to University of Minne~ota, Department of Chemistry.
(I) M.P. Groenewege, Specrrochimica Acta, 11, 579 ( 19 56) . (2) Milan Randi~. J. Chem. Phys., .13, 710, (1960).
106
(Presented at the 33rd Annual Meeting of the Minnesota Academy of Science, May 7 and 8, 1965, Gustavus Adolphus College, St. Peter, Minnesota .)
The Minnesota Academy of Science