annual accountability report fiscal year 2013-2014 assessment program ... 2014 is prepared pursuant...
TRANSCRIPT

NOVA SCOTIA DEPARTMENT OF EDUCATION AND EARLY CHILDHOOD DEVELOPMENT
ANNUAL ACCOUNTABILITY REPORT FISCAL YEAR 2013-14

TABLE OF CONTENTS
Accountability Statement ...................................................................................................................1
Message from the Minister ................................................................................................................2
1.0 Introduction and Structure ......................................................................................................3
2.0 Department Progress and Accomplishments for 2013-14 .........................................................4
Nova Scotia Assessment: Reading and Writing in Grade 3 (Reading) ...................................................... 4
Nova Scotia Assessment: Reading and Writing in Grade 6 (Reading) ...................................................... 5
Nova Scotia Assessment: Reading and Writing in Grade 8 (Reading) ...................................................... 6
Nova Scotia Assessment: Reading and Writing in Grade 3 (Writing) ....................................................... 7
Nova Scotia Assessment: Reading and Writing in Grade 6 (Writing) ....................................................... 8
Nova Scotia Assessment: Reading and Writing in Grade 8 (Writing) ....................................................... 9
Nova Scotia Assessments: Mathematics in Grade 4 ............................................................................... 10
Nova Scotia Assessments: Mathematics in Grade 6 ............................................................................... 11
Nova Scotia Assessments: Mathematics in Grade 8 ............................................................................... 12
Programme for International Student Assessment (PISA) ...................................................................... 13
Pan-Canadian Assessment Program (PCAP) ........................................................................................... 14
Progress in International Reading Literacy Study (PIRLS) ....................................................................... 15
High School Graduation Rate .................................................................................................................. 16
3.0 Financial Results ................................................................................................................... 17
Appendix 1 – Disclosures of Wrongdoing received by the Department of Education and Early
Childhood Development .................................................................................................................. 18

Department of Education and Early Childhood Development Accountability Report 2013-14 1 | P a g e
ACCOUNTABILITY STATEMENT The Accountability Report of the Department of Education and Early Childhood Development for the year ended March 31, 2014 is prepared pursuant to the Finance Act and government policies and guidelines. These authorities require the reporting of outcomes against the Department of Education and Early Childhood Development Statement of Mandate for the fiscal year 2013-2014. The reporting of department outcomes necessarily includes estimates, judgments and opinions by department management. We acknowledge that this Accountability Report is the responsibility of Department management. The report is, to the extent possible, a complete and accurate representation of outcomes relative to the goals and priorities set out in the Department of Education and Early Childhood Development’s 2013-2014 Statement of Mandate.
Original Signed by
Hon. Karen Casey Minister Original Signed by
Sandra McKenzie Deputy Minister

Department of Education and Early Childhood Development Accountability Report 2013-14 2 | P a g e
MESSAGE FROM THE MINISTER It is my pleasure to present you with the Department of Education and Early Childhood Development’s (EECD) fourteenth accountability report. This document reports on the department’s activities as outlined in its 2013-14 Statement of Mandate. In 2013-14, the department continued to work with its partners in education to build a high quality, accessible education system that meets the needs of all Nova Scotians. Over the past year, the department continued to improve curriculum and assessments to better meet the needs of students. In 2013–14, a new mathematics curriculum was introduced in grades primary to 3 and grade 10 that focuses clearly on the most important things for students to learn at each grade level. The new Program of Learning Assessment for Nova Scotia was fully implemented to better support instructional planning and education decision making at the school, school board, and provincial levels. The new assessment program enables students to be assessed in early grades, helping teachers provide interventions earlier so that students have the skills and knowledge they need to be successful as they move on to higher grades. The new program also removed duplication between school board and provincial testing, and allowed for results to be more easily understood and interpreted. The department continued to focus on early learning in 2013-14 ensuring improved and better coordinated support to children and their families in the years before they begin school. During 2013-14, three Early Years Centres were opened enabling more access to services and supports for young children in Nova Scotia. Each centre, at a minimum, offers a play-based learning program, programs to support families of young children, and access to regulated childcare. For our students preparing to graduate from the public school program, the department recognizes the importance of being prepared for post-secondary education and ensuring students have the twenty-first century skills and knowledge required for good jobs. We have continued to integrate technology into the classroom and curriculum, and have provided ongoing support for successful programs like Options and Opportunities (O2) and Skilled Trades. Our accomplishments in 2013-14, which include a number of significant initiatives started in 2013-14 such as the comprehensive review of the public education system, the report card review, and the study of the school review process, reflect our commitment to building a high quality public education system. The work undertaken by the department prioritizes the well-being and success of students in the province through high quality teaching in every classroom and effective programs and services in all school communities.
Department of Education and Early Childhood Development Accountability Report 2013-14 3 | P a g e
1.0 INTRODUCTION AND STRUCTURE The 2013-14 Department of Education and Early Childhood Development Accountability Report provides information on performance measures and finances identified in the 2013-14 Statement of Mandate. It is structured into three main sections:
a review of the departmental performance measures for 2013-14 and accomplishments over the course of the year (section 2.0)
a review of financial results (section 3.0)
information on any wrongdoings disclosed in good faith, findings of those wrongdoings, and recommendations and actions taken by the Department during the 2013-14 fiscal year (Appendix 1)
The reporting years stated for all assessment results presented in this report refer to the academic year (September to June), rather than the fiscal year. It is important to note that a revised set of provincial assessments were implemented in the 2012-13 school year to better support instructional planning and to inform decision making related to improved student achievement at the school, regional, and provincial levels. As part of the changes to the assessments, results from all provincial assessments are presented under four performance levels, descriptions of which vary based on the assessment. For all assessments, level 3 is the expected performance for the grade and level four is considered to be above expectation, though not above the grade level. Therefore, for the purposes of the performance measures in this report, the percentage of students meeting expectations are those students performing at, or above, level 3 on the particular assessment. These new assessments represent the beginning of a new data set that is not comparable to previous years. Therefore, for performance measures on percentage of students meeting expectations in reading, writing, and mathematics, a new provincial baseline was established in 2012-13.

Department of Education and Early Childhood Development Accountability Report 2013-14 4 | P a g e
2.0 DEPARTMENT PROGRESS AND ACCOMPLISHMENTS FOR 2013-14
NOVA SCOTIA ASSESSMENT: READING AND WRITING IN GRADE 3 (READING) One of the department’s core business areas is grade primary to 12 education. The percentage of grade 3 students meeting provincial expectations in the area of reading is one of the measures for a desired outcome that falls within this core business area. WHAT DOES THIS MEASURE TELL US? Nova Scotia Assessment: Reading and Writing in Grade 3 was first administered in the 2012-13 school year, which serves as the baseline year. This assessment measures students’ reading ability in relation to end of grade 2 expectations. It is administered in the fall of each school year. Aggregate board and provincial results are made public through the Program of Learning Assessment for Nova Scotia (PLANS) website (plans.ednet.ns.ca) and are used to make broader decisions relating to curriculum, programming, and intervention strategies. Teachers and parents are provided with individual student reports that can be used to inform programming for students. REPORTING ON 2013-14 TARGETS The target for this measure is an increase of the percentage of students meeting expectations over the baseline of 76 percent by 2016-17. In 2013-14, there was a decrease in the percentage of students meeting expectations of 6 percent compared to the 2012-13 baseline year. This measure is part of a revised set of provincial assessments that were implemented in 2012-13. This new measure, Nova Scotia Assessment: Reading and Writing in Grade 3, has replaced the Early Language Literacy Assessment (Grade 3) measure. WHERE DO WE WANT TO GO/BE IN THE FUTURE? The 2014-15 Statement of Mandate includes a target performance measure for reading in grade 3 to increase above the 2012-13 baseline of 76 percent by 2016-17, indicating an increased percentage of students meeting provincial expectations. Students who do not meet provincial expectations are supported in their development as readers through early literacy support available to students in grades primary to 3. Early literacy support provides developmentally-appropriate instruction for identified students in English, French Immersion, and French First Language programs. The 2014-15 Statement of Mandate includes a commitment to strengthen the Early Literacy Support Framework to ensure a comprehensive approach to early literacy support, including an evidence-based approach to instructional practices, interventions, and family literacy initiatives.
Percent of Grade 3 Students Meeting Reading Expectations
Year
% of students meeting expectations
2012-13* 76%
2013-14 70%
*baseline

Department of Education and Early Childhood Development Accountability Report 2013-14 5 | P a g e
NOVA SCOTIA ASSESSMENT: READING AND WRITING IN GRADE 6 (READING) One of the department’s core business areas is grade primary to 12 education. The percentage of grade 6 students meeting provincial expectations in reading is one of the measures for a desired outcome that falls within this core business area. WHAT DOES THIS MEASURE TELL US? Nova Scotia Assessment: Reading and Writing in Grade 6 was first administered in the 2012-13 school year, which also serves as the baseline year. This assessment measures students’ reading ability in relation to expectations for students at the end of grade 5. It is administered in the fall of each school year. Aggregate board and provincial results are made public through the Program of Learning Assessment for Nova Scotia (PLANS) website (plans.ednet.ns.ca) and are used to make broader decisions relating to curriculum, programming, and intervention strategies. Teachers and parents are provided with individual student reports that can be used to inform programming for students. REPORTING ON 2013-14 TARGETS (READING) The target for this measure is to increase the percentage of students meeting expectations in reading over the 2012-13 baseline of 76 percent by 2016-17. In 2013-14, the percentage of students meeting expectations for reading fell by one percent in grade 6. This measure is part of a revised set of provincial assessments. This new measure, Nova Scotia Assessment: Reading and Writing in Grade 6, has replaced the Elementary Literacy Assessment (Grade 6) measure. WHERE DO WE WANT TO GO/BE IN THE FUTURE? The 2014-15 Statement of Mandate includes a target for reading in grade 6 to increase the percentage of students meeting provincial expectations above the 2012-13 baseline of 76 percent by 2016-17. Although results in 2013-14 show a slight drop in the percentage of students meeting expectations in grade 6 reading compared to the previous year, this is not considered a significant change in results at this time. Students who do not meet expectations in reading are supported in their development as readers to ensure students have the skills and knowledge they need to be successful as they move on to higher grades.
Percent of Grade 6 Students Meeting Expectations in Reading
Year
% of students meeting expectations
2012-13* 76%
2013-14 75%
*baseline

Department of Education and Early Childhood Development Accountability Report 2013-14 6 | P a g e
NOVA SCOTIA ASSESSMENT: READING AND WRITING IN GRADE 8 (READING) One of the department’s core business areas is grade primary to 12 education. The percentage of students in grade 8 meeting provincial expectations in reading is one of the measures for a desired outcome that falls within this core business area. WHAT DOES THIS MEASURE TELL US? Nova Scotia Assessment: Reading and Writing in Grade 8 was first administered in the spring of the 2012-13 school year, which serves as the baseline year. This assessment measures students’ reading ability in relation to expectations for students in grade 8. It is administered in the late spring of every school year. Aggregate board and provincial results are made public through the Program of Learning Assessment for Nova Scotia (PLANS) website (plans.ednet.ns.ca) and are used to make decisions relating to curriculum, programming, and intervention strategies. Teachers and parents are provided with individual student reports that can be used to inform programming for students. REPORTING ON 2013-14 TARGETS (READING) The target for this measure is to increase the percentage of students meeting expectations in reading over the 2012-13 baseline of 70 percent by 2016-17. The assessment used to measure this target is administered in late spring of each year, therefore the percentage of students meeting expectations for 2013-14 will not be available until fall 2014. This measure is part of a revised set of provincial assessments. This new measure, Nova Scotia Assessment: Reading and Writing in Grade 8, has replaced the Junior High Literacy Assessment (Grade 9). WHERE DO WE WANT TO GO/BE IN THE FUTURE? The 2014-15 Statement of Mandate includes a target performance measure for grade 8 reading to increase the percentage of students meeting provincial expectations above the 2012-13 baseline of 70 percent by 2016-17.
Percent of Grade 8 Students Meeting Expectations in Reading
Year
% of students meeting expectations
2012-13* 70%
2013-14 administered June 2014
*baseline

Department of Education and Early Childhood Development Accountability Report 2013-14 7 | P a g e
NOVA SCOTIA ASSESSMENT: READING AND WRITING IN GRADE 3 (WRITING) One of the department’s core business areas is grade primary to 12 education. The percentage of students meeting provincial expectations in the area of writing is one of the measures for a desired outcome that falls within this core business area. WHAT DOES THIS MEASURE TELL US? Nova Scotia Assessment: Reading and Writing in Grade 3 was first administered in the 2012-13 school year, which serves as the baseline year. This assessment measures students’ writing ability in relation to expectations for students at the end of grade 2. It is administered in the fall of every school year. The assessment presents results for writing according to four criteria: Ideas, Organization, Language Use, and Conventions. Aggregate board and provincial results are made public through the Program of Learning Assessment for Nova Scotia (PLANS) website (plans.ednet.ns.ca) and are used to make broader decisions relating to curriculum, programming, and intervention strategies. Teachers and parents are provided with individual student reports that can be used to inform programming for students. REPORTING ON 2013-14 TARGETS The target for this measure is an improvement of the percentage of students meeting expectations in each of the four areas, over the baseline year. In 2013-14 there was a drop in the percent of students meeting expectations in the writing areas of Organization (-4 percent), Language Use (-4 percent), and Conventions (-5 percent), and no change in the percent of students meeting expectations in the writing area of Ideas. This measure is part of a revised set of provincial assessments. This new measure, Nova Scotia Assessment: Reading and Writing in Grade 3, has replaced the Early Language Literacy Assessment (Grade 3) measure. WHERE DO WE WANT TO GO/BE IN THE FUTURE? The 2014-15 Statement of Mandate includes a target performance measure for grade 3 writing to increase the percentage of students meeting provincial expectations, above the 2012-13 baseline by 2016-17. As outlined in the 2014-15 Statement of Mandate, the department has committed to a more comprehensive approach to early literacy support that includes an evidence-based approach to instructional practices, interventions, and family literacy initiatives. Students who do not meet provincial expectations are supported in their development as writers through early literacy support that is available to students in grades primary to 3.
Percent of Grade 3 Students Meeting Writing Expectations
Year
% of students meeting expectations
Ideas Organization Language Use Conventions
2012-13* 88% 80% 83% 71%
2013-14 88% 76% 79% 66%
*baseline

Department of Education and Early Childhood Development Accountability Report 2013-14 8 | P a g e
NOVA SCOTIA ASSESSMENT: READING AND WRITING IN GRADE 6 (WRITING) One of the department’s core business areas is grade primary to 12 education. The percentage of students meeting provincial expectations in the area of writing is one of the measures for a desired outcome that falls within this core business area. WHAT DOES THIS MEASURE TELL US? Nova Scotia Assessment: Reading and Writing in Grade 6 was first administered in the 2012-13 school year, which serves as the baseline year. This assessment measures students’ writing ability in relation to expectations for students at the end of grade 5. It is administered in the fall of every school year. The assessment presents results for writing according to four criteria: Ideas, Organization, Language Use, and Conventions. Aggregate board and provincial results are made public through the Program of Learning Assessment for Nova Scotia (PLANS) website (plans.ednet.ns.ca) and are used to make broader decision relating to curriculum, programming, and intervention strategies. Teachers and parents are provided with individual student reports that can be used to inform programming for students. REPORTING ON 2013-14 TARGETS The target for this measure is an improvement in the percentage of students meeting expectations over the baseline year. In 2013-14 the percentage of students meeting expectations dropped in each of the four writing areas: Ideas (-1 percent); Organization (-2 percent), Language Use (-3 percent), and Conventions (-8 percent). This measure is part of a revised set of provincial assessments. Nova Scotia Assessment: Reading and Writing in Grade 6 replaced the Elementary Literacy Assessment. WHERE DO WE WANT TO GO/BE IN THE FUTURE? The 2014-15 Statement of Mandate includes a target performance measure for grade 6 writing to increase the percentage of students meeting provincial expectations above the 2012-13 baseline by 2016-17. Although results in 2013-14 show a drop in the percentage of students meeting expectations in grade 6 writing across the four areas, it is not possible to determine a trend in the results at this time due to the implementation of the new provincial assessments in 2012-13.
Percent of Grade 6 Students Meeting Writing Expectations
Year
% of students meeting expectations
Ideas Organization Language Use Conventions
2012-13* 89% 81% 82% 73%
2013-14 88% 79% 79% 65%
*baseline

Department of Education and Early Childhood Development Accountability Report 2013-14 9 | P a g e
NOVA SCOTIA ASSESSMENT: READING AND WRITING IN GRADE 8 (WRITING) One of the department’s core business areas is grade primary to 12 education. The percentage of students meeting provincial expectations in the area of writing is one of the measures for a desired outcome that falls within this core business area. WHAT DOES THIS MEASURE TELL US? Nova Scotia Assessment: Reading and Writing in Grade 8 was first administered in the 2012-13 school year, which also serves as the baseline year. This assessment measures students’ writing ability in relation to expectations for students in grade 8. It is administered in the fall of every school year. The assessment presents results for writing according to four criteria: Ideas, Organization, Language Use, and Conventions. Aggregate board and provincial results are made public through the Program of Learning Assessment for Nova Scotia (PLANS) website (plans.ednet.ns.ca) and are used to make broader decision relating to curriculum, programming, and intervention strategies. Teachers and parents are provided with individual student reports that can be used to inform programming for students. REPORTING ON 2013-14 TARGETS The target for this measure is an increase in the percentage of students meeting expectations over the baseline year. The assessment used to measure this target is administered in late spring of each year, therefore the percentage of students meeting expectations for 2013-14 will not be available until fall 2014. This measure is part of a revised set of provincial assessments. This new measure, Nova Scotia Assessment: Reading and Writing in Grade 8, has replaced the Junior High Literacy Assessment (Grade 9). WHERE DO WE WANT TO GO/BE IN THE FUTURE? The 2014-15 Statement of Mandate includes a target performance measure for grade 8 writing to increase the percentage of students meeting provincial expectations, above the 2012-13 baseline by 2016-17.
Percent of Grade 8 Students Meeting Writing Expectations
Year
% of students meeting expectations
Ideas Organization Language Use
Conventions
2012-13* 95% 88% 89% 80%
2013-14 Administered in June 2014
*baseline
Department of Education and Early Childhood Development Accountability Report 2013-14 10 | P a g e
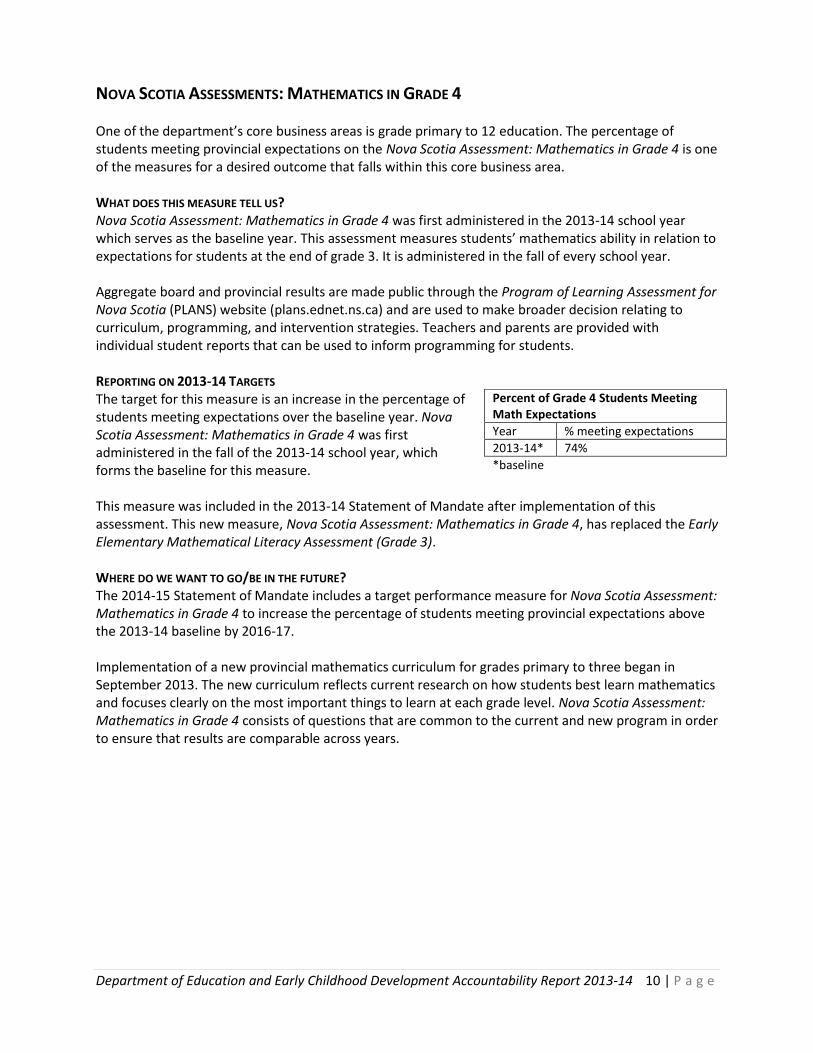
NOVA SCOTIA ASSESSMENTS: MATHEMATICS IN GRADE 4 One of the department’s core business areas is grade primary to 12 education. The percentage of students meeting provincial expectations on the Nova Scotia Assessment: Mathematics in Grade 4 is one of the measures for a desired outcome that falls within this core business area. WHAT DOES THIS MEASURE TELL US? Nova Scotia Assessment: Mathematics in Grade 4 was first administered in the 2013-14 school year which serves as the baseline year. This assessment measures students’ mathematics ability in relation to expectations for students at the end of grade 3. It is administered in the fall of every school year. Aggregate board and provincial results are made public through the Program of Learning Assessment for Nova Scotia (PLANS) website (plans.ednet.ns.ca) and are used to make broader decision relating to curriculum, programming, and intervention strategies. Teachers and parents are provided with individual student reports that can be used to inform programming for students. REPORTING ON 2013-14 TARGETS The target for this measure is an increase in the percentage of students meeting expectations over the baseline year. Nova Scotia Assessment: Mathematics in Grade 4 was first administered in the fall of the 2013-14 school year, which forms the baseline for this measure. This measure was included in the 2013-14 Statement of Mandate after implementation of this assessment. This new measure, Nova Scotia Assessment: Mathematics in Grade 4, has replaced the Early Elementary Mathematical Literacy Assessment (Grade 3). WHERE DO WE WANT TO GO/BE IN THE FUTURE? The 2014-15 Statement of Mandate includes a target performance measure for Nova Scotia Assessment: Mathematics in Grade 4 to increase the percentage of students meeting provincial expectations above the 2013-14 baseline by 2016-17. Implementation of a new provincial mathematics curriculum for grades primary to three began in September 2013. The new curriculum reflects current research on how students best learn mathematics and focuses clearly on the most important things to learn at each grade level. Nova Scotia Assessment: Mathematics in Grade 4 consists of questions that are common to the current and new program in order to ensure that results are comparable across years.
Percent of Grade 4 Students Meeting Math Expectations
Year % meeting expectations
2013-14* 74%
*baseline

Department of Education and Early Childhood Development Accountability Report 2013-14 11 | P a g e
NOVA SCOTIA ASSESSMENTS: MATHEMATICS IN GRADE 6 One of the department’s core business areas is grade primary to 12 education. The percentage of students meeting provincial expectations on the Nova Scotia Assessments: Mathematics in Grade 6 is one of the measures for a desired outcome that falls within this core business area. WHAT DOES THIS MEASURE TELL US? Nova Scotia Assessments: Mathematics in Grade 6 was first administered in the 2012-13 school year which serves as the baseline year. This assessment measures students’ mathematics ability in relation to expectations for students at the end of grade 5. It is administered in the fall of every school year. Aggregate board and provincial results are made public through the Program of Learning Assessment for Nova Scotia (PLANS) website (plans.ednet.ns.ca) and are used to make broader decision relating to curriculum, programming, and intervention strategies. Teachers and parents are provided with individual student reports that can be used to inform programming for students. REPORTING ON 2013-14 TARGETS The target for this measure is an improvement of the percentage of students meeting expectations over the 2012-13 baseline of 73 percent. In 2013-14, there was no change in the percentage of students meeting expectations compared to the baseline. This measure is part of a revised set of provincial assessments. This new measure, Nova Scotia Assessments: Mathematics in Grade 6, has replaced the Elementary Mathematical Literacy Assessment. WHERE DO WE WANT TO GO/BE IN THE FUTURE? The 2014-15 Statement of Mandate includes a target performance measure for Nova Scotia Assessments: Mathematics in Grade 6 to increase the percentage of students meeting provincial expectations above the 2012-13 baseline by 2016-17. Increasing student learning and achievement in mathematics is a priority for the department, as outlined in the 2014-15 Statement of Mandate. The province will be implementing a new mathematics curriculum for grades 4 to 6 in 2014-15. The new curriculum reflects current research on how students best learn mathematics and focuses clearly on the most important things to learn at each grade level. Mathematics in Grade 6 will consist of questions that are common to the current and new program in order to ensure that results are comparable across years.
Percent of Grade 6 Students Meeting Math Expectations
Year % meeting expectations
2012-13* 73%
2013-14 73%
*baseline

Department of Education and Early Childhood Development Accountability Report 2013-14 12 | P a g e
NOVA SCOTIA ASSESSMENTS: MATHEMATICS IN GRADE 8 One of the department’s core business areas is grade primary to 12 education. The percentage of students meeting provincial expectations on the Nova Scotia Assessments: Mathematics in Grade 8 is one of the measures for a desired outcome that falls within this core business area. WHAT DOES THIS MEASURE TELL US? Nova Scotia Assessments: Mathematics in Grade 8 was first administered in the 2012-13 school year which also serves as the baseline year. This assessment measures students’ mathematics ability in relation to expectations for students at the end of grade 8. It is administered in the spring of every school year. Aggregate board and provincial results are made public through the Program of Learning Assessment for Nova Scotia (PLANS) website (plans.ednet.ns.ca) and are used to make broader decision relating to curriculum, programming, and intervention strategies. Teachers and parents are provided with individual student reports that can be used to inform programming for students. REPORTING ON 2013-14 TARGETS The target for this measure is an improvement of the percentage of students meeting expectations over the baseline. Nova Scotia Assessments: Mathematics in Grade 8 was first administered in the spring of the 2012-13 school year, which forms the baseline for this measure. The percentage of students meeting expectations for 2013-14 will not be available until fall 2014. This measure is part of a revised set of provincial assessments. WHERE DO WE WANT TO GO/BE IN THE FUTURE? The 2014-15 Statement of Mandate includes a target performance measure to increase the percentage of grade 8 students meeting provincial expectations in mathematics, above the 2012-13 baseline by 2016-17. Increasing student learning and achievement in mathematics is a priority for the department, as outlined in the 2014-15 Statement of Mandate. This includes providing direct mathematics support and interventions for students, with a focus on grades 7 to 9, as well as providing coaching support for teachers. The province is also in the process of implementing a new mathematics curriculum, which is being phased in by grade over the next few school years. The new curriculum reflects current research on how students best learn mathematics and focuses clearly on the most important things to learn at each grade level.
Percent of Grade 8 Students Meeting Math Expectations
Year % meeting expectations
2012-13* 54%
2013-14 administered in June 2014
*baseline

Department of Education and Early Childhood Development Accountability Report 2013-14 13 | P a g e
PROGRAMME FOR INTERNATIONAL STUDENT ASSESSMENT (PISA) One of the department’s core business areas is grade primary to 12 education. The Programme for International Student Assessment (PISA) results are used to measure 15-year-old students’ performance in reading, mathematics, and science and allow for comparison across jurisdictions. The PISA assessment is one of the measures for a desired outcome that falls with the department’s core business area of grade primary to 12 education. WHAT DOES THIS MEASURE TELL US? PISA is a well-respected international instrument sponsored by the Organization for Economic Co-operation and Development (OECD). Every three years it provides reliable measures of 15 year old students’ performance in reading, mathematics, and science and allows us to compare students in Nova Scotia with the performance of students in other jurisdictions. Each assessment includes questions from all three subject areas with a focus on one subject area each time the assessment is administered. The major focus of the 2012 PISA assessment was mathematics. Results from the 2012 PISA assessment were released in December 2013. Over 60 countries participate in the assessment. The first PISA was administered in the spring of 2000. Canada has participated in PISA since its inception. REPORTING ON 2013-14 TARGETS The 2012 PISA results indicate that compared to 2009, the average performance of students in Nova Scotia for 2012, did not change by a statistically significant amount in the areas of reading and science; but were statistically significantly lower for mathematics. Compared to the OECD average, Nova Scotia is performing on par (i.e. not statistically different) in all three areas. However, of concern is that Nova Scotian students continue to perform below the Canadian average by a statistically significant margin in all three areas. As mathematics was the focus in the 2012 PISA assessment, the target for this report was to maintain or improve the 2003 average of 5151 in mathematics, by 2013-14. The Nova Scotia average for 2012 was 497, a statistically significant drop from 2009 meaning the target was not achieved. WHERE DO WE WANT TO GO/BE IN THE FUTURE? Students who do not meet expectations in the areas of reading, mathematics, and science are supported in their development to ensure students have the skills and knowledge they need to be successful as they move on to higher grades. Specifically in mathematics, the province is in the process of implementing a new mathematics curriculum and comprehensive mathematics strategy, which is being phased in by grade over the next few school years. The new curriculum reflects current research on how students best learn mathematics and focuses clearly on the most important things to learn at each grade level.
1 The target is set based on the most recent assessment where that subject was the area of focus.
PISA Results
Subject NS Average (2009)
NS Average (2012)
Canadian Average (2012)
OECD Average (2012)
Reading 516 508 523 496
Math 512 497 518 494
Science 523 516 525 501

Department of Education and Early Childhood Development Accountability Report 2013-14 14 | P a g e
PAN-CANADIAN ASSESSMENT PROGRAM (PCAP) One of the department’s core business areas is grade primary to 12 education. The Pan-Canadian Assessment Program (PCAP) results are used to measure student performance in reading, mathematics, and science in grade 8. The PCAP assessment is one of the measures for a desired outcome that falls with the department’s core business area of grade primary to 12 education. WHAT DOES THIS MEASURE TELL US? PCAP is an assessment instrument developed by the Council of Ministers of Education, Canada (CMEC). It is administered every three years and provides reliable measures of student performance in reading, mathematics, and science. The target population is students in grade 8. The average score for Canada is 500. REPORTING ON 2012-13 TARGETS The target for this measure was an increase over the 2007 baseline data by 2013-14. PCAP data is collected and reported every three years; 2013 data will not be available until late summer 2014 and therefore it is not possible to report on the target for this measure at this time. It is important to note that based on the 2010 results, Nova Scotia performed below the Canadian average in all three subject areas. When compared to 2007, the 2010 PCAP results for reading in Nova Scotia was not a statistically significant increase, meaning the results remained on par with 2007 results. WHERE DO WE WANT TO GO/BE IN THE FUTURE? The target for this measure is to improve the average scores of Nova Scotia’s grade 8 students on the 2013 PCAP assessment above the 2007 baseline. Results of the 2013 PCAP assessment are expected to be available in summer 2014. It may be necessary to develop a new performance measure for PCAP results using PCAP 2010 as the baseline, due to changes to the target population from 2007 to 2010. Students who do not meet expectations in the areas of reading, mathematics, and science are supported in their development to ensure students have the skills and knowledge they need to be successful as they move on to higher grades. Specifically in mathematics, the province is in the process of implementing a new mathematics curriculum, which is being phased in by grade, over the next few school years. The new curriculum reflects current research on how students best learn mathematics and focuses clearly on the most important things to learn at each grade level.
2 When first administered in 2007 the target population for the assessment was 13-year-old students. The target
population was changed to students in grade 8 in preparation for the second administration of the assessment in
2010. Results from 2007 were adjusted to account for this change in the assessment population and therefore
results cannot be compared between 2007 and 2010 in the areas of mathematics and science.
PCAP Results
Adjusted 2007 Results
2
2010 Results
Subject NS Average Canadian Average
NS Average
Canadian Average
Reading 483 500 489 500
Math N/A N/A 474 500
Science N/A N/A 489 500

Department of Education and Early Childhood Development Accountability Report 2013-14 15 | P a g e
PROGRESS IN INTERNATIONAL READING LITERACY STUDY (PIRLS) One of the department’s core business areas is grade primary to 12 education. The Progress in International Reading Literacy Study (PIRLS) results are used to measure the performance of grade 4 students in reading comprehension. The PIRLS assessment is one of the measures for a desired outcome that falls with the department’s core business area of grade primary to 12 education. WHAT DOES THIS MEASURE TELL US? PIRLS is an international assessment of reading comprehension for grade 4. The assessment allows us to compare the performance of grade 4 students in Nova Scotia with the performance of students in other jurisdictions in reading comprehension. PIRLS uses a fixed “international centrepoint” of 500 as a means of allowing jurisdictions to compare performance. PIRLS is conducted every five years. The first administration of PIRLS was in 2001. Nova Scotia has participated since 2006. In 2006, a limited number of Canadian jurisdictions participated and therefore no Canadian average is available. The next administration of PIRLS will be in 2016, with results expected in December 2017. REPORTING ON 2013-14 TARGETS The target for this measure is an improvement in the Nova Scotia average over the 2006 baseline, and an increase in the percentage of students performing at or above the intermediate benchmark3 over the baseline. The 2011 Nova Scotia average of 549 was a statistically significant improvement over the 2006 baseline of 542. Compared to the Canadian average, Nova Scotian students were on par. The percentage of Nova Scotia students at or above the intermediate benchmark also increased by a statistically significant amount (85 percent versus 82 percent) and remained on par with the Canada as whole. WHERE DO WE WANT TO GO/BE IN THE FUTURE? The 2014-15 Department of Education and Early Childhood Development Statement of Mandate includes a target performance measure for PIRLS 2016 that is a statistically significant improvement over the baseline performance (2006 results). The department will continue to work with students to support their development as readers through the Early Literacy Support Framework to ensure students have the skills and knowledge they need as they move on to higher grades.
3 The PIRLS assessment reports the percentage of students meeting each of four international benchmarks:
Advanced, High, Intermediate, or Low.
PIRLS Results
Year NS Average
Canadian Average
NS % at or above intermediate benchmark
Canada % at or above intermediate benchmark
2006* 542 N/A 82% N/A
2011 549 548 85% 86%
*baseline

Department of Education and Early Childhood Development Accountability Report 2013-14 16 | P a g e
HIGH SCHOOL GRADUATION RATE One of the department’s core business areas is grade primary to 12 education. The high school graduation rate is one of the measures for a desired outcome that falls within this core business area. WHAT DOES THIS MEASURE TELL US? The graduation rate is the percentage of students receiving a high school graduation diploma compared with the number of students in grade 9 three years earlier. Education is a key variable in improved employment prospects and higher earnings. The successful pursuit of further education depends upon high school graduation. This is the foundation upon which an individual’s future success is built. REPORTING ON 2013-14 TARGETS The target for this measure is to increase the graduation rate over the 2009-10 baseline of 86.1 percent by 2013-14. The graduation rate from the 2012-13 school year was 89.6 percent, an increase over the baseline, and an increase of 1.0 percent from 2011-12. Graduation rates are not available until after the conclusion of the school year in June, so this performance measure represents data from the previous year.
79.0% 80.0%81.6% 82.8%
84.3% 85.0% 84.8% 83.9% 83.8%86.1%
88.7% 88.6% 89.6%
50.0%
55.0%
60.0%
65.0%
70.0%
75.0%
80.0%
85.0%
90.0%
95.0%
100.0%
GRADE 12 GRADUATION RATE
Received High School Diploma
WHERE DO WE WANT TO GO/BE IN THE FUTURE? Our target is to continue to increase the graduation rate. The department has implemented a number of programs aimed at addressing student engagement and encouraging students to stay in school. Senior high students can choose course options that are consistent with their post-secondary plans, be they university, community college, skilled trades, or the job market.

Department of Education and Early Childhood Development Accountability Report 2013-14 17 | P a g e
3.0 FINANCIAL RESULTS Education and Early Childhood Development
2013-14 Estimate 2013-14 Actual
Program and Service Area ($ thousands) ($ thousands)
Senior Management 874 1,060
Early Years 1,186 1,040
Corporate Policy 1,688 2,061
Corporate Services 15,632 14,1404
Public Schools 34,231 39,3715
Acadian and French Language Services 1,937 1,950
Public Education Funding 916,955 913,8326
Other Grants 4,900 9,1077
Learning Resources Credit Allocation 6,813 7,0828
Teachers’ Pension 58,021 60,7529
School Capital Amortization 63,422 65,51210
Total Department of Education and Early Childhood Development
1,105,659 1,115,907
Additional Information:
Fees and Other Charges (1,846) (1,510)
Ordinary Recoveries (16,052) (22,908)
TCA Purchase Requirements 7,510 6,948
Provincial Funded Staff (FTEs) 213.62 185.47
4 Under budget due primarily to vacancies and operational savings to offset department pressures.
5 Over budget due to increased spending in accordance with the Official Languages in Education Protocol (OLEP)
which are fully recoverable from the Federal Government; increased support for Continuous School Improvement;
and increased support for virtual high schools and the mathematics engagement project. 6 Under budget due to savings in NSTU Premiums and non-formula program grants. These resources were used to
offset cost pressures in Teachers’ Pension and other department pressures. 7 Over budget due to commitments related to OLEP. OLEP is fully recoverable from the federal government.
8 Over budget due to increased learning resource purchases.
9 Over budget due to higher than anticipated pension charges from the Nova Scotia Pension Agency.
10 Over budget due to acceleration of capital projects in 2013-14.

Department of Education and Early Childhood Development Accountability Report 2013-14 18 | P a g e
APPENDIX 1 – DISCLOSURES OF WRONGDOING RECEIVED BY THE DEPARTMENT OF
EDUCATION AND EARLY CHILDHOOD DEVELOPMENT
DEPARTMENT OF EDUCATION – DISCLOSURES OF WRONGDOING INFORMATION REQUIRED UNDER SECTION 18 OF THE
PUBLIC INTEREST DISCLOSURE OF WRONGDOING ACT FISCAL YEAR 2013-14
Number of disclosures received One (1)
Number of findings of wrongdoing One (1)
Details of each wrongdoing (insert separate row for each wrongdoing)
Potential for cross-contamination of potable and non-potable water in a public school.
Recommendations and actions taken on each wrong doing (insert separate row for each wrongdoing)
Backflow preventer device (BPD) was installed to prevent cross-contamination of potable and non-potable water at the school.