annual 2019 post-closure monitoring report
TRANSCRIPT


Annual 2019 Post-Closure Monitoring Report Former Section 29 Surface Impoundments Lost Hills, California
Prepared for:
San Joaquin Valley Business Unit October 15, 2019 Bakersfield, California 93302 Project 0075802017

Wood Environment & Infrastructure Solutions, Inc. 1281 East Alluvial Avenue, Suite 101
Fresno, CA 93720-2659 USA
T: 559-264-2535
www.woodplc.com
‘Wood’ is a trading name for John Wood Group PLC and its subsidiaries
October 15, 2019 Project 0075802017 Ms. Linh Vo Chevron North America Exploration and Production San Joaquin Valley Business Unit Post Office Box 1392 Bakersfield, California 93302 Subject: Annual 2019 Post-Closure Monitoring Report
Former Section 29 Surface Impoundments Lost Hills, California
Dear Ms. Vo: Wood Environment & Infrastructure Solutions, Inc. (Wood), is pleased to present the enclosed report describing the results of post-closure monitoring activities performed during 2019 at the former Section 29 Surface Impoundments located in Lost Hills, California. The report has been prepared on behalf of the San Joaquin Valley Business Unit of Chevron North America Exploration and Production (Chevron) for submittal to the Central Valley Regional Water Quality Control Board. Wood is pleased to be of continuing service to Chevron. If you have any questions, please call either of us. Sincerely, Wood Environment & Infrastructure Solutions, Inc. Leslie K. Purvis, LEP William V. Pipes, PG Environmental Scientist Principal Geologist I:\7000s\7580.000\Archive\7580-191.docx
(Submitted Electronically) cc: Jeffrey Johnson, Chevron Ron Holcomb, RWQCB

Annual 2019 Post-Closure Monitoring Report Former Section 29 Surface Impoundments Lost Hills, California Prepared for: Chevron North America Exploration and Production San Joaquin Valley Business Unit Post Office Box 1392 Bakersfield, California 93302 Prepared by: Wood Environment & Infrastructure Solutions, Inc. 1281 East Alluvial Avenue, Suite 101 Fresno, California 93720 T: 559-264-2535 October 15, 2019 Project 0075802017 Copyright and non-disclosure notice The contents and layout of this document are subject to copyright owned by Wood (© Wood Environment & Infrastructure Solutions, Inc.) to the extent that copyright has been legally assigned by us to another party or is used by Wood under license. To the extent that we own the copyright in this document, it may not be copied or used without our prior written agreement for any purpose other than the purpose indicated in this document. The methodology (if any) contained in this document is provided to you in confidence and must not be disclosed or copied to third parties without the prior written agreement of Wood. Disclosure of that information may constitute an actionable breach of confidence or may otherwise prejudice our commercial interests. Any third party who obtains access to this document by any means will, in any event, be subject to the Third-Party Disclaimer set out below.
Third-party disclaimer Any disclosure of this document to a third party is subject to this disclaimer. The document was prepared by Wood at the instruction of, and for use by, our client named on the front of the document. It does not in any way constitute advice to any third party who is able to access it by any means. Wood excludes to the fullest extent lawfully permitted all liability whatsoever for any loss or damage howsoever arising from reliance on the contents of this document. We do not however exclude our liability (if any) for personal injury or death resulting from our negligence, for fraud or any other matter in relation to which we cannot legally exclude liability.
Professional declaration This document was prepared by Wood staff under the supervision of the Geologist whose seal and signature appears hereon. The findings, recommendations, specifications, or professional opinions presented in this document were prepared in accordance with generally accepted professional geologic practice and within the scope of the project. No other warranty, express or implied, is provided.
______________________________________________________ William V. Pipes, PG Principal Geologist

Annual 2019 Post-Closure Monitoring Report Former Section 29 Surface Impoundments
Lost Hills, California
I:\7000s\7580.000\Archive\7580-191.docx Page i
Table of contents 1.0 Introduction ........................................................................................................................................................................... 1 2.0 Background ............................................................................................................................................................................ 1 3.0 Annual 2019 Monitoring Activities ............................................................................................................................... 2
3.1 Groundwater Monitoring ................................................................................................................................. 2 3.2 Soil Moisture Monitoring ................................................................................................................................. 4 3.3 Impoundment Cover Inspection ................................................................................................................... 4
4.0 Annual 2019 Monitoring Results ................................................................................................................................... 4 4.1 Groundwater Occurrence ................................................................................................................................. 4 4.2 Groundwater Quality ......................................................................................................................................... 5 4.3 Soil Moisture ......................................................................................................................................................... 7 4.4 Impoundment Cover Inspection ................................................................................................................... 8
5.0 Financial Assurance Review ............................................................................................................................................. 8 5.1 Monitoring and Reporting Costs .................................................................................................................. 8 5.2 Maintenance Costs ............................................................................................................................................. 9 5.3 Summary of Estimated Costs ......................................................................................................................... 9
6.0 Summary of 2019 Post-Closure Activities .................................................................................................................. 9 7.0 Future Post-Closure Monitoring Activities ..............................................................................................................10 8.0 References ............................................................................................................................................................................10
List of tables Table 1: Well Construction Summary Table 2: Depth to Groundwater and Groundwater Elevation Data Table 3: Purge and Field Parameter Data Table 4: Laboratory Analytical Results Table 5: Anion-Cation Balance Table 6: Laboratory Analytical Results – Oxygen and Hydrogen Isotopes Table 7: Soil Moisture Data Table 8: Summary of Post-Closure Maintenance and Monitoring Costs
List of figures Figure 1: Site Location Map Figure 2: Site Plan and Potentiometric Surface Map Figure 3: Piper Diagram, Water Samples, Initial Sampling and April 2019 Figure 4: Oxygen and Hydrogen Isotope Ratios
List of appendices Appendix A: Hydrographs Appendix B: Laboratory Analytical Reports and Chain-of-Custody Records Appendix C: Time Concentration Charts Appendix D: Cover Inspection Documents

Annual 2019 Post-Closure Monitoring Report Former Section 29 Surface Impoundments
Lost Hills, California
I:\7000s\7580.000\Archive\7580-191.docx Page 1
1.0 Introduction Wood Environment & Infrastructure Solutions, Inc. (Wood), has prepared this report describing the results of post-closure monitoring activities performed in 2019 at the former Section 29 Surface Impoundments (impoundments) located at the Lost Hills Oil Field in Kern County, California. This report has been prepared on behalf of the San Joaquin Valley Business Unit of Chevron North America Exploration and Production (Chevron) for submittal to the Central Valley Regional Water Quality Control Board (RWQCB). Post-closure monitoring activities were performed as part of the post-closure maintenance and monitoring program for the former impoundments. Groundwater, soil moisture, and facility monitoring were performed in accordance with Waste Discharge Requirements (WDRs) Order No. R5-2013-0056 and its associated Monitoring and Reporting Program (MRP), which were issued to Chevron on May 31, 2013, by the RWQCB (RWQCB, 2013a). This monitoring report is organized as follows:
• Section 2.0 – background information on the site and a brief summary of previous investigations.
• Section 3.0 – a description of groundwater and soil monitoring activities.
• Section 4.0 – a discussion of the field and laboratory results from the 2019 annual groundwater and soil monitoring events.
• Section 5.0 – a summary of the 2019 annual financial assurance review.
• Section 6.0 – a summary of post-closure monitoring and inspection activities conducted in 2019.
• Section 7.0 – a brief description of future activities.
• Section 8.0 – references used in preparing this report.
2.0 Background The former impoundments are located in northwestern Kern County on GP Road between Holloway and Lost Hills Roads, about 3 miles northwest of the town of Lost Hills, California (Figure 1). The former impoundments occupy approximately 26 acres and are bounded by agricultural land to the north and east and the Lost Hills Oil Field to the south and west (Figure 2). Background information for the site is summarized in groundwater investigation reports prepared between 2000 and 2004. The results of these investigations indicated that produced water infiltrated from the former impoundments and mixed with the existing poor quality alluvial groundwater in the vicinity of the former impoundments. In December 2000, monitoring well 29MW-1 was installed about 500 feet southwest and upgradient of the former impoundments. In August and September 2004, off-site sentinel wells 21MW-1, 21MW-2, and 21MW-3 were installed. These three sentinel wells were designed to monitor the downgradient extent of the produced water mixed with native groundwater at the time. In August 2007, monitoring well 29MW-2 was installed about 2,200 feet northeast of upgradient well 29MW-1 (Figure 2). This location is in the center of affected groundwater downgradient of the former impoundments. In November 2014, Chevron installed groundwater monitoring wells 21MW-4 and 21MW-5 about 3,200 feet northeast (downgradient) of well 21MW-1. Deep well 21MW-5 and shallow well 21MW-4 were installed to further characterize the

Annual 2019 Post-Closure Monitoring Report Former Section 29 Surface Impoundments
Lost Hills, California
I:\7000s\7580.000\Archive\7580-191.docx Page 2
lateral and vertical extent of constituents of concern in groundwater downgradient of monitoring well 21MW-1, per the WDRs. The groundwater monitoring network currently consists of seven wells: one well upgradient of the former impoundments (well 29MW-1) and six wells downgradient of the former impoundments (wells 29MW-2, 21MW-1, 21MW-2, 21MW-3, 21MW-4, and 21MW-5). Except for well 21MW-5, the downgradient wells are completed across a relatively thick and continuous water-bearing sand that occurs at the base of the Quaternary deposits within the Older Alluvium, just above a fine-grained layer called the Corcoran Clay Equivalent and the Tulare Formation. This sand is referred to as the Basal Alluvial Sand. The Basal Alluvial Sand is a pathway for the migration of produced water downgradient of the former impoundments (Geomatrix, 2004). Well 21MW-5 is completed below the Corcoran Clay Equivalent in the upper portion of the Tulare Formation to assess whether produced water from the impoundments migrated below the Corcoran Clay Equivalent into the upper portions of the Tulare Formation. Monitoring well construction details are summarized in Table 1, and well locations are shown on Figure 2. A Groundwater Corrective Action Plan for the former impoundments was submitted to the RWQCB in June 2006 (Geomatrix, 2006). The RWQCB approved the Groundwater Corrective Action Plan in March 2007 (RWQCB, 2007). Chevron ceased sending water to the former impoundments in February 2008. Chevron completed closure of the former impoundments in March 2009. Former impoundment closure activities consisted of excavating residual waste from the former impoundments, collecting confirmation samples below the residual waste, backfilling and compacting the former impoundments with fill material, placing the final cover, and conducting a post-closure site survey. A Closure Report was submitted to the RWQCB in March 2009 (AMEC Geomatrix, 2009). The RWQCB approved final closure of the former impoundments in August 2010 (RWQCB, 2010). In May 2013, WDRs Order No. R5-2013-0056 was adopted and required preparation and submittal of additional post-closure monitoring plans. Chevron submitted a Sampling and Analysis Plan, Water Quality Monitoring Plan, and Post-Closure Maintenance and Monitoring Plan to the RWQCB on July 31, 2013 (AMEC, 2013a, 2013b, and 2013c). The RWQCB approved the Sampling and Analysis Plan in an August 27, 2013, letter (RWQCB, 2013b), the Water Quality Monitoring Plan in an August 28, 2013, letter (RWQCB, 2013c), and the Post-Closure Maintenance and Monitoring Plan in a September 18, 2013, letter (RWQCB, 2013d).
3.0 Annual 2019 Monitoring Activities Annual post-closure monitoring activities in 2019 included groundwater monitoring, soil moisture monitoring, and inspecting the former impoundment cover in accordance with the MRP. These activities are described in the following subsections. 3.1 Groundwater Monitoring Annual groundwater monitoring was performed at the former impoundments on April 22, 2019. The monitoring was performed in accordance with the Sampling and Analysis Plan and Post-Closure Maintenance and Monitoring Plan. Groundwater monitoring consisted of measuring the depth to groundwater and collecting groundwater samples from the seven monitoring wells for laboratory analysis.

Annual 2019 Post-Closure Monitoring Report Former Section 29 Surface Impoundments
Lost Hills, California
I:\7000s\7580.000\Archive\7580-191.docx Page 3
The depth to groundwater was measured to the nearest 0.01 foot in each well using an electric water level sounder. The sounder was cleaned between each measurement by washing with a Liquinox solution and then rinsing with clean water followed by deionized water. Before sample collection, a minimum of two pump and riser tubing volumes was purged from each monitoring well using micropurge methods. During purging, field parameters (pH, specific conductance, and temperature) were monitored. Approximately 11 gallons of purge water were generated and contained in a portable tank. The purge water was disposed of at the Lost Hills ENWARS facility, as directed by Chevron. After purging was complete and field parameters had stabilized, a groundwater sample was collected from each monitoring well using micropurge methods. Sample containers were supplied by the laboratory. After sample collection, the containers were labeled, placed in an ice-chilled chest, and transported using chain-of-custody procedures to TestAmerica Laboratories, Inc. (TestAmerica), a California-certified laboratory located in Irvine, California, for chemical analysis. The groundwater samples were analyzed by TestAmerica using U.S. Environmental Protection Agency (EPA) approved methods for the constituents listed in the following table.
Matrix/Type Constituent Method1 Monitoring Parameters Total Dissolved Solids EPA 160.1
Electrical Conductivity EPA 120.1 Chloride EPA 300.0 Boron, dissolved EPA 6010B
Constituents of Concern Total Alkalinity, dissolved SM 2320B Standard Minerals Carbonate, dissolved SM 2320B
Bicarbonate, dissolved SM 2320B Sulfate, dissolved EPA 300.0 Nitrate as Nitrogen, dissolved EPA 300.0 Calcium, dissolved EPA 6010B Magnesium, dissolved EPA 6010B Sodium, dissolved EPA 6010B Potassium, dissolved EPA 6010B
Aromatic Hydrocarbons Benzene EPA 8260B Toluene EPA 8260B Ethylbenzene EPA 8260B Xylenes (m,p-xylenes and o-xylenes) EPA 8260B
Isotopes Oxygen (Delta [δ]-18O) and Hydrogen (δ-D) CF-IRMS 1. EPA - U.S. Environmental Protection Agency and SM - standard method.
Quality assurance/quality control (QA/QC) samples also were collected, including a replicate sample from well 21MW-1, an equipment blank, field blank, and trip blank. The QA/QC samples were analyzed by TestAmerica for petroleum hydrocarbon constituents. Additional sample volume was collected for a matrix spike/matrix spike duplicate. In addition to annual groundwater monitoring in accordance with the WDRs, groundwater samples were also collected from monitoring well 21MW-4 on behalf of the Westside Water Quality Coalition (WWQC).

Annual 2019 Post-Closure Monitoring Report Former Section 29 Surface Impoundments
Lost Hills, California
I:\7000s\7580.000\Archive\7580-191.docx Page 4
Groundwater sampling was performed for the WWQC in December 2018 and June 2019, and the groundwater samples were analyzed for nitrate as nitrogen using EPA Method 300.0. 3.2 Soil Moisture Monitoring Soil moisture monitoring of the former impoundment cover was conducted on April 23, 2019. The monitoring was performed in accordance with the MRP and additional requirements specified by the RWQCB in their approval of the Post-Closure Maintenance and Monitoring Plan (RWQCB, 2013d). Soil moisture monitoring is being conducted to assess the possible infiltration of water through the final cover of the closed impoundments and to confirm the results of the unsaturated zone modeling. The simulations of water infiltration into the closed and covered surface impoundments infiltrating water would be limited to the upper portions of the backfill and cover and, therefore, could not contribute a recharge flux to groundwater beneath the impoundments (AMEC Geomatrix, 2008). The sample location is in the southern portion of the cover, about 100 feet northeast of the end of the southern perimeter fence (Figure 2). The sample location was chosen in 2010 based on accessibility and representativeness. The sample location was staked, flagged, and marked using a hand-held global positioning system; soil samples are collected from this location each year. The soil moisture samples were obtained by advancing a drive sampler equipped with a precleaned stainless steel sample sleeve to a depth of 1.5 feet, then 3 feet below ground surface. The sample sleeves were removed from the drive sampler at the appropriate depth and the soil cores were capped, labeled, and transported to the Wood geotechnical laboratory in Newport Beach, California, using chain-of-custody procedures. The sample was analyzed for moisture content using ASTM International Test Method D 2216. Upon completion of soil sampling, the sample location was backfilled with native soil to match the grade of the former impoundments and tamped down. 3.3 Impoundment Cover Inspection Chevron personnel performed post-storm inspections of the impoundment cover on October 2, 2018, and March 12, 2019, following significant rain events in the vicinity of the impoundments. Chevron personnel also performed an annual inspection of the cover of the closed impoundments on August 20, 2019. 4.0 Annual 2019 Monitoring Results The results of the April 2019 groundwater and soil monitoring conducted at the former impoundments and impoundment inspections performed during the reporting period are described in the following subsections. Groundwater hydrographs are provided in Appendix A, the laboratory analytical data for groundwater and soil are provided in Appendix B, time concentration charts for selected constituents of concern in groundwater are provided in Appendix C, and cover inspection documents are provided in Appendix D. 4.1 Groundwater Occurrence The depth to groundwater was measured in the monitoring wells on April 22, 2019. Depth-to-groundwater measurements and calculated groundwater elevations are summarized in Table 2. The depth to groundwater in the six wells completed in the Basal Alluvial Sand ranged from 68.27 to 108.70 feet below the top of casing, and groundwater elevations ranged from 216.84 to 224.5 feet with reference to North American Vertical Datum 1988 (NAVD88) (Table 2). Upgradient well 29MW-1 was dry. The average horizontal groundwater gradient was 0.0010, or about 5.08 feet per mile. The gradient has been decreasing since May 2008 when discharges to the former impoundment ceased. The decrease of the groundwater

Annual 2019 Post-Closure Monitoring Report Former Section 29 Surface Impoundments
Lost Hills, California
I:\7000s\7580.000\Archive\7580-191.docx Page 5
gradient downgradient of the closed impoundments indicates that the mound of groundwater formed from the discharge of produced water from the impoundments is dissipating. The potentiometric surface map for this reporting period (Figure 2) indicates that groundwater flows to the east-northeast, similar to the flow direction observed during previous monitoring events. The depth to groundwater in the deeper Tulare Formation well 21MW-5 was 286.82 feet below the top of casing, and the calculated groundwater elevation was -2.08 feet NAVD88 (Table 2). The groundwater elevation in well 21MW-5 was 218.92 feet lower than in its companion well 21MW-4 (216.84 feet NAVD88), demonstrating the lack of a hydraulic connection between the Basal Alluvial Sand and the Tulare Formation at this location. There are insufficient data to calculate the horizontal gradient and flow direction for groundwater in the Tulare Formation. Hydrographs for the monitoring wells are provided in Appendix A. The comparative hydrograph (A-1) shows groundwater elevations measured in all seven monitoring wells. Hydrographs A-2 through A-8 display the groundwater elevation, screened interval, and pump intake location for each monitoring well. The hydrographs show a steady decline in water levels in all the wells since 2007. The decline is greater in the wells closest to the former impoundments (wells 29MW-1 and 29MW-2), as the mound of groundwater caused by previous produced water disposal dissipates. 4.2 Groundwater Quality The purging and field parameter data for the groundwater samples are summarized in Table 3, laboratory analytical results are summarized in Table 4, anion-cation balances are summarized in Table 5, and isotope data are summarized in Table 6. Groundwater sample data from October 2004 to the present are included in Tables 4 and 5. A piper diagram showing the geochemistry of the groundwater samples is shown on Figure 3, and a diagram of the oxygen and hydrogen isotope ratios is shown on Figure 4. The groundwater quality results for the April 2019 monitoring event are summarized in the following paragraphs. Field Parameters The field parameters measured during groundwater sampling during the April 2019 groundwater monitoring event are summarized as follows:
Alluvium Wells: The temperature of the groundwater samples collected from the wells monitoring the alluvium at the end of purging ranged from 22.1 to 22.9 degrees Celsius, and pH ranged from 6.36 to 7.48 standard units. Electrical conductivity (EC) measured in the field at the end of purging ranged from 3,534 micromhos per centimeter (µmhos/cm) to 20,590 µmhos/cm. These measurements are within the range of previous field parameter data for samples from these wells.
Tulare Formation Well: The temperature of the groundwater sample collected from the well monitoring the Tulare Formation at the end of purging was 23.7 degrees Celsius, and pH was 8.30 standard units. EC measured in the field at the end of purging was 3,235 µmhos/cm. These measurements are within the range of previous field parameter data for samples from this well.

Annual 2019 Post-Closure Monitoring Report Former Section 29 Surface Impoundments
Lost Hills, California
I:\7000s\7580.000\Archive\7580-191.docx Page 6
Inorganics and General Chemistry Analytical results of the groundwater samples collected during the April 2019 groundwater monitoring event are summarized as follows:
• Alluvium Wells
Boron concentrations ranged from 4.3 to 45 milligrams per liter (mg/L). These concentrations are similar to previous results.
Cations – Calcium concentrations ranged from 270 to 1,400 mg/L and magnesium concentrations ranged from 92 to 530 mg/L, both similar to previous results. Potassium concentrations ranged from 7.3 to 22 mg/L and sodium concentrations ranged from 620 to 4,300 mg/L, both similar to previous results. The calcium and sodium results were qualified with a “B,” indicating that calcium/sodium was detected in the method blank for these samples.
Anions – Bicarbonate alkalinity concentrations ranged from 130 to 620 mg/L, similar to previous results. Carbonate and hydroxide alkalinity concentrations were less than the detection limit in each of the sampled wells. Chloride concentrations ranged from 870 to 9,800 mg/L, and nitrate as nitrogen concentrations ranged from non-detect to 0.84 J mg/L (the “J” qualifier indicates an estimated result less than the reporting limit). Sulfate concentrations ranged from 1,500 to 2,800 mg/L. The anion concentrations are similar to previous results.
Total dissolved solids concentrations ranged from 3,800 to 21,000 mg/L, similar to previous results.
Laboratory EC measurements ranged from 5,300 to 34,000 µmhos/cm, similar to previous results.
Concentrations of inorganics and general chemistry analytes in WWQC samples collected from well 21MW-4 were similar to previous data for this well.
• Tulare Formation Well
The boron concentration was 3.3 mg/L, similar to previous results.
Cations – The calcium concentration was 230 B mg/L and the magnesium concentration was 57 mg/L, both similar to previous results. The potassium concentration was 8.2 mg/L and the sodium concentration was 490 B mg/L, both similar to previous results. The calcium and sodium results were qualified with a “B,” indicating that calcium/sodium was detected in the method blank for this sample.
Anions – The bicarbonate alkalinity concentration was 76 mg/L, similar to previous results. Carbonate and hydroxide alkalinity concentrations were less than the detection limit. The chloride concentration was 410 mg/L and nitrate as nitrogen was non-detect. The sulfate concentration was 1,400 mg/L. The anion concentrations are similar to previous results.
The total dissolved solids concentration was 2,900 mg/L, similar to previous results.
The laboratory EC measurement was 3,900 µmhos/cm, similar to previous results.
Anion-cation balances were calculated for groundwater samples collected from October 2004 to the present (Table 5). The balance results for the samples collected in April 2019 ranged from -8.02 to -4.39 percent. Figure 3 shows a piper diagram depicting the geochemistry of the groundwater samples

Annual 2019 Post-Closure Monitoring Report Former Section 29 Surface Impoundments
Lost Hills, California
I:\7000s\7580.000\Archive\7580-191.docx Page 7
collected from each monitoring point during its initial sampling and during the April 2019 monitoring event. Since well 29MW-1 has been dry since 2015, the 2014 results are shown. The piper diagram indicates that the most recent groundwater samples collected from wells 21MW-1, 29MW-1, and 29MW-2 are a sodium-chloride type water, and the groundwater samples collected from wells 21MW-2, 21MW-3, 21MW-4, and 21MW-5 are a sodium-sulfate type water (Figure 3). Petroleum Hydrocarbons Benzene, toluene, ethylbenzene, and xylenes were not detected at concentrations greater than their reporting limits in the groundwater samples collected during this monitoring event, except for downgradient well 29MW-2. Benzene was detected at a concentration of 17 micrograms per liter (µg/L), o-xylenes was detected at a concentration of 1.8 J μg/L, and m,p-xylenes was detected at a concentration of 0.59 J μg/L (the “J” qualifier indicates an estimated result less than the reporting limit.) These results are similar to previous results for well 29MW-2. Tentatively Identified Compounds The Standard Provisions and Reporting Requirements associated with the MRP specify the reporting of tentatively identified compounds (TICs) detected in the groundwater samples (RWQCB, 2003). No TICs were identified at concentrations greater than their reporting limits in the groundwater samples collected from the monitoring wells during this monitoring event. One TICs in the groundwater sample from downgradient well 29MW-2 was identified: 1,2,3-trimethylbenzene. All the other TICs identified in the groundwater samples were listed as “unknown.” The QA/QC samples also were analyzed for petroleum hydrocarbons and TICs. As shown in Table 4, petroleum hydrocarbons were not detected. TICs were identified in the field, equipment, and trip blank samples at concentrations less than their reporting limits. As with the groundwater samples, the TICs were listed as “unknown.” Oxygen and Hydrogen Isotopes The groundwater samples were analyzed for oxygen and hydrogen isotopes to help differentiate between unaffected native groundwater and groundwater mixed with produced water from the impoundments. Produced water is connate water (water originally present as the sediments were deposited) and native groundwater is meteoric water (water from rainfall that has recharged the aquifer). Each water type has a different signature of isotope values. The oxygen and hydrogen isotope results are presented in Table 6. The oxygen isotope values for the groundwater samples collected from the alluvium wells ranged from -2.1 to -8.1 delta units per parts per thousand, and the hydrogen isotopes ranged from -36.9 to -65.6 delta units per parts per thousand. The oxygen isotopes value for the groundwater sample collected from the Tulare Formation well was -8.8 delta units per parts per thousand, and the hydrogen isotopes was -66.7 delta units per parts per thousand. These values are similar to previous results (Table 6). As shown on Figure 4, the current isotope results for well 21MW-1 are similar to results for well 29MW-1. This is due to the produced water mixed with native groundwater migrating toward the northwest and away from the former impoundments. 4.3 Soil Moisture The soil samples collected on April 23, 2019, indicated a soil moisture content of 10.3 percent for the 1 to 1.5 foot sample and 12.3 percent for the 2.5 to 3 foot sample. The 2019 soil moisture content was

Annual 2019 Post-Closure Monitoring Report Former Section 29 Surface Impoundments
Lost Hills, California
I:\7000s\7580.000\Archive\7580-191.docx Page 8
compared with previous data, results of the 2008 vadose zone modeling performed as part of the Closure Plan Addendum (Geomatrix, 2008; AMEC Geomatrix, 2008), and field density tests performed in 2009 during closure construction. The 2019 soil moisture is within the range of previous data and the 2008 modeling, indicating that water is not infiltrating through the final cover and upper portions of the backfill material. Soil moisture data are summarized in Table 7. The laboratory analytical report and chain-of-custody record for the 2019 annual soil monitoring event are included in Appendix B. 4.4 Impoundment Cover Inspection Chevron personnel performed post-storm inspections of the impoundment cover on October 2, 2018, and March 12, 2019, following significant rain events in the vicinity of the impoundments. A Wood Principal Engineer reviewed the post-storm inspection documents provided by Chevron after each rain event and prepared recommendations for erosion repair. The repairs were implemented by Chevron personnel in November 2018 and April 2019, respectively. In December 2018 after the rainy season began, Chevron personnel re-seeded areas of the impoundment cover where vegetation was sparse. Chevron personnel also performed an annual inspection the cover of the closed impoundments on August 20, 2019. The inspection included photographing the impoundment cover and looking for evidence of erosion, ponding, or other degradation of the cover, as well as noting the condition of the vegetative cover. Inspection and repair documentation from Chevron and Wood is provided in Appendix D. Chevron plans to re-seed several areas of the impoundment cover where vegetation is sparse. The re-seeding is planned for November or December 2019, after the rainy season has begun.
5.0 Financial Assurance Review The WDRs require an annual review of the financial assurance mechanism and estimated costs for 30 years of post-closure maintenance and monitoring in order to meet the funding requirements for waste units regulated by the RWQCB. The 2019 annual review is described in the following subsections. 5.1 Monitoring and Reporting Costs Post-closure monitoring and reporting costs include:
• annual groundwater monitoring of seven wells,
• annual soil moisture sampling of the former impoundment cover,
• laboratory analysis of the groundwater and soil samples for the constituents specified in the WDRs,
• performing an annual engineering inspection of the former impoundment cover and preparing a report of repairs (if needed), as specified in the WDRs, and
• preparing an annual post-closure monitoring report for submission to the RWQCB.

Annual 2019 Post-Closure Monitoring Report Former Section 29 Surface Impoundments
Lost Hills, California
I:\7000s\7580.000\Archive\7580-191.docx Page 9
5.2 Maintenance Costs Post-closure maintenance costs include intermittent activities not performed annually. For purposes of this cost estimate, Wood assumed that each of the following activities would occur twice during the 30-year post-closure period:
• performing repairs of any damage to the former impoundment cover and reseeding the cover,
• rehabilitating/redeveloping the monitoring wells, and
• replacing the dedicated pump and tubing systems in the monitoring wells.
5.3 Summary of Estimated Costs Estimated costs for 30 years of post-closure maintenance and monitoring at the former impoundments are provided in Table 8. The total estimated cost is $826,499.37 in 2019 dollars. This estimate of post-closure maintenance and monitoring cost is adequately covered by the existing Irrevocable Standby Letter of Credit (U.S. Bank Letter of Credit No. SLCMMSP07892), issued in the amount of $850,000, to cover the post-closure maintenance and monitoring activities, in accordance with the WDRs.
6.0 Summary of 2019 Post-Closure Activities Chevron completed closure of the former impoundments in March 2009, and a Closure Report was submitted to the RWQCB in March 2009 (AMEC Geomatrix, 2009). The closure was approved by the RWQCB in an August 2010 approval letter (RWQCB, 2010). The approval letter also specified post-closure activities including annual groundwater monitoring, annual soil sampling, and annual reporting. Post-closure activities performed in 2019 are summarized in the following subsections. Groundwater Monitoring Well Network The groundwater monitoring well network at the former impoundments (Figure 2) is effective for monitoring groundwater conditions in the vicinity of the former impoundments and the nature and extent of the produced water mixed with groundwater downgradient of the former impoundments in both the Basal Alluvial Sand and the Tulare Formation. Of the downgradient wells, wells 29MW-2 and 21MW-1 are located along the axis of the produced water plume and wells 21MW-2 and 21MW-3 are located cross-gradient of the plume. Well 21MW-1 is located at the toe of the plume. Wells 21MW4 and 21MW-5 are the current sentinel wells located to the northeast, downgradient of the toe of the plume (Figure 2). Produced Water Plume The plume of produced water mixed with groundwater downgradient of the former impoundments is slowly migrating in the Basal Alluvial Sand away from the former impoundments, as noted on the time concentration charts in Appendix C. The analytical results indicate that the produced water from the former impoundments is contained within the Basal Alluvial Sand and has not migrated downward into the Tulare Formation. Compliance with the Monitoring and Reporting Program Groundwater monitoring in 2019 was performed in conformance with the WDRs and MRP. The results of monitoring performed in 2019 demonstrate compliance with requirements of the WDRs.

Annual 2019 Post-Closure Monitoring Report Former Section 29 Surface Impoundments
Lost Hills, California
I:\7000s\7580.000\Archive\7580-191.docx Page 10
7.0 Future Post-Closure Monitoring Activities Annual post-closure groundwater monitoring and soil moisture monitoring will be performed in April 2020. The cover of the former impoundments will be inspected before September 30, 2020, in accordance with the MRP. The annual 2020 post-closure monitoring report will be submitted to the RWQCB by October 31, 2020.
8.0 References AMEC Environment & Infrastructure, 2013, Sampling and Analysis Plan, Former Section 29 Surface
Impoundments, Lost Hills, California, July 31 (AMEC, 2013a).
AMEC Environment & Infrastructure, 2013, Water Quality Monitoring Plan, Former Section 29 Surface Impoundments, Lost Hills, California, July 31 (AMEC, 2013b).
AMEC Environment & Infrastructure, 2013, Post-Closure Maintenance and Monitoring Plan, Former Section 29 Surface Impoundments, Lost Hills, California, July 31 (AMEC, 2013c).
AMEC Geomatrix, Inc., 2008, Closure Plan Addendum II, Section 29 Surface Impoundments, Lost Hills Oil Field, Kern County, California, August 19 (AMEC Geomatrix, 2008).
AMEC Geomatrix, Inc., 2009, Closure Report, Section 29 Surface Impoundments, Lost Hills, California, March 30 (AMEC Geomatrix, 2009).
California Regional Water Quality Control Board, 2003, Standard Provisions and Reporting Requirements, Industrial Facilities for Title 27, September (RWQCB, 2003).
California Regional Water Quality Control Board, 2007, Groundwater Corrective Action Plan, Section 29 Surface Impoundments, Lost Hills Oil Field, Kern County, March 7 (RWQCB, 2007).
California Regional Water Quality Control Board, 2010, Closure – Section 29 Surface Impoundments, Lost Hills Oil Field, Kern County, August 4 (RWQCB, 2010).
California Regional Water Quality Control Board, 2013, Waste Discharge Requirements Order No. R5-2013-0056, Chevron USA, Inc., Former Section 29 Surface Impoundments, Lost Hills Oil Field, Kern County, May 31 (RWQCB, 2013a).
California Regional Water Quality Control Board, 2013, Review of Sampling and Analysis Plan, Former Section 29 Surface Impoundments, Lost Hills Oil Field, Kern County, August 27 (RWQCB, 2013b).
California Regional Water Quality Control Board, 2013, Review of Water Quality Monitoring Plan, Former Section 29 Surface Impoundments, Lost Hills Oil Field, Kern County, August 28 (RWQCB, 2013c).
California Regional Water Quality Control Board, 2013, Review of Post-Closure Maintenance and Monitoring Plan, Former Section 29 Surface Impoundments, Lost Hills Oil Field, Kern County, September 18 (RWQCB, 2013d).
Geomatrix Consultants, Inc., 2004, Additional Groundwater Investigation and Monitoring Well Installation, Section 29 Percolation Ponds, Lost Hills, California, December 16 (Geomatrix, 2004).
Geomatrix Consultants, Inc., 2006, Groundwater Corrective Action Plan, Section 29 Surface Impoundments, Lost Hills, California, June 30 (Geomatrix, 2006).
Geomatrix Consultants, Inc., 2008, Closure Plan Addendum, Section 29 Surface Impoundments, Lost Hills, California, June 20 (Geomatrix, 2008).

Table 1Well Construction Summary
Former Section 29 Surface ImpoundmentsLost Hills, California
Date Total DepthCasing
Diameter Slot SizeScreened Interval
Ground Surface Elevation
Top of Casing Elevation
Well1 Completed (feet bgs)2 (inches)3 (inches)3 (feet bgs)2 (feet NAVD88)4 (feet NAVD88)4
21MW-1 08/31/04 277 4 0.02 260 - 270 290.70 293.3921MW-2 09/09/04 260 4 0.02 240 - 260 290.10 292.5121MW-3 09/21/04 310 4 0.02 284 - 304 294.80 297.3721MW-4 11/21/14 350.3 4 0.02 320.7 - 349.9 282.80 285.1121MW-5 11/12/14 595.4 4 0.02 565.8 - 595.0 282.90 284.7429MW-1 12/19/00 204 5 0.02 106 - 136 363.20 365.7829MW-2 08/23/07 180.6 4 0.02 159.9 - 179.5 332.20 333.20
1. Well locations are shown on Figure 2.2. Total depth of well and depth of top and bottom of screened interval in feet below ground surface (bgs).3. Diameter of casing and size of slotted screen in inches. Section 21 wells were constructed of Schedule 80 polyvinyl chloride (PVC) casing.4. Surveyed elevation of ground surface and top of PVC casing in feet referencing North American Vertical Datum 1988 (NAVD88).
Wells were surveyed in 2007 by Berry & Associates Land Surveying and in 2014 by Nelms Surveying, Inc.
Page 1 of 1I:\7000s\7580.000\Archive\7580-192

Table 2Depth to Groundwater and Groundwater Elevation Data
Former Section 29 Surface ImpoundmentsLost Hills, California
21MW-1 09/24/04 293.39 63.99 229.4010/06/04 64.10 229.2902/07/06 63.74 229.6505/19/06 63.18 230.2108/03/06 63.55 229.8411/02/06 63.65 229.7402/15/07 63.47 229.9205/17/07 63.51 229.8808/02/07 64.04 229.3511/01/07 64.14 229.2502/07/08 64.54 228.8505/15/08 65.21 228.1808/19/08 65.43 227.9611/20/08 66.08 227.3102/05/09 66.31 227.0805/15/09 66.89 226.5008/06/09 67.00 226.3905/06/10 68.20 225.1905/25/11 68.44 224.9505/07/12 69.00 224.3911/27/12 69.81 223.5805/02/13 71.00 222.3904/30/14 71.80 221.5904/21/15 72.33 221.0604/14/16 73.55 219.8404/25/17 75.48 217.9104/23/18 74.58 218.8104/22/19 75.93 217.46
21MW-2 09/24/04 292.51 62.64 229.8710/06/04 62.79 229.7202/07/06 62.37 230.1405/19/06 61.81 230.7008/03/06 62.03 230.4811/02/06 62.30 230.21
GroundwaterElevation
(feet NAVD88)2Well1 Date
Top of Casing Elevation
(feet NAVD88)2
Depth to Groundwater (feet btoc)3
Page 1 of 5I:\7000s\7580.000\Archive\7580-192

Table 2Depth to Groundwater and Groundwater Elevation Data
GroundwaterElevation
(feet NAVD88)2Well1 Date
Top of Casing Elevation
(feet NAVD88)2
Depth to Groundwater (feet btoc)3
21MW-2 02/15/07 292.51 62.12 230.39(cont.) 05/17/07 62.15 230.36
08/02/07 62.67 229.8411/01/07 62.84 229.6702/07/08 63.16 229.3505/15/08 63.82 228.6908/19/08 64.08 228.4311/20/08 nm nm02/05/09 65.35 227.1605/15/09 65.82 226.6908/06/09 66.00 226.5105/06/10 67.00 225.5105/25/11 67.37 225.1405/07/12 67.83 224.6811/27/12 68.68 223.8305/02/13 69.77 222.7404/30/14 70.53 221.9804/21/15 71.31 221.2004/14/16 72.43 220.0804/25/17 73.32 219.1904/23/18 73.44 219.0704/22/19 74.84 217.67
21MW-3 09/24/04 297.37 68.91 228.4610/06/04 68.98 228.3902/07/06 68.56 228.8105/19/06 67.95 229.4208/03/06 68.22 229.1511/02/06 68.25 229.1202/15/07 68.23 229.1405/17/07 68.22 229.1508/02/07 68.76 228.6111/01/07 68.86 228.5102/07/08 69.27 228.1005/15/08 69.89 227.4808/19/08 70.14 227.2311/20/08 70.76 226.6102/05/09 71.00 226.3705/15/09 71.58 225.79
Page 2 of 5I:\7000s\7580.000\Archive\7580-192

Table 2Depth to Groundwater and Groundwater Elevation Data
GroundwaterElevation
(feet NAVD88)2Well1 Date
Top of Casing Elevation
(feet NAVD88)2
Depth to Groundwater (feet btoc)3
21MW-3 08/06/09 297.37 71.60 225.77(cont.) 05/06/10 72.70 224.67
05/25/11 72.90 224.4705/07/12 73.78 223.5911/27/12 74.26 223.1105/02/13 75.78 221.5904/30/14 76.35 221.0204/21/15 76.53 220.8404/14/16 77.64 219.7304/25/17 78.58 218.7904/23/18 78.61 218.7604/22/19 79.94 217.43
21MW-4 11/25/14 285.11 55.00 230.1104/21/15 64.94 220.1704/14/16 65.79 219.3204/25/17 66.78 218.3304/23/18 66.68 218.4304/22/19 68.27 216.84
21MW-5 11/19/14 284.74 274.84 9.9004/21/15 273.82 10.9204/14/16 280.11 4.6304/25/17 280.59 4.1504/23/18 279.06 5.6804/22/19 286.82 -2.08
29MW-1 10/06/04 365.78 96.12 269.6602/07/06 98.07 267.7105/19/06 97.93 267.8508/03/06 98.02 267.7611/02/06 98.29 267.4902/15/07 98.70 267.0805/17/07 98.07 267.7108/02/07 98.00 267.7811/01/07 98.50 267.2802/07/08 98.87 266.9105/15/08 98.99 266.7908/19/08 100.32 265.4611/20/08 101.77 264.01
Page 3 of 5I:\7000s\7580.000\Archive\7580-192

Table 2Depth to Groundwater and Groundwater Elevation Data
GroundwaterElevation
(feet NAVD88)2Well1 Date
Top of Casing Elevation
(feet NAVD88)2
Depth to Groundwater (feet btoc)3
29MW-1 02/05/09 365.78 102.87 262.91(cont.) 05/15/09 104.54 261.24
08/06/09 106.00 259.7805/06/10 110.00 255.7805/25/11 114.93 250.8505/07/12 119.30 246.4811/27/12 123.74 242.0405/02/13 127.09 238.6904/30/14 130.11 235.6704/21/15 132.24 233.5404/14/16 134.16 231.6204/25/17 Dry Dry04/23/18 Dry Dry04/22/19 Dry Dry
29MW-2 11/01/07 333.20 86.40 246.8002/07/08 86.58 246.6205/15/08 87.16 246.0408/19/08 87.83 245.3711/20/08 88.76 244.4402/05/09 89.60 243.6005/15/09 90.63 242.5708/06/09 91.49 241.7105/06/10 94.00 239.2005/25/11 96.28 236.9205/07/12 97.80 235.4011/27/12 100.20 233.0005/02/13 100.21 232.9904/30/14 101.70 231.5004/21/15 103.15 230.0504/14/16 105.18 228.0204/25/17 106.61 226.5904/23/18 107.45 225.7504/22/19 108.70 224.50
Endnotes provided on the next page.
Page 4 of 5I:\7000s\7580.000\Archive\7580-192

Table 2Depth to Groundwater and Groundwater Elevation Data
1. Well locations are shown on Figure 2.2. Surveyed elevation of the top of the well casing and groundwater elevation in feet referencing North American
Vertical Datum 1988 (NAVD88). Wells 21MW-1, 21MW-2, 21MW-3, 29MW-1, and 29MW-2 were surveyedin 2007 by Berry & Associates Land Surveying. Wells 21MW-4 and 21MW-5 were surveyed in 2014 byNelms Surveying, Inc.
3. Depth to groundwater measured in feet below the top of casing (btoc).
Page 5 of 5I:\7000s\7580.000\Archive\7580-192

Table 3Purge and Field Parameter Data
Former Section 29 Surface ImpoundmentsLost Hills, California
Well1 Date Time (mL)2 (°C)3 (s.u.)4 (µmhos/cm)5 Comments21MW-1 04/22/19 10:52 1,440 22.0 6.86 12,900 clear
10:59 2,880 22.1 6.93 12,920 clear11:06 4,320 22.1 6.99 12,930 clear11:13 5,760 22.1 7.00 12,940 clear, sample
21MW-2 04/22/19 11:42 1,369 23.0 6.78 3,753 clear11:49 2,738 23.0 7.26 3,740 clear11:56 4,107 23.0 7.32 3,748 clear12:02 5,476 22.9 7.43 3,749 clear, sample
21MW-3 04/22/19 9:57 1,578 22.5 6.91 3,519 clear10:04 3,156 22.6 7.29 3,508 clear10:11 4,734 22.6 7.35 3,528 clear10:18 6,312 22.6 7.35 3,534 clear, sample
21MW-4 04/22/19 14:25 1,893 22.9 7.46 4,974 clear14:35 3,785 22.8 7.47 4,971 clear14:45 5,677 22.7 7.48 4,968 clear14:55 7,570 22.8 7.48 4,965 clear, sample
21MW-5 04/22/19 13:29 3,118 23.6 8.41 3,300 clear13:40 6,235 23.5 8.40 3,243 clear13:51 9,352 23.6 8.32 3,238 clear14:02 12,470 23.7 8.30 3,235 clear, sample
29MW-1 04/22/19 Well was dry29MW-2 04/22/19 12:30 989 22.7 6.51 20,720 clear
12:37 1,978 22.9 6.45 20,680 clear12:44 2,967 22.9 6.38 20,610 clear12:51 3,956 22.7 6.36 20,590 clear, sample
1. Well locations are shown on Figure 2. 2. Cumulative water purged reported in milliliters (mL).3. Temperature in degrees Celsius (°C).4. pH recorded in standard pH units (s.u.).5. Electrical conductivity (EC) measured in micromhos per centimeter (µmhos/cm).
Temperature pH ECCumulative
Purged
Page 1 of 1I:\7000s\7580.000\Archive\7580-192

Table 4Laboratory Analytical Results
Former Section 29 Surface ImpoundmentsLost Hills, California
Inorganics and General Chemistry (mg/L)2 Petroleum Hydrocarbons4 (µg/L)Alkalinity (as CaCO3)
Date Boro
n
Pota
ssiu
m
Tota
l
Bica
r-bo
nate
Carb
onat
e
Hydr
oxid
e
Chlo
ride
Nitra
te-N
Sulfa
te
TDS
Benz
ene
Tolu
ene
o-Xy
lenes
21MW-1 10/06/04 4.8 480 160 11 840 140 170 ND na 1,510 0.32 1,680 4,100 na ND 0.34 ND na ND ND02/08/06 7.9 680 250 15 1,100 160 160 <2.0 <2.0 2,200 <0.75 1,700 8,500 9,200 <2.0 0.53 J <2.0 <2.0 0.71 J ND05/19/06 8.9 840 290 15 1,200 170 170 <2.0 <2.0 2,700 <1.13 1,900 7,500 10,000 <2.0 <2.0 <2.0 <2.0 <2.0 ND08/03/06 8.4 870 290 15 1,100 170 170 <2.0 <2.0 2,900 <1.13 2,100 8,600 10,000 <2.0 <2.0 <2.0 <2.0 <2.0 ND11/02/06 10 900 320 15 1,200 180 180 <2.0 <2.0 3,100 <0.11 1,900 8,600 11,000 <2.0 <2.0 <2.0 <2.0 <2.0 ND02/15/07 9.8 890 290 16 1,200 170 170 <2.0 <2.0 3,000 <0.11 1,900 9,300 11,000 <2.0 <2.0 <2.0 <2.0 <2.0 ND05/17/07 11 930 310 17 1,200 180 180 <2.0 <2.0 3,100 <0.11 1,900 11,000 12,000 <2.0 <2.0 <2.0 <2.0 <2.0 ND08/02/07 11 920 310 18 1,400 200 200 <2.0 <2.0 3,400 <1.1 1,900 8,900 12,000 <2.0 <2.0 <2.0 <2.0 <2.0 ND11/01/07 12 1,000 350 20 1,400 170 170 <2.0 <2.0 3,300 <1.1 1,800 9,000 12,000 <2.0 <2.0 <2.0 <2.0 <2.0 ND02/07/08 12 930 340 18 1,500 180 180 <2.0 <2.0 3,500 <2.2 1,900 8,900 12,000 <2.0 <2.0 <2.0 <2.0 <2.0 ND05/15/08 12 970 330 19 1,400 200 200 <2.0 <2.0 3,200 <1.1 1,900 9,000 12,000 <2.0 <2.0 <2.0 <2.0 <2.0 ND08/19/08 12 940 340 18 1,400 200 200 <2.0 <2.0 3,300 <0.11 1,800 10,000 13,000 <2.0 <2.0 <2.0 <2.0 <2.0 ND11/20/08 11 940 320 18 1,700 200 200 <2.0 <2.0 4,300 <1.1 2,100 11,000 13,000 <2.0 <2.0 <2.0 <2.0 <2.0 ND02/05/09 15 1,100 400 19 1,700 190 190 <2.0 <2.0 3,400 <1.1 1,900 11,000 13,000 <2.0 <2.0 <2.0 <2.0 <2.0 ND05/15/09 14 1,200 410 21 1,700 210 210 <2.0 <2.0 3,500 <0.22 2,000 11,000 15,000 <2.0 <2.0 <2.0 <2.0 <2.0 ND08/06/09 14 1,100 390 20 1,600 200 200 <2.0 <2.0 3,800 <0.55 1,900 12,000 14,000 <2.0 <2.0 <2.0 <2.0 <2.0 ND05/06/10 15 1,100 360 20 1,700 200 200 <2.0 <2.0 3,900 <2.2 1,900 12,000 15,000 <2.0 <2.0 <2.0 <2.0 <2.0 ND05/25/11 18 1,300 420 20 1,900 210 210 <2.0 <2.0 4,600 <1.1 2,400 13,000 11,000 <2.0 <2.0 <2.0 <2.0 <2.0 ND05/07/12 18 1,300 400 18 1,900 220 220 <4.0 <4.0 4,700 <10 1,800 13,000 17,000 <2.0 <2.0 <2.0 <2.0 <2.0 Naphthalene 0.4 J11/27/12 20 1,200 450 18 1,800 220 220 <4.0 <4.0 4,800 <25 2,500 14,000 15,000 <2.0 <2.0 <2.0 <2.0 <2.0 Methylene Chloride 2.8 J
Naphthalene 0.42 J123-TCB 0.31 J
05/02/13 21 1,300 450 19 2,100 220 220 <4.0 <4.0 4,800 <25 2,200 13,000 18,000 <2.0 <2.0 <2.0 <2.0 <2.0 Ethanol 220 N-MT-Formamide 3.8 TJN1-M-3-P-1H-Indene 5.4 TJN
04/30/14 22 1,300 370 18 2,000 240 240 <4.0 <4.0 4,700 <2.26 2,100 13,000 17,000 <2.0 <2.0 0.26 J <2.0 <2.0 Acetone 4.7 J04/21/15 21 1,400 B 420 20 2,400 250 250 <4.0 <4.0 5,400 1.42 2,000 14,000 19,000 <2.0 <2.0 <2.0 <2.0 <2.0 ND04/14/16 26 1,400 530 20 2,400 250 250 <4.0 <4.0 5,300 4.07 J 2,300 14,000 17,000 <2.0 <2.0 <2.0 <2.0 <2.0 ND04/28/17 22 1,300 450 18 2,400 250 250 <4.0 <4.0 5,400 1.74 J 2,200 14,000 17,000 <2.0 <2.0 <2.0 <2.0 <2.0 Unknown 2.6 TJ04/23/18 24 1,200 B 440 17 2,100 250 250 <4.0 <4.0 5,800 1.45 J 2,200 15,000 19,000 <2.0 <2.0 <2.0 <2.0 <2.0 Unknown (3 TICs) 2.7 to 11 TJ04/22/19 24 1,200 B 420 17 2,100 B 260 260 <4.0 <4.0 5,400 <5.65 2,200 13,000 18,000 <2.0 <2.0 <2.0 <2.0 <2.0 Unknown (3 TICs) 2.6 to 12 TJ
D 04/22/19 24 1,200 B 420 18 2,100 B 260 260 <4.0 <4.0 5,500 <5.65 2,200 13,000 18,000 <2.0 <2.0 <2.0 <2.0 <2.0 Unknown (1 TIC) 9.7 TJ
Calci
um
Sodi
um
Well1Groundwater Monitoring
Ethy
lben
zene
m,p
-Xyle
nes
Mag
nesiu
m
EC3
(µm
hos/
cm)
Tentatively Identified Compounds5
(µg/L)
Page 1 of 6I:\7000s\7580.000\Archive\7580-192

Table 4Laboratory Analytical Results
Inorganics and General Chemistry (mg/L)2 Petroleum Hydrocarbons4 (µg/L)Alkalinity (as CaCO3)
Date Boro
n
Pota
ssiu
m
Tota
l
Bica
r-bo
nate
Carb
onat
e
Hydr
oxid
e
Chlo
ride
Nitra
te-N
Sulfa
te
TDS
Benz
ene
Tolu
ene
o-Xy
lenes
Calci
um
Sodi
um
Well1 Ethy
lben
zene
m,p
-Xyle
nes
Mag
nesiu
m
EC3
(µm
hos/
cm)
Tentatively Identified Compounds5
(µg/L)21MW-2 10/06/04 4.0 300 94 45 920 100 73 24 na 1,160 0.39 1,540 4,000 na ND ND ND na ND ND
02/07/06 4.7 290 110 8.9 770 130 130 <2.0 <2.0 1,000 0.67 1,600 3,500 5,500 <2.0 <2.0 <2.0 <2.0 <2.0 ND05/19/06 5.0 310 100 13 870 120 120 <2.0 <2.0 950 1.3 1,500 3,900 5,600 <2.0 <2.0 <2.0 <2.0 <2.0 ND08/03/06 4.5 310 98 10 800 120 120 <2.0 <2.0 1,000 1.3 1,700 4,000 5,600 <2.0 <2.0 <2.0 <2.0 <2.0 ND11/02/06 4.9 320 100 9.3 830 110 110 <2.0 <2.0 1,100 1.4 1,500 3,700 5,700 <2.0 <2.0 <2.0 <2.0 <2.0 ND02/15/07 4.9 300 100 9.5 840 110 110 <2.0 <2.0 1,100 2.3 1,500 3,900 5,500 <2.0 <2.0 <2.0 <2.0 <2.0 ND05/17/07 5.0 300 100 11 840 120 120 <2.0 <2.0 960 1.4 1,400 4,200 5,700 <2.0 <2.0 <2.0 <2.0 <2.0 ND08/02/07 4.9 280 99 11 780 130 130 <2.0 <2.0 1,000 1.7 1,500 4,200 5,400 <2.0 <2.0 <2.0 <2.0 <2.0 ND11/01/07 5.1 310 110 11 880 96 96 <2.0 <2.0 990 0.88 1,400 4,100 5,400 <2.0 <2.0 <2.0 <2.0 <2.0 ND02/07/08 4.7 300 110 11 870 120 120 <2.0 <2.0 980 0.80 J 1,500 3,900 5,500 <2.0 <2.0 <2.0 <2.0 <2.0 ND05/15/08 4.7 290 100 10 840 120 120 <2.0 <2.0 990 0.66 1,500 3,800 5,400 <2.0 <2.0 <2.0 <2.0 <2.0 ND08/19/08 4.2 260 91 11 820 120 120 <2.0 <2.0 950 0.83 1,500 3,900 5,300 <2.0 <2.0 <2.0 <2.0 <2.0 ND11/20/08 ns ns ns ns ns ns ns ns ns ns ns ns ns ns ns ns ns ns ns ns02/05/09 4.9 310 110 10 870 120 120 <2.0 <2.0 870 0.38 J 1,400 3,900 5,200 <2.0 <2.0 <2.0 <2.0 <2.0 ND05/15/09 4.5 300 110 11 880 130 130 <2.0 <2.0 910 0.68 1,400 3,900 5,300 <2.0 <2.0 <2.0 <2.0 <2.0 ND08/06/09 4.6 280 110 11 890 120 120 <2.0 <2.0 910 0.85 1,400 4,000 5,200 <2.0 <2.0 <2.0 <2.0 <2.0 ND05/06/10 4.6 290 98 11 870 120 120 <2.0 <2.0 970 <0.55 1,400 3,900 5,200 <2.0 <2.0 <2.0 <2.0 <2.0 ND05/25/11 4.9 310 100 9.8 820 140 140 <2.0 <2.0 800 0.57 1,400 3,800 4,700 <2.0 <2.0 <2.0 <2.0 <2.0 ND05/07/12 4.4 320 94 10 860 120 120 <4.0 <4.0 920 <5.0 1,500 3,800 5,200 <2.0 <2.0 <2.0 <2.0 <2.0 ND11/27/12 5.0 280 110 9.4 710 120 120 <4.0 <4.0 880 <5.0 1,500 4,100 4,700 <2.0 <2.0 <2.0 <2.0 <2.0 Methylene Chloride 2.7 J05/02/13 5.0 310 100 11 790 120 120 <4.0 <4.0 870 <5.0 1,400 3,900 5,000 <2.0 <2.0 <2.0 <2.0 <2.0 ND04/30/14 4.7 280 95 9.7 770 ^ 130 130 <4.0 <4.0 960 <0.56 1,600 3,900 4,900 <2.0 <2.0 <2.0 <2.0 <2.0 ND04/21/15 4.2 260 B 84 9.4 750 140 140 <4.0 <4.0 880 0.32 1,300 3,700 5,600 <2.0 <2.0 <2.0 <2.0 <2.0 3-butyl-1-methyl-1H-Inden 14 TJN04/14/16 5.4 310 120 12 910 130 130 <4.0 <4.0 870 0.88 J 1,400 4,000 5,300 <2.0 <2.0 <2.0 <2.0 <2.0 ND04/28/17 4.5 290 95 10 800 130 130 <4.0 <4.0 1,000 0.29 J 1,700 3,900 5,100 <2.0 <2.0 <2.0 <2.0 <2.0 Unknown (2 TICs) 3.1 to 6.6 TJ04/23/18 4.3 260 B 91 11 680 120 120 <4.0 <4.0 870 <0.56 1,500 3,800 5,400 <2.0 <2.0 <2.0 <2.0 <2.0 Unknown (3 TICs) 3.4 to 11 TJ04/22/19 4.7 270 B 92 11 720 ^B 130 130 <4.0 <4.0 910 0.84 J 1,500 3,900 5,400 <2.0 <2.0 <2.0 <2.0 <2.0 Unknown (3 TICs) 3.9 to 12 TJ
21MW-3 10/08/04 4.2 340 100 8.4 690 150 180 ND na 934 ND 1,530 3,860 na ND ND ND na ND ND02/09/06 4.4 310 100 8.2 620 130 130 <2.0 <2.0 860 <0.75 1,500 2,200 5,000 <2.0 <2.0 <2.0 <2.0 <2.0 ND05/19/06 4.4 330 100 8.6 760 120 120 <2.0 <2.0 850 <1.13 1,400 3,200 5,200 <2.0 <2.0 <2.0 <2.0 <2.0 ND08/03/06 4.2 340 100 9.8 700 130 130 <2.0 <2.0 930 <0.56 1,600 3,800 5,100 <2.0 <2.0 <2.0 <2.0 <2.0 ND11/02/06 4.4 320 100 9.2 700 130 130 <2.0 <2.0 960 <0.11 1,500 3,700 5,200 <2.0 <2.0 <2.0 <2.0 <2.0 ND02/15/07 4.5 320 99 8.4 740 120 120 <2.0 <2.0 1,000 <0.11 1,500 3,700 5,100 <2.0 <2.0 <2.0 <2.0 <2.0 ND05/17/07 4.6 330 100 9.2 730 120 120 <2.0 <2.0 900 <0.11 1,400 4,000 5,400 <2.0 <2.0 <2.0 <2.0 <2.0 ND08/02/07 4.4 320 100 9.5 710 140 140 <2.0 <2.0 920 <0.55 1,300 3,900 5,200 <2.0 <2.0 <2.0 <2.0 <2.0 ND
Page 2 of 6I:\7000s\7580.000\Archive\7580-192

Table 4Laboratory Analytical Results
Inorganics and General Chemistry (mg/L)2 Petroleum Hydrocarbons4 (µg/L)Alkalinity (as CaCO3)
Date Boro
n
Pota
ssiu
m
Tota
l
Bica
r-bo
nate
Carb
onat
e
Hydr
oxid
e
Chlo
ride
Nitra
te-N
Sulfa
te
TDS
Benz
ene
Tolu
ene
o-Xy
lenes
Calci
um
Sodi
um
Well1 Ethy
lben
zene
m,p
-Xyle
nes
Mag
nesiu
m
EC3
(µm
hos/
cm)
Tentatively Identified Compounds5
(µg/L)21MW-3 11/01/07 4.7 340 110 10 830 120 120 <2.0 <2.0 880 <1.1 1,400 3,900 5,200 <2.0 <2.0 <2.0 <2.0 <2.0 ND
02/07/08 4.3 330 110 9.5 710 120 120 <2.0 <2.0 910 <1.1 1,400 3,900 5,300 <2.0 <2.0 <2.0 <2.0 <2.0 ND05/15/08 4.3 320 110 8.9 750 120 120 <2.0 <2.0 860 <1.1 1,400 3,800 4,900 <2.0 <2.0 <2.0 <2.0 <2.0 ND08/19/08 4.0 280 94 9.1 700 120 120 <2.0 <2.0 880 <0.11 1,500 3,700 5,200 <2.0 <2.0 <2.0 <2.0 <2.0 ND11/20/08 3.9 310 96 9.6 830 130 130 <2.0 <2.0 920 <1.1 1,500 3,900 5,000 <2.0 <2.0 <2.0 <2.0 <2.0 ND02/05/09 4.6 350 110 8.9 780 110 110 <2.0 <2.0 860 <1.1 1,500 3,700 5,000 <2.0 <2.0 <2.0 <2.0 <2.0 ND05/15/09 4.0 320 110 9.9 780 130 130 <2.0 <2.0 900 <0.11 1,500 3,800 5,000 <2.0 <2.0 <2.0 <2.0 <2.0 ND08/06/09 4.3 310 110 9.9 780 120 120 <2.0 <2.0 890 <0.22 1,400 3,600 5,200 <2.0 <2.0 <2.0 <2.0 <2.0 ND05/06/10 4.3 310 100 9.6 780 130 130 <2.0 <2.0 930 <1.1 1,500 3,800 5,200 <2.0 <2.0 <2.0 <2.0 <2.0 ND05/25/11 4.7 350 110 9.1 770 130 130 <2.0 <2.0 840 <0.55 1,600 3,800 4,700 <2.0 <2.0 <2.0 <2.0 <2.0 ND05/07/12 4.3 350 100 8.8 760 130 130 <4.0 <4.0 910 <5.0 1,500 3,700 5,200 <2.0 <2.0 <2.0 <2.0 <2.0 ND11/27/12 4.7 350 110 9.1 700 120 120 <4.0 <4.0 900 <5.0 1,500 4,100 4,600 <2.0 <2.0 <2.0 <2.0 <2.0 Methylene Chloride 2.0 J05/02/13 4.6 320 110 8.5 670 120 120 <4.0 <4.0 860 <5.0 1,400 3,900 5,000 <2.0 <2.0 <2.0 <2.0 <2.0 Unknown 4.6 TJ04/30/14 4.3 300 99 7.8 650 130 130 <4.0 <4.0 930 <0.56 1,600 3,900 4,800 <2.0 <2.0 <2.0 <2.0 <2.0 Anthranilic acid 2.6 TJN04/21/15 4.0 340 B 94 8.6 720 130 130 <4.0 <4.0 980 <0.11 1,300 3,700 5,400 <2.0 <2.0 <2.0 <2.0 <2.0 ND04/14/16 5.9 400 150 11 950 130 130 <4.0 <4.0 880 <1.13 1,500 3,800 5,200 <2.0 <2.0 <2.0 <2.0 <2.0 ND04/28/17 4.0 310 97 7.9 710 130 130 <4.0 <4.0 890 <0.56 1,600 F1 3,900 5,100 <2.0 <2.0 <2.0 <2.0 <2.0 ND04/23/18 4.4 310 B 98 8.1 640 120 120 <4.0 <4.0 970 <0.056 1,500 3,800 5,300 <2.0 <2.0 <2.0 <2.0 <2.0 ND04/22/19 4.3 300 B 92 7.8 620 B 130 130 <4.0 <4.0 870 <1.13 1,500 3,800 5,300 <2.0 <2.0 <2.0 <2.0 <2.0 Unknown (2 TICs) 3.1 to 6.7 TJ
21MW-4 11/25/14 4.4 310 90 7.5 720 120 120 <4.0 <4.0 780 <0.56 1,200 3,800 5,700 <2.0 5.7 <2.0 <2.0 <2.0 Carbon disulfide 0.66 JB2-methyl-2-propanol 9.5 J
04/30/15 4.4 320 96 10 810 150 150 <4.0 <4.0 920 <0.56 1,400 3,900 5,300 <2.0 <2.0 <2.0 <2.0 <2.0 Vinyl chloride 0.45 J04/14/16 5.4 360 130 10 930 140 140 <4.0 <4.0 910 0.81 J 1,500 4,100 5,400 <2.0 <2.0 <2.0 <2.0 <2.0 ND04/25/17 4.3 310 90 8.1 800 B 130 130 <4.0 <4.0 830 <1.13 1,700 3,900 5,700 <2.0 <2.0 <2.0 <2.0 <2.0 Unknown (3 TICs) 7.2 to 12 TJ04/23/18 4.1 290 B 92 7.5 680 130 130 <4.0 <4.0 890 <0.56 1,500 4,100 5,500 <2.0 <2.0 <2.0 <2.0 <2.0 Unknown (3 TICs) 3.7 to 11 TJ
(WWQC) 12/05/18 4.1 330 100 8.1 800 130 130 <3.0 <3.0 1,000 0.24 1,600 3,700 na na na na na na na04/22/19 4.4 300 B 94 7.3 720 ^B 130 130 <4.0 <4.0 940 <1.13 1,600 4,000 5,500 <2.0 <2.0 <2.0 <2.0 <2.0 Unknown (2 TICs) 8.3 to 26 TJ
(WWQC) 06/25/19 na na na na na na na na na na <1.1 na na na na na na na na na
21MW-5 11/21/14 3.1 280 56 4.4 500 77 77 <4.0 <4.0 480 <0.56 1,600 2,900 4,200 <2.0 3.8 <2.0 <2.0 <2.0 ND04/30/15 3.4 270 65 5.4 540 88 88 <4.0 <4.0 400 <0.23 1,400 2,900 3,800 <2.0 0.88 J <2.0 <2.0 <2.0 Vinyl chloride 0.47 J04/14/16 3.4 250 69 10 560 83 82 <4.0 <4.0 430 <0.56 1,400 2,900 3,900 <2.0 0.49 J <2.0 <2.0 <2.0 ND04/25/17 3.0 220 55 9.8 540 B 45 45 <4.0 <4.0 390 0.2 J 1,400 2,800 3,900 <2.0 2.1 <2.0 <2.0 <2.0 Unknown (3 TICs) 2.9 to 11 TJ04/23/18 3.1 230 B 57 5.8 470 82 82 <4.0 <4.0 410 <0.056 1,500 2,900 3,800 <2.0 <2.0 <2.0 <2.0 <2.0 Unknown (3 TICs) 3.3 to 11 TJ04/22/19 3.3 230 B 57 8.2 490 ^B 76 76 <4.0 <4.0 410 <0.56 1,400 2,900 3,900 <2.0 1.5 J <2.0 <2.0 <2.0 Unknown (3 TICs) 8.1 to 9.3 TJ
Page 3 of 6I:\7000s\7580.000\Archive\7580-192

Table 4Laboratory Analytical Results
Inorganics and General Chemistry (mg/L)2 Petroleum Hydrocarbons4 (µg/L)Alkalinity (as CaCO3)
Date Boro
n
Pota
ssiu
m
Tota
l
Bica
r-bo
nate
Carb
onat
e
Hydr
oxid
e
Chlo
ride
Nitra
te-N
Sulfa
te
TDS
Benz
ene
Tolu
ene
o-Xy
lenes
Calci
um
Sodi
um
Well1 Ethy
lben
zene
m,p
-Xyle
nes
Mag
nesiu
m
EC3
(µm
hos/
cm)
Tentatively Identified Compounds5
(µg/L)29MW-1 10/08/04 6.6 1,200 430 9.5 1,600 97 120 ND na 4,670 ND 2,410 12,900 na ND ND ND na ND ND
02/09/06 6.7 1,100 360 9.7 1,500 120 120 <2.0 <2.0 3,800 18 2,100 8,200 16,000 <2.0 <2.0 <2.0 <2.0 <2.0 ND05/19/06 6.0 1,100 360 9.0 1,600 86 86 <2.0 <2.0 4,100 19 2,200 12,000 15,000 <2.0 <2.0 <2.0 <2.0 <2.0 ND08/03/06 6.0 1,200 370 11 1,600 84 84 <2.0 <2.0 4,300 18 2,400 13,000 14,000 <2.0 <2.0 <2.0 <2.0 <2.0 ND11/02/06 7.5 1,300 420 11 1,900 68 68 <2.0 <2.0 5,500 16 2,200 13,000 15,000 <2.0 <2.0 <2.0 <2.0 <2.0 ND02/15/07 6.4 1,100 370 10 1,700 80 80 <2.0 <2.0 4,300 28 2,200 13,000 14,000 <2.0 <2.0 <2.0 <2.0 <2.0 ND05/17/07 6.8 1,200 390 12 1,700 84 84 <2.0 <2.0 4,300 17 2,200 15,000 17,000 <2.0 <2.0 <2.0 <2.0 <2.0 ND08/02/07 6.9 1,200 400 11 1,800 86 86 <2.0 <2.0 4,600 25 2,200 12,000 16,000 <2.0 <2.0 <2.0 <2.0 <2.0 ND11/01/07 7.0 1,200 400 14 1,900 96 96 <2.0 <2.0 4,400 17 2,200 11,000 16,000 <2.0 <2.0 <2.0 <2.0 <2.0 ND02/07/08 7.1 1,200 410 12 1,900 80 80 <2.0 <2.0 4,300 16 2,100 11,000 15,000 <2.0 <2.0 <2.0 <2.0 <2.0 ND05/15/08 6.9 1,200 380 14 1,800 84 84 <2.0 <2.0 4,000 15 2,100 12,000 14,000 <2.0 <2.0 <2.0 <2.0 <2.0 ND08/19/08 6.9 1,200 400 11 1,900 92 92 <2.0 <2.0 4,400 17 2,300 12,000 16,000 <2.0 <2.0 <2.0 <2.0 <2.0 ND11/20/08 6.2 1,100 360 11 1,900 88 88 <2.0 <2.0 4,600 21 2,400 12,000 16,000 <2.0 <2.0 <2.0 <2.0 <2.0 ND02/05/09 7.0 1,100 390 10 1,800 96 96 <2.0 <2.0 3,500 16 2,000 12,000 15,000 <2.0 <2.0 <2.0 <2.0 <2.0 ND05/15/09 6.8 1,300 450 12 2,100 76 76 <2.0 <2.0 3,700 18 2,100 11,000 16,000 <2.0 <2.0 <2.0 <2.0 <2.0 ND08/06/09 6.6 1,100 400 15 1,800 64 64 <2.0 <2.0 3,900 20 2,100 12,000 15,000 <2.0 <2.0 <2.0 <2.0 <2.0 ND05/06/10 6.5 1,100 370 13 1,700 80 80 <2.0 <2.0 3,900 21 2,200 12,000 7,000 <2.0 <2.0 <2.0 <2.0 <2.0 ND05/25/11 6.9 1,200 390 9.6 1,700 96 96 <2.0 <2.0 3,600 14 2,100 12,000 9,600 <2.0 <2.0 <2.0 <2.0 <2.0 ND05/07/12 6.6 1,200 340 8.9 1,500 80 80 <4.0 <4.0 3,500 53 2,100 10,000 13,000 <2.0 <2.0 <2.0 <2.0 <2.0 ND11/27/12 6.5 880 270 8.9 1,200 72 72 <4.0 <4.0 2,600 36 2,400 6,500 9,000 <2.0 <2.0 <2.0 <2.0 <2.0 Methylene Chloride 2.8 J05/02/13 5.5 680 160 7.9 990 72 72 <4.0 <4.0 1,800 3.8 2,200 7,000 8,300 <2.0 <2.0 <2.0 <2.0 <2.0 Unknown (3 TICs) 5.9 to 12 TJ04/30/14 5.5 730 140 8.8 1,200 76 76 <4.0 <4.0 1,500 1.81 J 2,000 6,500 7,800 <2.0 <2.0 <2.0 <2.0 <2.0 113T-1H-Indene 3.5 TJN04/21/15 Water level below pump intake - no sample was collected04/14/16 Water level below pump intake - no sample was collected04/28/17 Well dry04/23/18 Well dry04/22/19 Well dry
29MW-2 11/01/07 39 2,300 860 33 5,200 380 380 <2.0 <2.0 12,000 27 2,000 26,000 52,000 30 <2.0 <2.0 3.2 <2.0 Ethanol 150 02/07/08 43 2,300 920 34 5,600 460 460 <2.0 <2.0 12,000 20 2,200 25,000 42,000 43 <2.0 <2.0 3.6 <2.0 ND05/15/08 41 2,200 820 31 5,400 460 460 <2.0 <2.0 13,000 22 2,400 28,000 37,000 40 <2.0 <2.0 3.4 <2.0 ND08/19/08 44 2,000 810 27 5,800 450 450 <2.0 <2.0 13,000 21 2,300 31,000 48,000 46 <2.0 <2.0 3.8 <2.0 ND11/20/08 39 1,900 730 28 5,600 470 470 <2.0 <2.0 14,000 33 2,500 30,000 44,000 37 <2.0 <2.0 4.0 <2.0 ND02/05/09 50 1,900 780 34 5,400 510 510 <2.0 <2.0 11,000 13 2,400 27,000 43,000 44 <2.0 <2.0 3.9 <2.0 ND05/15/09 46 2,300 910 32 6,000 490 490 <2.0 <2.0 11,000 22 2,300 26,000 45,000 42 <2.0 <2.0 3.9 <2.0 ND08/06/09 45 1,700 700 32 5,500 520 520 <2.0 <2.0 11,000 16 2,400 29,000 43,000 40 <2.0 <2.0 3.3 <2.0 ND
Page 4 of 6I:\7000s\7580.000\Archive\7580-192

Table 4Laboratory Analytical Results
Inorganics and General Chemistry (mg/L)2 Petroleum Hydrocarbons4 (µg/L)Alkalinity (as CaCO3)
Date Boro
n
Pota
ssiu
m
Tota
l
Bica
r-bo
nate
Carb
onat
e
Hydr
oxid
e
Chlo
ride
Nitra
te-N
Sulfa
te
TDS
Benz
ene
Tolu
ene
o-Xy
lenes
Calci
um
Sodi
um
Well1 Ethy
lben
zene
m,p
-Xyle
nes
Mag
nesiu
m
EC3
(µm
hos/
cm)
Tentatively Identified Compounds5
(µg/L)29MW-2 05/06/10 48 1,400 540 30 8,700 620 620 <2.0 <2.0 10,000 4.5 2,900 23,000 38,000 47 <2.0 <2.0 2.5 <2.0 ND(cont.) 05/25/11 50 1,400 520 25 5,000 610 610 <2.0 <2.0 8,300 <2.2 3,100 21,000 26,000 42 <2.0 <2.0 2.0 <2.0 ND
05/07/12 39 1,300 420 21 4,200 520 520 <4.0 <4.0 7,600 <25 2,600 18,000 30,000 33 <2.0 <2.0 1.0 J <2.0 Propene 3.0 2-methyl-2-propanol 55 Vinyl Chloride 0.46 J5,5D-1,3C 3.2 TJNNaphthalene 1.2 JUnknown (2 TICs) 3.0 to 3.9 TJ
11/27/12 49 1,200 500 23 4,100 580 580 <4.0 <4.0 7,900 <50 2,900 23,000 30,000 35 <2.0 <2.0 1.9 J <2.0 Propene 4.0 Vinyl Chloride 0.84 J*2-methyl-2-propanol 68Methylene Chloride 2.7 JIsopropylbenzene 0.40 JNaphthalene 1.5 J
05/02/13 36 1,200 450 21 3,700 520 520 <4.0 <4.0 7,700 8.4 J 2,800 20,000 32,000 27 <2.0 <2.0 2.0 <2.0 2-methyl-2-propanol 59 135-TMB 4.6 TJNNaphthalene 1.4 J1-M-Naphthalene 5.0 TJN2-M-Naphthalene 5.8 TJNUnknown (9 TICs) 4.9 to 75 TJ
04/30/14 44 1,700 530 24 4,700 630 630 <4.0 <4.0 10,000 <5.65 2,700 24,000 37,000 29 <2.0 <2.0 3.1 0.53 J Acetone 5.5 J2-methyl-2-propanol 66 5,5D-1,3C 12 TJN135-TMB 8.7 TJN4(1H)Pyrimidinone 18 TJN2-methyl-2-Nonene 9.2 TJN1-methyl-Indan 13 TJN2I-13D-Cyclopentane 12 TJN3-Ethyl-3-octene 5.7 TJNPulegone 6.1 TJN3E-5M-1P-Cyclohexane 10 TJNPICyclohexane 7.5 TJN44D-2-ACyclohexanone 6.8 TJN23D-56-D-1H-Indene 7.3 TJN246T-Benzaldehyde 6.1 TJN
Page 5 of 6I:\7000s\7580.000\Archive\7580-192

Table 4Laboratory Analytical Results
Inorganics and General Chemistry (mg/L)2 Petroleum Hydrocarbons4 (µg/L)Alkalinity (as CaCO3)
Date Boro
n
Pota
ssiu
m
Tota
l
Bica
r-bo
nate
Carb
onat
e
Hydr
oxid
e
Chlo
ride
Nitra
te-N
Sulfa
te
TDS
Benz
ene
Tolu
ene
o-Xy
lenes
Calci
um
Sodi
um
Well1 Ethy
lben
zene
m,p
-Xyle
nes
Mag
nesiu
m
EC3
(µm
hos/
cm)
Tentatively Identified Compounds5
(µg/L)29MW-2 04/21/15 49 1,700 B 650 27 5,400 620 620 <4.0 <4.0 9,300 5.2 2,400 23,000 37,000 24 <2.0 <2.0 2.8 <2.0 Unknown (9 TICs) 4.1 to 11 TJ(cont.) 2-methyl-2-propanol 75
5,5D-1,3C 9.8 TJN135-TMB 6.6 TJN1-(3,4DMP)-Ethanone 5.8 TJN
04/14/16 58 1,700 770 27 4,400 610 610 <4.0 <4.0 9,400 10.84 J 2,700 23,000 35,000 20 <2.0 <2.0 2.8 <2.0 2-methyl-2-propanol 72 Unknown (11 TICs) 5.7 to 10 TJ1-(2,5DMP)-Ethanone 8.2 TJN1-M-Naphthalene 5.6 TJN
04/28/17 43 1,300 500 20 4,700 620 620 <4.0 <4.0 9,100 3.16 J 2,600 22,000 33,000 18 <2.0 <2.0 2.1 <2.0 Unknown (15 TICs) 4.9 to 12 TJ04/23/18 48 1,400 B 580 21 4,500 610 610 <4.0 <4.0 9,800 4.29 J 2,500 22,000 35,000 19 <2.0 <2.0 2.3 <2.0 5,5D-1,3C 10 TJN
Naphthalene 10 TJN1-(3,4DMP)-Ethanone 14 TJN12-DPCP 18 TJNUnknown (11 TICs) 9.7 to 19 TJ
04/22/19 45 1,400 B 530 22 4,300 ^B 620 620 <4.0 <4.0 9,800 <11.3 2,800 21,000 34,000 17 <2.0 <2.0 1.8 J 0.59 J 123-TMB 4.3 TJNUnknown (14 TICs) 3.3 to 11 TJ
04/22/19 na na na na na na na na na na na na na na <2.0 <2.0 <2.0 <2.0 <2.0 Unknown (2 TICs) 8.2 to 23 TJEquipment Blank 04/22/19 na na na na na na na na na na na na na na <2.0 <2.0 <2.0 <2.0 <2.0 Unknown (2 TICs) 8.2 to 30 TJTrip Blank 04/22/19 na na na na na na na na na na na na na na <2.0 <2.0 <2.0 <2.0 <2.0 Unknown (2 TICs) 8.1 to 23 TJ
1. Well locations are shown on Figure 2. D - duplicate sample. (WWQC) - sample collected from Chevron monitoring well by the Westside Water Quality Coalition.2. Dissolved boron, calcium, magnesium, potassium, and sodium analyzed using U.S. Environmental Protection Agency (EPA) Method 6010B. Total, bicarbonate, carbonate, and hydroxide alkalinity as calcium carbonate (CaCO3) analyzed using Standard Method 2320B.
Chloride, nitrate as nitrogen (N), and sulfate analyzed using EPA Method 300.0. Total dissolved solids (TDS) analyzed using EPA Method 160.1. Nitrate as N results were converted from Nitrate as Nitrate (NO3) by dividing the result by 4.4266. Results reportedin milligrams per liter (mg/L). ns - not sampled. ND - not detected. na - not analyzed for this constituent. < - less than the reporting limit as shown on the analytical data sheets. ^ - Calibration or MRL standard instrument-related QC exceeds control limits.B - constituent was detected in the method blank and the sample. F1 - MS and/or MSD recovery is outside acceptance limits.
3. Electrical Conductivity (EC) analyzed by EPA Method 120.1. Results reported in micromhos per centimeter (µmhos/cm).4. Petroleum hydrocarbons analyzed using EPA Method 8260B. Results reported in micrograms per liter (µg/L). J - an estimate, concentration is greater than the method detection limit but less than the reporting limit.5. EPA Method 8260B open scan for tentatively identified compounds. Results reported in µg/L. * - Laboratory control sample or control sample duplicate exceeded control limits. TJ - unknown compound, estimated value. N - presumptive evidence of material.
113T-1H-Indene - 1,1,3-trimethyl-1H-Indene 1-M-Naphthalene - 1-methyl Naphthalene 2-M-Naphthalene - 2-methyl Naphthalene123-TCB - 1,2,3-Trichlorobenzene 1-M-3-P-1H-Indene - 1-methyl-3-propyl-1H-Indene 3E-5M-1P-Cyclohexane - 3-ethyl-5-methyl-1-propyl-Cyclohexane
123-TMB - 1,2,3-Trimethylbenzene 12-DPCP - 1,2-Dipropylcyclopropene 44D-2-Acyclohexanone - 4,4-Dimethyl-2-allylcyclohexanone135-TMB - 1,3,5-Trimethylbenzene 23D-56-D-1H-Indene - 2,3-dihydro-5,6-dimethyl-1H-Indene 5,5D-1,3C - 5,5-dimethyl-1,3-Cyclohexanedione
1-(2,5DMP)-Ethanone - 1-(2,5-dimethylphenyl)-Ethanone 246T-Benzaldehyde - 2,4,6-trimethyl-Benzaldehyde N-MT-Formamide - N-methylthio Formamide1-(3,4DMP)-Ethanone - 1-(3,4-dimethylphenyl)-Ethanone 2I-13D-Cyclopentane - 2-isopropyl-1,3-dimethyl-Cyclopentane PICyclohexane - Pentylidenecyclohexane
QA/QC SamplesField Blank
Page 6 of 6I:\7000s\7580.000\Archive\7580-192

Table 5Anion-Cation Balance1
21MW-1 10/06/04 -4.5621MW-2 10/06/04 -1.8421MW-3 10/08/04 -5.4429MW-1 10/08/04 -5.5021MW-1 02/08/06 1.0221MW-1 D 02/08/06 0.9221MW-2 02/07/06 -5.7021MW-3 02/09/06 -6.6229MW-1 02/09/06 -1.5121MW-1 05/19/06 -0.3221MW-1 D 05/19/06 2.6021MW-2 05/19/06 1.1021MW-3 05/19/06 2.1629MW-1 05/19/06 -3.20Influent 05/19/06 0.91Final Impoundment 05/19/06 -4.2821MW-1 08/03/06 -5.4921MW-1 D 08/03/06 -3.4121MW-2 08/03/06 -6.0221MW-3 08/03/06 -5.3029MW-1 08/03/06 -4.1921MW-1 11/02/06 -2.6721MW-1 D 11/02/06 -3.3421MW-2 11/02/06 -3.2221MW-3 11/02/06 -5.2129MW-1 11/02/06 -5.47Influent 11/02/06 -4.31Final Impoundment 11/02/06 -5.3621MW-1 02/15/07 -2.7021MW-1 D 02/15/07 -2.3821MW-2 02/15/07 -3.7321MW-3 02/15/07 -4.5029MW-1 02/15/07 -3.3921MW-1 05/17/07 -2.3821MW-1 D 05/17/07 -0.05
Former Section 29 Surface ImpoundmentsLost Hills, California
Sample Location DateAnion-Cation Balance
(%)
Page 1 of 5I:\7000s\7580.000\Archive\7580-192
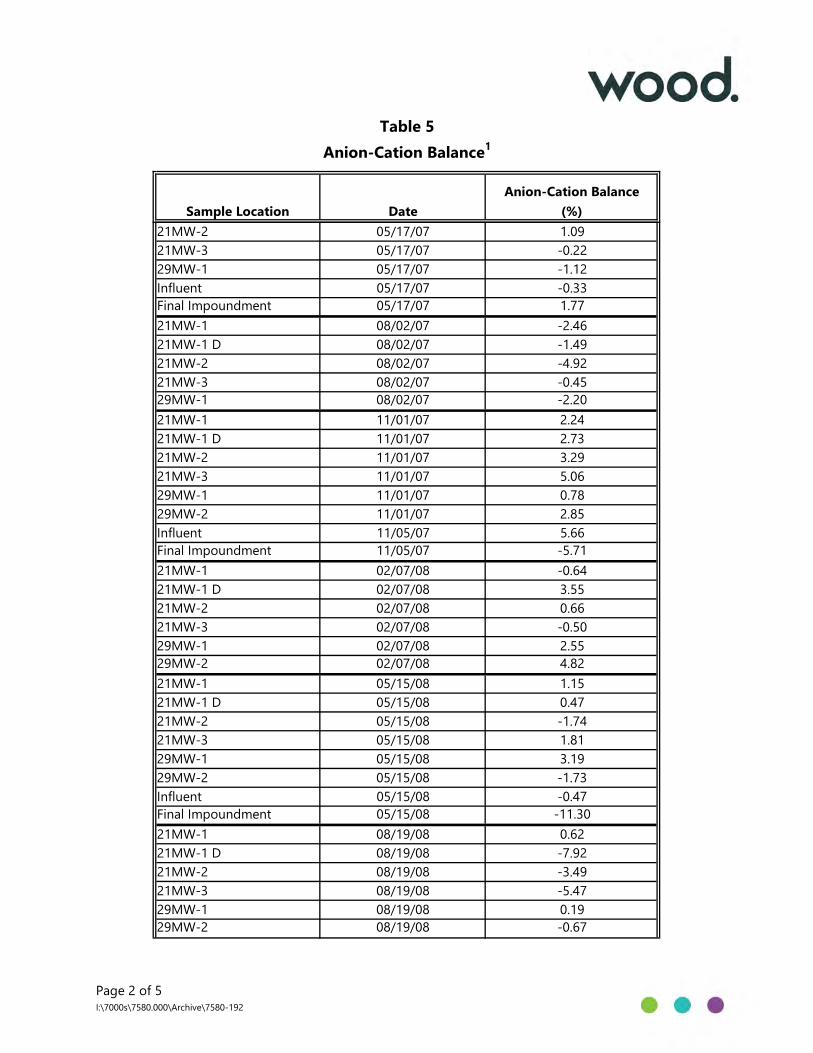
Table 5Anion-Cation Balance1
Sample Location DateAnion-Cation Balance
(%)21MW-2 05/17/07 1.0921MW-3 05/17/07 -0.2229MW-1 05/17/07 -1.12Influent 05/17/07 -0.33Final Impoundment 05/17/07 1.7721MW-1 08/02/07 -2.4621MW-1 D 08/02/07 -1.4921MW-2 08/02/07 -4.9221MW-3 08/02/07 -0.4529MW-1 08/02/07 -2.2021MW-1 11/01/07 2.2421MW-1 D 11/01/07 2.7321MW-2 11/01/07 3.2921MW-3 11/01/07 5.0629MW-1 11/01/07 0.7829MW-2 11/01/07 2.85Influent 11/05/07 5.66Final Impoundment 11/05/07 -5.7121MW-1 02/07/08 -0.6421MW-1 D 02/07/08 3.5521MW-2 02/07/08 0.6621MW-3 02/07/08 -0.5029MW-1 02/07/08 2.5529MW-2 02/07/08 4.8221MW-1 05/15/08 1.1521MW-1 D 05/15/08 0.4721MW-2 05/15/08 -1.7421MW-3 05/15/08 1.8129MW-1 05/15/08 3.1929MW-2 05/15/08 -1.73Influent 05/15/08 -0.47Final Impoundment 05/15/08 -11.3021MW-1 08/19/08 0.6221MW-1 D 08/19/08 -7.9221MW-2 08/19/08 -3.4921MW-3 08/19/08 -5.4729MW-1 08/19/08 0.1929MW-2 08/19/08 -0.67
Page 2 of 5I:\7000s\7580.000\Archive\7580-192

Table 5Anion-Cation Balance1
Sample Location DateAnion-Cation Balance
(%)21MW-1 11/20/08 -6.7521MW-1 D 11/20/08 -2.4221MW-2 11/20/08 ns21MW-3 11/20/08 -0.0529MW-1 11/20/08 -4.4429MW-2 11/20/08 -6.9421MW-1 02/05/09 7.6221MW-1 D 02/05/09 4.8021MW-2 02/05/09 5.4821MW-3 02/05/09 2.5229MW-1 02/05/09 7.1529MW-2 02/05/09 3.0521MW-1 05/15/09 7.5221MW-1 D 05/15/09 10.8221MW-2 05/15/09 4.2621MW-3 05/15/09 -0.0129MW-1 05/15/09 12.3829MW-2 05/15/09 9.9721MW-1 08/06/09 2.0621MW-1 D 08/06/09 -2.2221MW-2 08/06/09 3.9721MW-3 08/06/09 1.7829MW-1 08/06/09 3.1129MW-2 08/06/09 1.4121MW-1 05/06/10 1.7321MW-1 D 05/06/10 0.7621MW-2 05/06/10 1.4621MW-3 05/06/10 -1.8629MW-1 05/06/10 0.2229MW-2 05/06/10 16.3021MW-1 05/25/11 -0.3721MW-1 D 05/25/11 5.4321MW-2 05/25/11 4.4321MW-3 05/25/11 0.5329MW-1 05/25/11 5.7129MW-2 05/25/11 3.1021MW-1 05/07/12 1.8121MW-1 D 05/07/12 4.3821MW-2 05/07/12 1.48
Page 3 of 5I:\7000s\7580.000\Archive\7580-192

Table 5Anion-Cation Balance1
Sample Location DateAnion-Cation Balance
(%)21MW-3 05/07/12 -0.4429MW-1 05/07/12 1.8229MW-2 05/07/12 0.6721MW-1 11/27/12 -4.4121MW-1 D 11/27/12 3.0621MW-2 11/27/12 -3.8221MW-3 11/27/12 -1.5729MW-1 11/27/12 -3.5729MW-2 11/27/12 -2.5921MW-1 05/02/13 2.1421MW-1 D 05/02/13 0.0721MW-2 05/02/13 1.9721MW-3 05/02/13 -1.3029MW-1 05/02/13 -4.2129MW-2 05/02/13 -5.1621MW-1 04/30/14 0.4621MW-1 D 04/30/14 -0.2821MW-2 04/30/14 -6.3021MW-3 04/30/14 -9.2829MW-1 04/30/14 7.9429MW-2 04/30/14 -2.5421MW-1 04/21/15 2.5121MW-1 D 04/21/15 10.8221MW-2 04/21/15 -1.8321MW-3 04/21/15 -0.9421MW-4 04/30/15 1.0721MW-5 04/30/15 0.3029MW-1 04/21/15 Dry29MW-2 04/21/15 6.9821MW-1 04/14/16 3.7221MW-1 D 04/14/16 4.5421MW-2 04/14/16 7.3021MW-3 04/14/16 11.5121MW-4 04/14/16 7.4421MW-5 04/14/16 -0.1829MW-1 04/14/16 Dry29MW-2 04/14/16 0.8821MW-1 04/28/17 0.8521MW-1 D 04/28/17 -0.22
Page 4 of 5I:\7000s\7580.000\Archive\7580-192

Table 5Anion-Cation Balance1
Sample Location DateAnion-Cation Balance
(%)21MW-2 04/28/17 -7.1921MW-3 04/28/17 -5.6121MW-4 04/25/17 -2.9621MW-5 04/25/17 -2.2729MW-1 04/28/17 Dry29MW-2 04/28/17 -1.9721MW-1 04/23/18 -6.6321MW-1 D 04/23/18 -10.8421MW-2 04/23/18 -7.2421MW-3 04/23/18 -8.3621MW-4 04/23/18 -6.4321MW-5 04/23/18 -9.4529MW-1 04/23/18 Dry29MW-2 04/23/18 -4.1521MW-1 04/22/19 -4.3921MW-1 D 04/22/19 -5.0821MW-2 04/22/19 -6.1621MW-3 04/22/19 -8.0221MW-4 04/22/19 -7.0521MW-5 04/22/19 -5.6829MW-1 04/22/19 Dry29MW-2 04/22/19 -7.11
1. Sample locations are shown on Figure 2.Anion-Cation balances shown in percent (%). D - duplicate sample.
Page 5 of 5I:\7000s\7580.000\Archive\7580-192

Table 6Laboratory Analytical Results
Oxygen and Hydrogen IsotopesFormer Section 29 Surface Impoundments
Lost Hills, California
Sample1 Date Collected δ18O δD21MW-1 10/06/04 -8.6 -67.0
05/17/07 -8.2 -65.408/02/07 -7.2 -60.711/01/07 -7.9 -62.602/07/08 -7.9 -64.105/15/08 -7.8 -63.208/19/08 -7.9 -64.111/20/08 -7.0 -65.002/05/09 -6.9 -64.405/06/10 na na05/25/11 -6.6 -61.505/07/12 -6.6 -57.511/27/12 -6.5 -58.405/02/13 -6.5 -59.204/30/14 -6.1 -56.104/21/15 -6.1 -57.104/14/16 -6.3 -54.404/28/17 -6.1 -55.104/23/18 -5.7 -53.504/22/19 -5.7 -53.2
(D) 04/22/19 -5.7 -53.021MW-2 10/06/04 -8.3 -65.0
05/17/07 -8.8 -69.008/02/07 -8.0 -67.111/01/07 -9.0 -68.402/07/08 -9.0 -70.105/15/08 -9.1 -69.808/19/08 -9.8 -69.211/20/08 ns ns02/05/09 -8.3 -65.805/06/10 na na05/25/11 -8.3 -68.405/07/12 -8.5 -66.611/27/12 -8.3 -67.805/02/13 -8.4 -68.104/30/14 -8.3 -65.704/21/15 -8.2 -67.5
Results2
Page 1 of 3I:\7000s\7580.000\Archive\7580-192

Table 6Laboratory Analytical Results
Oxygen and Hydrogen Isotopes
Sample1 Date Collected δ18O δDResults2
21MW-2 04/14/16 -8.6 -65.3(cont.) 04/28/17 -8.4 -66.1
04/23/18 -8.1 -65.104/22/19 -8.1 -64.9
21MW-3 10/08/04 -8.0 -72.005/17/07 -9.6 -69.208/02/07 -8.2 -66.411/01/07 -8.8 -68.402/07/08 -9.0 -69.405/15/08 -9.1 -68.608/19/08 -8.9 -69.911/20/08 -8.4 -63.302/05/09 -8.4 -66.505/06/10 na na05/25/11 -8.4 -69.905/07/12 -8.5 -67.211/27/12 -8.2 -67.205/02/13 -8.6 -70.204/30/14 -8.2 -66.904/21/15 -8.4 -68.404/14/16 -8.4 -65.704/28/17 -8.5 -65.904/23/18 -7.9 -64.504/22/19 -8.0 -65.6
21MW-4 11/25/14 -8.7 -66.804/30/15 -8.1 -67.604/14/16 -8.3 -65.604/25/17 -8.1 -65.504/23/18 -8.6 -65.004/22/19 -8.0 -65.5
21MW-5 11/21/14 -8.7 -68.404/30/15 -8.7 -69.404/14/16 -9.0 -68.204/25/17 -9.0 -68.404/23/18 -9.1 -68.104/22/19 -8.8 -66.7
29MW-1 10/08/04 -6.4 -63.005/17/07 -8.0 -65.508/02/07 -7.3 -62.811/01/07 -7.3 -64.4
Page 2 of 3I:\7000s\7580.000\Archive\7580-192

Table 6Laboratory Analytical Results
Oxygen and Hydrogen Isotopes
Sample1 Date Collected δ18O δDResults2
29MW-1 02/07/08 -7.0 -64.4(cont.) 05/15/08 -7.4 -64.5
08/19/08 -7.3 -63.711/20/08 -7.0 -62.202/05/09 -6.9 -63.505/06/10 na na05/25/11 -6.8 -63.505/07/12 -7.0 -62.711/27/12 -7.3 -65.005/02/13 -7.6 -67.404/30/14 -8.0 -64.904/21/15 ns ns04/14/16 ns ns04/28/17 ns ns04/23/18 ns ns04/22/19 ns ns
29MW-2 11/01/07 -3.0 -43.202/07/08 -2.9 -40.805/15/08 -2.6 -40.808/19/08 -2.5 -40.111/20/08 -2.2 -39.202/05/09 -2.6 -39.605/06/10 na na05/25/11 -2.1 -40.505/07/12 -2.9 -42.611/27/12 -2.4 -40.905/02/13 -3.2 -44.604/30/14 -2.2 -38.004/21/15 -2.1 -39.904/14/16 -2.6 -38.404/28/17 -2.5 -38.804/23/18 -2.4 -38.204/22/19 -2.1 -36.9
1. Sample locations are shown on Figure 2. (D) - duplicate sample.2. Analysis of oxygen (δ18O) and hydrogen (δD) isotopes using method CF-IRMS. Calculated using Vienna SMOW (Standard Mean Ocean Water) as the zero point. Isotopic data reported as delta units (δ) per parts per thousand (0/00), where: δ(0/00) = [ [ (18O/16O)sample - (18O/16O)standard] /(18O/16O)standard] x 1000 ns - well was not sampled. na - not analyzed for this constituent.
Page 3 of 3I:\7000s\7580.000\Archive\7580-192

Table 7Soil Moisture Data
Former Section 29 Surface ImpoundmentsLost Hills, California
Soil Moisture Content at Depth, in percentDate 1 to 1.5 feet 2.5 to 3 feet
2008 HYDRUS Model 14 (at 0.5 meter) 5.0 (at 1 meter)2009 Closure Construction 12.1 (average near current soil sampling location)
10/01/10 11.3 nm08/25/11 9.9 13.508/20/12 9.7 10.008/22/13 10.7 11.804/30/14 5.8 6.904/21/15 8.3 10.404/14/16 10.6 12.304/25/17 10.4 13.604/24/18 9.1 11.804/23/19 10.3 12.3
Page 1 of 1I:\7000s\7580.000\Archive\7580-192

Table 8Summary of Post-Closure Maintenance and Monitoring Costs
Former Section 29 Surface ImpoundmentsLost Hills, California
Description Cost Total DescriptionConsultant costs, per year $17,118.25
times 30 years $513,547.50 Monitoring, cover inspection, reportingChevron costs, per year $3,735.92
times 30 years $112,077.60 Cover repairs, project managementIntermittent costs, per 15 years $46,535.00 Cover repair/reseeding subcontractor,
twice in 30 years $93,070.00 pump replacement, well rehabilitationSubtotal, All Costs $718,695.10
Plus Contingency (15%) $107,804.27TOTAL $826,499.37 Costs in 2019 dollars
Page 1 of 1I:\7000s\7580.000\Archive\7580-192

SITE
California
)
SITE
Lost HillsLo
s Rios
St
Lost
Hills
Rd
R 345
R 345
R 345
Brown M
ateria
l Rd
Holloway Rd
G P Rd
Lost
Hills
Rd
Paso Robles Hwy
Site Location MapFormer Section 29 Surface Impoundments
Lost Hills, California
1Project No.: 007580
Figure
Date: 7/10/2018By: SCM0 2,000 4,0001,000Approximate Scale in Feet
0 500 1,000250Approximate Scale in Meters
Dat
e: 7
/10/
2018
Pr
inte
d by
: sco
tt.m
itche
ll2Pa
th: N
:\700
0s\0
0758
0\gi
s\m
aps\
2018
\Ann
ual_
Cov
er_I
nspe
ctio
n\_f
ig01
_Site
Loca
tionM
ap.m
xd

Basemap modified from ESRI's online content sharingprogram, World Imagery Layer, 1-meter resolutionNAIP 2014 aerial imagery, dated June 19, 2014.
<
<
<
<
<
<!>
<
<
<
<
<
<
E
Lost HillsOil Fields
Former Section 29Surface Impoundments
218
21MW-5(-2.08)
21MW-2217.67
21MW-4216.84
21MW-1217.46
21MW-3217.43
29MW-1Dry
29MW-2224.50
2120
2829
22
1617
27
15
222
224
220
<
21MW-3218.76
E
Explanation
Notes:1. Soil sample location is at southern end of former pond area. Location is 150 feet northeastward, perpendicular from end of southwestern fence and is marked with a rebar stake and traffic cone.2. Latitude and longitude were marked in October 2012 using a hand-held GPS. Sample location is Latitude 35.63954, Longitude -119.72985.
(5.68)
Monitoring well and groundwater elevation in feet referencing North American Vertical Datum 1988 (NAVD88) measured on April 22, 2019
Approximate soil sample location
Well 21MW-5 is completed in adifferent aquifer; groundwater elevationdata were not used to prepare thepotentiometric surface
Line of equal elevation ofpotentiometric surface, in feet NAVD88.Contours are dashed whereapproximately located
Groundwater flow direction
222
Site Plan and Potentiometric Surface MapFormer Section 29 Surface Impoundments
Lost Hills, California
2Project No.: 007580
Figure
Date: 10/18/2019By: EMC
Dat
e: 1
0/18
/201
9 P
rinte
d by
: eliz
abet
h.ch
apm
anPa
th: N
:\700
0s\0
0758
0\gi
s\m
aps\
2018
\Ann
ual_
Mon
itorin
g_R
epor
t\_fig
02_S
P_Po
tent
io.m
xd
0 1,000 2,000500Approximate Scale in Feet
0 250 500125Meters

I:\7000s\7580.000\Archive\7580-192.xlsx
Notes: Samples collected from each monitoring point during initial sampling and in April 2019. Well 29MW-1 has been dry since 2015, so 2014 results are shown.
06/07/2019LKP 0075802017
Piper Diagram, Water SamplesInitial Sampling and April 2019
Former Section 29 Surface ImpoundmentsLost Hills, California
3Date: By: Project No.:
Figure

I:\7000s\7580.000\Archive\7580-192.xlsx
-100
-90
-80
-70
-60
-50
-40
-30
-20
-10
0
-12 -11 -10 -9 -8 -7 -6 -5 -4 -3 -2 -1 0
Hydr
ogen
Isot
ope R
atio
Oxygen Isotope Ratio
21MW-1 21MW-2 21MW-3 21MW-421MW-5 29MW-1 29MW-2 MWL
MWL
Explanation:Isotope data from 2016 to 2019 are shown. Well 29MW-1 has been dry since 2015; isotope data are from 2011 to 2014. Most recent data point is enlarged.Calculated using Vienna SMOW (Standard Mean Ocean Water) as the zero point. Isotopic data reported as delta units (δ) per parts per thousand (0/00), where:
δ(0/00) = [ [ (18O/16O)sample - (18O/16O)standard] /(18O/16O)standard] x 1000 MWL - Meteoric water line; a linear relationship described for continental precipitation whereby:
δ2H = (8 x δ18O) + 10
06/07/2019LKP 0075802017
Oxygen and Hydrogen Isotope RatiosFormer Section 29 Surface Impoundments
Lost Hills, California
4Date: By: Project No.:
Figure

Appendix A Hydrographs

I:\7000s\7580.000\Archive\7580-192
-25
0
25
50
75
100
125
150
175
200
225
250
275
300
Jan-
04
Jan-
05
Jan-
06
Jan-
07
Jan-
08
Jan-
09
Jan-
10
Jan-
11
Jan-
12
Jan-
13
Jan-
14
Jan-
15
Jan-
16
Jan-
17
Jan-
18
Jan-
19
Jan-
20
Gro
undw
ater
Ele
vatio
n, F
eet A
bove
Mea
n Se
a Le
vel
21MW-1 21MW-2 21MW-3 21MW-4
21MW-5 29MW-1 29MW-2
Explanation
06/07/2019LKP 0075802017
Comparative HydrographGroundwater Monitoring Wells
Former Section 29 Surface ImpoundmentsLost Hills, California
A-1Date: By: Project No.:
Figure

I:\7000s\7580.000\Archive\7580-192
0
25
50
75
100
125
150
175
200
225
250
Jan-
04
Jan-
05
Jan-
06
Jan-
07
Jan-
08
Jan-
09
Jan-
10
Jan-
11
Jan-
12
Jan-
13
Jan-
14
Jan-
15
Jan-
16
Jan-
17
Jan-
18
Jan-
19
Jan-
20
Elev
atio
n, F
eet A
bove
Mea
n Se
a Le
vel
21MW-1 Top of Screened Interval
Bottom of Screened Interval Pump Inlet
Explanation
06/07/2019LKP 0075802017
HydrographMonitoring Well 21MW-1
Former Section 29 Surface ImpoundmentsLost Hills, California
A-2Date: By: Project No.:
Figure

I:\7000s\7580.000\Archive\7580-192
0
25
50
75
100
125
150
175
200
225
250
Jan-
04
Jan-
05
Jan-
06
Jan-
07
Jan-
08
Jan-
09
Jan-
10
Jan-
11
Jan-
12
Jan-
13
Jan-
14
Jan-
15
Jan-
16
Jan-
17
Jan-
18
Jan-
19
Jan-
20
Elev
atio
n, F
eet A
bove
Mea
n Se
a Le
vel
21MW-2 Top of Screened Interval
Bottom of Screened Interval Pump Inlet
Explanation
21MW-2 wellhead was damaged in November 2008; depth to water could not be measured. 06/07/2019LKP 0075802017
HydrographMonitoring Well 21MW-2
Former Section 29 Surface ImpoundmentsLost Hills, California
A-3Date: By: Project No.:
Figure

I:\7000s\7580.000\Archive\7580-192
-25
0
25
50
75
100
125
150
175
200
225
250
Jan-
04
Jan-
05
Jan-
06
Jan-
07
Jan-
08
Jan-
09
Jan-
10
Jan-
11
Jan-
12
Jan-
13
Jan-
14
Jan-
15
Jan-
16
Jan-
17
Jan-
18
Jan-
19
Jan-
20
Elev
atio
n, F
eet A
bove
Mea
n Se
a Le
vel
21MW-3 Top of Screened Interval
Bottom of Screened Interval Pump Inlet
Explanation
06/07/2019LKP 0075802017
HydrographMonitoring Well 21MW-3
Former Section 29 Surface ImpoundmentsLost Hills, California
A-4Date: By: Project No.:
Figure

I:\7000s\7580.000\Archive\7580-192
-75
-50
-25
0
25
50
75
100
125
150
175
200
225
250
Jan-
04
Jan-
05
Jan-
06
Jan-
07
Jan-
08
Jan-
09
Jan-
10
Jan-
11
Jan-
12
Jan-
13
Jan-
14
Jan-
15
Jan-
16
Jan-
17
Jan-
18
Jan-
19
Jan-
20
Elev
atio
n, F
eet A
bove
Mea
n Se
a Le
vel
21MW-4 Top of Screened Interval
Bottom of Screened Interval Pump Inlet
Explanation
06/07/2019LKP 0075802017
HydrographMonitoring Well 21MW-4
Former Section 29 Surface ImpoundmentsLost Hills, California
A-5Date: By: Project No.:
Figure

I:\7000s\7580.000\Archive\7580-192
-325
-300
-275
-250
-225
-200
-175
-150
-125
-100
-75
-50
-25
0
25
Jan-
04
Jan-
05
Jan-
06
Jan-
07
Jan-
08
Jan-
09
Jan-
10
Jan-
11
Jan-
12
Jan-
13
Jan-
14
Jan-
15
Jan-
16
Jan-
17
Jan-
18
Jan-
19
Jan-
20
Elev
atio
n, F
eet A
bove
Mea
n Se
a Le
vel
21MW-5 Top of Screened Interval
Bottom of Screened Interval Pump Inlet
Explanation
06/07/2019LKP 0075802017
HydrographMonitoring Well 21MW-5
Former Section 29 Surface ImpoundmentsLost Hills, California
A-6Date: By: Project No.:
Figure

I:\7000s\7580.000\Archive\7580-192
200
225
250
275
300
Jan-
04
Jan-
05
Jan-
06
Jan-
07
Jan-
08
Jan-
09
Jan-
10
Jan-
11
Jan-
12
Jan-
13
Jan-
14
Jan-
15
Jan-
16
Jan-
17
Jan-
18
Jan-
19
Jan-
20
Elev
atio
n, F
eet A
bove
Mea
n Se
a Le
vel
29MW-1 Top of Screened Interval
Bottom of Screened Interval Pump Inlet
Explanation
06/07/2019LKP 0075802017
HydrographMonitoring Well 29MW-1
Former Section 29 Surface ImpoundmentsLost Hills, California
A-7Date: By: Project No.:
Figure

I:\7000s\7580.000\Archive\7580-192
Explanation
125
150
175
200
225
250
275
Jan-
04
Jan-
05
Jan-
06
Jan-
07
Jan-
08
Jan-
09
Jan-
10
Jan-
11
Jan-
12
Jan-
13
Jan-
14
Jan-
15
Jan-
16
Jan-
17
Jan-
18
Jan-
19
Jan-
20
Elev
atio
n, F
eet A
bove
Mea
n Se
a Le
vel
29MW-2 Top of Screened Interval
Bottom of Screened Interval Pump Inlet
Explanation
06/07/2019LKP 0075802017
HydrographMonitoring Well 29MW-2
Former Section 29 Surface ImpoundmentsLost Hills, California
A-8Date: By: Project No.:
Figure

Appendix B Laboratory Analytical Reports and Chain-of-Custody Records

ANALYTICAL REPORTEurofins TestAmerica, Irvine17461 Derian AveSuite 100Irvine, CA 92614-5817Tel: (949)261-1022
Laboratory Job ID: 440-239555-1Client Project/Site: Chevron Lost Hills Sect 29
For:Wood E&I Solutions Inc1281 E Alluvial Ave, Ste 101Fresno, California 93720
Attn: Ms. Leslie Purvis
Authorized for release by:5/23/2019 12:25:29 PM
Saman Taeidi, Project Manager I(949)[email protected]
The test results in this report meet all 2003 NELAC and 2009 TNI requirements for accreditedparameters, exceptions are noted in this report. This report may not be reproduced except in full,and with written approval from the laboratory. For questions please contact the Project Managerat the e-mail address or telephone number listed on this page.
This report has been electronically signed and authorized by the signatory. Electronic signature isintended to be the legally binding equivalent of a traditionally handwritten signature.
Results relate only to the items tested and the sample(s) as received by the laboratory.
1
2
3
4
5
6
7
8
9
10
11
12
13
14

Table of Contents
Client: Wood E&I Solutions IncProject/Site: Chevron Lost Hills Sect 29
Laboratory Job ID: 440-239555-1
Page 2 of 47Eurofins TestAmerica, Irvine
5/23/2019
Cover Page . . . . . . . . . . . . . . . . . . . . . . . . . . . . . . . . . . . . . . . . . . . . . . 1
Table of Contents . . . . . . . . . . . . . . . . . . . . . . . . . . . . . . . . . . . . . . . . . 2
Sample Summary . . . . . . . . . . . . . . . . . . . . . . . . . . . . . . . . . . . . . . . . . 3
Case Narrative . . . . . . . . . . . . . . . . . . . . . . . . . . . . . . . . . . . . . . . . . . . 4
Client Sample Results . . . . . . . . . . . . . . . . . . . . . . . . . . . . . . . . . . . . . . 5
Method Summary . . . . . . . . . . . . . . . . . . . . . . . . . . . . . . . . . . . . . . . . . 13
Lab Chronicle . . . . . . . . . . . . . . . . . . . . . . . . . . . . . . . . . . . . . . . . . . . . 14
QC Sample Results . . . . . . . . . . . . . . . . . . . . . . . . . . . . . . . . . . . . . . . . 17
QC Association Summary . . . . . . . . . . . . . . . . . . . . . . . . . . . . . . . . . . . 25
Definitions/Glossary . . . . . . . . . . . . . . . . . . . . . . . . . . . . . . . . . . . . . . . 28
Certification Summary . . . . . . . . . . . . . . . . . . . . . . . . . . . . . . . . . . . . . . 29
Subcontract Data . . . . . . . . . . . . . . . . . . . . . . . . . . . . . . . . . . . . . . . . . 30
Chain of Custody . . . . . . . . . . . . . . . . . . . . . . . . . . . . . . . . . . . . . . . . . . 45
Receipt Checklists . . . . . . . . . . . . . . . . . . . . . . . . . . . . . . . . . . . . . . . . . 47
1
2
3
4
5
6
7
8
9
10
11
12
13
14

Sample SummaryJob ID: 440-239555-1Client: Wood E&I Solutions Inc
Project/Site: Chevron Lost Hills Sect 29
Lab Sample ID Client Sample ID ReceivedCollectedMatrix Asset ID
440-239555-1 21MW-3 Water 04/22/19 10:18 04/22/19 19:30
440-239555-2 21MW-1 Water 04/22/19 11:13 04/22/19 19:30
440-239555-3 21MW-1-DUP Water 04/22/19 11:20 04/22/19 19:30
440-239555-4 21MW-2 Water 04/22/19 12:02 04/22/19 19:30
440-239555-5 29MW-2 Water 04/22/19 12:51 04/22/19 19:30
440-239555-6 21MW-5 Water 04/22/19 14:02 04/22/19 19:30
440-239555-7 21MW-4 Water 04/22/19 14:55 04/22/19 19:30
440-239555-8 EB Water 04/22/19 15:15 04/22/19 19:30
440-239555-9 FB Water 04/22/19 15:20 04/22/19 19:30
440-239555-10 TB Water 04/22/19 00:01 04/22/19 19:30
Eurofins TestAmerica, Irvine
Page 3 of 47 5/23/2019
1
2
3
4
5
6
7
8
9
10
11
12
13
14

Case NarrativeClient: Wood E&I Solutions Inc Job ID: 440-239555-1Project/Site: Chevron Lost Hills Sect 29
Job ID: 440-239555-1
Laboratory: Eurofins TestAmerica, Irvine
Narrative
Job Narrative
440-239555-1
Receipt
The samples were received on 4/22/2019 7:30 PM; the samples arrived in good condition, properly preserved and, where required, on ice. The temperature of the cooler at receipt was 4.6º C.
GC/MS VOA Method(s) 8260B: Internal standard (ISTD) response for TBA-d9 for the following sample was below outside acceptance criteria: (MB
440-543336/4). This ISTD does not correspond to any of the requested target compounds; therefore, the data have been reported.
Method(s) 8260B: The continuing calibration verification (CCV) associated with batch 440-543336 recovered above the upper control limit for Toluene and Ethylbenzene. The samples associated with this CCV were non-detects for the affected analytes; therefore, the data have
been reported. The following samples are impacted: 21MW-3 (440-239555-1), 21MW-1 (440-239555-2), 21MW-1-DUP (440-239555-3), 21MW-2 (440-239555-4), 29MW-2 (440-239555-5), 21MW-5 (440-239555-6) and (CCVIS 440-543336/2).
No additional analytical or quality issues were noted, other than those described above or in the Definitions/Glossary page.
HPLC/IC Method(s) 300.0: The following samples were diluted for Nitrate as NO3 due to the nature of the sample matrix: 21MW-3 (440-239555-1),
21MW-1 (440-239555-2), 21MW-1-DUP (440-239555-3), 21MW-2 (440-239555-4), 29MW-2 (440-239555-5), 21MW-5 (440-239555-6) and 21MW-4 (440-239555-7). Elevated reporting limits (RLs) are provided.
No additional analytical or quality issues were noted, other than those described above or in the Definitions/Glossary page.
Metals Method(s) 6010B: The continuing calibration blank (CCB) for analytical batch 440-542612 contained Sodium above the reporting limit (RL). All reported samples associated with this CCB were either ND for this analyte or contained this analyte at a concentration greater than 10X the value found in the CCB; therefore, re-analysis of samples was not performed.
Method(s) 6010B: The method blank for preparation batch 440-542376 and analytical batch 440-542818 contained Sodium above the method detection limit (MDL) and Calcium above the reporting limit (RL). Associated sample(s) were not re-extracted and/or re-analyzed because results were greater than 10X the value found in the method blank.
Method(s) 6010B: The continuing calibration blank (CCB) for analytical batch 440-542818 contained Sodium above the reporting limit (RL).
All reported samples associated with this CCB were either ND for this analyte or contained this analyte at a concentration greater than 10X the value found in the CCB; therefore, re-analysis of samples was not performed.
No additional analytical or quality issues were noted, other than those described above or in the Definitions/Glossary page.
General Chemistry Method(s) 120.1: Conductivity result was reported at a dilution and may have increased error compared to an undiluted sample.
21MW-1 (440-239555-2), 21MW-1-DUP (440-239555-3) and 29MW-2 (440-239555-5)
No additional analytical or quality issues were noted, other than those described above or in the Definitions/Glossary page.
Subcontract non-Sister
No analytical or quality issues were noted, other than those described in the Definitions/Glossary page.
VOA Prep No analytical or quality issues were noted, other than those described in the Definitions/Glossary page.
Eurofins TestAmerica, IrvinePage 4 of 47 5/23/2019
1
2
3
4
5
6
7
8
9
10
11
12
13
14

Client Sample ResultsJob ID: 440-239555-1Client: Wood E&I Solutions Inc
Project/Site: Chevron Lost Hills Sect 29
Lab Sample ID: 440-239555-1Client Sample ID: 21MW-3Matrix: WaterDate Collected: 04/22/19 10:18
Date Received: 04/22/19 19:30
Method: 8260B - Volatile Organic Compounds (GC/MS)RL MDL
Benzene ND 2.0 0.25 ug/L 04/30/19 15:18 1
Analyte Dil FacAnalyzedPreparedUnit DResult Qualifier
2.0 0.25 ug/L 04/30/19 15:18 1Ethylbenzene ND
2.0 0.25 ug/L 04/30/19 15:18 1Toluene ND
2.0 0.50 ug/L 04/30/19 15:18 1m,p-Xylene ND
2.0 0.25 ug/L 04/30/19 15:18 1o-Xylene ND
2.0 0.25 ug/L 04/30/19 15:18 1Xylenes, Total ND
Unknown 3.1 T J ug/L 12.08 04/30/19 15:18 1
Tentatively Identified Compound Dil FacAnalyzedPreparedUnit DQualifierEst. Result CAS No.RT
104/30/19 15:18T JUnknown 6.7 ug/L 13.82
4-Bromofluorobenzene (Surr) 94 80 - 120 04/30/19 15:18 1
Surrogate Dil FacAnalyzedPreparedQualifier Limits%Recovery
Dibromofluoromethane (Surr) 124 04/30/19 15:18 176 - 132
Toluene-d8 (Surr) 102 04/30/19 15:18 180 - 128
Method: 300.0 - Anions, Ion ChromatographyRL MDL
Chloride 870 100 50 mg/L 04/23/19 02:49 200
Analyte Dil FacAnalyzedPreparedUnit DResult Qualifier
5.0 2.5 mg/L 04/23/19 02:33 10Nitrate as NO3 ND
100 50 mg/L 04/23/19 02:49 200Sulfate 1500
Method: 6010B - Metals (ICP) - DissolvedRL MDL
Boron 4.3 0.10 0.050 mg/L 04/24/19 17:09 04/25/19 15:00 2
Analyte Dil FacAnalyzedPreparedUnit DResult Qualifier
0.20 0.10 mg/L 04/24/19 17:09 04/25/19 15:00 2Calcium 300 B
0.040 0.020 mg/L 04/24/19 17:09 04/25/19 15:00 2Magnesium 92
1.0 0.50 mg/L 04/24/19 17:09 04/25/19 15:00 2Potassium 7.8
1.0 0.52 mg/L 04/24/19 17:09 04/25/19 15:00 2Sodium 620 B ^
General ChemistryRL MDL
Specific Conductance 5300 1.0 1.0 umhos/cm 04/25/19 11:09 1
Analyte Dil FacAnalyzedPreparedUnit DResult Qualifier
4.0 4.0 mg/L 04/25/19 07:35 1Alkalinity as CaCO3 130
4.0 4.0 mg/L 04/25/19 07:35 1Bicarbonate Alkalinity as CaCO3 130
4.0 4.0 mg/L 04/25/19 07:35 1Carbonate Alkalinity as CaCO3 ND
4.0 4.0 mg/L 04/25/19 07:35 1Hydroxide Alkalinity as CaCO3 ND
100 50 mg/L 04/24/19 08:39 1Total Dissolved Solids 3800
Lab Sample ID: 440-239555-2Client Sample ID: 21MW-1Matrix: WaterDate Collected: 04/22/19 11:13
Date Received: 04/22/19 19:30
Method: 8260B - Volatile Organic Compounds (GC/MS)RL MDL
Benzene ND 2.0 0.25 ug/L 04/30/19 16:43 1
Analyte Dil FacAnalyzedPreparedUnit DResult Qualifier
2.0 0.25 ug/L 04/30/19 16:43 1Ethylbenzene ND
2.0 0.25 ug/L 04/30/19 16:43 1Toluene ND
2.0 0.50 ug/L 04/30/19 16:43 1m,p-Xylene ND
2.0 0.25 ug/L 04/30/19 16:43 1o-Xylene ND
2.0 0.25 ug/L 04/30/19 16:43 1Xylenes, Total ND
Eurofins TestAmerica, Irvine
Page 5 of 47 5/23/2019
1
2
3
4
5
6
7
8
9
10
11
12
13
14

Client Sample ResultsJob ID: 440-239555-1Client: Wood E&I Solutions Inc
Project/Site: Chevron Lost Hills Sect 29
Lab Sample ID: 440-239555-2Client Sample ID: 21MW-1Matrix: WaterDate Collected: 04/22/19 11:13
Date Received: 04/22/19 19:30
Unknown 12 T J ug/L 5.22 04/30/19 16:43 1
Tentatively Identified Compound Dil FacAnalyzedPreparedUnit DQualifierEst. Result CAS No.RT
104/30/19 16:43T JUnknown 2.6 ug/L 12.08
104/30/19 16:43T JUnknown 6.8 ug/L 13.82
4-Bromofluorobenzene (Surr) 96 80 - 120 04/30/19 16:43 1
Surrogate Dil FacAnalyzedPreparedQualifier Limits%Recovery
Dibromofluoromethane (Surr) 121 04/30/19 16:43 176 - 132
Toluene-d8 (Surr) 102 04/30/19 16:43 180 - 128
Method: 300.0 - Anions, Ion ChromatographyRL MDL
Chloride 5400 500 250 mg/L 04/23/19 03:53 1000
Analyte Dil FacAnalyzedPreparedUnit DResult Qualifier
25 13 mg/L 04/23/19 03:37 50Nitrate as NO3 ND
500 250 mg/L 04/23/19 03:53 1000Sulfate 2200
Method: 6010B - Metals (ICP) - DissolvedRL MDL
Boron 24 0.50 0.25 mg/L 04/24/19 17:09 04/25/19 15:23 10
Analyte Dil FacAnalyzedPreparedUnit DResult Qualifier
1.0 0.50 mg/L 04/24/19 17:09 04/25/19 15:23 10Calcium 1200 B
0.20 0.10 mg/L 04/24/19 17:09 04/25/19 15:23 10Magnesium 420
5.0 2.5 mg/L 04/24/19 17:09 04/25/19 15:23 10Potassium 17
5.0 2.6 mg/L 04/24/19 17:09 04/25/19 15:23 10Sodium 2100 ^ B
General ChemistryRL MDL
Specific Conductance 18000 2.0 2.0 umhos/cm 04/25/19 11:09 2
Analyte Dil FacAnalyzedPreparedUnit DResult Qualifier
4.0 4.0 mg/L 04/25/19 07:51 1Alkalinity as CaCO3 260
4.0 4.0 mg/L 04/25/19 07:51 1Bicarbonate Alkalinity as CaCO3 260
4.0 4.0 mg/L 04/25/19 07:51 1Carbonate Alkalinity as CaCO3 ND
4.0 4.0 mg/L 04/25/19 07:51 1Hydroxide Alkalinity as CaCO3 ND
100 50 mg/L 04/24/19 08:39 1Total Dissolved Solids 13000
Lab Sample ID: 440-239555-3Client Sample ID: 21MW-1-DUPMatrix: WaterDate Collected: 04/22/19 11:20
Date Received: 04/22/19 19:30
Method: 8260B - Volatile Organic Compounds (GC/MS)RL MDL
Benzene ND 2.0 0.25 ug/L 04/30/19 17:12 1
Analyte Dil FacAnalyzedPreparedUnit DResult Qualifier
2.0 0.25 ug/L 04/30/19 17:12 1Ethylbenzene ND
2.0 0.25 ug/L 04/30/19 17:12 1Toluene ND
2.0 0.50 ug/L 04/30/19 17:12 1m,p-Xylene ND
2.0 0.25 ug/L 04/30/19 17:12 1o-Xylene ND
2.0 0.25 ug/L 04/30/19 17:12 1Xylenes, Total ND
Unknown 9.7 T J ug/L 5.22 04/30/19 17:12 1
Tentatively Identified Compound Dil FacAnalyzedPreparedUnit DQualifierEst. Result CAS No.RT
4-Bromofluorobenzene (Surr) 95 80 - 120 04/30/19 17:12 1
Surrogate Dil FacAnalyzedPreparedQualifier Limits%Recovery
Dibromofluoromethane (Surr) 106 04/30/19 17:12 176 - 132
Toluene-d8 (Surr) 106 04/30/19 17:12 180 - 128
Eurofins TestAmerica, Irvine
Page 6 of 47 5/23/2019
1
2
3
4
5
6
7
8
9
10
11
12
13
14

Client Sample ResultsJob ID: 440-239555-1Client: Wood E&I Solutions Inc
Project/Site: Chevron Lost Hills Sect 29
Lab Sample ID: 440-239555-3Client Sample ID: 21MW-1-DUPMatrix: WaterDate Collected: 04/22/19 11:20
Date Received: 04/22/19 19:30
Method: 300.0 - Anions, Ion ChromatographyRL MDL
Chloride 5500 500 250 mg/L 04/23/19 04:25 1000
Analyte Dil FacAnalyzedPreparedUnit DResult Qualifier
25 13 mg/L 04/23/19 04:09 50Nitrate as NO3 ND
500 250 mg/L 04/23/19 04:25 1000Sulfate 2200
Method: 6010B - Metals (ICP) - DissolvedRL MDL
Boron 24 0.50 0.25 mg/L 04/24/19 17:09 04/25/19 15:25 10
Analyte Dil FacAnalyzedPreparedUnit DResult Qualifier
1.0 0.50 mg/L 04/24/19 17:09 04/25/19 15:25 10Calcium 1200 B
0.20 0.10 mg/L 04/24/19 17:09 04/25/19 15:25 10Magnesium 420
5.0 2.5 mg/L 04/24/19 17:09 04/25/19 15:25 10Potassium 18
5.0 2.6 mg/L 04/24/19 17:09 04/25/19 15:25 10Sodium 2100 ^ B
General ChemistryRL MDL
Specific Conductance 18000 2.0 2.0 umhos/cm 04/25/19 11:09 2
Analyte Dil FacAnalyzedPreparedUnit DResult Qualifier
4.0 4.0 mg/L 04/25/19 07:59 1Alkalinity as CaCO3 260
4.0 4.0 mg/L 04/25/19 07:59 1Bicarbonate Alkalinity as CaCO3 260
4.0 4.0 mg/L 04/25/19 07:59 1Carbonate Alkalinity as CaCO3 ND
4.0 4.0 mg/L 04/25/19 07:59 1Hydroxide Alkalinity as CaCO3 ND
100 50 mg/L 04/24/19 08:39 1Total Dissolved Solids 13000
Lab Sample ID: 440-239555-4Client Sample ID: 21MW-2Matrix: WaterDate Collected: 04/22/19 12:02
Date Received: 04/22/19 19:30
Method: 8260B - Volatile Organic Compounds (GC/MS)RL MDL
Benzene ND 2.0 0.25 ug/L 04/30/19 17:40 1
Analyte Dil FacAnalyzedPreparedUnit DResult Qualifier
2.0 0.25 ug/L 04/30/19 17:40 1Ethylbenzene ND
2.0 0.25 ug/L 04/30/19 17:40 1Toluene ND
2.0 0.50 ug/L 04/30/19 17:40 1m,p-Xylene ND
2.0 0.25 ug/L 04/30/19 17:40 1o-Xylene ND
2.0 0.25 ug/L 04/30/19 17:40 1Xylenes, Total ND
Unknown 12 T J ug/L 5.22 04/30/19 17:40 1
Tentatively Identified Compound Dil FacAnalyzedPreparedUnit DQualifierEst. Result CAS No.RT
104/30/19 17:40T JUnknown 3.9 ug/L 12.08
104/30/19 17:40T JUnknown 7.1 ug/L 13.82
4-Bromofluorobenzene (Surr) 95 80 - 120 04/30/19 17:40 1
Surrogate Dil FacAnalyzedPreparedQualifier Limits%Recovery
Dibromofluoromethane (Surr) 119 04/30/19 17:40 176 - 132
Toluene-d8 (Surr) 102 04/30/19 17:40 180 - 128
Method: 300.0 - Anions, Ion ChromatographyRL MDL
Chloride 910 100 50 mg/L 04/23/19 05:30 200
Analyte Dil FacAnalyzedPreparedUnit DResult Qualifier
5.0 2.5 mg/L 04/23/19 04:41 10Nitrate as NO3 3.7 J
100 50 mg/L 04/23/19 05:30 200Sulfate 1500
Eurofins TestAmerica, Irvine
Page 7 of 47 5/23/2019
1
2
3
4
5
6
7
8
9
10
11
12
13
14

Client Sample ResultsJob ID: 440-239555-1Client: Wood E&I Solutions Inc
Project/Site: Chevron Lost Hills Sect 29
Lab Sample ID: 440-239555-4Client Sample ID: 21MW-2Matrix: WaterDate Collected: 04/22/19 12:02
Date Received: 04/22/19 19:30
Method: 6010B - Metals (ICP) - DissolvedRL MDL
Boron 4.7 0.50 0.25 mg/L 04/24/19 17:09 04/25/19 15:27 10
Analyte Dil FacAnalyzedPreparedUnit DResult Qualifier
1.0 0.50 mg/L 04/24/19 17:09 04/25/19 15:27 10Calcium 270 B
0.20 0.10 mg/L 04/24/19 17:09 04/25/19 15:27 10Magnesium 92
5.0 2.5 mg/L 04/24/19 17:09 04/25/19 15:27 10Potassium 11
5.0 2.6 mg/L 04/24/19 17:09 04/25/19 15:27 10Sodium 720 ^ B
General ChemistryRL MDL
Specific Conductance 5400 1.0 1.0 umhos/cm 04/25/19 11:09 1
Analyte Dil FacAnalyzedPreparedUnit DResult Qualifier
4.0 4.0 mg/L 04/25/19 08:07 1Alkalinity as CaCO3 130
4.0 4.0 mg/L 04/25/19 08:07 1Bicarbonate Alkalinity as CaCO3 130
4.0 4.0 mg/L 04/25/19 08:07 1Carbonate Alkalinity as CaCO3 ND
4.0 4.0 mg/L 04/25/19 08:07 1Hydroxide Alkalinity as CaCO3 ND
100 50 mg/L 04/24/19 08:39 1Total Dissolved Solids 3900
Lab Sample ID: 440-239555-5Client Sample ID: 29MW-2Matrix: WaterDate Collected: 04/22/19 12:51
Date Received: 04/22/19 19:30
Method: 8260B - Volatile Organic Compounds (GC/MS)RL MDL
Benzene 17 2.0 0.25 ug/L 04/30/19 18:08 1
Analyte Dil FacAnalyzedPreparedUnit DResult Qualifier
2.0 0.25 ug/L 04/30/19 18:08 1Ethylbenzene ND
2.0 0.25 ug/L 04/30/19 18:08 1Toluene ND
2.0 0.50 ug/L 04/30/19 18:08 1m,p-Xylene 0.59 J
2.0 0.25 ug/L 04/30/19 18:08 1o-Xylene 1.8 J
2.0 0.25 ug/L 04/30/19 18:08 1Xylenes, Total 2.4
Unknown 3.3 T J ug/L 3.80 04/30/19 18:08 1
Tentatively Identified Compound Dil FacAnalyzedPreparedUnit DQualifierEst. Result CAS No.RT
104/30/19 18:08T JUnknown 11 ug/L 5.22
104/30/19 18:08T JUnknown 5.8 ug/L 10.55
104/30/19 18:08T J NBenzene, 1,2,3-trimethyl- 526-73-84.3 ug/L 11.04
104/30/19 18:08T JUnknown 6.0 ug/L 11.20
104/30/19 18:08T JUnknown 4.2 ug/L 11.68
104/30/19 18:08T JUnknown 5.8 ug/L 11.88
104/30/19 18:08T JUnknown 4.4 ug/L 11.99
104/30/19 18:08T JUnknown 8.0 ug/L 12.07
104/30/19 18:08T JUnknown 11 ug/L 13.06
104/30/19 18:08T JUnknown 5.7 ug/L 13.16
104/30/19 18:08T JUnknown 4.2 ug/L 13.53
104/30/19 18:08T JUnknown 5.4 ug/L 13.59
104/30/19 18:08T JUnknown 10 ug/L 13.78
104/30/19 18:08T JUnknown 4.8 ug/L 13.82
4-Bromofluorobenzene (Surr) 92 80 - 120 04/30/19 18:08 1
Surrogate Dil FacAnalyzedPreparedQualifier Limits%Recovery
Dibromofluoromethane (Surr) 110 04/30/19 18:08 176 - 132
Toluene-d8 (Surr) 101 04/30/19 18:08 180 - 128
Eurofins TestAmerica, Irvine
Page 8 of 47 5/23/2019
1
2
3
4
5
6
7
8
9
10
11
12
13
14

Client Sample ResultsJob ID: 440-239555-1Client: Wood E&I Solutions Inc
Project/Site: Chevron Lost Hills Sect 29
Lab Sample ID: 440-239555-5Client Sample ID: 29MW-2Matrix: WaterDate Collected: 04/22/19 12:51
Date Received: 04/22/19 19:30
Method: 300.0 - Anions, Ion ChromatographyRL MDL
Chloride 9800 1000 500 mg/L 04/23/19 06:02 2000
Analyte Dil FacAnalyzedPreparedUnit DResult Qualifier
50 25 mg/L 04/23/19 05:46 100Nitrate as NO3 ND
50 25 mg/L 04/23/19 05:46 100Sulfate 2800
Method: 6010B - Metals (ICP) - DissolvedRL MDL
Boron 45 0.50 0.25 mg/L 04/24/19 17:09 04/25/19 15:29 10
Analyte Dil FacAnalyzedPreparedUnit DResult Qualifier
1.0 0.50 mg/L 04/24/19 17:09 04/25/19 15:29 10Calcium 1400 B
0.20 0.10 mg/L 04/24/19 17:09 04/25/19 15:29 10Magnesium 530
5.0 2.5 mg/L 04/24/19 17:09 04/25/19 15:29 10Potassium 22
5.0 2.6 mg/L 04/24/19 17:09 04/25/19 15:29 10Sodium 4300 ^ B
General ChemistryRL MDL
Specific Conductance 34000 5.0 5.0 umhos/cm 04/25/19 11:09 5
Analyte Dil FacAnalyzedPreparedUnit DResult Qualifier
4.0 4.0 mg/L 04/25/19 08:20 1Alkalinity as CaCO3 620
4.0 4.0 mg/L 04/25/19 08:20 1Bicarbonate Alkalinity as CaCO3 620
4.0 4.0 mg/L 04/25/19 08:20 1Carbonate Alkalinity as CaCO3 ND
4.0 4.0 mg/L 04/25/19 08:20 1Hydroxide Alkalinity as CaCO3 ND
200 100 mg/L 04/24/19 08:39 1Total Dissolved Solids 21000
Lab Sample ID: 440-239555-6Client Sample ID: 21MW-5Matrix: WaterDate Collected: 04/22/19 14:02
Date Received: 04/22/19 19:30
Method: 8260B - Volatile Organic Compounds (GC/MS)RL MDL
Benzene ND 2.0 0.25 ug/L 04/30/19 18:36 1
Analyte Dil FacAnalyzedPreparedUnit DResult Qualifier
2.0 0.25 ug/L 04/30/19 18:36 1Ethylbenzene ND
2.0 0.50 ug/L 04/30/19 18:36 1m,p-Xylene ND
2.0 0.25 ug/L 04/30/19 18:36 1o-Xylene ND
2.0 0.25 ug/L 04/30/19 18:36 1Xylenes, Total ND
Unknown 9.3 T J ug/L 5.22 04/30/19 18:36 1
Tentatively Identified Compound Dil FacAnalyzedPreparedUnit DQualifierEst. Result CAS No.RT
4-Bromofluorobenzene (Surr) 102 80 - 120 04/30/19 18:36 1
Surrogate Dil FacAnalyzedPreparedQualifier Limits%Recovery
Dibromofluoromethane (Surr) 101 04/30/19 18:36 176 - 132
Toluene-d8 (Surr) 106 04/30/19 18:36 180 - 128
Method: 8260B - Volatile Organic Compounds (GC/MS) - RARL MDL
Toluene 1.5 J 2.0 0.25 ug/L 05/01/19 13:43 1
Analyte Dil FacAnalyzedPreparedUnit DResult Qualifier
Unknown 8.1 T J ug/L 6.51 05/01/19 13:43 1
Tentatively Identified Compound Dil FacAnalyzedPreparedUnit DQualifierEst. Result CAS No.RT
105/01/19 13:43T JUnknown 8.1 ug/L 16.52
4-Bromofluorobenzene (Surr) 93 80 - 120 05/01/19 13:43 1
Surrogate Dil FacAnalyzedPreparedQualifier Limits%Recovery
Dibromofluoromethane (Surr) 98 05/01/19 13:43 176 - 132
Eurofins TestAmerica, Irvine
Page 9 of 47 5/23/2019
1
2
3
4
5
6
7
8
9
10
11
12
13
14

Client Sample ResultsJob ID: 440-239555-1Client: Wood E&I Solutions Inc
Project/Site: Chevron Lost Hills Sect 29
Lab Sample ID: 440-239555-6Client Sample ID: 21MW-5Matrix: WaterDate Collected: 04/22/19 14:02
Date Received: 04/22/19 19:30
Method: 8260B - Volatile Organic Compounds (GC/MS) - RA (Continued)
Toluene-d8 (Surr) 100 80 - 128 05/01/19 13:43 1
Surrogate Dil FacAnalyzedPreparedQualifier Limits%Recovery
Method: 300.0 - Anions, Ion ChromatographyRL MDL
Chloride 410 100 50 mg/L 04/23/19 06:34 200
Analyte Dil FacAnalyzedPreparedUnit DResult Qualifier
2.5 1.3 mg/L 04/23/19 06:18 5Nitrate as NO3 ND
100 50 mg/L 04/23/19 06:34 200Sulfate 1400
Method: 6010B - Metals (ICP) - DissolvedRL MDL
Boron 3.3 0.50 0.25 mg/L 04/24/19 17:09 04/25/19 15:31 10
Analyte Dil FacAnalyzedPreparedUnit DResult Qualifier
1.0 0.50 mg/L 04/24/19 17:09 04/25/19 15:31 10Calcium 230 B
0.20 0.10 mg/L 04/24/19 17:09 04/25/19 15:31 10Magnesium 57
5.0 2.5 mg/L 04/24/19 17:09 04/25/19 15:31 10Potassium 8.2
5.0 2.6 mg/L 04/24/19 17:09 04/25/19 15:31 10Sodium 490 ^ B
General ChemistryRL MDL
Specific Conductance 3900 1.0 1.0 umhos/cm 04/25/19 11:09 1
Analyte Dil FacAnalyzedPreparedUnit DResult Qualifier
4.0 4.0 mg/L 04/25/19 08:27 1Alkalinity as CaCO3 76
4.0 4.0 mg/L 04/25/19 08:27 1Bicarbonate Alkalinity as CaCO3 76
4.0 4.0 mg/L 04/25/19 08:27 1Carbonate Alkalinity as CaCO3 ND
4.0 4.0 mg/L 04/25/19 08:27 1Hydroxide Alkalinity as CaCO3 ND
50 25 mg/L 04/24/19 08:39 1Total Dissolved Solids 2900
Lab Sample ID: 440-239555-7Client Sample ID: 21MW-4Matrix: WaterDate Collected: 04/22/19 14:55
Date Received: 04/22/19 19:30
Method: 8260B - Volatile Organic Compounds (GC/MS)RL MDL
Benzene ND 2.0 0.25 ug/L 05/01/19 04:24 1
Analyte Dil FacAnalyzedPreparedUnit DResult Qualifier
2.0 0.25 ug/L 05/01/19 04:24 1Ethylbenzene ND
2.0 0.25 ug/L 05/01/19 04:24 1Toluene ND
2.0 0.50 ug/L 05/01/19 04:24 1m,p-Xylene ND
2.0 0.25 ug/L 05/01/19 04:24 1o-Xylene ND
2.0 0.25 ug/L 05/01/19 04:24 1Xylenes, Total ND
Unknown 8.3 T J ug/L 6.52 05/01/19 04:24 1
Tentatively Identified Compound Dil FacAnalyzedPreparedUnit DQualifierEst. Result CAS No.RT
105/01/19 04:24T JUnknown 26 ug/L 15.85
4-Bromofluorobenzene (Surr) 93 80 - 120 05/01/19 04:24 1
Surrogate Dil FacAnalyzedPreparedQualifier Limits%Recovery
Dibromofluoromethane (Surr) 101 05/01/19 04:24 176 - 132
Toluene-d8 (Surr) 102 05/01/19 04:24 180 - 128
Method: 300.0 - Anions, Ion ChromatographyRL MDL
Chloride 940 100 50 mg/L 04/23/19 07:06 200
Analyte Dil FacAnalyzedPreparedUnit DResult Qualifier
5.0 2.5 mg/L 04/23/19 06:50 10Nitrate as NO3 ND
Eurofins TestAmerica, Irvine
Page 10 of 47 5/23/2019
1
2
3
4
5
6
7
8
9
10
11
12
13
14

Client Sample ResultsJob ID: 440-239555-1Client: Wood E&I Solutions Inc
Project/Site: Chevron Lost Hills Sect 29
Lab Sample ID: 440-239555-7Client Sample ID: 21MW-4Matrix: WaterDate Collected: 04/22/19 14:55
Date Received: 04/22/19 19:30
Method: 300.0 - Anions, Ion Chromatography (Continued)RL MDL
Sulfate 1600 100 50 mg/L 04/23/19 07:06 200
Analyte Dil FacAnalyzedPreparedUnit DResult Qualifier
Method: 6010B - Metals (ICP) - DissolvedRL MDL
Boron 4.4 0.50 0.25 mg/L 04/24/19 17:09 04/25/19 15:34 10
Analyte Dil FacAnalyzedPreparedUnit DResult Qualifier
1.0 0.50 mg/L 04/24/19 17:09 04/25/19 15:34 10Calcium 300 B
0.20 0.10 mg/L 04/24/19 17:09 04/25/19 15:34 10Magnesium 94
5.0 2.5 mg/L 04/24/19 17:09 04/25/19 15:34 10Potassium 7.3
5.0 2.6 mg/L 04/24/19 17:09 04/25/19 15:34 10Sodium 720 ^ B
General ChemistryRL MDL
Specific Conductance 5500 1.0 1.0 umhos/cm 04/25/19 11:09 1
Analyte Dil FacAnalyzedPreparedUnit DResult Qualifier
4.0 4.0 mg/L 04/25/19 08:34 1Alkalinity as CaCO3 130
4.0 4.0 mg/L 04/25/19 08:34 1Bicarbonate Alkalinity as CaCO3 130
4.0 4.0 mg/L 04/25/19 08:34 1Carbonate Alkalinity as CaCO3 ND
4.0 4.0 mg/L 04/25/19 08:34 1Hydroxide Alkalinity as CaCO3 ND
100 50 mg/L 04/24/19 08:39 1Total Dissolved Solids 4000
Lab Sample ID: 440-239555-8Client Sample ID: EBMatrix: WaterDate Collected: 04/22/19 15:15
Date Received: 04/22/19 19:30
Method: 8260B - Volatile Organic Compounds (GC/MS)RL MDL
Benzene ND 2.0 0.25 ug/L 05/01/19 04:51 1
Analyte Dil FacAnalyzedPreparedUnit DResult Qualifier
2.0 0.25 ug/L 05/01/19 04:51 1Ethylbenzene ND
2.0 0.25 ug/L 05/01/19 04:51 1Toluene ND
2.0 0.50 ug/L 05/01/19 04:51 1m,p-Xylene ND
2.0 0.25 ug/L 05/01/19 04:51 1o-Xylene ND
2.0 0.25 ug/L 05/01/19 04:51 1Xylenes, Total ND
Unknown 8.2 T J ug/L 6.52 05/01/19 04:51 1
Tentatively Identified Compound Dil FacAnalyzedPreparedUnit DQualifierEst. Result CAS No.RT
105/01/19 04:51T JUnknown 30 ug/L 16.20
4-Bromofluorobenzene (Surr) 91 80 - 120 05/01/19 04:51 1
Surrogate Dil FacAnalyzedPreparedQualifier Limits%Recovery
Dibromofluoromethane (Surr) 100 05/01/19 04:51 176 - 132
Toluene-d8 (Surr) 101 05/01/19 04:51 180 - 128
Lab Sample ID: 440-239555-9Client Sample ID: FBMatrix: WaterDate Collected: 04/22/19 15:20
Date Received: 04/22/19 19:30
Method: 8260B - Volatile Organic Compounds (GC/MS)RL MDL
Benzene ND 2.0 0.25 ug/L 05/01/19 05:18 1
Analyte Dil FacAnalyzedPreparedUnit DResult Qualifier
2.0 0.25 ug/L 05/01/19 05:18 1Ethylbenzene ND
2.0 0.25 ug/L 05/01/19 05:18 1Toluene ND
2.0 0.50 ug/L 05/01/19 05:18 1m,p-Xylene ND
Eurofins TestAmerica, Irvine
Page 11 of 47 5/23/2019
1
2
3
4
5
6
7
8
9
10
11
12
13
14

Client Sample ResultsJob ID: 440-239555-1Client: Wood E&I Solutions Inc
Project/Site: Chevron Lost Hills Sect 29
Lab Sample ID: 440-239555-9Client Sample ID: FBMatrix: WaterDate Collected: 04/22/19 15:20
Date Received: 04/22/19 19:30
Method: 8260B - Volatile Organic Compounds (GC/MS) (Continued)RL MDL
o-Xylene ND 2.0 0.25 ug/L 05/01/19 05:18 1
Analyte Dil FacAnalyzedPreparedUnit DResult Qualifier
2.0 0.25 ug/L 05/01/19 05:18 1Xylenes, Total ND
Unknown 8.2 T J ug/L 6.52 05/01/19 05:18 1
Tentatively Identified Compound Dil FacAnalyzedPreparedUnit DQualifierEst. Result CAS No.RT
105/01/19 05:18T JUnknown 23 ug/L 15.92
4-Bromofluorobenzene (Surr) 92 80 - 120 05/01/19 05:18 1
Surrogate Dil FacAnalyzedPreparedQualifier Limits%Recovery
Dibromofluoromethane (Surr) 99 05/01/19 05:18 176 - 132
Toluene-d8 (Surr) 102 05/01/19 05:18 180 - 128
Lab Sample ID: 440-239555-10Client Sample ID: TBMatrix: WaterDate Collected: 04/22/19 00:01
Date Received: 04/22/19 19:30
Method: 8260B - Volatile Organic Compounds (GC/MS)RL MDL
Benzene ND 2.0 0.25 ug/L 05/01/19 05:44 1
Analyte Dil FacAnalyzedPreparedUnit DResult Qualifier
2.0 0.25 ug/L 05/01/19 05:44 1Ethylbenzene ND
2.0 0.25 ug/L 05/01/19 05:44 1Toluene ND
2.0 0.50 ug/L 05/01/19 05:44 1m,p-Xylene ND
2.0 0.25 ug/L 05/01/19 05:44 1o-Xylene ND
2.0 0.25 ug/L 05/01/19 05:44 1Xylenes, Total ND
Unknown 8.1 T J ug/L 6.52 05/01/19 05:44 1
Tentatively Identified Compound Dil FacAnalyzedPreparedUnit DQualifierEst. Result CAS No.RT
105/01/19 05:44T JUnknown 23 ug/L 16.60
4-Bromofluorobenzene (Surr) 94 80 - 120 05/01/19 05:44 1
Surrogate Dil FacAnalyzedPreparedQualifier Limits%Recovery
Dibromofluoromethane (Surr) 99 05/01/19 05:44 176 - 132
Toluene-d8 (Surr) 102 05/01/19 05:44 180 - 128
Eurofins TestAmerica, Irvine
Page 12 of 47 5/23/2019
1
2
3
4
5
6
7
8
9
10
11
12
13
14

Method SummaryJob ID: 440-239555-1Client: Wood E&I Solutions Inc
Project/Site: Chevron Lost Hills Sect 29
Method Method Description LaboratoryProtocol
SW8468260B Volatile Organic Compounds (GC/MS) TAL IRV
MCAWW300.0 Anions, Ion Chromatography TAL IRV
SW8466010B Metals (ICP) TAL IRV
MCAWW120.1 Conductivity, Specific Conductance TAL IRV
SMSM 2320B Alkalinity TAL IRV
SMSM 2540C Solids, Total Dissolved (TDS) TAL IRV
NoneSubcontract Oxygen & Hydrogen Isotope analysis SC0015
SW8463005A Preparation, Total Recoverable or Dissolved Metals TAL IRV
SW8465030B Purge and Trap TAL IRV
Protocol References:
MCAWW = "Methods For Chemical Analysis Of Water And Wastes", EPA-600/4-79-020, March 1983 And Subsequent Revisions.
None = None
SM = "Standard Methods For The Examination Of Water And Wastewater"
SW846 = "Test Methods For Evaluating Solid Waste, Physical/Chemical Methods", Third Edition, November 1986 And Its Updates.
Laboratory References:
SC0015 = Pace-Pittsburgh (Microseeps), 220 William Pitt Way, Pittsburgh, PA 15238, TEL (412)826-5245
TAL IRV = Eurofins TestAmerica, Irvine, 17461 Derian Ave, Suite 100, Irvine, CA 92614-5817, TEL (949)261-1022
Eurofins TestAmerica, Irvine
Page 13 of 47 5/23/2019
1
2
3
4
5
6
7
8
9
10
11
12
13
14

Lab ChronicleClient: Wood E&I Solutions Inc Job ID: 440-239555-1Project/Site: Chevron Lost Hills Sect 29
Client Sample ID: 21MW-3 Lab Sample ID: 440-239555-1Matrix: WaterDate Collected: 04/22/19 10:18
Date Received: 04/22/19 19:30
Analysis 8260B RM04/30/19 15:181 TAL IRV543336
Type
Batch
Method
Batch
Prep Type LabAnalystRun
Prepared
or Analyzed
Initial
Amount Amount
Final Batch
NumberFactor
Dil
Total/NA 10 mL 10 mL
Analysis 300.0 10 541723 04/23/19 02:33 NTN TAL IRVTotal/NA
Analysis 300.0 DL 200 541723 04/23/19 02:49 NTN TAL IRVTotal/NA
Analysis 300.0 200 541724 04/23/19 02:49 NTN TAL IRVTotal/NA
Prep 3005A 542376 04/24/19 17:09 BV TAL IRVDissolved 25 mL 25 mL
Analysis 6010B 2 542818 04/25/19 15:00 VS TAL IRVDissolved
Analysis 120.1 1 542532 04/25/19 11:09 XL TAL IRVTotal/NA
Analysis SM 2320B 1 542690 04/25/19 07:35 YZ TAL IRVTotal/NA
Analysis SM 2540C 1 542211 04/24/19 08:39 XL TAL IRVTotal/NA 10 mL 100 mL
Client Sample ID: 21MW-1 Lab Sample ID: 440-239555-2Matrix: WaterDate Collected: 04/22/19 11:13
Date Received: 04/22/19 19:30
Analysis 8260B RM04/30/19 16:431 TAL IRV543336
Type
Batch
Method
Batch
Prep Type LabAnalystRun
Prepared
or Analyzed
Initial
Amount Amount
Final Batch
NumberFactor
Dil
Total/NA 10 mL 10 mL
Analysis 300.0 50 541723 04/23/19 03:37 NTN TAL IRVTotal/NA 5 mL 1.0 mL
Analysis 300.0 1000 541724 04/23/19 03:53 NTN TAL IRVTotal/NA
Prep 3005A 542376 04/24/19 17:09 BV TAL IRVDissolved 25 mL 25 mL
Analysis 6010B 10 542818 04/25/19 15:23 VS TAL IRVDissolved
Analysis 120.1 2 542532 04/25/19 11:09 XL TAL IRVTotal/NA
Analysis SM 2320B 1 542690 04/25/19 07:51 YZ TAL IRVTotal/NA
Analysis SM 2540C 1 542211 04/24/19 08:39 XL TAL IRVTotal/NA 10 mL 100 mL
Client Sample ID: 21MW-1-DUP Lab Sample ID: 440-239555-3Matrix: WaterDate Collected: 04/22/19 11:20
Date Received: 04/22/19 19:30
Analysis 8260B RM04/30/19 17:121 TAL IRV543336
Type
Batch
Method
Batch
Prep Type LabAnalystRun
Prepared
or Analyzed
Initial
Amount Amount
Final Batch
NumberFactor
Dil
Total/NA 10 mL 10 mL
Analysis 300.0 50 541723 04/23/19 04:09 NTN TAL IRVTotal/NA 5 mL 1.0 mL
Analysis 300.0 1000 541724 04/23/19 04:25 NTN TAL IRVTotal/NA
Prep 3005A 542376 04/24/19 17:09 BV TAL IRVDissolved 25 mL 25 mL
Analysis 6010B 10 542818 04/25/19 15:25 VS TAL IRVDissolved
Analysis 120.1 2 542532 04/25/19 11:09 XL TAL IRVTotal/NA
Analysis SM 2320B 1 542690 04/25/19 07:59 YZ TAL IRVTotal/NA
Analysis SM 2540C 1 542211 04/24/19 08:39 XL TAL IRVTotal/NA 10 mL 100 mL
Eurofins TestAmerica, Irvine
Page 14 of 47 5/23/2019
1
2
3
4
5
6
7
8
9
10
11
12
13
14

Lab ChronicleClient: Wood E&I Solutions Inc Job ID: 440-239555-1Project/Site: Chevron Lost Hills Sect 29
Client Sample ID: 21MW-2 Lab Sample ID: 440-239555-4Matrix: WaterDate Collected: 04/22/19 12:02
Date Received: 04/22/19 19:30
Analysis 8260B RM04/30/19 17:401 TAL IRV543336
Type
Batch
Method
Batch
Prep Type LabAnalystRun
Prepared
or Analyzed
Initial
Amount Amount
Final Batch
NumberFactor
Dil
Total/NA 10 mL 10 mL
Analysis 300.0 10 541723 04/23/19 04:41 NTN TAL IRVTotal/NA 5 mL 1.0 mL
Analysis 300.0 200 541724 04/23/19 05:30 NTN TAL IRVTotal/NA
Prep 3005A 542376 04/24/19 17:09 BV TAL IRVDissolved 25 mL 25 mL
Analysis 6010B 10 542818 04/25/19 15:27 VS TAL IRVDissolved
Analysis 120.1 1 542532 04/25/19 11:09 XL TAL IRVTotal/NA
Analysis SM 2320B 1 542690 04/25/19 08:07 YZ TAL IRVTotal/NA
Analysis SM 2540C 1 542211 04/24/19 08:39 XL TAL IRVTotal/NA 10 mL 100 mL
Client Sample ID: 29MW-2 Lab Sample ID: 440-239555-5Matrix: WaterDate Collected: 04/22/19 12:51
Date Received: 04/22/19 19:30
Analysis 8260B RM04/30/19 18:081 TAL IRV543336
Type
Batch
Method
Batch
Prep Type LabAnalystRun
Prepared
or Analyzed
Initial
Amount Amount
Final Batch
NumberFactor
Dil
Total/NA 10 mL 10 mL
Analysis 300.0 100 541723 04/23/19 05:46 NTN TAL IRVTotal/NA 5 mL 1.0 mL
Analysis 300.0 100 541724 04/23/19 05:46 NTN TAL IRVTotal/NA 5 mL 1.0 mL
Analysis 300.0 2000 541724 04/23/19 06:02 NTN TAL IRVTotal/NA
Prep 3005A 542376 04/24/19 17:09 BV TAL IRVDissolved 25 mL 25 mL
Analysis 6010B 10 542818 04/25/19 15:29 VS TAL IRVDissolved
Analysis 120.1 5 542532 04/25/19 11:09 XL TAL IRVTotal/NA
Analysis SM 2320B 1 542690 04/25/19 08:20 YZ TAL IRVTotal/NA
Analysis SM 2540C 1 542211 04/24/19 08:39 XL TAL IRVTotal/NA 5 mL 100 mL
Client Sample ID: 21MW-5 Lab Sample ID: 440-239555-6Matrix: WaterDate Collected: 04/22/19 14:02
Date Received: 04/22/19 19:30
Analysis 8260B WC05/01/19 13:431RA TAL IRV543607
Type
Batch
Method
Batch
Prep Type LabAnalystRun
Prepared
or Analyzed
Initial
Amount Amount
Final Batch
NumberFactor
Dil
Total/NA 10 mL 10 mL
Analysis 8260B 1 543336 04/30/19 18:36 RM TAL IRVTotal/NA 10 mL 10 mL
Analysis 300.0 5 541723 04/23/19 06:18 NTN TAL IRVTotal/NA 5 mL 1.0 mL
Analysis 300.0 200 541724 04/23/19 06:34 NTN TAL IRVTotal/NA
Prep 3005A 542376 04/24/19 17:09 BV TAL IRVDissolved 25 mL 25 mL
Analysis 6010B 10 542818 04/25/19 15:31 VS TAL IRVDissolved
Analysis 120.1 1 542532 04/25/19 11:09 XL TAL IRVTotal/NA
Analysis SM 2320B 1 542690 04/25/19 08:27 YZ TAL IRVTotal/NA
Analysis SM 2540C 1 542211 04/24/19 08:39 XL TAL IRVTotal/NA 20 mL 100 mL
Eurofins TestAmerica, Irvine
Page 15 of 47 5/23/2019
1
2
3
4
5
6
7
8
9
10
11
12
13
14

Lab ChronicleClient: Wood E&I Solutions Inc Job ID: 440-239555-1Project/Site: Chevron Lost Hills Sect 29
Client Sample ID: 21MW-4 Lab Sample ID: 440-239555-7Matrix: WaterDate Collected: 04/22/19 14:55
Date Received: 04/22/19 19:30
Analysis 8260B P1A05/01/19 04:241 TAL IRV543521
Type
Batch
Method
Batch
Prep Type LabAnalystRun
Prepared
or Analyzed
Initial
Amount Amount
Final Batch
NumberFactor
Dil
Total/NA 10 mL 10 mL
Analysis 300.0 10 541723 04/23/19 06:50 NTN TAL IRVTotal/NA 5 mL 1.0 mL
Analysis 300.0 200 541724 04/23/19 07:06 NTN TAL IRVTotal/NA
Prep 3005A 542376 04/24/19 17:09 BV TAL IRVDissolved 25 mL 25 mL
Analysis 6010B 10 542818 04/25/19 15:34 VS TAL IRVDissolved
Analysis 120.1 1 542532 04/25/19 11:09 XL TAL IRVTotal/NA
Analysis SM 2320B 1 542690 04/25/19 08:34 YZ TAL IRVTotal/NA
Analysis SM 2540C 1 542211 04/24/19 08:39 XL TAL IRVTotal/NA 10 mL 100 mL
Client Sample ID: EB Lab Sample ID: 440-239555-8Matrix: WaterDate Collected: 04/22/19 15:15
Date Received: 04/22/19 19:30
Analysis 8260B P1A05/01/19 04:511 TAL IRV543521
Type
Batch
Method
Batch
Prep Type LabAnalystRun
Prepared
or Analyzed
Initial
Amount Amount
Final Batch
NumberFactor
Dil
Total/NA 10 mL 10 mL
Client Sample ID: FB Lab Sample ID: 440-239555-9Matrix: WaterDate Collected: 04/22/19 15:20
Date Received: 04/22/19 19:30
Analysis 8260B P1A05/01/19 05:181 TAL IRV543521
Type
Batch
Method
Batch
Prep Type LabAnalystRun
Prepared
or Analyzed
Initial
Amount Amount
Final Batch
NumberFactor
Dil
Total/NA 10 mL 10 mL
Client Sample ID: TB Lab Sample ID: 440-239555-10Matrix: WaterDate Collected: 04/22/19 00:01
Date Received: 04/22/19 19:30
Analysis 8260B P1A05/01/19 05:441 TAL IRV543521
Type
Batch
Method
Batch
Prep Type LabAnalystRun
Prepared
or Analyzed
Initial
Amount Amount
Final Batch
NumberFactor
Dil
Total/NA 10 mL 10 mL
Laboratory References:
SC0015 = Pace-Pittsburgh (Microseeps), 220 William Pitt Way, Pittsburgh, PA 15238, TEL (412)826-5245
TAL IRV = Eurofins TestAmerica, Irvine, 17461 Derian Ave, Suite 100, Irvine, CA 92614-5817, TEL (949)261-1022
Eurofins TestAmerica, Irvine
Page 16 of 47 5/23/2019
1
2
3
4
5
6
7
8
9
10
11
12
13
14

QC Sample ResultsJob ID: 440-239555-1Client: Wood E&I Solutions Inc
Project/Site: Chevron Lost Hills Sect 29
Method: 8260B - Volatile Organic Compounds (GC/MS)
Client Sample ID: Method BlankLab Sample ID: MB 440-543336/4Matrix: Water Prep Type: Total/NAAnalysis Batch: 543336
RL MDL
Benzene ND 2.0 0.25 ug/L 04/30/19 08:14 1
MB MB
Analyte Dil FacAnalyzedPreparedDUnitResult Qualifier
ND 0.252.0 ug/L 04/30/19 08:14 1Ethylbenzene
ND 0.252.0 ug/L 04/30/19 08:14 1Toluene
ND 0.502.0 ug/L 04/30/19 08:14 1m,p-Xylene
ND 0.252.0 ug/L 04/30/19 08:14 1o-Xylene
ND 0.252.0 ug/L 04/30/19 08:14 1Xylenes, Total
Tentatively Identified Compound None ug/L 04/30/19 08:14 1
MB MB
Tentatively Identified Compound Dil FacPrepared AnalyzedDUnitQualifierEst. Result RT CAS No.
4-Bromofluorobenzene (Surr) 102 80 - 120 04/30/19 08:14 1
MB MB
Surrogate Dil FacPrepared AnalyzedQualifier Limits%Recovery
100 04/30/19 08:14 1Dibromofluoromethane (Surr) 76 - 132
109 04/30/19 08:14 1Toluene-d8 (Surr) 80 - 128
Client Sample ID: Lab Control SampleLab Sample ID: LCS 440-543336/5Matrix: Water Prep Type: Total/NAAnalysis Batch: 543336
Benzene 10.0 10.2 ug/L 102 68 - 130
Analyte
LCS LCS
DUnitResult Qualifier %Rec
Spike
Added
%Rec.
Limits
Ethylbenzene 10.0 12.0 ug/L 120 70 - 130
Toluene 10.0 11.0 ug/L 110 70 - 130
m,p-Xylene 10.0 9.85 ug/L 98 70 - 130
o-Xylene 10.0 10.9 ug/L 109 70 - 130
4-Bromofluorobenzene (Surr) 80 - 120
Surrogate
97
LCS LCS
Qualifier Limits%Recovery
109Dibromofluoromethane (Surr) 76 - 132
102Toluene-d8 (Surr) 80 - 128
Client Sample ID: 21MW-3Lab Sample ID: 440-239555-1 MSMatrix: Water Prep Type: Total/NAAnalysis Batch: 543336
Benzene ND 10.0 10.2 ug/L 102 66 - 130
Analyte
MS MS
DUnitResult Qualifier %Rec
Spike
Added
Sample
Result
Sample
Qualifier
%Rec.
Limits
Ethylbenzene ND 10.0 11.7 ug/L 117 70 - 130
Toluene ND 10.0 10.9 ug/L 109 70 - 130
m,p-Xylene ND 10.0 9.90 ug/L 99 70 - 133
o-Xylene ND 10.0 10.8 ug/L 108 70 - 133
4-Bromofluorobenzene (Surr) 80 - 120
Surrogate
99
MS MS
Qualifier Limits%Recovery
106Dibromofluoromethane (Surr) 76 - 132
103Toluene-d8 (Surr) 80 - 128
Eurofins TestAmerica, Irvine
Page 17 of 47 5/23/2019
1
2
3
4
5
6
7
8
9
10
11
12
13
14

QC Sample ResultsJob ID: 440-239555-1Client: Wood E&I Solutions Inc
Project/Site: Chevron Lost Hills Sect 29
Method: 8260B - Volatile Organic Compounds (GC/MS) (Continued)
Client Sample ID: 21MW-3Lab Sample ID: 440-239555-1 MSDMatrix: Water Prep Type: Total/NAAnalysis Batch: 543336
Benzene ND 10.0 9.81 ug/L 98 66 - 130 4 20
Analyte
MSD MSD
DUnitResult Qualifier %Rec
Spike
Added
Sample
Result
Sample
Qualifier
%Rec.
Limits LimitRPD
RPD
Ethylbenzene ND 10.0 11.2 ug/L 112 70 - 130 5 20
Toluene ND 10.0 10.2 ug/L 102 70 - 130 6 20
m,p-Xylene ND 10.0 9.39 ug/L 94 70 - 133 5 25
o-Xylene ND 10.0 10.5 ug/L 105 70 - 133 2 20
4-Bromofluorobenzene (Surr) 80 - 120
Surrogate
98
MSD MSD
Qualifier Limits%Recovery
111Dibromofluoromethane (Surr) 76 - 132
100Toluene-d8 (Surr) 80 - 128
Client Sample ID: Method BlankLab Sample ID: MB 440-543521/6Matrix: Water Prep Type: Total/NAAnalysis Batch: 543521
RL MDL
Benzene ND 2.0 0.25 ug/L 04/30/19 21:43 1
MB MB
Analyte Dil FacAnalyzedPreparedDUnitResult Qualifier
ND 0.252.0 ug/L 04/30/19 21:43 1Ethylbenzene
ND 0.252.0 ug/L 04/30/19 21:43 1Toluene
ND 0.502.0 ug/L 04/30/19 21:43 1m,p-Xylene
ND 0.252.0 ug/L 04/30/19 21:43 1o-Xylene
ND 0.252.0 ug/L 04/30/19 21:43 1Xylenes, Total
Tentatively Identified Compound None ug/L 04/30/19 21:43 1
MB MB
Tentatively Identified Compound Dil FacPrepared AnalyzedDUnitQualifierEst. Result RT CAS No.
4-Bromofluorobenzene (Surr) 92 80 - 120 04/30/19 21:43 1
MB MB
Surrogate Dil FacPrepared AnalyzedQualifier Limits%Recovery
103 04/30/19 21:43 1Dibromofluoromethane (Surr) 76 - 132
104 04/30/19 21:43 1Toluene-d8 (Surr) 80 - 128
Client Sample ID: Lab Control SampleLab Sample ID: LCS 440-543521/4Matrix: Water Prep Type: Total/NAAnalysis Batch: 543521
Benzene 10.0 10.1 ug/L 101 68 - 130
Analyte
LCS LCS
DUnitResult Qualifier %Rec
Spike
Added
%Rec.
Limits
Ethylbenzene 10.0 9.80 ug/L 98 70 - 130
Toluene 10.0 10.1 ug/L 101 70 - 130
m,p-Xylene 10.0 10.2 ug/L 102 70 - 130
o-Xylene 10.0 10.8 ug/L 108 70 - 130
4-Bromofluorobenzene (Surr) 80 - 120
Surrogate
92
LCS LCS
Qualifier Limits%Recovery
103Dibromofluoromethane (Surr) 76 - 132
100Toluene-d8 (Surr) 80 - 128
Eurofins TestAmerica, Irvine
Page 18 of 47 5/23/2019
1
2
3
4
5
6
7
8
9
10
11
12
13
14

QC Sample ResultsJob ID: 440-239555-1Client: Wood E&I Solutions Inc
Project/Site: Chevron Lost Hills Sect 29
Method: 8260B - Volatile Organic Compounds (GC/MS) (Continued)
Client Sample ID: Matrix SpikeLab Sample ID: 440-239147-A-6 MSMatrix: Water Prep Type: Total/NAAnalysis Batch: 543521
Benzene ND 125 124 ug/L 99 66 - 130
Analyte
MS MS
DUnitResult Qualifier %Rec
Spike
Added
Sample
Result
Sample
Qualifier
%Rec.
Limits
Ethylbenzene ND 125 121 ug/L 97 70 - 130
Toluene ND 125 122 ug/L 97 70 - 130
m,p-Xylene ND 125 128 ug/L 102 70 - 133
o-Xylene ND 125 131 ug/L 105 70 - 133
4-Bromofluorobenzene (Surr) 80 - 120
Surrogate
92
MS MS
Qualifier Limits%Recovery
103Dibromofluoromethane (Surr) 76 - 132
98Toluene-d8 (Surr) 80 - 128
Client Sample ID: Matrix Spike DuplicateLab Sample ID: 440-239147-A-6 MSDMatrix: Water Prep Type: Total/NAAnalysis Batch: 543521
Benzene ND 125 124 ug/L 100 66 - 130 0 20
Analyte
MSD MSD
DUnitResult Qualifier %Rec
Spike
Added
Sample
Result
Sample
Qualifier
%Rec.
Limits LimitRPD
RPD
Ethylbenzene ND 125 122 ug/L 97 70 - 130 0 20
Toluene ND 125 122 ug/L 98 70 - 130 0 20
m,p-Xylene ND 125 128 ug/L 102 70 - 133 0 25
o-Xylene ND 125 134 ug/L 107 70 - 133 2 20
4-Bromofluorobenzene (Surr) 80 - 120
Surrogate
91
MSD MSD
Qualifier Limits%Recovery
105Dibromofluoromethane (Surr) 76 - 132
99Toluene-d8 (Surr) 80 - 128
Client Sample ID: Method BlankLab Sample ID: MB 440-543607/4Matrix: Water Prep Type: Total/NAAnalysis Batch: 543607
RL MDL
Toluene ND 2.0 0.25 ug/L 05/01/19 07:54 1
MB MB
Analyte Dil FacAnalyzedPreparedDUnitResult Qualifier
Tentatively Identified Compound None ug/L 05/01/19 07:54 1
MB MB
Tentatively Identified Compound Dil FacPrepared AnalyzedDUnitQualifierEst. Result RT CAS No.
13.24J 05/01/19 07:54 13.00 ug/L 124-19-6n-Nonyl Aldehyde
4-Bromofluorobenzene (Surr) 93 80 - 120 05/01/19 07:54 1
MB MB
Surrogate Dil FacPrepared AnalyzedQualifier Limits%Recovery
99 05/01/19 07:54 1Dibromofluoromethane (Surr) 76 - 132
103 05/01/19 07:54 1Toluene-d8 (Surr) 80 - 128
Eurofins TestAmerica, Irvine
Page 19 of 47 5/23/2019
1
2
3
4
5
6
7
8
9
10
11
12
13
14

QC Sample ResultsJob ID: 440-239555-1Client: Wood E&I Solutions Inc
Project/Site: Chevron Lost Hills Sect 29
Method: 8260B - Volatile Organic Compounds (GC/MS) (Continued)
Client Sample ID: Lab Control SampleLab Sample ID: LCS 440-543607/5Matrix: Water Prep Type: Total/NAAnalysis Batch: 543607
Toluene 10.0 9.62 ug/L 96 70 - 130
Analyte
LCS LCS
DUnitResult Qualifier %Rec
Spike
Added
%Rec.
Limits
4-Bromofluorobenzene (Surr) 80 - 120
Surrogate
92
LCS LCS
Qualifier Limits%Recovery
99Dibromofluoromethane (Surr) 76 - 132
98Toluene-d8 (Surr) 80 - 128
Client Sample ID: Matrix SpikeLab Sample ID: 440-240023-A-4 MSMatrix: Water Prep Type: Total/NAAnalysis Batch: 543607
Toluene ND 5000 4610 ug/L 92 70 - 130
Analyte
MS MS
DUnitResult Qualifier %Rec
Spike
Added
Sample
Result
Sample
Qualifier
%Rec.
Limits
4-Bromofluorobenzene (Surr) 80 - 120
Surrogate
92
MS MS
Qualifier Limits%Recovery
101Dibromofluoromethane (Surr) 76 - 132
98Toluene-d8 (Surr) 80 - 128
Client Sample ID: Matrix Spike DuplicateLab Sample ID: 440-240023-A-4 MSDMatrix: Water Prep Type: Total/NAAnalysis Batch: 543607
Toluene ND 5000 4420 ug/L 88 70 - 130 4 20
Analyte
MSD MSD
DUnitResult Qualifier %Rec
Spike
Added
Sample
Result
Sample
Qualifier
%Rec.
Limits LimitRPD
RPD
4-Bromofluorobenzene (Surr) 80 - 120
Surrogate
92
MSD MSD
Qualifier Limits%Recovery
100Dibromofluoromethane (Surr) 76 - 132
98Toluene-d8 (Surr) 80 - 128
Method: 300.0 - Anions, Ion Chromatography
Client Sample ID: Method BlankLab Sample ID: MB 440-541723/6Matrix: Water Prep Type: Total/NAAnalysis Batch: 541723
RL MDL
Nitrate as NO3 ND 0.50 0.25 mg/L 04/22/19 12:09 1
MB MB
Analyte Dil FacAnalyzedPreparedDUnitResult Qualifier
Client Sample ID: Lab Control SampleLab Sample ID: LCS 440-541723/5Matrix: Water Prep Type: Total/NAAnalysis Batch: 541723
Nitrate as NO3 5.00 4.92 mg/L 98 90 - 110
Analyte
LCS LCS
DUnitResult Qualifier %Rec
Spike
Added
%Rec.
Limits
Eurofins TestAmerica, Irvine
Page 20 of 47 5/23/2019
1
2
3
4
5
6
7
8
9
10
11
12
13
14

QC Sample ResultsJob ID: 440-239555-1Client: Wood E&I Solutions Inc
Project/Site: Chevron Lost Hills Sect 29
Method: 300.0 - Anions, Ion Chromatography (Continued)
Client Sample ID: Method BlankLab Sample ID: MB 440-541724/6Matrix: Water Prep Type: Total/NAAnalysis Batch: 541724
RL MDL
Chloride ND 0.50 0.25 mg/L 04/22/19 12:09 1
MB MB
Analyte Dil FacAnalyzedPreparedDUnitResult Qualifier
ND 0.250.50 mg/L 04/22/19 12:09 1Sulfate
Client Sample ID: Lab Control SampleLab Sample ID: LCS 440-541724/5Matrix: Water Prep Type: Total/NAAnalysis Batch: 541724
Chloride 5.00 4.64 mg/L 93 90 - 110
Analyte
LCS LCS
DUnitResult Qualifier %Rec
Spike
Added
%Rec.
Limits
Sulfate 5.00 4.96 mg/L 99 90 - 110
Client Sample ID: 21MW-3Lab Sample ID: 440-239555-1 MSMatrix: Water Prep Type: Total/NAAnalysis Batch: 541724
Chloride 870 1000 1890 mg/L 102 80 - 120
Analyte
MS MS
DUnitResult Qualifier %Rec
Spike
Added
Sample
Result
Sample
Qualifier
%Rec.
Limits
Sulfate 1500 1000 2540 mg/L 106 80 - 120
Client Sample ID: 21MW-3Lab Sample ID: 440-239555-1 MSDMatrix: Water Prep Type: Total/NAAnalysis Batch: 541724
Chloride 870 1000 1880 mg/L 101 80 - 120 1 20
Analyte
MSD MSD
DUnitResult Qualifier %Rec
Spike
Added
Sample
Result
Sample
Qualifier
%Rec.
Limits LimitRPD
RPD
Sulfate 1500 1000 2510 mg/L 104 80 - 120 1 20
Method: 300.0 - Anions, Ion Chromatography - DL
Client Sample ID: 21MW-3Lab Sample ID: 440-239555-1 MSMatrix: Water Prep Type: Total/NAAnalysis Batch: 541723
Nitrate as NO3 - DL ND 1000 1000 mg/L 100 80 - 120
Analyte
MS MS
DUnitResult Qualifier %Rec
Spike
Added
Sample
Result
Sample
Qualifier
%Rec.
Limits
Client Sample ID: 21MW-3Lab Sample ID: 440-239555-1 MSDMatrix: Water Prep Type: Total/NAAnalysis Batch: 541723
Nitrate as NO3 - DL ND 1000 996 mg/L 100 80 - 120 1 20
Analyte
MSD MSD
DUnitResult Qualifier %Rec
Spike
Added
Sample
Result
Sample
Qualifier
%Rec.
Limits LimitRPD
RPD
Eurofins TestAmerica, Irvine
Page 21 of 47 5/23/2019
1
2
3
4
5
6
7
8
9
10
11
12
13
14

QC Sample ResultsJob ID: 440-239555-1Client: Wood E&I Solutions Inc
Project/Site: Chevron Lost Hills Sect 29
Method: 6010B - Metals (ICP)
Client Sample ID: Method BlankLab Sample ID: MB 440-542376/1-AMatrix: Water Prep Type: Total RecoverableAnalysis Batch: 542818 Prep Batch: 542376
RL MDL
Boron ND 0.050 0.025 mg/L 04/24/19 17:09 04/25/19 11:20 1
MB MB
Analyte Dil FacAnalyzedPreparedDUnitResult Qualifier
0.128 0.0500.10 mg/L 04/24/19 17:09 04/25/19 11:20 1Calcium
ND 0.0100.020 mg/L 04/24/19 17:09 04/25/19 11:20 1Magnesium
ND 0.250.50 mg/L 04/24/19 17:09 04/25/19 11:20 1Potassium
0.416 J 0.260.50 mg/L 04/24/19 17:09 04/25/19 11:20 1Sodium
Client Sample ID: Lab Control SampleLab Sample ID: LCS 440-542376/2-AMatrix: Water Prep Type: Total RecoverableAnalysis Batch: 542818 Prep Batch: 542376
Boron 1.00 0.904 mg/L 90 80 - 120
Analyte
LCS LCS
DUnitResult Qualifier %Rec
Spike
Added
%Rec.
Limits
Calcium 5.00 4.64 mg/L 93 80 - 120
Magnesium 5.00 4.39 mg/L 88 80 - 120
Potassium 10.0 8.94 mg/L 89 80 - 120
Sodium 10.0 9.34 mg/L 93 80 - 120
Client Sample ID: 21MW-3Lab Sample ID: 440-239555-1 MSMatrix: Water Prep Type: DissolvedAnalysis Batch: 542818 Prep Batch: 542376
Boron 4.3 1.00 5.16 4 mg/L 88 75 - 125
Analyte
MS MS
DUnitResult Qualifier %Rec
Spike
Added
Sample
Result
Sample
Qualifier
%Rec.
Limits
Calcium 300 B 5.00 300 4 mg/L 104 75 - 125
Magnesium 92 5.00 97.8 4 mg/L 116 75 - 125
Potassium 7.8 10.0 16.1 mg/L 84 75 - 125
Sodium 620 B ^ 10.0 625 4 mg/L 92 75 - 125
Client Sample ID: 21MW-3Lab Sample ID: 440-239555-1 MSDMatrix: Water Prep Type: DissolvedAnalysis Batch: 542818 Prep Batch: 542376
Boron 4.3 1.00 5.24 4 mg/L 96 75 - 125 2 20
Analyte
MSD MSD
DUnitResult Qualifier %Rec
Spike
Added
Sample
Result
Sample
Qualifier
%Rec.
Limits LimitRPD
RPD
Calcium 300 B 5.00 305 4 mg/L 204 75 - 125 2 20
Magnesium 92 5.00 98.9 4 mg/L 138 75 - 125 1 20
Potassium 7.8 10.0 16.5 mg/L 88 75 - 125 3 20
Sodium 620 B ^ 10.0 636 4 mg/L 204 75 - 125 2 20
Method: 120.1 - Conductivity, Specific Conductance
Client Sample ID: Method BlankLab Sample ID: MB 440-542532/3Matrix: Water Prep Type: Total/NAAnalysis Batch: 542532
RL MDL
Specific Conductance ND 1.0 1.0 umhos/cm 04/25/19 11:09 1
MB MB
Analyte Dil FacAnalyzedPreparedDUnitResult Qualifier
Eurofins TestAmerica, Irvine
Page 22 of 47 5/23/2019
1
2
3
4
5
6
7
8
9
10
11
12
13
14

QC Sample ResultsJob ID: 440-239555-1Client: Wood E&I Solutions Inc
Project/Site: Chevron Lost Hills Sect 29
Method: 120.1 - Conductivity, Specific Conductance (Continued)
Client Sample ID: Lab Control SampleLab Sample ID: LCS 440-542532/4Matrix: Water Prep Type: Total/NAAnalysis Batch: 542532
Specific Conductance 953 970 umhos/cm 102 90 - 110
Analyte
LCS LCS
DUnitResult Qualifier %Rec
Spike
Added
%Rec.
Limits
Client Sample ID: 21MW-3Lab Sample ID: 440-239555-1 DUMatrix: Water Prep Type: Total/NAAnalysis Batch: 542532
Specific Conductance 5300 5240 umhos/cm 0.8 5
Analyte
DU DU
DUnitResult Qualifier
Sample
Result
Sample
Qualifier LimitRPD
RPD
Client Sample ID: 21MW-4Lab Sample ID: 440-239555-7 DUMatrix: Water Prep Type: Total/NAAnalysis Batch: 542532
Specific Conductance 5500 5420 umhos/cm 0.6 5
Analyte
DU DU
DUnitResult Qualifier
Sample
Result
Sample
Qualifier LimitRPD
RPD
Method: SM 2320B - Alkalinity
Client Sample ID: Method BlankLab Sample ID: MB 440-542690/3Matrix: Water Prep Type: Total/NAAnalysis Batch: 542690
RL MDL
Alkalinity as CaCO3 ND 4.0 4.0 mg/L 04/25/19 06:26 1
MB MB
Analyte Dil FacAnalyzedPreparedDUnitResult Qualifier
ND 4.04.0 mg/L 04/25/19 06:26 1Bicarbonate Alkalinity as CaCO3
ND 4.04.0 mg/L 04/25/19 06:26 1Carbonate Alkalinity as CaCO3
ND 4.04.0 mg/L 04/25/19 06:26 1Hydroxide Alkalinity as CaCO3
Client Sample ID: Lab Control SampleLab Sample ID: LCS 440-542690/2Matrix: Water Prep Type: Total/NAAnalysis Batch: 542690
Alkalinity as CaCO3 98.8 100 mg/L 102 80 - 120
Analyte
LCS LCS
DUnitResult Qualifier %Rec
Spike
Added
%Rec.
Limits
Client Sample ID: 21MW-3Lab Sample ID: 440-239555-1 DUMatrix: Water Prep Type: Total/NAAnalysis Batch: 542690
Alkalinity as CaCO3 130 128 mg/L 0.4 20
Analyte
DU DU
DUnitResult Qualifier
Sample
Result
Sample
Qualifier LimitRPD
RPD
Bicarbonate Alkalinity as CaCO3 130 128 mg/L 0.4 20
Carbonate Alkalinity as CaCO3 ND ND mg/L NC 20
Hydroxide Alkalinity as CaCO3 ND ND mg/L NC 20
Eurofins TestAmerica, Irvine
Page 23 of 47 5/23/2019
1
2
3
4
5
6
7
8
9
10
11
12
13
14

QC Sample ResultsJob ID: 440-239555-1Client: Wood E&I Solutions Inc
Project/Site: Chevron Lost Hills Sect 29
Method: SM 2540C - Solids, Total Dissolved (TDS)
Client Sample ID: Method BlankLab Sample ID: MB 440-542211/1Matrix: Water Prep Type: Total/NAAnalysis Batch: 542211
RL MDL
Total Dissolved Solids ND 10 5.0 mg/L 04/24/19 08:39 1
MB MB
Analyte Dil FacAnalyzedPreparedDUnitResult Qualifier
Client Sample ID: Lab Control SampleLab Sample ID: LCS 440-542211/2Matrix: Water Prep Type: Total/NAAnalysis Batch: 542211
Total Dissolved Solids 1000 1060 mg/L 106 90 - 110
Analyte
LCS LCS
DUnitResult Qualifier %Rec
Spike
Added
%Rec.
Limits
Client Sample ID: 21MW-3Lab Sample ID: 440-239555-1 DUMatrix: Water Prep Type: Total/NAAnalysis Batch: 542211
Total Dissolved Solids 3800 3870 mg/L 2 5
Analyte
DU DU
DUnitResult Qualifier
Sample
Result
Sample
Qualifier LimitRPD
RPD
Eurofins TestAmerica, Irvine
Page 24 of 47 5/23/2019
1
2
3
4
5
6
7
8
9
10
11
12
13
14

QC Association SummaryJob ID: 440-239555-1Client: Wood E&I Solutions Inc
Project/Site: Chevron Lost Hills Sect 29
GC/MS VOA
Analysis Batch: 543336
Lab Sample ID Client Sample ID Prep Type Matrix Method Prep Batch
Water 8260B440-239555-1 21MW-3 Total/NA
Water 8260B440-239555-2 21MW-1 Total/NA
Water 8260B440-239555-3 21MW-1-DUP Total/NA
Water 8260B440-239555-4 21MW-2 Total/NA
Water 8260B440-239555-5 29MW-2 Total/NA
Water 8260B440-239555-6 21MW-5 Total/NA
Water 8260BMB 440-543336/4 Method Blank Total/NA
Water 8260BLCS 440-543336/5 Lab Control Sample Total/NA
Water 8260B440-239555-1 MS 21MW-3 Total/NA
Water 8260B440-239555-1 MSD 21MW-3 Total/NA
Analysis Batch: 543521
Lab Sample ID Client Sample ID Prep Type Matrix Method Prep Batch
Water 8260B440-239555-7 21MW-4 Total/NA
Water 8260B440-239555-8 EB Total/NA
Water 8260B440-239555-9 FB Total/NA
Water 8260B440-239555-10 TB Total/NA
Water 8260BMB 440-543521/6 Method Blank Total/NA
Water 8260BLCS 440-543521/4 Lab Control Sample Total/NA
Water 8260B440-239147-A-6 MS Matrix Spike Total/NA
Water 8260B440-239147-A-6 MSD Matrix Spike Duplicate Total/NA
Analysis Batch: 543607
Lab Sample ID Client Sample ID Prep Type Matrix Method Prep Batch
Water 8260B440-239555-6 - RA 21MW-5 Total/NA
Water 8260BMB 440-543607/4 Method Blank Total/NA
Water 8260BLCS 440-543607/5 Lab Control Sample Total/NA
Water 8260B440-240023-A-4 MS Matrix Spike Total/NA
Water 8260B440-240023-A-4 MSD Matrix Spike Duplicate Total/NA
HPLC/IC
Analysis Batch: 541723
Lab Sample ID Client Sample ID Prep Type Matrix Method Prep Batch
Water 300.0440-239555-1 21MW-3 Total/NA
Water 300.0440-239555-1 - DL 21MW-3 Total/NA
Water 300.0440-239555-2 21MW-1 Total/NA
Water 300.0440-239555-3 21MW-1-DUP Total/NA
Water 300.0440-239555-4 21MW-2 Total/NA
Water 300.0440-239555-5 29MW-2 Total/NA
Water 300.0440-239555-6 21MW-5 Total/NA
Water 300.0440-239555-7 21MW-4 Total/NA
Water 300.0MB 440-541723/6 Method Blank Total/NA
Water 300.0LCS 440-541723/5 Lab Control Sample Total/NA
Water 300.0440-239555-1 MS - DL 21MW-3 Total/NA
Water 300.0440-239555-1 MSD - DL 21MW-3 Total/NA
Analysis Batch: 541724
Lab Sample ID Client Sample ID Prep Type Matrix Method Prep Batch
Water 300.0440-239555-1 21MW-3 Total/NA
Water 300.0440-239555-2 21MW-1 Total/NA
Eurofins TestAmerica, Irvine
Page 25 of 47 5/23/2019
1
2
3
4
5
6
7
8
9
10
11
12
13
14

QC Association SummaryJob ID: 440-239555-1Client: Wood E&I Solutions Inc
Project/Site: Chevron Lost Hills Sect 29
HPLC/IC (Continued)
Analysis Batch: 541724 (Continued)
Lab Sample ID Client Sample ID Prep Type Matrix Method Prep Batch
Water 300.0440-239555-3 21MW-1-DUP Total/NA
Water 300.0440-239555-4 21MW-2 Total/NA
Water 300.0440-239555-5 29MW-2 Total/NA
Water 300.0440-239555-5 29MW-2 Total/NA
Water 300.0440-239555-6 21MW-5 Total/NA
Water 300.0440-239555-7 21MW-4 Total/NA
Water 300.0MB 440-541724/6 Method Blank Total/NA
Water 300.0LCS 440-541724/5 Lab Control Sample Total/NA
Water 300.0440-239555-1 MS 21MW-3 Total/NA
Water 300.0440-239555-1 MSD 21MW-3 Total/NA
Metals
Prep Batch: 542376
Lab Sample ID Client Sample ID Prep Type Matrix Method Prep Batch
Water 3005A440-239555-1 21MW-3 Dissolved
Water 3005A440-239555-2 21MW-1 Dissolved
Water 3005A440-239555-3 21MW-1-DUP Dissolved
Water 3005A440-239555-4 21MW-2 Dissolved
Water 3005A440-239555-5 29MW-2 Dissolved
Water 3005A440-239555-6 21MW-5 Dissolved
Water 3005A440-239555-7 21MW-4 Dissolved
Water 3005AMB 440-542376/1-A Method Blank Total Recoverable
Water 3005ALCS 440-542376/2-A Lab Control Sample Total Recoverable
Water 3005A440-239555-1 MS 21MW-3 Dissolved
Water 3005A440-239555-1 MSD 21MW-3 Dissolved
Analysis Batch: 542818
Lab Sample ID Client Sample ID Prep Type Matrix Method Prep Batch
Water 6010B 542376440-239555-1 21MW-3 Dissolved
Water 6010B 542376440-239555-2 21MW-1 Dissolved
Water 6010B 542376440-239555-3 21MW-1-DUP Dissolved
Water 6010B 542376440-239555-4 21MW-2 Dissolved
Water 6010B 542376440-239555-5 29MW-2 Dissolved
Water 6010B 542376440-239555-6 21MW-5 Dissolved
Water 6010B 542376440-239555-7 21MW-4 Dissolved
Water 6010B 542376MB 440-542376/1-A Method Blank Total Recoverable
Water 6010B 542376LCS 440-542376/2-A Lab Control Sample Total Recoverable
Water 6010B 542376440-239555-1 MS 21MW-3 Dissolved
Water 6010B 542376440-239555-1 MSD 21MW-3 Dissolved
General Chemistry
Analysis Batch: 542211
Lab Sample ID Client Sample ID Prep Type Matrix Method Prep Batch
Water SM 2540C440-239555-1 21MW-3 Total/NA
Water SM 2540C440-239555-2 21MW-1 Total/NA
Water SM 2540C440-239555-3 21MW-1-DUP Total/NA
Water SM 2540C440-239555-4 21MW-2 Total/NA
Water SM 2540C440-239555-5 29MW-2 Total/NA
Water SM 2540C440-239555-6 21MW-5 Total/NA
Water SM 2540C440-239555-7 21MW-4 Total/NA
Eurofins TestAmerica, Irvine
Page 26 of 47 5/23/2019
1
2
3
4
5
6
7
8
9
10
11
12
13
14

QC Association SummaryJob ID: 440-239555-1Client: Wood E&I Solutions Inc
Project/Site: Chevron Lost Hills Sect 29
General Chemistry (Continued)
Analysis Batch: 542211 (Continued)
Lab Sample ID Client Sample ID Prep Type Matrix Method Prep Batch
Water SM 2540CMB 440-542211/1 Method Blank Total/NA
Water SM 2540CLCS 440-542211/2 Lab Control Sample Total/NA
Water SM 2540C440-239555-1 DU 21MW-3 Total/NA
Analysis Batch: 542532
Lab Sample ID Client Sample ID Prep Type Matrix Method Prep Batch
Water 120.1440-239555-1 21MW-3 Total/NA
Water 120.1440-239555-2 21MW-1 Total/NA
Water 120.1440-239555-3 21MW-1-DUP Total/NA
Water 120.1440-239555-4 21MW-2 Total/NA
Water 120.1440-239555-5 29MW-2 Total/NA
Water 120.1440-239555-6 21MW-5 Total/NA
Water 120.1440-239555-7 21MW-4 Total/NA
Water 120.1MB 440-542532/3 Method Blank Total/NA
Water 120.1LCS 440-542532/4 Lab Control Sample Total/NA
Water 120.1440-239555-1 DU 21MW-3 Total/NA
Water 120.1440-239555-7 DU 21MW-4 Total/NA
Analysis Batch: 542690
Lab Sample ID Client Sample ID Prep Type Matrix Method Prep Batch
Water SM 2320B440-239555-1 21MW-3 Total/NA
Water SM 2320B440-239555-2 21MW-1 Total/NA
Water SM 2320B440-239555-3 21MW-1-DUP Total/NA
Water SM 2320B440-239555-4 21MW-2 Total/NA
Water SM 2320B440-239555-5 29MW-2 Total/NA
Water SM 2320B440-239555-6 21MW-5 Total/NA
Water SM 2320B440-239555-7 21MW-4 Total/NA
Water SM 2320BMB 440-542690/3 Method Blank Total/NA
Water SM 2320BLCS 440-542690/2 Lab Control Sample Total/NA
Water SM 2320B440-239555-1 DU 21MW-3 Total/NA
Eurofins TestAmerica, Irvine
Page 27 of 47 5/23/2019
1
2
3
4
5
6
7
8
9
10
11
12
13
14

Definitions/GlossaryJob ID: 440-239555-1Client: Wood E&I Solutions Inc
Project/Site: Chevron Lost Hills Sect 29
Qualifiers
GC/MS VOAQualifier Description
J Result is less than the RL but greater than or equal to the MDL and the concentration is an approximate value.
Qualifier
GC/MS VOA TICsQualifier Description
J Indicates an Estimated Value for TICs
Qualifier
J Result is less than the RL but greater than or equal to the MDL and the concentration is an approximate value.
N Presumptive evidence of material.
T Result is a tentatively identified compound (TIC) and an estimated value.
HPLC/ICQualifier Description
J Result is less than the RL but greater than or equal to the MDL and the concentration is an approximate value.
Qualifier
MetalsQualifier Description
^ ICV,CCV,ICB,CCB, ISA, ISB, CRI, CRA, DLCK or MRL standard: Instrument related QC is outside acceptance limits.
Qualifier
4 MS, MSD: The analyte present in the original sample is greater than 4 times the matrix spike concentration; therefore, control limits are not
applicable.B Compound was found in the blank and sample.
J Result is less than the RL but greater than or equal to the MDL and the concentration is an approximate value.
GlossaryThese commonly used abbreviations may or may not be present in this report.
¤ Listed under the "D" column to designate that the result is reported on a dry weight basis
Abbreviation
%R Percent Recovery
CFL Contains Free Liquid
CNF Contains No Free Liquid
DER Duplicate Error Ratio (normalized absolute difference)
Dil Fac Dilution Factor
DL Detection Limit (DoD/DOE)
DL, RA, RE, IN Indicates a Dilution, Re-analysis, Re-extraction, or additional Initial metals/anion analysis of the sample
DLC Decision Level Concentration (Radiochemistry)
EDL Estimated Detection Limit (Dioxin)
LOD Limit of Detection (DoD/DOE)
LOQ Limit of Quantitation (DoD/DOE)
MDA Minimum Detectable Activity (Radiochemistry)
MDC Minimum Detectable Concentration (Radiochemistry)
MDL Method Detection Limit
ML Minimum Level (Dioxin)
NC Not Calculated
ND Not Detected at the reporting limit (or MDL or EDL if shown)
PQL Practical Quantitation Limit
QC Quality Control
RER Relative Error Ratio (Radiochemistry)
RL Reporting Limit or Requested Limit (Radiochemistry)
RPD Relative Percent Difference, a measure of the relative difference between two points
TEF Toxicity Equivalent Factor (Dioxin)
TEQ Toxicity Equivalent Quotient (Dioxin)
Eurofins TestAmerica, Irvine
Page 28 of 47 5/23/2019
1
2
3
4
5
6
7
8
9
10
11
12
13
14

Accreditation/Certification SummaryClient: Wood E&I Solutions Inc Job ID: 440-239555-1Project/Site: Chevron Lost Hills Sect 29
Laboratory: Eurofins TestAmerica, IrvineAll accreditations/certifications held by this laboratory are listed. Not all accreditations/certifications are applicable to this report.
Authority Program EPA Region Identification Number Expiration Date
Alaska CA0153110State Program 06-30-19
Arizona State Program 9 AZ0671 10-14-19
California LA Cty Sanitation Districts 9 10256 06-30-19
California State Program 9 CA ELAP 2706 06-30-19
Guam State Program 9 Cert. No. 19-005R 01-23-20
Hawaii State Program 9 N/A 01-29-20
Kansas NELAP 7 E-10420 07-31-19
Nevada State Program 9 CA015312018-1 07-31-19
New Mexico State Program 6 N/A 01-29-20
Oregon NELAP 10 4028 01-29-20
US Fish & Wildlife Federal 058448 07-31-19
USDA Federal P330-18-00214 07-09-21
Washington State Program 10 C900 09-03-19
Eurofins TestAmerica, Irvine
Page 29 of 47 5/23/2019
1
2
3
4
5
6
7
8
9
10
11
12
13
14

Pace Analytical Energy Services LLC
CERTIFICATE OF ANALYSISThis report shall not be reproduced, except in full,
Report ID: 30126 - 1168162 Page 1 of 12
Saman TaeidiEurofins Test America- Irvine, CA17461 Derian AveSuite 100Irvine, CA 92614
May 21, 2019
RE:Pace Workorder:
440-239555-1
Dear Saman Taeidi:
30126
Enclosed are the analytical results for sample(s) received by the laboratory on Wednesday, April 24, 2019.Results reported herein conform to the most current NELAC standards, where applicable, unless otherwisenarrated in the body of the report.
If you have any questions concerning this report, please feel free to contact me.
Sincerely,
Enclosures
Ruth Welsh 05/21/[email protected]
Total Number of Pages ____As a valued client we would appreciate your comments on our service.
Please email [email protected].
Customer Service Representative
220 William Pitt WayPittsburgh, PA 15238
Phone: (412) 826-5245Fax: (412) 826-3433
without the written consent of Pace Analytical Energy Services LLC.
Page 30 of 47 5/23/2019
1
2
3
4
5
6
7
8
9
10
11
12
13
14

Pace Analytical Energy Services LLC
CERTIFICATE OF ANALYSISThis report shall not be reproduced, except in full,
Report ID: 30126 - 1168162 Page 2 of 12
LABORATORY ACCREDITATIONS & CERTIFICATIONS
Pennsylvania Department of Environmental Protection, Bureau of Laboratories02-00538NELAP Non-Potable Water
Accreditor:Accreditation ID:Scope:
West Virginia Department of Environmental Protection, Division of Water and WasteManagement395Non-Potable Water
Accreditor:
Accreditation ID:Scope:
South Carolina Department of Health and Environmental Control, Office of EnvironmentalLaboratory Certification89009003Clean Water Act (CWA); Resource Conservation and Recovery Act (RCRA)
Accreditor:
Accreditation ID:Scope:
State of Virginia460201Non-Potable Water
Accreditor:Accreditation ID:Scope:
NELAP: New Jersey, Department of Environmental ProtectionPA026Non-Potable Water
Accreditor:Accreditation ID:Scope:
NELAP: New York, Department of Health Wadsworth Center11815Non-Potable Water
Accreditor:Accreditation ID:Scope:
State of Connecticut, Department of Public Health, Division of Environmental HealthPH-0263Clean Water Act (CWA) Resource Conservation and Recovery Act (RCRA)
Accreditor:Accreditation ID:Scope:
NELAP: Texas, Commission on Environmental QualityT104704453-09-TXNon-Potable Water
Accreditor:Accreditation ID:Scope:
State of New Hampshire299409Non-potable water
Accreditor:Accreditation ID:Scope:
State of GeorgiaChapter 391-3-26As per the Georgia EPD Rules and Regulations for Commercial Laboratories, PAES isaccredited by the Pennsylvania Department of Environmental Protection Bureau ofLaboratories under the National Environmental Laboratory Approval Program (NELAC).
Accreditor:Accreditation ID:Scope:
220 William Pitt WayPittsburgh, PA 15238
Phone: (412) 826-5245Fax: (412) 826-3433
without the written consent of Pace Analytical Energy Services LLC.
Page 31 of 47 5/23/2019
1
2
3
4
5
6
7
8
9
10
11
12
13
14

Pace Analytical Energy Services LLC
CERTIFICATE OF ANALYSISThis report shall not be reproduced, except in full,
Report ID: 30126 - 1168162 Page 3 of 12
SAMPLE SUMMARY
Workorder: 30126 440-239555-1
Lab ID Sample ID Matrix Date Collected Date Received
301260001 21MW-3 (440-239555-1) Water 4/22/2019 10:18 4/24/2019 11:15
301260002 21MW-1 (440-239555-2) Water 4/22/2019 11:13 4/24/2019 11:15
301260003 21MW-1-DUP (440-239555-3) Water 4/22/2019 11:20 4/24/2019 11:15
301260004 21MW-2 (440-239555-4) Water 4/22/2019 12:02 4/24/2019 11:15
301260005 29MW-2 (440-239555-5) Water 4/22/2019 12:51 4/24/2019 11:15
301260006 21MW-5 (440-239555-6) Water 4/22/2019 14:02 4/24/2019 11:15
301260007 21MW-4 (440-239555-7) Water 4/22/2019 14:55 4/24/2019 11:15
220 William Pitt WayPittsburgh, PA 15238
Phone: (412) 826-5245Fax: (412) 826-3433
without the written consent of Pace Analytical Energy Services LLC.
Page 32 of 47 5/23/2019
1
2
3
4
5
6
7
8
9
10
11
12
13
14

Pace Analytical Energy Services LLC
CERTIFICATE OF ANALYSISThis report shall not be reproduced, except in full,
Report ID: 30126 - 1168162 Page 4 of 12
ANALYTICAL RESULTS
Workorder: 30126 440-239555-1
4/24/2019 11:15
21MW-3 (440-239555-1)
Matrix: Water
RegLmtParameters
Lab ID:
Sample ID:
RegLmt
301260001
Results Units PQL DF ByAnalyzedMDL Qualifiers
Date Collected:
Date Received:
4/22/2019 10:18
Compound Specific Isotopic - PAESAnalysis Desc: D18O Analytical Method: D18O
Hydrogen 2 (Deuterium)Isotope
Complete 1 5/14/2019 00:00 NAU n
Oxygen 18 Isotope Complete 1 5/14/2019 00:00 NAU n
220 William Pitt WayPittsburgh, PA 15238
Phone: (412) 826-5245Fax: (412) 826-3433
without the written consent of Pace Analytical Energy Services LLC.
Page 33 of 47 5/23/2019
1
2
3
4
5
6
7
8
9
10
11
12
13
14

Pace Analytical Energy Services LLC
CERTIFICATE OF ANALYSISThis report shall not be reproduced, except in full,
Report ID: 30126 - 1168162 Page 5 of 12
ANALYTICAL RESULTS
Workorder: 30126 440-239555-1
4/24/2019 11:15
21MW-1 (440-239555-2)
Matrix: Water
RegLmtParameters
Lab ID:
Sample ID:
RegLmt
301260002
Results Units PQL DF ByAnalyzedMDL Qualifiers
Date Collected:
Date Received:
4/22/2019 11:13
Compound Specific Isotopic - PAESAnalysis Desc: D18O Analytical Method: D18O
Hydrogen 2 (Deuterium)Isotope
Complete 1 5/14/2019 00:00 NAU n
Oxygen 18 Isotope Complete 1 5/14/2019 00:00 NAU n
220 William Pitt WayPittsburgh, PA 15238
Phone: (412) 826-5245Fax: (412) 826-3433
without the written consent of Pace Analytical Energy Services LLC.
Page 34 of 47 5/23/2019
1
2
3
4
5
6
7
8
9
10
11
12
13
14
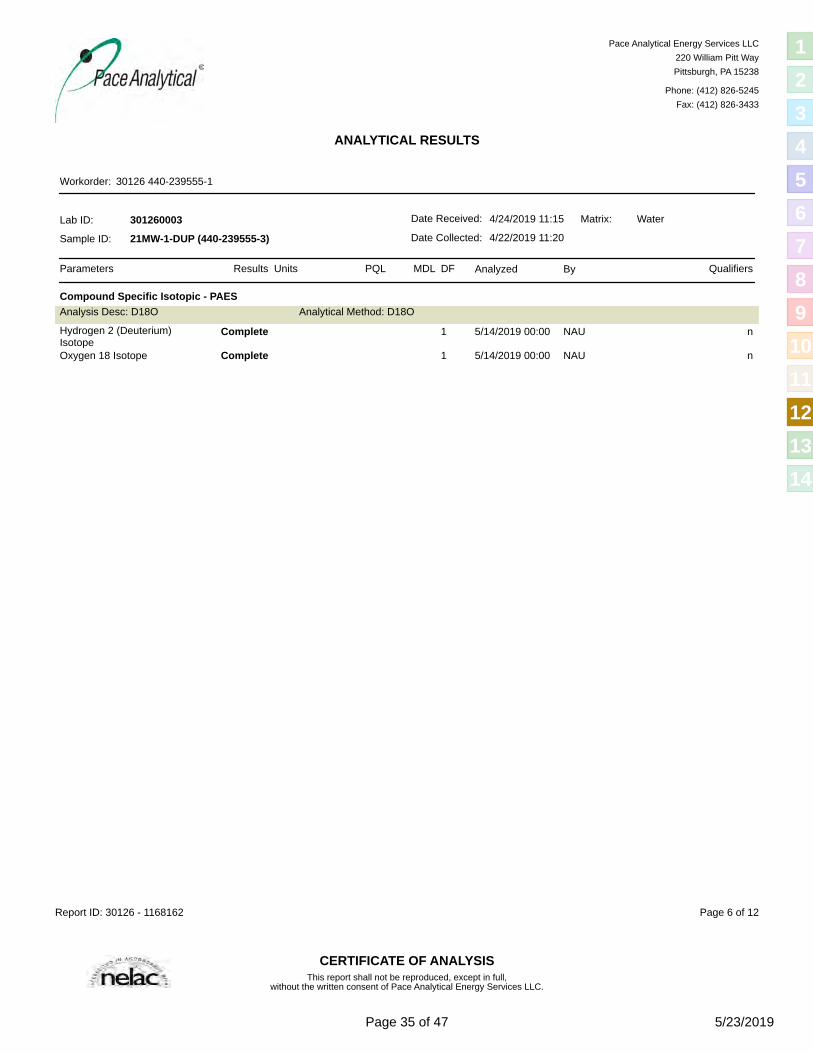
Pace Analytical Energy Services LLC
CERTIFICATE OF ANALYSISThis report shall not be reproduced, except in full,
Report ID: 30126 - 1168162 Page 6 of 12
ANALYTICAL RESULTS
Workorder: 30126 440-239555-1
4/24/2019 11:15
21MW-1-DUP (440-239555-3)
Matrix: Water
RegLmtParameters
Lab ID:
Sample ID:
RegLmt
301260003
Results Units PQL DF ByAnalyzedMDL Qualifiers
Date Collected:
Date Received:
4/22/2019 11:20
Compound Specific Isotopic - PAESAnalysis Desc: D18O Analytical Method: D18O
Hydrogen 2 (Deuterium)Isotope
Complete 1 5/14/2019 00:00 NAU n
Oxygen 18 Isotope Complete 1 5/14/2019 00:00 NAU n
220 William Pitt WayPittsburgh, PA 15238
Phone: (412) 826-5245Fax: (412) 826-3433
without the written consent of Pace Analytical Energy Services LLC.
Page 35 of 47 5/23/2019
1
2
3
4
5
6
7
8
9
10
11
12
13
14

Pace Analytical Energy Services LLC
CERTIFICATE OF ANALYSISThis report shall not be reproduced, except in full,
Report ID: 30126 - 1168162 Page 7 of 12
ANALYTICAL RESULTS
Workorder: 30126 440-239555-1
4/24/2019 11:15
21MW-2 (440-239555-4)
Matrix: Water
RegLmtParameters
Lab ID:
Sample ID:
RegLmt
301260004
Results Units PQL DF ByAnalyzedMDL Qualifiers
Date Collected:
Date Received:
4/22/2019 12:02
Compound Specific Isotopic - PAESAnalysis Desc: D18O Analytical Method: D18O
Hydrogen 2 (Deuterium)Isotope
Complete 1 5/14/2019 00:00 NAU n
Oxygen 18 Isotope Complete 1 5/14/2019 00:00 NAU n
220 William Pitt WayPittsburgh, PA 15238
Phone: (412) 826-5245Fax: (412) 826-3433
without the written consent of Pace Analytical Energy Services LLC.
Page 36 of 47 5/23/2019
1
2
3
4
5
6
7
8
9
10
11
12
13
14

Pace Analytical Energy Services LLC
CERTIFICATE OF ANALYSISThis report shall not be reproduced, except in full,
Report ID: 30126 - 1168162 Page 8 of 12
ANALYTICAL RESULTS
Workorder: 30126 440-239555-1
4/24/2019 11:15
29MW-2 (440-239555-5)
Matrix: Water
RegLmtParameters
Lab ID:
Sample ID:
RegLmt
301260005
Results Units PQL DF ByAnalyzedMDL Qualifiers
Date Collected:
Date Received:
4/22/2019 12:51
Compound Specific Isotopic - PAESAnalysis Desc: D18O Analytical Method: D18O
Hydrogen 2 (Deuterium)Isotope
Complete 1 5/14/2019 00:00 NAU n
Oxygen 18 Isotope Complete 1 5/14/2019 00:00 NAU n
220 William Pitt WayPittsburgh, PA 15238
Phone: (412) 826-5245Fax: (412) 826-3433
without the written consent of Pace Analytical Energy Services LLC.
Page 37 of 47 5/23/2019
1
2
3
4
5
6
7
8
9
10
11
12
13
14

Pace Analytical Energy Services LLC
CERTIFICATE OF ANALYSISThis report shall not be reproduced, except in full,
Report ID: 30126 - 1168162 Page 9 of 12
ANALYTICAL RESULTS
Workorder: 30126 440-239555-1
4/24/2019 11:15
21MW-5 (440-239555-6)
Matrix: Water
RegLmtParameters
Lab ID:
Sample ID:
RegLmt
301260006
Results Units PQL DF ByAnalyzedMDL Qualifiers
Date Collected:
Date Received:
4/22/2019 14:02
Compound Specific Isotopic - PAESAnalysis Desc: D18O Analytical Method: D18O
Hydrogen 2 (Deuterium)Isotope
Complete 1 5/14/2019 00:00 NAU n
Oxygen 18 Isotope Complete 1 5/14/2019 00:00 NAU n
220 William Pitt WayPittsburgh, PA 15238
Phone: (412) 826-5245Fax: (412) 826-3433
without the written consent of Pace Analytical Energy Services LLC.
Page 38 of 47 5/23/2019
1
2
3
4
5
6
7
8
9
10
11
12
13
14

Pace Analytical Energy Services LLC
CERTIFICATE OF ANALYSISThis report shall not be reproduced, except in full,
Report ID: 30126 - 1168162 Page 10 of 12
ANALYTICAL RESULTS
Workorder: 30126 440-239555-1
4/24/2019 11:15
21MW-4 (440-239555-7)
Matrix: Water
RegLmtParameters
Lab ID:
Sample ID:
RegLmt
301260007
Results Units PQL DF ByAnalyzedMDL Qualifiers
Date Collected:
Date Received:
4/22/2019 14:55
Compound Specific Isotopic - PAESAnalysis Desc: D18O Analytical Method: D18O
Hydrogen 2 (Deuterium)Isotope
Complete 1 5/14/2019 00:00 NAU n
Oxygen 18 Isotope Complete 1 5/14/2019 00:00 NAU n
220 William Pitt WayPittsburgh, PA 15238
Phone: (412) 826-5245Fax: (412) 826-3433
without the written consent of Pace Analytical Energy Services LLC.
Page 39 of 47 5/23/2019
1
2
3
4
5
6
7
8
9
10
11
12
13
14

Pace Analytical Energy Services LLC
CERTIFICATE OF ANALYSISThis report shall not be reproduced, except in full,
Report ID: 30126 - 1168162 Page 11 of 12
ANALYTICAL RESULTS QUALIFIERS
Workorder: 30126 440-239555-1
DEFINITIONS/QUALIFIERS
U
J
Indicates the compound was analyzed for, but not detected at or above the noted concentration.
Estimated concentration greater than the set method detection limit (MDL) and less than the set reporting limit (PQL).
MDL Method Detection Limit. Can be used synonymously with LOD; Limit Of Detection.
PQL Practical Quanitation Limit. Can be used synonymously with LOQ; Limit Of Quantitation.
ND Not detected at or above reporting limit.
DF Dilution Factor.
S Surrogate.
RPD Relative Percent Difference.
% Rec Percent Recovery.
The laboratory does not hold NELAP/TNI accreditation for this method or analyte.n
220 William Pitt WayPittsburgh, PA 15238
Phone: (412) 826-5245Fax: (412) 826-3433
without the written consent of Pace Analytical Energy Services LLC.
Page 40 of 47 5/23/2019
1
2
3
4
5
6
7
8
9
10
11
12
13
14

Pace Analytical Energy Services LLC
CERTIFICATE OF ANALYSISThis report shall not be reproduced, except in full,
Report ID: 30126 - 1168162 Page 12 of 12
QUALITY CONTROL DATA CROSS REFERENCE TABLE
Workorder: 30126 440-239555-1
Lab ID Sample ID Prep Method Analysis MethodPrep Batch BatchAnalysis
301260001 21MW-3 (440-239555-1) CSIA/1946D18O
301260002 21MW-1 (440-239555-2) CSIA/1946D18O
301260003 21MW-1-DUP (440-239555-3) CSIA/1946D18O
301260004 21MW-2 (440-239555-4) CSIA/1946D18O
301260005 29MW-2 (440-239555-5) CSIA/1946D18O
301260006 21MW-5 (440-239555-6) CSIA/1946D18O
301260007 21MW-4 (440-239555-7) CSIA/1946D18O
220 William Pitt WayPittsburgh, PA 15238
Phone: (412) 826-5245Fax: (412) 826-3433
without the written consent of Pace Analytical Energy Services LLC.
Page 41 of 47 5/23/2019
1
2
3
4
5
6
7
8
9
10
11
12
13
14

Page 42 of 47 5/23/2019
1
2
3
4
5
6
7
8
9
10
11
12
13
14

Page 43 of 47 5/23/2019
1
2
3
4
5
6
7
8
9
10
11
12
13
14

Page 44 of 47 5/23/2019
1
2
3
4
5
6
7
8
9
10
11
12
13
14

Page 45 of 47 5/23/2019
1
2
3
4
5
6
7
8
9
10
11
12
13
14

Page 46 of 47 5/23/2019
1
2
3
4
5
6
7
8
9
10
11
12
13
14

Login Sample Receipt Checklist
Client: Wood E&I Solutions Inc Job Number: 440-239555-1
Login Number: 239555
Question Answer Comment
Creator: Escalante, Maria I
List Source: Eurofins TestAmerica, Irvine
List Number: 1
TrueRadioactivity wasn't checked or is </= background as measured by a survey meter.
N/AThe cooler's custody seal, if present, is intact. Not present
N/ASample custody seals, if present, are intact. Not Present
TrueThe cooler or samples do not appear to have been compromised or tampered with.
TrueSamples were received on ice.
TrueCooler Temperature is acceptable.
TrueCooler Temperature is recorded.
TrueCOC is present.
TrueCOC is filled out in ink and legible.
TrueCOC is filled out with all pertinent information.
TrueIs the Field Sampler's name present on COC?
TrueThere are no discrepancies between the containers received and the COC.
TrueSamples are received within Holding Time (excluding tests with immediate HTs)
TrueSample containers have legible labels.
TrueContainers are not broken or leaking.
TrueSample collection date/times are provided.
TrueAppropriate sample containers are used.
TrueSample bottles are completely filled.
N/ASample Preservation Verified.
TrueThere is sufficient vol. for all requested analyses, incl. any requested MS/MSDs
TrueContainers requiring zero headspace have no headspace or bubble is <6mm (1/4").
TrueMultiphasic samples are not present.
TrueSamples do not require splitting or compositing.
N/AResidual Chlorine Checked.
Eurofins TestAmerica, IrvinePage 47 of 47 5/23/2019
1
2
3
4
5
6
7
8
9
10
11
12
13
14

ANALYTICAL REPORTEurofins TestAmerica, Irvine17461 Derian AveSuite 100Irvine, CA 92614-5817Tel: (949)261-1022
Laboratory Job ID: 440-244587-1Client Project/Site: Westside Water Quality Coalition
For:Wood E&I Solutions Inc1281 E. Alluvial Ave.Suite 101Fresno, California 93720
Attn: Jill Ghelerter
Authorized for release by:6/29/2019 6:48:32 AM
Saman Taeidi, Project Manager I(949)[email protected]
The test results in this report meet all 2003 NELAC and 2009 TNI requirements for accreditedparameters, exceptions are noted in this report. This report may not be reproduced except in full,and with written approval from the laboratory. For questions please contact the Project Managerat the e-mail address or telephone number listed on this page.
This report has been electronically signed and authorized by the signatory. Electronic signature isintended to be the legally binding equivalent of a traditionally handwritten signature.
Results relate only to the items tested and the sample(s) as received by the laboratory.
1
2
3
4
5
6
7
8
9
10
11
12
13

Table of Contents
Client: Wood E&I Solutions IncProject/Site: Westside Water Quality Coalition
Laboratory Job ID: 440-244587-1
Page 2 of 13Eurofins TestAmerica, Irvine
6/29/2019
Cover Page . . . . . . . . . . . . . . . . . . . . . . . . . . . . . . . . . . . . . . . . . . . . . . 1
Table of Contents . . . . . . . . . . . . . . . . . . . . . . . . . . . . . . . . . . . . . . . . . 2
Sample Summary . . . . . . . . . . . . . . . . . . . . . . . . . . . . . . . . . . . . . . . . . 3
Case Narrative . . . . . . . . . . . . . . . . . . . . . . . . . . . . . . . . . . . . . . . . . . . 4
Client Sample Results . . . . . . . . . . . . . . . . . . . . . . . . . . . . . . . . . . . . . . 5
Method Summary . . . . . . . . . . . . . . . . . . . . . . . . . . . . . . . . . . . . . . . . . 6
Lab Chronicle . . . . . . . . . . . . . . . . . . . . . . . . . . . . . . . . . . . . . . . . . . . . 7
QC Sample Results . . . . . . . . . . . . . . . . . . . . . . . . . . . . . . . . . . . . . . . . 8
QC Association Summary . . . . . . . . . . . . . . . . . . . . . . . . . . . . . . . . . . . 9
Definitions/Glossary . . . . . . . . . . . . . . . . . . . . . . . . . . . . . . . . . . . . . . . 10
Certification Summary . . . . . . . . . . . . . . . . . . . . . . . . . . . . . . . . . . . . . . 11
Chain of Custody . . . . . . . . . . . . . . . . . . . . . . . . . . . . . . . . . . . . . . . . . . 12
Receipt Checklists . . . . . . . . . . . . . . . . . . . . . . . . . . . . . . . . . . . . . . . . . 13
1
2
3
4
5
6
7
8
9
10
11
12
13

Sample SummaryJob ID: 440-244587-1Client: Wood E&I Solutions Inc
Project/Site: Westside Water Quality Coalition
Lab Sample ID Client Sample ID ReceivedCollectedMatrix Asset ID
440-244587-1 WESTC00022_20190625 Water 06/25/19 12:07 06/26/19 10:30
Eurofins TestAmerica, Irvine
Page 3 of 13 6/29/2019
1
2
3
4
5
6
7
8
9
10
11
12
13

Case NarrativeClient: Wood E&I Solutions Inc Job ID: 440-244587-1Project/Site: Westside Water Quality Coalition
Job ID: 440-244587-1
Laboratory: Eurofins TestAmerica, Irvine
Narrative
Job Narrative
440-244587-1
Receipt
The sample was received on 6/26/2019 10:30 AM; the sample arrived in good condition, properly preserved and, where required, on ice. The temperature of the cooler at receipt was 4.0º C.
HPLC/IC Method(s) 300.0: The following sample was diluted due to the nature of the sample matrix: WESTC00022_20190625 (440-244587-1).
Elevated reporting limits (RLs) are provided.
No additional analytical or quality issues were noted, other than those described above or in the Definitions/Glossary page.
Eurofins TestAmerica, IrvinePage 4 of 13 6/29/2019
1
2
3
4
5
6
7
8
9
10
11
12
13

Client Sample ResultsJob ID: 440-244587-1Client: Wood E&I Solutions Inc
Project/Site: Westside Water Quality Coalition
Lab Sample ID: 440-244587-1Client Sample ID: WESTC00022_20190625Matrix: WaterDate Collected: 06/25/19 12:07
Date Received: 06/26/19 10:30
Method: 300.0 - Anions, Ion ChromatographyRL MDL
Nitrate as N ND 1.1 0.55 mg/L 06/26/19 15:14 10
Analyte Dil FacAnalyzedPreparedUnit DResult Qualifier
Eurofins TestAmerica, Irvine
Page 5 of 13 6/29/2019
1
2
3
4
5
6
7
8
9
10
11
12
13

Method SummaryJob ID: 440-244587-1Client: Wood E&I Solutions Inc
Project/Site: Westside Water Quality Coalition
Method Method Description LaboratoryProtocol
MCAWW300.0 Anions, Ion Chromatography TAL IRV
Protocol References:
MCAWW = "Methods For Chemical Analysis Of Water And Wastes", EPA-600/4-79-020, March 1983 And Subsequent Revisions.
Laboratory References:
TAL IRV = Eurofins TestAmerica, Irvine, 17461 Derian Ave, Suite 100, Irvine, CA 92614-5817, TEL (949)261-1022
Eurofins TestAmerica, Irvine
Page 6 of 13 6/29/2019
1
2
3
4
5
6
7
8
9
10
11
12
13

Lab ChronicleClient: Wood E&I Solutions Inc Job ID: 440-244587-1Project/Site: Westside Water Quality Coalition
Client Sample ID: WESTC00022_20190625 Lab Sample ID: 440-244587-1Matrix: WaterDate Collected: 06/25/19 12:07
Date Received: 06/26/19 10:30
Analysis 300.0 NTN06/26/19 15:1410 TAL IRV554734
Type
Batch
Method
Batch
Prep Type LabAnalystRun
Prepared
or Analyzed
Initial
Amount Amount
Final Batch
NumberFactor
Dil
Total/NA
Laboratory References:
TAL IRV = Eurofins TestAmerica, Irvine, 17461 Derian Ave, Suite 100, Irvine, CA 92614-5817, TEL (949)261-1022
Eurofins TestAmerica, Irvine
Page 7 of 13 6/29/2019
1
2
3
4
5
6
7
8
9
10
11
12
13

QC Sample ResultsJob ID: 440-244587-1Client: Wood E&I Solutions Inc
Project/Site: Westside Water Quality Coalition
Method: 300.0 - Anions, Ion Chromatography
Client Sample ID: Method BlankLab Sample ID: MB 440-554734/6Matrix: Water Prep Type: Total/NAAnalysis Batch: 554734
RL MDL
Nitrate as N ND 0.11 0.055 mg/L 06/26/19 12:36 1
MB MB
Analyte Dil FacAnalyzedPreparedDUnitResult Qualifier
Client Sample ID: Lab Control SampleLab Sample ID: LCS 440-554734/5Matrix: Water Prep Type: Total/NAAnalysis Batch: 554734
Nitrate as N 1.13 1.17 mg/L 104 90 - 110
Analyte
LCS LCS
DUnitResult Qualifier %Rec
Spike
Added
%Rec.
Limits
Client Sample ID: Matrix SpikeLab Sample ID: 440-244583-C-1 MSMatrix: Water Prep Type: Total/NAAnalysis Batch: 554734
Nitrate as N 0.093 J 1.13 1.29 mg/L 106 80 - 120
Analyte
MS MS
DUnitResult Qualifier %Rec
Spike
Added
Sample
Result
Sample
Qualifier
%Rec.
Limits
Client Sample ID: Matrix Spike DuplicateLab Sample ID: 440-244583-C-1 MSDMatrix: Water Prep Type: Total/NAAnalysis Batch: 554734
Nitrate as N 0.093 J 1.13 1.28 mg/L 105 80 - 120 1 20
Analyte
MSD MSD
DUnitResult Qualifier %Rec
Spike
Added
Sample
Result
Sample
Qualifier
%Rec.
Limits LimitRPD
RPD
Eurofins TestAmerica, Irvine
Page 8 of 13 6/29/2019
1
2
3
4
5
6
7
8
9
10
11
12
13

QC Association SummaryJob ID: 440-244587-1Client: Wood E&I Solutions Inc
Project/Site: Westside Water Quality Coalition
HPLC/IC
Analysis Batch: 554734
Lab Sample ID Client Sample ID Prep Type Matrix Method Prep Batch
Water 300.0440-244587-1 WESTC00022_20190625 Total/NA
Water 300.0MB 440-554734/6 Method Blank Total/NA
Water 300.0LCS 440-554734/5 Lab Control Sample Total/NA
Water 300.0440-244583-C-1 MS Matrix Spike Total/NA
Water 300.0440-244583-C-1 MSD Matrix Spike Duplicate Total/NA
Eurofins TestAmerica, Irvine
Page 9 of 13 6/29/2019
1
2
3
4
5
6
7
8
9
10
11
12
13

Definitions/GlossaryJob ID: 440-244587-1Client: Wood E&I Solutions Inc
Project/Site: Westside Water Quality Coalition
GlossaryThese commonly used abbreviations may or may not be present in this report.
¤ Listed under the "D" column to designate that the result is reported on a dry weight basis
Abbreviation
%R Percent Recovery
CFL Contains Free Liquid
CNF Contains No Free Liquid
DER Duplicate Error Ratio (normalized absolute difference)
Dil Fac Dilution Factor
DL Detection Limit (DoD/DOE)
DL, RA, RE, IN Indicates a Dilution, Re-analysis, Re-extraction, or additional Initial metals/anion analysis of the sample
DLC Decision Level Concentration (Radiochemistry)
EDL Estimated Detection Limit (Dioxin)
LOD Limit of Detection (DoD/DOE)
LOQ Limit of Quantitation (DoD/DOE)
MDA Minimum Detectable Activity (Radiochemistry)
MDC Minimum Detectable Concentration (Radiochemistry)
MDL Method Detection Limit
ML Minimum Level (Dioxin)
NC Not Calculated
ND Not Detected at the reporting limit (or MDL or EDL if shown)
PQL Practical Quantitation Limit
QC Quality Control
RER Relative Error Ratio (Radiochemistry)
RL Reporting Limit or Requested Limit (Radiochemistry)
RPD Relative Percent Difference, a measure of the relative difference between two points
TEF Toxicity Equivalent Factor (Dioxin)
TEQ Toxicity Equivalent Quotient (Dioxin)
Eurofins TestAmerica, Irvine
Page 10 of 13 6/29/2019
1
2
3
4
5
6
7
8
9
10
11
12
13

Accreditation/Certification SummaryClient: Wood E&I Solutions Inc Job ID: 440-244587-1Project/Site: Westside Water Quality Coalition
Laboratory: Eurofins TestAmerica, IrvineThe accreditations/certifications listed below are applicable to this report.
Authority Program EPA Region Identification Number Expiration Date
California CA ELAP 27069State Program 06-30-19 *
Eurofins TestAmerica, Irvine
* Accreditation/Certification renewal pending - accreditation/certification considered valid.
Page 11 of 13 6/29/2019
1
2
3
4
5
6
7
8
9
10
11
12
13

Page 12 of 13 6/29/2019
1
2
3
4
5
6
7
8
9
10
11
12
13

Login Sample Receipt Checklist
Client: Wood E&I Solutions Inc Job Number: 440-244587-1
Login Number: 244587
Question Answer Comment
Creator: Skinner, Alma D
List Source: Eurofins TestAmerica, Irvine
List Number: 1
TrueRadioactivity wasn't checked or is </= background as measured by a survey meter.
N/AThe cooler's custody seal, if present, is intact. Not present
N/ASample custody seals, if present, are intact. Not Present
TrueThe cooler or samples do not appear to have been compromised or tampered with.
TrueSamples were received on ice.
TrueCooler Temperature is acceptable.
TrueCooler Temperature is recorded.
TrueCOC is present.
TrueCOC is filled out in ink and legible.
TrueCOC is filled out with all pertinent information.
TrueIs the Field Sampler's name present on COC?
TrueThere are no discrepancies between the containers received and the COC.
TrueSamples are received within Holding Time (excluding tests with immediate HTs)
TrueSample containers have legible labels.
TrueContainers are not broken or leaking.
TrueSample collection date/times are provided.
TrueAppropriate sample containers are used.
TrueSample bottles are completely filled.
N/ASample Preservation Verified.
TrueThere is sufficient vol. for all requested analyses, incl. any requested MS/MSDs
TrueContainers requiring zero headspace have no headspace or bubble is <6mm (1/4").
TrueMultiphasic samples are not present.
TrueSamples do not require splitting or compositing.
N/AResidual Chlorine Checked.
Eurofins TestAmerica, IrvinePage 13 of 13 6/29/2019
1
2
3
4
5
6
7
8
9
10
11
12
13

Thank you for using BSK Associates for your analytical testing needs. In the following pages, you will
find the test results for the samples submitted to our laboratory on 12/5/2018. The results have been
approved for release by our Laboratory Director as indicated by the authorizing signature below.
The samples were analyzed for the test(s) indicated on the Chain of Custody (see attached) and the
results relate only to the samples analyzed. BSK certifies that the testing was performed in
accordance with the quality system requirements specified in the 2009 TNI Standard. Any deviations
from this standard or from the method requirements for each test procedure performed will be
annotated alongside the analytical result or noted in the Case Narrative. Unless otherwise noted, the
sample results are reported on an �as received� basis.
This certificate of analysis shall not be reproduced except in full, without written approval of the laboratory.
If additional clarification of any information is required, please contact your Project Manager,
Adam Trevarrow , at (800) 877-8310 or (559) 497-2888 x116.
Thank you again for using BSK Associates. We value your business and appreciate your loyalty.
Sincerely,
Amec Foster Wheeler
Fresno, CA 93720
1281 E. Alluvial, Ste. 101
Dear Jill Ghelerter,
Jill Ghelerter
12/18/2018
A8L0619
RE: Report for A8L0619 Westside Water Quality Coalition
Adam Trevarrow, Project Manager
Accredited in Accordance with NELAP
ORELAP #4021-009
BSK Associates Laboratory Fresno
1414 Stanislaus St
Fresno, CA 93706
559-497-2888 (Main)
559-485-6935 (FAX)Invoice: A837217
www.BSKAssociates.com
The results in this report apply to the samples analyzed in
accordance with the chain of custody document. This
analytical report must be reproduced in its entirety.
A8L0619 FINAL 12182018 1246
Page 1 of 10

A8L0619
Westside Water Quality Coalition
Case Narrative
Project and Report Details
Client: Amec Foster Wheeler
Report To:
Project #:
Received: 12/05/2018 - 12:00
Jill Ghelerter
Invoice To:
Invoice Attn:
Amec Foster Wheeler
Cheryl Baldwin
Project PO#: FR1216043A.011
Report Due: 12/19/2018
Invoice Details
FR1216043A.011
Sample Receipt Conditions
Default CoolerCooler:
Temperature on Receipt ºC: 2.9
Containers Intact
COC/Labels Agree
Preservation Confirmed
Received On Wet Ice
Sample(s) arrived at lab on same day sampled.
Packing Material - Other
Sample(s) were received in temperature range.
Initial receipt at BSK-FAL
Data Qualifiers
The following qualifiers have been applied to one or more analytical results:
MS1.0 Matrix spike recoveries exceed control limits.
MS1.4 Matrix spike recovery data unreliable due to significant parent sample concentration relative to fortification level (>4x).
Recipient(s) Report Format
Report Distribution
CC:
Jill Ghelerter FINAL.RPT
Joshua Spink FINAL.RPT
Leslie Purvis FINAL.RPT
www.BSKAssociates.com
The results in this report apply to the samples analyzed in
accordance with the chain of custody document. This
analytical report must be reproduced in its entirety.
A8L0619 FINAL 12182018 1246
Page 2 of 10

Certificate of Analysis
A8L0619Westside Water Quality Coalition
FR1216043A.011
Sample Description: WESTC0002220181205
Sample ID: A8L0619-01 12/05/18 - 09:29
Sampled By:
Grab
Steve Velasquez Water
Sample Date - Time:
Matrix:
Sample Type:
BSK Associates Laboratory Fresno
General Chemistry
ResultAnalyte RL Prepared AnalyzedRL
MultUnitsMethod Batch Qual
3.0 mg/LAlkalinity as CaCO3 SM 2320B 12/10/18 12/10/18A818406130 1
3.0 mg/LBicarbonate as CaCO3 SM 2320B 12/10/18 12/10/18A818406130 1
3.0 mg/LCarbonate as CaCO3 SM 2320B 12/10/18 12/10/18A818406ND 1
3.0 mg/LHydroxide as CaCO3 SM 2320B 12/10/18 12/10/18A818406ND 1
5.0 mg/LChloride EPA 300.0 12/06/18 12/06/18A8182291000 5
5.0 mg/LSulfate as SO4 EPA 300.0 12/06/18 12/06/18A8182291600 5
5.0 mg/LTotal Dissolved Solids SM 2540C 12/11/18 12/17/18A8184843700 1
0.10 mg/LTotal Nitrogen 0.24
0.10 mg/LTotal Oxidizable Nitrogen, as N SM 4500-NO3 F 12/11/18 12/11/18A8184690.24 1
Metals
ResultAnalyte RL Prepared AnalyzedRL
MultUnitsMethod Batch Qual
0.10 mg/LBoron EPA 200.7 12/07/18 12/11/18A818316 MS1.44.1 1
0.10 mg/LCalcium EPA 200.7 12/07/18 12/11/18A818316 MS1.4330 1
0.10 mg/LMagnesium EPA 200.7 12/07/18 12/11/18A818316 MS1.4100 1
2.0 mg/LPotassium EPA 200.7 12/07/18 12/11/18A8183168.1 1
1.0 mg/LSodium EPA 200.7 12/07/18 12/11/18A818316 MS1.4800 1
www.BSKAssociates.com
The results in this report apply to the samples analyzed in
accordance with the chain of custody document. This
analytical report must be reproduced in its entirety.
A8L0619 FINAL 12182018 1246
Page 3 of 10

A8L0619
Westside Water Quality Coalition
BSK Associates Laboratory Fresno
General Chemistry Quality Control Report
Analyte Result Units Level
Spike
Result %REC Limits RPD Limit QualRL
Source %REC RPD Date
Analyzed
Batch: A818229 Prepared: 12/6/2018
Analyst: BCBPrep Method: Method Specific Preparation
EPA 300.0 - Quality Control
Blank (A818229-BLK1)
Chloride ND mg/L1.0 12/06/18
Sulfate as SO4 ND mg/L1.0 12/06/18
Blank Spike (A818229-BS1)
90-11098Chloride 10098 mg/L1.0 ND 12/06/18
90-11097Sulfate as SO4 10097 mg/L1.0 ND 12/06/18
Matrix Spike (A818229-MS1), Source: A8L0627-01
80-120100Chloride 5060 mg/L1.0 10 12/06/18
80-12099Sulfate as SO4 5059 mg/L1.0 8.9 12/06/18
Matrix Spike Dup (A818229-MSD1), Source: A8L0627-01
2080-120101 0Chloride 5061 mg/L1.0 10 12/06/18
2080-120100 0Sulfate as SO4 5059 mg/L1.0 8.9 12/06/18
Batch: A818406 Prepared: 12/10/2018
Analyst: CEGPrep Method: Method Specific Preparation
SM 2320B - Quality Control
Blank (A818406-BLK1)
Alkalinity as CaCO3 ND mg/L3.0 12/10/18
Bicarbonate as CaCO3 ND mg/L3.0 12/10/18
Carbonate as CaCO3 ND mg/L3.0 12/10/18
Hydroxide as CaCO3 ND mg/L3.0 12/10/18
Blank Spike (A818406-BS1)
80-12095Alkalinity as CaCO3 10095 mg/L3.0 ND 12/10/18
Blank Spike Dup (A818406-BSD1)
2080-12096 1Alkalinity as CaCO3 10096 mg/L3.0 ND 12/10/18
Duplicate (A818406-DUP1), Source: A8L0523-04
100Alkalinity as CaCO3 140 mg/L3.0 140 12/10/18
100Bicarbonate as CaCO3 140 mg/L3.0 140 12/10/18
10Carbonate as CaCO3 ND mg/L3.0 ND 12/10/18
10Hydroxide as CaCO3 ND mg/L3.0 ND 12/10/18
Batch: A818484 Prepared: 12/11/2018
Analyst: DEP SYYPrep Method: Method Specific Preparation
SM 2540C - Quality Control
Blank (A818484-BLK1)
Total Dissolved Solids ND mg/L5.0 12/17/18
www.BSKAssociates.com
The results in this report apply to the samples analyzed in
accordance with the chain of custody document. This
analytical report must be reproduced in its entirety.
A8L0619 FINAL 12182018 1246
Page 4 of 10

A8L0619
Westside Water Quality Coalition
BSK Associates Laboratory Fresno
General Chemistry Quality Control Report
Analyte Result Units Level
Spike
Result %REC Limits RPD Limit QualRL
Source %REC RPD Date
Analyzed
Batch: A818484 Prepared: 12/11/2018
Analyst: DEP SYYPrep Method: Method Specific Preparation
SM 2540C - Quality Control
Blank Spike (A818484-BS1)
70-13096Total Dissolved Solids 1000960 mg/L5.0 ND 12/17/18
Duplicate (A818484-DUP1), Source: A8L0021-01
204Total Dissolved Solids 53 mg/L5.0 51 12/17/18
Duplicate (A818484-DUP2), Source: A8L0532-08
200Total Dissolved Solids 710 mg/L5.0 710 12/17/18
Batch: A818469 Prepared: 12/11/2018
Analyst: CEGPrep Method: Method Specific Preparation
SM 4500-NO3 F - Quality Control
Blank (A818469-BLK1)
Total Oxidizable Nitrogen, as N ND mg/L0.10 12/11/18
Blank Spike (A818469-BS1)
80-120101Total Oxidizable Nitrogen, as N 1010 mg/L0.10 ND 12/11/18
Blank Spike Dup (A818469-BSD1)
2080-120101 1Total Oxidizable Nitrogen, as N 1010 mg/L0.10 ND 12/11/18
Matrix Spike (A818469-MS1), Source: A8K3461-01
80-12098Total Oxidizable Nitrogen, as N 1011 mg/L0.10 1.4 12/11/18
Matrix Spike (A818469-MS2), Source: A8L0762-02
80-12095Total Oxidizable Nitrogen, as N 109.9 mg/L0.10 0.45 12/11/18
Matrix Spike Dup (A818469-MSD1), Source: A8K3461-01
2080-12098 0Total Oxidizable Nitrogen, as N 1011 mg/L0.10 1.4 12/11/18
Matrix Spike Dup (A818469-MSD2), Source: A8L0762-02
2080-12096 1Total Oxidizable Nitrogen, as N 1010 mg/L0.10 0.45 12/11/18
www.BSKAssociates.com
The results in this report apply to the samples analyzed in
accordance with the chain of custody document. This
analytical report must be reproduced in its entirety.
A8L0619 FINAL 12182018 1246
Page 5 of 10
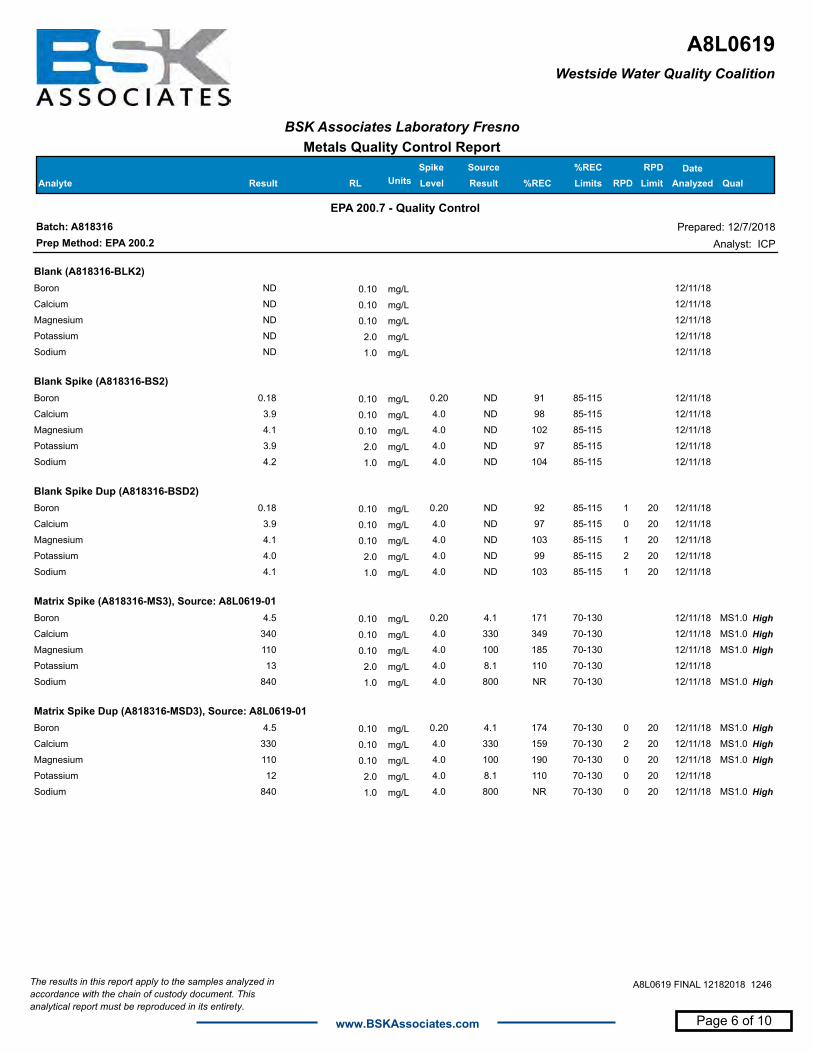
A8L0619
Westside Water Quality Coalition
BSK Associates Laboratory Fresno
Metals Quality Control Report
Analyte Result Units Level
Spike
Result %REC Limits RPD Limit QualRL
Source %REC RPD Date
Analyzed
Batch: A818316 Prepared: 12/7/2018
Analyst: ICPPrep Method: EPA 200.2
EPA 200.7 - Quality Control
Blank (A818316-BLK2)
Boron ND mg/L0.10 12/11/18
Calcium ND mg/L0.10 12/11/18
Magnesium ND mg/L0.10 12/11/18
Potassium ND mg/L2.0 12/11/18
Sodium ND mg/L1.0 12/11/18
Blank Spike (A818316-BS2)
85-11591Boron 0.200.18 mg/L0.10 ND 12/11/18
85-11598Calcium 4.03.9 mg/L0.10 ND 12/11/18
85-115102Magnesium 4.04.1 mg/L0.10 ND 12/11/18
85-11597Potassium 4.03.9 mg/L2.0 ND 12/11/18
85-115104Sodium 4.04.2 mg/L1.0 ND 12/11/18
Blank Spike Dup (A818316-BSD2)
2085-11592 1Boron 0.200.18 mg/L0.10 ND 12/11/18
2085-11597 0Calcium 4.03.9 mg/L0.10 ND 12/11/18
2085-115103 1Magnesium 4.04.1 mg/L0.10 ND 12/11/18
2085-11599 2Potassium 4.04.0 mg/L2.0 ND 12/11/18
2085-115103 1Sodium 4.04.1 mg/L1.0 ND 12/11/18
Matrix Spike (A818316-MS3), Source: A8L0619-01
MS1.070-130171Boron 0.20 High4.5 mg/L0.10 4.1 12/11/18
MS1.070-130349Calcium 4.0 High340 mg/L0.10 330 12/11/18
MS1.070-130185Magnesium 4.0 High110 mg/L0.10 100 12/11/18
70-130110Potassium 4.013 mg/L2.0 8.1 12/11/18
MS1.070-130NRSodium 4.0 High840 mg/L1.0 800 12/11/18
Matrix Spike Dup (A818316-MSD3), Source: A8L0619-01
20 MS1.070-130174 0Boron 0.20 High4.5 mg/L0.10 4.1 12/11/18
20 MS1.070-130159 2Calcium 4.0 High330 mg/L0.10 330 12/11/18
20 MS1.070-130190 0Magnesium 4.0 High110 mg/L0.10 100 12/11/18
2070-130110 0Potassium 4.012 mg/L2.0 8.1 12/11/18
20 MS1.070-130NR 0Sodium 4.0 High840 mg/L1.0 800 12/11/18
www.BSKAssociates.com
The results in this report apply to the samples analyzed in
accordance with the chain of custody document. This
analytical report must be reproduced in its entirety.
A8L0619 FINAL 12182018 1246
Page 6 of 10
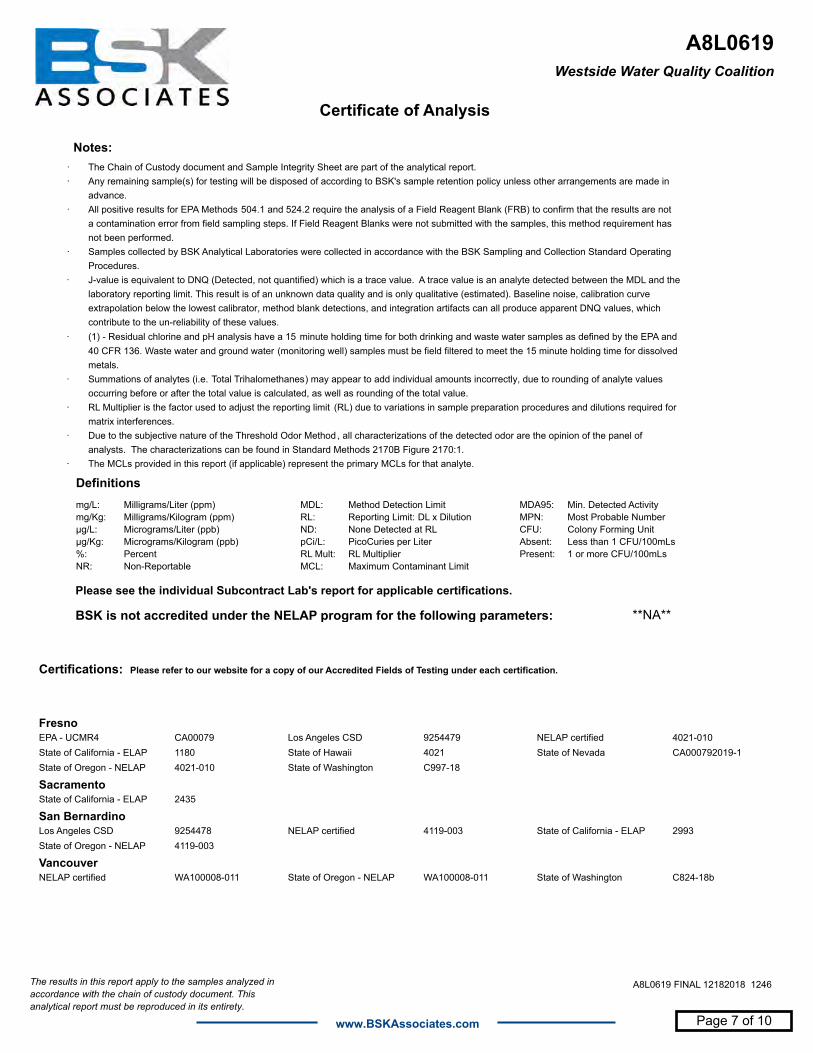
A8L0619
Westside Water Quality Coalition
Certificate of Analysis
Notes:
· The Chain of Custody document and Sample Integrity Sheet are part of the analytical report.
· Any remaining sample(s) for testing will be disposed of according to BSK's sample retention policy unless other arrangements are made in
advance.
· All positive results for EPA Methods 504.1 and 524.2 require the analysis of a Field Reagent Blank (FRB) to confirm that the results are not
a contamination error from field sampling steps. If Field Reagent Blanks were not submitted with the samples, this method requirement has
not been performed.
· Samples collected by BSK Analytical Laboratories were collected in accordance with the BSK Sampling and Collection Standard Operating
Procedures.
· J-value is equivalent to DNQ (Detected, not quantified) which is a trace value. A trace value is an analyte detected between the MDL and the
laboratory reporting limit. This result is of an unknown data quality and is only qualitative (estimated). Baseline noise, calibration curve
extrapolation below the lowest calibrator, method blank detections, and integration artifacts can all produce apparent DNQ values, which
contribute to the un-reliability of these values.
· (1) - Residual chlorine and pH analysis have a 15 minute holding time for both drinking and waste water samples as defined by the EPA and
40 CFR 136. Waste water and ground water (monitoring well) samples must be field filtered to meet the 15 minute holding time for dissolved
metals.
· Summations of analytes (i.e. Total Trihalomethanes) may appear to add individual amounts incorrectly, due to rounding of analyte values
occurring before or after the total value is calculated, as well as rounding of the total value.
· RL Multiplier is the factor used to adjust the reporting limit (RL) due to variations in sample preparation procedures and dilutions required for
matrix interferences.
· Due to the subjective nature of the Threshold Odor Method , all characterizations of the detected odor are the opinion of the panel of
analysts. The characterizations can be found in Standard Methods 2170B Figure 2170:1.
· The MCLs provided in this report (if applicable) represent the primary MCLs for that analyte.
Definitions
mg/L: Milligrams/Liter (ppm)
mg/Kg: Milligrams/Kilogram (ppm)
µg/L: Micrograms/Liter (ppb)
µg/Kg: Micrograms/Kilogram (ppb)
%: Percent
NR: Non-Reportable
MDL: Method Detection Limit
RL: Reporting Limit: DL x Dilution
ND: None Detected at RL
pCi/L: PicoCuries per Liter
RL Mult: RL Multiplier
MCL: Maximum Contaminant Limit
MDA95: Min. Detected Activity
MPN: Most Probable Number
CFU: Colony Forming Unit
Absent: Less than 1 CFU/100mLs
Present: 1 or more CFU/100mLs
BSK is not accredited under the NELAP program for the following parameters: **NA**
Please see the individual Subcontract Lab's report for applicable certifications.
Certifications: Please refer to our website for a copy of our Accredited Fields of Testing under each certification.
Fresno
CA00079EPA - UCMR4 9254479Los Angeles CSD 4021-010NELAP certified
1180State of California - ELAP 4021State of Hawaii CA000792019-1State of Nevada
4021-010State of Oregon - NELAP C997-18State of Washington
Sacramento
2435State of California - ELAP
San Bernardino
9254478Los Angeles CSD 4119-003NELAP certified 2993State of California - ELAP
4119-003State of Oregon - NELAP
Vancouver
WA100008-011NELAP certified WA100008-011State of Oregon - NELAP C824-18bState of Washington
www.BSKAssociates.com
The results in this report apply to the samples analyzed in
accordance with the chain of custody document. This
analytical report must be reproduced in its entirety.
A8L0619 FINAL 12182018 1246
Page 7 of 10

Page 8 of 10

Page 9 of 10

Page 10 of 10

Project Name: Chevron Lost Hills-2019 Post Closure Monitoring Project No.: 0075802017.003Date: 4/29-4/30/2019 Tested By: LT
Wet Soil
and Tare
(gr)
Dry Soil
and Tare
(gr)
Tare No.
Tare
Weight
(gr)
Moisture
Content
(%)
308.72 288.98 1 97.18 10.3
375.78 345.31 15 97.09 12.3
Page 1 of 1
Soil Description
Light Olive Brown (2.5Y, 5/4) Sandy Lean Clay (CL)
Olive Brown (2.5Y, 4/4) Sandy Lean Clay (CL)
MOISTURE CONTENTASTM D2216
Sample ID
Soil-2019-1.5
Soil-2019-3.0

Appendix C Time Concentration Charts

I:\7000s\7580.000\Archive\7580-192.xlsx
0
10
20
30
40
50
60
70Ja
n-04
Jan-
05
Jan-
06
Jan-
07
Jan-
08
Jan-
09
Jan-
10
Jan-
11
Jan-
12
Jan-
13
Jan-
14
Jan-
15
Jan-
16
Jan-
17
Jan-
18
Jan-
19
Jan-
20
Con
cent
ratio
n, m
illig
ram
s pe
r lite
r
21MW-1 21MW-2 21MW-3 21MW-4
21MW-5 29MW-1 29MW-2 Cleanup Level
Explanation
06/07/2019LKP 0075802017
Boron ConcentrationsFormer Section 29 Surface Impoundments
Lost Hills, California
C-1Date: By: Project No.:
Figure

I:\7000s\7580.000\Archive\7580-192C2-Ca TC
0
500
1,000
1,500
2,000
2,500
3,000
Jan-
04
Jan-
05
Jan-
06
Jan-
07
Jan-
08
Jan-
09
Jan-
10
Jan-
11
Jan-
12
Jan-
13
Jan-
14
Jan-
15
Jan-
16
Jan-
17
Jan-
18
Jan-
19
Jan-
20
Con
cent
ratio
n, m
illig
ram
s pe
r lite
r
21MW-1 21MW-2 21MW-3 21MW-4
21MW-5 29MW-1 29MW-2
Explanation
06/07/2019LKP 0075802017
Calcium ConcentrationsFormer Section 29 Surface Impoundments
Lost Hills, California
C-2Date: By: Project No.:
Figure

I:\7000s\7580.000\Archive\7580-192C3-Cl TC
0
2,000
4,000
6,000
8,000
10,000
12,000
14,000
16,000
Jan-
04
Jan-
05
Jan-
06
Jan-
07
Jan-
08
Jan-
09
Jan-
10
Jan-
11
Jan-
12
Jan-
13
Jan-
14
Jan-
15
Jan-
16
Jan-
17
Jan-
18
Jan-
19
Jan-
20
Con
cent
ratio
n, m
illig
ram
s pe
r lite
r
21MW-1 21MW-2 21MW-3 21MW-4
21MW-5 29MW-1 29MW-2 Cleanup Level
Explanation
06/07/2019LKP 0075802017
Chloride ConcentrationsFormer Section 29 Surface Impoundments
Lost Hills, California
C-3Date: By: Project No.:
Figure

I:\7000s\7580.000\Archive\7580-192C4-Na TC
0
1,000
2,000
3,000
4,000
5,000
6,000
7,000
8,000
9,000
10,000
Jan-
04
Jan-
05
Jan-
06
Jan-
07
Jan-
08
Jan-
09
Jan-
10
Jan-
11
Jan-
12
Jan-
13
Jan-
14
Jan-
15
Jan-
16
Jan-
17
Jan-
18
Jan-
19
Jan-
20
Con
cent
ratio
n, m
illig
ram
s pe
r lite
r
21MW-1 21MW-2 21MW-3 21MW-4
21MW-5 29MW-1 29MW-2
Explanation
06/07/2019LKP 0075802017
Sodium ConcentrationsFormer Section 29 Surface Impoundments
Lost Hills, California
C-4Date: By: Project No.:
Figure

I:\7000s\7580.000\Archive\7580-192C5-So4 TC
0
500
1,000
1,500
2,000
2,500
3,000
3,500
Jan-
04
Jan-
05
Jan-
06
Jan-
07
Jan-
08
Jan-
09
Jan-
10
Jan-
11
Jan-
12
Jan-
13
Jan-
14
Jan-
15
Jan-
16
Jan-
17
Jan-
18
Jan-
19
Jan-
20
Con
cent
ratio
n, m
illig
ram
s pe
r lite
r
21MW-1 21MW-2 21MW-3 21MW-4
21MW-5 29MW-1 29MW-2
Explanation
06/07/2019LKP 0075802017
Sulfate ConcentrationsFormer Section 29 Surface Impoundments
Lost Hills, California
C-5Date: By: Project No.:
Figure

I:\7000s\7580.000\Archive\7580-192C6-TDS TC
0
5,000
10,000
15,000
20,000
25,000
30,000
35,000
Jan-
04
Jan-
05
Jan-
06
Jan-
07
Jan-
08
Jan-
09
Jan-
10
Jan-
11
Jan-
12
Jan-
13
Jan-
14
Jan-
15
Jan-
16
Jan-
17
Jan-
18
Jan-
19
Jan-
20
Con
cent
ratio
n, m
illig
ram
s pe
r lite
r
21MW-1 21MW-2 21MW-3 21MW-4
21MW-5 29MW-1 29MW-2 Cleanup Level
Explanation
06/07/2019LKP 0075802017
Total Dissolved Solids ConcentrationsFormer Section 29 Surface Impoundments
Lost Hills, California
C-6Date: By: Project No.:
Figure
Appendix D Cover Inspection Documents

Wood Environment & Infrastructure Solutions, Inc. 1281 East Alluvial Avenue, Suite 101
Fresno, CA 93720-2659 USA
T: 559-264-2535
www.woodplc.com
‘Wood’ is a trading name for John Wood Group PLC and its subsidiaries
December 18, 2018 Project 0075802017 Ms. Linh Vo Chevron North America Exploration and Production 9525 Camino Media, Room C-1020 Bakersfield, California 93311 Subject: Post-Storm Impoundment Inspection and Repair Former Section 29 Surface Impoundments, Lost Hills, California Dear Ms. Vo: Wood Environment & Infrastructure Solutions, Inc. (Wood), has prepared this letter on behalf of Chevron North America Exploration and Production (Chevron) to describe post-storm inspection and repair activities at Chevron’s former Section 29 Surface Impoundments (impoundments) located in the Lost Hills Oil Field (Figure 1). Background information, inspection information, and repair documentation are presented in the following sections.
Background Waste Discharge Requirements Order No. R5-2013-0056 and its associated Monitoring and Reporting Program (MRP) were issued to Chevron on May 31, 2013, by the Central Valley California Regional Water Quality Control Board. The MRP includes two provisions for cover inspections: (1) an annual inspection to be performed after the rainy season has concluded, and (2) a post-storm inspection to be performed after significant rain events. In January 2018, the impoundment cover was re-seeded in areas of sparse vegetation, as recommended in the Annual 2017 Post-Closure Monitoring Report.1 In May 2018, the annual inspection was completed by Mr. Howard Barlow, Principal Geotechnical Engineer of Wood. In September 2018, Chevron performed a supplemental inspection. Wood and Chevron inspection documents were provided in the Annual 2018 Post-Closure Monitoring Report.2
Post-Storm Inspection After a rainfall event on October 2, 2018, Chevron personnel performed a post-storm inspection of the impoundments. The post-storm event inspection was performed in accordance with the MRP. During the
1 Amec Foster Wheeler, Inc., 2017, Annual 2017 Post-Closure Monitoring Report, Former Section 29 Surface Impoundments, Lost Hills, California, October 26. 2 Wood Environment & Infrastructure Solutions, Inc., 2018, Annual 2018 Post-Closure Monitoring Report, Former Section 29 Surface Impoundments, Lost Hills, California, October 17.

Ms. Linh Vo Chevron North America Exploration and Production
December 18, 2018 Page 2
inspection, Chevron personnel observed eight areas of potential storm water damage to the impoundment cover soil (Fi gure 2).
Recommendations Mr. Barlow reviewed photographs of the eight areas of potential storm water damage observed by Chevron personnel. The eight locations identified by Chevron personnel were sparsely vegetated. Shallow erosion rill s were observed in locations 2, 4, 5, 7, and 8. Repair in these areas was recommended to prevent progressive worsening of the erosion during future precipitation events.
Mr. Barlow recommend ed the following:
• Scarify the affected areas at least 5 feet on either side of the erosion to a depth of 3 inches, adding sufficient soil from the borrow area used to construct the cover to fill the erosion rills.
• Moisture-condition the soils to a moisture content above optimum.
• Compact the soils to a minimum of 85 percent of the maximum dry density as determined by ASTM International D 1557 test procedures.
• Re-seed the locations that exhibited sparse vegetation; re-seeding should take place during the rainy season so that a healthy vegetative cover may be established in these areas.
Repairs The impoundment cover was repaired in November 2018 under the supervision of Chevron personnel. The repairs were completed in accordance with the MRP and are described in Chevron 's 2018 Cover Repair Documentation (attached).
Wood appreciates being of service to Chevron. If you have any questions or need additional information, please contact us.
Sincerely, Wood Environment & Infrastructure Solutions, Inc.
Leslie K. Purvi s, LEP Environmental Scientist
/:\7000s\ 7580. 000\Archive\7580-170.docx
(Submitted Electroni cally)
Attachments: Figure 1 - Site Location Map
Principal Geotechnical Engineer
Figure 2 - Site Plan and Inspection Locations Chevron's Inspection and Repair Report
cc: Mr. Ron Holcomb, California Regional Water Quality Control Board
• • •

SITE
California
)
SITE
Lost HillsLo
s Rios
St
Lost
Hills
Rd
R 345
R 345
R 345
Brown M
ateria
l Rd
Holloway Rd
G P Rd
Lost
Hills
Rd
Paso Robles Hwy
Site Location MapFormer Section 29 Surface Impoundments
Lost Hills, California
1Project No.: 007580
Figure
Date: 7/10/2018By: SCM0 2,000 4,0001,000Approximate Scale in Feet
0 500 1,000250Approximate Scale in Meters
Dat
e: 7
/10/
2018
Pr
inte
d by
: sco
tt.m
itche
ll2Pa
th: N
:\700
0s\0
0758
0\gi
s\m
aps\
2018
\Ann
ual_
Cov
er_I
nspe
ctio
n\_f
ig01
_Site
Loca
tionM
ap.m
xd

!A
!A
!A!A
!A
!A
!A
!A
1
2
34
5
6
7
8
G P Rd Sec. 20, Twp. 26S, Rng. 21ESec. 29, Twp. 26S, Rng. 21E
Source: Esri, DigitalGlobe, GeoEye, Earthstar Geographics, CNES/Airbus DS, USDA, USGS,AeroGRID, IGN, and the GIS User Community
Site Plan and Inspection ObservationsFormer Section 29 Surface Impoundments
Lost Hills, California
2Project No.: 007580
Figure
Basemap modified from
Date: 12/18/2018By: SCM
Date: 12/18/2018 Printed by: scott.mitchell2Path: N:\7000s\007580\gis\maps\2018\Post-Storm_Cover_Inspection\_fig02_SitePlan_InspLocs.mxd
0 250 500125
Approximate Scale in Feet
0 50 10025
Approximate Scale in Meters
Explanation
!A Erosion locations observed during October 8, 2018 post-storm inspection
Cover boundary

Linh Vo Environmental Specialist Health, Environment and Safety
San Joaquin Valley Business Unit Chevron North America Exploration and Production P. O. Box 1392 Bakersfield, CA 93302 Tel 661 654 7983 Fax 661 412 6034 Mobile 661-437-1546 [email protected]
Former Section 29 Surface Impoundments 2018 Cover Repair Documentation – Post Storm Lost Hills Oil Field, Kern County, California Background: On October 8, 2018, Chevron performed an inspection of potential storm water damage for the impoundments in accordance with the provisions of Waste Discharge Requirements Order No. R5-2013-0056 and its associated Monitoring and Reporting Program, which were issued to Chevron on May 31, 2013, by the Central Valley Regional Water Quality Control Board. Mr. Stone walked the impoundments to look for depressions in the cover, erosion gullies, and damage to the cover that could provide access for surface water to infiltrate the subsurface beneath the impoundment cover, if left uncorrected. Inspection Results: The eight locations of potential storm water damage were identified and photographed on October 8, 2018 by Mr. Stone, Chevron personnel. The eight locations identified by Mr. Stone were sparsely vegetated. Mr. Howard Barlow, Principal Geotechnical Engineer of Wood, reviewed the photographs and recommended to repair five locations (2, 4, 5, 7, and 8), which have shallow erosion rills in order to prevent progressive worsening of the erosion during future precipitation events. Mr. Barlow indicated that repair to the impoundment cover should consist of scarifying the affected area in a direction perpendicular to the slope of the cover for a distance of at least 5 feet on either side of the erosion and to a depth of 3 inches. If additional soil is required to fill the erosion rills, it should be obtained from the same borrow source that was used to construct the cover. The cover soil should be conditioned to a moisture content above optimum and compacted to a minimum of 85 percent of the maximum dry density as determined by ASTM International D 1557 test procedures. The reworked area should be reseeded before the start of the next rainy season so that a healthy vegetative cover may be established.

2
Cover Repairs Completed: On November 6, 2018, Sturgeon Services worked on behalf of Chevron to repair the erosion rill identified on the former Section 29 surface impoundment cover. Surface repairs were completed at 7 of the 8 locations. Location 4 could not be field verified; no erosion was observed in this location during later site visits, so no repairs were performed at this location. The soil surface at each site was scraped with a motor grader to an approximate depth of 1 foot. The soil was removed from the erosion areas and processed with water. Once the soil was processed, the soil was returned to the erosion areas and re-compacted with the wheel of the motor grader to reach 85% compaction. The area was then tested for compaction. Before and after photographs are provided to document the repair completed at each site. The photos used to show the “before” repaired condition were taken during the October 8, 2018 post storm inspection. Post repair photos provided for the site, represent the current condition at the location after the repairs were complete. Revegetation: Chevron will reseed the repaired areas during the rainy season, based on the amount of precipitation to promote the germination of the seed.

3
Before / After Photographs: Location #1 Before After
Location #2 Before After

4
Location #3 Before After
Location #4 Before After
Could not be field verified. Erosion was not observed during later site visits and no repairs were made.

5
Location #5 Before After
Location #6 Before After

6
Location #7 Before After
Location #8 Before After

1
Purvis, Leslie
From: Vo, Linh My <[email protected]>Sent: Monday, January 21, 2019 2:34 PMTo: Purvis, LeslieCc: Johnson, Jeffery WSubject: RE: DRAFT: post-storm inspection and repairs, former Section 29 impoundments
Hi Leslie, We had McCormick reseed the repaired areas on Dec 26, 2018. Please capture this in the next report. Thanks, Linh M. Vo ●● HES Specialist ‐ Project Development Support San Joaquin Valley Business Unit Chevron North America Exploration and Production 9525 Camino Media. Bakersfield, CA 93311 Tel: 661‐412‐6034 Cell: 661‐437‐1546 From: Purvis, Leslie <[email protected]> Sent: Tuesday, December 18, 2018 2:18 PM To: Vo, Linh My <[email protected]> Cc: Johnson, Jeffery W <[email protected]>; Barlow, Howard <[email protected]>; Charrette, Kalyn <[email protected]> Subject: [**EXTERNAL**] DRAFT: post‐storm inspection and repairs, former Section 29 impoundments Importance: High
Linh, The draft impoundment report by Wood is attached, for your review. Please provide comments or approval to publish at your earliest convenience; the final report should be uploaded to GeoTracker by December 20. Thanks, Leslie Purvis, LEP Technical Professional 3-Environmental Science Direct: 559-892-2921 Mobile: 559-307-7063 www.woodplc.com

Wood Environment & Infrastructure Solutions, Inc.
1281 East Alluvial Avenue, Suite 101
Fresno, CA 93720-2659
USA
T: 559-264-2535
www.woodplc.com
‘Wood’ is a trading name for John Wood Group PLC and its subsidiaries
May 24, 2019
Project 0075802017
Ms. Linh Vo
Chevron North America Exploration and Production
9525 Camino Media, Room 2038B
Bakersfield, CA 93311
Subject: March 2019 Post-Storm Assessment and Repair
Former Section 29 Impoundments, Lost Hills Oil Field
Dear Ms. Vo:
Wood Environment & Infrastructure Solutions, Inc. (Wood), has prepared this letter on behalf of Chevron
North America Exploration and Production (Chevron) to describe post-storm inspection and repair
activities at Chevron’s former Section 29 Surface Impoundments (impoundments) located in the Lost Hills
Oil Field (Figure 1). Background information, inspection information, and repair documentation are
presented in the following sections.
Background
Waste Discharge Requirements Order No. R5-2013-0056 and its associated Monitoring and Reporting
Program (MRP) were issued to Chevron on May 31, 2013, by the Central Valley California Regional Water
Quality Control Board (RWQCB). The MRP includes two provisions for cover inspections: (1) an annual
inspection to be performed after the rainy season has concluded, and (2) a post-storm inspection to be
performed after significant rain events.
Post-Storm Inspection
On March 5, 2019, a rain event occurred at the Chevron former Section 29 impoundments. Chevron
personnel inspected the impoundments on March 12, 2019, and provided a post-storm report,
photographs, and GPS location information to Wood. Chevron requested that a Wood engineer review
the post-storm report and photographs and make repair recommendations as warranted.
Recommendations
Howard Barlow, Principal Engineer of Wood, reviewed the post-storm report and photographs, which
identified four areas of potential erosion. The general locations of the four areas are shown on Figure 2.
Mr. Barlow’s observations and recommendations are included in the following paragraphs.
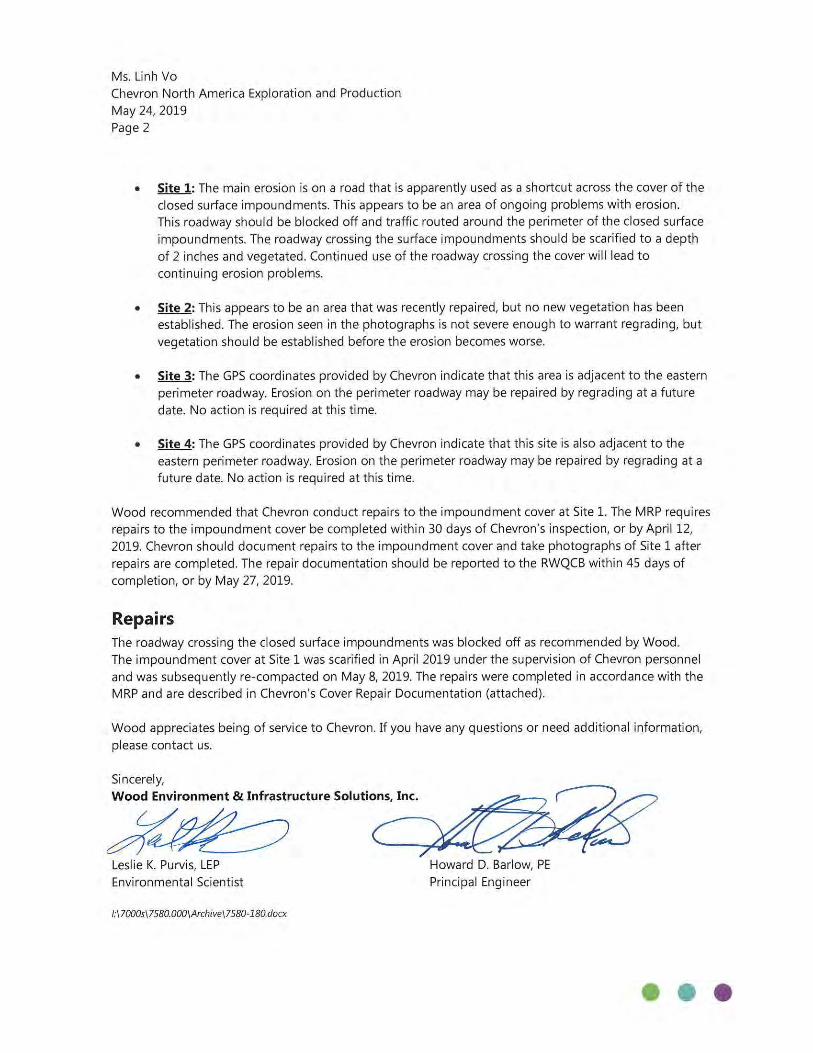
Ms. Linh Vo Chevron North America Exploration and Production May 24,2019 Page 2
• Site 1: The main erosion is on a road that is apparently used as a shortcut across the cover of the closed surface impoundments. This appears to be an area of ongoing problems with erosion. This roadway should be blocked off and traffic routed around the perimeter of the closed surface impoundments. The roadway crossing the surface impoundments shou ld be scarified to a depth of 2 inches and vegetated. Continued use of the roadway crossing the cover wi ll lead to continuing erosion problems.
• Site 2: This appears to be an area that was recently repaired, but no new vegetation has been established. The erosion seen in the photographs is not severe enough to warrant regrading, but vegetation should be established before the erosion becomes worse.
• Site 3: The GPS coordinates provided by Chevron indicate that this area is adjacent to the eastern perimeter roadway. Erosion on the perimeter roadway may be repaired by regrading at a future
date. No action is required at this t ime.
• Site 4: The GPS coordinates provided by Chevron indicate that this site is also adjacent to the eastern perimeter roadway. Erosion on the perimeter roadway may be repaired by regrad ing at a future date. No action is required at this time.
Wood recommended that Chevron conduct repairs to the impoundment cover at Site 1. The MRP requ ires repairs to the impoundment cover be completed within 30 days of Chevron's inspection, or by April 12, 2019. Chevron should document repairs to the impoundment cover and take photographs of Site 1 after repairs are completed. The repair documentation should be reported to the RWQCB within 45 days of completion, or by May 27, 2019.
Repairs The roadway crossing the closed surface impoundments was blocked off as recommended by Wood. The impoundment cover at Site 1 was scarified in Apri l 2019 under the supervision of Chevron personnel and was subsequently re-compacted on May 8, 2019. The repairs were completed in accordance with the MRP and are described in Chevron's Cover Repair Documentation (attached).
Wood appreciates being of service to Chevron. If you have any questions or need additional information,
please contact us.
Sincerely, Wood Environment & Infrastructure Solutions, Inc.
Leslie K. Purvis, LEP Environmental Scientist
1:\ 7000s\7580.000\Archive\7580-180.docx
Howard D. Barlow, PE Principal Engineer
•• •

Ms. Linh Vo
Chevron North America Exploration and Production
May 24, 2019
Page 3
Attachments: Figure 1 – Site Location Map
Figure 2 – Site Plan and Erosion Locations
Chevron March 12, 2019, Post-Storm Report
Chevron Repair Documentation and Photographs
cc: Mr. Ron Holcomb, Central Valley Regional Water Quality Control Board

SITE
California
)
SITE
Lost HillsLo
s Rios
St
Lost
Hills
Rd
R 345
R 345
R 345
Brown M
ateria
l Rd
Holloway Rd
G P Rd
Lost
Hills
Rd
Paso Robles Hwy
Site Location MapFormer Section 29 Surface Impoundments
Lost Hills, California
1Project No.: 007580
Figure
Date: 7/10/2018By: SCM0 2,000 4,0001,000Approximate Scale in Feet
0 500 1,000250Approximate Scale in Meters
Dat
e: 7
/10/
2018
Pr
inte
d by
: sco
tt.m
itche
ll2Pa
th: N
:\700
0s\0
0758
0\gi
s\m
aps\
2018
\Ann
ual_
Cov
er_I
nspe
ctio
n\_f
ig01
_Site
Loca
tionM
ap.m
xd
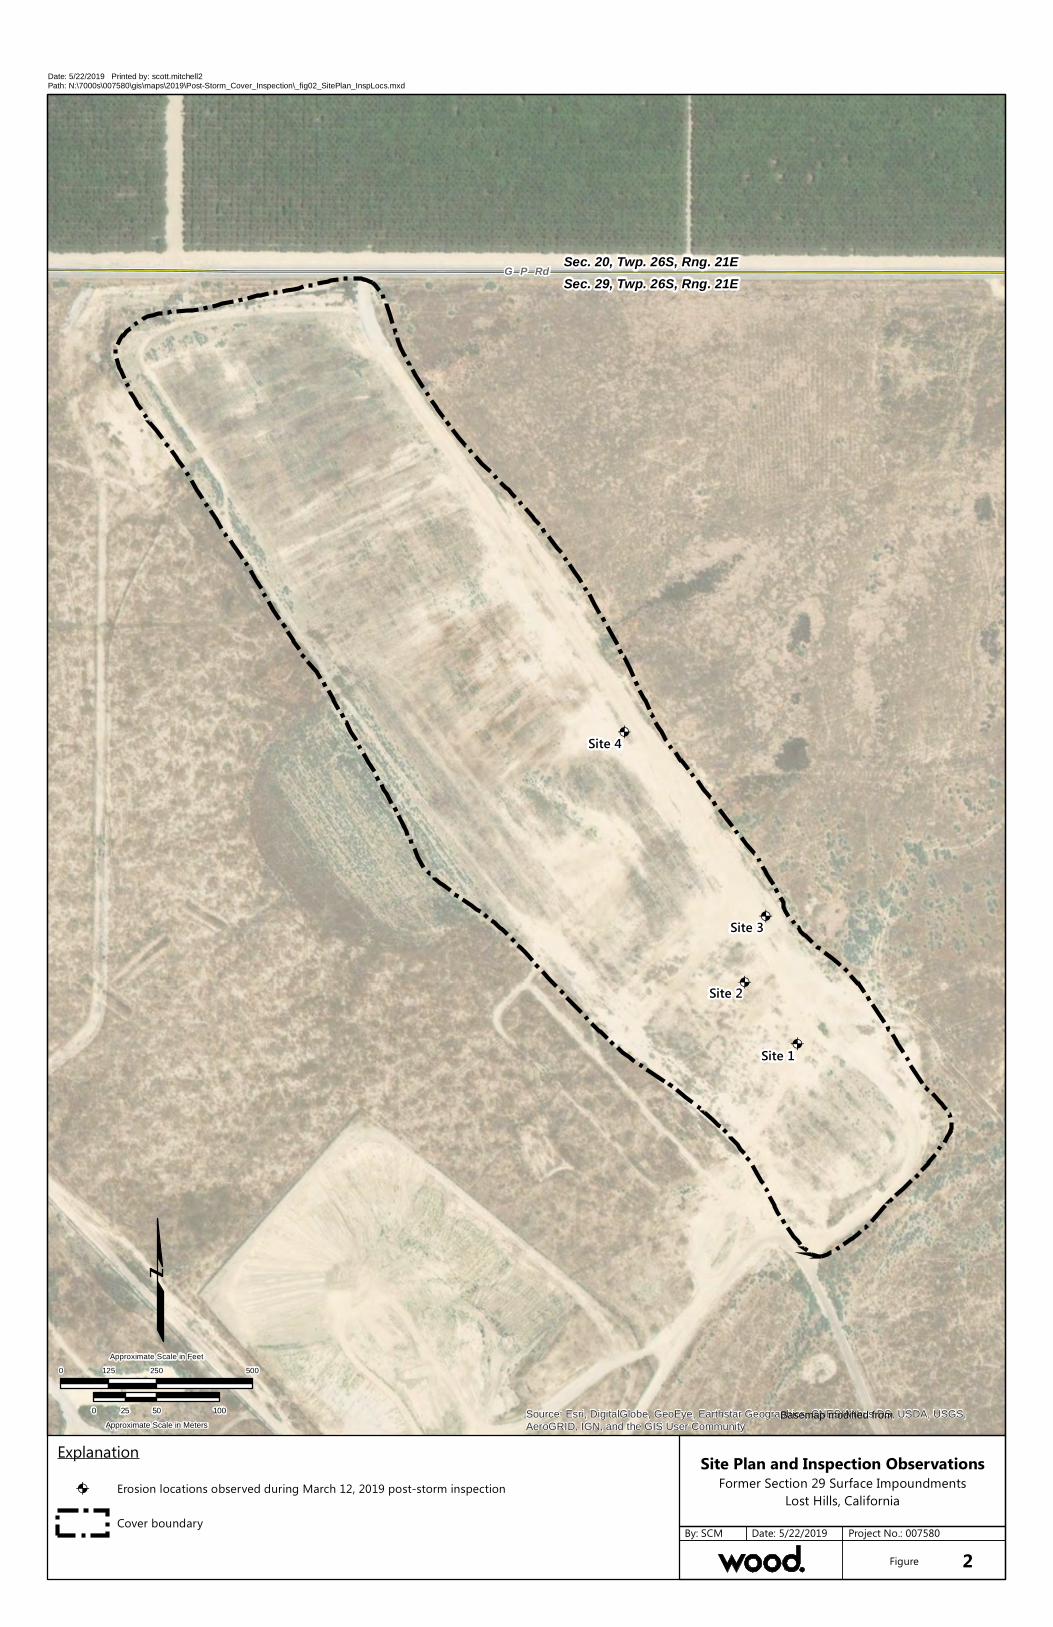
!A
!A
!A
!A
Site 1
Site 2
Site 3
Site 4
G P Rd Sec. 20, Twp. 26S, Rng. 21ESec. 29, Twp. 26S, Rng. 21E
Source: Esri, DigitalGlobe, GeoEye, Earthstar Geographics, CNES/Airbus DS, USDA, USGS,AeroGRID, IGN, and the GIS User Community
Site Plan and Inspection ObservationsFormer Section 29 Surface Impoundments
Lost Hills, California
2Project No.: 007580
Figure
Basemap modified from
Date: 5/22/2019By: SCM
Date: 5/22/2019 Printed by: scott.mitchell2Path: N:\7000s\007580\gis\maps\2019\Post-Storm_Cover_Inspection\_fig02_SitePlan_InspLocs.mxd
0 250 500125
Approximate Scale in Feet
0 50 10025
Approximate Scale in Meters
Explanation!A Erosion locations observed during March 12, 2019 post-storm inspection
Cover boundary

STORM EVENT INSPECTION FORM
Name of inspector Brandon Hoehn
Date of storm event 3/5/19 (1.42”)
Date of inspection 3/12/19
Inspection location Section 29 Surface Impoundments, Lost Hills, California
Inspected site coordinates
Latitude Longitude
Site 1 35.38.21N 119.43.42W
Site 2 35.38.22N 119.43.44W
Site 3 35.38.24N 119.43.43W
Site 4 35.38.29N 119.43.48W
Recommendations from Certified Engineer for repairs
Date of damage repaired
Inspected site photos Before repair After repair
Site 1 Site 1 [insert photo]
Site 2 Site 2 [insert photo]
Site 3 Site 3 [insert photo]
Site 4 Site 4 [insert photo]
Date of soil compaction test
Date of revegetation
Additional Comments
Jeff Johnson Environmental Specialist Health, Environment and Safety
San Joaquin Valley Business Unit Chevron North America Exploration and Production P. O. Box 1392 Bakersfield, CA 93302 Tel 661 654 7983 Mobile 661-599-5322 [email protected]
Former Section 29 Surface Impoundments 2019 Cover Repair Documentation – Post Storm Lost Hills Oil Field, Kern County, California Background: On March 5, 2019, a precipitation event occurred in Lost Hills, CA. On March 12, 2019 Chevron performed post storm inspection of the former Section 29 surface impoundments in accordance with the provisions of Waste Discharge Requirements Order No. R5-2013-0056 and its associated Monitoring and Reporting Program, which were issued to Chevron on May 31, 2013, by the Central Valley Regional Water Quality Control Board. Mr. Brandon Hoehn walked the impoundments and completed a post storm inspection of the pond cover identifying any depressions, erosion, and any other pond cover damage. Inspection Results / Cover Repair Recommendations: Four locations of erosion were identified and photographed. The results of the post storm inspection were submitted to Wood plc on March 13, 2019 for review and repair recommendation. Mr. Howard Barlow, Principal Geotechnical Engineer of Wood, reviewed the photographs and GPS locations provided by Chevron for the 4 sites where erosion was noted on the Section 29 Closed Surface Impoundments cover. Mr Barlow’s assessment was, of the 4 sites identified, only Site #1 required repair. Site 1: The main erosion is on a road crossing the cover for the closed surface impoundments that is apparently used as a shortcut. This appears to be an area of on-going problems with erosion. This roadway should be blocked off and traffic routed around the perimeter of the closed surface impoundments. The roadway crossing the surface impoundments should be scarified to a depth of 2 inches and vegetated. Continued use of the roadway crossing the cover will lead to continuing erosion problems.

2
Site 2: This appears to be an area that was recently repaired, but no new vegetation has been established. The erosion seen in the photographs is not severe enough to warrant regrading, but vegetation should be established before the erosion becomes worse. Site 3: The GPS coordinates provided by Chevron indicate that this site is adjacent to the perimeter roadway. Erosion on the perimeter roadway may be repaired by regrading at a future date. No action is required at this time. Site 4: The GPS coordinates provided by Chevron indicate that this site is adjacent to the perimeter roadway. Erosion on the perimeter roadway may be repaired by regrading at a future date. No action is required at this time. Cover Repairs Completed: Site #1 was repaired in accordance with the Wood plc recommendation. The ends of the shortcut road were bermed and barricaded with high visibility barrier fencing to route traffic around the perimeter of the impoundments. Preliminary repair was completed on April 17, 2019. Subsequent site preparation and final compaction was completed on May 9, 2019. Photographs documenting the post repair condition of Site #1 were taken May 22, 2019. Before and after photographs have been provided to Wood plc to document the repair completed at Site #1. The photos used to show the “before” repaired condition were taken during the March 12, 2019 post storm inspection. Post repair photos taken May 22, 2019, represent the current condition at Site #1 after the repairs were complete. Photographs are attached. Perimeter road regrading will be completed at a future date. Revegetation: Chevron will reseed the repaired areas prior to the Fall/Spring rainy season, in anticipation of precipitation that will promote seed germination and plant growth.

I:\7000s\7580.000\From Others\Chevron\PondInspections\2019-0305_Post-Storm\2019_PondPhotos.xlsx, Site 1 Insp, 5/23/2019
Note: Photographs provided by Chevron.
05/22/19LKP 0075802017
Site 1 InspectionFormer Section 29 Impoundments
Lost Hills Oil Field, California
1a
Date: By: Project No.:
Attachment

I:\7000s\7580.000\From Others\Chevron\PondInspections\2019-0305_Post-Storm\2019_PondPhotos.xlsx, Site 1 Repairs, 5/23/2019
Note: Photographs provided by Chevron.
05/22/19LKP 0075802017
Site 1 RepairsFormer Section 29 Impoundments
Lost Hills Oil Field, California
1b
Date: By: Project No.:
Attachment

I:\7000s\7580.000\From Others\Chevron\PondInspections\2019-0305_Post-Storm\2019_PondPhotos.xlsx, Site 2 Insp, 5/23/2019
Note: Photographs provided by Chevron.
05/22/19LKP 0075802017
Site 2 InspectionFormer Section 29 Impoundments
Lost Hills Oil Field, California
1c
Date: By: Project No.:
Attachment

I:\7000s\7580.000\From Others\Chevron\PondInspections\2019-0305_Post-Storm\2019_PondPhotos.xlsx, Site 3 Insp, 5/23/2019
Note: Photographs provided by Chevron.
05/22/19LKP 0075802017
Site 3 InspectionFormer Section 29 Impoundments
Lost Hills Oil Field, California
1d
Date: By: Project No.:
Attachment

I:\7000s\7580.000\From Others\Chevron\PondInspections\2019-0305_Post-Storm\2019_PondPhotos.xlsx, Site 4 Insp, 5/23/2019
Note: Photographs provided by Chevron.
05/22/19LKP 0075802017
Site 4 InspectionFormer Section 29 Impoundments
Lost Hills Oil Field, California
1e
Date: By: Project No.:
Attachment
1
San Joaquin Valley SBU Chevron North America Exploration and Production 15255 Lost Hills Rd Lost Hills, CA 93249
2019 Annual Closure Inspection
Chevron Lost Hills Perc Ponds
In 2008-09, the Perc Ponds at Chevron Lost Hills were closed. The following are observations made from
an inspection of the former Perc Pond Facility.
Inspection: August 20, 2019
Inspector: Brandon Hoehn (Chevron Health, Environment and Safety Specialist)
Location: Former Perc Ponds Section 29 Lost Hills Field.
Condition of the surface cap: No ponding took place on the cap. The small amount of annual rain (less
than 6 inches/year) along with the established vegetation growing on the surface has prevented significant
erosion of the cap.
Established Growth: Extensive amounts of growth have taken place across the surface of the former
facility.
Attachments: Pictures of facility (All pictures taken 8/20/2019)

2
1) N 35.639532°, W 119.728387° Looking Northwest

3
2) N 35.640580°, W 119.729243° Looking Southwest

4
3) N 35.644407°, W 119.732417° Looking Southwest

5
4) N 35.644207°, W 119.734456° Looking Southeast

6
5) N 35.642112°, W 119.732895° Looking Northeast

7
6) N 35.638600°, W 119.729133° Looking Northeast