annu ral epotr 2018
TRANSCRIPT
Annual Report 2018
Deutsche Bank

Deutsche Bank
The Group at a glance2018 2017
Key financial informationPost-tax return on average shareholders’ equity 0.4 % (1.2) %Post-tax return on average tangible shareholders’ equity 0.5 % (1.4) %Cost/income ratio¹ 92.7 % 93.4 %
Compensation ratio² 46.7 % 46.3 %Noncompensation ratio³ 46.0 % 47.0 %
Total net revenues, in € m. 25,316 26,447Provision for credit losses, in € m. 525 525Total noninterest expenses, in € m. 23,461 24,695
Adjusted costs4 22,810 23,891Income (loss) before income taxes, in € m. 1,330 1,228Net income (loss), in € m. 341 (735)Basic earnings per share € (0.01) € (0.53)Diluted earnings per share € (0.01) € (0.53)Share price at period end € 6.97 € 15.88Share price high € 16.46 € 17.82Share price low € 6.68 € 13.11
Dec 31, 2018 Dec 31, 2017CRR/CRD 4 Leverage Ratio (fully loaded) 4.1 % 3.8 %CRR/CRD 4 Leverage Ratio (phase in) 4.3 % 4.1 %Fully loaded CRR/CRD 4 leverage exposure, in € bn. 1,273 1,395Common Equity Tier 1 capital ratio (fully loaded) 13.6 % 14.0 %Common Equity Tier 1 capital ratio (phase in) 13.6 % 14.8 %Risk-weighted assets, in € bn. 350 344Total assets, in € bn. 1,348 1,475Shareholders’ equity, in € bn. 62 63Book value per basic share outstanding € 29.69 € 30.16Tangible book value per basic share outstanding € 25.71 € 25.94Other InformationBranches 2,064 2,425
Thereof: in Germany 1,409 1,570Employees (full-time equivalent) 91,737 97,535
Thereof: in Germany 41,669 42,5261 Total noninterest expenses as a percentage of net interest income before provision for credit losses, plus noninterest income.2 Compensation and benefits as a percentage of total net interest income before provision for credit losses, plus noninterest income.3 Noncompensation noninterest expenses, which is defined as total noninterest expenses less compensation and benefits, as a percentage of total net interest income before
provision for credit losses, plus noninterest income.4 The reconciliation of adjusted costs to noninterest expenses is provided in section “Supplementary Information (Unaudited): Non-GAAP Financial Measures: Adjusted costs”
of this document.
Due to rounding, numbers presented throughout this document may not sum precisely to the totals provided and percentages may not precisely reflect the absolute figures.

Content Deutsche Bank Group
III Letter from the Chairman of the Management BoardVI Management BoardVII Report of the Supervisory BoardXVI Supervisory BoardXIX Strategy
1 — Management Report
2 Operating and Financial Review33 Outlook39 Risks and Opportunities44 Risk Report154 Compensation Report199 Corporate Responsibility199 Employees204 Internal Control over Financial Reporting206 Information pursuant to Section 315a (1) of the
German Commercial Code and Explanatory Report210 Corporate Governance Statement pursuant to Sections 289f and 315d
of the German Commercial Code
2 — Consolidated Financial Statements
212 Consolidated Statement of Income213 Consolidated Statement of Comprehensive Income214 Consolidated Balance Sheet215 Consolidated Statement of Changes in Equity221 Consolidated Statement of Cash Flows223 Notes to the Consolidated Financial Statements 265 Notes to the Consolidated Income Statement271 Notes to the Consolidated Balance Sheet326 Additional Notes383 Confirmations
3 — Corporate Governance Statement / Corporate Governance Report
393 Management Board and Supervisory Board408 Reporting and Transparency408 Related Party Transactions409 Auditing and Controlling411 Compliance with the German Corporate Governance Code
4 — Supplementary Information
416 Non-GAAP Financial Measures420 Declaration of Backing422 Imprint / Publications

III Letter from the Chairman of the Management Board
VI Management Board
VII Report of the Supervisory Board
XVI Supervisory Board
XIX Strategy
Deutsche Bank Group

III
Deutsche BankAnnual Report 2018
Letter from the Chairman of the Management Board
Letter from the Chairman of the Management Board
Dear Shareholders,
We can look back on 2018 as a year that was anything but easy for Deutsche Bank. Despite many challenges, weaccomplished a great deal, made excellent progress in many areas and achieved our stated objectives. Deutsche Bank hasbuilt very solid foundations – this is the basis for controlled growth.
The clearest sign of the turnaround is that for the first time since 2014 we reported a net profit, of 341 million euros. Year-on-year this is an improvement of more than 1 billion euros. We also managed to increase our pre-tax profit to 1.3 billion euros.Returning to profitability was a vital milestone for us.
A new spirit of cost discipline played a key role. This enabled us to reduce our adjusted costs by more than 1 billion euros. At22.8 billion euros for the year, our adjusted costs even beat the target we set ourselves of 23 billion euros, and as aconsequence we have tightened our cost target for 2019 by 200 million euros to 21.8 billion euros. The discipline wasparticularly evident in the fourth quarter, where we have seen an uptick in costs in some previous years. We are determinedto continue on this path. We reduced the number of full-time equivalent employees in the Deutsche Bank Group by almost6,000 to 91,700, comfortably hitting our target of bringing our workforce down to below 93,000 full-time equivalents.
We achieved all this without compromising on our controls. We have continued hiring more staff in control functions, inparticular strengthening our Anti-Financial Crime unit. We are investing in tightening our ‘Know your Client’ processes andimproving our systems for reporting suspicious transactions. In this context we are cooperating closely with our regulators.
Of course, cost reductions on this scale had some impact on revenues, which fell 4% in 2018. This development was drivenpartly by difficult market conditions later in the year, which also affected our international peers, and partly by disciplinedimplementation of our strategic decision to re-focus our business.
At the same time we further strengthened our balance sheet. We have solid capital ratios and significant liquidity reserves,our leverage ratio improved during the year, and levels of both credit and market risk remain low.
With a return to profitability, improved internal controls and a strong balance sheet, we have laid firm foundations for thecontrolled growth which is now our strategic priority. We are not yet where we want to be; but we believe that we are on theright path to provide you, our shareholders, with sustained higher returns. In this regard it is important to highlight that weoperate in a challenging market environment and we are considering strategic opportunities as they arise. While there is nocertainty transactions expected by market participants will occur, the basis for any decisions must be to improve the growthand return profile of the bank. We intend to analyze our options with the same commercial discipline we brought to our strategicand operational decisions in 2018.
Strategic milestones reached
2018 was also a year in which we re-focused our business. After careful analysis we are aligning our Corporate & InvestmentBank (CIB) towards businesses which are most important for our clients and where we have, or can attain, a leading position.In other areas we have scaled back our resource commitment - for instance, in segments of the Equities business and USRates. We reduced our leverage exposure in CIB by more than 130 billion euros in 2018, and this impacted revenues asanticipated.
We aim to remain a relevant partner to the world’s global companies, providing them with a comprehensive range of advisoryservices and access to the capital markets. Our Global Transaction Banking unit is a world leader in a number of areasincluding Trade Finance and Cash Management. Our Markets business including Fixed Income & Currencies (FIC), wherewe are the only European institution among the world’s four leading banks, is also highly important to our clients.
Corporate Finance is a vital part of our offering, primarily in our home market of Europe, but also through our strong butfocused presence in North America and Asia. Deutsche Bank is one of the world’s leading debt capital market houses.

IV
Deutsche Bank Letter from the Chairman of the Management BoardAnnual Report 2018
In our Private & Commercial Bank, we made fundamental changes last year. We are integrating Deutsche Bank and Postbankin our home market, and in May we merged the relevant legal entities to form the “Bank for Germany”. Now we are in theprocess of merging the head offices and infrastructure functions of the two banks, including their day-to-day operations.
Joining forces should enable us to constantly improve the service to our 20 million-plus clients in Germany, and unlocksynergies of some 900 million euros annually which we aim to fully realize by 2022. This also gives us the opportunity to reapthe benefits of economies of scale, which are becoming increasingly important in this business – not least for investments indigital platforms.
We also made progress outside Germany. We completed the disposal of large parts of our Private & Commercial Clientsbusiness in Poland while the divestment in Portugal is well advanced. We successfully integrated Sal. Oppenheim into ourWealth Management business with only modest client attrition.
Our Private & Commercial Bank generated a post-tax return on tangible equity of about 5 percent in 2018 despite significantrestructuring and a very challenging interest rate environment - and this is before synergies anticipated from the creation ofthe “Bank for Germany”. That shows the enormous potential of this business.
The partial flotation of our asset manager, DWS, in March 2018 was a milestone event. This provides the entrepreneurialindependence that we expect will enable DWS to tap future growth opportunities more effectively – among other things byimmediately supplying DWS with its own acquisition currency.
The new alliances that DWS has forged with insurers Nippon Life and Generali, and with the French asset manager TikehauCapital, are also very promising. I am very confident that with its new leadership, DWS will once again build on its historicstrengths.
Solid balance sheet and strong liquidity
The successful reorganisation of our business divisions is one of the things we determined we needed in order to grow again.The second is our financial strength: in a number of key dimensions, Deutsche Bank has rarely been as stable as it is today:
– Our Common Equity Tier 1 (CET1) ratio of 13.6 percent at year-end comfortably meets our target of above 13 percent –and is higher than almost all of our leading peers.
– We have reduced our balance sheet considerably over the years and improved its quality.– Our market risk levels and our credit risk losses have rarely been so low.– Our liquidity reserves are around four times higher than a decade ago and are well above the levels required by our
regulators.– We have substantially reduced our legal risks in recent years.
Looking ahead: reaping the benefits of work done in 2018
Looking forward, we continue to manage the company towards our near- and medium-term targets, including generating aReturn on Tangible Equity of more than 4% in 2019. While financial market conditions in our Sales & Trading businesses haveimproved significantly in the first quarter of 2019 compared to the turbulent environment we saw in the fourth quarter of 2018,activity levels are relatively muted on a historical comparison. To support the achievement of our financial targets to the fullestextent possible, we will continue to manage all aspects in our direct control, including ongoing expense discipline.
We are encouraged that despite the challenging environment we have felt the strong backing of our clients. They rely onDeutsche Bank, and corporate clients in particular want a European alternative to the big US banks.
V
Deutsche BankAnnual Report 2018
Letter from the Chairman of the Management Board
I am firmly convinced that all our business divisions generate a positive impact for our clients, our staff, our investors andsociety as a whole. Deutsche Bank plays its part in driving economic growth and ultimately social progress. Banks are thelifeblood of the economy. We acknowledge this weighty responsibility and regard ourselves as a corporate citizen at the heartof society. For more details on how we practice corporate responsibility, please consult our Non-Financial Report which weare also publishing today.
We want to promote economic growth and social progress, in Germany and beyond. At home in Europe, connected to theworld – that is our ambition.
Best regards,
Christian SewingChief Executive OfficerDeutsche Bank AG
Frankfurt am Main, March 2019
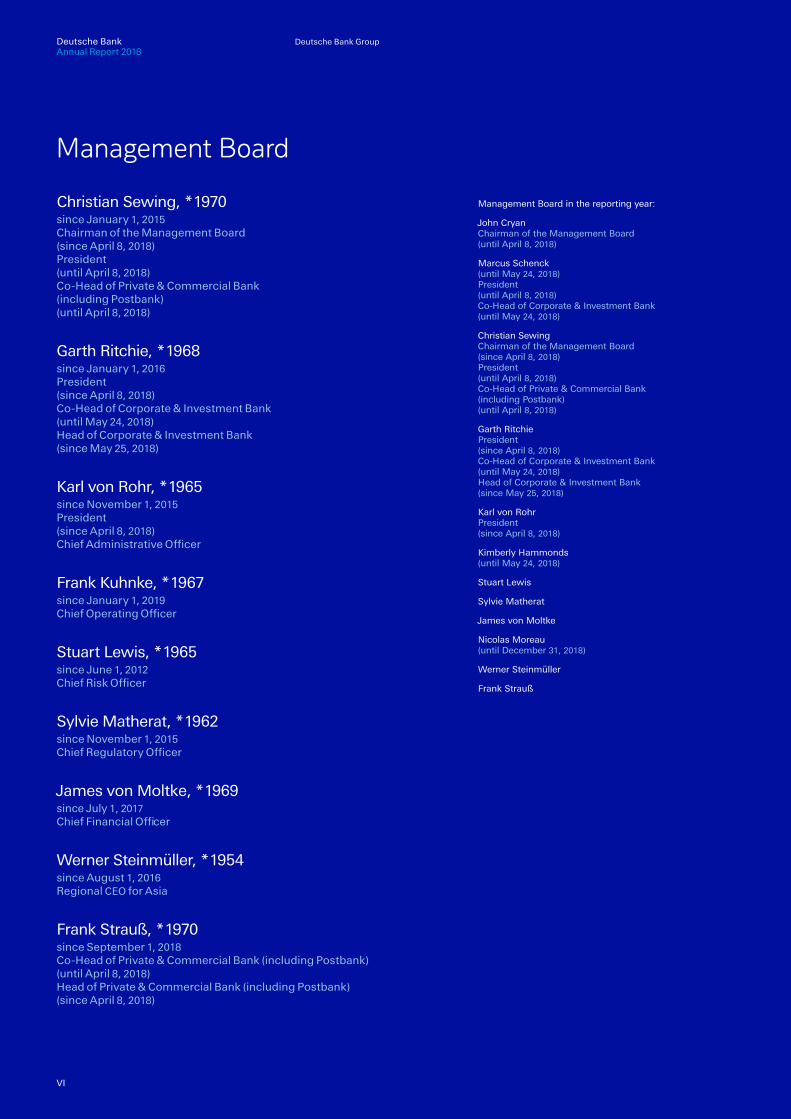
Management Board
Christian Sewing, * 1970since January 1, 2015Chairman of the Management Board (since April 8, 2018)President (until April 8, 2018)Co-Head of Private & Commercial Bank (including Postbank) (until April 8, 2018)
Garth Ritchie, * 1968since January 1, 2016President (since April 8, 2018)Co-Head of Corporate & Investment Bank (until May 24, 2018)Head of Corporate & Investment Bank (since May 25, 2018)
Karl von Rohr, * 1965since November 1, 2015President (since April 8, 2018)Chief Administrative Officer
Frank Kuhnke, * 1967since January 1, 2019Chief Operating Officer
Stuart Lewis, * 1965since June 1, 2012Chief Risk Officer
Sylvie Matherat, * 1962since November 1, 2015Chief Regulatory Officer
James von Moltke, * 1969since July 1, 2017Chief Financial Officer
Werner Steinmüller, * 1954since August 1, 2016Regional CEO for Asia
Frank Strauß, * 1970since September 1, 2018Co-Head of Private & Commercial Bank (including Postbank) (until April 8, 2018)Head of Private & Commercial Bank (including Postbank) (since April 8, 2018)
Management Board in the reporting year:
John CryanChairman of the Management Board (until April 8, 2018)
Marcus Schenck(until May 24, 2018)President (until April 8, 2018)Co-Head of Corporate & Investment Bank (until May 24, 2018)
Christian SewingChairman of the Management Board (since April 8, 2018)President (until April 8, 2018)Co-Head of Private & Commercial Bank (including Postbank) (until April 8, 2018)
Garth RitchiePresident (since April 8, 2018)Co-Head of Corporate & Investment Bank (until May 24, 2018)Head of Corporate & Investment Bank (since May 25, 2018)
Karl von RohrPresident (since April 8, 2018)
Kimberly Hammonds(until May 24, 2018)
Stuart Lewis
Sylvie Matherat
James von Moltke
Nicolas Moreau(until December 31, 2018)
Werner Steinmüller
Frank Strauß
Deutsche Bank GroupDeutsche BankAnnual Report 2018
Deutsche Bank Group
VI

VII
Deutsche BankAnnual Report 2018
Report of the Supervisory Board
Report of the Supervisory Board
Dear Shareholders,
Your Deutsche Bank still did not deliver the upswing in the reporting year 2018 which you as shareholders expect and whichthe Management Board, Supervisory Board and all staff members are striving for.
Deutsche Bank is a strong institution, one that is rich in tradition and that has already had to cope with many crises and difficultperiods in its 149-year history. It has always managed to master the challenges and emerge from these situations with renewedstrength.
Even if the share price does not seem to reflect this, important groundwork was laid for such an upswing in 2018.
In April, we appointed Mr. Sewing as Chairman of the Management Board, a chief executive who is thoroughly familiar withall facets of the bank. As the bank’s former Deputy Chief Risk Officer, Mr. Sewing is equally at home in the international capitalmarkets business as in corporate and retail banking in Germany, which he was responsible for over the last few years. Thetargets he announced for 2018 after his appointment with regard to costs, headcount, capital and profitability were all achieved.
In the costs area, in particular, the bank and its managers have developed a degree of discipline that was missing in the past.The bank’s balance sheet is much more robust than it has been for a long time, and the liquidity position reached a very highlevel.
Profit for 2018 was severely impacted by internal and external effects in the fourth quarter and still cannot be regarded assatisfactory. After many years of remediating legacy issues, the bank’s ability to grow profitably again on the revenue side isbeing closely monitored and is considered a decisive lever to boost the share price from its current unsatisfactory level.
As your Supervisory Board, we are making every effort to support this in an appropriate way. On the following pages VII toXV you will find a detailed report of our activities during the reporting period. I would like to take this opportunity to draw yourattention to several personnel changes. On the Management Board, Mr. Kuhnke took over responsibility as Chief OperatingOfficer after his predecessor, Ms. Hammonds, left the bank at the end of May.
Although reaching the appointed cost targets reflects the efforts of many staff members, this is also due not least to a rigorouslyconsistent management style.
Following the successful Initial Public Offering of our Asset Management company DWS at the beginning of the year, Mr.Moreau, who was responsible for this area, left the Management Board of Deutsche Bank AG at the end of December 2018.His successor as Chief Executive Officer of DWS, Dr. Wöhrmann, was appointed General Manager (Generalbevollmächtigter)of the bank at the end of October.
There were also changes on your bank’s Supervisory Board in 2018. Ms. Dublon, Ms. Irrgang, Ms. Parent, ProfessorKagermann, Mr. Rudschäfski and Dr. Teyssen stepped down, having provided years of valuable service through theirSupervisory Board work. Their contributions, in particular on the committees, were extensively praised already at the lastGeneral Meeting.
The General Meeting in May 2018 elected Ms. Clark, Ms. Trogni, Mr. Thain and Professor Winkeljohann as new members ofthe Supervisory Board. There were also changes on the employee representatives’ side. Newly elected as employeerepresentatives to the Supervisory Board were Mr. Blomeyer-Bartenstein, Mr. Polaschek and Mr. Szukalski. For Mr. Szukalski,it is the second time. Mr. Bsirske, Mr. Duscheck, Mr. Heider, Ms. Klee, Ms. Mark, Ms. Platscher and Mr. Rose were re-electedfor another term in office. I gained Mr. Polaschek as the new Deputy Chairman. We are certain we can ensure our cooperationfounded on trust in the interests of the bank will continue, even in these challenging times.
Against this backdrop, the Supervisory Board established, alongside the existing committees, a Strategy Committee and aTechnology, Data and Innovation Committee to focus on tasks that are described in greater detail in the following. The twocommittees are chaired by Mr. Thain and Ms. Trogni, respectively. Ms. Clark took over as Chairperson of the Risk Committee.In light of the increase in his other professional obligations, Mr. Meddings – after three years of valuable service with a high-intensity workload – handed over the chairing of the Audit Committee to Professor Winkeljohann. I would like to take thisopportunity to thank all of them for their personal dedication to our bank.
VIII
Deutsche Bank Report of the Supervisory BoardAnnual Report 2018
Esteemed shareholders, my colleagues and I are naturally well aware that in the final analysis only performance counts, andit is not yet where it should be – at least not when it comes to the share price. However, we live in a world in which processquality and process integrity also have an important role to play. On their own, they are not enough to be successful, but theyare the preconditions for sustainable success. With this in mind, your Supervisory Board held a total of 54 meetings in plenumand in the committees to perform our monitoring duties and to advise the Management Board intensively in numerous matters.
Specifically, in the year under review:
Report of the Supervisory BoardThe Supervisory Board performed the tasks assigned to it by law, administrative regulations, Articles of Association and Termsof Reference.
The Management Board reported to us regularly, without delay and comprehensively on business policies and strategy, inaddition to other fundamental issues relating to the company’s management and culture, corporate planning, coordination andcontrol, compliance and compensation systems. It reported to us on the financial development, earnings and risk situation,the bank’s risk, liquidity and capital management, the appropriate technical and organizational resources as well as eventsthat were of significant importance to the bank. We were involved in decisions of fundamental importance. As in previousyears, the Management Board provided, as we requested, enhanced reporting on specific topic areas. The Supervisory BoardChairman maintained regular contact with the Management Board between the meetings, as did the committee chairs for thecommittees they chair. Regular discussions concerning important topics and upcoming decisions were also held between theChairman of the Supervisory Board, the chairs of the Supervisory Board committees and the Management Board.
There were a total of 54 meetings of the Supervisory Board and its committees. When necessary, resolutions were passed bycirculation procedure between the meetings.
Meetings of the Supervisory Board in plenum
The Supervisory Board held nine meetings in plenum in 2018, where it addressed all topics with a special relevance for thebank.
We again attached a special importance to the topic of strategy in 2018, and its implementation, and took sufficient time todeliberate on strategic matters with the Management Board at all of our meetings. At our meetings in February, May, July,October and December, we addressed the development of the bank’s business, influenced by a dynamic regulatory andcompetitive environment, along with the related core priorities. In this context, the Management Board reported to us regularlyon the bank’s strategy and the preparations for the United Kingdom’s pending exit from the European Union (Brexit), the InitialPublic Offering (IPO) of DWS and the merger between Deutsche Bank Privat- und Geschäftskunden AG and DeutschePostbank AG. It informed us on a regular basis of the performance of the share prices of Deutsche Bank AG, DWS and theirrespective competitors. At our meetings in February, July and October, the Management Board reported to us on thedevelopments in the litigation cases and regulatory proceedings of significant importance to the bank. We also extensivelydiscussed the continually growing importance of digitalization and its impact on bank-internal processes. To address thesetopics more intensively, we resolved at our meeting on May 23, 2018, to additionally establish a Strategy Committee as wellas a Technology, Data and Innovation Committee, and thus to monitor all of the key priorities of the Management Board moreefficiently and to more strongly focus and intensify the discussion of and advice on such matters in the interests of the bank.
At our meeting on February 1, we addressed the target/actual analysis against the plan figures for 2017 as well as theManagement Board’s preliminary proposal for the dividend in consideration of the regulatory requirements for capital funding.The Management Board reported to us on the progress made on the planned strategic measures to rebuild a simpler, client-focused Corporate & Investment Bank. We addressed the strategic financial and capital plan at the Group level for the years2018-2022 as well as the strategic targets. Following a comprehensive discussion with the Management Board, we issuedour approval in principle to the IPO of DWS. We addressed the supervisory priorities of various regulators for 2018, the effectsof new administrative law requirements on the bank and the measures to be taken in this context. We completed theassessment to be performed annually of the Supervisory Board and Management Board for the year 2017 and addressed theCorporate Governance Statement, which was also the Corporate Governance Report. We accepted the Management Board’sproposal to waive its variable compensation for the 2017 financial year. We also discussed the topics for the SupervisoryBoard’s training measures for 2018.
At our meeting on March 15, after the Management Board’s reporting and a discussion with the auditor, and based on theAudit Committee’s recommendation, we approved the Consolidated Financial Statements and Annual Financial Statementsfor 2017 and agreed to the Management Board’s proposal for the appropriation of distributable profit. Together withrepresentatives of the Joint Supervisory Team (JST) of the European Central Bank, Federal Financial Supervisory Authority

IX
Deutsche BankAnnual Report 2018
Report of the Supervisory Board
(BaFin) and Deutsche Bundesbank, we discussed the most important insights gained from the Supervisory Review andEvaluation Process (SREP) in 2017 and the regulatory priorities based on this perspective for 2018. Topics we discussed withthe Management Board were the introduction of balanced scorecards in the bank, the structuring of the compensation systems,the Human Resources Report for 2017, the timetable for the DWS IPO and other regulatory topics. We also addressed topicsfor the General Meeting and approved the proposals for its Agenda, including proposals for the election of new shareholderrepresentatives on the Supervisory Board.
At an extraordinary meeting on April 8, we resolved to appoint Mr. Sewing as Chairman of the Management Board withimmediate effect, as successor to Mr. Cryan, who left the Management Board. At this meeting, we also appointed Mr. Ritchieand Mr. von Rohr as Presidents (Deputy Chairmen of the Management Board).
At our meeting on May 23, in the evening before the General Meeting, we discussed all of the significant topics of the pendingGeneral Meeting with the Management Board.
At our constitutive meeting on May 24, following the General Meeting, we re-elected Dr. Achleitner as Chairman of theSupervisory Board and Mr. Polaschek as new Deputy Chairman. As a result of the changed composition of the SupervisoryBoard after the General Meeting, we adjusted the composition of all the committees and appointed some new committeemembers, also in consideration of the expertise and experience of the individual Supervisory Board members. Ms. Clark waselected with immediate effect as Chairperson of the Risk Committee, as the successor of Ms. Dublon, who left the SupervisoryBoard as of July 31, 2018. Mr. Thain was elected Chairman of the newly established Strategy Committee and Ms. Trogni asChairperson of the newly established Technology, Data and Innovation Committee, based on their comprehensive expertisein the respective areas. We also resolved on issuing the mandate for the audit of the annual financial statements andconsolidated financial statements for 2018 to KPMG AG Wirtschaftsprüfungsgesellschaft, Berlin (KPMG).
On July 26, we addressed in particular the development of the bank’s business and the Interim Report as of June 30, 2018.The Management Board reported to us on regulatory topics, compliance, anti-money laundering, liquidity and costmanagement as well as the results of the annual employee survey. We also addressed the implementation of bank-regulatoryrequirements for our work.
On September 14 and 15, a two-day strategy workshop took place with the Management Board. We intensively addressedthe strategic targets and priorities, also based on the bank’s individual business divisions, as well as the progress made intheir implementation. Together with the Chairman of the Management Board and the Chief Human Resources Officer, wediscussed succession planning for the Management Board and for the management level below the Management Board.
On October 25, we resolved, after receiving an explanation of the recommendation of the Audit Committee, to propose to theGeneral Meeting in 2019 that Ernst & Young GmbH Wirtschaftsprüfungsgesellschaft (Ernst & Young) be elected for the limitedreview of the consolidated interim financial statements for the first quarter of 2020. We plan to propose that Ernst & Young beelected as auditor of the annual and consolidated financial statements for the full 2020 financial year. We also addressedknow-your-customer topics. We appointed the incumbent Chief Operating Officer, Mr. Kuhnke, as member of the ManagementBoard with effect from January 1, 2019. His areas of functional responsibility on the Management Board correspond to hisprior tasks – he is responsible, among other things, for the bank’s information security, data management and digital strategy.We agreed to Mr. Moreau’s departure from the Management Board with effect from December 31, 2018, and we assigned hisarea of Management Board functional responsibility for Asset Management to Mr. Sewing. Furthermore, we resolved toapprove the Declaration of Conformity for 2018 pursuant to Section 161 of the Stock Corporation Act.
At the last meeting of the year on December 6, we discussed together with the Management Board an update on the bank’sknow-your customer program as well as the budgets for the Compliance and Anti-Money Laundering functions in 2018. Thediscussion also focused on the topics relating to the correspondent bank relationship with Danske Bank and measures of theinvestigative authorities in connection with the business activities of Regula Limited. The Management Board reported to uson the progress made in working through regulatory priorities and discussed with us the significant milestones of the planningprocess 2019-2023. We elected Professor Dr. Winkeljohann as the new Chairman of the Audit Committee with effect fromJanuary 1, 2019.

X
Deutsche Bank Report of the Supervisory BoardAnnual Report 2018
Committees of the Supervisory Board
The Chairman’s Committee held nine meetings in 2018. It regularly handled the preparations for our meetings and took careof ongoing matters between the meetings. The Chairman’s Committee supported the Supervisory Board in monitoring thepreparations for the IPO of DWS. The Chairman’s Committee issued the approval of current and former Management Boardmembers’ acceptance of mandates, honorary offices or special tasks outside of Deutsche Bank Group. The Committee alsotook note of the mandates of the Supervisory Board members. The Chairman’s Committee prepared the decisions of theSupervisory Board in the field of corporate governance and handled matters relating to the not yet legally final court decisionson legal actions for the rescission, annulment or declaration of resolutions of the General Meetings in 2016 and 2017 as wellas a shareholder’s court application for the replacement of the auditor elected by the General Meeting for the audit of theannual and consolidated financial statements for the 2018 financial year.
At its six meetings, the Risk Committee dealt with the current and future overall risk appetite and strategy of Deutsche Bank,in particular with regard to credit, liquidity, refinancing, country, market and operational risks. The Risk Committee addressedthe financial and non-financial risks of the bank, their identification and their management as well as the measures to reducethem. In particular, the Risk Committee focused on personnel and model risks as well as the risks relating to Brexit and thebank’s internal preparations for it. In addition, the Risk Committee received reports regularly from the Management Boardabout the appropriateness of risk, capital and liquidity as well as corresponding changes in risk-weighted assets. The RiskCommittee also regularly received reports from the Risk Management function concerning key issues and initiatives, thebudget for the Risk Management function, strategic stress scenarios, recovery and resolution plans (“living wills”) and risks inthe banking book. Furthermore, the Risk Committee dealt with findings and recommendations from regulators on risk-relatedtopics.
The Risk Committee monitored whether conditions in the client business are in line with the bank’s business model and riskstructure. It made decisions on the bank’s credit exposures requiring approval under German law, the Articles of Associationand Terms of Reference.
Furthermore, the Risk Committee supported the Compensation Control Committee in assessing the effects of thecompensation systems on the bank’s risk, capital and liquidity situation. It also examined whether the compensation systemsare aligned to the bank’s business strategy focused on the institution’s sustainable development. In this context, the RiskCommittee monitored whether the derived risk strategies and compensation strategy are also aligned to this at the institutionand Group level. In November, the Risk Committee members attended the meeting of the Compensation Control Committeeas guests and contributed to the in-depth discussion of topics concerning variable compensation for the 2018 financial year.
The Audit Committee met seven times in 2018. The Audit Committee supported us in monitoring the financial reporting processand intensively addressed the Annual Financial Statements and Consolidated Financial Statements, the interim reports aswell as the Annual Report on Form 20 F for the U.S. Securities and Exchange Commission. Within the context of the financialreporting process, it supported us in monitoring the implementation of the new International Financial Reporting Standard 9as well as the recognition of provisions. The Audit Committee also dealt with the valuation of various financial instruments andthe bank’s pension obligations as well as tax-related topics, in particular against the backdrop of the U.S. tax reform. The AuditCommittee had the Management Board report regularly on the “available distributable items” and the capacity to service thecoupons on the Additional Tier 1 capital instruments.
The Audit Committee monitored the effectiveness of the risk management system, in particular with regard to the internalcontrol system and Group Audit, while also taking into account the possible impacts from the ongoing cost containmentprogram. This also covered, among other things, the reporting on the ongoing development of controls to combat moneylaundering and to prevent financial crime, transaction surveillance, the three lines of defense model and the key initiatives forthe further strengthening of the internal control system. The Audit Committee was kept up-to-date on the work of Group Audit,its audit plan and its resources. It addressed measures taken by the Management Board to remediate deficiencies identifiedby the auditor, Group Audit and regulatory authorities. It also regularly received updates on the status and progress in thiscontext and in the remediation of findings.
We issued the mandate to KPMG as the independent auditor and, with the support of the Audit Committee, set the amount ofthe auditor’s remuneration. KPMG also reviewed the legally required non-financial reporting. The Audit Committee dealt withthe measures to prepare for the audit of the Annual Financial Statements and Consolidated Financial Statements for 2018,specified its own areas of focus for the audit and approved a list of permissible non-audit services. The Audit Committee wasregularly provided with reports on the engagement of accounting firms, including the auditor, for non-audit-related services.The Committee also addressed the key audit matters presented in the auditor’s report, the separate Non-Financial Report ofthe Group as well as the Non-Financial Statement.
The Head of Group Audit attended all of the Audit Committee meetings. Representatives of the auditor also attended all ofthese meetings, however, with the exception of the specific agenda items dealing with the rotation of the auditor.

XI
Deutsche BankAnnual Report 2018
Report of the Supervisory Board
Auditor Rotation: To implement the requirements of Regulation (EU) No. 537/2014 concerning the mandatory rotation of theauditor, a public tender request procedure was performed in 2018 to select a new auditor for Deutsche Bank AG and DeutscheBank Group for the 2020 financial year. To ensure an efficient and effective selection procedure, a project organization wasestablished that acted under the supervision and decision-making authority of the Audit Committee.
The performance of the audit tender procedure was supported within the bank’s operations by a Steering Committee andProject Team. The Steering Committee comprised, in addition to the Audit Committee Chair, three other members of the AuditCommittee, the Chief Financial Officer, the Head of Group Audit as well as senior executives of the relevant business divisionsinvolved. The specification of the key process steps, the selection criteria and the key decisions were discussed in advancewith the Audit Committee Chair and the Steering Committee and were ultimately approved by the Audit Committee. At itsmeetings, the Audit Committee regularly received reports on the audit tender procedure as it progressed and deliberated anddecided on the further key steps. In accordance with the EU require¬ments for a public tendering, the entire process wasconducted in a fair and transparent manner and free of discrimination. Through the public announcement of the audit tenderprocess, including in the Federal Gazette (Bundesanzeiger), auditing firms were first invited to express their interest inparticipating in the selection process. In the next step, those expressing an interest were provided with extensive documentsto make the submission of a well-founded written offer possible. In addition, all competitors were given the opportunity toclarify any outstanding matters in a questions and answers phase. The two offers subsequently submitted were analyzed bythe Project Team and the Steering Committee. The two final candidates were each invited separately to present their offersand introduce the lead members of their teams to the Steering Committee and the Audit Committee. The key financial pointsof each of the offers were discussed with both candidates. Following the conclusion of the procedure and on the basis of adetailed report on the procedure as well as the assessment of the candidates, the Audit Committee issued its recommendationfor the two candidates at its meeting on October 23, 2018, to the Supervisory Board. Within the framework of thisrecommendation, there was a preference for Ernst & Young GmbH Wirtschaftsprüfungsgesellschaft.
The Nomination Committee met six times. It addressed, in particular, issues related to succession and appointments whiletaking into account statutory and regulatory requirements, and it nominated suitable specific candidates for the ManagementBoard and Supervisory Board. The Nomination Committee supported us in implementing the requirements, applicable as ofJune 30, 2018, of the European Banking Authority (EBA) Guidelines on Internal Governance and Guidelines on theAssessment of the Suitability of Members of the Management Body and Key Function Holders, while also taking intoconsideration the European Central Bank (ECB) Guidelines on the Assessment of Professional Qualifications and PersonalReliability (Guide to Fit and Proper Assessments).
It also supported us in the implementation of potential improvements identified through the assessment carried out in 2017and intensively prepared the assessment of the Supervisory Board and Management Board for 2018. Furthermore, theNomination Committee issued recommendations to the Management Board concerning the principles for selecting andappointing people to the senior management level.
The Compensation Control Committee met five times in 2018. It monitored the appropriate structuring of the compensationsystems for the Management Board and employees, along with the compensation for the heads of control functions andmaterial risk takers. It also dealt with the Compensation Report 2017 and the Compensation Officer’s Compensation ControlReport, which concluded the bank’s compensation system is appropriately structured and in accordance with the requirementsof the Remuneration Ordinance for Institutions (InstitutsVergV). The Compensation Control Committee concurred with thisassessment.
It submitted proposals regarding the compensation of the Management Board while taking the agreed targets and objectivesinto consideration. The Compensation Control Committee supported us in monitoring the involvement of the internal controlareas as well as all other material areas in the structuring of the compensation systems and assessed the effects of thecompensation systems on the risk, capital and liquidity situation. The Management Board reported to us on the proceduresfor determining and allocating the total amount of variable compensation for the bank’s employees, while taking into account,in particular, affordability.
At its meetings in February, July and October, the Compensation Control Committee received reports on the ManagementBoard’s communications with the regulatory authorities on compensation topics and changes in the regulatory frameworkrelating to compensation. It addressed the implementation of the Remuneration Ordinance for Institutions (InstitutsVergV) ofJuly 25, 2017, and the individual components of variable compensation for the 2018 financial year as well as the plan rules.The Compensation Control Committee also handled anticipated changes to the compensation system of DWS following itsIPO as well as the compensation topics in connection with the merger of Deutsche Bank Privat- und Geschäftskunden AGand Deutsche Postbank AG.

XII
Deutsche Bank Report of the Supervisory BoardAnnual Report 2018
The Integrity Committee met six times in 2018. The Committee addressed the alignment of the culture in the individualbusiness divisions to the holistic corporate culture, also in consideration of the merger between Deutsche Bank Privat- undGeschäftskunden AG and Deutsche Postbank AG. The Integrity Committee reviewed and discussed the updated Code ofConduct with the Management Board, along with the initiatives for its sustainable embedding in the organization. In thiscontext, the Committee also addressed the management of conduct risk and consequences management. Furthermore, theCommittee held discussions with the Management Board on the implementation status of the standard, bank-wide “lessonslearned” process, which manages the sustainable embedding of lessons from the past in the organization and as a resultmitigates the risk from flawed processes and/or misconduct.
The Management Board reported regularly at the meetings on the legal cases with the highest risks for the bank and othermaterial litigation cases and proceedings.
At its meetings in October and December, the Integrity Committee addressed Deutsche Bank’s correspondent bankrelationships, in particular with Danske Bank’s Estonia branch. In December, the Management Board reported on theinvestigative authorities’ search of the bank’s premises in connection with the business activities of Regula Limited, a formersubsidiary of the bank. The Integrity Committee devotes special attention to following up on these topics.
The Management Board reported on the measures and progress achieved in optimizing the internal policy framework andother governance topics. Environmental and social issues were also addressed at the Integrity Committee meetings. Amongother things, this involved the bank’s corporate social responsibility and contribution to the conservation of our environment.
The new Strategy Committee met three times. The subject of the first meeting, initially, was to clarify the delineation of itstasks and responsibilities with the Supervisory Board plenum and the cooperation with the other Supervisory Boardcommittees. The Strategy Committee had the Management Board Chairman report at all its meetings on the implementationstatus of the key strategic measures and the achievement of the bank’s short-term and long-term financial objectives. It helddiscussions with the Management Board on implementation progress both at the Group level and in the corporate divisions,on current and future business opportunities and challenges against the backdrop of the competitive environment, and itreceived reports on the bank’s significant transformation projects with strategic relevance. Within the framework of deep divesinto the bank’s business divisions, the Committee intensively discussed the positioning of the global Wealth Managementbusiness and its strategic priorities. Furthermore, the Committee set out the areas of focus in preparing for the SupervisoryBoard’s two-day strategy workshop in September.
The new Technology, Data and Innovation Committee met three times. The Committee addressed both the IT architectureand IT strategy, also from the perspective of individual areas of the bank. At the meetings, the Management Board reportedon the bank’s global data management strategy – the target objectives, the status of their implementation and the interactionwith internal stakeholders. During its meetings, the Committee addressed the focal points of the work of the Innovation Lab inBerlin and the Digital Factory in Frankfurt as well as the innovation initiatives in investment banking. In this context, it alsodeliberated with the Management Board on the budget planning for key IT projects for the 2019 financial year. Moreover, itdealt with the bank-wide application landscape, the monitoring of important IT metrics, topics of IT and cyber security, and themitigation and management of IT risks.
Meetings of the Mediation Committee, established pursuant to the provisions of Germany’s Co-Determination Act (MitbestG),were not necessary.

XIII
Deutsche BankAnnual Report 2018
Report of the Supervisory Board
Participation in meetings
The Supervisory Board members participated in the meetings of the Supervisory Board and of the committees in which theywere members as follows:
Meetings(incl.
committees)
Meetings(plenary
sessions)
Participation(plenary
sessions)Meetings
(committees) Participation (committees)
Participationin %
(all meetings)Achleitner 54 9 9 45 45 100Blomeyer-Bartenstein 11 5 5 6 6 100Böhr 7 4 4 3 3 100Bsirske 32 9 9 23 23 100Clark 11 5 5 6 6 100Dublon 9 6 6 3 3 100Duscheck 15 9 9 6 4 87Eschelbeck 12 9 9 3 3 100Garrett-Cox 18 9 8 9 7 83Heider 18 9 9 9 9 100Irrgang 7 4 4 3 3 100Kagermann 14 4 4 10 8 86Klee 15 9 9 6 6 100Mark 19 9 9 10 10 100Meddings 25 9 9 16 15 96Parent 7 4 3 3 1 57Platscher 19 9 9 10 10 100Polaschek 22 5 5 17 17 100Rose 19 9 9 10 10 100Rudschäfski 14 4 4 10 10 100Schütz 13 9 9 4 4 100Simon 32 9 9 23 23 100Szukalski 8 5 5 3 3 100Teyssen 9 4 3 5 3 67Thain 8 5 5 3 3 100Trogni 11 5 5 6 6 100Winkeljohann 4 3 3 1 1 100
Corporate Governance
The composition of the Supervisory Board and its committees is in accordance with the requirements of the German BankingAct (KWG) as well as regulatory governance standards. The suitability of each individual member was assessed both internallyby the Nomination Committee and externally by the European Central Bank, and determined and monitored continuously bythe Joint Supervisory Team (JST). The suitability assessment covers the expertise, reliability and time available of eachindividual member. In addition, there was an assessment of the knowledge, skills and experience of the Supervisory Board inits entirety that are necessary for the performance of its tasks.
The Chairman of the Supervisory Board and the chairpersons of all the committees are independent in accordance with theTerms of Reference applicable from time to time. They coordinated their work continuously and consulted each other regularlyand – as required – on an ad hoc basis between the meetings in order to ensure the exchange of information necessary tocapture and assess all relevant case matters and risks in the performance of their tasks. The cooperation in the committeeswas marked by an open and trustful atmosphere.
The committee chairpersons reported regularly at the meetings of the Supervisory Board on the work of the individualcommittees. Regularly before the meetings of the Supervisory Board, the representatives of the employees and therepresentatives of the shareholders conducted preliminary discussions separately. At the beginning or end of the SupervisoryBoard and committee meetings, discussions were regularly held in “executive sessions” without the participation of theManagement Board.
Based on recommendations from the respectively responsible committees, we determined that Ms. Garrett-Cox, Dr.Achleitner, Mr. Meddings, Professor Dr. Simon and Professor Dr. Winkeljohann were financial experts in accordance with thedefinition of the implementation rules of the U.S. Securities and Exchange Commission issued pursuant to Section 407 of theSarbanes-Oxley Act of 2002 as well as Section 100 (5) and Section 107 (4) of Germany’s Stock Corporation Act (AktG), andSection 25d (9) of the German Banking Act (KWG). Dr. Achleitner and Professor Dr. Simon were specified by name ascompensation experts in accordance with Section 25d (12) of the German Banking Act (KWG). Furthermore, we confirmedthe independence, as defined by U.S. regulations, of all members of the Audit Committee and determined that the SupervisoryBoard has what we consider to be an adequate number of independent members.

XIV
Deutsche Bank Report of the Supervisory BoardAnnual Report 2018
Dr. Achleitner and the chairpersons of the committees met regularly with representatives of the key regulators and informedthem about the work of the Supervisory Board and its committees and about the cooperation with the Management Board.
In preparation for the General Meeting 2018, Dr. Achleitner, in his capacity as Chairman of the Supervisory Board, conducteddiscussions together with our Investor Relations Department with representatives of investors with regard to governance andstrategy topics as well as Management Board compensation.
At several meetings of the Nomination Committee and of the Supervisory Board in plenum, we addressed the assessmentprescribed by law of the Management Board and the Supervisory Board for the 2018 financial year. The final discussion ofthe results took place on January 31, 2019, and the results were set out in a final report. We implemented the potentialimprovements that were identified in the 2017 financial year. We are of the opinion that the Supervisory Board andManagement Board achieved a high standard and that there are no reservations, in particular, regarding the professionalqualifications, personal reliability and time available of the members of the Management Board and of the Supervisory Board.Improvement measures discussed with the Management Board and Supervisory Board members to increase the efficiency ofthe work of the Supervisory Board and its eight standing committees are implemented promptly.
The Declaration of Conformity pursuant to Section 161 of the Stock Corporation Act (AktG), which we last issued with theManagement Board on October 27, 2017, was reissued at the meeting of the Supervisory Board on October 25, 2018. Thetext of the Declaration of Conformity, along with a comprehensive presentation of the bank’s corporate governance, canbe found beginning on page 411 of the Annual Report 2018 and on the bank’s website athttps://www.db.com/ir/en/documents.htm. Our Declarations of Conformity since 2007 are also available there, in addition tothe currently applicable versions of the Terms of Reference for the Supervisory Board and its committees as well as for theManagement Board.
Training and Further Education Measures
Members of the Supervisory Board completed the training and further education measures required for their tasks on theirown. Furthermore, numerous further education measures were conducted for the work of the Supervisory Board in plenumand committees to maintain and expand the required specialized knowledge. The topics comprised, among others, accounting,performance measurement using balanced scorecards, human resources trends and staff development, digitalization, theproducts and services of an investment bank, corporate governance as well as internal communications and investor relations.
For the new members that joined the Supervisory Board, extensive induction courses tailored to the individuals were held tofacilitate their induction into office.
Conflicts of Interest and Their Handling
Professor Dr. Winkeljohann did not take part in the deliberations on and the resolutions for the selection of an auditor.
Annual Financial Statements, Consolidated Financial Statements, the separateConsolidated Non-Financial Report and Non-Financial Statement
KPMG audited the Annual Financial Statements, including the accounting and Management Report, as well as theConsolidated Financial Statements with the related Management Report for the 2018 financial year and issued in each casean unqualified audit opinion on March 15, 2019. The Auditor’s Reports were signed jointly by the Auditors Mr. Pukropski andMr. Böth. Mr. Pukropski signed the Auditor’s Report for the Annual Financial Statements and Consolidated FinancialStatements for the first time for the 2013 financial year and Mr. Böth for the first time for the 2017 financial year.
Furthermore, KPMG performed a limited assurance review in the context of the separate Non-Financial Report as well as theNon-Financial Statement (Non-Financial Reporting) and in each case issued an unqualified opinion.
The Audit Committee examined the documents for the Annual Financial Statements 2018 and Consolidated FinancialStatements 2018 as well as the Non-Financial Reporting 2018 at its meeting on March 19, 2019. The representatives of KPMGprovided the final report on the audit results. The Chairman of the Audit Committee reported to us on this at the meeting ofthe Supervisory Board. Based on the recommendation and advance handling of the Audit Committee and after inspecting theAnnual Financial Statements and Consolidated Financial Statements documents as well as the documents for the Non-Financial Reporting, we agreed to the results of the audits following an extensive discussion on the Supervisory Board as wellas with the representatives of the auditor. We determined that, also based on the final results of our inspections, there are noobjections to be raised.

XV
Deutsche BankAnnual Report 2018
Report of the Supervisory Board
We approved the Annual Financial Statements and Consolidated Financial Statements prepared by the Management Boardon March 21, 2019. The Annual Financial Statements are thus established. We agree to the Management Board’s proposalfor the appropriation of distributable profit.
Personnel issues
With the conclusion of the General Meeting on May 24, 2018, Ms. Parent, Professor Dr. Kagermann and Dr. Teyssen left theSupervisory Board. The General Meeting elected Ms. Clark, Ms. Trogni and Mr. Thain as new members until the conclusionof the General Meeting that resolves on the ratification of the acts of management for the 2022 financial year.
Furthermore, the General Meeting elected Ms. Dublon as member of the Supervisory Board until July 31, 2018, and ProfessorDr. Winkeljohann as member with effect from August 1, 2018, until the conclusion of the General Meeting that resolves on theratification of the acts of management for the 2022 financial year.
With the conclusion of the General Meeting on May 24, 2018, the term of office of the employee representatives on theSupervisory Board came to an end. Mr. Bsirske, Mr. Duscheck, Mr. Heider, Ms. Klee, Ms. Mark, Ms. Platscher and Mr. Rosewere re-elected to the Supervisory Board. Newly elected as employee representatives to the Supervisory Board were Mr.Blomeyer-Bartenstein, Mr. Polaschek and Mr. Szukalski. For Mr. Szukalski it is the second time.
Mr. Cryan left the Management Board on April 8, 2018. Dr. Schenck and Ms. Hammonds each left the Management Board onMay 24, 2018. Mr. Moreau left the Management Board with effect from December 31, 2018.
With immediate effect on April 8, 2018, we appointed Mr. Sewing as Chairman of the Management Board and Mr. Ritchie andMr. von Rohr as Presidents (Deputy Chairmen of the Management Board).
Furthermore, we extended Mr. Ritchie’s appointment for five years (see “Corporate Governance Statement / ManagementBoard” starting on page 393 of the Annual Report) and appointed Mr. Kuhnke as member of the Management Board witheffect from January 1, 2019. In January 2019, we resolved to extend Mr. Steinmüller’s appointment for one year, until July 31,2020.
We thank the members who left last year for their dedicated work and their constructive assistance to the company during thepast years.
We would also like to thank the bank’s employees for their great personal dedication.
Frankfurt am Main, March 21, 2019
The Supervisory Board
Dr. Paul AchleitnerChairman

Supervisory Board
Dr. Paul Achleitner– ChairmanMunichGermany
Detlef Polaschek*since May 24, 2018– Deputy ChairmanEssenGermany
Stefan Rudschäfski*until May 24, 2018– Deputy ChairmanKaltenkirchenGermany
Ludwig Blomeyer- Bartenstein*since May 24, 2018BremenGermany
Wolfgang Böhr*until May 24, 2018DusseldorfGermany
Frank Bsirske*BerlinGermany
Mayree Carroll Clarksince May 24, 2018New YorkUSA
Dina Dublonuntil July 31, 2018New YorkUSA
Jan Duscheck*BerlinGermany
Dr. Gerhard EschelbeckCupertinoUSA
Katherine Garrett-CoxBrechin, AngusUnited Kingdom
Timo Heider*EmmerthalGermany
Sabine Irrgang*until May 24, 2018MannheimGermany
Prof. Dr. Henning Kagermannuntil May 24, 2018Königs WusterhausenGermany
Martina Klee*Frankfurt am MainGermany
Henriette Mark*MunichGermany
Richard MeddingsCranbrookUnited Kingdom
Louise M. Parentuntil May 24, 2018New YorkUSA
Gabriele Platscher*BraunschweigGermany
Bernd Rose*MendenGermany
Gerd Alexander SchützViennaAustria
Prof. Dr. Stefan SimonZurichSwitzerland
Stephan Szukalski*since May 24, 2018Ober-MörlenGermany
Dr. Johannes Teyssenuntil May 24, 2018DusseldorfGermany
John Alexander Thainsince May 24, 2018RyeUSA
Michele Trognisince May 24, 2018RiversideUSA
Prof. Dr. Norbert Winkeljohannsince August 1, 2018OsnabrückGermany
Deutsche Bank Group
* Employee representatives
Deutsche BankAnnual Report 2018
Deutsche Bank Group
XVI

Committees
Chairman’s CommitteeDr. Paul Achleitner – Chairman
Frank Bsirske*
Prof. Dr. Henning Kagermann (until May 24, 2018)
Detlef Polaschek* (since May 24, 2018)
Stefan Rudschäfski* (until May 24, 2018)
Prof. Dr. Stefan Simon (since May 24, 2018)
Nomination CommitteeDr. Paul Achleitner – Chairman
Frank Bsirske*
Prof. Dr. Henning Kagermann (until May 2018)
Detlef Polaschek* (since May 24, 2018)
Stefan Rudschäfski* (until May 24, 2018)
Gerd Alexander Schütz (since May 24, 2018)
Prof. Dr. Stefan Simon (since May 24, 2018)
Dr. Johannes Teyssen (until May 24, 2018)
Audit CommitteeProf. Dr. Norbert Winkeljohann – Chairman
(since January 1, 2019Member since November 1, 2018)
Richard Meddings – Chairman
(until December 31, 2018)
Dr. Paul Achleitner
Katherine Garrett-Cox (until October 31, 2018 and January 1, 2019)
Henriette Mark*
Gabriele Platscher*
Detlef Polaschek* (since May 24, 2018)
Bernd Rose*
Prof. Dr. Stefan Simon
Compensation Control CommitteeDr. Paul Achleitner – Chairman
Frank Bsirske*
Prof. Dr. Henning Kagermann (until May 24, 2018)
Detlef Polaschek* (since May 24, 2018)
Stefan Rudschäfski* (until May 24, 2018)
Prof. Dr. Stefan Simon (since May 24, 2018)
Strategy Committee (since May 24, 2018)John Alexander Thain – Chairman
Dr. Paul Achleitner
Frank Bsirske*
Mayree Carroll Clark
Timo Heider*
Henriette Mark*
Richard Meddings
Detlef Polaschek*
Technology, Data and Innovation Committee (since May 24, 2018)Michele Trogni – Chairperson
Dr. Paul Achleitner
Jan Duscheck*
Dr. Gerhard Eschelbeck
Martina Klee*
Bernd Rose*
* Employee representatives
CommitteesDeutsche BankAnnual Report 2018
XVII

Integrity CommitteeProf. Dr. Stefan Simon – Chairman
Dr. Paul Achleitner
Ludwig Blomeyer-Bartenstein* (since May 24, 2018)
Katherine Garrett-Cox (since May 24, 2018)
Sabine Irrgang* (until May 24, 2018)
Timo Heider*
Martina Klee* (until May 24, 2018)
Louise M. Parent (until May 24, 2018)
Gabriele Platscher* (since May 24, 2018)
Dr. Johannes Teyssen (until May 24, 2018)
Risk CommitteeMayree Carroll Clark – Chairperson
(since May 24, 2018)
Dina Dublon – Chairperson
(until May 24, 2018)
Dr. Paul Achleitner
Ludwig Blomeyer-Bartenstein* (since May 24, 2018)
Wolfgang Böhr* (until May 24, 2018)
Jan Duscheck* (since May 24, 2018)
Richard Meddings (until December 31, 2018)
Louise M. Parent (until May 24, 2018)
Stephan Szukalski* (since May 24, 2018)
Michele Trogni (since May 24, 2018)
Prof. Dr. Norbert Winkeljohann (since January 1, 2019)
Mediation CommitteeDr. Paul Achleitner – Chairman
Frank Bsirske* (since May 24, 2018)
Wolfgang Böhr* (until May 24, 2018)
Prof. Dr. Henning Kagermann (until May 24, 2018)
Detlef Polaschek* (since May 24, 2018)
Stefan Rudschäfski* (until May 24, 2018)
Prof. Dr. Stefan Simon (since May 24, 2018)
Deutsche Bank Group
* Employee representatives
Deutsche BankAnnual Report 2018
Deutsche Bank Group
XVIII

XIX
Deutsche BankAnnual Report 2018
Strategy
Strategy
We are a leading European bank with global reach supported by a strong home base in Germany, Europe’s largest economy.We provide services in commercial and investment banking, retail banking as well as wealth and asset management productsto corporations, governments, institutional investors, small and medium-sized businesses, and private individuals.
In the second quarter of 2018, we announced changes to our strategy and updates to our financial targets. Management isfocused on materially improving returns to shareholders over time and on deploying our balance sheet and other resourcesto the highest return activities consistent with our client franchise and risk appetite. To achieve these primary objectives wehave defined four key strategic imperatives: First, shift the bank to a more stable revenue and earnings profile. Second,execute on clearly defined strategies in our Private & Commercial Bank (PCB) and our Asset Management (AM) businesses.Third, reshape our Corporate & Investment Bank (CIB) towards a model which emphasizes our core strength in transactionbanking, capital markets, financing and treasury solutions. And fourth, reduce our costs and commit to an uncompromisingcost culture.
As the basis of our strategy, we seek to continue building on our 2018 achievements: we intend to retain our cost disciplineand plan to continue to reduce expenditures. However, we also aim to begin a new phase – one of controlled growth. We aimto grow in all our business divisions, at the same time not relinquishing our cost discipline or compromising our integrity.
Achieving a more stable revenue and earnings profile
We aim to increase the share of revenues coming from stable sources characterized by lower earnings volatility and to expandour more stable businesses – Private & Commercial Bank, our Asset Management division DWS and Global TransactionBanking. The more stable business mix is intended to lower our funding costs, support our credit rating and make ourperformance more resilient even in very challenging environments or markets.
Growth in our Private & Commercial Bank and DWS
Our Private & Commercial Bank comprises the three business units Private and Commercial Business (Germany), Privateand Commercial Business (International) and Wealth Management (Global).
Our Private and Commercial Business (Germany) serves more than 20 million private and commercial clients and pursues adifferentiated, customer-focused approach with two main distinct and strong brands: Deutsche Bank and Postbank. The strongpositioning of the two brands, the broad customer base and the use of complementary strengths build the basis for significantcost and revenue synergies of € 900 million annually which we aim to fully realize in 2022 and beyond. A new operating modelwith a joint infrastructure and product platform as well as a joint management will help to pursue towards the achievements ofthese targets.
In our Private and Commercial Business (International), we continue to sharpen focus and invest into our core markets. Whilestreamlining our geographic footprint with the completed partial exit from Poland and the ongoing disposal of our business inPortugal, we are investing into our Italian, Spanish, Belgian and Indian operations as we view them as attractive and growingmarkets.
In Wealth Management (Global) we seek to grow our market share, both in Germany and internationally.
We are also proceeding with our investments in digital solutions for banking and non-banking products through further equityinvestments into strategic partners and enhancements of our digital platform.
For DWS, with the IPO now completed, we are focusing on growing assets under management, improving efficiency andprofitability and driving strong DWS shareholder return, including a robust dividend.

XX
Deutsche Bank StrategyAnnual Report 2018
Reshaping Corporate & Investment Bank
We intend to remain a leading European Corporate & Investment Bank with global reach. As part of the restructuringannounced and completed in 2018, CIB will focus on its core product strengths and key markets.
We announced three strategic updates for CIB. First, we optimized our Origination and Advisory business: we will maintain astrong presence but we are focusing on sectors and segments that are most relevant for our most important clients or in whichwe have a strong global position. Second, we pivoted to our strengths in Fixed Income & Currencies (FIC) focused aroundour core strengths while reducing exposure to US Rates. Third, in Equities, we refocused our resources around our existingprofitable customer relationships.
Going forward, we will focus our resources on our key strengths in transaction banking, capital markets, financing and treasurysolutions. Additionally, we intend to significantly reduce our cost to serve via workforce reductions and through modernizationof platform.
Rigorous cost management
Given the progress made in reducing adjusted costs in 2018, management is now committed to reduce adjusted costsby a further € 1 billion to € 21.8 billion in 2019, thereby lowering the target we set ourselves in 2018 by € 200 million.Costs in 2019 should benefit from the full run rate of previously enacted measures as well as from our planned additionalheadcount reductions, the synergies from our German retail merger and completion of the sale of our Portuguese retailoperations. We also aim to benefit from management’s ongoing effort to reduce non-compensation costs, includingfurther rationalizing vendor spending and our real estate footprint. At the same time, we will continue to invest in ourtechnology and controls.
Our Financial Targets
Near-term operating targets
‒ Post-tax Return on Average Tangible Equity of greater than 4 % in 2019‒ Adjusted costs of € 21.8 billion in 2019‒ Full-time equivalent internal employees of below 90,000 by year-end 2019
Long-term operating target
‒ Post-tax Return on Average Tangible Equity of circa 10 % in a normalized environment and on the basis of the achievementof our cost targets
As we execute on our near- and long-term operating targets, we intend to continue managing our balance sheet conservatively,with the following capital targets:
Capital targets
– CRR/CRD 4 Common Equity Tier 1 capital ratio above 13 %– CRR/CRD 4 Leverage Ratio (phase-in) of 4.5 % over time– A competitive dividend payout ratio

XXI
Deutsche BankAnnual Report 2018
Strategy
Progress on strategy implementation
In 2018, we delivered on our adjusted cost and headcount targets. Our adjusted costs of € 22.8 billion, were below our€ 23 billion target. On a full-time equivalent (FTE) basis, we reduced the number of internal employees to 91,737 at yearend 2018, compared to our target of below 93,000. Our Common Equity Tier 1 ratio at 13.6 % is above our target, andour leverage ratio on a phased-in basis improved to 4.3 % compared to 4.5 %, our target over time.
During 2018 our Corporate & Investment Bank (CIB) announced headcount and resource reductions as part of thedivision’s strategic reshaping. These actions were successfully delivered across the second and third quarter of 2018.Measures included: reprioritizing our presence in Origination & Advisory in sectors where we have strong market position;decreasing leverage exposure within Equities, mainly in Prime Finance, and US Rates including repo financing; andreducing our Equities headcount by approximately 25 %. We continued to implement further measures to reduce ourcost base, while the risk weighted assets and leverage exposure of assets identified as not consistent with CIB’s strategycontinue to roll off as planned. Through achievement of greater revenue and resource productivity as well as costefficiency we aim to improve CIB’s profitability going forward.
In 2019, CIB is focused on delivering controlled revenue growth from targeted resource deployment and investment.This will be supported by a more focused client coverage and product offering, leading to an improved ability to directresources to the highest return relationships, ultimately increasing share of clients’ “wallet” (amounts clients spend onbanking products). CIB continues to reinvigorate its client-led franchise through more effective coverage, as evidencedby the creation of an integrated Institutional and Treasury Coverage Group in 2018. The aim of this group is to achievesynergies from closer alignment and shared expertise. Further expense management initiatives in 2019 are focused onmiddle and back office functions.
We continue to see a clear opportunity for CIB to occupy an attractive position as one of the handful of globally relevantEuropean participants in the Global CIB market.
For Private & Commercial Bank, following the successful merger of Deutsche Bank Privat- und Geschäftskunden AG andDeutsche Postbank AG in the second quarter of 2018, we took further actions in the fourth quarter of 2018 to achieveour future organizational structure. We further optimized the Private and Commercial Business (Germany) salesorganization and also enhanced our sales infrastructure as well as branch formats. To streamline our head office, weannounced a dedicated leadership team for our product governance and management and defined the head office targetoperating model. Additionally, we strengthened our digital platform by the launch of our digital brand “Yunar” and we wereamong the first banks in Germany to offer Apple Pay to our clients.
In our Private and Commercial Business (International), we continued to execute the bank’s strategy to sharpen its focusand reduce complexity. The announced disposal of the majority of our retail business in Poland was successfully closedin the course of the fourth quarter of 2018, while the sale of the local retail business in Portugal is progressing on trackand the parties intend to close the transaction in the second quarter of 2019, subject to regulatory approvals and otherconditions. In Italy and Spain, we have further refined our business models to improve client coverage and efficiency,supported by an optimized sales network and streamlined organization, and we are continuing to focus on improving thereturns of our businesses in India and Belgium.
In Wealth Management (Global), we made further progress towards our strategic agenda focusing on improving theefficiency and robustness of our platform while putting emphasis on growth, notably in core ultra-high-net-worth (UHNW)markets, through targeted front-office hiring. Over the course of 2018, WM further invested in strengthening its controlframework. At the same time, various projects were undertaken aimed to enhance the client experience throughimproved digital offerings, quicker onboarding, as well as approaching clients with a more nuanced client service model.A significant milestone in the simplification of our management structure was the launch of a new regional structure inthe fourth quarter of 2018 moving from four to three regions (Americas, Europe, Emerging Markets). And we successfullycompleted the integration of Sal. Oppenheim’s Wealth Management business into Deutsche Bank Group in the secondquarter of 2018.

XXII
Deutsche Bank StrategyAnnual Report 2018
In Asset Management, following the successful IPO of DWS in the first quarter of 2018, the business has begun to operateas a more autonomous company and to build the foundation for long-term growth. AM is executing on growth initiatives,including strategic hires into the client coverage teams, in part to bolster institutional growth, as well as to support thePassive business. AM also successfully added new distributors to the proprietary digital investment platform, and becamethe first asset manager to introduce its digital investment platform to the unit-linked insurance market.
DWS and BNP Paribas Securities Services jointly decided not to proceed with the transfer of our fund administrationservices in Germany and Luxembourg to BNP Paribas Securities Services and the provision of depositary and custodyservices to our retail funds, as announced in June 2018.
Asset Management has seen continued progress with our Environment, Social and Governance (ESG) strategy,illustrated by the recent expansion of our product suite across the Active, Passive and Alternatives investment spaces.
An efficiency and transformation program has been established with dedicated initiatives to challenge and reduceexpenditures as well as to enhance efficiency and productivity by simplifying our operating model.

2 Operating and Financial Review2 Executive Summary4 Deutsche Bank Group10 Results of Operations28 Financial Position31 Liquidity and Capital Resources
33 Outlook
39 Risks and Opportunities
44 Risk Report46 Risk and Capital Overview50 Risk and Capital Framework60 Risk and Capital Management90 Risk and Capital Performance
154 Compensation Report157 Management Board Compensation Report183 Employee Compensation Report196 Compensation System for Supervisory Board
Members
199 Corporate Responsibility
199 Employees
204 Internal Control over Financial Reporting
206 Information pursuant to Section 315a (1) of theGermanCommercialCodeand Explanatory Report
210 Corporate Governance Statement pursuant to Sections 289f and 315d of the German Commercial Code
Management Report1

2
Deutsche Bank 1 – Management ReportAnnual Report 2018
Operating and Financial Review
The following discussion and analysis should be read in conjunction with the consolidated financial statements and the relatednotes to them. Our Operating and Financial Review includes qualitative and quantitative disclosures on Segmental Results ofOperations and Entity Wide disclosures on Net Revenue Components as required by International Financial ReportingStandard (IFRS) 8, “Operating Segments”. This information, which forms part of and is incorporated by reference into thefinancial statements of this report, is marked by a bracket in the margins throughout this Operating and Financial Review. Foradditional Business Segment disclosure under IFRS 8 please refer to Note 4 “Business Segments and Related Information”of the Consolidated Financial Statements. Forward-looking statements are disclosed in our Outlook section.
Executive Summary
The Global Economy
Economic growth (in %)¹ 2018² 2017 Main driverGlobal Economy 3.8 3.8 Robust global growth, with industrialized countries saw a peak in their economic cycle,
while growth in emerging markets slowed towards the end of the year. Trade tensionsreached a level that weighed on global trade. The strong US economy provided impetusto global growth.
Of which:Industrialized countries 2.2 2.3 The global momentum supported growth in industrialized countries but trade disputes
began to have a negative impact on the global value chains of the industrializedcountries.
Emerging markets 4.9 4.8 Emerging markets benefited from the extension of the global economic cycle. Growthpeaked in Asia whereas some Latin American economies stabilized.
Eurozone Economy 1.8 2.5 The eurozone economy expanded more slowly than expected, reflecting temporaryeffects in some member states and a deteriorating external environment. Growth wassupported by domestic demand underpinned by a solid income growth and improvedfinancial conditions.
Of which: German economy 1.4 2.2 The German economy surprised to the downside. Delays in the certification of newvehicles hampered automobile production and thus impacted the overall economicvalue chain. A tight labor market led to strong wage agreements.
US Economy 2.9 2.2 Strong performance of the US economy was supported by tax cuts, fiscal spending aswell as supportive financial conditions and consumer spending backed by wage growthand a tight labor market.
Japanese Economy 0.7 1.9 The Japanese economy slowed due to lower private consumption spending and loweremployment growth as well as weaker external demand.
Asian Economy³ 6.2 6.1 Asian economies continued to show strong growth, but may have passed their cyclicalpeak. Trade was a key driver of economic expansion.
Of which: Chinese Economy 6.6 6.9 Chinese growth slowed somewhat. The government has kept a tight policy stance in theproperty sector. Lower land sales impacted sliding fiscal revenues. Chinese exportswere resilient despite growing trade tensions throughout 2018.
1 Annual Real GDP Growth (% YoY). Sources: National Authorities unless stated otherwise.2 Sources: Deutsche Bank Research.3 Including China, India, Indonesia, Republic of Korea, and Taiwan, ex Japan.
The Banking Industry
In the Eurozone, 2018 saw banks record their first noteworthy growth in corporate lending since the financial crisis, withvolumes up 2 % year on year. By contrast, the dynamics in real estate lending to households and in consumer lending werestable at 3 %. Interest rates remained close to historical lows and weighed on the banks' net interest margin. Growth incorporate deposits slowed quite significantly to 3 % year on year while growth in retail deposits increased to over 4.5 %.European banks likely saw revenues and overhead expenses decline slightly, with a significant drop in risk provisions (froman already low level).
In Germany, lending to corporates and the self-employed continued to gain considerable pace last year, an increase of 5.5 %year on year. The figure was the highest since the dot-com bubble in the early 2000s and coincided with a sharp decline incorporate bond issuance. Retail lending also continued to expand at 3.5 %, driven by a 5 % increase in mortgage volumes.On the funding side, household deposits grew roughly at 5 % while corporate deposits expanded at a considerably slowerpace of 2.5 %. Despite excellent asset quality, there is no change expected in the structurally low profitability of Germany'sbanks, a situation mainly caused by the intense competition and low interest rate environment.

3
Deutsche Bank Operating and Financial ReviewAnnual Report 2018 Executive Summary
The US banking industry is almost certain to have set a new profit record. The first nine months saw the banks alreadygenerate higher net profit than in any prior full-year period. This was due to a wide range of factors including healthy creditbusiness, the benefit of higher interest rates on net interest margin and on liquid funds, tax cuts, and market share gained inthe global capital markets business. Lending to households increased by 2.2 % year on year a decline from its 2017 ratereflecting slower growth in mortgage lending to 3 % and a 9 % decline in home equity loans, while growth in consumer loanswas stable at 5 %. In contrast, the growth rate in lending to businesses doubled to 7.5 % over the course of the year, drivenby double-digit growth in corporate lending, where outstanding volumes have doubled since 2010. Commercial real estatelending grew at a somewhat lower rate than in the previous year at 5 %. Private sector deposits continued to expand by 4 %.
In China, the credit growth further slowed in 2018. Lending to businesses grew by just 8 % year on year, while the figure forretail customers was 18 %. Private sector deposits grew at a 7 % rate, stable versus the prior period. In Japan, too, growthrates remained largely stable overall at 2.5 % for lending and 3.5 % for deposits.
Investment banking recorded a solid result in the M&A advisory business in 2018, while transaction volumes in equity anddebt issuance saw year-on-year declines. Securities trading posted largely positive growth. Equities trading in the UnitedStates and the derivatives business delivered an excellent performance and there was also robust growth in bonds. The onlycontraction was in European equities trading.
Deutsche Bank Performance
In 2018, Deutsche Bank achieved its first full year net profit since 2014 and delivered on its adjusted cost and headcounttargets. The bank also announced and executed against a series of strategic repositioning measures, mainly within theCorporate & Investment Bank, and made good progress while further strengthening its controls and processes. In 2018, thebank successfully completed the legal merger of Deutsche Bank Privat- und Geschäftskunden AG and Postbank, the partialsale of the retail business in Poland, the integration of Sal. Oppenheim and the Initial Public Offering (“IPO”) of DWS GroupGmbH & Co. KGaA (“DWS”). The bank is focused on redeploying resources and investing in areas of core strength which themanagement believes will drive growth.
Group Key Performance IndicatorsNear-term operating performance Status end of 2018 Status end of 2017Post-tax return on average tangible shareholders’ equity ¹ 0.5 % (1.4) %Adjusted costs² € 22.8 bn € 23.9 bnEmployees3 91,737 97,535
Capital performanceCRR/CRD 4 fully loaded Common Equity Tier 1 ratio4 13.6 % 14.0 %CRR/CRD 4 leverage ratio (phase-in)4 4.3 % 4.1 %1 Based on Net Income attributable to Deutsche Bank shareholders and additional equity components. For further information, please refer to “Supplementary Information: Non-
GAAP Financial Measures” of this report.2 Adjusted costs are noninterest expenses excluding impairment of goodwill and other intangible assets, litigation and restructuring and severance. For further information,
please refer to “Supplementary Information: Non-GAAP Financial Measures” of this report.3 Internal full-time equivalents.4 Further detail on the calculation of this ratio is provided in the Risk Report.
Net revenues in 2018 were € 25.3 billion, a decline of € 1.1 billion, or 4 % from 2017. Revenues in the Corporate & InvestmentBank (CIB) were impacted by the strategic repositioning, specifically the reduction in headcount and leverage exposure,challenging market conditions, lower client activity, which was in part driven by adverse developments with respect to thebank, negative interest rates and margin compression. Revenues in Private & Commercial Bank (PCB) were essentially flatas growth in revenues from loans was offset by ongoing interest rate headwinds on deposit products. Revenues in AssetManagement (AM) were impacted by net outflows, margin compression, lower performance fees and the absence of specificrevenue items recorded in 2017. Revenues in Corporate and Other (C&O) improved mainly driven by the absence of therealization of a negative currency translation adjustment related to the sale of a non-strategic subsidiary in Argentina in 2017and higher positive impacts from valuation and timing differences in 2018 compared to prior year.
Provision for credit losses was € 525 million in 2018, unchanged compared to 2017.
Noninterest expenses in 2018 were € 23.5 billion, a decrease of € 1.2 billion or 5 %, from 2017 as management executed onits cost reduction targets. The decrease was driven by reductions across most of the cost categories including lowercompensation and benefits expense, reduced cost for professional service fees and for occupancy, as well as lower litigationand restructuring charges.

4
Deutsche Bank 1 – Management ReportAnnual Report 2018
Income before income taxes was € 1.3 billion in 2018 compared to € 1.2 billion in 2017, an increase of € 103 million or 8 %mainly driven by lower noninterest expenses partly offset by lower revenues.
Income tax expense was € 989 million in 2018, compared to € 2.0 billion in 2017 which included a one-time tax charge of€ 1.4 billion attributable to the remeasurement of US deferred tax assets as a result of the US tax reform. The effective taxrate of 74 % in 2018 was mainly impacted by changes in the recognition and measurement of deferred tax assets and share-based payment-related tax effects.
The bank reported a net income of € 341 million in 2018, compared to a net loss of € 735 million in 2017. The improvementwas primarily driven by the absence of the prior year’s one-time tax charge and lower noninterest expenses.
The bank’s CRR/CRD 4 fully loaded Common Equity Tier 1 (CET 1) ratio was 13.6 % at the end of 2018 compared to 14.0 %at the end of 2017, primarily driven by an increase in Risk weighted assets.
Deutsche Bank Group
Deutsche Bank: Our Organization
Headquartered in Frankfurt am Main, Germany, we are the largest bank in Germany and one of the largest financial institutionsin Europe and the world, as measured by total assets of € 1,348 billion as of December 31, 2018. As of that date, we employed91,737 full-time equivalent internal employees and operated in 59 countries out of 2,064 branches worldwide, of which 68 %were in Germany. We offer a wide variety of investment, financial and related products and services to private individuals,corporate entities and institutional clients around the world.
As of December 31, 2018, we were organized into the following three corporate divisions:
– Corporate & Investment Bank (CIB)– Private & Commercial Bank (PCB)– Asset Management (AM)
The three corporate divisions are supported by infrastructure functions. In addition, Deutsche Bank has a local and regionalorganizational layer to facilitate a consistent implementation of global strategies.
We have operations or dealings with existing or potential customers in most countries in the world. These operations anddealings include working through:
– subsidiaries and branches in many countries;– representative offices in many other countries; and– one or more representatives assigned to serve customers in a large number of additional countries.
We have made the following significant capital expenditures or divestitures since January 1, 2016, that are not allocated tothe capital expenditures or divestitures of corporate divisions described below:
In August 2016, Deutsche Bank Group entered into an agreement to sell Deutsche Bank S.A., its subsidiary in Argentina, toBanco Comafi S.A. The transaction is part of the Group’s plan to rationalize its global footprint. In June 2017, the transactionwas successfully completed.
On October 26, 2016, Deutsche Bank entered into an agreement to sell its Mexican bank and broker dealer subsidiaries toInvesta Bank S.A., Institución de Banca Múltiple. Investa Bank S.A. has since been renamed to Accendo Banco. Closing ofthe transaction was originally expected in the first half of 2018, but remains subject to regulatory approvals and othercustomary conditions. During the fourth quarter of 2018, Deutsche Bank notified Accendo Banco that the Group is exercisingits right to terminate the purchase agreement.
Capital expenditures or divestitures related to the divisions are included in the respective Corporate Division Overview.

5
Deutsche Bank Operating and Financial ReviewAnnual Report 2018 Deutsche Bank Group
Management Structure
The Management Board has structured the Group as a matrix organization, comprising (i) Corporate Divisions, (ii)Infrastructure Functions and (iii) Regions.
Pursuant to the German Stock Corporation Act, the Management Board is responsible for the executive management ofDeutsche Bank. Its members are appointed and removed by the Supervisory Board, which is a separate corporate body. OurManagement Board focuses on, among other topics, strategic management, corporate governance, financial accounting andreporting, resource allocation, control and risk management, and is assisted by functional committees.
Within each corporate division and region, coordination and management functions are handled by operating committees andexecutive committees, which help ensure that the implementation of the strategy of individual business divisions and the plansfor the development of infrastructure areas are aligned to our global business objectives.
Corporate & Investment Bank (CIB)
Corporate Division OverviewCIB comprises our Global Transaction Banking, Origination & Advisory, Sales & Trading (FIC) and Sales & Trading (Equity)businesses. The division brings together wholesale banking expertise across, coverage, risk management, sales and trading,Investment Banking and infrastructure across Deutsche Bank. This enables CIB to align resourcing and capital across ourclient and product perimeter to effectively serve the Bank’s clients.
In CIB, we made the following significant capital divestiture since January 1, 2016 and no significant capital expenditures:
In early October 2017, Deutsche Bank Group signed a binding agreement to sell its Alternative Fund Services business, aunit of the Global Transaction Banking division, to Apex Group Limited. The transaction supported the Group’s announcedstrategic priorities and was completed in the second quarter of 2018.
Products and ServicesGlobal Transaction Banking (GTB) is a global provider of cash management, trade finance and securities services, deliveringthe full range of commercial banking products and services for both corporate clients and financial institutions worldwide.
Origination and Advisory is responsible for mergers and acquisitions (M&A) as well as debt and equity advisory and origination.Regional and industry-focused coverage teams ensure the delivery of the entire range of financial products and services toour corporate and institutional clients.
Sales & Trading (FIC) and Sales & Trading (Equity) combine sales, trading and structuring of a wide range of financial marketproducts, including bonds, equities and equity-linked products, exchange-traded and over-the-counter derivatives, foreignexchange, money market instruments, and structured products, while Research provides analysis of markets, products andtrading strategies for clients.
All our trading activities are covered by our risk management procedures and controls which are described in detail in the RiskReport.
Distribution Channels and MarketingAs part of our strategy, we are re-focusing and optimizing our client coverage model to the benefit of our core clients. We areexiting client relationships where we consider returns to be too low or risks to be too high while also strengthening our clienton-boarding and know-your-client (KYC) procedures.
Coverage of our clients is provided by the Institutional and Treasury Coverage group, which combines our Equity and Debtsales teams, Financial Solutions Group and Corporate Banking Coverage. This new consolidated group is intended to benefitthe division through closer cooperation and enhanced synergies leading to increased cross selling of products/solutions to ourclients, while working closely with the Investment Banking Coverage team within Corporate Finance.

6
Deutsche Bank 1 – Management ReportAnnual Report 2018
Private & Commercial Bank (PCB)
Corporate Division OverviewIn PCB, we serve personal and private clients, small and medium-sized enterprises as well as wealthy private clients. We areorganized along three core business divisions: Private and Commercial Business (Germany), Private and CommercialBusiness (International) and Wealth Management (Global). Our product range includes payment and account services, creditand deposit products as well as investment advice and selected digital offerings. In these products, we offer our customersboth the coverage of all basic financial needs and individual, tailor-made solutions.
PCB made the following significant capital expenditures or divestitures since January 1, 2016:
In March 2018, Deutsche Bank Group entered into an agreement to sell the retail banking business in Portugal to ABANCACorporación Bancaria S.A. The parties are aiming to close the transaction in the first half of 2019, subject to regulatoryapprovals and the finalization of separation measures.
In December 2017, Deutsche Bank Group entered into an agreement for the partial sale of its retail banking business in Polandto Santander Bank Polska (formerly Bank Zachodni WBK). The transaction was completed in November 2018.
In March 2017, Deutsche Bank Group signed a definitive agreement to sell its share in Concardis GmbH, a leading Germanpayment service provider established in form of a joint venture of the German banking sector, to a consortium of AdventInternational and Bain Capital Private Equity. In July 2017, the transaction was successfully completed.
On December 28, 2015, we agreed to sell our entire 19.99 % stake in Hua Xia Bank Company Limited to PICC Property andCasualty Company Limited. The share transfer was completed in the fourth quarter 2016 and all remaining closing formalitieswere completed in the first quarter of 2017.
In the fourth quarter 2015, we announced that we had entered into a definitive asset purchase agreement to sell our U.S.Private Client Services (PCS) unit to Raymond James Financial, Inc. In September 2016 the transaction was completedsuccessfully.
In November 2015, Visa Inc. announced a definitive agreement to acquire Visa Europe Limited. As part of this acquisition VisaEurope Limited requested all its shareholders, which included several Deutsche Bank Group entities, to return their sharesagainst consideration. We returned our shares in Visa Europe Limited in January 2016 and received the cash and preferredshares consideration at closing on June 21, 2016 as well as an entitlement to a deferred cash payment including interest uponthe third anniversary of the closing date.
Products and ServicesIn our Private and Commercial Business (Germany) division, we pursue a differentiated, customer-focused approach with twobrands – “Deutsche Bank” and “Postbank”. With our “Deutsche Bank” brand we focus on providing our private customers withbanking and financial products and services that include sophisticated and individual advisory solutions. For small andmedium-sized corporate clients, we provide an integrated commercial banking coverage model in collaboration with theCorporate & Investment Bank. The focus of our “Postbank” brand remains on providing our retail and corporate customerswith standard products and daily retail banking services. In cooperation with Deutsche Post DHL AG, we also offer postal andparcel services in the Postbank branches.
Our Private and Commercial Business (International) division provide banking and other financial services to private andcommercial clients in Belgium, India, Italy and Spain with some variations in the product offering among countries that aredriven by local market, regulatory and customer requirements.
The Wealth Management (Global) division serves wealthy, high-net-worth (HNW) and ultra-high-net-worth (UHNW) individualsand families. We support our clients in planning, managing and investing their wealth, financing their personal and businessinterests and servicing their institutional and corporate needs. We also provide institutional-like services for sophisticatedclients and complement our offerings by closely collaborating with the Corporate & Investment Bank and Asset Management.
We also have consolidated activities, which are no longer part of our core businesses, into a separate unit (called “ExitedBusinesses”) and have established a Digital Ventures unit to holistically steer PCB’s digital agenda across businesses andbrands, focusing on new platform-based digital business models, venture capital investments as well as end-to-end processdigitalization and appropriate data architecture as a basis for structured data analysis and application of Artificial Intelligence.

7
Deutsche Bank Operating and Financial ReviewAnnual Report 2018 Deutsche Bank Group
Distribution Channels and MarketingWe pursue an omni-channel approach and our customers can flexibly choose between different possibilities to access ourservices and products (branches, advisory centers, mobile networks of independent consultants and online/mobile banking).
In our Private and Commercial Business (Germany) and Private and Commercial Business (International) we have similardistribution channels. Those include our branch network, supported by customer call centers and self-service terminals;advisory centers of Deutsche Bank brand in Germany, which connect our branch network with our digital offerings; online andmobile banking including our Digital Platform, through which we provide a transaction platform for banking, brokerage andself-services, combined with a multi-mobile offering for smartphones and tablets; and lastly, financial advisors, as an additionalservice channel in collaboration with self-employed financial advisors as well as sales and cooperation partners.
Wealth Management (Global) has a distinct client coverage. Relationship managers and senior advisor teams manage clientrelationships, advice and assist clients in accessing wealth management services and open-architecture products. InstitutionalWealth Partners (IWP) provide institutional access with market views and trade ideas from our Global Markets platform, aswell as non-recourse lending solutions. Deutsche Oppenheim Family Offices AG (DOAG) offers services that includediscretionary portfolio management, strategic asset allocation, “Family Office Strategy” funds, consulting, third-party managerselection, reporting & controlling as well as real estate and private equity investments.
Asset Management (AM)
Corporate Division OverviewWith over € 660 billion of assets under management as of December 31, 2018, AM is one of the world’s leading investmentmanagement organizations, bringing access to the world’s financial markets and delivering solutions to clients around theglobe. AM aims to provide sustainable financial solutions for all its clients: individual investors and the institutions that servethem.
The corporate division “Deutsche Asset Management” was renamed “Asset Management” during the first quarter of 2018. InMarch 2018, Deutsche Bank completed the partial initial public offering (IPO) of DWS Group GmbH & Co. KGaA (“DWS”), theholding company for AM. Since March 23, 2018, shares of DWS are listed on the Frankfurt stock exchange. We retain an80 % ownership interest in DWS and AM remains a core business for Deutsche Bank.
We have made the following significant capital divestitures since January 1, 2016:
In December 2016, Deutsche Bank completed the sale of the Abbey Life business (Abbey Life Assurance Company Limited,Abbey Life Trustee Services Limited and Abbey Life Trust Securities Limited) to a subsidiary of Phoenix Group Holdings.
Products and ServicesAM’s investment capabilities span both active and passive strategies across a diverse array of asset classes and liquidityspectrum including equities, fixed income, liquidity, real estate, infrastructure, private equity and sustainable investments. Weoffer these capabilities through a variety of wrappers including Exchange Traded Funds, Mutual Funds, and SeparatelyManaged Accounts. AM delivers alpha and beta solutions to address the longevity, liability and liquidity needs of clients,leveraging artificial intelligence and digital technology.
Distribution Channels and MarketingCoverage/Advisory teams manage client relationships, provide advice and assist clients to access AM’s products and services.AM also markets and distributes its offerings through other business divisions of Deutsche Bank Group, notably PCB for retailcustomers, as well as through third-party distributors. To ensure effective service and advice, all clients have a single point ofaccess to AM, with dedicated teams serving specific client groups.

8
Deutsche Bank 1 – Management ReportAnnual Report 2018
Non-Core Operations Unit Corporate Division (NCOU)
In the second half of 2012, the Non-Core Operations Unit (NCOU) was established with the aim to help the Bank reduce risksassociated with capital-intensive assets that are not core to the strategy, thereby reducing capital demand. As set out in ourprevious strategy announcements, our objectives in setting up the NCOU were to improve external transparency of our non-core positions; to increase management focus on the core operating businesses by separating the non-core activities; and tofacilitate targeted accelerated de-risking.
NCOU successfully executed its de-risking target and reduced the portfolio to less than € 10 billion RWA by the year-end2016. As a result, the NCOU ceased to exist as a standalone division from 2017 onwards.
The remaining legacy assets with balance sheet value of approximately € 6 billion as of December 31, 2016 were transferredto the corresponding core operating segments, predominately Corporate & Investment Bank and Private & Commercial Bank.
The NCOU division made the following significant divestitures since January 1, 2016:
In November 2016, Deutsche Bank sold its remaining 16.9 % stake in Red Rock Resorts after an IPO in April 2016 whereDeutsche Bank sold around 3 %.
In April 2016, Deutsche Bank reached an agreement to sell 100 % of Maher Terminals USA LLC in Port Elizabeth, New Jerseyto Macquarie Infrastructure Partners III, a fund managed by Macquarie Infrastructure and Real Assets. Following receipt of allregulatory approvals, we completed the sale in November 2016 for U.S.$ 739 million.
Infrastructure
The infrastructure functions perform control and service functions and, in particular, tasks relating to Group-wide, supra-divisional resource-planning, steering and control, as well as tasks relating to risk, liquidity and capital management.
The infrastructure functions are organized into the following areas of responsibility of our senior management:
– Chief Executive Officer: Communications & Corporate Social Responsibility, Group Audit, Art, Culture & Sports– Chief Financial Officer: Group and Regional Finance, Chief Accounting Officer, Group Tax and Treasury, Planning &
Performance Management, Business and Infrastructure Finance (CFOs), Infrastructure Transformation, Investor Relations,Corporate Investments, Corporate Merger and Acquisitions
– Chief Risk Officer: Business Aligned Risk Management, Regional Risk Management, Enterprise Risk Management andModel Risk, Credit Risk Management, Market Risk Management & Risk Methodology, Non-Financial Risk Management,Treasury & Liquidity Risk Management and Corporate Insurance
– Chief Regulatory Officer: Government and Regulatory Affairs, Anti Financial Crime, Compliance, Business Selection andConflict Office
– Chief Administrative Officer: Legal and Group Governance incl. Data Privacy, Human Resources including CorporateExecutive Matters
– Chief Operating Officer: Chief Information Office, Chief Security Office, Chief Data Office, Digital Strategy & Innovation,Corporate Services, Operations CIB and Client Data Services
For the financial years until 2017, all expenses and revenues incurred within the infrastructure functions and areas are fullyallocated to Corporate & Investment Bank, Private & Commercial Bank and Deutsche Asset Management. From 2018onwards, Infrastructure expenses associated with shareholder activities as defined in the OECD Transfer Pricing Guidelinesare no longer allocated to corporate divisions, but are held centrally and reported under Corporate & Other.
To increase overall effectiveness and collaboration, the bank decided in 2017 to move certain infrastructure employees to thedivisions for which they provide service. This has helped to increase the business divisions’ responsibility and autonomy withrespect to their organizational and process-related decisions and led to a significant increase of the number of employeesassociated with the business divisions compared to 2016 – in particular in the Corporate & Investment Bank as well as inDeutsche Asset Management. Independent Control Functions generally remained in central areas.

9
Deutsche Bank Operating and Financial ReviewAnnual Report 2018 Deutsche Bank Group
Significant Capital Expenditures and Divestitures
Information on each Corporate Division’s significant capital expenditures and divestitures for the last three financial years hasbeen included in the above descriptions of the Corporate Divisions.
Since January 1, 2018, there have been no public takeover offers by third parties with respect to our shares and we have notmade any public takeover offers for our own account in respect of any other company’s shares.

10
Deutsche Bank 1 – Management ReportAnnual Report 2018
Results of Operations
Consolidated Results of Operations
On January 1, 2018, the Group adopted IFRS 9 “Financial Instruments”, which replaces IAS 39, “Financial Instruments:Recognition and Measurement”.
The adoption resulted in changes with regards to impairment as well as classification and measurement, leading to changesto the financial statements presentation. Changes to the financial statements presentation include the introduction of specificline items in the consolidated balance sheet and consolidated income statement, respectively, for Financial Assets at FairValue through Other Comprehensive Income and the discontinuation of specific line items for Financial Assets Available forSale and Securities Held to Maturity for financial years commencing January 1, 2018.
For further information regarding the adoption of IFRS 9, please refer to Note 2 “Recently Adopted and New AccountingPronouncements” of this document.
You should read the following discussion and analysis in conjunction with the consolidated financial statements.
Condensed Consolidated Statement of Income
in € m.2018 increase (decrease)
from 20172017 increase (decrease)
from 2016(unless stated otherwise) 2018 2017 2016 in € m. in % in € m. in %Net interest income 13,192 12,378 14,707 814 7 (2,329) (16)Provision for credit losses 525 525 1,383 (0) (0) (857) (62)Net interest income after provision for credit losses 12,667 11,853 13,324 815 7 (1,472) (11)Commissions and fee income¹ 10,039 11,002 11,744 (963) (9) (742) (6)Net gains (losses) on financial assets/liabilities atfair value through profit or loss¹ 1,332 2,926 1,401 (1,593) (54) 1,524 109Net gains (losses) on financial assets at amortizedcost 2 N/A N/A 2 N/M 0 N/MNet gains (losses) on financial assets at fair valuethrough other comprehensive income 317 N/A N/A 317 N/M 0 N/MNet gains (losses) on financial assets availablefor sale N/A 479 653 (479) N/M (174) (27)Net income (loss) from equity method investments 219 137 455 82 60 (318) (70)Other income (loss) 215 (475) 1,053 689 N/M (1,528) N/MTotal noninterest income 12,124 14,070 15,307 (1,945) (14) (1,238) (8)Total net revenues² 24,791 25,922 28,632 (1,131) (4) (2,709) (9)Compensation and benefits 11,814 12,253 11,874 (439) (4) 380 3General and administrative expenses 11,286 11,973 15,454 (687) (6) (3,481) (23)Policyholder benefits and claims 0 0 374 (0) N/M (374) (100)Impairment of goodwill and other intangible assets 0 21 1,256 (21) N/M (1,235) (98)Restructuring activities 360 447 484 (86) (19) (37) (8)Total noninterest expenses 23,461 24,695 29,442 (1,234) (5) (4,747) (16)Income (loss) before income taxes 1,330 1,228 (810) 103 8 2,038 N/MIncome tax expense (benefit) 989 1,963 546 (974) (50) 1,417 N/MNet income (loss) 341 (735) (1,356) 1,077 N/M 621 (46)Net income attributable to noncontrolling interests 75 15 45 59 N/M (30) (66)Net income (loss) attributable to Deutsche Bankshareholders and additional equity components 267 (751) (1,402) 1,017 N/M 651 (46)N/M – Not meaningful1 For further detail please refer to Note 1 “Significant Accounting Policies and Critical Accounting Estimates” of this report.2 After provision for credit losses.
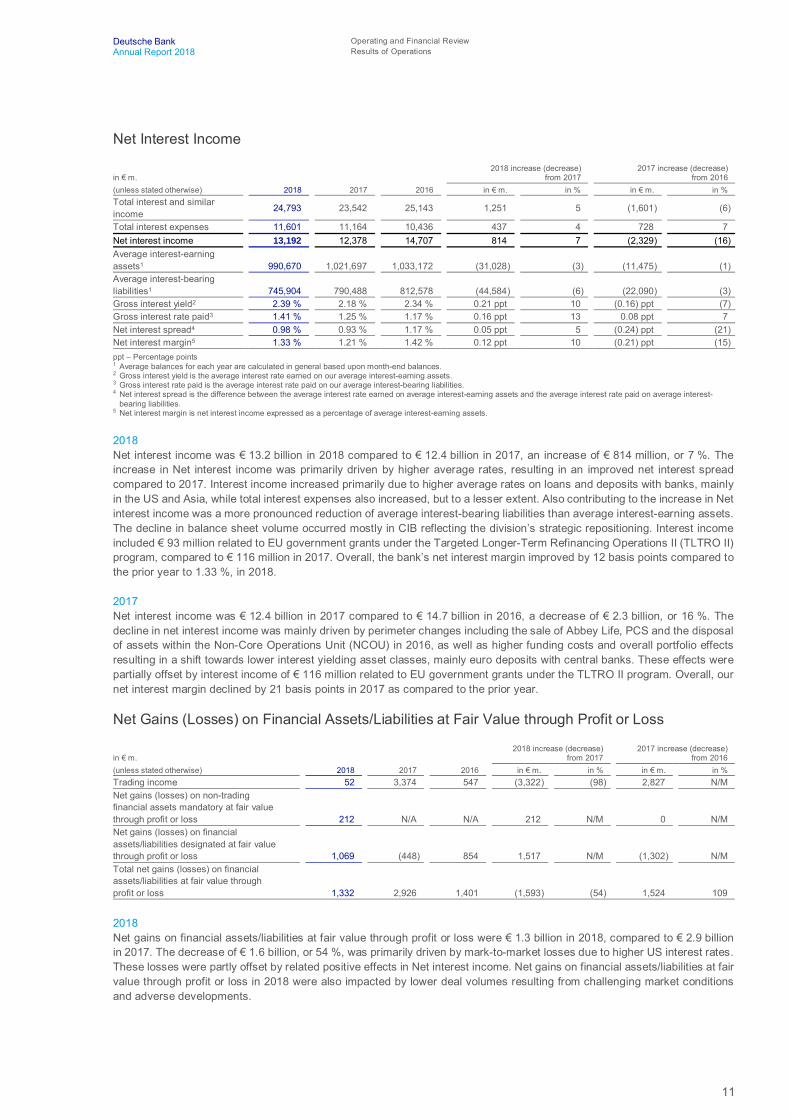
11
Deutsche Bank Operating and Financial ReviewAnnual Report 2018 Results of Operations
Net Interest Income
in € m.2018 increase (decrease)
from 20172017 increase (decrease)
from 2016(unless stated otherwise) 2018 2017 2016 in € m. in % in € m. in %Total interest and similarincome 24,793 23,542 25,143 1,251 5 (1,601) (6)
Total interest expenses 11,601 11,164 10,436 437 4 728 7Net interest income 13,192 12,378 14,707 814 7 (2,329) (16)Average interest-earningassets1 990,670 1,021,697 1,033,172 (31,028) (3) (11,475) (1)Average interest-bearingliabilities1 745,904 790,488 812,578 (44,584) (6) (22,090) (3)Gross interest yield2 2.39 % 2.18 % 2.34 % 0.21 ppt 10 (0.16) ppt (7)Gross interest rate paid3 1.41 % 1.25 % 1.17 % 0.16 ppt 13 0.08 ppt 7Net interest spread4 0.98 % 0.93 % 1.17 % 0.05 ppt 5 (0.24) ppt (21)Net interest margin5 1.33 % 1.21 % 1.42 % 0.12 ppt 10 (0.21) ppt (15)ppt – Percentage points1 Average balances for each year are calculated in general based upon month-end balances.2 Gross interest yield is the average interest rate earned on our average interest-earning assets.3 Gross interest rate paid is the average interest rate paid on our average interest-bearing liabilities.4 Net interest spread is the difference between the average interest rate earned on average interest-earning assets and the average interest rate paid on average interest-
bearing liabilities.5 Net interest margin is net interest income expressed as a percentage of average interest-earning assets.
2018Net interest income was € 13.2 billion in 2018 compared to € 12.4 billion in 2017, an increase of € 814 million, or 7 %. Theincrease in Net interest income was primarily driven by higher average rates, resulting in an improved net interest spreadcompared to 2017. Interest income increased primarily due to higher average rates on loans and deposits with banks, mainlyin the US and Asia, while total interest expenses also increased, but to a lesser extent. Also contributing to the increase in Netinterest income was a more pronounced reduction of average interest-bearing liabilities than average interest-earning assets.The decline in balance sheet volume occurred mostly in CIB reflecting the division’s strategic repositioning. Interest incomeincluded € 93 million related to EU government grants under the Targeted Longer-Term Refinancing Operations II (TLTRO II)program, compared to € 116 million in 2017. Overall, the bank’s net interest margin improved by 12 basis points compared tothe prior year to 1.33 %, in 2018.
2017Net interest income was € 12.4 billion in 2017 compared to € 14.7 billion in 2016, a decrease of € 2.3 billion, or 16 %. Thedecline in net interest income was mainly driven by perimeter changes including the sale of Abbey Life, PCS and the disposalof assets within the Non-Core Operations Unit (NCOU) in 2016, as well as higher funding costs and overall portfolio effectsresulting in a shift towards lower interest yielding asset classes, mainly euro deposits with central banks. These effects werepartially offset by interest income of € 116 million related to EU government grants under the TLTRO II program. Overall, ournet interest margin declined by 21 basis points in 2017 as compared to the prior year.
Net Gains (Losses) on Financial Assets/Liabilities at Fair Value through Profit or Loss
in € m.2018 increase (decrease)
from 20172017 increase (decrease)
from 2016(unless stated otherwise) 2018 2017 2016 in € m. in % in € m. in %Trading income 52 3,374 547 (3,322) (98) 2,827 N/MNet gains (losses) on non-tradingfinancial assets mandatory at fair valuethrough profit or loss 212 N/A N/A 212 N/M 0 N/MNet gains (losses) on financialassets/liabilities designated at fair valuethrough profit or loss 1,069 (448) 854 1,517 N/M (1,302) N/MTotal net gains (losses) on financialassets/liabilities at fair value throughprofit or loss 1,332 2,926 1,401 (1,593) (54) 1,524 109
2018Net gains on financial assets/liabilities at fair value through profit or loss were € 1.3 billion in 2018, compared to € 2.9 billionin 2017. The decrease of € 1.6 billion, or 54 %, was primarily driven by mark-to-market losses due to higher US interest rates.These losses were partly offset by related positive effects in Net interest income. Net gains on financial assets/liabilities at fairvalue through profit or loss in 2018 were also impacted by lower deal volumes resulting from challenging market conditionsand adverse developments.

12
Deutsche Bank 1 – Management ReportAnnual Report 2018
2017Net gains on financial assets/liabilities at fair value through profit or loss were € 2.9 billion in 2017 compared to € 1.4 billion in2016, an increase of € 1.5 billion or 109 %. The increase was primarily driven by trading income, which improved by€ 2.8 billion, mainly due to the non-recurrence of de-risking losses within the NCOU in 2016. Mark-to-market losses onissuances designated at fair value through profit or loss were the main contributor to a loss of € 448 million on financialassets/liabilities designated at fair value through profit or loss in 2017 compared to a gain of € 854 million in 2016. This losswas largely offset by mark-to-market gains in trading income related to financial instruments used as hedges for thoseissuances.
Net Interest Income and Net Gains (Losses) on Financial Assets/Liabilities at Fair Value throughProfit or Loss
Our trading and risk management businesses include significant activities in interest rate instruments and related derivatives.Under IFRS, interest and similar income earned from trading instruments and financial instruments designated at fair valuethrough profit or loss (i.e., coupon and dividend income) and the costs of funding net trading positions are part of net interestincome. Our trading activities can periodically shift income between net interest income and net gains (losses) on financialassets/liabilities at fair value through profit or loss depending on a variety of factors, including risk management strategies.
In order to provide a more business-focused discussion, the following table presents net interest income and net gains (losses)on financial assets/liabilities at fair value through profit or loss by corporate division.
in € m.2018 increase (decrease)
from 20172017 increase (decrease)
from 2016(unless stated otherwise) 2018 2017 2016 in € m. in % in € m. in %Net interest income 13,192 12,378 14,707 814 7 (2,329) (16)Total net gains (losses) on financial assets/liabilitiesat fair value through profit or loss 1,332 2,926 1,401 (1,593) (54) 1,524 109Total net interest income and net gains (losses) onfinancial assets/liabilities at fair value through profit or loss 14,524 15,304 16,108 (779) (5) (805) (5)
Breakdown by Corporate Division:1
Corporate & Investment Bank 7,905 8,651 10,774 (746) (9) (2,122) (20)Private & Commercial Bank 6,283 6,158 6,420 125 2 (262) (4)Asset Management (89) 30 365 (119) N/M (335) (92)Non-Core Operations Unit N/A N/A (1,307) 0 N/M 1,307 N/MCorporate & Other 425 464 (144) (39) (8) 608 N/MTotal net interest income and net gains (losses) onfinancial assets/liabilities at fair value through profit or loss 14,524 15,304 16,108 (779) (5) (805) (5)N/M – Not meaningful1 This breakdown reflects net interest income and net gains (losses) on financial assets/liabilities at fair value through profit or loss only. For a discussion of the corporate
divisions’ total revenues by product please refer to Note 4 “Business Segments and Related Information”.
2018Total net interest income and net gains (losses) on financial assets/liabilities at fair value through profit or loss were€ 14.5 billion in 2018, compared to € 15.3 billion in 2017, a decrease of € 779 million, or 5 %. The decrease was primarilydriven by CIB mainly reflecting the strategic repositioning, muted client activity, geo-political uncertainty across a number ofregions, and adverse developments. In addition, total net interest income and net gains (losses) on financial assets/liabilitiesat fair value through profit or loss in AM decreased versus the prior year mainly driven by a change in valuation of guaranteedfunds which has a related offset in Other Income. The decreases were partly offset by an increase in PCB primarily due togrowth in loan revenues, positive valuation effects from home savings liabilities, a positive year-on-year impact from mortgageloans previously measured at fair value and measured at amortized cost basis since the adoption of IFRS 9, partly offset bythe negative impact from a low interest rate environment on deposits and lower income from interest rate risk hedges.
2017Total net interest income and net gains (losses) on financial assets/liabilities at fair value through profit or loss were€ 15.3 billion in 2017, compared to € 16.1 billion in 2016, a decrease of € 805 million, or 5 %. The decrease was primarilydriven by CIB, mainly due to lower client volumes from a low volatility environment as well as margin pressure. The declinealso included a loss of € 348 million in debt valuation adjustments (DVA) from the tightening of credit spreads and a decreasein derivative liability exposures. In addition, Total net interest income and net gains (losses) on financial assets/liabilities at fairvalue through profit or loss decreased also in AM, mainly due to nonrecurring revenues from Abbey Life which was sold at theend of 2016 and the absence of a write-up of our exposure to HETA; and in PCB, mainly impacted by the persistent lowinterest rate environment and loan book reductions. Partly offsetting these decreases was NCOU, which ceased to exist from2017 onwards and reported negative € 1.3 billion of Total net interest income and net gains (losses) on financial assets/liabilities at fair value through profit or loss in 2016, including the aforementioned de-risking losses.

13
Deutsche Bank Operating and Financial ReviewAnnual Report 2018 Results of Operations
Provision for Credit Losses
2018Provision for credit losses was € 525 million in 2018, unchanged as compared to 2017. Provisions in CIB decreased by€ 94 million driven by de-risking activities in the shipping portfolio, offset by an increase of € 93 million in PCB, mainly drivenby Postbank reflecting the non-recurrence of prior year’s release of provisions related to a single credit exposure. The lowlevel of provisions for credit losses reflects our strong underwriting standards, the low risk nature of our portfolios and thebenign operating environment.
2017Provision for credit losses was € 525 million in 2017, a decrease of € 857 million, or 62 %, compared to 2016, as a result ofsignificantly lower charges and higher releases in all divisions. In CIB, the improvement reflected better performance of allportfolios including shipping. Despite the year-over-year reduction, shipping continued to be the main driver of provision forcredit losses in 2017, in part related to the re-evaluation of the respective impairment method during the year. In PCB, provisionfor credit losses improved, reflecting the good portfolio quality and the continued benign environment along with a significantrelease in Postbank.
Remaining Noninterest Income
in € m.2018 increase (decrease)
from 20172017 increase (decrease)
from 2016(unless stated otherwise) 2018 2017 2016 in € m. in % in € m. in %Commissions and fee income1 10,039 11,002 11,744 (963) (9) (742) (6)Net gains (losses) on financial assets at fairvalue through other comprehensive income 317 N/A N/A 317 N/M 0 N/M
Net gains (losses) on financial assets atamortized cost 2 N/A N/A 2 N/M 0 N/M
Net gains (losses) on financial assetsavailable for sale N/A 479 653 (479) N/M (174) (27)Net income (loss) from equity methodinvestments 219 137 455 82 60 (318) (70)Other income (loss) 215 (475) 1,053 689 N/M (1,528) N/MTotal remaining noninterest income 10,792 11,144 13,906 (352) (3) (2,762) (20)
1 includes:Commissions and fees from fiduciaryactivities:
Commissions for administration 303 338 401 (35) (10) (63) (16)Commissions for assets undermanagement 3,130 3,603 3,507 (473) (13) 96 3Commissions for other securitiesbusiness 290 379 380 (88) (23) (1) (0)
Total 3,724 4,320 4,287 (596) (14) 33 1Commissions, broker’s fees, mark-ups onsecurities underwriting and other securitiesactivities:
Underwriting and advisory fees 1,629 1,825 1,871 (196) (11) (46) (2)Brokerage fees 936 1,160 1,434 (224) (19) (274) (19)
Total 2,565 2,985 3,305 (420) (14) (320) (10)Fees for other customer services 3,751 3,698 4,152 53 1 (454) (11)Total commissions and fee income 10,039 11,002 11,744 (963) (9) (742) (6)
N/M – Not meaningful
Commissions and fee income2018Total Commissions and fee income was € 10.0 billion in 2018, a decrease of € 963 million, or 9 %, as compared to 2017. Thedecrease included € 473 million lower commissions for assets under management, primarily in AM due to lower fees fromactively managed funds partly offset by higher fees from passively managed funds. Underwriting and advisory fees andbrokerage fees declined by € 420 million primarily driven by lower market volumes and lower level of client activities in CIB aswell as lower revenues from investment products in PCB following the implementation of MiFID II regulations.
2017Total Commissions and fee income was € 11.0 billion in 2017, a decrease of € 742 million, or 6 %, compared to 2016.Underwriting and advisory fees and brokerage fees declined by € 320 million and fees from other customer services declinedby € 454 million driven by reduced perimeter and lower volumes in Global Transaction Banking as well as reduced volumesin Sales & Trading (Equity). Fee income in PCB declined primarily reflecting the sale of the PCS business. Fund managementfees increased by € 96 million primarily driven by favorable market conditions in AM.
14
Deutsche Bank 1 – Management ReportAnnual Report 2018
Net gains (losses) on financial assets at fair value through other comprehensive income2018Total Net gains (losses) on financial assets at fair value through other comprehensive income was € 317 million in 2018primarily related to a realized gain on sales of municipal bonds in the US, government bonds and securities from our StrategicLiquidity Reserve.
2017Total Net gains (losses) on financial assets at fair value through other comprehensive income was introduced as new incomecategory in 2018, following the adoption of IFRS 9.
Net gains (losses) on financial assets at amortized cost2018Net gains (losses) on financial assets at amortized cost were € 2 million in 2018, primarily reflecting the impact of an earlyredemption of certain bonds.
2017Net gains (losses) on financial assets at amortized cost was introduced as new income category in 2018, following the adoptionof IFRS 9.
Net gains (losses) on financial assets available for sale2018Net gains (losses) on financial assets available for sale ceased to exist in 2018, following the adoption of IFRS 9.
2017Net gains on financial assets available for sale were € 479 million in 2017 compared to € 653 million in 2016, a decrease of€ 174 million or 27 %. The decrease was primarily due to the nonrecurrence of gains related to de-risking activities in NCOUand a gain on sale of stake in Visa Europe Limited, both in 2016. This was partly offset by a gain on sale of shares in ConcardisGmbH in 2017.
Net income (loss) from equity method investments2018Net gains from equity method investments were € 219 million in 2018 compared to € 137 million in 2017, an increase of€ 82 million, or 60 %, primarily due to change in valuation of an investment.
2017Net gains from equity investments were € 137 million in 2017 compared to € 455 million in 2016, a decrease of € 318 million,or 70 %, primarily due to the non-recurrence of a gain from the IPO of Red Rock Resorts in NCOU.
Other income (loss)2018Other income (loss) was € 215 million in 2018 compared to a loss of € 475 million in 2017. The increase was primarily drivenby de-designation in fair value hedge accounting, gains from property sales in PCB, interest rate hedges and the terminationof certain swaps. Additionally other income includes a positive impact from the valuation of guaranteed funds in AM, whichhas a related offset in net gains (losses) on financial assets/liabilities at fair value through profit or loss. Other income alsobenefitted from the absence of negative prior year effects related to the termination of a legacy trust preferred security andthe realization of a currency translation adjustment associated with the sale of our non-strategic subsidiary in Argentina aswell as a lower negative impacts from the sales transactions in Poland and Portugal compared to the prior year. These effectswere partly offset by a lower income from workout activities related to legacy positions in Sal. Oppenheim in 2018.
2017Other income (loss) was negative € 475 million in 2017 compared to positive € 1.1 billion in 2016. The decline was primarilydriven by the absence of a positive realization in Other comprehensive income from the sale of stake in Hua Xia Bank Co.Limited. The decline also included a negative impact from the agreement to sell a significant portion of the retail business inPoland, a one-off loss due to termination of a legacy trust preferred security as well as the realization of a negative currencytranslation adjustment associated with the sale of our non-strategic subsidiary in Argentina.

15
Deutsche Bank Operating and Financial ReviewAnnual Report 2018 Results of Operations
Noninterest Expenses
in € m.2018 increase (decrease)
from 20172017 increase (decrease)
from 2016(unless stated otherwise) 2018 2017 2016 in € m. in % in € m. in %Compensation and benefits 11,814 12,253 11,874 (439) (4) 380 3General and administrative expenses¹ 11,286 11,973 15,454 (687) (6) (3,481) (23)Policyholder benefits and claims 0 0 374 (0) N/M (374) (100)Impairment of goodwill and other intangibleassets 0 21 1,256 (21) N/M (1,235) (98)Restructuring activities 360 447 484 (86) (19) (37) (8)Total noninterest expenses 23,461 24,695 29,442 (1,234) (5) (4,747) (16)N/M – Not meaningful
1 includes:IT costs 3,822 3,816 3,872 6 0 (56) (1)Regulatory, tax & insurance2,3 1,545 1,489 1,421 57 4 67 5Occupancy, furniture and equipmentexpenses 1,723 1,849 1,972 (126) (7) (123) (6)Professional service fees 1,530 1,750 2,305 (220) (13) (555) (24)Communication and data services 636 686 761 (50) (7) (75) (10)Travel and representation expenses 347 405 450 (58) (14) (45) (10)Banking and transaction charges 753 744 664 9 1 80 12Marketing expenses 278 309 285 (30) (10) 24 8Consolidated investments 0 0 334 0 N/M (334) N/MOther expenses4 652 925 3,390 (274) (30) (2,465) (73)
Total general and administrative expenses 11,286 11,973 15,454 (687) (6) (3,481) (23)2 Regulatory, tax & insurance which comprises bank levy and insurance and deposit protection has been presented separately in order to provide further transparency. In the
Annual Report for the year ended December 31, 2017, these expenses were included within Other expenses.3 Includes bank levy of € 690 million in 2018, € 596 million in 2017 and € 547 million in 2016.4 Includes litigation related expenses of € 88 million in 2018, € 213 million in 2017 and € 2.4 billion in 2016.
Compensation and benefits2018Compensation and benefits decreased by € 439 million, or 4 %, to € 11.8 billion in 2018 compared to € 12.3 billion in 2017.The decrease was primarily driven by lower salary expenses reflecting headcount reductions and lower variablecompensation.
2017Compensation and benefits increased by € 380 million, or 3 %, to € 12.3 billion in 2017 compared to € 11.9 billion in 2016.The increase was primarily driven by higher variable compensation, reflecting the return to normal compensation programs in2017. This increase was partly offset by a decrease in salaries, due to lower headcount and favorable foreign exchangemovements, and by lower amortization of prior years’ deferrals as well as by lower severance expense.
General and administrative expenses2018General and administrative expenses decreased by € 687 million, or 6 %, to € 11.3 billion in 2018 compared to € 12.0 billionin 2017. The decrease was across most expense categories primarily reflecting management actions to optimize spending.
2017General and administrative expenses decreased by € 3.5 billion, or 23 %, to € 12.0 billion in 2017 compared to € 15.5 billionin 2016. The decrease was mainly due to a € 2.2 billion reduction in litigation charges compared to 2016. Professional servicefees declined by € 555 million driven by lower legal fees and lower business consulting cost.
Impairment of goodwill and other intangible assets2018No impairment charges were reported for 2018.
2017Impairment charges on goodwill and other intangible assets decreased to € 21 million in 2017 from € 1.3 billion in 2016. The2016 charge reflected an impairment of € 1.0 billion in AM, triggered by the sale of Abbey Life and an impairment of € 285 mil-lion in CIB following the transfer of certain businesses from AM.

16
Deutsche Bank 1 – Management ReportAnnual Report 2018
Restructuring2018Restructuring expenses amounted to € 360 million in 2018 compared to € 447 million in 2017. The decrease was mainly drivenby lower charges in PCB partially offset by higher expenses in CIB reflecting the higher spend from strategic repositioning.
2017Restructuring expenses amounted to € 447 million in 2017 compared to € 484 million in 2016. Restructuring charges for 2017were primarily related to the planned merger of Deutsche Bank Privat- und Geschäftskunden AG and Postbank.
Income Tax Expense2018Income tax expense in 2018 was € 989 million compared to € 2.0 billion in 2017. The effective tax rate of 74 % (2017: 160 %)was mainly impacted by changes in the recognition and measurement of deferred tax assets and share based payment relatedtax effects.
2017Income tax expense in 2017 was € 2.0 billion compared to € 546 million in 2016. The effective tax rate of 160 % (2016:negative 67 %) was mainly impacted by a one-time charge of € 1.4 billion resulting from the U.S. tax reform and other changesin the recognition and measurement of deferred tax assets.
Net income (loss)2018The net income of € 341 million in 2018, compared to a net loss of € 735 million in 2017, was primarily driven by the non-recurrence of the aforementioned one-time tax charge and lower noninterest expenses.
2017The 2017 result was a net loss of € 735 million, driven by the aforementioned one-time tax charge attributable to the re-measurement of US deferred tax assets as a result of the U.S. tax reform, compared to a net loss of € 1.4 billion in 2016.

17
Deutsche Bank Operating and Financial ReviewAnnual Report 2018 Results of Operations
Segment Results of Operations
The following is a discussion of the results of our business segments. See Note 4 “Business Segments and RelatedInformation” to the consolidated financial statements for information regarding:
– changes in the format of our segment disclosure and– the framework of our management reporting systems.
The criterion for segmentation into divisions is our organizational structure as it existed at December 31, 2018. Prior periodcomparables were restated due to changes in the divisional structure. Segment results were prepared in accordance with ourmanagement reporting systems.
2018
in € m.(unless stated otherwise)
Corporate &Investment
Bank
Private &Commercial
BankAsset
Management
Non-CoreOperations
UnitCorporate &
OtherTotal
ConsolidatedNet revenues1 13,046 10,158 2,186 – (73) 25,316Provision for credit losses 120 406 (1) – 0 525Noninterest expensesCompensation and benefits 3,970 4,001 787 – 3,055 11,814General and administrative expenses 8,115 4,867 929 – (2,624) 11,286Policyholder benefits and claims 0 0 0 – 0 0Impairment of goodwill and other intangible assets 0 0 0 – 0 0Restructuring activities 287 55 19 – 0 360Total noninterest expenses 12,372 8,923 1,735 – 431 23,461Noncontrolling interests 24 (0) 85 – (109) 0Income (loss) before income taxes 530 829 367 – (396) 1,330Cost/income ratio 95 % 88 % 79 % – N/M 93 %Assets2 988,531 343,704 10,030 – 5,872 1,348,137Additions to non-current assets 514 516 43 – 575 1,647Risk-weighted assets3 236,306 87,709 10,365 – 16,053 350,432CRD 4 leverage exposure measure (spot value atreporting date) 892,653 354,584 5,044 – 20,644 1,272,926Average shareholders' equity 43,427 14,514 4,669 – 0 62,610Post-tax return on average tangible shareholders’ equity4 1 %` 5 % 18 % – N/M 1 %Post-tax return on average shareholders’ equity4 1 % 4 % 6 % – N/M 0 %
1 includes:Net interest income 3,574 6,077 (52) – 3,592 13,192
Net income (loss) from equity method investments 170 2 41 – 6 2192 includes:
Equity method investments 556 78 240 – 5 879N/M – Not meaningful3 Risk-weighted assets and capital ratios are based upon CRR/CRD 4 fully loaded.4 The post-tax return on average tangible shareholders’ equity and average shareholders’ equity at the Group level reflects the reported effective tax rate for the Group, which
was 74 % for the year ended December 31, 2018. For the post-tax return on average tangible shareholders’ equity and average shareholders’ equity of the segments, theGroup effective tax rate was adjusted to exclude the impact of permanent differences not attributed to the segments, so that the segment tax rates were 28 % for the yearended December 31, 2018.

18
Deutsche Bank 1 – Management ReportAnnual Report 2018
2017
in € m.(unless stated otherwise)
Corporate &Investment
Bank
Private &Commercial
BankAsset
Management
Non-CoreOperations
UnitCorporate &
OtherTotal
ConsolidatedNet revenues1 14,227 10,178 2,532 – (489) 26,447Provision for credit losses 213 313 (1) – (0) 525Noninterest expensesCompensation and benefits 4,364 4,027 812 – 3,050 12,253General and administrative expenses 8,441 5,012 978 – (2,458) 11,973Policyholder benefits and claims 0 0 0 – 0 0Impairment of goodwill and other intangible assets 6 12 3 – 0 21Restructuring activities 81 360 6 – 0 447Total noninterest expenses 12,892 9,411 1,799 – 593 24,695Noncontrolling interests 26 (12) 1 – (16) 0Income (loss) before income taxes 1,096 465 732 – (1,066) 1,228Cost/income ratio 91 % 93 % 71 % – N/M 93 %Assets2 1,127,028 333,069 8,050 – 6,586 1,474,732Additions to non-current assets 125 551 60 – 1,067 1,803Risk-weighted assets3 231,574 87,472 8,432 – 16,734 344,212CRD 4 leverage exposure measure (spot value atreporting date) 1,029,946 344,087 2,870 – 17,983 1,394,886Average shareholders' equity 44,197 14,943 4,687 – 99 63,926Post-tax return on average tangible shareholders’ equity4 2 % 2 % 56 % – N/M (1) %Post-tax return on average shareholders’ equity4 2 % 2 % 10 % – N/M (1) %
1 includes:Net interest income 4,104 5,875 (19) – 2,418 12,378
Net income (loss) from equity method investments 81 3 44 – 9 1372 includes:
Equity method investments 553 91 211 – 10 866N/M – Not meaningful3 Risk-weighted assets and capital ratios are based upon CRR/CRD 4 fully loaded.4 The post-tax return on average tangible shareholders’ equity and average shareholders’ equity at the Group level reflects the reported effective tax rate for the Group, which
was 160 % for the year ended December 31, 2017. For the post-tax return on average tangible shareholders’ equity and average shareholders’ equity of the segments, theGroup effective tax rate was adjusted to exclude the impact of permanent differences not attributed to the segments, so that the segment tax rates were 33 % for the yearended December 31, 2017.
2016
in € m.(unless stated otherwise)
Corporate &Investment
Bank
Private &Commercial
BankAsset
Management
Non-CoreOperations
UnitCorporate &
OtherTotal
ConsolidatedNet revenues1 16,764 11,090 3,015 (382) (473) 30,014Provision for credit losses 816 439 1 128 (0) 1,383Noninterest expensesCompensation and benefits 4,062 4,075 737 68 2,931 11,874General and administrative expenses 9,280 4,888 1,026 2,659 (2,398) 15,454Policyholder benefits and claims 0 0 374 0 0 374Impairment of goodwill and other intangible assets 285 0 1,021 (49) (0) 1,256Restructuring activities 299 142 47 4 (7) 484Total noninterest expenses 13,926 9,104 3,205 2,682 525 29,442Noncontrolling interests 49 0 0 (4) (46) 0Income (loss) before income taxes 1,973 1,547 (190) (3,187) (952) (810)Cost/income ratio 83 % 82 % 106 % N/M N/M 98 %Assets2 1,201,894 329,869 12,300 5,523 40,959 1,590,546Additions to non-current assets 22 480 1 0 1,517 2,019Risk-weighted assets3 237,596 86,082 8,960 9,174 15,706 357,518CRD 4 leverage exposure measure (spot value atreporting date) 954,203 342,424 3,126 7,882 40,018 1,347,653Average shareholders' equity 40,312 14,371 4,460 690 2,249 62,082Post-tax return on average tangible shareholders’ equity4 3 % 8 % 71 % N/M N/M (3) %Post-tax return on average shareholders’ equity4 3 % 7 % (3) % N/M N/M (2) %
1 includes:Net interest income 6,314 6,201 326 142 1,724 14,707
Net income (loss) from equity method investments 138 5 44 269 (1) 4552 includes:
Equity method investments 698 23 203 98 4 1,027N/M – Not meaningful3 Risk-weighted assets and capital ratios are based upon CRR/CRD 4 fully loaded.4 The post-tax return on average tangible shareholders’ equity and average shareholders’ equity at the Group level reflects the reported effective tax rate for the Group, which
was (67) % for the year ended December 31, 2016. For the post-tax return on average tangible shareholders’ equity and average shareholders’ equity of the segments, theGroup effective tax rate was adjusted to exclude the impact of permanent differences not attributed to the segments, so that the segment tax rates were 35 % for the yearended December 31, 2016.

19
Deutsche Bank Operating and Financial ReviewAnnual Report 2018 Results of Operations
Corporate & Investment Bank
2018 increase (decrease)from 2017
2017 increase (decrease)from 2016
in € m.(unless stated otherwise) 2018 2017 2016 in € m. in % in € m. in %Net revenuesGlobal Transaction Banking 3,834 3,917 4,419 (83) (2) (502) (11)
Equity Origination 362 396 405 (34) (9) (9) (2)Debt Origination 1,081 1,327 1,393 (247) (19) (66) (5)Advisory 493 508 495 (16) (3) 13 3
Origination and Advisory 1,935 2,232 2,292 (296) (13) (60) (3)Sales & Trading (Equity) 1,957 2,233 2,751 (276) (12) (518) (19)Sales & Trading (FIC) 5,361 6,447 7,066 (1,087) (17) (619) (9)
Sales & Trading 7,317 8,680 9,817 (1,363) (16) (1,137) (12)Other (40) (601) 235 561 (93) (836) N/MTotal net revenues 13,046 14,227 16,764 (1,181) (8) (2,537) (15)Provision for credit losses 120 213 816 (94) (44) (603) (74)Noninterest expensesCompensation and benefits 3,970 4,364 4,062 (393) (9) 302 7General and administrative expenses 8,115 8,441 9,280 (326) (4) (839) (9)Impairment of goodwill and other intangible assets 0 6 285 (6) N/M (279) (98)Restructuring activities 287 81 299 205 N/M (218) (73)Total noninterest expenses 12,372 12,892 13,926 (520) (4) (1,034) (7)Noncontrolling interests 24 26 49 (2) (7) (23) (46)Income (loss) before income taxes 530 1,096 1,973 (566) (52) (877) (44)Cost/income ratio 95 % 91 % 83 % N/M 4 ppt N/M 8 pptAssets¹ 988,531 1,127,028 1,201,894 (138,497) (12) (74,866) (6)Risk-weighted assets² 236,306 231,574 237,596 4,733 2 (6,022) (3)Average shareholders' equity³ 43,427 44,197 40,312 (770) (2) 3,885 10Post-tax return on average tangible shareholders’ equity 1 % 2 % 3 % N/M (1) ppt N/M (2) pptPost-tax return on average shareholders' equity 1 % 2 % 3 % N/M (1) ppt N/M (2) pptN/M – Not meaningful1 Segment assets represent consolidated view, i.e., the amounts do not include intersegment balances.2 Risk-weighted assets and capital ratios are based upon CRR/CRD 4 fully loaded.3 See Note 4 “Business Segments and Related Information” to the consolidated financial statements for a description of how average shareholders' equity is allocated to the
divisions.
2018In 2018, CIB announced, initiated and completed headcount and resource reductions as part of the division’s strategicreshaping. This reshaping had a negative near term impact on revenues, but allowed the division to reduce leverage exposureand refocus on areas of strength. CIB income before income taxes for the full year 2018 was € 530 million or 52 % lower thanthe prior year. The decrease year over year was mainly driven by lower revenues, and higher restructuring costs, partly offsetby lower compensation and benefits, general and administrative expenses and provisions for credit losses.
CIB net revenues for the full year 2018 were € 13 billion, a decrease of € 1.2 billion or 8 % compared to the full year 2017.
Global Transaction Banking net revenues were € 3.8 billion, a decrease of € 83 million or 2 % compared to 2017. CashManagement revenues were slightly lower, as a result of client perimeter reductions in 2017 and continued negative interestrates in Europe. However the business saw sequential revenue growth quarter-on-quarter through 2018. Trade revenues wereslightly lower, specifically in structured products due to ongoing margin compression, while the underlying flow businessshowed positive development. Trust, Agency and Securities Services revenues were higher driven by a gain on sale on anasset disposal in the second quarter of 2018 and benefitted from higher interest rates in the U.S.
Origination and Advisory net revenues were € 1.9 billion, a € 296 million or 13 % decrease compared to the prior year. DebtOrigination revenues were € 247 million or 19 % lower in a significantly reduced fee pool environment, despite significantmarket share gains in leveraged loans. Equity Origination revenues were € 34 million or 9 % lower. Advisory revenues wereessentially flat compared to 2017.
Sales & Trading (FIC) net revenues were € 5.4 billion, a decrease of € 1.1 billion or 17 %. Rates revenues were significantlylower compared to the prior year, in particular in Europe with lower levels of client activity and the impact of the strategicreshaping in the U.S. Credit revenues were lower compared to a strong prior year. Foreign Exchange revenues wereessentially flat. Revenues in Emerging Markets were lower due to underperformance in Latin America, specifically in the flowbusiness, partly offset by an improvement in Eastern Europe, Middle East and Africa. Foreign Exchange and Rates revenuesin Asia Pacific were lower due to performance in Japan and Australia, partly offset by strong revenues in Asia.
20
Deutsche Bank 1 – Management ReportAnnual Report 2018
Sales & Trading (Equity) net revenues were € 2.0 billion, a decrease of € 276 million, or 12 %. Revenues in Prime Financewere slightly lower. Equity Derivatives revenues were slightly lower due to reduced client flow across both Europe and AsiaPacific, partly offset by a solid performance in the U.S., which benefited from increased volatility in the first quarter of 2018.Cash Equity revenues were lower due to facilitation losses in the Americas and the non-recurrence of gains on asset sales inthe previous year.
Other net revenues were negative € 40 million, compared to negative € 601 million in 2017. The year over year improvementwas driven by a gain of € 126 million (2017: a loss of € 348 million) relating to the impact of DVA on certain derivative liabilities.The non-recurrence of negative revenue events relating to assets identified as not consistent with CIB’s strategy also impactedthe year-on-year comparison. Investment grade lending revenues were essentially flat compared to 2017.
Provision for credit losses were € 120 million compared to € 213 million in the prior year. In the first half of 2018 de-risking onour shipping portfolio made further progress, while the benign macro-economic environment throughout the majority of theyear supported the low level of net provisions. The fourth quarter of 2018 did see an increase mainly due to higher Stage 1 &2 provisions. This was due to a weakening macro-economic outlook, which has an impact due to the forward lookinginformation element of IFRS 9, in addition to a one-off adjustment to the calculation methodology on certain loans on whichwe hold insurance protection.
Non-interest expenses in 2018 were € 12.4 billion, a decrease of € 520 million or 4 % compared to the prior year. The decreasewas driven by lower compensation and benefits costs across both fixed and variable compensation reflecting the strategicheadcount actions. Non compensation costs were also lower across a number of line items due to continued cost discipline.The cost reductions were partially offset by increased restructuring costs.
2017CIB Income before income taxes in 2017 of € 1.1 billion was € 877 million or 44 % lower than in the previous year. The period-over-period reduction in revenues was only partially offset by reduced noninterest expenses and lower credit loss provisions.
CIB net revenues for the full year 2017 were € 14.2 billion, a decrease of € 2.5 billion, or 15 % year-on-year.
Global Transaction Banking net revenues were € 3.9 billion, a decrease of € 502 million, or 11 %. Cash Management revenueswere slightly lower, as interest rate increases in the U.S. partly offset the negative impact of client and product perimeterreductions initiated in 2016. Trade revenues were lower, driven by active balance sheet management efforts and continuedmargin pressure. Trust, Agency and Securities Services revenues were essentially flat, as lower transaction volumes due toclient and country exits were offset by interest rate increases in the U.S. In addition, GTB revenues were negatively impactedby a change in funding charges allocation methodology in 2017.
Origination and Advisory revenues were € 2.2 billion, a € 60 million, or 3 % decrease compared to the prior year. EquityOrigination revenues decreased by € 9 million or 2 %. Debt Origination revenues were € 66 million or 5 % lower, with a strongfirst quarter of 2017 supported by high inflows into the Leveraged Loan market, offset by slightly lower revenues during theremainder of 2017 amid lower client activity and Deutsche Bank’s reduced risk appetite in the U.S. Advisory revenues were€ 13 million or 3 % higher driven by a robust market and strong deal participation.
Sales & Trading (FIC) net revenues were € 6.4 billion, a decrease of € 619 million, or 9 %. Credit revenues were essentiallyflat supported by strong performance in distressed products in the first half of 2017, offset by less favorable trading conditionsfor flow businesses in the second half of 2017. Rates revenues were higher with solid performance in Europe, partly offset bya weaker performance in the U.S. Foreign Exchange revenues were significantly lower as a persistently low volatilityenvironment impacted client flows. Asia Pacific Foreign Exchange and Rates revenues decreased with a strong first quarterof 2017 offset by lower client activity during the remainder of the year. Emerging Markets revenues were significantly lowerdue to subdued client flow and specific developments in Venezuela, South Africa and Turkey towards the end of the year.
Sales & Trading (Equity) net revenues were € 2.2 billion, a decrease of € 518 million, or 19 %. Revenues in Prime Financewere lower reflecting lower average balances during the year, reduced margins and higher funding cost. Equity Derivativesrevenues were lower with a challenging trading environment particularly in the second half of 2017. Cash Equities revenueswere essentially flat with volumes remaining challenged.

21
Deutsche Bank Operating and Financial ReviewAnnual Report 2018 Results of Operations
Other revenues were negative € 601 million, compared to a gain of € 235 million in 2016. 2017 included a loss of € 348 million(2016: a gain of € 27 million) relating to the impact of DVA on certain derivative liabilities. € 136 million of this loss was drivenby a change in the creditor hierarchy in the event of a bank insolvency which was introduced by the German ResolutionMechanism Act (Abwicklungsmechanismusgesetz), effective January 1, 2017. This hierarchy change results in derivativecounterparties receiving greater protection as they would be satisfied prior to senior unsecured debt holders in the creditorwaterfall structure. This greater protection increases the value of the derivative assets for the counterparty, thereby increasingthe value of derivative liabilities on our balance sheet, resulting in the loss. Revenues associated with assets identified as notconsistent with CIB’s strategy are reported under ‘Other’ as of the second quarter of 2017, including a negative impact relatedto the valuation of the legacy RMBS portfolio.
Provision for credit losses of € 213 million were down 74 % year-on-year. The decrease resulted primarily from reductionsacross all portfolios, including shipping. Despite the year-over-year reduction, shipping continued to be the main driver ofprovision for credit losses in 2017.
Noninterest expenses of € 12.9 billion, were € 1.0 billion, or 7 % lower than in 2016. Reduced litigation provisions, materiallylower goodwill impairment and lower restructuring all positively impacted the comparison versus the prior year. Compensationcosts increased due to the normalization of variable compensation payments in 2017, partially offset by lower non-compensation expenses. The year-on-year development of noninterest expenses also benefitted from foreign exchange ratemovements.
Private & Commercial Bank
2018 increase (decrease)from 2017
2017 increase (decrease)from 2016
in € m.(unless stated otherwise) 2018 2017 2016 in € m. in % in € m. in %Net revenues:Private and Commercial Business (Germany) 6,802 6,583 6,873 220 3 (290) (4)Private and Commercial Business (International)1 1,439 1,455 1,466 (16) (1) (11) (1)Wealth Management (Global) 1,746 2,021 1,720 (274) (14) 301 18Exited businesses2 170 119 1,031 51 42 (912) (88)Total net revenues 10,158 10,178 11,090 (20) (0) (912) (8)
Of which:Net interest income 6,077 5,875 6,201 202 3 (326) (5)Commissions and fee income 3,143 3,367 3,395 (224) (7) (28) (1)Remaining income 937 935 1,494 2 0 (558) (37)
Provision for credit losses 406 313 439 93 30 (126) (29)Noninterest expenses:Compensation and benefits 4,001 4,027 4,075 (26) (1) (47) (1)General and administrative expenses 4,867 5,012 4,888 (145) (3) 124 3Impairment of goodwill and other intangible assets 0 12 0 (12) N/M 12 N/MRestructuring activities 55 360 142 (305) (85) 218 154Total noninterest expenses 8,923 9,411 9,104 (488) (5) 307 3Noncontrolling interests (0) (12) 0 12 (100) (12) N/MIncome (loss) before income taxes 829 465 1,547 363 78 (1,081) (70)Cost/income ratio 88 % 92 % 82 % N/M (5) ppt N/M 10 pptAssets3 343,704 333,069 329,869 10,635 3 3,200 1Risk-weighted assets4 87,709 87,472 86,082 237 0 1,390 2Average shareholders' equity5 14,514 14,943 14,371 (429) (3) 572 4Post-tax return on average tangible shareholders’ equity 5 % 2 % 8 % N/M 2 ppt N/M (6) pptPost-tax return on average shareholders' equity 4 % 2 % 7 % N/M 2 ppt N/M (5) pptN/M – Not meaningful1 Covers operations in Belgium, India, Italy and Spain.2 Covers operations in Poland and Portugal as well as Private Client Services (PCS) and Hua Xia in historical periods.3 Segment assets represent consolidated view, i.e., the amounts do not include intersegment balances.4 Risk-weighted assets and capital ratios are based upon CRR/CRD 4 fully loaded.5 See Note 4 “Business Segments and Related Information” to the consolidated financial statements for a description of how average shareholders’ equity is allocated to the
divisions.
Additional information2018 increase (decrease)
from 20172017 increase (decrease)
from 2016in € bn.(unless stated otherwise) 2018 2017 2016 in € bn. in % in € bn. in %Assets under management¹ 474 506 501 (32) (6) 5 1Net flows (2) 4 (42) (6) N/M 47 N/MN/M – Not meaningful1 We define assets under management as (a) assets we hold on behalf of customers for investment purposes and/or (b) client assets that are managed by us. We manage
assets under management on a discretionary or advisory basis, or these assets are deposited with us. Deposits are considered assets under management if they serveinvestment purposes. In our Private and Commercial Business (Germany) and Private and Commercial Business (International), this includes all time deposits and savingsdeposits. In Wealth Management, we assume that all customer deposits are held with us primarily for investment purposes.
22
Deutsche Bank 1 – Management ReportAnnual Report 2018
2018In 2018, PCB successfully completed the legal merger of Deutsche Bank Privat- und Geschäftskunden AG and Postbank, thepartial sale of the retail business in Poland, the integration of Sal. Oppenheim and further optimized its branch network. PCBgenerated income before income taxes of € 829 million in 2018, an increase of € 363 million, or 78 %, compared to the prioryear, which was achieved while sustaining continued investment in our strategic initiatives and despite the ongoing headwindfrom low interest rate environment. The increase was primarily driven by a decline in noninterest expenses, partly offset byhigher provision for credit losses, reflecting a provision release in the prior year as well as loan growth in 2018.
PCB net revenues of € 10.2 billion remained essentially flat compared to the prior year period.
In the Private and Commercial Business (Germany) net revenues increased by € 220 million, or 3 %, compared to the prioryear period. Net interest income increased slightly compared to 2017, driven by growth in loan revenues, positive valuationeffects from home savings liabilities and a positive year-on-year impact from mortgage loans previously measured at fair valueand measured at amortized cost basis since the adoption of the reporting standard IFRS 9. These effects more than offset theimpact of the low interest rate environment on deposit margins. Deposit revenues also included a positive impact from thegrowth in volumes. Remaining income increased significantly mainly reflecting higher asset sales including a € 156 milliongain from a property sale, partly offset by lower income from interest-rate-risk hedges. The prior year period included anegative impact of € 118 million from the termination of a legacy Trust Preferred Security, which largely offset the positiveimpact of € 108 million from the sale of shares in Concardis GmbH. Commission and fee income slightly decreased year-on-year. Lower revenues from postal services subsequent to a contract alignment as well as lower revenues from investmentproducts, in part impacted by MiFID II implementation were partly offset by higher fee income from current accounts reflectingrepricing actions.
In the Private and Commercial Business (International), net revenues decreased by € 16 million, or 1 %, compared to the prioryear period. The decrease was mainly driven by positive effects related to an asset sale transaction in 2017, reported inRemaining income. Net interest income remained essentially flat compared to the prior year period, with negative impactsfrom the ongoing low interest rate environment on deposit revenues offset by higher loan revenues. Commission and feeincome was essentially flat compared to the previous year as growth in commercial product revenues offset the decline ininvestment product revenues due to the challenging market environment.
Net revenues in Wealth Management (Global) declined by € 274 million, or 14 %, driven by a € 197 million lower impact fromworkout activities related to legacy positions in the Sal. Oppenheim franchise. Net revenues were also impacted by unfavorableforeign exchange rate movements. Excluding these effects, net revenues were essentially flat compared to the prior yearperiod. Revenue growth in Asia-Pacific was offset by lower client revenues in EMEA and Germany partly impacted by MiFID IIimplementation and strategic business decisions as well as volatile capital markets and lower client activity.
In the exited businesses, net revenues increased by € 51 million, or 42 %, compared to the prior year period. The increasewas driven by a lower negative impact from sales transactions in Poland and Portugal (2017 was impacted by € 157 millionrelated to the agreement of the partial sale of the retail business in Poland compared to a € 57 million negative effect from thetransactions in Portugal and Poland in 2018). This was partly offset by a lower client revenue contribution in Poland due to itssale in November 2018 and the non-recurrence of a positive impact of € 20 million related to the disposal of the PCS unit.
Provision for credit losses of € 406 million increased by € 93 million, or 30 %, compared to the prior year period. This increasereflected higher releases in the previous year period mainly related to a single provision in Postbank as well as loan growth.Both periods included positive impacts from portfolio sales.
Noninterest expenses of € 8.9 billion decreased by € 488 million, or 5 %, compared to 2017. The decline included € 305 millionlower restructuring charges related to strategy execution including the reorganization and integration measures in Germanyas well as lower litigation costs. In addition, the decline in noninterest expenses is attributable to savings reflecting strict costdiscipline as well as executed reorganization measures. These positive impacts were partly offset by incremental investmentspending of approximately € 220 million related to the merger of Deutsche Bank Privat- und Geschäftskunden AG andPostbank, investments in our businesses in Italy and Spain as well as costs related to the agreements to sell businesses inPortugal and Poland.
PCB’s Assets under Management of € 474 billion decreased by € 32 billion compared to December 31, 2017. The declinewas mainly attributable to € 30 billion market depreciation, a deconsolidation effect of € 4 billion subsequent to the disposal ofthe business in Poland and € 2 billion net outflows partly compensated by € 4 billion foreign exchange rate movements. Netinflows in the Private and Commercial Business (Germany) primarily in deposits were offset by net outflows in WealthManagement. In Wealth Management, net inflows in Germany and Asia Pacific region were more than offset by net outflowsin EMEA and Americas.

23
Deutsche Bank Operating and Financial ReviewAnnual Report 2018 Results of Operations
2017PCB’s results in 2017 were significantly impacted by strategy-related items, which included restructuring provisions related tothe merger of Deutsche Bank Privat- und Geschäftskunden AG and Postbank as well as a negative revenue impactsubsequent to the agreement related to the partial sale of the retail business in Poland. In contrast, results in 2016 benefitedfrom a gain related to the sale of the stake in Hua Xia Bank Co. Ltd. These specific factors as well as the challenging interestenvironment explain most of the year-on-year decline of € 1.1 billion in PCB’s income before income taxes of € 465 million.
Total net revenues of € 10.2 billion decreased by € 912 million, or 8 %, compared to 2016.
In the Private and Commercial Business (Germany) net revenues declined by € 290 million, or 4 %, compared to the prioryear. Remaining income was significantly lower as in 2016, which benefited from gains on certain asset sales including€ 129 million related to the sale of shares in VISA Europe Limited. In 2017 Remaining income included a negative impact of€ 118 million from the termination of a legacy trust preferred security, which was largely compensated by a gain of € 108 millionfrom the sale of shares in Concardis GmbH. Net interest income declined slightly year-on-year as the ongoing impact of thelow interest rate environment on deposit revenues was partly mitigated by higher loan revenues reflecting growth in lendingvolumes. Commission and fee income increased slightly reflecting higher fee income from current accounts subsequent to theintroduction of a new pricing model for current accounts (in Postbank) and higher revenues from investment products.
Revenues in the Private and Commercial Business (International) declined year-on-year by € 11 million, or 1 %. Remainingincome decreased compared to 2016, which also included € 73 million gains related to the sale of shares in VISA EuropeLimited, while revenues in 2017 included a smaller positive impact from an asset sale transaction. Net interest income wasessentially flat as the impact of the low interest rate environment on deposit revenues was partly offset by higher loanrevenues. Commission and fee income increased slightly principally reflecting higher fees from cards and current accounts aswell as improved revenues from investment products.
Revenues in the Wealth Management (Global) businesses increased by € 301 million, or 18 %, mainly driven by positiveimpacts of approximately € 400 million from workout activities in the Sal. Oppenheim franchise. Workout gains were primarilydriven by favorable legal outcomes which positively impacted the valuation of loans, whose carrying values were reduced aspart of the acquisition. Excluding these effects, net revenues decreased compared to 2016 reflecting foreign exchange ratemovements as well as a decline in net interest revenues driven by loan book reductions mainly in the Americas. Commissionand fee income was slightly below 2016, reflecting lower client activities and a lower asset base in the Americas and EMEApartly compensated by good growth in Asia Pacific.
In the exited businesses, net revenues declined by € 912 million, or 88 % year-on-year. 2016 included a € 618 million revenuecontribution from Hua Xia Bank Co. Ltd. as well as a € 140 million higher revenue contribution from the Private Client Services(PCS) unit in the U.S. prior to its sale. Net revenues in 2017 were also negatively impacted by € 157 million related to theagreement of the partial sale of the retail business in Poland.
Provision for credit losses of € 313 million decreased by € 126 million, or 29 %, year-on-year benefiting from a provisionrelease in Postbank as well as a good portfolio quality in a continued benign economic environment. Both periods includedpositive impacts from selective portfolio sales.
Noninterest expenses of € 9.4 billion increased by € 307 million, or 3 %, compared to 2016. Noninterest expenses in 2017included net restructuring charges of € 360 million (€ 142 million in 2016) related to strategic items including the reorganizationand integration measures in Germany. Noninterest expenses also increased due to higher variable compensation and higherinvestment spending. These effects were partially offset by savings from executed reorganization measures and a reducedcost base after the disposal of the PCS unit.
PCB’s Assets under Management of € 506 billion increased by € 5 billion compared to December 31, 2016. Negative impactsfrom foreign exchange rate movements were more than offset by market appreciation and by net inflows of € 4 billion primarilyin the Private and Commercial Business (Germany). Net inflows were mainly in deposit products, in part reflecting thesuccessful win-back of mandates. In Wealth Management net inflows were partly impacted by strategic business decisionsand continued de-risking.
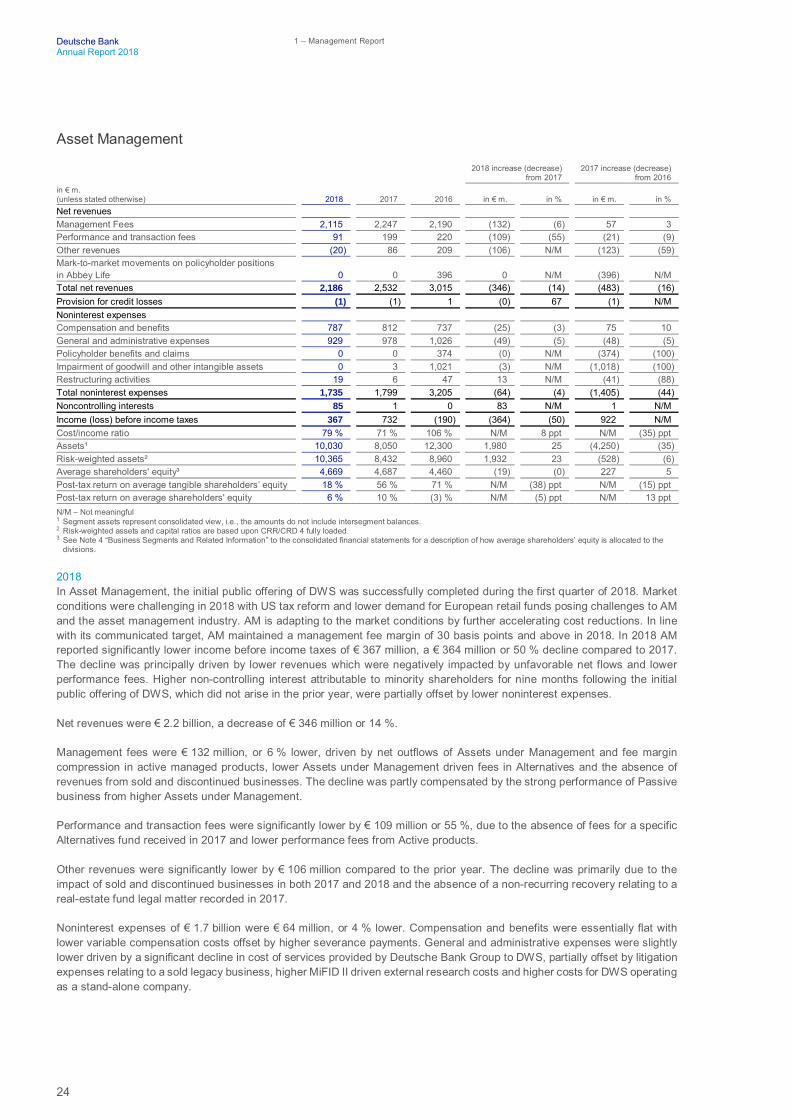
24
Deutsche Bank 1 – Management ReportAnnual Report 2018
Asset Management
2018 increase (decrease)from 2017
2017 increase (decrease)from 2016
in € m.(unless stated otherwise) 2018 2017 2016 in € m. in % in € m. in %Net revenuesManagement Fees 2,115 2,247 2,190 (132) (6) 57 3Performance and transaction fees 91 199 220 (109) (55) (21) (9)Other revenues (20) 86 209 (106) N/M (123) (59)Mark-to-market movements on policyholder positionsin Abbey Life 0 0 396 0 N/M (396) N/MTotal net revenues 2,186 2,532 3,015 (346) (14) (483) (16)Provision for credit losses (1) (1) 1 (0) 67 (1) N/MNoninterest expensesCompensation and benefits 787 812 737 (25) (3) 75 10General and administrative expenses 929 978 1,026 (49) (5) (48) (5)Policyholder benefits and claims 0 0 374 (0) N/M (374) (100)Impairment of goodwill and other intangible assets 0 3 1,021 (3) N/M (1,018) (100)Restructuring activities 19 6 47 13 N/M (41) (88)Total noninterest expenses 1,735 1,799 3,205 (64) (4) (1,405) (44)Noncontrolling interests 85 1 0 83 N/M 1 N/MIncome (loss) before income taxes 367 732 (190) (364) (50) 922 N/MCost/income ratio 79 % 71 % 106 % N/M 8 ppt N/M (35) pptAssets¹ 10,030 8,050 12,300 1,980 25 (4,250) (35)Risk-weighted assets² 10,365 8,432 8,960 1,932 23 (528) (6)Average shareholders' equity³ 4,669 4,687 4,460 (19) (0) 227 5Post-tax return on average tangible shareholders’ equity 18 % 56 % 71 % N/M (38) ppt N/M (15) pptPost-tax return on average shareholders' equity 6 % 10 % (3) % N/M (5) ppt N/M 13 pptN/M – Not meaningful1 Segment assets represent consolidated view, i.e., the amounts do not include intersegment balances.2 Risk-weighted assets and capital ratios are based upon CRR/CRD 4 fully loaded.3 See Note 4 “Business Segments and Related Information” to the consolidated financial statements for a description of how average shareholders’ equity is allocated to the
divisions.
2018In Asset Management, the initial public offering of DWS was successfully completed during the first quarter of 2018. Marketconditions were challenging in 2018 with US tax reform and lower demand for European retail funds posing challenges to AMand the asset management industry. AM is adapting to the market conditions by further accelerating cost reductions. In linewith its communicated target, AM maintained a management fee margin of 30 basis points and above in 2018. In 2018 AMreported significantly lower income before income taxes of € 367 million, a € 364 million or 50 % decline compared to 2017.The decline was principally driven by lower revenues which were negatively impacted by unfavorable net flows and lowerperformance fees. Higher non-controlling interest attributable to minority shareholders for nine months following the initialpublic offering of DWS, which did not arise in the prior year, were partially offset by lower noninterest expenses.
Net revenues were € 2.2 billion, a decrease of € 346 million or 14 %.
Management fees were € 132 million, or 6 % lower, driven by net outflows of Assets under Management and fee margincompression in active managed products, lower Assets under Management driven fees in Alternatives and the absence ofrevenues from sold and discontinued businesses. The decline was partly compensated by the strong performance of Passivebusiness from higher Assets under Management.
Performance and transaction fees were significantly lower by € 109 million or 55 %, due to the absence of fees for a specificAlternatives fund received in 2017 and lower performance fees from Active products.
Other revenues were significantly lower by € 106 million compared to the prior year. The decline was primarily due to theimpact of sold and discontinued businesses in both 2017 and 2018 and the absence of a non-recurring recovery relating to areal-estate fund legal matter recorded in 2017.
Noninterest expenses of € 1.7 billion were € 64 million, or 4 % lower. Compensation and benefits were essentially flat withlower variable compensation costs offset by higher severance payments. General and administrative expenses were slightlylower driven by a significant decline in cost of services provided by Deutsche Bank Group to DWS, partially offset by litigationexpenses relating to a sold legacy business, higher MiFID II driven external research costs and higher costs for DWS operatingas a stand-alone company.

25
Deutsche Bank Operating and Financial ReviewAnnual Report 2018 Results of Operations
Assets under Management were € 664 billion, a decrease of € 37 billion, or 5 %, versus December 31, 2017. The decreasewas driven by € 28 billion unfavorable market development and € 23 billion net outflows, partly offset by € 13 billion positiveforeign exchange effects. The outflows were primarily driven by outsourced insurance assets and the impact of US companiesrepatriating assets following US tax reforms. The development in Assets under Management was also impacted by volatilemarkets and weaker investor sentiment together with underperformance in some flagship funds. Passive had strong inflowsparticularly in European Exchange Traded Products and mandates.
The following table provides the development of Assets under Management during 2018, broken down by product type as wellas the respective management fee margins:
in € bn.ActiveEquity
ActiveFixed
Income
ActiveMulti
AssetActive
SQIActiveCash Passive Alternatives
Assets underManagement
Balance as of December 31, 2017 95 238 57 65 59 115 73 702Inflows 14 58 10 16 490 56 10 655Outflows (21) (75) (14) (17) (493) (48) (9) (678)
Net Flows (7) (17) (3) (0) (3) 8 1 (23)FX impact 1 6 0 0 1 3 1 13Performance (10) (2) (3) (3) 0 (11) 0 (28)Other 0 1 0 (0) (0) (0) 1 1Balance as of December 31, 2018 78 226 51 61 58 115 76 664Management fee margin (in bps) 76 14 39 26 7 25 53 311 Inflows and Outflows as reported include the AuM shifts between asset classes.
2017In 2017, AM reported significantly higher income before income taxes of € 732 million, a € 922 million increase compared to2016, driven by the absence of the impairment of goodwill and other intangible assets related to Abbey Life recorded in 2016.Excluding Abbey Life, which was disposed in the fourth quarter of 2016, AM income before income taxes in 2017 was broadlyflat compared to 2016, as higher revenues were offset by higher noninterest expenses and several non-recurring items.
Net revenues were € 2.5 billion, a decrease of € 483 million or 16 %. Excluding Abbey Life in 2016, net revenues increasedby € 54 million, or 2 %, compared to the prior year.
Management fees increased slightly by € 57 million, or 3 %, mainly in Active driven by favorable market movements.
Performance and transaction fees were € 21 million or 9 % lower, primarily driven by lower fund performance fees from oneof the Active funds compared to the prior year.
Other revenues were significantly lower by € 123 million or 59 % compared to the prior year. The decline was primarily due tonon-recurring revenues from Abbey Life excluding mark-to-market revenues and proceeds on sale of Asset Management Indiaas well as a write-up relating to HETA exposure which was exited in 2016 - these impacts were partly offset by a recoveryrelating to a real-estate fund legal matter in the current year and the loss on sale of the Luxembourg-based Sal. Oppenheimasset servicing business and negative fair value related to guaranteed products in prior year. Following the sale of Abbey Lifein 2016, no mark-to-market movements on policyholder positions were recorded in 2017, compared to € 396 million reportedin the prior year.
Noninterest expenses of € 1.8 billion decreased significantly by € 1.4 billion, or 44 %, due to the non-recurrence of costsrelating to Abbey Life and lower restructuring expenses. Compensation and benefits were higher due to increased variablecompensation costs. General and administrative expenses were slightly lower compared to prior year, driven by the non-recurrence of costs relating to Abbey Life, partly offset by an operational loss provision taken in 2015 and released in 2016,coupled with 2017 costs relating to the DWS IPO.
Assets under Management were € 702 billion, a decrease of € 4 billion versus December 31, 2016, driven by € 36 billionunfavorable foreign exchange rate movements and € 13 billion divestments mainly relating to disposals of the Luxembourg-based Sal. Oppenheim asset servicing business and U.S. Private Clients business, partly offset by € 30 billion favorablemarket performance and € 16 billion net inflows led by European Exchange Traded Funds, multi asset and liquidity productnet inflows, partly offset by insurance asset net outflows.

26
Deutsche Bank 1 – Management ReportAnnual Report 2018
The following table provides the development of Assets under Management during 2017, broken down by product type as wellas the respective management fee margins:
in € bn.ActiveEquity
ActiveFixed
Income
ActiveMulti
AssetActive
SQIActiveCash Passive Alternatives
Assets underManagement
Balance as of December 31, 2016 91 255 51 66 63 98 82 706Inflows 19 70 21 16 410 36 16 589Outflows (21) (72) (10) (20) (409) (25) (15) (573)
Net Flows (2) (2) 11 (4) 1 11 0 16FX impact (3) (17) (1) (0) (3) (7) (5) (36)Performance 9 5 1 2 (1) 11 3 30Other (1) (3) (6) 2 0 1 (6) (13)Balance as of December 31, 2017 95 238 57 65 59 115 73 702Management fee margin (in bps) 76 14 42 24 9 24 58 321 Inflows and Outflows as reported include the AuM shifts between asset classes.
Non-Core Operations Unit
2018 increase (decrease)from 2017
2017 increase (decrease)from 2016
in € m.(unless stated otherwise) 2018 2017 2016 in € m. in % in € m. in %Net revenues – – (382) 0 N/M 382 N/Mthereof:Net interest income and net gains (losses) on financialassets/liabilities at fair value through profit or loss – – (1,307) 0 N/M 1,307 N/MProvision for credit losses – – 128 0 N/M (128) N/MNoninterest expensesCompensation and benefits – – 68 0 N/M (68) N/MGeneral and administrative expenses – – 2,659 0 N/M (2,659) N/MPolicyholder benefits and claims – – 0 0 N/M 0 N/MImpairment of goodwill and other intangible assets – – (49) 0 N/M 49 N/MRestructuring activities – – 4 0 N/M (4) N/MTotal noninterest expenses – – 2,682 0 N/M (2,682) N/MNoncontrolling interests – – (4) 0 N/M 4 N/MIncome (loss) before income taxes – – (3,187) 0 N/M 3,187 N/MAssets¹ – – 5,523 0 N/M (5,523) N/MRisk-weighted assets² – – 9,174 0 N/M (9,174) N/MAverage shareholders' equity³ – – 690 0 N/M (690) N/MN/M – Not meaningful1 Segment assets represent consolidated view, i.e., the amounts do not include intersegment balances.2 Risk-weighted assets and capital ratios are based upon CRR/CRD 4 fully loaded.3 See Note 4 “Business Segments and Related Information” to the consolidated financial statements for a description of how average shareholders’ equity is allocated to the
divisions.
From 2017 onwards, Non-Core Operations Unit (NCOU) ceased to exist as a standalone division. The remaining legacy assetsas of December 31, 2016 are now managed by the corresponding operating segments, predominately Corporate & InvestmentBank and Private & Commercial Bank.

27
Deutsche Bank Operating and Financial ReviewAnnual Report 2018 Results of Operations
Corporate & Other (C&O)
2018 increase (decrease)from 2017
2017 increase (decrease)from 2016
in € m.(unless stated otherwise) 2018 2017 2016 in € m. in % in € m. in %Net revenues (73) (489) (473) 416 (85) (17) 4Provision for credit losses 0 (0) (0) 1 N/M 0 (19)Noninterest expensesCompensation and benefits 3,055 3,050 2,931 5 0 119 4General and administrative expenses (2,624) (2,458) (2,398) (166) 7 (59) 2Policyholder benefits and claims 0 0 0 0 N/M 0 N/MImpairment of goodwill and other intangible assets 0 0 (0) 0 N/M 0 N/MRestructuring activities 0 0 (7) (0) (85) 7 N/MTotal noninterest expenses 431 593 525 (161) (27) 67 13Noncontrolling interests (109) (16) (46) (93) N/M 30 (65)Income (loss) before income taxes (396) (1,066) (952) 670 (63) (114) 12Assets1 5,872 6,586 40,959 (714) (11) (34,373) (84)Risk-weighted assets2 16,053 16,734 15,706 (681) (4) 1,028 7Average shareholders' equity 0 99 2,249 (99) N/M (2,150) (96)N/M – Not meaningful1 Assets in C&O reflect residual Treasury assets not allocated to the business segments as well as Corporate assets, such as deferred tax assets and central clearing accounts,
outside the management responsibility of the business segments.2 Risk weighted assets are based upon CRR/CRD 4 fully loaded. Risk-weighted assets in C&O reflect Treasury and Corporate assets outside the management responsibility of
the business segments, primarily the Group’s deferred tax assets.
2018C&O reported a loss before income taxes of € 396 million in 2018, an improvement of € 670 million, or 63 %, mainly driven bythe realization of a negative currency translation adjustment in 2017, lower noninterest expenses as well as higher reversalsof noncontrolling interests in 2018 primarily resulting from the initial public offering of DWS Group GmbH & Co. KGaA (“DWS”).
Net revenues were negative € 73 million in 2018, compared to negative € 489 million in 2017. Net revenues in 2017 wereimpacted by the realization of a currency translation adjustment of negative € 164 million associated with the disposal of anon-strategic subsidiary in Argentina. Revenues related to maintaining funding and liquidity buffers in excess of business-based liquidity requirements amounted to negative € 73 million in 2018, compared to negative € 93 million in the prior year.Valuation and timing differences contributed revenues of € 107 million in 2018, compared to € 51 million in 2017.
Noninterest expenses were € 431 million in 2018, a decrease of € 161 million, or 27 %, compared to prior year, driven bylower-than-planned Infrastructure expenses in 2018. From 2018 onwards, Infrastructure expenses are allocated to thecorporate divisions based on the planned allocations. Any difference between planned and actual allocations is captured withinC&O. This was partly offset by expenses associated with shareholder activities as defined in the OECD Transfer PricingGuidelines not allocated to the business divisions of € 422 million in 2018, compared to € 371 million in the prior year.
Noncontrolling interests are deducted from income before income taxes of the divisions and reversed in C&O. The increasefrom € 16 million in 2017 to € 109 million in 2018 was primarily a result of the aforementioned IPO of DWS.
2017C&O reported a loss before income taxes of € 1.1 billion in 2017, compared to a loss of € 952 million in 2016, an increase of€ 114 million, or 12 %, primarily driven by the realization of a negative currency translation adjustment and higher litigationcosts in 2017, partly compensated by a positive valuation and timing impact.
Net revenues were negative € 489 million in 2017, compared to negative € 473 million in the prior year, a decline of € 17 millionor 4 %. Net revenues in 2017 were impacted by the realization of a currency translation adjustment of negative € 164 millionassociated with the disposal of a non-strategic subsidiary in Argentina. Revenues related to maintaining funding and liquiditybuffers in excess of business-based liquidity requirements were negative € 93 million in 2017, compared to negative € 12 mil-lion in 2016. Foreign exchange revaluation of proceeds from GBP denominated AT1 issuance was negative € 26 million in2017, compared to negative € 127 million in the prior year. Valuation and timing differences contributed revenues of € 51 mil-lion in 2017, compared to negative € 148 million in 2016.
Noninterest expenses were € 593 million in 2017, an increase of € 67 million, or 13 %, compared to prior year. Litigation costsof € 112 million in 2017 increased by of € 130 million, compared to prior year. 2016 litigation costs benefitted from a € 73 mil-lion insurance recovery. This was partly offset by expenses associated with shareholder activities as defined in the OECDTransfer Pricing Guidelines not allocated to the business divisions of € 371 million in 2017, compared to € 411 million in 2016.
Noncontrolling interests are deducted from income before income taxes of the divisions and reversed in C&O. The decreasefrom € 46 million in 2016 to € 16 million in 2017 primarily related to CIB and PCB.

28
Deutsche Bank 1 – Management ReportAnnual Report 2018
Financial PositionAssets
2018 increase (decrease) from 2017in € m. Dec 31, 2018 Dec 31, 2017 in € m. in %Cash and central bank balances 188,731 225,655 (36,924) (16)Interbank balances (w/o central banks) 8,881 9,265 (384) (4)Central bank funds sold and securities purchased under resale agreements 8,222 9,971 (1,749) (18)Securities borrowed 3,396 16,732 (13,336) (80)Financial assets at fair value through profit or loss
Trading assets 152,738 184,661 (31,924) (17)Positive market values from derivative financial instruments 320,058 361,032 (40,974) (11)Non-trading financial assets mandatory at fair value through profit and loss 100,444 N/M 100,444 N/MFinancial assets designated at fair value through profit or loss 104 91,276 (91,172) (100)
Total financial assets at fair value through profit or loss 573,344 636,970 (63,626) (10)Financial assets at fair value through other comprehensive income 51,182 N/M 51,182 N/MFinancial assets available for sale N/M 49,397 (49,397) N/MEquity method investments 879 866 13 1Loans at amortized cost 400,297 401,699 (1,403) (0)Securities held to maturity N/M 3,170 (3,170) N/MProperty and equipment 2,421 2,663 (241) (9)Goodwill and other intangible assets 9,141 8,839 302 3Other assets 93,444 101,491 (8,047) (8)
Of which: Brokerage and securities related receivables 66,675 83,015 (16,340) (20)Assets for current tax / Deferred tax assets 8,200 8,014 186 2Total assets 1,348,137 1,474,732 (126,595) (9)
Of which: Total central bank funds sold, securities purchased under resaleagreements and securities loaned across all applicable measurementcategories 81,467 104,800 (23,333) (22)
at amortized cost 11,618 26,703 (15,085) (56)mandatory at fair value through profit and loss 68,752 N/M 68,752 N/Mdesignated at fair value through profit and loss 0 78,097 (78,097) N/Mat fair value through other comprehensive income 1,097 N/M 1,097 N/M
Of which: Total loans across all applicable measurement categories 429,591 420,063 9,528 2at amortized cost 400,297 401,699 (1,403) (0)at fair value through profit and loss (trading) 11,462 10,876 586 5mandatory at fair value through profit and loss 12,741 N/M 12,741 N/Mdesignated at fair value through profit and loss 0 4,802 (4,802) N/Mat fair value through other comprehensive income 5,092 N/M 5,092 N/Mavailable for sale at fair value N/M 2,685 (2,685) N/M
Liabilities and Equity 2018 increase (decrease) from 2017
in € m. Dec 31, 2018 Dec 31, 2017 in € m. in %Deposits 564,405 581,873 (17,468) (3)Central bank funds purchased and securities sold under repurchaseagreements 4,867 18,105 (13,239) (73)
Securities loaned 3,359 6,688 (3,330) (50)Financial liabilities at fair value through profit or loss 415,680 478,636 (62,957) (13)
Trading liabilities 59,924 71,462 (11,539) (16)Negative market values from derivative financial instruments 301,487 342,726 (41,239) (12)Financial liabilities designated at fair value through profit or loss 53,757 63,874 (10,117) (16)Investment contract liabilities 512 574 (62) (11)
Other short-term borrowings 14,158 18,411 (4,253) (23)Other liabilities 117,513 132,208 (14,695) (11)
Of which: Brokerage and securities related payables 90,708 106,742 (16,035) (15)Provisions 2,711 4,158 (1,447) (35)Liabilities for current tax / Deferred tax liabilities 1,456 1,346 110 8Long-term debt 152,083 159,715 (7,632) (5)Trust preferred securities 3,168 5,491 (2,323) (42)Obligation to purchase common shares 0 0 0 N/MTotal liabilities 1,279,400 1,406,633 (127,234) (9)
Of which: Total central bank funds purchased, securities sold under resaleagreements and securities loaned across all applicable measurementcategories 54,529 79,673 (25,144) (32)
at amortized cost 8,226 24,794 (16,568) (67)designated at fair value through profit and loss 46,304 54,880 (8,576) (16)
Total equity 68,737 68,099 639 1

29
Deutsche Bank Operating and Financial ReviewAnnual Report 2018 Financial Position
Movements in Assets
As of December 31, 2018, total assets decreased by € 126.6 billion (or 9 %) compared to year-end 2017.
Positive market value from derivative financial instruments decreased by € 41.0 billion, mainly attributable to interest rateproducts driven by increased swap rates which are inversely correlated with mark-to-market values as well as foreignexchange rate products as a result of fluctuating foreign exchange rates. Reduced trading volumes also contributed to thedecrease. This decrease went along with a corresponding decrease in negative market values from derivative financialinstruments.
Cash and central bank balances decreased by € 36.9 billion, primarily driven by reductions in deposits and short-termborrowings as well as initiatives to utilize excess cash to fund securities positions.
Trading assets decreased by € 31.9 billion, mainly driven by strategic reshaping in CIB along with de-risking activities as wellas reduced client positions in the Equities business. The weakening of global indices also contributed to the decrease.
Central bank funds sold, securities purchased under resale agreements and securities borrowed, across all applicable balancesheet categories, decreased by € 23.3 billion, primarily driven by managed reductions as a result of our balance sheetoptimization initiatives, lower short coverage requirements and increased netting.
Brokerage and securities related receivables decreased by € 16.3 billion, primarily due to the majority of receivables fromPrime Brokerage being moved to non-trading financial assets mandatory at fair value through profit and loss under IFRS 9.Cash/margin receivables also decreased, reflecting the reduction in negative market values from derivative financialinstruments.
These decreases were partly offset by a € 8.3 billion increase in other assets excluding brokerage and securities relatedreceivables, mainly driven by reclassifications of exposures to debt securities hold-to-collect following the implementation ofIFRS 9 and reclassifications to assets held for sale subsequent to the agreement to sell our retail operations in Portugal.
Loan classifications have been significantly impacted by the adoption of IFRS 9. Loans previously classified at amortized costunder IAS 39 are now reported in several different categories, not only in loans at amortized cost, but also in non-tradingfinancial assets mandatory at fair value through profit and loss and financial assets designated at fair value through othercomprehensive income. Across all of these categories, the actual business movement for net loans was an increase of€ 9.5 billion, or € 16.6 billion excluding the impact of exited business in PCB, mainly driven by new deals and increaseddrawdowns from the existing facilities during the period.
The overall movement of the balance sheet included an increase of € 24.0 billion due to foreign exchange rate movements,mainly driven by strengthening of the U.S. Dollar versus the Euro. The effects from foreign exchange rate movements areembedded in the movement of the balance sheet line items discussed in this section.
Movements in Liabilities
As of December 31, 2018, total liabilities decreased by € 127.2 billion (or 9 %) compared to year-end 2017.
Negative market values from derivative financial instruments decreased by € 41.2 billion, primarily due to the same factors asthe movements in positive market values from derivative financial instruments discussed above.
Central bank funds purchased, securities sold under repurchase agreements and securities loaned, across all applicablebalance sheet categories, decreased by € 25.1 billion, primarily driven by managed reductions as a result of our balance sheetoptimization initiatives and increased netting.
Deposits decreased by € 17.5 billion, primarily driven by management actions to lower volumes with financial institutions aswell as matured trades during the period. Maturing Certificates of Deposits held by other wholesale customers also contributedto the decrease. This decrease was partly offset by an increase in our retail business.
Brokerage and securities related payables decreased by € 16.0 billion, primarily due to strategic actions to reduce PrimeBrokerage payables as part of our balance sheet optimization initiatives and lower cash/margin payables being in line with theobserved reduction in positive market values from derivative financial instruments.

30
Deutsche Bank 1 – Management ReportAnnual Report 2018
Trading liabilities decreased by € 11.5 billion, mainly driven by managed reductions in short positions to reduce short coveragerequirements supporting our deleveraging activities along with our strategic reshaping in CIB.
Long term debt decreased by € 7.6 billion, primarily driven by matured deals including Targeted Longer-Term RefinancingOperations II (TLTRO II) during the period and managed reductions as a result of our balance sheet optimization initiatives.
Similar to total assets, the impact of foreign exchange rate movements during the period is embedded in the overallmovements in liabilities as discussed in this section.
Liquidity
Liquidity reserves amounted to € 259 billion as of December 31, 2018 (compared to € 280 billion as of December 31, 2017).We maintained a positive liquidity stress result as of December 31, 2018 (under the combined scenario).
Equity
Total equity as of December 31, 2018, increased by € 1.3 billion compared to pro-forma total equity after the adoption ofIFRS 9 as of January 1, 2018, which considers a one-time transition effect of € (671) million to the Total shareholders’ equityof € 63.2 billion as of December 31, 2017 (please refer to chapter “IFRS 9 Transition Impact Analysis” in this report).
The increase of € 1.3 billion was mainly driven by an increase of non-controlling interests of € 1.3 billion as a result of the IPOand partial sale of Deutsche Bank’s subsidiary DWS Group GmbH & Co. KGaA, the net income attributable to Deutsche Bankshareholders and additional equity components of € 267 million as well as net gains from exchange rate changes of€ 500 million, relating especially to the US dollar. These factors were partly offset by a reduction in unrealized gains on financialassets at fair value through other comprehensive income of € 428 million, mainly due to asset sales, coupons paid onadditional equity components of € 292 million net of tax as well as cash dividends paid to Deutsche Bank shareholders of€ 227 million.
Regulatory Capital
With effect from January 1, 2018, the CRR/CRD 4 “transitional” (or “phase-in”) rules under which Common Equity Tier 1 (CET 1)regulatory adjustments were phased in have reached a rate of 100 %, together with the 100 % phase-out rate of minority interestonly recognizable under the transitional rules. For Risk-weighted assets (RWA) the grandfathering of equity investments at a risk-weight of 100 % expired by the end of 2017. Instead a risk weight between 190 % and 370 % determined based on Article 155CRR under the CRR/CRD 4 is applied. Hence, starting 2018 onwards, the CET 1 capital and RWA figures show no differencebetween CRR/CRD 4 and fully loaded CRR/CRD 4.
Our CET 1 capital according to CRR/CRD 4 as of December 31, 2018 (fully loaded rules applicable) decreased by € 3.3 billion to€ 47.5 billion, compared to € 50.8 billion as of December 31, 2017 (based on transitional arrangements). RWA according toCRR/CRD 4 increased by € 7.1 billion to € 350.4 billion as of December 31, 2018, compared to € 343.3 billion as of December 31,2017. Due to the decrease in CRR/CRD 4 CET 1 capital and increase in RWA, the CRR/CRD 4 CET 1 capital ratio as ofDecember 31, 2018 decreased to 13.6 % compared to 14.8 % as of December 31, 2017.
Our fully loaded CRR/CRD 4 CET 1 capital as of December 31, 2018 (now equal to CRR/CRD 4 CET 1 capital) amounted to€ 47.5 billion, € 0.8 billion lower compared to € 48.3 billion as of December 31, 2017. RWA according to CRR/CRD 4 fully loadedincreased by € 6.2 billion to € 350.4 billion as of December 31, 2018 compared to € 344.2 billion as of December 31, 2017. Thisresulted in the fully loaded CRR/CRD 4 CET 1 capital ratio as of December 31, 2018 decreasing to 13.6 % compared to 14.0 %as of December 31, 2017.

31
Deutsche Bank Operating and Financial ReviewAnnual Report 2018 Liquidity and Capital Resources
Liquidity and Capital ResourcesFor a detailed discussion of our liquidity risk management, see our Risk Report.
Credit Ratings
Deutsche Bank is rated by Moody’s Investors Service, Inc. (“Moody’s”), Standard & Poor’s Credit Market Services EuropeLimited (“S&P”), Fitch Ratings Limited (“Fitch”), and DBRS, Inc. (“DBRS”, together with Moody’s, S&P and Fitch, the “RatingAgencies”).
S&P and Fitch are established in the European Union and have been registered in accordance with Regulation (EC) No1060/2009 of the European Parliament and of the Council of September 16, 2009, as amended, on credit rating agencies(“CRA Regulation”). With respect to Moody’s, the credit ratings are endorsed by Moody’s office in the UK (Moody’s InvestorsService Ltd.) in accordance with Article 4(3) of the CRA Regulation. With respect to DBRS, the credit ratings are endorsed byDBRS Ratings Ltd. in the UK in accordance with Article 4(3) of the CRA Regulation.
Credit Ratings Development
The rating agencies have reacted to the strategic adjustments that the bank announced in April 2018. While the agenciesregard the strategic changes as creditor-friendly in the long-term and acknowledge Deutsche Bank’s current capital andbalance sheet strength, they see short-term execution challenges on the bank’s extended restructuring.
In April 2018, S&P placed Deutsche Bank’s issuer credit and senior unsecured (or ‘preferred debt’) ratings on credit watchnegative before downgrading both ratings by one notch to BBB+ in June 2018. Moody’s, Fitch and DBRS changed their ratingsoutlooks to negative between April and June 2018.
In July 2018, Germany adopted a law change to harmonize the liability structure of German banks more closely with otherEuropean jurisdictions. With this, German banks are able to issue both lower ranked senior non-preferred debt (ranking paripassu with existing legacy plain vanilla unsecured debt) as well as higher ranked senior preferred debt (ranking pari passuwith existing structured notes and short-term money market instruments).
Shortly after the amendment took effect, Moody’s and DBRS resolved the rating actions they had assigned to most Germanbanks to reflect this upcoming change. End of July 2018, DBRS lowered Deutsche Bank’s senior debt rating by one notch toBBB (high) and renamed this debt class to senior non-preferred. At the same time, DBRS introduced a new long term seniordebt class, and assigned an A (low) rating. This rating action resolved the ‘rating under review with negative implications’status from beginning of July 2018.
In August 2018 Moody’s removed the remaining notch government support from Deutsche Bank’s senior debt rating anddowngraded the debt class to Baa3. This renamed junior senior (or ‘non-preferred’) debt class will not carry an outlookassignment going forward, therefore the former negative outlook was withdrawn. Moody’s confirmed Deutsche Bank’s seniorsenior (or ‘preferred’) debt rating at A3 and renamed it to senior unsecured. At the same time Moody’s upgraded DeutscheBank’s issuer rating to A3 to refer to the level of the most senior unsecured debt class available in each jurisdiction.
Potential Impacts of Ratings Downgrades
Deutsche Bank calculates both the contractual and hypothetical potential impact of a one-notch and two-notch downgrade bythe rating agencies (Moody’s, Standard & Poor’s and Fitch) on its liquidity position, and includes this impact in its daily liquiditystress test and Liquidity Coverage Ratio calculations. The LCR and liquidity stress test results by scenario are separatelydisclosed.
In terms of contractual obligations, the hypothetical impact of a one-notch downgrade across the three Rating AgenciesMoody’s, Standard & Poor’s and Fitch amounts to approximately € 0.7 billion, mainly driven by increased contractualderivatives funding and/or margin requirements. The hypothetical impact of a two-notch downgrade amounts to approximately€ 1.0 billion, mainly driven by increased contractual derivatives funding and/or margin requirements of approximately € 984million.

32
Deutsche Bank 1 – Management ReportAnnual Report 2018
The above analysis assumes a simultaneous downgrade by the three rating agencies Moody’s, Standard & Poor’s and Fitchthat would consequently reduce Deutsche Bank’s funding capacity in the stated amounts. This specific contractual analysisfeeds into the bank’s idiosyncratic liquidity stress test scenario.
The actual impact of a downgrade to Deutsche Bank is unpredictable and may differ from potential funding and liquidity impactsdescribed above.
Selected rating categoriesCounterparty
RiskSenior preferred/
Deposits¹Senior
non-preferred² Short-term ratingMoody’s Investors Service, New York A3 A3 Baa3 P-2Standard & Poor’s, New York – BBB+ BBB- A-2Fitch Ratings, New York A- (dcr) A- BBB+ F2DBRS, Toronto A (high) A (low) BBB (high) R-1 (low)1 Defined as senior unsecured bank rating at Moody‘s, senior unsecured debt at Standard & Poor’s, senior preferred debt rating at Fitch and senior debt rating at DBRS. All
agencies provide separate ratings for deposits and ‘senior preferred’ debt, but at the same rating level.2 Defined as junior senior debt rating at Moody's, as senior subordinated debt at Standard & Poor’s and as senior non-preferred debt at Fitch and DBRS.
Each rating reflects the view of the rating agency only at the time the rating was issued, and each rating should be separatelyevaluated and the rating agencies should be consulted for any explanations of the significance of their ratings. The ratingagencies can change their ratings at any time if they believe that circumstances so warrant. The long-term credit ratings shouldnot be viewed as recommendations to buy, hold or sell Deutsche Bank’s securities.
Tabular Disclosure of Contractual Obligations
Cash payment requirements outstanding as of December 31, 2018.
Contractual obligations Payment dueby period
in € m. Total Less than 1 year 1–3 years 3–5 years More than 5 yearsLong-term debt obligations¹ 165,756 50,193 51,079 25,886 38,598Trust preferred securities1,2 3,342 3,342 0 0 0Long-term financial liabilities designatedat fair value through profit or loss3 5,856 1,332 572 880 3,073Finance lease obligations 118 19 24 10 65Operating lease obligations 6,264 707 1,139 938 3,480Purchase obligations 2,015 239 728 255 793Long-term deposits¹ 33,727 0 15,656 6,028 12,043Other long-term liabilities 1,922 1,111 316 189 306Total 219,000 56,943 69,515 34,184 58,3581 Includes interest payments.2 Contractual payment date or first call date.3 Long-term debt and long-term deposits designated at fair value through profit or loss.
Figures above do not include the future revenues of non-cancellable sublease rentals of € 20 million on operating leases.Purchase obligations for goods and services include future payments for, among other things, information technology servicesand facility management. Some figures above for purchase obligations represent minimum contractual payments and actualfuture payments may be higher. Long-term deposits exclude contracts with a remaining maturity of less than one year. Undercertain conditions future payments for some long-term financial liabilities designated at fair value through profit or loss mayoccur earlier. See the following notes to the consolidated financial statements for further information: Note 5 “Net InterestIncome and Net Gains (Losses) on Financial Assets/Liabilities at Fair Value through Profit or Loss”, Note 24 “Leases”, Note 28“Deposits” and Note 32 “Long-Term Debt and Trust Preferred Securities”.
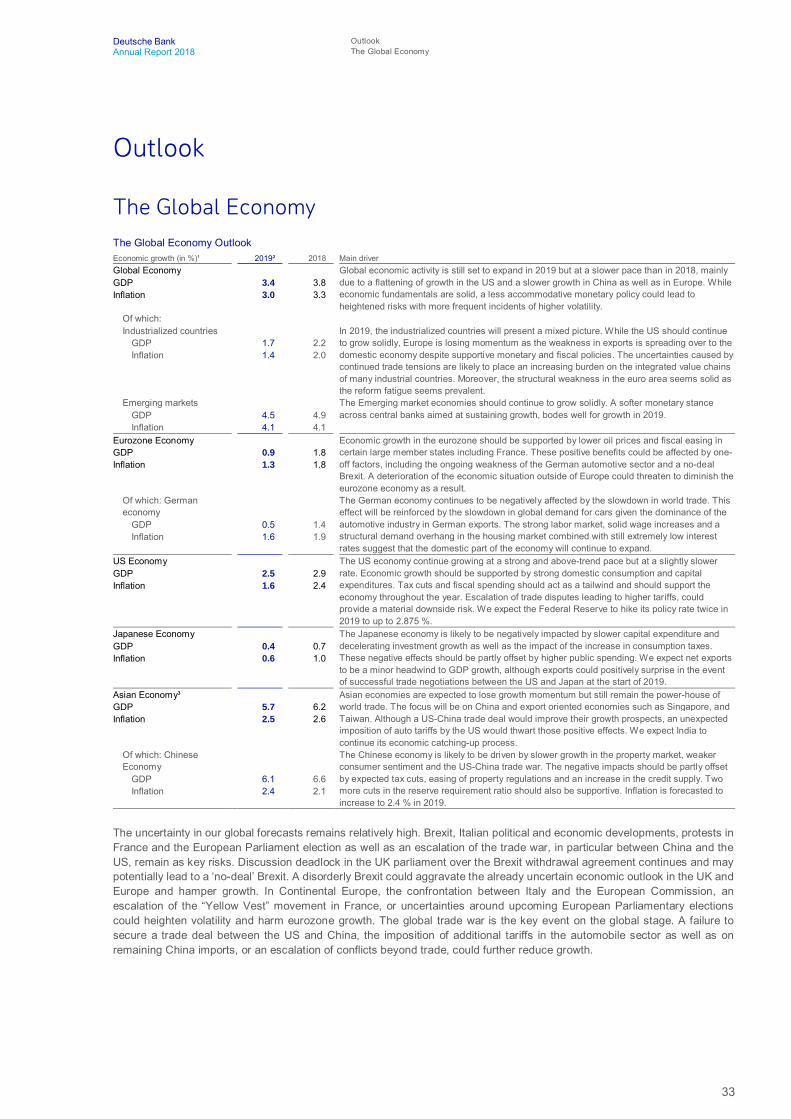
33
Deutsche Bank OutlookAnnual Report 2018 The Global Economy
Outlook
The Global EconomyThe Global Economy OutlookEconomic growth (in %)¹ 2019² 2018 Main driverGlobal Economy Global economic activity is still set to expand in 2019 but at a slower pace than in 2018, mainly
due to a flattening of growth in the US and a slower growth in China as well as in Europe. Whileeconomic fundamentals are solid, a less accommodative monetary policy could lead toheightened risks with more frequent incidents of higher volatility.
GDP 3.4 3.8Inflation 3.0 3.3
Of which:Industrialized countries In 2019, the industrialized countries will present a mixed picture. While the US should continue
to grow solidly, Europe is losing momentum as the weakness in exports is spreading over to thedomestic economy despite supportive monetary and fiscal policies. The uncertainties caused bycontinued trade tensions are likely to place an increasing burden on the integrated value chainsof many industrial countries. Moreover, the structural weakness in the euro area seems solid asthe reform fatigue seems prevalent.
GDP 1.7 2.2Inflation 1.4 2.0
Emerging markets The Emerging market economies should continue to grow solidly. A softer monetary stanceacross central banks aimed at sustaining growth, bodes well for growth in 2019.GDP 4.5 4.9
Inflation 4.1 4.1Eurozone Economy Economic growth in the eurozone should be supported by lower oil prices and fiscal easing in
certain large member states including France. These positive benefits could be affected by one-off factors, including the ongoing weakness of the German automotive sector and a no-dealBrexit. A deterioration of the economic situation outside of Europe could threaten to diminish theeurozone economy as a result.
GDP 0.9 1.8Inflation 1.3 1.8
Of which: Germaneconomy
The German economy continues to be negatively affected by the slowdown in world trade. Thiseffect will be reinforced by the slowdown in global demand for cars given the dominance of theautomotive industry in German exports. The strong labor market, solid wage increases and astructural demand overhang in the housing market combined with still extremely low interestrates suggest that the domestic part of the economy will continue to expand.
GDP 0.5 1.4Inflation 1.6 1.9
US Economy The US economy continue growing at a strong and above-trend pace but at a slightly slowerrate. Economic growth should be supported by strong domestic consumption and capitalexpenditures. Tax cuts and fiscal spending should act as a tailwind and should support theeconomy throughout the year. Escalation of trade disputes leading to higher tariffs, couldprovide a material downside risk. We expect the Federal Reserve to hike its policy rate twice in2019 to up to 2.875 %.
GDP 2.5 2.9Inflation 1.6 2.4
Japanese Economy The Japanese economy is likely to be negatively impacted by slower capital expenditure anddecelerating investment growth as well as the impact of the increase in consumption taxes.These negative effects should be partly offset by higher public spending. We expect net exportsto be a minor headwind to GDP growth, although exports could positively surprise in the eventof successful trade negotiations between the US and Japan at the start of 2019.
GDP 0.4 0.7Inflation 0.6 1.0
Asian Economy³ Asian economies are expected to lose growth momentum but still remain the power-house ofworld trade. The focus will be on China and export oriented economies such as Singapore, andTaiwan. Although a US-China trade deal would improve their growth prospects, an unexpectedimposition of auto tariffs by the US would thwart those positive effects. We expect India tocontinue its economic catching-up process.
GDP 5.7 6.2Inflation 2.5 2.6
Of which: ChineseEconomy
The Chinese economy is likely to be driven by slower growth in the property market, weakerconsumer sentiment and the US-China trade war. The negative impacts should be partly offsetby expected tax cuts, easing of property regulations and an increase in the credit supply. Twomore cuts in the reserve requirement ratio should also be supportive. Inflation is forecasted toincrease to 2.4 % in 2019.
GDP 6.1 6.6Inflation 2.4 2.1
The uncertainty in our global forecasts remains relatively high. Brexit, Italian political and economic developments, protests inFrance and the European Parliament election as well as an escalation of the trade war, in particular between China and theUS, remain as key risks. Discussion deadlock in the UK parliament over the Brexit withdrawal agreement continues and maypotentially lead to a ‘no-deal’ Brexit. A disorderly Brexit could aggravate the already uncertain economic outlook in the UK andEurope and hamper growth. In Continental Europe, the confrontation between Italy and the European Commission, anescalation of the “Yellow Vest” movement in France, or uncertainties around upcoming European Parliamentary electionscould heighten volatility and harm eurozone growth. The global trade war is the key event on the global stage. A failure tosecure a trade deal between the US and China, the imposition of additional tariffs in the automobile sector as well as onremaining China imports, or an escalation of conflicts beyond trade, could further reduce growth.
34
Deutsche Bank 1 – Management ReportAnnual Report 2018
The Banking IndustryThe greatest risks to the global banking industry in 2019 are likely to materialize if political issues create a sustained slowdownin macroeconomic growth. In the US, the trade disputes with China and Europe continue to simmer, and the fact that differentpolitical parties have majorities in the two respective houses of the US Congress have significantly increased the risk of politicaland government gridlock. Europe faces the prospect of a ‘no deal’ Brexit. It is also possible that Italy's populist governmentmay take renewed action leading to increased uncertainty and volatility on the financial markets.
In Europe, the banking industry is expected to see a more challenging environment in 2019, slowing macroeconomic growth,the risks surrounding Brexit, and a potential decline in exports on any trade war. In addition, the banks' net interest incomeremains under pressure from zero and negative interest rates and a major shift in policy seems unlikely this year. Based onour current macroeconomic forecasts, business and household lending should continue at a moderate pace.
The conditions in Germany are comparable to those faced by European banks in general, although the indicators aresomewhat more favorable overall. Asset quality is expected to remain solid with robust lending growth, even amidst a slighteconomic downturn. Similar earnings problems to those faced overall in Europe, primarily in terms of interest, and even greaterdifficulties in achieving solid profitability.
In the US, banks are facing a considerably more positive outlook. The economic slowdown will likely be less pronounced thanin Europe, and unlike the ECB, the Federal Reserve is expected to continue raising interest rates, one of the main drivers forincreases in revenues and profits.
The outlook for Chinese banks will depend on how acutely the trade dispute affects economic growth and the extent to whichthe government reacts with stimulus programs, which generally also involve increased lending. In the absence of any majordistortions, the pace of lending growth could decline slightly from the relatively high levels in 2018. In Japan, there are nosigns of fundamental change in the traditional banking business, with moderate lending growth likely to continue.
In Europe, the negotiations between the EU and the UK on the withdrawal agreement concluded in 2018 which was laterrejected by the UK parliament. Whether a withdrawal agreement will eventually be reached and ratified will determine whetheror not a transition period is implemented. The discussions on the future relationship between the EU and the UK will beimpacted by the outcome of this process. Uncertainty on the regulation of cross-border business is likely to continue through2019. In Europe, regulators are working to finalize outstanding legislative packages before the election of the next EuropeanParliament in May 2019. One of these main packages focuses on Risk Reduction and includes Basel standards such as theNet Stable Funding Ratio (NSFR), Leverage Ratio (LR), Interest Rate Risk in the Banking Book (IRRBB), Large Exposures(LE) and Total Loss Absorbing Capacity (TLAC). The mandate of the current European Commission will end in October 2019.A newly installed College of Commissioners will then work on establishing the new five year work programme which will definenew priorities for EU financial services regulators. We expect EU policy-makers to be focused on growth and the developmentof EU financial markets following Brexit.
The Deutsche Bank GroupIn 2019, we intend to build on the progress made last year to pursue our near-term operating targets for adjusted costs andemployees. We are also working towards our 2019 Post-tax Return on Average Tangible Equity target. Achieving our near-term Post-tax Return on Average Tangible Equity target requires amongst other things growth in our more market-sensitivebusinesses, which will in part depend on market conditions. Market conditions have improved as compared to thoseexperienced in the fourth quarter of 2018, however, they are somewhat weaker than we had anticipated. We aim to achieveour other key performance indicators over time, consistent with becoming a simpler and safer bank.

35
Deutsche Bank OutlookAnnual Report 2018 The Deutsche Bank Group
Our most important key performance indicators are shown in the table below:
Key Performance Indicators
Dec 31, 2018 Target KPINear-term operating targets
Post-tax Return on Average Tangible Equity1 0.5 % 2019: greater than 4 %Adjusted costs2 € 22.8 bn 2019: € 21.8 bnEmployees3 91,737 2019: below 90,000
Long-term operating targetPost-tax Return on Average Tangible Equity1 0.5 % circa 10 %
Capital targetsCRR/CRD 4 Common Equity Tier 1 capital ratio4 13.6 % above 13.0 %CRR/CRD 4 leverage ratio according to transitional rules (phase-in)5 4.3 % 4.5 %
1 Based on Net Income attributable to Deutsche Bank shareholders. For further information, please refer to “Supplementary Information (Unaudited): Non-GAAP FinancialMeasures” of this report.
2 Adjusted costs are noninterest expenses excluding impairment of goodwill and other intangible assets, litigation and restructuring and severance. For further informationplease refer to “Supplementary Information (unaudited): Non-GAAP Financial Measures” of this report.
3 Internal full-time equivalents.4 Further detail on the calculation of this ratio is provided in the Risk Report.5 Further detail on the calculation of the CRR/CRD 4 leverage ratio according to transitional rules (phase-in basis) is provided in the Risk Report.
We are committed to working towards a target for our Post-tax Return on Average Tangible Equity of greater than 4 % in 2019.
For 2019, we expect revenues to be slightly higher compared to 2018. We aim to improve revenue in particular throughinvestment in targeted growth areas including through loan and volume growth as well as through liquidity and balance sheetoptimization and redeployment. Our outlook reflects our expectation of a solid global macroeconomic growth in 2019, withgrowth in the US specifically remaining strong, and no material distortions in foreign exchange rates.
We are committed to reducing our adjusted costs in 2019 to € 21.8 billion. We aim to reduce our internal workforce to below90,000 full-time employees by year-end 2019. We expect to benefit from the run-rate impact of measures executed in 2018,as well as from the impact of Postbank integration and from the exit of retail business in Portugal. We will continue to addressstructural cost issues and optimize processes. Over time, we aspire to achieve a Post-tax Return on Average Tangible Equityof approximately 10 %, in a normalized environment and on the basis of the achievement of our cost targets.
We expect to benefit from a more normalized tax rate, and assume an increase in provision in credit losses in 2019 comparedto last year.
We expect our CRR/CRD 4 Common Equity Tier 1 capital ratio to be negatively impacted by pending supervisory assessmentsbut to remain above 13 % throughout the year 2019. We expect our CRR/CRD 4 leverage ratio (phase-in) to remain above4 % in 2019. Absent supervisory adjustments, we anticipate year-end 2019 risk weighted assets (RWA) to stay essentially flatand CRR/CRD 4 leverage exposure to be slightly higher compared to year end 2018. With the transition to IFRS 16 as ofJanuary 1, 2019, we expect to see a further decline in our CRR/CRD 4 Common Equity Tier 1 capital ratio of approximately20 basis points as we recognize certain lease contracts on our balance sheet.
We target a competitive dividend payout ratio. Our dividend payments are subject to our ability to maintain sufficient levels ofdistributable profits under our standalone financial statements in accordance with German accounting rules (HGB) for therespective fiscal year.
By the nature of our business, we are involved in litigation, arbitration and regulatory proceedings and investigations inGermany and in a number of jurisdictions outside Germany, especially in the US. Such matters are subject to manyuncertainties. While we have resolved a number of important legal matters and made progress on others, we expect thelitigation and enforcement environment to remain challenging in the short term. Litigation expenses in 2018 were relativelylow as a result of our successful efforts in resolving a number of matters at or below estimated provisions. For 2019, and witha caveat that forecasting litigation expense is subject to many uncertainties, we expect litigation expense to be significantlyhigher than in 2018.
36
Deutsche Bank 1 – Management ReportAnnual Report 2018
Our Business Segments
Corporate & Investment Bank (CIB)
CIB’s aim is to provide efficient and seamless client coverage for our offering of investment and transaction banking productsand services for corporate and institutional clients and thereby generate attractive returns for our shareholders.
After completing the targeted headcount and resource reductions as part of our strategic reshaping in 2018, the division’sfocus is now on revenue growth in 2019. We expect CIB revenues to be slightly higher this year compared to the prior year.CIB should also benefit from the Group wide re-deployment of excess liquidity into higher-yielding assets, which is expectedto reduce liquidity-related funding costs.
For Global Transaction Banking, we expect revenues adjusted for a gain on sale in 2018 to be slightly higher in 2019 comparedto the prior year, due to the benefits from expected interest rate increases in the US, in addition to treasury and depositinitiatives. We expect Trade revenues to be higher, driven by increased income from structured transactions. CashManagement revenues are expected be higher from net interest income growth and deposit initiatives. Trust and Agency andSecurities Services revenues adjusted for the aforementioned gain on sale are expected to be slightly lower.
Origination & Advisory revenues are expected to be higher in 2019 year over year, driven by market share growth. We expectDebt Origination revenues to be higher as the business aims to build on the market share gains achieved during 2018especially in Leveraged Finance, combined with an intensified focus on Investment Grade acquisition financing. EquityOrigination revenues are also expected to be higher year over year with a renewed focus on initial public offerings andacquisition financing. Advisory revenues are expected to be essentially flat in 2019 compared to 2018.
We expect Sales & Trading Fixed Income and Currencies (FIC) revenues to be higher in 2019 compared to 2018 driven byan expected increase in client activity levels and a more favorable trading environment after difficult conditions, especially inthe fourth quarter. Revenues in FIC should also benefit from improved client coverage provided by the integrated Institutionaland Treasury Coverage Group, targeted resource deployment in Credit, an increased focus on cross-selling with GTB and theaforementioned lower funding costs as a result of re-deployment of the Group’s excess liquidity.
Sales & Trading Equity revenues are expected to be slightly higher in 2019 compared to 2018. Equity Trading is expected tobenefit from platform stabilization and investment in electronic trading platforms. We expect Equity Derivatives to see growthin structured products from funding optimization, targeted hires and system investment. Within Prime Finance, a focus onclient balances and spreads in addition to the aforementioned lower funding costs as a result of re-deployment of the Group’sexcess liquidity are expected to drive higher revenues.
Noninterest expenses for 2019 are expected to be essentially flat. Costs excluding litigation, severance and restructuring andgoodwill impairment are expected to be slightly lower, driven by lower non-compensation costs and reduced infrastructurerelated costs. In 2019, we expect CIB to benefit from the full-year run-rate impact of the headcount reductions in 2018. Furtherexpense management initiatives in 2019 are focused on middle and back office functions. For 2019, we expect RWA in CIBto be essentially flat as targeted Credit Risk RWA increases should be offset by reduced Market Risk RWA and slightly lowerOperational Risk RWA. We continue to focus on regulatory compliance, know-your-client (KYC) and client on-boardingprocess enhancement, system stability and control and conduct.
Risks to our outlook include potential impacts on our business model from Brexit and other macro and global geopoliticaluncertainty. Risks regarding a potential deterioration of international trade relations cause further concerns. Uncertaintyaround central bank policies, ongoing regulatory developments (e.g. Basel III framework agreement) also pose risks, whilechallenges such as event risks and levels of client activity may also have an adverse impact.
37
Deutsche Bank OutlookAnnual Report 2018 Our Business Segments
Private & Commercial Bank (PCB)
PCB provides private, corporate and wealth management clients with a comprehensive range of products from standardbanking services to individual investment and financing advice. We intend to keep our focus on the transformation and growthof our core businesses in 2019. In our German home market, we aim to continue the execution of our integration plans withinDB Privat- und Firmenkundenbank AG and to deliver synergies and savings potential from the merger transaction. In ourPrivate and Commercial Business (International), we will also execute identified measures consistent with the bank’s strategy.The sale of our retail banking business in Portugal is well on track and envisaged to be closed in the first half of 2019. In ourremaining countries, we intend to continue the transformation of our businesses with the objective to improve client coverageand efficiency. In our global Wealth Management business, our emphasis will be on further transforming and growing ourglobal presence by hiring relationship managers in key markets. We also plan to continue to invest in our digital technologiesacross all business units.
Our financial outlook for 2019 assumes that net revenues remain essentially flat compared to 2018, with two opposing trends.The year-over-year revenue development will be negatively impacted by lower specific items, which we do not expect to repeatin the same magnitude as in 2018. We also expect the margin pressure on our deposit products to continue in the ongoinglow interest rate environment and that our revenue base declines associated with our business divestitures in Poland andPortugal. However, we expect to be able to compensate for these negative factors with growth in our investment and loanbusinesses. In the investment businesses, we plan to grow net new assets, continue to hire relationship managers in coremarkets and expect to be able to leverage pricing opportunities in a normalizing market environment. In the loan businesses,we plan to benefit from the growth achieved in 2018 and target to further accelerate growth in 2019 within our existing tightrisk management framework and with a focus on consumer and commercial loans.
Associated with this growth in our loan businesses, we expect higher provision for credit losses and RWA in 2019. Theincrease in RWA will also reflect the implementation of regulatory changes including effects from the ECB’s targeted reviewof internal models. Assets under management are expected to be slightly higher in 2019, in line with our growth initiatives andslightly offset by a deconsolidation impact subsequent to the announced disposal of our business in Portugal.
We expect noninterest expenses and adjusted costs in 2019 to be slightly lower compared to 2018. The decline will be drivenby further savings from our executed reorganization measures, including the merger of Deutsche Bank Privat- undGeschäftskunden AG and Postbank and the impact of our business divestitures in Poland and Portugal. Savings will be offsetin part by inflationary effects and by continued investments in targeted growth initiatives, including the further development ofour digital technologies and the further expansion of our Wealth Management franchise.
Specific risks to our outlook are slower economic growth in our major operating countries, a delayed or less pronouncedinterest rate recovery than expected, and lower client activity in the investment business. Client activity could be affected byadverse developments or market uncertainties, including higher than expected volatility in equity and credit markets. Theimplementation of regulatory requirements including consumer protection measures and delays in the implementation of ourstrategic projects could also have a negative impact on our revenues and costs.
38
Deutsche Bank 1 – Management ReportAnnual Report 2018
Asset Management (AM)
We believe that AM, with its strong and diverse investment capabilities, is well positioned to address the challenges facing theindustry and capture opportunities.
Developing economies are growing and increasing in wealth, offering new opportunities for managers as local investorsexpand their investment horizons globally. In developed markets, low interest rates are causing a shift from unmanagedassets, such as cash and deposit accounts, into managed portfolios. New digital technology, such as robo-advisory, isenhancing distribution capabilities giving investors online access, while the wider adoption of artificial intelligence is expandingproduct choice and enhancing performance. Asset managers are playing a progressively larger role in providing capital to theeconomy, taking advantage of bank retrenchment due to regulatory and capital constraints and diminished ability of nationalgovernments to fund infrastructure investment. However, pressure on fees and costs will persist, in an environment ofheightened competition and growing regulatory and compliance requirements.
Over the medium term, the industry’s global assets under management are expected to substantially increase, driven bystrong net flows in passive strategies, alternatives and multi asset solutions, as clients increasingly demand value-for-money,transparency and outcome oriented products. Due to its capabilities in active and passive products, alternative investmentsand multi asset solutions, we believe that AM is well-positioned to grow market share amid these industry growth trends. WhileAM’s digital capabilities are also creating new channels for it to distribute products and services, bottom line results areexpected to be challenged by fee compression, rising costs of regulation and competitive dynamics. In the face of thischallenge, AM intends to focus its growth initiatives on products and services where it has a competitive advantage, while alsomaintaining cost discipline.
We expect assets under management at the end of 2019 to be higher compared to the end of 2018. Net flows are expectedto be positive across all major asset classes driven by passive products, alternative investments and multi asset solutions,thereby contributing to the flow target of 3 %-5 % per annum.
We expect 2019 revenues to be essentially flat compared to 2018. Management fees are assumed to be essentially flatcompared to 2018 reflecting anticipated assets under management growth, offset by margin compression, the unfavorableimpact from net outflows in 2018 as well as the most recent market downturn during the fourth quarter of 2018. Performanceand transaction fees are expected to be lower than 2018, contributing 3 % to 5 % of our total net revenues. Other revenuesare expected to be significantly higher mainly driven by lower funding costs. While we remain constructive on equity markets,we anticipate the management fee margin to be further challenged following one of the worst equity performances ever inDecember 2018.
In 2019, we intend to continue to keep our focus on tight cost management, with the aim of achieving reduced noninterestexpenses and cost income ratio (CIR), together with slightly lower adjusted costs. We are on track to achieve our mid-termCIR target of below 65 %.
Risks to our outlook include the longevity of the bull market, continued low interests rates in developed markets, the pace ofgrowth in emerging economies growth and increase in wealth, as well as the increasing demand for retirement products indeveloped countries aging populations. Continued elevated levels of political uncertainty worldwide, protectionist and anti-trade policies, and the United Kingdom’s decision to leave the European Union could have unpredictable consequences inthe economy, market volatility and investors’ confidence, which may lead to declines in business and could affect our revenuesand profits as well as the execution of our strategic plans. In addition, the evolving regulatory framework could lead tounforeseen regulatory compliance costs and possible delays in the implementation of our efficiency measures due tojurisdictional restrictions, which could have an adverse impact on our cost base.

39
Deutsche Bank Risks and OpportunitiesAnnual Report 2018 Risks
Risks and Opportunities
The following section focuses on future trends or events that may result in downside risk or upside potential from what wehave anticipated in our “Outlook”.
Our aspirations are subject to various external and internal factors. In particular, timely and complete achievement of ourstrategic aspirations may be adversely impacted by the reduced revenue-generating capacities of some of our core businessesin the current challenging macro-economic and market environment, the ongoing headwinds posed by regulatory reformsand/or the effects on us of our legal and regulatory proceedings. Materialization of risks might (inter alia) lead to reducedprofitability negatively affecting capital accretion and dividend capacity, the opposite would most likely hold true for thematerialization of opportunities.
Risks
Macroeconomic and market conditions
If growth prospects, the interest rate environment and competition in the financial services industry worsen compared to theexpectation in our outlook, this could adversely affect our business, results of operations or strategic plans.
Rising trade tensions between key trading partners (United States (US), China and the European Union (EU)) could bedisruptive for global growth. A further escalation of US protectionism could lead to a rise in global tariffs and non-tariff barriers,affecting global trade and investment. Supply-chain disruptions would lead to a slowdown in global production, with Germany,China and other emerging markets being hit particularly hard, potentially leading to declines in business levels (e.g., in GlobalTransaction Banking) and losses across our businesses.
The euro area economy and Germany as well as Italy in particular have already entered a cyclical economic slowdown and2019 GDP growth forecasts have been revised downwards mainly to reflect the deterioration of the external environment. Thegrowth outlook could worsen further if downside risks like a severe trade war escalation or a “no-deal” Brexit materialized.
Continued elevated levels of political uncertainty, e.g. due to populist movements in major European Union member states,could have unpredictable consequences for the financial system and the economy more broadly and could contribute to anunwinding of aspects of European integration, potentially leading to declines in business levels, write-downs of assets andlosses across our businesses. Our ability to protect ourselves against these risks is limited.
We may be required to take impairments on our exposure to the sovereign debt of European and other countries if thesovereign debt crisis reignites. The credit default swaps into which we have entered to manage sovereign credit risk may notfully offset these impairments.
A substantial proportion of the assets and liabilities on our balance sheet comprise financial instruments that we carry at fairvalue, with changes in fair value recognized in our income statement. As a result of such changes, we have incurred lossesin the past, and may incur further losses in the future.
Adverse market conditions, unfavorable prices and volatility including material movements in foreign exchange rates (andresulting translation effects) as well as cautious investor and client sentiment may in the future materially and adversely affectour revenues and profits as well as the timely and complete achievement of our strategic aspirations and targets.
The direct costs and related business impacts described in this section and in our Outlook, should they be significantly greaterthan we currently expect, could impact the “available distributable items” (ADI) calculation for Deutsche Bank AG, which formsthe basis for payment capacity on our Additional Tier 1 (AT1) securities. If Deutsche Bank AG’s stand-alone results inaccordance with German accounting rules according to the German Commercial Code (Handelsgesetzbuch, HGB) do notprovide sufficient ADI, this would impact our ability to make distributions on our AT1 instruments. This could lead to higherfunding costs for us and adversely affect market perceptions of us, with potential adverse effects on our results of operationsand financial condition. Such impacts may also put increasing pressure on our capital, liquidity and other regulatory ratios.Also, if we do not report sufficient levels of distributable profits under our stand-alone financial statements in accordance withHGB, this would impact our ability to pay common equity dividends.
Any further downgrade in our credit rating could adversely affect our funding costs and business activities, although we areunable to predict to what degree this would be the case.

40
Deutsche Bank 1 – Management ReportAnnual Report 2018
Political risks
Our key political risk, among other political risks, is Brexit. The overall macro-economic impact of the United Kingdom’s (UK)decision to leave the EU is difficult to predict and depends on whether or not a withdrawal agreement can be reached. Ingeneral, we expect a prolonged period of uncertainty regarding the UK’s future status with the EU to weigh on investmentspending and economic growth. Particularly in a no-deal scenario, we could see higher market volatility and a morepronounced negative impact on economic growth in the UK and, to a lesser extent, the EU. But even in the EU, some countriesand sectors would be more affected than others depending on the level of trade and supply chain integration with the UK. Inaddition, European banks may be exposed to heightened operational and market risks as a result of “no-deal” Brexit. In certainscenarios there would be uncertainty around continuity of contracts or related to contract life cycle events. Due to the continuedlegal and regulatory uncertainty, we will not be able to fully mitigate all potential “no deal” Brexit risks such as e.g., increasedoperational risks from accelerated client migrations and more complex interim booking models. A dedicated governancestructure is in place to oversee our Brexit preparations, including management of operational and strategic issues arising froma “no deal” outcome.
Strategy
If we are unable to implement our strategy successfully including the sale of assets, which is also subject to the previouslymentioned factors, we may be unable to achieve our financial objectives, or we may incur losses or low profitability or erosionof our capital base, and our financial condition, results of operations and share price may be materially and adversely affected.
Liquidity and funding risks
Our liquidity, business activities and profitability may be adversely affected by an inability to access the debt capital markets,funds from our subsidiaries or to sell assets during periods of market-wide or firm-specific liquidity constraints. This situationmay arise due to circumstances unrelated to our businesses and outside our control, such as disruptions in the financialmarkets, or circumstances specific to us, such as reluctance of our counterparties or the market to finance our operations dueto perceptions about potential outflows resulting from litigation, regulatory and similar matters, actual or perceived weaknessesin our businesses, our business model or our strategy, as well as in our resilience to counter negative economic and marketconditions.
Further credit rating downgrades have contributed to an increase in our funding costs. Our elevated spread levels are sensitiveto further adverse developments and any future downgrade could bring our credit rating into the non-investment gradecategory. This could materially and adversely affect our funding costs, the willingness of customers to continue to do businesswith us and significant aspects of our business model. Additionally, under many of the contracts governing derivativeinstruments to which we are a party, a downgrade could require us to post additional collateral, lead to terminations of contractswith accompanying payment obligations for us or give counterparties additional remedies.
Regulatory supervisory reforms, assessments and proceedings
The regulatory reforms enacted and proposed in response to weaknesses in the financial sector together with the increasedregulatory scrutiny and discretion such as the comprehensive package of reforms published by the European Commission in2016 to further strengthen the resilience of the European Union banks will impose material costs on us, create significantuncertainty for us and may adversely affect our business plans as well as our ability to execute our strategic plans. Thosechanges that require us to maintain increased capital may significantly affect our business model, financial condition andresults of operation as well as the competitive environment generally. Other regulatory reforms, such as bank levies, may alsomaterially increase our forecasted operating costs. Regulatory reforms in respect of resolvability or resolution measures mayalso significantly impact our business operations, and lead to losses for our shareholders and creditors.
Regulators can also impose capital surcharges or regulatory adjustments, for example, as a result of the annual SupervisoryReview and Evaluation Process (SREP), to reflect additional risks posed by deficiencies in our control environment, or as aresult of supervisory inspections concerning the treatment of specific products or transactions. The ECB has used thesepowers already in its SREP Decision and may continue to do so to address findings from onsite inspections. In extreme cases,they can even suspend our permission to operate within their jurisdictions. Furthermore, implementing enhanced controls mayresult in higher regulatory compliance costs that could offset or exceed efficiency gains. Regulators may disagree with ourinterpretation of specific regulatory requirements when interpretative matters are discussed as part of our ongoing regulatorydialogue or in the context of supervisory exams. Changes in rule interpretations can have a material impact on the treatmentof positions for Pillar 1 regulatory purposes. Similarly, the evolving interpretations of the European Banking Authority (EBA)on the Capital Requirements Regulation (CRR) can also negatively impact our regulatory capital, leverage or liquidity ratios.

41
Deutsche Bank Risks and OpportunitiesAnnual Report 2018 Risks
Legal and tax proceedings
We are subject to a number of legal proceedings and tax examinations. The outcome of these proceedings is difficult toestimate and may substantially and adversely affect our planned results of operations, financial condition and reputation. Ifthese matters are resolved on terms that are more adverse to us than we expect, in terms of their costs or necessary changesto our businesses, or if related negative perceptions concerning our business and prospects and related business impactsincrease, we may not be able to achieve our strategic objectives or we may be required to change them.
Compliance and Anti-Financial Crime risks
We are also subject to regulatory reviews and investigations, the outcome of which is difficult to estimate and which maysubstantially and adversely affect our planned results of operations, financial condition and reputation. For example, onSeptember 21, 2018, the German Federal Financial Supervisory Authority (Bundesanstalt für Finanzdienstleistungsaufsicht,“BaFin”) issued an order requiring us to implement measures on specified timelines over the coming months and years toimprove our control and compliance infrastructure relating to anti-money laundering and, in particular, the know-your-client(KYC) processes in CIB, and appointed KPMG as special representative, reporting to BaFin on a quarterly basis on certainaspects of our compliance and progress with implementation of these measures. In addition, the BaFin extended the specialrepresentative’s mandate to cover the bank’s internal controls in the correspondent banking business on February 15, 2019.Our anti-money laundering and KYC processes, as well as our other internal processes that are aimed at preventing use ofour products and services for the purpose of committing or concealing financial crime and our personnel responsible for ourefforts in these areas, continue to be the subject of scrutiny by authorities in a number of jurisdictions. If we are unable tosignificantly improve our infrastructure and control environment in a timely manner, our results of operation, financial conditionand reputation could be materially and adversely affected.
Risk management policies, procedures and methods as well as operational risks
Although we have devoted significant resources to develop our risk management policies, procedures and methods, includingwith respect to market, credit, liquidity and operational risk, they may not be fully effective in mitigating our risk exposures inall economic market environments or against all types of risk, including risks that we fail to identify or anticipate.
We may face operational risks arising from failures in our internal control environment or errors in the performance of ourprocesses, e.g. in transaction processing, as well as loss of business continuity, which may disrupt our business and lead tomaterial losses.
In addition, we are also exposed to conduct risk, comprising inappropriate business practices, including selling products thatare not suitable for a particular customer, fraud, unauthorized trading and failure to comply with applicable regulations, lawsand internal policies. An employee’s misconduct reflecting fraudulent intent may lead to not only material losses but alsoreputational damage.
Impairment of Goodwill and other intangible assets
Goodwill is reviewed for impairment annually or more frequently if there are indications that impairment may have occurred.
Intangible assets are recognized separately from goodwill when they are separable or arise from contractual or other legalrights and their fair value can be measured reliably. These assets are tested for impairment or their useful lives reaffirmed atleast annually.
The determination of the recoverable amount in the impairment assessment of non-financial assets requires estimates basedon quoted market prices, prices of comparable businesses, present value or other valuation techniques, or a combinationthereof, necessitating management to make subjective judgments and assumptions. These estimates and assumptions couldresult in significant differences to the amounts reported if underlying circumstances were to change. Impairments of goodwilland other intangible assets have had and may have a material adverse effect on our profitability and results of operations.

42
Deutsche Bank 1 – Management ReportAnnual Report 2018
Deferred Tax Assets
We recognize deferred tax assets for future tax consequences attributable to temporary differences between the financialstatement carrying amounts of existing assets and liabilities and their respective tax bases, unused tax losses and unused taxcredits. To the extent that it is no longer probable that sufficient taxable income will be available to allow the benefit of part orall of that deferred tax assets to be utilized we have to reduce the carrying amounts. This accounting estimate related to thedeferred tax assets depends upon underlying assumptions that can change from period to period and requires significantmanagement judgment. Each quarter, we re-evaluate our estimate related to deferred tax assets, including our assumptionsabout future profitability. Any reductions in the amount of deferred tax assets from a change in estimate have had and mayin the future have material adverse effects on our profitability, equity and financial condition.
Digitalization
Digitalization offers new competitors such as cross-industry entrants or financial technology companies market entryopportunities. We thereby expect our businesses to have an increased need for investment in digital product and processresources to mitigate the risk of a potential loss of market share. In addition, with increasing levels of digitization, the ubiquitousaccess to banking services and the advent of new computing techniques, cyber-attacks could lead to technology failures,security breaches, unauthorized access, loss or destruction of data or unavailability of services. Any of these events couldinvolve us in litigation or cause us to suffer financial loss, disruption of our business activities, liability to our customers,government intervention or damage to our reputation, whereas the cost of managing these cyber and information securityrisks remain high. Furthermore we face the challenge to embrace and incorporate new, disruptive technologies in conjunctionwith existing technological architecture.
Opportunities
Macroeconomic and market conditions
Should economic conditions, such as GDP growth, the interest rate environment and competitive conditions in the financialservices industry improve beyond forecasted levels, this could lead to increasing revenues that may only be partially offset byadditional costs, thus improving both income before income taxes and cost-income ratio directly and subsequently improvingregulatory measures such as CET 1 and leverage ratio.
A resolution of the current tensions between the US and China would boost global trade and growth, at least in the short term.
Another upside scenario is an even better than expected performance of the US economy, e.g. if fiscal policy measures andthe tight labor market lift productivity growth and hence the potential growth rate of the economy.
If market conditions, price levels, volatility and investor sentiment develop better than expected, this may also positively impactour revenues and profits. Similarly, if we experience higher levels of customer demand and market share than anticipated,this may positively affect our results of operations.
Regulatory change
Regulatory change can encourage banks to provide better products or services that can offer opportunities for differentiationin the marketplace. For example, MiFID II requires firms to provide a high standard of transparency and best execution andwill provide Deutsche Bank the opportunity to further differentiate the bank by enhancing the services provided to its clients.
43
Deutsche Bank Risks and OpportunitiesAnnual Report 2018 Opportunities
Strategy
Our strategy seeks to enable us to materially improve returns to shareholders over time and deploy our balance sheet andother resources to the highest return activities consistent with our client franchise and risk appetite. The implementation of ourstrategy may create further opportunities if implemented to a greater extent or under more favorable conditions thananticipated. If businesses and processes improve beyond our planning assumptions and cost efficiencies can be realizedsooner or to a greater extent than forecasted, this could also positively impact our results of operations.
By investing in our areas of core strengths we expect to pursue our strategy of targeted growth. Within the Corporate &Investment Bank we seek to continue to grow revenues in Global Transaction Banking and FX to bolster our core franchise.Similarly we anticipate implementing a targeted hiring strategy in fixed income and debt origination. For the Private andCommercial Bank, our focus remains on consumer finance and our Mittelstand customer segment, and on seeking growthwithin Wealth Management core markets. Asset Management, including the DWS legal entities, have set a strategy to pursuewith targeted growth in Americas and Asia and anticipate launching new products in active, alternatives and responsibleinvesting.
Digitalization
Digitalization offers various revenue opportunities to increase monetization on existing and acquire new customer groups byexpanding our own portfolio of products and engaging in product partnerships with third parties, thereby potentially benefitingfrom a shorter time-to-market. Market trends such as the platform economy, matching internal and external products withcustomer demands and transacting through one central platform, and open banking provide a clear opportunity for us toposition ourselves as a strong player in these ecosystems. The goal is to develop an ecosystem of comprehensive services,with different components developed by different firms for areas like retail deposit marketplace, automated financial planningservices (robo-advisor), and insurance recommendation services. Furthermore, we have an opportunity to expand our datacapabilities, to improve personalized services for a better customer experience as well as to embrace disruptive technologiessuch as artificial intelligence to build out our service offering. Our large geographic outreach allows us to scale productsglobally. Particularly in the Private & Commercial Bank, we intend to build an ecosystem by accelerating digital growth in ourcore offering of consumer and investment products, as well as tap into additional markets with new near- and beyond bankingofferings.
On the cost side, digitization offers our divisions an opportunity for significant efficiency gains. By investing in digitalapplications such as digital client self-boarding, front-to-back processes can be automated and the productivity increased.Development of strong data capabilities will enhance our ability to make accurate predictions about client and market behavior,reducing fraud and pricing products more efficiently, while complying with regulatory obligations using latest technologies.

Risk Report
45 Introduction
46 Risk and Capital Overview46 Key Risk Metrics47 Overall Risk Assessment48 RiskProfile
50 Risk and Capital Framework50 Risk Management Principles51 Risk Governance54 Risk Appetite and Capacity54 Risk and Capital Plan56 Stress Testing58 Recovery and Resolution Planning
60 Risk and Capital Management60 Capital Management60 Resource Limit Setting61 RiskIdentificationandAssessment61 Credit Risk Management72 Market Risk Management 78 Operational Risk83 Liquidity Risk Management87 Business (Strategic) Risk Management89 Reputational Risk Management89 RiskConcentrationandRiskDiversification
90 Risk and Capital Performance90 Capital, Leverage Ratio104 Credit Risk Exposure123 Asset Quality136 Trading Market Risk Exposures140 Nontrading Market Risk Exposures142 Operational Risk Exposure143 Liquidity Risk Exposure

45
Deutsche Bank IntroductionAnnual Report 2018 Disclosures according to principles and recommendations of the Enhanced Disclosure Task Force
(EDTF)
Introduction
Disclosures in line with IFRS 7 and IAS 1The following Risk Report provides qualitative and quantitative disclosures about credit, market and other risks in line with therequirements of International Financial Reporting Standard 7 (IFRS 7) Financial Instruments: Disclosures, and capitaldisclosures required by International Accounting Standard 1 (IAS 1) Presentation of Financial Statements. It also considersthe changes following the adoption of IFRS 9 with regards to classification and measurement and impairment and includesthe related impacts on key ratios, like regulatory capital and risk-weighted assets (RWA) at Deutsche Bank. Further detailsspecific to IFRS 9 can be found further below in this report, specifically in the Credit Risk Management and Model section, inthe Credit Risk Mitigation section, in the Asset Quality section and in Note 1 “Significant accounting policies and criticalaccounting estimates” as well as Note 2 “Recently adopted and new accounting pronouncements” to the consolidated financialstatements. Information which forms part of and is incorporated by reference into the financial statements of this report ismarked by a bracket in the margins throughout this Risk Report.
Disclosures according to Pillar 3 of the Basel 3 CapitalFrameworkMost disclosures according to Pillar 3 of the Basel 3 Capital Framework, which are implemented in the European Union bythe Regulation (EU) No 575/2013 on prudential requirements for credit institutions and investment firms (Capital RequirementsRegulation or CRR) and supported by EBA Implementing Technical Standards or the “Final Report on the Guidelines onDisclosure Requirements under Part Eight of Regulation (EU) No 575/2013” (“EBA Guideline”, EBA/GL/2016/11, version 2*)are published in our additional Pillar 3 report, which can be found on our website. In cases where disclosures in this RiskReport also support Pillar 3 disclosure requirements these are highlighted by references from the Pillar 3 Report into the RiskReport.
Disclosures according to principles and recommendations ofthe Enhanced Disclosure Task Force (EDTF)In 2012 the Enhanced Disclosure Task Force (“EDTF”) was established as a private sector initiative under the auspices of theFinancial Stability Board (“FSB”), with the primary objective to develop fundamental principles for enhanced risk disclosuresand to recommend improvements to existing risk disclosures. As a member of the EDTF we adhere to the disclosurerecommendations in this Risk Report and also in our additional Pillar 3 Report.

46
Deutsche Bank 1 – Management ReportAnnual Report 2018
Risk and capital overview
Key risk metricsThe following selected key risk ratios and corresponding metrics form part of our holistic risk management across individualrisk types. The Common Equity Tier 1 Ratio (CET 1), Internal Capital Adequacy Ratio (ICA), Leverage Ratio (LR), MinimumRequirement for Own Funds and Eligible Liabilities (MREL), Liquidity Coverage Ratio (LCR), and Stressed Net LiquidityPosition (sNLP) serve as high level metrics and are fully integrated across strategic planning, risk appetite framework, stresstesting (except LCR and MREL), and recovery and resolution planning practices, which are reviewed and approved by ourManagement Board at least annually. The CET 1, LR, Leverage Exposure, MREL, LCR and Risk-Weighted-Assets ratios andmetrics, which are regulatory defined, are based on the fully loaded rules under the Regulation (EU) No 575/2013 on prudentialrequirements for credit institutions and investment firms (Capital Requirements Regulation or “CRR”) and the directive2013/36/EU on access to the activity of credit institutions and the prudential supervision of credit institutions and investmentfirms (Capital Requirements Directive 4 or “CRD 4”). MREL is based on the Single Resolution Mechanism (SRM) regulationas well as respective communication by the Single Resolution Board (SRB). ICA, Economic Capital and SNLP are DeutscheBank specific internal risk metrics in addition to the above described regulatory metrics.
Common Equity Tier 1 Ratio31.12.2018 13.6 %31.12.2017 14.0 %
Internal Capital Adequacy Ratio¹31.12.2018 196 %31.12.2017 192 %
Leverage Ratio31.12.2018 4.1 %31.12.2017 3.8 %
Minimum requirement for own funds and eligible liabilities (MREL)31.12.2018 11.1 %
Liquidity Coverage Ratio31.12.2018 140 %31.12.2017 140 %
Total Risk-Weighted Assets31.12.2018 € 350.4 bn31.12.2017 € 344.2 bn
Total Economic Capital²31.12.2018 € 26.1 bn31.12.2017 € 27.1 bn
Leverage Exposure31.12.2018 € 1,273 bn31.12.2017 € 1,395 bn
Stressed Net Liquidity Position (sNLP)31.12.2018 € 48.1 bn31.12.2017 € 32.6 bn
1 The definition of capital supply for the purpose of calculating the internal capital adequacy ratio has been changed to take a perspective that aims at maintaining the viability ofDeutsche Bank on an ongoing basis. More information is provided in section “Internal Capital Adequacy”.
2 The quantile used to measure the economic capital demand has been changed from 99.98 % to 99.9 % to take a perspective that aims at maintaining the viability of DeutscheBank on an ongoing basis in alignment with the change of the definition of capital supply. More information is provided in section “Internal Capital Adequacy”. An overview ofthe quantitative impact of the quantile change on the economic capital is provided in section “Risk Profile”.
For further details please refer to sections “Risk profile”, “Risk appetite and capacity”, “Risk and capital plan”, “Stress testing”,“Recovery and resolution planning”, “Risk and capital management”, “Capital, leverage ratio and MREL” (for phase-in andfully loaded figures), “Liquidity coverage ratio”, and “Stress testing and scenario analysis”.

47
Deutsche Bank Risk and capital overviewAnnual Report 2018 Overall risk assessment
Overall risk assessmentKey risk types include credit risk (including default, migration, transaction, settlement, exposure, country, mitigation andconcentration risks), market risk (including interest rate, foreign exchange, equity, credit spread, commodity and cross-asset& other risks), liquidity risk, business risk (including tax and strategic risk), cross risk, reputational risk and operational risk(with important sub-categories like compliance, legal, model, information security, fraud, and money laundering risks). Wemanage the identification, assessment and mitigation of top and emerging risks through an internal governance process andthe use of risk management tools and processes. Our approach to identification and impact assessment aims to ensure thatwe mitigate the impact of these risks on our financial results, long-term strategic goals and reputation. Please refer to thesection "Risk and capital management" for detailed information on the management of our material risks.
As part of our regular analysis, sensitivities of the key portfolio risks are reviewed using a bottom-up risk assessment,complemented by a top-down macro-economic and political scenario analysis. This two-pronged approach allows us tocapture risk drivers that have an impact across our risk portfolios and business divisions as well as those relevant to specificportfolios.
Global growth concerns fueled a sharp deterioration in risk sentiment coming into the end of 2018, with equities falling sharplyand credit spreads widening. The global economic outlook has softened but in a baseline growth is expected to remain solid.In developed markets, the US economy is expected to continue growing at a strong and above-trend rate while Europe isexpected to see a further slowdown in 2019. The picture in emerging markets is mixed with growth in China expected tomoderate further.
Key downside risks include Brexit, where the risks of the UK leaving the EU without a withdrawal agreement are rising followingthe defeat of Prime Minister May’s Brexit deal and the UK parliament’s decision to seek a renegotiation of the backstop. Adisorderly Brexit could aggravate the already softer economic outlook in the UK and Europe. Tensions between Italy andBrussels and an escalation of the yellow vest movement in France are potential additional sources of political risk in Europe.The potential for an escalation in global trade conflict also remains a key source of global downside risk.
The assessment of the potential impacts of these risks is made through, inter alia, portfolio reviews and group-wide stresstests which assess our ability to absorb events should they occur. The results of these tests showed that the currently availablecapital and liquidity reserves, in combination with available mitigation measures, would allow us to absorb the impact of theserisks if they were to materialize in line with the tests’ parameters. Information about risk and capital positions for our portfolioscan be found in the “Risk and capital performance” section.
The overall focus of risk and capital management is on maintaining our risk profile in line with our risk strategy and supportingour strategic management initiatives with a focus on-balance sheet optimization.
48
Deutsche Bank 1 – Management ReportAnnual Report 2018
Risk profileThe table below shows our overall risk position as measured by the economic capital usage calculated for credit, market,operational and business risk for the dates specified. To determine our overall (economic capital) risk position, we generallyconsider diversification benefits across risk types.
Overall risk position as measured by economic capital usage by risk type2018 increase (decrease)
from 2017in € m.(unless stated otherwise) Dec 31, 2018 Dec 31, 2017 in € m. in %Credit risk 10,610 10,769 (159) (1)Market risk 10,341 10,428 (87) (1)
Trading market risk 4,046 3,800 246 6Nontrading market risk 6,295 6,628 (333) (5)
Operational risk 7,359 7,329 30 0Business risk 4,758 5,677 (918) (16)Diversification benefit¹ (6,960) (7,074) 114 (2)Total economic capital usage 26,108 27,129 (1,020) (4)1 Diversification benefit across credit, market, operational and strategic risk (largest part of business risk).
As of December 31, 2018, our economic capital usage amounted to € 26.1 billion, which was € 1.0 billion or 4 % lower than€ 27.1 billion economic capital usage as of December 31, 2017.
The economic capital usage for credit risk as of December 31, 2018 was € 0.2 billion or 1 % lower compared to year-end 2017mainly due to a lower counterparty credit risk component and smaller increases in settlement and transfer risk components.The change in counterparty credit risk is mainly due to reductions in exposures from derivatives and securities financingtransactions, partly offset by increases in lending, whereas the increases for settlement and transfer risk are largely driven bymodel overlays related to changes in methodology.
The economic capital usage for trading market risk increased to € 4.0 billion as of December 31, 2018, compared to € 3.8billion at year-end 2017. The increase was primarily driven by a model enhancement to better capture the tail risk in thestressed period, which was partly offset by a reduction in the traded default risk component due to reductions in inventory.The nontrading market risk economic capital usage decreased by € 0.3 billion or 5 % compared to December 31, 2017. Thedecrease was mainly driven by an accounting methodology change due to IFRS 9 becoming effective and diversificationeffects.
The operational risk economic capital usage totaled € 7.4 billion as of December 31, 2018, which was € 30 million or 0.4 %higher than the € 7.3 billion economic capital usage as of December 31, 2017. In line with the development of our RWA foroperational risk, the increase was driven by several, largely offsetting effects. A lighter loss profile feeding into our capitalmodel and a number of model improvements, mostly from recalibrations of data weights, reduced our capital demand foroperational risk. The decrease has been compensated by our reduced budgeted expected losses for operational risk. For adetailed description see the section “Operational Risk Management”.
Our business risk economic capital methodology captures strategic risk, which also implicitly includes elements of non-standard risks including refinancing and reputational risk, a tax risk component and a capital charge for IFRS deferred taxassets on temporary differences. The business risk decreased to € 4.8 billion as of December 31, 2018 which was € 0.9 billionor 16 % lower compared to € 5.7 billion as of December 31, 2017. The decrease is due to a lower economic capital usage forthe strategic risk component of € 1.1 billion driven by a better earnings outlook in our plan for 2019 compared to the one for2018 in the previous year which was partially offset by higher economic capital usage from IFRS deferred tax assets ontemporary differences of € 0.1 billion.
The inter-risk diversification benefit of the economic capital usage across credit, market, operational and strategic riskdecreased by € 0.1 billion mainly due to a lower economic capital usage for the strategic risk component.
Our mix of business activities results in diverse risk taking by our business divisions. We also measure the key risks inherentin their respective business models through the total economic capital metric, which mirrors each business division’s riskprofile and takes into account cross-risk effects at group level.

49
Deutsche Bank Risk and capital overviewAnnual Report 2018 Risk profile
Risk profile of our business divisions as measured by economic capitalDec 31, 2018
in € m. (unlessstated otherwise)
Corporate &Investment
Bank
Private &Commercial
BankAsset
ManagementCorporate &
Other TotalTotal
(in %)Credit Risk 6,340 3,537 52 681 10,610 41Market Risk 4,760 1,124 370 4,088 10,341 40Operational Risk 6,092 866 401 0 7,359 28Business Risk 3,521 29 0 1,208 4,758 18Diversification Benefit¹ (5,371) (933) (231) (424) (6,960) (27)Total EC 15,341 4,623 592 5,552 26,108 100Total EC in % 59 18 2 21 100 N/MN/M – Not meaningful1 Diversification benefit across credit, market, operational and strategic risk (largest part of business risk).
Dec 31, 2017¹
in € m. (unlessstated otherwise)
Corporate &Investment
Bank
Private &Commercial
BankAsset
ManagementCorporate &
Other TotalTotal
(in %)Credit Risk 6,519 3,596 62 591 10,769 40Market Risk 4,679 1,386 310 4,054 10,428 38Operational Risk 5,995 932 402 0 7,329 27Business Risk 4,435 10 99 1,133 5,677 21Diversification Benefit² (5,450) (950) (264) (410) (7,074) (26)Total EC 16,178 4,974 609 5,368 27,129 100Total EC in % 60 18 2 20 100 N/MN/M – Not meaningful1 Amounts allocated to the business segments have been restated to reflect comparatives according to the structure as of December 31, 2018.2 Diversification benefit across credit, market, operational and strategic risk (largest part of business risk).
Corporate & Investment Bank’s (CIB) risk profile is dominated by its trading activities to support origination, structuring andmarket making activities, which gives rise to all major risk types. Credit risk is broadly distributed across business units butmost prominent in Global Credit Trading, Rates, Trade Finance, and Leveraged Debt Capital Markets. The share of operationalrisk in CIB’s risk profile reflects a high loss profile in the industry combined with internal losses and has only slightly increasedcompared to the year-end 2017. Market risk arises mainly from its trading and market making activities. The remainder ofCIB’s risk profile is derived from business risk reflecting earnings volatility risk. The economic capital usage for CIB decreasedcompared to the year-end 2017, mainly due to lower economic capital usage for the strategic risk component, primarily dueto an updated strategic plan which reflected moderate improvement in planned operating income.
Private & Commercial Bank’s (PCB) risk profile comprises credit risk from retail, small and medium-sized enterprises lendingand wealth management activities as well as nontrading market risk from investment risk, interest rate risk, including riskarising from modelling of client deposits and credit spread risk. There was no significant change for economic capital usageacross credit, operational and strategic risk compared to the year-end 2017 and lower economic capital usage for market riskrelated to reductions in exposure to investment risk and interest rate risk.
Asset Management (AM), as a fiduciary asset manager, invests money on behalf of clients. As such, risk are primarily of afiduciary nature and hence operationally driven. Nontrading market risk, however, does arise on guarantee products and co-investments in our funds. There was no significant change for economic capital usage compared to the year-end 2017.
Corporate & Other (C&O) mainly comprises nontrading market risk for structural foreign exchange risk, pension risk and equitycompensation risk. The economic capital usage for credit and business risk increased compared to the year-end 2017 mainlydue to a higher economic capital usage for transfer risk and IFRS deferred tax assets from temporary differences.
50
Deutsche Bank 1 – Management ReportAnnual Report 2018
Risk and capital framework
Risk management principlesThe diversity of our business model requires us to identify, assess, measure, aggregate and manage our risks, and to allocateour capital among our businesses. Our aim is to help reinforce our resilience by encouraging a holistic approach to themanagement of risk and return throughout our organization as well as the effective management of our risk, capital andreputational profile. We actively take risks in connection with our business. The following principles underpin our riskmanagement framework:
– Risk is taken within a defined risk appetite;– Every risk taken needs to be approved within the risk management framework;– Risk taken needs to be adequately compensated; and– Risk should be continuously monitored and managed.
Risk and capital are managed via a framework of principles, organizational structures and measurement and monitoringprocesses that are closely aligned with the activities of the divisions and business units:
– Core risk management responsibilities are embedded in the Management Board and delegated to senior risk managersand senior risk management committees responsible for execution and oversight.
– We operate a Three Lines of Defense (“3LoD”) risk management model, in which risk, control and reporting responsibilitiesare defined.
– The 1st Line of Defense (“1st LoD”) refers to those roles in the Bank whose activities generate risks, whether financial ornon-financial, and who own the risks that are generated in their respective organizations. The 1st LoD manages these riskswithin the defined risk appetite and ensures that organization, governance and structures are in place to identify, monitor,assess and accept or mitigate the risks they generate or are exposed to.
– The 2nd Line of Defense (“2nd LoD”) refers to the risk type controller roles in the Bank who facilitate the implementation ofa sound risk management framework throughout the organization. The 2nd LoD defines the risk appetite and riskmanagement and control standards for their risk type, and independently oversees and challenges the risk taking and riskmanagement activities of the 1st LoD.
– The 3rd Line of Defense (“3rd LoD”) is Group Audit, which is accountable for providing independent and objective assuranceon the adequacy of the design and effectiveness of the systems of internal control and risk management.
– The risk strategy is approved by the Management Board on an annual basis and is defined based on the Group RiskAppetite and the Strategic and Capital Plan in order to align risk, capital and performance targets.
– Cross-risk analysis reviews are conducted across the Group to validate that sound risk management practices and a holisticawareness of risk exist.
– All material risk types, including credit risk, market risk, operational risk, liquidity risk, business risk and reputational risk,are managed via risk management processes. Modeling and measurement approaches for quantifying risk and capitaldemand are implemented across the material risk types. For more details, refer to section “Risk and Capital Management”for the management processes of our material risks.
– Monitoring, stress testing tools and escalation processes are in place for key capital and liquidity thresholds and metrics.– Systems, processes and policies are critical components of our risk management capability.– Recovery and contingency planning provides the escalation path for crisis management and supplies senior management
with a set of actions designed to improve the capital and liquidity positions in a stress event.– Resolution planning is the responsibility of our resolution authority, the Single Resolution Board. It provides a strategy to
manage Deutsche Bank in case of default. It is designed to prevent major disruptions to the financial system or the widereconomy through maintaining critical services.
– We apply an integrated risk management approach that aims at Group-wide consistency in risk management standards,while allowing for adaptation to local or legal entity specific requirements.
51
Deutsche Bank Risk and capital frameworkAnnual Report 2018 Risk governance
We promote a strong risk culture where employees at all levels are responsible for the management and escalation of risksand are empowered and encouraged to act as risk managers. We expect employees to exhibit behaviors that support a strongrisk culture in line with our Code of Conduct. To promote this, our policies require that risk-related behavior is taken intoaccount during our performance assessment and compensation processes. This expectation continues to be reinforcedthrough communications campaigns and mandatory training courses for all DB employees. In addition, our Management Boardmembers and senior management frequently communicate the importance of a strong risk culture to support a consistent tonefrom the top.
A standards-based assessment of risk culture, in particular focusing on risk awareness, risk ownership and management ofrisk within risk appetite has been undertaken. Assessment results are incorporated into existing risk reporting, reinforcing themessage that risk culture is an integral part of effective day-to-day risk management.
Risk governanceOur operations throughout the world are regulated and supervised by relevant authorities in each of the jurisdictions in whichwe conduct business. Such regulation focuses on licensing, capital adequacy, liquidity, risk concentration, conduct of businessas well as organizational and reporting requirements. The European Central Bank (the “ECB”) in connection with thecompetent authorities of EU countries which joined the Single Supervisory Mechanism via the Joint Supervisory Team act incooperation as our primary supervisors to monitor our compliance with the German Banking Act and other applicable lawsand regulations as well as the CRR/CRD 4 framework and respective implementations into German law.
European banking regulators assess our capacity to assume risk in several ways, which are described in more detail in thesection “Regulatory Capital” of this report.
Several layers of management provide cohesive risk governance:
– The Supervisory Board is informed regularly on our risk situation, risk management and risk controlling, as well as on ourreputation and material litigation cases. It has formed various committees to handle specific tasks (for a detailed descriptionof these committees, please see the “Corporate Governance Report” under “Management Board and Supervisory Board”,“Standing Committees”).
– At the meetings of the Risk Committee, the Management Board reports on key risk portfolios, on risk strategy and onmatters of special importance due to the risks they entail. It also reports on loans requiring a Supervisory Board resolutionpursuant to law or the Articles of Association. The Risk Committee deliberates with the Management Board on issues ofthe overall risk appetite, aggregate risk position and the risk strategy and supports the Supervisory Board in monitoring theimplementation of this strategy.
– The Integrity Committee, among other responsibilities, monitors the Management Board’s measures that promote thecompany’s compliance with legal requirements, authorities’ regulations and the company’s own in-house policies. It alsoreviews the Bank’s Code of Business Conduct and Ethics, and, upon request, supports the Risk Committee in monitoringand analyzing the Bank’s legal and reputational risks.
– The Audit Committee, among other matters, monitors the effectiveness of the risk management system, particularly theinternal control system and the internal audit system.
– The Management Board is responsible for managing Deutsche Bank Group in accordance with the law, the Articles ofAssociation and its Terms of Reference with the objective of creating sustainable value in the interest of the company, thustaking into consideration the interests of the shareholders, employees and other stakeholders. The Management Board isresponsible for establishing a proper business organization, encompassing appropriate and effective risk management.The Management Board established the Group Risk Committee (“GRC”) as the central forum for review and decision onmaterial risk and capital-related topics. The GRC generally meets once a week. It has delegated some of its duties toindividuals and sub-committees. The GRC and its sub-committees are described in more detail below.

52
Deutsche Bank 1 – Management ReportAnnual Report 2018
Risk management governance structure of the Deutsche Bank Group
The following functional committees are central to the management of risk at Deutsche Bank:
– The Group Risk Committee (GRC) has various duties and dedicated authority, including approval of new or materiallychanged risk and capital models, review of high-level risk portfolios, risk exposure developments, and internal andregulatory Group-wide stress testing results, and monitoring of risk culture across the Group. The GRC sets risk appetitetargets, for example in the form of limits or thresholds. In addition, the GRC reviews and recommends items forManagement Board approval, such as key risk management principles, the Group Recovery Plan and the ContingencyFunding Plan, over-arching risk appetite parameters, and recovery and escalation indicators. The GRC also supports theManagement Board during Group-wide risk and capital planning processes.
– The Non-Financial Risk Committee (NFRC) oversees, governs and coordinates the management of non-financial risks inDeutsche Bank Group and establishes a cross-risk and holistic perspective of the key non-financial risks of the Group,including conduct and financial crime risk. It is tasked to define the non-financial risk appetite tolerance framework, tomonitor and control the effectiveness of the non-financial risk operating model (including interdependencies betweenbusiness divisions and control functions), and to monitor the development of emerging non-financial risks relevant for theGroup.
– The Group Reputational Risk Committee (GRRC) is responsible for the oversight, governance and coordination ofreputational risk management and provides for a look-back and a lessons learnt process. It reviews and decides allreputational risk issues escalated by the Regional Reputational Risk Committees (“RRRCs”) and RRRC decisions whichhave been appealed by the business divisions, infrastructure functions or regional management. It provides guidance onGroup-wide reputational risk matters, including communication of sensitive topics, to the appropriate levels of DeutscheBank Group. The RRRCs which are sub-committees of the GRRC, are responsible for the oversight, governance andcoordination of the management of reputational risk in the respective regions on behalf of the Management Board.
– The Enterprise Risk Committee (ERC) has been established with a mandate to focus on enterprise-wide risk trends, eventsand cross-risk portfolios, bringing together risk experts from various risk disciplines. As part of its mandate, the ERCapproves the enterprise risk inventory, certain country and industry threshold increases, and scenario design outlines formore severe group-wide stress tests as well as reverse stress tests. It reviews group-wide stress test results in accordancewith risk appetite, reviews the risk outlook, emerging risks and topics with enterprise-wide risk implications like risk culture.
– The Financial Resource Management Council (FRMC) is an ad-hoc governance body, chaired by the Chief Financial Officerand Chief Risk Officer with delegated authority from the Management Board, to oversee financial crisis management at thebank. The FRMC provides a single forum to oversee execution of both the Contingency Funding Plan and the GroupRecovery Plan. The council recommends upon mitigating actions to be taken in a time of anticipated or actual capital or
Management BoardOverall Risk and Capital Management Supervision
Supervisory Board
Enterprise RiskCommittee
Oversight and decision-makingon financial risks and cross risks,
including definition & review ofstress tests, and management of
group-wide risk patterns
Financial ResourceManagement Council
Supports the decision-making in a periodof anticipated or actual capital or liquidity
stress as a forum to discuss andrecommend mitigating actions
Audit CommitteeMonitors the effectiveness of the risk
management system, particularly of theinternal control system and the internal
audit system
Risk CommitteeAdvises on overall risk appetite and/or
risk strategy and monitors strategyimplementation by the management.Discusses the risk strategy, key risk
topics and portfolios
Integrity CommitteeMonitors compliance with legal
requirements, authorities‘ regulation andin-house policies. Precautionary
monitoring and strategic analysis of legaland reputational risk
Non-Financial RiskCommittee
Ensures oversight, governance andcoordination of non-financial riskmanagement and establishes a
cross-risk and holistic perspectiveof key non-financial risks
Group ReputationalRisk CommitteeEnsures the oversight,
governance and coordinationof the reputational risk
management
Group Risk CommitteeEvaluates and classifies risks,sets rules for risk management,risk appetite planning & steering
and monitors risks
Group Asset & LiabilityCommittee
Optimizes the sourcing and deployment ofthe bank's balance sheet and financialresources, within the overarching risk
appetite
53
Deutsche Bank Risk and capital frameworkAnnual Report 2018 Risk governance
liquidity stress. Specifically, the FRMC is tasked with analyzing the bank’s capital and liquidity position, in anticipation of astress scenario recommending proposals for capital and liquidity related matters, and ensure execution of decisions.
– The Group Asset & Liability Committee has been established by the Management Board in 2018. Its mandate is to optimizethe sourcing and deployment of the bank’s balance sheet and financial resources within the overarching risk appetite setby the Management Board.
Our Chief Risk Officer (CRO), who is a member of the Management Board, has Group-wide, supra-divisional responsibility forthe management of all credit, market, liquidity and operational risks as well as for the continuing development andenhancement of methods for risk measurement. In addition, the CRO is responsible for monitoring, analyzing and reportingrisk on a comprehensive basis.
The CRO has direct management responsibility for the Risk function. Risk management & control duties in the Risk functionare generally assigned to specialized risk management units focusing on the management of
– Specific risk types– Risks within a specific business– Risks in a specific region.
These specialized risk management units generally handle the following core tasks:
– Foster consistency with the risk appetite set by the GRC within a framework established by the Management Board andapplied to Business Divisions;
– Determine and implement risk and capital management policies, procedures and methodologies that are appropriate to thebusinesses within each division;
– Establish and approve risk limits;– Conduct periodic portfolio reviews to keep the portfolio of risks within acceptable parameters; and– Develop and implement risk and capital management infrastructures and systems that are appropriate for each division.
Additionally, Business Aligned Risk Management (BRM) represents the Risk function vis-à-vis specific business areas. TheCROs for each business division manage their respective risk portfolio, taking a holistic view of each division to challenge andinfluence the division’s strategy and risk ownership and implement risk appetite.
The specialized risk management functions are complemented by our Enterprise Risk Management (ERM) function, whichsets a bank-wide risk management framework seeking to ensure that all risks at the Group and Divisional level are identified,owned and assessed for materiality. Material risks are owned and controlled by functional (usually 1st LoD) risk teams withinthe agreed risk appetite and risk management principles. ERM is responsible for aggregating and analyzing enterprise-widerisk information, including review of the risk/return profiles of portfolios to support informed strategic decision-making regardingthe effective application of the Bank’s resources. ERM has the mandate to:
– Manage enterprise risk appetite at Group level, including the framework and methodology as to how appetite is appliedacross risk types, divisions, businesses and legal entities;
– Integrate and aggregate risks to provide greater enterprise risk transparency to support decision making;– Commission forward-looking stress tests and manage Group recovery and resolution plans; and– Govern and improve the effectiveness of the risk management framework.
The specialized risk management functions and ERM have a reporting line to the CRO.
While operating independently from each other and the business divisions, our Finance and Risk functions have the jointresponsibility to quantify and verify the risk that we assume.
In May 2018, we fully merged our subsidiary Deutsche Postbank AG into the subsidiary DB PGK AG, to form “DB Privat- undFirmenkundenbank AG” (DB PFK AG). As a result, the existing joint risk management for the previously individual subsidiarieshas been adjusted to reflect the new setup and size of the entity. The joint risk management of our enlarged subsidiary DBPFK AG is promoted through harmonized processes for identifying, assessing, managing, monitoring, and communicatingrisk, the strategies and procedures for determining and safeguarding risk-bearing capacity, and corresponding internal controlprocedures as well as joint governance.
54
Deutsche Bank 1 – Management ReportAnnual Report 2018
Key features of the adjusted setup are:
– Established DB PFK AG Risk Management structure which continues to have additional functional reporting lines intoDeutsche Bank AG Risk
– Involvement of the central DB PFK AG Risk Committee in the Group Risk Committee through mutual memberships– Extension of selected risk committees of DB PFK AG to include voting members of relevant risk functions of Deutsche
Bank AG, and vice versa– Alignment to key Group risk policies– Joint DB PFK AG reporting across the merged portfolios for all risk types and inclusion of DB PFK AG in the Group Risk
and Capital Profile– Independent DB PFK AG business and risk strategy aligned with and embedded in the Group Risk Appetite Framework,
Strategy and Policies
Risk appetite and capacityRisk appetite expresses the aggregate level of risk that we are willing to assume to achieve our strategic objectives, as definedby a set of quantitative metrics and qualitative statements. Risk capacity is defined as the maximum level of risk we canassume given our capital and liquidity base, risk management and control capabilities, and our regulatory constraints.
Risk appetite is an integral element in our business planning processes via our risk strategy and plan, to promote theappropriate alignment of risk, capital and performance targets, while at the same time considering risk capacity and appetiteconstraints from both financial and non-financial risks. Compliance of the plan with our risk appetite and capacity is also testedunder stressed market conditions. Top-down risk appetite serves as the limit for risk-taking for the bottom-up planning fromthe business functions.
The Management Board reviews and approves our risk appetite and capacity on an annual basis, or more frequently in theevent of unexpected changes to the risk environment, with the aim of ensuring that they are consistent with our Group’sstrategy, business and regulatory environment and stakeholders’ requirements.
In order to determine our risk appetite and capacity, we set different group level triggers and thresholds on a forward lookingbasis and define the escalation requirements for further action. We assign risk metrics that are sensitive to the material risksto which we are exposed and which are able to function as key indicators of financial health. In addition to that, we link ourrisk and recovery management governance framework with the risk appetite framework.
Reports relating to our risk profile as compared to our risk appetite and strategy and our monitoring thereof are presentedregularly up to the Management Board. In the event that our desired risk appetite is breached, a predefined escalationgovernance matrix is applied so these breaches are highlighted to the respective committees.
Risk and capital plan
Strategic and capital plan
We conduct annually an integrated strategic planning process which lays out the development of our future strategic directionfor us as a Group and for our business areas. The strategic plan aims to create a holistic perspective on capital, funding andrisk under risk-return considerations. This process translates our long-term strategic targets into measurable short- to medium-term financial targets and enables intra-year performance monitoring and management. Thereby we aim to identify growthoptions by considering the risks involved and the allocation of available capital resources to drive sustainable performance.Risk-specific portfolio strategies complement this framework and allow for an in-depth implementation of the risk strategy onportfolio level, addressing risk specifics including risk concentrations.
The strategic planning process consists of two phases: a top-down target setting and a bottom-up substantiation.
In a first phase – the top-down target setting – our key targets for profit and loss (including revenues and costs), capital supply,capital demand as well as leverage, funding and liquidity are discussed for the group and the key business areas. In thisprocess, the targets for the next five years are based on our global macro-economic outlook and the expected regulatoryframework. Subsequently, the targets are approved by the Management Board.

55
Deutsche Bank Risk and capital frameworkAnnual Report 2018 Risk and capital plan
In a second phase, the top-down objectives are substantiated bottom-up by detailed business unit plans, which consist of amonth by month operative plan; years two and three are planned per quarter and years four and five are annual plans. Theproposed bottom-up plans are reviewed and challenged by Finance and Risk and are discussed individually with the businessheads. Thereby, the specifics of the business are considered and concrete targets decided in line with our strategic direction.The bottom-up plans include targets for key legal entities to review local risk and capitalization levels. Stress tests complementthe strategic plan to also consider stressed market conditions.
The resulting Strategic and Capital Plan is presented to the Management Board for discussion and approval. The final plan ispresented to the Supervisory Board.
The Strategic and Capital Plan is designed to support our vision of being a leading European bank with a global reachsupported by a strong home base in Germany and aims to ensure:
– Balanced risk adjusted performance across business areas and units;– High risk management standards with focus on risk concentrations;– Compliance with regulatory requirements;– Strong capital and liquidity position; and– Stable funding and liquidity strategy allowing for business planning within the liquidity risk appetite and regulatory
requirements.
The Strategic and Capital Planning process allows us to:
– Set earnings and key risk and capital adequacy targets considering the bank’s strategic focus and business plans;– Assess our risk-bearing capacity with regard to internal and external requirements (i.e., economic capital and regulatory
capital); and– Apply an appropriate stress test to assess the impact on capital demand, capital supply and liquidity.
All externally communicated financial targets are monitored on an ongoing basis in appropriate management committees. Anyprojected shortfall versus targets is discussed together with potential mitigating strategies with the aim to ensure that weremain on track to achieve our targets. Amendments to the strategic and capital plan must be approved by the ManagementBoard. Achieving our externally communicated solvency targets ensures that we also comply with the Group SupervisoryReview and Evaluation Process (SREP) requirements as articulated by our home supervisor. Deutsche Bank was informedby the ECB of its decision regarding prudential minimum capital requirements for 2019 that apply from March 1, 2019 onwards,following the results of the 2018 SREP. The decision requires Deutsche Bank to maintain a CET 1 ratio of at least 11.82 %on a consolidated basis. This CET 1 capital requirement comprises the Pillar 1 minimum capital requirement of 4.50 %, thePillar 2 requirement (SREP add-on) of 2.75 %, the capital conservation buffer of 2.50 %, the countercyclical buffer (currently0.07 %) and the G-SII buffer of 2.00 %. The new CET 1 capital requirement of 11.82 % for 2019 is higher than the CET 1capital requirement of 10.69 %, which was applicable to Deutsche Bank in 2018, reflecting the now fully phase-in capitalconservation buffer and the G-SII buffer. Correspondingly, 2019 requirements for Deutsche Bank's Tier 1 capital ratio are at13.32 % and for its total capital ratio at 15.32 %. Also, the ECB communicated to us an individual expectation to hold a further“Pillar 2” CET 1 capital add-on, commonly referred to as the ‘“Pillar 2” guidance’. The capital add-on pursuant to the “Pillar 2”guidance is separate from and in addition to the Pillar 2 requirement. The ECB has stated that it expects banks to meet the“Pillar 2” guidance although it is not legally binding, and failure to meet the “Pillar 2” guidance does not lead to automaticrestrictions of capital distributions.
Internal Capital Adequacy Assessment Process
Deutsche Bank’s internal capital adequacy assessment process (ICAAP) consists of several well-established componentswhich ensure that Deutsche Bank maintains sufficient capital to cover the risks to which the bank is exposed on an ongoingbasis:
– Risk identification and assessment: The risk identification process forms the basis of the ICAAP and results in an inventoryof risks for the Group. All risks identified are assessed for their materiality. Further details can be found in section “Riskidentification and assessment”.
– Capital demand/risk measurement: Risk measurement methodologies and models are applied to quantify the capitaldemand which is required to cover all material risks except for those which cannot be adequately limited by capital e.g.liquidity risk. Further details can be found in sections “Risk profile” and “Capital, Leverage Ratio and MREL”.
– Capital supply: Capital supply quantification refers to the definition of available capital resources to absorb unexpectedlosses. Further details can be found in section “Capital, Leverage Ratio and MREL”
– Risk appetite: Deutsche Bank has established Group risk appetite thresholds which express the level of risk that we arewilling to assume to achieve our strategic objectives. Threshold breaches are subject to a dedicated governance frameworktriggering management actions aimed to safeguard capital adequacy. Further details can be found in sections “Risk appetiteand capacity” and “Key risk metrics”.

56
Deutsche Bank 1 – Management ReportAnnual Report 2018
– Capital planning: The risk appetite thresholds for capital adequacy metrics constitute boundaries which have to be met tosafeguard capital adequacy on a forward-looking basis. Further details can be found in section “Strategic and capital plan”.
– Stress testing: Capital plan figures are also considered under various stress test scenarios to prove resilience and overallviability of the bank. Capital adequacy metrics are also subject to regular stress tests throughout the year to constantlyevaluate Deutsche Bank’s capital position in hypothetical stress scenarios and to detect vulnerabilities under stress. Furtherdetails can be found in section “Stress testing”.
– Capital adequacy assessment: Although capital adequacy is constantly monitored throughout the year, the ICAAPconcludes with a dedicated annual capital adequacy assessment (CAS). The assessment consists of a Management Boardstatement about Deutsche Bank’s capital adequacy, which is linked to specific conclusions and management actions to betaken to safeguard capital adequacy on a forward-looking basis.
As part of its ICAAP, Deutsche Bank distinguishes between a normative and economic internal perspective. The normativeinternal perspective refers to the internal process aimed at the fulfilment of all capital-related legal requirements andsupervisory demands on an ongoing basis. The economic internal perspective refers to an internal process aimed at capitaladequacy using internal economic capital demand models and an internal economic capital supply definition. Bothperspectives focus on maintaining the viability of Deutsche Bank on an ongoing basis.
Stress testingDeutsche Bank is subject to stress test exercises to satisfy both internal as well as externally imposed stress test requirements.The internal stress tests are based on in-house developed methods and inform a variety of risk management use cases suchas our risk appetite framework or capital allocation. The regulatory stress tests, e.g. the EBA stress test and the US-basedCCAR (Comprehensive Capital Analysis and Review) stress tests are strictly following the processes and methodologies asprescribed by the regulatory authorities.
Our internal stress tests are performed on a regular basis in order to assess the impact of a severe economic downturn onour risk profile and financial position. These exercises complement traditional risk measures and represent an integral part ofour strategic and capital planning process. Our stress testing framework comprises regular Group-wide stress tests based oninternally defined scenarios of different severities and localizations. We include all material risk types into our stress testingexercises. The time-horizon of internal stress tests is generally one year and can be extended to multi-year, if required by thescenario assumptions. Our methodologies undergo regular scrutiny from Deutsche Bank’s internal validation team (ModelRisk Management) whether they correctly capture the impact of a given stress scenario. These analyses are complementedby portfolio- and country-specific stress tests as well as regulatory requirements, such as annual reverse stress tests andadditional stress tests requested by our regulators on group or legal entity level. Moreover, capital plan stress testing isperformed to assess the viability of our capital plan in adverse circumstances and to demonstrate a clear link between riskappetite, business strategy, capital plan and stress testing. An integrated procedure allows us to assess the impact of ad-hocscenarios that simulate potential imminent financial or geopolitical shocks.
The initial phase of our internal stress tests consists of defining a macroeconomic downturn scenario by ERM Risk Researchin cooperation with business specialists. ERM Risk Research monitors the political and economic development around theworld and maintains a macro-economic heat map that identifies potentially harmful scenarios. Based on quantitative modelsand expert judgments, economic parameters such as foreign exchange rates, interest rates, GDP growth or unemploymentrates are set accordingly to reflect the impact on our business. The scenario parameters are translated into specific risk driversby subject matter experts in the risk units. Based on our internal models framework for stress testing, the following majormetrics are calculated under stress: risk-weighted assets, impacts on profit and loss and economic capital by risk type. Theseresults are aggregated at the Group level, and key metrics such as the CET 1 ratio, ECA ratio and Leverage Ratio understress are derived. Stress impacts on the Liquidity Coverage Ratio (LCR) and the Liquidity Reserve are also considered. Priorto the impact assessment the more severe scenarios are discussed and approved by the Enterprise Risk Committee (ERC)which also reviews the final stress results. After comparing these results against our defined risk appetite, the ERC alsodiscusses specific mitigation actions to remediate the stress impact in alignment with the overall strategic and capital plan ifcertain limits are breached. The results also feed into the recovery planning which is crucial for the recoverability of the Bankin times of crisis. The outcome is presented to senior management up to the Management Board to raise awareness on thehighest level as it provides key insights into specific business vulnerabilities and contributes to the overall risk profileassessment of the bank. The group wide stress tests performed in 2018 indicated that the bank’s capitalization together withavailable mitigation measures allow it to reach the internally set stress exit level, the latter being above regulatory earlyintervention levels. A reverse stress test is performed annually in order to challenge our business model by determiningscenarios which would cause us to become unviable. Such a reverse stress test is based on a hypothetical macroeconomicscenario enriched by idiosyncratic events based on the top risks monitored by each risk type. Comparing the hypotheticalscenario resulting in the Bank’s non-viability to the current economic environment, we consider the probability of occurrenceof such a hypothetical stress scenario as extremely low. Given this, we do not believe that our business continuity is at risk.

57
Deutsche Bank Risk and capital frameworkAnnual Report 2018 Risk reporting and measurement systems
Deutsche Bank also took part in two major regulatory stress tests performed in 2018, i.e. the biannual European EBA stresstest as well as the US-based CCAR stress test. In the US, DB USA Corporation received no Federal Reserve (FRB) objectionsto its quantitative capital plan given its ample capital and liquidity under the stressed scenario. The entity, however, receiveda qualitative objection to the CCAR 2018 capital plan for weaknesses in governance, model methodology, validation, data andinfrastructure.
The EBA stress test exercise 2018 was based on the newly introduced IFRS 9 accounting framework and did not prescribeany pass/fail threshold for the projected CET 1 and Leverage ratios under the macroeconomic base and adverse scenario.
Stress testing framework of Deutsche Bank Group
Risk reporting and measurement systemsOur risk measurement systems support regulatory reporting and external disclosures, as well as internal managementreporting across credit, market, liquidity, cross, business, operational and reputational risks. The risk infrastructureincorporates the relevant legal entities and business divisions and provides the basis for reporting on risk positions, capitaladequacy and limit, threshold or target utilization to the relevant functions on a regular and ad-hoc basis. Established unitswithin Finance and Risk assume responsibility for measurement, analysis and reporting of risk while promoting sufficientquality and integrity of risk-related data. Our risk management systems are reviewed by Group Audit following a risk-basedaudit approach.
Deutsche Bank’s reporting is an integral part of Deutsche Bank’s risk management approach and as such aligns with theorganizational setup delivering consistent information on Group level and for material legal entities as well as breakdowns byrisk types, business division and material business units.
The following principles guide Deutsche Bank’s “risk reporting and monitoring” practices:
– Deutsche Bank monitors risks taken against risk appetite and risk-reward considerations on various levels across theGroup, e.g. Group, business divisions, material business units, material legal entities, risk types, portfolio and counterpartylevels.
– Risk reporting is required to be accurate, clear, useful and complete and must convey reconciled and validated risk data tocommunicate information in a concise manner to ensure, across material Financial and Non-Financial Risks, the bank’srisk profile is easily and well understood.
– Senior risk committees, such as the Enterprise Risk Committee (ERC) and the Group Risk Committee (GRC), as well asthe Management Board who are responsible for risk and capital management receive regular reporting (as well as ad-hocreporting as required).
– Dedicated teams within Deutsche Bank proactively manage material Financial- and Non-Financial Risks and must ensurethat required management information is in place to enable proactive identification and management of risks and avoidundue concentrations within a specific Risk Type and across Risks (Cross-Risk view).
In applying the previously mentioned principles, Deutsche Bank maintains a common basis for all risk reports and aims tominimize individual separate reporting efforts to allow Deutsche Bank to provide consistent information, which onlydifferentiates by granularity and audience focus.
ERM RiskResearch:
Scenario definition
Research definesscenario with severalrisk parameters suchas FX, interest rates,
growth, etc.
Risk Units:Parameter translation
Scenario parametersare translated into
risk-specific drivers
Risk Units:Calculation engines
Teams run risk-specific calculationengines to arrive at
stressed results
Central Function:Calculation of
aggregated impact
Calculation ofaggregated stressimpact based oncapital plan for
several metrics suchas RWA, CET1, etc.
Central Function:Comparison against
risk appetite
Stress results arecompared againstrisk appetite and incase of breachesmitigation actions
are considered
SeniorManagement:
Actions
Strategic decisionon adequate risk
mitigation orreduction from acatalogue of pre-
determinedalternatives
SeniorManagement:No action required
Finance:Capital plan

58
Deutsche Bank 1 – Management ReportAnnual Report 2018
The Bank identifies a large number of metrics within our risk measurement systems which support regulatory reporting andexternal disclosures, as well as internal management reporting across risks and for material risk types. Deutsche Bankdesignates a subset of those as “Key Risk Metrics” that represent the most critical ones for which the Bank places an appetite,limit, threshold or target at Group level and / or are reported routinely to senior management for discussion or decision making.The identified Key Risk Metrics include Capital Adequacy and Liquidity metrics; further details can be found in the section“Key risk metrics”.
While a large number of reports are used across the Bank, Deutsche Bank designates a subset of these as “Key Risk Reports”that are critical to support Deutsche Bank’s Risk Management Framework through the provision of risk information to seniormanagement and therefore enable the relevant governing bodies to monitor, steer and control the Bank’s risk taking activitieseffectively.
The main reports on risk and capital management that are used to provide the central governance bodies with informationrelating to the Group risk profile are the following:
– The monthly Risk and Capital Profile (RCP) report is a Cross-Risk report, provides a comprehensive view of DeutscheBank’s risk profile and is used to inform the ERC, the GRC as well as the Management Board and subsequently the RiskCommittee of the Supervisory Board. The RCP includes Risk Type specific and Business-Aligned overviews andEnterprise-wide risk topics. It also includes updates on Key Group Risk Appetite Metrics and other Key Portfolio Risk TypeControl Metrics as well as updates on Key Risk Developments, highlighting areas of particular interest with updates oncorresponding risk management strategies.
– An overview of our liquidity and solvency/leverage position is presented to the GRC and the Asset & Liability Committee(ALCO) by Group Capital Management and the Group Treasurer on a monthly basis. It comprises information on keymetrics including CRR/CRD 4 Common Equity Tier 1 ratio, the CRR/CRD 4 Leverage Ratio, and MREL as well as anoverview of our current funding and liquidity status, the liquidity stress test results and contingency measures.
– Group-wide macroeconomic stress tests are typically performed twice per quarter (or more frequently if required). They arereported to and discussed in the ERC and escalated to the GRC if deemed necessary. The stressed key performanceindicators are benchmarked against the Group Risk Appetite thresholds.
While the above reports are used at a Group level to monitor and review the risk profile of Deutsche Bank holistically, thereare other, supplementing standard and ad-hoc management reports that Risk Type or Business Aligned Risk Managementfunctions use to monitor and control the risk profile.
Recovery and resolution planningA number of jurisdictions such as the member states of the European Union, including Germany and the United Kingdom, aswell as the United States, have enacted regulations requiring banks or competent regulatory authorities to develop recoveryand resolution plans in order to be prepared for the management of a severe crisis up to a potential failure of a bank.
For the purpose of recovery planning, we maintain a Group recovery plan (Recovery Plan) which is updated and submitted tothe European Central Bank (ECB) at least annually to reflect changes in the business and the regulatory requirements. TheRecovery Plan prepares us to restore our financial strength and viability during an extreme stress situation, laying out a set ofdefined actions aimed to protect us, our customers and the markets and prevent a potential resolution event. In line withregulatory guidance, the Recovery Plan includes a wide range of countermeasures that are designed to mitigate differenttypes of stress scenarios, originating from both idiosyncratic and market-wide events, that would threaten Deutsche Bank’scapital and liquidity position. In addition, the Recovery Plan also outlines clear predefined governance and processes set upto support timely, efficient and effective monitoring, escalation, decision-making and implementation of recovery options if acrisis event occurs.
The Management Board oversees the development of the Recovery Plan and has set up a dedicated contingent governanceprocess to manage financial stress events.

59
Deutsche Bank Risk and capital frameworkAnnual Report 2018 Recovery and resolution planning
As set out in the Bank Recovery and Resolution Directive (BRRD), the German Recovery and Resolution Act (Sanierungs-und Abwicklungsgesetz, SAG) transforming the BRRD into German national legislation, and the Single Resolution MechanismRegulation (the SRM Regulation), the Group resolution plan is prepared by the resolution authorities, rather than by the bankitself. We work closely with the Single Resolution Board (SRB) and the Bundesanstalt für Finanzdienstleistungsaufsicht(“BaFin”) who establish the Group resolution plan for Deutsche Bank, which is currently based on a single point of entry (SPE)bail-in as the preferred resolution strategy. Under the SPE bail-in strategy, the parent entity Deutsche Bank AG would berecapitalized through a write-down and/or conversion to equity of capital instruments (Common Equity Tier 1, Additional Tier 1,Tier 2) and other eligible liabilities in order to stabilize the Group. Within one month after the application of the bail-in tool torecapitalize an institution, the BRRD (as implemented in the SAG) requires such institution to establish a businessreorganization plan addressing the causes of failure and aiming to restore the institution's long-term viability.
The BRRD requires banks in EU member states to maintain minimum requirements for own funds and eligible liabilities(MREL) to make resolution credible by establishing sufficient loss absorption and recapitalization capacity. Apart from MREL-requirements, Deutsche Bank, as a global systemically important bank, will be subject to global minimum standards for TotalLoss-Absorbing Capacity (TLAC), which set out strict requirements for the amount and eligibility of instruments to bemaintained for bail-in purposes. In particular, TLAC instruments must be subordinated (including so-called senior “non-preferred” debt, but also in the form of regulatory capital instruments) to other senior liabilities. This ensures that a bail-inwould be applied first to equity and TLAC instruments, which must be exhausted before a bail-in may affect other senior(“preferred”) liabilities such as deposits, derivatives, debt instruments that are “structured” and senior preferred plain vanillabonds.
In the United States, Deutsche Bank AG is required under Title I of the Dodd-Frank Wall Street Reform and ConsumerProtection Act (the “Dodd-Frank Act”), as amended, and the implementing regulations therefor, to prepare and submitperiodically to the Federal Reserve Board and the Federal Deposit Insurance Corporation (“FDIC”) a plan for the orderlyresolution of subsidiaries and operations in the event of future material financial distress or failure (the “U.S. Resolution Plan”).For foreign-based companies subject to these resolution planning requirements such as Deutsche Bank AG, the U.S.Resolution Plan relates only to subsidiaries, branches, agencies and businesses that are domiciled in or whose activities arecarried out in whole or in material part in the United States.
Deutsche Bank AG filed its most recent U.S. Resolution Plan in July 2018 and received written regulatory feedback inDecember 2018. The Federal Reserve and FDIC found that Deutsche Bank’s U.S. Resolution Plan had no deficiencies butidentified one shortcoming in the plan, associated with governance mechanisms and related escalation triggers. DeutscheBank is required to submit a response to its December 2018 feedback letter by April 5, 2019. Deutsche Bank’s response willdiscuss the remediation of the shortcoming as well as enhancements of its resolution capabilities. Both the remediation of theshortcoming and enhancements must be completed prior to the submission of our next U.S. Resolution Plan, which is currentlyexpected to be due on July 1, 2020.

60
Deutsche Bank 1 – Management ReportAnnual Report 2018
Risk and Capital Management
Capital managementOur Treasury function manages solvency, capital adequacy, leverage and bail-in capacity ratios at Group level and locally ineach region, as applicable. Treasury implements our capital strategy, which itself is developed by the Group Risk Committeeand approved by the Management Board. Treasury, directly or through the Group Asset and Liability Committee, which hasbeen established in the first half of the year 2018, manages, among other things, issuance and repurchase of shares andcapital instruments, hedging of capital ratios against foreign exchange swings, setting capacities for key financial resources,design of shareholders’ equity allocation, and regional capital planning. We are fully committed to maintaining our soundcapitalization both from an economic and regulatory perspective. We continuously monitor and adjust our overall capitaldemand and supply in an effort to achieve an appropriate balance of the economic and regulatory considerations at all timesand from all perspectives. These perspectives include book equity based on IFRS accounting standards, regulatory andeconomic capital as well as specific capital requirements from rating agencies.
Treasury manages the issuance and repurchase of capital instruments, namely Common Equity Tier 1, Additional Tier 1 andTier 2 capital instruments as well as TLAC/MREL eligible debt instruments. Treasury constantly monitors the market for liabilitymanagement trades. Such trades represent a countercyclical opportunity to create Common Equity Tier 1 capital by buyingback our issuances below par.
Our core currencies are Euro, US Dollar, Chinese Renminbi and Pound Sterling. Treasury manages the sensitivity of ourcapital ratios against swings in core currencies. The capital invested into our foreign subsidiaries and branches in the othernon-core currencies is largely hedged against foreign exchange swings. Treasury determines which currencies are to behedged, develops suitable hedging strategies in close cooperation with Risk Management and finally executes these hedges.
Resource limit settingUsage of key financial resources is influenced through the following governance processes and incentives.
Target resource capacities are reviewed in our annual strategic plan in line with our CET 1 and Leverage Ratio ambitions. Ina quarterly process, the Group Asset and Liability Committee, which insofar as it replaced the Group Risk Committee asdecision body, approves divisional resource limits for Total Capital Demand and leverage exposure that are based on thestrategic plan but adjusted for market conditions and the short-term outlook. Limits are enforced through a close monitoringprocess and an excess charging mechanism.
Overall regulatory capital requirements are principally driven by either our CET 1 ratio (solvency) or leverage ratio (leverage)requirements, whichever is the more binding constraint. For the internal capital allocation, the combined contribution of eachsegment to the Group’s Common Equity Tier 1 ratio, the Group’s Leverage ratio and the Group’s Capital Loss under Stressare weighted to reflect their relative importance and level of constraint to the Group. Contributions to the Common EquityTier 1 ratio and the Leverage ratio are measured through Risk-Weighted Assets (RWA) and Leverage Ratio Exposure (LRE)assuming full implementation of CRR/CRD 4 rules. The Group’s Capital Loss under Stress is a measure of the Group’s overalleconomic risk exposure under a defined stress scenario. In our performance measurement, our methodology also appliesdifferent rates for the cost of equity for each of the business segments, reflecting in a more differentiated way the earningsvolatility of the individual business models. This enables improved performance management and investment decisions.
Regional capital plans covering the capital needs of our branches and subsidiaries across the globe are prepared on an annualbasis and presented to the Group Investment Committee. Most of our subsidiaries are subject to legal and regulatory capitalrequirements. In developing, implementing and testing our capital and liquidity, we fully take such legal and regulatoryrequirements into account.
Further, Treasury is represented on the Investment Committee of the largest Deutsche Bank pension fund which sets theinvestment guidelines for this fund. This representation is intended to ensure that pension assets are aligned with pensionliabilities, thus protecting our capital base.

61
Deutsche Bank Risk and Capital ManagementAnnual Report 2018 Credit Risk Management
Risk Identification and AssessmentOur business activities generate credit risks, market risks, business risks, liquidity risks, cross risks, operational risks andreputational risks. We regularly identify risks to our business’ and infrastructure’s operations, also under stressed conditions,and assess the materiality of identified risks with respect to their severity and likelihood of materialization. The assessment ofcurrent risks is complemented by a view on emerging risks applying a forward-looking perspective. This risk identification andassessment process results in our risk inventory which captures the material risks across relevant businesses and entities.Regular updates to the risk inventory are reported to senior management together with the risk profile and inform our riskmanagement processes.
Throughout 2018 we have strengthened the enterprise risk identification and assessment framework applicable to DeutscheBank Group and key entities. The enhanced process involves both first line and second line input into risk identification andthe assessment of the risks’ materiality. This framework provides the basis, on which we can aggregate risks for the Groupacross businesses and entities. The resulting inventory of risks, after review and challenge by senior management, informskey risk management processes including the development of stress scenarios tailored to Deutsche Bank’s risk profile, thecalibration of risk appetite and the risk profile monitoring and reporting.
Credit Risk Management
Credit Risk framework
Credit Risk arises from all transactions where actual, contingent or potential claims against any counterparty, borrower, obligoror issuer (which we refer to collectively as “counterparties”) exist, including those claims that we plan to distribute. Thesetransactions are typically part of our non-trading lending activities (such as loans and contingent liabilities) as well as our directtrading activity with clients (such as OTC derivatives). These also include traded bonds and debt securities. Carrying valuesof equity investments are also disclosed in our Credit Risk section. We manage the respective positions within our market riskand credit risk frameworks.
Based on the annual risk identification and materiality assessment, Credit Risk is grouped into five categories, namely default/migration risk, country risk, transaction/ settlement risk (exposure risk), mitigation (failure) risk and concentration risk.
– Default/Migration Risk is the risk that a counterparty defaults on its payment obligations or experiences material creditquality deterioration increasing the likelihood of a default.
– Country Risk is the risk that otherwise solvent and willing counterparties are unable to meet their obligations due to directsovereign intervention or policies.
– Transaction/Settlement Risk (Exposure Risk) is the risk that arises from any existing, contingent or potential future positiveexposure.
– Mitigation Risk is the risk of higher losses due to risk mitigation measures not performing as anticipated.– Concentration Risk is the risk of an adverse development in a specific single counterparty, country, industry or product
leading to a disproportionate deterioration in the risk profile of Deutsche Bank’s credit exposures to that counterparty,country, industry or product.
We measure, manage/mitigate and report/monitor our credit risk using the following philosophy and principles:
– Our Credit Risk Management function is independent from our business divisions and in each of our divisions, creditdecision standards, processes and principles are consistently applied.
– A key principle of credit risk management is client credit due diligence. Our client selection is achieved in collaboration withour business division counterparts who stand as a first line of defense.
– We aim to prevent undue concentration and tail-risks (large unexpected losses) by maintaining a diversified credit portfolio.Client, industry, country and product-specific concentrations are assessed and managed against our risk appetite.
– We maintain underwriting standards aiming to avoid large undue credit risk on a counterparty and portfolio level. In thisregard we assume unsecured cash positions and actively use hedging for risk mitigation purposes. Additionally, we striveto secure our derivative portfolio through collateral agreements and may additionally hedge concentration risks to furthermitigate credit risks from underlying market movements.
– Every new credit facility and every extension or material change of an existing credit facility (such as its tenor, collateralstructure or major covenants) to any counterparty requires credit approval at the appropriate authority level. We assigncredit approval authorities to individuals according to their qualifications, experience and training, and we review theseperiodically.
62
Deutsche Bank 1 – Management ReportAnnual Report 2018
– We measure and consolidate all our credit exposures to each obligor across our consolidated Group on a global basis, inline with regulatory requirements.
– We manage credit exposures on the basis of the “one obligor principle” (as required under CRR Article 4(1)(39)), underwhich all facilities to a group of borrowers which are linked to each other (for example by one entity holding a majority ofthe voting rights or capital of another) are consolidated under one group.
– We have established within Credit Risk Management – where appropriate – specialized teams for deriving internal clientratings, analyzing and approving transactions, monitoring the portfolio or covering workout clients.
– Where required, we have established processes to report credit exposures at legal entity level.
Measuring Credit Risk
Credit Risk is measured by credit rating, regulatory and internal capital demand and key credit metrics mentioned below.
The credit rating is an essential part of the Bank’s underwriting and credit process and builds the basis for risk appetitedetermination on a counterparty and portfolio level, credit decision and transaction pricing as well the determination of creditrisk regulatory capital. Each counterparty must be rated and each rating has to be reviewed at least annually. Ongoingmonitoring of counterparties helps keep ratings up-to-date. There must be no credit limit without a credit rating. For each creditrating the appropriate rating approach has to be applied and the derived credit rating has to be established in the relevantsystems. Different rating approaches have been established to best reflect the specific characteristics of exposure classes,including central governments and central banks, institutions, corporates and retail.
Counterparties in our non-homogenous portfolios are rated by our independent Credit Risk Management function. Countryrisk related ratings are provided by ERM Risk Research.
Our rating analysis is based on a combination of qualitative and quantitative factors. When rating a counterparty we apply in-house assessment methodologies, scorecards and our 21-grade rating scale for evaluating the credit-worthiness of ourcounterparties.
Changes to existing credit models and introduction of new models are approved by the Regulatory Credit Risk ModelCommittee (RCRMC) chaired by the Head of CRM, as well as by the Head of Model Risk Management or delegate under adelegated authority, where appropriate, before the methodologies are used for credit decisions and capital calculation for thefirst time or before they are significantly changed. Proposals with high impact are recommended for approval to the GroupRisk Committee. Regulatory approval may also be required. The methodology validation is performed independently of modeldevelopment by Model Risk Management. The results of the regular validation processes as stipulated by internal policieshave to be brought to the attention of the Regulatory Credit Risk Model Forum (RCRMF) and the RCRMC, even if the validationresults do not lead to a change. The validation plan for rating methodologies is presented to RCRMF at the beginning of thecalendar year.
For Postbank, and since May 2018 for DB PFK AG, responsibility for implementation, validation and monitoring of internalrating systems effectiveness is with Postbank’s/DB PFK AG’s Group Risk Controlling function and overseen by the model andvalidation committee, chaired by Postbank’s/ DB PFK AG’s Head of Group Risk Controlling. An independent model risk andvalidation function has been established in addition to the model risk development unit. All rating systems are subject toapproval by Postbank’s/ DB PFK AG’s Bank Risk Committee chaired by the Chief Risk Officer. In addition, DB Group’s IRBAGovernance is extended to all DB PFK AG models as part of the merger and the granted capital waiver. Effectiveness of ratingsystems and rating results are reported to the Postbank/ DB PFK AG Management Board on a regular basis. Joint governanceis ensured via a cross committee membership of Deutsche Bank senior managers joining Postbank/ DB PFK AG committeesand vice versa.
We measure risk-weighted assets to determine the regulatory capital demand for credit risk using “advanced”, “foundation”and “standard” approaches of which advanced and foundation are approved by our regulator.
The advanced Internal Ratings Based Approach (IRBA) is the most sophisticated approach available under the regulatoryframework for credit risk and allows us to make use of our internal credit rating methodologies as well as internal estimates ofspecific further risk parameters. These methods and parameters represent long-used key components of the internal riskmeasurement and management process supporting the credit approval process, the economic capital and expected losscalculation and the internal monitoring and reporting of credit risk. The relevant parameters include the probability of default(PD), the loss given default (LGD) and the maturity (M) driving the regulatory risk-weight and the credit conversion factor(CCF) as part of the regulatory exposure at default (EAD) estimation. For the majority of derivative counterparty exposures aswell as securities financing transactions (SFT), we make use of the internal model method (IMM) in accordance with CRR andSolvV to calculate EAD. For most of our internal rating systems more than seven years of historical information is available toassess these parameters. Our internal rating methodologies aim at point-in-time rather than a through-the-cycle rating, but inline with regulatory solvency requirements, they are calibrated based on long-term averages of observed default rates.
63
Deutsche Bank Risk and Capital ManagementAnnual Report 2018 Credit Risk Management
We apply the foundation IRBA to the majority of our remaining foundation IRBA eligible credit portfolios at Postbank/ DB PFKAG. The foundation IRBA is an approach available under the regulatory framework for credit risk allowing institutions to makeuse of their internal rating methodologies while using pre-defined regulatory values for all other risk parameters. Parameterssubject to internal estimates include the PD while the LGD and the CCF are defined in the regulatory framework.
We apply the standardized approach to a subset of our credit risk exposures. The standardized approach measures creditrisk either pursuant to fixed risk weights, which are predefined by the regulator, or through the application of external ratings.We assign certain credit exposures permanently to the standardized approach in accordance with Article 150 CRR. Theseare predominantly exposures to the Federal Republic of Germany and other German public sector entities as well asexposures to central governments of other European Member States that meet the required conditions. These exposuresmake up the majority of the exposures carried in the standardized approach and receive predominantly a risk weight of zeropercent. For internal purposes, however, these exposures are subject to an internal credit assessment and fully integrated inthe risk management and economic capital processes.
In addition to the above described regulatory capital demand, we determine the internal capital demand for credit risk via aneconomic capital model.
We calculate economic capital for the default risk, country risk and settlement risk as elements of credit risk. In line with oureconomic capital framework, economic capital for credit risk is set at a level to absorb with a probability of 99.9 % very severeaggregate unexpected losses within one year. Our economic capital for credit risk is derived from the loss distribution of aportfolio via Monte Carlo Simulation of correlated rating migrations. The loss distribution is modeled in two steps. First,individual credit exposures are specified based on parameters for the probability of default, exposure at default and loss givendefault. In a second step, the probability of joint defaults is modeled through the introduction of economic factors, whichcorrespond to geographic regions and industries. The simulation of portfolio losses is then performed by an internallydeveloped model, which takes rating migration and maturity effects into account. Effects due to wrong-way derivatives risk(i.e., the credit exposure of a derivative in the default case is higher than in non-default scenarios) are modeled by applyingour own alpha factor when deriving the exposure at default for derivatives and securities financing transactions under theCRR. We allocate expected losses and economic capital derived from loss distributions down to transaction level to enablemanagement on transaction, customer and business level.
Besides the credit rating which is the key credit risk metric we apply for managing our credit portfolio, including transactionapproval and the setting of risk appetite, we establish internal limits and credit exposures under these limits. Credit limits setforth maximum credit exposures we are willing to assume over specified periods. In determining the credit limit for acounterparty, we consider the counterparty’s credit quality by reference to our internal credit rating. Credit limits and creditexposures are both measured on a gross and net basis where net is derived by deducting hedges and certain collateral fromrespective gross figures. For derivatives, we look at current market values and the potential future exposure over the relevanttime horizon which is based upon our legal agreements with the counterparty. We generally also take into consideration therisk-return characteristics of individual transactions and portfolios. Risk-Return metrics explain the development of clientrevenues as well as capital consumption. In this regard we also look at the client revenues in relation to the balance sheetconsumption.
IFRS 9 impairment approach
We determine credit loss allowances in accordance with IFRS 9 as follows:
– Stage 1 reflects financial instruments where it is assumed that credit risk has not increased significantly after initialrecognition.
– Stage 2 contains all financial assets, that are not defaulted, but have experienced a significant increase in credit risk sinceinitial recognition.
– Stage 3 consists of financial assets of clients which are defaulted in accordance of Capital Requirements Regulation (CRR)under Art. 178. The Group defines these financial assets as impaired.
– Significant increase in Credit Risk is determined using quantitative and qualitative information based on the Group’shistorical experience, credit risk assessment and forward-looking information.
– POCI are Purchased or Originated Credit-Impaired financial assets in Stage 3 where at the time of initial recognition thereis objective evidence of impairment.
The IFRS 9 impairment approach is an integral part of the Group’s Credit Risk Management. The estimation of ECL (ExpectedCredit Loss) which is the basis for the Group’s credit loss allowance is either done via the Group’s ECL engine or by CreditOfficers on a case-by-case basis. In both cases, the calculation takes place for each financial asset individually. The GroupECL engine is used to calculate the credit loss allowance for all financial assets in the homogeneous portfolio as well as forall financial assets in the non-homogenous portfolios in Stage 1 and Stage 2. The credit loss allowance for our financial assetsin our non-homogeneous portfolio in Stage 3 is determined by Credit Officers on a case by case basis.

64
Deutsche Bank 1 – Management ReportAnnual Report 2018
For a more detailed description of these expressions and the approach, please refer to Note 1 - Significant Accounting Policiesand Critical Accounting Estimates of the Consolidated Financial Statements and in the following sections.
Stage DeterminationAt initial recognition, financial assets which are not POCI are reflected in Stage 1. If there is a significant increase in creditrisk, the financial asset is transferred to Stage 2. Significant increase in credit risk is determined by using rating-related andprocess-related indicators. In contrast, the assignment of a financial instrument to Stage 3 is based on the status of the obligorbeing in default.
Rating-related indicators: Based on a dynamic change in counterparty PDs that is linked to all transactions with thecounterparty, the Group compares lifetime PD at the reporting date, with expectations at the date of initial recognition. Basedon historically observed migration behavior and available forward-looking information, an expected forward rating distributionis obtained. A quantile of this distribution, which is defined for each counterparty class, is chosen as the threshold. If theremaining lifetime PD of a transaction according to current expectations exceeds the PD of the relevant threshold rating, thefinancial asset is considered to be significantly increased. The thresholds used to determine Stage 2 indicators are determinedusing expert judgment and validated annually.
Process-related Indicators: Process-related indicators are derived via usage of existing risk management indicators, whichallow the Group to identify whether the credit risk of financial assets has significantly increased. These include obligors beingadded mandatorily to a credit watchlist, being mandatorily transferred to workout status, payments being 30 days or moreoverdue or in forbearance.
On an ongoing basis, as long as the condition for one or more of the indicators is fulfilled and the financial asset is notrecognized as defaulted, the asset will remain in Stage 2. If none of the indicator conditions is any longer fulfilled and thefinancial asset is not defaulted, the asset transfers back to Stage 1. In case of a default, the financial asset is allocated toStage 3. In the case that a previously defaulted financial asset ceases to be classified as defaulted, it transfers back to Stage1 or Stage 2.
Expected LifetimeThe expected lifetime of a financial asset is a key factor in determining the lifetime expected credit losses (LTECL). Lifetimeexpected credit losses represent default events over the expected life of a financial asset. The Group measures expectedcredit losses considering the risk of default over the maximum contractual period (including any borrower’s extension options)over which it is exposed to credit risk.
Retail overdrafts, credit card facilities and certain corporate revolving facilities typically include both a loan and an undrawncommitment component. The expected lifetime of such on-demand facilities exceeds their contractual life as they are typicallycancelled only when the Group becomes aware of an increase in credit risk. The expected lifetime is estimated by taking intoconsideration historical information and the Group’s Credit Risk Management actions such as credit limit reductions and facilitycancellation. Where such facilities are subject to an individual review by Credit Risk Management, the lifetime for calculatingexpected credit losses is 12 months. For facilities not subject to individual review by Credit Risk Management, Deutsche Bankapplies a lifetime for calculating expected credit losses of 24 months.
Forward-looking informationUnder IFRS 9, the allowance for credit losses is based on reasonable and supportable forward looking information obtainablewithout undue cost or effort, which takes into consideration past events, current conditions and forecasts of future economicconditions.
To incorporate forward-looking information into Deutsche Bank’s allowance for credit losses, the Group uses two keyelements:
‒ As its base scenario, the Group uses the macroeconomic forecasts provided by its research department dbResearch. Theseforecasts cover a number of macroeconomic variables (e.g., GDP, unemployment rates and interest rates) and reflectdbResearch’s view as to the most likely development of those variables, typically over a two year period and updated quarterly.
‒ This base scenario is then translated into a multiple scenario analysis by leveraging the Group-wide stress test environment.This environment generates the impact of a multitude of economic scenarios and is used as basis for deriving multi-year PDcurves for different rating and counterparty classes, which are applied in the calculation of expected credit losses and in theidentification of significant deterioration in credit quality of financial assets as described previously.
The general use of forward-looking information, including macro-economic factors, as well as adjustments taking into accountextraordinary factors, are monitored by the Group's Risk and Finance Credit Loss Provision Forum. In certain situations CreditRisk officers and senior management may have additional information in relation to specific portfolios to indicate that thedistribution used by the stress testing framework is not appropriate. In such situations the Group would apply a judgmentaloverlay.

65
Deutsche Bank Risk and Capital ManagementAnnual Report 2018 Credit Risk Management
Basis of inputs and assumptions and the estimation techniquesThe Group calculates expected credit losses for each financial asset individually. Similarly, the determination of the need totransfer between stages is made on an individual asset basis.
The Group uses three main components to measure ECL. These are PD, Loss Given Default (LGD) and Exposure at Default(EAD). The Group has leveraged existing parameters used for determination of capital demand under the Basel InternalRatings Based Approach and internal risk management practices as much as possible to calculate ECL. These parametersare adjusted where necessary to comply with IFRS 9 requirements (e.g. use of point in time ratings and removal of downturnelements in the regulatory parameters). Incorporating forecasts of future economic conditions into the measurement ofexpected credit losses influences the allowance for credit losses for each stage. In order to calculate lifetime expected creditlosses, the Group’s calculation includes deriving the corresponding lifetime PDs from migration matrices that reflect economicforecasts.
The expected credit loss calculation for Stage 3 distinguishes between transactions in homogeneous and non-homogenousportfolios, and purchased or originated credit-impaired transactions. For transactions that are in Stage 3 and in ahomogeneous portfolio, a similar approach as for Stage 1 and 2 transactions is taken. Since a Stage 3 transaction is defaulted,the probability of default is equal to 100 %. To incorporate the currently available information, the LGD parameters aremodelled to be time-dependent, thus capture the time dependency of recovery expectation after default.
The estimation techniques for the input factors are described in more detail below.
The one-year PD for counterparties is derived from our internal rating systems. The Group assigns a PD to each relevantcounterparty credit exposure based at the 21-grade master rating scale for all of our exposure.
The counterparty ratings assigned are derived based on internally developed rating models which specify consistent anddistinct customer-relevant criteria and assign a rating grade based on a specific set of criteria as given for a certain customer.The set of criteria is generated from information sets relevant for the respective customer segments including general customerbehavior, financial and external data. The methods in use range from statistical scoring models to expert-based models takinginto account the relevant available quantitative and qualitative information. Expert-based models are usually applied forcounterparties in the exposure classes “Central governments and central banks”, “Institutions” and “Corporates” with theexception of those “Corporates” segments for which sufficient data basis is available for statistical scoring models. For thelatter as well as for the retail segment statistical scoring or hybrid models combining both approaches are commonly used.Quantitative rating methodologies are developed based on applicable statistical modelling techniques, such as logisticregression.
One-year PDs are extended to multi-year PD curves using through-the-cycle (TTC) matrices and macroeconomic forecastsprovided by Deutsche Bank Research that define a macroeconomic base scenario. Based on these macroeconomic forecasts,TTC matrices are transformed into point-in-time (PIT) rating migration matrices, typically for a two year period. The calculationof the PIT matrices is performed in the Group’s stress testing environment, which provides a link between macroeconomicvariables and the default and rating behavior of counterparties. The macroeconomic forecasts adjust the distribution of therespective macroeconomic factors and consequently, the rating migration matrices that define migration and defaultprobabilities. The actual calculation is based on a Monte-Carlo simulation of multiple scenarios or on equivalent analyticaltechniques. Multi-year PDs and rating migration matrices are thus derived and applied to portfolios in scope for IFRS 9 whichare categorized according to the following counterparty classes: retail Germany, retail Spain, retail Italy, financial institutions,midcaps, corporates, and sovereigns.
LGD is defined as the likely loss intensity in case of a counterparty default. It provides an estimation of the exposure thatcannot be recovered in a default event and therefore captures the severity of a loss. Conceptually, LGD estimates areindependent of a customer’s probability of default. The LGD models ensure that the main drivers for losses (i.e., differentlevels and quality of collateralization and customer or product types or seniority of facility) are reflected in specific LGD factors.In our LGD models we assign collateral type specific LGD parameters to the collateralized exposure (collateral value afterapplication of haircuts).
The EAD over the lifetime of a financial asset is modelled taking into account expected repayment profiles. We apply specificCredit Conversion Factors (CCFs) in order to calculate an EAD value. Conceptually, the EAD is defined as the expectedamount of the credit exposure to a counterparty at the time of its default. In instances where a transaction involves an unusedlimit, a percentage share of this unused limit is added to the outstanding amount in order to appropriately reflect the expectedoutstanding amount in case of a counterparty default. This reflects the assumption that for commitments the utilization at thetime of default might be higher than the utilization under IAS 39. When a transaction involves an additional contingentcomponent (i.e., guarantees) a further percentage share is applied as part of the CCF model in order to estimate the amountof guarantees drawn in case of default. The calibrations of such parameters are based on statistical experience as well asinternal historical data and consider counterparty and product type specifics.
66
Deutsche Bank 1 – Management ReportAnnual Report 2018
Consideration of Collateralization in IFRS 9 Expected Credit Loss calculationThe LTECL engine projects the level of collateralization for each point in time in the life of a financial asset. For the reportingdate, the engine uses the existing collateral distribution process applied for the DB’s Economic Capital model. In this model,the liquidation value of each eligible collateral is allocated to relevant financial assets to distinguish between collateralized anduncollateralized parts of each exposure.
For personal collateral, the LTECL engine assumes that the relative level of collateralization remains stable over time. In thatcase the absolute exposure and collateral values decrease together over time. For impersonal collateral, the LTECL shallassume that the absolute collateral value remains constant. In that case, the collateralized part of the exposure increases overtime and consequently the exposure will be fully collateralized at some point.
Certain financial guarantee contract are integral to the financial assets guaranteed. In such cases, the financial guarantee isconsidered as collateral for the financial asset and the benefit of the guarantee is used to mitigate the ECL of the guaranteedfinancial asset.
For further details on how we determine the liquidation value of our collaterals please refer to section “Managing and Mitigationof Credit Risk”
Model sensitivityThere are two main sources of ECL volatility for Stage 1 and 2 assets. Similarly to traditional risk measures like Risk WeightedAssets or Economic Capital, our ECL is sensitive to changes in the portfolio relevant for IFRS 9. Changes to the portfoliocomposition, the exposure profile or counterparty ratings, which are particularly important due to potential implications onstage determination, influence the level of ECL and thus the level of our Credit Loss Allowance.
In addition to portfolio changes, ECL is also impacted by macroeconomic forecasts. The selection process for themacroeconomic variables combines expert assessment and statistical tests and reflects the characteristics of the individualportfolios. As a consequence, ECL sensitivities to macroeconomic forecasts are portfolio-specific with GDP growth rates andunemployment rates in the Eurozone and the US as dominant factors.
Managing and mitigation of Credit Risk
Managing Credit Risk on counterparty level
Credit-related counterparties are principally allocated to credit officers within credit teams which are aligned to types ofcounterparty (such as financial institutions, corporates or private individuals) or economic area (e.g., emerging markets) anddedicated rating analyst teams. The individual credit officers have the relevant expertise and experience to manage the creditrisks associated with these counterparties and their associated credit related transactions. For retail clients, credit decisionmaking and credit monitoring is highly automated for efficiency reasons. Credit Risk Management has full oversight of therespective processes and tools used in the retail credit process. It is the responsibility of each credit officer to undertakeongoing credit monitoring for their allocated portfolio of counterparties. We also have procedures in place intended to identifyat an early stage credit exposures for which there may be an increased risk of loss.
In instances where we have identified counterparties where there is a concern that the credit quality has deteriorated orappears likely to deteriorate to the point where they present a heightened risk of loss in default, the respective exposure isgenerally placed on a “watchlist”. We aim to identify counterparties that, on the basis of the application of our risk managementtools, demonstrate the likelihood of problems well in advance in order to effectively manage the credit exposure and maximizethe recovery. The objective of this early warning system is to address potential problems while adequate options for actionare still available. This early risk detection is a tenet of our credit culture and is intended to ensure that greater attention ispaid to such exposures.
Credit limits are established by the Credit Risk Management function via the execution of assigned credit authorities. This alsoapplies to settlement risk that must fall within limits pre-approved by Credit Risk Management considering risk appetite and ina manner that reflects expected settlement patterns for the subject counterparty. Credit approvals are documented by thesigning of the credit report by the respective credit authority holders and retained for future reference.
Credit authority is generally assigned to individuals as personal credit authority according to the individual’s professionalqualification, experience and training. All assigned credit authorities are reviewed on a periodic basis to help ensure that theyare commensurate with the individual performance of the authority holder.
Where an individual’s personal authority is insufficient to establish required credit limits, the transaction is referred to a highercredit authority holder or where necessary to an appropriate credit committee. Where personal and committee authorities areinsufficient to establish appropriate limits, the case is referred to the Management Board for approval.
67
Deutsche Bank Risk and Capital ManagementAnnual Report 2018 Credit Risk Management
Mitigation of Credit Risk on counterparty level
In addition to determining counterparty credit quality and our risk appetite, we also use various credit risk mitigation techniquesto optimize credit exposure and reduce potential credit losses. Credit risk mitigants are applied in the following forms:
– Comprehensive and enforceable credit documentation with adequate terms and conditions.– Collateral held as security to reduce losses by increasing the recovery of obligations.– Risk transfers, which shift the loss arising from the probability of default risk of an obligor to a third party including hedging
executed by our Credit Portfolio Strategies Group.– Netting and collateral arrangements which reduce the credit exposure from derivatives and securities financing transactions
(e.g. repo transactions).– Hedging of derivatives counterparty risk including CVA, using primarily CDS contracts via our Counterparty Portfolio
Management desk.
CollateralWe regularly agree on collateral to be received from or to be provided to customers in contracts that are subject to credit risk.Collateral is security in the form of an asset or third-party obligation that serves to mitigate the inherent risk of credit loss in anexposure, by either substituting the counterparty default risk or improving recoveries in the event of a default. While collateralcan be an alternative source of repayment, it does not replace the necessity of high quality underwriting standards and athorough assessment of the debt service ability of the counterparty in line with CRR Article 194 (9).
We segregate collateral received into the following two types:
– Financial and other collateral, which enables us to recover all or part of the outstanding exposure by liquidating the collateralasset provided, in cases where the counterparty is unable or unwilling to fulfill its primary obligations. Cash collateral,securities (equity, bonds), collateral assignments of other claims or inventory, equipment (i.e., plant, machinery and aircraft)and real estate typically fall into this category. All financial collateral is regularly, mostly daily, revalued and measuredagainst the respective credit exposure. The value of other collateral, including real estate, is monitored based uponestablished processes that includes regular revaluations by internal and/or external experts.
– Guarantee collateral, which complements the counterparty’s ability to fulfill its obligation under the legal contract and assuch is provided by third parties. Letters of credit, insurance contracts, export credit insurance, guarantees, creditderivatives and risk participations typically fall into this category. Guarantee collateral with a non-investment grade ratingof the guarantor is limited.
Our processes seek to ensure that the collateral we accept for risk mitigation purposes is of high quality. This includes seekingto have in place legally effective and enforceable documentation for realizable and measureable collateral assets which areevaluated regularly by dedicated teams. The assessment of the suitability of collateral for a specific transaction is part of thecredit decision and must be undertaken in a conservative way, including collateral haircuts that are applied. We have collateraltype specific haircuts in place which are regularly reviewed and approved. In this regard, we strive to avoid “wrong-way” riskcharacteristics where the counterparty’s risk is positively correlated with the risk of deterioration in the collateral value. Forguarantee collateral, the process for the analysis of the guarantor’s creditworthiness is aligned to the credit assessmentprocess for counterparties.
The valuation of collateral is considered under a liquidation scenario. Liquidation value is equal to the expected proceeds ofcollateral monetization / realization in a base case scenario, wherein a fair price is achieved through careful preparation andorderly liquidation of the collateral. Collateral can either move in value over time (dynamic value) or not (static value). Thedynamic liquidation value generally includes a safety margin or haircut over realizable value to address liquidity andmarketability aspects.
The Group assigns a liquidation value to eligible collateral, based on, among other things:
– the market value and / or lending value, notional amount or face value of a collateral as a starting point;– the type of collateral; the currency mismatch, if any, between the secured exposure and the collateral; and a maturity
mismatch, if any;– the applicable legal environment or jurisdiction (onshore versus offshore collateral);– the market liquidity and volatility in relation to agreed termination clauses;– the correlation between the performance of the borrower and the value of the collateral, e.g., in the case of the pledge of a
borrower’s own shares or securities (in this case generally full correlation leads to no liquidation value);– the quality of physical collateral and potential for litigation or environmental risks; and– a determined collateral type specific haircut (0 – 100 %) reflecting collection risks (i.e. price risks over the average
liquidation period and processing/utilization/sales cost) as specified in the respective policies.

68
Deutsche Bank 1 – Management ReportAnnual Report 2018
Collateral haircut settings are typically based on available historic internal and/or external recovery data (expert opinions mayalso be used, where appropriate). They also incorporate a forward-looking component in the form of collection and valuationforecast provided by experts within Risk Management. When data is not sufficiently available or inconclusive, moreconservative haircuts than otherwise used must be applied. Haircut settings are reviewed at least annually.
Risk transfersRisk transfers to third parties form a key part of our overall risk management process and are executed in various forms,including outright sales, single name and portfolio hedging, and securitizations. Risk transfers are conducted by the respectivebusiness units and by our Credit Portfolio Strategies Group (CPSG), in accordance with specifically approved mandates.
CPSG manages the residual credit risk of loans and lending-related commitments of the institutional and corporate creditportfolio, the leveraged portfolio and the medium-sized German companies’ portfolio within our CIB Division.
Acting as a central pricing reference, CPSG provides the businesses with an observed or derived capital market rate for loanapplications; however, the decision of whether or not the business can enter into the credit risk remains exclusively with CreditRisk Management.
CPSG is concentrating on two primary objectives within the credit risk framework to enhance risk management discipline,improve returns and use capital more efficiently:
– to reduce single-name credit risk concentrations within the credit portfolio and– to manage credit exposures by utilizing techniques including loan sales, securitization via collateralized loan obligations,
sub-participations and single-name and portfolio credit default swaps.
Netting and collateral arrangements for derivatives and Securities Financing TransactionsNetting is applicable to both exchange traded derivatives and OTC derivatives. Netting is also applied to securities financingtransactions (e.g. repurchase, securities lending and margin lending transactions) as far as documentation, structure andnature of the risk mitigation allow netting with the underlying credit risk.
All exchange traded derivatives are cleared through central counterparties (CCPs), which interpose themselves between thetrading entities by becoming the counterparty to each of the entities. Where legally required or where available and to theextent agreed with our counterparties, we also use CCP clearing for our OTC derivative transactions.
The Dodd-Frank Act and related Commodity Futures Trading Commission (CFTC) rules introduced in 2013 mandatory CCPclearing in the United States for certain standardized OTC derivative transactions, including certain interest rate swaps andindex credit default swaps. Additionally, the CFTC adopted final rules in 2016 that require additional interest rate swaps to becleared on a phased implementation schedule that ended in October 2018. The European Regulation (EU) No 648/2012 onOTC Derivatives, Central Counterparties and Trade Repositories (EMIR) and the Commission Delegated Regulations(EU) 2015/2205, (EU) 2015/592 and (EU) 2016/1178 based thereupon introduced mandatory CCP clearing in the EU clearingfor certain standardized OTC derivatives transactions. Mandatory CCP clearing in the EU began for certain interest ratederivatives on June 21, 2016 and for certain iTraxx-based credit derivatives and additional interest rate derivatives onFebruary 9, 2017. Article 4 (2) of EMIR authorizes competent authorities to exempt intragroup transactions from mandatoryCCP clearing, provided certain requirements, such as full consolidation of the intragroup transactions and the application ofan appropriate centralized risk evaluation, measurement and control procedure are met. The Bank successfully applied forthe clearing exemption for most of its regulatory-consolidated subsidiaries with intragroup derivatives, including e.g., DeutscheBank Securities Inc. and Deutsche Bank Luxembourg S.A. As of December 31, 2018, the Bank is allowed to make use of hasobtained intragroup exemptions from the EMIR clearing obligation for 68 bilateral intragroup relationships. The extent of theexemptions differs as not all entities enter into relevant transaction types subject to the clearing obligation. Of the 68 intragrouprelationships, 17 are relationships where both entities are established in the Union (EU) for which a full exemption has beengranted, and 51 are relationships where one is established in a third country (“Third Country Relationship”). Third CountryRelationships required repeat applications for each new asset class being subject to the clearing obligation; the process tookplace in the course of 2017. Such repeat applications have been filed for 39 of the Third Country Relationships, with one ofthose entities having been liquidated in the meantime. Due to “Brexit”, the status of some group entities changes from an EUentity to a third country entity in March 2019. There are two affected UK group entities, but we have not applied for any EMIRclearing exemption for those entities.
The rules and regulations of CCPs typically provide for the bilateral set off of all amounts payable on the same day and in thesame currency (“payment netting”) thereby reducing our settlement risk. Depending on the business model applied by theCCP, this payment netting applies either to all of our derivatives cleared by the CCP or at least to those that form part of thesame class of derivatives. Many CCP rules and regulations also provide for the termination, close-out and netting of all clearedtransactions upon the CCP’s default (“close-out netting”), which reduced our credit risk. In our risk measurement and riskassessment processes we apply close-out netting only to the extent we have satisfied ourselves of the legal validity andenforceability of the relevant CCP’s close-out netting provisions.

69
Deutsche Bank Risk and Capital ManagementAnnual Report 2018 Credit Risk Management
In order to reduce the credit risk resulting from OTC derivative transactions, where CCP clearing is not available, we regularlyseek the execution of standard master agreements (such as master agreements for derivatives published by the InternationalSwaps and Derivatives Association, Inc. (ISDA) or the German Master Agreement for Financial Derivative Transactions) withour counterparts. A master agreement allows for the close-out netting of rights and obligations arising under derivativetransactions that have been entered into under such a master agreement upon the counterparty’s default, resulting in a singlenet claim owed by or to the counterparty. For parts of the derivatives business (e.g., foreign exchange transactions) we alsoenter into master agreements under which payment netting applies in respect to transactions covered by such masteragreements, reducing our settlement risk. In our risk measurement and risk assessment processes we apply close-out nettingonly to the extent we have satisfied ourselves of the legal validity and enforceability of the master agreement in all relevantjurisdictions.
Also, we enter into credit support annexes (CSA) to master agreements in order to further reduce our derivatives-related creditrisk. These annexes generally provide risk mitigation through periodic, usually daily, margining of the covered exposure. TheCSAs also provide for the right to terminate the related derivative transactions upon the counterparty’s failure to honor amargin call. As with netting, when we believe the annex is enforceable, we reflect this in our exposure measurement.
The Dodd-Frank Act and CFTC rules thereunder, including CFTC rule § 23.504, as well as EMIR and Commission DelegatedRegulation based thereupon, namely Commission Delegated Regulation (EU) 2016/2251, introduced the mandatory use ofmaster agreements and related CSAs, which must be executed prior to or contemporaneously with entering into an unclearedOTC derivative transaction. Similar documentation requirements can be found in the U.S. margin rules adopted by U.S.prudential regulators. Under those rules, we are required to post and collect initial margin and variation margin for ourderivatives exposures with other derivatives dealers, as well as with our counterparties that (a) are “financial end users,” asthat term is defined in the U.S. margin rules, and (b) have an average daily aggregate notional amount of uncleared swaps,uncleared security-based swaps, foreign exchange forwards and foreign exchange swaps exceeding U.S.$ 8 billion in June,July and August of the previous calendar year. The U.S. margin rules additionally require us to post and collect variationmargin for our derivatives with other financial end user counterparties. These margin requirements are subject to aU.S.$ 50 million threshold for initial margin and a zero threshold for variation margin, with a combined U.S.$ 500,000 minimumtransfer amount. The U.S. margin requirements have been in effect for large banks since September 2016, with additionalvariation margin requirements having come into effect March 1, 2017 and additional initial margin requirements phased in onan annual basis from September 2017 through September 2020.
Under Commission Delegated Regulation (EU) 2016/2251, which implements the EMIR margin requirements, the CSA mustprovide for daily valuation and daily variation margining based on a zero threshold and a minimum transfer amount of notmore than € 500,000. For large derivative exposures exceeding € 8 billion, initial margin has to be posted as well. The variationmargin requirements under EMIR apply as of March 1, 2017; the initial margin requirements will be subject to a staged phase-in until September 1, 2020. Under Article 31 of Commission Delegated Regulation (EU) 2016/2251, an EU party may decideto not exchange margin with counterparties in certain non-netting jurisdictions provided certain requirements are met. Pursuantto Article 11 (5) to (10) of EMIR competent authorities are authorized to exempt intragroup transactions from the marginingobligation, provided certain requirements are met. While some of those requirements are the same as for the EMIR clearingexemptions (see above), there are additional requirements such as the absence of any current or foreseen practical or legalimpediment to the prompt transfer of funds or repayment of liabilities between intragroup counterparties. The Bank plans tomake use of this exemption. The Bank has successfully applied for the collateral exemption for some of its regulatory-consolidated subsidiaries with intragroup derivatives, including, e.g., Deutsche Bank Securities Inc. and Deutsche BankLuxembourg S.A. As of December 31, 2018, the Bank has obtained intragroup exemptions from the EMIR collateral obligationfor 14 bilateral intragroup relationships which are published under https://www.db.com/company/en/intra-group-exemptions--margining.htm. For further 10 bilateral intragroup relationships, the EMIR margining exemption may be used based on Article11 (5) of EMIR, i.e. without the need for any application, because both entities are established in the same EU Member State.Due to “Brexit”, the status of two intragroup entities will change from an EU entity to that of a third country entity on March 29,2019. This may trigger the need for a new application the process of which is currently under discussion with the nationalcompetent authority.
Certain CSAs to master agreements provide for rating-dependent triggers, where additional collateral must be pledged if aparty’s rating is downgraded. We also enter into master agreements that provide for an additional termination event upon aparty’s rating downgrade. These downgrade provisions in CSAs and master agreements usually apply to both parties but insome agreements may apply to us only. We analyze and monitor our potential contingent payment obligations resulting froma rating downgrade in our stress testing approach for liquidity risk on an ongoing basis. For an assessment of the quantitativeimpact of a downgrading of our credit rating please refer to table “Stress Testing Results” in the section “Liquidity Risk”.
70
Deutsche Bank 1 – Management ReportAnnual Report 2018
Concentrations within Credit Risk mitigationConcentrations within credit risk mitigations taken may occur if a number of guarantors and credit derivative providers withsimilar economic characteristics are engaged in comparable activities with changes in economic or industry conditionsaffecting their ability to meet contractual obligations. We use a range of tools and metrics to monitor our credit risk mitigatingactivities.
For more qualitative and quantitative details in relation to the application of credit risk mitigation and potential concentrationeffects please refer to the section “Maximum Exposure to Credit Risk”.
Managing Credit Risk on portfolio level
On a portfolio level, significant concentrations of credit risk could result from having material exposures to a number ofcounterparties with similar economic characteristics, or who are engaged in comparable activities, where these similaritiesmay cause their ability to meet contractual obligations to be affected in the same manner by changes in economic or industryconditions.
Our portfolio management framework supports a comprehensive assessment of concentrations within our credit risk portfolioin order to keep concentrations within acceptable levels.
Industry risk managementTo manage industry risk, we have grouped our corporate and financial institutions counterparties into various industry sub-portfolios. Portfolios are regularly reviewed with the frequency of review according to portfolio size and risk profile as well asrisk developments. Larger / riskier portfolios are reviewed at least on an annual basis. Reviews highlight industry developmentsand risks to our credit portfolio, review cross-risk concentration risks, analyze the risk/reward profile of the portfolio andincorporate the results of an economic downside stress test. Finally, this analysis is used to define the credit strategies for theportfolio in question.
In our Industry Limit framework, thresholds are established for aggregate credit limits to counterparties within each industrysub-portfolio. Regular overviews are prepared for the Enterprise Risk Committee to discuss recent developments and to agreeon actions where necessary
Beyond credit risk, our Industry Risk Framework comprises of Market Risk thresholds for Traded Credit Positions while keynon-financial risks are closely monitored.
Country risk managementAvoiding undue concentrations from a regional perspective is also an integral part of our credit risk management framework.In order to achieve this, country risk limits are applied to Emerging Markets as well as selected Developed Markets countries(based on internal country risk ratings). Similar to industry risk, country portfolios are regularly reviewed with the frequency ofreview according to portfolio size and risk profile as well as risk developments. Larger / riskier portfolios are reviewed at leaston an annual basis. These reviews assess key macroeconomic developments and outlook, review portfolio composition andcross-risk concentration risks and analyze the risk/reward profile of the portfolio. Based on this, thresholds and strategies areset for countries and, where relevant, for the region as a whole.
In our Country Limit framework, thresholds are established for counterparty credit risk exposures in a given country to managethe aggregated credit risk subject to country-specific economic and political events. These thresholds include exposures toentities incorporated locally as well as subsidiaries of foreign multinational corporations. Also, gap risk thresholds are set tocontrol the risk of loss due to intra-country wrong-way risk exposure.
Beyond credit risk, our Country Risk Framework comprises Market Risk thresholds for trading positions in emerging marketsthat are based on the P&L impact of potential stressed market events on these positions. Furthermore we take intoconsideration treasury risk comprising thresholds for capital positions and intra-group funding exposure of Deutsche Bankentities in above countries given the transfer risk inherent in these cross-border positions. Key non-financial risks are closelymonitored.

71
Deutsche Bank Risk and Capital ManagementAnnual Report 2018 Credit Risk Management
Our country risk ratings represent a key tool in our management of country risk. They are established by the independentERM Risk Research function within Deutsche Bank and include:
– Sovereign rating: A measure of the probability of the sovereign defaulting on its foreign or local currency obligations.– Transfer risk rating: A measure of the probability of a “transfer risk event”, i.e., the risk that an otherwise solvent debtor is
unable to meet its obligations due to inability to obtain foreign currency or to transfer assets as a result of direct sovereignintervention.
– Event risk rating: A measure of the probability of major disruptions in the market risk factors relating to a country (interestrates, credit spreads, etc.). Event risks are measured as part of our event risk scenarios, as described in the section “MarketRisk Measurement” of this report.
All sovereign and transfer risk ratings are reviewed, at least on an annual basis.
Product/Asset class specific risk managementComplementary to our counterparty, industry and country risk approach, we focus on product/asset class specific riskconcentrations and selectively set limits, thresholds or indicators where required for risk management purposes. Specific risklimits are set in particular if a concentration of transactions of a specific type might lead to significant losses under certainconditions. In this respect, correlated losses might result from disruptions of the functioning of financial markets, significantmoves in market parameters to which the respective product is sensitive, macroeconomic default scenarios or other factors.Specific focus is put on concentrations of transactions with underwriting risks where we underwrite commitments with theintention to sell down or distribute part of the risk to third parties. These commitments include the undertaking to fund bankloans and to provide bridge loans for the issuance of public bonds. The risk is that we may not be successful in the distributionof the facilities, meaning that we would have to hold more of the underlying risk for longer periods of time than originallyintended. These underwriting commitments are additionally exposed to market risk in the form of widening credit spreads. Wedynamically hedge this credit spread risk to be within the approved market risk limit framework.
A major asset class, in which DB is active in underwriting, is leverage lending, which we mainly execute through our LeveragedDebt Capital Markets (LDCM) business unit. The business model is a fee-based ‚originate to distribute‘ approach based onthe distribution of largely unfunded underwriting commitments into the capital market. The aforementioned risks regardingdistribution and credit spread movement apply to this business unit, however, are managed under a range of specific notionalas well as market risk limits. The latter require the business to also hedge its underwriting pipeline against market dislocations.The fee-based model of our LDCM business unit includes a restrictive approach to related credit exposures retained on DB‘sbalance sheet, which results in low hold levels for individual clients leading to a diversified overall portfolio without any materialconcentration risks. The resulting longer-term on-balance sheet portfolio is also subject to a credit limit and hedging framework.
In addition to underwriting risk, we also focus on concentration of transactions with specific risk dynamics (including risk tocommercial real estate and risk from securitization positions).
Furthermore, in our PCC businesses, we apply product-specific strategies setting our risk appetite for sufficientlyhomogeneous portfolios, such as the retail portfolios of mortgages and business and consumer finance products. In WealthManagement, target levels are set for global concentrations along products as well as based on type and liquidity of collateral.

72
Deutsche Bank 1 – Management ReportAnnual Report 2018
Market Risk Management
Market Risk framework
The vast majority of our businesses are subject to market risk, defined as the potential for change in the market value of ourtrading and invested positions. Risk can arise from changes in interest rates, credit spreads, foreign exchange rates, equityprices, commodity prices and other relevant parameters, such as market volatility and market implied default probabilities.
One of the primary objectives of Market Risk Management, a part of our independent Risk function, is to ensure that ourbusiness units’ risk exposure is within the approved appetite commensurate with its defined strategy. To achieve this objective,Market Risk Management works closely together with risk takers (“the business units”) and other control and support groups.
We distinguish between three substantially different types of market risk:
– Trading market risk arises primarily through the market-making and client facilitation activities of the Corporate &Investment Bank Corporate Division. This involves taking positions in debt, equity, foreign exchange, other securities andcommodities as well as in equivalent derivatives.
– Traded default risk arising from defaults and rating migrations relating to trading instruments.– Nontrading market risk arises from market movements, primarily outside the activities of our trading units, in our banking
book and from off-balance sheet items. This includes interest rate risk, credit spread risk, investment risk and foreignexchange risk as well as market risk arising from our pension schemes, guaranteed funds and equity compensation.Nontrading market risk also includes risk from the modeling of client deposits as well as savings and loan products.
Market Risk Management governance is designed and established to promote oversight of all market risks, effective decision-making and timely escalation to senior management.
Market Risk Management defines and implements a framework to systematically identify, assess, monitor and report ourmarket risk. Market risk managers identify market risks through active portfolio analysis and engagement with the businessunits.
Market Risk measurement
We aim to accurately measure all types of market risks by a comprehensive set of risk metrics embedding accounting,economic and regulatory considerations.
We measure market risks by several internally developed key risk metrics and regulatory defined market risk approaches.
Trading Market Risk
Our primary mechanism to manage trading market risk is the application of our risk appetite framework of which the limitframework is a key component. Our Management Board, supported by Market Risk Management, sets group-wide value-at-risk, economic capital and portfolio stress testing limits for market risk in the trading book. Market Risk Management allocatesthis overall appetite to our Corporate Divisions and individual business units within them based on established and agreedbusiness plans. We also have business aligned heads within Market Risk Management who establish business limits, byallocating the limit down to individual portfolios, geographical regions and types of market risks.
Value-at-risk, economic capital and portfolio stress testing limits are used for managing all types of market risk at an overallportfolio level. As an additional and important complementary tool for managing certain portfolios or risk types, Market RiskManagement performs risk analysis and business specific stress testing. Limits are also set on sensitivity andconcentration/liquidity, exposure, business-level stress testing and event risk scenarios, taking into consideration businessplans and the risk vs return assessment.
Business units are responsible for adhering to the limits against which exposures are monitored and reported. The market risklimits set by Market Risk Management are monitored on a daily, weekly and monthly basis, dependent on the risk managementtool being used.
73
Deutsche Bank Risk and Capital ManagementAnnual Report 2018 Market Risk Management
Internally developed Market Risk Models
Value-at-Risk (VaR)
VaR is a quantitative measure of the potential loss (in value) of Fair Value positions due to market movements that should notbe exceeded in a defined period of time and with a defined confidence level.
Our value-at-risk for the trading businesses is based on our own internal model. In October 1998, the German BankingSupervisory Authority (now the BaFin) approved our internal model for calculating the regulatory market risk capital for ourgeneral and specific market risks. Since then the model has been continually refined and approval has been maintained.
We calculate VaR using a 99 % confidence level and a one day holding period. This means we estimate there is a 1 in 100chance that a mark-to-market loss from our trading positions will be at least as large as the reported VaR. For regulatorypurposes, which include the calculation of our risk-weighted assets, the holding period is ten days.
We use one year of historical market data as input to calculate VaR. The calculation employs a Monte Carlo Simulationtechnique, and we assume that changes in risk factors follow a well-defined distribution, e.g. normal or non-normal (t, skew-t,Skew-Normal). To determine our aggregated VaR, we use observed correlations between the risk factors during this one yearperiod.
Our VaR model is designed to take into account a comprehensive set of risk factors across all asset classes. Key risk factorsare swap/government curves, index and issuer-specific credit curves, funding spreads, single equity and index prices, foreignexchange rates, commodity prices as well as their implied volatilities. To help ensure completeness in the risk coverage,second order risk factors, e.g. CDS index vs. constituent basis, money market basis, implied dividends, option-adjustedspreads and precious metals lease rates are considered in the VaR calculation.
For each business unit a separate VaR is calculated for each risk type, e.g. interest rate risk, credit spread risk, equity risk,foreign exchange risk and commodity risk. For each risk type this is achieved by deriving the sensitivities to the relevant risktype and then simulating changes in the associated risk drivers. “Diversification effect” reflects the fact that the total VaR on agiven day will be lower than the sum of the VaR relating to the individual risk types. Simply adding the VaR figures of theindividual risk types to arrive at an aggregate VaR would imply the assumption that the losses in all risk types occursimultaneously.
The model incorporates both linear and, especially for derivatives, nonlinear effects through a combination of sensitivity-basedand revaluation approaches.
The VaR measure enables us to apply a consistent measure across all of our fair value businesses and products. It allows acomparison of risk in different businesses, and also provides a means of aggregating and netting positions within a portfolioto reflect correlations and offsets between different asset classes. Furthermore, it facilitates comparisons of our market riskboth over time and against our daily trading results.
When using VaR estimates a number of considerations should be taken into account. These include:
– The use of historical market data may not be a good indicator of potential future events, particularly those that are extremein nature. This “backward-looking” limitation can cause VaR to understate future potential losses (as in 2008), but can alsocause it to be overstated.
– Assumptions concerning the distribution of changes in risk factors, and the correlation between different risk factors, maynot hold true, particularly during market events that are extreme in nature. The one day holding period does not fully capturethe market risk arising during periods of illiquidity, when positions cannot be closed out or hedged within one day.
– VaR does not indicate the potential loss beyond the 99 th quantile.– Intra-day risk is not reflected in the end of day VaR calculation.– There may be risks in the trading or banking book that are partially or not captured by the VaR model.
We are committed to the ongoing development of our internal risk models, and we allocate substantial resources to reviewing,validating and improving them. Additionally, we have further developed and improved our process of systematically capturingand evaluating risks currently not captured in our value-at-risk model. An assessment is made to determine the level ofmateriality of these risks and material risks are prioritized for inclusion in our internal model. Risks not in value-at-risk aremonitored and assessed on a regular basis through our Risk Not In VaR (RNIV) framework.
74
Deutsche Bank 1 – Management ReportAnnual Report 2018
Stressed Value-at-Risk
Stressed Value-at-Risk (SVaR) calculates a stressed value-at-risk measure based on a one year period of significant marketstress. We calculate a stressed value-at-risk measure using a 99 % confidence level. The holding period is one day for internalpurposes and ten days for regulatory purposes. Our SVaR calculation utilizes the same systems, trade information andprocesses as those used for the calculation of value-at-risk. The only difference is that historical market data and observedcorrelations from a period of significant financial stress (i.e., characterized by high volatilities) is used as an input for the MonteCarlo Simulation.
The time window selection process for the stressed value-at-risk calculation is based on the identification of a time windowcharacterized by high levels of volatility in the top value-at-risk contributors. The identified window is then further validated bycomparing the SVaR results to neighboring windows using the complete Group portfolio.
Incremental Risk Charge
Incremental Risk Charge captures default and credit rating migration risks for credit-sensitive positions in the trading book. Itapplies to credit products over a one-year capital horizon at a 99.9 % confidence level, employing a constant positionapproach. We use a Monte Carlo Simulation for calculating incremental risk charge as the 99.9 % quantile of the portfolio lossdistribution and for allocating contributory incremental risk charge to individual positions.
The model captures the default and migration risk in an accurate and consistent quantitative approach for all portfolios.Important parameters for the incremental risk charge calculation are exposures, recovery rates, maturity ratings withcorresponding default and migration probabilities and parameters specifying issuer correlations.
Comprehensive Risk Measure
Comprehensive Risk Measure captures incremental risk for the corporate correlation trading portfolio calculated using aninternal model subject to qualitative minimum requirements as well as stress testing requirements. The comprehensive riskmeasure for the correlation trading portfolio is based on our own internal model.
We calculate the comprehensive risk measure based on a Monte Carlo Simulation technique to a 99.9 % confidence leveland a capital horizon of one year. Our model is applied to the eligible corporate correlation trading positions where typicalproducts include collateralized debt obligations, nth-to-default credit default swaps, and commonly traded index- and single-name credit default swaps used to risk manage these corporate correlation products.
Trades subject to the comprehensive risk measure have to meet minimum liquidity standards to be eligible. The modelincorporates concentrations of the portfolio and nonlinear effects via a full revaluation approach.
For regulatory reporting purposes, the comprehensive risk measure represents the higher of the internal model spot value atthe reporting dates, their preceding 12-week average calculation, and the floor, where the floor is equal to 8 % of the equivalentcapital charge under the standardized approach securitization framework. Since the first quarter of 2016, the CRM RWAcalculations include two regulatory-prescribed add-ons which cater for (a) stressing the implied correlation within nth-to-defaultbaskets and (b) any stress test loss in excess of the internal model spot value.
The internal model comprehensive risk measure was decommissioned in the fourth quarter of 2018 following regulatoryapproval. The small remaining exposures captured by this model are now covered by the incremental risk charge and themarket risk standardized approach.
Market Risk Standardized Approach
Market Risk Management monitors exposures and concentrations for certain exposures under the specific Market RiskStandardized Approach (“MRSA”). We use the MRSA to determine the regulatory capital charge for the specific market riskof trading book securitizations.
We also use the MRSA to determine the regulatory capital charge for longevity risk as set out in CRR/CRD 4 regulations.Longevity risk is the risk of adverse changes in life expectancies resulting in a loss in value on longevity linked policies andtransactions. For risk management purposes, stress testing and economic capital allocations are also used to monitor andmanage longevity risk. Furthermore, certain types of investment funds require a capital charge under the MRSA. For riskmanagement purposes, these positions are also included in our internal reporting framework.

75
Deutsche Bank Risk and Capital ManagementAnnual Report 2018 Market Risk Management
Market Risk Stress Testing
Stress testing is a key risk management technique, which evaluates the potential effects of extreme market events andmovements in individual risk factors. It is one of the core quantitative tools used to assess the market risk of Deutsche Bank’spositions and complements VaR and Economic Capital. Market Risk Management performs several types of stress testing tocapture the variety of risks (Portfolio Stress Testing, individual specific stress tests and Event Risk Scenarios) and alsocontributes to Group-wide stress testing. These stress tests cover a wide range of severities designed to test the earningsstability and capital adequacy of the bank.
Trading Market Risk Economic Capital (TMR EC)
Our trading market risk economic capital model-scaled Stressed VaR based EC (SVaR based EC) - comprises two corecomponents, the “common risk” component covering risk drivers across all businesses and the “business-specific risk”component, which enriches the Common Risk via a suite of Business Specific Stress Tests (BSSTs). Both components arecalibrated to historically observed severe market shocks. Common risk is calculated using a scaled version of the RegulatorySVaR framework while BSSTs are designed to capture more product/business-related bespoke risks (e.g. complex basisrisks) as well as higher order risks not captured in the common risk component.
Traded Default Risk Economic Capital (TDR EC)
TDR EC captures the relevant credit exposures across our trading and fair value banking books. Trading book exposures aremonitored by MRM via single name concentration and portfolio thresholds which are set based upon rating, size and liquidity.Single name concentration risk thresholds are set for two key metrics: Default Exposure, i.e., the P&L impact of aninstantaneous default at the current recovery rate (RR), and bond equivalent Market Value (MV), i.e. default exposure at 0 %recovery. In order to capture diversification and concentration effects we perform a joint calculation for traded default riskeconomic capital and credit risk economic capital. Important parameters for the calculation of traded default risk are exposures,recovery rates and default probabilities as well as maturities. The probability of joint rating downgrades and defaults isdetermined by the default and rating correlations of the portfolio model. These correlations are specified through systematicfactors that represent countries, geographical regions and industries.
Trading Market Risk Reporting
Market Risk Management reporting creates transparency on the risk profile and facilitates the understanding of core marketrisk drivers to all levels of the organization. The Management Board and Senior Governance Committees receive regularreporting, as well as ad hoc reporting as required, on market risk, regulatory capital and stress testing. Senior Risk Committeesreceive risk information at a number of frequencies, including weekly or monthly.
Additionally, Market Risk Management produces daily and weekly Market Risk specific reports and daily limit utilization reportsfor each business owner.
Regulatory prudent valuation of assets carried at fair value
Pursuant to Article 34 CRR institutions shall apply the prudent valuation requirements of Article 105 CRR to all assetsmeasured at fair value and shall deduct from CET 1 capital the amount of any additional value adjustments necessary.
We determined the amount of the additional value adjustments based on the methodology defined in the CommissionDelegated Regulation (EU) 2016/101.
As of December 31, 2018 the amount of the additional value adjustments was € 1.5 billion. The December 31, 2017 amountwas € 1.2 billion. The increase was largely driven by methodology enhancements throughout the year, with remaining impactsfrom changes in underlying risk exposures and market data moves.
As of December 31, 2018 the reduction of the expected loss from subtracting the additional value adjustments was € 45million, which partly mitigated the negative impact of the additional value adjustments on our CET 1 capital.
76
Deutsche Bank 1 – Management ReportAnnual Report 2018
Nontrading Market Risk
Nontrading market risk arises primarily from outside the activities of our trading units, in our banking book and from certainoff-balance sheet items. Significant market risk factors the Group is exposed to and are overseen by risk management groupsin that area are:
– Interest rate risk (including risk from embedded optionality and changes in behavioral patterns for certain product types),credit spread risk, foreign exchange risk, equity risk (including investments in public and private equity as well as realestate, infrastructure and fund assets).
– Market risks from off-balance sheet items, such as pension schemes and guarantees, as well as structural foreign exchangerisk and equity compensation risk.
Interest Rate Risk in the Banking Book
Interest rate risk in the banking book (IRRBB) is the current or prospective risk, to both the Group's capital and earnings,arising from movements in interest rates, which affect the Group's banking book exposures. This includes gap risk, whicharises from the term structure of banking book instruments, basis risk, which describes the impact of relative changes ininterest rates for financial instruments that are priced using different interest rate curves, as well as option risk, which arisesfrom option derivative positions or from optional elements embedded in financial instruments.
The Group manages its IRRBB exposures using economic value as well as earnings based measures. Our Group Treasurydivision is mandated to manage the interest rate risk centrally, with Market Risk Management acting as an independentoversight function.
Economic value based measures look at the change in economic value of banking book assets, liabilities and off-balancesheet exposures resulting from interest rate movements, independent of the accounting treatment. Thereby the Groupmeasures the change in Economic Value of Equity (∆EVE) as the maximum decrease of the banking book economic valueunder the six standard scenarios defined by Basel Committee on Banking Supervision (BCBS) in addition to internal stressscenarios for risk steering purposes.
Earnings-based measures look at the expected change in Net Interest Income (NII), compared to a defined benchmarkscenario, over a defined time horizon resulting from interest rate movements. Thereby the Group measures ∆NII as themaximum reduction in NII under the six standard scenarios defined by Basel Committee on Banking Supervision (BCBS) inaddition to internal stress scenarios for risk steering purposes, compared to the Group’s official capital planning, over a periodof 12 months.
The Group employs mitigation techniques to immunize the interest rate risk arising from nontrading positions. The interestrate risk arising from nontrading asset and liability positions is managed through Treasury Pool Management, with the mostnotable exception of DB Privat- und Firmenkundenbank AG, where the interest rate risk is managed by a dedicated riskmanagement function. The residual interest rate risk positions are hedged with Deutsche Bank’s trading books within the CIBdivision. The treatment of interest rate risk in our trading portfolios and the application of the value-at-risk model is discussedin the “Trading Market Risk” section of this document.
Positions in our banking books as well as the hedges described in the aforementioned paragraph follow the accountingprinciples as detailed in the “Notes to the Consolidated Financial Statements” section of this document.
The Model Risk Management group performs independent validation of models used for IRRBB measurement in line withDeutsche Bank’s group-wide risk governance framework.
The calculation of VaR and sensitivities of interest rate risk is performed daily, whereas the measurement and reporting ofeconomic value interest rate and earnings risk is performed on a monthly basis. The Group generally uses the same metricsin its internal management systems as it applies for the disclosure in this report. This is applicable to both the methodology aswell as the modelling assumptions used when calculating the metrics. The only notable exception is the usage of a steady(i.e. unchanged) rates scenario as benchmark for the ∆NII calculation in the public disclosures, whereas the internalquantitative risk appetite metric will use the Group’s official capital planning curve.
Deutsche Bank’s key modelling assumptions are applied to the positions in our PCB division and parts of our CIB Division.Those positions are subject to risk of changes in our client’s behavior with regard to their deposits as well as loan products.

77
Deutsche Bank Risk and Capital ManagementAnnual Report 2018 Market Risk Management
The Group manages the interest rate risk exposure of its Non-Maturity Deposits (NMDs) through a replicating portfolioapproach to determine the average repricing maturity of the portfolio. For the purpose of constructing the replicating portfolio,the portfolio of NMDs is clustered by dimensions such as Business Unit, Currency, Product and Geographical Location. Themain dimensions influencing the repricing maturity are elasticity of deposit rates to market interest rates, volatility of depositbalances and observable client behavior. For the reporting period the average repricing maturity assigned across all suchreplicating portfolio is 1.8 years and Deutsche Bank uses 15 years as the longest repricing maturity.
In the Loan and some of the Term deposit products Deutsche Bank considers early prepayment/withdrawal behavior of itscustomers. The parameters are based on historical observations, statistical analyses and expert assessments.
Furthermore, the Group generally calculates IRRBB related metrics in contractual currencies and aggregates the resultingmetrics for reporting purposes. When calculating economic value based metrics the commercial margin is excluded to materialparts.
Credit Spread Risk in the Banking Book
Deutsche Bank is exposed to credit spread risk of bonds held in the banking book, mainly as part of the Treasury LiquidityReserves portfolio and in DB Privat- und Firmenkundenbank AG. This risk category is closely associated with interest rate riskin the banking book as changes in the perceived credit quality of individual instruments may result in fluctuations in spreadsrelative to underlying interest rates.
Foreign exchange risk
Foreign exchange risk arises from our nontrading asset and liability positions that are denominated in currencies other thanthe functional currency of the respective entity. The majority of this foreign exchange risk is transferred through internal hedgesto trading books within Corporate & Investment Bank and is therefore reflected and managed via the value-at-risk figures inthe trading books. The remaining foreign exchange risks that have not been transferred are mitigated through match fundingthe investment in the same currency, so that only residual risk remains in the portfolios. Small exceptions to above approachfollow the general Market Risk Management monitoring and reporting process, as outlined for the trading portfolio.
The bulk of nontrading foreign exchange risk is related to unhedged structural foreign exchange exposure, mainly in our U.S.,U.K. and China entities. Structural foreign exchange exposure arises from local capital (including retained earnings) held inthe Group’s consolidated subsidiaries and branches and from investments accounted for at equity. Change in foreignexchange rates of the underlying functional currencies are booked as Currency Translation Adjustments (CTA).
The primary objective for managing our structural foreign exchange exposure is to stabilize consolidated capital ratios fromthe effects of fluctuations in exchange rates. Therefore the exposure remains unhedged for a number of core currencies withconsiderable amounts of risk-weighted assets denominated in that currency in order to avoid volatility in the capital ratio forthe specific entity and the Group as a whole.
Equity and investment risk
Nontrading equity risk arising predominantly from our non-consolidated investment holdings in the banking book and from ourequity compensation plans.
Our non-consolidated investment holdings in the banking book are categorized into strategic and alternative investmentassets. Strategic investments typically relate to acquisitions made to support our business franchise and are undertaken witha medium to long-term investment horizon. Alternative assets are comprised of principal investments and other non-strategicinvestment assets. Principal investments are direct investments in private equity (including leveraged buy-out fundcommitments and equity bridge commitments), real estate (including mezzanine debt) and venture capital, undertaken forcapital appreciation. In addition, principal investments are made in hedge funds and mutual funds in order to establish a trackrecord for sale to external clients. Other non-strategic investment assets comprise assets recovered in the workout ofdistressed positions or other legacy investment assets in private equity and real estate of a non-strategic nature.

78
Deutsche Bank 1 – Management ReportAnnual Report 2018
Pension risk
We are exposed to market risk from a number of defined benefit pension schemes for past and current employees. The abilityof the pension schemes to meet the projected pension payments is maintained through investments and ongoing plancontributions. Market risk materializes due to a potential decline in the market value of the assets or an increase in the liabilityof each of the pension plans. Market Risk Management monitors and reports all market risks both on the asset and liabilityside of our defined benefit pension plans including interest rate risk, inflation risk, credit spread risk, equity risk and longevityrisk. Overall, the Group seeks to minimize the impact of adverse market movements to key financial metric, with the primaryobjective on protecting the overall IFRS funded status, however in selected markets with the aim to balance competing keyfinancial metrics. The investment managers manage the pension assets in line with investment mandates or guidelines asagreed with the pension plans’ trustees and investment committees. For key defined benefit plans for which the Bank aims toprotect the IFRS funded status, the Group applies a liability driven investment (LDI) approach. Risks from mismatches betweenfluctuations in the present value of the defined benefit obligations and plan assets due to capital market movements areminimized, subject to balancing relevant trade-offs. For pension plans where the LDI approach may impact other key financialmetrics adversely, the Group deviates from this primary investment strategy, most notably for the German main plan wherethe investment strategy for assets has been adjusted since 2015 by reducing the interest rate & credit spread hedges. Thedevelopment of the impact of this investment strategy is being closely monitored and regularly reviewed.
For details on our defined benefit pension obligation see Note 35 “Employee Benefits” to the consolidated financial statements.
Other risks
Market risks in our Asset Management business primarily result from principal guaranteed funds or accounts, but also fromco-investments in our funds.
Nontrading Market Risk Economic Capital
Nontrading market risk economic capital is calculated either by applying the standard traded market risk EC methodology orthrough the use of non-traded market risk models that are specific to each risk class and which consider, among other factors,historically observed market moves, the liquidity of each asset class, and changes in client’s behavior in relation to productswith behavioral optionalities.
Operational risk management
Operational risk management framework
Operational risk means the risk of loss resulting from inadequate or failed internal processes, people and systems or fromexternal events, and includes legal risk. Operational risk excludes business and reputational risk. It forms a subset of thebank’s non-financial risks, as does reputational risk.
The governance of our operational risks follows the bank’s Three Lines of Defence (3LoD) approach to manage all of its risks,financial and non-financial. The 3LoD approach aims to protect the bank, its customers and shareholders against risk lossesand resulting reputational damages. It seeks to ensure that all our operational risks are identified and covered, thataccountabilities regarding the management of operational risks are clearly assigned and risks are taken on and managed inthe best and long term interest of the bank. The 3LoD approach and its underlying principles, i.e., the full accountability of theFirst Line of Defence (1st LoD) to manage its own risks and the existence of an independent Second Line of Defence (2ndLoD) to oversee and challenge risk taking and risk management within the bank’s defined risk appetite, apply to all levels ofthe organization including the Group-level, regions, countries, and legal entities.
Deutsche Bank’s operational risk appetite sets out the amount of operational risk we are willing to accept as a consequenceof doing business. We take on operational risks consciously, both strategically as well as in day-to-day business. While thebank may have no appetite for certain types of operational risk failures (such as serious violations of laws or regulations andmisconduct), in other cases a certain amount of operational risk must be accepted if the bank is to achieve its businessobjectives. In case a residual risk is assessed to be outside our risk appetite, further risk reducing actions must be undertaken,including to further remediate risks, insure risks or cease business.

79
Deutsche Bank Risk and Capital ManagementAnnual Report 2018 Operational risk management
Non-Financial Risk Management (NFRM) is the risk function for the non-financial risk types of the bank, including operationalrisk, and owns the overarching Operational Risk Management Framework (ORMF).
The ORMF is a set of interrelated tools and processes that are used to identify, assess, measure, monitor and remediateoperational risks. Its components have been designed to operate together to provide a comprehensive approach to managingthe bank’s most material operational risks. ORMF components include the setup of the 1st and 2nd LoD as well as roles andresponsibilities for the operational risk management process and appropriate independent challenge, the Group’s approachto setting operational risk appetite and adhering to it, the operational risk type and control taxonomies, the minimum standardsfor operational risk management processes including tools, independent governance, and the bank’s operational risk capitalmodel.
The bank established and follows three OR governance standards including core roles and their respective mandates for themanagement of operational risks:
Operational risk governance standard I: NFRM owns the ORMF and determines the sufficient level of operational risk capital.
– As the 2nd LoD control function, NFRM defines the bank’s approach to operational risk appetite and monitors its adherence,breaches and consequences. It is the independent reviewer and challenger of the 1st LoD’s risk and control assessmentsand risk management activities. NFRM provides the oversight of risk and control mitigation plans to return the bank’soperational risk to its risk appetite where required. It also establishes and regularly reports the bank’s operational risk profileand top risks.
– As the subject matter expert for operational risk, NFRM provides independent risk views to facilitate forward lookingmanagement of operational risks, actively engages with risk owners and facilitates the implementation of risk managementand control standards across the bank.
– NFRM is to ensure that sufficient capital is held to underpin the bank’s operational risks. NFRM is accountable for thedesign, implementation and maintenance of the approach to determine the adequate level of capital required for operationalrisk for recommendation to the Management Board. This includes the calculation and allocation of operational risk capitaldemand and expected loss under the Advanced Measurement Approach (AMA).
Operational risk governance standard II: Risk owners as the 1st LoD have full accountability for their operational risksand manage these against a defined risk specific appetite.
Risk owners are those roles in the bank that generate risks, whether financial or non-financial. As heads of business divisionsand infrastructure functions they must determine the appropriate organizational structure to identify their organizations’operational risk profile, implement risk management and control standards within their organization, take business decisionson the mitigation or acceptance of operational risks within the risk appetite and establish and maintain primary controls.
Operational risk governance standard III: Risk Type Controllers (“RTCs”) act as the 2nd LoD control functions for operationalrisks.
RTCs establish the framework and define risk appetite statements for the specific operational risk type they control. Theymonitor the risk type’s profile against risk appetite and exercise a veto on risk appetite breaches. RTCs define the riskmanagement and control standards and independently oversee and challenge risk owners’ implementation of these standardsas well as their risk-taking and management activities. RTCs establish independent operational risk governance and prepareaggregated risk type profile reporting. As risk type experts, RTCs define the risk type and its taxonomy and support andfacilitate the implementation of risk management standards and processes in the 1st LoD. To maintain their independence,RTC roles are located only in infrastructure functions. Giving advice does not impact the independence of the RTC.
Organizational & governance structure
While the day-to-day management of operational risk is the primary responsibility of our business divisions and infrastructurefunctions as risk owners, NFRM oversees the Group-wide management of operational risks, identifies and reports riskconcentrations, and promotes a consistent application of the ORMF across the bank. NFRM is part of the Group risk functionwhich is headed by the Chief Risk Officer.
The Chief Risk Officer appoints the Head of NFRM who is accountable for the design, implementation and maintenance of aneffective, efficient and regulatory compliant ORMF, including the operational risk capital model. The Head of NFRM monitorsand challenges the ORMF’s implementation and monitors overall risk levels against risk appetite.

80
Deutsche Bank 1 – Management ReportAnnual Report 2018
The Non-Financial Risk Committee (NFRC), which is co-chaired by the Chief Risk Officer and the Chief Regulatory Officer, isresponsible for the oversight, governance and coordination of the management of operational risk in the Group on behalf ofthe Management Board by establishing a cross-risk and holistic perspective of the key operational risks of the Group. Itsdecision-making and policy related authorities include the review, advice and management of all operational risk issues whichmay impact the risk profile of our business divisions and infrastructure functions. Several sub-fora with attendees from both,the 1st and 2nd LoDs support the NFRC to effectively fulfil its mandate. In addition to the Group level NFRC, business divisionshave established 1st LoD governance fora for the oversight and management of operational risks on various levels of theorganization.
Managing our operational risk
In order to manage the broad range of risk types underlying operational risk, our ORMF provides a set of tools and processes(as described below, e.g. for loss data collection or the risk & control assessment) that apply to all operational risk types.These enable us to determine our operational risk profile in comparison to our risk appetite for operational risk, tosystematically identify operational risk themes and concentrations, and to define risk mitigating measures and priorities.
In 2018, we enhanced the ORMF and the management of operational risks by focusing on the further simplification of our riskmanagement processes, and by promoting an active and continuous dialogue between the 1st and 2nd LoDs with the objectiveto make the management of operational risks more transparent, meaningful and embedded in day-to-day business decisions:
Loss data collection: In a timely manner, we collect, categorize and analyze data on internal (with a P&L impact ≥ €10.000)and relevant external operational risk events. Material events trigger clearly defined lessons learned and read-acrossanalyses, which are performed in close collaboration between business partners, risk and infrastructure functions. Lessonslearned reviews analyze the causes of significant operational risk events, identify their root causes, and document appropriateremediation actions to reduce the likelihood of their reoccurrence. Read across reviews take the conclusions of the lessonslearned process and seek to analyze whether similar risks and control weaknesses identified in a lessons learned review existin other areas of the bank, even if they have not yet resulted in problems. This allows preventative actions to be undertaken.The intensity of lessons learned and read across activities, the degree of embeddedness and collaboration between variousfunctions working on these analyses has considerably increased through 2018.
We complement our operational risk profile by using a set of scenarios including relevant external cases provided by a publicdatabase and additional internal scenarios. We thereby systematically utilize information on external loss events occurring inthe banking industry to prevent similar incidents from happening to us, for example through particular deep dive analyses orrisk profile reviews.
The Risk & Control Assessment process (RCA) comprises of a series of bottom-up assessments of the risks generated bybusinesses and infrastructure functions (1st LoDs), the effectiveness of the controls in place to manage them, and theremediation actions required to bring the outsized risks back into risk appetite. This enables both the 1st and 2nd LoDs tohave a clear view of the bank’s material operational risks. Through 2018, we finalized the implementation of a workshop basedapproach that fosters close interaction between various relevant parties and started a pilot to integrate various existingassessment processes in NFRM, Compliance and AFC to simplify the process and enhance efficiency. We further enhancedthe bank’s control inventory and introduced a NFR consequence management framework with a clear workflow andconsequence types. The non-financial risk type taxonomy was updated with clearer definitions and supporting guidance.
We regularly report and perform analyses on our top risks. Top risks are rated in terms of both the likelihood that they couldoccur and the impact on the bank should they do so. The reporting provides a forward-looking perspective on the impact ofplanned remediation and control enhancements. It also contains emerging risks and themes that have the potential to evolveas a top risk in future. Top risk reduction programs comprise the most significant risk reduction activities that are key to bringingour operational top risk themes back within risk appetite. In 2018, the reporting of top risks has been enhanced using astrategic reporting tool.
NFR appetite metrics are used to monitor the operational risk profile, including against the bank’s defined risk appetite, andto alert the organization to impending problems in a timely fashion. In 2018, a new NFR appetite approach was introduced,comprising enhanced metrics, an updated Group risk appetite monitor and a deeper embedding at divisional and businessunit level.

81
Deutsche Bank Risk and Capital ManagementAnnual Report 2018 Operational risk management
Operational risk type frameworks
The ORMF, which provides the overarching set of standards, tools and processes that apply to the management of all risktypes underlying operational risk, is complemented by the operational risk type frameworks, risk management and controlstandards and tools set up by the respective risk type controllers for the operational risk types they control. These include thefollowing with respect to the following risk types:
– The Compliance department performs an independent 2nd level control function that protects the bank’s license to operateby promoting and enforcing compliance with the law and driving a culture of compliance and ethical conduct in the bank.The Compliance department assists the businesses and working with other infrastructure functions and regulators toestablish and maintain a risk-based approach to the management of the bank’s compliance risks in accordance with thebank’s risk appetite and to help the bank detect, mitigate and prevent breaches of laws and regulations. The Compliancedepartment performs the following principal activities: regulatory engagement and management collaborating withgovernment & regulatory affairs; acting as a trusted advisor; and identifying, assessing, mitigating, monitoring and reportingon compliance risk. The results of these assessments are regularly reported to the Management Board and SupervisoryBoard.
– Financial crime risks are managed by our AFC function via maintenance and development of a dedicated program. TheAFC program is based on regulatory and supervisory requirements. AFC has defined roles and responsibilities andestablished dedicated functions for the identification and management of financial crime risks resulting from moneylaundering, terrorism financing, non-compliance with sanctions and embargoes as well as other criminal activities includingfraud, bribery and corruption and other crimes. AFC assures further update of its strategy on financial crime prevention viaregular development of internal policies processes and controls, institution-specific risk assessment and staff training.
– Legal (incl. group governance) is an infrastructure function, mandated to provide legal advice both to the ManagementBoard as well as to the business divisions and infrastructure functions and to support the Management Board in setting upand guarding DB’s governance framework and manage the bank’s legal and governance risk. This includes in particularbut without limitation:
– Advising the Management Board and Supervisory Board on legal aspects of their activities– Advising all Deutsche Bank units on adherence to legal and regulatory requirements in relation to all activities– Managing Deutsche Bank Group’s legal relations with third parties, or between Group entities– Supporting other units in managing Deutsche Bank Group’s interactions with regulatory authorities– Engaging and managing external lawyers used by Deutsche Bank Group– Managing Deutsche Bank Group’s litigation and contentious regulatory matters, (incl. contentious HR matters),
and managing Deutsche Bank Group’s response to external regulatory investigations– Advising on legal aspects of internal investigations– Setting the global governance framework for Deutsche Bank, facilitate its cross-unit application and assess the
implementation– Developing and safeguarding efficient corporate governance structures suitable to support efficient decision-
making, to align risk and accountability on the basis of clear and consistent roles and responsibilities– Maintaining Deutsche Bank Group’s framework for policies and procedures and serve as guardian for Group
policies and procedures– Ensuring appropriate quality assurance around all of the above
– NFRM RTC is risk type controller for a number of operational risks. Its mandate includes controls over transactionprocessing activities, as well as infrastructure risks to prevent technology or process disruption, maintain the confidentiality,integrity and availability of data, records and information security, and ensure businesses have robust plans in place torecover critical business processes and functions in the event of disruption from technical or building outage, or the effectsof cyber-attack or natural disaster as well as any physical security or safety risk. NFRM RTC also manages the risks arisingfrom the bank’s internal and external vendor engagements via the provision of a comprehensive vendor risk managementframework.
82
Deutsche Bank 1 – Management ReportAnnual Report 2018
Measuring our operational risks
We calculate and measure the regulatory and economic capital requirements for operational risk using the AMA methodology.Our AMA capital calculation is based upon the loss distribution approach. Gross losses from historical internal and externalloss data (Operational Riskdata eXchange Association consortium data) and external scenarios from a public database (IBMOpData) complemented by internal scenario data are used to estimate the risk profile (i.e., a loss frequency and a loss severitydistribution). Our loss distribution approach model includes conservatism by recognizing losses on events that arise overmultiple years as single events in our historical loss profile.
Within the loss distribution approach model, the frequency and severity distributions are combined in a Monte Carlo simulationto generate potential losses over a one year time horizon. Finally, the risk mitigating benefits of insurance are applied to eachloss generated in the Monte Carlo simulation. Correlation and diversification benefits are applied to the net losses in a mannercompatible with regulatory requirements to arrive at a net loss distribution at Group level, covering expected and unexpectedlosses. Capital is then allocated to each of the business divisions after considering qualitative adjustments and expected loss.
The regulatory capital requirement for operational risk is derived from the 99.9 % percentile. Since Q4 2017, the economiccapital is also set at 99.9 % percentile, see the section “Internal Capital Adequacy”. Both regulatory and economic capitalrequirements are calculated for a time horizon of one year.
The regulatory and economic capital demand calculations are performed on a quarterly basis. NFRM aims to ensure that forthe approach for capital demand quantification appropriate development, validation and change governance processes are inplace, whereby the validation is performed by an independent validation function and in line with the Group’s model riskmanagement process.
Drivers for operational risk capital development
In 2018, our total operational risk losses further decreased but continued to be predominantly driven by losses and provisionsarising from civil litigation and regulatory enforcement. Such losses still make up 67 % of operational risk losses and accountfor the majority of operational risk regulatory and economic capital demand, which is more heavily reliant on our long-termloss history. For a description of our current legal and regulatory proceedings, please see section “Current IndividualProceedings” in Note 29 “Provisions” to the consolidated financial statements. The operational risk losses from civil litigationand regulatory enforcement decreased by € 380 million or 67 % while our non-legal operational risk losses were € 86 millionor 48 % lower compared to 2017.
In view of the relevance of legal risks within our operational risk profile, we dedicate specific attention to the management andmeasurement of our open civil litigation and regulatory enforcement matters where the bank relies both on information frominternal as well as external data sources to consider developments in legal matters that affect the bank specifically but alsothe banking industry as a whole. Reflecting the multi-year nature of legal proceedings the measurement of these risksfurthermore takes into account changing levels of certainty by capturing the risks at various stages throughout the lifecycle ofa legal matter.
Conceptually, the bank measures operational risk including legal risk by determining the maximum loss that will not beexceeded with a given probability. This maximum loss amount includes a component that due to the IFRS criteria is reflectedin our financial statements and a component that is expressed as regulatory or economic capital demand beyond the amountreflected as provisions within our financial statements.
The legal losses which the bank expects with a likelihood of more than 50 % are already reflected in our IFRS group financialstatements. These losses include net changes in provisions for existing and new cases in a specific period where the loss isdeemed probable and is reliably measurable in accordance with IAS 37. The development of our legal provisions for civillitigations and regulatory enforcement is outlined in detail in Note 29 “Provisions” to the consolidated financial statements.
Uncertain legal losses which are not reflected in our financial statements as provisions because they do not meet therecognition criteria under IAS 37 are expressed as “regulatory or economic capital demand”.
To quantify the litigation losses in the AMA model the bank takes into account historic losses, provisions, contingent liabilitiesand legal forecasts. Legal forecasts are generally comprised of ranges of potential losses from legal matters that are notdeemed probable but are reasonably possible. Reasonably possible losses may result from ongoing and new legal matterswhich are reviewed at least quarterly by the attorneys handling the legal matters.
We include the legal forecasts in the “relevant loss data” used in our AMA model. Hereby the projection range of the legalforecasts is not restricted to the one year capital time horizon but goes beyond and conservatively assumes early settlementof the underlying losses in the reporting period - thus considering the multi-year nature of legal matters.

83
Deutsche Bank Risk and Capital ManagementAnnual Report 2018 Liquidity Risk Management
Liquidity Risk ManagementLiquidity risk is the risk arising from our potential inability to meet all payment obligations when they come due or only beingable to meet these obligations at excessive costs. The objective of the Group’s liquidity risk management framework is toensure that the Group can fulfill its payment obligations at all times and can manage liquidity and funding risks within its riskappetite. The framework considers relevant and significant drivers of liquidity risk, whether on-balance sheet or off-balancesheet.
Liquidity Risk Management framework
In accordance with the ECB’s Supervisory Review and Evaluation Process (SREP), Deutsche Bank has implemented anannual Internal Liquidity Adequacy Assessment Process (ILAAP), which is reviewed and approved by the Management Board.The ILAAP provides comprehensive documentation of the Bank’s Liquidity Risk Management framework, including: identifyingthe key liquidity and funding risks to which the Group is exposed; describing how these risks are identified, monitored andmeasured and describing the techniques and resources used to manage and mitigate these risks.
The Management Board defines the liquidity and funding risk strategy for the Bank, as well as the risk appetite, based onrecommendations made by the Group Risk Committee (GRC). At least annually the Management Board reviews and approvesthe risk appetite which is applied to the Group to measure and control liquidity risk as well as our long-term funding andissuance plan.
Treasury is mandated to manage the overall liquidity and funding position of the Bank, with Liquidity Risk Management (LRM)acting as an independent control function, responsible for reviewing the liquidity risk framework, proposing the risk appetite toGRC and the validation of Liquidity Risk models which are developed by Treasury, to measure and manage the Group’sliquidity risk profile.
Treasury manages liquidity and funding, in accordance with the Management Board-approved risk appetite across a range ofrelevant metrics, and implements a number of tools to monitor these and ensure compliance. In addition, Treasury worksclosely in conjunction with LRM and the business, to analyze and understand the underlying liquidity characteristics of thebusiness portfolios. These parties are engaged in regular and frequent dialogue to understand changes in the Bank’s positionarising from business activities and market circumstances. Dedicated business targets are allocated to ensure the Groupoperates within its overall liquidity and funding appetite.
The Management Board is informed of performance against the risk appetite metrics, via a weekly Liquidity Dashboard. Aspart of the annual strategic planning process, we project the development of the key liquidity and funding metrics based onthe underlying business plans to ensure that the plan is in compliance with our risk appetite.
Capital Markets Issuance
Deutsche Bank has a wide range of funding sources, including retail and institutional deposits, unsecured and securedwholesale funding and debt issuance in the capital markets. Debt issuance, encompassing senior unsecured bonds, coveredbonds as well as capital securities, is a key source of term funding for the Bank and is managed directly by Treasury. At leastonce a year Treasury submits an annual long-term Funding Plan to the GRC for recommendation and then to the ManagementBoard for approval. This plan is driven by global and local funding and liquidity requirements based on expected businessdevelopment. Our capital markets issuance portfolio is dynamically managed through our yearly issuance plans to avoidexcessive maturity concentrations.
Short-term liquidity and wholesale funding
Deutsche Bank tracks all contractual cash flows from wholesale funding sources, on a daily basis, over a 12-month horizon.For this purpose, we consider wholesale funding to include unsecured liabilities raised primarily by Treasury PoolManagement, as well as secured liabilities raised by our Corporate & Investment Bank Division. Our wholesale fundingcounterparties typically include corporates, banks and other financial institutions, governments and sovereigns.

84
Deutsche Bank 1 – Management ReportAnnual Report 2018
The Group has implemented a set of Management Board-approved limits to restrict the Bank’s exposure to wholesalecounterparties, which have historically shown to be the most susceptible to market stress. The wholesale funding limits aremonitored daily, and apply to the total combined currency amount of all wholesale funding currently outstanding, both securedand unsecured with specific tenor limits covering the first 8 weeks. Our Liquidity Reserves are the primary mitigant againstpotential stress in the short-term.
The tables in section “Liquidity Risk Exposure: Funding Diversification” show the contractual maturity of our short-termwholesale funding and capital markets issuance.
Liquidity stress testing and scenario analysis
Global liquidity stress testing and scenario analysis is one of the key tools for measuring liquidity risk and evaluating theGroup’s short-term liquidity position within the liquidity framework. It complements the daily operational cash managementprocess. The long-term liquidity strategy based on contractual and behavioral modelled cash flow information is representedby the Funding Matrix.
Our global liquidity stress testing process is managed by Treasury in accordance with the Management Board approved riskappetite. Treasury is responsible for the design of the overall methodology, the choice of liquidity risk drivers and thedetermination of appropriate assumptions (parameters) to translate input data into model results. Liquidity Risk Managementis responsible for the definition of the stress scenarios and the independent validation of liquidity risk models. Liquidity andTreasury Reporting & Analysis (LTRA) is responsible for implementing these methodologies in conjunction with Treasury,LRM and IT as well as for the stress test calculation.
We use stress testing and scenario analysis to evaluate the impact of sudden and severe stress events on our liquidity position.The scenarios we apply are based on systemic historic events, such as the 2008 financial markets crisis as well asidiosyncratic events.
Deutsche Bank has selected four scenarios to calculate the Group’s stressed Net Liquidity Position (“sNLP”). These scenarioscapture the historical experience of Deutsche Bank during periods of idiosyncratic and/or market-wide stress and are assumedto be both plausible and sufficiently severe as to materially impact the Group’s liquidity position. A global market crisis, forexample, is covered by a specific stress scenario (systemic market risk) that models the potential consequences observedduring the financial crisis of 2008. Additionally, we have introduced regional market stress scenarios. Under each of thescenarios we assume a high degree of maturing loans to non-wholesale customers is rolled-over, to support our businessfranchise. Wholesale funding, from the most risk sensitive counterparties (including banks and money-market mutual funds)is assumed to roll-off at contractual maturity or even be bought back, in the acute phase of the stress.
In addition, we include the potential funding requirements from contingent liquidity risks which might arise, including creditfacilities, increased collateral requirements under derivative agreements, and outflows from deposits with a contractual ratinglinked trigger.
We then model the actions we would take to counterbalance the outflows incurred. Countermeasures include utilizing theLiquidity Reserve and generating liquidity from unencumbered, marketable assets.
Stress testing is conducted at a global level and for defined individual legal entities. In addition to the consolidated currencystress test, stress tests for material currencies (EUR, USD and GBP) are performed. We review our stress-testing assumptionson a regular basis and have made further enhancements to the methodology and severity of certain parameters through thecourse of 2018.
On a daily basis, we run the liquidity stress test over an eight-week horizon, which we consider the most critical time span ina liquidity crisis, and apply the relevant stress assumptions to risk drivers from on-balance sheet and off-balance sheetproducts. Beyond the eight week time horizon, we analyze the impact of a more prolonged stress period, extending to twelvemonths. This stress testing analysis is performed on a daily basis.
The risk appetite to maintain a surplus of at least € 10 billion throughout the 8 week stress horizon under all scenarios for ourdaily consolidated currency stress test remained at this level also for 2018.
The tables in section “Liquidity Risk Exposure: Stress Testing and Scenario Analysis” show the results of our internal globalliquidity stress test under the various different scenarios.

85
Deutsche Bank Risk and Capital ManagementAnnual Report 2018 Liquidity Risk Management
Liquidity Coverage Ratio
In addition to our internal stress test result, the Group has a Management Board-approved risk appetite for the LiquidityCoverage Ratio (LCR). The LCR is intended to promote the short-term resilience of a bank’s liquidity risk profile over a 30 daystress scenario. The ratio is defined as the amount of High Quality Liquid Assets (HQLA) that could be used to raise liquidityin a stressed scenario, measured against the total volume of net cash outflows, arising from both contractual and modelledexposures.
This requirement has been implemented into European law, via the Commission Delegated Regulation (EU) 2015/61, adoptedin October 2014. Compliance with the LCR was required in the EU from October 1, 2015.
The LCR complements the internal stress testing framework. By maintaining a ratio in excess of minimum regulatoryrequirements, the LCR seeks to ensure that the Group holds adequate liquidity resources to mitigate a short-term liquiditystress.
In November 2018, the Bank has set its internal risk appetite more conservative by 3% in order to maintain a LCR ratio of atleast 113%, effective from 1st of January 2019 onwards.
Key differences between the internal liquidity stress test and LCR include the time horizon (eight weeks versus 30 days),classification and haircut differences between Liquidity Reserves and the LCR HQLA, outflow rates for various categories offunding, and inflow assumption for various assets (for example, loan repayments). Our liquidity stress test also includesoutflows related to intraday liquidity assumptions, which are not explicitly captured in the LCR.
Funding Risk Management
Structural funding
Deutsche Bank’s primary tool for monitoring and managing longer term funding risk is the Funding Matrix. The Funding Matrixassesses the Group’s structural funding profile for the greater than one year time horizon. To produce the Funding Matrix, allfunding-relevant assets and liabilities are mapped into time buckets corresponding to their contractual or modeled maturities.This allows the Group to identify expected excesses and shortfalls in term liabilities over assets in each time bucket, facilitatingthe management of potential liquidity exposures.
The liquidity profile is based on contractual cash flow information. If the contractual maturity profile of a product does notadequately reflect the liquidity profile, it is replaced by modeling assumptions. Short-term balance sheet items (<1yr) ormatched funded structures (asset and liabilities directly matched with no liquidity risk) can be excluded from the term analysis.
The bottom-up assessment by individual business line is combined with a top-down reconciliation against the Group’s IFRSbalance sheet. From the cumulative term profile of assets and liabilities beyond 1 year, long-funded surpluses or short-fundedgaps in the Group’s maturity structure can be identified. The cumulative profile is thereby built up starting from the greaterthan 10 year bucket down to the greater than 1 year bucket.
The strategic liquidity planning process, which incorporates the development of funding supply and demand across businessunits, together with the bank’s targeted key liquidity and funding metrics, provides the key input parameter for our annualcapital markets issuance plan. Upon approval by the Management Board the capital markets issuance plan establishesissuance targets for securities by tenor, volume, currency and instrument. We also maintain a stand-alone U.S. dollar andGBP funding matrix which limits the maximum short position in any time bucket (more than 1 year to more than 10 years) to€ 10 billion and € 5 billion respectively. This supplements the risk appetite for our global funding matrix which requires us tomaintain a positive funding position in any time bucket (more than 1 year to more than 10 years).

86
Deutsche Bank 1 – Management ReportAnnual Report 2018
Net Stable Funding Ratio
The Net Stable Funding Ratio (NSFR) was proposed as part of Basel 3, as the regulatory metric for assessing a bank’sstructural funding profile. The NSFR is intended to reduce medium to long-term funding risks by requiring banks to maintain astable funding profile in relation to their on- and off-balance sheet activities. The ratio is defined as the amount of AvailableStable Funding (the portion of capital and liabilities expected to be a stable source of funding), relative to the amount ofRequired Stable Funding (a function of the liquidity characteristics of various assets held).
In the EU, the Commission published a legislative proposal to amend the CRR. The proposal defines, inter alia, a mandatoryquantitative NSFR requirement which would apply two years after the proposal comes into force. The proposal remains subjectto change in the EU legislative process. Therefore, for banks domiciled in the EU, the final definition of the ratio and associatedimplementation timeframe has not yet been confirmed.
We are currently in the process of assessing the impacts of the NSFR, and would expect to formally embed this metric withinour overall liquidity risk management framework, once the relevant rules and timing within the EU have been finally determined.
Funding Diversification
Diversification of our funding profile in terms of investor types, regions, products and instruments is an important element ofour liquidity risk management framework. Our most stable funding sources come from capital markets and equity, retail, andtransaction banking clients. Other customer deposits and secured funding and short positions are additional sources offunding. Unsecured wholesale funding represents unsecured wholesale liabilities sourced primarily by our Treasury PoolManagement. Given the relatively short-term nature of these liabilities, they are primarily used to fund liquid trading assets.
To promote the additional diversification of our refinancing activities, we hold a license allowing us to issue mortgagePfandbriefe. In addition, we have established a program for the purpose of issuing Covered Bonds under Spanish law(Cedulas).
Unsecured wholesale funding comprises a range of unsecured products, such as Certificates of Deposit (CDs), CommercialPapers (CPs) as well as term, call and overnight deposits across tenors primarily up to one year.
To avoid any unwanted reliance on these short-term funding sources, and to promote a sound funding profile, which complieswith the defined risk appetite, we have implemented limits (across tenors) on these funding sources, which are derived fromour daily stress testing analysis. In addition, we limit the total volume of unsecured wholesale funding to manage the relianceon this funding source as part of the overall funding diversification.
The chart “Liquidity Risk Exposure: Funding Diversification” shows the composition of our external funding sources thatcontribute to the liquidity risk position, both in EUR billion and as a percentage of our total external funding sources.
Funds Transfer Pricing
The funds transfer pricing framework applies to all businesses/regions and promotes pricing of (i) assets in accordance withtheir underlying liquidity risk, (ii) liabilities in accordance with their liquidity value and funding maturity and (iii) contingentliquidity exposures in accordance with the cost of providing for commensurate liquidity reserves to fund unexpected cashrequirements.
Within this framework all funding and liquidity risk costs and benefits are allocated to the firm’s business units based on marketrates. Those market rates reflect the economic costs of liquidity for Deutsche Bank. Treasury might set further financialincentives in line with the Bank’s liquidity risk guidelines. While the framework promotes a diligent group-wide allocation of theBank's funding costs to the liquidity users, it also provides an incentive-based framework for businesses generating stablelong-term and stress compliant funding. Funding relevant transactions are subject to liquidity (term) premiums and/or otherfunds transfer pricing mechanisms depending on market conditions. Liquidity premiums are set by Treasury and reflected ina segregated Treasury liquidity account which is the aggregator of liquidity costs and benefits. The management and allocationof the liquidity account cost base is the key variable for funds transfer pricing within Deutsche Bank.

87
Deutsche Bank Risk and Capital ManagementAnnual Report 2018 Business (Strategic) Risk Management
Liquidity reserves
Liquidity reserves comprise available cash and cash equivalents, highly liquid securities (includes government, agency andgovernment guaranteed) as well as other unencumbered central bank eligible assets.
The volume of our liquidity reserves is a function of our expected daily stress result, both at an aggregate level as well as atan individual currency level. To the extent we receive incremental short-term wholesale liabilities which attract a high stressroll-off, we will largely keep the proceeds of such liabilities in cash or highly liquid securities as a stress mitigant. Accordingly,the total volume of our liquidity reserves will fluctuate as a function of the level of short-term wholesale liabilities held, althoughthis has no material impact on our overall liquidity position under stress. Our liquidity reserves include only assets that arefreely transferable or that can be utilized after taking into consideration local liquidity demands within the Group, includinglocal limits on free transferability within the Group, or that can be applied against local entity stress outflows. As a result ourliquidity reserves exclude surplus liquidity held in DBTCA due to requirements pursuant to Section 23A of the U.S. FederalReserve Act. Certain intraday requirements are directly deducted in the calculation of the Liquidity Reserves while others arerepresented as outflows in our internal liquidity model. We hold the vast majority of our liquidity reserves centrally across themajor currencies, at our parent and our foreign branches with further reserves held at key locations in which we are active.
Asset Encumbrance
Encumbered assets primarily comprise those on- and off-balance sheet assets that are pledged as collateral against securedfunding, collateral swaps, and other collateralized obligations. We generally encumber loans to support long-term capitalmarkets secured issuance such as covered bonds or other self-securitization structures, while financing debt and equityinventory on a secured basis is a regular activity for our Corporate & Investment Bank business. Additionally, in line with theEBA technical standards on regulatory asset encumbrance reporting, we consider as encumbered assets pledged withsettlement systems, including default funds and initial margins, as well as other assets pledged which cannot be freelywithdrawn such as mandatory minimum reserves at central banks. We also include derivative margin receivable assets asencumbered under these EBA guidelines.
Business (Strategic) Risk ManagementStrategic Risk is the risk of suffering an operating income shortfall due to lower than expected performance in revenues notcompensated by a reduction in costs. Strategic Risk may arise from changes to the competitive landscape or regulatoryframework or ineffective positioning in the macroeconomic environment. Strategic Risk could also arise due to a failure toexecute strategy and/ or failure to effectively take actions to address underperformance.
A Strategic and Capital plan is developed annually and presented to the Management Board for discussion and approval. Thefinal plan is then presented to the Supervisory Board. During the year, execution of business strategies is regularly monitoredto assess the performance against strategic objectives and to seek to ensure we remain on track to achieve targets. A morecomprehensive description of this process is detailed in the section ‘Strategic and Capital Plan’.

88
Deutsche Bank 1 – Management ReportAnnual Report 2018
Model Risk ManagementModel risk is the potential for adverse consequences from incorrect or misused model outputs and reports using theseoutputs. Model risk can lead to financial loss, poor business or strategic decision making, or damage our reputation. The term‘model’ refers to a quantitative method, system, or approach that applies statistical, economic, financial, or mathematicaltheories, techniques, and assumptions to process input data into quantitative estimates.
Model risk is managed across Pricing models, Risk & Capital models, and Other models:
– Pricing models are used to generate asset and liability fair value measurements reported in official books and recordsand/or risk sensitivities which feed Market Risk Management (MRM) processes;
– Risk & Capital models are related to risks used for regulatory or internal capital requirements, e.g. VaR, IMM, Stress testsetc.;
– Other models are those outside of the Bank’s Pricing and Risk & Capital models.
Model risk appetite is aligned to the Group’s qualitative statements, ensuring that model risk management is embedded in astrong risk culture and that risks are minimized to the extent possible.
The management of model risk includes:
– Performing robust independent model validation that provides effective challenge to the model development process andincludes identification of conditions for use, methodological limitations that may require adjustments or overlays, andvalidation findings that require remediation;
– Establishing a strong model risk management and governance framework, including senior forums for monitoring andescalation of model risk related topics;
– Creating Bank-wide model risk related policies, aligned to regulatory requirements with clear roles and responsibilities forkey stakeholders across the model life cycle; and
– Providing an assessment of the model risk control environment and reporting to the Management Board on a periodicbasis.
We have been implementing improvements in our model risk management framework, and significant progress has beenachieved in 2018 across the three underlying model categories, including:
– Continued progress in improving the control environment for Pricing Models over 2018, as reflected in significant reductionsin model usage exceptions and control of trades on non-strategic platforms within tolerance
– Identification and inclusion of ‘Other Models’ within a Model Inventory that completed a transparent baseline of all Modelcategories, from which model risk can be measured, managed and monitored at Group level in 2019 and beyond
– Key controls continue to operate across Risk & Capital Models, with introduction of compensating control framework forvalidation issues and prioritized focus on remediation of certain issues.
Management has determined to instil a robust and consistent model risk management framework in order to ensure that theframework effectively identifies, monitors and measures risk. The effort focuses on board oversight, model identification andmodel inventory, single coherent policy and governance framework, model development practices, and effective and rigorousmodel validation.

89
Deutsche Bank Risk and Capital ManagementAnnual Report 2018 Risk Concentration and Risk Diversification
Reputational Risk ManagementWithin our risk management process, we define reputational risk as the risk of possible damage to our brand and reputation,and the associated risk to earnings, capital or liquidity, arising from any association, action or inaction which could be perceivedby stakeholders to be inappropriate, unethical or inconsistent with Deutsche Bank’s values and beliefs.
The Reputational Risk Framework (the Framework) is in place to manage primary reputational risk. It covers the processthrough which active decisions are taken on matters which may pose a reputational risk, ex ante, and, in doing so, preventdamage to Deutsche Bank’s reputation wherever possible. Reputational risks which may arise from a failure with another risktype, control or process (secondary reputational risk) are addressed separately via the associated risk type framework. TheFramework is established to provide consistent standards for the identification, assessment and management of reputationalrisk issues. While every employee has a responsibility to protect our reputation, the primary responsibility for the identification,assessment, management, monitoring and, if necessary, referring or reporting, of reputational risk matters lies with ourbusiness divisions. Each employee is under an obligation, within the scope of his or her activities, to be alert to any potentialcauses of reputational risk and to address them according to the Framework. Reputational Risk Management has designedand implemented a look back and lessons learned process in order to assess and control the effectiveness of the Framework,including in relation to reputational risk identification and referral.
If a matter is identified that is considered to pose, at a minimum, a moderate reputational risk then it is required to be referredfor further consideration within the business division through its Unit Reputational Risk Assessment Process (Unit RRAP). Inthe event that a matter is deemed to pose a material reputational risk then it must be referred through to one of the fourRegional Reputational Risk Committees (RRRCs) for further review. In addition to the materiality assessment, there are alsocertain criteria, known as mandatory referral criteria, which are considered inherently higher risk from a reputationalperspective and therefore require mandatory referral to defined Subject Matter Experts (SMEs), e.g. Industry ReputationalRisk or Group Sustainability, and/or referral to a Unit RRAP or RRRC.
The RRRCs are sub-committees of the Group Reputational Risk Committee (GRRC), which is itself a sub-committee of theGroup Risk Committee (GRC), and are responsible for the oversight, governance and coordination of the management ofreputational risk in their respective regions of Deutsche Bank on behalf of the Management Board. In exceptionalcircumstances, matters can also be referred by the RRRCs to the GRRC.
The modelling and quantitative measurement of reputational risk internal capital is implicitly covered in our economic capitalframework primarily within operational and strategic risk.
Risk Concentration and Risk Diversification
Risk Concentrations
Risk concentrations refer to clusters of the same or similar risk drivers within specific risk types (intra-risk concentrations incredit, market, operational, liquidity and business risks) as well as across different risk types (inter-risk concentrations). Theyoccur within and across counterparties, businesses, regions/countries, industries and products. The management andmonitoring of risk concentrations is achieved through a quantitative and qualitative approach, as follows:
– Intra-risk concentrations are assessed, monitored and mitigated by the individual risk functions (credit, market, operational,liquidity and strategic risk management). This is supported by limit setting on different levels and/or management accordingto risk type.
– Inter-risk concentrations are managed through quantitative top-down stress-testing and qualitative bottom-up reviews,identifying and assessing risk themes independent of any risk type and providing a holistic view across the bank.
The most senior governance body for the oversight of risk concentrations throughout 2018 was the Enterprise Risk Committee(ERC), which is a subcommittee of the Group Risk Committee (GRC).
Risk Type Diversification Benefit
The risk type diversification benefit quantifies diversification effects between credit, market, operational and strategic risk inthe economic capital calculation. To the extent correlations between these risk types fall below 1.0, a risk type diversificationbenefit results. The calculation of the risk type diversification benefit is intended to ensure that the standalone economic capitalfigures for the individual risk types are aggregated in an economically meaningful way.

90
Deutsche Bank 1 – Management ReportAnnual Report 2018
Risk and capital performance
Capital, Leverage Ratio and MREL
Regulatory capital
The calculation of our regulatory capital incorporates the capital requirements following the “Regulation (EU) No 575/2013 onprudential requirements for credit institutions and investment firms” (Capital Requirements Regulation or “CRR”) and the“Directive 2013/36/EU on access to the activity of credit institutions and the prudential supervision of credit institutions andinvestment firms” (Capital Requirements Directive 4 or “CRD 4”) as implemented into German law. The information in thissection as well as in the section “Development of risk-weighted Assets” is based on the regulatory principles of consolidation.
This section refers to the capital adequacy of the group of entities consolidated for banking regulatory purposes pursuant tothe CRR and the German Banking Act (“Kreditwesengesetz” or “KWG”). Therein not included are insurance companies orcompanies outside the finance sector.
The total regulatory capital pursuant to the effective regulations as of year-end 2018 comprises Tier 1 and Tier 2 (T2) capital.Tier 1 capital is subdivided into Common Equity Tier 1 (CET 1) capital and Additional Tier 1 (AT1) capital.
Common Equity Tier 1 (CET 1) capital consists primarily of common share capital (reduced by own holdings) including relatedshare premium accounts, retained earnings (including losses for the financial year, if any) and accumulated othercomprehensive income, subject to regulatory adjustments (i.e. prudential filters and deductions). Prudential filters for CET 1capital, according to Articles 32 to 35 CRR, include (i) securitization gains on sale, (ii) cash flow hedges and changes in thevalue of own liabilities, and (iii) additional value adjustments. CET 1 capital deductions comprise (i) intangible assets, (ii)deferred tax assets that rely on future profitability, (iii) negative amounts resulting from the calculation of expected lossamounts, (iv) net defined benefit pension fund assets, (v) reciprocal cross holdings in the capital of financial sector entitiesand, (vi) significant and non-significant investments in the capital (CET 1, AT1, T2) of financial sector entities above certainthresholds. All items not deducted (i.e., amounts below the threshold) are subject to risk-weighting.
Additional Tier 1 (AT1) capital consists of AT1 capital instruments and related share premium accounts as well asnoncontrolling interests qualifying for inclusion in consolidated AT1 capital, and during the transitional period grandfatheredinstruments eligible under earlier frameworks. To qualify as AT1 capital under CRR/CRD 4, instruments must have principalloss absorption through a conversion to common shares or a write-down mechanism allocating losses at a trigger point andmust also meet further requirements (perpetual with no incentive to redeem; institution must have full dividend/coupondiscretion at all times, etc.).
Tier 2 (T2) capital comprises eligible capital instruments, the related share premium accounts and subordinated long-termdebt, certain loan loss provisions and noncontrolling interests that qualify for inclusion in consolidated T2 capital. To qualifyas T2 capital, capital instruments or subordinated debt must have an original maturity of at least five years. Moreover, eligiblecapital instruments may inter alia not contain an incentive to redeem, a right of investors to accelerate repayment, or a creditsensitive dividend feature.
Capital instruments that no longer qualify as AT1 or T2 capital under the CRR/CRD 4 fully loaded rules are subject tograndfathering rules during the transitional period and are phased out from 2013 to 2022 with their recognition capped at 40 %in 2018 and the cap decreasing by 10 % every year.
Capital instruments
Our Management Board received approval from the 2017 Annual General Meeting to buy back up to 206.7 million sharesbefore the end of April 2022. Thereof 103.3 million shares can be purchased by using derivatives, this includes 41.3 millionderivatives with a maturity exceeding 18 months. During the period from the 2017 Annual General Meeting until the 2018Annual General Meeting (May 24, 2018), 22.8 million shares have been purchased, of which 4.4 million shares throughexercise of call options. The shares purchased were used for equity compensation purposes in the same period or are to beused in the upcoming period so that the number of shares held in Treasury from buybacks was 1.3 million as of the 2018Annual General Meeting.

91
Deutsche Bank Risk and capital performanceAnnual Report 2018 Capital, Leverage Ratio and MREL
The 2018 Annual General Meeting granted our Management Board the approval to buy back up to 206.7 million shares beforethe end of April 2023. Thereof 103.3 million shares can be purchased by using derivatives, this includes 41.3 million derivativeswith a maturity exceeding 18 months. These authorizations substitute the authorizations of the previous year. During theperiod from the 2018 Annual General Meeting until December 31, 2018, 9.3 million shares were purchased. The sharespurchased are to be used in the upcoming period so that the number of shares held in Treasury from buybacks was 1.2 millionas of December 31, 2018.
Since the 2017 Annual General Meeting, and as of December 31, 2018, authorized capital available to the Management Boardis € 2,560 million (1,000 million shares). As of December 31, 2018, the conditional capital against cash stands at € 512 million(200 million shares). Additional conditional capital for equity compensation amounts to € 51.2 million (20 million shares).Further the 2018 Annual General Meeting authorized the issuance of participatory notes and other Hybrid Debt Securities thatfulfill the regulatory requirements to qualify as Additional Tier 1 capital with an equivalent value of € 8.0 billion.
Our legacy Hybrid Tier 1 capital instruments (substantially all noncumulative trust preferred securities) are not recognizedunder fully loaded CRR/CRD 4 rules as Additional Tier 1 capital, mainly because they have no write-down or equity conversionfeature. However, they are recognized as Additional Tier 1 capital under CRR/CRD 4 transitional provisions and can still berecognized as Tier 2 capital under the fully loaded CRR/CRD 4 rules. During the transitional phase-out period the maximumrecognizable amount of Additional Tier 1 instruments from Basel 2.5 compliant issuances as of December 31, 2012 will bereduced at the beginning of each financial year by 10 % or € 1.3 billion, through 2022. For December 31, 2018, this resultedin eligible Additional Tier 1 instruments of € 7.6 billion (i.e. € 4.6 billion newly issued AT1 Notes plus € 3.0 billion of legacyHybrid Tier 1 instruments recognizable during the transition period). € 3.0 billion of the legacy Hybrid Tier 1 instruments canstill be recognized as Tier 2 capital under the fully loaded CRR/CRD 4 rules. Additional Tier 1 instruments recognized underfully loaded CRR/CRD 4 rules amounted to € 4.6 billion as of December 31, 2018. In 2018, the bank has redeemed one legacyHybrid Tier 1 instrument with a notional of U.S. $ 2.0 billion and an eligible equivalent amount of € 1.6 billion and anotherlegacy Hybrid Tier 1 instrument with a notional of € 1.0 billion and an eligible equivalent amount of € 1.0 billion. The firstredemption was already derecognized from regulatory Additional Tier 1 capital in 2017 with the effective date of the call-permission by the ECB.
The total of our Tier 2 capital instruments as of December 31, 2018 recognized during the transition period under CRR/CRD4 was € 6.2 billion. As of December 31, 2018, there were no legacy Hybrid Tier 1 instruments that are counted as Tier 2 capitalunder transitional rules. The gross notional value of the Tier 2 capital instruments was € 7.5 billion. Tier 2 instrumentsrecognized under fully loaded CRR/CRD 4 rules amounted to € 9.2 billion as of December 31, 2018 (including the € 3.0 billionlegacy Hybrid Tier 1 capital instruments only recognizable as Additional Tier 1 capital during the transitional period). In 2018,the bank has redeemed one Tier 2 capital instrument with a notional of JPY 21.0 billion and an eligible equivalent amount of€ 0.1 billion and another Tier 2 capital instrument with a notional of JPY 3.0 billion and an eligible equivalent amount of€ 0.0 billion. These redemptions were already derecognized from regulatory Tier 2 capital in 2017 with the effective date ofthe call-permission by the ECB.
Minimum capital requirements and additional capital buffers
The Pillar 1 CET 1 minimum capital requirement applicable to the Group is 4.50 % of risk-weighted assets (RWA). The Pillar 1total capital requirement of 8.00 % demands further resources that may be met with up to 1.50 % Additional Tier 1 capital andup to 2.00 % Tier 2 capital.
Failure to meet minimum capital requirements can result in supervisory measures such as restrictions of profit distributions orlimitations on certain businesses such as lending. We complied with the regulatory capital adequacy requirements in 2018.
In addition to these minimum capital requirements, the following combined capital buffer requirements have been phased insince 2016 (other than the systemic risk buffer, if any, which is not subject to any phase-in) and will become fully effectivefrom 2019 onwards. The buffer requirements must be met in addition to the Pillar 1 minimum capital requirements, but can bedrawn down in times of economic stress.
Deutsche Bank continues to be designated as a global systemically important institution (G-SII) by the German FederalFinancial Supervisory Authority (BaFin) in agreement with the Deutsche Bundesbank, resulting in a G-SII buffer requirementof 2.00 % CET 1 capital of RWA in 2019 and was phased in with 0.5 % in 2016, 1.00 % in 2017 and 1.50 % in 2018. This isin line with the FSB assessment of systemic importance based on the indicators as published in 2018. We will continue topublish our indicators on our website.

92
Deutsche Bank 1 – Management ReportAnnual Report 2018
The capital conservation buffer is implemented in Section 10c German Banking Act based on Article 129 CRD 4 and equalsa requirement of 2.50 % CET 1 capital of RWA in 2019 and was phased in with 0.625 % in 2016, 1.25 % in 2017 and 1.875 %in 2018.
The countercyclical capital buffer is deployed in a jurisdiction when excess credit growth is associated with an increase insystem-wide risk. It may vary between 0 % and 2.50 % CET 1 capital of RWA by 2019. In exceptional cases, it could also behigher than 2.50 %. The institution specific countercyclical buffer that applies to Deutsche Bank is the weighted average ofthe countercyclical capital buffers that apply in the jurisdictions where our relevant credit exposures are located. As perDecember 31, 2018, the institution-specific countercyclical capital buffer was at 0.07 %.
In addition to the aforementioned buffers, national authorities, such as the BaFin, may require a systemic risk buffer to preventand mitigate long-term non-cyclical systemic or macro-prudential risks that are not covered by the CRR. They can require anadditional buffer of up to 5.00 % CET 1 capital of RWA. As of the year-end 2018, no systemic risk buffer applied to DeutscheBank.
Additionally, Deutsche Bank AG has been classified by BaFin as an other systemically important institution (O-SII) with anadditional buffer requirement of 2.00 % that has to be met on a consolidated level. For Deutsche Bank, the O-SII buffer wasintroduced in first steps of 0.66 % in 2017, 1.32 % in 2018 and 2.00 % in 2019. Unless certain exceptions apply, only thehigher of the systemic risk buffer (as of December 31, 2018, not applicable), G-SII buffer and O-SII buffer must be applied.Accordingly, the O-SII buffer is not applicable as of December 31, 2018.
In addition, pursuant to the Pillar 2 Supervisory Review and Evaluation Process (SREP), the European Central Bank (ECB)may impose capital requirements on individual banks which are more stringent than statutory requirements (so-called Pillar 2requirement). On December 19, 2017, Deutsche Bank was informed by the ECB of its decision regarding prudential minimumcapital requirements for 2018, following the results of the 2017 SREP. Beginning from January 1, 2018, the decision requiresDeutsche Bank to maintain a phase-in CET 1 ratio, which as of December 31, 2018 is at least 10.69 % on a consolidatedbasis. This requirement on CET 1 capital comprises the Pillar 1 minimum capital requirement of 4.50 %, the Pillar 2requirement (SREP Add-on) of 2.75 %, the phase-in capital conservation buffer of 1.875 %, the countercyclical buffer of0.07 % (as per December 31, 2018) and the phase-in G-SII capital buffer of 1.50 %. Correspondingly the requirements forDeutsche Bank's Tier 1 capital ratio were at 12.19 % and total capital ratio at 14.19 % as of December 31, 2018.
Beginning from January 1, 2019, Deutsche Bank must maintain a CET 1 ratio of at least 11.82 % on a consolidated basis asthe transition period for the capital conservation buffer and the G-SII capital buffer requirements ended and the full bufferlevels of 2.50 % and 2.00 %, respectively, need to be covered with CET 1 capital. To summarize, the CET 1 capital requirementcomprises the Pillar 1 minimum capital requirement of 4.50 %, the unchanged Pillar 2 requirement (SREP Add-on) of 2.75 %,the capital conservation buffer of 2.50 %, the countercyclical buffer (0.07 % per year end 2018) and the G-SII buffer of 2.00%. Correspondingly, 2019 requirements for Deutsche Bank's Tier 1 capital ratio are at 13.32 % and for its total capital ratio at15.32 %. On February 8, 2019, Deutsche Bank was informed by the ECB of its decision regarding prudential minimum capitalrequirements for 2019, following the results of the 2018 SREP. The decision left Deutsche Bank’s Pillar 2 requirement andthus the CET 1 capital requirements unchanged at 2.75 % beginning from March 1, 2019. Also, the ECB communicated to usan individual expectation to hold a further Pillar 2 CET 1 capital add-on, commonly referred to as the Pillar 2 guidance. Thecapital add-on pursuant to the Pillar 2 guidance is separate from and in addition to the Pillar 2 requirement. The ECB hasstated that it expects banks to meet the Pillar 2 guidance although it is not legally binding, and failure to meet the Pillar 2guidance does not lead to automatic restrictions of capital distributions.
The following table gives an overview of the different Pillar 1 and Pillar 2 minimum capital requirements (but excluding thePillar 2 guidance) as well as capital buffer requirements applicable to Deutsche Bank in the years 2018 and 2019 (articulatedon a phase-in basis):
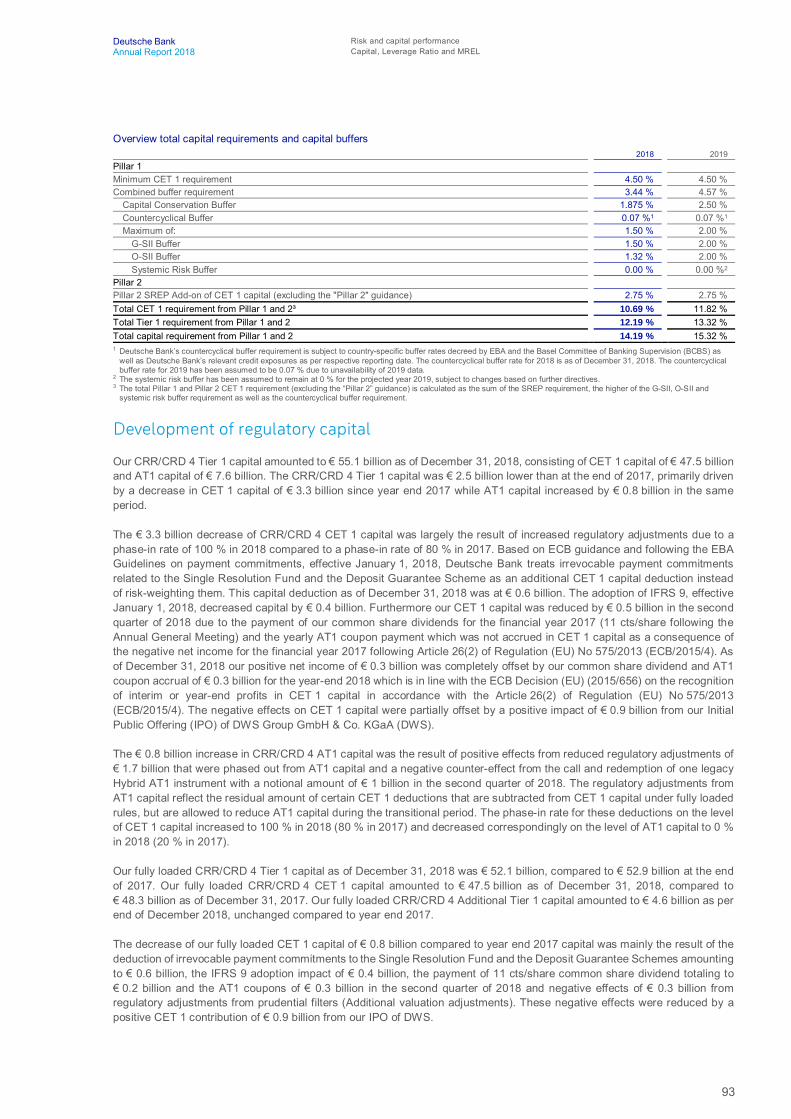
93
Deutsche Bank Risk and capital performanceAnnual Report 2018 Capital, Leverage Ratio and MREL
Overview total capital requirements and capital buffers2018 2019
Pillar 1Minimum CET 1 requirement 4.50 % 4.50 %Combined buffer requirement 3.44 % 4.57 %
Capital Conservation Buffer 1.875 % 2.50 %Countercyclical Buffer 0.07 %1 0.07 %1
Maximum of: 1.50 % 2.00 %G-SII Buffer 1.50 % 2.00 %O-SII Buffer 1.32 % 2.00 %Systemic Risk Buffer 0.00 % 0.00 %2
Pillar 2Pillar 2 SREP Add-on of CET 1 capital (excluding the "Pillar 2" guidance) 2.75 % 2.75 %Total CET 1 requirement from Pillar 1 and 2³ 10.69 % 11.82 %Total Tier 1 requirement from Pillar 1 and 2 12.19 % 13.32 %Total capital requirement from Pillar 1 and 2 14.19 % 15.32 %1 Deutsche Bank’s countercyclical buffer requirement is subject to country-specific buffer rates decreed by EBA and the Basel Committee of Banking Supervision (BCBS) as
well as Deutsche Bank’s relevant credit exposures as per respective reporting date. The countercyclical buffer rate for 2018 is as of December 31, 2018. The countercyclicalbuffer rate for 2019 has been assumed to be 0.07 % due to unavailability of 2019 data.
2 The systemic risk buffer has been assumed to remain at 0 % for the projected year 2019, subject to changes based on further directives.3 The total Pillar 1 and Pillar 2 CET 1 requirement (excluding the “Pillar 2” guidance) is calculated as the sum of the SREP requirement, the higher of the G-SII, O-SII and
systemic risk buffer requirement as well as the countercyclical buffer requirement.
Development of regulatory capital
Our CRR/CRD 4 Tier 1 capital amounted to € 55.1 billion as of December 31, 2018, consisting of CET 1 capital of € 47.5 billionand AT1 capital of € 7.6 billion. The CRR/CRD 4 Tier 1 capital was € 2.5 billion lower than at the end of 2017, primarily drivenby a decrease in CET 1 capital of € 3.3 billion since year end 2017 while AT1 capital increased by € 0.8 billion in the sameperiod.
The € 3.3 billion decrease of CRR/CRD 4 CET 1 capital was largely the result of increased regulatory adjustments due to aphase-in rate of 100 % in 2018 compared to a phase-in rate of 80 % in 2017. Based on ECB guidance and following the EBAGuidelines on payment commitments, effective January 1, 2018, Deutsche Bank treats irrevocable payment commitmentsrelated to the Single Resolution Fund and the Deposit Guarantee Scheme as an additional CET 1 capital deduction insteadof risk-weighting them. This capital deduction as of December 31, 2018 was at € 0.6 billion. The adoption of IFRS 9, effectiveJanuary 1, 2018, decreased capital by € 0.4 billion. Furthermore our CET 1 capital was reduced by € 0.5 billion in the secondquarter of 2018 due to the payment of our common share dividends for the financial year 2017 (11 cts/share following theAnnual General Meeting) and the yearly AT1 coupon payment which was not accrued in CET 1 capital as a consequence ofthe negative net income for the financial year 2017 following Article 26(2) of Regulation (EU) No 575/2013 (ECB/2015/4). Asof December 31, 2018 our positive net income of € 0.3 billion was completely offset by our common share dividend and AT1coupon accrual of € 0.3 billion for the year-end 2018 which is in line with the ECB Decision (EU) (2015/656) on the recognitionof interim or year-end profits in CET 1 capital in accordance with the Article 26(2) of Regulation (EU) No 575/2013(ECB/2015/4). The negative effects on CET 1 capital were partially offset by a positive impact of € 0.9 billion from our InitialPublic Offering (IPO) of DWS Group GmbH & Co. KGaA (DWS).
The € 0.8 billion increase in CRR/CRD 4 AT1 capital was the result of positive effects from reduced regulatory adjustments of€ 1.7 billion that were phased out from AT1 capital and a negative counter-effect from the call and redemption of one legacyHybrid AT1 instrument with a notional amount of € 1 billion in the second quarter of 2018. The regulatory adjustments fromAT1 capital reflect the residual amount of certain CET 1 deductions that are subtracted from CET 1 capital under fully loadedrules, but are allowed to reduce AT1 capital during the transitional period. The phase-in rate for these deductions on the levelof CET 1 capital increased to 100 % in 2018 (80 % in 2017) and decreased correspondingly on the level of AT1 capital to 0 %in 2018 (20 % in 2017).
Our fully loaded CRR/CRD 4 Tier 1 capital as of December 31, 2018 was € 52.1 billion, compared to € 52.9 billion at the endof 2017. Our fully loaded CRR/CRD 4 CET 1 capital amounted to € 47.5 billion as of December 31, 2018, compared to€ 48.3 billion as of December 31, 2017. Our fully loaded CRR/CRD 4 Additional Tier 1 capital amounted to € 4.6 billion as perend of December 2018, unchanged compared to year end 2017.
The decrease of our fully loaded CET 1 capital of € 0.8 billion compared to year end 2017 capital was mainly the result of thededuction of irrevocable payment commitments to the Single Resolution Fund and the Deposit Guarantee Schemes amountingto € 0.6 billion, the IFRS 9 adoption impact of € 0.4 billion, the payment of 11 cts/share common share dividend totaling to€ 0.2 billion and the AT1 coupons of € 0.3 billion in the second quarter of 2018 and negative effects of € 0.3 billion fromregulatory adjustments from prudential filters (Additional valuation adjustments). These negative effects were reduced by apositive CET 1 contribution of € 0.9 billion from our IPO of DWS.

94
Deutsche Bank 1 – Management ReportAnnual Report 2018
Own Funds Template (incl. RWA and capital ratios)Dec 31, 2018 Dec 31, 2017
in € m.CRR/CRD 4fully loaded CRR/CRD 41
CRR/CRD 4fully loaded CRR/CRD 4
Common Equity Tier 1 (CET 1) capital: instruments and reservesCapital instruments, related share premium accounts and other reserves2 45,515 45,515 45,195 45,195Retained earnings 16,297 16,297 17,977 17,977Accumulated other comprehensive income (loss), net of tax 382 382 696 660Independently reviewed interim profits net of any foreseeable charge or dividend3 0 0 (751) (751)Other2 846 846 0 33
Common Equity Tier 1 (CET 1) capital before regulatory adjustments 63,041 63,041 63,116 63,114
Common Equity Tier 1 (CET 1) capital: regulatory adjustmentsAdditional value adjustments (negative amount) (1,504) (1,504) (1,204) (1,204)Other prudential filters (other than additional value adjustments) (329) (329) (102) (74)Goodwill and other intangible assets (net of related tax liabilities) (negative amount) (8,566) (8,566) (8,394) (6,715)Deferred tax assets that rely on future profitability excluding those arising fromtemporary differences (net of related tax liabilities where the conditions in Art. 38 (3)CRR are met) (negative amount) (2,758) (2,758) (3,004) (2,403)Negative amounts resulting from the calculation of expected loss amounts4 (367) (367) (502) (408)Defined benefit pension fund assets (negative amount) (1,111) (1,111) (1,125) (900)Direct, indirect and synthetic holdings by an institution of own CET 1 instruments (negativeamount) (25) (25) (144) (117)Direct, indirect and synthetic holdings by the institution of the CET 1 instruments of financialsector entities where the institution has a significant investment in those entities (amountabove the 10 % / 15 % thresholds and net of eligible short positions) (negative amount) 0 0 0 0Deferred tax assets arising from temporary differences (net of related tax liabilities wherethe conditions in Art. 38 (3) CRR are met) (amount above the 10 % / 15 % thresholds)(negative amount) 0 0 0 0Other regulatory adjustments5 (895) (895) (341) (485)
Total regulatory adjustments to Common Equity Tier 1 (CET 1) capital (15,555) (15,555) (14,816) (12,306)Common Equity Tier 1 (CET 1) capital 47,486 47,486 48,300 50,808
Additional Tier 1 (AT1) capital: instrumentsCapital instruments and the related share premium accounts 4,676 4,676 4,676 4,676Amount of qualifying items referred to in Art. 484 (4) CRR and the related sharepremium accounts subject to phase out from AT1 N/M 3,009 N/M 3,904
Additional Tier 1 (AT1) capital before regulatory adjustments 4,676 7,685 4,676 8,579
Additional Tier 1 (AT1) capital: regulatory adjustmentsDirect, indirect and synthetic holdings by an institution of own AT1 instruments(negative amount) (80) (80) (55) (26)Residual amounts deducted from AT1 capital with regard to deduction from CET 1 capitalduring the transitional period pursuant to Art. 472 CRR N/M N/M N/M (1,730)Other regulatory adjustments 0 0 0 0
Total regulatory adjustments to Additional Tier 1 (AT1) capital (80) (80) (55) (1,756)Additional Tier 1 (AT1) capital 4,595 7,604 4,621 6,823Tier 1 capital (T1 = CET 1 + AT1) 52,082 55,091 52,921 57,631
Tier 2 (T2) capital 9,211 6,202 10,329 6,384Total capital (TC = T1 + T2) 61,292 61,292 63,250 64,016Total risk-weighted assets 350,432 350,432 344,212 343,316
Capital ratiosCommon Equity Tier 1 capital ratio (as a percentage of risk-weighted assets) 13.6 13.6 14.0 14.8Tier 1 capital ratio (as a percentage of risk-weighted assets) 14.9 15.7 15.4 16.8Total capital ratio (as a percentage of risk-weighted assets) 17.5 17.5 18.4 18.6N/M – Not meaningful1 With effect from January 1, 2018, the CRR/CRD 4 “transitional” (or “phase-in”) rules under which CET 1 regulatory adjustments were phased in have reached a rate of 100 %,
together with the 100 % phase-out rate of minority interest only recognizable under the transitional rules.2 Our IPO of DWS led to a € 0.9 billion CET 1 contribution which is reflected in ‘Capital instruments, related share premium accounts and other reserves’ at € 0.1 billion and
minority interest in ‘Other’ at € 0.8 billion.3 No interim profits to be recognized as per ECB Decision (EU) 2015/656 in accordance with the Article 26(2) of Regulation (EU) No 575/2013 (ECB/2015/4).4 Based on Article 159 CRR and recent guidance provided by EBA (Q&A 2017_3426) published on January 18, 2019 only unearned credit spread additional value adjustments
are used as specific credit risk adjustments.5 Includes € 0.6 billion capital deduction effective from January 2018 onwards, based on ECB guidance and following the EBA Guidelines on irrevocable payment commitments
related to the Single Resolution Fund and the Deposit Guarantee Scheme. Further includes capital deduction of € 0.3 billion that was imposed on Deutsche Bank effectivefrom October 2016 onwards based on a notification by the ECB pursuant to Article 16(1)(c) and 16(2)(d) of Regulation (EU) No 1024/2013.

95
Deutsche Bank Risk and capital performanceAnnual Report 2018 Capital, Leverage Ratio and MREL
Reconciliation of shareholders’ equity to regulatory capitalCRR/CRD 4
in € m. Dec 31, 2018 Dec 31, 2017Total shareholders’ equity per accounting balance sheet1 62,495 63,174Deconsolidation/Consolidation of entities
(33) (58)Of which:Additional paid-in capital (12) (6)Retained earnings (150) (228)Accumulated other comprehensive income (loss), net of tax 130 176
Total shareholders' equity per regulatory balance sheet 62,462 63,116Minority Interests (amount allowed in consolidated CET 1)1 846 33Accrual for dividend and AT1 coupons2 (267) 0Reversal of deconsolidation/consolidation of the position Accumulated other comprehensive income (loss),net of tax, during transitional period 0 (35)Common Equity Tier 1 (CET 1) capital before regulatory adjustments 63,041 63,114Additional value adjustments (1,504) (1,204)Other prudential filters (other than additional value adjustments) (329) (74)Regulatory adjustments relating to unrealized gains and losses pursuant to Art. 467 and 468 CRR 0 (144)Goodwill and other intangible assets (net of related tax liabilities) (8,566) (6,715)Deferred tax assets that rely on future profitability (2,758) (2,403)Defined benefit pension fund assets (1,111) (900)Direct, indirect and synthetic holdings by the institution of the CET 1 instruments of financial sector entitieswhere the institution has a significant investment in those entities 0 0Other regulatory adjustments (1,287) (866)Common Equity Tier 1 capital 47,486 50,8081 Our IPO of DWS led to a € 0.9 billion CET 1 contribution which is reflected in the ‘Total shareholders’ equity per accounting balance sheet’ at € 0.1 billion and ‘Minority
interests’ at € 0.8 billion.2 No interim profits to be recognized as per ECB Decision (EU) 2015/656 in accordance with the Article 26(2) of Regulation (EU) No 575/2013 (ECB/2015/4).
Development of regulatory capitalCRR/CRD 4
in € m.
twelve monthsended
Dec 31, 2018
twelve monthsended
Dec 31, 2017Common Equity Tier 1 (CET 1) capital - opening amount 50,808 47,782Common shares, net effect
0 1,760Additional paid-in capital 327 6,153Retained earnings (662) (795)Common shares in treasury, net effect/(+) sales (–) purchase (6) (9)Movements in accumulated other comprehensive income (134) (2,748)Accrual for dividend and Additional Tier 1 (AT1) coupons ¹ (267) 0Additional value adjustments (299) 194Goodwill and other intangible assets (net of related tax liabilities) (1,850) (1,653)Deferred tax assets that rely on future profitability (excluding those arising from temporary differences) (355) (91)Negative amounts resulting from the calculation of expected loss amounts 41 (219)Defined benefit pension fund assets (211) (333)Direct, indirect and synthetic holdings by the institution of the CET 1 instruments of financial sector entitieswhere the institution has a significant investment in those entities 0 0Securitization positions not included in risk-weighted assets 0 0Deferred tax assets arising from temporary differences (amount above 10 % and 15 % threshold,net of related tax liabilities where the conditions in Art. 38 (3) CRR are met) 0 354Other, including regulatory adjustments 95 413Common Equity Tier 1 (CET 1) capital - closing amount 47,486 50,808Additional Tier 1 (AT1) Capital – opening amount 6,823 7,703New Additional Tier 1 eligible capital issues 0 0Matured and called instruments (1,008) (2,376)Transitional arrangements 1,730 1,708
Of which:Goodwill and other intangible assets (net of related tax liabilities) 1,679 1,696
Other, including regulatory adjustments 59 (212)Additional Tier 1 (AT1) Capital – closing amount 7,604 6,823Tier 1 capital 55,091 57,631Tier 2 (T2) capital – closing amount 6,202 6,384Total regulatory capital 61,292 64,0161 No interim profits to be recognized as per ECB Decision (EU) 2015/656 in accordance with the Article 26(2) of Regulation (EU) No 575/2013 (ECB/2015/4).

96
Deutsche Bank 1 – Management ReportAnnual Report 2018
Development of risk-weighted assets
The table below provides an overview of RWA broken down by risk type and business division. They include the aggregatedeffects of the segmental reallocation of infrastructure related positions, if applicable, as well as reallocations betweenthe segments.
Risk-weighted assets by risk type and business division according to transitional rulesDec 31, 2018
in € m.
Corporate &Investment
Bank
Private &Commercial
BankAsset
ManagementCorporate &
Other TotalCredit Risk 115,035 76,592 5,236 15,964 212,827Settlement Risk 39 0 0 47 86Credit Valuation Adjustment (CVA) 7,642 202 112 42 7,997Market Risk 37,446 89 0 0 37,535Operational Risk 76,145 10,827 5,017 0 91,989Total 236,307 87,709 10,365 16,053 350,432
Dec 31, 2017
in € m.
Corporate &Investment
Bank
Private &Commercial
BankAsset
ManagementCorporate &
Other TotalCredit Risk 118,940 75,377 3,273 16,552 214,142Settlement Risk 142 0 0 5 147Credit Valuation Adjustment (CVA) 6,189 171 84 7 6,451Market Risk 30,896 70 0 0 30,966Operational Risk 74,936 11,654 5,020 0 91,610Total 231,103 87,272 8,378 16,564 343,316
The RWA according to CRR/CRD 4 were € 350.4 billion as of December 31, 2018, compared to € 343.3 billion at the end of2017, which were still subject to transitional arrangements. The increase by € 7.1 billion was primarily driven by Market Riskand CVA RWA. The latter is driven by several methodology and policy-related changes. The Market Risk RWA increase of €6.6 billion is driven by higher Stressed VaR and temporary increases in concentration risk. Credit Risk RWA decreased by €1.3 billion mainly resulting from parameter recalibrations as well as model and methodology changes in addition to lower RWAdue to the improved capturing of pending settlements for syndicated loans, which was partly offset by higher RWA due tobusiness growth in our CIB and PCB segments.
Since January 1, 2018 the RWA under transitional rules is equal to the fully loaded measure as all transitional arrangementsexpired. For December 31, 2017 the RWA on transitional rules still recognized a small subset of equity positions according tograndfathering rules resulting in transitional RWA of € 343.3 billion, slightly below the fully loaded RWA of € 344.2 billion.
The tables below provide an analysis of key drivers for risk-weighted asset movements observed for credit risk, credit valuationadjustments as well as market and operational risk in the reporting period. They also show the corresponding movements incapital requirements, derived from the RWA by an 8% capital ratio.
Development of risk-weighted assets for Credit Risk including Counterparty Credit RiskDec 31, 2018 Dec 31, 2017
in € m. Credit risk RWACapital
requirements Credit risk RWACapital
requirementsCredit risk RWA balance, beginning of year 214,142 17,131 220,345 17,628Book size 4,086 327 3,523 282Book quality (3,314) (265) 506 40Model updates (1,357) (109) 1,272 102Methodology and policy (976) (78) 0 0Acquisition and disposals (1,653) (132) 0 0Foreign exchange movements 2,536 203 (10,162) (813)Other (637) (51) (1,342) (107)Credit risk RWA balance, end of year 212,827 17,026 214,142 17,131

97
Deutsche Bank Risk and capital performanceAnnual Report 2018 Capital, Leverage Ratio and MREL
Of which: Development of risk-weighted assets for Counterparty Credit RiskDec 31, 2018 Dec 31, 2017
in € m.Counterparty
credit risk RWACapital
requirementsCounterparty
credit risk RWACapital
requirementsCounterparty credit risk RWA balance, beginning of year 33,924 2,714 35,614 2,849Book size (8,235) (659) (4,628) (370)Book quality 104 8 3,715 297Model updates (850) (68) 1,272 102Methodology and policy 0 0 0 0Acquisition and disposals 0 0 0 0Foreign exchange movements 339 27 (2,048) (164)Other 0 0 0 0Counterparty credit risk RWA balance, end of year 25,282 2,023 33,924 2,714
The classifications of key drivers for the RWA credit risk development table are fully aligned with the recommendations of theEnhanced Disclosure Task Force (EDTF). Organic changes in our portfolio size and composition are considered in thecategory “Book size”. The category “Book quality” mainly represents the effects from portfolio rating migrations, loss givendefault, model parameter recalibrations as well as collateral and netting coverage activities. “Model updates” include modelrefinements and advanced model roll out. RWA movements resulting from externally, regulatory-driven changes, e.g. applyingnew regulations, are considered in the “Methodology and policy” section. “Acquisition and disposals” is reserved to showsignificant exposure movements which can be clearly assigned to new businesses or disposal-related activities. Changes thatcannot be attributed to the above categories are reflected in the category “Other”.
The decrease in RWA for credit risk by 0.6 % or € 1.3 billion since December 31, 2017 is driven by book quality and model-and methodology-related changes. The category “Book quality” includes reductions resulting from parameter recalibrationsand data enhancements. The category “Model updates” provides further reductions mainly stemming from refinements in ourinternal model method for derivatives. Furthermore the category “Methodology and policy” reflects the derecognition ofirrevocable payment commitments to the Single Resolution Fund and the Deposit Guarantee Scheme which are deductedfrom CET 1 since the beginning of the year. “Other” principally reflects the net impact from lower RWA due to the improvedcapturing of pending settlements for syndicated loans and higher RWA for equity positions following the phase-out of therespective grandfathering provision under CRR/CRD 4 transitional rules. “Acquisition and disposals” provides the reduction incredit risk RWA, which is related to the partial sale of our Poland retail business. These reductions were partly offset byincrease in the category “Book size” representing business growth in our CIB and PCB segments in addition to an increaseresulting from foreign exchange movements.
The decrease in counterparty credit risk is mainly driven by trade terminations as well as data and collateral enhancementsacross the businesses. In addition the category “Model updates” contributed to the overall decrease which includes the impactfrom refinements in our internal model method for derivatives.
Based on the CRR/CRD 4 regulatory framework, we are required to calculate RWA using the CVA which takes into accountthe credit quality of our counterparties. RWA for CVA covers the risk of mark-to-market losses on the expected counterpartyrisk in connection with OTC derivative exposures. We calculate the majority of the CVA based on our own internal model asapproved by the BaFin.
Development of risk-weighted assets for Credit Valuation AdjustmentDec 31, 2018 Dec 31, 2017
in € m. CVA RWACapital
requirements CVA RWACapital
requirementsCVA RWA balance, beginning of year 6,451 516 9,416 753Movement in risk levels (770) (62) (3,228) (258)Market data changes and recalibrations 0 0 0 0Model updates 0 0 0 0Methodology and policy 2,028 162 870 70Acquisitions and disposals 0 0 0 0Foreign exchange movements 288 23 (607) (49)CVA RWA balance, end of year 7,997 640 6,451 516
The development of CVA RWA is broken down into a number of categories: “Movement in risk levels”, which includes changesto the portfolio size and composition; “Market data changes and calibrations”, which includes changes in market data levelsand volatilities as well as recalibrations; “Model updates” refers to changes to either the IMM credit exposure models or thevalue-at-risk models that are used for CVA RWA; “Methodology and policy” relates to changes to the regulation. Any significantbusiness acquisitions or disposals would be presented in the category with that name.

98
Deutsche Bank 1 – Management ReportAnnual Report 2018
As of December 31, 2018, the RWA for CVA amounted to € 8.0 billion, representing an increase of € 1.5 billion (19 %)compared with € 6.5 billion for December 31, 2017. The overall increase was driven by “Methodology and policy” changes,with some offset from de-risking of the portfolio and currency effects; the most notable policy change was the inclusion ofsecurities financing transactions following a change of regulatory guidance.
Development of risk-weighted assets for Market RiskDec 31, 2018
in € m. VaR SVaR IRC CRM Other Total RWATotal capital
requirementsMarket risk RWA balance, beginning of year 4,380 10,896 9,871 56 5,763 30,966 2,477
Movement in risk levels 799 4,562 1,174 (3) 903 7,435 595Market data changes and recalibrations (51) 0 0 0 (165) (215) (17)Model updates/changes 108 431 80 0 (200) 420 34Methodology and policy 131 537 (1,057) (53) (500) (941) (75)Acquisitions and disposals 0 0 0 0 (223) (223) (18)Foreign exchange movements 0 0 0 0 94 94 8Other 0 0 0 0 0 0 0
Market risk RWA balance, end of year 5,368 16,426 10,068 0 5,673 37,535 3,003
Dec 31, 2017
in € m. VaR SVaR IRC CRM Other Total RWATotal capital
requirementsMarket risk RWA balance, beginning of year 5,957 14,271 8,662 273 4,599 33,762 2,701
Movement in risk levels (1,658) (3,375) 2,598 (217) 922 (1,729) (138)Market data changes and recalibrations 81 0 0 0 581 661 53Model updates/changes 0 0 (1,390) 0 (38) (1,428) (114)Methodology and policy 0 0 0 0 0 0 0Acquisitions and disposals 0 0 0 0 0 0 0Foreign exchange movements 0 0 0 0 (301) (301) (24)Other 0 0 0 0 0 0 0
Market risk RWA balance, end of year 4,380 10,896 9,871 56 5,763 30,966 2,477
The analysis for market risk covers movements in our internal models for value-at-risk (VaR), stressed value-at-risk (SvaR),incremental risk charge (IRC) and comprehensive risk measure (CRM) as well as results from the market risk standardizedapproach, which are captured in the table under the category “Other”. The market risk standardized approach covers tradingsecuritizations and nth-to-default derivatives, longevity exposures, relevant Collective Investment Undertakings and marketrisk RWA from Postbank.
The market risk RWA movements due to changes in market data levels, volatilities, correlations, liquidity and ratings areincluded under the “Market data changes and recalibrations” category. Changes to our market risk RWA internal models, suchas methodology enhancements or risk scope extensions, are included in the category of “Model updates”. In the “Methodologyand policy” category we reflect regulatory driven changes to our market risk RWA models and calculations. Significant newbusinesses and disposals would be assigned to the line item “Acquisition and disposals”. The impacts of “Foreign exchangemovements” are only calculated for the CRM and Standardized approach methods.
As of December 31, 2018 the RWA for market risk was € 37.5 billion which has increased by € 6.6 billion (21 %) sinceDecember 31, 2017. The increase was primarily driven by stressed value-at-risk coming from the "Movement in risk levels"category from a reduction in diversification benefit due to changes in the composition of interest rate and equity relatedexposures.
Development of risk-weighted assets for operational riskDec 31, 2018 Dec 31, 2017
in € m.Operational risk
RWACapital
requirementsOperational risk
RWACapital
requirementsOperational risk RWA balance, beginning of year 91,610 7,329 92,675 7,414Loss profile changes (internal and external) (2,847) (228) (2,815) (225)Expected loss development 5,407 433 1,104 88Forward looking risk component 484 39 (3,265) (261)Model updates (2,666) (213) 3,912 313Methodology and policy 0 0 0 0Acquisitions and disposals 0 0 0 0Operational risk RWA balance, end of year 91,989 7,359 91,610 7,329

99
Deutsche Bank Risk and capital performanceAnnual Report 2018 Capital, Leverage Ratio and MREL
Changes of internal and external loss events are reflected in the category “Loss profile changes”. The category “Expectedloss development” is based on divisional business plans as well as historical losses and is deducted from the AMA capitalfigure within certain constraints. The category “Forward looking risk component” reflects qualitative adjustments and as suchthe effectiveness and performance of the day-to-day operational risk management activities via NFR appetite metrics andRCA scores, focusing on the business environment and internal control factors. The category “Model updates” covers modelrefinements such as the implementation of model changes. The category “Methodology and policy” represents externallydriven changes such as regulatory add-ons. The category “Acquisition and disposals” represents significant exposuremovements which can be clearly assigned to new or disposed businesses.
The overall RWA increase of € 0.4 billion was driven by several, largely offsetting effects. A reduced litigation intensitythroughout the industry as well as decreasing provision and legal forecast levels for Deutsche Bank led to a lighter loss profilefeeding into our capital model. These loss profile changes (internal and external) reduced our RWA for Operational Risk by€ 2.8 billion. Moreover, a number of model updates resulted in an overall RWA decrease of € 2.7 billion. These improvementsmostly related to the alignment of weights for internal and external loss data, but also to the implementation of our enhancedRCA process. The resulting decrease has been partly compensated by changes in the forward looking risk component, whereweaker risk appetite metrics and RCA results led to an RWA increase of € 0.5 billion. The most prominent impact, however,originated from the development of our expected loss deductible. We derive our capital requirements as the difference betweenthe total losses simulated in our AMA model and an expected loss deductible. The deductible is given by the minimum of theaverage total loss projected by the model and our operational risk loss forecasts. In 2018, the expected loss deductible wasdominated by the latter, which declined strongly due to our positive outlook on the development of our operational risk profile.Our simulated total loss estimate, which predominantly relies on historical information, was less reactive to this trend, so thatthe difference between the two quantities caused an RWA increase of € 5.4 billion.
Economic Capital
Internal Capital Adequacy
Our internal capital adequacy assessment process (ICAAP) is aimed at maintaining the viability of Deutsche Bank on anongoing basis. We assess our internal capital adequacy from an economic perspective as the ratio of our internal capitalsupply divided by our internal economic capital demand as shown in the table below.
Total capital supply and demandin € m.(unless stated otherwise) Dec 31, 2018 Dec 31, 2017Capital supply
Shareholders' equity 62,495 63,174Noncontrolling interests¹ 900 0AT1 coupons accruals (218) (213)Gain on sale of securitizations, cash flow hedges (26) (29)Fair value gains on own debt and debt valuation adjustments, subject to own credit risk (304) (73)Additional valuation adjustments (1,504) (1,204)Intangible assets (9,141) (8,839)IFRS deferred tax assets excl. temporary differences (3,090) (3,341)Expected loss shortfall (367) (502)Defined benefit pension fund assets2 (1,111) (1,125)Holdings of own common equity tier 1 capital instruments (11) (131)Home loans and savings protection ("Fonds zur bauspartechnischen Absicherung") 0 (19)Other adjustments3 (1,122) (322)Additional tier 1 equity instruments 4,675 4,675
Capital supply 51,176 52,051
Total economic capital requirementCredit risk 10,610 10,769Market risk 10,341 10,428Operational risk 7,359 7,329Business risk 4,758 5,677Diversification benefit (6,960) (7,074)
Capital demand 26,108 27,129
Internal capital adequacy ratio 196 % 192 %1 Includes noncontrolling interest up to the economic capital requirement for each subsidiary.2 Reported as net assets (assets minus liabilities) of a defined pension fund, i.e. applicable for overfunded pension plans.3 Includes € 0.6 billion capital deduction of irrevocable payment commitments related to the Single Resolution Fund and Deposit Guarantee Scheme, since January 1, 2018.

100
Deutsche Bank 1 – Management ReportAnnual Report 2018
A ratio of more than 100 % signifies that the total capital supply is sufficient to cover the capital demand determined by therisk positions. This ratio was 196 % as of December 31, 2018, compared with 192 % as of December 31, 2017. The changeof the ratio was mainly due to a decrease in capital demand partially offset by decrease in capital supply. The capital supplydecreased by € 0.9 billion mainly driven by negative effects from deduction of irrevocable payment commitments to the SingleResolution Fund and the Deposit Guarantee Schemes of € 0.6 billion, IFRS 9 adoption of € 0.4 billion, unrealized losses of€ 0.3 billion from interest rate changes, additional value adjustment deduction of € 0.3 billion and payment of common sharedividend of € 0.2 billion. These negative effects were partially reduced by a positive contribution of € 1.0 billion from our initialpublic offering (IPO) of DWS Group GmbH & Co. KGaA (“DWS”). The decrease in capital demand was driven by lowereconomic capital usage as explained in the section “Risk Profile”.
The above capital adequacy measures apply to the consolidated Deutsche Bank Group as a whole and form an integral partof our risk and capital management framework.
Leverage Ratio
We manage our balance sheet on a Group level and, where applicable, locally in each region. In the allocation of financialresources we favor business portfolios with the highest positive impact on our profitability and shareholder value. We monitorand analyze balance sheet developments and track certain market-observed balance sheet ratios. Based on this we triggerdiscussion and management action by the Group Risk Committee (GRC). Following the publication of the CRR/CRD 4framework, we established a leverage ratio calculation according to that framework.
Leverage Ratio according to revised CRR/CRD 4 framework
The CRR/CRD 4 framework introduced a non-risk based leverage ratio that is intended to act as a supplementary measureto the risk based capital requirements. Its objectives are to constrain the build-up of leverage in the banking sector, helpingavoid destabilizing deleveraging processes which can damage the broader financial system and the economy, and to reinforcethe risk based requirements with a simple, non-risk based “backstop” measure. While the CRR/CRD 4 framework currentlydoes not provide for a mandatory minimum leverage ratio to be complied with, the legislative proposals as part of the EuropeanTrilogue include a 3 % minimum requirement but the proposed implementation dates are different. The final Basel rules thathave been published in December 2017 also include an additional leverage ratio buffer requirement for banks identified asglobal systemically important institutions (“G-SII”) of 50 % of the G-SII buffer. Details of the implementation and the timing ofthe application of this additional leverage ratio buffer remain subject to finalization of the legislative process.
We calculate our leverage ratio exposure on a fully loaded basis in accordance with Article 429 of the CRR as per DelegatedRegulation (EU) 2015/62 of October 10, 2014 published in the Official Journal of the European Union on January 17, 2015amending Regulation (EU) No 575/2013. In addition, we provide the leverage ratio on a phase-in basis as displayed below inthe tables.
Our total leverage ratio exposure includes derivatives, securities financing transactions (SFTs), off-balance sheet exposureand other on-balance sheet exposure (excluding derivatives and SFTs).
The leverage exposure for derivatives is calculated by using the regulatory mark-to-market method for derivatives comprisingthe current replacement cost plus a regulatory defined add-on for the potential future exposure. Variation margin received incash from counterparties is deducted from the current replacement cost portion of the leverage ratio exposure measure andvariation margin paid to counterparties is deducted from the leverage ratio exposure measure related to receivablesrecognized as an asset on the balance sheet, provided certain conditions are met. Deductions of receivables for cash variationmargin provided in derivatives transactions are shown under derivative exposure in the table “Leverage ratio commondisclosure” below. The effective notional amount of written credit derivatives, i.e., the notional reduced by any negative fairvalue changes that have been incorporated in Tier 1 capital is included in the leverage ratio exposure measure; the resultingexposure measure is further reduced by the effective notional amount of purchased credit derivative protection on the samereference name provided certain conditions are met.
The securities financing transaction (SFT) component includes the gross receivables for SFTs, which are netted with SFTpayables if specific conditions are met. In addition to the gross exposure a regulatory add-on for the counterparty credit risk isincluded.

101
Deutsche Bank Risk and capital performanceAnnual Report 2018 Capital, Leverage Ratio and MREL
The off-balance sheet exposure component follows the credit risk conversion factors (CCF) of the standardized approach forcredit risk (0 %, 20 %, 50 %, or 100 %), which depend on the risk category subject to a floor of 10 %.
The other on-balance sheet exposure component (excluding derivatives and SFTs) reflects the accounting values of the assets(excluding derivatives and SFTs) as well as regulatory adjustments for asset amounts deducted in determining Tier 1 capital.
The following tables show the leverage ratio exposure and the leverage ratio, both on a fully loaded basis, in accordance withthe disclosure tables of the implementing technical standards (ITS) which were adopted by the European Commission viaCommission Implementing Regulation (EU) 2016/200 published in the Official Journal of the European Union on February 16,2016. For additional information, they also contain the phase-in figures.
Summary reconciliation of accounting assets and leverage ratio exposuresin € bn. Dec 31, 2018 Dec 31, 2017Total assets as per published financial statements 1,348 1,475
Adjustment for entities which are consolidated for accounting purposes but are outside the scope ofregulatory consolidation 0 5Adjustments for derivative financial instruments (140) (172)Adjustment for securities financing transactions (SFTs) 14 41Adjustment for off-balance sheet items (i.e. conversion to credit equivalent amounts of off-balancesheet exposures) 99 95Other adjustments (49) (50)
Leverage ratio total exposure measure (fully loaded) 1,273 1,395
Leverage ratio total exposure measure (phase-in) 1,273 1,396
Leverage ratio common disclosurein € bn.(unless stated otherwise) Dec 31, 2018 Dec 31, 2017Total derivative exposures 159 166Total securities financing transaction exposures 103 158Total off-balance sheet exposures 99 95Other Assets 925 990Asset amounts deducted in determining Tier 1 capital¹ (13) (14)
Tier 1 capital (fully loaded) 52.1 52.9Leverage ratio total exposure measure (fully loaded) 1,273 1,395Leverage ratio (fully loaded, in %) 4.1 3.8
Tier 1 capital (phase-in) 55.1 57.6Leverage ratio total exposure measure (phase-in) 1,273 1,396Leverage ratio (phase-in, in %) 4.3 4.11 Using a fully loaded definition of Tier 1 capital. The amount using a transitional definition of Tier 1 capital is € (13) billion and € (13) billion as of December 31, 2018 and
December 31, 2017, respectively.
Description of the factors that had an impact on the leverage ratio in 2018
As of December 31, 2018, our fully loaded CRR/CRD 4 leverage ratio was 4.1 % compared to 3.8 % as of December 31,2017, taking into account as of December 31, 2018 a fully loaded Tier 1 capital of € 52.1 billion over an applicable exposuremeasure of € 1,273 billion (€ 52.9 billion and € 1,395 billion as of December 31, 2017, respectively).
Our CRR/CRD 4 leverage ratio according to transitional provisions was 4.3 % as of December 31, 2018 (4.1 % as ofDecember 31, 2017), calculated as Tier 1 capital according to transitional rules of € 55.1 billion over an applicable exposuremeasure of € 1,273 billion (€ 57.6 billion and € 1,396 billion as of December 31, 2017, respectively). Starting with January 1,2018, the exposure measure under transitional rules is equal to the fully loaded exposure measure while it was € 1 billionhigher as of December 31, 2017 as the asset amounts deducted in determining Tier 1 capital were lower under transitionalrules.

102
Deutsche Bank 1 – Management ReportAnnual Report 2018
Over the year 2018, our leverage ratio exposure decreased by € 122 billion to € 1,273 billion. This is primarily driven by thereduction of € 55 billion in SFT exposures reflecting a decrease on the balance sheet in the SFT related items (securitiespurchased under resale agreements, securities borrowed and receivables from prime brokerage) and lower add-ons forcounterparty credit risk due to extended collateral recognition. The € 65 billion reduction in Other Assets reflects thedevelopment on our balance sheet, in particular for cash and central bank / interbank balances which decreased by € 37 billionand non-derivative trading assets which decreased by € 33 billion. Derivatives decreased by € 7 billion from lower add-ons forthe potential future exposure. Off-balance sheet exposures slightly increased by € 4 billion corresponding to higher notionalamounts for irrevocable lending commitments.
The decrease of the leverage ratio exposure in 2018 includes a positive foreign exchange impact of € 26 billion mainly due tothe depreciation of the Euro against the U.S. dollar.
Our leverage ratio calculated as the ratio of total assets under IFRS to total equity under IFRS was 20 as of December 31,2018 compared to 22 as of December 31, 2017.
For main drivers of the Tier 1 capital development please refer to section “Regulatory Capital” in this report.
Minimum Requirement of Own Funds and Eligible Liabilities (“MREL”)
MREL Requirements
The minimum requirement for own funds and eligible liabilities (“MREL”) requirement was introduced by the European Union’sregulation establishing uniform rules and a uniform procedure for the resolution of credit institutions (Single ResolutionMechanism Regulation or “SRM Regulation”) and the European Union’s Directive establishing a framework for the recoveryand resolution of credit institutions (Bank Recovery and Resolution Directive or “BRRD”) as implemented into German law bythe German Recovery and Resolution Act.
The currently required level of MREL is determined by the competent resolution authorities for each supervised bankindividually on a case-by-case basis, depending on the respective preferred resolution strategy. In the case of Deutsche BankAG, MREL is determined by the Single Resolution Board (“SRB”). While there is no statutory minimum level of MREL, theBRRD and a delegated regulation set out criteria which the resolution authority must consider when determining the relevantrequired level of MREL. Guidance is provided through a policy published annually by the SRB.
In the second quarter of 2018, the SRB has set a binding MREL ratio for Deutsche Bank which was communicated via theGerman Federal Financial Supervisory Authority (Bundesanstalt für Finanzdienstleistungsaufsicht, “BaFin”). The MREL ratioon a consolidated basis has been set at 9.14 % of Total Liabilities and Own Funds (“TLOF”) and applied immediately. TLOFprincipally consists of IFRS total liabilities, reflecting the regulatory scope of consolidation, after consideration of derivativesnetting and of own funds, i.e. regulatory capital. MREL will be reviewed annually by the SRB.
Deutsche Bank AG, as a global systemically important bank, will also become subject to global minimum standards for itsTotal Loss-Absorbing Capacity (“TLAC”). The TLAC requirement will be implemented by the November 2016 banking reformpackage, on which the European Parliament and the Council of the European Union reached a provisional political agreementin December 2018. We expect that the TLAC requirements will be effective immediately when the provisions of the bankingreform package enter into force, which is currently expected to occur in the first half of 2019.
The banking reform package implements TLAC by introducing a new “Pillar 1” MREL requirement for global systemicallyimportant institutions, such as Deutsche Bank. This new requirement is based on both risk-based and non-risk-baseddenominators and is expected to be set at the higher of 18 % of total risk exposure and 6.75 % of the leverage ratio exposuremeasure following a transition period. In addition, the competent authorities will have the ability to impose an MREL add-onrequirement on global systemically important institutions. TLAC and MREL requirements are specifically designed to requirebanks to maintain a sufficient amount of instruments which are eligible to absorb losses in resolution with the aim of ensuringthat failing banks can be resolved without recourse to taxpayers’ money.

103
Deutsche Bank Risk and capital performanceAnnual Report 2018 Capital, Leverage Ratio and MREL
MREL ratio development
As of December 31, 2018 TLOF were € 1,058 billion and available MREL were € 118 billion, corresponding to a ratio of11.14 %. This means that Deutsche Bank has a comfortable buffer of own funds and eligible liabilities which is € 21 billionabove our MREL of € 97 billion (i.e. 9.14 % of TLOF).
MREL disclosurein € m.(unless stated otherwise) Dec 31, 2018Regulatory capital elements of MRELCommon Equity Tier 1 capital (CET 1) 47,486Additional Tier 1 (AT1) capital instruments eligible under MREL 7,604Tier 2 (T2) capital instruments eligible under MREL
Tier 2 (T2) capital instruments before MREL adjustments 6,202Tier 2 (T2) capital instruments adjustments for MREL 745
Tier 2 (T2) capital instruments eligible under MREL 6,947Total regulatory capital elements of MREL 62,037
Other elements of MRELSenior non-preferred plain vanilla 54,852Senior preferred plain vanilla 1,020Total other elements of MREL 55,872
Total liabilities and own funds after prudential netting (TLOF) 1,058,484
MREL ratioMREL ratio (as percentage of TLOF) 11.14%
Own Funds and Eligible Liabilities
In order to meet the MREL requirement, Deutsche Bank needs to ensure that a sufficient amount of eligible instruments ismaintained. Instruments eligible for MREL are regulatory capital instruments (“own funds”) and liabilities that meet certaincriteria, which are referred to as eligible liabilities.
Own funds used for MREL excludes Tier 2 capital instruments with a remaining maturity of less than 1 year and includes thefull amount of T2 capital instruments with a remaining maturity of greater than 1 year and less than 5 years which are excludedfrom regulatory capital
Eligible liabilities are liabilities that meet eligibility criteria which are supposed to ensure that they are structurally suited asloss-absorbing capital. As a result, eligible liabilities exclude deposits which are covered by an insurance deposit protectionscheme or which are preferred under German insolvency law (e.g., deposits from private clients as well as small and medium-size enterprises). Among other things, secured liabilities, derivatives liabilities and structured notes are generally excluded aswell. In addition, eligible liabilities must have a remaining time to maturity of at least one year and must either be issued underthe law of a Member State of the European Union or must include a bail-in clause in their contractual terms to make write-down or conversion effective.
The banking reform package will introduce additional eligibility criteria that global systemically important institutions will haveto meet with respect to TLAC and any MREL-add on requirement, most notably a subordination requirement. EffectiveJanuary 1, 2017, the German Banking Act provided for a new class of statutorily subordinated debt securities that rank as“senior non-preferred” below the bank’s other senior liabilities (but in priority to the bank’s contractually subordinated liabilities,such as those qualifying as Tier 2 instruments). Following a harmonization effort by the European Union implemented inGermany effective July 21, 2018, banks are permitted to decide if a specific issuance of eligible senior debt will be in the non-preferred or in the preferred category. Any such “senior non-preferred” debt instruments issued by Deutsche Bank AG undersuch new rules rank on parity with its then outstanding debt instruments that were classified as “senior non-preferred” underthe prior rules. Deutsche Bank predominantly relies on Deutsche Bank AG’s “senior non-preferred” debt instruments as eligibleliabilities for MREL.

104
Deutsche Bank 1 – Management ReportAnnual Report 2018
Credit Risk ExposureFor 2018, we provide information following the IFRS 9 accounting standard, while 2017 numbers are based on the IAS 39accounting rules and are presented in the old format. Since the accounting requirements have changed significantly, numbersare not comparable. For further information please refer to chapter “IFRS 9 Transition Impact Analysis” in Note 2 “RecentlyAdopted and New Accounting Pronouncements” to the consolidated financial statement.
Counterparty credit exposure arises from our traditional non-trading lending activities which include elements such as loansand contingent liabilities, as well as from our direct trading activity with clients in certain instruments including OTC derivativeslike foreign exchange forwards and Forward Rate Agreements. Default risk also arises from our positions in equity productsand traded credit products such as bonds.
We define our credit exposure by taking into account all transactions where losses might occur due to the fact thatcounterparties may not fulfill their contractual payment obligations.
Maximum Exposure to Credit Risk
The maximum exposure to credit risk table shows the direct exposure before consideration of associated collateral held andother credit enhancements (netting and hedges) that do not qualify for offset in our financial statements for the periodsspecified. The table also presents exposures which are subject to impairment in accordance with IFRS 9. The netting creditenhancement component includes the effects of legally enforceable netting agreements as well as the offset of negative mark-to-markets from derivatives against pledged cash collateral. The collateral credit enhancement component mainly includesreal estate, collateral in the form of cash as well as securities-related collateral. In relation to collateral we apply internallydetermined haircuts and additionally cap all collateral values at the level of the respective collateralized exposure.

105
Deutsche Bank Risk and capital performanceAnnual Report 2018 Credit Risk Exposure
Maximum Exposure to Credit RiskDec 31, 2018
Credit Enhancements
in € m.
Maximumexposure
to credit risk1Subject to
impairment Netting Collateral
Guaranteesand Credit
derivatives2Total credit
enhancementsFinancial assets at amortized cost3
Cash and central bank balances 188,736 188,736 − 0 − 0Interbank balances (w/o central banks) 8,885 8,885 − 4 0 4Central bank funds sold and securitiespurchased under resale agreements 8,222 8,222 − 7,734 − 7,734Securities borrowed 3,396 3,396 − 0 − 0Loans 404,537 404,537 − 224,353 16,582 240,934Other assets subject to credit risk4,5 71,899 65,010 29,073 3,199 79 32,352Securities held to maturity N/M N/M N/M N/M N/M N/M
Total financial assets at amortized cost3 685,676 678,787 29,073 235,290 16,661 281,024
Financial assets at fair value through profitor loss6
Trading assets 96,966 − − 677 155 831Positive market values from derivativefinancial instruments 320,058 − 250,231 48,548 82 298,861Non-trading financial assets mandatoryat fair value through profit or loss 97,771 − 245 67,385 0 67,630
Of which:Securities purchased under resaleagreement 44,543 − 245 43,258 0 43,503Securities borrowed 24,210 − − 24,003 0 24,003Loans 12,741 − − 125 0 125
Financial assets designated at fair valuethrough profit or loss 104 − − 0 0 0Financial assets available for sale N/M N/M N/M N/M N/M N/M
Total financial assets at fair value throughprofit or loss 514,899 − 250,476 116,610 237 367,323
Financial assets at fair value through OCI 51,182 51,182 0 1,488 520 2,008Of which:Securities purchased under resaleagreement 1,097 1,097 − 621 0 621Securities borrowed 0 0 − 0 0 0Loans 5,092 5,092 − 450 104 554
Total financial assets at fair value throughOCI 51,182 51,182 − 1,488 520 2,008
Financial guarantees and other creditrelated contingent liabilities7 51,605 51,605 − 3,375 5,291 8,666Revocable and irrevocable lendingcommitments and other credit relatedcommitments7 212,049 211,055 − 16,418 4,734 21,152Total off-balance sheet 263,654 262,659 − 19,793 10,025 29,818
Maximum exposure to credit risk 1,515,410 992,628 279,550 373,181 27,443 680,1731 Does not include credit derivative notional sold (€ 415,967 million) and credit derivative notional bought protection.2 Bought Credit protection is reflected with the notional of the underlying.3 All amounts at gross value before deductions of allowance for credit losses.4 All amounts at amortized cost (gross) except for qualifying hedge derivatives, which are reflected at Fair value through P&L.5 Includes Asset Held for Sale regardless of accounting classification.6 Excludes equities, other equity interests and commodities.7 Figures are reflected at notional amounts.

106
Deutsche Bank 1 – Management ReportAnnual Report 2018
Dec 31, 2017Credit Enhancements
in € m.¹
Maximumexposure
to credit risk2 Netting Collateral
Guaranteesand Credit
derivatives3Total credit
enhancementsCash and central bank balances 225,655 − 0 − 0Interbank balances (w/o central banks) 9,265 − 0 7 7Central bank funds sold and securities purchased underresale agreements 9,971 − 9,914 − 9,914Securities borrowed 16,732 − 15,755 − 15,755Financial assets at fair value through profit or loss4 550,313 286,149 136,650 265 423,065
Trading assets 98,730 − 2,635 146 2,781Positive market values from derivative financial instruments 361,032 285,421 52,797 119 338,338Financial assets designated at fair value throughprofit or loss 90,551 728 81,218 0 81,946
Of which:Securities purchased under resale agreement 57,843 728 56,566 0 57,294Securities borrowed 20,254 − 20,034 0 20,034
Financial assets available for sale4 47,766 − 559 0 559Loans5 405,621 − 211,578 20,063 231,641Securities held to maturity 3,170 − − − −Other assets subject to credit risk 66,900 29,854 1,514 56 31,424Financial guarantees and other credit related contingentliabilities6 48,212 − 4,024 6,579 10,604Irrevocable lending commitments and other credit relatedcommitments6 158,253 − 7,544 1,759 9,303Maximum exposure to credit risk 1,541,858 316,003 387,538 28,730 732,2711 All amounts at carrying value unless otherwise indicated.2 Does not include credit derivative notional sold (€ 828,804 million) and credit derivative notional bought protection.3 Bought credit protection is reflected with the notional of the underlying.4 Excludes equities, other equity interests and commodities.5 Gross loans less deferred expense/unearned income before deductions of allowance for loan losses.6 Figures are reflected at notional amounts. Revocable commitments not included in the year were € 45.1 billion.
The overall decrease in maximum exposure to credit risk for December 31, 2018 is € 26.4 billion, mainly driven by a € 41.0billion decrease in positive market values from derivative financial instruments and Cash and central bank balances decreasedby € 36.9 billion, offset by an increase due to first time inclusion of revocable lending commitments of € 44.3 billion.
Included in the category of trading assets as of December 31, 2018, were traded bonds of € 85.2 billion (€ 87.3 billion as ofDecember 31, 2017) of which over 79 % were investment-grade (over 82 % as of December 31, 2017).
Credit Enhancements are split into three categories: netting, collateral and guarantees / credit derivatives. Haircuts, parametersetting for regular margin calls as well as expert judgments for collateral valuation are employed to prevent marketdevelopments from leading to a build-up of uncollateralized exposures. All categories are monitored and reviewed regularly.Overall credit enhancements received are diversified and of adequate quality being largely cash, highly rated governmentbonds and third-party guarantees mostly from well rated banks and insurance companies. These financial institutions aredomiciled mainly in European countries and the United States. Furthermore we have collateral pools of highly liquid assetsand mortgages (principally consisting of residential properties mainly in Germany) for the homogeneous retail portfolio.
Main Credit Exposure Categories
The tables in this section show details about several of our main credit exposure categories, namely loans, revocable andirrevocable lending commitments, contingent liabilities over-the-counter (“OTC”) derivatives, debt securities and repo andrepo-style transactions:
– “Loans” are gross loans as reported on our balance sheet at amortized cost and loans at fair value through othercomprehensive income before deduction of allowance for credit losses, it also includes loans at fair value through profitand loss. This includes “Traded loans” that are bought and held for the purpose of selling them in the near term, or thematerial risks of which have all been hedged or sold. From a regulatory perspective the latter category principally coverstrading book positions.
– “Revocable and irrevocable lending commitments” consist of the undrawn portion of revocable and irrevocable lending-related commitments.
– “Contingent liabilities” consist of financial and performance guarantees, standby letters of credit and other similararrangements (mainly indemnity agreements).
– “OTC derivatives” are our credit exposures from over-the-counter derivative transactions that we have entered into, afternetting and cash collateral received. On our balance sheet, these are included in financial assets at fair value through profitor loss or, for derivatives qualifying for hedge accounting, in other assets, in either case, before netting and cash collateralreceived.

107
Deutsche Bank Risk and capital performanceAnnual Report 2018 Credit Risk Exposure
– “Debt securities” include debentures, bonds, deposits, notes or commercial paper, which are issued for a fixed term andredeemable by the issuer, as reported on our balance sheet within accounting categories at amortized cost and at fair valuethrough other comprehensive income before deduction of allowance for credit losses, it also includes category at fair valuethrough profit and loss. This includes “Traded bonds”, which are bonds, deposits, notes or commercial paper that arebought and held for the purpose of selling them in the near term. From a regulatory perspective the latter category principallycovers trading book positions.
– “Repo and repo-style transactions” consist of reverse repurchase transactions, as well as securities or commoditiesborrowing transactions before application of netting and collateral received.
Although considered in the monitoring of maximum credit exposures, the following are not included in the details of our maincredit exposure: brokerage and securities related receivables, cash and central bank balances, interbank balances (withoutcentral banks), assets held for sale, accrued interest receivables, traditional securitization positions.
Main Credit Exposure Categories by Business DivisionsDec 31, 2018
Loans Off-balance sheet OTC derivatives
in € m.at amortized
cost1
trading -at fair value
through P&L
Designated /mandatory at
fair valuethrough P&L
at fair valuethrough OCI2
Revocable andirrevocable
lendingcommitments3
Contingentliabilities
at fair valuethrough P&L4
Corporate & InvestmentBank 135,078 11,462 12,532 5,092 168,332 48,871 27,028Private & CommercialBank 269,175 0 209 0 43,331 2,638 353Asset Management 68 0 0 0 117 14 0Corporate & Other 216 0 0 0 269 81 37Total 404,537 11,462 12,741 5,092 212,049 51,605 27,417
Dec 31, 2018Debt Securities Repo and repo-style transactions7 Total
in € m.at amortized
cost5at fair value
through P&Lat fair value
through OCI6at amortized
cost8at fair value
through P&Lat fair value
through OCI9
Corporate & InvestmentBank 579 88,451 1,032 11,348 64,684 0 574,488Private & CommercialBank 4,569 19 7,799 260 0 0 328,353Asset Management 0 419 0 0 0 0 618Corporate & Other 51 3,776 36,162 11 4,068 1,097 45,768Total 5,199 92,664 44,993 11,618 68,752 1,097 949,2271 Includes stage 3 and stage 3 POCI loans at amortized cost amounting to € 9.1 billion as of December 31, 2018.2 Includes stage 3 and stage 3 POCI loans at fair value through OCI amounting to € 1 million as of December 31, 20183 Includes stage 3 and stage 3 POCI off-balance sheet exposure amounting to € 599 million as of December 31, 2018.4 Includes the effect of netting agreements and cash collateral received where applicable. Excludes derivatives qualifying for hedge accounting.5 Includes stage 3 and stage 3 POCI debt securities at amortized cost amounting to € 73 million as of December 31, 2018.6 Includes stage 3 and stage 3 POCI debt securities at fair value through OCI amounting to € 2 million as of December 31, 2018.7 Before reflection of collateral and limited to securities purchased under resale agreements and securities borrowed.8 Includes stage 3 and stage 3 POCI repo and repo-style transactions at amortized cost amounting to € 0 as of December 31, 2018.9 Includes stage 3 and stage 3 POCI repo and repo-style transactions at fair value through OCI amounting to € 0 as of December 31, 2018.
Dec 31, 2017
Loans Off-balance sheetOTC
derivatives³ Debt securities
Repo andrepo-style
transactions Total
in € m. Loans¹TradedLoans
Irrevocablelending
commit-ments²
Contingentliabilities
OTCderivatives³
Debtsecurities
TradedBonds
Repo andrepo-style
transactions TotalCorporate & InvestmentBank 137,954 10,875 141,892 45,342 30,993 2,667 83,067 99,335 552,125Private & Commercial Bank 267,554 1 16,201 2,802 422 14,421 0 835 302,235Asset Management 87 0 53 16 0 39 67 0 262Corporate & Other 26 0 107 52 15 31,124 4,130 4,630 40,084Total 405,621 10,876 158,253 48,212 31,430 48,251 87,264 104,800 894,7071 Includes impaired loans amounting to € 6.2 billion as of December 31, 2017.2 Includes irrevocable lending commitments related to consumer credit exposure of € 10.1 billion as of December 31, 2017.3 Includes the effect of netting agreements and cash collateral received where applicable. Excludes derivatives qualifying for hedge accounting.4 Includes debt securities on financial assets available for sale and securities held to maturity.5 Before reflection of collateral and limited to securities purchased under resale agreements and securities borrowed.

108
Deutsche Bank 1 – Management ReportAnnual Report 2018
For 2018, we provide information following the IFRS 9 accounting standard, while 2017 numbers are based on the IAS 39accounting rules and are presented in the old format. Since the accounting requirements have changed significantly, numbersare not comparable. For further information please refer to chapter “IFRS 9 Transition Impact Analysis” in Note 2 “RecentlyAdopted and New Accounting Pronouncements” to the consolidated financial statement.
Our main credit exposure increased by € 54.5 billion.
– From a divisional perspective, increases in exposure are observed across all divisions. Details in respect of Corporate &Investment Bank and Private & Commercial Bank credit exposures are provided in subsequent sections. Corporate & Otherprimarily comprises of Treasury exposures.
– From a product perspective, significant increases in exposure have been observed on account of first time inclusion ofRevocable commitments and inclusion of all Loan categories both part of the IFRS 9 introduction. This Increase has beenpartially offset by decrease on repos due to managed reduction.
Main Credit Exposure Categories by Industry SectorsDec 31, 2018
Loans Off-balance sheet OTC derivatives
in € m.at amortized
cost1
trading -at fair value
through P&L
Designated /mandatory at
fair valuethrough P&L
at fair valuethrough OCI2
Revocable andirrevocable
lendingcommitments3
Contingentliabilities
at fair valuethrough P&L4
Agriculture, forestry andfishing 640 15 0 0 541 40 5Mining and quarrying 2,995 563 0 141 6,094 1,505 210Manufacturing 28,342 786 7 1,831 45,296 11,985 1,378Electricity, gas, steamand air conditioningsupply 3,210 284 57 3 4,908 1,563 452Water supply, sewerage,waste management andremediation activities 867 28 0 0 399 155 181Construction 3,902 495 0 25 3,638 2,089 338Wholesale and retailtrade, repair of motorvehicles and motorcycles 20,293 488 215 875 14,380 5,058 317Transport and storage 5,774 647 48 79 5,059 920 1,017Accommodation and foodservice activities 2,026 40 0 28 1,761 195 158Information andcommunication 4,372 505 29 374 17,277 2,061 793Financial and insuranceactivities 77,628 3,530 11,845 882 62,739 22,191 17,415Real estate activities 33,432 1,538 88 95 5,375 221 1,084Professional, scientificand technical activities 6,590 239 0 190 4,172 1,708 47Administrative andsupport service activities 7,381 338 169 34 4,835 451 628Public administration anddefense, compulsorysocial security 8,917 1,160 203 472 978 48 2,088Education 698 1 0 0 76 18 362Human health servicesand social work activities 3,483 104 0 31 1,862 124 239Arts, entertainment andrecreation 859 71 0 21 873 38 13Other service activities 4,720 520 77 10 2,406 708 157Activities of householdsas employers,undifferentiated goods-and services-producingactivities of householdsfor own use 188,407 85 2 0 29,372 522 347Activities of extraterritorialorganizations and bodies 1 25 0 0 7 6 188Total 404,537 11,462 12,741 5,092 212,049 51,605 27,417

109
Deutsche Bank Risk and capital performanceAnnual Report 2018 Credit Risk Exposure
Dec 31, 2018Debt Securities Repo and repo-style transactions7 Total
in € m.at amortized
cost5at fair value
through P&Lat fair value
through OCI6at amortized
cost8at fair value
through P&Lat fair value
through OCI9
Agriculture, forestry andfishing 0 9 0 0 0 0 1,251Mining and quarrying 119 481 5 0 0 0 12,113Manufacturing 472 1,245 47 0 0 0 91,389Electricity, gas, steamand air conditioningsupply 374 631 45 0 0 0 11,527Water supply, sewerage,waste management andremediation activities 5 36 0 0 0 0 1,670Construction 35 585 59 0 0 0 11,165Wholesale and retailtrade, repair of motorvehicles and motorcycles 87 224 1 0 0 0 41,938Transport and storage 100 608 55 0 0 0 14,308Accommodation and foodservice activities 21 25 0 0 0 0 4,254Information andcommunication 168 724 505 0 0 0 26,810Financial and insuranceactivities 2,771 18,102 16,219 10,668 66,949 1,097 312,035Real estate activities 84 1,928 23 6 28 0 43,903Professional, scientificand technical activities 23 306 0 0 0 0 13,275Administrative andsupport service activities 38 160 0 434 131 0 14,599Public administration anddefense, compulsorysocial security 797 63,468 27,892 510 1,631 0 108,165Education 0 121 0 0 0 0 1,275Human health servicesand social work activities 0 474 63 0 0 0 6,381Arts, entertainment andrecreation 0 398 0 0 0 0 2,273Other service activities 43 2,691 26 0 13 0 11,371Activities of householdsas employers,undifferentiated goods-and services-producingactivities of householdsfor own use 0 0 0 0 0 0 218,735Activities of extraterritorialorganizations and bodies 62 448 54 0 0 0 790Total 5,199 92,664 44,993 11,618 68,752 1,097 949,2271 Includes stage 3 and stage 3 POCI loans at amortized cost amounting to € 9.1 billion as of December 31, 2018.2 Includes stage 3 and stage 3 POCI loans at fair value through OCI amounting to € 1 million as of December 31, 20183 Includes stage 3 and stage 3 POCI off-balance sheet exposure amounting to € 599 million as of December 31, 2018.4 Includes the effect of netting agreements and cash collateral received where applicable. Excludes derivatives qualifying for hedge accounting.5 Includes stage 3 and stage 3 POCI debt securities at amortized cost amounting to € 73 million as of December 31, 2018.6 Includes stage 3 and stage 3 POCI debt securities at fair value through OCI amounting to € 2 million as of December 31, 2018.7 Before reflection of collateral and limited to securities purchased under resale agreements and securities borrowed.8 Includes stage 3 and stage 3 POCI repo and repo-style transactions at amortized cost amounting to € 0 as of December 31, 2018.9 Includes stage 3 and stage 3 POCI repo and repo-style transactions at fair value through OCI amounting to € 0 as of December 31, 2018.

110
Deutsche Bank 1 – Management ReportAnnual Report 2018
Dec 31, 2017
Loans Off-balance sheetOTC
derivatives³ Debt securities
Repo andrepo-style
transactions Total
in € m. Loans¹TradedLoans
Irrevocablelending
commit-ments²
Contingentliabilities
OTCderivatives³
Debtsecurities4
TradedBonds
Repo andrepo-style
transactions5 TotalFinancial intermediation 52,087 1,635 31,839 9,407 17,991 15,590 16,982 100,006 245,536Fund managementactivities 18,668 306 6,213 173 1,232 53 737 44 27,426Manufacturing 27,569 628 38,450 14,893 1,347 294 1,991 0 85,172Wholesale and retail trade 19,246 388 10,684 5,623 413 50 501 0 36,905Households 186,687 74 9,975 671 398 0 0 0 197,805Commercial real estateactivities 29,180 2,080 4,343 508 1,185 1 1,468 41 38,806Public sector 13,510 611 844 138 3,510 30,301 54,989 4,694 108,597Other6 58,674 5,154 55,904 16,799 5,353 1,963 10,596 16 154,459Total 405,621 10,876 158,253 48,212 31,430 48,251 87,264 104,800 894,7071 Includes impaired loans amounting to € 6.2 billion as of December 31, 2017.2 Includes irrevocable lending commitments related to consumer credit exposure of € 10.1 billion as of December 31, 2017.3 Includes the effect of netting agreements and cash collateral received where applicable. Excludes derivatives qualifying for hedge accounting.4 Includes debt securities on financial assets available for sale and securities held to maturity.5 Before reflection of collateral and limited to securities purchased under resale agreements and securities borrowed.6 Major industries within Other were: Real estate other than commercial (€ 63.4 billion), Transport; storage and communication (€ 28.2 billion), Other community and personal
social services (€ 14.1 billion), Electricity; gas and water supply (€ 12.8 billion), Construction (€ 11.7 billion) and Mining and quarrying (€ 10.0 billion).
The above tables give an overview of our credit exposure by industry, allocated based on the NACE code of the counterparty.NACE (Nomenclature des Activités Économiques dans la Communauté Européenne) is a standard European industryclassification system. The 2018 table provides further breakdown on industry to increase the transparency.
The portfolio is subject to the same credit underwriting requirements stipulated in our “Principles for Managing Credit Risk”,including various controls according to single name, country, industry and product-specific concentration.
Material transactions, such as loans underwritten with the intention to syndicate, are subject to review by senior credit riskmanagement professionals and (depending upon size) an underwriting credit committee and/or the Management Board. Highemphasis is placed on structuring such transactions so that de-risking is achieved in a timely and cost-effective manner.Exposures within these categories are mostly to good quality borrowers and also subject to further risk mitigation as outlinedin the description of our Credit Portfolio Strategies Group’s activities.
Our household loans exposure is principally associated with our Private & Commercial Bank portfolios.
Our commercial real estate loans, primarily in the U.S. and Europe, are generally secured by first mortgages on the underlyingreal estate property. Credit underwriting policy guidelines provide that LTV ratios of generally less than 75 % are maintained.Additionally, given the significance of the underlying collateral independent external appraisals are commissioned for allsecured loans by a valuation team (part of the independent Credit Risk Management function) which is also responsible forreviewing and challenging the reported real estate values regularly.
The Commercial Real Estate Group only in exceptional cases retains mezzanine or other junior tranches of debt (although wedo underwrite mezzanine loans). Loans originated for distribution are carefully monitored under a pipeline limit. Securitizedloan positions are entirely sold (except where regulation requires retention of economic risk), while we frequently retain aportion of syndicated bank loans. This hold portfolio is also subject to the aforementioned principles and policy guidelines. Wealso participate in conservatively underwritten unsecured lines of credit to well-capitalized real estate investment trusts andother public companies, which are generally investment-grade. We provide both fixed rate (generally securitized product) andfloating rate loans, with interest rate exposure subject to hedging arrangements. In addition, sub-performing and non-performing loans and pools of loans are acquired from other financial institutions at generally substantial discounts to both thenotional amounts and current collateral values. The underwriting process for these is stringent and the exposure is managedunder separate portfolio limits. Commercial real estate property valuations and rental incomes can be significantly impactedby macro-economic conditions and underlying properties to idiosyncratic events. Accordingly, the portfolio is categorized ashigher risk and hence subject to the aforementioned tight restrictions on concentration.
Our credit exposure to our ten largest counterparties accounted for 8 % of our aggregated total credit exposure in thesecategories as of December 31, 2018 compared with 8 % as of December 31, 2017. Our top ten counterparty exposures werewith well-rated counterparties or otherwise related to structured trades which show high levels of risk mitigation.
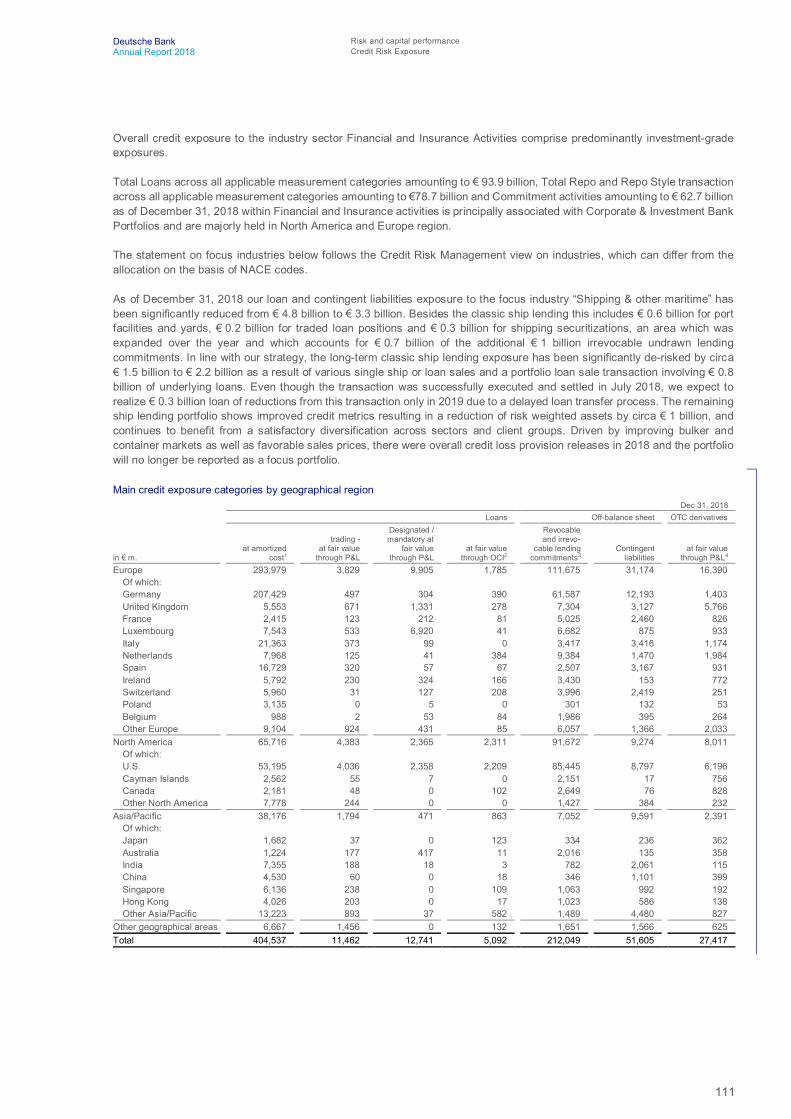
111
Deutsche Bank Risk and capital performanceAnnual Report 2018 Credit Risk Exposure
Overall credit exposure to the industry sector Financial and Insurance Activities comprise predominantly investment-gradeexposures.
Total Loans across all applicable measurement categories amounting to € 93.9 billion, Total Repo and Repo Style transactionacross all applicable measurement categories amounting to €78.7 billion and Commitment activities amounting to € 62.7 billionas of December 31, 2018 within Financial and Insurance activities is principally associated with Corporate & Investment BankPortfolios and are majorly held in North America and Europe region.
The statement on focus industries below follows the Credit Risk Management view on industries, which can differ from theallocation on the basis of NACE codes.
As of December 31, 2018 our loan and contingent liabilities exposure to the focus industry “Shipping & other maritime” hasbeen significantly reduced from € 4.8 billion to € 3.3 billion. Besides the classic ship lending this includes € 0.6 billion for portfacilities and yards, € 0.2 billion for traded loan positions and € 0.3 billion for shipping securitizations, an area which wasexpanded over the year and which accounts for € 0.7 billion of the additional € 1 billion irrevocable undrawn lendingcommitments. In line with our strategy, the long-term classic ship lending exposure has been significantly de-risked by circa€ 1.5 billion to € 2.2 billion as a result of various single ship or loan sales and a portfolio loan sale transaction involving € 0.8billion of underlying loans. Even though the transaction was successfully executed and settled in July 2018, we expect torealize € 0.3 billion loan of reductions from this transaction only in 2019 due to a delayed loan transfer process. The remainingship lending portfolio shows improved credit metrics resulting in a reduction of risk weighted assets by circa € 1 billion, andcontinues to benefit from a satisfactory diversification across sectors and client groups. Driven by improving bulker andcontainer markets as well as favorable sales prices, there were overall credit loss provision releases in 2018 and the portfoliowill no longer be reported as a focus portfolio.
Main credit exposure categories by geographical regionDec 31, 2018
Loans Off-balance sheet OTC derivatives
in € m.at amortized
cost1
trading -at fair value
through P&L
Designated /mandatory at
fair valuethrough P&L
at fair valuethrough OCI2
Revocableand irrevo-
cable lendingcommitments3
Contingentliabilities
at fair valuethrough P&L4
Europe 293,979 3,829 9,905 1,785 111,675 31,174 16,390Of which:Germany 207,429 497 304 390 61,587 12,193 1,403United Kingdom 5,553 671 1,331 278 7,304 3,127 5,766France 2,415 123 212 81 5,025 2,460 826Luxembourg 7,543 533 6,920 41 6,682 875 933Italy 21,363 373 99 0 3,417 3,416 1,174Netherlands 7,968 125 41 384 9,384 1,470 1,984Spain 16,729 320 57 67 2,507 3,167 931Ireland 5,792 230 324 166 3,430 153 772Switzerland 5,960 31 127 208 3,996 2,419 251Poland 3,135 0 5 0 301 132 53Belgium 988 2 53 84 1,986 395 264Other Europe 9,104 924 431 85 6,057 1,366 2,033
North America 65,716 4,383 2,365 2,311 91,672 9,274 8,011Of which:U.S. 53,195 4,036 2,358 2,209 85,445 8,797 6,196Cayman Islands 2,562 55 7 0 2,151 17 756Canada 2,181 48 0 102 2,649 76 828Other North America 7,778 244 0 0 1,427 384 232
Asia/Pacific 38,176 1,794 471 863 7,052 9,591 2,391Of which:Japan 1,682 37 0 123 334 236 362Australia 1,224 177 417 11 2,016 135 358India 7,355 188 18 3 782 2,061 115China 4,530 60 0 18 346 1,101 399Singapore 6,136 238 0 109 1,063 992 192Hong Kong 4,026 203 0 17 1,023 586 138Other Asia/Pacific 13,223 893 37 582 1,489 4,480 827
Other geographical areas 6,667 1,456 0 132 1,651 1,566 625Total 404,537 11,462 12,741 5,092 212,049 51,605 27,417

112
Deutsche Bank 1 – Management ReportAnnual Report 2018
Dec 31, 2018Debt Securities Repo and repo-style transactions7 Total
in € m.at amortized
cost5at fair value
through P&Lat fair value
through OCI6at amortized
cost8at fair value
through P&Lat fair value
through OCI9
Europe 4,467 36,459 24,922 4,394 14,342 316 553,638Of which:Germany 1,443 6,685 9,597 925 899 2 303,352United Kingdom 182 14,552 2,499 966 4,379 0 46,608France 714 3,061 1,559 0 3,681 0 20,157Luxembourg 167 1,332 3,474 89 1,206 0 29,796Italy 249 2,707 1,146 578 1,040 0 35,563Netherlands 592 1,785 1,219 0 179 0 25,130Spain 168 2,146 504 379 529 0 27,504Ireland 91 920 215 0 1,277 0 13,370Switzerland 40 560 119 112 316 0 14,139Poland 0 130 2,387 0 0 0 6,144Belgium 139 542 481 0 0 0 4,935Other Europe 682 2,038 1,724 1,344 836 315 26,938
North America 237 34,356 14,491 1,942 45,548 0 280,306Of which:U.S. 220 33,112 13,915 1,275 30,428 0 241,186Cayman Islands 0 631 9 655 14,094 0 20,937Canada 0 419 556 0 847 0 7,707Other North America 17 194 10 12 178 0 10,476
Asia/Pacific 495 19,343 5,037 4,567 8,625 226 98,632Of which:Japan 63 3,142 8 2,752 5,808 0 14,545Australia 0 3,977 510 19 523 0 9,366India 267 2,172 1,849 0 79 61 14,948China 0 2,124 0 0 614 0 9,192Singapore 114 1,403 671 0 325 0 11,242Hong Kong 0 520 222 0 11 0 6,746Other Asia/Pacific 51 6,006 1,777 1,797 1,266 165 32,594
Other geographical areas 0 2,506 543 714 237 555 16,651Total 5,199 92,664 44,993 11,618 68,752 1,097 949,2271 Includes stage 3 and stage 3 POCI loans at amortized cost amounting to € 9.1 billion as of December 31, 2018.2 Includes stage 3 and stage 3 POCI loans at fair value through OCI amounting to € 1 million as of December 31, 2018.3 Includes stage 3 and stage 3 POCI off-balance sheet exposure amounting to € 599 million as of December 31, 2018.4 Includes the effect of netting agreements and cash collateral received where applicable. Excludes derivatives qualifying for hedge accounting.5 Includes stage 3 and stage 3 POCI debt securities at amortized cost amounting to € 73 million as of December 31, 2018.6 Includes stage 3 and stage 3 POCI debt securities at fair value through OCI amounting to € 2 million as of December 31, 2018.7 Before reflection of collateral and limited to securities purchased under resale agreements and securities borrowed.8 Includes stage 3 and stage 3 POCI repo and repo-style transactions at amortized cost amounting to € 0 as of December 31, 2018.9 Includes stage 3 and stage 3 POCI repo and repo-style transactions at fair value through OCI amounting to € 0 as of December 31, 2018.

113
Deutsche Bank Risk and capital performanceAnnual Report 2018 Credit Risk Exposure
Dec 31, 2017
Loans Off-balance sheetOTC
derivatives3 Debt securities
Repo andrepo-style
transactions5 Total
in € m. Loans1TradedLoans
Irrevocablelending
commit-ments2
Contingentliabilities
OTCderivatives3
Debtsecurities4
TradedBonds
Repo andrepo-style
transactions5 TotalEurope 299,937 3,149 65,739 27,574 18,353 35,304 33,120 26,648 509,825
Of which:Germany 199,867 146 27,483 10,739 1,661 12,414 4,912 3,421 260,644United Kingdom 6,895 190 5,748 1,514 5,849 864 9,668 10,123 40,851France 2,651 242 8,265 1,266 1,231 3,597 3,096 3,442 23,788Luxembourg 15,983 247 2,858 484 1,102 6,142 1,017 711 28,544Italy 21,836 497 1,642 3,657 1,750 642 4,167 820 35,012Netherlands 8,304 493 6,498 1,627 2,292 2,793 2,022 82 24,112Spain 13,250 227 1,866 3,046 704 946 2,188 987 23,213Ireland 4,415 272 1,843 481 972 655 1,022 2,673 12,333Switzerland 6,922 65 2,324 2,488 313 163 644 416 13,336Poland 7,871 36 807 234 26 1,820 296 0 11,089Belgium 1,177 12 1,280 405 352 1,574 601 0 5,401Other Europe 10,765 723 5,124 1,633 2,099 3,696 3,486 3,975 31,500
North America 64,086 5,129 85,358 10,031 10,015 10,986 31,636 56,776 274,017Of which:U.S. 53,795 4,750 80,776 9,489 8,036 10,623 29,972 44,659 242,101Cayman Islands 2,312 103 1,951 52 700 17 1,041 9,162 15,336Canada 838 87 1,564 110 1,092 346 272 1,688 5,996Other North America 7,141 190 1,068 380 187 0 351 1,267 10,584
Asia/Pacific 34,469 1,735 4,447 8,967 2,254 1,025 20,319 19,909 93,126Of which:Japan 1,093 66 276 349 366 15 4,760 10,354 17,278Australia 1,477 310 1,076 128 277 588 3,716 1,453 9,026India 7,034 86 717 1,645 219 0 3,973 1,517 15,191China 4,393 2 378 1,195 263 0 836 3,130 10,198Singapore 4,946 75 419 794 177 0 927 220 7,559Hong Kong 4,224 551 385 598 144 2 399 45 6,348Other Asia/Pacific 11,300 644 1,197 4,259 808 419 5,707 3,190 27,526
Other geographical areas 7,130 862 2,708 1,639 808 936 2,190 1,466 17,739Total 405,621 10,876 158,253 48,212 31,430 48,251 87,264 104,800 894,7071 Includes impaired loans amounting to € 6.2 billion as of December 31, 2017.2 Includes irrevocable lending commitments related to consumer credit exposure of € 10.1 billion as of December 31, 2017.3 Includes the effect of netting agreements and cash collateral received where applicable. Excludes derivatives qualifying for hedge accounting.4 Includes debt securities on financial assets available for sale and securities held to maturity.5 Before reflection of collateral and limited to securities purchased under resale agreements and securities borrowed.
The above tables give an overview of our credit exposure by geographical region, allocated based on the counterparty’scountry of domicile, see also section “Credit Exposure to Certain Eurozone Countries” of this report for a detailed discussionof the “country of domicile view”.
Our largest concentration of credit risk within loans from a regional perspective is in our home market Germany, with asignificant share in households, which includes the majority of our mortgage lending business.
Within OTC derivatives, tradable assets as well as repo and repo-style transactions, our largest concentrations from a regionalperspective were in Europe and North America.

114
Deutsche Bank 1 – Management ReportAnnual Report 2018
Credit Exposure to Certain Eurozone Countries
Certain Eurozone countries are presented within the table below due to concerns relating to sovereign risk.
In our “country of domicile view” we aggregate credit risk exposures to counterparties by allocating them to the domicile of theprimary counterparty, irrespective of any link to other counterparties, or in relation to credit default swaps underlying referenceassets from, these Eurozone countries. Hence we also include counterparties whose group parent is located outside of thesecountries and exposures to special purpose entities whose underlying assets are from entities domiciled in other countries.
The following table, which is based on the country of domicile view, presents our gross position, the included amount thereofof undrawn / contingent exposure and our net exposure to these Eurozone countries. The gross exposure reflects our netcredit risk exposure grossed up for net credit derivative protection purchased with underlying reference assets domiciled inone of these countries, guarantees received and collateral. Such collateral is particularly held with respect to the retail portfolio,but also for financial institutions predominantly based on derivative margining arrangements, as well as for corporates. Inaddition, the amounts also reflect the allowance for credit losses. In some cases, our counterparties’ ability to draw on undrawncommitments is limited by terms included in the specific contractual documentation. Net credit exposures are presented aftereffects of collateral held, guarantees received and further risk mitigation, including net notional amounts of credit derivativesfor protection sold/bought. The provided gross and net exposures to certain European countries do not include credit derivativetranches and credit derivatives in relation to our correlation business which, by design, is structured to be credit risk neutral.Additionally, the tranche and correlated nature of these positions does not allow a meaningful disaggregated notionalpresentation by country, e.g., as identical notional exposures represent different levels of risk for different tranche levels.
Gross position, included undrawn exposure and net exposure to certain Eurozone countries – Country of Domicile View
SovereignFinancial
Institutions Corporates Individuals Other TotalDec31,
Dec31,
Dec31,
Dec31,
Dec31,
Dec31,
Dec31,
Dec31,
Dec31,
Dec31,
Dec31,
Dec31,
in € m. 2018 2017 2018 2017 2018 2017 2018 2017 2018 2017 2018¹ 2017Greece
Gross 53 55 821 734 406 526 5 5 1 0 1,286 1,320Undrawn / contingent 0 0 35 30 4 5 1 0 0 0 41 36
Net 35 38 277 270 (5) 8 2 1 1 0 311 317Ireland
Gross 418 865 662 927 9,016 7,556 26 31 3,8752 2,2752 13,998 11,654Undrawn / contingent 0 0 23 4 3,279 2,005 1 0 8022 3162 4,105 2,326
Net 339 717 198 477 6,186 4,420 6 6 3,7772 2,2752 10,506 7,895Italy
Gross 3,628 2,875 3,188 3,338 11,893 12,050 18,449 16,489 264 147 37,422 34,898Undrawn / contingent 1 13 34 28 5,211 5,162 1,790 96 0 0 7,035 5,300
Net 2,538 1,015 634 672 7,864 8,202 9,997 7,633 264 146 21,296 17,669Portugal
Gross (204) (227) 64 185 888 1,329 14 1,757 27 80 789 3,123Undrawn / contingent 0 0 32 75 382 374 5 24 0 0 419 474
Net (122) (223) 61 115 832 893 7 134 27 80 805 998Spain
Gross 1,779 1,672 1,575 1,301 12,597 9,106 9,990 9,570 167 128 26,108 21,777Undrawn / contingent 0 0 184 225 4,890 4,583 533 259 18 0 5,625 5,068
Net 1,766 1,554 910 552 10,257 7,113 2,668 2,117 256 128 15,857 11,464Total gross 5,674 5,240 6,310 6,485 34,800 30,566 28,484 27,851 4,335 2,629 79,603 72,771
Total Undrawn / contingent 1 14 307 364 13,767 12,130 2,331 380 819 316 17,225 13,203Total net³ 4,555 3,102 2,080 2,086 25,134 20,637 12,680 9,891 4,325 2,629 48,775 38,3441 Approximately 75 % of the overall exposure as per December 31, 2018 will mature within the next 5 years.2 Other exposures to Ireland include exposures to counterparties where the domicile of the group parent is located outside of Ireland as well as exposures to special purpose
entities whose underlying assets are from entities domiciled in other countries.3 Total net exposure excludes credit valuation reserves for derivatives amounting to € 86.3 million as of December 31, 2018 and € 64.6 million as of December 31, 2017.4 Revocable commitments not included in the year were € 2.5 billion.
Net exposure to the above selected Eurozone countries increased by € 10.4 billion in 2018 driven by increased exposure inSpain, Italy and Ireland. Further, movement of € 2.5 billion in net exposure is due to first time inclusion of revocable loancommitments as part of the IFRS 9 introduction.
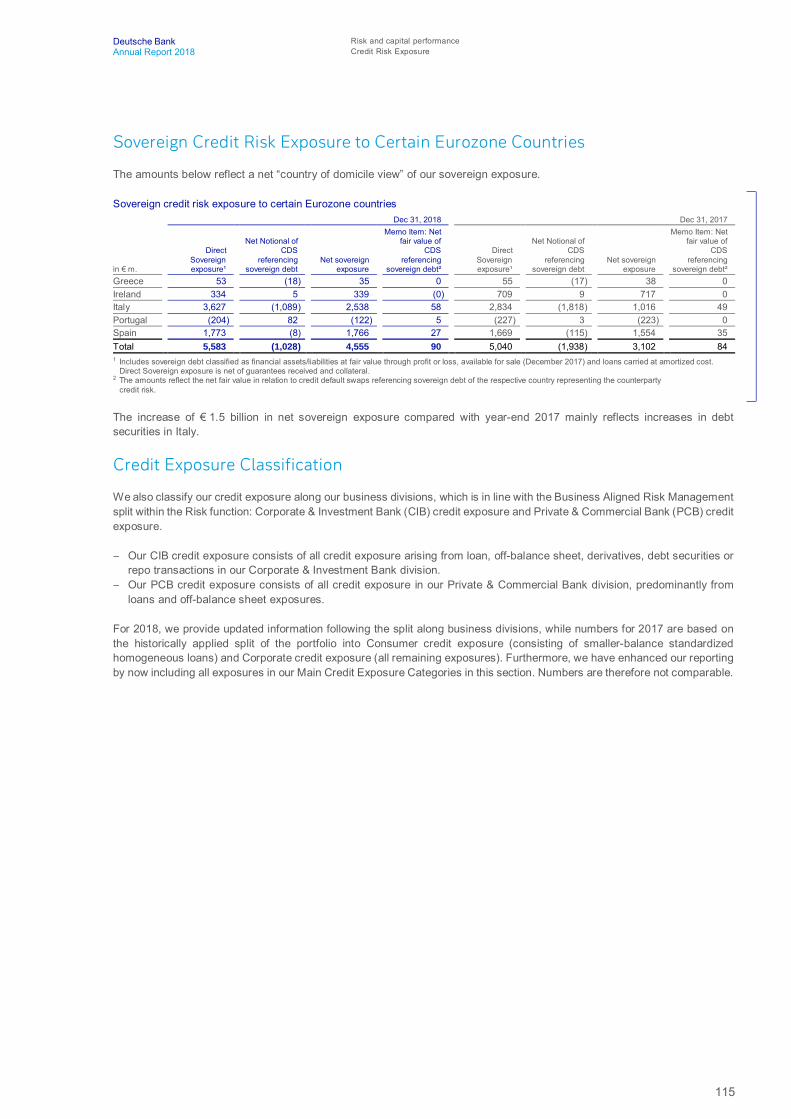
115
Deutsche Bank Risk and capital performanceAnnual Report 2018 Credit Risk Exposure
Sovereign Credit Risk Exposure to Certain Eurozone Countries
The amounts below reflect a net “country of domicile view” of our sovereign exposure.
Sovereign credit risk exposure to certain Eurozone countriesDec 31, 2018 Dec 31, 2017
in € m.
DirectSovereignexposure¹
Net Notional ofCDS
referencingsovereign debt
Net sovereignexposure
Memo Item: Netfair value of
CDSreferencing
sovereign debt²
DirectSovereignexposure¹
Net Notional ofCDS
referencingsovereign debt
Net sovereignexposure
Memo Item: Netfair value of
CDSreferencing
sovereign debt²Greece 53 (18) 35 0 55 (17) 38 0Ireland 334 5 339 (0) 709 9 717 0Italy 3,627 (1,089) 2,538 58 2,834 (1,818) 1,016 49Portugal (204) 82 (122) 5 (227) 3 (223) 0Spain 1,773 (8) 1,766 27 1,669 (115) 1,554 35Total 5,583 (1,028) 4,555 90 5,040 (1,938) 3,102 841 Includes sovereign debt classified as financial assets/liabilities at fair value through profit or loss, available for sale (December 2017) and loans carried at amortized cost.
Direct Sovereign exposure is net of guarantees received and collateral.2 The amounts reflect the net fair value in relation to credit default swaps referencing sovereign debt of the respective country representing the counterparty
credit risk.
The increase of € 1.5 billion in net sovereign exposure compared with year-end 2017 mainly reflects increases in debtsecurities in Italy.
Credit Exposure Classification
We also classify our credit exposure along our business divisions, which is in line with the Business Aligned Risk Managementsplit within the Risk function: Corporate & Investment Bank (CIB) credit exposure and Private & Commercial Bank (PCB) creditexposure.
– Our CIB credit exposure consists of all credit exposure arising from loan, off-balance sheet, derivatives, debt securities orrepo transactions in our Corporate & Investment Bank division.
– Our PCB credit exposure consists of all credit exposure in our Private & Commercial Bank division, predominantly fromloans and off-balance sheet exposures.
For 2018, we provide updated information following the split along business divisions, while numbers for 2017 are based onthe historically applied split of the portfolio into Consumer credit exposure (consisting of smaller-balance standardizedhomogeneous loans) and Corporate credit exposure (all remaining exposures). Furthermore, we have enhanced our reportingby now including all exposures in our Main Credit Exposure Categories in this section. Numbers are therefore not comparable.

116
Deutsche Bank 1 – Management ReportAnnual Report 2018
CIB Credit Exposure
The tables below show our CIB Credit Exposure by product types and internal rating bands. Please refer to section "MeasuringCredit Risk" for more details about our internal ratings.
Main CIB credit exposure categories according to our internal creditworthiness categories of our counterparties – grossDec 31, 2018
in € m.(unless stated otherwise) Loans Off-balance sheet
OTCderivatives
RatingbandProbability
of default in %1at amortized
cost
trading -at fair value
through P&L
Designated /mandatory at
fair valuethrough P&L
at fair valuethrough OCI
Revocableand irrevo-
cable lendingcommitments
Contingentliabilities
at fair valuethrough P&L2
iAAA–iAA > 0.00 ≤ 0.04 12,632 25 7,879 164 20,043 4,398 9,926iA > 0.04 ≤ 0.11 29,455 266 518 775 44,927 10,104 7,113iBBB > 0.11 ≤ 0.5 29,761 1,061 519 2,734 54,477 23,743 5,789iBB > 0.5 ≤ 2.27 31,393 5,384 1,587 1,333 27,754 5,888 3,006
iB > 2.27 ≤10.22 19,828 3,522 1,665 84 16,263 3,504 996
iCCC and below > 10.22 ≤100 12,009 1,204 364 1 4,868 1,234 197
Total 135,078 11,462 12,532 5,092 168,332 48,871 27,028
Dec 31, 2018in € m.(unless stated otherwise) Debt Securities Repo and repo-style transactions
RatingbandProbability
of default in %1at amortized
costat fair value
through P&Lat fair value
through OCIat amortized
costat fair value
through P&Lat fair value
through OCI TotaliAAA–iAA > 0.00 ≤ 0.04 87 54,365 8 2,929 33,339 0 145,795iA > 0.04 ≤ 0.11 38 6,885 122 1,279 9,967 0 111,448iBBB > 0.11 ≤ 0.5 112 8,686 114 275 6,190 0 133,459iBB > 0.5 ≤ 2.27 189 16,657 639 3,775 14,236 0 111,841
iB > 2.27 ≤10.22 105 1,365 149 2,704 891 0 51,078
iCCC and below > 10.22 ≤100 49 492 0 387 61 0 20,867
Total 579 88,451 1,032 11,348 64,684 0 574,4881 Reflects the probability of default for a one year time horizon.2 Includes the effect of netting agreements and cash collateral received where applicable.
Main CIB credit exposure categories according to our internal creditworthiness categories of our counterparties – netDec 31, 2018¹
in € m.(unless stated otherwise) Loans Off-balance sheet
OTCderivatives
RatingbandProbability
of default in %2at amortized
cost
trading -at fair value
through P&L
Designated /mandatory at
fair valuethrough P&L
at fair valuethrough OCI
Revocableand irrevo-
cable lendingcommitments
Contingentliabilities
at fair valuethrough P&L
iAAA–iAA > 0.00 ≤ 0.04 10,064 25 7,755 164 18,804 3,872 3,890iA > 0.04 ≤ 0.11 25,535 266 518 775 43,491 8,444 3,292iBBB > 0.11 ≤ 0.5 22,151 729 518 2,641 52,159 21,321 3,637iBB > 0.5 ≤ 2.27 18,076 4,066 1,018 1,302 26,568 4,630 2,351
iB > 2.27 ≤10.22 6,434 2,880 655 9 15,083 2,262 776
iCCC and below > 10.22 ≤100 3,571 1,049 364 1 4,172 701 69
Total 85,831 9,014 10,828 4,892 160,277 41,229 14,015
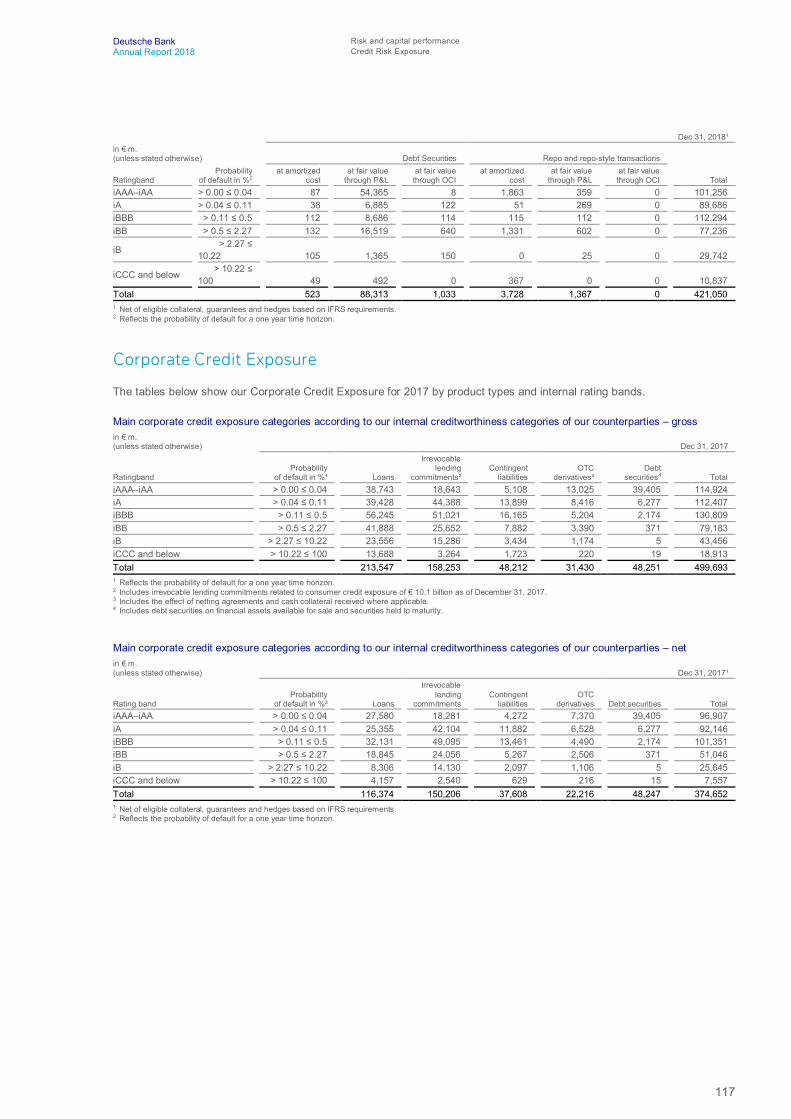
117
Deutsche Bank Risk and capital performanceAnnual Report 2018 Credit Risk Exposure
Dec 31, 2018¹in € m.(unless stated otherwise) Debt Securities Repo and repo-style transactions
RatingbandProbability
of default in %2at amortized
costat fair value
through P&Lat fair value
through OCIat amortized
costat fair value
through P&Lat fair value
through OCI TotaliAAA–iAA > 0.00 ≤ 0.04 87 54,365 8 1,863 359 0 101,256iA > 0.04 ≤ 0.11 38 6,885 122 51 269 0 89,686iBBB > 0.11 ≤ 0.5 112 8,686 114 115 112 0 112,294iBB > 0.5 ≤ 2.27 132 16,519 640 1,331 602 0 77,236
iB > 2.27 ≤10.22 105 1,365 150 0 25 0 29,742
iCCC and below > 10.22 ≤100 49 492 0 367 0 0 10,837
Total 523 88,313 1,033 3,728 1,367 0 421,0501 Net of eligible collateral, guarantees and hedges based on IFRS requirements.2 Reflects the probability of default for a one year time horizon.
Corporate Credit Exposure
The tables below show our Corporate Credit Exposure for 2017 by product types and internal rating bands.
Main corporate credit exposure categories according to our internal creditworthiness categories of our counterparties – grossin € m.(unless stated otherwise) Dec 31, 2017
RatingbandProbability
of default in %¹ Loans
Irrevocablelending
commitments²Contingent
liabilitiesOTC
derivatives³Debt
securities4 TotaliAAA–iAA > 0.00 ≤ 0.04 38,743 18,643 5,108 13,025 39,405 114,924iA > 0.04 ≤ 0.11 39,428 44,388 13,899 8,416 6,277 112,407iBBB > 0.11 ≤ 0.5 56,245 51,021 16,165 5,204 2,174 130,809iBB > 0.5 ≤ 2.27 41,888 25,652 7,882 3,390 371 79,183iB > 2.27 ≤ 10.22 23,556 15,286 3,434 1,174 5 43,456iCCC and below > 10.22 ≤ 100 13,688 3,264 1,723 220 19 18,913Total 213,547 158,253 48,212 31,430 48,251 499,6931 Reflects the probability of default for a one year time horizon.2 Includes irrevocable lending commitments related to consumer credit exposure of € 10.1 billion as of December 31, 2017.3 Includes the effect of netting agreements and cash collateral received where applicable.4 Includes debt securities on financial assets available for sale and securities held to maturity.
Main corporate credit exposure categories according to our internal creditworthiness categories of our counterparties – netin € m.(unless stated otherwise) Dec 31, 2017¹
Rating bandProbability
of default in %² Loans
Irrevocablelending
commitmentsContingent
liabilitiesOTC
derivatives Debt securities TotaliAAA–iAA > 0.00 ≤ 0.04 27,580 18,281 4,272 7,370 39,405 96,907iA > 0.04 ≤ 0.11 25,355 42,104 11,882 6,528 6,277 92,146iBBB > 0.11 ≤ 0.5 32,131 49,095 13,461 4,490 2,174 101,351iBB > 0.5 ≤ 2.27 18,845 24,056 5,267 2,506 371 51,046iB > 2.27 ≤ 10.22 8,306 14,130 2,097 1,106 5 25,645iCCC and below > 10.22 ≤ 100 4,157 2,540 629 216 15 7,557Total 116,374 150,206 37,608 22,216 48,247 374,6521 Net of eligible collateral, guarantees and hedges based on IFRS requirements.2 Reflects the probability of default for a one year time horizon.

118
Deutsche Bank 1 – Management ReportAnnual Report 2018
CPSG Risk Mitigation for the CIB Credit Exposure
Our Credit Portfolio Strategies Group (“CPSG”) helps mitigate the risk of our corporate credit exposures. The notional amountof CPSG’s risk reduction activities decreased from € 32.7 billion as of December 31, 2017, to € 31.1 billion as of December31, 2018.
As of year-end 2018, CPSG mitigated the credit risk of € 30.9 billion of loans and lending-related commitments, throughsynthetic collateralized loan obligations supported predominantly by financial guarantees. This position totaled € 32 billion asof December 31, 2017.
CPSG also held credit derivatives with an underlying notional amount of € 0.2 billion as of December 31, 2018. The positiontotaled € 0.7 billion as of December 31, 2017. The credit derivatives used for our portfolio management activities are accountedfor at fair value.
PCB credit exposure
PCB credit exposure, credit exposure stage 3 and net credit costs
Total exposure in € m. of which loan book in € m.Credit exposure stage 3 in
€ m.Net credit costs
as a % of total exposure1
Dec 31, 2018 Dec 31, 2018 Dec 31, 2018 Dec 31, 2018PCB Germany (excl. WM) 242,277 195,435 2,737 0.09%
Consumer Finance 33,392 16,029 905 0.66%Mortgage 153,040 143,985 1,397 (0.01%)Business Finance 28,039 20,582 357 0.14%Commercial Mortgage 10,102 9,660 67 (0.09%)Financial Markets 17,099 4,574 10 (0.01%)Other 605 605 0 0%
PCC International 38,598 34,119 1,825 0.44%Consumer Finance 11,056 8,342 381 0.86%Mortgage 17,419 17,333 835 0%Business Finance 9,119 8,400 608 0.82%Other 1,005 44 2 0%
Wealth Management 47,479 39,830 853 0.02%Total PCB credit exposure 328,353 269,384 5,415 0.12%1 Net credit costs for the twelve months period ended at the respective balance sheet date divided by the total exposure at that balance sheet date.
The tables below presents our Consumer Credit Exposure for 2017.
Consumer credit exposure, consumer loan delinquencies and net credit costsTotal exposure
in € m.¹90 days or more past due as
a % of total exposure¹Net credit costs as a % of
total exposure²Dec 31, 2017³ Dec 31, 2017³ Dec 31, 2017³
Consumer credit exposure Germany: 153,728 0.73 0.12Consumer and small business financing 21,224 2.96 1.07Mortgage lending 132,505 0.37 (0.03)
Consumer credit exposure outside Germany 38,345 3.77 0.39Consumer and small business financing 15,298 6.54 0.78Mortgage lending 23,047 1.93 0.12
Total consumer credit exposure 192,074 1.34 0.171 Includes impaired loans amounting to € 2.8 billion as of December 31, 20172 Net credit costs for the twelve months period ended at the respective balance sheet date divided by the exposure at that balance sheet date.3 Total Exposure above represents Loans at amortized cost basis IAS 39 accounting rules applicable on December 31, 2017.
Consumer finance is divided into personal instalment loans, credit lines and credit cards. Consumer finance business isuncollateralized, loan risk depends on client quality. Various lending requirements are stipulated, including (but not limited to)client rating, maximum loan amounts and maximum tenors, and are adapted to regional conditions and/or circumstances ofthe borrower (i.e., for consumer loans a maximum loan amount taking into account customer net income). Given the largelyhomogeneous nature of this portfolio, counterparty credit-worthiness and ratings are predominately derived by utilizing anautomated decision engine.

119
Deutsche Bank Risk and capital performanceAnnual Report 2018 Credit Risk Exposure
Mortgage business is principally the financing of owner-occupied residential properties (minor focus on buy-to-let andcommercial properties) sold by various business channels in Europe, primarily in Germany but also in Spain and Italy. Thelevel of credit risk of the mortgage loan portfolio is determined by assessing the quality of the client and the underlyingcollateral. The loan amounts are generally larger than consumer finance loans and they are extended for longer time horizons.Based on our underwriting criteria and processes and the diversified portfolio (customers/properties) with low loan-to-value(LTV) ratios, the mortgage portfolio is categorized as lower risk, while consumer finance is categorized as medium risk.
Business finance represents credit products for small businesses, SME up to large corporates. Products range from currentaccounts and credit lines to investment loans or revolving facilities, factoring and leasing. Smaller clients below a turnover of€ 2.5 million are limited to current accounts and loans. Clients are located primarily in Germany, but credit can also beextended to subsidiaries abroad, mostly in Europe. The debtors of factoring clients may be located worldwide. The respectivecredit exposure is usually insured through Hermes guarantees or trade insurance.
Commercial mortgage business is the financing of commercial properties, mostly office, retail, hotels and residentialproperties. Financing is made via SPV, through investment funds or directly. Focus locations are prime real estate locationsprimarily in Western Europe with Germany as the most important market.
Financial Market represents treasury investments in corporates, banks and financial institutions as well as sovereigns.Products are mostly covered and uncovered bonds, in loan exposure the majority represents Bundesbank exposure as wellas loans to German sub-sovereigns and public institutions.
The Wealth Management Business Unit offers customized wealth management solutions and private banking servicesincluding discretionary portfolio management and traditional and alternative investment solutions, complemented by structuredrisk management, wealth planning, lending and family office services for wealth, high-net-worth (HNW) and ultra-high-net-worth (UHNW) individuals and family offices. Wealth Management’s total exposure is divided into Lombard Lending (againstreadily marketable liquid collateral / securities) and Structured Lending (against less liquid collateral). While the level of creditrisk for the Lombard portfolio is determined by assessing the quality of the underlying collateral, the level of credit risk for theStructured portfolio is determined by assessing both the quality of the client and the collateral. Products range from securedlombard and mortgage loans to current accounts (Europe only), credit lines and other loans; to a lesser extent derivatives andcontingencies. Clients are located globally.
According to the new scope of this chapter, the loan to value for December 2018 is calculated for the PCB mortgageportfolio instead of the consumer mortgage portfolio.
PCB mortgage loan-to-value1
Dec 31, 2018≤ 50 % 67 %> 50 ≤ 70 % 16 %> 70 ≤ 90 % 9 %> 90 ≤ 100 % 3 %> 100 ≤ 110 % 2 %> 110 ≤ 130 % 2 %> 130 % 1 %1 When assigning the exposure to the corresponding LTV buckets, the exposure amounts are distributed according to their relative share of the underlying assessed real estate
value.
The table below shows the Consumer mortgage lending exposure grouped by loan-to-value buckets for 2017.Consumer mortgage lending exposure grouped by loan-to-value buckets 1
Dec 31, 2017≤ 50 % 68 %> 50 ≤ 70 % 16 %> 70 ≤ 90 % 9 %> 90 ≤ 100 % 3 %> 100 ≤ 110 % 2 %> 110 ≤ 130 % 1 %> 130 % 1 %1 When assigning the exposure to the corresponding LTV buckets, the exposure amounts are distributed according to their relative share of the underlying assessed real estate
value.

120
Deutsche Bank 1 – Management ReportAnnual Report 2018
The LTV expresses the amount of exposure as a percentage of the underlying real estate value.
Our LTV ratios are calculated using the total exposure divided by the current determined value of the respective properties.These values are monitored and updated if necessary on a regular basis. The exposure of transactions that are additionallybacked by liquid collateral is reduced by the respective collateral values, whereas any prior charges increase thecorresponding total exposure. The LTV calculation includes exposure which is secured by real estate collateral. Any mortgagelending exposure that is collateralized exclusively by any other type of collateral is not included in the LTV calculation.
The creditor’s creditworthiness, the LTV and the quality of collateral is an integral part of our risk management when originatingloans and when monitoring and steering our credit risks. In general, we are willing to accept higher LTV’s, the better thecreditor’s creditworthiness is. Nevertheless, restrictions of LTV apply e.g. for countries with negative economic outlook orexpected declines of real estate values.
As of December 31, 2018, 67 % of our exposure related to the mortgage lending portfolio had a LTV ratio below or equal to50 %, almost unchanged to 68% in the prior year.
Credit Exposure from Derivatives
All exchange traded derivatives are cleared through central counterparties (“CCPs”), the rules and regulations of which providefor daily margining of all current and future credit risk positions emerging out of such transactions. To the extent possible, wealso use CCP services for OTC derivative transactions (“OTC clearing”); we thereby benefit from the credit risk mitigationachieved through the CCP’s settlement system.
The Dodd-Frank Act provides for an extensive framework for the regulation of OTC derivatives, including mandatory clearing,exchange trading and transaction reporting of certain OTC derivatives, as well as rules regarding the registration of, andcapital, margin and business conduct standards for, swap dealers, security-based swap dealers, major swap participants andmajor security-based swap participants. The Dodd-Frank Act and related CFTC rules introduced in 2013 mandatory OTCclearing in the United States for certain standardized OTC derivative transactions, including certain interest rate swaps andindex credit default swaps. The European Regulation (EU) No 648/2012 on OTC Derivatives, Central Counterparties andTrade Repositories (“EMIR”) introduced a number of risk mitigation techniques for non-centrally cleared OTC derivatives in2013 and the reporting of OTC and exchange traded derivatives in 2014. Mandatory clearing for certain standardized OTCderivatives transactions in the EU began in June 2016, and margin requirements for uncleared OTC derivative transactions inthe EU started in February 2017. Deutsche Bank implemented the exchange of both initial and variation margin in the EU fromFebruary 2017 for the first category of counterparties subject to the EMIR margin for uncleared derivatives requirements. Allother in-scope entities followed the variation margin requirements from March 1, 2017. Deutsche Bank further implementedthe exchange of initial margin with the second and third categories of counterparties beginning in September 2017 andSeptember 2018, respectively. Initial margin requirements are subject to a phased implementation schedule which will be fullyapplied by September 2020.
The CFTC adopted final rules in 2016 that require additional interest rate swaps to be cleared, with a phased implementationschedule ending in October 2018. Deutsche Bank implemented the CFTC’s expanded clearing requirements for the relevantinterest rate swaps subject to the phased compliance, covering identified instruments denominated in AUD, CAD, CHF, HKD,MXN, NOK, PLN, SEK and SGD. In December 2016, also pursuant to the Dodd-Frank Act, the CFTC re-proposed regulationsto impose position limits on certain commodities and economically equivalent swaps, futures and options. More recently, inNovember 2018, the CFTC proposed amendments to the rules that would significantly expand swap mandatory tradingrequirements. This proposal has not yet been finalized. The Securities and Exchange Commission (“SEC”) has also finalizedrules regarding registration, reporting, business conduct standards and trade acknowledgement and verification requirementsfor security-based swap dealers and major security-based swap participants, although these rules will not come into effectuntil the SEC completes further security-based swap rulemakings. Finally, U.S. prudential regulators (the Federal Reserve,the FDIC, the Office of the Comptroller of the Currency, the Farm Credit Administration and the Federal Housing FinanceAgency) have adopted final rules establishing margin requirements for non-cleared swaps and security-based swaps, and theCFTC has adopted final rules establishing margin requirements for non-cleared swaps. The final margin rules follow a phasedimplementation schedule, with certain initial margin and variation margin requirements in effect as of September 2016 andadditional variation margin requirements in effect as of March 1, 2017 for all covered counterparties. Deutsche Bankimplemented the exchange of both initial and variation margin for uncleared derivatives in the U.S. from September 2016, forthe first category of counterparties subject to the U.S. prudential regulators’ margin requirements. Additional initial marginrequirements for smaller counterparties are phased in on an annual basis from September 2017 through September 2020,with the relevant compliance dates depending in each case on the transactional volume of the parties and their affiliates. TheSEC proposal to establish margin requirements for non-cleared security-based swaps has not yet been finalized.

121
Deutsche Bank Risk and capital performanceAnnual Report 2018 Credit Risk Exposure
The following table shows a breakdown of notional amounts and gross market value of derivative transactions along with abreakdown of notional amounts of OTC derivative assets and liabilities on the basis of clearing channel.
Notional amounts of derivatives on basis of clearing channel and type of derivativeDec 31, 2018
Notional amount maturity distribution
in € m. Within 1 year> 1 and≤ 5 years After 5 years Total
Positivemarket
value
Negativemarket
value
Netmarket
valueInterest rate related:
OTC 12,741,035 9,791,856 5,605,269 28,138,160 202,480 181,453 21,028Bilateral (Amt) 2,511,405 2,706,991 1,871,607 7,090,004 176,248 156,339 19,909CCP (Amt) 10,229,630 7,084,865 3,733,661 21,048,156 26,233 25,114 1,119
Exchange-traded 5,643,533 1,813,582 367 7,457,483 560 357 203Total Interest rate related 18,384,569 11,605,439 5,605,636 35,595,643 203,040 181,809 21,231Currency related:
OTC 4,277,488 1,063,548 440,037 5,781,073 85,221 81,555 3,666Bilateral (Amt) 4,217,941 1,063,386 440,037 5,721,364 84,592 80,765 3,827CCP (Amt) 59,547 162 0 59,709 629 790 (161)
Exchange-traded 23,137 0 0 23,137 5 7 (2)Total Currency related 4,300,625 1,063,548 440,037 5,804,211 85,226 81,562 3,664Equity/index related:
OTC 265,587 145,152 16,391 427,130 15,645 19,925 (4,280)Bilateral (Amt) 265,587 145,152 16,391 427,130 15,645 19,925 (4,280)CCP (Amt) 0 0 0 0 0 0 0
Exchange-traded 605,254 110,450 10,974 726,678 10,407 9,969 438Total Equity/index related 870,841 255,602 27,365 1,153,808 26,052 29,894 (3,843)Credit derivatives related
OTC 115,256 615,668 123,651 854,575 8,197 8,382 (184)Bilateral (Amt) 71,996 175,015 49,365 296,375 3,138 3,142 (3)CCP (Amt) 43,260 440,653 74,287 558,200 5,059 5,240 (181)
Exchange-traded 0 0 0 0 0 0 0Total Credit derivatives related 115,256 615,668 123,651 854,575 8,197 8,382 (184)Commodity related:
OTC 5,028 1,015 1,432 7,476 99 1,090 (991)Bilateral (Amt) 5,028 1,015 1,432 7,476 99 1,090 (991)CCP (Amt) 0 0 0 0 0 0 0
Exchange-traded 22,727 1,333 0 24,060 246 289 (43)Total Commodity related 27,755 2,348 1,432 31,535 345 1,379 (1,034)Other:
OTC 11,854 2,555 86 14,494 213 337 (124)Bilateral (Amt) 11,853 2,555 86 14,493 213 336 (124)CCP (Amt) 1 0 0 1 0 0 0
Exchange-traded 5,244 3 0 5,247 13 46 (33)Total Other 17,098 2,558 86 19,741 226 383 (157)Total OTC business 17,416,248 11,619,795 6,186,866 35,222,909 311,855 292,741 19,115
Total bilateral business 7,083,810 4,094,114 2,378,919 13,556,843 279,935 261,597 18,338Total CCP business 10,332,438 7,525,680 3,807,948 21,666,066 31,921 31,144 777
Total exchange-traded business 6,299,896 1,925,368 11,341 8,236,605 11,231 10,668 563Total 23,716,144 13,545,163 6,198,208 43,459,514 323,086 303,409 19,678Positive market values after nettingand cash collateral received 0 0 0 0 29,393 0 0

122
Deutsche Bank 1 – Management ReportAnnual Report 2018
Dec 31, 2017Notional amount maturity distribution
in € m. Within 1 year> 1 and≤ 5 years After 5 years Total
Positivemarket
value
Negativemarket
value
Netmarket
valueInterest rate related:
OTC 18,389,853 9,644,152 5,862,868 33,896,874 224,783 202,492 22,291Bilateral (Amt) 2,231,176 2,624,101 1,989,543 6,844,820 200,520 177,989 22,532CCP (Amt) 16,158,677 7,020,051 3,873,326 27,052,054 24,262 24,503 (241)
Exchange-traded 4,100,955 1,379,528 155 5,480,638 250 275 (25)Total Interest rate related 22,490,809 11,023,680 5,863,023 39,377,512 225,033 202,767 22,266Currency related:
OTC 4,265,081 1,036,897 470,541 5,772,518 82,392 75,535 6,858Bilateral (Amt) 4,209,509 1,036,536 470,541 5,716,586 81,597 74,823 6,774CCP (Amt) 55,572 361 0 55,932 795 712 83
Exchange-traded 48,252 0 0 48,252 19 18 1Total Currency related 4,313,333 1,036,897 470,541 5,820,771 82,411 75,553 6,859Equity/index related:
OTC 301,662 156,272 19,248 477,182 18,201 23,010 (4,810)Bilateral (Amt) 301,662 156,272 19,248 477,182 18,201 23,010 (4,810)CCP (Amt) 0 0 0 0 0 0 0
Exchange-traded 732,870 107,631 5,398 845,900 9,986 12,708 (2,722)Total Equity/index related 1,034,533 263,903 24,647 1,323,082 28,187 35,718 (7,531)Credit derivatives related
OTC 209,376 1,321,066 153,867 1,684,309 28,317 27,888 429Bilateral (Amt) 91,919 204,583 49,442 345,944 5,363 4,779 584CCP (Amt) 117,457 1,116,482 104,426 1,338,365 22,954 23,108 (154)
Exchange-traded 0 0 0 0 0 0 0Total Credit derivatives related 209,376 1,321,066 153,867 1,684,309 28,317 27,888 429Commodity related:
OTC 3,431 995 2,015 6,441 35 1,485 (1,449)Bilateral (Amt) 3,431 995 2,015 6,441 35 1,485 (1,449)CCP (Amt) 0 0 0 0 0 0 0
Exchange-traded 39,955 4,163 0 44,119 187 214 (27)Total Commodity related 43,386 5,158 2,015 50,560 222 1,699 (1,476)Other:
OTC 3,744 765 0 4,509 9 371 (362)Bilateral (Amt) 3,744 765 0 4,509 9 371 (362)CCP (Amt) 0 0 0 0 0 0 0
Exchange-traded 5,196 1 0 5,197 5 26 (20)Total Other 8,940 766 0 9,706 14 397 (382)Total OTC business 23,173,146 12,160,146 6,508,540 41,841,833 353,737 330,780 22,957
Total bilateral business 6,841,441 4,023,253 2,530,789 13,395,482 305,726 282,457 23,269Total CCP business 16,331,705 8,136,894 3,977,751 28,446,351 48,012 48,324 (312)
Total exchange-traded business 4,927,230 1,491,323 5,553 6,424,106 10,447 13,240 (2,793)Total 28,100,376 13,651,470 6,514,093 48,265,939 364,185 344,020 20,164Positive market values after nettingand cash collateral received 0 0 0 0 32,083 0 0
Equity Exposure
The table below presents the carrying values of our equity investments according to IFRS definition split by trading andnontrading for the respective reporting dates. We manage our respective positions within our market risk and other appropriaterisk frameworks.
Composition of our Equity Exposurein € m. Dec 31, 2018 Dec 31, 2017Trading Equities 56,673 85,932Nontrading Equities¹ 2,835 2,496Total Equity Exposure 59,507 88,4271 Includes equity investment funds amounting to € 605 million as of December 31, 2018 and € 367 million as of December 31, 2017.
As of December 31, 2018, our Trading Equities exposure was mainly composed of € 54.3 billion from Corporate & InvestmentBank activities and € 2.3 billion from Asset Management. Overall trading equities decreased by € 29.3 billion year on yeardriven mainly by decreased exposure in Corporate & Investment Bank activities.

123
Deutsche Bank Risk and capital performanceAnnual Report 2018 Asset Quality
Asset QualityFor 2018, we provide information following the IFRS 9 accounting standard, while 2017 numbers are based on the IAS 39accounting rules. Since the accounting requirements have changed significantly, numbers are not comparable. Therefore2017 figures are shown in a separate section subsequent to the disclosures under IFRS 9. The main reasons are the broaderscope of assets subject to impairment, differences in asset classification as well as in impairment calculation and definition:
The Asset Quality section under IFRS 9 describes the quality of debt instruments subject to impairment, which under IFRS 9consist of debt instruments measured at amortized cost, financial instruments at fair value through other comprehensiveincome (FVOCI) as well as off-balance sheet lending commitments such as loan commitments and financial guarantees(hereafter collectively referred to as “Financial Assets”). Under IAS 39 the Asset Quality section mainly described the qualityof the group Loans measured at amortized costs classified as Loans in our balance sheet.
The determination of impairment losses and allowance moves from an incurred credit loss model under IAS 39, whereby creditlosses are recognized when a defined loss event occurs, to an expected credit loss model under IFRS 9, where allowancesfor loan losses are recorded upon initial recognition of the Financial Asset, based on expectations of potential credit losses atthe time of initial recognition.
The Group has aligned its definition of “credit-impaired” under IFRS 9 to the default definition as per Art. 178 of the CapitalRequirements Regulation (CRR) for regulatory purposes. As a consequence, Stage 3 financial assets consist of two types ofdefaulted financial assets: firstly financial assets, where the Group expects an impairment loss reflected in an allowance forcredit losses, and secondly, financial assets, where the Group does not expect an impairment loss (e.g., due to high qualitycollateral or sufficient expected future cash flows following thorough due diligence). This is a major difference to our impairmentdefinition under IAS 39, where financial assets were only considered to be impaired if the Group expected to suffer animpairment loss.
For further information please refer to chapter “IFRS 9 Transition Impact Analysis” in Note 2 “Recently Adopted and NewAccounting Pronouncements” to the consolidated financial statements.
Overview of financial assets subject to impairment
The following tables provide an overview of the exposure amount and allowance for credit losses by financial asset classbroken down into stages as per IFRS 9 requirements.
Overview of financial assets subject to impairmentDec 31, 2018
Gross Carrying Amount Allowance for Credit Losses2
in € m. Stage 1 Stage 2 Stage 3Stage 3
POCI Total Stage 1 Stage 2 Stage 3Stage 3
POCI TotalAmortized Cost1 637,037 32,335 7,452 1,963 678,787 509 501 3,247 3 4,2591 Financial Assets at Amortized Cost consist of: Loans at Amortized Cost, Cash and central bank balances, Interbank balances (w/o central banks), Central bank funds sold and
securities purchased under resale agreements, Securities borrowed and certain subcategories of Other assets.2 Allowance for credit losses do not include allowance for country risk amounting to € 6 million as of Dec 31, 2018.
Dec 31, 2018Fair Value Allowance for Credit Losses
in € m. Stage 1 Stage 2 Stage 3Stage 3
POCI Total Stage 1 Stage 2 Stage 3Stage 3
POCI TotalFair Value through OCI 50,932 247 2 1 51,182 11 1 0 (0) 13
Dec 31, 2018Notional Amount Allowance for Credit Losses1
in € m. Stage 1 Stage 2 Stage 3Stage 3
POCI Total Stage 1 Stage 2 Stage 3Stage 3
POCI TotalOff-balance sheet 252,039 10,021 599 0 262,659 132 73 84 0 2891 Allowance for credit losses do not include allowance for country risk amounting to € 5 million as of Dec 31, 2018.

124
Deutsche Bank 1 – Management ReportAnnual Report 2018
Financial assets at amortized cost
The following tables provide an overview of the gross carrying amount and credit loss allowance by financial asset classbroken down into stages as per IFRS 9 requirements.
Development of exposures and allowance for credit losses in the reporting periodDec 31, 2018
Gross carrying amountin € m. Stage 1 Stage 2 Stage 3 Stage 3 POCI TotalBalance, beginning of year 663,707 30,305 7,726 2,019 703,756Movements in financial assets including new business 29,175 5,743 1,058 (61) 35,914Transfers due to changes in creditworthiness 1,240 (2,344) 1,104 N/M 0Changes due to modifications that did not result inderecognition (11) (8) (208) 0 (227)Changes in models N/M N/M N/M N/M N/MFinancial assets that have been derecognized during theperiod (65,682) (1,766) (2,411) (4) (69,863)Recovery of written off amounts 0 0 146 0 146Foreign exchange and other changes 8,608 405 37 10 9,060Balance, end of reporting period 637,037 32,335 7,452 1,963 678,787
Financial assets at amortized cost subject to impairment dropped by € 25 billion or 4 % in 2018 mainly driven by Stage 1:
Stage 1 exposures decreased by € 27 billion or 4 % driven by Cash and central bank balances due to reductions in depositsand short-term borrowings.
Stage 2 exposures increased by € 2 billion or 7 % driven by Loans at amortized cost in CIB.
Stage 3 exposures decreased by € 274 million or 4 % in 2018 driven by CIB, mainly reflecting de-risking activities in ourshipping portfolio. This reduction was partly offset by an increase in PCB driven by the Postbank business, partly as a resultof non-recurring effects.
Dec 31, 2018Allowance for Credit Losses3
in € m. Stage 1 Stage 2 Stage 3 Stage 3 POCI TotalBalance, beginning of year 462 494 3,638 3 4,596Movements in financial assets including new business (132) 215 440 (17) 507Transfers due to changes in creditworthiness 199 (137) (62) N/M 0Changes due to modifications that did not result inderecognition N/M N/M N/M N/M N/MChanges in models 0 0 0 0 0Financial assets that have been derecognized during theperiod² (6) (17) (972) 0 (995)Recovery of written off amounts 0 0 172 0 172Foreign exchange and other changes (14) (54) 30 17 (21)Balance, end of reporting period 509 501 3,247 3 4,259Provision for Credit Losses excluding country risk1 66 78 379 (17) 5071 Movements in financial assets including new business, transfers due to changes in creditworthiness and changes in models add up to Provision for Credit Losses excluding
country risk.2 This position includes charge offs of allowance for credit losses.3 Allowance for credit losses does not include allowance for country risk amounting to € 6 million as of Dec. 31, 2018.
Allowance for credit losses against financial assets at amortized cost subject to impairment dropped by € 338 million or 7 %in 2018 mainly driven by Stage 3:
Stage 1 allowances increased by € 47 million or 10% driven by additional provisions in CIB to reflect for a weakening macro-economic outlook as well as a one-off adjustment to the calculation methodology on certain loans on which we hold insuranceprotection.
Stage 2 allowances remained almost stable.
Stage 3 allowances decreased by € 391 million or 11 % driven by CIB, where charge offs partly related to de-risking activitiesin our shipping portfolio overcompensated additional provisions.
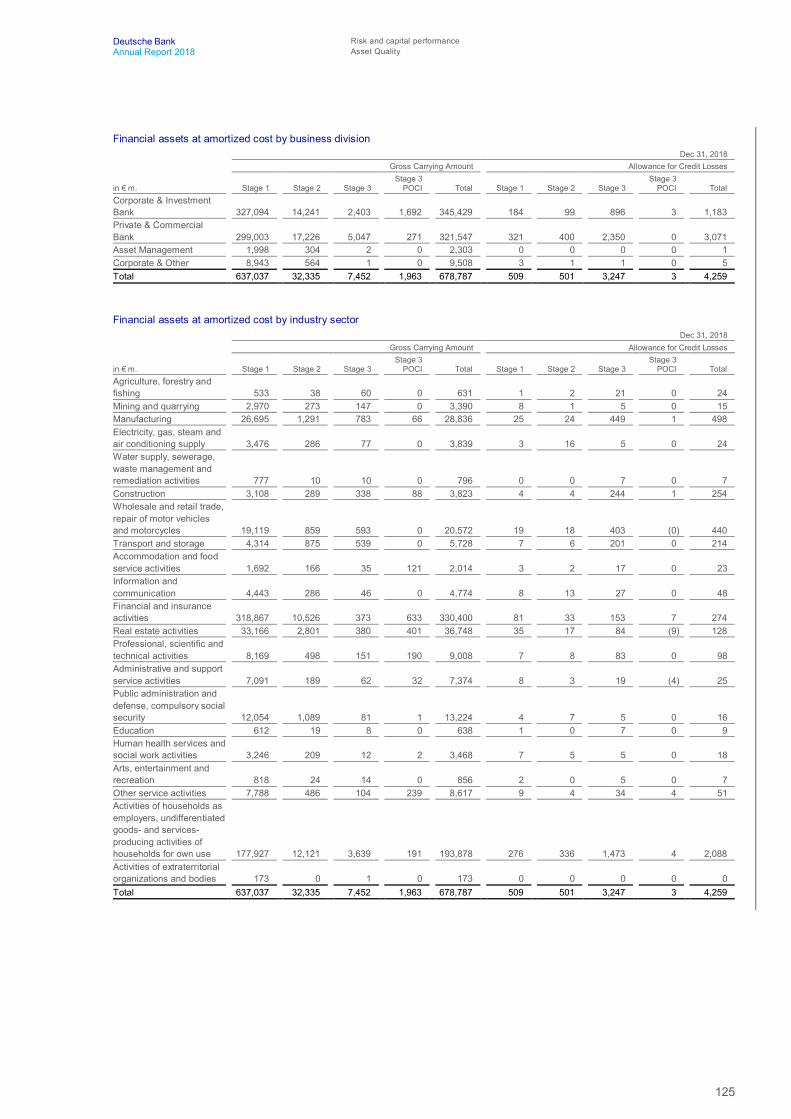
125
Deutsche Bank Risk and capital performanceAnnual Report 2018 Asset Quality
Financial assets at amortized cost by business divisionDec 31, 2018
Gross Carrying Amount Allowance for Credit Losses
in € m. Stage 1 Stage 2 Stage 3Stage 3
POCI Total Stage 1 Stage 2 Stage 3Stage 3
POCI TotalCorporate & InvestmentBank 327,094 14,241 2,403 1,692 345,429 184 99 896 3 1,183Private & CommercialBank 299,003 17,226 5,047 271 321,547 321 400 2,350 0 3,071Asset Management 1,998 304 2 0 2,303 0 0 0 0 1Corporate & Other 8,943 564 1 0 9,508 3 1 1 0 5Total 637,037 32,335 7,452 1,963 678,787 509 501 3,247 3 4,259
Financial assets at amortized cost by industry sectorDec 31, 2018
Gross Carrying Amount Allowance for Credit Losses
in € m. Stage 1 Stage 2 Stage 3Stage 3
POCI Total Stage 1 Stage 2 Stage 3Stage 3
POCI TotalAgriculture, forestry andfishing 533 38 60 0 631 1 2 21 0 24Mining and quarrying 2,970 273 147 0 3,390 8 1 5 0 15Manufacturing 26,695 1,291 783 66 28,836 25 24 449 1 498Electricity, gas, steam andair conditioning supply 3,476 286 77 0 3,839 3 16 5 0 24Water supply, sewerage,waste management andremediation activities 777 10 10 0 796 0 0 7 0 7Construction 3,108 289 338 88 3,823 4 4 244 1 254Wholesale and retail trade,repair of motor vehiclesand motorcycles 19,119 859 593 0 20,572 19 18 403 (0) 440Transport and storage 4,314 875 539 0 5,728 7 6 201 0 214Accommodation and foodservice activities 1,692 166 35 121 2,014 3 2 17 0 23Information andcommunication 4,443 286 46 0 4,774 8 13 27 0 48Financial and insuranceactivities 318,867 10,526 373 633 330,400 81 33 153 7 274Real estate activities 33,166 2,801 380 401 36,748 35 17 84 (9) 128Professional, scientific andtechnical activities 8,169 498 151 190 9,008 7 8 83 0 98Administrative and supportservice activities 7,091 189 62 32 7,374 8 3 19 (4) 25Public administration anddefense, compulsory socialsecurity 12,054 1,089 81 1 13,224 4 7 5 0 16Education 612 19 8 0 638 1 0 7 0 9Human health services andsocial work activities 3,246 209 12 2 3,468 7 5 5 0 18Arts, entertainment andrecreation 818 24 14 0 856 2 0 5 0 7Other service activities 7,788 486 104 239 8,617 9 4 34 4 51Activities of households asemployers, undifferentiatedgoods- and services-producing activities ofhouseholds for own use 177,927 12,121 3,639 191 193,878 276 336 1,473 4 2,088Activities of extraterritorialorganizations and bodies 173 0 1 0 173 0 0 0 0 0Total 637,037 32,335 7,452 1,963 678,787 509 501 3,247 3 4,259
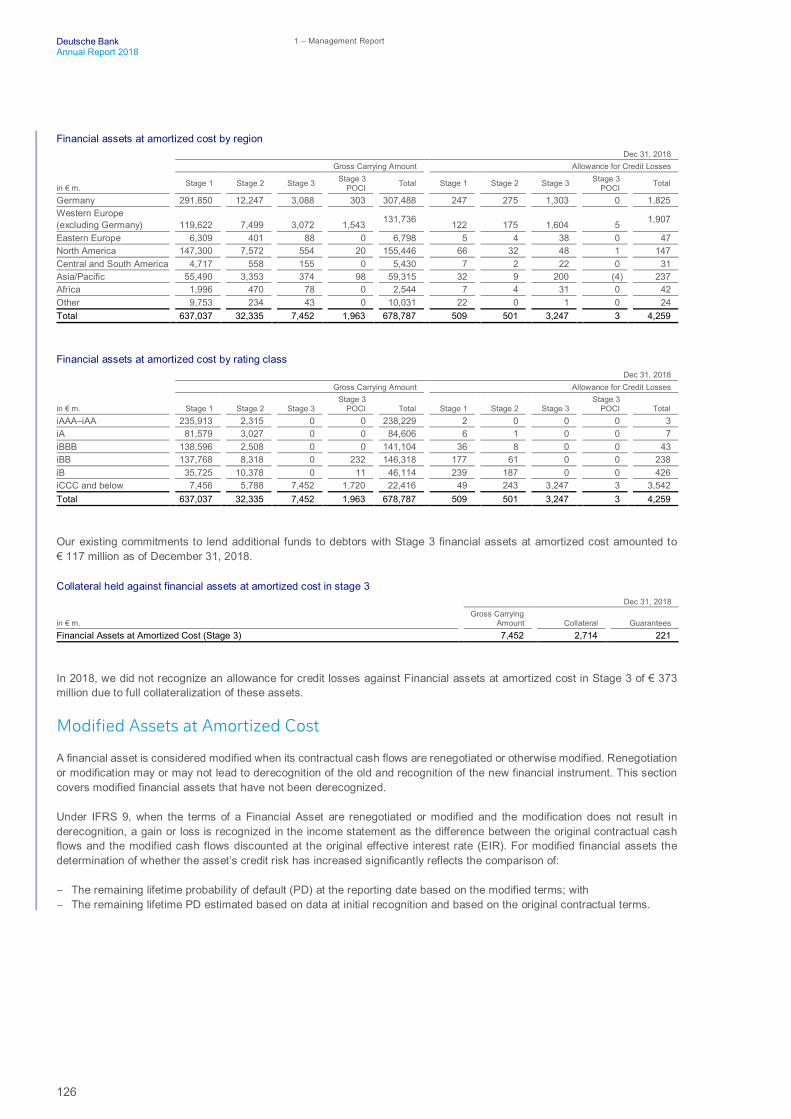
126
Deutsche Bank 1 – Management ReportAnnual Report 2018
Financial assets at amortized cost by regionDec 31, 2018
Gross Carrying Amount Allowance for Credit Losses
in € m. Stage 1 Stage 2 Stage 3 Stage 3POCI Total Stage 1 Stage 2 Stage 3 Stage 3
POCI Total
Germany 291,850 12,247 3,088 303 307,488 247 275 1,303 0 1,825Western Europe(excluding Germany) 119,622 7,499 3,072 1,543 131,736 122 175 1,604 5 1,907
Eastern Europe 6,309 401 88 0 6,798 5 4 38 0 47North America 147,300 7,572 554 20 155,446 66 32 48 1 147Central and South America 4,717 558 155 0 5,430 7 2 22 0 31Asia/Pacific 55,490 3,353 374 98 59,315 32 9 200 (4) 237Africa 1,996 470 78 0 2,544 7 4 31 0 42Other 9,753 234 43 0 10,031 22 0 1 0 24Total 637,037 32,335 7,452 1,963 678,787 509 501 3,247 3 4,259
Financial assets at amortized cost by rating classDec 31, 2018
Gross Carrying Amount Allowance for Credit Losses
in € m. Stage 1 Stage 2 Stage 3Stage 3
POCI Total Stage 1 Stage 2 Stage 3Stage 3
POCI TotaliAAA–iAA 235,913 2,315 0 0 238,229 2 0 0 0 3iA 81,579 3,027 0 0 84,606 6 1 0 0 7iBBB 138,596 2,508 0 0 141,104 36 8 0 0 43iBB 137,768 8,318 0 232 146,318 177 61 0 0 238iB 35,725 10,378 0 11 46,114 239 187 0 0 426iCCC and below 7,456 5,788 7,452 1,720 22,416 49 243 3,247 3 3,542Total 637,037 32,335 7,452 1,963 678,787 509 501 3,247 3 4,259
Our existing commitments to lend additional funds to debtors with Stage 3 financial assets at amortized cost amounted to€ 117 million as of December 31, 2018.
Collateral held against financial assets at amortized cost in stage 3Dec 31, 2018
in € m.Gross Carrying
Amount Collateral GuaranteesFinancial Assets at Amortized Cost (Stage 3) 7,452 2,714 221
In 2018, we did not recognize an allowance for credit losses against Financial assets at amortized cost in Stage 3 of € 373million due to full collateralization of these assets.
Modified Assets at Amortized Cost
A financial asset is considered modified when its contractual cash flows are renegotiated or otherwise modified. Renegotiationor modification may or may not lead to derecognition of the old and recognition of the new financial instrument. This sectioncovers modified financial assets that have not been derecognized.
Under IFRS 9, when the terms of a Financial Asset are renegotiated or modified and the modification does not result inderecognition, a gain or loss is recognized in the income statement as the difference between the original contractual cashflows and the modified cash flows discounted at the original effective interest rate (EIR). For modified financial assets thedetermination of whether the asset’s credit risk has increased significantly reflects the comparison of:
– The remaining lifetime probability of default (PD) at the reporting date based on the modified terms; with– The remaining lifetime PD estimated based on data at initial recognition and based on the original contractual terms.

127
Deutsche Bank Risk and capital performanceAnnual Report 2018 Asset Quality
Modified Assets Amortized CostDec 31, 2018
in € m. Stage 1 Stage 2 Stage 3Stage 3
POCI TotalAmortized cost carrying amount prior to modification 11 8 222 0 241Net modification gain/losses recognized (11) (8) (208) 0 (227)
In the first year after the implementation of the IFRS 9 requirements, we have observed immaterial amounts of modified assetsthat have been upgraded to stage 1. We have not observed any subsequent re-deterioration of those assets into stages 2 and3.
Financial Assets at Fair value through Other Comprehensive Income
The fair value of financial assets at Fair value through Other Comprehensive Income (FVOCI) subject to impairment was € 51billion at December 31, 2018, compared to € 48 billion at the beginning of year 2018. Allowance for credit losses against theseassets were almost unchanged at very low levels (€ 12 million at the beginning of year 2018 and € 13 million as of December31, 2018, respectively). Due to immateriality no further breakdown will be provided for financial assets at FVOCI.
Off-balance sheet lending commitments and guarantee business
The following tables provide an overview of the nominal amount and credit loss allowance for our off-balance sheet financialasset class broken down into stages as per IFRS 9 requirements.
Development of nominal amount and allowance for credit lossesDec 31, 2018
Nominal Amountin € m. Stage 1 Stage 2 Stage 3 Stage 3 POCI TotalBalance, beginning of year1 243,566 7,114 1,448 0 252,129Movements including new business 6,765 3,923 (1,191) 0 9,496Transfers due to changes in creditworthiness 752 (1,089) 338 N/M 0Changes in models N/M N/M N/M N/M N/MForeign exchange and other changes 957 73 4 0 1,035Balance, end of reporting period 252,039 10,021 599 0 262,6591 Revocable commitments were included in impairment relevant exposures in Q4 2018. As a consequence, Balance, beginning of year was restated compared to our interim
reports 2018.
Dec 31, 2018Allowance for Credit Losses2
in € m. Stage 1 Stage 2 Stage 3 Stage 3 POCI TotalBalance, beginning of year 117 36 119 0 272Movements including new business (0) 31 (13) 0 18Transfers due to changes in creditworthiness 2 (0) (2) N/M 0Changes in models N/M N/M N/M N/M N/MForeign exchange and other changes 14 6 (20) 0 (0)Balance, end of reporting period 132 73 84 0 289Provision for Credit Losses excluding country risk1 1 31 (15) 0 181 The above table breaks down the impact on provision for credit losses from movements in financial assets including new business, transfers due to changes in
creditworthiness and changes in models.2 Allowance for credit losses does not include allowance for country risk amounting to € 5 million as of December 31, 2018.
Legal Claims
Assets subject to enforcement activity consist of assets, which have been fully or partially written off and the Group stillcontinues to pursue recovery of the asset. Such enforcement activity comprises for example cases where the bank continuesto devote resources (e.g. our Legal Department/CRM workout unit) towards recovery, either via legal channels or third partyrecovery agents. Enforcement activity also applies to cases where the Bank maintains outstanding and unsettled legal claims.This is irrespective of whether amounts are expected to be recovered and the recovery timeframe. It may be common practicein certain jurisdictions for recovery cases to span several years.
Amounts outstanding on financial assets that were written off during the reporting period and are still subject to enforcementactivity amounted to € 224 million for the year 2018, mainly related to CIB.

128
Deutsche Bank 1 – Management ReportAnnual Report 2018
Renegotiated and forborne assets at amortized costs
For economic or legal reasons we might enter into a forbearance agreement with a borrower who faces or will face financialdifficulties in order to ease the contractual obligation for a limited period of time. A case-by-case approach is applied for ourcorporate clients considering each transaction and client -specific facts and circumstances. For consumer loans we offerforbearances for a limited period of time, in which the total or partial outstanding or future instalments are deferred to a laterpoint of time. However, the amount not paid including accrued interest during this period must be re-compensated at a laterpoint of time. Repayment options include distribution over residual tenor, a one-off payment or a tenor extension. Forbearancesare restricted and depending on the economic situation of the client, our risk management strategies and the local legislation.In case a forbearance agreement is entered into, an impairment measurement is conducted as described below, an impairmentcharge is taken if necessary and the loan is subsequently recorded as impaired.
In our management and reporting of forborne assets at amortized costs, we are following the EBA definition for forbearancesand non-performing loans (Implementing Technical Standards (ITS) on Supervisory reporting on forbearance and non-performing exposures under article 99(4) of Regulation (EU) No 575/2013). Once the conditions mentioned in the ITS are met,we report the loan as being forborne; we remove the asset from our forbearance reporting, once the discontinuance criteria inthe ITS are met (i.e., the contract is considered as performing, a minimum two year probation period has passed, regularpayments of more than an insignificant aggregate amount of principal or interest have been made during at least half of theprobation period, and none of the exposures to the debtor is more than 30 days past-due at the end of the probation period).
Forborne financial assets at amortized costDec 31, 2018
Performing Non-performing
Totalforborneloans at
amortizedcost
in € m. Stage 2 Stage 2 Stage 3German 1,046 49 1,200 2,295Non-German 741 55 1,750 2,546Total 1,787 104 2,950 4,841
Development of forborne financial assets at amortized costin € m. Dec 31, 2018Balance beginning of period 5,089Classified as forborne during the year 1,679Transferred to non-forborne during the year (including repayments) (1,574)Charge-offs (386)Exchange rate and other movements 33Balance end of period 4,841
The reduction in forborne assets at amortized cost of € 248 million or 5 % was mainly driven by non-performing exposures inCIB mainly reflecting the ongoing de-risking of our shipping portfolio as well as in PCB, among others caused by disposals.
Collateral Obtained
We obtain collateral on the balance sheet only in certain cases by either taking possession of collateral held as security or bycalling upon other credit enhancements. Collateral obtained is made available for sale in an orderly fashion or through publicauctions, with the proceeds used to repay or reduce outstanding indebtedness. Generally we do not occupy obtainedproperties for our business use. The commercial and residential real estate collateral obtained in 2018 refers predominantlyto our exposures in Spain.
Collateral Obtained during the reporting periodin € m. 2018Commercial real estate 7Residential real estate1 57Other 0Total collateral obtained during the reporting period 641 Carrying amount of foreclosed residential real estate properties amounted to € 62 million as of December 31, 2018 and € 67 million as of December 31, 2017.
The collateral obtained, as shown in the table above, excludes collateral recorded as a result of consolidating securitizationtrusts under IFRS 10. In 2018 as well as in 2017 the Group did not obtain any collateral related to these trusts.

129
Deutsche Bank Risk and capital performanceAnnual Report 2018 Asset Quality (Previous year’s figures reported under IAS 39)
Asset Quality (Previous year’s figures reported under IAS 39)This section below describes the asset quality of our loans for the comparative period 2017. All loans where known informationabout possible credit problems of borrowers causes our management to have serious doubts as to the collectability of theborrower’s contractual obligations, are included in this section.
Overview of performing, renegotiated, past due and impaired loans by customer groupsDec 31, 2017
in € m.Corporate
loansConsumer
loans TotalLoans neither past due, nor renegotiated or impaired 208,457 185,979 394,436Past due loans, neither renegotiated nor impaired 1,167 2,778 3,945Loans renegotiated, but not impaired 518 488 1,006Impaired loans 3,406 2,828 6,234Total 213,547 192,074 405,621
Past Due Loans
Loans are considered to be past due if contractually agreed payments of principal and/or interest remain unpaid by theborrower, except if those loans are acquired through consolidation. The latter are considered to be past due if payments ofprincipal and/or interest, which were expected at a certain payment date at the time of the initial consolidation of the loans,are unpaid by the borrower.
Non-impaired past due loans at amortized cost by past due statusin € m. Dec 31, 2017Loans less than 30 days past due 2,747Loans 30 or more but less than 60 days past due 482Loans 60 or more but less than 90 days past due 250Loans 90 days or more past due 776Total 4,255
Non-impaired past due loans at amortized cost by industryin € m. Dec 31, 2017Financial intermediation 267Fund management activities 40Manufacturing 179Wholesale and retail trade 233Households 2,481Commercial real estate activities 363Public sector 10Other 682Total 4,255
Non-impaired past due loans at amortized cost by regionin € m. Dec 31, 2017Germany 1,810Western Europe (excluding Germany) 1,758Eastern Europe 158North America 343Central and South America 6Asia/Pacific 161Africa 19Other 0Total 4,255
Our non-impaired past due loans increased to € 4.3 billion as of December 31, 2017, largely caused by loans, that wereoverdue by a few days. Businesswise, the main driver was PCB.

130
Deutsche Bank 1 – Management ReportAnnual Report 2018
Aggregated value of collateral – with the fair values of collateral capped at loan outstanding – held against our non-impaired pastdue loansin € m. Dec 31, 2017Financial and other collateral 2,364Guarantees received 148Total 2,512
Renegotiated and forborne loans
The tables below give an overview of the Group’s forborne loans.
Forborne loansDec 31, 2017¹
PerformingNon-
performing
Totalforborne
loansin € m. Nonimpaired Nonimpaired ImpairedGerman 1,183 601 804 2,587Non-German 612 553 1,337 2,502Total 1,794 1,154 2,141 5,0891 Forborne Loans have been restated following a refinement of internal processes.
Development of forborne loansin € m. Dec 31, 2017¹Balance beginning of period 5,468Classified as forborne during the year 1,492Transferred to non-forborne during the year (including repayments) (1,519)Charge-offs (234)Exchange rate and other movements (119)Balance end of period 5,0891 Balance, end of period as well as Classified as forborne during the year have been restated following a refinement of internal processes.
The total forborne loans in 2017 decreased by € 379 million mainly driven by non-performing forborne loans to non-Germanclients mainly reflecting non-performing loan sales in our shipping portfolio reported in CIB as well as in PCC International.
Impaired loans
Credit Risk Management regularly assesses at each balance sheet date whether there is objective evidence that a loan orgroup of loans is impaired. A loan or group of loans is impaired and impairment losses are incurred if:
– there is objective evidence of impairment as a result of a loss event that occurred after the initial recognition of the assetand up to the balance sheet date (a “loss event”). When making our assessment we consider information on such eventsthat is reasonably available up to the date the financial statements are authorized for issuance in line with the requirementsof IAS 10;
– the loss event had an impact on the estimated future cash flows of the financial asset or the group of financial assets, and– a reliable estimate of the loss amount can be made at each reporting date.
Credit Risk Management’s loss assessments are subject to regular review in collaboration with Group Finance. The results ofthis review are reported to and approved by Group Finance and Risk Senior Management.
For further details with regard to impaired loans please refer to Note 1 “Significant Accounting Policies and Critical AccountingEstimates” to the consolidated financial statements.

131
Deutsche Bank Risk and capital performanceAnnual Report 2018 Asset Quality (Previous year’s figures reported under IAS 39)
Impairment loss and allowance for loan losses
If there is evidence of impairment the impairment loss is generally calculated on the basis of discounted expected cash flowsusing the original effective interest rate of the loan. If the terms of a loan are renegotiated or otherwise modified because offinancial difficulties of the borrower without qualifying for de-recognition of the loan, the impairment loss is measured using theoriginal effective interest rate before modification of terms. We reduce the carrying amount of the impaired loan by the use ofan allowance account and recognize the amount of the loss in the consolidated statement of income as a component of theprovision for credit losses. We record increases to our allowance for loan losses as an increase of the provision for loan lossesin our income statement. Charge-offs reduce our allowance while recoveries, if any, are credited to the allowance account. Ifwe determine that we no longer require allowances which we have previously established, we decrease our allowance andrecord the amount as a reduction of the provision for loan losses in our income statement. When it is considered that there isno realistic prospect of recovery and all collateral has been realized or transferred to us, the loan and any associated allowancefor loan losses is charged off (i.e., the loan and the related allowance for loan losses are removed from the balance sheet).
While we assess the impairment for our corporate credit exposures individually, we assess the impairment of our smaller-balance standardized homogeneous loans collectively.
Our collectively assessed allowance for non-impaired loans reflects allowances to cover for incurred losses that have neitherbeen individually identified nor provided for as part of the impairment assessment of smaller-balance homogeneous loans.
For further details regarding our accounting policies regarding impairment loss and allowance for credit losses, please referto Note 1 “Significant Accounting Policies and Critical Accounting Estimates”.to the consolidated financial statements.
Impaired loans, allowance for loan losses and coverage ratios by business divisionDec 31, 2017
in € m.Impaired
loansLoan lossallowance
Impaired loancoverage
ratioCorporate & Investment Bank 2,517 1,565 62 %Private & Commercial Bank 3,717 2,355 63 %Asset Management 0 0 N/MCorporate & Other 1 1 N/MTotal 6,234 3,921 63 %N/M – not meaningful.
Impaired loans, allowance for loan losses and coverage ratios by industryDec 31, 2017
Impaired Loans Loan loss allowance
in € m.Individually
assessedCollectively
assessed Total
Individuallyassessedallowance
Collectivelyassessed
allowance forimpaired
loans
Collectivelyassessed
allowance fornon-impaired
loans Total
Impaired loancoverage
ratioFinancial intermediation 121 8 129 1 3 40 44 34 %Fund management activities 8 8 16 1 0 3 4 24 %Manufacturing 520 165 685 439 146 51 635 93 %Wholesale and retail trade 333 188 521 211 156 27 394 76 %Households 155 2,233 2,388 153 1,290 83 1,526 64 %Commercial real estateactivities 345 30 376 115 11 42 168 45 %Public sector 74 0 74 6 0 12 17 24 %Other¹ 1,792 254 2,046 840 139 153 1,132 55 %Total 3,348 2,886 6,234 1,766 1,745 410 3,921 63 %1 Thereof: ‘Transportation, storage and communication’ - Total Impaired Loans € 808 million/Total Loan loss allowance € 469 million, ‘Real estate; renting and business
activities’ - € 482 million/ € 234 million, ‘Construction’: € 378 million/ € 144 million, ‘Mining and quarrying’ - € 169 million/ € 116 million.

132
Deutsche Bank 1 – Management ReportAnnual Report 2018
Impaired loans, allowance for loan losses and coverage ratios by regionDec 31, 2017
Impaired Loans Loan loss allowance
in € m.Individually
assessedCollectively
assessed Total
Individuallyassessedallowance
Collectivelyassessed
allowance forimpaired
loans
Collectivelyassessed
allowance fornon-impaired
loans Total
Impaired loancoverage
ratioGermany 953 1,312 2,266 600 823 104 1,527 67 %Western Europe(excluding Germany) 1,471 1,422 2,892 815 822 113 1,749 60 %Eastern Europe 45 123 168 45 92 11 147 88 %North America 497 1 498 67 0 102 170 34 %Central and South America 70 0 70 14 0 21 35 50 %Asia/Pacific 264 28 292 223 8 41 272 93 %Africa 48 0 49 1 0 9 10 20 %Other 0 0 0 0 0 11 11 N/MTotal 3,348 2,886 6,234 1,766 1,745 410 3,921 63 %N/M – not meaningful.
Development of impaired loansDec 31, 2017
in € m.Individually
assessedCollectively
assessed TotalBalance, beginning of year 4,126 3,321 7,447Classified as impaired during the year 1,370 1,248 2,618Transferred to not impaired during the year1 (1,127) (961) (2,088)Charge-offs (540) (605) (1,146)Disposals of impaired loans (267) (116) (383)Exchange rate and other movements (215) (1) (216)Balance, end of year 3,348 2,886 6,2341 Includes repayments.
Our impaired loans decreased in 2017 by € 1.2 billion or 16 % to € 6.2 billion. The reduction in our individually assessedportfolio mainly reflects charge-offs in CIB along with de-risking of former NCOU assets, while the reduction in our collectivelyassessed portfolio was driven by charge-offs related to disposals in PCC International.
The impaired loan coverage ratio (defined as total on-balance sheet allowances) for all loans individually impaired orcollectively assessed divided by IFRS impaired loans (excluding collateral) increased from 61 % as of year-end 2016 to 63 %as of December 31, 2017.
Provision for loan losses and recoveries by Industry2017
Provision for loan losses before recoveries
in € m.
Forindividually
assessedloans
Forcollectively
assessedimpaired
loans
Forcollectively
assessednon-impaired
loans Total RecoveriesFinancial intermediation 25 (2) (3) 20 4Fund management activities 0 0 (2) (1) 0Manufacturing 48 18 (28) 38 19Wholesale and retail trade 46 19 1 66 5Households 11 322 20 354 66Commercial real estate activities (20) 4 5 (10) 12Public sector 2 0 9 11 0Other1 239 23 (62) 201 20Total 352 385 (59) 678 1271 In 2017, the largest contributions to risk provisioning in the "Other" category came from the "Transport, Storage and Communications" sector (€ 107 million) and the "Mining
and quarrying" sector (€ 72 million).
Our existing commitments to lend additional funds to debtors with impaired loans amounted to € 28 million as of December31, 2017.

133
Deutsche Bank Risk and capital performanceAnnual Report 2018 Asset Quality (Previous year’s figures reported under IAS 39)
Collateral held against impaired loans, with fair values capped at transactional outstandingin € m. Dec 31, 2017Financial and other collateral1 1,757Guarantees received 309Total collateral held for impaired loans 2,0661 Defaulted mortgage loans secured by residential real estate properties, where the loan agreement has been terminated/cancelled are generally subject to formal foreclosure
proceedings.
Our coverage ratio including collateral (defined as total on-balance sheet allowances for all loans individually impaired orcollectively assessed plus collateral held against impaired loans, with fair values capped at transactional outstanding, dividedby IFRS impaired loans) increased to 96 % as of December 31, 2017.
Financial assets available for sale
The impairment concept is also applicable for available for sale debt instruments, which are otherwise carried at fair valuewith changes in fair value reported in other comprehensive income. If an available for sale debt instrument is consideredimpaired, the cumulative impairment loss reflects the difference between the amortized cost and the current fair value of theinstrument. For a detailed discussion of our accounting procedures please refer to Note 1 “Significant Accounting policies andCritical Accounting Estimates” to the consolidated financial statements.
Non-impaired past due and impaired financial assets available for sale, accumulated impairments, coverage ratio and collateral heldagainst impaired financial assets available for salein € m. Dec 31, 2017Financial assets non-impaired past due available for sale 1,538
Of which:Less than 30 days past due 17630 or more but less than 60 days past due 2360 or more but less than 90 days past due 13890 days or more past due 1,201
Impaired financial assets available for sale 157Accumulated impairment for financial assets available for sale 113Impaired financial assets available for sale coverage ratio in % 71 %Collateral held against impaired financial assets available for sale 17
Of which:Financial and other collateral 17Guarantees received 0
Collateral obtained
The below table give an overview of the group’s collateral obtained in the reporting period. The commercial and residentialreal estate collateral obtained in 2017 refers predominantly to our exposures in Spain.
Collateral obtained during the reporting periodsin € m. 2017Commercial real estate 9Residential real estate1 63Other 0Total collateral obtained during the reporting period 721 Carrying amount of foreclosed residential real estate properties amounted to € 67 million as of December 31, 2017.
The collateral obtained, as shown in the table above, excludes collateral recorded as a result of consolidating securitizationtrusts under IFRS 10. In 2017, the Group did not obtain any collateral related to these trusts.

134
Deutsche Bank 1 – Management ReportAnnual Report 2018
Allowance for credit losses
Development of allowance for credit losses2017
Allowance for Loan Losses Allowance for Off-Balance Sheet Positions
in € m.Individually
assessedCollectively
assessed SubtotalIndividually
assessedCollectively
assessed Subtotal TotalBalance, beginning of year 2,071 2,475 4,546 162 183 346 4,892Provision for credit losses 299 253 552 (23) (4) (27) 525
Of which: (Gains)/Losses fromdisposal of impaired loans (83) (32) (115) 0 0 0 (115)
Net charge-offs: (487) (532) (1,019) 0 0 0 (1,019)Charge-offs (541) (605) (1,146) 0 0 0 (1,146)Recoveries 54 73 127 0 0 0 127
Other changes (117) (41) (158) (18) (16) (34) (191)Balance, end of year 1,766 2,155 3,9211 122 163 2852 4,207
Changes compared to prior yearProvision for credit losses
Absolute (444) (351) (795) (47) (16) (62) (857)Relative (60) % (58) % (59) % (196) % (132) % (175) % (62) %
Net charge-offsAbsolute 407 338 745 0 0 0 745Relative (45) % (39) % (42) % 0 % 0 % 0 % (42) %
Balance, end of yearAbsolute (305) (320) (625) (41) (20) (60) (685)Relative (15) % (13) % (14) % (25) % (11) % (17) % (14) %
1 of which: ‘Transfer risk reserve’ € 5 million.2 of which: ‘Transfer risk reserve’ € 8 million.
Allowance for credit losses as of December 31, 2017 amounted to € 4.2 billion compared to € 4.9 billion as of December 31,2016. The reduction was driven by charge-offs, partly compensated by additional provision for credit losses.
As of December 31, 2017, provision for credit losses decreased by € 857 million. compared to year-end 2016, driven by adecrease in provision for loan losses of € 795 million, as well as by a reduction in provisions for off-balance sheet positions of€ 62 million. The decrease in our individually assessed loan portfolio mainly resulted from CIB, driven by all portfolios includingshipping. Despite the year-over-year reduction, shipping continued to be the main driver of provision for credit losses in 2017,in part related to the re-evaluation of the respective impairment method during the year as discussed in Note 1, “Significantaccounting policies and critical accounting estimates” to the consolidated financial statements. A further year-over-yearreduction in PCB was driven by a significant release in former Postbank. The decrease in provisions for our collectivelyassessed loan portfolio mainly resulted from the non-recurrence of one-off items related to assets reported under NCOU inthe prior year and further reflected the good portfolio quality and ongoing benign economic environment in PCB.
The decrease in net charge-offs of € 745 million compared to 2016 was mainly driven by non-recurrence of net charge offsrelated to assets reported under NCOU in the prior year as well as in former Postbank.
Derivatives – Credit Valuation Adjustment
We establish counterparty Credit Valuation Adjustment (CVA) for OTC derivative transactions to cover expected credit losses.The adjustment amount is determined by assessing the potential credit exposure to a given counterparty and taking intoaccount any collateral held, the effect of any relevant netting arrangements, expected loss given default and the credit risk,based on available market information, including CDS spreads.

135
Deutsche Bank Risk and capital performanceAnnual Report 2018 Asset Quality (Previous year’s figures reported under IAS 39)
Treatment of default situations under derivatives
Unlike standard loan assets, we generally have more options to manage the credit risk in our derivatives transactions whenmovement in the current replacement costs or the behavior of our counterparty indicate that there is the risk that upcomingpayment obligations under the transactions might not be honored. In these situations, we are frequently able under the relevantderivatives agreements to obtain additional collateral or to terminate and close-out the derivative transactions at short notice.
The master agreements for OTC derivative transactions executed with our clients usually provide for a broad set of standardor bespoke termination rights, which allow us to respond swiftly to a counterparty’s default or to other circumstances whichindicate a high probability of failure. Considering the severe systemic disruptions to the financial system, that could be causedby a disorderly failure of a CCP, the Financial Stability Board (“FSB”) has recommended to subject CCPs to resolution regimesthat apply the same objectives and provisions that apply to global systematically important banks (G-SIBs).
Our contractual termination rights are supported by internal policies and procedures with defined roles and responsibilitieswhich ensure that potential counterparty defaults are identified and addressed in a timely fashion. These procedures includenecessary settlement and trading restrictions. When our decision to terminate derivative transactions results in a residual netobligation owed by the counterparty, we restructure the obligation into a non-derivative claim and manage it through ourregular work-out process. As a consequence, for accounting purposes we typically do not show any nonperforming derivatives.
Wrong-way risk occurs when exposure to a counterparty is adversely correlated with the credit quality of that counterparty. Incompliance with Article 291(2) and (4) CRR we, excluding DB PFK AG, had established a monthly process to monitor severallayers of wrong-way risk (specific wrong-way risk, general explicit wrong-way risk at country/industry/region levels and generalimplicit wrong-way risk, whereby relevant exposures arising from transactions subject to wrong-way risk are automaticallyselected and presented for comment to the responsible credit officer). A wrong-way risk report is then sent to Credit Risksenior management on a monthly basis. In addition, we, excluding DB PFK AG, utilized our established process for calibratingour own alpha factor (as defined in Article 284 (9) CRR) to estimate the overall wrong-way risk in our derivatives and securitiesfinancing transaction portfolio. DB PFK AG derivative counterparty risk is immaterial to the Group and collateral held is typicallyin the form of cash.
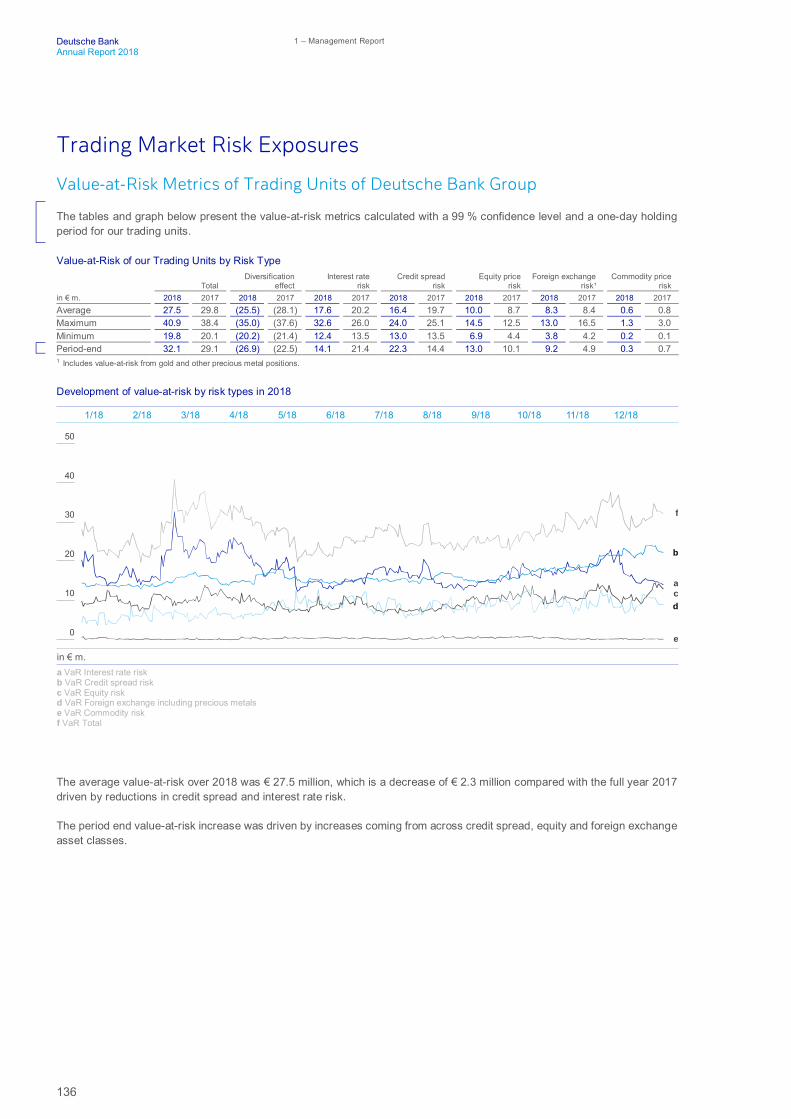
136
Deutsche Bank 1 – Management ReportAnnual Report 2018
Trading Market Risk Exposures
Value-at-Risk Metrics of Trading Units of Deutsche Bank Group
The tables and graph below present the value-at-risk metrics calculated with a 99 % confidence level and a one-day holdingperiod for our trading units.
Value-at-Risk of our Trading Units by Risk Type
TotalDiversification
effectInterest rate
riskCredit spread
riskEquity price
riskForeign exchange
risk¹Commodity price
riskin € m. 2018 2017 2018 2017 2018 2017 2018 2017 2018 2017 2018 2017 2018 2017Average 27.5 29.8 (25.5) (28.1) 17.6 20.2 16.4 19.7 10.0 8.7 8.3 8.4 0.6 0.8Maximum 40.9 38.4 (35.0) (37.6) 32.6 26.0 24.0 25.1 14.5 12.5 13.0 16.5 1.3 3.0Minimum 19.8 20.1 (20.2) (21.4) 12.4 13.5 13.0 13.5 6.9 4.4 3.8 4.2 0.2 0.1Period-end 32.1 29.1 (26.9) (22.5) 14.1 21.4 22.3 14.4 13.0 10.1 9.2 4.9 0.3 0.71 Includes value-at-risk from gold and other precious metal positions.
Development of value-at-risk by risk types in 2018
The average value-at-risk over 2018 was € 27.5 million, which is a decrease of € 2.3 million compared with the full year 2017driven by reductions in credit spread and interest rate risk.
The period end value-at-risk increase was driven by increases coming from across credit spread, equity and foreign exchangeasset classes.
50
40
20
10
30
0
in € m.
1/18 2/18 3/18 4/18 5/18 6/18 7/18 8/18 9/18 10/18 11/18 12/18
a VaR Interest rate riskb VaR Credit spread riskc VaR Equity riskd VaR Foreign exchange including precious metalse VaR Commodity riskf VaR Total
f
ac
e
b
d

137
Deutsche Bank Risk and capital performanceAnnual Report 2018 Trading Market Risk Exposures
Regulatory Trading Market Risk Measures
The table below presents the stressed value-at-risk metrics calculated with a 99 % confidence level and a one-day holdingperiod for our trading units.
Average, Maximum and Minimum Stressed Value-at-Risk by Risk Type
TotalDiversification
effectInterest rate
riskCredit spread
riskEquity price
riskForeign exchange
risk¹Commodity price
riskin € m. 2018 2017 2018 2017 2018 2017 2018 2017 2018 2017 2018 2017 2018 2017Average 84.1 76.7 (81.9) (88.4) 58.3 69.8 69.3 62.1 16.1 18.8 20.0 12.6 2.4 1.8Maximum 124.7 125.0 (106.7) (115.8) 89.9 92.0 79.7 73.2 78.1 66.8 38.2 28.0 7.7 6.1Minimum 61.2 42.0 (66.1) (73.0) 35.2 48.3 59.0 54.3 2.4 1.5 7.7 6.9 0.5 0.3Period-end 96.2 85.6 (75.3) (81.0) 57.6 67.8 70.1 64.3 21.3 19.9 21.7 12.6 0.7 1.91 Includes value-at-risk from gold and other precious metal positions.
The average stressed value-at-risk was € 84.1 million over 2018, an increase of € 7.4 million compared with the full year 2017.The increase was driven by a reduction in the diversification effect with some additional increase coming from the credit spreadand foreign exchange asset classes.
The period end stressed value-at-risk increase was driven by a reduction in diversification effect and increases in the creditspread, foreign exchange and equity asset classes.
The following graph compares the development of the daily value-at-risk with the daily stressed value-at-risk and their 60 dayaverages, calculated with a 99 % confidence level and a one-day holding period for our trading units. Amounts are shown inmillions of euro.
Development of value-at-risk and stressed value-at-risk in 2018
For regulatory reporting purposes, the incremental risk charge for the respective reporting dates represents the higher of thespot value at the reporting dates, and their preceding 12-week average calculation.
Average, Maximum and Minimum Incremental Risk Charge of Trading Units (with a 99.9 % confidence level and one-year capitalhorizon)1,2,3,
TotalGlobal Credit
Trading Core RatesFixed Income &
Currencies APACEmerging
Markets - Debt Otherin € m. 2018 2017 2018 2017 2018 2017 2018 2017 2018 2017 2018 2017Average 680.6 802.1 335.8 544.6 271.1 107.1 224.8 168.1 (11.9) 37.2 (139.2) (54.8)Maximum 847.6 899.3 403.4 597.4 481.9 172.5 451.9 229.0 17.3 62.9 (111.3) (20.4)Minimum 550.8 754.8 274.6 503.7 159.1 48.7 72.1 92.4 (29.2) (1.4) (177.1) (90.0)Period-end 805.4 789.6 383.6 540.1 388.6 133.2 188.0 142.3 5.8 19.9 (160.5) (45.9)1 Amounts show the bands within which the values fluctuated during the 12-weeks preceding December 31, 2018 and December 31, 2017, respectively.2 Business line breakdowns have been updated for 2018 reporting to better reflect the current business structure.3 All liquidity horizons are set to 12 months.
SVaR TotalSVaR Rolling 60d AverageVaR TotalVaR Rolling 60d Average
in € m.
1/18 2/18 3/18 4/18 5/18 6/18 7/18 8/18 9/18 10/18 11/18 12/18
140
120
40
80
60
100
20
a SVaR Totalb SVaR Rolling 60d Averagec VaR totald VaR Rolling 60d Average
ab
cd

138
Deutsche Bank 1 – Management ReportAnnual Report 2018
The incremental risk charge as at the end of 2018 was € 805 million an increase of € 15 million (2 %) compared with year end2017. The 12-week average of the incremental risk charge as at the end of 2018 was € 681 million and thus € 121 million(15 %) lower compared with the average for the 12-week period ended December 31, 2017. The decreased averageincremental risk charge is driven by a decrease in credit exposures in the Global Credit Trading and Emerging Markets - Debtbusiness areas when compared to the full year 2017.
For regulatory reporting purposes, the comprehensive risk measure for the respective reporting dates represents the higherof the internal spot value at the reporting dates, their preceding 12-week average calculation, and the floor, where the floor isequal to 8 % of the equivalent capital charge under the standardized approach securitization framework.
Average, Maximum and Minimum Comprehensive Risk Measure of Trading Units (with a 99.9 % confidence level and one-yearcapital horizon)1,2,3
in € m. 2018 2017Average 0.0 5.4Maximum 0.0 6.3Minimum 0.0 4.5Period-end 0.0 4.41 Regulatory Comprehensive Risk Measure calculated for the 12-week period ending December 31.2 Period end is based on the internal model spot value.3 All liquidity horizons are set to 12 months.
The internal model comprehensive risk measure was decommissioned in the fourth quarter of 2018 following regulatoryapproval. The small remaining exposures captured by this model are now covered by the incremental risk charge and themarket risk standardized approach.
Market Risk Standardized Approach
As of December 31, 2018, the securitization positions, for which the specific interest rate risk is calculated using the marketrisk standardized approach, generated capital requirements of € 418 million corresponding to risk weighted-assets of € 5.2billion. As of December 31, 2017 these positions generated capital requirements of € 379.5 million corresponding to riskweighted-assets of € 4.7 billion.
For nth-to-default credit default swaps the capital requirement was € 2.6 million corresponding to risk weighted-assets of € 33million as of December 31, 2018 compared with € 2.8 million and € 35 million as of December 31, 2017.
The capital requirement for Collective Investment Undertakings under the market risk standardized approach was € 14 millioncorresponding to risk weighted-assets of € 180 million as of December 31, 2018, compared with € 45 million and € 556 millionas of December 31, 2017.
The capital requirement for longevity risk under the market risk standardized approach was € 14 million corresponding to risk-weighted assets of € 180 million as of December 31, 2018, compared with € 32 million and € 395 million as of December 31,2017.
Results of Regulatory Backtesting of Trading Market Risk
In 2018 we observed one global outlier, where our loss on a buy-and-hold basis exceeded the value-at-risk of our TradingBooks, compared with three outliers in 2017. The outlier in 2018 occurred in February driven by losses coming from theEquities business line due to an increase in market volatility. There were no Actual Backtesting outliers, which compares theVaR to Total Income less Fees & Commissions, in 2018 compared to two in 2017.
Based on the backtesting results, our analysis of the underlying reasons for outliers and enhancements included in our value-at-risk methodology we continue to believe that our value-at-risk model will remain an appropriate measure for our tradingmarket risk under normal market conditions. The following graph shows the trading units daily buy-and-hold income incomparison to the value-at-risk as of the close of the previous business day for the trading days of the reporting period. Thevalue-at-risk is presented in negative amounts to visually compare the estimated potential loss of our trading positions withthe buy and hold income. Figures are shown in millions of euro. The chart shows that our trading units achieved a positivebuy and hold income for 52 % of the trading days in 2018 (versus 57 % in 2017), as well as displaying the global outlierexperienced in 2018.
The capital requirements for the value-at-risk model, for which the backtesting results are shown here, accounts for 1.5 % ofthe total capital requirement for the Group.

139
Deutsche Bank Risk and capital performanceAnnual Report 2018 Trading Market Risk Exposures
EU MR4 – Comparison of VAR estimates with gains/losses
Daily Income of our Trading Units
The following histogram shows the distribution of daily income of our trading units. Daily income is defined as total incomewhich consists of new trades, fees & commissions, buy & hold income, reserves, carry and other income. It displays thenumber of trading days on which we reached each level of trading income shown on the horizontal axis in millions of euro.
Distribution of daily income of our trading units in 2018
Our trading units achieved a positive revenue for 86 % of the trading days in 2018 compared with 93 % in the full year 2017.
0
10
20
30
Belo
w(5
0)
(50)
to(4
5)
(45)
to(4
0)
(40)
to(3
5)
(35)
to(3
0)
(30)
to(2
5)
(25)
to(2
0)
(20)
to(1
5)
(15)
to(1
0)
(10)
to(5
)
(5)t
o0
0to
5
5to
10
10to
15
15to
20
20to
25
25to
30
30to
35
35to
40
40to
45
45to
50
50to
55
55to
60
60to
65
65to
70
70to
75
75to
80
80to
85
85to
90
90to
95
95to
100
over
100
Days
in€
m.
BnH P&LActual P&LVaR
in € m.
1/18 2/18 3/18 4/18 5/18 6/18 7/18 8/18 9/18 10/18 11/18 12/18
100
75
-25
25
0
50
-50
Value-at-RiskActual income of Trading unitsBuy-and-hold income of Trading Units

140
Deutsche Bank 1 – Management ReportAnnual Report 2018
Nontrading Market Risk Exposures
Economic Capital Usage for Nontrading Market Risk
The following table shows the Nontrading Market Risk economic capital usage by risk type:
Economic Capital Usage by risk type.Economic capital usage
in € m. Dec 31, 2018 Dec 31, 2017Interest rate risk 1,416 1,743Credit spread risk 271 722Equity and Investment risk 1,239 1,431Foreign exchange risk 1,713 1,509Pension risk 1,588 1,174Guaranteed funds risk 68 49Total nontrading market risk portfolios 6,295 6,628
The economic capital figures do take into account diversification benefits between the different risk types.
Economic Capital Usage for Nontrading Market Risk totaled € 6.3 billion as of December 31, 2018, which is € 0.3 billion belowour economic capital usage at year-end 2017.
– Interest rate risk. Economic capital charge for interest rate risk in the banking book, including gap risk, basis risk and optionrisk, such as the risk of a change in client behavior embedded in modelled non-maturity deposits or prepayment risk. Intotal the economic capital usage for December 31, 2018 was € 1,416 million, compared to € 1,743 million for December 31,2017. The decrease in economic capital contribution was mainly driven by diversification effects.
– Credit spread risk. Economic capital charge for portfolios in the banking book subject to material credit spread risk.Economic capital usage was € 271 million as of December 31, 2018, versus € 722 million as of December 31, 2017. Thedecrease in economic capital contribution was mainly driven by accounting methodology changes in combination withdiversification effects.
– Equity and Investment risk. Economic capital charge for equity risk from our non-consolidated investment holdings, suchas our strategic investments and alternative assets, and from a structural short position in our own share price arising fromour equity compensation plans. The economic capital usage was € 1,239 million as of December 31, 2018, compared with€ 1,431 million as of December 31, 2017, predominately driven by a reduced market value of our equity compensationshort position.
– Pension risk. This risk arises from our defined benefit obligations, including interest rate risk and inflation risk, credit spreadrisk, equity risk and longevity risk. The economic capital usage was € 1,588 million and € 1,174 million as of December 31,2018 and December 31, 2017 respectively. The increase in Pension economic capital is mainly related to methodologicalimprovements and reduced diversification with other risk types.
– Foreign exchange risk. Foreign exchange risk predominately arises from our structural position in unhedged capital andretained earnings in non-euro currencies in certain subsidiaries. Our economic capital usage was € 1,713 million as ofDecember 31, 2018 versus € 1,509 million as of December 31, 2017. The increase in economic capital contribution wasmainly driven by changes in deferred tax assets in foreign currency.
– Guaranteed funds risk. Economic capital usage was € 68 million as of December 31, 2018, versus € 49 million as ofDecember 31, 2017. The increase in economic capital contribution was largely was largely driven by diversification effectsand market performance.

141
Deutsche Bank Risk and capital performanceAnnual Report 2018 Nontrading Market Risk Exposures
Interest Rate Risk in the Banking Book
The following table shows the impact on the Group’s net interest income in the banking book as well as the change of theeconomic value for the banking book positions from interest rate changes under the six standard scenarios defined by BaselCommittee on Banking Supervision (BCBS):
Economic value & net interest income interest rate risk in the banking book by scenarioDelta EVE Delta NII¹
in € bn. Dec 31, 2018 Dec 31, 2017 Dec 31, 2018 Dec 31, 2017Parallel up 0.8 (0.4) 2.9 2.8Parallel down (3.2) (1.1) (0.8) (0.8)Steepener 0.9 0.2 (0.5) (0.6)Flattener (1.6) (0.6) 2.7 2.7Short rate up (0.7) (0.5) 3.6 3.5Short rate down (0.1) 0.0 (1.0) (0.7)Maximum (3.2) (1.1) (1.0) (0.8)
in € bn. Dec 31, 2018 Dec 31, 2017Tier 1 Capital 55.1 57.6N/A – Not applicable1 Delta Net Interest Income (NII) reflects the difference between projected NII in the respective scenario with shifted rates vs. unchanged rates. Sensitivities are based on a
static balance sheet at constant exchange rates, excluding trading positions and DWS. Figures do not include Mark to Market (MtM) / Other Comprehensive Income (OCI)effects on centrally managed positions not eligible for hedge accounting.
A sudden parallel increase in the yield curve would positively impact the Group’s earnings (net interest income) from thebanking book positions. Deutsche Bank estimates that the total one-year net interest income change resulting from parallelyield curve shifts of +200 and (200) basis points (floored by a rate of zero) would be € 2.9 billion and € (0.8) billion, respectively,at December 31, 2018.
The maximum Economic Value of Equity (EVE) loss was € (3.2) billion as of December 2018, compared to € (1.1) billion asof December 2017. The increase in maximum EVE loss was mainly driven by an alignment with regards to the treatment ofcommercial margins and methodology enhancements with regards to the capture of convexity impacts in combination with thechange in interest rate levels. As per December 2018 the maximum EVE loss represents 5.8 % of Tier 1 Capital.
The following table shows the variation of the economic value for Deutsche Bank’s banking book positions resulting fromdownward and upward interest rate shocks by currency:
Economic value interest rate risk in the banking book by currencyDec 31, 2018
in € bn. -200 bp¹ +200 bpEUR (1.9) 0.6GBP (0.1) 0.1USD (1.3) 0.2JPY (0.0) 0.0Other 0.1 (0.1)Total (3.2) 0.81 Floored at zero
The estimated change in the economic value resulting from the impact of the BCBS parallel yield curve shifts of -200 bps(floored by a rate of zero) and +200 bps would be € (3.2) billion and € 0.8 billion, respectively, at December 31, 2018. Thechange in +200bps scenario from € (0.4) billion to € 0.8 billion was predominately driven by the alignment with regards to thetreatment of commercial margins.

142
Deutsche Bank 1 – Management ReportAnnual Report 2018
Operational risk exposure
Operational risk – risk profile
Operational risk losses by event type (profit and loss view)in € m. 2018 2017¹Clients, Products and Business Practices 156 513Internal Fraud 13 (48)External Fraud 50 19Execution, Delivery and Process Management 44 224Others 19 42Group 282 7491 2017 loss figures revised from prior year presentation due to subsequent capture of losses and reclassification.
As of December 31, 2018, profit and loss based operational losses decreased by € 467 million or 62 % compared to year-end2017. The decrease was driven by the event types “Clients, Products and Business Practices” and “Execution, Delivery andProcess Management”, due to settlements reached and increased litigation reserves for unsettled cases in 2017.
Operational losses by event type occurred in the period 2018 (2013-2017)1
1 Percentages in brackets correspond to loss frequency respectively to loss amount for losses occurred in 2013-2017 period. Frequency and amounts can changesubsequently.
The above left chart “Frequency of Operational Losses” summarizes operational risk events which occurred in 2018 comparedto the five-year period 2013-2017 in brackets based on the period in which a loss was first recognized for that event. Forexample, for a loss event that was first recognized in 2010 with an additional profit/loss event recognized in 2018, the frequencychart would not include the loss event, but the loss distribution chart would include the profit/loss recognized in the respectiveperiod.
Frequencies are driven by the event types “External Fraud” with a frequency of 54 % and the event type “Clients, Productsand Business Practices” with 34 % of all observed loss events. “Execution, Delivery and Process Management” contributes10 %. “Others” are stable at 2 %. The event type “Internal Fraud” has a low frequency, resulting in less than 1 % of the lossevents in the period 2018.
The above right chart “Distribution of Operational Losses” summarizes operational risk loss postings recognized in theprofit/loss in 2018 compared to the five-year period 2013-2017. The event type “Clients, Products and Business Practices”dominates the operational loss distribution with a share of 55 % and is determined by outflows related to litigation,investigations and enforcement actions. “External Fraud” has the second highest share (18 %) which is related to one largeevent in 2018. Finally, the event types “Execution, Delivery and Process Management” (16 %), “Others” (7 %) and “InternalFraud” (5 %) are minor, compared to other event types.
While we seek to ensure the comprehensive capture of operational risk loss events with a P&L impact of € 10.000 or greater,the totals shown in this section may be underestimated due to delayed detection and recording of loss events.
Frequency of Operational Losses (first posting date) Distribution of Operational Losses (posting date)
2% (2%)Others
10% (11%)Execution, Deliveryand Process Mgmt
1% (1%)Internal Fraud
34% (38%)Clients, Products and
Business Practices
54% (49%)External Fraud
16% (6%)Execution, Deliveryand Process Mgmt
18% (-1%)External Fraud
5% (25%)Internal Fraud
7% (1%)Others
55% (70%)Clients, Products and
Business Practices

143
Deutsche Bank Risk and capital performanceAnnual Report 2018 Liquidity Risk Exposure
Liquidity Risk Exposure
Funding Markets and Capital Markets Issuance
2018 has been a challenging year for credit markets. The transition from Quantitative Easing to Quantitative Tighteningcombined with an increased macro uncertainty led to higher volatility and credit spreads.
Our 5 year CDS traded within a range of 65 to 224 basis points. The peak was observed in the beginning of December, sincethen, the spread has declined and as of year-end was trading at 208 basis points. The spreads on our bonds exhibited similarbehavior . For example, our 2.375 % EUR benchmark maturing in January 2023 traded in a range of 51 to 259 basis points,closing at 230 basis points at year end 2018.
Our revised 2018 issuance plan of € 20-22 billion, comprising debt issuance with an original maturity in excess of one year,was completed and we concluded 2018 having raised €19.8 billion in term funding. This funding was broadly spread acrossthe following funding sources: Senior non-preferred plain-vanilla issuance (€ 9.4 billion), senior preferred plain-vanilla issuance(€ 1.0 billion), covered bond issuance (€ 2.5 billion), and other senior preferred structured issuance (€ 6.9 billion). The(€ 19.8 billion) total is divided into Euro (€ 8.3 billion), US dollar (€ 9.7 billion), British Pound (€ 0.3 billion) and other currenciesaggregated (€ 1.5 billion). In addition to direct issuance, we use long-term cross currency swaps to manage our non-Eurofunding needs. Our investor base for 2018 issuances comprised asset managers and pension funds (40 %), retail customers(19 %), banks (8 %), governments and agencies (5 %), insurance companies (3%) and other institutional investors (18 %).The geographical distribution was split between Germany (20 %), rest of Europe (35 %), US (25 %), Asia/Pacific (15 %) andOther (5 %).
The average spread of our issuance over 3-months-Euribor (all non-Euro funding spreads are rebased versus 3-monthsEuribor) was 60 basis points for the full year and lower compared to 71 basis points average spread in 2017. The averagetenor was 6.1 years. Our issuance activities were higher in the first half of the year. We issued the following volumes overeach quarter: Q1: € 10.8 billion, Q2: € 3.0 billion, Q3: € 3.2 billion and Q4: € 2.8 billion, respectively.
In 2019, our issuance plan is € 20-25 billion which we plan to cover by accessing the above sources, without being overlydependent on any one source. We also plan to raise a portion of this funding in U.S. dollar and may enter into cross currencyswaps to manage any residual requirements. We have total capital markets maturities, excluding legally exercisable calls ofapproximately € 22 billion in 2019.
Funding Diversification
In 2018, total external funding decreased by € 72.1 billion from € 1,015.8 billion at December 31, 2017 to € 943.8 billion atDecember 31, 2018. The overall decrease was primarily driven by a decrease of balances in Secured Funding and Shorts by€ 39.8 billion (55.2 %). This is due to managed reductions as a result of our balance sheet optimization initiatives andincreased netting. In addition, unsecured wholesale funding decreased by € 16.4 billion (22.7 %) and Transaction Bankingdeposits by € 8.2 billion (11.4 %), primarily due to lower volumes and matured trades with financial institution and maturingcertificates of deposits held by other wholesale customers. This decrease was partly offset by an increase of € 7.1 billion(9.8 %) in our retail business. The decrease of the Capital Markets and Equity volume by € 3.3 billion (4.6 %) relates to totalissuance maturities in excess of new issuances.
The overall proportion of our most stable funding sources (comprising capital markets and equity, retail, and transactionbanking) has increased from 72 % in 2017 to 77.5 % in 2018.

144
Deutsche Bank 1 – Management ReportAnnual Report 2018
Composition of External Funding Sources
1 Other includes fiduciary, self-funding structures (e.g. X-markets), margin / Prime Brokerage cash balances (shown on a net basis)Reference: Reconciliation to total balance sheet: Derivatives & settlement balances € 325.0 billion (€ 369.4 billion), add-back for netting effect for Margin & Prime Brokeragecash balances (shown on a net basis) € 51.1 billion (€ 59.2 billion), other non-funding liabilities € 28.3 billion (€ 30.3 billion) for December 31, 2018 and December 31, 2017respectively; figures may not add up due to rounding.
Maturity of unsecured wholesale funding, ABCP and capital markets issuance1
Dec 31, 2018
in € m.
Not morethan
1 month
Over1 month
but notmore than3 months
Over3 months
but notmore than6 months
Over6 months
but notmore than
1 year
Sub-totalless than
1 year
Over1 year
but notmore than
2 yearsOver
2 years TotalDeposits from banks 1,119 1,542 4,064 1,181 7,906 151 271 8,328Deposits from otherwholesale customers 1,820 1,868 5,413 5,044 14,145 1,017 1,459 16,621CDs and CP 823 946 1,313 889 3,972 7 0 3,979ABCP 0 0 0 0 0 0 0 0Senior non-preferredplain vanilla 600 5,276 7,463 5,812 19,150 8,954 44,256 72,360Senior preferredplain vanilla 0 0 0 0 0 5 1,012 1,017Senior structured 626 951 1,186 1,655 4,418 3,490 15,630 23,538Covered bonds/ABS 213 972 553 407 2,145 3,848 15,666 21,659Subordinated liabilities 9 731 2,226 32 2,998 2,217 9,605 14,820Other 0 0 0 0 0 0 0 0Total 5,209 12,285 22,219 15,022 54,734 19,690 87,898 162,322
Of which:Secured 213 972 553 407 2,145 3,848 15,666 21,659Unsecured 4,997 11,313 21,666 14,615 52,590 15,842 72,232 140,663
1 Includes additional Tier 1 notes reported as additional equity components in the financial statements. Liabilities with call features are shown at earliest legally exercisable calldate. No assumption is made as to whether such calls would be exercised.
The total volume of unsecured wholesale liabilities, ABCP and capital markets issuance maturing within one year amount to€ 55 billion as of December 31, 2018, and should be viewed in the context of our total Liquidity Reserves of € 259 billion.
201
318
217
5645
177
2
20% 31% 21% 6% 4% 17% 0%
197
325
208
4529
137
2
21% 34% 22% 5% 3% 15% 0%0
50
100
150
200
250
300
350
Capital Marketsand Equity
Retail TransactionBanking
OtherCustomers¹
UnsecuredWholesale
Secured Fundingand Shorts
FinancingVehicles
December 31, 2017: total € 1015.8 billionDecember 31, 2018: total € 943.8 billion
in € bn.

145
Deutsche Bank Risk and capital performanceAnnual Report 2018 Liquidity Risk Exposure
Dec 31, 2017
in € m.
Not morethan
1 month
Over1 month
but notmore than3 months
Over3 months
but notmore than6 months
Over6 months
but notmore than
1 year
Sub-totalless than
1 year
Over1 year
but notmore than
2 yearsOver
2 years TotalDeposits from banks 9,709 3,477 2,196 1,172 16,554 721 54 17,330Deposits from otherwholesale customers 3,451 5,884 4,112 3,974 17,421 483 525 18,429CDs and CP 1,579 2,595 2,381 2,873 9,427 6 82 9,516ABCP 0 0 0 0 0 0 0 0Senior non-preferredplain vanilla 405 4,038 3,231 3,288 10,961 16,009 44,399 71,368Senior preferredplain vanilla 0 0 0 0 0 0 0 0Senior structured 345 868 1,654 2,952 5,818 3,044 16,893 25,756Covered bonds/ABS 90 194 1,711 737 2,731 2,190 17,248 22,169Subordinated liabilities 50 234 5,265 700 6,250 135 11,694 18,079Other 4 0 0 0 4 0 0 4Total 15,632 17,289 20,550 15,695 69,167 22,588 90,895 182,650
Of which:Secured 90 194 1,711 737 2,731 2,190 17,248 22,169Unsecured 15,542 17,096 18,840 14,959 66,436 20,398 73,647 160,481
The following table shows the currency breakdown of our short-term unsecured wholesale funding, of our ABCP funding andof our capital markets issuance.
Unsecured wholesale funding, ABCP and capital markets issuance (currency breakdown)Dec 31,2018 Dec 31,2017
in € m. in EUR in USD in GBPin other
CCYs Total in EUR in USD in GBPin other
CCYs TotalDeposits frombanks 2,400 5,241 22 665 8,328 2,310 11,096 2,423 1,502 17,330Deposits fromother whole-sale customers 15,482 678 269 192 16,621 14,109 3,743 233 344 18,429CDs and CP 2,279 769 94 838 3,979 6,401 1,942 310 863 9,516ABCP 0 0 0 0 0 0 0 0 0 0Senior non-preferredplain vanilla 33,736 31,549 1,163 5,913 72,360 36,407 27,482 864 6,616 71,368Senior preferredplain vanilla 1,017 0 0 0 1,017 0 0 0 0 0Senior structured 8,858 11,564 22 3,094 23,538 9,937 12,301 31 3,487 25,756Covered bonds/ABS 21,659 0 0 0 21,659 22,142 25 0 2 22,169Subordinatedliabilities 6,338 7,498 801 183 14,820 7,940 8,960 801 378 18,079Other 0 0 0 0 0 0 4 0 0 4Total 91,768 57,298 2,372 10,884 162,322 99,245 65,552 4,662 13,192 182,650
Of which:Secured 21,659 0 0 0 21,659 22,142 25 0 2 22,169Unsecured 70,110 57,298 2,372 10,884 140,663 77,103 65,527 4,662 13,190 160,481

146
Deutsche Bank 1 – Management ReportAnnual Report 2018
Liquidity Reserves
Composition of our liquidity reserves by parent company (including branches) and subsidiariesDec 31, 2018 Dec 31, 2017
in € bn. Carrying Value Liquidity Value Carrying Value Liquidity ValueAvailable cash and cash equivalents (held primarily at central banks) 184 184 222 222
Parent (incl. foreign branches) 148 148 189 189Subsidiaries 36 36 33 33
Highly liquid securities (includes government, governmentguaranteed and agency securities) 61 58 39 37
Parent (incl. foreign branches) 31 28 24 23Subsidiaries 30 30 15 15
Other unencumbered central bank eligible securities 15 11 19 13Parent (incl. foreign branches) 11 8 11 8Subsidiaries 3 2 8 5
Total liquidity reserves 259 252 280 272Parent (incl. foreign branches) 191 184 223 219Subsidiaries 69 68 56 53
As of December 31, 2018, our liquidity reserves amounted to € 259 billion compared with € 280 billion as of December 31,2017. The decrease of € 21 billion comprised a € 38 billion decrease in cash and cash equivalents, a € 4 billion decrease inother unencumbered securities offset by an increase of € 22 billion in highly liquid securities. The development was largelydriven by management action to actively reduce excess liquidity and invest in higher yielding assets as part of our strategy.Our average liquidity reserves during the year were € 271 billion compared with € 269 billion during 2017. In the table abovethe carrying value represents the market value of our liquidity reserves while the liquidity value reflects our assumption of thevalue that could be obtained, primarily through secured funding, taking into account the experience observed in securedfunding markets at times of stress.
The liquidity value (weighted) of our Liquidity Reserves of € 252 billion exceeds the liquidity value (weighted) of our HighQuality Liquid Assets (HQLA) of € 250 billion. The major drivers of this difference are that Liquidity Reserves include centralbank eligible, but otherwise less liquid securities (for example traded loans, other investment grade corporate bonds and ABS)which are not recognized in HQLA. Additionally, HQLA includes major index equities, but excludes cash balances depositedwith central banks to satisfy minimum cash requirements as well as cash balances deposited with non EU Central Banks ratedbelow AA- which are included in the LCR but not as part of the HQLA.
Liquidity Coverage Ratio
Our weighted average LCR of 145 % (twelve months average) has been calculated in accordance with the CommissionDelegated Regulation (EU) 2015/61 and the EBA Guidelines on LCR disclosure to complement the disclosure of liquidity riskmanagement under Article 435 CRR.
The year-end LCR as of December 31, 2018 stands at 140.37 % compared to 139.70 % as of December 31, 2017.
LCR componentsDec 31, 2018 Dec 31, 2017
in € bn. (unless stated otherwise)
Total adjustedweighted value
(average)
Total adjustedweighted value
(average)Number of data points used in the calculation of averages 12 12Liquidity buffer 250 247Total net cash outflows 172 172Liquidity Coverage Ratio (LCR) in % 145 % 144 %

147
Deutsche Bank Risk and capital performanceAnnual Report 2018 Liquidity Risk Exposure
Funding Risk Management
Structural Funding
All funding matrices (the aggregate currency, the U.S. dollar and the GBP funding matrix) were in line with the respective riskappetite as of year ends 2018 and 2017.
Stress Testing and Scenario Analysis
During 2018, our stressed Net Liquidity Position remained well above the risk appetite and finished 2018 with a surplus of€ 48 billion.
Global All Currency Daily Stress Testing ResultsDec 31, 2018 Dec 31, 2017
in € bn.Funding
Gap¹Gap
Closure²Net Liquidity
PositionFunding
Gap¹Gap
Closure²Net Liquidity
PositionSystemic market risk 93 209 116 121 284 1631 notch downgrade (DB specific) 63 193 131 79 252 173Severe downgrade (DB specific) 222 278 57 287 331 43Combined3 231 279 48 318 351 331 Funding gap caused by impaired rollover of liabilities and other projected outflows.2 Based on liquidity generation through Liquidity Reserves and other countermeasures.3 Combined impact of systemic market risk and severe downgrade.
Global EUR Daily Stress Testing ResultsDec 31, 2018 Dec 31, 2017
in €Funding
Gap¹Gap
Closure²Net Liquidity
PositionFunding
Gap¹Gap
Closure²Net Liquidity
PositionCombined³ 117 144 28 157 172 151 Funding gap caused by impaired rollover of liabilities and other projected outflows.2 Based on liquidity generation through Liquidity Reserves and other countermeasures.3 Combined impact of systemic market risk and severe downgrade.
Global USD Daily Stress Testing ResultsDec 31, 2018 Dec 31, 2017
in € bn.Funding
Gap¹Gap
Closure²Net Liquidity
PositionFunding
Gap¹Gap
Closure²Net Liquidity
PositionCombined³ 83 96 13 114 127 131 Funding gap caused by impaired rollover of liabilities and other projected outflows.2 Based on liquidity generation through Liquidity Reserves and other countermeasures.3 Combined impact of systemic market risk and severe downgrade.
Global GBP Daily Stress Testing ResultsDec 31, 2018 Dec 31, 2017
in € bn. Funding Gap¹ Gap Closure²Net Liquidity
PositionFunding
GapGap
ClosureNet Liquidity
PositionCombined³ 6 9 3 14 18 41 Funding gap caused by impaired rollover of liabilities and other projected outflows.2 Based on liquidity generation through Liquidity Reserves and other countermeasures.3 Combined impact of systemic market risk and severe downgrade.
The following table presents the amount needed to meet collateral requirements from contractual obligations in the event of aone- or two-notch downgrade by rating agencies for all currencies..
Contractual ObligationsDec 31, 2018 Dec 31, 2017
in € m.One-notch
downgradeTwo-notch
downgradeOne-notch
downgradeTwo-notch
downgradeContractual derivatives funding or margin requirements 688 994 1,024 1,577Other contractual funding or margin requirements 0 0 317 1,459
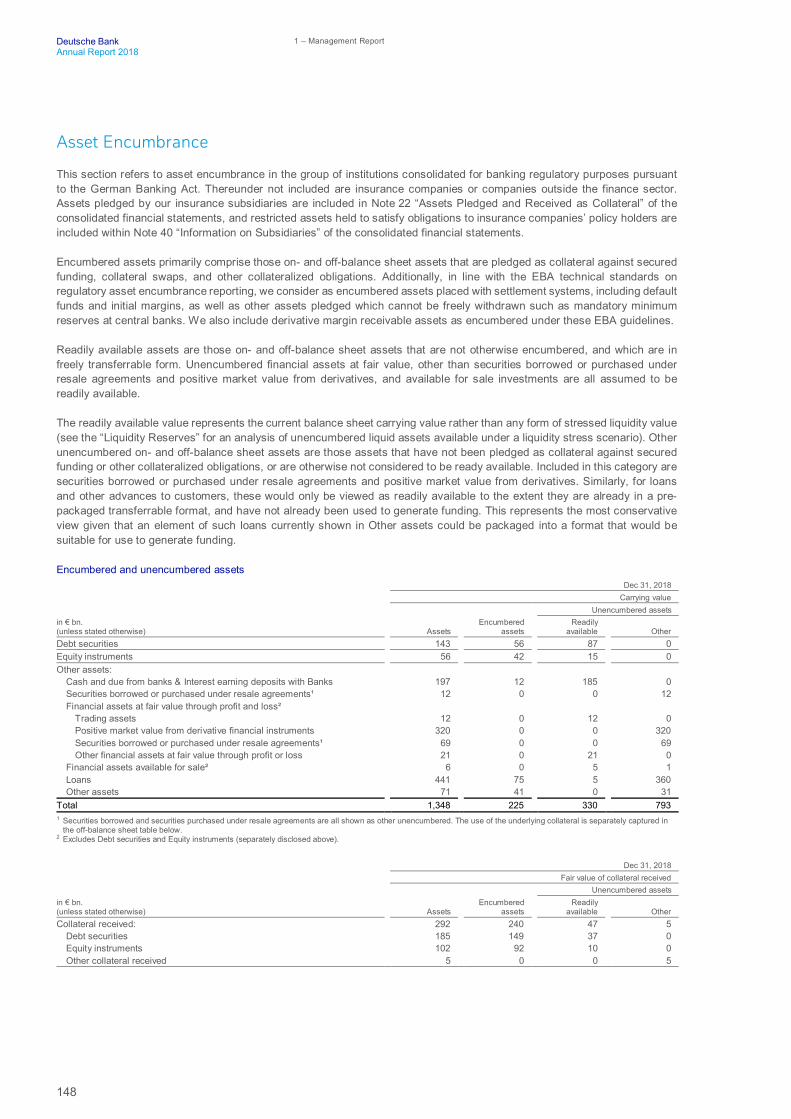
148
Deutsche Bank 1 – Management ReportAnnual Report 2018
Asset Encumbrance
This section refers to asset encumbrance in the group of institutions consolidated for banking regulatory purposes pursuantto the German Banking Act. Thereunder not included are insurance companies or companies outside the finance sector.Assets pledged by our insurance subsidiaries are included in Note 22 “Assets Pledged and Received as Collateral” of theconsolidated financial statements, and restricted assets held to satisfy obligations to insurance companies’ policy holders areincluded within Note 40 “Information on Subsidiaries” of the consolidated financial statements.
Encumbered assets primarily comprise those on- and off-balance sheet assets that are pledged as collateral against securedfunding, collateral swaps, and other collateralized obligations. Additionally, in line with the EBA technical standards onregulatory asset encumbrance reporting, we consider as encumbered assets placed with settlement systems, including defaultfunds and initial margins, as well as other assets pledged which cannot be freely withdrawn such as mandatory minimumreserves at central banks. We also include derivative margin receivable assets as encumbered under these EBA guidelines.
Readily available assets are those on- and off-balance sheet assets that are not otherwise encumbered, and which are infreely transferrable form. Unencumbered financial assets at fair value, other than securities borrowed or purchased underresale agreements and positive market value from derivatives, and available for sale investments are all assumed to bereadily available.
The readily available value represents the current balance sheet carrying value rather than any form of stressed liquidity value(see the “Liquidity Reserves” for an analysis of unencumbered liquid assets available under a liquidity stress scenario). Otherunencumbered on- and off-balance sheet assets are those assets that have not been pledged as collateral against securedfunding or other collateralized obligations, or are otherwise not considered to be ready available. Included in this category aresecurities borrowed or purchased under resale agreements and positive market value from derivatives. Similarly, for loansand other advances to customers, these would only be viewed as readily available to the extent they are already in a pre-packaged transferrable format, and have not already been used to generate funding. This represents the most conservativeview given that an element of such loans currently shown in Other assets could be packaged into a format that would besuitable for use to generate funding.
Encumbered and unencumbered assetsDec 31, 2018
Carrying valueUnencumbered assets
in € bn.(unless stated otherwise) Assets
Encumberedassets
Readilyavailable Other
Debt securities 143 56 87 0Equity instruments 56 42 15 0Other assets:
Cash and due from banks & Interest earning deposits with Banks 197 12 185 0Securities borrowed or purchased under resale agreements¹ 12 0 0 12Financial assets at fair value through profit and loss²
Trading assets 12 0 12 0Positive market value from derivative financial instruments 320 0 0 320Securities borrowed or purchased under resale agreements¹ 69 0 0 69Other financial assets at fair value through profit or loss 21 0 21 0
Financial assets available for sale² 6 0 5 1Loans 441 75 5 360Other assets 71 41 0 31
Total 1,348 225 330 7931 Securities borrowed and securities purchased under resale agreements are all shown as other unencumbered. The use of the underlying collateral is separately captured in
the off-balance sheet table below.2 Excludes Debt securities and Equity instruments (separately disclosed above).
Dec 31, 2018Fair value of collateral received
Unencumbered assetsin € bn.(unless stated otherwise) Assets
Encumberedassets
Readilyavailable Other
Collateral received: 292 240 47 5Debt securities 185 149 37 0Equity instruments 102 92 10 0Other collateral received 5 0 0 5

149
Deutsche Bank Risk and capital performanceAnnual Report 2018 Liquidity Risk Exposure
Dec 31, 2017Carrying value
Unencumbered assetsin € bn.(unless stated otherwise) Assets
Encumberedassets
Readilyavailable Other
Debt securities 148 65 84 0Equity instruments 86 63 23 0Other assets:
Cash and due from banks & Interest earning deposits with Banks 234 11 223 0Securities borrowed or purchased under resale agreements¹ 27 0 0 27Financial assets at fair value through profit and loss²
Trading assets 11 0 11 0Positive market value from derivative financial instruments 363 0 0 363Securities borrowed or purchased under resale agreements¹ 78 0 0 78Other financial assets at fair value through profit or loss 5 0 5 0
Financial assets available for sale² 3 0 3 0Loans 417 70 15 332Other assets 108 42 0 66
Total 1,480 251 363 8661 Securities borrowed and securities purchased under resale agreements are all shown as other unencumbered. The use of the underlying collateral is separately captured in
the off-balance sheet table below.2 Excludes Debt securities and Equity instruments (separately disclosed above).3 Prior period results have been restated due to a refined approach to determine assets pledged.
Dec 31, 2017Fair value of collateral received
Unencumbered assetsin € bn.(unless stated otherwise) Assets
Encumberedassets
Readilyavailable Other
Collateral received: 365 307 58 0Debt securities 228 189 39 0Equity instruments 137 118 18 0Other collateral received 0 0 0 0
1 Prior period results have been restated due to a refined approach to determine collateral received and collateral re-pledged.
The above tables set out a breakdown of on- and off-balance sheet items, broken down between encumbered, readily availableand other. Any securities borrowed or purchased under resale agreements are shown based on the fair value of collateralreceived.
The above tables of encumbered assets include assets that are not encumbered at an individual entity level, but which maybe subject to restrictions in terms of their transferability within the group. Such restrictions may be due to local connectedlending requirements or similar regulatory restrictions. In this situation it is not feasible to identify individual balance sheetitems that cannot be transferred.
Maturity Analysis of Assets and Financial Liabilities
Treasury manages the maturity analysis of assets and liabilities. Modeling of assets and liabilities is necessary in cases wherethe contractual maturity does not adequately reflect the liquidity risk position. The most significant example in this contextwould be immediately repayable deposits from retail and transaction banking customers which have consistently displayedhigh stability throughout even the most severe financial crises.
The modeling profiles are part of the overall liquidity risk management framework (see section “Liquidity Stress Testing andScenario Analysis” for short-term liquidity positions ≤ 1 year and section “Structural Funding” for long-term liquidity positions> 1 year) which is defined and approved by the Management Board.
The following tables present a maturity analysis of our total assets based on carrying value and upon earliest legallyexercisable maturity as of December 31, 2018 and 2017, respectively.

150
Deutsche Bank 1 – Management ReportAnnual Report 2018
Analysis of the earliest contractual maturity of assetsDec 31, 2018
in € m.
Ondemand
(incl.Overnight
andone day
notice)
Up toone
month
Over1 month
to nomorethan
3 months
Over3 months
but nomorethan
6 months
Over6 months
but nomorethan
9 months
Over9 months
but nomorethan
1 year
Over1 yearbut nomorethan
2 years
Over2 yearsbut nomorethan
5 yearsOver
5 years TotalCash and central bankbalances 182,778 2,596 224 0 22 3,070 40 0 0 188,732Interbank balances(w/o central banks) 4,234 3,182 202 110 131 422 0 0 599 8,881Central bank funds sold 0 0 0 0 0 0 0 0 0 0Securities purchased underresale agreements 40 2,537 1,415 887 461 521 1,067 1,294 0 8,222
With banks 1 2,015 173 588 447 266 0 1,136 0 4,626With customers 39 522 1,242 299 14 255 1,067 158 0 3,596
Securities borrowed 2,880 517 0 0 0 0 0 0 0 3,396With banks 49 60 0 0 0 0 0 0 0 110With customers 2,830 456 0 0 0 0 0 0 0 3,287
Financial assets at fair valuethrough profit or loss 472,750 37,855 14,782 2,174 2,830 5,872 2,274 4,617 30,085 573,240
Trading assets 152,456 0 0 0 0 0 0 0 281 152,738Fixed-income securitiesand loans 96,650 0 0 0 0 0 0 0 18 96,668Equities and other variable-income securities 55,250 0 0 0 0 0 0 0 264 55,514Other trading assets 556 0 0 0 0 0 0 0 0 556
Positive market values fromderivative financialinstruments 320,058 0 0 0 0 0 0 0 0 320,058Non-trading financial assetsmandatory at fair valuethrough profit or loss 236 37,855 14,782 2,174 2,830 5,872 2,274 4,617 29,804 100,444
Securities purchased underresale agreements 0 32,550 3,231 616 372 78 110 2,098 5,488 44,543Securities borrowed 0 4,331 625 2 0 0 39 0 19,213 24,210Fixed-income securitiesand loans 1 739 10,855 1,556 2,458 4,590 1,777 2,501 3,763 28,239Other non-trading financialassets mandatory at fairvalue through profit or loss 235 235 72 0 0 1,204 348 18 1,340 3,453
Financial assets designatedat fair value through profit orloss 0 9 95 0 0 0 0 0 1 104
Positive market values fromderivative financial instrumentsqualifying for hedge accounting 0 143 179 220 21 23 322 641 1,480 3,028Financial assets available forsale N/M N/M N/M N/M N/M N/M N/M N/M N/M N/MFinancial assets at fair valuethrough other comprehensiveincome 3 3,101 2,290 2,945 3,982 4,403 6,858 16,371 11,228 51,182
Securities purchased underresale agreements 0 1,097 0 0 0 0 0 0 0 1,097Securities borrowed 0 0 0 0 0 0 0 0 0 0Debt securities 0 1,692 1,717 2,519 3,811 4,307 6,252 13,494 11,203 44,993Loans 3 312 574 426 171 96 606 2,878 25 5,092Other 0 0 0 0 0 0 0 0 0 0
Loans 15,812 39,559 23,116 14,432 9,585 8,324 23,928 67,648 197,892 400,297To banks 170 1,644 1,394 1,017 120 131 544 406 1,179 6,605To customers 15,642 37,915 21,722 13,415 9,465 8,194 23,383 67,242 196,713 393,691
Retail 2,238 7,109 3,702 1,735 857 887 4,794 15,099 151,001 187,422Corporates and othercustomers 13,404 30,806 18,020 11,680 8,609 7,307 18,589 52,143 45,712 206,269
Securities held to maturity N/M N/M N/M N/M N/M N/M N/M N/M N/M N/MOther financial assets 65,390 7,813 446 418 108 2,917 835 2,416 1,844 82,187Total financial assets 743,887 97,311 42,750 21,187 17,142 25,551 35,324 92,987 243,130 1,319,269Other assets 13,198 91 91 124 158 197 34 984 13,991 28,868Total assets 757,086 97,402 42,841 21,311 17,300 25,749 35,357 93,972 257,121 1,348,137

151
Deutsche Bank Risk and capital performanceAnnual Report 2018 Liquidity Risk Exposure
Analysis of the earliest contractual maturity of assetsDec 31, 2017
in € m.
Ondemand
(incl.Overnight
andone day
notice)
Up toone
month
Over1 month
to nomorethan
3 months
Over3 months
but nomorethan
6 months
Over6 months
but nomorethan
9 months
Over9 months
but nomorethan
1 year
Over1 yearbut nomorethan
2 years
Over2 yearsbut nomorethan
5 yearsOver
5 years TotalCash and central bankbalances 222,082 1,173 106 94 29 2,053 118 0 0 225,655Interbank balances(w/o central banks) 4,737 2,613 305 215 116 696 122 0 463 9,265Central bank funds sold 0 0 0 0 0 0 0 0 0 0Securities purchased underresale agreements 29 4,625 1,220 1,277 1,448 617 561 89 105 9,971
With banks 21 3,758 585 735 1,400 443 468 0 0 7,409With customers 8 867 635 542 48 175 94 89 105 2,562
Securities borrowed 15,786 553 49 0 323 0 22 0 0 16,732With banks 1,889 283 0 0 0 0 0 0 0 2,172With customers 13,896 270 49 0 323 0 22 0 0 14,560
Financial assets at fair valuethrough profit or loss – trading 565,632 40,074 14,269 1,914 731 455 1,805 3,047 9,043 636,970
Trading assets 184,661 0 0 0 0 0 0 0 0 184,661Fixed-income securitiesand loans 98,140 0 0 0 0 0 0 0 0 98,140Equities and other variable-income securities 85,932 0 0 0 0 0 0 0 0 85,932Other trading assets 590 0 0 0 0 0 0 0 0 590
Positive market values fromderivative financialinstruments 361,032 0 0 0 0 0 0 0 0 361,032Financial assets designatedat fairvalue through profit or loss 19,938 40,074 14,269 1,914 731 455 1,805 3,047 9,043 91,276
Securities purchased underresale agreements 5,364 36,195 12,160 1,115 662 125 1,066 903 253 57,843Securities borrowed 14,540 3,786 1,928 0 0 0 0 0 0 20,254Fixed-income securitiesand loans 34 93 182 799 68 17 720 2,144 8,216 12,273Equities and other variable-income securities 0 0 0 0 0 132 20 0 573 725Other financial assetsdesignated at fair valuethrough profit or loss 0 0 0 0 0 181 0 0 1 182
Positive market values fromderivative financial instrumentsqualifying for hedge accounting 0 40 191 26 139 9 119 1,029 1,601 3,153Financial assets available forsale 47 1,175 1,257 2,934 1,728 2,742 5,469 15,438 18,608 49,397
Fixed-income securities andloans 24 969 1,253 2,934 1,728 2,021 5,404 15,418 18,016 47,766Equities and other variable-income securities 23 206 4 0 0 721 64 20 592 1,630
Loans 17,334 27,284 27,229 17,442 9,273 14,628 27,053 62,232 199,225 401,699To banks 787 2,163 2,832 1,979 1,253 821 1,103 670 1,230 12,838To customers 16,546 25,121 24,397 15,463 8,021 13,807 25,950 61,562 197,995 388,862
Retail 4,291 4,725 4,645 1,632 1,721 1,313 4,720 15,216 151,449 189,712Corporates and othercustomers 12,256 20,395 19,752 13,831 6,300 12,493 21,230 46,346 46,546 199,149
Securities held to maturity 0 0 0 0 0 0 0 1,652 1,518 3,170Other financial assets 85,083 352 179 135 92 143 21 433 74 86,513Total financial assets 910,728 77,889 44,804 24,037 13,878 21,343 35,290 83,920 230,636 1,442,525Other assets 20,451 0 0 0 0 0 0 0 11,756 32,207Total assets 931,178 77,889 44,804 24,037 13,878 21,343 35,290 83,920 242,392 1,474,732
The following tables present a maturity analysis of our total liabilities based on carrying value and upon earliest legallyexercisable maturity as of December 31, 2018 and 2017, respectively.

152
Deutsche Bank 1 – Management ReportAnnual Report 2018
Analysis of the earliest contractual maturity of liabilitiesDec 31, 2018
in € m.
Ondemand
(incl.Over-
night andone day
notice)
Up toone
month
Over1 month
to nomorethan
3 months
Over3 months
but nomorethan
6 months
Over6 months
but nomorethan
9 months
Over9 months
but nomorethan
1 year
Over1 yearbut nomorethan
2 years
Over2 yearsbut nomorethan
5 yearsOver
5 years TotalDeposits 348,026 26,750 109,965 26,422 10,517 10,021 11,563 9,662 11,479 564,405
Due to banks 46,399 2,487 8,699 6,059 913 1,624 2,284 5,470 8,045 81,980Due to customers 301,627 24,263 101,266 20,363 9,604 8,397 9,279 4,193 3,434 482,425
Retail 125,292 9,731 74,012 3,878 1,736 1,176 917 970 603 218,314Corporates and othercustomers 176,335 14,532 27,254 16,486 7,868 7,221 8,362 3,223 2,831 264,111
Trading liabilities 361,411 0 0 0 0 0 0 0 0 361,411Trading securities 59,629 0 0 0 0 0 0 0 0 59,629Other trading liabilities 295 0 0 0 0 0 0 0 0 295Negative market values fromderivative financialinstruments 301,487 0 0 0 0 0 0 0 0 301,487
Financial liabilities designed atfair value through profit or loss(without loan commitments andfinancial guarantees) 11,282 28,466 3,640 4,699 540 370 639 1,041 3,079 53,757
Securities sold underrepurchase agreements 10,822 27,909 3,031 4,259 0 2 208 17 6 46,254Long-term debt 255 33 238 234 416 155 391 936 2,949 5,607Other financial liabilitiesdesignated at fair valuethroughprofit or loss 205 524 372 206 124 212 40 89 124 1,895
Investment contract liabilities 0 0 0 0 0 512 0 0 0 512Negative market values fromderivative financial instrumentsqualifying for hedge accounting 0 178 431 383 93 25 264 241 306 1,922Central bank funds purchased 252 0 0 0 0 0 0 0 0 252Securities sold underrepurchase agreements 3,151 611 349 3 265 234 0 1 0 4,615
Due to banks 2,205 513 264 3 265 205 0 1 0 3,456Due to customers 945 99 85 0 0 29 0 0 0 1,158
Securities loaned 3,357 1 1 0 0 0 0 0 0 3,359Due to banks 1,320 1 0 0 0 0 0 0 0 1,322Due to customers 2,036 0 1 0 0 0 0 0 0 2,037
Other short term borrowings 11,067 899 584 1,136 266 205 0 0 0 14,158Long-term debt 0 1,735 28,579 9,505 5,017 2,480 22,627 47,762 34,377 152,083
Debt securities - senior 0 1,678 7,444 8,977 4,388 1,790 15,050 43,552 25,510 108,389Debt securities - subordi-nated 0 28 1,943 109 1 0 1,314 1,232 2,089 6,717Other long-term debt - senior 0 26 19,193 376 592 673 6,250 2,838 6,602 36,550Other long-term debt -subordinated 0 3 0 42 36 17 13 141 175 427
Trust Preferred Securities 0 0 0 3,168 0 0 0 0 0 3,168Other financial liabilities 96,571 976 1,785 134 44 1,024 268 101 59 100,962Total financial liabilities 835,117 59,617 145,335 45,450 16,743 14,872 35,361 58,809 49,300 1,260,603Other liabilities 18,797 0 0 0 0 0 0 0 0 18,797Total equity 0 0 0 0 0 0 0 0 68,737 68,737Total liabilities and equity 853,913 59,617 145,335 45,450 16,743 14,872 35,361 58,809 118,037 1,348,137Off-balance sheet commitmentsgiven 39,720 9,767 13,480 19,872 9,390 15,678 27,793 91,753 36,200 263,654
Banks 20,274 5,010 7,445 10,854 5,178 8,539 14,394 46,720 19,178 137,593Retail 8,192 1,246 388 86 115 577 343 79 4,360 15,386Corporates and othercustomers 11,253 3,511 5,647 8,932 4,097 6,563 13,055 44,954 12,662 110,674

153
Deutsche Bank Risk and capital performanceAnnual Report 2018 Liquidity Risk Exposure
Analysis of the earliest contractual maturity of liabilitiesDec 31, 2017
in € m.
Ondemand
(incl.Over-
night andone day
notice)
Up toone
month
Over1 month
to nomorethan
3 months
Over3 months
but nomorethan
6 months
Over6 months
but nomorethan
9 months
Over9 months
but nomorethan
1 year
Over1 yearbut nomorethan
2 years
Over2 yearsbut nomorethan
5 yearsOver
5 years TotalDeposits 359,619 34,022 111,755 23,845 12,259 9,488 9,296 9,503 12,087 581,873
Due to banks 58,070 5,618 10,520 4,464 1,081 1,345 2,744 5,277 8,921 98,041Due to customers 301,549 28,404 101,234 19,381 11,178 8,143 6,552 4,226 3,165 483,832
Retail 120,110 10,308 73,943 3,059 2,074 1,336 1,111 1,187 601 213,730Corporates and othercustomers 181,439 18,095 27,291 16,323 9,103 6,806 5,441 3,038 2,565 270,102
Trading liabilities 414,189 0 0 0 0 0 0 0 0 414,189Trading securities 71,148 0 0 0 0 0 0 0 0 71,148Other trading liabilities 314 0 0 0 0 0 0 0 0 314Negative market values fromderivative financialinstruments 342,726 0 0 0 0 0 0 0 0 342,726
Financial liabilities designed atfair value through profit or loss(without loan commitments andfinancial guarantees) 16,018 29,236 6,080 1,574 548 5,520 665 1,091 3,134 63,866
Securities sold underrepurchase agreements 14,722 28,857 4,167 1,089 5 4,897 62 24 18 53,840Long-term debt 256 33 582 323 345 427 603 889 2,980 6,439Other financial liabilitiesdesignated at fair valuethroughprofit or loss 1,040 346 1,332 161 199 196 1 178 136 3,587
Investment contract liabilities 0 0 0 0 0 574 0 0 0 574Negative market values fromderivative financial instrumentsqualifying for hedge accounting 0 11 58 230 65 41 423 249 218 1,294Central bank funds purchased 174 83 0 0 0 0 0 0 0 257Securities sold underrepurchase agreements 14,143 353 1,497 409 94 837 476 16 23 17,849
Due to banks 11,459 266 1,453 327 43 736 476 11 0 14,772Due to customers 2,684 87 44 82 52 102 0 5 23 3,077
Securities loaned 6,684 3 1 0 0 0 0 0 1 6,688Due to banks 2,253 3 0 0 0 0 0 0 1 2,256Due to customers 4,432 0 1 0 0 0 0 0 0 4,433
Other short term borrowings 11,831 848 1,542 1,227 738 2,226 0 0 0 18,411Long-term debt 0 886 5,029 16,419 9,931 14,137 21,218 49,923 42,172 159,715
Debt securities - senior 0 626 4,266 3,481 5,873 3,334 19,392 45,546 26,978 109,496Debt securities - subordi-nated 0 0 189 267 67 11 48 1,096 5,554 7,232Other long-term debt - senior 0 210 529 12,496 3,886 10,722 1,685 3,230 9,362 42,120Other long-term debt -subordinated 0 50 45 176 105 70 93 50 278 868
Trust Preferred Securities 0 0 1,644 2,723 274 183 666 0 0 5,491Other financial liabilities 112,960 1,254 2,228 180 197 177 204 163 4 117,367Total financial liabilities 935,618 66,696 129,835 46,607 24,107 33,182 32,949 60,944 57,637 1,387,574Other liabilities 19,051 0 0 0 0 0 0 0 0 19,051Total equity 0 0 0 0 0 0 0 0 68,099 68,099Total liabilities and equity 954,669 66,696 129,835 46,607 24,107 33,182 32,949 60,944 125,736 1,474,724Off-balance sheet commitmentsgiven 6,290 8,484 10,418 16,261 8,234 15,928 27,732 84,121 28,996 206,464
Banks 238 406 1,398 1,591 557 733 952 346 216 6,437Retail 352 253 389 247 108 205 223 445 8,483 10,706Corporates and othercustomers 5,700 7,825 8,630 14,423 7,569 14,990 26,557 83,330 20,297 189,320

Compensation Report
155 Introduction
157 Management Board Compensation Report157 Management Board Compensation Governance158 Principles of the Compensation Policies159 Compensation Structure165 Long-Term Incentive and Sustainability166 Forfeiture Conditions / Clawback166 Limitations in the Event of Exceptional
Developments167 Shareholding Guidelines167 OtherBenefitsuponEarlyTermination168 Management Board compensation
forthe2018financialyear171 Share awards172 Management Board Share Ownership,
Shareholding Guidelines175 Compensation in accordance with the
German Corporate Governance Code (GCGC)181 Compensation in accordance with the
German Accounting Standard No. 17 (GAS 17)
183 Employee Compensation Report183 Regulatory Environment184 Compensation Governance185 Compensation Strategy186 Group Compensation Framework187 Determination of performance-based
Variable Compensation188 Variable Compensation Structure189 Ex-post Risk Adjustment of
Variable Compensation190 EmployeeGroupswithspecific
Compensation Structures193 Material Risk Taker Compensation Disclosure
196 Compensation System for Supervisory Board Members
197 Supervisory Board Compensation for the 2018 Financial Year
155
Deutsche Bank IntroductionAnnual Report 2018 Supervisory Board Report and Disclosure
Introduction
The 2018 Compensation Report provides detailed compensation information with regard to the overall Deutsche Bank Group.
The Compensation Report comprises the following three sections:
Management Board Compensation ReportThe first section of the Report sets out the structure and design of the compensation system for the members of theManagement Board of Deutsche Bank AG (compensation policies). It is followed by information on the compensationand other benefits granted by the Supervisory Board to the members of the Management Board of Deutsche Bank AG.
Employee Compensation ReportThe second section of the compensation report discloses information with regard to the compensation system and structurethat applies to the employees in Deutsche Bank Group (including DWS Group and Postbank units). The report provides detailson the Group Compensation Framework and it outlines the decisions on Variable Compensation for 2018. Furthermore, thispart contains quantitative disclosures specific to employees identified as Material Risk Takers (MRTs) in accordance with theRemuneration Ordinance for Institutions (Institutsvergütungsverordnung – InstVV).
Supervisory Board Report and DisclosureThe third section provides information on the structure and level of compensation for Supervisory Board members of DeutscheBank AG.
The report complies with the requirements of Section 314 (1) No. 6 of the German Commercial Code (Handelsgesetzbuch,“HGB”), the German Accounting Standard No. 17 (“DRS 17”) “Reporting on Executive Body Remuneration”, CRR, InstVV,and the recommendations of the German Corporate Governance Code.

156
Deutsche Bank 1 – Management ReportAnnual Report 2018
Letter of the chairman of the Supervisory BoardDear Shareholders,
In this report you will find comprehensive information on the compensation system and the compensation for themembers of the Management Board. Let me summarize in brief the main points:
We have not changed our compensation policies this year, as we believe our existing framework has proven effective.In line with our compensation policies, each Management Board member, alongside a fixed salary and a contribution tothe company pension plan, is entitled to a variable compensation which is subject to the achievement of annually definedobjectives. The largest part (60 %) of the variable compensation is based on long-term and Group-oriented targets,whereas the remaining (up to 40 %) is based on short-term Group targets and individual or divisional objectives. For thefirst time in 2018, individual objectives include performance against certain qualitative and quantitative metrics includedon the Management Board Balanced Scorecards. These scorecards are being rolled out across the bank and will befurther cascaded down the organization during 2019.
In the year under review, the achievement level for the Long-Term-Award was 41 % and for the short-term Group targets70 %. For details please refer to the following pages.
The bank reported its first net profit since 2014. Since the Management Board had not received any variablecompensation for financial years 2015, 2016 and 2017, we are granting the Management Board members the variablecompensation that results from the achievement of their respective targets. The outcomes are at the same timedifferentiated and balanced with values between 80% and 154% within a range of zero to 200%. For the first time, therequirements of the 2017 German Remuneration Ordinance for Institutions have to be applied to the granting of variablecompensation for the year under review. As a result, deferred compensation for Management Board members will besubject to a deferral period of at least five years and it will be possible to reclaim compensation components for up totwo years after the final tranche has vested in specific situations that have been defined by the regulator.
The Supervisory Board looks forward to discussing this and other topics with you at the General Meeting.
Yours sincerely,
Dr. Paul Achleitner

157
Deutsche Bank Management Board Compensation ReportAnnual Report 2018 Management Board Compensation Governance
Management Board Compensation Report
Management Board Compensation Governance
The Supervisory Board, as a plenary body, is responsible for the structuring and design of the system for thecompensation of the members of the Management Board (compensation policies) as well as for determining theirindividual compensation. The Supervisory Board is supported by the Compensation Control Committee. TheCompensation Control Committee controls and supports the appropriate structuring of the compensation policies andprepares the resolutions of the Supervisory Board regarding the individual compensation of the Management Boardmembers. In addition, the Compensation Control Committee and/or the Supervisory Board will consult independentexternal consultants where this is considered necessary.
The Compensation Control Committee currently comprises four members. In accordance with regulatory requirements, atleast one must have sufficient expertise and professional experience in the area of risk management and risk controlling andat least one other must be an employee representative.
The Supervisory Board regularly reviews the compensation policies for the members of the Management Board. In thecase of a change or restructuring of the compensation policies, the Supervisory Board uses the possibility provided in §120 (4) of the German Stock Corporation Act (Aktiengesetz – AktG) for the General Meeting to approve the system ofcompensation for Management Board members. This was last seen in 2017, and the Supervisory Board will continue touse this possibility in accordance with the German Act Implementing the Second Shareholder Rights Directive which iscurrently in the legislative process.
Compensation ControlCommittee
Prepares the resolutions regardingthe compensation policies and thecompensation level and presentsthem to the Supervisory Board.
Supervisory Board
Passes resolutions on thecompensation policies and thecompensation level. Theresolved compensation policiesare presented to the AnnualGeneral Meeting.
Annual General Meeting
Passes resolutions on theapproval of the compensationpolicies.

158
Deutsche Bank 1 – Management ReportAnnual Report 2018
Principles of the Compensation PoliciesNumerous factors are to be considered when structuring the compensation policies and determining individual compensation.These factors can be summarized as specific remuneration principles. The following overview shows the core remunerationprinciples which have an impact on both the compensation policies and the individual remuneration and have therefore beentaken into consideration by the Supervisory Board when passing a resolution on questions of remuneration.
When passing a resolution on the structure and determination of compensation, the Supervisory Board considers in particular:
Governance The structuring of the compensation policies and determination of individual remuneration takesplace within the framework of the statutory and regulatory requirements. The Supervisory Board’sobjective is to offer, within the regulatory requirements, a compensation package that is both inline with customary market practices and competitive with comparable roles.
Group Strategy Through the structure of the compensation policies the members of the Management Board areto be motivated to achieve the objectives set out in the Bank’s strategies, to work continuouslytowards the positive development of the Group and to avoid unreasonably high risks.
Collective and IndividualPerformance of theManagement BoardMembers
The variable, performance-related compensation is determined on the basis of the level ofachievement of previously agreed objectives. For this purpose, collective and Deutsche BankGroup-related objectives applying equally to all Management Board members are set. In addition,the Supervisory Board sets individual objectives for each member of the Management Boardseparately, which particularly take into account the development of the business, infrastructure orregional areas of responsibility as the case may be. Such objectives may be financial or non-financial.
Regulatory orother compensation caps
Pursuant to the regulatory approaches under CRD 4, the ratio of fixed to variable compensationis generally limited to 1:1 (cap regulation), i.e. the amount of variable compensation must notexceed that of fixed compensation. However, lawmakers have also stipulated that shareholderscan resolve to relax the requirement by setting the ratio of fixed to variable compensation to 1:2.In May 2014, the General Meeting approved the aforementioned setting to 1:2 with a majority of91 %. The compensation policies resolved by the Supervisory Board also provides fixed caps forthe individual variable compensation components. In addition, the Supervisory Board is entitled toset an additional cap for the total compensation of the individual members of the ManagementBoard. In the 2018 financial year, the additional cap is € 9.85 million.
Sustainability Aspects The total variable compensation for Management Board members is currently only to be grantedon a deferred basis. Since 2017, a portion of at least 75 % of the deferred variable compensationis to be granted in the form of equity-based compensation components, which only vest no lessthan five years after the grant in one tranche (cliff vesting) and are subject to an additional retentionperiod of one year. The remaining portion is to be granted as non-equity based compensationcomponent and to vest in identical tranches over a period of four years. During the deferral andretention period, deferred compensation is subject to specific forfeiture provisions. The totalvariable compensation may be reclaimed by the bank for up to two years after the expiry of thelast deferral period in response to specific individual negative contributions to results made by theManagement Board member (clawback).
Interests ofthe Shareholders
When designing the specific structure of the compensation policies, determining individualcompensation amounts, and structuring compensation delivery and allocation, the focus is onensuring a close link between the interests of both the Management Board members andshareholders. While defining the variable compensation, this is achieved through the utilization ofclearly defined key financial figures which are directly linked to the performance of Deutsche Bank.
The compensation policies and the compensation structures they encompass are reflected in the individual ManagementBoard members’ contracts.

159
Deutsche Bank Management Board Compensation ReportAnnual Report 2018 Compensation Structure
Compensation Structure
– Transparent Compensation Structures– Clear link between compensation and previously agreed objectives– Strong emphasis on the interests of the shareholders
Structure and compensation elements of the compensation policies
The compensation policies applicable since January 2017 consist of non-performance-related (fixed) and performance-related(variable) components.
Non-Performance-Related Components (Fixed Compensation)
The fixed compensation is not linked to performance and consists of the base salary, allowances, contributions to the companypension plan and “other benefits”.
The annual base salary amounts to € 3.4 million for the Chairman of the Management Board. The Presidents receive anannual base salary of € 3 million. The annual base salary for ordinary Management Board members with responsibilityfor CIB is € 3 million and for all other ordinary board members € 2.4 million.
Various factors were considered when determining the appropriate level of the base salary. First, the base salary rewardsgeneral assumption of the office of Management Board member and the related overall responsibility of the individualManagement Board members. In addition, the compensation paid in the comparable market is taken into account whendetermining the amount of the base salary. However, a market comparison must take into consideration that the regulatoryrequirements pursuant to the German Remuneration Ordinance for Institutions (Institutsvergütungsverordnung – InstVV) inconjunction with Section 25a (5) of the German Banking Act (Kreditwesengesetz) set a cap for variable compensation at200 % of the fixed compensation. Accordingly, the fixed compensation must be determined in a way that ensures competitivecompensation in line with market practice while taking into account the aforementioned requirements. The regulatory requiredcap was implemented in 2014.
Base salary
+
Contribution to the company pension plan
Short-Term Award
+
Long-Term Award
Group component
Individual component
Fixed compensation
Variable compensation

160
Deutsche Bank 1 – Management ReportAnnual Report 2018
Under InstVV rules, the Supervisory Board is able to award optional functional allowances to Management Board memberswho are assigned additional tasks and a particular responsibility extending beyond the assigned regular area of responsibilitywithin the Management Board. The allowance can be a maximum of 100 % of the fixed base salary and is paid for as long asthe additional tasks and the particular responsibility are assigned to the Management Board member. Under the InstVV rules,functional allowances are considered part of fixed compensation and therefore are not subject to forfeiture or clawbackconditions.
Additional non-performance-related components include “other benefits”. The “other benefits” comprise the monetary value ofnon-cash benefits such as company cars and driver services, insurance premiums, expenses for company-related socialfunctions and security measures including payments, if applicable, of taxes on these benefits as well as taxablereimbursements of expenses.
Performance-Related Components (Variable Compensation)
The current compensation policies provide that compensation must be linked to transparent performance criteria. The structureallows for the agreement of individual and divisional objectives alongside collective objectives and makes it possible to achievecompetitive pay levels in line with market practice on the basis of the respective member’s area of responsibility and, at thesame time, also meets in this respect the regulatory requirements.
The entire variable compensation is performance-related. It consists of a two components:
– the Short-Term Award and– the Long-Term Award.
The 2017 InstVV generally stipulates a three-year assessment period for the variable compensation. This requirement is takeninto account by assigning a three-year reference period to each of the three objectives of the long-term component. If therelevant three years cannot be attributed to a member of the Management Board due to that member joining the bank onlyrecently, performance will be determined for the period that can be attributed to the Management Board member. In addition,the deferral period of the variable compensation is extended by the number of years missing with respect to the assessmentperiod.
Short-Term Award (STA)
The STA is linked to the achievement of short term and medium-term objectives. Objectives include collective objectives tobe achieved by the Management Board as a whole and individual objectives whose achievement level is determinedseparately for each member of the Management Board.
In order to distinguish collective objectives from individual objectives, the STA is divided into two components:
– the Group Component and– the Individual Component.
Group ComponentThe objectives to be achieved form the basis for the calculation of the Group component as part of the STA. The key objectiveof the Group component is to link the variable compensation for the Management Board to the performance of the Bank.
In 2016, the Management Board decided to align part of the variable compensation for non-tariff employees of the Bank moreclosely with Group performance. This seeks to reward the contribution of all employees to the financial results of the Bankand the achievements in the implementation of its strategy. Management Board compensation is also closely linked to theperformance of the Bank using selected key financial figures. The Supervisory Board decided to align the compensationpolicies for the Management Board members more closely with the compensation system for employees. This is achieved byusing the annual performance metrics underlying the Group component in the compensation system for employees as thereference value for the Group component of the STA since 2017.

161
Deutsche Bank Management Board Compensation ReportAnnual Report 2018 Compensation Structure
In accordance with the strategy, four performance metrics constituting important indicators for the capital, risk, cost and returnprofile of the Bank form the reference value for the Group Component of the STA:
Common Equity Tier 1(CET1) capital ratio (fullyloaded)
The Common Equity Tier-1 Ratio of the Bank in relation to risk-weighted assets.
Leverage ratio The Bank´s Tier 1 capital as a percentage of its total leverage exposure pursuant to CRR/CRD 4.
Adjusted costs Total noninterest expenses, excluding restructuring and severance, litigation and impairment ofgoodwill and other intangible assets.
Post-tax return on tangibleequity (RoTE)
Net income (or loss) attributable to Deutsche Bank shareholders as a percentage of averagetangible shareholders’ equity. The latter is the shareholders’ equity on the bank´s balance sheet,excluding goodwill and other intangible assets.
The Supervisory Board regularly reviews the selection of the performance metrics. The above four objectives are equallyweighted at up to 25 % in the determination of the Group Component of the STA, depending on the achievement level. If,overall, the performance metric-based objectives are not achieved during the period being evaluated, the Supervisory Boardmay determine that a Group component will not be granted.
Individual ComponentThe individual component of the STA rewards the achievement of short- and medium-term individual objectives. Theseobjectives are established by the Supervisory Board as part of the objective setting agreement for the respective financialyear’s performance evaluation. The key objectives are designed to contribute to the applicable business policy and strategicobjectives of the Bank, in line with each Management Board member’s area of responsibility. Not only is financial successtaken into account in the process, but also the conduct towards staff members and clients as part of carrying out businessactivities. Objectives for the individual component may for example include revenue developments in the course of the year,project-related targets, diversity objectives or other developments in employee or client satisfaction.
As part of the annual objective setting agreement, corresponding key financial figures and/or factors are set for all objectivesthat are used to determine the objective achievement level. As a general rule, three objectives per financial year are set foreach Management Board member.
For the first time in 2018, the Balanced Scorecard was integrated in the compensation policies of the individual componentof the Short Term Award to be determined by the Supervisory Board. The Balanced Scorecard allows for the operationalizationof strategic objectives by transforming the latter into concrete measures while simultaneously creating an overview of prioritiesacross the Group. The Balanced Scorecard of Management Board Members consists of two components, (i) the keyperformance indicators (KPI) and (ii) the key deliverables, the achievement level of which is determined at the end of thefinancial year. The Balanced Scorecard contains key financial figures as well as (non-financial) key performance indicatorsfor client business, personnel, control environment and innovation. In order to link the Balanced Scorecard to the remunerationof the members of the Management Board, the Supervisory Board resolved that a ratio of 30 % of the individual componentof the STA (i.e., 6-9 % of the total variable compensation) included in the component comprising the KPI will be accounted forin the performance evaluation of the Management Board members for the 2018 financial year. The component of the BalancedScorecard comprising the key deliverables will also be accounted for in the performance evaluation as of the 2019 financialyear.
The sum of individually agreed and divisional objectives amounts to a maximum of 90 % of the individual component of theSTA, depending on the achievement level of the aforementioned individual objectives and key performance indicators of theBalanced Scorecard. The Supervisory Board decides on the remaining portion of 10 % of the individual component to rewardoutstanding contributions over the course of the financial year as an exercise of its discretionary authority. If, overall, theobjectives are not achieved during the period being evaluated, the Supervisory Board may determine that an individualcomponent will not be granted.
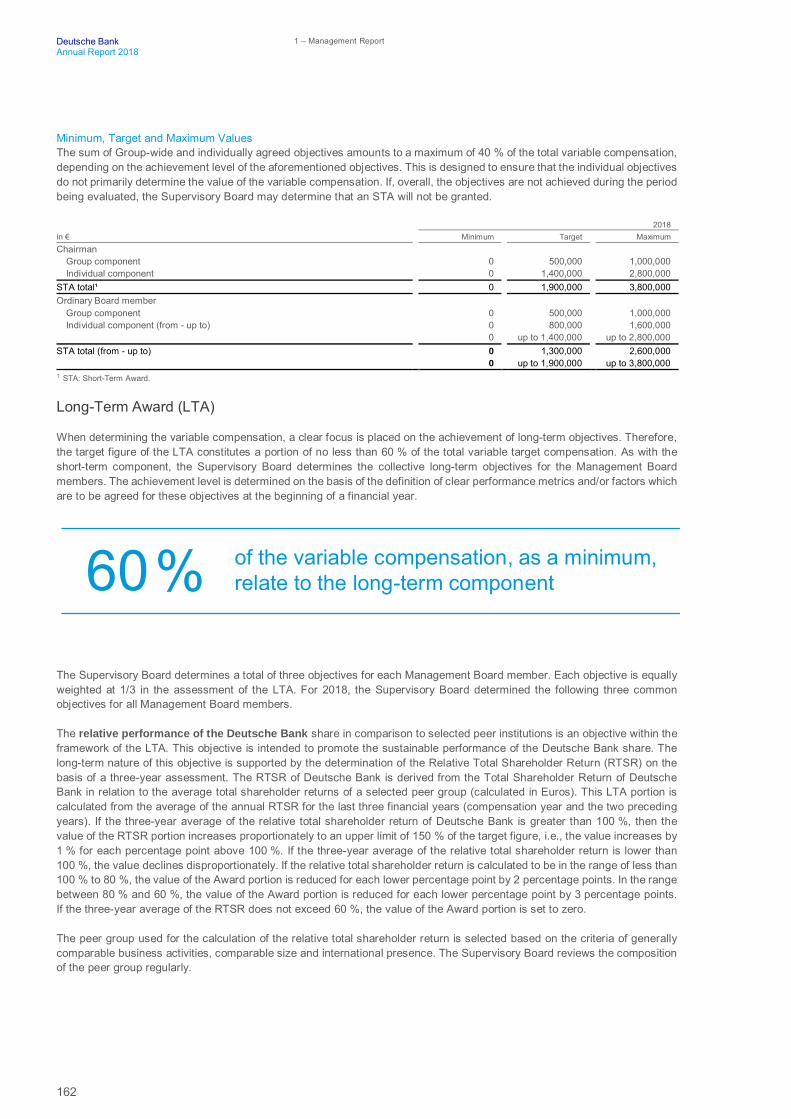
162
Deutsche Bank 1 – Management ReportAnnual Report 2018
Minimum, Target and Maximum ValuesThe sum of Group-wide and individually agreed objectives amounts to a maximum of 40 % of the total variable compensation,depending on the achievement level of the aforementioned objectives. This is designed to ensure that the individual objectivesdo not primarily determine the value of the variable compensation. If, overall, the objectives are not achieved during the periodbeing evaluated, the Supervisory Board may determine that an STA will not be granted.
2018in € Minimum Target MaximumChairman
Group component 0 500,000 1,000,000Individual component 0 1,400,000 2,800,000
STA total¹ 0 1,900,000 3,800,000Ordinary Board member
Group component 0 500,000 1,000,000Individual component (from - up to) 0 800,000 1,600,000
0 up to 1,400,000 up to 2,800,000STA total (from - up to) 0 1,300,000 2,600,000
0 up to 1,900,000 up to 3,800,0001 STA: Short-Term Award.
Long-Term Award (LTA)
When determining the variable compensation, a clear focus is placed on the achievement of long-term objectives. Therefore,the target figure of the LTA constitutes a portion of no less than 60 % of the total variable target compensation. As with theshort-term component, the Supervisory Board determines the collective long-term objectives for the Management Boardmembers. The achievement level is determined on the basis of the definition of clear performance metrics and/or factors whichare to be agreed for these objectives at the beginning of a financial year.
The Supervisory Board determines a total of three objectives for each Management Board member. Each objective is equallyweighted at 1/3 in the assessment of the LTA. For 2018, the Supervisory Board determined the following three commonobjectives for all Management Board members.
The relative performance of the Deutsche Bank share in comparison to selected peer institutions is an objective within theframework of the LTA. This objective is intended to promote the sustainable performance of the Deutsche Bank share. Thelong-term nature of this objective is supported by the determination of the Relative Total Shareholder Return (RTSR) on thebasis of a three-year assessment. The RTSR of Deutsche Bank is derived from the Total Shareholder Return of DeutscheBank in relation to the average total shareholder returns of a selected peer group (calculated in Euros). This LTA portion iscalculated from the average of the annual RTSR for the last three financial years (compensation year and the two precedingyears). If the three-year average of the relative total shareholder return of Deutsche Bank is greater than 100 %, then thevalue of the RTSR portion increases proportionately to an upper limit of 150 % of the target figure, i.e., the value increases by1 % for each percentage point above 100 %. If the three-year average of the relative total shareholder return is lower than100 %, the value declines disproportionately. If the relative total shareholder return is calculated to be in the range of less than100 % to 80 %, the value of the Award portion is reduced for each lower percentage point by 2 percentage points. In the rangebetween 80 % and 60 %, the value of the Award portion is reduced for each lower percentage point by 3 percentage points.If the three-year average of the RTSR does not exceed 60 %, the value of the Award portion is set to zero.
The peer group used for the calculation of the relative total shareholder return is selected based on the criteria of generallycomparable business activities, comparable size and international presence. The Supervisory Board reviews the compositionof the peer group regularly.
of the variable compensation, as a minimum,relate to the long-term component60%

163
Deutsche Bank Management Board Compensation ReportAnnual Report 2018 Compensation Structure
In 2018, the peer group for the RTSR comprises the following banks:
Peer Group of Deutsche Bank
The Supervisory Board sets an objective designed to promote the growing and strengthening of the Bank, based on the notionof actual organic capital growth. Organic Capital Growth is defined as the balance of the following changes (which are alsoreported in the Consolidated Statement of Changes in Equity) occurring during the financial year, divided by the DeutscheBank Shareholders Equity attributable as at December 31 of the previous financial year.
– Total comprehensive income, net of tax– Coupons on additional equity components, net of tax– Remeasurement gains (losses) related to defined benefit plans, net of tax– Option premiums and other effects from options on common shares– Net gains (losses) on treasury shares sold
Consequently, "non-organic" changes in equity, in particular payment of a dividend or capital increase, are of no relevance tothe achievement of the objective.
As in the last year, the third objective is taken from the category “Culture & Clients”. In this context, the Supervisory sets anobjective which is linked to corporate culture, client satisfaction and dealing with clients. This objective is linked to thesustainable development of the intrabank environment or designed to foster the development of client relations for the 2018financial year. One objective set by the Supervisory Board for all Management Board members is – this year again – againthe evaluation of the control environment within the Deutsche Bank Group.
The Long Term Award can be a maximum of 150 % of the respective target figures.
Objectives
Objectives are established by the Supervisory Board as part of an objective setting agreement at the beginning of therespective financial year for purposes of performance evaluation. For all objectives, financial metrics are set to measure theachievement level of the objectives in a transparent way. The discretionary decision is strictly limited to 3 to 6 % with respectto the total variable compensation.
The allocation of the objectives to the individual compensation components is set out below.
BNP Paribas Société Générale Barclays Credit Suisse UBS
Bank of America Citigroup JP Morgan Chase HSBC

164
Deutsche Bank 1 – Management ReportAnnual Report 2018
Relevant indicators Relative weight
Group component (1)
Individual component (2)
CET1 ratio
Leverage ratio
Adjusted non-interest expenses
Post-tax return on tangible equity (RoTE)
25 %
25 %
25 %
25 %
(1) Joint strategic key objectives which also form base for the assessment of the group component as part of thecompensation system for the employees of DB Group.
(2) Short-term individual and divisional objectives of quantitative and qualitative nature.(3) Long-term group-wide objectives.
Individual component (2)
Individual Objectives
Discretion
60 %
30 %
10 %
Balanced Scorecard
Short-Term Award (STA)
Long-Term Award (LTA) (3)
Relative total shareholder return
Organic Capital Growth
33,34 %
33,33 %
33,33 %Culture & Clients / Control Environment

165
Deutsche Bank Management Board Compensation ReportAnnual Report 2018 Long-Term Incentive and Sustainability
Maximum Compensation
Total Compensation/Target and Maximum Values2018 2017
Basesalary STA1 LTA2
Totalcompensation
Totalcompensation
in €Group
componentIndividual
componentChairman
Target 3,400,000 500,000 1,400,000 3,400,000 8,700,000 8,700,000Maximum 3,400,000 1,000,000 2,800,000 5,100,000 12,300,000 12,300,000
Ordinary Board member (CIB)Target 3,000,000 500,000 1,400,000 2,800,000 7,700,000 7,700,000Maximum 3,000,000 1,000,000 2,800,000 4,200,000 11,000,000 11,000,000
Ordinary Board member (AM)Target 2,400,000 500,000 1,300,000 2,800,000 7,000,000 7,000,000Maximum 2,400,000 1,000,000 2,600,000 4,200,000 10,200,000 10,200,000
Ordinary Board member (PCB)Target 2,400,000 500,000 1,100,000 2,800,000 6,800,000 6,800,000Maximum 2,400,000 1,000,000 2,200,000 4,200,000 9,800,000 9,800,000
Ordinary Board member(Infrastructure/Region)
Target 2,400,000 500,000 800,000 2,800,000 6,500,000 6,500,000Maximum 2,400,000 1,000,000 1,600,000 4,200,000 9,200,000 9,200,000
1 STA: Short-Term Award.2 LTA: Long-Term Award.
The total compensation of a Management Board member is subject to additional caps. Due to regulatory requirements, thevariable compensation is capped at 200 % of the fixed compensation. In addition, the Supervisory Board again set a cap of€ 9.85 million for the overall total compensation for the 2018 financial year. Consequently, compensation is capped at amaximum of € 9.85 million, even where the level of the target achievement would result in higher compensation.
Long-Term Incentive and SustainabilityAccording to the requirements of the InstVV at least 60 % of the total variable compensation must be granted on a deferredbasis. Not less than half of this deferred portion may comprise equity-based compensation components, while the remainingportion must be granted as deferred cash compensation. Both compensation components must be deferred over a multi-yearperiod which, for the equity-based compensation components, must be followed by a retention period. During the period untilpayment or delivery, the compensation portions awarded on a deferred basis may be forfeited. At least half of the maximumof 40 % of the Variable Compensation granted on a non-deferred basis must consist of equity-based compensationcomponents and only the remaining portion may be paid out directly in cash. Of the total Variable Compensation, no morethan a maximum of 20 % may be paid out in cash immediately, while at least 80 % are paid or delivered at a later date.
Since 2014, the total variable compensation for Management Board members is only granted on a deferred basis.
In order to bind the Management Board members even closer to the performance of the Bank and the Deutsche Bank shareprice, the Supervisory Board decided that as of the 2017 financial year, the long-term component (LTA), and in fact no lessthan 75 % of the total variable compensation, will continue to be granted only in the form of Restricted Equity Awards. Onlythe short-term component (STA), however, a maximum of 25 % of the total variable compensation, is granted in the form ofRestricted Incentive Awards.
The Restricted Incentive Awards vest over a period of four years. The Restricted Equity Awards vest after five years in onetranche (“cliff vesting”) and have an additional retention period of one year. Accordingly, Management Board members arefirst permitted to dispose of the equities after six years. During the deferral and retention period, the value of the RestrictedEquity Awards is linked to the Bank’s share price and is therefore tied to the sustained performance of the Bank. Specific
At least of the variable compensation is grantedequity-based75%

166
Deutsche Bank 1 – Management ReportAnnual Report 2018
forfeiture provisions apply for Restricted Incentive Awards and Restricted Equity Awards during the deferral and retentionperiod.
The following chart shows the time period for the payment or the delivery of the variable compensation components in the fiveconsecutive years following the grant year as well as the period of a possible clawback.
Timeframe for payment or delivery and non-forfeiture for the Management Board
Forfeiture Conditions / ClawbackIn order to create long-term incentives, the Restricted Equity Awards and the Restricted Incentive Awards compensationcomponents are deferred or spread out over several years. Awards may be fully or partially forfeited, for example, due toindividual misconduct (including a breach of regulations) or termination for cause, and also due to a negative Group result orindividual negative contributions to results. In addition, the Awards may be completely forfeited if the statutory or regulatoryminimum requirements for the core capital ratio are not met during this period.
The revision of the InstVV adopted in August 2017 requires that “clawback provisions” are to be agreed with the members ofthe management body (Geschäftsleiter) of significant institutions. Contrary to the forfeiture conditions, this clause allows theSupervisory Board to reclaim already paid out or delivered compensation components in response to specific individualnegative contributions to results made by the Management Board member for up to two years after the expiry of the lastdeferral period. The clawback provision which had already been individually agreed with the Management Board members in2017 is now for the first time applicable to the compensation elements granted in the 2018 performance year.
Limitations in the Event of Exceptional DevelopmentsIn the event of exceptional developments, the total compensation for each Management Board member is limited to amaximum amount. In addition, the Supervisory Board and the members of the Management Board agreed on a possiblelimitation of the variable compensation which is included in the service agreements of the Management Board members andaccording to which the variable compensation may be limited to amounts below the provided maximum amounts or may notbe granted altogether. Furthermore, statutory regulations provide that the Supervisory Board may reduce the compensationof the Management Board members to an appropriate level, if the situation of the company deteriorates in such a way followingthe determination of the compensation that the continued granting of the compensation would be unreasonable for thecompany. A payment of variable compensation elements will also not take place if the payment of Variable Compensationcomponents is prohibited or restricted by the competent regulator in accordance with existing statutory requirements.
RestrictedIncentiveAwards
Awards Grant year
1stsubsequent
year
2ndsubsequent
year
3rdsubsequent
year
4thsubsequent
year
5thsubsequent
year
6thsubsequent
year
7thsubsequent
year
RestrictedEquityAwards
in % 25 25 25 25 100
in % 100100 100
Vesting and/or non fortfeiture, aligned with payment or delivery.Vesting followed by a retention period until delivery; subject to individual fortfeiture conditions during the retention period.End of possibility to demand the return (ʹClawbackʹ) of already paid/delivered compensation components.

167
Deutsche Bank Management Board Compensation ReportAnnual Report 2018 Other Benefits upon Early Termination
Shareholding Guidelines
– Long-term commitment of Management Board members to the Bank– Identification with Deutsche Bank and its shareholders– Link to performance of the Bank through deferred compensation
All members of the Management Board are required to hold a specified value of Deutsche Bank shares. This requirementfosters the identification of the Management Board members with Deutsche Bank and its shareholders and aims to ensure asustainable link to the performance of the Bank.
For the Chairman, the number of shares to be held amounts to two times the annual base salary, i.e., the equivalent of€ 6,800,000. For other Management Board members the number of shares to be held is one time the annual base salary, i.e.,the equivalent of € 2,400,000 or € 3,000,000, respectively.
The share retention obligations must first be fulfilled on the date on which the Management Board member was granted anoverall equity based variable compensation corresponding to 1 ⅓ times the retention obligations since his or her appointmentto the Management Board. Deferred equity-based compensation may be taken into account at 75 % of its value towardsfulfillment of the obligation.
Observance of the requirement is reviewed semi-annually as of June 30 and December 31. If the required number of sharesis not met, the Management Board members must correct any deficiencies by the next review.
As compensation components are deferred or spread out over several years, another link to the performance of the DeutscheBank share is established that should generally continue to exist even for the period after leaving the Management Board.
Pension benefitsThe Supervisory Board allocates an entitlement to pension plan benefits to the Management Board members. Theseentitlements involve a defined contribution pension plan. Under this pension plan, a personal pension account is set up foreach participating member of the Management Board after appointment to the Management Board.
Management Board members receive a contribution in the form of a contractually agreed fixed annual amount in Euro.The contribution accrues interest credited in advance, determined by means of an age-related factor, at an average rateof 4 % per year up to the age of 60. From the age of 61 onwards, an additional contribution in the amount of 4 % peryear of the amount reached on December 31 of the previous year will be credited to the pension account.
The annual contributions, taken together, form the pension amount available to pay the future pension benefit in case of apension event (age limit, disability or death). The pension right is vested from the start.
Other Benefits upon Early TerminationThe Management Board members are in principle entitled to receive a severance payment upon early termination of theirappointment at the Bank’s initiative, provided the Bank is not entitled to revoke the appointment or give notice under thecontractual agreement for cause. The circumstances of the early termination of the appointment and the length of service onthe Management Board are to be taken into account when determining the amount of the severance payment. The severancepayment, as a rule, is two annual compensation amounts and is limited to the claims to compensation for the remaining termof the contract. The calculation of the severance payment is based on the annual compensation for the previous financial yearand on the expected annual compensation for the current financial year, if applicable. The severance payment is determinedand granted in accordance with the statutory and regulatory requirements, in particular with the provisions of the InstVV.
If a Management Board member leaves office in connection with a change of control, he/she is also, under certain conditions,entitled in principle to a severance payment. The exact amount of the severance payment is determined by the SupervisoryBoard within its sole discretion. According to the German Corporate Governance Codex, the severance payment will notexceed three annual compensation amounts and is limited to the claims to compensation for the remaining term of the contract.The calculation of the compensation is again based on the annual compensation for the previous financial year.
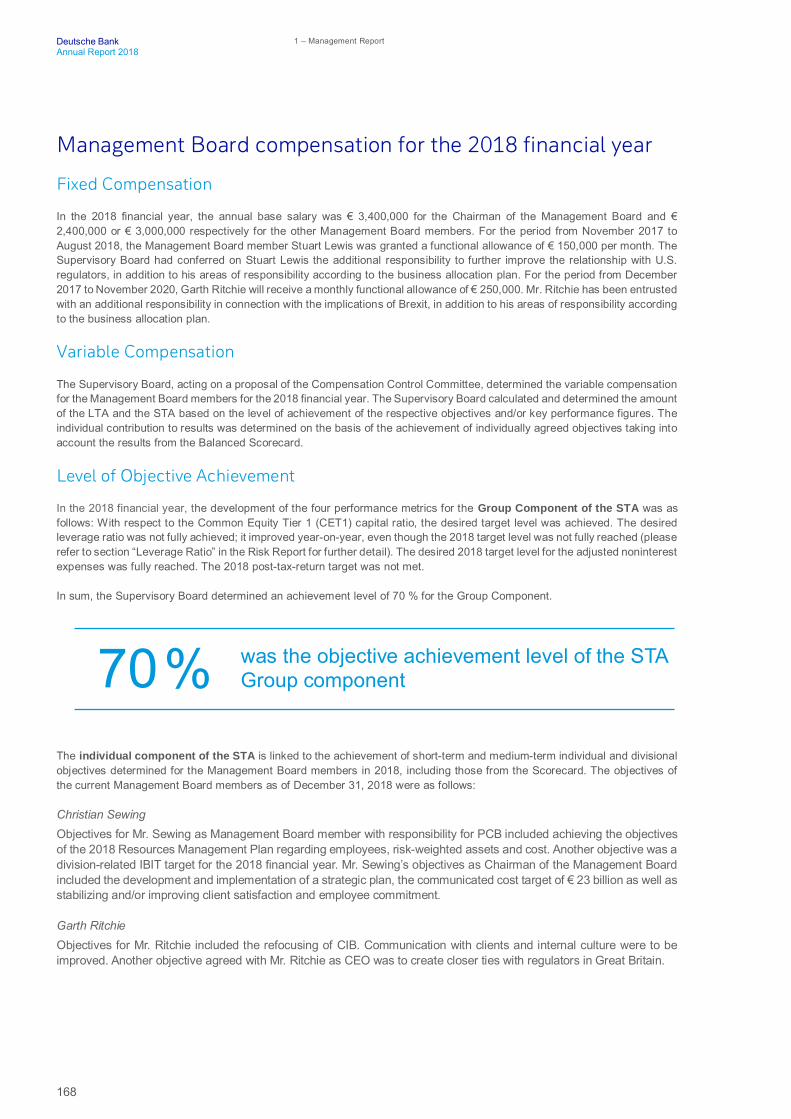
168
Deutsche Bank 1 – Management ReportAnnual Report 2018
Management Board compensation for the 2018 financial year
Fixed Compensation
In the 2018 financial year, the annual base salary was € 3,400,000 for the Chairman of the Management Board and €2,400,000 or € 3,000,000 respectively for the other Management Board members. For the period from November 2017 toAugust 2018, the Management Board member Stuart Lewis was granted a functional allowance of € 150,000 per month. TheSupervisory Board had conferred on Stuart Lewis the additional responsibility to further improve the relationship with U.S.regulators, in addition to his areas of responsibility according to the business allocation plan. For the period from December2017 to November 2020, Garth Ritchie will receive a monthly functional allowance of € 250,000. Mr. Ritchie has been entrustedwith an additional responsibility in connection with the implications of Brexit, in addition to his areas of responsibility accordingto the business allocation plan.
Variable Compensation
The Supervisory Board, acting on a proposal of the Compensation Control Committee, determined the variable compensationfor the Management Board members for the 2018 financial year. The Supervisory Board calculated and determined the amountof the LTA and the STA based on the level of achievement of the respective objectives and/or key performance figures. Theindividual contribution to results was determined on the basis of the achievement of individually agreed objectives taking intoaccount the results from the Balanced Scorecard.
Level of Objective Achievement
In the 2018 financial year, the development of the four performance metrics for the Group Component of the STA was asfollows: With respect to the Common Equity Tier 1 (CET1) capital ratio, the desired target level was achieved. The desiredleverage ratio was not fully achieved; it improved year-on-year, even though the 2018 target level was not fully reached (pleaserefer to section “Leverage Ratio” in the Risk Report for further detail). The desired 2018 target level for the adjusted noninterestexpenses was fully reached. The 2018 post-tax-return target was not met.
In sum, the Supervisory Board determined an achievement level of 70 % for the Group Component.
The individual component of the STA is linked to the achievement of short-term and medium-term individual and divisionalobjectives determined for the Management Board members in 2018, including those from the Scorecard. The objectives ofthe current Management Board members as of December 31, 2018 were as follows:
Christian SewingObjectives for Mr. Sewing as Management Board member with responsibility for PCB included achieving the objectivesof the 2018 Resources Management Plan regarding employees, risk-weighted assets and cost. Another objective was adivision-related IBIT target for the 2018 financial year. Mr. Sewing’s objectives as Chairman of the Management Boardincluded the development and implementation of a strategic plan, the communicated cost target of € 23 billion as well asstabilizing and/or improving client satisfaction and employee commitment.
Garth RitchieObjectives for Mr. Ritchie included the refocusing of CIB. Communication with clients and internal culture were to beimproved. Another objective agreed with Mr. Ritchie as CEO was to create closer ties with regulators in Great Britain.
was the objective achievement level of the STAGroup component70%

169
Deutsche Bank Management Board Compensation ReportAnnual Report 2018 Management Board compensation for the 2018 financial year
Karl von RohrOne of the objectives for Mr. von Rohr was to implement the merger of Postbank AG into Deutsche Bank Privat- undGeschäftskunden AG with respect to legal and HR matters. Mr. von Rohr also had the delivery of the DWS IPO as wellas the creation of corporate governance structures at DWS supervisory board level as objectives. The number of pendinglegal disputes – focusing on the matters posing the highest risk – was to be further reduced. In addition, cost targetswere agreed with Mr. von Rohr for his area of responsibility.
Stuart LewisOne objective for Mr. Lewis was to streamline the risk organization by transferring non-risk-initiatives to more appropriateareas. Another objective was to improve focus and co-operation with Finance. Finally, Mr. Lewis pursued the objectiveof immediately remediating supervisory findings.
Sylvie MatheratIn her responsibility for the Chief Regulatory Office, Ms. Matherat was mandated to further strengthen the bank’s controlenvironment in 2018. For Compliance, she was tasked with the enhancement of Surveillance, which included an effectivenessreview and development of scenarios in Trade Surveillance, expansion of e-Communication Surveillance and automation in VoiceSurveillance. In addition, she was to implement the requirements of the Fourth Anti Money Laundering Directive (4AMLD) in ourAnti-Financial Crime (AFC) policies and roll out the framework for the investigation of financial crime. The third objective agreedwith Ms. Matherat was to improve the monitoring of financial transactions. Finally, the strengthening and enhancement of costmanagement was an objective agreed with Ms. Matherat.
James von MoltkeObjectives for Mr. von Moltke included the design and roll-out of the strategic “Cost Catalyst” program which aims toidentify and eliminate structural cost inefficiencies, improve our cost culture and contribute to achieving Deutsche Bank’snear-term operating performance targets. Further objectives related to enhancing the Bank’s liquidity reporting andmanagement capabilities and executing on organizational enhancements in line with the priorities of the Financeorganization.
Nicolas MoreauObjectives for Mr. Moreau included generating net inflows and achieving a solid investment performance. Furtherobjectives were the implementation of cost reductions and improving cost efficiency. Performance criteria for the objectiveto create a performance culture in DWS were increasing the percentage of women in management positions andimproving employee commitment.
Werner SteinmüllerFor the financial year 2018, a revenue target relating to Asia Pacific, the region for which Mr. Steinmüller is accountable,and a cost objective were agreed with Mr. Steinmüller. An additional franchise target was agreed to strengthen andexpand Governance, control environment and the Deutsche Bank brand in the region.
Frank StraußMr. Strauß had to achieve an IBIT and a revenue target for the Private & Commercial Clients division. The establishmentof “The Bank for Germany” was another objective. A further objective was the 2018 Resources Management Planregarding employees, risk-weighted assets and cost. Finally, Mr. Strauß was to roll out a digital banking platform.
The individual level of achievement of the Management Board members who were in office for the entire year in 2018 isbetween 80 % and 154 %.
was the objective achievement level of theSTA individual component80 % -154 %

170
Deutsche Bank 1 – Management ReportAnnual Report 2018
In the 2018 financial year, the development of the three performance metrics for the Group Component of the LTA was asfollows: Although the RTSR improved year-on-year, the average performance in the relevant three-year-period (2016 to 2018)was 73.6 % and as a result was below the performance of the peer group; this resulted in an achievement level of 42 %.Organic Capital Growth as defined developed negatively from 2016 to 2018; the resulting achievement level was 0 %. Thestrengthening of the control environment was evaluated based on feedback from internal audit and supervisory authoritiesand has improved again in 2018; the achievement level was 81 %. As a result of these factors, the overall achievement levelresolved by the Supervisory Board is 41 %.
Total Compensation
The members of the Management Board collectively received in/for the 2018 financial year compensation (without fringebenefits and pension service costs) totaling € 55,716,289 (2017: € 29,750,000). € 29,911,111 of this amount was for fixedcompensation (2017: € 29,750,000). € 25,805,178 (2017: € 0) was received for performance-related components with long-term incentives.
The Supervisory Board determined the aforementioned compensation on an individual basis for 2018 and 2017 as follows:
2018 2017Base
salaryFunctionalallowance STA¹ LTA²
Totalcompensation
Totalcompensation
in €Group
componentIndividual
componentChristian Sewing 3,291,111 0 350,000 2,035,931 1,327,037 7,004,079 2,900,000Garth Ritchie 3,000,000 3,000,000 350,000 1,120,000 1,148,003 8,618,003 3,250,000Karl von Rohr 2,836,667 0 350,000 1,200,000 1,148,003 5,534,670 2,400,000Stuart Lewis 2,400,000 1,200,000 350,000 1,000,000 1,148,003 6,098,003 2,700,000Sylvie Matherat 2,400,000 0 350,000 640,000 1,148,003 4,538,003 2,400,000James von Moltke3 2,400,000 0 350,000 1,200,000 1,148,003 5,098,003 1,200,000Nicolas Moreau4 1,200,000 0 175,000 520,000 574,001 2,469,001 2,400,000Werner Steinmüller 2,400,000 0 350,000 880,000 1,148,003 4,778,003 2,400,000Frank Strauß5 2,400,000 0 350,000 1,669,600 1,148,003 5,567,603 800,000John Cryan6 1,133,333 0 116,667 175,000 464,668 1,889,668 3,400,000Kimberly Hammonds7 1,000,000 0 145,833 200,000 478,335 1,824,168 2,400,000Dr. Marcus Schenck8 1,250,000 0 145,833 422,917 478,335 2,297,085 2,900,000Jeffrey Urwin9 0 0 0 0 0 0 600,000Total 25,711,111 4,200,000 3,383,333 11,063,448 11,358,397 55,716,289 29,750,0001 STA: Short-Term Award.2 LTA: Long-Term Award.3 Member since July 1, 2017.4 Member until December 31, 2018. In his position as managing director of DWS Management GmbH a total compensation of € 2,916,667 was determined for 2018.5 Member since September 1, 2017.6 Member until April 8, 2018.7 Member until May 24, 2018.8 Member until May 24, 2018.9 Member until March 31, 2017.
The table above does not include any compensation elements granted to a member of the Management Board as areplacement for components of compensation that have been forfeited at the previous employer. These are shown in thetables in accordance with the German Corporate Governance Code and DRS 17.
was the LTA objective achievement level41%
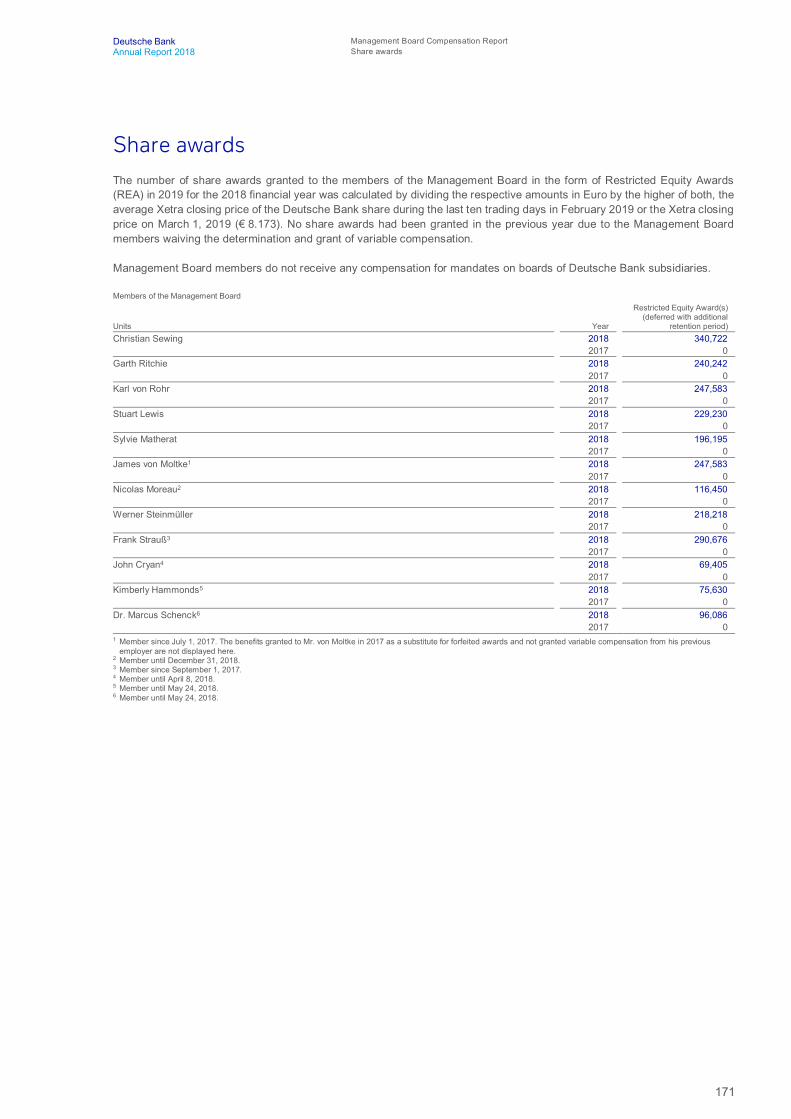
171
Deutsche Bank Management Board Compensation ReportAnnual Report 2018 Share awards
Share awardsThe number of share awards granted to the members of the Management Board in the form of Restricted Equity Awards(REA) in 2019 for the 2018 financial year was calculated by dividing the respective amounts in Euro by the higher of both, theaverage Xetra closing price of the Deutsche Bank share during the last ten trading days in February 2019 or the Xetra closingprice on March 1, 2019 (€ 8.173). No share awards had been granted in the previous year due to the Management Boardmembers waiving the determination and grant of variable compensation.
Management Board members do not receive any compensation for mandates on boards of Deutsche Bank subsidiaries.
Members of the Management Board
Units Year
Restricted Equity Award(s)(deferred with additional
retention period)Christian Sewing 2018 340,722
2017 0Garth Ritchie 2018 240,242
2017 0Karl von Rohr 2018 247,583
2017 0Stuart Lewis 2018 229,230
2017 0Sylvie Matherat 2018 196,195
2017 0James von Moltke1 2018 247,583
2017 0Nicolas Moreau2 2018 116,450
2017 0Werner Steinmüller 2018 218,218
2017 0Frank Strauß3 2018 290,676
2017 0John Cryan4 2018 69,405
2017 0Kimberly Hammonds5 2018 75,630
2017 0Dr. Marcus Schenck6 2018 96,086
2017 01 Member since July 1, 2017. The benefits granted to Mr. von Moltke in 2017 as a substitute for forfeited awards and not granted variable compensation from his previous
employer are not displayed here.2 Member until December 31, 2018.3 Member since September 1, 2017.4 Member until April 8, 2018.5 Member until May 24, 2018.6 Member until May 24, 2018.

172
Deutsche Bank 1 – Management ReportAnnual Report 2018
Management Board Share Ownership, Shareholding Guidelines
As of February 15, 2019 and February 16, 2018, respectively, the current members of the Management Board held DeutscheBank shares as presented below:
Members of the Management BoardNumber of
sharesChristian Sewing 2019 73,237
2018 54,356Garth Ritchie 2019 84,738
2018 43,227Karl von Rohr 2019 5,601
2018 5,601Frank Kuhnke1 2019 7,094Stuart Lewis 2019 103,561
2018 88,292Sylvie Matherat 2019 0
2018 0James von Moltke2 2019 24,967
2018 0Werner Steinmüller 2019 146,905
2018 119,688Frank Strauß3 2019 10,772
2018 7,172Total 2019 456,875
2018 318,3361 Member since January 1, 2019.2 Member since July 1, 2017.3 Member since September 1, 2017.
The current members of the Management Board held an aggregate of 456,875 Deutsche Bank shares on February 15, 2019,amounting to approximately 0.02 % of Deutsche Bank shares issued on that date.
The following table shows the number of share awards held by the Management Board members as of February 16, 2018and February 15, 2019 as well as the number of share awards newly granted, delivered or forfeited in this period.
Members of the Management BoardBalance as ofFeb 16, 2018 Granted Delivered Forfeited
Balance as ofFeb 15, 2019
Christian Sewing 96,821 684 35,824 0 61,681Garth Ritchie 618,736 2,242 76,424 0 544,554Karl von Rohr 49,206 551 0 0 49,757Frank Kuhnke1 – – – – 104,507Stuart Lewis 160,498 1,474 28,916 0 133,056Sylvie Matherat 12,181 137 0 0 12,318James von Moltke2 194,142 0 47,535 0 146,607Werner Steinmüller 220,821 1,894 51,836 0 170,878Frank Strauß3 46,983 20,019 6,857 0 60,1441 Member since January 1, 2019.2 Member since July 1, 2017.3 Member since September 1, 2017.
One Management Board member did not fulfill the retention obligation as of December 31, or else was unable to meet thisobligation in time for that date, due to purchasing restrictions. At the time of this report, however, the obligation has beenfulfilled. The remaining Management Board members fulfilled the retention obligations for shares in 2018 or are currently inthe waiting period.

173
Deutsche Bank Management Board Compensation ReportAnnual Report 2018 Share awards
Pension Benefits
The following table shows the annual contributions, the interest credits, the account balances and the annual servicecosts for the years 2018 and 2017 as well as the corresponding defined benefit obligations for each member of theManagement Board in office in 2018 as of December 31, 2018 and December 31, 2017. The different balances areattributable to the different lengths of service on the Management Board, the respective age-related factors, and thedifferent contribution rates, as well as the individual pensionable compensation amounts and the previously mentionedadditional individual entitlements.
Members of theManagement Board
Annual contribution,in the year
Interest credit,in the year
Account balance,end of year
Service cost (IFRS),in the year
Present value of thedefined benefit
obligation (IFRS),end of year
in € 2018 2017 2018 2017 2018 2017 2018 2017 2018 2017Christian Sewing 1,007,500 1,046,500 0 0 3,831,500 2,824,000 879,750 899,307 3,366,182 2,450,830Garth Ritchie 1,440,000 1,500,000 0 0 4,490,000 3,050,000 1,274,429 1,306,915 4,026,939 2,704,127Karl von Rohr 845,000 871,000 0 0 2,368,001 1,523,001 796,009 807,465 2,249,165 1,434,564Stuart Lewis 845,000 871,000 0 0 4,058,938 3,213,938 796,009 807,465 4,236,867 3,377,866Sylvie Matherat 754,000 786,500 0 0 2,127,168 1,373,168 755,261 774,917 2,125,681 1,354,995James von Moltke1 975,000 503,750 0 0 1,478,750 503,750 864,990 451,453 1,334,670 463,619Nicolas Moreau2 0 1,340,000 0 0 07 1,687,500 607,093 1,232,878 0 1,591,229Werner Steinmüller 650,000 650,000 32,934 6,667 1,506,268 823,334 688,942 701,617 1,542,860 907,793Frank Strauß3 1,007,500 348,834 0 0 1,356,334 348,834 876,266 313,391 1,202,739 321,839John Cryan4 0 728,000 0 0 08 1,875,250 733,807 748,829 0 1,916,940KimberlyHammonds5 0 936,000 0 0 09 1,186,001 825,100 842,110 0 1,091,041
Dr. Marcus Schenck6 541,668 1,105,000 0 0 2,731,169 2,189,501 504,568 1,018,267 2,553,842 2,051,0901 Member since July 1, 2017.2 Member until December 31, 2018. In his position as managing director of DWS Management GmbH a service cost amount of € 607,093 was determined for 2018.3 Member since September 1, 2017.4 Member until April 8, 2018.5 Member until May 24, 2018.6 Member until May 24, 2018.7 The pension entitlement was not vested at the time of the termination of the Management Board membership and was paid in form of a cash compensation in the amount of
€ 2,084,667 and in the amount of € 579,694 for the DWS Management GmbH.8 The pension entitlement was not vested at the time of the termination of the Management Board membership and was paid in form of a cash compensation in the amount of
€ 3,420,961.9 The pension entitlement was not vested at the time of the termination of the Management Board membership and was paid in form of a cash compensation in the amount of
€ 2,231,933.
Other Benefits upon Early Termination
In 2018, the Management Board members John Cryan, Kimberly Hammonds, Marcus Schenck and Nicolas Moreau leftthe Management Board. Termination payments to which they were entitled based on their employment contract wereagreed with these members as follows:
John Cryan left the Management Board with effect from the end of April 8, 2018. On the basis of the terminationagreement, compensation payments for a post-contractual restraint on competition already agreed in the employmentcontract in the amount of € 2,210,000 and a severance payment in the amount of € 8,674,000 were agreed. Of theseverance, the first instalment in the amount of € 1,071,800 was disbursed in cash in May 2018. The second instalmentin the amount of € 1,071,800 was granted in shares and becomes due for disbursement on April 30, 2019. A furtherinstalment in the amount of € 3,265,200 was granted in the form of deferred cash compensation with a settlement periodending April 30, 2023. A final instalment in the amount of € 3,265,200 was granted in the form of deferred share-basedcompensation with a settlement period ending April 30, 2024. All contractually agreed provisions with respect to variablecompensation elements apply accordingly to the severance payment, including the option to reclaim any variablecompensation (clawback), and the severance payment is subject to a regulation for the offsetting of income receivedfrom other sources.

174
Deutsche Bank 1 – Management ReportAnnual Report 2018
Kimberly Hammonds left the Management Board with effect from the end of May 24, 2018. On the basis of the terminationagreement, compensation payments for a post-contractual restraint on competition already agreed in the employmentcontract in the amount of € 1,560,000 and a severance payment in the amount of € 3,303,834 were agreed. Of theseverance, the first instalment in the amount of € 192,767 was disbursed in cash in May 2018. A second instalment inthe amount of € 192,767 was granted in the form of shares and becomes due for disbursement on May 31, 2019. Afurther instalment in the amount of € 1,459,150 was granted in the form of deferred cash compensation with a settlementperiod ending May 31, 2023. A final instalment in the amount of € 1,459,150 was granted in the form of deferred share-based compensation with a settlement period ending May 31, 2024. All contractually agreed provisions with respect tovariable compensation elements apply accordingly to the severance payment, including the option to reclaim any variablecompensation (clawback), and the severance payment is subject to a regulation for the offsetting of income receivedfrom other sources. The contractually, but not legally vested present value of the pension account in the company pensionplan at the time of Mrs. Hammond’s termination of the Management Board membership has been disbursed to her.
Marcus Schenck left the Management Board with effect from the end of May 24, 2018. On the basis of the terminationagreement, compensation payments for a post-contractual restraint on competition were agreed in the aggregate amountof € 1,950,000, payable in 12 monthly instalments. Marcus Schenck informed the bank that he has taken up a newposition as of February 1, 2019. Therefore, the payments ceased from this date onwards. No further severance paymentwas agreed.
Nicolas Moreau left the Management Board with effect from the end of December 31, 2018. On the basis of thetermination agreement, compensation payments for a post-contractual restraint on competition agreed in theemployment contract in the amount of € 960,000 and a severance payment in the amount of € 807,600 were agreed. Ofthe severance, the first instalment in the amount of € 403,800 was granted in the form of deferred cash compensationwith a settlement period ending March 1, 2024. A second instalment in the amount of € 403,800 was granted as share-based compensation with a settlement period ending March 1, 2025. All contractually agreed provisions with respect tovariable compensation elements apply accordingly to the severance payment, including the option to reclaim any variablecompensation (clawback). Furthermore, the termination of the employment relationship between DWS ManagementGmbH and Nicolas Moreau as managing director of the GmbH was agreed. Based on this termination agreement, aseverance payment in the amount of € 7,000,000 was agreed. The first instalment in the amount of € 1,400,000 wasdisbursed in cash in December 2018. The second instalment in the same amount was granted in shares and becomesdue for disbursement on March 1, 2020. A further instalment in the amount of € 2,100,000 was granted in the form ofdeferred cash compensation with a settlement period ending March 1, 2024. A final instalment in the amount of€ 2,100,000 was granted in the form of deferred share-based compensation with a settlement period ending March 1,2025.
Expense for Long-Term Incentive Components
The following table presents the compensation expense recognized in the respective years for long-term incentivecomponents of compensation granted for service on the Management Board.
Members of the Management Board Amount expensed forShare-based compensation
componentsCash-based compensation
componentsin € 2018 2017 2018 2017James von Moltke¹ 225,845 0 630,407 671,148Stuart Lewis (393,743)2 955,633 57,414 230,9741 Member since July 1 2017.2 Share-based compensation of Management Board members is generally valued based on the share price at each respective reporting date and leads to a negative result in
this instance.

175
Deutsche Bank Management Board Compensation ReportAnnual Report 2018 Compensation in accordance with the German Corporate Governance Code (GCGC)
Compensation in accordance with the German CorporateGovernance Code (GCGC)The compensation for the members of the Management Board in accordance with the requirements of section 4.2.5paragraph 3 of the GCGC is provided below. This comprises the benefits granted for the year under review including the fringebenefits and including the maximum and minimum achievable compensation for variable compensation components. Inaddition, the disbursals of fixed compensation and variable compensation (broken down by Restricted Incentive Awards andRestricted Equity Awards) in/for the year under review, broken down into the relevant reference years are reported.
The following table provides the compensation granted for the 2018 and 2017 financial years according to GCGC:Christian Sewing
2018 2017in € Determined Target Min Max Determined TargetFixed compensation (base salary) 3,291,111 3,291,111 3,291,111 3,291,111 2,900,000 2,900,000Functional allowance 0 0 0 0 0 0Fringe benefits (fixed compensation) 91,805 91,805 91,805 91,805 80,307 80,307Total 3,382,916 3,382,916 3,382,916 3,382,916 2,980,307 2,980,307Variable compensation 3,712,968 5,055,000 0 8,491,667 0 4,400,000
thereof:Restricted Incentive Awards 928,242 1,818,333 0 3,636,666 0 1,600,000Restricted Equity Awards 2,784,726 3,236,667 0 4,855,001 0 2,800,000
Fringe benefits (variable compensation) 0 0 0 0 0 0Total 3,712,968 5,055,000 0 8,491,667 0 4,400,000Pension service costs 879,750 879,750 879,750 879,750 899,307 899,307Total compensation (GCGC) 7,975,634 9,317,666 4,262,666 12,754,333 3,879,614 8,279,614Total compensation¹ 7,004,079 8,346,111 3,291,111 11,782,778 2,900,000 7,300,0001 Without fringe benefits and pension service costs.
Garth Ritchie2018 2017
in € Determined Target Min Max Determined TargetFixed compensation (base salary) 3,000,000 3,000,000 3,000,000 3,000,000 3,000,000 3,000,000Functional allowance 3,000,000 3,000,000 3,000,000 3,000,000 250,000 250,000Fringe benefits (fixed compensation) 189,609 189,609 189,609 189,609 269,457 269,457Total 6,189,609 6,189,609 6,189,609 6,189,609 3,519,457 3,519,457Variable compensation 2,618,003 4,700,000 0 8,000,000 0 4,700,000
thereof:Restricted Incentive Awards 654,500 1,900,000 0 3,800,000 0 1,900,000Restricted Equity Awards 1,963,503 2,800,000 0 4,200,000 0 2,800,000
Fringe benefits (variable compensation) 0 0 0 0 0 0Total 2,618,003 4,700,000 0 8,000,000 0 4,700,000Pension service costs 1,274,429 1,274,429 1,274,429 1,274,429 1,306,915 1,306,915Total compensation (GCGC) 10,082,041 12,164,038 7,464,038 15,464,038 4,826,372 9,526,372Total compensation1 8,618,003 10,700,000 6,000,000 14,000,000 3,250,000 7,950,0001 Without fringe benefits and pension service costs.
Karl von Rohr2018 2017
in € Determined Target Min Max Determined TargetFixed compensation (base salary) 2,836,667 2,836,667 2,836,667 2,836,667 2,400,000 2,400,000Fringe benefits (fixed compensation) 49,853 49,853 49,853 49,853 23,642 23,642Total 2,886,520 2,886,520 2,886,520 2,886,520 2,423,642 2,423,642Variable compensation 2,698,003 4,100,000 0 6,800,000 0 4,100,000
thereof:Restricted Incentive Awards 674,500 1,300,000 0 2,600,000 0 1,300,000Restricted Equity Awards 2,023,503 2,800,000 0 4,200,000 0 2,800,000
Fringe benefits (variable compensation) 0 0 0 0 0 0Total 2,698,003 4,100,000 0 6,800,000 0 4,100,000Pension service costs 796,009 796,009 796,009 796,009 807,465 807,465Total compensation (GCGC) 6,380,532 7,782,529 3,682,529 10,482,529 3,231,107 7,331,107Total compensation¹ 5,534,670 6,936,667 2,836,667 9,636,667 2,400,000 6,500,0001 Without fringe benefits and pension service costs.
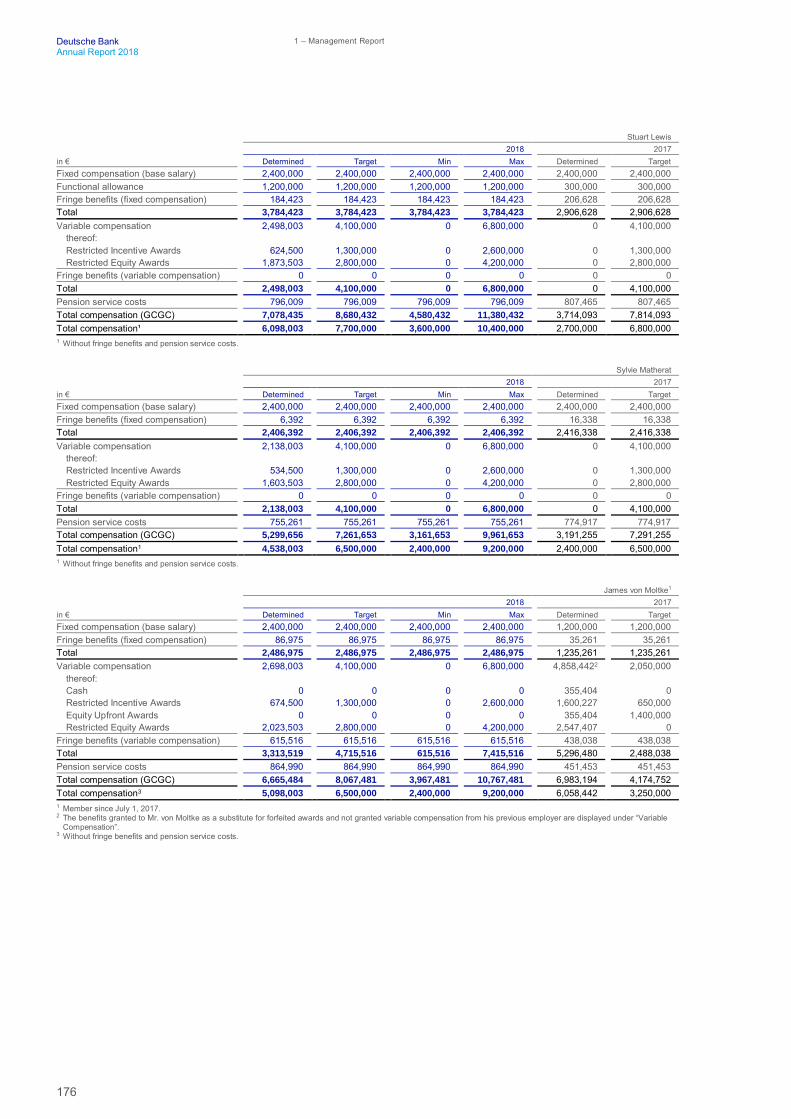
176
Deutsche Bank 1 – Management ReportAnnual Report 2018
Stuart Lewis2018 2017
in € Determined Target Min Max Determined TargetFixed compensation (base salary) 2,400,000 2,400,000 2,400,000 2,400,000 2,400,000 2,400,000Functional allowance 1,200,000 1,200,000 1,200,000 1,200,000 300,000 300,000Fringe benefits (fixed compensation) 184,423 184,423 184,423 184,423 206,628 206,628Total 3,784,423 3,784,423 3,784,423 3,784,423 2,906,628 2,906,628Variable compensation 2,498,003 4,100,000 0 6,800,000 0 4,100,000
thereof:Restricted Incentive Awards 624,500 1,300,000 0 2,600,000 0 1,300,000Restricted Equity Awards 1,873,503 2,800,000 0 4,200,000 0 2,800,000
Fringe benefits (variable compensation) 0 0 0 0 0 0Total 2,498,003 4,100,000 0 6,800,000 0 4,100,000Pension service costs 796,009 796,009 796,009 796,009 807,465 807,465Total compensation (GCGC) 7,078,435 8,680,432 4,580,432 11,380,432 3,714,093 7,814,093Total compensation¹ 6,098,003 7,700,000 3,600,000 10,400,000 2,700,000 6,800,0001 Without fringe benefits and pension service costs.
Sylvie Matherat2018 2017
in € Determined Target Min Max Determined TargetFixed compensation (base salary) 2,400,000 2,400,000 2,400,000 2,400,000 2,400,000 2,400,000Fringe benefits (fixed compensation) 6,392 6,392 6,392 6,392 16,338 16,338Total 2,406,392 2,406,392 2,406,392 2,406,392 2,416,338 2,416,338Variable compensation 2,138,003 4,100,000 0 6,800,000 0 4,100,000
thereof:Restricted Incentive Awards 534,500 1,300,000 0 2,600,000 0 1,300,000Restricted Equity Awards 1,603,503 2,800,000 0 4,200,000 0 2,800,000
Fringe benefits (variable compensation) 0 0 0 0 0 0Total 2,138,003 4,100,000 0 6,800,000 0 4,100,000Pension service costs 755,261 755,261 755,261 755,261 774,917 774,917Total compensation (GCGC) 5,299,656 7,261,653 3,161,653 9,961,653 3,191,255 7,291,255Total compensation1 4,538,003 6,500,000 2,400,000 9,200,000 2,400,000 6,500,0001 Without fringe benefits and pension service costs.
James von Moltke1
2018 2017in € Determined Target Min Max Determined TargetFixed compensation (base salary) 2,400,000 2,400,000 2,400,000 2,400,000 1,200,000 1,200,000Fringe benefits (fixed compensation) 86,975 86,975 86,975 86,975 35,261 35,261Total 2,486,975 2,486,975 2,486,975 2,486,975 1,235,261 1,235,261Variable compensation 2,698,003 4,100,000 0 6,800,000 4,858,4422 2,050,000
thereof:Cash 0 0 0 0 355,404 0Restricted Incentive Awards 674,500 1,300,000 0 2,600,000 1,600,227 650,000Equity Upfront Awards 0 0 0 0 355,404 1,400,000Restricted Equity Awards 2,023,503 2,800,000 0 4,200,000 2,547,407 0
Fringe benefits (variable compensation) 615,516 615,516 615,516 615,516 438,038 438,038Total 3,313,519 4,715,516 615,516 7,415,516 5,296,480 2,488,038Pension service costs 864,990 864,990 864,990 864,990 451,453 451,453Total compensation (GCGC) 6,665,484 8,067,481 3,967,481 10,767,481 6,983,194 4,174,752Total compensation3 5,098,003 6,500,000 2,400,000 9,200,000 6,058,442 3,250,0001 Member since July 1, 2017.2 The benefits granted to Mr. von Moltke as a substitute for forfeited awards and not granted variable compensation from his previous employer are displayed under “Variable
Compensation”.3 Without fringe benefits and pension service costs.

177
Deutsche Bank Management Board Compensation ReportAnnual Report 2018 Compensation in accordance with the German Corporate Governance Code (GCGC)
Nicolas Moreau1
2018 2017in € Determined Target Min Max Determined TargetFixed compensation (base salary) 1,200,000 1,200,000 1,200,000 1,200,000 2,400,000 2,400,000Fringe benefits (fixed compensation) 129,407 129,407 129,407 129,407 59,383 59,383Total 1,329,407 1,329,407 1,329,407 1,329,407 2,459,383 2,459,383Variable compensation 1,269,001 2,300,000 0 3,900,000 0 4,600,000
thereof:Restricted Incentive Awards 317,250 900,000 0 1,800,000 0 1,800,000Restricted Equity Awards 951,751 1,400,000 0 2,100,000 0 2,800,000
Fringe benefits (variable compensation) 0 0 0 0 0 0Total 1,269,001 2,300,000 0 3,900,000 0 4,600,000Pension service costs 607,093 607,093 607,093 607,093 1,232,878 1,232,878Total compensation (GCGC) 3,205,501 4,236,500 1,936,500 5,836,500 3,692,261 8,292,261Total compensation2 2,469,001 3,500,000 1,200,000 5,100,000 2,400,000 7,000,0001 Member until December 31, 2018. In his position as managing director of DWS Management GmbH a total compensation (GCGC) of € 3,523,792 was determined for 2018.2 Without fringe benefits and pension service costs.
Werner Steinmüller2018 2017
in € Determined Target Min Max Determined TargetFixed compensation (base salary) 2,400,000 2,400,000 2,400,000 2,400,000 2,400,000 2,400,000Fringe benefits (fixed compensation) 76,993 76,993 76,993 76,993 82,934 82,934Total 2,476,993 2,476,993 2,476,993 2,476,993 2,482,934 2,482,934Variable compensation 2,378,003 4,100,000 0 6,800,000 0 4,100,000
thereof:Restricted Incentive Awards 594,500 1,300,000 0 2,600,000 0 1,300,000Restricted Equity Awards 1,783,503 2,800,000 0 4,200,000 0 2,800,000
Fringe benefits (variable compensation) 387,196 387,196 387,196 387,196 316,490 316,490Total 2,765,199 4,487,196 387,196 7,187,196 316,490 4,416,490Pension service costs 688,942 688,942 688,942 688,942 701,617 701,617Total compensation (GCGC) 5,931,134 7,653,131 3,553,131 10,353,131 3,501,041 7,601,041Total compensation1 4,778,003 6,500,000 2,400,000 9,200,000 2,400,000 6,500,0001 Without fringe benefits and pension service costs.
Frank Strauß1
2018 2017in € Determined Target Min Max Determined TargetFixed compensation (base salary) 2,400,000 2,400,000 2,400,000 2,400,000 800,000 800,000Fringe benefits (fixed compensation) 71,892 71,892 71,892 71,892 26,893 26,893Total 2,471,892 2,471,892 2,471,892 2,471,892 826,893 826,893Variable compensation 3,167,603 4,400,000 0 7,400,000 0 1,466,667
thereof:Restricted Incentive Awards 791,900 1,600,000 0 3,200,000 0 533,333Restricted Equity Awards 2,375,703 2,800,000 0 4,200,000 0 933,333
Fringe benefits (variable compensation) 0 0 0 0 0 0Total 3,167,603 4,400,000 0 7,400,000 0 1,466,667Pension service costs 876,266 876,266 876,266 876,266 313,391 313,391Total compensation (GCGC) 6,515,761 7,748,158 3,348,158 10,748,158 1,140,284 2,606,951Total compensation2 5,567,603 6,800,000 2,400,000 9,800,000 800,000 2,266,6671 Member since September 1, 2017.2 Without fringe benefits and pension service costs.
John Cryan1
2018 2017in € Determined Target Min Max Determined TargetFixed compensation (base salary) 1,133,333 1,133,333 1,133,333 1,133,333 3,400,000 3,400,000Fringe benefits (fixed compensation) 10,125 10,125 10,125 10,125 220,982 220,982Total 1,143,458 1,143,458 1,143,458 1,143,458 3,620,982 3,620,982Variable compensation 756,335 1,766,666 0 2,966,666 0 5,300,000
thereof:Restricted Incentive Awards 189,083 633,333 0 1,266,666 0 1,900,000Restricted Equity Awards 567,252 1,133,333 0 1,700,000 0 3,400,000
Fringe benefits (variable compensation) 0 0 0 0 0 0Total 756,335 1,766,666 0 2,966,666 0 5,300,000Pension service costs 733,807 733,807 733,807 733,807 748,829 748,829Total compensation (GCGC) 2,633,600 3,643,931 1,877,265 4,843,931 4,369,811 9,669,811Total compensation2 1,889,668 2,899,999 1,133,333 4,099,999 3,400,000 8,700,0001 Member until April 8, 2018.2 Without fringe benefits and pension service costs.

178
Deutsche Bank 1 – Management ReportAnnual Report 2018
Kimberly Hammonds1
2018 2017in € Determined Target Min Max Determined TargetFixed compensation (base salary) 1,000,000 1,000,000 1,000,000 1,000,000 2,400,000 2,400,000Fringe benefits (fixed compensation) 209,799 209,799 209,799 209,799 260,489 260,489Total 1,209,799 1,209,799 1,209,799 1,209,799 2,660,489 2,660,489Variable compensation 824,168 1,708,334 0 2,833,335 0 4,100,000
thereof:Restricted Incentive Awards 206,042 541,667 0 1,083,334 0 1,300,000Restricted Equity Awards 618,126 1,166,667 0 1,750,001 0 2,800,000
Fringe benefits (variable compensation) 0 0 0 0 0 0Total 824,168 1,708,334 0 2,833,335 0 4,100,000Pension service costs 825,100 825,100 825,100 825,100 842,110 842,110Total compensation (GCGC) 2,859,067 3,743,233 2,034,899 4,868,234 3,502,599 7,602,599Total compensation2 1,824,168 2,708,334 1,000,000 3,833,335 2,400,000 6,500,0001 Member until May 24, 2018.2 Without fringe benefits and pension service costs.
Dr. Marcus Schenck1
2018 2017in € Determined Target Min Max Determined TargetFixed compensation (base salary) 1,250,000 1,250,000 1,250,000 1,250,000 2,900,000 2,900,000Fringe benefits (fixed compensation) 13,117 13,117 13,117 13,117 16,148 16,148Total 1,263,117 1,263,117 1,263,117 1,263,117 2,916,148 2,916,148Variable compensation 1,047,085 1,958,334 0 3,333,335 0 4,400,000
thereof:Restricted Incentive Awards 261,771 791,667 0 1,583,334 0 1,600,000Restricted Equity Awards 785,314 1,166,667 0 1,750,001 0 2,800,000
Fringe benefits (variable compensation) 0 0 0 0 0 0Total 1,047,085 1,958,334 0 3,333,335 0 4,400,000Pension service costs 504,568 504,568 504,568 504,568 1,018,267 1,018,267Total compensation (GCGC) 2,814,770 3,726,019 1,767,685 5,101,020 3,934,415 8,334,415Total compensation2 2,297,085 3,208,334 1,250,000 4,583,335 2,900,000 7,300,0001 Member until May 24, 2018.2 Without fringe benefits and pension service costs.
Jeffrey Urwin1
2018 2017in € Determined Target Min Max Determined TargetFixed compensation (base salary) 0 0 0 0 600,000 600,000Fringe benefits (fixed compensation) 0 0 0 0 530 530Total 0 0 0 0 600,530 600,530Variable compensation 0 0 0 0 0 0
thereof:Restricted Incentive Awards 0 0 0 0 0 0Restricted Equity Awards 0 0 0 0 0 0
Fringe benefits (variable compensation) 0 0 0 0 0 0Total 0 0 0 0 0 0Pension service costs 0 0 0 0 557,370 557,370Total compensation (GCGC) 0 0 0 0 1,157,900 1,157,900Total compensation2 0 0 0 0 600,000 600,0001 Member until March 31, 2017.2 Without fringe benefits and pension service costs.

179
Deutsche Bank Management Board Compensation ReportAnnual Report 2018 Compensation in accordance with the German Corporate Governance Code (GCGC)
The following table provides the compensation disbursals in/for the 2018 and 2017 financial years according to GCGCChristian Sewing Garth Ritchie Karl von Rohr Stuart Lewis
in € 2018 2017 2018 2017 2018 2017 2018 2017Fixed compensation 3,291,111 2,900,000 3,000,000 3,000,000 2,836,667 2,400,000 2,400,000 2,400,000Functional allowance 0 0 3,000,000 250,000 0 0 1,200,000 300,000Fringe benefits (fixed compensation) 91,805 80,307 189,609 269,457 49,853 23,642 184,423 206,628Total 3,382,916 2,980,307 6,189,609 3,519,457 2,886,520 2,423,642 3,784,423 2,906,628Variable compensation 0 0 0 0 0 0 431,973 999,285
thereof Cash: 0 0 0 0 0 0 0 0thereof Restricted Incentive Awards:
2013 Restricted Incentive Award for 2012 0 0 0 0 0 0 0 377,8712014 Restricted Incentive Award for 2013 0 0 0 0 0 0 126,935 357,3912015 Restricted Incentive Award for 2014 0 0 0 0 0 0 105,340 200,9652017 Restricted Incentive Award: Buyout 0 0 0 0 0 0 0 0
thereof Equity Awards:2013 Equity Upfront Award for 2012 0 0 0 0 0 0 0 27,5602014 Equity Upfront Award for 2013 0 0 0 0 0 0 0 35,4982013 Restricted Equity Award for 2012 0 0 0 0 0 0 199,698 02017 Restricted Equity Award: Buyout 0 0 0 0 0 0 0 0
Fringe benefits (variable compensation) 0 0 0 0 0 0 0 0Total 0 0 0 0 0 0 431,973 999,285Pension service costs 879,750 899,307 1,274,429 1,306,915 796,009 807,465 796,009 807,465Total compensation (GCGC) 4,262,666 3,879,614 7,464,038 4,826,372 3,682,529 3,231,107 5,012,405 4,713,378
Sylvie Matherat James von Moltke1 Nicolas Moreau2 Werner Steinmüllerin € 2018 2017 2018 2017 2018 2017 2018 2017Fixed compensation 2,400,000 2,400,000 2,400,000 1,200,000 1,200,000 2,400,000 2,400,000 2,400,000Functional allowance 0 0 0 0 0 0 0 0Fringe benefits (fixed compensation) 6,392 16,338 86,975 35,261 129,407 59,383 76,993 82,934Total 2,406,392 2,416,338 2,486,975 1,235,261 1,329,407 2,459,383 2,476,993 2,482,934Variable compensation 0 0 1,166,703 355,404 0 0 0 0
thereof Cash: 0 0 0 355,404 0 0 0 0thereof Restricted Incentive Awards:
2013 Restricted Incentive Award for 2012 0 0 0 0 0 0 0 02014 Restricted Incentive Award for 2013 0 0 0 0 0 0 0 02015 Restricted Incentive Award for 2014 0 0 0 0 0 0 0 02017 Restricted Incentive Award: Buyout 0 0 560,758 0 0 0 0 0
thereof Equity Awards:2013 Equity Upfront Award for 2012 0 0 0 0 0 0 0 02014 Equity Upfront Award for 2013 0 0 0 0 0 0 0 02013 Restricted Equity Award for 2012 0 0 0 0 0 0 0 02017 Restricted Equity Award: Buyout 0 0 605,945 0 0 0 0 0
Fringe benefits (variable compensation) 0 0 615,516 438,038 0 0 387,196 316,490Total 0 0 1,782,219 793,442 0 0 387,196 316,490Pension service costs 755,261 774,917 864,990 451,453 607,093 1,232,878 688,942 701,617Total compensation (GCGC) 3,161,653 3,191,255 5,134,184 2,480,156 1,936,500 3,692,261 3,553,131 3,501,0411 Member since July 1, 2017. The benefits disbursed to Mr. von Moltke in 2017 as a substitute for forfeited awards and not granted variable compensation from his previous
employer are displayed under “Variable Compensation”.2 Member until December 31, 2018. In his position as managing director of DWS Management GmbH a total compensation of € 2,323,792 was paid in 2018.

180
Deutsche Bank 1 – Management ReportAnnual Report 2018
Frank Strauß1 John Cryan2 Kimberly Hammonds3 Dr. Marcus Schenck4
in € 2018 2017 2018 2017 2018 2017 2018 2017Fixed compensation 2,400,000 800,000 1,133,333 3,400,000 1,000,000 2,400,000 1,250,000 2,900,000Functional allowance 0 0 0 0 0 0 0 0Fringe benefits (fixed compensation) 71,892 26,893 10,125 220,982 209,799 260,489 13,117 16,148Total 2,471,892 826,893 1,143,458 3,620,982 1,209,799 2,660,489 1,263,117 2,916,148Variable compensation 0 0 0 0 0 0 0 0
thereof Cash: 0 0 0 0 0 0 0 0thereof Restricted Incentive Awards:
2013 Restricted Incentive Award for 2012 0 0 0 0 0 0 0 02014 Restricted Incentive Award for 2013 0 0 0 0 0 0 0 02015 Restricted Incentive Award for 2014 0 0 0 0 0 0 0 02017 Restricted Incentive Award: Buyout 0 0 0 0 0 0 0 0
thereof Equity Awards:2013 Equity Upfront Award for 2012 0 0 0 0 0 0 0 02014 Equity Upfront Award for 2013 0 0 0 0 0 0 0 02013 Restricted Equity Award for 2012 0 0 0 0 0 0 0 02017 Restricted Equity Award: Buyout 0 0 0 0 0 0 0 0
Fringe benefits (variable compensation) 0 0 0 0 0 0 0 0Total 0 0 0 0 0 0 0 0Pension service costs 876,266 313,391 733,807 748,829 825,100 842,110 504,568 1,018,267Total compensation (GCGC) 3,348,158 1,140,284 1,877,265 4,369,811 2,034,899 3,502,599 1,767,685 3,934,4151 Member since September 1, 2017.2 Member until April 8, 2018.3 Member until May 24, 2018.4 Member until May 24, 2018.
Jeffrey Urwin1
in € 2018 2017Fixed compensation 0 600,000Functional allowance 0 0Fringe benefits (fixed compensation) 0 530Total 0 600,530Variable compensation 0 0
thereof Cash: 0 0thereof Restricted Incentive Awards:
2013 Restricted Incentive Award for 2012 0 02014 Restricted Incentive Award for 2013 0 02015 Restricted Incentive Award for 2014 0 02017 Restricted Incentive Award: Buyout 0 0
thereof Equity Awards:2013 Equity Upfront Award for 2012 0 02014 Equity Upfront Award for 2013 0 02013 Restricted Equity Award for 2012 0 02017 Restricted Equity Award: Buyout 0 0
Fringe benefits (variable compensation) 0 0Total 0 0Pension service costs 0 557,370Total compensation (GCGC) 0 1,157,900#REF!1 Member until March 31, 2017.
With respect to deferred awards scheduled to be delivered in the first quarter of 2019, the Supervisory Board has confirmedthat the performance conditions relating to Group-wide IBIT for the financial year 2018 have been met.

181
Deutsche Bank Management Board Compensation ReportAnnual Report 2018 Compensation in accordance with the German Accounting Standard No. 17 (GAS 17)
Compensation in accordance with the German AccountingStandard No. 17 (GAS 17)In accordance with the requirements of the GAS 17, the members of the Management Board collectively received in the 2018financial year compensation totaling € 52,181,136 (2017: € 37,665,535). Of that, € 25,711,111 (2017: € 29,200,000) was forfixed compensation, € 4,200,000 (2017: € 550,000) for functional allowances, € 2,123,102 (2017: € 2,053,520) for fringebenefits and € 20,146,923 (2017: € 5,862,015) for performance-related components.
In accordance with German Accounting Standard No. 17, the Restricted Incentive Awards, as a deferred, non-equity-basedcompensation component subject to certain (forfeiture) conditions, must be recognized in the total compensation for the yearof their payment (i.e. in the financial year in which the unconditional payment takes place) and not in the year they are originallygranted. Based on this the Management Board members individually received the following compensation components fortheir service on the Management Board for or in the years 2018 and 2017, including the non-performance-related fringebenefits.
Compensation according to GAS 17Christian Sewing Garth Ritchie Karl von Rohr Stuart Lewis
in € 2018 2017 2018 2017 2018 2017 2018 2017Compensation
Performance-related componentsWithout long-term incentivesImmediately paid out 0 0 0 0 0 0 0 0
With short-term incentivesCash 0 0 0 0 0 0 0 0
With long-term incentivesCash-based
Restricted IncentiveAward(s) paid 0 0 0 0 0 0 232,275 936,228
Share-basedEquity Upfront Award(s) 0 0 0 0 0 0 0 0Restricted Equity Award(s) 2,784,726 0 1,963,503 0 2,023,503 0 1,873,503 0
Non-performance-relatedcomponents
Base salary 3,291,111 2,900,000 3,000,000 3,000,000 2,836,667 2,400,000 2,400,000 2,400,000Functional allowance 0 0 3,000,000 250,000 0 0 1,200,000 300,000Fringe benefits (fixed andvariable compensation) 91,805 80,307 189,609 269,457 49,853 23,642 184,423 206,628
Total 6,167,642 2,980,307 8,153,112 3,519,457 4,910,023 2,423,642 5,890,201 3,842,856
Sylvie Matherat James von Moltke1 Nicolas Moreau2 Werner Steinmüllerin € 2018 2017 2018 2017 2018 2017 2018 2017Compensation
Performance-related componentsWith short-term incentives
Cash 0 0 0 355,404 0 0 0 0With long-term incentives
Cash-basedRestricted IncentiveAward(s) paid 0 0 560,758 0 0 0 0 0
Share-basedEquity Upfront Award(s) 0 0 0 355,404 0 0 0 0Restricted Equity Award(s) 1,603,503 0 2,023,503 2,547,407 951,751 0 1,783,503 0
Non-performance-relatedcomponents
Base salary 2,400,000 2,400,000 2,400,000 1,200,000 1,200,000 2,400,000 2,400,000 2,400,000Functional allowance 0 0 0 0 0 0 0 0Fringe benefits (fixed andvariable compensation) 6,392 16,338 702,491 473,299 129,407 59,383 464,189 399,424
Total 4,009,895 2,416,338 5,686,752 4,931,514 2,281,158 2,459,383 4,647,692 2,799,4241 Member since July 1, 2017.2 Member until December 31, 2018. In his position as managing director of DWS Management GmbH he received a total of € 2,466,699.

182
Deutsche Bank 1 – Management ReportAnnual Report 2018
Frank Strauß1 John Cryan2 Kimberly Hammonds3 Dr. Marcus Schenck4
in € 2018 2017 2018 2017 2018 2017 2018 2017Compensation
Performance-related componentsWith short-term incentives
Cash 0 0 0 0 0 0 0 0With long-term incentives
Cash-basedRestricted IncentiveAward(s) paid 0 0 0 0 0 0 0 0
Share-basedEquity Upfront Award(s) 0 0 0 0 0 0 0 0Restricted Equity Award(s) 2,375,703 0 567,252 0 618,126 0 785,314 0
Non-performance-relatedcomponents
Base salary 2,400,000 800,000 1,133,333 3,400,000 1,000,000 2,400,000 1,250,000 2,900,000Functional allowance 0 0 0 0 0 0 0 0Fringe benefits (fixed andvariable compensation) 71,892 26,893 10,125 220,982 209,799 260,489 13,117 16,148
Total 4,847,595 826,893 1,710,710 3,620,982 1,827,925 2,660,489 2,048,431 2,916,1481 Member since September 1, 2017.2 Member until April 8, 2018.3 Member until May 24, 2018.4 Member until May 24, 2018.
Jeffrey Urwin1 Totalin € 2018 2017 2018 2017Compensation
Performance-related componentsWith short-term incentives
Cash 0 0 0 355,404With long-term incentives
Cash-basedRestricted Incentive Award(s) paid 0 0 793,033 2,603,8002
Share-basedEquity Upfront Award(s) 0 0 0 355,404Restricted Equity Award(s) 0 0 19,353,890 2,547,407
Non-performance-related componentsBase salary 0 600,000 25,711,111 29,200,000Functional allowance 0 0 4,200,000 550,000Fringe benefits (fixed and variable compensation) 0 530 2,123,102 2,053,520
Total 0 600,530 52,181,136 37,665,5352
1 Member until March 31, 2017.2 The amount of € 1,667,572 for Mr. Fitschen reported in last year's annual report is included in total but no longer reported separately as he had already left the Management
Board in the 2016 financial year.
With respect to deferred awards scheduled to be delivered in the first quarter of 2019, the Supervisory Board has confirmedthat the performance conditions relating to Group-wide IBIT for the 2018 financial year have been met.

183
Deutsche Bank Employee Compensation ReportAnnual Report 2018 Regulatory Environment
Employee Compensation Report
The content of the 2018 Employee Compensation Report is based on the qualitative and quantitative remuneration disclosurerequirements outlined in Article 450 No. 1 (a) to (i) Capital Requirements Regulation (CRR) in conjunction with Section 16 ofthe Remuneration Ordinance for Institutions (Institutsvergütungsverordnung – InstVV).
This Compensation Report takes a consolidated view and covers all consolidated entities of the Deutsche Bank Group. Inaccordance with regulatory requirements, equivalent reports for 2018 are prepared for the following Significant Institutionswithin Deutsche Bank Group: Deutsche Bank Privat- und Firmenkundenbank AG, Germany; BHW Bausparkasse AG,Germany; Deutsche Bank Luxembourg S.A., Luxembourg; Deutsche Bank S.p.A., Italy; and Deutsche Bank Mutui S.p.A.,Italy.
Regulatory EnvironmentEnsuring compliance with regulatory requirements is an overarching consideration in our Group Compensation Strategy. Westrive to be at the forefront of implementing regulatory requirements with respect to compensation and will continue to workclosely with our prudential supervisor, the European Central Bank (ECB), to be in compliance with all existing and newrequirements.
As an EU-headquartered institution, Deutsche Bank is subject to the CRR and Capital Requirements Directive 4 (CRD 4)globally, as transposed into German national law in the German Banking Act and InstVV. We adopted the rules in its currentversion for all of Deutsche Bank’s subsidiaries and branches world-wide to the extent required in accordance with Section 27InstVV. As a Significant Institution within the meaning of InstVV, Deutsche Bank identifies all employees whose work isdeemed to have a material impact on the overall risk profile (Material Risk Takers or MRTs) in accordance with criteriastipulated under the Commission Delegated Regulation (EU) No. 604/2014. MRTs are identified at a Group level and at thelevel of Significant Institutions.
Taking into account more specific sectorial legislation and in accordance with InstVV, some of Deutsche Bank’s subsidiaries(in particular within the DWS Group) fall under the local transpositions of the Alternative Investments Fund Managers Directive(AIFMD) or the Undertakings for Collective Investments in Transferable Securities Directive (UCITS). We also identify MaterialRisk Takers in these subsidiaries. Identified employees are subject to the remuneration provisions outlined in the Guidelineson sound remuneration policies under AIFMD/UCITS published by the European Securities and Markets Authority (ESMA).
Deutsche Bank also takes into account the regulations targeted at employees who engage directly or indirectly with the bank’sclients (for instance the local transpositions of the Markets in Financial Instruments Directive II – MiFID II). These provisionsresulted in the implementation of a specific compensation policy, a review of compensation plans and the identification ofemployees deemed to be Relevant Persons to ensure that they act in the best interest of clients.
Where applicable, Deutsche Bank is also subject to specific rules and regulations implemented by local regulators. Many ofthese requirements are aligned with the InstVV. However, where variations are apparent, proactive and open discussions withregulators have enabled us to follow the local regulations whilst ensuring any impacted employees or locations remain withinthe bank’s overall Group Compensation Framework. This includes, for example, the identification of Covered Employees inthe United States under the requirements of the Federal Reserve Board. In any case, we apply the InstVV requirements asminimum standards globally.

184
Deutsche Bank 1 – Management ReportAnnual Report 2018
Compensation GovernanceDeutsche Bank has a robust governance structure enabling it to operate within the clear parameters of the CompensationStrategy and the Compensation Policies. In accordance with the German two-tier board structure, the Supervisory Boardgoverns the compensation of the Management Board members while the Management Board oversees compensation mattersfor all other employees in the Group. Both the Supervisory Board and the Management Board are supported by specificcommittees and functions, in particular the Compensation Control Committee (CCC) and the Senior Executive CompensationCommittee (SECC), respectively.
In line with their responsibilities, the bank’s control functions are involved in the design and application of the bank’sremuneration systems, in the identification of MRTs and in determining the total amount of VC. This includes assessing theimpact of employees’ behavior and the business-related risks, performance criteria, granting of remuneration and severancesas well as ex-post risk adjustments.
Reward Governance structure
1 Does not comprise a complete list of Supervisory Board Committees.
Compensation Control Committee (CCC)The Supervisory Board has setup the CCC to support in establishing and monitoring the structure of the compensation systemfor the Management Board Members of Deutsche Bank AG, considering, in particular, the effects on the risks and riskmanagement in accordance with the InstVV. Furthermore, the CCC monitors the appropriateness of the compensation systemfor the employees of Deutsche Bank Group, as established by the Management Board and the SECC. The CCC checksregularly whether the total amount of variable compensation is affordable and set in accordance with the InstVV. The CCCalso assesses the impact of the compensation systems on the management of risk, capital and liquidity and seeks to ensurethat the compensation systems are aligned to the business and risk strategies. Furthermore, the CCC supports the SupervisoryBoard in monitoring the MRT identification process and whether the internal control functions and the other relevant areas areproperly involved in the structuring of the compensation systems.
The CCC consists of the Chairperson of the Supervisory Board and three further Supervisory Board Members, two of whichare employee representatives. The Committee held five meetings in the calendar year 2018. In November, the members ofthe Risk Committee attended the Compensation Control Committee meeting as guests.
Supervisory Board1
Chairman’sCommittee
AuditCommittee
RiskCommittee
IntegrityCommittee
CompensationControl
Committee
Management Board
CompensationOfficer
Senior ExecutiveCompensation Committee
(SECC)
MonitoringInformation & Reporting
Support& Information
MonitoringInformation

185
Deutsche Bank Employee Compensation ReportAnnual Report 2018 Compensation Strategy
Compensation OfficerThe Management Board, in cooperation with the CCC, has appointed a Group Compensation Officer to support theSupervisory Boards of Deutsche Bank AG and of the bank’s Significant Institutions in Germany in performing theircompensation related duties. The Compensation Officer is involved in the conceptual review, development, monitoring andthe application of the employees’ compensation systems on an ongoing basis. The Compensation Officer performs hismonitoring obligations independently and provides an assessment on the appropriateness of design and practices of thecompensation systems for employees at least annually. He supports and advises the CCC regularly.
Senior Executive Compensation Committee (SECC)The SECC is a delegated committee established by the Management Board which has the mandate to develop sustainablecompensation principles, to prepare recommendations on Total Compensation levels and to ensure appropriate compensationgovernance and oversight. The SECC establishes the Group Compensation Strategy and Compensation Policy. The SECCalso utilizes quantitative and qualitative factors to assess Group and divisional performance as a basis for compensationdecisions and makes recommendations to the Management Board regarding the total amount of annual variable compensationand its allocation across business divisions and infrastructure functions.
In order to maintain its independence, only representatives from infrastructure and control functions who are not aligned toany of the business divisions are members of the SECC. In 2018, the SECC’s membership comprised of the ChiefAdministration Officer and the Chief Financial Officer as Co-Chairpersons, as well as the Chief Risk Officer (all of whom areManagement Board Members), the Global Head of Human Resources as well as an additional representative from bothFinance and Risk as voting members. The Compensation Officer, the Deputy Compensation Officer and one of the GlobalCo-Heads of HR Performance & Reward were nonvoting members. The SECC generally meets on a monthly basis and it had21 meetings with regard to the compensation process for performance year 2018.
Compensation StrategyDeutsche Bank recognizes that its compensation system plays a vital role in supporting its strategic objectives. It enables usto attract and retain the individuals required to achieve our bank’s objectives. The Group Compensation Strategy is aligned toDeutsche Bank’s business strategy, risk strategy, and to its corporate values and beliefs.
The Group Compensation Policy informs our employees about the implementation of the Compensation Strategy, governanceprocesses as well as compensation structures and practices. All relevant documents are available to employees via ourintranet site.
Five key objectives of our compensation practices
– To support the delivery of the bank’s client-focused,global bank strategy by attracting and retaining talentacross its full range of diverse business models andcountry locations
– To support the long-term, sustainable performanceand development of the bank and a correspondingrisk strategy
– To promote and support long-term performancebased on cost discipline and efficiency
– To ensure that the bank’s compensation practices aresafe, by way of risk-adjusting performance outcomes,preventing inappropriate risk taking, ensuringsustained compatibility with capital and liquidityplanning, and complying with regulation
– To apply and promote the bank’s corporate values ofintegrity, sustainable performance, client centricity,innovation, discipline and partnership
– Align compensation to shareholderinterests and sustained bank-wideprofitability, taking account of risk
– Maximize sustainable performance, bothat the employee and the bank-wide level
– Attract and retain the best talent
– Calibrate compensation to reflect differentdivisions and levels of responsibility
– Apply a simple and transparentcompensation design
– Ensure compliance with regulatoryrequirements
Core remuneration principles

186
Deutsche Bank 1 – Management ReportAnnual Report 2018
Group Compensation FrameworkOur compensation framework emphasizes an appropriate balance between Fixed Pay (FP) and Variable Compensation (VC)– together Total Compensation (TC). It aligns incentives for sustainable performance at all levels of Deutsche Bank whilstensuring the transparency of compensation decisions and their impact on shareholders and employees. The underlyingprinciples of our compensation framework are applied to all employees equally, irrespective of differences in seniority, tenureor gender.
Pursuant to CRD 4 and the requirements subsequently adopted in the German Banking Act, Deutsche Bank is subject to aratio of 1:1 with regard to fixed-to-variable remuneration components, which was increased to 1:2 with shareholder approvalon May 22, 2014 with an approval rate of 95.27 %, based on valid votes by 27.68 % of the share capital represented at theAnnual General Meeting. Nonetheless, the bank has determined that employees in specific infrastructure functions shouldcontinue to be subject to a ratio of at least 1:1 while Control Functions as defined by InstVV are subject to a ratio of 2:1 withregard to fixed-to-variable remuneration components.
The bank has assigned a Reference Total Compensation (RTC) to eligible employees that describes a reference value fortheir role. This value provides our employees orientation on their FP and VC. Actual individual TC can be at, above or belowthe Reference Total Compensation, based on Group affordability, and performance expectations having been satisfied atGroup, divisional and individual levels, as determined by Deutsche Bank at its sole discretion.
Fixed Pay is used to compensate employees for their skills, experience and competencies, commensurate with therequirements, size and scope of their role. The appropriate level of FP is determined with reference to the prevailing marketrates for each role, internal comparisons and applicable regulatory requirements. FP plays a key role in permitting us to meetour strategic objectives by attracting and retaining the right talent. For the majority of our employees, FP is the primarycompensation component with a share of greater than 50 % of TC.
Variable Compensation reflects affordability and performance at Group, divisional, and individual level. It allows us todifferentiate individual performance and to drive behavior through appropriate incentive systems that can positively influenceculture. It also allows for flexibility in the cost base. VC generally consists of two elements – the Group VC Component andthe Individual VC Component. The Individual VC Component is delivered either in the form of Individual VC (generallyapplicable for employees at the level of Vice President (VP) and above) or as Recognition Award (generally applicable foremployees at the level of Assistant Vice President (AVP) and below). In cases of negative performance contributions ormisconduct, an employee’s VC can be reduced accordingly and can go down to zero. VC is granted and paid out subject toGroup affordability. Under our compensation framework, there continues to be no guarantee of VC in an existing employmentrelationship. Such arrangements are utilized only on a very limited basis for new hires in the first year of employment and aresubject to the bank’s standard deferral requirements.
Key components of the compensation framework
1 Some Assistant Vice Presidents and below in select entities and divisions are eligible for the Individual VC Component in lieu of the Recognition Award.
Vice President and above Assistant Vice President and below1
RecognitionAward
Group VCComponent
Individual VC
Group VCComponent
Fixed Pay Fixed Pay
Reference TotalCompensation
Reference TotalCompensation

187
Deutsche Bank Employee Compensation ReportAnnual Report 2018 Determination of performance-based Variable Compensation
The Group VC Component is based on one of the overarching goals of the compensation framework – to ensure an explicitlink between VC and the performance of the Group. To assess our annual achievements in reaching our strategic targets, thefour Key Performance Indicators (KPIs) utilized as the basis for determining the 2018 Group VC Component were: CommonEquity Tier 1 (CET 1) Capital Ratio (fully loaded), Leverage Ratio, Adjusted Costs, and Post-Tax Return on Tangible Equity(RoTE). These four KPIs represent important metrics for the capital, risk, cost and the revenue profile of our bank and providean indication of the sustainable performance of Deutsche Bank.
Individual VC takes into consideration a number of financial and non-financial factors, including the applicable divisionalperformance, the employee’s individual performance, conduct, and adherence to values and beliefs, as well as additionalfactors such as the comparison of pay levels with the employee’s peer group and retention considerations.
Recognition Awards provide the opportunity to acknowledge and reward outstanding contributions made by the employees oflower seniority levels in a timely and transparent manner. Generally, the overall size of the Recognition Award budget isdirectly linked to a set percentage of FP for the eligible population and it is currently paid out twice a year, based on a reviewof nominations and contributions in a process managed at the divisional level.
Employee benefits complement Total Compensation and are considered FP from a regulatory perspective, as they have nodirect link to performance or discretion. They are granted in accordance with applicable local market practices andrequirements. Pension expenses represent the main element of the bank’s benefits portfolio, globally.
In the context of InstVV, severance payments are considered VC. The bank has updated its severance framework to ensurefull alignment with the respective new InstVV requirements.
Limited to extraordinary circumstances, the bank reserves the right to grant Retention Awards to help induce select employeeswhich are at risk of leaving and that are critical to the bank’s future, to remain at the bank. Retention Awards are generallylinked to certain critical events in which the bank has a legitimate interest in retaining the employee for a defined period oftime. This serves to minimize operational, financial or reputational risk. These awards are considered VC in a regulatory senseand are generally subject to the same requirements as other VC elements.
Determination of performance-based Variable CompensationDeutsche Bank applies a methodology when determining VC that reflects the risk-adjusted performance and is primarily drivenby (i) Group affordability, i.e. what can Deutsche Bank award in alignment with regulatory requirements, and (ii) performance,i.e. what should we award in order to provide an appropriate compensation for performance, while protecting the long-termhealth of the franchise.
Group affordability is assessed to determine that relevant parameters are meeting the current and projected future regulatoryand strategic goals. The affordability parameters used are fully aligned with our Risk Appetite Framework and ensure that thebank’s capital as well as liquidity position and planning, its risk-bearing capacity, the combined capital buffer requirements,and results are adequately taken into account.
When assessing Group and divisional performance, we reference a range of considerations. The performance is assessed incontext of divisional financial and – based on Balanced Scorecards – non-financial targets. The financial targets are subjectto appropriate risk-adjustment, in particular by referencing the degree of future potential risks to which Deutsche Bank maybe exposed, and the amount of capital required to absorb severe unexpected losses arising from these risks. For theinfrastructure functions, the performance assessment is mainly based on the achievement of cost targets and the BalancedScorecards. While the allocation of VC to infrastructure functions depends on the overall performance of Deutsche Bank, it isnot dependent on the performance of the division(s) these functions, particularly independent control functions, oversee.
At the level of the individual employee, we have established Variable Compensation Guiding Principles, which detail the factorsand metrics that have to be taken into account when making Individual VC decisions. Our managers must fully appreciate therisk-taking activities of individuals to ensure that VC allocations are balanced and risk-taking is not inappropriately incentivized.The factors and metrics to be considered include, but are not limited to, individual performance based on quantitative andqualitative aspects, culture and behavioral considerations, and disciplinary sanctions. Managers of Material Risk Takers mustspecifically document the factors and risk metrics considered when making Individual VC decisions, and demonstrate howthese factors influenced their decision. Generally, performance is assessed based on a one year period. However, forManagement Board members of Significant Institutions, the performance across three years is taken into account.

188
Deutsche Bank 1 – Management ReportAnnual Report 2018
Variable Compensation StructureOur compensation structures are designed to provide a mechanism that promotes and supports long-term performance of ouremployees and our bank. Whilst a portion of VC is paid upfront, these structures require that an appropriate portion is deferredto ensure alignment to the sustainable performance of the Group.
At the same time, we believe that the use of shares or share-based instruments for deferred VC is an effective way to aligncompensation with Deutsche Bank’s sustainable performance and the interests of shareholders. By using Deutsche Bankshares, the value of the individual’s VC is linked to Deutsche Bank’s share price over the deferral and retention period.
We continue to go beyond regulatory requirements with the amount of VC that is deferred and Deutsche Bank’s minimumdeferral periods. Whilst ensuring lower compensated employees are not subject to deferrals, we ensure an appropriate amountof deferred VC for higher earners. We start to defer parts of variable compensation for Material Risk Takers where VC is setat or above € 50,000. For non-MRTs, deferrals start at higher levels of VC. The VC threshold for MRTs requiring at least 60 %deferral is set at € 500,000. Furthermore, Directors and Managing Directors in the Corporate & Investment Bank (CIB) withFixed Pay in excess of € 500,000 are subject to a VC deferral of 100 %. Material Risk Takers are on average subject todeferral rates in excess of the minimum 40 % (60 % for Senior Management) as required by InstVV.
As detailed in the table below, deferral periods range from three to five years, dependent on employee groups.
Overview on 2018 Award Types (excluding DWS Group)Award Type Description Beneficiaries Deferral Period Retention Period ProportionUpfront:Cash VC
Upfront cash portion All eligible employees N/A N/A InstVV MRTs: 50 % ofupfront VC
Non-MRTs: 100 % ofupfront VC
Upfront:Equity Upfront Award(EUA)
Upfront equity portion (linked toDeutsche Bank’s share priceover the retention period)
All InstVV MRTs withVC >= € 50,000
N/A Twelve months 50 % of upfront VC
Deferred:Restricted IncentiveAward (RIA)
Deferred cash portion All employees withdeferred VC
Equal tranche vestingoverCIB: four yearsSen. Mgmt.: five yearsOther: three years1
N/A 50 % of deferred VC
Deferred:Restricted EquityAward (REA)
Deferred equity portion (linkedto Deutsche Bank’s share priceover the vesting and retentionperiod)
All employees withdeferred VC
Equal tranche vestingoverCIB: four yearsSen.Mgmt.: five yearsOther: three years1
Twelve months forInstVV MRTs
50 % of deferred VC
N/A – Not applicable1 Senior Management, for the purposes of performance year 2018 annual awards, is defined as Deutsche Bank’s Senior Leadership Cadre, plus Management Board members
of Significant Institutions and their direct reports (excl. non-management/-strategic roles) – excluding DWS Executive Board. All Senior Management employees are alsoconsidered InstVV MRTs.
Our employees are not allowed to sell, pledge, transfer or assign a deferred award or any rights in respect to the award. Theymay not enter into any transaction having an economic effect of hedging any variable compensation, for example offsettingthe risk of price movement with respect to the equity-based award. Our Human Resources and Compliance functions,supported by the Compensation Officer, work together to monitor employee trading activity and to ensure that all ouremployees comply with this requirement.

189
Deutsche Bank Employee Compensation ReportAnnual Report 2018 Ex-post Risk Adjustment of Variable Compensation
Ex-post Risk Adjustment of Variable CompensationWe believe that the future conduct and performance of our employees are key elements of deferred VC. As a result, alldeferred awards are subject to performance conditions and forfeiture provisions as detailed below.
Overview on Deutsche Bank Group performance conditions and forfeiture provisions of Variable Compensation
1 For award types subject to cliff-vesting, the whole award will be forfeited if at quarter end prior to vesting or settlement the Group CET 1 Capital Ratio, or the LiquidityCoverage Ratio are below the threshold. For Equity Upfront Awards, the Group CET 1 Capital Ratio, or the Liquidity Coverage Ratio are only assessed at the quarter end priorto delivery.
2 Forfeiture provisions here are not a complete list, other provisions apply as outlined in the respective plan rules.
Description ForfeitureProvision
DB Group’s Common EquityTier 1 Capital Ratio andLiquidity Coverage Ratio
If at the quarter end prior to vesting anddelivery the Group CET 1 Capital Ratio,or the Liquidity Coverage Ratio are belowa certain threshold
Next tranche of deferred award due fordelivery (100 % of all undelivered EquityUpfront Awards)1
Forfeiture Provisions2
, In the event of an internal policy orprocedure breach, breach of anyapplicable laws or regulations, or aControl Failure
, If any award was based onperformance measures orassumptions that are later deemed tobe materially inaccurate
, Where a Significant Adverse Eventoccurs, and the Participant isconsidered sufficiently proximate
, If forfeiture is required to comply withprevailing regulatory requirements
Up to 100 % of undelivered awards
Group IBITIf the Management Board determines thatprior to delivery Group IBIT isnegative
Next tranche of deferred award due fordelivery
Divisional IBITIf the Management Board determinesthat prior to delivery Divisional IBIT isnegative
Next tranche of deferred award due fordelivery (applies only to MRTs in BusinessDivisions)
ClawbackIn the event an InstVV MRT participatedin conduct that resulted in significant lossor regulatory sanction; or failed to complywith relevant external or internal rulesregarding appropriate standards ofconduct
100 % of award which has been delivered,before the second anniversary of the lastvesting date for the award

190
Deutsche Bank 1 – Management ReportAnnual Report 2018
Employee Groups with specific Compensation StructuresFor some areas of the bank, compensation structures apply that deviate, within regulatory boundaries, in some aspects fromthe Group Compensation Framework outlined previously.
Postbank unitsWith effect from May 25, 2018, Deutsche Postbank AG merged with Deutsche Bank Privat- und Geschäftskunden AG to formDB Privat- und Firmenkundenbank AG. For the remainder of 2018, the Postbank units retained their compensation structureswith some amendments for Material Risk Takers.
In line with Deutsche Bank Group practice, Postbank units utilize a Group and an Individual VC Component. However, fornon-MRTs the Group VC Component is currently still based on Postbank business unit results. For Material Risk Takers,limited to performance year 2018, the Group VC Component reflects a combination of the objective achievement rate of bothPostbank units and Deutsche Bank Group. For Senior Management, Material Risk Takers and other executive staff inPostbank units, the Group-wide deferral rules apply.
The compensation for nonexecutive staff in Postbank units is based on frameworks agreed with trade unions or with therespective workers’ councils. Where no collective agreements exist, compensation is subject to individual contracts. In general,nonexecutive staff in Postbank units receive VC, but the structure and portion of VC differ between legal entities.
DWSThe vast majority of DWS asset management entities fall under AIFMD or UCITS while a limited number of entities remain inscope of the bank’s Group Compensation Framework and InstVV. DWS has established its own compensation governance,policy, and structures, as well as Risk Taker identification process in line with AIFMD/UCITS requirements. These structuresand processes are in line with InstVV where required, but tailored towards the Asset Management business.
DWS has implemented a self-imposed fixed-to-variable ratio of 1:2 for AIFMD/UCITS Control Function employees and 1:5 forother employees in order to align the compensation with industry standards. Generally, DWS applies remuneration rules thatare equivalent to the Deutsche Bank Group approach, but use DWS Group-related parameters, where possible. Notabledeviations from the Group Compensation Framework include the use of share-based instruments linked to DWS shares andfund-linked instruments. These serve to improve the alignment of employee compensation with DWS’ shareholders’ andinvestors’ interests.
Control FunctionsIn line with InstVV, the bank has defined control functions that are subject to specific regulatory requirements. These controlfunctions comprise Risk, Compliance, Anti-Financial Crime, Group Audit, parts of Human Resources, and the CompensationOfficer and his Deputy. To prevent conflicts of interests, the parameters used to determine the Individual VC Component ofthese control functions do not follow the same parameters being used for the business they oversee. Based on their riskprofile, these functions are subject to a fixed-to-variable pay ratio of 2:1.
In addition, for some additional corporate functions that perform control roles (including Legal, Group Finance, Group Tax,Regulation, and other parts of Human Resources), the bank has determined a voluntary application of a fixed-to-variable payratio of 1:1.
Tariff staffWithin Deutsche Bank Group there are more than 21,000 tariff employees in Germany (based on full-time equivalent). Thesetariff employees are primarily employed by Deutsche Bank AG, DB Privat- und Firmenkundenbank AG, and subsidiaries withinthe Postbank unit. They are subject to a collective agreement (Tarifvertrag für das private Bankgewerbe und die öffentlichenBanken), as negotiated between trade unions and employer associations. Also, former Postbank units are subject toagreements as negotiated with the respective trade unions directly. The remuneration of tariff staff is included in thequantitative disclosures in this report.
191
Deutsche Bank Employee Compensation ReportAnnual Report 2018 Compensation Decisions for 2018
Compensation Decisions for 2018Year-End considerations and decisions for 2018For the determination of the total amount of VC for 2018, the Management Board considered many factors such as affordabilityand performance at both the Group and divisional level. The assessment of performance has been complemented by theconsideration of other important aspects including the ongoing focus on achieving the bank’s strategic objectives, regulatoryrequirements, the impact of competitive positioning on retaining and motivating employees, and a sustainable balancebetween shareholder and employee interests as required by the bank’s Compensation Strategy.
For the financial year 2018, Deutsche Bank’s pre-tax earnings amounted to approximately € 1.3 billion. For the first time since2014, the bank reported a net profit.
The SECC has monitored Group affordability throughout 2018 and confirmed that the bank’s capital and liquidity positionsremained comfortably above regulatory minimum requirements throughout the year. As such, the Management Boardconfirmed that the Group affordability parameters were met and the total amount of VC for performance year 2018 may beawarded.
In the context of the above considerations and taking into account the risk-adjusted financial performance, the ManagementBoard has determined a total amount of performance-based VC for 2018 of € 1.9 billion (including the Individual VCComponent, the Group VC Component, Recognition Awards, and VC for Postbank units). The determination of VC for theManagement Board of Deutsche Bank AG was not part of this decision, as it was carried out by our Supervisory Board in aseparate process (please refer to the Management Board Compensation Report). The VC for the Management Board is,however, included as part of performance-based VC for 2018 in the tables and charts below.
As part of the overall 2018 VC awards granted in March 2019, the Group VC Component was awarded to all eligible employeesin line with the assessment of the four defined KPIs, as outlined in the chapter Group Compensation Framework. TheManagement Board determined a payout rate of 70 % for 2018.
Disclosure of Total Compensation for 2018The VC for Postbank units will be included as part of performance-based VC from reporting period 2018 onwards.
In line with the new definitions of Fixed Pay and Variable Pay according to the updated Section 2 InstVV, additionalcompensation elements need to be included in the quantitative disclosures compared to previous years. The disclosed FixedPay amounts now also include pension expenses as material benefits. Disclosed Variable Pay now also includes severancepayments. For ease of reference, prior year values in the following table have been adjusted to include these two elementsas well as VC for Postbank units for the 2017 reporting period as well.
Based on the new definitions, compared to 2017, the Fixed Pay according to § 2 InstVV for 2018 (including pension expensesas required by InstVV) decreased by approximately 3 % from € 8.6 billion to € 8.3 billion, mainly due to headcount reductions.As established by our compensation framework, FP continues to remain the primary compensation component for the majorityof our employees, especially those at the lower seniority levels.
The total amount of year-end performance-based VC for 2018 – the amount of VC that Deutsche Bank Group pays to itsemployees for their performance in 2018 – decreased by approximately 14 % from € 2.3 billion to € 1.9 billion. When excludingVC for the Management Board of Deutsche Bank AG, performance-based VC decreased by approximately 15 % year on year.
Variable Pay according to § 2 InstVV includes not only performance-based VC but also other VC commitments and severancepayments. Compared to 2017, it decreased by approximately 8 %, mainly due to the reduced performance-based VC for 2018– partially offset by increased severance cost in light of the bank’s strategic priorities.

192
Deutsche Bank 1 – Management ReportAnnual Report 2018
Compensation awards for 2018 – all employees2018 2017
in € m.(unless stated otherwise)¹
SupervisoryBoard2
Manage-ment
Board3 CIB3 PCB3 DWS3
Inde-pendentControl
Functions3Corporate
Functions3GroupTotal
GroupTotal
Number of employees (full-timeequivalent) 20 9 16,373 41,706 4,024 5,676 23,948 91,737 97,535Total compensation 6 95 3,736 3,449 704 741 1,908 10,633 11,121
Base salary and allowances 6 31 2,381 2,730 440 597 1,506 7,684 7,901Pension expenses 0 10 173 263 41 54 116 657 726
Fixed Pay according to § 2InstVV4 6 42 2,555 2,992 480 651 1,622 8,341 8,628
Year-end performance-based VC5 0 27 1,033 381 175 86 243 1,945 2,256Other VC6 0 0 104 12 23 1 4 143 113Severance payments 0 26 45 64 26 4 39 203 123
Variable Pay according to § 2InstVV7 0 53 1,181 457 224 91 286 2,292 2,493Retention Award Program (Jan2017)8 0 961N/A – Not applicable1 The table may contain marginal rounding differences.2 Supervisory Board includes the Deutsche Bank AG board members at year-end. They are not considered for the Group Total Number of employees. Employee
representatives are considered with their compensation for the Supervisory Board role only (their employee compensation is included in the relevant divisional column). Theremuneration for members of the Deutsche Bank AG Supervisory Board is not reflected in the Group Total.
3 Management Board includes the respective board members of Deutsche Bank AG at year-end. PCB includes Postbank units. DWS includes DWS Group – irrespective ofwhether employees are in scope of InstVV or AIFMD/UCITS V. Independent Control Functions includes Chief Risk Officer, Group Audit, Compliance, Anti-Financial Crime.Corporate Functions comprise any infrastructure function which is neither captured as an Independent Control Function nor part of any division.
4 Fixed Pay according to § 2 InstVV includes base salary, allowances, and pension expenses.5 Year-end performance-based VC includes Individual/Group VC Components, Recognition Award, VC for Postbank units (for 2017 and for 2018), VC for Deutsche Bank AG
Management Board.6 Other VC includes other contractual VC commitments in the period such as sign-on payments and retention awards.7 Variable Pay according to § 2 InstVV includes Deutsche Bank’s year-end performance-based VC awards for 2018 and other VC commitments in the relevant period, as well
as severance payments. € 26 million buyouts for new hires (replacement awards for lost entitlements from previous employers) are not included. Long-term Incentive Plansare not included as they will be considered as VC for the year in which the awards are due.
8 Retention Award Program (Jan 2017) amount includes forfeitures and was FX-adjusted for 2017. For more information please refer to the Annual Report 2017.
Year-end performance-based Variable Compensation and deferral rates year over year
2.2
1.5 1.6 1.4 1.2
0.1
0.9 0.7
1.4
1.71.6
1.31.2
0.4
1.31.2
2011 2012 2013 2014 2015 2016 2017 2018
61%
47% 49%52%
49%
28%
42%37%
0.5 1.5 2.5 3.5 4.5 5.5 6.5 7.5 8.5
0%
20%
40%
60%
80%
100%
€0 bn
€1 bn
€2 bn
€3 bn
€4 bn
€5 bn
3.6 3.2 3.2 2.7 2.4 0.5 2.3 1.9
excl. VC forPostbank units
incl. VC forPostbank units
Due to rounding, numbers presented may not add up precisely to the totals provided.
DeferredCashDeferral rate in % (i.e., the proportion of the total Variable Compensation that is delivered in deferred awards)

193
Deutsche Bank Employee Compensation ReportAnnual Report 2018 Material Risk Taker Compensation Disclosure
Recognition and Amortization of Variable CompensationAs of December 31, 2018, including awards for financial year 2018 granted in early March 2019, unamortized deferred VCexpenses amount to approximately € 1.6 billion. The following table outlines the amount of VC recognized on the balancesheet for 2018 and the projected future amortization of outstanding deferred VC over the next financial years (future grantsand forfeitures excluded).
Year-end performance-based Variable Compensation (including Retention Award Program in 2017), recognized as of December 31,2018 and projected amortization of deferred compensation granted
Projected amortization(excluding future grants and forfeitures)
in € bn.
Recognizedon-balancesheet as of
Dec 31, 2018
Not yetrecognizedon-balancesheet as of
Dec 31, 2018 2019 2020 2021 - 2024Upfront Awards - 2018 1.2 0.1 0.1 0.0 -Deferred - 2018 0.1 0.6 0.3 0.2 0.1Deferred - 2017 and prior1 1.6 1.0 0.5 0.3 0.2Total 2.9 1.6 0.9 0.5 0.3Due to rounding, numbers presented may not add up precisely to the totals provided. Including Variable Compensation for Postbank units.1 Deferred Variable Compensation granted for performance year 2017 or earlier includes Variable Compensation for Postbank units for 2017 and 2017 Retention Award
Program which was not designed to compensate for performance.
Of the year-end performance-based VC for 2018, € 1.3 billion is charged to the income statement for 2018, including theupfront cash VC awards for 2018 amounting to € 1.2 billion as well as € 0.1 billion of deferred awards for 2018 alreadyrecognized as of December 31, 2018 due to regulatory requirements. € 0.7 billion will be charged to future years, including€ 0.1 billion of Equity Upfront Awards which are granted upfront but amortized over a twelve months retention period as wellas € 0.6 billion of Restricted Incentive and Restricted Equity Awards.
In addition, the income statement for 2018 was charged with a VC of € 0.6 billion stemming from prior years’ deferrals,recognized and amortized as Other liabilities. € 1.0 billion of prior years’ deferrals were recognized in Equity for 2018 as theywere still part of the treasury stock distributable as of December 31, 2018. These outstanding share awards will vest and willbe recognized as compensation expense during 2019 or in future years. Additional prior years’ deferrals amounting to€ 1.0 billion will be charged to future years.
Material Risk Taker Compensation DisclosureOn a global basis, 1,913 employees were identified as Material Risk Takers according to InstVV for financial year 2018,compared to 1,907 employees for 2017 (excluding Postbank units: 1,795 MRTs). The remuneration elements for all MRTsidentified according to InstVV are detailed in the table below in accordance with Section 16 InstVV and Article 450 CRR.

194
Deutsche Bank 1 – Management ReportAnnual Report 2018
Aggregate remuneration for Material Risk Takers according to InstVV2018 2017
in € m. (unless stated otherwise)¹
Super-visory
Board²
Manage-ment
Board3 CIB3 PCB3 DWS3
Inde-pendentControl
Functions3Corporate
Functions3GroupTotal
GroupTotal
Number of MRTs (headcount) 49 45 1,109 334 17 180 179 1,913 1,795Number of MRTs (FTE) 48 39 1,013 322 15 174 170 1,781 1,772
thereof: Senior Management4 0 25 35 119 7 29 37 252Total Pay 7 122 1,236 174 27 94 147 1,807 2,359
Total Fixed Pay 7 57 705 103 12 74 91 1,049 981thereof:in cash (incl. pension expenses)5 5 57 705 103 12 74 91 1,048in shares or other instruments6 1 0 0 0 0 0 0 1
Total Variable Pay for period7 0 65 530 71 16 20 56 758 1,379thereof:in cash 0 34 273 38 12 11 30 398 685in shares or share-basedinstruments 0 31 257 33 3 9 26 360 689in other types of instruments 0 0 0 0 1 0 0 0 6
Total Variable Pay for period,deferred 0 42 447 39 5 8 29 569 1,087
thereof:in cash 0 14 223 20 2 4 15 278 535in shares or share-basedinstruments 0 27 223 19 2 4 15 291 545in other types of instruments 0 0 0 0 0 0 0 0 6
Total amount of variable pay stilloutstanding at the beginning of theyear that was deferred in previousyears 0 61 1,303 126 24 42 121 1,678 1,783
thereof:vested 0 10 54 14 3 5 9 95 704
vested and paid/delivered 0 9 53 11 3 5 9 90unvested 0 51 1,250 112 21 37 112 1,583 1,079
Deferred Variable Pay awarded,paid out or reduced during period
awarded during period 0 27 683 58 11 20 44 842 762paid out during period 0 16 315 52 7 17 40 447 639reduced through explicit riskadjustments8 0 0 7 0 0 0 0 7 3
Number of beneficiaries ofguaranteed variable remuneration(incl. sign-on payments) 0 0 4 0 0 0 0 4 27Total amount of guaranteed variablepay (incl. sign-on payments) 0 0 2 0 0 0 0 2 21
Total amount of severancepayments granted during period9 0 29 15 3 8 0 2 58 21Number of beneficiaries ofseverance payments granted duringperiod 1 6 82 7 3 3 6 108 53Highest severance payment grantedto an individual during period 0 11 1 1 4 0 2 11 51 The table may contain marginal rounding differences. Employees are allocated to columns based on their primary role. 2017 values are based on the values disclosed in the
2017 report and include the full value of the Retention Award Program granted to MRTs in 2017.2 Supervisory Board includes the Supervisory Board members of all Significant Institutions within Deutsche Bank Group at year-end. Employee representatives solely identified
due to their Supervisory Board role are considered with their compensation for the Supervisory Board role only.3 Management Board includes the respective board members of all Significant Institutions within Deutsche Bank Group at year-end. PCB includes Postbank units. As the
determination of VC for some employees in Postbank units continues even beyond the publication of this report, the VC for MRTs in Postbank units is considered based onpreliminary data. Final values will be disclosed in the compensation reports of DB Privat- und Firmenkundenbank AG as well as BHW Bausparkasse AG. DWS includes onlyInstVV Material Risk Takers within DWS Group. Independent Control Functions include Chief Risk Officer, Group Audit, Compliance, Anti-Financial Crime. CorporateFunctions comprise any infrastructure function which is neither captured as an Independent Control Function nor part of any division.
4 Senior Management is defined as Deutsche Bank’s Senior Leadership Cadre, plus Management Board members of Significant Institutions and their direct reports (excl. non-management/-strategic roles) – excluding DWS Executive Board. All Senior Management employees are also considered InstVV MRTs. Management Board members ofSignificant Institutions are only included in the Management Board column.
5 Fixed Pay in cash includes base salary, allowances and material benefits (pension expenses).6 Fixed Pay in shares is only granted to members of the Deutsche Bank AG Supervisory Board as described in the chapter Compensation System for Supervisory Board
Members.7 Total Variable Pay for period includes Deutsche Bank’s year-end performance-based VC awards for 2018 and other VC commitments in the relevant period, as well as
severance payments. Buyouts and Long-term Incentive Plans are not included.8 Includes penalty (malus) and clawback.9 Severance payments are generally paid out in the year in which they have been granted.

195
Deutsche Bank Employee Compensation ReportAnnual Report 2018 Material Risk Taker Compensation Disclosure
Remuneration of high earners2018
in € Number of employeesTotal Pay
1,000,000 to 1,499,999 3561,500,000 to 1,999,999 1252,000,000 to 2,499,999 612,500,000 to 2,999,999 313,000,000 to 3,499,999 153,500,000 to 3,999,999 224.000,000 to 4,499,999 54,500,000 to 4,999,999 35,000,000 to 5,999,999 146,000,000 to 6,999,999 87,000,000 to 7,999,999 18,000,000 to 8,999,999 09,000,000 to 9,999,999 210,000,000 to 10,999,999 0
Total 6431 Compared to 2017, high earners in Postbank units and pension expenses as well as severance payments are considered for the first time. Buyouts and Long-term Incentive
Plans not included.
In total, 643 employees received a Total Pay of € 1 million or more for 2018, compared to 705 employees in 2017 and 316employees in 2016. Based on the same definitions as used in previous years – excluding pension expenses and severances– the number of high earners for 2018 would be 607 employees.
The table above does not include the four members of the Group Management Board who left the Management Board in2018. In addition to the fixed and variable remuneration and the service costs (IFRS) for pension benefits, terminationagreements were concluded with all four members of the Management Board in which termination benefits (severancepayments and compensation for waiting periods) were agreed to which the members of the Management Board are entitledon the basis of their service contracts (in one case two service contracts). If all compensation components are added, the totalamount in one case is between € 4.5 and 5 million, in one case between € 7 and 8 million, in one case between€ 13 and 14 million and in one case between € 15 and 16 million. Details of all components are disclosed in the ManagementBoard Compensation Report.

196
Deutsche Bank 1 – Management ReportAnnual Report 2018
Compensation System for Supervisory BoardMembers
The compensation principles for Supervisory Board members are set forth in our Articles of Association, which ourshareholders amend from time to time at the Annual General Meeting. Such compensation provisions, which were newlyconceived in 2013, were last amended by resolution of the Annual General Meeting on May 18, 2017 and became effectiveon October 5, 2017. Accordingly, the following provisions apply:
The members of the Supervisory Board receive fixed annual compensation (“Supervisory Board Compensation”). The annualbase compensation amounts to € 100,000 for each Supervisory Board member. The Supervisory Board Chairman receivestwice that amount and the Deputy Chairperson one and a half times that amount.
Members and chairs of the committees of the Supervisory Board are paid additional fixed annual compensation as follows:
Dec 31, 2018Committeein € Chairperson MemberAudit Committee 200,000 100,000Risk Committee 200,000 100,000Nomination Committee 100,000 50,000Mediation Committee 0 0Integrity Committee 200,000 100,000Chairman’s Committee 100,000 50,000Compensation Control Committee 100,000 50,000Strategy Committee 100,000 50,000Technology, Data and Innovation Committee 100,000 50,000
75 % of the compensation determined is disbursed to each Supervisory Board member after submitting invoices within thefirst three month of the following year. The other 25 % is converted by the company at the same time into company sharesbased on the average closing price on the Frankfurt Stock Exchange (Xetra or successor system) during the last ten tradingdays of the preceding January, calculated to three digits after the decimal point. The share value of this number of shares ispaid to the respective Supervisory Board member in February of the year following his departure from the Supervisory Boardor the expiration of his term of office, based on the average closing price on the Frankfurt Stock Exchange (Xetra or successorsystem) during the last ten trading days of the preceding January, provided that the member does not leave the SupervisoryBoard due to important cause which would have justified dismissal.
In case of a change in Supervisory Board membership during the year, compensation for the financial year will be paid on apro rata basis, rounded up/down to full months. For the year of departure, the entire compensation is paid in cash; a forfeitureregulation applies to 25 % of the compensation for that financial year.
The company reimburses the Supervisory Board members for the cash expenses they incur in the performance of their office,including any value added tax (VAT) on their compensation and reimbursements of expenses. Furthermore, any employercontributions to social security schemes that may be applicable under foreign law to the performance of their SupervisoryBoard work shall be paid for each Supervisory Board member affected. Finally, the Chairman of the Supervisory Board will beappropriately reimbursed for travel expenses incurred in performing representative tasks that his function requires and for thecosts of security measures required on account of his function.
In the interest of the company, the members of the Supervisory Board will be included in an appropriate amount, with adeductible, in any financial liability insurance policy held by the company. The premiums for this are paid by the company.

197
Deutsche Bank Compensation System for Supervisory Board MembersAnnual Report 2018 Supervisory Board Compensation for the 2018 Financial Year
Supervisory Board Compensation for the 2018 Financial YearIndividual members of the Supervisory Board received the following compensation for the 2018 financial year (excluding valueadded tax).
Compensation for fiscal year 2018 Compensation for fiscal year 2017
Members of the Supervisory Boardin € Fixed
Thereof payablein 1st quarter
2019 FixedThereof paid in
1st quarter 2018Dr. Paul Achleitner1 858,333 643,750 800,000 683,333Detlef Polaschek2 262,500 196,875 0 0Stefan Rudschäfski3 125,000 125,000 300,000 225,000Ludwig Blomeyer-Bartenstein2 175,000 131,250 0 0Wolfgang Böhr3 83,333 83,333 200,000 150,000Frank Bsirske4 279,167 235,417 250,000 187,500Mayree Carroll Clark2 204,167 153,125 0 0Dina Dublon5 175,000 175,000 300,000 225,000Jan Duscheck4 187,500 151,042 100,000 75,000Dr. Gerhard Eschelbeck6 129,167 96,875 58,333 43,750Katherine Garrett-Cox 241,667 181,250 200,000 150,000Timo Heider4 229,167 192,708 200,000 150,000Sabine Irrgang3 83,333 83,333 200,000 150,000Prof. Dr. Henning Kagermann3 104,167 104,167 250,000 187,500Martina Klee4 170,833 148,958 200,000 150,000Peter Löscher7 0 0 83,333 83,333Henriette Mark4 229,167 192,708 200,000 150,000Richard Meddings 429,167 321,875 400,000 300,000Louise Parent3 125,000 125,000 400,000 300,000Gabriele Platscher4 258,333 214,583 200,000 150,000Bernd Rose4 229,167 192,708 200,000 150,000Gerd Alexander Schütz8 129,167 107,292 58,333 43,750Prof. Dr. Stefan Simon 487,500 365,625 216,667 162,500Stephan Szukalski2 116,667 87,500 0 0Dr. Johannes Teyssen3 104,167 104,167 250,000 187,500John Alexander Thain2 116,667 87,500 0 0Michele Trogni2 175,000 131,250 0 0Prof. Dr. Klaus Rüdiger Trützschler7 0 0 83,333 83,333Prof. Dr. Norbert Winkeljohann9 58,333 43,750 0 0Total 5,766,669 4,676,041 5,150,000 3,987,5001 Member was re-elected on May 18, 2017.2 Member since May 24, 2018.3 Member until May 24, 2018.4 As Employee representatives on April 26, 2018 re-elected.5 Member since July 31, 2018.6 Member since May 18, 2017.7 Member until May 18, 2017.8 Member since May 18, 2017. Re-elected on May 24, 2018.9 Member since August 1, 2018.
Following the submission of invoices 25 % of the compensation determined for each Supervisory Board member for the 2018financial year was converted into notional shares of the company on the basis of a share price of € 7.9747 (average closingprice on the Frankfurt Stock Exchange (Xetra) during the last ten trading days of January 2019). Members who left theSupervisory Board in 2018 were paid the entire amount of compensation in cash. For members whose term of office ended in2018, the total compensation for the period until then, was paid fully in cash.
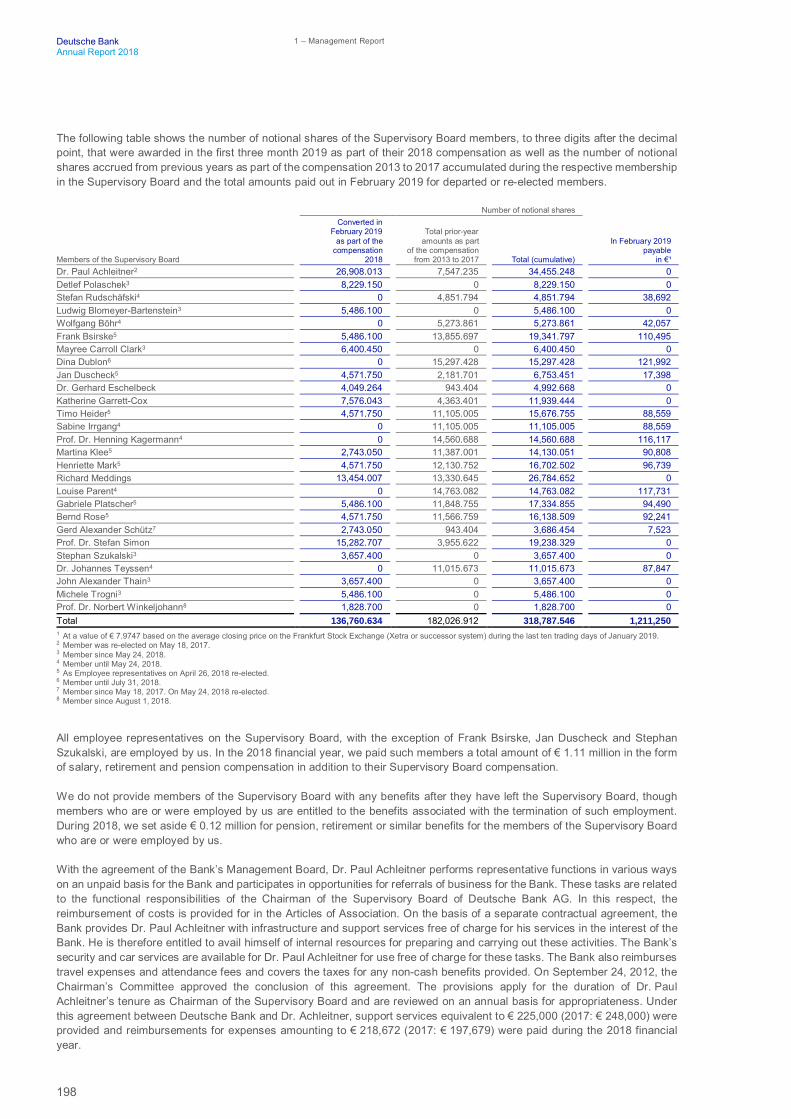
198
Deutsche Bank 1 – Management ReportAnnual Report 2018
The following table shows the number of notional shares of the Supervisory Board members, to three digits after the decimalpoint, that were awarded in the first three month 2019 as part of their 2018 compensation as well as the number of notionalshares accrued from previous years as part of the compensation 2013 to 2017 accumulated during the respective membershipin the Supervisory Board and the total amounts paid out in February 2019 for departed or re-elected members.
Number of notional shares
Members of the Supervisory Board
Converted inFebruary 2019
as part of thecompensation
2018
Total prior-yearamounts as part
of the compensationfrom 2013 to 2017 Total (cumulative)
In February 2019payable
in €¹Dr. Paul Achleitner2 26,908.013 7,547.235 34,455.248 0Detlef Polaschek3 8,229.150 0 8,229.150 0Stefan Rudschäfski4 0 4,851.794 4,851.794 38,692Ludwig Blomeyer-Bartenstein3 5,486.100 0 5,486.100 0Wolfgang Böhr4 0 5,273.861 5,273.861 42,057Frank Bsirske5 5,486.100 13,855.697 19,341.797 110,495Mayree Carroll Clark3 6,400.450 0 6,400.450 0Dina Dublon6 0 15,297.428 15,297.428 121,992Jan Duscheck5 4,571.750 2,181.701 6,753.451 17,398Dr. Gerhard Eschelbeck 4,049.264 943.404 4,992.668 0Katherine Garrett-Cox 7,576.043 4,363.401 11,939.444 0Timo Heider5 4,571.750 11,105.005 15,676.755 88,559Sabine Irrgang4 0 11,105.005 11,105.005 88,559Prof. Dr. Henning Kagermann4 0 14,560.688 14,560.688 116,117Martina Klee5 2,743.050 11,387.001 14,130.051 90,808Henriette Mark5 4,571.750 12,130.752 16,702.502 96,739Richard Meddings 13,454.007 13,330.645 26,784.652 0Louise Parent4 0 14,763.082 14,763.082 117,731Gabriele Platscher5 5,486.100 11,848.755 17,334.855 94,490Bernd Rose5 4,571.750 11,566.759 16,138.509 92,241Gerd Alexander Schütz7 2,743.050 943.404 3,686.454 7,523Prof. Dr. Stefan Simon 15,282.707 3,955.622 19,238.329 0Stephan Szukalski3 3,657.400 0 3,657.400 0Dr. Johannes Teyssen4 0 11,015.673 11,015.673 87,847John Alexander Thain3 3,657.400 0 3,657.400 0Michele Trogni3 5,486.100 0 5,486.100 0Prof. Dr. Norbert Winkeljohann8 1,828.700 0 1,828.700 0Total 136,760.634 182,026.912 318,787.546 1,211,2501 At a value of € 7.9747 based on the average closing price on the Frankfurt Stock Exchange (Xetra or successor system) during the last ten trading days of January 2019.2 Member was re-elected on May 18, 2017.3 Member since May 24, 2018.4 Member until May 24, 2018.5 As Employee representatives on April 26, 2018 re-elected.6 Member until July 31, 2018.7 Member since May 18, 2017. On May 24, 2018 re-elected.8 Member since August 1, 2018.
All employee representatives on the Supervisory Board, with the exception of Frank Bsirske, Jan Duscheck and StephanSzukalski, are employed by us. In the 2018 financial year, we paid such members a total amount of € 1.11 million in the formof salary, retirement and pension compensation in addition to their Supervisory Board compensation.
We do not provide members of the Supervisory Board with any benefits after they have left the Supervisory Board, thoughmembers who are or were employed by us are entitled to the benefits associated with the termination of such employment.During 2018, we set aside € 0.12 million for pension, retirement or similar benefits for the members of the Supervisory Boardwho are or were employed by us.
With the agreement of the Bank’s Management Board, Dr. Paul Achleitner performs representative functions in various wayson an unpaid basis for the Bank and participates in opportunities for referrals of business for the Bank. These tasks are relatedto the functional responsibilities of the Chairman of the Supervisory Board of Deutsche Bank AG. In this respect, thereimbursement of costs is provided for in the Articles of Association. On the basis of a separate contractual agreement, theBank provides Dr. Paul Achleitner with infrastructure and support services free of charge for his services in the interest of theBank. He is therefore entitled to avail himself of internal resources for preparing and carrying out these activities. The Bank’ssecurity and car services are available for Dr. Paul Achleitner for use free of charge for these tasks. The Bank also reimbursestravel expenses and attendance fees and covers the taxes for any non-cash benefits provided. On September 24, 2012, theChairman’s Committee approved the conclusion of this agreement. The provisions apply for the duration of Dr. PaulAchleitner’s tenure as Chairman of the Supervisory Board and are reviewed on an annual basis for appropriateness. Underthis agreement between Deutsche Bank and Dr. Achleitner, support services equivalent to € 225,000 (2017: € 248,000) wereprovided and reimbursements for expenses amounting to € 218,672 (2017: € 197,679) were paid during the 2018 financialyear.

199
Deutsche Bank EmployeesAnnual Report 2018 Group Headcount
Corporate Responsibility
Our approach to sustainability is grounded on the “triple bottom line” concept that encompasses the dimensions of people,planet and profit. For us, this means sustainable business performance, that balances economic success with environmentaland social responsibility
Deutsche Bank’s Code of Conduct comprehends our purpose, values, and beliefs, as well as the minimum standards ofconduct to which everybody at the bank has to adhere. While underlining the relevance of effective rules and controls, theCode also outlines our commitment to foster a business approach that considers the direct and indirect economic, social, andenvironmental impacts of our business decisions on our stakeholders. The principles laid out in our Code of Conduct arereflected in our management structures, policies and processes and control systems. We continually monitor developmentsin our business environment, and review and adjust our internal frameworks accordingly.
We value open dialogue with our stakeholders and respect their diverse expectations. Together, this helps us make informeddecisions while continually shaping our sustainability approach.
Furthermore, our sustainability approach is informed by internationally recognized standards and principles. We seek to alignwith global agreements such as the UN Sustainable Development Goals, and the Paris Agreement on climate change andvoluntarily commit ourselves to best practice principles including the Ten Principles of the UN United Nations Global Compact,the UN Principles for Responsible Investment, and UN Guiding Principles on Business and Human Rights. We reinforce ourcommitment on specific issues such as climate change and human rights by publicly communicating our support e.g. viasigning the Paris Pledge for Action or publishing dedicated statements such as our Human Rights Statement.
Deutsche Bank’s Management Board is responsible for the integration of sustainability across the bank. A centrally organizedsustainability team within our Communications & CSR function acts as an interface between internal and externalstakeholders. Our Group-wide Sustainability Council acts as advisory body to the Management Board and will further developand enforce the bank’s sustainability approach.
For more information on sustainability, please visit the consolidated Non-Financial Report 2018 (NFRep 2018) for DeutscheBank Group. The NFRep 2018 includes the legally required information in accordance with § 315 (3) of the GermanCommercial Code, marked by a bracket. The NFRep 2018 PDF is published on our Investor Relations website atdb.com/annual-reports.
Employees
Group HeadcountAs of December 31, 2018, we employed a total of 91,737 staff members compared to 97,535 as of December 31, 2017.We calculate our employee figures on a full-time equivalent basis, meaning we include proportionate numbers of part-timeemployees.
The following table shows our numbers of full-time equivalent employees as of December 31, 2018, 2017 and 2016.
Employees1 Dec 31, 2018 Dec 31, 2017 Dec 31, 2016Germany 41,669 42,526 44,600Europe (outside Germany), Middle East and Africa 20,871 23,543 24,062Asia/Pacific 19,732 20,861 20,099North America2 9,275 10,358 10,611Latin America 189 247 373Total employees 91,737 97,535 99,7441 Full-time equivalent employees; in 2018 BHW KSG aligned its FTE definition to Deutsche Bank which increased the Group number as of December 31, 2018 by 95 (prior
periods not restated).2 Primarily the United States.

200
Deutsche Bank 1 – Management ReportAnnual Report 2018
The number of our employees decreased in 2018 by 5,797 or 5.9 % driven by implementation of our targets announced inMay 2018:
– Germany (-857; -2.0 %) driven by the implementation of restructuring measures, primarily in Private & Commercial Bankrelated to closure of branches;
– North America (-1,083; -11.3 %) driven mostly by reductions in Corporate & Investment Bank and in COO;– Latin America (-58; -23.5 %) due to reductions primarily in Brazil as a result of the implementation of our footprint strategy;– EMEA ex Germany (-2,672; -11.3 %) particularly a result of the demerger of the private and commercial banking business
in Poland;– Asia/Pacific (-1,128; -5.4 %) primarily driven by reductions in COO (-837).
Employees Dec 31, 2018 Dec 31, 2017 Dec 31, 2016Corporate & Investment Bank 17.8 % 18.1 % 18.2 %Private & Commercial Bank 45.5 % 45.1 % 45.6 %Asset Management 4.4 % 4.1 % 4.1 %Non-Core Operations Unit 0.0 % 0.0 % 0.1 %Infrastructure 32.3 % 32.7 % 32.0 %
– Corporate & Investment Bank (-1,314; -7.4 %) driven by reductions in the global financial centers primarily in the US, UK,Hong Kong and Singapore;
– Private & Commercial Bank (-2,244; -5.1 %) driven by the demerger of the private and commercial banking business inPoland and of reductions in Germany;
– Asset Management/DWS (+11; +0.3 %);– Infrastructure functions (-2,250; -7.1 %) primarily driven by reductions in COO (-1,746), which were partly offset by
insourcing of business critical external roles and further strengthening of Anti-Financial Crime division.
Labor RelationsIn Germany, labor unions and employers’ associations generally negotiate collective bargaining agreements on salaries andbenefits for employees below the management level. Many companies in Germany, including ourselves and our materialGerman subsidiaries, are members of employers’ associations and are bound by collective bargaining agreements.
Accordingly, our employers’ association, the Arbeitgeberverband des privaten Bankgewerbes e.V., regularly renegotiates thecollective bargaining agreements that cover many of our employees. The current agreement reached in July 2016 includesthe period from May 2016 onwards. After five months without any pay raise, a first pay raise of 1.5 % takes place from October2016 on, a second pay rise of 1.1 % from January 2018 on, and a third pay raise of 1.1 % from November 2018 on. Theexisting collective bargaining agreement lasts until January 31, 2019. Negotiations on a new collective bargaining agreementtake place in the first half of 2019.
Our employers’ association negotiates with the following unions:
– ver.di (Vereinigte Dienstleistungsgewerkschaft), a union formed in July 2001 resulting from the merger of five unions,including the former bank unions Deutsche Angestellten Gewerkschaft and Gewerkschaft Handel, Banken undVersicherungen;
– Deutscher Bankangestellten Verband (DBV – Gewerkschaft der Finanzdienstleister);– Deutscher Handels- und Industrieangestellten Verband (DHV – Die Berufsgewerkschaft).
German law prohibits us from asking our employees whether they are members of labor unions. Therefore, we do not knowhow many of our employees are union members. Approximately 15 % of the employees in the German banking industry areunionized. We estimate that less than 15 % of our employees in Germany are unionized (excluding former Postbank, whichitself traditionally has a significantly higher unionization rate of approximately 60 %). On a worldwide basis, we estimate thatapproximately 15 % of our employees are members of labor unions (including former Postbank, less than 25 %).
As of December 31, 2018, 31 % of former Postbank staff members in Germany are civil servants (full-time equivalent basis),compared to 32 % as of December 31, 2017.

201
Deutsche Bank EmployeesAnnual Report 2018 Promoting internal career mobility
Post-Employment Benefit PlansWe sponsor a number of post-employment benefit plans on behalf of our employees, both defined contribution plans anddefined benefit plans.
In our globally coordinated accounting process covering defined benefit plans with a defined benefit obligation exceeding€ 2 million our global actuary reviews the valuations provided by locally appointed actuaries in each country.
By applying our global principles for determining the financial and demographic assumptions we ensure that the assumptionsare best-estimate, unbiased and mutually compatible, and that they are globally consistent.
For a further discussion on our employee benefit plans see Note 35 “Employee Benefits” to our consolidated financialstatements.
RestructuringThe bank’s regions were impacted by different measures. All regions have been impacted by the restructuring measures.Europe (excluding Germany and UK) saw the sharpest decline in employee numbers (-2,672 FTE), largely driven by the saleof the retail business in Poland in the fourth quarter of 2018. In 2018, we continued to insource business-critical external roles,especially in IT.
Talent acquisitionThe voluntary staff turnover rate was at 8.4% in 2018 (2017: 7.8%). The slight increase of 0.6 percentage points is primarilydue to a higher fluctuation in Asia/Pacific (2018: 18.0%, 2017: 16.8%), whereas voluntary staff turnover rate in Germanyremained on a low level (2018: 2.0%, 2017: 2.0%). However, this fluctuation remains at a normal level.
Recruiting talent continues to be a key priority for Deutsche Bank. Filling open positions in front-office roles and operationscenters was again a priority in 2018, as was hiring talent to meet the growing demand in regulatory roles (e.g. Anti-FinancialCrime, Audit and Compliance). Additionally, talent acquisition focused on insourcing of 1,207 external roles (2017: 1,446),particularly in IT, as well as hiring 1,517 young talents (2017: 1,235), therein 910 graduates (2017: 619) and 607 vocationaltrainees in Germany (2017: 616).
Promoting internal career mobilityInternal mobility plays a vital role in retaining qualified and talented employees and keeping their expertise and experiencewithin the bank. In 2018, we continued to develop and embed our internal mobility strategy and uphold our commitment tofilling vacant positions with suitable internal candidates. All vacant positions are first advertised to internal staff for at least twoweeks. Prioritizing internal candidates helps employees affected by restructuring find new roles at the bank. We also promotecross-divisional mobility to enable employees to expand their skills and experience for rounded careers. Furthermore, internalmobility helps reduce the bank’s redundancy and recruitment costs. 37% (2017: 32%) of all job vacancies were filled internallyin 2018 (excl. Postbank). In Germany the figure was 65% (2017: 66%) due to redundancies caused by restructuring measures,as well as by changes resulting from digitalization and control functions.

202
Deutsche Bank 1 – Management ReportAnnual Report 2018
Diversity and InclusionAs a global organization, Deutsche Bank is committed to an inclusive culture that respects and embraces the diversity of ouremployees, clients, and communities. As diversity and inclusion are central to the bank’s culture, we seek to:
– Build talented and diverse teams to drive business results– Create a respectful and inclusive environment where people can thrive– Strengthen our relationship with clients, partners, regulators, communities, and potential employees
We aim to attract, develop, and retain the best people from all cultures, countries, races, ethnicities, genders, sexualorientations, abilities, beliefs, backgrounds, and experiences. To this end, and to prepare for opportunities and challengesarising from changing demographics and digitalization, we follow an integrated and multi-dimensional approach to diversityand inclusion.
Deutsche Bank continued its efforts to advance women in the workplace throughout 2018. The percentage of women on theSupervisory Board stood at 30% at the end of the year (2017: 35%), which met the statutory requirement of 30% for listed andco-determined German companies under gender quota legislation introduced in 2015.
The latest Supervisory Board’s target for the Management Board was set in 2017 as at least 20% female members by June30, 2022. This translates to two women given a Management Board size of between eight and twelve members. With onewoman (Chief Regulatory Officer) currently on the Management Board, this target has not yet been met. Within the DiversityPrinciples of the Suitability Guidelines for selecting the members of the Management Board, the Supervisory Board is workingtowards the 2022 target.
As of year-end 2018, 20.0% of positions at the first management level below the Management Board were held by femaleexecutives (2017: 18%). At the second level below the Management Board, this percentage stood at 21% (2017: 19.6%). Inaccordance with legal requirement in Germany, the bank set targets for December 31, 2020 of 20% and 25%, respectively.
In 2011, Deutsche Bank signed a voluntary declaration to substantially raise the proportion of female managers globally bythe end of 2018. As of year-end 2018, the percentage of female Managing Directors and Directors stood at 22.8% (excludingPostbank 2017: 21.9%). Since 2010, the number of women at this level has increased by 24.1%. The share of female officerswas 33.6% (2017: 33.3%).
For the first time in 2018, Deutsche Bank made the list of the top 100 most inclusive companies on the Thomson Reuters D&IIndex. Now in its third year, this investable index is informed by ESG data and evaluates companies on various componentsof inclusion. Deutsche Bank ranks #68 of all the 2,173 companies evaluated. This puts us in the top 100, which is the investibleindex referenced. In the banking services category, we ranked fourth out of 185 companies and sixth out of 84 Germancompanies.
During almost 20 years of experience in diversity and inclusion, a number of key external partnerships were built across theglobe. These partnerships not only help us to drive our internal agenda. They also enable us to share good practice and topositively impact on the societies we are operating in. We are convinced that his helps us to strengthen relationships withclients, partners and communities.
– In Germany the bank is a founding member and currently management board member of the Charta der Vielfalt (Charterof Diversity), an association under the patronage of Chancellor Angela Merkel that actively fosters diversity in theworkplace.
– Elsewhere, Deutsche Bank is a founding signatory of the U.K. Treasury’s Women in Finance Charter, promoting a moregender-balanced financial services industry, as well as the Charte de la Diversité in Luxembourg, the Charter Diversidadin Spain, the Manifesto for Women’s Employment in Italy, and i-Gen, the Portuguese business forum for gender diversity.

203
Deutsche Bank EmployeesAnnual Report 2018 Key employee figures
DigitalizationTechnological developments offer unprecedented opportunities for banks. In their traditional business model, they areincreasingly being challenged by providers of disruptive business models. Banks are faced with the task of making theirexisting business efficient and profitable while developing new business opportunities. Deutsche Bank's aim is to position itselfas a technology company, be a leader in digital banking with new ideas, and establish systematic research and developmentfor innovations through combining state-of-the-art technology with analyst know-how, e.g. ROBIN, Deutsche Bank's digitalasset management. The continuous need to make decisions in this area demands not only the knowledge and experience ofemployees, but also a high degree of willingness and ability to develop completely new and hitherto unknown areas.
Designing effective and future-oriented HR work means explaining to existing and future employees the sense, direction, andorientation of Deutsche Bank’s path and strategy in our fast-moving and dynamic business environment. Since this ischaracterized by unpredictability and increasing complexity that make decision-making difficult, the question of how quicklywe recognize internal and external changes and how effectively we react to them to offer clients added value will be crucial inthe future.
Key employee figuresA few selected employee figures and KPIs are set forth below. For full details on Deutsche Bank’s people metrics, as well asits strategic HR priorities and achievements, please refer to the bank’s Human Resources Report 2018.
Dec 31, 2018 Dec 31, 2017 Dec 31, 2016Female staff (based upon global corporate titles, in FTE)¹
Female Managing Directors and Directors 22.8 % 21.9 % 21.3 %Female officers 33.6 % 33.3 % 32.8 %Female non-officers 56.5 % 55.8 % 55.6 %
Total female staff 41.7 % 41.6 % 41.5 %Age (in %, headcount)
up to 29 years 15.5 % 16.2 % 17.1 %30 - 39 years 29.3 % 30.1 % 29.9 %40 - 49 years 27.6 % 27.7 % 28.2 %Over 49 years 27.6 % 26.0 % 24.8 %
Part-time employment (in % of total staff)Germany 23.9 % 24.4 % 23.7 %Europe (outside Germany), Middle East and Africa 6.4 % 6.5 % 6.2 %Americas 0.5 % 0.4 % 0.4 %Asia/Pacific 0.2 % 0.2 % 0.2 %
Total part-time employment 13.1 % 13.0 % 12.9 %Apprentices ratio in Germany 3.4 % 3.6 % 3.9 %
2018 2017 2016Commitment index²
Germany 50 % 51 % 52 %UK 51 % 52 % 57 %Europe (outside Germany & UK), Middle East and Africa 62 % 60 % 63 %Americas 56 % 54 % 61 %Asia/Pacific 68 % 67 % 68 %
Total Commitment Index 57 % 57 % 58 %Voluntary staff turnover rate
Germany 2.0 % 2.0 % 1.8 %Europe (outside Germany), Middle East and Africa 9.2 % 8.5 % 7.0 %Americas 14.1 % 13.0 % 11.3 %Asia/Pacific 18.0 % 16.8 % 17.1 %
Total voluntary staff turnover rate 8.4 % 7.8 % 7.2 %Health rate (in %)³ 93.9 % 94.2 % 94.3 %1 Excluding legal entities outside of DB Corporate Title system, primarily former Postbank.2 Excluding former Postbank.3 Health rate: 100 - ((total sickness days x 100)/total regular working days); Germany excluding primarily former Postbank.

204
Deutsche Bank 1 – Management ReportAnnual Report 2018
Internal Control over Financial Reporting
GeneralManagement of Deutsche Bank and its consolidated subsidiaries is responsible for establishing and maintaining adequateinternal control over financial reporting (ICOFR). Our internal control over financial reporting is a process designed under thesupervision of our chairman and our Chief Financial Officer to provide reasonable assurance regarding the reliability offinancial reporting and the preparation of the company’s consolidated financial statements for external reporting purposes inaccordance with International Financial Reporting Standards (IFRS). ICOFR includes our disclosure controls and proceduresdesigned to prevent misstatements.
Risks in Financial ReportingThe main risks in financial reporting are that either financial statements do not present a true and fair view due to inadvertentor intentional errors (fraud) or the publication of financial statements is not done on a timely basis. These risks may reduceinvestor confidence or cause reputational damage and may have legal consequences including banking regulatoryinterventions. A lack of fair presentation arises when one or more financial statement amounts or disclosures containmisstatements (or omissions) that are material. Misstatements are deemed material if they could, individually or collectively,influence economic decisions that users make on the basis of the financial statements.
To confine those risks of financial reporting, management of the Group has established ICOFR with the aim of providingreasonable but not absolute assurance against material misstatements and conducted an assessment of the effectiveness ofthe Group’s internal control over financial reporting based on the framework established in Internal Control IntegratedFramework (2013) issued by the Committee of Sponsoring Organizations of the Treadway Commission (COSO). COSOrecommends the establishment of specific objectives to facilitate the design and evaluate adequacy of a control system. As aresult in establishing ICOFR, management has adopted the following financial statement objectives:
– Existence - assets and liabilities exist and transactions have occurred.– Completeness - all transactions are recorded, account balances are included in the financial statements.– Valuation - assets, liabilities and transactions are recorded in the financial reports at the appropriate amounts.– Rights and Obligations and ownership - rights and obligations are appropriately recorded as assets and liabilities.– Presentation and disclosures - classification, disclosure and presentation of financial reporting is appropriate.– Safeguarding of assets - unauthorized acquisition, use or disposition of assets is prevented or detected in a timely manner.
However, any internal control system, including ICOFR, no matter how well conceived and operated, can provide onlyreasonable, but not absolute assurance that the objectives of that control system are met. As such, disclosure controls andprocedures or systems for ICOFR may not prevent all errors and fraud. Also, projections of any evaluation of effectiveness tofuture periods, are subject to the risk that controls may become inadequate because of changes in conditions, or that thedegree of compliance with policies or procedures may deteriorate. Further, the design of a control system must reflect the factthat there are resource constraints, and the benefits of controls must be considered relative to their costs.
On January 1, 2018, we adopted IFRS 9 and have updated and modified certain internal controls over financial reporting asa result of the new accounting standard.
205
Deutsche Bank Internal Control over Financial ReportingAnnual Report 2018 Risks in Financial Reporting
Controls to Minimize the Risk of Financial Reporting Misstatement
The system of ICOFR includes those policies and procedures that:
– Pertain to the maintenance of records, that, in reasonable detail, accurately and fairly reflect the transactions anddispositions of the company’s assets;
– Provide reasonable assurance that transactions are recorded as necessary to permit preparation of financial statements inaccordance with generally accepted accounting principles, and that receipts and expenditures of the company are beingmade only in accordance with authorizations of the company’s management and;
– Provide reasonable assurance regarding prevention or timely detection of unauthorized acquisition, use of disposition ofthe company’s assets that could have a material effect on the financial statements.
Measuring Effectiveness of Internal Control
Each year, management of the Group undertakes a formal evaluation of the adequacy and effectiveness of the system ofICOFR. This evaluation incorporates an assessment of the effectiveness of the control environment as well as individualcontrols which make up the system of ICOFR taking into account:
– The financial misstatement risk of the financial statement line items, considering such factors as materiality and thesusceptibility of the particular financial statement item to misstatement.
– The susceptibility of identified controls to failure, considering such factors as the degree of automation, complexity, andrisk of management override, competence of personnel and the level of judgment required.
These factors determine in their entirety the type and scope of the evidence required by § 315 HGB, which the managementneeds to assess whether or not the established ICOFR is effective. The evidence itself is generated from procedures integratedwithin the daily responsibilities of staff or from procedures implemented specifically for purposes of the ICOFR evaluation.Information from other sources also form an important component of the evaluation since such evidence may either bringadditional control issues to the attention of management or may corroborate findings. Such information sources include:
– Reports on audits carried out by or on behalf of regulatory authorities;– External Auditor reports; and,– Reports commissioned to evaluate the effectiveness of outsourced processes to third parties.
In addition, Group Audit evaluates the design and operating effectiveness of ICOFR by performing periodic and ad-hoc risk-based audits. Reports are produced summarizing the results from each audit performed which are distributed to theresponsible managers for the activities concerned. These reports also provide evidence to support the annual evaluation bymanagement of the overall operating effectiveness of the ICOFR.
As a result of the evaluation, management has concluded that ICOFR is appropriately designed and operating effectively asof December 31, 2018.
The Group’s independent auditors, KPMG AG, have issued an unqualified opinion on the effectiveness of the Group’s internalcontrol over financial reporting as of December 31, 2018, as stated in their report, which appears herein.
206
Deutsche Bank 1 – Management ReportAnnual Report 2018
Information pursuant to Section 315a (1) of theGerman Commercial Code and Explanatory Report
Structure of the Share Capital including Authorized andConditional CapitalFor information regarding Deutsche Bank’s share capital please refer to Note 34 “Common Shares” to the ConsolidatedFinancial Statements.
Restrictions on Voting Rights or the Transfer of SharesUnder Section 136 of the German Stock Corporation Act the voting right of the affected shares is excluded by law. As far asthe bank held own shares as of December 31, 2018 in its portfolio according to Section 71b of the German Stock CorporationAct no rights could be exercised. We are not aware of any other restrictions on voting rights or the transfer of shares.
Shareholdings which Exceed 10% of the Voting RightsThe German Securities Trading Act (Wertpapierhandelsgesetz) requires that any investor whose share of voting rightsreaches, exceeds or falls below certain thresholds as the result of purchases, disposals or otherwise, must notify us and theGerman Federal Financial Supervisory Authority (BaFin) thereof. The lowest threshold is 3 %. We are not aware of anyshareholder holding directly or indirectly 10 % or more of the voting rights.
Shares with Special Control RightsShares which confer special control rights have not been issued.
System of Control of any Employee Share Scheme where theControl Rights are not Exercised Directly by the EmployeesThe employees, who hold Deutsche Bank shares, exercise their control rights as other shareholders in accordance withapplicable law and the Articles of Association (Satzung).

207
Deutsche Bank Information pursuant to Section 315a (1) of the German Commercial Code and Explanatory ReportAnnual Report 2018 Rules Governing the Amendment of the Articles of Association
Rules Governing the Appointment and Replacement ofMembers of the Management BoardPursuant to the German Stock Corporation Act (Section 84) and the Articles of Association of Deutsche Bank (Section 6) themembers of the Management Board are appointed by the Supervisory Board. The number of Management Board membersis determined by the Supervisory Board. According to the Articles of Association, the Management Board has at least threemembers. The Supervisory Board may appoint one or two members of the Management Board as Chairpersons of theManagement Board. Members of the Management Board may be appointed for a maximum term of up to five years. Theymay be reappointed or have their term extended for one or more terms of up to a maximum of five years each. The GermanCo-Determination Act (Mitbestimmungsgesetz; Section 31) requires a majority of at least two thirds of the members of theSupervisory Board to appoint members of the Management Board. If such majority is not achieved, the Mediation Committeeshall give, within one month, a recommendation for the appointment to the Management Board. The Supervisory Board willthen appoint the members of the Management Board with the majority of its members. If such appointment fails, theChairperson of the Supervisory Board shall have two votes in a new vote. If a required member of the Management Boardhas not been appointed, the Local Court (Amtsgericht) in Frankfurt am Main shall, in urgent cases, make the necessaryappointments upon motion by any party concerned (Section 85 of the Stock Corporation Act).
Pursuant to the German Banking Act (Kreditwesengesetz) and Regulation (EU) No 468/2014 of the European Central Bank(SSM Framework Regulation) evidence must be provided to the European Central Bank (ECB), the German Federal FinancialSupervisory Authority (BaFin) and the Deutsche Bundesbank that the member of the Management Board has adequatetheoretical and practical experience of the businesses of the Bank as well as managerial experience before the member isappointed (Sections 24 (1) No. 1 and 25c (1) of the Banking Act, Article 93 of the SSM Framework Regulation).
The Supervisory Board may revoke the appointment of an individual as member of the Management Board or as Chairpersonof the Management Board for good cause. Such cause includes in particular a gross breach of duties, the inability to managethe Bank properly or a vote of no-confidence by the shareholders’ meeting (Hauptversammlung, referred to as the GeneralMeeting), unless such vote of no-confidence was made for obviously arbitrary reasons.
The ECB or the BaFin may appoint a special representative and transfer to such special representative the responsibility andpowers of individual members of the Management Board if such members are not trustworthy or do not have the requiredcompetencies or if the credit institution does not have the required number of Management Board members. In any such case,the responsibility and powers of the Management Board members concerned are suspended (Section 45c (1) through (3) ofthe Banking Act, Article 93 (2) of the SSM Framework Regulation).
If the discharge of a bank’s obligations to its creditors is endangered or if there are valid concerns that effective supervisionof the bank is not possible, the BaFin may take temporary measures to avert that risk. It may also prohibit members of theManagement Board from carrying out their activities or impose limitations on such activities (Section 46 (1) of the BankingAct). In such case, the Local Court Frankfurt am Main shall, at the request of the BaFin appoint the necessary members ofthe Management Board, if, as a result of such prohibition, the Management Board no longer has the necessary number ofmembers in order to conduct the business (Section 46 (2) of the Banking Act).
Rules Governing the Amendment of the Articles of AssociationAny amendment of the Articles of Association requires a resolution of the General Meeting (Section 179 of the StockCorporation Act). The authority to amend the Articles of Association in so far as such amendments merely relate to the wording,such as changes of the share capital as a result of the issuance of authorized capital, has been assigned to the SupervisoryBoard by the Articles of Association of Deutsche Bank (Section 20 (3)). Pursuant to the Articles of Association, the resolutionsof the General Meeting are taken by a simple majority of votes and, in so far as a majority of capital stock is required, by asimple majority of capital stock, except where law or the Articles of Association determine otherwise (Section 20 (1)).Amendments to the Articles of Association become effective upon their entry in the Commercial Register (Section 181 (3) ofthe Stock Corporation Act).

208
Deutsche Bank 1 – Management ReportAnnual Report 2018
Powers of the Management Board to Issue or Buy Back SharesThe Annual General Meeting of May 18, 2017 authorized the Management Board pursuant to Section 71 (1) No. 7 of the StockCorporation Act to buy and sell, for the purpose of securities trading, own shares of Deutsche Bank AG on or before April 30,2022, at prices which do not exceed or fall short by more than 10 % of the average of the share prices (closing auction pricesof the Deutsche Bank share in Xetra trading and/or in a comparable successor system on the Frankfurt Stock Exchange) onthe respective three preceding stock exchange trading days. In this context, the shares acquired for this purpose may not, atthe end of any day, exceed 5 % of the share capital of Deutsche Bank AG.
The Annual General Meeting of May 24, 2018 authorized the Management Board pursuant to Section 71 (1) No. 8 of the StockCorporation Act to buy, on or before April 30, 2023, own shares of Deutsche Bank AG in a total volume of up to 10 % of theshare capital at the time the resolution was taken or – if the value is lower – of the share capital at the time this authorizationis exercised. Together with own shares acquired for trading purposes and/or for other reasons and which are from time to timein the company’s possession or attributable to the company pursuant to Sections 71a et seq. of the Stock Corporation Act,the own shares purchased on the basis of this authorization may not at any time exceed 10 % of the company’s respectivelyapplicable share capital. The own shares may be bought through the stock exchange or by means of a public purchase offerto all shareholders. The countervalue for the purchase of shares (excluding ancillary purchase costs) through the stockexchange may not be more than 10 % higher or more than 20 % lower than the average of the share prices (closing auctionprices of the Deutsche Bank share in Xetra trading and/or in a comparable successor system on the Frankfurt Stock Exchange)on the last three stock exchange trading days before the obligation to purchase. In the case of a public purchase offer, it maynot be more than 10 % higher or more than 20 % lower than the average of the share prices (closing auction prices of theDeutsche Bank share in Xetra trading and/or in a comparable successor system on the Frankfurt Stock Exchange) on the lastthree stock exchange trading days before the day of publication of the offer. If the volume of shares offered in a public purchaseoffer exceeds the planned buyback volume, acceptance must be in proportion to the shares offered in each case. The preferredacceptance of small quantities of up to 50 of the company’s shares offered for purchase per shareholder may be provided for.
The Management Board has also been authorized to dispose of the purchased shares and of any shares purchased on thebasis of previous authorizations pursuant to Section 71 (1) No. 8 of the Stock Corporation Act on the stock exchange or by anoffer to all shareholders. The Management Board has been authorized to dispose of the purchased shares againstcontribution-in kind and with the exclusion of shareholders’ pre-emptive rights for the purpose of acquiring companies orshareholdings in companies or other assets that serve the company’s business operations. In addition, the Management Boardhas been authorized, in case it disposes of such own shares by offer to all shareholders, to grant to the holders of the optionrights, convertible bonds and convertible participatory rights issued by the company and its affiliated companies pre-emptiverights to the shares to the extent that they would be entitled to such rights if they exercised their option and/or conversionrights. Shareholders’ pre-emptive rights are excluded for these cases and to this extent.
The Management Board has also been authorized to use shares purchased on the basis of authorizations pursuant to § 71(1) No. 8 Stock Corporation Act to issue staff shares, with the exclusion of shareholders’ pre-emptive rights, to employees andretired employees of the company and its affiliated companies or to use them to service option rights on shares of the companyand/or rights or duties to purchase shares of the company granted to employees or members of executive or non-executivemanagement bodies of the company and of affiliated companies.
Furthermore, the Management Board has been authorized, with the exclusion of shareholders’ pre-emptive rights, to sell suchown shares to third parties against cash payment if the purchase price is not substantially lower than the price of the shareson the stock exchange at the time of sale. Use may only be made of this authorization if it has been ensured that the numberof shares sold on the basis of this authorization does not exceed 10 % of the company’s share capital at the time thisauthorization becomes effective or – if the amount is lower – at the time this authorization is exercised. Shares that are issuedor sold during the validity of this authorization with the exclusion of pre-emptive rights, in direct or analogous application ofSection 186 (3) sentence 4 Stock Corporation Act, are to be included in the maximum limit of 10 % of the share capital. Alsoto be included are shares that are to be issued to service option and/or conversion rights from convertible bonds, bonds withwarrants, convertible participatory rights or participatory rights, if these bond or participatory rights are issued during the validityof this authorization with the exclusion of pre-emptive rights in corresponding application of Section 186 (3) sentence 4 StockCorporation Act.
The Management Board has also been authorized to cancel shares acquired on the basis of this or a preceding authorizationwithout the execution of this cancellation process requiring a further resolution by the General Meeting.

209
Deutsche Bank Information pursuant to Section 315a (1) of the German Commercial Code and Explanatory ReportAnnual Report 2018 Agreements for Compensation in Case of a Takeover Bid
The Annual General Meeting of May 24, 2018 authorized the Management Board pursuant to Section 71 (1) No. 8 of the StockCorporation Act to execute the purchase of shares under the resolved authorization also with the use of put and call optionsor forward purchase contracts. The company may accordingly sell to third parties put options based on physical delivery andbuy call options from third parties if it is ensured by the option conditions that these options are fulfilled only with shares whichthemselves were acquired subject to compliance with the principle of equal treatment. All share purchases based on put orcall options are limited to shares in a maximum volume of 5 % of the actual share capital at the time of the resolution by theGeneral Meeting on this authorization. The term of the options must be selected such that the share purchase upon exercisingthe option is carried out at the latest on April 30, 2023.
The purchase price to be paid for the shares upon exercise of the put options or upon the maturity of the forward purchasemay not exceed more than 10 % or fall below 10 % of the average of the share prices (closing auction prices of the DeutscheBank share in Xetra trading and/or in a comparable successor system on the Frankfurt Stock Exchange) on the last threestock exchange trading days before conclusion of the respective transaction in each case excluding ancillary purchase costsbut taking into account the option premium received. The call options may only be exercised if the purchase price to be paiddoes not exceed by more than 10 % or fall below 10 % of the average of the share prices (closing auction prices of theDeutsche Bank share in Xetra trading and/or in a comparable successor system on the Frankfurt Stock Exchange) on the lastthree stock exchange trading days before the acquisition of the shares.
To the sale and cancellation of shares acquired with the use of derivatives the general rules established by the GeneralMeeting apply.
Own shares may continue to be purchased using existing derivatives that were agreed on the basis and during the existenceof previous authorizations.
Significant Agreements which Take Effect, Alter or Terminateupon a Change of Control of the Company Following a TakeoverBidSignificant agreements which take effect, alter or terminate upon a change of control of the company following a takeover bidhave not been entered into.
Agreements for Compensation in Case of a Takeover BidIf a member of the Management Board leaves the bank within the scope of a change of control, she or he receives a one-offcompensation payment described in greater detail in the Compensation Report.

210
Deutsche Bank 1 – Management ReportAnnual Report 2018
Corporate Governance Statement pursuant toSections 289f and 315d of the German CommercialCode
The entire Corporate Governance Statement according to sections 289f and 315d of the German Commercial Code isavailable on our website under https://www.db.com/ir/en/reports.htm as well as in the chapter “3 – Corporate GovernanceStatement according to Sections 289f, 315d of the German Commercial Code / Corporate Governance Report”.

2Consolidated Financial Statements
212 Consolidated Statement of Income
213 Consolidated Statement of Comprehensive Income
214 Consolidated Balance Sheet
215 Consolidated Statement of Changes in Equity
221 Consolidated Statement of Cash Flows
223 Notes to the Consolidated Financial Statements
223 1–SignificantAccountingPoliciesandCritical Accounting Estimates
249 2 – Recently Adopted and New AccountingPronouncements
255 3 – Acquisitions and Dispositions256 4 – Business Segments and Related
Information
265 Notes to the Consolidated Income Statement
265 5 – Net Interest Income and Net Gains (Losses) on Financial Assets/Liabilities atFairValuethroughProfitorLoss
267 6 – Commissions and Fee Income268 7 – Net Gains (Losses) on Financial Assets
Available for Sale268 8 – Other Income268 9 – General and Administrative Expenses269 10 – Restructuring270 11 – Earnings per Share
271 Notes to the Consolidated Balance Sheet
271 12 – Financial Assets/Liabilities at Fair Value throughProfitorLoss
273 13 – Financial Instruments carried at Fair Value
286 14 – Fair Value of Financial Instruments not carried at Fair Value
288 15 – Financial Assets Available for Sale288 16 – Financial assets at fair value through
other comprehensive income289 17 – Financial Instruments Held to Maturity289 18 – Equity Method Investments
291 19–OffsettingFinancialAssetsandFinancial Liabilities
294 20 – Loans295 21 – Allowance for Credit Losses297 22 – Transfer of Financial Assets , Assets
Pledged and Received as Collateral299 23 – Property and Equipment300 24 – Leases301 25 – Goodwill and Other Intangible Assets307 26 – Non-Current Assets and Disposal
Groups Held for Sale309 27 – Other Assets and Other Liabilities309 28 – Deposits310 29 – Provisions323 30 – Credit related Commitments324 31 – Other Short-Term Borrowings324 32 – Long-Term Debt and Trust Preferred
Securities325 33 – Maturity Analysis of the earliest
contractualundiscountedcashflowsof Financial Liabilities
326 Additional Notes326 34 – Common Shares327 35–EmployeeBenefits340 36 – Income Taxes342 37 – Derivatives345 38 – Related Party Transactions347 39 – Information on Subsidiaries348 40 – Structured Entities353 41 – Current and Non-Current Assets and
Liabilities354 42 – Events after the Reporting Period355 43 – Regulatory capital Information360 44 – Supplementary Information to the
Consolidated Financial Statements according to Sections 297 (1a) / 315a HGB
361 45 – Country by Country Reporting363 46 – Shareholdings
383 Confirmations

212
Deutsche Bank 2 – Consolidated Financial StatementsAnnual Report 2018
Consolidated Statement of Income
in € m. Notes 2018 2017 2016Interest and similar income1 5 24,793 23,542 25,143Interest expense 5 11,601 11,164 10,436Net interest income 5 13,192 12,378 14,707Provision for credit losses 21 525 525 1,383Net interest income after provision for credit losses 12,667 11,853 13,324Commissions and fee income 6 10,039 11,002 11,744Net gains (losses) on financial assets/liabilitiesat fair value through profit or loss 5 1,332 2,926 1,401Net gains (losses) on financial assets at amortized cost 2 N/A N/ANet gains (losses) on financial assets at fair value throughother comprehensive income 317 N/A N/A
Net gains (losses) on financial assets available for sale 7 N/A 479 653Net income (loss) from equity method investments 18 219 137 455Other income (loss) 8 215 (475) 1,053Total noninterest income 12,124 14,070 15,307Compensation and benefits 35 11,814 12,253 11,874General and administrative expenses 9 11,286 11,973 15,454Policyholder benefits and claims 0 0 374Impairment of goodwill and other intangible assets 25 0 21 1,256Restructuring activities 10 360 447 484Total noninterest expenses 23,461 24,695 29,442Income (loss) before income taxes 1,330 1,228 (810)Income tax expense (benefit) 36 989 1,963 546Net income (loss) 341 (735) (1,356)Net income (loss) attributable to noncontrolling interests 75 15 45Net income (loss) attributable to Deutsche Bank shareholdersand additional equity components 267 (751) (1,402)1 Interest and similar income included € 16.8 billion for the year ended December 31, 2018 calculated based on effective interest method.
Earnings per Sharein € m. Notes 2018 2017 2016Earnings per share:1,2 11Basic (€ 0.01) (€ 0.53) (€ 1.08)Diluted (€ 0.01) (€ 0.53) (€ 1.08)Number of shares in million:1Denominator for basic earnings per share –weighted-average shares outstanding 2,102.2 1,967.7 1,555.3Denominator for diluted earnings per share –adjusted weighted-average shares after assumed conversions3 2,102.2 1,967.7 1,555.31 The number of average basic and diluted shares outstanding has been adjusted for all periods before April 2017 in order to reflect the effect of the bonus component of
subscription rights issued in April 2017 in connection with the capital increase.2 Earnings were adjusted by € 292 and € 298 and € 276 million net of tax for the coupons paid on Additional Tier 1 Notes in April 2018, April 2017 and April 2016. In accordance
with IAS 33 the coupons paid on Additional Tier 1 Notes are not attributable to Deutsche Bank shareholders and therefore need to be deducted in the calculation. Thisadjustment created a net loss situation for Earnings per Common Share for 2018.
3 Due to the net loss situation for 2018, 2017 and 2016 potentially dilutive shares are generally not considered for the earnings per share calculation, because to do so woulddecrease the net loss per share. Under a net income situation however, the number of adjusted weighted average shares after assumed conversion would have beenincreased by 53 million shares for 2018, 62 million shares for 2017 and 27 million shares for 2016.
The accompanying notes are an integral part of the Consolidated Financial Statements.

213
Deutsche Bank Consolidated Statement of Comprehensive IncomeAnnual Report 2018
Consolidated Statement of Comprehensive Income
in € m. 2018 2017 2016Net income (loss) recognized in the income statement 341 (735) (1,356)Other comprehensive incomeItems that will not be reclassified to profit or loss
Remeasurement gains (losses) related to defined benefit plans, before tax (216) (69) (861)Net fair value gains (losses) attributable to credit risk related to financialliabilities designated as at fair value through profit or loss, before tax 52 N/A N/A
Total of income tax related to items that will not be reclassified to profit or loss 10 (23) 344Items that are or may be reclassified to profit or loss
Financial assets available for saleUnrealized net gains (losses) arising during the period, before tax N/A 197 (2)Realized net (gains) losses arising during the period (reclassified to profit or loss),before tax N/A (523) (571)
Financial assets at fair value through other comprehensive incomeUnrealized net gains (losses) arising during the period, before tax (245) N/A N/ARealized net (gains) losses arising during the period (reclassified to profit or loss),before tax (317) N/A N/A
Derivatives hedging variability of cash flowsUnrealized net gains (losses) arising during the period, before tax (3) (34) 62Realized net (gains) losses arising during the period (reclassified to profit or loss),before tax 0 (137) (2)
Assets classified as held for saleUnrealized net gains (losses) arising during the period, before tax 2 (162) 529Realized net (gains) losses arising during the period (reclassified to profit or loss),before tax (2) 162 (1,191)
Foreign currency translationUnrealized net gains (losses) arising during the period, before tax 457 (2,699) 203Realized net (gains) losses arising during the period (reclassified to profit or loss),before tax 0 20 (2)
Equity Method InvestmentsNet gains (losses) arising during the period (10) (36) 11Total of income tax related to items that are or may be reclassified to profit or loss 228 146 117Other comprehensive income (loss), net of tax (43) (3,157) (1,364)Total comprehensive income (loss), net of tax 298 (3,892) (2,721)Attributable to:
Noncontrolling interests 116 (20) 52Deutsche Bank shareholders and additional equity components 182 (3,872) (2,773)
The accompanying notes are an integral part of the Consolidated Financial Statements.

214
Deutsche Bank 2 – Consolidated Financial StatementsAnnual Report 2018
Consolidated Balance Sheet
in € m. Notes Dec 31, 2018 Dec 31, 2017Assets:Cash and central bank balances 188,731 225,655Interbank balances (w/o central banks) 8,881 9,265Central bank funds sold and securities purchased under resale agreements 22 8,222 9,971Securities borrowed 22 3,396 16,732Financial assets at fair value through profit or loss
Trading assets 152,738 184,661Positive market values from derivative financial instruments 320,058 361,032Non-trading financial assets mandatory at fair value through profit and loss 100,444 N/AFinancial assets designated at fair value through profit or loss 104 91,276
Total financial assets at fair value through profit or loss 12, 13, 22, 37 573,344 636,970Financial assets at fair value through other comprehensive income 16 51,182 N/AFinancial assets available for sale 15, 22 N/A 49,397Equity method investments 18 879 866Loans at amortized cost 20, 21, 22 400,297 401,699Securities held to maturity 17 N/A 3,170Property and equipment 23 2,421 2,663Goodwill and other intangible assets 25 9,141 8,839Other assets 26, 27 93,444 101,491Assets for current tax 36 970 1,215Deferred tax assets 36 7,230 6,799Total assets 1,348,137 1,474,732
Liabilities and equity:Deposits 28 564,405 581,873Central bank funds purchased and securities sold under repurchase agreements 22 4,867 18,105Securities loaned 22 3,359 6,688Financial liabilities at fair value through profit or loss
Trading liabilities 59,924 71,462Negative market values from derivative financial instruments 301,487 342,726Financial liabilities designated at fair value through profit or loss 53,757 63,874Investment contract liabilities 512 574
Total financial liabilities at fair value through profit or loss 12, 13, 37 415,680 478,636Other short-term borrowings 31 14,158 18,411Other liabilities 26, 27 117,513 132,208Provisions 21, 29 2,711 4,158Liabilities for current tax 36 944 1,001Deferred tax liabilities 36 512 346Long-term debt 32 152,083 159,715Trust preferred securities 32 3,168 5,491Obligation to purchase common shares 0 0Total liabilities 1,279,400 1,406,633Common shares, no par value, nominal value of € 2.56 34 5,291 5,291Additional paid-in capital 40,252 39,918Retained earnings 16,714 17,454Common shares in treasury, at cost 34 (15) (9)Equity classified as obligation to purchase common shares 0 0Accumulated other comprehensive income (loss), net of tax 253 520Total shareholders’ equity 62,495 63,174Additional equity components 4,675 4,675Noncontrolling interests 1,568 250Total equity 68,737 68,099Total liabilities and equity 1,348,137 1,474,732
The accompanying notes are an integral part of the Consolidated Financial Statements.

215
Deutsche Bank Consolidated Statement of Changes in EquityAnnual Report 2018
Consolidated Statement of Changes in Equity
in € m.Common shares
(no par value)Additional
paid-in capitalRetainedearnings
Common sharesin treasury,
at costBalance as of December 31, 2017 (IAS 39) 5,291 39,918 17,454 (9)IFRS 9 Introduction Impact 0 (2) (301) 0
Balance as of January 1, 2018 (IFRS 9) 5,291 39,916 17,153 (9)
Total comprehensive income (loss),net of tax1 0 0 267 0Gains (losses) attributable to equityinstruments designated as at fair valuethrough other comprehensive income,net of tax 0 0 0 0Gains (losses) upon early extinguishmentattributable to change in own credit risk offinancial liabilities designated as at fairvalue through profit and loss, net of tax 0 0 0 0Common shares issued 0 0 0 0Cash dividends paid 0 0 (227) 0Coupon on additional equity components,net of tax 0 0 (292) 0Remeasurement gains (losses) related todefined benefit plans, net of tax 0 0 (186) 0Net change in share awards in thereporting period 0 90 0 0Treasury shares distributed under share-basedcompensation plans 0 0 0 199Tax benefits related to share-basedcompensation plans 0 (5) 0 0Option premiums and other effects fromoptions on common shares 0 0 0 0Purchases of treasury shares 0 0 0 (4,119)Sale of treasury shares 0 0 0 3,914Net gains (losses) on treasury shares sold 0 (2) 0 0Other 0 2532 0 0
Balance as of December 31, 2018 5,291 40,252 16,714 (15)1 Excluding remeasurement gains (losses) related to defined benefit plans, net of tax.2 Includes the impact from the initial public offering of DWS Group GmbH & Co. KGaA.

216
Deutsche Bank 2 – Consolidated Financial StatementsAnnual Report 2018
Unrealized net gains (losses)
in € m.
Onfinancial
assetsavailablefor sale,
net of tax2
Onfinancial
assetsat fair value
throughother
compre-hensiveincome,
net of tax2
Attributableto change in
own credit riskof financial
liabilitiesdesignated
as at fairvalue through
profit and loss,net of tax2
Onderivatives
hedgingvariability ofcash flows,net of tax2
Onassets
classifiedas held for
sale,net of tax2
Foreigncurrency
translation,net of tax2
Unrealizednet gains(losses)
fromequity
methodinvestments
Accumula-ted other
comprehen-sive income,
net of tax1
Balance as of December 31, 2017 (IAS 39) 689 0 0 18 0 (227) 40 520IFRS 9 Introduction Impact (689) 394 (16) 0 0 (45) (12) (368)
Balance as of January 1, 2018 (IFRS 9) 0 394 (16) 18 0 (272) 28 152
Total comprehensive income (loss),net of tax1 0 (428) 44 (1) 0 500 (14) 101Gains (losses) attributable to equityinstruments designated as at fair valuethrough other comprehensive income,net of tax 0 0 0 0 0 0 0 0Gains (losses) upon early extinguishmentattributable to change in own credit risk offinancial liabilities designated as at fairvalue through profit and loss, net of tax 0 0 0 0 0 0 0 0Common shares issued 0 0 0 0 0 0 0 0Cash dividends paid 0 0 0 0 0 0 0 0Coupon on additional equity components,net of tax 0 0 0 0 0 0 0 0Remeasurement gains (losses) related todefined benefit plans, net of tax 0 0 0 0 0 0 0 0Net change in share awards in thereporting period 0 0 0 0 0 0 0 0Treasury shares distributed under share-based compensation plans 0 0 0 0 0 0 0 0Tax benefits related to share-basedcompensation plans 0 0 0 0 0 0 0 0Option premiums and other effects fromoptions on common shares 0 0 0 0 0 0 0 0Purchases of treasury shares 0 0 0 0 0 0 0 0Sale of treasury shares 0 0 0 0 0 0 0 0Net gains (losses) on treasury shares sold 0 0 0 0 0 0 0 0Other 0 0 0 0 0 0 0 0
Balance as of December 31, 2018 0 (34) 28 17 0 228 15 2531 Excluding remeasurement gains (losses) related to defined benefit plans, net of tax.2 Excluding unrealized net gains (losses) from equity method investments.

217
Deutsche Bank Consolidated Statement of Changes in EquityAnnual Report 2018
in € m.
Totalshareholders’
equity
Additionalequity
components2Noncontrolling
interests Total equityBalance as of December 31, 2017 (IAS 39) 63,174 4,675 250 68,099IFRS 9 Introduction Impact (671) 0 (1) (672)
Balance as of January 1, 2018 (IFRS 9) 62,503 4,675 249 67,427Total comprehensive income (loss),net of tax1 368 0 122 490Gains (losses) attributable to equityinstruments designated as at fair valuethrough other comprehensive income,net of tax 0 0 0 0Gains (losses) upon early extinguishmentattributable to change in own credit risk offinancial liabilities designated as at fairvalue through profit and loss, net of tax 0 0 0 0Common shares issued 0 0 0 0Cash dividends paid (227) 0 (8) (235)Coupon on additional equity components,net of tax (292) 0 0 (292)Remeasurement gains (losses) related todefined benefit plans, net of tax (186) 0 (12) (198)Net change in share awards in thereporting period 90 0 23 112Treasury shares distributed under share-based compensation plans 199 0 0 199Tax benefits related to share-basedcompensation plans (5) 0 1 (4)Option premiums and other effects fromoptions on common shares 0 0 0 0Purchases of treasury shares (4,119) 0 0 (4,119)Sale of treasury shares 3,914 0 0 3,914Net gains (losses) on treasury shares sold (2) 0 0 (2)Other 253 0 1,1933 1,446
Balance as of December 31, 2018 62,495 4,675 1,568 68,7371 Excluding remeasurement gains (losses) related to defined benefit plans, net of tax.2 Includes Additional Tier 1 Notes, which constitute unsecured and subordinated notes of Deutsche Bank and are classified as equity in accordance with IFRS.3 Includes the impact from the initial public offering of DWS Group GmbH & Co. KGaA.

218
Deutsche Bank 2 – Consolidated Financial StatementsAnnual Report 2018
in € m.Common shares
(no par value)Additional
paid-in capitalRetainedearnings
Common sharesin treasury,
at costBalance as of December 31, 2015 3,531 33,572 21,182 (10)
Total comprehensive income (loss),net of tax1 0 0 (1,402) 0Common shares issued 0 0 0 0Cash dividends paid 0 0 0 0Coupon on additional equity components,net of tax 0 0 (276) 0Remeasurement gains (losses) related todefined benefit plans, net of tax 0 0 (517) 0Net change in share awards in thereporting period 0 64 0 0Treasury shares distributed under share-based compensation plans 0 0 0 239Tax benefits related to share-basedcompensation plans 0 2 0 0Option premiums and other effects fromoptions on common shares 0 (129) 0 0Purchases of treasury shares 0 0 0 (5,264)Sale of treasury shares 0 0 0 5,035Net gains (losses) on treasury shares sold 0 (7) 0 0Other 0 263 0 0
Balance as of December 31, 2016 3,531 33,765 18,987 0
Total comprehensive income (loss),net of tax1 0 0 (751) 0Common shares issued 1,760 6,277 0 0Cash dividends paid 0 0 (392) 0Coupon on additional equity components,net of tax 0 0 (298) 0Remeasurement gains (losses) related todefined benefit plans, net of tax 0 0 (91) 0Net change in share awards in thereporting period 0 (51) 0 0Treasury shares distributed under share-based compensation plans 0 0 0 424Tax benefits related to share-basedcompensation plans 0 3 0 0Option premiums and other effects fromoptions on common shares 0 (104) 0 0Purchases of treasury shares 0 0 0 (7,912)Sale of treasury shares 0 0 0 7,479Net gains (losses) on treasury shares sold 0 6 0 0Other 0 22 0 0
Balance as of December 31, 2017 5,291 39,918 17,454 (9)1 Excluding remeasurement gains (losses) related to defined benefit plans, net of tax.

219
Deutsche Bank Consolidated Statement of Changes in EquityAnnual Report 2018
Unrealized net gains (losses)
in € m.
Onfinancial
assetsavailablefor sale,
net of tax2
Onfinancial
assetsat fair value
throughother
compre-hensiveincome,
net of tax2
Attributableto change in
own credit riskof financial
liabilitiesdesignated
as at fairvalue through
profit and loss,net of tax2
Onderivatives
hedgingvariability ofcash flows,net of tax2
Onassets
classifiedas held for
sale,net of tax2
Foreigncurrency
translation,net of tax2
Unrealizednet gains(losses)
fromequity
methodinvestments
Accumula-ted other
comprehen-sive income,
net of tax1
Balance as of December 31, 2015 1,384 0 0 97 662 2,196 66 4,404
Total comprehensive income (loss),net of tax1 (472) 0 0 46 (662) 223 11 (854)Common shares issued 0 0 0 0 0 0 0 0Cash dividends paid 0 0 0 0 0 0 0 0Coupon on additional equity components,net of tax 0 0 0 0 0 0 0 0Remeasurement gains (losses) related todefined benefit plans, net of tax 0 0 0 0 0 0 0 0Net change in share awards in thereporting period 0 0 0 0 0 0 0 0Treasury shares distributed under share-based compensation plans 0 0 0 0 0 0 0 0Tax benefits related to share-basedcompensation plans 0 0 0 0 0 0 0 0Option premiums and other effects fromoptions on common shares 0 0 0 0 0 0 0 0Purchases of treasury shares 0 0 0 0 0 0 0 0Sale of treasury shares 0 0 0 0 0 0 0 0Net gains (losses) on treasury shares sold 0 0 0 0 0 0 0 0Other 0 0 0 0 0 0 0 0
Balance as of December 31, 2016 912 0 0 143 0 2,418 77 3,550
Total comprehensive income (loss),net of tax1 (223) 0 0 (125) 0 (2,646) (36) (3,030)Common shares issued 0 0 0 0 0 0 0 0Cash dividends paid 0 0 0 0 0 0 0 0Coupon on additional equity components,net of tax 0 0 0 0 0 0 0 0Remeasurement gains (losses) related todefined benefit plans, net of tax 0 0 0 0 0 0 0 0Net change in share awards in thereporting period 0 0 0 0 0 0 0 0Treasury shares distributed under share-based compensation plans 0 0 0 0 0 0 0 0Tax benefits related to share-basedcompensation plans 0 0 0 0 0 0 0 0Option premiums and other effects fromoptions on common shares 0 0 0 0 0 0 0 0Purchases of treasury shares 0 0 0 0 0 0 0 0Sale of treasury shares 0 0 0 0 0 0 0 0Net gains (losses) on treasury shares sold 0 0 0 0 0 0 0 0Other 0 0 0 0 0 0 0 0
Balance as of December 31, 2017 689 0 0 18 0 (227) 40 5201 Excluding remeasurement gains (losses) related to defined benefit plans, net of tax.2 Excluding unrealized net gains (losses) from equity method investments.

220
Deutsche Bank 2 – Consolidated Financial StatementsAnnual Report 2018
in € m.
Totalshareholders’
equity
Additionalequity
components2Noncontrolling
interests Total equityBalance as of December 31, 2015 62,678 4,675 270 67,624Total comprehensive income (loss),net of tax1 (2,256) 0 52 (2,204)Common shares issued 0 0 0 0Cash dividends paid 0 0 (11) (11)Coupon on additional equity components,net of tax (276) 0 0 (276)Remeasurement gains (losses) related todefined benefit plans, net of tax (517) 0 0 (517)Net change in share awards in thereporting period 64 0 0 64Treasury shares distributed under share-based compensation plans 239 0 0 239Tax benefits related to share-basedcompensation plans 2 0 0 2Option premiums and other effects fromoptions on common shares (129) 0 0 (129)Purchases of treasury shares (5,264) 0 0 (5,264)Sale of treasury shares 5,035 0 0 5,035Net gains (losses) on treasury shares sold (7) 0 0 (7)Other 263 (6)3 4 262
Balance as of December 31, 2016 59,833 4,669 316 64,819Total comprehensive income (loss),net of tax1 (3,781) 0 (20) (3,800)Common shares issued 8,037 0 0 8,037Cash dividends paid (392) 0 (11) (403)Coupon on additional equity components,net of tax (298) 0 0 (298)Remeasurement gains (losses) related todefined benefit plans, net of tax (91) 0 0 (91)Net change in share awards in thereporting period (51) 0 0 (51)Treasury shares distributed under share-based compensation plans 424 0 0 424Tax benefits related to share-basedcompensation plans 3 0 0 3Option premiums and other effects fromoptions on common shares (104) 0 0 (104)Purchases of treasury shares (7,912) 0 0 (7,912)Sale of treasury shares 7,479 0 0 7,479Net gains (losses) on treasury shares sold 6 0 0 6Other 22 63 (36) (9)
Balance as of December 31, 2017 63,174 4,675 250 68,0991 Excluding remeasurement gains (losses) related to defined benefit plans, net of tax.2 Includes Additional Tier 1 Notes, which constitute unsecured and subordinated notes of Deutsche Bank and are classified as equity in accordance with IFRS.3 Includes net proceeds from purchase and sale of Additional Equity Components.

221
Deutsche Bank Consolidated Statement of Cash FlowsAnnual Report 2018
Consolidated Statement of Cash Flows
in € m. 2018 2017 2016Net Income (loss) 341 (735) (1,356)Cash flows from operating activities:Adjustments to reconcile net income to net cash provided by (used in) operating activities:Provision for credit losses 525 525 1,383Restructuring activities 360 447 484Gain on sale of financial assets available for sale and securities held to maturity N/A (516) (695)Gain on sale of financial assets at fair value through other comprehensive income, equity methodinvestments and other (619) (59) (203)
Deferred income taxes, net 276 1,234 (312)Impairment, depreciation and other amortization, and accretion 2,391 2,159 3,745Share of net income from equity method investments (129) (141) (183)Income (loss) adjusted for non-cash charges, credits and other items 3,145 2,914 2,862Adjustments for net change in operating assets and liabilities:
Interest-earning time deposits with central banks and banks (10,954) 966 (2,814)Central bank funds sold, securities purchased under resale agreements, securities borrowed 15,004 8,560 19,440Non-Trading financial assets mandatory at fair value through profit and loss (98,560) N/A N/AFinancial assets designated at fair value through profit or loss 91,176 (6,721) 20,337Loans at amortized cost 302 2,759 18,190Other assets 6,284 21,970 (7,847)Deposits (16,763) 34,601 (15,237)Financial liabilities designated at fair value through profit or loss and investment contract liabilities1 (10,549) 5,461 8,686Central bank funds purchased, securities sold under repurchase agreements, securities loaned (16,716) (3,355) 16,362Other short-term borrowings (4,266) 1,148 (10,632)Other liabilities (19,119) (23,107) (12,888)Senior long-term debt2 (6,840) (12,728) 12,328Trading assets and liabilities, positive and negative market values from derivative financial instruments,net 20,542 1,596 30,341Other, net (6,752) 5,512 (8,518)
Net cash provided by (used in) operating activities (54,066) 39,576 70,610Cash flows from investing activities:Proceeds from:
Sale of financial assets at fair value through other comprehensive income 22,126 N/A N/AMaturities of financial assets at fair value through other comprehensive income 26,001 N/A N/ASale of debt securities held to collect at amortized cost 94 N/A N/AMaturities of debt securities held to collect at amortized cost 1,904 N/A N/ASale of financial assets available for sale N/A 10,657 26,855Maturities of financial assets available for sale N/A 6,798 6,029Maturities of securities held to maturity N/A 0 0Sale of equity method investments 30 80 50Sale of property and equipment 356 113 206
Purchase of:Financial assets at fair value through other comprehensive income (41,031) N/A N/ADebt Securities held to collect at amortized cost (309) N/A N/AFinancial assets available for sale N/A (13,472) (21,639)Securities held to maturity N/A 0 0Equity method investments (1) (12) (81)Property and equipment (465) (485) (725)
Net cash received in (paid for) business combinations/divestitures 114 82 2,023Other, net (1,291) (1,328) (1,479)Net cash provided by (used in) investing activities 7,528 2,433 11,239
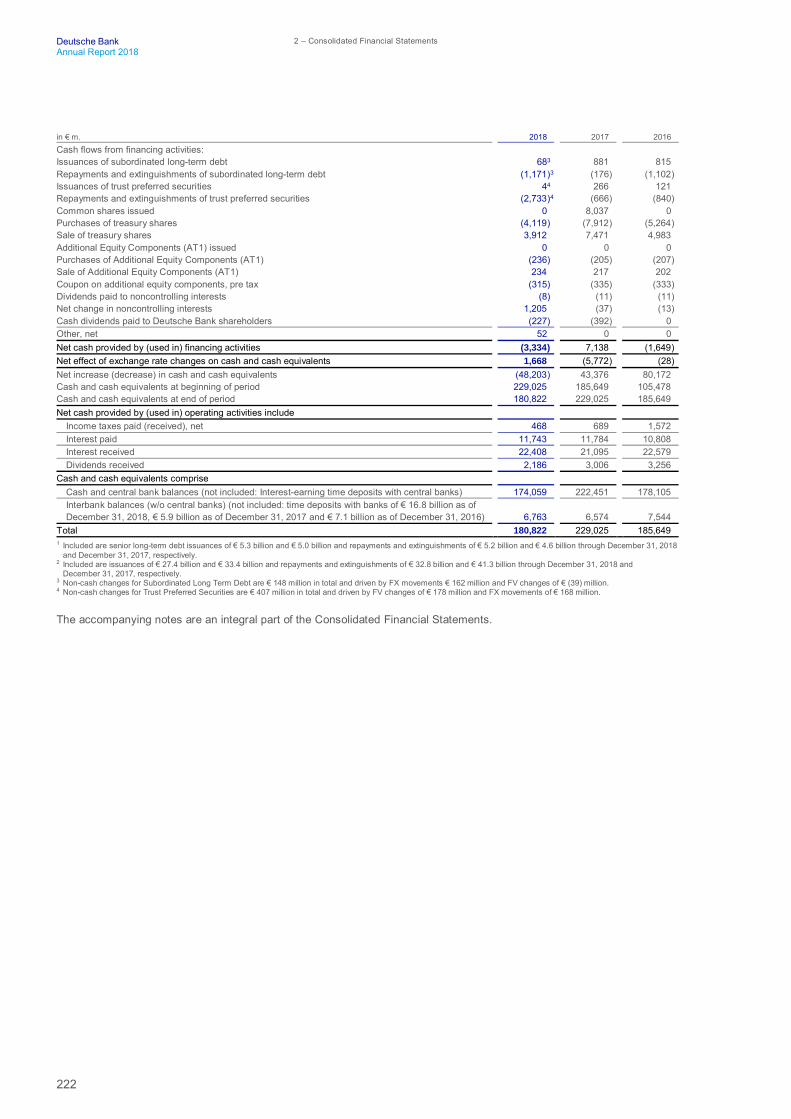
222
Deutsche Bank 2 – Consolidated Financial StatementsAnnual Report 2018
in € m. 2018 2017 2016Cash flows from financing activities:Issuances of subordinated long-term debt 683 881 815Repayments and extinguishments of subordinated long-term debt (1,171)3 (176) (1,102)Issuances of trust preferred securities 44 266 121Repayments and extinguishments of trust preferred securities (2,733)4 (666) (840)Common shares issued 0 8,037 0Purchases of treasury shares (4,119) (7,912) (5,264)Sale of treasury shares 3,912 7,471 4,983Additional Equity Components (AT1) issued 0 0 0Purchases of Additional Equity Components (AT1) (236) (205) (207)Sale of Additional Equity Components (AT1) 234 217 202Coupon on additional equity components, pre tax (315) (335) (333)Dividends paid to noncontrolling interests (8) (11) (11)Net change in noncontrolling interests 1,205 (37) (13)Cash dividends paid to Deutsche Bank shareholders (227) (392) 0Other, net 52 0 0Net cash provided by (used in) financing activities (3,334) 7,138 (1,649)Net effect of exchange rate changes on cash and cash equivalents 1,668 (5,772) (28)Net increase (decrease) in cash and cash equivalents (48,203) 43,376 80,172Cash and cash equivalents at beginning of period 229,025 185,649 105,478Cash and cash equivalents at end of period 180,822 229,025 185,649Net cash provided by (used in) operating activities include
Income taxes paid (received), net 468 689 1,572Interest paid 11,743 11,784 10,808Interest received 22,408 21,095 22,579Dividends received 2,186 3,006 3,256
Cash and cash equivalents compriseCash and central bank balances (not included: Interest-earning time deposits with central banks) 174,059 222,451 178,105Interbank balances (w/o central banks) (not included: time deposits with banks of € 16.8 billion as ofDecember 31, 2018, € 5.9 billion as of December 31, 2017 and € 7.1 billion as of December 31, 2016) 6,763 6,574 7,544
Total 180,822 229,025 185,6491 Included are senior long-term debt issuances of € 5.3 billion and € 5.0 billion and repayments and extinguishments of € 5.2 billion and € 4.6 billion through December 31, 2018
and December 31, 2017, respectively.2 Included are issuances of € 27.4 billion and € 33.4 billion and repayments and extinguishments of € 32.8 billion and € 41.3 billion through December 31, 2018 and
December 31, 2017, respectively.3 Non-cash changes for Subordinated Long Term Debt are € 148 million in total and driven by FX movements € 162 million and FV changes of € (39) million.4 Non-cash changes for Trust Preferred Securities are € 407 million in total and driven by FV changes of € 178 million and FX movements of € 168 million.
The accompanying notes are an integral part of the Consolidated Financial Statements.

223
Deutsche Bank Notes to the Consolidated Financial StatementsAnnual Report 2018 Significant Accounting Policies and Critical Accounting Estimates
Notes to the Consolidated Financial Statements
01 – Significant Accounting Policies and Critical AccountingEstimates
Basis of Accounting
Deutsche Bank Aktiengesellschaft (“Deutsche Bank” or the “Parent”) is a stock corporation organized under the laws of theFederal Republic of Germany. Deutsche Bank together with all entities in which Deutsche Bank has a controlling financialinterest (the “Group”) is a global provider of a full range of corporate and investment banking, private clients and assetmanagement products and services.
The accompanying consolidated financial statements are stated in euros, the presentation currency of the Group. All financialinformation presented in million euros has been rounded to the nearest million. The consolidated financial statements havebeen prepared in accordance with International Financial Reporting Standards (“IFRS”) as issued by the InternationalAccounting Standards Board (“IASB”) and endorsed by the European Union (“EU”). The Group’s application of IFRS resultsin no differences between IFRS as issued by the IASB and IFRS as endorsed by the EU.
Disclosures about the nature and the extent of risks arising from financial instruments as required by IFRS 7, “FinancialInstruments: Disclosures” are set forth in the Risk Report section of the Management Report and are an integral part of theConsolidated Financial Statements. These audited disclosures are identified by bracketing in the margins of the Risk Report.
Discount Rate for Defined Benefit Pension Plans
In 2017 the Group moved to a more standardized, simpler approach to set its discount rate used to value its defined benefitplans in the Eurozone; similar approaches are generally accepted and are already used for the Group’s other major pensionplans in the United Kingdom and the United States. The refinement resulted in no change in the discount rate and so no effecton the Group’s Consolidated Statement of Comprehensive Income in 2017.
Adjustment of Impairment Methodology for Shipping Loans
In the third quarter of 2017, the Group has adjusted the parameters for shipping loans being assessed for impairment undera going concern or gone concern scenario. This change in parameters resulted in a change in the estimated impairmentcharge of € 70 million increase. The Group also revised its general haircut applied to shipping loans with gone concernexposures, which also resulted in a change in estimate of € 36 million additional impairment. These changes in estimates arereflected in the allowance for credit losses.
Home Savings Contracts
In the second quarter of 2018, the Group changed its accounting policy for the obligations related to interest bonuses on homesavings contracts. Such bonuses are typically paid to depositors who abstain from entering into a mortgage loan whenqualifying for utilization and decide to terminate the contract and receive repayment of the deposit amount plus accrued interestand bonus coupon. Previously, the Group accounted for the obligation to pay an interest bonus as a provision under IAS 37.Developments in market practice resulted in the Group analyzing its accounting policy and deciding to account for the homesavings deposit, in its entirety, in accordance with IFRS 9 as it provides more reliable and relevant information about theproduct. The change in accounting policy resulted in a reclassification of € 1.1 billion and € 1.1 billion from Provisions toDeposits in the Group’s consolidated balance sheet as of June 30, 2018 and December 31, 2017, respectively. The re-measurement of the obligations related to interest bonuses under IFRS 9 compared to IAS 37 resulted in an immaterial effecton the Group’s Consolidated Statement of Comprehensive Income and the Group's total shareholders' equity in the currentand all comparative periods, and therefore they were not adjusted.

224
Deutsche Bank 2 – Consolidated Financial StatementsAnnual Report 2018
Critical Accounting Estimates
The preparation of financial statements under IFRS requires management to make estimates and assumptions for certaincategories of assets and liabilities. These estimates and assumptions affect the reported amounts of assets and liabilities anddisclosure of contingent assets and liabilities at the balance sheet date, and the reported amounts of revenue and expensesduring the reporting period. Actual results could differ from management’s estimates. The Group’s significant accountingpolicies are described in “Significant Accounting Policies”.
Certain of the Group’s accounting policies require critical accounting estimates that involve complex and subjective judgmentsand the use of assumptions, some of which may be for matters that are inherently uncertain and susceptible to change. Suchcritical accounting estimates could change from period to period and may have a material impact on the Group’s financialcondition, changes in financial condition or results of operations. Critical accounting estimates could also involve estimateswhere management could have reasonably used another estimate in the current accounting period. The Group has identifiedthe following significant accounting policies that involve critical accounting estimates:
– the impairment of associates (see “Associates” below)– the impairment of financial assets at fair value through other comprehensive income (see “Financial Assets (IFRS 9 - 2018
only) – Financial Assets at Fair Value through Other Comprehensive Income” below)– the impairment of financial assets available for sale (see “Financial Assets (IAS 39 - prior periods only) – Financial Assets
Classified as Available for Sale” below)– the determination of fair value (see “Determination of Fair Value” below)– the recognition of trade date profit (see “Recognition of Trade Date Profit” below)– the impairment of loans and provisions for off-balance sheet positions (see “Impairment of Loans and Provision for Off-
balance Sheet Positions” below)– the impairment of goodwill and other intangibles (see “Goodwill and Other Intangible Assets” below)– the recognition and measurement of deferred tax assets (see “Income Taxes” below)– the accounting for legal and regulatory contingencies and uncertain tax positions (see “Provisions” below)
Significant Accounting Policies
The following is a description of the significant accounting policies of the Group. Except for the changes in accounting policiesand changes in accounting estimates described previously and noted below these policies have been consistently applied for2016, 2017 and 2018.
Principles of Consolidation
The financial information in the Consolidated Financial Statements includes the parent company, Deutsche Bank AG, togetherwith its consolidated subsidiaries, including certain structured entities presented as a single economic unit.
Subsidiaries
The Group’s subsidiaries are those entities which it directly or indirectly controls. Control over an entity is evidenced by theGroup’s ability to exercise its power in order to affect any variable returns that the Group is exposed to through its involvementwith the entity.
The Group sponsors the formation of structured entities and interacts with structured entities sponsored by third parties for avariety of reasons, including allowing clients to hold investments in separate legal entities, allowing clients to invest jointly inalternative assets, for asset securitization transactions, and for buying or selling credit protection.
When assessing whether to consolidate an entity, the Group evaluates a range of control factors, namely:
– the purpose and design of the entity– the relevant activities and how these are determined– whether the Group’s rights result in the ability to direct the relevant activities– whether the Group has exposure or rights to variable returns– whether the Group has the ability to use its power to affect the amount of its returns

225
Deutsche Bank Notes to the Consolidated Financial StatementsAnnual Report 2018 Significant Accounting Policies and Critical Accounting Estimates
Where voting rights are relevant, the Group is deemed to have control where it holds, directly or indirectly, more than half ofthe voting rights over an entity unless there is evidence that another investor has the practical ability to unilaterally direct therelevant activities.
Potential voting rights that are deemed to be substantive are also considered when assessing control.
Likewise, the Group also assesses existence of control where it does not control the majority of the voting power but has thepractical ability to unilaterally direct the relevant activities. This may arise in circumstances where the size and dispersion ofholdings of the shareholders give the Group the power to direct the activities of the investee.
Subsidiaries are consolidated from the date on which control is transferred to the Group and are deconsolidated from the datethat control ceases.
The Group reassesses the consolidation status at least at every quarterly reporting date. Therefore, any changes in thestructure leading to a change in one or more of the control factors, require reassessment when they occur. This includeschanges in decision making rights, changes in contractual arrangements, changes in the financing, ownership or capitalstructure as well as changes following a trigger event which was anticipated in the original documentation.
All intercompany transactions, balances and unrealized gains on transactions between Group companies are eliminated onconsolidation.
Consistent accounting policies are applied throughout the Group for the purposes of consolidation. Issuances of a subsidiary’sstock to third parties are treated as noncontrolling interests. Profit or loss attributable to noncontrolling interests are reportedseparately in the Consolidated Statement of Income and Consolidated Statement of Comprehensive Income.
At the date that control of a subsidiary is lost, the Group a) derecognizes the assets (including attributable goodwill) andliabilities of the subsidiary at their carrying amounts, b) derecognizes the carrying amount of any noncontrolling interests inthe former subsidiary, c) recognizes the fair value of the consideration received and any distribution of the shares of thesubsidiary, d) recognizes any investment retained in the former subsidiary at its fair value and e) recognizes any resultingdifference of the above items as a gain or loss in the income statement. Any amounts recognized in prior periods in othercomprehensive income in relation to that subsidiary would be reclassified to the Consolidated Statement of Income ortransferred directly to retained earnings if required by other IFRSs.
Associates
An associate is an entity in which the Group has significant influence, but not a controlling interest, over the operating andfinancial management policy decisions of the entity. Significant influence is generally presumed when the Group holdsbetween 20 % and 50 % of the voting rights. The existence and effect of potential voting rights that are currently exercisableor convertible are considered in assessing whether the Group has significant influence. Among the other factors that areconsidered in determining whether the Group has significant influence are representation on the board of directors(supervisory board in the case of German stock corporations) and material intercompany transactions. The existence of thesefactors could require the application of the equity method of accounting for a particular investment even though the Group’sinvestment is less than 20 % of the voting stock.
Investments in associates are accounted for under the equity method of accounting. The Group’s share of the results ofassociates is adjusted to conform to the accounting policies of the Group and is reported in the Consolidated Statement ofIncome as Net income (loss) from equity method investments. The Group’s share in the associate’s profits and losses resultingfrom intercompany sales is eliminated on consolidation.
Under the equity method of accounting, the Group’s investments in associates and jointly controlled entities are initiallyrecorded at cost including any directly related transaction costs incurred in acquiring the associate, and subsequentlyincreased (or decreased) to reflect both the Group’s pro-rata share of the post-acquisition net income (or loss) of the associateor jointly controlled entity and other movements included directly in the equity of the associate or jointly controlled entity.Goodwill arising on the acquisition of an associate or a jointly controlled entity is included in the carrying value of the investment(net of any accumulated impairment loss). As goodwill is not reported separately it is not specifically tested for impairment.Rather, the entire equity method investment is tested for impairment at each balance sheet date.

226
Deutsche Bank 2 – Consolidated Financial StatementsAnnual Report 2018
If there is objective evidence of impairment, an impairment test is performed by comparing the investment’s recoverableamount, which is the higher of its value in use and fair value less costs to sell, with its carrying amount. An impairment lossrecognized in prior periods is only reversed if there has been a change in the estimates used to determine the investment’srecoverable amount since the last impairment loss was recognized. If this is the case the carrying amount of the investmentis increased to its higher recoverable amount. The increased carrying amount of the investment in associate attributable to areversal of an impairment loss shall not exceed the carrying amount that would have been determined had no impairment lossbeen recognized for the investment in prior years.
At the date that the Group ceases to have significant influence over the associate or jointly controlled entity the Grouprecognizes a gain or loss on the disposal of the equity method investment equal to the difference between the sum of the fairvalue of any retained investment and the proceeds from disposing of the associate and the carrying amount of the investment.Amounts recognized in prior periods in other comprehensive income in relation to the associate are accounted for on the samebasis as would have been required if the investee had directly disposed of the related assets or liabilities.
Critical Accounting Estimates: As the assessment of whether there is objective evidence of impairment may require significantmanagement judgment and the estimates for impairment could change from period to period based on future events that mayor may not occur, the Group considers this to be a critical accounting estimate.
Foreign Currency Translation
The Consolidated Financial Statements are prepared in euro, which is the presentation currency of the Group. Various entitiesin the Group use a different functional currency, being the currency of the primary economic environment in which the entityoperates.
An entity records foreign currency revenues, expenses, gains and losses in its functional currency using the exchange ratesprevailing at the dates of recognition.
Monetary assets and liabilities denominated in currencies other than the entity’s functional currency are translated at theperiod end closing rate. Foreign exchange gains and losses resulting from the translation and settlement of these items arerecognized in the Consolidated Statement of Income as net gains (losses) on financial assets/liabilities at fair value throughprofit or loss in order to align the translation amounts with those recognized from foreign currency related transactions(derivatives) which hedge these monetary assets and liabilities.
Nonmonetary items that are measured at historical cost are translated using the historical exchange rate at the date of thetransaction. Translation differences on nonmonetary items which are held at fair value through profit or loss are recognized inprofit or loss. Translation differences on available for sale nonmonetary items (equity securities) are included in othercomprehensive income and recognized in the Consolidated Statement of Income when the non-monetary item is sold as partof the overall gain or loss on sale of the item.
For purposes of translation into the presentation currency, assets and liabilities of foreign operations are translated at theperiod end closing rate and items of income and expense are translated into euros at the rates prevailing on the dates of thetransactions, or average rates of exchange where these approximate actual rates. The exchange differences arising on thetranslation of a foreign operation are included in other comprehensive income. For foreign operations that are subsidiaries,the amount of exchange differences attributable to any noncontrolling interests is recognized in noncontrolling interests.
Upon disposal of a foreign subsidiary and associate (which results in loss of control or significant influence over that operation)the total cumulative exchange differences recognized in other comprehensive income are reclassified to profit or loss.
Upon partial disposal of a foreign operation that is a subsidiary and which does not result in loss of control, the proportionateshare of cumulative exchange differences is reclassified from other comprehensive income to noncontrolling interests as thisis deemed a transaction with equity holders. For a partial disposal of an associate which does not result in a loss of significantinfluence, the proportionate share of cumulative exchange differences is reclassified from other comprehensive income toprofit or loss.

227
Deutsche Bank Notes to the Consolidated Financial StatementsAnnual Report 2018 Significant Accounting Policies and Critical Accounting Estimates
Interest, Commissions and Fees (IFRS 9 and IFRS 15 - 2018 only)
Net Interest Income – Interest income and expense from all interest-bearing assets and liabilities is recognized as net interestincome using the effective interest method. The effective interest rate (EIR) is a method of calculating the amortized cost of afinancial asset or a financial liability and of allocating the interest income or expense over the relevant period using theestimated future cash flows.
The estimated future cash flows used in the EIR calculation include those determined by all of the contractual terms of theasset or liability, all fees (including commissions) that are considered to be integral to the effective interest rate, direct andincremental transaction costs and all other premiums or discounts. However, if the financial instrument is carried at fair valuethrough profit or loss, any associated fees are recognized in trading income when the instrument is initially recognized,provided there are no significant unobservable inputs used in determining its fair value.
If a financial asset is credit-impaired interest revenue is calculated by applying the effective interest rate to the gross carryingamount. The gross carrying amount of a financial asset is the amortized cost of a financial asset gross of any impairmentallowance. For assets which are initially recognized as purchased or credit-impaired, interest revenue is calculated throughthe use of a credit-adjusted effective interest rate which takes into consideration expected credit losses.
The Group recognizes income from government grants which are associated to interest-bearing assets and liabilities in netinterest income when there is reasonable assurance that it will receive the grants and will comply with the conditions attachedto the grants.
As a result of the amendments to International Accounting Standard 1: “Presentation of Financial Statements” (IAS 1) followingthe adoption of IFRS 9, the Group presents interest income and expense calculated using the EIR method separately in theincome statement.
Commissions and Fee Income –The Group applies the IFRS 15, “Revenue from Contracts with Customers” five-step revenuerecognition model to the recognition of Commissions and Fee Income, under which income must be recognized when controlof goods and services is transferred, hence the contractual performance obligations to the customer has been satisfied.
Accordingly, after a contract with a customer has been identified in the first step, the second step is to identify the performanceobligation – or a series of distinct performance obligations – provided to the customer. The Group must examine whether theservice is capable of being distinct and is actually distinct within the context of the contract. A promised service is distinct ifthe customer can benefit from the service either on its own or together with other resources that are readily available to thecustomer, and the promise to transfer the service to the customer is separately identifiable from other promises in the contract.The amount of income is measured on the basis of the contractually agreed transaction price for the performance obligationdefined in the contract. If a contract includes variable consideration, the Group estimates the amount of consideration to whichit will be entitled in exchange for transferring the promised goods or services to a customer. Income is recognized in profit andloss when the identified performance obligation has been satisfied.
The Group provides asset management services that give rise to asset management and performance fees and constitute asingle performance obligation. The asset management and performance fee components are variable considerations suchthat at each reporting date the Group estimates the fee amount to which it will be entitled in exchange for transferring thepromised services to the customer. The benefits arising from the asset management services are simultaneously receivedand consumed by the customer over time. The Group recognizes revenue over time by measuring the progress towardscomplete satisfaction of that performance obligation, subject to the removal of any uncertainty as to whether it is highlyprobable that a significant reversal in the cumulative amount of revenue recognized would occur or not. For the managementfee component this is the end of the monthly or quarterly service period. For performance fees this date is when any uncertaintyrelated to the performance component has been fully removed.
Loan commitment fees related to commitments that are accounted for off-balance sheet are recognized in commissions andfee income over the life of the commitment if it is unlikely that the Group will enter into a specific lending arrangement. If it isprobable that the Group will enter into a specific lending arrangement, the loan commitment fee is deferred until the originationof a loan and recognized as an adjustment to the loan’s effective interest rate.

228
Deutsche Bank 2 – Consolidated Financial StatementsAnnual Report 2018
The following Commissions and Fee Income is predominantly earned from services that are received and consumed by thecustomer over time: Administration, assets under management, foreign commercial business, loan processing and guaranteessundry other customer services. Commissions and Fee Income predominantly earned from providing services at a point intime or transaction-type services include: other securities, underwriting and advisory fees, brokerage fees, local payments,foreign currency/ exchange business and intermediary fees.
Expenses that are directly related and incremental to the generation of Commissions and Fee Income are presented net inCommissions and Fee Income. This includes income and associated expense where the Group contractually owns theperformance obligation (i.e. as Principal) in relation to the service that gives rise to the revenue and associated expense. Incontrast, it does not include situations where the Group does not contractually own the performance obligation and is actingas agent. The determination of whether the Group is acting as principal or agent is based on the contractual terms of theunderlying service arrangement. The gross Commissions and Fee Income and Expense amounts are disclosed in “Note 6 –Commissions and Fee Income”.
Interest, Commissions and Fees (IAS 18 - prior periods only)
The Group applied the revenue recognition requirements of IAS 18, “Revenue” (IAS 18). Revenue was recognized when theamount of revenue and associated costs could be reliably measured, it is probable that economic benefits associated with thetransaction will be realized and the stage of completion of the transaction could be reliably measured. This concept wasapplied to the key revenue generating activities of the Group as follows.
Net Interest Income – Interest from all interest-bearing assets and liabilities was recognized as net interest income using theeffective interest method. The effective interest rate is a method of calculating the amortized cost of a financial asset or afinancial liability and of allocating the interest income or expense over the relevant period using the estimated future cashflows. The estimated future cash flows used in this calculation include those determined by the contractual terms of the assetor liability, all fees that are considered to be integral to the effective interest rate, direct and incremental transaction costs andall other premiums or discounts.
Once an impairment loss was recognized on a loan, held-to-maturity investment or available for sale debt instruments,although the accrual of interest in accordance with the contractual terms of the instrument was discontinued, interest incomewas recognized based on the rate of interest that was used to discount future cash flows for the purpose of measuring theimpairment loss. For a loan and held to maturity investment this would be the original effective interest rate, but a new effectiveinterest rate was established each time an available for sale debt instrument was impaired as impairment was measured tofair value and based on a current market rate.
The Group recognized income from government grants which are associated to interest-bearing assets and liabilities in netinterest income when there was reasonable assurance that it will receive the grants and will comply with the conditionsattached to the grants.
Commissions and Fee Income – The recognition of fee revenue (including commissions) was determined by the purpose ofthe fees and the basis of accounting for any associated financial instruments. If there was an associated financial instrument,fees that are an integral part of the effective interest rate of that financial instrument are included within the effective yieldcalculation. However, if the financial instrument was carried at fair value through profit or loss, any associated fees arerecognized in profit or loss when the instrument was initially recognized, provided there was no significant unobservable inputsused in determining its fair value. Fees earned from services that are provided over a specified service period were recognizedover that service period. Fees earned for the completion of a specific service or significant event were recognized when theservice was completed or the event occurred.
Loan commitment fees related to commitments that are accounted for off-balance sheet were recognized in commissions andfee income over the life of the commitment if it is unlikely that the Group will enter into a specific lending arrangement. If it wasprobable that the Group will enter into a specific lending arrangement, the loan commitment fee was deferred until theorigination of a loan and recognized as an adjustment to the loan’s effective interest rate.
Performance-linked fees or fee components were recognized when the performance criteria are fulfilled.
The following fee income was predominantly earned from services that were provided over a period of time: investment fundmanagement fees, fiduciary fees, custodian fees, portfolio and other management and advisory fees, credit-related fees andcommission income. Fees predominantly earned from providing transaction-type services include underwriting fees, corporatefinance fees and brokerage fees.
Expenses that were directly related and incremental to the generation of fee income were presented net in Commissions andFee Income.

229
Deutsche Bank Notes to the Consolidated Financial StatementsAnnual Report 2018 Significant Accounting Policies and Critical Accounting Estimates
Financial Assets (IFRS 9 – 2018 only)
The Group classifies financial assets in line with the classification and measurement requirements of IFRS 9, “FinancialInstruments” (IFRS 9) where financial assets are classified based on both the business model used for managing the financialassets and the contractual cash flow characteristics of the financial asset (known as Solely Payments of Principal and Interestor “SPPI”). There are three business models available:
– Hold to Collect - Financial assets held with the objective to collect contractual cash flows. They are subsequently measuredat amortized cost and are recorded in multiple lines on the Group’s consolidated balance sheet.
– Hold to Collect and Sell - Financial assets held with the objective of both collecting contractual cash flows and sellingfinancial assets. They are recorded as Financial assets at Fair Value through Other Comprehensive Income on the Group’sconsolidated balance sheet.
– Other - Financial assets that do not meet the criteria of either “Hold to Collect” or “Hold to Collect and Sell”. They arerecorded as Financial Assets at Fair Value through Profit or Loss on the Group’s consolidated balance sheet.
The assessment of business model requires judgment based on facts and circumstances at the date of the adoption onJanuary 1, 2018 and upon initial measurement. As part of this assessment, the Group considers quantitative factors (e.g., theexpected frequency and volume of sales) and qualitative factors such as how the performance of the business model and thefinancial assets held within that business model are evaluated and reported to the Group’s key management personnel. Inaddition to taking into consideration the risks that affect the performance of the business model and the financial assets heldwithin that business model, in particular, the way in which those market and credit risks are managed; and how managers ofthe business are compensated (e.g., whether the compensation is based on the fair value of the assets managed or on thecontractual cash flows collected). This assessment results in an asset being classified in either a Hold to Collect, Hold toCollect and Sell or Other business model.
If the Group holds a financial asset either in a Hold to Collect or a Hold to Collect and Sell business model, then an assessmentat initial recognition to determine whether the contractual cash flows of the financial asset are Solely Payments of Principaland Interest on the principal amount outstanding at initial recognition is required to determine the classification. Contractualcash flows, that are SPPI on the principal amount outstanding, are consistent with a basic lending arrangement. Interest in abasic lending arrangement is consideration for the time value of money and the credit risk associated with the principal amountoutstanding during a particular period of time. It can also include consideration for other basic lending risks (e.g., liquidity risk)and costs (e.g., administrative costs) associated with holding the financial asset for a particular period of time; and a profitmargin that is consistent with a basic lending arrangement.
Financial Assets at Fair Value through Profit or Loss
Financial assets are classified at fair value through profit or loss if they are held in the other business model because they areeither held for trading or because they do not meet the criteria for Hold to Collect or Hold to Collect and Sell. In addition, itincludes financial assets that meet the criteria for Hold to Collect or Hold to Collect and Sell business model, but the financialasset fails SPPI or where the Group designated the financial assets under the fair value option.
Financial assets classified as Financial Assets at fair value through profit or loss are measured at fair value with realized andunrealized gains and losses included in Net gains (losses) on financial assets/liabilities at fair value through profit or loss.Interest on interest earning assets such as trading loans and debt securities and dividends on equity instruments are presentedin Interest and Similar Income.
Financial assets classified at fair value through profit or loss are recognized or derecognized on trade date. Trade date is thedate on which the Group commits to purchase or sell the asset.
Trading Assets – Financial assets are classified as held for trading if they have been originated, acquired or incurred principallyfor the purpose of selling or repurchasing them in the near term, or they form part of a portfolio of identified financial instrumentsthat are managed together and for which there is evidence of a recent actual pattern of short-term profit-taking. Trading assetsinclude debt and equity securities, derivatives held for trading purposes, and trading loans. This also includes loancommitments that are allocated to the Other business model and that are classified as derivatives held for trading.

230
Deutsche Bank 2 – Consolidated Financial StatementsAnnual Report 2018
Non-Trading Financial Assets Mandatory at Fair Value through Profit and Loss –The Group assigns any non-trading financialasset that does not fall into the Hold to Collect nor Hold to Collect and Sell business models into the Other business modeland classifies them as Non-Trading Financial Assets mandatory at Fair Value through Profit and Loss. This includespredominately reverse repurchase agreements which are managed on a fair value basis. Additionally, any financial asset thatfalls into the Hold to Collect or Hold to Collect and Sell business models for which the contractual cash flow characteristicsare not SPPI is classified by the Group as Non-Trading Financial Assets Mandatory at Fair Value through Profit and Loss.
Financial Assets Designated at Fair Value through Profit or Loss – Certain financial assets that would otherwise be measuredsubsequently at amortized cost or at fair value through other comprehensive income, may be designated at Fair Value throughProfit or Loss if the designation eliminates or significantly reduces a measurement or recognition inconsistency. The use ofthe fair value option under IFRS 9 is limited. The Group allows the fair value option to be designated only for those financialinstruments for which a reliable estimate of fair value can be obtained.
Financial Assets at Fair Value through Other Comprehensive Income
A financial asset shall be classified and measured at Fair Value through Other Comprehensive Income (“FVOCI”), if thefinancial asset is held in a Hold to Collect and Sell business model and the contractual cash flows are SPPI, unless designatedunder the fair value option.
Under FVOCI, a financial asset is measured at its fair value with any changes being recognized in Other ComprehensiveIncome (”OCI”) and is assessed for impairment under the IFRS 9 expected credit loss model where provisions are recordedthrough profit or loss are recognized based on expectations of potential credit losses. The Group’s impairment policy isdescribed further in the section “Impairment of Loans and Provision for Off-Balance Sheet Positions (IFRS 9 – 2018 only)”.The foreign currency translation effect for FVOCI assets is recognized in profit or loss, as is the interest component by usingthe effective interest method. The amortization of premiums and accretion of discounts are recorded in net interest income.Realized gains and losses are reported in net gains (losses) on financial assets at FVOCI. Generally, the weighted-averagecost method is used to determine the cost of FVOCI financial assets.
Financial assets classified as FVOCI are recognized or derecognized on trade date. Trade date is the date on which the Groupcommits to purchase or sell the asset.
It is possible to designate non-trading equity instruments as FVOCI. However, this category is expected to have limited usageby the Group and has not been used to date.
Financial Assets at Amortized Cost
A financial asset is classified and subsequently measured at amortized cost if the financial asset is held in a Hold to Collectbusiness model and the contractual cash flows are SPPI.
Under this measurement category, the financial asset is measured at fair value at initial recognition. Subsequently the carryingamount is reduced for principal payments, plus or minus the cumulative amortization using the effective interest method. Thefinancial asset is assessed for impairment under the IFRS 9 expected credit loss model where provisions are recognizedbased on expectations of potential credit losses. The Group’s impairment of financial instruments policy is described furtherin the section “Impairment of Loans and Provision for Off-Balance Sheet Positions (IFRS 9 – 2018 only)”. Financial assetsmeasured at amortized cost are recognized on a settlement date basis.
Financial Assets at Amortized Cost include predominately Loans at amortized costs, Central bank funds sold and securitiespurchased under resale agreements, Securities borrowed and certain receivables presented in Other Assets.
Modification of Financial Assets
When the terms of a financial asset are renegotiated or modified and the modification does not result in derecognition, a gainor loss is recognized in the income statement as the difference between the original contractual cash flows and the modifiedcash flows discounted at the original effective interest rate. The modified financial asset will continue to accrue interest at itsoriginal EIR.
Noncredit related or commercial renegotiations where an obligor has not experienced a significant increase in credit risk sinceorigination, and has a readily exercisable right to early terminate the financial asset results in derecognition of the originalagreement and recognition of a new financial asset based on the newly negotiated commercial terms.

231
Deutsche Bank Notes to the Consolidated Financial StatementsAnnual Report 2018 Significant Accounting Policies and Critical Accounting Estimates
For credit related modifications (i.e., those modifications due to significant increase in credit risk since inception) or thosewhere the obligor does not have the readily exercisable right to early terminate, the Group assesses whether the modifiedterms result in the financial asset being significantly modified and therefore derecognized. This assessment includes aquantitative assessment of the impact of the change in cash flows from the modification of contractual terms and additionallywhere necessary a qualitative assessment of the impact of the change in the contractual terms. Where these modificationsare not concluded to be significant, the financial asset is not derecognized and is accounted for as a modification as describedabove.
If the changes are concluded to be significant, the old instrument is derecognized and a new instrument recognized. Where amodification results in a new financial asset being recognized, the date of the modification is the date of initial recognition ofthe new financial asset. The Group then recognizes a credit loss allowance based on 12-month expected credit losses at eachreporting date. However, if following a modification that results in a derecognition of the original financial asset, there isevidence that the new financial asset is credit-impaired on initial recognition, then the new financial asset should be recognizedas an originated credit-impaired financial asset and initially classified in Stage 3 (refer to section “Impairment of Loans andProvision for Off-Balance Sheet Positions (IFRS 9 – 2018 only)” below).
Financial Assets (IAS 39 - prior periods only)
The Group applied the classification and measurement requirements of IAS 39, “Financial Instruments: Recognition andMeasurement” in prior periods.
The Group classified its financial assets into the following categories: financial assets at fair value through profit or loss, loans,held-to-maturity and financial assets available for sale (“AFS”). Appropriate classification of financial assets was determinedat the time of initial recognition or when reclassified in the consolidated balance sheet.
Financial assets classified at fair value through profit or loss and financial assets classified as AFS were recognized orderecognized on trade date if a regular way period for the instrument exists. Trade date is the date on which the Groupcommits to purchase or sell the asset or issue or repurchase the financial liability. Financial instruments measured at amortizedcost were recognized on a settlement date basis.
Financial Assets at Fair Value through Profit or Loss
The Group classified certain financial assets either as held for trading or designated at fair value through profit or loss. Theywere carried at fair value and presented as financial assets at fair value through profit or loss. Related realized and unrealizedgains and losses are included in net gains (losses) on financial assets/liabilities at fair value through profit or loss. Interest oninterest earning assets such as trading loans and debt securities and dividends on equity instruments were presented ininterest and similar income for financial instruments at fair value through profit or loss.
Trading Assets – Financial assets were classified as held for trading if they have been originated or acquired principally forthe purpose of selling or repurchasing them in the near term, or they formed part of a portfolio of identified financial assetsthat were managed together and for which there was evidence of a recent actual pattern of short-term profit-taking. Tradingassets included debt and equity securities, derivatives held for trading purposes, commodities and trading loans.
Financial Assets Designated at Fair Value through Profit or Loss – Certain financial assets that did not meet the definition oftrading assets were designated at fair value through profit or loss using the fair value option. To be designated at fair valuethrough profit or loss, financial assets had to meet one of the following criteria: (1) the designation eliminates or significantlyreduced a measurement or recognition inconsistency; (2) a group of financial assets or liabilities or both was managed andits performance is evaluated on a fair value basis in accordance with a documented risk management or investment strategy;or (3) the instrument contains one or more embedded derivatives, unless: (a) the embedded derivative does not significantlymodify the cash flows that otherwise would be required by the contract; or (b) it is clear with little or no analysis that separationis prohibited. In addition, the Group allowed the fair value option to be designated only for those financial instruments for whicha reliable estimate of fair value can be obtained. Financial assets which were designated at fair value through profit or loss,under the fair value option, include repurchase and reverse repurchase agreements, certain loans and loan commitments anddebt and equity securities.

232
Deutsche Bank 2 – Consolidated Financial StatementsAnnual Report 2018
Loans
Loans included originated and purchased non-derivative financial assets with fixed or determinable payments that were notquoted in an active market and which were not classified as financial assets at fair value through profit or loss, held-to-maturityor financial assets AFS. An active market exists when quoted prices are readily and regularly available from an exchange,dealer, broker, industry group, pricing service or regulatory agency and those prices represent actual and regularly occurringmarket transactions on an arm’s length basis.
Loans not acquired in a business combination or in an asset purchase were initially recognized at their transaction pricerepresenting the fair value, which is the cash amount advanced to the borrower. In addition, the net of direct and incrementaltransaction costs and fees were included in the initial carrying amount of loans. These loans were subsequently measured atamortized cost using the effective interest method less impairment.
Loans which have been acquired as either part of a business combination or as an asset purchase were initially recognizedat fair value at the acquisition date. This included loans for which an impairment loss had been established by the acquireebefore their initial recognition by the Group. The fair value at the acquisition date incorporated expected cash flows whichconsidered the credit quality of these loans including any incurred losses, which became the new amortized cost base. Interestincome was recognized using the effective interest method. Subsequent to the acquisition date the Group assessed whetherthere was objective evidence of impairment in line with the policies described in the section entitled “Impairment of Loans andProvision for Off-Balance Sheet Positions (IAS 39 Prior Periods)”. If the loans were determined to be impaired then a loanloss allowance was recognized with a corresponding charge to the provision for credit losses line in the ConsolidatedStatement of Income. Releases of such loan loss allowances established after their initial recognition were included in theprovision for credit losses line. Subsequent improvements in the credit quality of such loans for which no loss allowance hadbeen recorded were recognized immediately through an adjustment to the current carrying value and a corresponding gainwas recognized in interest income.
Held-to-Maturity Investments
Held-to-maturity investments were non-derivative financial assets with fixed or determinable payments and a fixed maturitythat the Group had the positive intention and ability to hold to maturity and which were not classified as financial assets at fairvalue through profit or loss, loans or financial assets AFS.
Held-to-maturity investments were initially recorded at fair value plus any directly attributable transaction costs and weresubsequently measured at amortized cost using the effective interest method. Subsequent to the acquisition date, the Groupassessed whether there was objective evidence of impairment in line with the policies described in the section entitled“Impairment of Loans and Provision for Off-Balance Sheet provisions (IAS 39 Prior Periods only)”. If a held-to-maturityinvestment was considered impaired, then an impairment loss was recognized in the Consolidated Statement of Income.
Financial Assets Classified as Available for Sale
Financial assets that were classified as AFS are initially recognized at its fair value plus transaction costs that were directlyattributable to the acquisition of the financial asset. The amortization of premiums and accretion of discount were recorded innet interest income. Financial assets classified as AFS were carried at fair value with the changes in fair value reported inother comprehensive income, unless the asset was subject to a fair value hedge, in which case changes in fair value resultingfrom the risk being hedged were recorded in other income. For monetary financial assets classified as AFS (debt instruments),changes in carrying amounts relating to changes in foreign exchange rate were recognized in the Consolidated Statement ofIncome and other changes in carrying amount were recognized in other comprehensive income as indicated above. Forfinancial assets classified as AFS that were nonmonetary items (equity instruments), the fair value gain or loss was recognizedin other comprehensive income, which also includes any related foreign exchange component.
Equity investments classified as AFS were assessed for impairment if, objective evidence demonstrates a significant orprolonged decline in the fair value of the investment below cost. In the case of debt securities classified as AFS, impairmentwas assessed based on the same criteria as for loans.
If there was evidence of impairment, any amounts previously recognized in other comprehensive income was recognized inthe Consolidated Statement of Income for the period, reported in net gains (losses) on financial assets available for sale. Thisimpairment loss for the period was determined as the difference between the acquisition cost (net of any principal repaymentsand amortization) and current fair value of the asset less any impairment loss on that investment previously recognized in theConsolidated Statement of Income.

233
Deutsche Bank Notes to the Consolidated Financial StatementsAnnual Report 2018 Significant Accounting Policies and Critical Accounting Estimates
When an AFS debt security was impaired, any subsequent decreases in fair value were recognized in the ConsolidatedStatement of Income as it was considered further impairment. Any subsequent increases were also recognized in theConsolidated Statement of Income until the asset is no longer considered impaired. When the fair value of the AFS debtsecurity recovered to at least amortized cost it was no longer considered impaired and subsequent changes in fair value werereported in other comprehensive income.
Reversals of impairment losses on equity investments classified as AFS were not reversed through the ConsolidatedStatement of Income; increases in their fair value after impairment were recognized in other comprehensive income.
Realized gains and losses were reported in net gains (losses) on financial assets available for sale. Generally, the weighted-average cost method was used to determine the cost of financial assets. Unrealized gains and losses recorded in othercomprehensive income were transferred to the Consolidated Statement of Income on disposal of an available for sale assetand reported in net gains (losses) on financial assets available for sale.
Critical Accounting Estimates – Because the assessment of objective evidence of impairment required significant managementjudgment and the estimate of impairment could change from period to period based upon future events that may or may notoccur, the Group considered the impairment of Financial Assets classified as Available for Sale to be a critical accountingestimate. For additional information see Note 7 “Net Gains (Losses) on Financial Assets Available for Sale”.
Loan Commitments
Loan commitments remain off-balance sheet, unless classified as derivatives held for trading or designated at fair valuethrough profit or loss under the fair value option (IAS 39 only). The Group does not recognize and measure changes in fairvalue of these off-balance sheet loan commitments that result from changes in market interest rates or credit spreads.However, as specified in the sections “Impairment of Loans and Provision for Off-Balance Sheet Positions (IFRS 9 – 2018only)” and “Impairment of Loans and Provision for Off-Balance Sheet Positions (IAS 39 prior periods only)” below, these off-balance sheet loan commitments are assessed for impairment individually and where appropriate, collectively.
Financial Liabilities (IFRS 9 in 2018 and IAS 39 in prior periods)
Under both IFRS 9 and IAS 39, financial liabilities are measured at amortized cost using the effective interest method, exceptfor financial liabilities at fair value through profit or loss.
Financial Liabilities at Fair Value through Profit or Loss
Financial liabilities at fair value through profit or loss include Trading Liabilities, Financial Liabilities Designated at Fair Valuethrough Profit or Loss and Non-Participating Investment Contracts (“Investment Contracts”). Under IFRS 9 and IAS 39 theyare carried at fair value with realized and unrealized gains and losses included in net gains (losses) on financial assets andliabilities at fair value through profit or loss. However under IFRS 9, for financial liabilities designated at fair value through profitand loss the fair value movements attributable to the Group’s own credit component for fair value movements is recognizedin Other Comprehensive Income rather than in the Statement of Income as under IAS 39.
Financial liabilities classified at fair value through profit or loss are recognized or derecognized on trade date. Trade date isthe date on which the Group commits to issue or repurchase the financial liability.
Interest on interest paying liabilities are presented in interest expense for financial instruments at fair value through profit orloss.
Trading Liabilities - Financial liabilities are classified as held for trading if they have been originated or incurred principally forthe purpose of repurchasing them in the near term. Trading liabilities consist primarily of derivative liabilities (including certainloan commitments) and short positions. This also includes loan commitments that are allocated to the other business modeland that are classified as derivatives held for trading.

234
Deutsche Bank 2 – Consolidated Financial StatementsAnnual Report 2018
Financial Liabilities Designated at Fair Value through Profit or Loss - Certain financial liabilities that do not meet the definitionof trading liabilities are designated at fair value through profit or loss using the fair value option. To be designated at fair valuethrough profit or loss, financial liabilities must meet one of the following criteria: (1) the designation eliminates or significantlyreduces a measurement or recognition inconsistency; (2) a group of financial liabilities is managed and its performance isevaluated on a fair value basis in accordance with a documented risk management or investment strategy; or (3) the instrumentcontains one or more embedded derivatives unless: (a) the embedded derivative does not significantly modify the cash flowsthat otherwise would be required by the contract; or (b) it is clear with little or no analysis that separation is prohibited. Inaddition, the Group allows the fair value option to be designated only for those financial instruments for which a reliableestimate of fair value can be obtained. Financial liabilities which are designated at fair value through profit or loss, under thefair value option, include repurchase agreements, loan commitments and structured note liabilities.
Investment Contracts - All of the Group’s investment contracts are unit-linked and do not contain significant insurance risk ordiscretionary participation features. The contract liabilities are determined using current unit prices multiplied by the numberof units attributed to the contract holders as of the balance sheet date. As this amount represents fair value, the liabilities havebeen classified as financial liabilities at fair value through profit or loss. Deposits collected under investment contracts areaccounted for as an adjustment to the investment contract liabilities. Investment income attributable to investment contractsis included in the consolidated statement of Income. Investment contract claims reflect the excess of amounts paid over theaccount balance released. Investment contract policyholders are charged fees for policy administration, investmentmanagement, surrenders or other contract services.
Embedded Derivatives
Some hybrid financial liability contracts contain both a derivative and a non-derivative component. In such cases, the derivativecomponent is termed an embedded derivative, with the non-derivative component representing the host financial liabilitycontract. If the economic characteristics and risks of embedded derivatives are not closely related to those of the host financialliability contract and the hybrid financial liability contract itself is not carried at fair value through profit or loss, the embeddedderivative is bifurcated and reported at fair value, with gains and losses recognized in net gains (losses) on financialassets/liabilities at fair value through profit or loss. The host financial liability contract will continue to be accounted for inaccordance with the appropriate accounting standard. The carrying amount of an embedded derivative is reported in the sameconsolidated balance sheet line item as the host financial liability contract. Certain hybrid financial liability instruments havebeen designated at fair value through profit or loss using the fair value option.
Financial Liabilities at Amortized Cost
Financial liabilities measured at amortized cost include long-term and short-term debt issued which are initially measured atfair value, which is the consideration received, net of transaction costs incurred. Repurchases of issued debt in the market aretreated as extinguishments and any related gain or loss is recorded in the Consolidated Statement of Income. A subsequentsale of own bonds in the market is treated as a reissuance of debt. Financial liabilities measured at amortized cost arerecognized on a settlement date basis.
Offsetting of Financial Instruments
Financial assets and liabilities are offset, with the net amount presented in the consolidated balance sheet, only if the Groupholds a currently enforceable legal right to set off the recognized amounts and there is an intention to settle on a net basis orto realize an asset and settle the liability simultaneously. The legal right to set off the recognized amounts must be enforceablein both the normal course of business and in the event of default, insolvency or bankruptcy of both the Group and itscounterparty. In all other situations they are presented gross. When financial assets and financial liabilities are offset in theconsolidated balance sheet, the associated income and expense items will also be offset in the Consolidated Statement ofIncome, unless specifically prohibited by an applicable accounting standard.
The majority of the offsetting applied by the Group relates to derivatives and repurchase and reverse repurchase agreements.A significant portion of offsetting is applied to interest rate derivatives and related cash margin balances, which are clearedthrough central clearing parties such as the London Clearing House. For further information please refer to Note 19 “OffsettingFinancial Assets and Financial Liabilities”.

235
Deutsche Bank Notes to the Consolidated Financial StatementsAnnual Report 2018 Significant Accounting Policies and Critical Accounting Estimates
Determination of Fair Value
Fair value is defined as the price that would be received to sell an asset or paid to transfer a liability in an arm’s lengthtransaction between market participants at the measurement date. The fair value of instruments that are quoted in activemarkets is determined using the quoted prices where they represent those at which regularly and recently occurringtransactions take place. The Group measures certain portfolios of financial assets and financial liabilities on the basis of theirnet risk exposures when the following criteria are met:
– The group of financial assets and liabilities is managed on the basis of its net exposure to a particular market risk (or risks)or to the credit risk of a particular counterparty, in accordance with a documented risk management strategy,
– The fair values are provided to key management personnel, and– The financial assets and liabilities are measured at fair value through profit or loss.
This portfolio valuation approach is consistent with how the Group manages its net exposures to market and counterpartycredit risks.
Critical Accounting Estimates – The Group uses valuation techniques to establish the fair value of instruments where pricesquoted in active markets are not available. Therefore, where possible, parameter inputs to the valuation techniques are basedon observable data derived from prices of relevant instruments traded in an active market. These valuation techniques involvesome level of management estimation and judgment, the degree of which will depend on the price transparency for theinstrument or market and the instrument’s complexity.
In reaching estimates of fair value management judgment needs to be exercised. The areas requiring significant managementjudgment are identified, documented and reported to senior management as part of the valuation control process and thestandard monthly reporting cycle. The specialist model validation and valuation control groups focus attention on the areas ofsubjectivity and judgment.
The level of management judgment required in establishing fair value of financial instruments for which there is a quoted pricein an active market is usually minimal. Similarly there is little subjectivity or judgment required for instruments valued usingvaluation models which are standard across the industry and where all parameter inputs are quoted in active markets.
The level of subjectivity and degree of management judgment required is more significant for those instruments valued usingspecialized and sophisticated models and where some or all of the parameter inputs are less liquid or less observable.Management judgment is required in the selection and application of appropriate parameters, assumptions and modellingtechniques. In particular, where data are obtained from infrequent market transactions then extrapolation and interpolationtechniques must be applied. Where no market data are available for a particular instrument then pricing inputs are determinedby assessing other relevant sources of information such as historical data, fundamental analysis of the economics of thetransaction and proxy information from similar transactions, and making appropriate adjustment to reflect the actual instrumentbeing valued and current market conditions. Where different valuation techniques indicate a range of possible fair values foran instrument then management has to decide what point within the range of estimates appropriately represents the fair value.Further, some valuation adjustments may require the exercise of management judgment to achieve fair value.
Financial assets and liabilities carried at fair value are required to be disclosed according to the inputs to the valuation methodthat are used to determine their fair value. Specifically, segmentation is required between those valued using quoted marketprices in an active market (level 1), valuation techniques based on observable parameters (level 2) and valuation techniquesusing significant unobservable parameters (level 3). Management judgment is required in determining the category to whichcertain instruments should be allocated. This specifically arises when the valuation is determined by a number of parameters,some of which are observable and others are not. Further, the classification of an instrument can change over time to reflectchanges in market liquidity and therefore price transparency.
The Group provides a sensitivity analysis of the impact upon the level 3 financial instruments of using a reasonably possiblealternative for the unobservable parameter. The determination of reasonably possible alternatives requires significantmanagement judgment.
For financial instruments measured at amortized cost (which includes loans, deposits and short and long term debt issued)the Group discloses the fair value. Generally there is limited or no trading activity in these instruments and therefore the fairvalue determination requires significant management judgment.
For further discussion of the valuation methods and controls and quantitative disclosures with respect to the determination offair value, please refer to Note 13 “Financial Instruments carried at Fair Value” and Note 14 “Fair Value of FinancialInstruments not carried at Fair Value”.
236
Deutsche Bank 2 – Consolidated Financial StatementsAnnual Report 2018
Recognition of Trade Date Profit
If there are significant unobservable inputs used in the valuation technique, the financial instrument is recognized at thetransaction price and any profit implied from the valuation technique at trade date is deferred.
Using systematic methods, the deferred amount is recognized over the period between trade date and the date when themarket is expected to become observable, or over the life of the trade (whichever is shorter). Such methodology is usedbecause it reflects the changing economic and risk profile of the instrument as the market develops or as the instrument itselfprogresses to maturity. Any remaining trade date deferred profit is recognized in the Consolidated Statement of Income whenthe transaction becomes observable or the Group enters into offsetting transactions that substantially eliminate theinstrument’s risk. In the rare circumstances that a trade date loss arises, it would be recognized at inception of the transactionto the extent that it is probable that a loss has been incurred and a reliable estimate of the loss amount can be made.
Critical Accounting Estimates – Management judgment is required in determining whether there exist significant unobservableinputs in the valuation technique. Once deferred, the decision to subsequently recognize the trade date profit requires a carefulassessment of the then current facts and circumstances supporting observability of parameters and/or risk mitigation.
Derivatives and Hedge Accounting
Derivatives are used to manage exposures to interest rate, foreign currency, credit and other market price risks, includingexposures arising from forecast transactions. All freestanding contracts that are considered derivatives for accountingpurposes are carried at fair value on the consolidated balance sheet regardless of whether they are held for trading or non-trading purposes.
The changes in fair value on derivatives held for trading are included in net gains (losses) on financial assets/liabilities at fairvalue through profit or loss.
Hedge Accounting
IFRS 9 includes an accounting policy choice to defer the adoption of IFRS 9 hedge accounting and to continue with IAS 39hedge accounting. The Group decided to exercise this accounting policy choice and did not adopt IFRS 9 hedge accountingas of January 1, 2018.
For accounting purposes there are three possible types of hedges: (1) hedges of changes in the fair value of assets, liabilitiesor unrecognized firm commitments (fair value hedges); (2) hedges of the variability of future cash flows from highly probableforecast transactions and floating rate assets and liabilities (cash flow hedges); and (3) hedges of the translation adjustmentsresulting from translating the functional currency financial statements of foreign operations into the presentation currency ofthe parent (hedges of net investments in foreign operations).
When hedge accounting is applied, the Group designates and documents the relationship between the hedging instrumentand the hedged item as well as its risk management objective and strategy for undertaking the hedging transactions and thenature of the risk being hedged. This documentation includes a description of how the Group will assess the hedginginstrument’s effectiveness in offsetting the exposure to changes in the hedged item’s fair value or cash flows attributable tothe hedged risk. Hedge effectiveness is assessed at inception and throughout the term of each hedging relationship. Hedgeeffectiveness is always assessed, even when the terms of the derivative and hedged item are matched.
Hedging derivatives are reported as other assets and other liabilities. In the event that a derivative is subsequently de-designated from a hedging relationship, it is transferred to financial assets/liabilities at fair value through profit or loss.
For hedges of changes in fair value, the changes in the fair value of the hedged asset, liability or unrecognized firmcommitment, or a portion thereof, attributable to the risk being hedged, are recognized in the Consolidated Statement ofIncome along with changes in the entire fair value of the derivative. When hedging interest rate risk, any interest accrued orpaid on both the derivative and the hedged item is reported in interest income or expense and the unrealized gains and lossesfrom the hedge accounting fair value adjustments are reported in other revenue. When the foreign exchange risk of an AFSequity security was hedged in prior accounting periods, the fair value adjustments related to the security’s foreign exchangeexposures were also recorded in other revenue. Hedge ineffectiveness is reported in other revenue and is measured as thenet effect of changes in the fair value of the hedging instrument and changes in the fair value of the hedged item arising fromchanges in the market rate or price related to the risk(s) being hedged.
237
Deutsche Bank Notes to the Consolidated Financial StatementsAnnual Report 2018 Significant Accounting Policies and Critical Accounting Estimates
If a fair value hedge of a debt instrument is discontinued prior to the instrument’s maturity because the derivative is terminatedor the relationship is de-designated, any remaining interest rate-related fair value adjustments made to the carrying amountof the debt instrument (basis adjustments) are amortized to interest income or expense over the remaining term of the originalhedging relationship. For other types of fair value adjustments and whenever a fair value hedged asset or liability is sold orotherwise derecognized, any basis adjustments are included in the calculation of the gain or loss on derecognition.
For hedges of variability in future cash flows, there is no change to the accounting for the hedged item and the derivative iscarried at fair value, with changes in value reported initially in other comprehensive income to the extent the hedge is effective.These amounts initially recorded in other comprehensive income are subsequently reclassified into the ConsolidatedStatement of Income in the same periods during which the forecast transaction affects the Consolidated Statement of Income.Thus, for hedges of interest rate risk, the amounts are amortized into interest income or expense at the same time as theinterest is accrued on the hedged transaction.
Hedge ineffectiveness is recorded in other income and is measured as changes in the excess (if any) in the absolutecumulative change in fair value of the actual hedging derivative over the absolute cumulative change in the fair value of thehypothetically perfect hedge.
When hedges of variability in cash flows attributable to interest rate risk are discontinued, amounts remaining in accumulatedother comprehensive income are amortized to interest income or expense over the remaining life of the original hedgerelationship, unless the hedged transaction is no longer expected to occur in which case the amount will be reclassified intoother income immediately. When hedges of variability in cash flows attributable to other risks are discontinued, the relatedamounts in accumulated other comprehensive income are reclassified into either the same Consolidated Statement of Incomecaption and period as profit or loss from the forecast transaction, or into other income when the forecast transaction is nolonger expected to occur.
For hedges of the translation adjustments resulting from translating the functional currency financial statements of foreignoperations (hedges of net investments in foreign operations) into the functional currency of the parent, the portion of thechange in fair value of the derivative due to changes in the spot foreign exchange rates is recorded as a foreign currencytranslation adjustment in other comprehensive income to the extent the hedge is effective; the remainder is recorded as otherincome in the Consolidated Statement of Income.
Changes in fair value of the hedging instrument relating to the effective portion of the hedge are subsequently recognized inprofit or loss on disposal of the foreign operations.
Impairment of Loans and Provision for Off-Balance Sheet Positions (IFRS 9 –2018 only)
The impairment requirements of IFRS 9 apply to all credit exposures that are measured at amortized cost or FVOCI, and tooff-balance sheet lending commitments such as loan commitments and financial guarantees. For purposes of the impairmentpolicy below, these instruments are referred to as (“Financial Assets”).
The determination of impairment losses and allowance moves from an incurred credit loss model whereby credit losses arerecognized when a defined loss event occurs under IAS 39, to an expected credit loss model under IFRS 9, where allowancesare taken upon initial recognition of the Financial Asset, based on expectations of potential credit losses at the time of initialrecognition.

238
Deutsche Bank 2 – Consolidated Financial StatementsAnnual Report 2018
Staged Approach to the Determination of Expected Credit Losses
IFRS 9 introduces a three stage approach to impairment for Financial Assets that are not credit-impaired at the date oforigination or purchase. This approach is summarized as follows:
– Stage 1: The Group recognizes a credit loss allowance at an amount equal to 12-month expected credit losses. Thisrepresents the portion of lifetime expected credit losses from default events that are expected within 12 months of thereporting date, assuming that credit risk has not increased significantly after initial recognition.
– Stage 2: The Group recognizes a credit loss allowance at an amount equal to lifetime expected credit losses for thoseFinancial Assets which are considered to have experienced a significant increase in credit risk since initial recognition. Thisrequires the computation of ECL based on lifetime probability of default, lifetime loss given default and lifetime exposure atdefault that represents the probability of default occurring over the remaining lifetime of the Financial Asset. Allowance forcredit losses are higher in this stage because of an increase in credit risk and the impact of a longer time horizon beingconsidered compared to 12 months in Stage 1.
– Stage 3: The Group recognizes a loss allowance at an amount equal to lifetime expected credit losses, reflecting aProbability of Default of 100 %, via the expected recoverable cash flows for the asset, for those Financial Assets that arecredit-impaired. The Group’s definition of default is aligned with the regulatory definition. Financial Assets that are credit-impaired upon initial recognition are categorized within Stage 3 with a carrying value already reflecting the lifetime expectedcredit losses. The accounting treatment for these purchased or originated credit-impaired (“POCI”) assets is discussedfurther below.
Significant Increase in Credit Risk
Under IFRS 9, when determining whether the credit risk (i.e., risk of default) of a Financial Asset has increased significantlysince initial recognition, the Group considers reasonable and supportable information that is relevant and available withoutundue cost or effort. This includes quantitative and qualitative information based on the Group’s historical experience, creditrisk assessment and forward-looking information (including macro-economic factors). The assessment of significant creditdeterioration is key in determining when to move from measuring an allowance based on 12-month ECLs to one that is basedon lifetime ECLs (i.e., transfer from Stage 1 to Stage 2).
The Group’s framework for determining if there has been a significant increase in credit risk aligns with the internal Credit RiskManagement (“CRM”) process and covers rating related and process related indicators which are discussed further in section“IFRS 9 Impairment Approach” in the Risk Report.
Credit-impaired Financial Assets in Stage 3
The Group has aligned its definition of credit-impaired under IFRS 9 to when a Financial Asset has defaulted for regulatorypurposes, according to the Capital Requirements Regulation under Art. 178.
The determination of whether a Financial Asset is credit-impaired and therefore in Stage 3 focusses exclusively on defaultrisk, without taking into consideration the effects of credit risk mitigants such as collateral or guarantees. Specifically, aFinancial Asset is credit-impaired and in Stage 3 when:
– The Group considers the obligor is unlikely to pay its credit obligations to the Group. Determination may include forbearanceactions, where a concession has been granted to the borrower or economic or legal reasons that are qualitative indicatorsof credit impairment; or
– Contractual payments of either principal or interest by the obligor are past due by more than 90 days.
For Financial Assets considered to be credit-impaired, the ECL allowance covers the amount of loss the Group is expected tosuffer. The estimation of ECLs is done on a case-by-case basis for non-homogeneous portfolios, or by applying portfolio basedparameters to individual Financial Assets in these portfolios via the Group’s ECL model for homogeneous portfolios. Thisestimate includes the use of discounted cash flows that are adjusted for scenarios.
Forecasts of future economic conditions when calculating ECLs are considered. The lifetime expected losses are estimatedbased on the probability-weighted present value of the difference between the contractual cash flows that are due to the Groupunder the contract; and the cash flows that the Group expects to receive.
A Financial Asset can be classified as credit-impaired in Stage 3 but without an allowance for credit losses (i.e., no impairmentloss is expected). This may be due to the value of collateral. The Group’s engine based ECL calculation is conducted on amonthly basis, whereas the case-by-case assessment of ECL in Stage 3 for non-homogeneous portfolio has to be performedat least on a quarterly basis.

239
Deutsche Bank Notes to the Consolidated Financial StatementsAnnual Report 2018 Significant Accounting Policies and Critical Accounting Estimates
Purchased or Originated Credit-Impaired Financial Assets in Stage 3
A Financial Asset is considered purchased or originated credit-impaired if there is objective evidence of impairment at the timeof initial recognition. Such credit-impaired Financial Assets are termed POCI Financial Assets. POCI Financial Assets aremeasured to reflect lifetime expected credit losses, and all subsequent changes in lifetime expected credit losses, whetherpositive or negative, are recognized in the income statement as a component of the provision for credit losses. POCI FinancialAssets can only be classified in Stage 3 over the life of the Financial Asset.
Write-Offs
The Group reduces the gross carrying amount of a Financial Asset when there is no reasonable expectation of recovery.Write-offs can relate to a Financial Asset in its entirety, or to a portion of it, and constitute a derecognition event. The Groupconsiders all relevant information in making this determination, including but not limited to:
– Foreclosure actions taken by the Group which have not been successful or have a high probability of not being successful– Collateral liquidation which has not, or will not lead to further considerable recoveries– Situations where no further recoveries are reasonably expected
Write-offs can take place before legal actions against the borrower to recover the debt have been concluded, and a write-offdoes not involve the Group forfeiting its legal right to recover the debt.
Collateral for Financial Assets Considered in the Impairment Analysis
IFRS 9 requires cash flows expected from collateral and other credit enhancement to be reflected in the ECL calculation. Thefollowing are key aspects with respect to collateral and guarantees:
– Eligibility of collateral, i.e. which collateral should be considered in the ECL calculation;– Collateral evaluation, i.e. what collateral (liquidation) value should be used; and– Projection of the available collateral amount over the life of a transaction.
These concepts are outlined in more detail in section “IFRS 9 Impairment Approach” in the Risk Report.
Critical Accounting Estimates – The accounting estimates and judgments related to the impairment of Financial Assets is acritical accounting estimate because the underlying assumptions used can change from period to period and may significantlyaffect the Group’s results of operations.
In assessing assets for impairments, management judgment is required, particularly in projecting future economic informationand scenarios in particular where circumstances of economic and financial uncertainty, when developments and changes toexpected cash flows can occur both with greater rapidity and less predictability. The actual amount of the future cash flowsand their timing may differ from the estimates used by management and consequently may cause actual losses to differ fromreported allowances.
For those non-homogeneous loans in Stage 3 the determination of the impairment allowance often requires the use ofconsiderable judgment concerning such matters as local economic conditions, the financial performance of the counterpartyand the value of any collateral held, for which there may not be a readily accessible market.
The determination of the expected credit losses in Stages 1 and 2 and for homogeneous loans in Stage 3 is calculated usingstatistical expected loss models. The model incorporates numerous estimates and judgments. The Group performs a regularreview of the model and underlying data and assumptions. The probability of defaults, loss recovery rates and judgmentsconcerning ability of borrowers in foreign countries to transfer the foreign currency necessary to comply with debt repayments,amongst other things, are incorporated into this review.
The quantitative disclosures are provided in Note 20 “Loans” and Note 21 “Allowance for Credit Losses”.

240
Deutsche Bank 2 – Consolidated Financial StatementsAnnual Report 2018
Impairment of Loans and Provision for Off-Balance Sheet Positions (IAS 39 - priorperiods only)
The Group applied the impairment requirements of IAS 39 “Financial Instruments: Recognition and Measurement” and IAS 37,“Provisions, Contingent Liabilities and Contingent Assets” in prior periods.
The Group first assessed whether objective evidence of impairment existed individually for loans that were individuallysignificant. It then assessed collectively for loans that were not individually significant and loans which were significant but forwhich there was no objective evidence of impairment under the individual assessment.
To allow management to determine whether a loss event has occurred on an individual basis, all significant counterpartyrelationships were reviewed periodically. This evaluation considered information and events related to the counterparty, suchas the counterparty experiencing significant financial difficulty or a breach of contract, for example, default or delinquency ininterest or principal payments.
If there was evidence of impairment leading to an impairment loss for an individual counterparty relationship, then the amountof the loss was determined as the difference between the carrying amount of the loan(s), including accrued interest, and thepresent value of expected future cash flows discounted at the loan’s original effective interest rate or the effective interest rateestablished upon reclassification to loans, including cash flows that may result from foreclosure less costs for obtaining andselling the collateral. The carrying amount of the loans was reduced by the use of an allowance account and the amount ofthe loss was recognized in the Consolidated Statement of Income as a component of the provision for credit losses.
The collective assessment of impairment was to establish an allowance amount relating to loans that were either individuallysignificant but for which there was no objective evidence of impairment, or were not individually significant but for which therewas, on a portfolio basis, a loss amount that was probable of having occurred and was reasonably estimable. The loss amounthad three components. The first component was an amount for transfer and currency convertibility risks for loan exposures incountries where there were serious doubts about the ability of counterparties to comply with the repayment terms due to theeconomic or political situation prevailing in the respective country of domicile. This amount was calculated using ratings forcountry risk and transfer risk which were established and regularly reviewed for each country in which the Group doesbusiness. The second component was an allowance amount representing the incurred losses on the portfolio of smaller-balance homogeneous loans, which were loans to individuals and small business customers of the private and retail business.The loans were grouped according to similar credit risk characteristics and the allowance for each group was determinedusing statistical models based on historical experience. The third component represented an estimate of incurred lossesinherent in the group of loans that had not yet been individually identified or measured as part of the smaller-balancehomogeneous loans. Loans that were found not to be impaired when evaluated on an individual basis were included in thescope of this component of the allowance.
Once a loan was identified as impaired, although the accrual of interest in accordance with the contractual terms of the loanwas discontinued, the accretion of the net present value of the written down amount of the loan due to the passage of timewas recognized as interest income based on the original effective interest rate of the loan.
At each balance sheet date, all impaired loans were reviewed for changes to the present value of expected future cash flowsdiscounted at the loan’s original effective interest rate. Any change to the previously recognized impairment loss wasrecognized as a change to the allowance account and recorded in the Consolidated Statement of Income as a component ofthe provision for credit losses.
When it was considered that there was no realistic prospect of recovery and all collateral had been realized or transferred tothe Group, the loan and any associated allowance was charged off (the loan and the related allowance were removed fromthe balance sheet). Individually significant loans where specific loan loss provisions were in place were evaluated at leastquarterly on a case-by-case basis. For this category of loans, the number of days past due was an indicator for a charge-offbut was not a determining factor. A charge-off would only take place after considering all relevant information, such as theoccurrence of a significant change in the borrower’s financial position such that the borrower could no longer pay the obligation,or the proceeds from the collateral were insufficient to completely satisfy the current carrying amount of the loan.

241
Deutsche Bank Notes to the Consolidated Financial StatementsAnnual Report 2018 Significant Accounting Policies and Critical Accounting Estimates
For collectively assessed loans, which were primarily mortgages and consumer finance loans, the timing of a charge-offdepended on whether there was any underlying collateral and the Group’s estimate of the amount collectible and the legalrequirements in the jurisdiction in which the loan was originated.
Subsequent recoveries, if any, were credited to the allowance account and were recorded in the Consolidated Statement ofIncome as a component of the provision for credit losses.
The process to determine the provision for off-balance sheet positions is similar to the methodology used for loans. Any lossamounts were recognized as an allowance in the consolidated balance sheet within provisions and charged to theConsolidated Statement of Income as a component of the provision for credit losses.
If in a subsequent period the amount of a previously recognized impairment loss decreased and the decrease was due to anevent occurring after the impairment was recognized, the impairment loss was reversed by reducing the allowance accountaccordingly. Such reversal was recognized in profit or loss.
Critical Accounting Estimates –The accounting estimates and judgments related to the impairment of loans and provision foroff-balance sheet positions was a critical accounting estimate because the underlying assumptions used for both theindividually and collectively assessed impairment can change from period to period and may significantly affect the Group’sresults of operations.
The quantitative disclosures are provided in Note 20 “Loans” and Note 21 “Allowance for Credit Losses”.
Derecognition of Financial Assets and Liabilities
Financial Asset Derecognition
A financial asset is considered for derecognition when the contractual rights to the cash flows from the financial asset expire,or the Group has either transferred the contractual right to receive the cash flows from that asset, or has assumed an obligationto pay those cash flows to one or more recipients, subject to certain criteria.
The Group derecognizes a transferred financial asset if it transfers substantially all the risks and rewards of ownership.
The Group enters into transactions in which it transfers previously recognized financial assets but retains substantially all theassociated risks and rewards of those assets; for example, a sale to a third party in which the Group enters into a concurrenttotal return swap with the same counterparty. These types of transactions are accounted for as secured financing transactions.
In transactions in which substantially all the risks and rewards of ownership of a financial asset are neither retained nortransferred, the Group derecognizes the transferred asset if control over that asset is not retained, i.e., if the transferee hasthe practical ability to sell the transferred asset. The rights and obligations retained in the transfer are recognized separatelyas assets and liabilities, as appropriate. If control over the asset is retained, the Group continues to recognize the asset to theextent of its continuing involvement, which is determined by the extent to which it remains exposed to changes in the value ofthe transferred asset.
The derecognition criteria are also applied to the transfer of part of an asset, rather than the asset as a whole, or to a groupof similar financial assets in their entirety, when applicable. If transferring a part of an asset, such part must be a specificallyidentified cash flow, a fully proportionate share of the asset, or a fully proportionate share of a specifically-identified cash flow.
If an existing financial asset is replaced by another asset from the same counterparty on substantially different terms, or if theterms of the financial asset are substantially modified (due to forbearance measures or otherwise), the existing financial assetis derecognized and a new asset is recognized. Any difference between the respective carrying amounts is recognized in theConsolidated Statement of Income.

242
Deutsche Bank 2 – Consolidated Financial StatementsAnnual Report 2018
Securitization
The Group securitizes various consumer and commercial financial assets, which is achieved via the transfer of these assetsto a structured entity, which issues securities to investors to finance the acquisition of the assets. Financial assets awaitingsecuritization are classified and measured as appropriate under the policies in the “Financial Assets and Liabilities” section. Ifthe structured entity is not consolidated then the transferred assets may qualify for derecognition in full or in part, under thepolicy on derecognition of financial assets. Synthetic securitization structures typically involve derivative financial instrumentsfor which the policies in the “Derivatives and Hedge Accounting” section would apply. Those transfers that do not qualify forderecognition may be reported as secured financing or result in the recognition of continuing involvement liabilities. Theinvestors and the securitization vehicles generally have no recourse to the Group’s other assets in cases where the issuersof the financial assets fail to perform under the original terms of those assets.
Interests in the securitized financial assets may be retained in the form of senior or subordinated tranches, interest only stripsor other residual interests (collectively referred to as “retained interests”). Provided the Group’s retained interests do not resultin consolidation of a structured entity, nor in continued recognition of the transferred assets, these interests are typicallyrecorded in financial assets at fair value through profit or loss and carried at fair value. Consistent with the valuation of similarfinancial instruments, the fair value of retained tranches or the financial assets is initially and subsequently determined usingmarket price quotations where available or internal pricing models that utilize variables such as yield curves, prepaymentspeeds, default rates, loss severity, interest rate volatilities and spreads. The assumptions used for pricing are based onobservable transactions in similar securities and are verified by external pricing sources, where available. Where observabletransactions in similar securities and other external pricing sources are not available, management judgment must be used todetermine fair value. The Group may also periodically hold interests in securitized financial assets and record them atamortized cost.
In situations where the Group has a present obligation (either legal or constructive) to provide financial support to anunconsolidated securitization entity a provision will be created if the obligation can be reliably measured and it is probable thatthere will be an outflow of economic resources required to settle it.
When an asset is derecognized a gain or loss equal to the difference between the consideration received and the carryingamount of the transferred asset is recorded. When a part of an asset is derecognized, gains or losses on securitization dependin part on the carrying amount of the transferred financial assets, allocated between the financial assets derecognized and theretained interests based on their relative fair values at the date of the transfer.
Derecognition of Financial Liabilities
A financial liability is derecognized when the obligation under the liability is discharged or cancelled or expires. If an existingfinancial liability is replaced by another from the same lender on substantially different terms, or the terms of the existingliability are substantially modified, such an exchange or modification is treated as a derecognition of the original liability andthe recognition of a new liability, and the difference in the respective carrying amounts is recognized in the ConsolidatedStatement of Income.
Repurchase and Reverse Repurchase Agreements
Securities purchased under resale agreements (“reverse repurchase agreements”) and securities sold under agreements torepurchase (“repurchase agreements”) are treated as collateralized financings and are recognized initially at fair value, beingthe amount of cash disbursed and received, respectively. The party disbursing the cash takes possession of the securitiesserving as collateral for the financing and having a market value equal to, or in excess of, the principal amount loaned. Thesecurities received under reverse repurchase agreements and securities delivered under repurchase agreements are notrecognized on, or derecognized from, the balance sheet, because the risks and rewards of ownership are not obtained norrelinquished. Securities delivered under repurchase agreements which are not derecognized from the balance sheet andwhere the counterparty has the right by contract or custom to sell or repledge the collateral are disclosed in Note 22 “Transferof Financial Assets, Assets Pledged and Received as Collateral”.
Under IFRS 9 the Group allocates reverse repurchase portfolios that are managed on a fair value basis to the other businessmodel and classifies them as “Non-trading financial assets mandatory at fair value through profit or loss”. Under IAS 39 theGroup choose to apply the fair value option to certain repurchase and reverse repurchase portfolios that were managed on afair value basis.
Interest earned on reverse repurchase agreements and interest incurred on repurchase agreements is reported as interestincome and interest expense, respectively.

243
Deutsche Bank Notes to the Consolidated Financial StatementsAnnual Report 2018 Significant Accounting Policies and Critical Accounting Estimates
Securities Borrowed and Securities Loaned
Securities borrowed transactions generally require the Group to deposit cash with the securities lender. In a securities loanedtransaction, the Group generally receives either cash collateral, in an amount equal to or in excess of the market value ofsecurities loaned, or securities. The Group monitors the fair value of securities borrowed and securities loaned and additionalcollateral is disbursed or obtained, if necessary.
The securities borrowed are not themselves recognized in the financial statements. If they are sold to third parties, theobligation to return the securities is recorded as a financial liability at fair value through profit or loss and any subsequent gainor loss is included in the Consolidated Statement of Income in net gains (losses) on financial assets/liabilities at fair valuethrough profit or loss. Securities lent to counterparties are also retained on the consolidated balance sheet.
Under IFRS 9 and IAS 39 the Group records the amount of cash advanced or received as securities borrowed and securitiesloaned, respectively, in the consolidated balance sheet.
Fees received or paid are reported in interest income and interest expense, respectively. Securities lent to counterpartieswhich are not derecognized from the consolidated balance sheet and where the counterparty has the right by contract orcustom to sell or repledge the collateral are disclosed in Note 22 “Transfer of Financial Assets, Assets Pledged and Receivedas Collateral”.
Goodwill and Other Intangible Assets
Goodwill arises on the acquisition of subsidiaries and associates and represents the excess of the aggregate of the cost of anacquisition and any noncontrolling interests in the acquiree over the fair value of the identifiable net assets acquired at thedate of the acquisition.
For the purpose of calculating goodwill, fair values of acquired assets, liabilities and contingent liabilities are determined byreference to market values or by discounting expected future cash flows to present value. This discounting is either performedusing market rates or by using risk-free rates and risk-adjusted expected future cash flows. Any noncontrolling interests in theacquiree is measured either at fair value or at the noncontrolling interests’ proportionate share of the acquiree’s identifiablenet assets (this is determined for each business combination).
Goodwill on the acquisition of subsidiaries is capitalized and reviewed for impairment annually or more frequently if there areindications that impairment may have occurred. For the purposes of impairment testing, goodwill acquired in a businesscombination is allocated to cash-generating units (“CGUs”), which are the smallest identifiable groups of assets that generatecash inflows largely independent of the cash inflows from other assets or groups of assets and that are expected to benefitfrom the synergies of the combination and considering the business level at which goodwill is monitored for internalmanagement purposes. In identifying whether cash inflows from an asset (or a group of assets) are largely independent of thecash inflows from other assets (or groups of assets) various factors are considered, including how management monitors theentity’s operations or makes decisions about continuing or disposing of the entity’s assets and operations.
If goodwill has been allocated to a CGU and an operation within that unit is disposed of, the attributable goodwill is includedin the carrying amount of the operation when determining the gain or loss on its disposal.
Certain non-integrated investments are not allocated to a CGU. Impairment testing is performed individually for each of theseassets.
Corporate assets are allocated to a CGU when the allocation can be done on a reasonable and consistent basis. If this is notpossible, the individual CGU is tested without the corporate assets. They are then tested on the level of the minimum collectionof CGUs to which they can be allocated on a reasonable and consistent basis.
Intangible assets are recognized separately from goodwill when they are separable or arise from contractual or other legalrights and their fair value can be measured reliably. Intangible assets that have a finite useful life are stated at cost less anyaccumulated amortization and accumulated impairment losses. Customer-related intangible assets that have a finite usefullife are amortized over periods of between 1 and 20 years on a straight-line basis based on their expected useful life. Theseassets are tested for impairment and their useful lives reaffirmed at least annually.

244
Deutsche Bank 2 – Consolidated Financial StatementsAnnual Report 2018
Certain intangible assets have an indefinite useful life and hence are not amortized, but are tested for impairment at leastannually or more frequently if events or changes in circumstances indicate that impairment may have occurred.
Costs related to software developed or obtained for internal use are capitalized if it is probable that future economic benefitswill flow to the Group and the cost can be measured reliably. Capitalized costs are amortized using the straight-line methodover the asset’s useful life which is deemed to be either three, five or ten years. Eligible costs include external direct costs formaterials and services, as well as payroll and payroll-related costs for employees directly associated with an internal-usesoftware project. Overhead costs, as well as costs incurred during the research phase or after software is ready for use, areexpensed as incurred. Capitalized software costs are tested for impairment either annually if still under development or anytime when there is an indication of impairment once the software is in use.
Critical Accounting Estimates – The determination of the recoverable amount in the impairment assessment of non-financialassets requires estimates based on quoted market prices, prices of comparable businesses, present value or other valuationtechniques, or a combination thereof, necessitating management to make subjective judgments and assumptions. Becausethese estimates and assumptions could result in significant differences to the amounts reported if underlying circumstanceswere to change, the Group considers these estimates to be critical.
The quantitative disclosures are provided in Note 25 “Goodwill and Other Intangible Assets”.
Provisions
Provisions are recognized if the Group has a present legal or constructive obligation as a result of past events, if it is probablethat an outflow of resources will be required to settle the obligation, and a reliable estimate can be made of the amount of theobligation.
The amount recognized as a provision is the best estimate of the consideration required to settle the present obligation as ofthe balance sheet date, taking into account the risks and uncertainties surrounding the obligation.
If the effect of the time value of money is material, provisions are discounted and measured at the present value of theexpenditure expected to be required to settle the obligation, using a pre-tax rate that reflects the current market assessmentsof the time value of money and the risks specific to the obligation. The increase in the provision due to the passage of time isrecognized as interest expense.
When some or all of the economic benefits required to settle a provision are expected to be recovered from a third party (forexample, because the obligation is covered by an insurance policy), an asset is recognized if it is virtually certain thatreimbursement will be received.
Critical Accounting Estimates – The use of estimates is important in determining provisions for potential losses that may arisefrom litigation, regulatory proceedings and uncertain income tax positions. The Group estimates and provides for potentiallosses that may arise out of litigation, regulatory proceedings and uncertain income tax positions to the extent that such lossesare probable and can be estimated, in accordance with IAS 37, “Provisions, Contingent Liabilities and Contingent Assets” orIAS 12, “Income Taxes”, respectively. Significant judgment is required in making these estimates and the Group’s finalliabilities may ultimately be materially different.
Contingencies in respect of legal matters are subject to many uncertainties and the outcome of individual matters is notpredictable with assurance. Significant judgment is required in assessing probability and making estimates in respect ofcontingencies, and the Group’s final liability may ultimately be materially different. The Group’s total liability in respect oflitigation, arbitration and regulatory proceedings is determined on a case-by-case basis and represents an estimate of probablelosses after considering, among other factors, the progress of each case, the Group’s experience and the experience of othersin similar cases, and the opinions and views of legal counsel. Predicting the outcome of the Group’s litigation matters isinherently difficult, particularly in cases in which claimants seek substantial or indeterminate damages. See Note 29“Provisions” for information on the Group’s judicial, regulatory and arbitration proceedings.

245
Deutsche Bank Notes to the Consolidated Financial StatementsAnnual Report 2018 Significant Accounting Policies and Critical Accounting Estimates
Income Taxes
The Group recognizes the current and deferred tax consequences of transactions that have been included in the consolidatedfinancial statements using the provisions of the respective jurisdictions’ tax laws. Current and deferred taxes are recognizedin profit or loss except to the extent that the tax relates to items that are recognized directly in equity or other comprehensiveincome in which case the related tax is recognized either directly in equity or other comprehensive income accordingly.
Deferred tax assets and liabilities are recognized for future tax consequences attributable to temporary differences betweenthe financial statement carrying amounts of existing assets and liabilities and their respective tax bases, unused tax lossesand unused tax credits. Deferred tax assets are recognized only to the extent that it is probable that sufficient taxable profitwill be available against which those unused tax losses, unused tax credits and deductible temporary differences can beutilized.
Deferred tax assets and liabilities are measured based on the tax rates that are expected to apply in the period that the assetis realized or the liability is settled, based on tax rates and tax laws that have been enacted or substantively enacted at thebalance sheet date.
Current tax assets and liabilities are offset when (1) they arise from the same tax reporting entity or tax group of reportingentities, (2) the legally enforceable right to offset exists and (3) they are intended to be settled net or realized simultaneously.
Deferred tax assets and liabilities are offset when the legally enforceable right to offset current tax assets and liabilities existsand the deferred tax assets and liabilities relate to income taxes levied by the same taxing authority on either the same taxreporting entity or tax group of reporting entities.
Deferred tax liabilities are provided on taxable temporary differences arising from investments in subsidiaries, branches andassociates and interests in joint ventures except when the timing of the reversal of the temporary difference is controlled bythe Group and it is probable that the difference will not reverse in the foreseeable future. Deferred income tax assets areprovided on deductible temporary differences arising from such investments only to the extent that it is probable that thedifferences will reverse in the foreseeable future and sufficient taxable income will be available against which those temporarydifferences can be utilized.
Deferred tax related to fair value remeasurement of financial assets classified as AFS under IAS 39 and as FVTOCI underIFRS 9, cash flow hedges and other items, which are charged or credited directly to other comprehensive income, is alsocredited or charged directly to other comprehensive income and subsequently recognized in the Consolidated Statement ofIncome once the underlying transaction or event to which the deferred tax relates is recognized in the Consolidated Statementof Income.
For share-based payment transactions, the Group may receive a tax deduction related to the compensation paid in shares.The amount deductible for tax purposes may differ from the cumulative compensation expense recorded. At any reportingdate, the Group must estimate the expected future tax deduction based on the current share price. The associated currentand deferred tax consequences are recognized as income or expense in the Consolidated Statement of Income for the period.If the amount deductible, or expected to be deductible, for tax purposes exceeds the cumulative compensation expense, theexcess tax benefit is recognized directly in equity.
Critical Accounting Estimates – In determining the amount of deferred tax assets, the Group uses historical tax capacity andprofitability information and, if relevant, forecasted operating results based upon approved business plans, including a reviewof the eligible carry-forward periods, available tax planning opportunities and other relevant considerations. Each quarter, theGroup re-evaluates its estimate related to deferred tax assets, including its assumptions about future profitability.
The Group believes that the accounting estimate related to the deferred tax assets is a critical accounting estimate becausethe underlying assumptions can change from period to period and requires significant management judgment. For example,tax law changes or variances in future projected operating performance could result in a change of the deferred tax asset. Ifthe Group was not able to realize all or part of its net deferred tax assets in the future, an adjustment to its deferred tax assetswould be charged to income tax expense or directly to equity in the period such determination was made. If the Group was torecognize previously unrecognized deferred tax assets in the future, an adjustment to its deferred tax asset would be creditedto income tax expense or directly to equity in the period such determination was made.
For further information on the Group’s deferred taxes (including quantitative disclosures on recognized deferred tax assets)see Note 36 “Income Taxes”.

246
Deutsche Bank 2 – Consolidated Financial StatementsAnnual Report 2018
Business Combinations and Noncontrolling Interests
The Group uses the acquisition method to account for business combinations. At the date the Group obtains control of thesubsidiary, the cost of an acquisition is measured at the fair value of the consideration given, including any cash or non-cashconsideration (equity instruments) transferred, any contingent consideration, any previously held equity interest in the acquireeand liabilities incurred or assumed. The excess of the aggregate of the cost of an acquisition and any noncontrolling interestsin the acquiree over the Group’s share of the fair value of the identifiable net assets acquired is recorded as goodwill. If theaggregate of the acquisition cost and any noncontrolling interests is below the fair value of the identifiable net assets (negativegoodwill), a gain is reported in other income. Acquisition-related costs are recognized as expenses in the period in which theyare incurred.
In business combinations achieved in stages (“step acquisitions”), a previously held equity interest in the acquiree isremeasured to its acquisition-date fair value and the resulting gain or loss, if any, is recognized in profit or loss. Amountsrecognized in prior periods in other comprehensive income associated with the previously held investment would berecognized on the same basis as would be required if the Group had directly disposed of the previously held equity interest.
Noncontrolling interests are shown in the consolidated balance sheet as a separate component of equity, which is distinctfrom the Group’s shareholders’ equity. The net income attributable to noncontrolling interests is separately disclosed on theface of the Consolidated Statement of Income. Changes in the ownership interest in subsidiaries which do not result in achange of control are treated as transactions between equity holders and are reported in additional paid-in capital (“APIC”).
Non-Current Assets Held for Sale
Individual non-current non-financial assets (and disposal groups) are classified as held for sale if they are available forimmediate sale in their present condition subject only to the customary sales terms of such assets (and disposal groups) andtheir sale is considered highly probable. For a sale to be highly probable, management must be committed to a sales plan andactively looking for a buyer. Furthermore, the assets (and disposal groups) must be actively marketed at a reasonable salesprice in relation to their current fair value and the sale should be expected to be completed within one year. Non-current non-financial assets (and disposal groups) which meet the criteria for held for sale classification are measured at the lower of theircarrying amount and fair value less costs to sell and are presented within “Other assets” and “Other liabilities” in the balancesheet. The comparatives are not represented when non-current assets (and disposal groups) are classified as held for sale.If the disposal group contains financial instruments, no adjustment to their carrying amounts is permitted.
Property and Equipment
Property and equipment includes own-use properties, leasehold improvements, furniture and equipment and software(operating systems only). Own-use properties are carried at cost less accumulated depreciation and accumulated impairmentlosses. Depreciation is generally recognized using the straight-line method over the estimated useful lives of the assets. Therange of estimated useful lives is 25 to 50 years for property and 3 to 10 years for furniture and equipment (including initialimprovements to purchased buildings). Leasehold improvements are capitalized and subsequently depreciated on a straight-line basis over the shorter of the term of the lease and the estimated useful life of the improvement, which generally rangesfrom 3 to 18 years. Depreciation of property and equipment is included in general and administrative expenses. Maintenanceand repairs are also charged to general and administrative expenses. Gains and losses on disposals are included in otherincome.
Property and equipment are assessed for any indication of impairment at each quarterly reporting date. If such indicationexists, the recoverable amount, which is the higher of fair value less costs to sell and value in use, must be estimated and animpairment charge is recorded to the extent the recoverable amount is less than its carrying amount. Value in use is thepresent value of the future cash flows expected to be derived from the asset. After the recognition of impairment of an asset,the depreciation charge is adjusted in future periods to reflect the asset’s revised carrying amount. If an impairment is laterreversed, the depreciation charge is adjusted prospectively.
Properties leased under a finance lease are capitalized as assets in property and equipment and depreciated over the termsof the leases.
247
Deutsche Bank Notes to the Consolidated Financial StatementsAnnual Report 2018 Significant Accounting Policies and Critical Accounting Estimates
Financial Guarantees
Financial guarantee contracts are contracts that require the issuer to make specified payments to reimburse the holder for aloss it incurs because a specified debtor fails to make payments when due in accordance with the terms of a debt instrument.
The Group has chosen to apply the fair value option to certain written financial guarantees that are managed on a fair valuebasis. Financial guarantees that the Group has not designated at fair value are recognized initially in the financial statementsat fair value on the date the guarantee is given. Subsequent to initial recognition, the Group’s liabilities under such guaranteesare measured at the higher of the amount initially recognized, less cumulative amortization, and the best estimate of theexpenditure required to settle any financial obligation as of the balance sheet date. These estimates are determined based onexperience with similar transactions and history of past losses, and management’s determination of the best estimate.
Any increase in the liability relating to guarantees is recorded in the Consolidated Statement of Income in provision for creditlosses.
Leasing Transactions
The Group enters into lease contracts, predominantly for premises, as a lessee. The terms and conditions of these contractsare assessed and the leases are classified as operating leases or finance leases according to their economic substance atinception of the lease.
Assets held under finance leases are initially recognized on the consolidated balance sheet at an amount equal to the fairvalue of the leased property or, if lower, the present value of the minimum lease payments. The corresponding liability to thelessor is included in the Consolidated balance sheet as a finance lease obligation. The discount rate used in calculating thepresent value of the minimum lease payments is either the interest rate implicit in the lease, if it is practicable to determine, orthe incremental borrowing rate. Contingent rentals are recognized as an expense in the periods in which they are incurred.
Operating lease rentals payable are recognized as an expense on a straight-line basis over the lease term, which commenceswhen the lessee controls the physical use of the property. Lease incentives are treated as a reduction of rental expense andare also recognized over the lease term on a straight-line basis. Contingent rentals arising under operating leases arerecognized as an expense in the period in which they are incurred.
Employee Benefits
Pension Benefits
The Group provides a number of pension plans. In addition to defined contribution plans, there are retirement benefit plansaccounted for as defined benefit plans. The assets of all the Group’s defined contribution plans are held in independentlyadministered funds. Contributions are generally determined as a percentage of salary and are expensed based on employeeservices rendered, generally in the year of contribution.
All retirement benefit plans accounted for as defined benefit plans are valued using the projected unit-credit method todetermine the present value of the defined benefit obligation and the related service costs. Under this method, thedetermination is based on actuarial calculations which include assumptions about demographics, salary increases and interestand inflation rates. Actuarial gains and losses are recognized in other comprehensive income and presented in equity in theperiod in which they occur. The majority of the Group’s benefit plans is funded.
Other Post-Employment Benefits
In addition, the Group maintains unfunded contributory post-employment medical plans for a number of current and retiredemployees who are mainly located in the United States. These plans pay stated percentages of eligible medical and dentalexpenses of retirees after a stated deductible has been met. The Group funds these plans on a cash basis as benefits aredue. Analogous to retirement benefit plans these plans are valued using the projected unit-credit method. Actuarial gains andlosses are recognized in full in the period in which they occur in other comprehensive income and presented in equity.
Refer to Note 35 “Employee Benefits” for further information on the accounting for pension benefits and other post-employmentbenefits.

248
Deutsche Bank 2 – Consolidated Financial StatementsAnnual Report 2018
Termination benefits
Termination benefits arise when employment is terminated by the Group before the normal retirement date or whenever anemployee accepts voluntary redundancy in exchange for these benefits. The Group recognizes termination benefits as aliability and an expense if the Group is demonstrably committed to a detailed formal plan without realistic possibility ofwithdrawal. In the case of an offer made to encourage voluntary redundancy, termination benefits are measured based on thenumber of employees expected to accept the offer. Benefits falling due more than twelve months after the end of the reportingperiod are discounted to their present value. The discount rate is determined by reference to market yields on high-qualitycorporate bonds.
Share-Based Compensation
Compensation expense for awards classified as equity instruments is measured at the grant date based on the fair value ofthe share-based award. For share awards, the fair value is the quoted market price of the share reduced by the present valueof the expected dividends that will not be received by the employee and adjusted for the effect, if any, of restrictions beyondthe vesting date. In case an award is modified such that its fair value immediately after modification exceeds its fair valueimmediately prior to modification, a remeasurement takes place and the resulting increase in fair value is recognized asadditional compensation expense.
The Group records the offsetting amount to the recognized compensation expense in additional paid-in capital (“APIC”).Compensation expense is recorded on a straight-line basis over the period in which employees perform services to which theawards relate or over the period of the tranches for those awards delivered in tranches. Estimates of expected forfeitures areperiodically adjusted in the event of actual forfeitures or for changes in expectations. The timing of expense recognition relatingto grants which, due to early retirement provisions, include a nominal but non-substantive service period are accelerated byshortening the amortization period of the expense from the grant date to the date when the employee meets the eligibilitycriteria for the award, and not the vesting date. For awards that are delivered in tranches, each tranche is considered aseparate award and amortized separately.
Compensation expense for share-based awards payable in cash is remeasured to fair value at each balance sheet date andrecognized over the vesting period in which the related employee services are rendered. The related obligations are includedin other liabilities until paid.
Obligations to Purchase Common Shares
Forward purchases of Deutsche Bank shares, and written put options where Deutsche Bank shares are the underlying, arereported as obligations to purchase common shares if the number of shares is fixed and physical settlement for a fixed amountof cash is required. At inception, the obligation is recorded at the present value of the settlement amount of the forward oroption. For forward purchases and written put options of Deutsche Bank shares, a corresponding charge is made toshareholders’ equity and reported as equity classified as an obligation to purchase common shares.
The liabilities are accounted for on an accrual basis, and interest costs, which consist of time value of money and dividends,on the liability are reported as interest expense. Upon settlement of such forward purchases and written put options, the liabilityis extinguished and the charge to equity is reclassified to common shares in treasury.
Deutsche Bank common shares subject to such forward contracts are not considered to be outstanding for purposes of basicearnings per share calculations, but are for dilutive earnings per share calculations to the extent that they are, in fact, dilutive.
Option and forward contracts on Deutsche Bank shares are classified as equity if the number of shares is fixed and physicalsettlement is required. All other contracts in which Deutsche Bank shares are the underlying are recorded as financial assetsor liabilities at fair value through profit or loss.

249
Deutsche Bank Notes to the Consolidated Financial StatementsAnnual Report 2018 Recently Adopted and New Accounting Pronouncements
Consolidated Statement of Cash Flows
For purposes of the consolidated statement of cash flows, the Group’s cash and cash equivalents include highly liquidinvestments that are readily convertible into cash and which are subject to an insignificant risk of change in value. Suchinvestments include cash and balances at central banks and demand deposits with banks.
The Group’s assignment of cash flows to the operating, investing or financing category depends on the business model(“management approach”). For the Group the primary operating activity is to manage financial assets and financial liabilities.Therefore, the issuance and management of long-term borrowings is a core operating activity which is different than for a non-financial company, where borrowing is not a principal revenue producing activity and thus is part of the financing category.
The Group views the issuance of senior long-term debt as an operating activity. Senior long-term debt comprises structurednotes and asset-backed securities, which are designed and executed by Corporate & Investment Bank business lines andwhich are revenue generating activities. The other component is debt issued by Treasury, which is considered interchangeablewith other funding sources; all of the funding costs are allocated to business activities to establish their profitability.
Cash flows related to subordinated long-term debt and trust preferred securities are viewed differently than those related tosenior-long term debt because they are managed as an integral part of the Group’s capital, primarily to meet regulatory capitalrequirements. As a result they are not interchangeable with other operating liabilities, but can only be interchanged with equityand thus are considered part of the financing category.
The amounts shown in the consolidated statement of cash flows do not precisely match the movements in the consolidatedbalance sheet from one period to the next as they exclude non-cash items such as movements due to foreign exchangetranslation and movements due to changes in the group of consolidated companies.
Movements in balances carried at fair value through profit or loss represent all changes affecting the carrying value. Thisincludes the effects of market movements and cash inflows and outflows. The movements in balances carried at fair value areusually presented in operating cash flows.
02 – Recently Adopted and New Accounting Pronouncements
Recently Adopted Accounting Pronouncements
The following are those accounting pronouncements which are relevant to the Group and which have been adopted during2018 in the preparation of these consolidated financial statements.
IFRS 2 Share-based Payments
On January 1, 2018, the Group adopted amendments to IFRS 2, “Share-based Payment” which clarify the accounting forcertain types of share-based payment transactions. The amendments which were developed through the IFRS InterpretationsCommittee clarify the accounting for cash-settled share-based payment transactions that include a performance condition, theclassification of share-based payment transactions with net settlement features and the accounting for modifications of share-based payment transactions from cash-settled to equity-settled. The amendments did not have a material impact on theGroup’s consolidated financial statements.
IFRS 9 Financial Instruments
On January 1, 2018, the Group adopted IFRS 9 “Financial Instruments”, which replaces IAS 39, “Financial Instruments:Recognition and Measurement”. IFRS 9 introduces new requirements on how an entity should classify and measure financialassets, requires changes to the reporting of ‘own credit’ with respect to issued debt liabilities that are designated at fair value,replaces the rules for impairment of financial assets and amends the requirements for hedge accounting. The standard alsorequires entities to provide users of financial statements with more informative and relevant disclosures. The standard hasbeen endorsed by the European Union (EU).
As a result of IFRS 9, Deutsche Bank has introduced changes to the financial statements presentation. These changes relateto specific line items in the consolidated income statement and consolidated balance sheet.

250
Deutsche Bank 2 – Consolidated Financial StatementsAnnual Report 2018
IFRS 9 incorporates new hedge accounting rules that intend to better align hedge accounting with risk management practices.Generally, some restrictions under IAS 39 rules have been removed and a greater variety of hedging instruments and hedgeditems become available for hedge accounting. IFRS 9 includes an accounting policy choice to defer the adoption of IFRS 9hedge accounting and to continue with IAS 39 hedge accounting. The Group has decided to exercise this accounting policychoice and did not adopt IFRS 9 hedge accounting as of January 1, 2018. However, the Group implemented the revisedhedge accounting disclosures that are required by the IFRS 9 related amendments to IFRS 7 “Financial Instruments:Disclosures”.
In October 2017, the IASB issued an amendment to IFRS 9 "Prepayment Features with Negative Compensation", which allowsentities to measure particular pre-payable financial assets with so-called negative compensation (also known as two waybreak clauses) at amortized cost or at fair value through other comprehensive income if the prepayment amount substantiallyrepresents unpaid principal and interest and reasonable compensation. Reasonable compensation may be positive ornegative. Prior to this amendment financial assets with this negative compensation feature would have failed the solelypayments of principal and interest test and have been mandatorily measured at fair value through profit or loss. Theamendment has been endorsed by the EU and is effective for annual periods beginning on or after January 1, 2019, with earlyadoption allowed. In the second quarter of 2018, the Group adopted the amendments to IFRS 9 “Prepayment Features withNegative Compensation”. The amendments did not have a material impact on the IFRS 9 Transition Impact Analysis.
IFRS 9 Transition Impact Analysis
The purpose of this section is to describe the key aspects of the changes following the adoption of IFRS 9 with regards toclassification and measurement and impairment as well as to provide an overview of the impact on key ratios, regulatorycapital, Total Shareholders’ Equity and Risk Weighted Assets (RWA) at Deutsche Bank. This section provides a movementanalysis from IAS 39 reported numbers as included in the Deutsche Bank Annual Report 2017 to IFRS 9 numbers as adoptedfrom January 1, 2018.
The transition rules of IFRS 9 do not require a retrospective application to prior periods, accordingly the initial adoption effectis reflected in the opening balance of Shareholders’ equity for the financial year 2018. Comparative periods in this report arepresented in the structure according to IAS 39.
Key metricsIAS 39 IFRS 9
Dec 31, 2017 Jan 1, 2018 ¹ ImpactIFRS Total shareholders’ equity in € m 63,174 62,503 (671)Common Equity Tier 1 capital fully loaded in € m 48,300 47,907 (393)Risk Weighted Assets in € bn 344 345 0.5Tier 1 Capital fully loaded in € m 52,921 52,528 (393)CET 1 Ratio fully loaded in % 14.0 13.9 (13)2
Leverage Exposure in € bn 1,395 1,395 (0.4)Leverage Ratio fully loaded in % 3.8 3.8 (3)2
Leverage Ratio phase-in in % 4.1 4.1 (3)2
1 Pro forma.2 In bps.
The implementation of IFRS 9 as of January 1, 2018 led to a decrease of Deutsche Bank’s Shareholders’ equity of€ 671 million including a tax benefit of € 199 million. Regulatory capital decreased by € 393 million due to a lowerdeduction of expected credit losses exceeding impairments for these exposures under the regulatory internal ratingbased approach (IRBA). Fully loaded CET 1 ratio decreased by 13 basis points, higher than earlier estimates due torefinements to the calculation of the impact of reducing the deduction for expected credit losses, and fully loadedLeverage Ratio is lower by 3 basis points.
Deutsche Bank decided not to apply transitional rules for calculating regulatory ratios pursuant to CRR Art. 473a. Thissection will therefore only refer to the full IFRS 9 impact.

251
Deutsche Bank Notes to the Consolidated Financial StatementsAnnual Report 2018 Recently Adopted and New Accounting Pronouncements
Impact on Regulatory Capital, RWA, and Leverage ExposureFully loaded
in € m.
Totalshareholders’
equity peraccounting
balance sheetCommon Equity
Tier 1 capital Tier 1 CapitalBalance as of Dec 31, 2017 63,174 48,300 52,921IFRS 9 changes from (870) (870) (870)
Classification and Measurement (193) (193) (193)Impairments (677) (677) (677)Tax effects from 199 199 199
Classification and Measurement 65 65 65Impairments 134 134 134
IFRS 9 impact net of tax (671) (671) (671)Changes to regulatory deductionsNegative amounts resulting from the calculation of expected loss amounts 278 278Balance as of Jan 1, 20181 62,503 47,907 52,5281 Pro forma.
in € bnRisk Weighted
AssetsLeverageExposure
Balance as of Dec 31, 2017 344 1,395Changes from 0 (0)
DTA RWA / Change of Total Assets 1 (1)SA RWA/ Lower Deductions (0) 0
Balance as of Jan 1, 20181 345 1,395Ratios as of Dec 31, 2017 14.0 % 3.8 %Ratios as of Jan 1, 20181 13.9 % 3.8 %Change in bps (13) (3)1 Pro forma.
Transitional rules
in € m.
Totalshareholders’
equity peraccounting
balance sheetCommon Equity
Tier 1 capital Tier 1 CapitalBalance as of Dec 31, 2017 63,174 50,808 57,631IFRS 9 changes from (870) (870) (870)
Classification and Measurement (193) (193) (193)Impairments (677) (677) (677)Tax effects from 199 199 199
Classification and Measurement 65 65 65Impairments 134 134 134
IFRS 9 impact net of tax (671) (671) (671)Changes to regulatory deductionsNegative amounts resulting from the calculation of expected loss amounts 223 278Balance as of Jan 1, 20181 62,503 50,3592 57,2381 Pro forma.2 Pro forma view considering 80 % phase-in according to CRR transitional rules.
in € bnRisk Weighted
AssetsLeverageExposure
Balance as of Dec 31, 2017 343 1,396Changes from 0 0
DTA RWA / Change of Total Assets 1 0SA RWA/ Lower Deductions (0) 0
Balance as of Jan 1, 20181 344 1,396Ratios as of Dec 31, 2017 14.8 % 4.1 %Ratios as of Jan 1, 20181 14.6 % 4.1 %Change in bps (15) (3)1 Pro forma.

252
Deutsche Bank 2 – Consolidated Financial StatementsAnnual Report 2018
Main Credit Exposure Categories by Business DivisionsWith the introduction of IFRS 9 Deutsche Bank reviewed the way how credit risk exposure is presented within the Risk Report.The definition of the Main Credit Exposure Categories were expanded and instead of only showing a certain subset ofproducts, it was decided to show all products, regardless of their classification and measurement under IFRS 9. The belowtable presents the 2017 comparative amounts for each Main Credit Exposure Category. A description of the categories isincluded in the “Credit Risk Exposure” section of the Risk Report.
Loans Off-balance sheet OTC derivatives Debt securitiesRepo and repo-
style transactions TotalDec 31, Dec 31, Dec 31, Dec 31, Dec 31, Dec 31, Dec 31, Dec 31, Dec 31, Dec 31, Dec 31, Dec 31,
in € m. 2018 2017 2018 2017 2018 2017 2018 2017 2018 2017 2018 2017Corporate &InvestmentBank 164,163 153,473 217,203 206,021 27,028 30,993 90,062 86,272 76,032 99,335 574,488 576,094Private &CommercialBank 269,384 270,398 45,969 46,082 353 422 12,387 14,421 260 835 328,353 332,158AssetManagement 68 87 131 69 0 0 419 106 0 0 618 262Corporate &Other 216 26 351 159 37 15 39,989 42,187 5,175 4,630 45,768 47,017Total 433,832 423,984 263,654 252,331 27,417 31,430 142,857 142,986 81,467 104,800 949,227 955,531
Classification and MeasurementThe following table provides an overview of the impact of the changes to total assets under classification and measurementfrom IAS 39 as of December 31, 2017 to IFRS 9 as of January 1, 2018, excluding allowances for On- and Off-Balance Sheetpositions, affected by IFRS 9.
in € m.
IAS 39carrying amount
Dec 31, 2017(i)
Reclassi-fications
(ii)
Remeasure-ments
(iii)
IFRS 9carrying amount
Jan 1, 2018(iv=i+ii+iii)
Fair Value through Profit or LossFrom Available for Sale (IAS 39) - 2,535 (3) -From Amortized Cost (IAS 39) - 41,914 (3) -To Amortized Cost (IFRS 9)
- (5,900) - -To Fair Value through Other Comprehensive Income (IFRS 9) - (6,508) - -
Total Fair Value through Profit or Loss 636,970 32,041 (6) 669,004Fair Value through Other Comprehensive Income
From Available for Sale (IAS 39) - 41,219 (104) -From Amortized Cost (IAS 39) - 9,943 64 -From Fair Value through Profit or Loss (IAS 39) - 6,508 - -To Amortized Cost (IFRS 9)
- - - -To Fair Value through Profit or Loss (IFRS 9) - - - -
Total Fair Value through Other Comprehensive Income - 57,671 (40) 57,631Amortized Cost
From Amortized Cost (IAS 39) - - - -From Available for Sale (IAS 39) - 5,642 24 -From Fair Value through Profit or Loss (IAS 39) - 5,900 (184) -To Fair Value through Other Comprehensive Income (IFRS 9) - (6,773) - -To Fair Value through Profit or Loss (IFRS 9) - (41,914) - -
Total Amortized Cost 780,721 (37,145) (159) 743,417Tax Assets 8,396 - 230 8,626Available for Sale (IAS 39) 49,397 (49,397) - -Held to Maturity (IAS 39) 3,170 (3,170) - -Total Financial Asset balances affected by IFRS 9, Reclassifications andRemeasurements 1,478,654 0 24 1,478,678
ImpairmentThe following table provides an overview of IAS 39 allowance for all debt instruments that are measured at amortized costsor fair value through other comprehensive income and off-balance sheet lending commitments, including financial guarantees(referred to as On- and Off-Balance Sheet positions in the table below) as of December 31, 2017 to the IFRS 9 expectedcredit loss allowance as of January 1, 2018.

253
Deutsche Bank Notes to the Consolidated Financial StatementsAnnual Report 2018 Recently Adopted and New Accounting Pronouncements
in € m.
IAS 39Allowance
for On-and Off-Balance Sheetpositions as atDec 31, 2017
(i)
Changes due toreclassifications
(ii)
Changes due tothe introduction
of the IFRS 9ECL model
(iii)
IFRS 9Allowance
for On-and Off-Balance SheetPositions as at
Jan 1, 2018(iv=i+ii+iii)
Fair Value through profit or lossFrom available for sale (IAS 39)
- - - -From amortized cost (IAS 39) - - - -To amortized cost (IFRS 9)
- - - -To fair value through other comprehensive income (IFRS 9) - - - -
Total Fair Value through Profit or Loss - - - -Fair Value through other comprehensive income
From available for sale (IAS 39) - - 12 12From amortized cost (IAS 39) - - 0 0From fair value through profit or loss (IAS 39) - - - -To amortized cost (IFRS 9) - - - -To fair value through profit or loss (IFRS 9) - - - -
Total Fair Value through Other Comprehensive Income - - 12 12Amortized cost
From amortized cost (IAS 39) 3,856 - 737 4,594From available for sale (IAS 39) - - - -From fair value through profit or loss (IAS 39) - - 9 9To fair value through other comprehensive income (IFRS 9) 10 (10) - -To fair value through profit or loss (IFRS 9) 55 (55) - -
Total Amortized Cost 3,921 (65) 746 4,603Total On Balance Sheet Positions affected by IFRS 9 ECL Model 3,921 (65) 758 4,615Off Balance Sheet 285 - (6) 280Total On- and Off Balance Sheet Positions affected by IFRS 9 ECL Model 4,207 (65) 753 4,894
IFRS 15 Revenue from Contracts with Customers
On January 1, 2018, the Group adopted IFRS 15, “Revenue from Contracts with Customers” (including the amendmentsissued subsequently to the original issuance of IFRS 15), which specifies how and when revenue is recognized, but doesnot impact income recognition related to financial instruments in scope of IFRS 9. The new requirements replace severalother IFRS standards and interpretations that governed revenue recognition under IFRS and provides a single,principles-based five-step model to be applied to all contracts with customers. The Standard also requires entities toprovide users of financial statements with more informative and relevant disclosures. The Group has exercised the initialapplication relief and applied the cumulative effect method, which allowed the Group to apply IFRS 15 to reporting periodsbeginning on or after January 1, 2018. IFRS 15 did not have a material impact on the Group’s consolidated financialstatements. The impact has been limited to the presentation of enhanced disclosures, including a disaggregation of theGroup’s revenue types prior to deduction of associated expenses.
New Accounting Pronouncements
The following accounting pronouncements were not effective as of December 31, 2018 and therefore have not beenapplied in preparing these financial statements.
IFRS 3 Business Combinations
In October 2018, the IASB issued amendments to IFRS 3 “Business Combinations”. These amendments clarify thedetermination of whether an acquisition made is of a business or a group of assets. The amended definition of a businessemphasizes that the output of a business is to provide goods and services to customers, whereas the previous definitionfocused on returns in the form of dividends, lower costs or other economic benefits to investors and others. Distinguishingbetween a business and a group of assets is important because an acquirer recognizes goodwill only when acquiring abusiness. The amendments will be effective for annual periods beginning on or after January 1, 2020 with early adoptionpermitted. The amendments will not have a material impact on the Group’s consolidated financial statements. Theseamendments have yet to be endorsed by the EU.

254
Deutsche Bank 2 – Consolidated Financial StatementsAnnual Report 2018
IFRS 16 Leases
In January 2016, the IASB issued IFRS 16, “Leases”, which introduces a single lessee accounting model and requiresa lessee to recognize assets and liabilities for all leases with a term of more than 12 months, unless the underlying assetis of low value. A lessee is required to recognize a right-of-use asset representing its right to use the underlying leasedasset and a lease liability representing its obligation to make lease payments. There will be only minor changes to thecurrent accounting for lessors. The standard also requires entities to provide users of financial statements with moreinformative and relevant disclosures. IFRS 16 is effective for annual periods beginning on or after January 1, 2019. Thestandard has been endorsed by the EU.
The Group has analyzed the impact of the initial application of IFRS 16 in a Group-wide implementation program. Themajority of leases are for land and buildings; other categories are company cars and technical/IT equipment.
The Group will apply the practical expedient in IFRS 16 to contracts that were identified as leases applying IAS 17,“Leases”, and IFRIC 4, “Determining whether an Arrangement contains a Lease”, on transition.
The Group has chosen to apply the modified retrospective transition approach, without restatement of comparativefigures. Under the modified retrospective approach, the Group can choose on a lease by lease basis to either (i) measurethe right-of-use asset at the same amount as the lease liability, or (ii) to measure the right-of-use asset retrospectivelyusing the transition discount rate. For approach (ii), the resulting difference between the right-of-use asset and the leaseliability will be recognized as an adjustment to the opening balance of retained earnings on transition.
On initial application the Group will apply approach (i) to leases classified as operating leases under IAS 17 except forlarger property leases where the Group will elect to apply approach (ii) which is expected to result in an adjustment tothe opening balance of retained earnings on transition of € 150 million, taking deferred taxes into account.
In addition, provisions previously recognized for onerous operating leases as well as accrued operating liabilities will bederecognized upon transition, and the value of the right-of-use assets will be reduced by that same amount.
The expected impact upon adoption will result in an approximately € 3.3 billion and € 3.5 billion increase in the balancesheet related to the recognition of right of use assets and corresponding liabilities, respectively. This will lead to an overallreduction in the Group’s total shareholders’ equity of € 150 million, taking deferred taxes into account. These estimatesmay change as the Group finalizes its implementation project in the first quarter of 2019.
IFRS 17 Insurance Contracts
In May 2017, the IASB issued IFRS 17, “Insurance Contracts”, which establishes the principles for the recognition,measurement, presentation and disclosure of insurance contracts within the scope of the standard. IFRS 17 replacesIFRS 4 which has given companies dispensation to carry on accounting for insurance contracts using national accountingstandards, resulting in a multitude of different approaches. IFRS 17 solves the comparison problems created by IFRS 4by requiring all insurance contracts to be accounted for in a consistent manner, benefiting both investors and insurancecompanies. Insurance obligations will be accounted for using current values – instead of historical cost. The informationwill be updated regularly, providing more useful information to users of financial statements. IFRS 17 is effective forannual periods beginning on or after January 1, 2021. Based on the Group’s current business activities it is expectedthat IFRS 17 will not have a material impact on the Group’s consolidated financial statements. The standard has yet tobe endorsed by the EU.
Improvements to IFRS 2015-2017 Cycles
In December 2017, the IASB issued amendments to multiple IFRS standards, which resulted from the IASB’s annualimprovement project for the 2015-2017 cycles. This comprises amendments that result in accounting changes forpresentation, recognition or measurement purposes as well as terminology or editorial amendments related to IFRS 3“Business combinations”, IAS 12 “Income taxes” and IAS 23 “Borrowing costs”. The amendments will be effective forannual periods beginning on or after January 1, 2019, with early adoption permitted. The Group expects that theamendments will not have a material impact on the Group’s consolidated financial statements. The amendments havebeen endorsed by the EU.

255
Deutsche Bank Notes to the Consolidated Financial StatementsAnnual Report 2018 Acquisitions and Dispositions
03 – Acquisitions and Dispositions
Business Combinations
During the years 2018, 2017 and 2016, the Group did not undertake any acquisitions accounted for as business combinations.
Acquisitions and Dispositions of Noncontrolling Interests while Retaining Control
Deutsche Bank’s Ownership Interest following Initial Public Offering of DWS shares
Deutsche Bank announced on February 26, 2018 its intention to proceed with the planned Initial Public Offering (“IPO”) of itssubsidiary DWS Group GmbH & Co. KGaA (“DWS”) on the regulated market of the Frankfurt Stock Exchange. The IPOconsisted purely of the sale of existing shares directly held by DWS’s sole shareholder, DB Beteiligungs Holding GmbH, a100 % subsidiary of Deutsche Bank AG. The total placement volume is comprised of 44.5 million DWS shares including over-allotments (greenshoe) of 4.5 million shares.
As announced on March 22, 2018, the placement price for shares offered in the IPO had been set at € 32.50 per share. As ofMarch 31, 2018, 40.0 million DWS shares were sold to new investors. Based on the placement price, the market capitalizationof DWS amounted to € 6.5 billion. Deutsche Bank received gross proceeds of € 1.3 billion from the placement of DWS shares,resulting in investors other than Deutsche Bank holding 20.0 % of DWS. Subsequently, Deutsche Bank remains DWS’smajority shareholder post IPO.
The final carrying amount of DWS’s net assets in the Group’s consolidated financial statements on the date of the IPO was€ 6.0 billion. This includes the net assets from the U.S. Asset Management business transferred to DWS on April 2, 2018which was subject to contractually binding agreements between the Group entities involved and constituted an element of theoffering.
The following table summarizes the effect of changes in Deutsche Bank’s ownership interest in DWS and their impact onshareholders’ equity at the end of the reporting period:
Deutsche Bank’s Ownership Interest in DWS and Impact on Shareholders’ Equityin € 2018Deutsche Bank’s ownership interest at the time of the IPO 5,991Net decrease in Deutsche Bank’s ownership interest (1,229)Deutsche Bank’s share of net income or loss 239Deutsche Bank’s share of other comprehensive income 149Deutsche Bank’s share of other equity changes 37Deutsche Bank’s ownership interest in DWS at the end of the reporting period 5,187Excess amount from the IPO 73Total effect on shareholders' equity from a change in Deutsche Bank's ownership interest in DWS, at the end of the reporting period 5,260
By the end of the stabilization period (April 20, 2018), out of the total greenshoe volume of 4.5 million shares, 1,018,128 shareswere allocated to new shareholders, which increased the proportion of outside shareholders in DWS to 20.51 %.
Dispositions
During 2018, 2017 and 2016, the Group finalized several dispositions of subsidiaries/businesses. These disposals are mainlyof businesses the Group had previously classified as held for sale. Accordingly, dispositions in 2018 included the partial saleof the Polish PCB business, while disposals in 2017 contained the Group’s Argentine subsidiary Deutsche Bank S.A. and Sal.Oppenheim’s Luxembourg-based fund administration and custody business. Divestitures in 2016 comprised the sale of AbbeyLife and Maher Terminals Port Elizabeth. For more detail on these transactions, please refer to Note 26 “Non-Current Assetsand Disposal Groups Held for Sale”. The total consideration received for these dispositions (thereof in cash) in 2018, 2017and 2016 was € 398 million (cash € 164 million), € 129 million (cash) and € 2.0 billion (cash), respectively. The table belowshows the assets and liabilities that were included in these disposals.
in € m. 2018 2017 2016Cash and cash equivalents 50 47 0All remaining assets 4,619 848 14,858Total assets disposed 4,669 895 14,858Total liabilities disposed 6,035 814 12,250

256
Deutsche Bank 2 – Consolidated Financial StatementsAnnual Report 2018
04 – Business Segments and Related InformationThe Group’s segmental information has been prepared in accordance with the “management approach”, which requirespresentation of the segments on the basis of the internal management reports of the entity which are regularly reviewed bythe chief operating decision maker, which is the Deutsche Bank Management Board, in order to allocate resources to asegment and to assess its financial performance.
Business Segments
The Group’s segment reporting follows the organizational structure as reflected in its internal management reporting systems,which are the basis for assessing the financial performance of the business segments and for allocating resources to thebusiness segments. Generally, restatements due to changes in the organizational structure were implemented in thepresentation of prior period comparables if they were considered in the Group’s management reporting systems.
Our business operations are organized under the divisional structure comprising the following corporate divisions:
– Corporate & Investment Bank (“CIB”),– Private & Commercial Bank (“PCB”),– Asset Management (“AM”).
The key changes compared to Deutsche Bank’s previously reported segmental information are outlined below.
In the first quarter of 2018, the definition of CIB’s “Sales & Trading (FIC)” revenue category has been updated to improvealignment with peer reporting and enable more relevant comparisons. As a result, the category “Financing” ceased to existand the majority of revenues previously reported under that category, for the year 2017 more than 95 %, has been moved intothe “Sales & Trading (FIC)” category and the remainder into “Other”. In the current quarter revenues related to ListedDerivatives & Clearing have been transferred from Sales & Trading (FIC) to Sales & Trading (Equities) to better align to thepriorities of the business. The presentation of comparison periods has been adjusted accordingly.
In May 2018, Deutsche Bank successfully merged Deutsche Bank Privat- und Geschäftskunden AG and Postbank into DBPrivat- und Firmenkundenbank AG. After the agreement to sell our retail business in Portugal and agreement for the partialsale of the Polish retail business in the first quarter of 2018, revenues from these Private and Commercial Clients International(PCCI) businesses, as well as Hua Xia Bank and the PCS disposed business are reported in a separate category to betterreflect our exited businesses. As a result, since the second quarter of 2018, PCB’s revenues are now reported as follows:
– Private and Commercial Business (Germany),– Private and Commercial Business (International), which covers operations in Belgium, India, Italy and Spain,– Wealth Management (Global), and– Exited businesses, which covers operations in Poland and Portugal as well as Private Client Services (PCS) and Hua Xia
Bank in historical periods.
The presentation of comparison periods has been adjusted accordingly.
In March 2017, Deutsche Bank announced its intention to pursue an initial public offering (IPO) of Deutsche AssetManagement, which was completed in March 2018. Since March 23, 2018, shares of the holding company DWS Group GmbH& Co. KGaA are listed on the Frankfurt stock exchange. The corporate division “Deutsche Asset Management” was renamed“Asset Management” during the first quarter 2018. Deutsche Bank remains DWS’s majority shareholder post IPO.
From 2018 onwards Group Infrastructure expenses are allocated to the corporate divisions based on Plan. Any delta betweenPlan and Actual allocations is captured centrally within “Corporate & Other”. Infrastructure expenses relating to shareholderactivities as defined in the OECD Transfer Pricing Guidelines, i.e. costs for specific group functions, are no longer allocatedto segments, but instead held centrally and reported under “Corporate & Other (C&O)”, formerly “Consolidation & Adjustments(C&A)”. These infrastructure expenses amounted to € 422 million in 2018 and € 371 million in 2017. All categories previouslyreported under C&A, including valuation and timing differences as well as treasury-related and corporate items not allocatedto the divisions, remain in C&O. The presentation of comparison periods has been adjusted accordingly.
From 2017 onwards, Non-Core Operations Unit (NCOU) ceased to exist as a standalone division. The remaining legacy assetsas of December 31, 2016 are now managed by the corresponding operating segments, predominately in Corporate &Investment Bank and Private & Commercial Bank.
257
Deutsche Bank Notes to the Consolidated Financial StatementsAnnual Report 2018 Business Segments and Related Information
Measurement of Segment Profit or Loss
Segment reporting requires a presentation of the segment results based on management reporting methods, including areconciliation between the results of the business segments and the consolidated financial statements, which is presented inthe “Management Report: Operating and Financial Review: Deutsche Bank Group: Corporate Divisions: Corporate and Other”.The information provided about each segment is based on internal management reporting about segment profit or loss, assetsand other information which is regularly reviewed by the chief operating decision maker. Segment assets are presented in theGroup’s internal management reporting based on a consolidated view, i.e., the amounts do not include intersegment balances.
Non-IFRS compliant accounting methods are rarely used in the Group’s management reporting and represent either valuationor classification differences. The largest valuation differences relate to measurement at fair value in management reportingversus measurement at amortized cost under IFRS and to the recognition of trading results from own shares in revenues inmanagement reporting (mainly in CIB) and in equity under IFRS. The major classification difference relates to noncontrollinginterest, which represents the net share of minority shareholders in revenues, provision for credit losses, noninterest expensesand income tax expenses. Noncontrolling interest is reported as a component of pre-tax income for the businesses inmanagement reporting (with a reversal in C&O) and a component of net income appropriation under IFRS.
Since the Group’s business activities are diverse in nature and its operations are integrated, certain estimates and judgmentshave been made to apportion revenue and expense items among the business segments.
The management reporting systems allocate the Group’s external net interest income according to the value of fundingconsumed or provided by each business segment’s activities, with transfer pricing referencing the Group’s access to financingin the wholesale markets. Furthermore, to retain comparability with those competitors that have legally independent units withtheir own equity funding, the Group allocates a net notional interest benefit on its consolidated capital, in line with eachsegment’s proportion of average shareholders’ equity.
Management uses certain measures for equity and related ratios as part of its internal reporting system because it believesthat these measures provide it with a useful indication of the financial performance of the business segments. The Groupdiscloses such measures to provide investors and analysts with further insight into how management operates the Group’sbusinesses and to enable them to better understand the Group’s results. These measures include:
Allocation of Average Shareholders’ Equity - Since 2017, Shareholders’ equity is fully allocated to the Group’s segments basedon the regulatory capital demand of each segment and is no longer capped at the amount of shareholders’ equity required tomeet the externally communicated targets for the Group’s Common Equity Tier 1 ratio and the Group’s Leverage ratio.Regulatory capital demand reflects the combined contribution of each segment to the Groups’ Common Equity Tier 1 ratio,the Groups’ Leverage ratio and the Group’s Capital Loss under Stress. Contributions in each of the three dimensions areweighted to reflect their relative importance and level of constraint for the Group. Contributions to the Common Equity Tier 1ratio and the Leverage ratio are measured though Risk-Weighted Assets (RWA) and Leverage Ratio Exposure (LRE)assuming full implementation of CRR/CRD 4 rules. The Group’s Capital Loss under Stress is a measure of the Group’s overalleconomic risk exposure under a defined stress scenario. Goodwill and other intangibles continue to be directly attributed tothe Group’s segments in order to allow the determination of allocated tangible shareholders’ equity and the respective returns.Shareholders’ equity and tangible shareholders’ equity is allocated on a monthly basis and averaged across quarters and forthe full year. All reported periods in 2016 and 2017 have been restated.
Segment average shareholders' equity in December 2016 represents the spot values for the period end. The differencebetween the spot values of the segments and the average Group amount is captured in C&O.
For purposes of the 2017 average shareholders’ equity allocation the Non-Core Operations Unit (NCOU) balances from year-end 2016 have been allocated to Corporate & Other (C&O) as Non-Core Operations Unit (NCOU) has ceased to exist as aseparate corporate division from 2017 onwards.
Net interest income as a component of net revenue, income (loss) before income taxes and related ratios is presented on afully taxable-equivalent basis for U.S. tax-exempt securities for the Corporate & Investment Bank. This enables managementto measure performance of taxable and tax-exempt securities on a comparable basis. This presentation resulted in an increasein Corporate & Investment Bank net interest income of € 42.4 million for full year 2018 (€ 113.6 million for full year 2017,€ 126.4 million for full year 2016). This increase is offset in Group consolidated figures through a reversal in C&O. The taxrate used in determining the fully taxable-equivalent net interest income in respect of the majority of the US tax-exemptsecurities is 21 % for 2018 and 35 % for 2017 and 2016.
258
Deutsche Bank 2 – Consolidated Financial StatementsAnnual Report 2018
Segmental Results of Operations
The following tables present the results of the Group’s business segments, including the reconciliation to the consolidatedresults of operations under IFRS.
2018
in € m.(unless stated otherwise)
Corporate &Investment
Bank
Private &Commercial
BankAsset
Management
Non-CoreOperations
UnitCorporate &
OtherTotal
ConsolidatedNet revenues1 13,046 10,158 2,186 – (73) 25,316Provision for credit losses 120 406 (1) – 0 525Noninterest expensesCompensation and benefits 3,970 4,001 787 – 3,055 11,814General and administrative expenses 8,115 4,867 929 – (2,624) 11,286Policyholder benefits and claims 0 0 0 – 0 0Impairment of goodwill and other intangible assets 0 0 0 – 0 0Restructuring activities 287 55 19 – 0 360Total noninterest expenses 12,372 8,923 1,735 – 431 23,461Noncontrolling interests 24 (0) 85 – (109) 0Income (loss) before income taxes 530 829 367 – (396) 1,330Cost/income ratio 95 % 88 % 79 % – N/M 93 %Assets2 988,531 343,704 10,030 – 5,872 1,348,137Additions to non-current assets 514 516 43 – 575 1,647Risk-weighted assets3 236,306 87,709 10,365 – 16,053 350,432CRD 4 leverage exposure measure (spot value atreporting date) 892,653 354,584 5,044 – 20,644 1,272,926Average shareholders' equity 43,427 14,514 4,669 – 0 62,610Post-tax return on average tangible shareholders’ equity4 1 %` 5 % 18 % – N/M 1 %Post-tax return on average shareholders’ equity4 1 % 4 % 6 % – N/M 0 %
1 includes:Net interest income 3,574 6,077 (52) – 3,592 13,192
Net income (loss) from equity method investments 170 2 41 – 6 2192 includes:
Equity method investments 556 78 240 – 5 879N/M – Not meaningful3 Risk-weighted assets and capital ratios are based upon CRR/CRD 4 fully loaded.4 The post-tax return on average tangible shareholders’ equity and average shareholders’ equity at the Group level reflects the reported effective tax rate for the Group, which
was 74 % for the year ended December 31, 2018. For the post-tax return on average tangible shareholders’ equity and average shareholders’ equity of the segments, theGroup effective tax rate was adjusted to exclude the impact of permanent differences not attributed to the segments, so that the segment tax rates were 28 % for the yearended December 31, 2018.
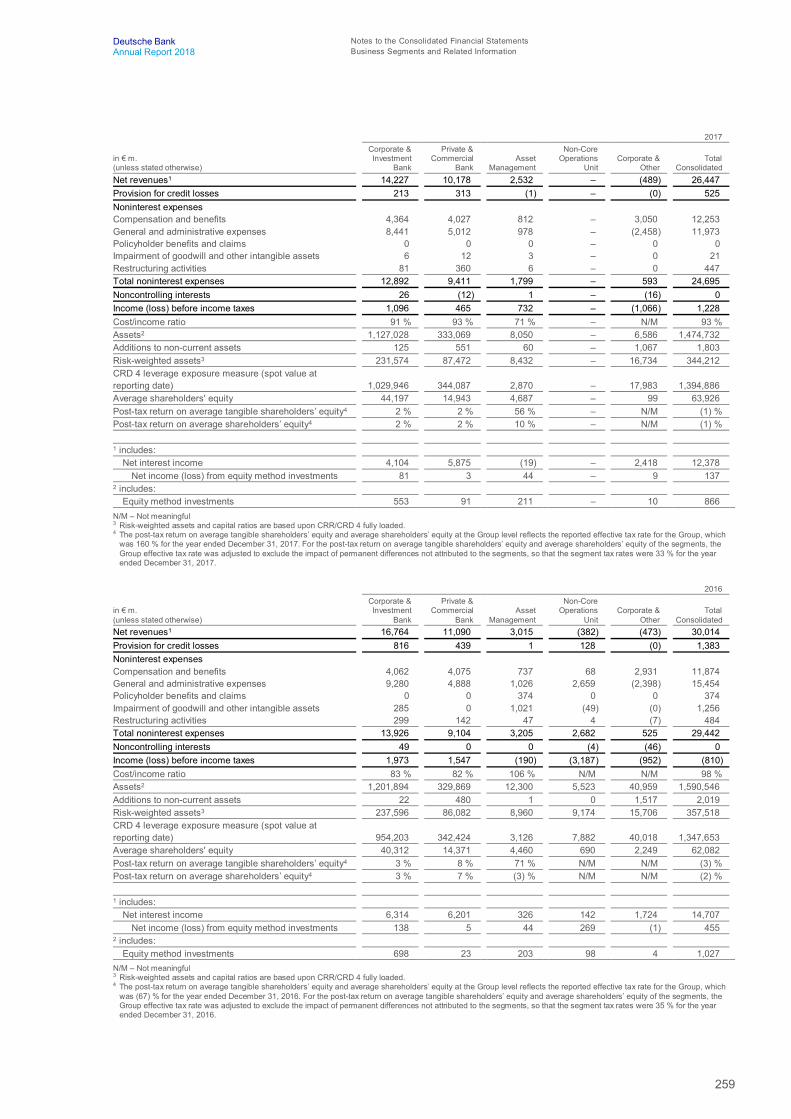
259
Deutsche Bank Notes to the Consolidated Financial StatementsAnnual Report 2018 Business Segments and Related Information
2017
in € m.(unless stated otherwise)
Corporate &Investment
Bank
Private &Commercial
BankAsset
Management
Non-CoreOperations
UnitCorporate &
OtherTotal
ConsolidatedNet revenues1 14,227 10,178 2,532 – (489) 26,447Provision for credit losses 213 313 (1) – (0) 525Noninterest expensesCompensation and benefits 4,364 4,027 812 – 3,050 12,253General and administrative expenses 8,441 5,012 978 – (2,458) 11,973Policyholder benefits and claims 0 0 0 – 0 0Impairment of goodwill and other intangible assets 6 12 3 – 0 21Restructuring activities 81 360 6 – 0 447Total noninterest expenses 12,892 9,411 1,799 – 593 24,695Noncontrolling interests 26 (12) 1 – (16) 0Income (loss) before income taxes 1,096 465 732 – (1,066) 1,228Cost/income ratio 91 % 93 % 71 % – N/M 93 %Assets2 1,127,028 333,069 8,050 – 6,586 1,474,732Additions to non-current assets 125 551 60 – 1,067 1,803Risk-weighted assets3 231,574 87,472 8,432 – 16,734 344,212CRD 4 leverage exposure measure (spot value atreporting date) 1,029,946 344,087 2,870 – 17,983 1,394,886Average shareholders' equity 44,197 14,943 4,687 – 99 63,926Post-tax return on average tangible shareholders’ equity4 2 % 2 % 56 % – N/M (1) %Post-tax return on average shareholders’ equity4 2 % 2 % 10 % – N/M (1) %
1 includes:Net interest income 4,104 5,875 (19) – 2,418 12,378
Net income (loss) from equity method investments 81 3 44 – 9 1372 includes:
Equity method investments 553 91 211 – 10 866N/M – Not meaningful3 Risk-weighted assets and capital ratios are based upon CRR/CRD 4 fully loaded.4 The post-tax return on average tangible shareholders’ equity and average shareholders’ equity at the Group level reflects the reported effective tax rate for the Group, which
was 160 % for the year ended December 31, 2017. For the post-tax return on average tangible shareholders’ equity and average shareholders’ equity of the segments, theGroup effective tax rate was adjusted to exclude the impact of permanent differences not attributed to the segments, so that the segment tax rates were 33 % for the yearended December 31, 2017.
2016
in € m.(unless stated otherwise)
Corporate &Investment
Bank
Private &Commercial
BankAsset
Management
Non-CoreOperations
UnitCorporate &
OtherTotal
ConsolidatedNet revenues1 16,764 11,090 3,015 (382) (473) 30,014Provision for credit losses 816 439 1 128 (0) 1,383Noninterest expensesCompensation and benefits 4,062 4,075 737 68 2,931 11,874General and administrative expenses 9,280 4,888 1,026 2,659 (2,398) 15,454Policyholder benefits and claims 0 0 374 0 0 374Impairment of goodwill and other intangible assets 285 0 1,021 (49) (0) 1,256Restructuring activities 299 142 47 4 (7) 484Total noninterest expenses 13,926 9,104 3,205 2,682 525 29,442Noncontrolling interests 49 0 0 (4) (46) 0Income (loss) before income taxes 1,973 1,547 (190) (3,187) (952) (810)Cost/income ratio 83 % 82 % 106 % N/M N/M 98 %Assets2 1,201,894 329,869 12,300 5,523 40,959 1,590,546Additions to non-current assets 22 480 1 0 1,517 2,019Risk-weighted assets3 237,596 86,082 8,960 9,174 15,706 357,518CRD 4 leverage exposure measure (spot value atreporting date) 954,203 342,424 3,126 7,882 40,018 1,347,653Average shareholders' equity 40,312 14,371 4,460 690 2,249 62,082Post-tax return on average tangible shareholders’ equity4 3 % 8 % 71 % N/M N/M (3) %Post-tax return on average shareholders’ equity4 3 % 7 % (3) % N/M N/M (2) %
1 includes:Net interest income 6,314 6,201 326 142 1,724 14,707
Net income (loss) from equity method investments 138 5 44 269 (1) 4552 includes:
Equity method investments 698 23 203 98 4 1,027N/M – Not meaningful3 Risk-weighted assets and capital ratios are based upon CRR/CRD 4 fully loaded.4 The post-tax return on average tangible shareholders’ equity and average shareholders’ equity at the Group level reflects the reported effective tax rate for the Group, which
was (67) % for the year ended December 31, 2016. For the post-tax return on average tangible shareholders’ equity and average shareholders’ equity of the segments, theGroup effective tax rate was adjusted to exclude the impact of permanent differences not attributed to the segments, so that the segment tax rates were 35 % for the yearended December 31, 2016.

260
Deutsche Bank 2 – Consolidated Financial StatementsAnnual Report 2018
Corporate & Investment Bank
2018 increase (decrease)from 2017
2017 increase (decrease)from 2016
in € m.(unless stated otherwise) 2018 2017 2016 in € m. in % in € m. in %Net revenuesGlobal Transaction Banking 3,834 3,917 4,419 (83) (2) (502) (11)
Equity Origination 362 396 405 (34) (9) (9) (2)Debt Origination 1,081 1,327 1,393 (247) (19) (66) (5)Advisory 493 508 495 (16) (3) 13 3
Origination and Advisory 1,935 2,232 2,292 (296) (13) (60) (3)Sales & Trading (Equity) 1,957 2,233 2,751 (276) (12) (518) (19)Sales & Trading (FIC) 5,361 6,447 7,066 (1,087) (17) (619) (9)
Sales & Trading 7,317 8,680 9,817 (1,363) (16) (1,137) (12)Other (40) (601) 235 561 (93) (836) N/MTotal net revenues 13,046 14,227 16,764 (1,181) (8) (2,537) (15)Provision for credit losses 120 213 816 (94) (44) (603) (74)Noninterest expensesCompensation and benefits 3,970 4,364 4,062 (393) (9) 302 7General and administrative expenses 8,115 8,441 9,280 (326) (4) (839) (9)Impairment of goodwill and other intangible assets 0 6 285 (6) N/M (279) (98)Restructuring activities 287 81 299 205 N/M (218) (73)Total noninterest expenses 12,372 12,892 13,926 (520) (4) (1,034) (7)Noncontrolling interests 24 26 49 (2) (7) (23) (46)Income (loss) before income taxes 530 1,096 1,973 (566) (52) (877) (44)Cost/income ratio 95 % 91 % 83 % N/M 4 ppt N/M 8 pptAssets¹ 988,531 1,127,028 1,201,894 (138,497) (12) (74,866) (6)Risk-weighted assets² 236,306 231,574 237,596 4,733 2 (6,022) (3)Average shareholders' equity³ 43,427 44,197 40,312 (770) (2) 3,885 10Post-tax return on average tangible shareholders’ equity 1 % 2 % 3 % N/M (1) ppt N/M (2) pptPost-tax return on average shareholders' equity 1 % 2 % 3 % N/M (1) ppt N/M (2) pptN/M – Not meaningful1 Segment assets represent consolidated view, i.e., the amounts do not include intersegment balances.2 Risk-weighted assets and capital ratios are based upon CRR/CRD 4 fully loaded.3 See “Measurement of Segment Profit or Loss” above for a description of how average shareholders' equity is allocated to the divisions.

261
Deutsche Bank Notes to the Consolidated Financial StatementsAnnual Report 2018 Business Segments and Related Information
Private & Commercial Bank
2018 increase (decrease)from 2017
2017 increase (decrease)from 2016
in € m.(unless stated otherwise) 2018 2017 2016 in € m. in % in € m. in %Net revenues:Private and Commercial Business (Germany) 6,802 6,583 6,873 220 3 (290) (4)Private and Commercial Business (International)1 1,439 1,455 1,466 (16) (1) (11) (1)Wealth Management (Global) 1,746 2,021 1,720 (274) (14) 301 18Exited businesses2 170 119 1,031 51 42 (912) (88)Total net revenues 10,158 10,178 11,090 (20) (0) (912) (8)
Of which:Net interest income 6,077 5,875 6,201 202 3 (326) (5)Commissions and fee income 3,143 3,367 3,395 (224) (7) (28) (1)Remaining income 937 935 1,494 2 0 (558) (37)
Provision for credit losses 406 313 439 93 30 (126) (29)Noninterest expenses:Compensation and benefits 4,001 4,027 4,075 (26) (1) (47) (1)General and administrative expenses 4,867 5,012 4,888 (145) (3) 124 3Impairment of goodwill and other intangible assets 0 12 0 (12) N/M 12 N/MRestructuring activities 55 360 142 (305) (85) 218 154Total noninterest expenses 8,923 9,411 9,104 (488) (5) 307 3Noncontrolling interests (0) (12) 0 12 (100) (12) N/MIncome (loss) before income taxes 829 465 1,547 363 78 (1,081) (70)Cost/income ratio 88 % 92 % 82 % N/M (5) ppt N/M 10 pptAssets3 343,704 333,069 329,869 10,635 3 3,200 1Risk-weighted assets4 87,709 87,472 86,082 237 0 1,390 2Average shareholders' equity5 14,514 14,943 14,371 (429) (3) 572 4Post-tax return on average tangible shareholders’ equity 5 % 2 % 8 % N/M 2 ppt N/M (6) pptPost-tax return on average shareholders' equity 4 % 2 % 7 % N/M 2 ppt N/M (5) pptN/M – Not meaningful1 Covers operations in Belgium, India, Italy and Spain.2 Covers operations in Poland and Portugal as well as Private Client Services (PCS) and Hua Xia in historical periods.3 Segment assets represent consolidated view, i.e., the amounts do not include intersegment balances.4 Risk-weighted assets and capital ratios are based upon CRR/CRD 4 fully loaded.5 See “Measurement of Segment Profit or Loss” above for a description of how average shareholders' equity is allocated to the divisions.

262
Deutsche Bank 2 – Consolidated Financial StatementsAnnual Report 2018
Asset Management
2018 increase (decrease)from 2017
2017 increase (decrease)from 2016
in € m.(unless stated otherwise) 2018 2017 2016 in € m. in % in € m. in %Net revenuesManagement Fees 2,115 2,247 2,190 (132) (6) 57 3Performance and transaction fees 91 199 220 (109) (55) (21) (9)Other revenues (20) 86 209 (106) N/M (123) (59)Mark-to-market movements on policyholder positionsin Abbey Life 0 0 396 0 N/M (396) N/MTotal net revenues 2,186 2,532 3,015 (346) (14) (483) (16)Provision for credit losses (1) (1) 1 (0) 67 (1) N/MNoninterest expensesCompensation and benefits 787 812 737 (25) (3) 75 10General and administrative expenses 929 978 1,026 (49) (5) (48) (5)Policyholder benefits and claims 0 0 374 (0) N/M (374) (100)Impairment of goodwill and other intangible assets 0 3 1,021 (3) N/M (1,018) (100)Restructuring activities 19 6 47 13 N/M (41) (88)Total noninterest expenses 1,735 1,799 3,205 (64) (4) (1,405) (44)Noncontrolling interests 85 1 0 83 N/M 1 N/MIncome (loss) before income taxes 367 732 (190) (364) (50) 922 N/MCost/income ratio 79 % 71 % 106 % N/M 8 ppt N/M (35) pptAssets¹ 10,030 8,050 12,300 1,980 25 (4,250) (35)Risk-weighted assets² 10,365 8,432 8,960 1,932 23 (528) (6)Average shareholders' equity³ 4,669 4,687 4,460 (19) (0) 227 5Post-tax return on average tangible shareholders’ equity 18 % 56 % 71 % N/M (38) ppt N/M (15) pptPost-tax return on average shareholders' equity 6 % 10 % (3) % N/M (5) ppt N/M 13 pptN/M – Not meaningful1 Segment assets represent consolidated view, i.e., the amounts do not include intersegment balances.2 Risk-weighted assets and capital ratios are based upon CRR/CRD 4 fully loaded.3 See “Measurement of Segment Profit or Loss” above for a description of how average shareholders' equity is allocated to the divisions.

263
Deutsche Bank Notes to the Consolidated Financial StatementsAnnual Report 2018 Business Segments and Related Information
Non-Core Operations Unit
2018 increase (decrease)from 2017
2017 increase (decrease)from 2016
in € m.(unless stated otherwise) 2018 2017 2016 in € m. in % in € m. in %Net revenues – – (382) 0 N/M 382 N/Mthereof:Net interest income and net gains (losses) on financialassets/liabilities at fair value through profit or loss – – (1,307) 0 N/M 1,307 N/MProvision for credit losses – – 128 0 N/M (128) N/MNoninterest expensesCompensation and benefits – – 68 0 N/M (68) N/MGeneral and administrative expenses – – 2,659 0 N/M (2,659) N/MPolicyholder benefits and claims – – 0 0 N/M 0 N/MImpairment of goodwill and other intangible assets – – (49) 0 N/M 49 N/MRestructuring activities – – 4 0 N/M (4) N/MTotal noninterest expenses – – 2,682 0 N/M (2,682) N/MNoncontrolling interests – – (4) 0 N/M 4 N/MIncome (loss) before income taxes – – (3,187) 0 N/M 3,187 N/MAssets¹ – – 5,523 0 N/M (5,523) N/MRisk-weighted assets² – – 9,174 0 N/M (9,174) N/MAverage shareholders' equity³ – – 690 0 N/M (690) N/MN/M – Not meaningful1 Segment assets represent consolidated view, i.e., the amounts do not include intersegment balances.2 Risk-weighted assets and capital ratios are based upon CRR/CRD 4 fully loaded.3 See “Measurement of Segment Profit or Loss” above for a description of how average shareholders' equity is allocated to the divisions.
Corporate & Other (C&O)
2018 increase (decrease)from 2017
2017 increase (decrease)from 2016
in € m.(unless stated otherwise) 2018 2017 2016 in € m. in % in € m. in %Net revenues (73) (489) (473) 416 (85) (17) 4Provision for credit losses 0 (0) (0) 1 N/M 0 (19)Noninterest expensesCompensation and benefits 3,055 3,050 2,931 5 0 119 4General and administrative expenses (2,624) (2,458) (2,398) (166) 7 (59) 2Policyholder benefits and claims 0 0 0 0 N/M 0 N/MImpairment of goodwill and other intangible assets 0 0 (0) 0 N/M 0 N/MRestructuring activities 0 0 (7) (0) (85) 7 N/MTotal noninterest expenses 431 593 525 (161) (27) 67 13Noncontrolling interests (109) (16) (46) (93) N/M 30 (65)Income (loss) before income taxes (396) (1,066) (952) 670 (63) (114) 12Assets1 5,872 6,586 40,959 (714) (11) (34,373) (84)Risk-weighted assets2 16,053 16,734 15,706 (681) (4) 1,028 7Average shareholders' equity 0 99 2,249 (99) N/M (2,150) (96)N/M – Not meaningful1 Assets in C&O reflect residual Treasury assets not allocated to the business segments as well as Corporate assets, such as deferred tax assets and central clearing accounts,
outside the management responsibility of the business segments.2 Risk weighted assets are based upon CRR/CRD 4 fully loaded. Risk-weighted assets in C&O reflect Treasury and Corporate assets outside the management responsibility of
the business segments, primarily the Group’s deferred tax assets.

264
Deutsche Bank 2 – Consolidated Financial StatementsAnnual Report 2018
Entity-Wide Disclosures
The Group’s Entity-Wide Disclosures include net revenues from internal and external counterparties. Excluding revenues frominternal counterparties would require disproportionate IT investment and is not in line with the Bank's management approach.For detail on our Net Revenue Components please see “Management Report: Operating and Financial Review: Results ofOperations: Corporate Divisions”.
The following table presents total net revenues (before provisions for credit losses) by geographic area for the years endedDecember 31, 2018, 2017 and 2016, respectively. The information presented for CIB, PCB, AM and NCOU has been classifiedbased primarily on the location of the Group’s office in which the revenues are recorded. The information for C&O is presentedon a global level only, as management responsibility for C&O is held centrally.
in € m. 2018 2017 2016Germany:
Corporate & Investment Bank 1,400 1,503 1,924Private & Commercial Bank 7,342 7,225 7,571Asset Management 985 1,009 888Non-Core Operations Unit 0 0 221
Total Germany¹ 9,727 9,737 10,604UK:
Corporate & Investment Bank 3,338 3,818 4,298Private & Commercial Bank 26 34 83Asset Management 294 434 836Non-Core Operations Unit 0 0 (322)
Total UK 3,659 4,286 4,895Rest of Europe, Middle East and Africa:
Corporate & Investment Bank 1,124 1,268 1,545Private & Commercial Bank 1,901 2,037 2,360Asset Management 379 465 497Non-Core Operations Unit 0 0 23
Total Rest of Europe, Middle East and Africa 3,404 3,770 4,425Americas (primarily United States):
Corporate & Investment Bank 4,671 4,999 5,929Private & Commercial Bank 362 390 625Asset Management 413 491 578Non-Core Operations Unit 0 0 (305)
Total Americas 5,445 5,881 6,827Asia/Pacific:
Corporate & Investment Bank 2,513 2,639 3,069Private & Commercial Bank 526 491 451Asset Management 114 133 216Non-Core Operations Unit 0 0 1
Total Asia/Pacific 3,154 3,263 3,736Corporate and Other (73) (489) (473)Consolidated net revenues² 25,316 26,447 30,0141 All Postbank operations are disclosed as German operations subject to further systems integration2 Consolidated net revenues comprise interest and similar income, interest expenses and total noninterest income (including net commission and fee income). Revenues are
attributed to countries based on the location in which the Group’s booking office is located. The location of a transaction on the Group’s books is sometimes different from thelocation of the headquarters or other offices of a customer and different from the location of the Group’s personnel who entered into or facilitated the transaction. Where theGroup records a transaction involving its staff and customers and other third parties in different locations frequently depends on other considerations, such as the nature of thetransaction, regulatory considerations and transaction processing considerations.

265
Deutsche Bank Notes to the Consolidated Income StatementAnnual Report 2018 Net Interest Income and Net Gains (Losses) on Financial Assets/Liabilities at Fair Value through Profit
or Loss
Notes to the Consolidated Income Statement
05 – Net Interest Income and Net Gains (Losses) on FinancialAssets/Liabilities at Fair Value through Profit or LossNet Interest Incomein € m. 2018 2017 2016Interest and similar income:1
Interest income on cash and central bank balances 1,860 1,070 433Interest income on interbank balances (w/o central banks) 223 245 252Central bank funds sold and securities purchased under resale agreements 221 292 359Interest income on financial assets available for sale N/A 1,083 1,313Dividend income on financial assets available for sale N/A 88 205Loans 12,992 12,004 12,311Interest income on securities held to maturity N/A 68 67Other 497 1,406 1,417Total Interest and similar income from assets at amortized cost 15,793 16,256 16,357Interest income from assets at fair value through other comprehensive income 1,014 N/A N/ATotal interest and similar income not at fair value through profit or loss 16,807 16,256 16,357Financial assets at fair value through profit or loss 7,985 7,286 8,786
Total interest and similar income 24,793 23,542 25,143Interest expense:1
Interest-bearing deposits 3,122 2,833 2,583Central bank funds purchased and securities sold under repurchase agreements 379 431 255Other short-term borrowings 139 135 179Long-term debt 1,981 1,795 1,759Trust preferred securities 234 413 437Other 1,923 1,500 1,083Total interest expense not at fair value through profit or loss 7,778 7,107 6,295Financial liabilities at fair value through profit or loss 3,822 4,058 4,141
Total interest expense 11,601 11,164 10,436Net interest income 13,192 12,378 14,7071 Prior period comparatives for gross interest income and gross interest expense have been restated. The restatements did not affect net interest income. € 550 million and
€ 493 million for year ended December 31, 2017 and 2016 were restated.
Interest income recorded on impaired financial assets was € 61 million and € 63 million for the years ended December 31,2017 and 2016, respectively.
Other interest income for the years ended December 31, 2018 and 2017 included € 93 million and € 116 million which wererelated to government grants under the Targeted Longer-Term Refinancing Operations II (TLTRO II)-program.
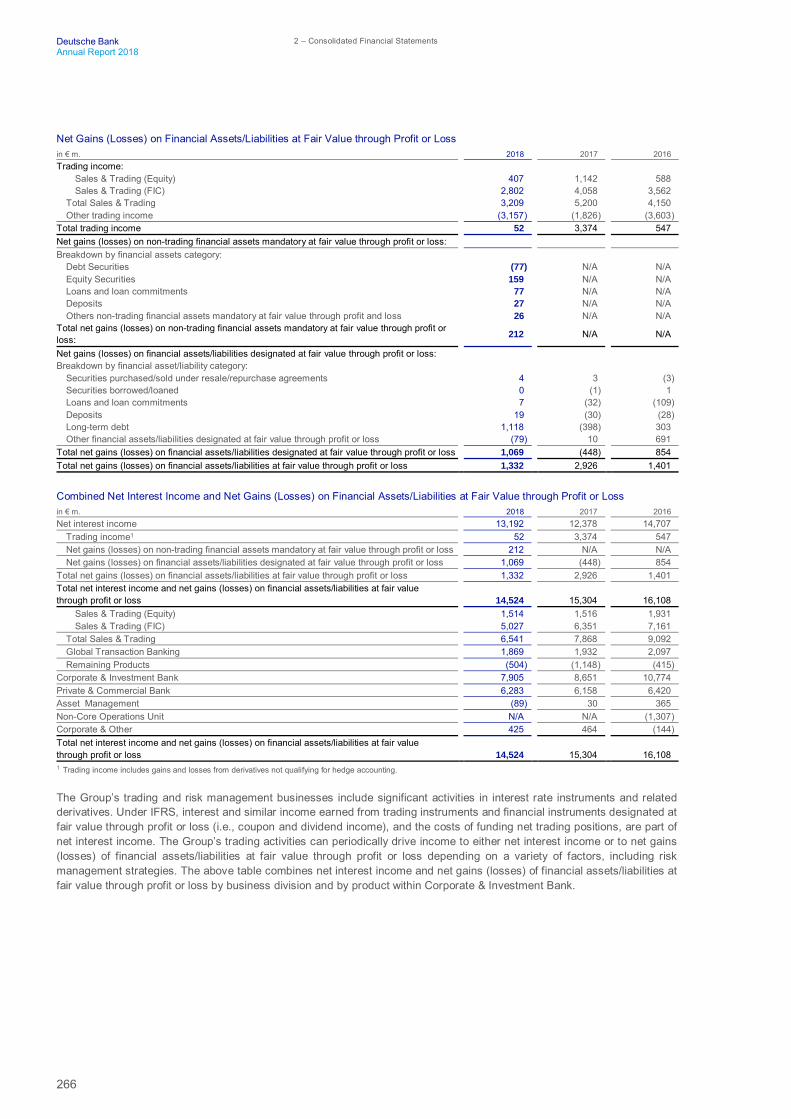
266
Deutsche Bank 2 – Consolidated Financial StatementsAnnual Report 2018
Net Gains (Losses) on Financial Assets/Liabilities at Fair Value through Profit or Lossin € m. 2018 2017 2016Trading income:
Sales & Trading (Equity) 407 1,142 588Sales & Trading (FIC) 2,802 4,058 3,562
Total Sales & Trading 3,209 5,200 4,150Other trading income (3,157) (1,826) (3,603)
Total trading income 52 3,374 547Net gains (losses) on non-trading financial assets mandatory at fair value through profit or loss:Breakdown by financial assets category:
Debt Securities (77) N/A N/AEquity Securities 159 N/A N/ALoans and loan commitments 77 N/A N/ADeposits 27 N/A N/AOthers non-trading financial assets mandatory at fair value through profit and loss 26 N/A N/A
Total net gains (losses) on non-trading financial assets mandatory at fair value through profit orloss: 212 N/A N/A
Net gains (losses) on financial assets/liabilities designated at fair value through profit or loss:Breakdown by financial asset/liability category:
Securities purchased/sold under resale/repurchase agreements 4 3 (3)Securities borrowed/loaned 0 (1) 1Loans and loan commitments 7 (32) (109)Deposits 19 (30) (28)Long-term debt 1,118 (398) 303Other financial assets/liabilities designated at fair value through profit or loss (79) 10 691
Total net gains (losses) on financial assets/liabilities designated at fair value through profit or loss 1,069 (448) 854Total net gains (losses) on financial assets/liabilities at fair value through profit or loss 1,332 2,926 1,401
Combined Net Interest Income and Net Gains (Losses) on Financial Assets/Liabilities at Fair Value through Profit or Lossin € m. 2018 2017 2016Net interest income 13,192 12,378 14,707
Trading income1 52 3,374 547Net gains (losses) on non-trading financial assets mandatory at fair value through profit or loss 212 N/A N/ANet gains (losses) on financial assets/liabilities designated at fair value through profit or loss 1,069 (448) 854
Total net gains (losses) on financial assets/liabilities at fair value through profit or loss 1,332 2,926 1,401Total net interest income and net gains (losses) on financial assets/liabilities at fair valuethrough profit or loss 14,524 15,304 16,108
Sales & Trading (Equity) 1,514 1,516 1,931Sales & Trading (FIC) 5,027 6,351 7,161
Total Sales & Trading 6,541 7,868 9,092Global Transaction Banking 1,869 1,932 2,097Remaining Products (504) (1,148) (415)
Corporate & Investment Bank 7,905 8,651 10,774Private & Commercial Bank 6,283 6,158 6,420Asset Management (89) 30 365Non-Core Operations Unit N/A N/A (1,307)Corporate & Other 425 464 (144)Total net interest income and net gains (losses) on financial assets/liabilities at fair valuethrough profit or loss 14,524 15,304 16,1081 Trading income includes gains and losses from derivatives not qualifying for hedge accounting.
The Group’s trading and risk management businesses include significant activities in interest rate instruments and relatedderivatives. Under IFRS, interest and similar income earned from trading instruments and financial instruments designated atfair value through profit or loss (i.e., coupon and dividend income), and the costs of funding net trading positions, are part ofnet interest income. The Group’s trading activities can periodically drive income to either net interest income or to net gains(losses) of financial assets/liabilities at fair value through profit or loss depending on a variety of factors, including riskmanagement strategies. The above table combines net interest income and net gains (losses) of financial assets/liabilities atfair value through profit or loss by business division and by product within Corporate & Investment Bank.

267
Deutsche Bank Notes to the Consolidated Income StatementAnnual Report 2018 Commissions and Fee Income
06 – Commissions and Fee Incomein € m. 2018 2017 2016Commission and fee income and expense:Commission and fee income 12,921 14,102 14,999Commission and fee expense 2,882 3,100 3,255Net commissions and fee income 10,039 11,002 11,744
In the first quarter of 2018, the Group adopted IFRS 15 “Revenue from Contracts with Customers” which requiresdisaggregation of revenues prior to the deduction of associated expenses.
Disaggregation of revenues by product type and business segment – based on IFRS 15Dec 31,2018
in € m.(unless stated otherwise) Corporate &
Investment Bank
Private &Commercial
BankAsset
ManagementCorporate &
OtherTotal
ConsolidatedMajor type of services:Commissions for administration 292 257 22 (3) 568Commissions for assets under management 45 261 3,131 (0) 3,436Commissions for other securities 302 30 2 0 335Underwriting and advisory fees 1,708 17 (1) (28) 1,696Brokerage fees 1,223 933 82 0 2,238Commissions for local payments 414 1,047 (0) (1) 1,460Commissions for foreign commercial business 485 137 0 (1) 621Commissions for foreign currency/exchange business 7 8 0 (0) 15Commissions for loan processing and guarantees 690 291 0 1 981Intermediary fees 3 478 0 12 493Fees for sundry other customer services 730 229 117 0 1,076Total fee and commissions income 5,898 3,688 3,352 (18) 12,921Gross expense (2,882)Net fees and commissions 10,039
The Group has applied IFRS 15 to reporting periods beginning on or after January 1, 2018 (as allowed under the cumulativeeffect method under IFRS 15). Prior to adoption of IFRS 15 the Group disclosed total commissions and fee income andexpenses on a gross basis annually. The disaggregation of commissions and fees were reported annually on a net basis. Forthe years ended 31 December 2017 and 2016, annual commissions and fees were € 4.3 billion and € 4.3 billion respectivelyfor fiduciary activities, € 3.0 billion and € 3.3 billion respectively for brokers’ fees, mark-ups on securities underwriting andother securities activities, and € 3.7 billion and € 4.2 billion respectively for fees for other customer services.
As of December 31, 2018, the Group’s balance of receivables from commission and fee income was € 839 million. As ofDecember 31, 2018, the Group’s balance of contract liabilities associated to commission and fee income was € 74 million.Contract liabilities arise from the Group’s obligation to provide future services to a customer for which it has receivedconsideration from the customer prior to completion of the services. The balances of receivables and contract liabilities do notvary significantly from period to period reflecting the fact that they predominately relate to recurring service contracts withservice periods of less than one year such as monthly current account services and quarterly asset management services.Customer payment in exchange for services provided are generally subject to performance by the Group over the specificservice period such that the Group’s right to payment arises at the end of the service period when its performance obligationsare fully completed. Therefore no material balance of contract asset is reported.
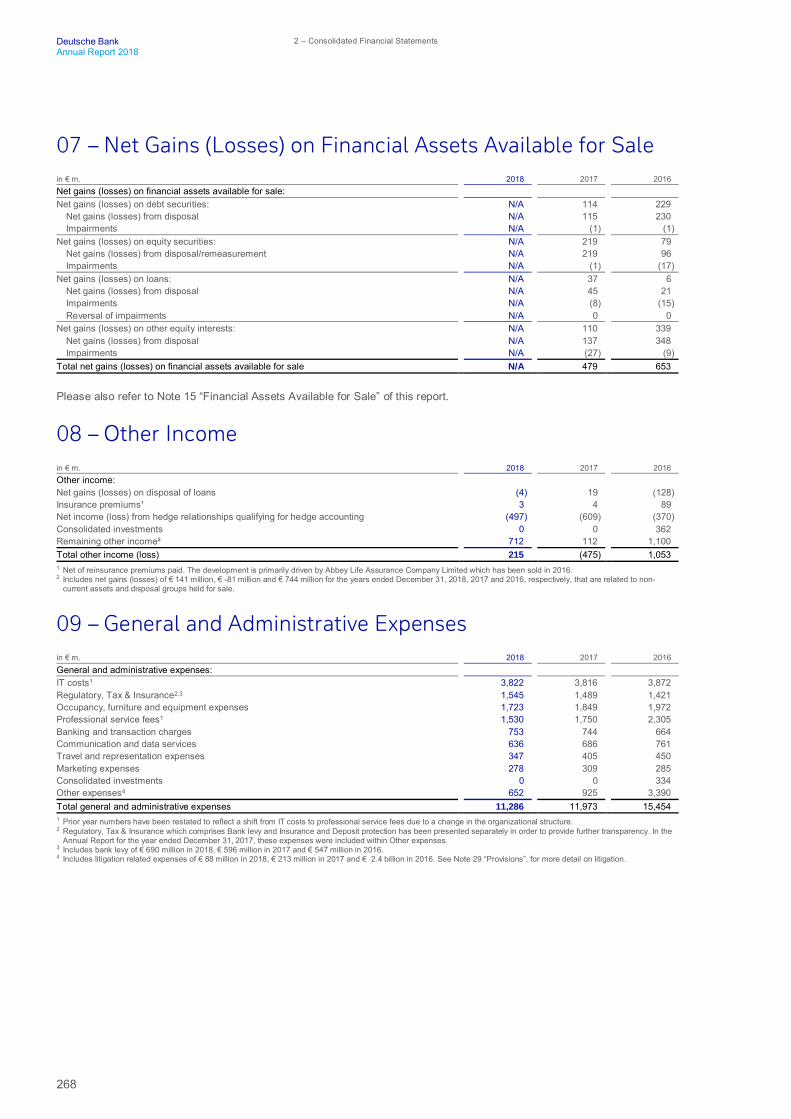
268
Deutsche Bank 2 – Consolidated Financial StatementsAnnual Report 2018
07 – Net Gains (Losses) on Financial Assets Available for Salein € m. 2018 2017 2016Net gains (losses) on financial assets available for sale:Net gains (losses) on debt securities: N/A 114 229
Net gains (losses) from disposal N/A 115 230Impairments N/A (1) (1)
Net gains (losses) on equity securities: N/A 219 79Net gains (losses) from disposal/remeasurement N/A 219 96Impairments N/A (1) (17)
Net gains (losses) on loans: N/A 37 6Net gains (losses) from disposal N/A 45 21Impairments N/A (8) (15)Reversal of impairments N/A 0 0
Net gains (losses) on other equity interests: N/A 110 339Net gains (losses) from disposal N/A 137 348Impairments N/A (27) (9)
Total net gains (losses) on financial assets available for sale N/A 479 653
Please also refer to Note 15 “Financial Assets Available for Sale” of this report.
08 – Other Incomein € m. 2018 2017 2016Other income:Net gains (losses) on disposal of loans (4) 19 (128)Insurance premiums¹ 3 4 89Net income (loss) from hedge relationships qualifying for hedge accounting (497) (609) (370)Consolidated investments 0 0 362Remaining other income² 712 112 1,100Total other income (loss) 215 (475) 1,0531 Net of reinsurance premiums paid. The development is primarily driven by Abbey Life Assurance Company Limited which has been sold in 2016.2 Includes net gains (losses) of € 141 million, € -81 million and € 744 million for the years ended December 31, 2018, 2017 and 2016, respectively, that are related to non-
current assets and disposal groups held for sale.
09 – General and Administrative Expensesin € m. 2018 2017 2016General and administrative expenses:IT costs1 3,822 3,816 3,872Regulatory, Tax & Insurance2,3 1,545 1,489 1,421Occupancy, furniture and equipment expenses 1,723 1,849 1,972Professional service fees1 1,530 1,750 2,305Banking and transaction charges 753 744 664Communication and data services 636 686 761Travel and representation expenses 347 405 450Marketing expenses 278 309 285Consolidated investments 0 0 334Other expenses4 652 925 3,390Total general and administrative expenses 11,286 11,973 15,4541 Prior year numbers have been restated to reflect a shift from IT costs to professional service fees due to a change in the organizational structure.2 Regulatory, Tax & Insurance which comprises Bank levy and Insurance and Deposit protection has been presented separately in order to provide further transparency. In the
Annual Report for the year ended December 31, 2017, these expenses were included within Other expenses.3 Includes bank levy of € 690 million in 2018, € 596 million in 2017 and € 547 million in 2016.4 Includes litigation related expenses of € 88 million in 2018, € 213 million in 2017 and € 2.4 billion in 2016. See Note 29 “Provisions”, for more detail on litigation.
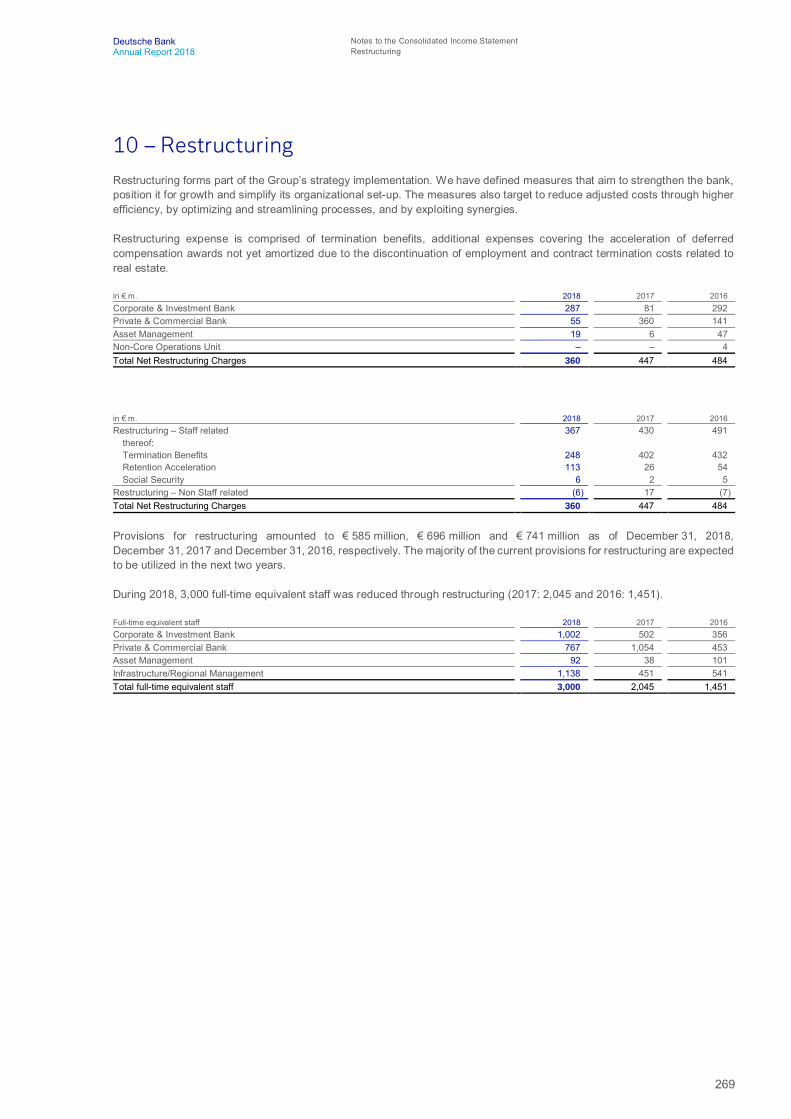
269
Deutsche Bank Notes to the Consolidated Income StatementAnnual Report 2018 Restructuring
10 – RestructuringRestructuring forms part of the Group’s strategy implementation. We have defined measures that aim to strengthen the bank,position it for growth and simplify its organizational set-up. The measures also target to reduce adjusted costs through higherefficiency, by optimizing and streamlining processes, and by exploiting synergies.
Restructuring expense is comprised of termination benefits, additional expenses covering the acceleration of deferredcompensation awards not yet amortized due to the discontinuation of employment and contract termination costs related toreal estate.
in € m. 2018 2017 2016Corporate & Investment Bank 287 81 292Private & Commercial Bank 55 360 141Asset Management 19 6 47Non-Core Operations Unit – – 4Total Net Restructuring Charges 360 447 484
in € m. 2018 2017 2016Restructuring – Staff related 367 430 491
thereof:Termination Benefits 248 402 432Retention Acceleration 113 26 54Social Security 6 2 5
Restructuring – Non Staff related (6) 17 (7)Total Net Restructuring Charges 360 447 484
Provisions for restructuring amounted to € 585 million, € 696 million and € 741 million as of December 31, 2018,December 31, 2017 and December 31, 2016, respectively. The majority of the current provisions for restructuring are expectedto be utilized in the next two years.
During 2018, 3,000 full-time equivalent staff was reduced through restructuring (2017: 2,045 and 2016: 1,451).
Full-time equivalent staff 2018 2017 2016Corporate & Investment Bank 1,002 502 356Private & Commercial Bank 767 1,054 453Asset Management 92 38 101Infrastructure/Regional Management 1,138 451 541Total full-time equivalent staff 3,000 2,045 1,451

270
Deutsche Bank 2 – Consolidated Financial StatementsAnnual Report 2018
11 – Earnings per ShareBasic earnings per share amounts are computed by dividing net income (loss) attributable to Deutsche Bank shareholders bythe average number of common shares outstanding during the year. The average number of common shares outstanding isdefined as the average number of common shares issued, reduced by the average number of shares in treasury and by theaverage number of shares that will be acquired under physically-settled forward purchase contracts, and increased byundistributed vested shares awarded under deferred share plans.
Diluted earnings per share assumes the conversion into common shares of outstanding securities or other contracts to issuecommon stock, such as share options, convertible debt, unvested deferred share awards and forward contracts. Theaforementioned instruments are only included in the calculation of diluted earnings per share if they are dilutive in therespective reporting period.
Computation of basic and diluted earnings per sharein € m. 2018 2017 2016Net income (loss) attributable to Deutsche Bank shareholders –numerator for basic earnings per share¹ 267 (1,049) (1,678)Effect of dilutive securities:
Forwards and options 0 0 0Convertible debt 0 0 0
Net income (loss) attributable to Deutsche Bank shareholders after assumedconversions – numerator for diluted earnings per share¹ 267 (1,049) (1,678)Number of shares in millionWeighted-average shares outstanding – denominator for basic earnings per share 2,102.2 1,967.7 1,555.3Effect of dilutive securities:
Forwards 0.0 0.0 0.0Employee stock compensation options 0.0 0.0 0.0Deferred shares 0.0 0.0 0.0Other (including trading options) 0.0 0.0 0.0
Dilutive potential common shares 0.0 0.0 0.0Adjusted weighted-average shares after assumed conversions –denominator for diluted earnings per share 2,102.2 1,967.7 1,555.31 Earnings were adjusted by € 292 million and € 298 million and € 276 million net of tax for the coupons paid on Additional Tier 1 Notes in April 2018, April 2017 and April 2016.
Earnings per sharein € 2018 2017 2016Basic earnings per share (0.01) (0.53) (1.08)Diluted earnings per share (0.01) (0.53) (1.08)
On April 7, 2017, Deutsche Bank AG completed a capital increase with subscription rights. As the subscription price of thenew shares was lower than the market price of the existing shares, the capital increase included a bonus element. Accordingto IAS 33, the bonus element is the result of an implicit change in the number of shares outstanding for all periods prior to thecapital increase without a fully proportionate change in resources. As a consequence, the weighted average number of sharesoutstanding has been adjusted retrospectively.
In accordance with IAS 33 the coupons paid on Additional Tier 1 Notes are not attributable to Deutsche Bank shareholdersand therefore need to be deducted in the calculation. This adjustment created a net loss situation for Earnings per CommonShare in 2018. Due to the net loss situation for 2018, 2017 and 2016 potentially dilutive shares are generally not consideredfor the earnings per share calculation, because to do so would have been anti-dilutive and hence decreased the net loss pershare.
Instruments outstanding and not included in the calculation of diluted earnings per share1
Number of shares in m. 2018 2017 2016Call options sold 0.0 0.0 0.0Employee stock compensation options 0.0 0.0 0.0Deferred shares 108.8 104.4 69.61 Not included in the calculation of diluted earnings per share, because to do so would have been anti-dilutive.

271
Deutsche Bank Notes to the Consolidated Balance SheetAnnual Report 2018 Financial Assets/Liabilities at Fair Value through Profit or Loss
Notes to the Consolidated Balance Sheet
12 – Financial Assets/Liabilities at Fair Value through Profit orLossin € m. Dec 31, 2018 Dec 31, 2017Trading Financial assets:
Trading assets:Trading securities 140,720 173,196Other trading assets1 12,017 11,466
Total trading assets 152,738 184,661Positive market values from derivative financial instruments 320,058 361,032
Total Trading Financial assets 472,796 545,693Non-trading financial assets mandatory at fair value through profit or loss:
Securities purchased under resale agreements 44,543 N/ASecurities borrowed 24,210 N/ALoans 12,741 N/AOther financial assets mandatory at fair value through profit or loss 18,951 N/A
Total Non-trading financial assets mandatory at fair value through profit or loss 100,444 N/AFinancial assets designated at fair value through profit or loss:
Securities purchased under resale agreements 0 57,843Securities borrowed 0 20,254Loans 0 4,802Other financial assets designated at fair value through profit or loss 104 8,377
Total financial assets designated at fair value through profit or loss 104 91,276Total financial assets at fair value through profit or loss 573,344 636,9701 Includes traded loans of € 11.5 billion and € 10.9 billion at December 31, 2018 and 2017 respectively.
in € m. Dec 31, 2018 Dec 31, 2017Financial liabilities classified as held for trading:
Trading liabilities:Trading securities 59,629 71,148Other trading liabilities 295 314
Total trading liabilities 59,924 71,462Negative market values from derivative financial instruments 301,487 342,726
Total financial liabilities classified as held for trading 361,411 414,189Financial liabilities designated at fair value through profit or loss:
Securities sold under repurchase agreements 46,254 53,840Loan commitments 0 8Long-term debt 5,607 6,439Other financial liabilities designated at fair value through profit or loss 1,895 3,587
Total financial liabilities designated at fair value through profit or loss 53,757 63,874Investment contract liabilities 512 574Total financial liabilities at fair value through profit or loss 415,680 478,636

272
Deutsche Bank 2 – Consolidated Financial StatementsAnnual Report 2018
Financial Assets & Liabilities designated at Fair Value through Profit or Loss
The Group previously designated various lending relationships at fair value through profit or loss. In 2018, these facilities aremandatorily at fair value through profit or loss under IFRS 9. Lending facilities consist of drawn loan assets and undrawnirrevocable loan commitments. The maximum exposure to credit risk on a drawn loan is its fair value. The Group’s maximumexposure to credit risk on drawn loans, including securities purchased under resale agreements and securities borrowed, was€ 0 million and € 83 billion as of December 31, 2018, and 2017, respectively. Exposure to credit risk also exists for undrawnirrevocable loan commitments and is predominantly counterparty credit risk.
The credit risk on the securities purchased under resale agreements and securities borrowed designated under the fair valueoption is mitigated by the holding of collateral. The valuation of these instruments takes into account the credit enhancementin the form of the collateral received. As such there is no material movement during the year or cumulatively due to movementsin counterparty credit risk on these instruments.
Changes in fair value of financial assets attributable to movements in counterparty credit riskin € Dec 31, 2018 Dec 31, 2017Notional value of financial assets exposed to credit risk 0 N/AAnnual change in the fair value reflected in the Statement of Income 0 N/ACumulative change in the fair value 0 N/ANotional of credit derivatives used to mitigate credit risk 0 N/AAnnual change in the fair value reflected in the Statement of Income 0 N/ACumulative change in the fair value 0 N/A
Changes in fair value of loans1 and loan commitments attributable to movements in counterparty credit risk2
Dec 31, 2018 Dec 31, 2017
in € m. LoansLoan
commitments LoansLoan
commitmentsNotional value of loans and loan commitments exposed to credit risk N/A N/A 2,865 1,973Annual change in the fair value reflected in the Statement of Income N/A N/A 7 14Cumulative change in the fair value³ N/A N/A 10 30Notional of credit derivatives used to mitigate credit risk N/A N/A 536 4,728Annual change in the fair value reflected in the Statement of Income N/A N/A (0) (42)Cumulative change in the fair value³ N/A N/A 1 (46)1 Where the loans are over-collateralized there is no material movement in valuation during the year or cumulatively due to movements in counterparty credit risk.2 Determined using valuation models that exclude the fair value impact associated with market risk.3 Changes are attributable to loans and loan commitments held at reporting date, which may differ from those held in prior periods. No adjustments are made to prior year to
reflect differences in the underlying population.
Changes in fair value of financial liabilities attributable to movements in the Group’s credit risk1
in € m. Dec 31, 2018 Dec 31, 2017²Presented in Other comprehensive IncomeCumulative change in the fair value (49) N/APresented in Statement of incomeAnnual change in the fair value reflected in the Statement of Income 0 60Cumulative change in the fair value 0 721 The fair value of a financial liability incorporates the credit risk of that financial liability. Changes in the fair value of financial liabilities issued by consolidated structured entities
have been excluded as this is not related to the Group’s credit risk but to that of the legally isolated structured entity, which is dependent on the collateral it holds.
Transfers of the cumulative gains or losses within equity during the periodin € m. Dec 31, 2018 Dec 31, 2017Cumulative gains or losses within equity during the period 0 N/A
Amounts realized on derecognition of liabilities designated at fair value through profit or lossin € m. Dec 31, 2018 Dec 31, 2017Amount presented in other comprehensive income realized at derecognition (3) N/A
The excess of the contractual amount repayable at maturity over the carrying value of financial liabilities 1
in € m. Dec 31, 2018 Dec 31, 2017Including undrawn loan commitments² 2,545 6,088Excluding undrawn loan commitments 2,536 2,0731 Assuming the liability is extinguished at the earliest contractual maturity that the Group can be required to repay. When the amount payable is not fixed, it is determined by
reference to conditions existing at the reporting date.2 The contractual cash flows at maturity for undrawn loan commitments assume full drawdown of the facility.
273
Deutsche Bank Notes to the Consolidated Balance SheetAnnual Report 2018 Financial Instruments carried at Fair Value
13 – Financial Instruments carried at Fair Value
Valuation Methods and Control
The Group has an established valuation control framework which governs internal control standards, methodologies, andprocedures over the valuation process.
Prices Quoted in Active Markets – The fair value of instruments that are quoted in active markets are determined using thequoted prices where they represent prices at which regularly and recently occurring transactions take place.
Valuation Techniques – The Group uses valuation techniques to establish the fair value of instruments where prices, quotedin active markets, are not available. Valuation techniques used for financial instruments include modelling techniques, the useof indicative quotes for proxy instruments, quotes from recent and less regular transactions and broker quotes.
For some financial instruments a rate or other parameter, rather than a price, is quoted. Where this is the case then the marketrate or parameter is used as an input to a valuation model to determine fair value. For some instruments, modelling techniquesfollow industry standard models, for example, discounted cash flow analysis and standard option pricing models. Thesemodels are dependent upon estimated future cash flows, discount factors and volatility levels. For more complex or uniqueinstruments, more sophisticated modelling techniques are required, and may rely upon assumptions or more complexparameters such as correlations, prepayment speeds, default rates and loss severity.
Frequently, valuation models require multiple parameter inputs. Where possible, parameter inputs are based on observabledata or are derived from the prices of relevant instruments traded in active markets. Where observable data is not availablefor parameter inputs, then other market information is considered. For example, indicative broker quotes and consensuspricing information are used to support parameter inputs where they are available. Where no observable information isavailable to support parameter inputs then they are based on other relevant sources of information such as prices for similartransactions, historic data, economic fundamentals, and research information, with appropriate adjustment to reflect the termsof the actual instrument being valued and current market conditions.
Valuation Adjustments – Valuation adjustments are an integral part of the valuation process. In making appropriate valuationadjustments, the Group follows methodologies that consider factors such as bid-offer spreads, counterparty/own credit andfunding risk. Bid-offer spread valuation adjustments are required to adjust mid market valuations to the appropriate bid or offervaluation. The bid or offer valuation is the best representation of the fair value for an instrument, and therefore its fair value.The carrying value of a long position is adjusted from mid to bid, and the carrying value of a short position is adjusted frommid to offer. Bid-offer valuation adjustments are determined from bid-offer prices observed in relevant trading activity and inquotes from other broker-dealers or other knowledgeable counterparties. Where the quoted price for the instrument is alreadya bid-offer price then no additional bid-offer valuation adjustment is necessary. Where the fair value of financial instruments isderived from a modelling technique, then the parameter inputs into that model are normally at a mid-market level. Suchinstruments are generally managed on a portfolio basis and, when specified criteria are met, valuation adjustments are takento reflect the cost of closing out the net exposure the Bank has to individual market or counterparty risks. These adjustmentsare determined from bid-offer prices observed in relevant trading activity and quotes from other broker-dealers.
Where complex valuation models are used, or where less-liquid positions are being valued, then bid-offer levels for thosepositions may not be available directly from the market, and therefore for the close-out cost of these positions, models andparameters must be estimated. When these adjustments are designed, the Group closely examines the valuation risksassociated with the model as well as the positions themselves, and the resulting adjustments are closely monitored on anongoing basis.
Counterparty Credit Valuation Adjustments (CVAs) are required to cover expected credit losses to the extent that the valuationtechnique does not already include an expected credit loss factor relating to the non-performance risk of the counterparty. TheCVA amount is applied to all relevant over-the-counter (OTC) derivatives, and is determined by assessing the potential creditexposure to a given counterparty and taking into account any collateral held, the effect of any relevant netting arrangements,expected loss given default and the probability of default, based on available market information, including Credit DefaultSwap (CDS) spreads. Where counterparty CDS spreads are not available, relevant proxies are used.
274
Deutsche Bank 2 – Consolidated Financial StatementsAnnual Report 2018
The fair value of the Group’s financial liabilities at fair value through profit or loss (i.e., OTC derivative liabilities and issuednote liabilities designated at fair value through profit or loss) incorporates valuation adjustments to measure the change in theGroup’s own credit risk (i.e. Debt Valuation Adjustments (DVA) for Derivatives and Own Credit Adjustment (OCA) for structurednotes). For derivative liabilities the Group considers its own creditworthiness by assessing all counterparties’ expected futureexposure to the Group, taking into account any collateral posted by the Group, the effect of relevant netting arrangements,the probability of default of the Group, based on the Group’s market CDS level and the expected loss given default, takinginto account the seniority of derivative claims under resolution (statutory subordination). Issued note liabilities are discountedutilizing the spread at which similar instruments would be issued or bought back at the measurement date as this reflects thevalue from the perspective of a market participant who holds the identical item as an asset. This spread is furtherparameterized into a market level of funding component and an idiosyncratic own credit component. Under IFRS 9 the changein the own credit component is reported under Other Comprehensive Income (OCI).
When determining CVA and DVA, additional adjustments are made where appropriate to achieve fair value, due to theexpected loss estimate of a particular arrangement, or where the credit risk being assessed differs in nature to that describedby the available CDS instrument.
Funding Valuation Adjustments (FVA) are required to incorporate the market implied funding costs into the fair value ofderivative positions. The FVA reflects a discounting spread applied to uncollateralized and partially collateralized derivativesand is determined by assessing the market-implied funding costs on both assets and liabilities.
Where there is uncertainty in the assumptions used within a modelling technique, an additional adjustment is taken to calibratethe model price to the expected market price of the financial instrument. Typically, such transactions have bid-offer levelswhich are less observable, and these adjustments aim to estimate the bid-offer by computing the liquidity-premium associatedwith the transaction. Where a financial instrument is of sufficient complexity that the cost of closing it out would be higher thanthe cost of closing out its component risks, then an additional adjustment is taken to reflect this.
Valuation Control – The Group has an independent specialized valuation control group within the Finance function whichgoverns and develops the valuation control framework and manages the valuation control processes. The mandate of thisspecialist function includes the performance of the independent valuation control process for all businesses, the continueddevelopment of valuation control methodologies and techniques, as well as devising and governing the formal valuation controlpolicy framework. Special attention of this independent valuation control group is directed to areas where managementjudgment forms part of the valuation process.
Results of the valuation control process are collected and analyzed as part of a standard monthly reporting cycle. Variancesof differences outside of preset and approved tolerance levels are escalated both within the Finance function and with SeniorBusiness Management for review, resolution and, if required, adjustment.
For instruments where fair value is determined from valuation models, the assumptions and techniques used within the modelsare independently validated by an independent specialist model validation group that is part of the Group’s Risk Managementfunction.
Quotes for transactions and parameter inputs are obtained from a number of third party sources including exchanges, pricingservice providers, firm broker quotes and consensus pricing services. Price sources are examined and assessed to determinethe quality of fair value information they represent, with greater emphasis given to those possessing greater valuation certaintyand relevance. The results are compared against actual transactions in the market to ensure the model valuations arecalibrated to market prices.
Price and parameter inputs to models, assumptions and valuation adjustments are verified against independent sources.Where they cannot be verified to independent sources due to lack of observable information, the estimate of fair value issubject to procedures to assess its reasonableness. Such procedures include performing revaluation using independentlygenerated models (including where existing models are independently recalibrated), assessing the valuations againstappropriate proxy instruments and other benchmarks, and performing extrapolation techniques. Assessment is made as towhether the valuation techniques produce fair value estimates that are reflective of market levels by calibrating the results ofthe valuation models against market transactions where possible.

275
Deutsche Bank Notes to the Consolidated Balance SheetAnnual Report 2018 Financial Instruments carried at Fair Value
Fair Value Hierarchy
The financial instruments carried at fair value have been categorized under the three levels of the IFRS fair value hierarchyas follows:
Level 1 – Instruments valued using quoted prices in active markets are instruments where the fair value can be determineddirectly from prices which are quoted in active, liquid markets and where the instrument observed in the market isrepresentative of that being priced in the Group’s inventory.
These include: government bonds, exchange-traded derivatives and equity securities traded on active, liquid exchanges.
Level 2 – Instruments valued with valuation techniques using observable market data are instruments where the fair valuecan be determined by reference to similar instruments trading in active markets, or where a technique is used to derive thevaluation but where all inputs to that technique are observable.
These include: many OTC derivatives; many investment-grade listed credit bonds; some CDS; many collateralized debtobligations (CDO); and many less-liquid equities.
Level 3 – Instruments valued using valuation techniques using market data which is not directly observable are instrumentswhere the fair value cannot be determined directly by reference to market-observable information, and some other pricingtechnique must be employed. Instruments classified in this category have an element which is unobservable and which has asignificant impact on the fair value.
These include: more-complex OTC derivatives; distressed debt; highly-structured bonds; illiquid asset-backed securities(ABS); illiquid CDO’s (cash and synthetic); monoline exposures; some private equity placements; many commercial real estate(CRE) loans; illiquid loans; and some municipal bonds.
Carrying value of the financial instruments held at fair value1
Dec 31, 2018 Dec 31, 2017
in € m.
Quotedprices in
active market(Level 1)
Valuationtechnique
observableparameters
(Level 2)
Valuationtechnique
unobservableparameters
(Level 3)
Quotedprices in
active market(Level 1)
Valuationtechnique
observableparameters
(Level 2)
Valuationtechnique
unobservableparameters
(Level 3)Financial assets held at fair value:
Trading assets 75,415 67,560 9,763 106,075 69,543 9,043Trading securities 75,210 61,424 4,086 105,792 62,770 4,634Other trading assets 205 6,136 5,676 283 6,773 4,409
Positive market values from derivative financialinstruments 10,140 301,609 8,309 12,280 341,413 7,340Non-trading financial assets mandatory at fairvalue through profit or loss 8,288 86,090 6,066 N/A N/A N/AFinancial assets designated at fair valuethrough profit or loss 104 0 0 6,547 83,242 1,488Financial assets at fair value through othercomprehensive income 32,517 18,397 268 N/A N/A N/AFinancial assets available for sale N/A N/A N/A 29,579 15,713 4,104Other financial assets at fair value 42 2,7792 207 0 3,2582 47
Total financial assets held at fair value 126,505 476,435 24,614 154,480 513,169 22,022
Financial liabilities held at fair value:Trading liabilities 42,548 17,361 15 53,644 17,817 2
Trading securities 42,547 17,082 0 53,644 17,503 2Other trading liabilities 1 279 15 0 314 0
Negative market values from derivativefinancial instruments 9,638 285,561 6,289 9,163 327,572 5,992Financial liabilities designated at fair valuethrough profit or loss 119 51,617 2,021 4 62,426 1,444Investment contract liabilities 0 512 0 0 574 0Other financial liabilities at fair value 201 2,6582 (611)3 0 2,5592,4 (298)3
Total financial liabilities held at fair value 52,505 357,709 7,714 62,810 410,948 7,1391 Amounts in this table are generally presented on a gross basis, in line with the Group’s accounting policy regarding offsetting of financial instruments, as described in Note 1
“Significant Accounting Policies and Critical Accounting Estimates”.2 Predominantly relates to derivatives qualifying for hedge accounting.3 Relates to derivatives which are embedded in contracts where the host contract is held at amortized cost but for which the embedded derivative is separated. The separated
embedded derivatives may have a positive or a negative fair value but have been presented in this table to be consistent with the classification of the host contract. Theseparated embedded derivatives are held at fair value on a recurring basis and have been split between the fair value hierarchy classifications.
4 Restatement undertaken represents pure reclass from Note 14 “Fair Value of Financial Instruments not carried at Fair Value” to Note 13 “Financial Instruments carried at FairValue”- no change in amounts. Amounts are carried at fair value.

276
Deutsche Bank 2 – Consolidated Financial StatementsAnnual Report 2018
In 2018, there were transfers of € 1.5 billion from Level 1 to Level 2 on trading securities based on changes in liquidity testingprocedures.
Valuation Techniques
The following is an explanation of the valuation techniques used in establishing the fair value of the different types of financialinstruments that the Group trades.
Sovereign, Quasi-sovereign and Corporate Debt and Equity Securities – Where there are no recent transactions then fairvalue may be determined from the last market price adjusted for all changes in risks and information since that date. Where aclose proxy instrument is quoted in an active market then fair value is determined by adjusting the proxy value for differencesin the risk profile of the instruments. Where close proxies are not available then fair value is estimated using more complexmodelling techniques. These techniques include discounted cash flow models using current market rates for credit, interest,liquidity and other risks. For equity securities modeling techniques may also include those based on earnings multiples.
Mortgage- and Other Asset-Backed Securities (MBS/ABS) include residential and commercial MBS and other ABS includingCDOs. ABS have specific characteristics as they have different underlying assets and the issuing entities have different capitalstructures. The complexity increases further where the underlying assets are themselves ABS, as is the case with many ofthe CDO instruments.
Where no reliable external pricing is available, ABS are valued, where applicable, using either relative value analysis which isperformed based on similar transactions observable in the market, or industry-standard valuation models making largestpossible use of available observable inputs. The industry standard models calculate principal and interest payments for agiven deal based on assumptions that can be independently price tested. The inputs include prepayment speeds, lossassumptions (timing and severity) and a discount rate (spread, yield or discount margin). These inputs/assumptions arederived from actual transactions, external market research and market indices where appropriate.
Loans – For certain loans fair value may be determined from the market price on a recently occurring transaction adjusted forall changes in risks and information since that transaction date. Where there are no recent market transactions then brokerquotes, consensus pricing, proxy instruments or discounted cash flow models are used to determine fair value. Discountedcash flow models incorporate parameter inputs for credit risk, interest rate risk, foreign exchange risk, loss given defaultestimates and amounts utilized given default, as appropriate. Credit risk, loss given default and utilization given defaultparameters are determined using information from the loan or other credit markets, where available and appropriate.
Leveraged loans can have transaction-specific characteristics which can limit the relevance of market-observed transactions.Where similar transactions exist for which observable quotes are available from external pricing services then this informationis used with appropriate adjustments to reflect the transaction differences. When no similar transactions exist, a discountedcash flow valuation technique is used with credit spreads derived from the appropriate leveraged loan index, incorporating theindustry classification, subordination of the loan, and any other relevant information on the loan and loan counterparty.
Over-The-Counter Derivative Financial Instruments – Market standard transactions in liquid trading markets, such as interestrate swaps, foreign exchange forward and option contracts in G7 currencies, and equity swap and option contracts on listedsecurities or indices are valued using market standard models and quoted parameter inputs. Parameter inputs are obtainedfrom pricing services, consensus pricing services and recently occurring transactions in active markets wherever possible.
More complex instruments are modeled using more sophisticated modeling techniques specific for the instrument and arecalibrated to available market prices. Where the model output value does not calibrate to a relevant market reference thenvaluation adjustments are made to the model output value to adjust for any difference. In less active markets, data is obtainedfrom less frequent market transactions, broker quotes and through extrapolation and interpolation techniques. Whereobservable prices or inputs are not available, management judgment is required to determine fair values by assessing otherrelevant sources of information such as historical data, fundamental analysis of the economics of the transaction and proxyinformation from similar transactions.

277
Deutsche Bank Notes to the Consolidated Balance SheetAnnual Report 2018 Financial Instruments carried at Fair Value
Financial Liabilities Designated at Fair Value through Profit or Loss under the Fair Value Option – The fair value of financialliabilities designated at fair value through profit or loss under the fair value option incorporates all market risk factors includinga measure of the Group’s credit risk relevant for that financial liability. The financial liabilities include structured note issuances,structured deposits, and other structured securities issued by consolidated vehicles, which may not be quoted in an activemarket. The fair value of these financial liabilities is determined by discounting the contractual cash flows using the relevantcredit-adjusted yield curve. The market risk parameters are valued consistently to similar instruments held as assets, forexample, any derivatives embedded within the structured notes are valued using the same methodology discussed in the“Over-The-Counter Derivative Financial Instruments” section above.
Where the financial liabilities designated at fair value through profit or loss under the fair value option are collateralized, suchas securities loaned and securities sold under repurchase agreements, the credit enhancement is factored into the fairvaluation of the liability.
Investment Contract Liabilities – Assets which are linked to the investment contract liabilities are owned by the Group. Theinvestment contract obliges the Group to use these assets to settle these liabilities. Therefore, the fair value of investmentcontract liabilities is determined by the fair value of the underlying assets (i.e., amount payable on surrender of the policies).
Analysis of Financial Instruments with Fair Value Derived from ValuationTechniques Containing Significant Unobservable Parameters (Level 3)
Some of the financial assets and financial liabilities in Level 3 of the fair value hierarchy have identical or similar offsettingexposures to the unobservable input. However, according to IFRS they are required to be presented gross.
Trading Securities – Certain illiquid emerging market corporate bonds and illiquid highly structured corporate bonds areincluded in this level of the hierarchy. In addition, some of the holdings of notes issued by securitization entities, commercialand residential MBS, collateralized debt obligation securities and other ABS are reported here. The decrease in the year ismainly due to a combination of sales and settlements offset by purchases, gains and transfers between Level 2 and Level 3due to changes in the observability of input parameters used to value these instruments.
Positive and Negative Market Values from Derivative Instruments categorized in this level of the fair value hierarchy are valuedbased on one or more significant unobservable parameters. The unobservable parameters may include certain correlations,certain longer-term volatilities, certain prepayment rates, credit spreads and other transaction-specific parameters.
Level 3 derivatives includes certain options where the volatility is unobservable; certain basket options in which the correlationsbetween the referenced underlying assets are unobservable; longer-term interest rate option derivatives; multi-currencyforeign exchange derivatives; and certain credit default swaps for which the credit spread is not observable.
The increase in assets was due to gains and transfers between Level 2 and Level 3 due to changes in the observability ofinput parameters used to value these instruments offset by settlements. The increase in liabilities was due to losses andtransfers between Level 2 and Level 3 offset by settlements.
Other Trading Instruments classified in Level 3 of the fair value hierarchy mainly consist of traded loans valued using valuationmodels based on one or more significant unobservable parameters. Level 3 loans comprise illiquid leveraged loans and illiquidresidential and commercial mortgage loans. The balance increased in the year due to purchases, issuances, gains andtransfers between Level 2 and Level 3 due to changes in the observability of input parameters used to value these instrumentsoffset by sales and settlements.
Non-trading financial assets mandatory at fair value through profit or loss (2018) classified in level 3 of fair value hierarchyconsist of any non-trading financial asset that does not fall into the Hold to Collect nor Hold to Collect and Sell businessmodels. This includes predominately reverse repurchase agreements which are managed on a fair value basis.Additionally, any financial asset that falls into the Hold to Collect or Hold to Collect and Sell business models for whichthe contractual cash flow characteristics are not SPPI. The increase in the period is driven by purchases, issuances,gains and transfers between Level 2 and Level 3 due to changes in the observability of input parameters used to valuethese instruments offset by sales and settlements.
Financial Assets/Liabilities designated at Fair Value through Profit or Loss – Certain corporate loans and structured liabilitieswhich were designated at fair value through profit or loss under the fair value option were categorized in this level of the fairvalue hierarchy. The corporate loans are valued using valuation techniques which incorporate observable credit spreads,recovery rates and unobservable utilization parameters. Revolving loan facilities are reported in the third level of the hierarchybecause the utilization in the event of the default parameter is significant and unobservable.

278
Deutsche Bank 2 – Consolidated Financial StatementsAnnual Report 2018
In addition, certain hybrid debt issuances designated at fair value through profit or loss containing embedded derivatives arevalued based on significant unobservable parameters. These unobservable parameters include single stock volatilitycorrelations. Assets marginally decreased during the year due to settlements and transfers between Level 2 and Level 3 offsetby gains. Liabilities increased in the year due to issuances and transfers between Level 2 and Level 3 offset by settlementsand gains.
Financial assets at fair value through other comprehensive income (2018)/Financial Assets Available for Sale (2017) includenon-performing loan portfolios where there is no trading intent and the market is very illiquid. Assets increased marginally dueto purchases offset by transfers between levels 2 and 3, sales, settlements and losses.
Reconciliation of financial instruments classified in Level 3
Reconciliation of financial instruments classified in Level 3Dec 31, 2018
in € m.
Balance,beginning
of year
Changesin the
group ofconsoli-
datedcompanies
Totalgains/
losses1 Purchases SalesIssu-
ances2Settle-ments3
Transfersinto
Level 34
Transfersout of
Level 34
Balance,end of
yearFinancial assets held atfair value:Trading securities 4,148 6 105 2,146 (1,908) 0 (481) 897 (826) 4,086Positive market valuesfrom derivative financialinstruments 7,340 0 718 0 0 0 (137) 1,940 (1,551) 8,309Other trading assets 4,426 0 233 981 (2,027) 3,055 (1,241) 506 (257) 5,676Non-trading financialassets mandatory at fairvalue through profit orloss 4,573 3 426 3,627 (567) 1,013 (3,128) 411 (292) 6,066Financial assetsdesignated at fair valuethrough profit or loss 91 0 4 0 0 0 (22) 0 (72) 0Financial assets at fairvalue through othercomprehensive income 231 3 (4)5 260 (162) 0 (6) 2 (55) 268Other financial assets atfair value 47 0 0 0 0 0 0 207 (47) 207Total financial assets heldat fair value 20,8558 12 1,4816,7 7,014 (4,664) 4,068 (5,015) 3,963 (3,100) 24,614Financial liabilities heldat fair value:Trading securities 2 (0) (1) 0 0 0 (0) 0 (1) 0Negative market valuesfrom derivative financialinstruments 5,992 0 531 0 0 0 (522) 1,319 (1,031) 6,289Other trading liabilities 0 0 (1) 0 0 0 16 0 0 15Financial liabilitiesdesignated at fair valuethrough profit or loss 1,444 0 (121) 0 0 692 (270) 408 (134) 2,021Other financial liabilitiesat fair value (298) 0 (299) 0 0 0 38 (29) (23) (611)Total financial liabilitiesheld at fair value 7,139 0 1106,7 0 0 692 (738) 1,699 (1,189) 7,7141 Total gains and losses predominantly relate to net gains (losses) on financial assets/liabilities at fair value through profit or loss reported in the consolidated statement of
income. The balance also includes net gains (losses) on financial assets available for sale reported in the consolidated statement of income and unrealized net gains (losses)on financial assets available for sale and exchange rate changes reported in other comprehensive income, net of tax. Further, certain instruments are hedged with instrumentsin Level 1 or Level 2 but the table above does not include the gains and losses on these hedging instruments. Additionally, both observable and unobservable parametersmay be used to determine the fair value of an instrument classified within Level 3 of the fair value hierarchy; the gains and losses presented below are attributable tomovements in both the observable and unobservable parameters.
2 Issuances relate to the cash amount received on the issuance of a liability and the cash amount paid on the primary issuance of a loan to a borrower.3 Settlements represent cash flows to settle the asset or liability. For debt and loan instruments this includes principal on maturity, principal amortizations and principal
repayments. For derivatives all cash flows are presented in settlements.4 Transfers in and transfers out of Level 3 are related to changes in observability of input parameters. During the year they are recorded at their fair value at the beginning of
year. For instruments transferred into Level 3 the table shows the gains and losses and cash flows on the instruments as if they had been transferred at the beginning of theyear. Similarly for instruments transferred out of Level 3 the table does not show any gains or losses or cash flows on the instruments during the year since the table ispresented as if they have been transferred out at the beginning of the year.
5 Total gains and losses on financial assets at fair value through other comprehensive income include a loss of € 8 million recognized in other comprehensive income, net oftax, and a loss of € 4 million recognized in the income statement presented in net gains (losses).
6 This amount includes the effect of exchange rate changes. For total financial assets held at fair value this effect is a gain of € 136 million and for total financial liabilities held atfair value this is a loss of € 33 million. The effect of exchange rate changes is reported in other comprehensive income, net of tax.
7 For assets positive balances represent gains, negative balances represent losses. For liabilities positive balances represent losses, negative balances represent gains.8 Opening balances have been restated due to reassessment of trades due to IFRS 9.
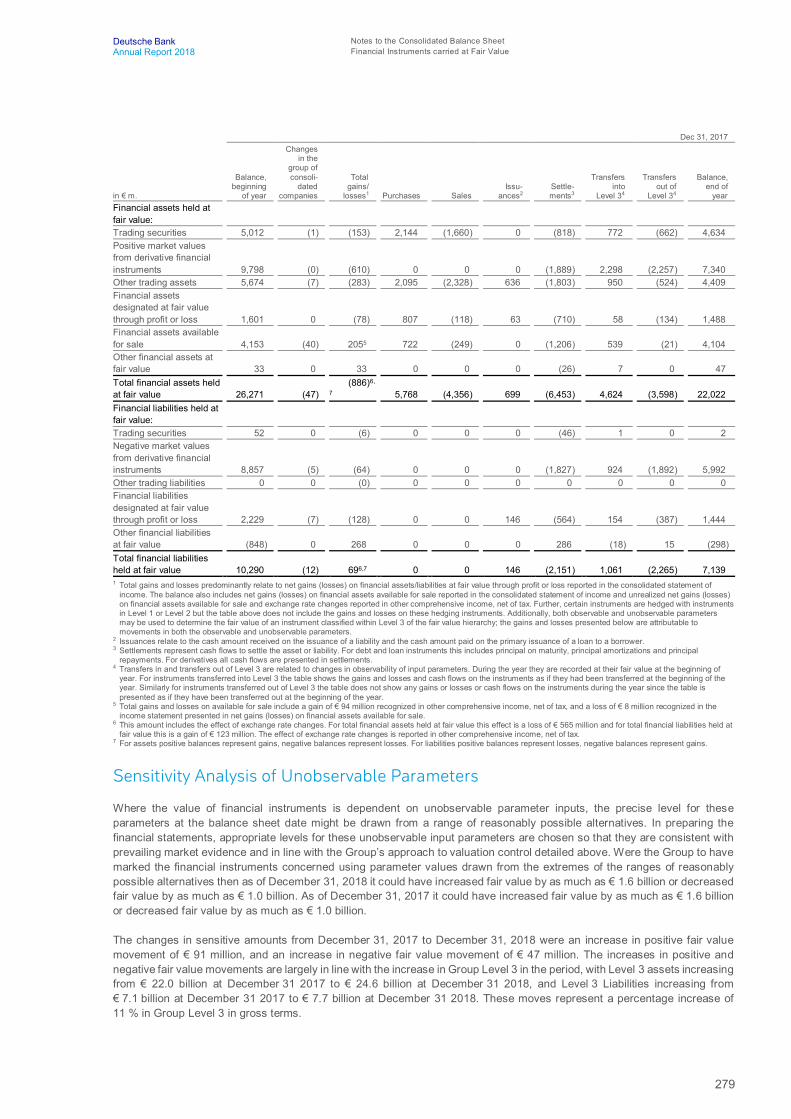
279
Deutsche Bank Notes to the Consolidated Balance SheetAnnual Report 2018 Financial Instruments carried at Fair Value
Dec 31, 2017
in € m.
Balance,beginning
of year
Changesin the
group ofconsoli-
datedcompanies
Totalgains/
losses1 Purchases SalesIssu-
ances2Settle-ments3
Transfersinto
Level 34
Transfersout of
Level 34
Balance,end of
yearFinancial assets held atfair value:Trading securities 5,012 (1) (153) 2,144 (1,660) 0 (818) 772 (662) 4,634Positive market valuesfrom derivative financialinstruments 9,798 (0) (610) 0 0 0 (1,889) 2,298 (2,257) 7,340Other trading assets 5,674 (7) (283) 2,095 (2,328) 636 (1,803) 950 (524) 4,409Financial assetsdesignated at fair valuethrough profit or loss 1,601 0 (78) 807 (118) 63 (710) 58 (134) 1,488Financial assets availablefor sale 4,153 (40) 2055 722 (249) 0 (1,206) 539 (21) 4,104Other financial assets atfair value 33 0 33 0 0 0 (26) 7 0 47Total financial assets heldat fair value 26,271 (47)
(886)6,
7 5,768 (4,356) 699 (6,453) 4,624 (3,598) 22,022Financial liabilities held atfair value:Trading securities 52 0 (6) 0 0 0 (46) 1 0 2Negative market valuesfrom derivative financialinstruments 8,857 (5) (64) 0 0 0 (1,827) 924 (1,892) 5,992Other trading liabilities 0 0 (0) 0 0 0 0 0 0 0Financial liabilitiesdesignated at fair valuethrough profit or loss 2,229 (7) (128) 0 0 146 (564) 154 (387) 1,444Other financial liabilitiesat fair value (848) 0 268 0 0 0 286 (18) 15 (298)Total financial liabilitiesheld at fair value 10,290 (12) 696,7 0 0 146 (2,151) 1,061 (2,265) 7,1391 Total gains and losses predominantly relate to net gains (losses) on financial assets/liabilities at fair value through profit or loss reported in the consolidated statement of
income. The balance also includes net gains (losses) on financial assets available for sale reported in the consolidated statement of income and unrealized net gains (losses)on financial assets available for sale and exchange rate changes reported in other comprehensive income, net of tax. Further, certain instruments are hedged with instrumentsin Level 1 or Level 2 but the table above does not include the gains and losses on these hedging instruments. Additionally, both observable and unobservable parametersmay be used to determine the fair value of an instrument classified within Level 3 of the fair value hierarchy; the gains and losses presented below are attributable tomovements in both the observable and unobservable parameters.
2 Issuances relate to the cash amount received on the issuance of a liability and the cash amount paid on the primary issuance of a loan to a borrower.3 Settlements represent cash flows to settle the asset or liability. For debt and loan instruments this includes principal on maturity, principal amortizations and principal
repayments. For derivatives all cash flows are presented in settlements.4 Transfers in and transfers out of Level 3 are related to changes in observability of input parameters. During the year they are recorded at their fair value at the beginning of
year. For instruments transferred into Level 3 the table shows the gains and losses and cash flows on the instruments as if they had been transferred at the beginning of theyear. Similarly for instruments transferred out of Level 3 the table does not show any gains or losses or cash flows on the instruments during the year since the table ispresented as if they have been transferred out at the beginning of the year.
5 Total gains and losses on available for sale include a gain of € 94 million recognized in other comprehensive income, net of tax, and a loss of € 8 million recognized in theincome statement presented in net gains (losses) on financial assets available for sale.
6 This amount includes the effect of exchange rate changes. For total financial assets held at fair value this effect is a loss of € 565 million and for total financial liabilities held atfair value this is a gain of € 123 million. The effect of exchange rate changes is reported in other comprehensive income, net of tax.
7 For assets positive balances represent gains, negative balances represent losses. For liabilities positive balances represent losses, negative balances represent gains.
Sensitivity Analysis of Unobservable Parameters
Where the value of financial instruments is dependent on unobservable parameter inputs, the precise level for theseparameters at the balance sheet date might be drawn from a range of reasonably possible alternatives. In preparing thefinancial statements, appropriate levels for these unobservable input parameters are chosen so that they are consistent withprevailing market evidence and in line with the Group’s approach to valuation control detailed above. Were the Group to havemarked the financial instruments concerned using parameter values drawn from the extremes of the ranges of reasonablypossible alternatives then as of December 31, 2018 it could have increased fair value by as much as € 1.6 billion or decreasedfair value by as much as € 1.0 billion. As of December 31, 2017 it could have increased fair value by as much as € 1.6 billionor decreased fair value by as much as € 1.0 billion.
The changes in sensitive amounts from December 31, 2017 to December 31, 2018 were an increase in positive fair valuemovement of € 91 million, and an increase in negative fair value movement of € 47 million. The increases in positive andnegative fair value movements are largely in line with the increase in Group Level 3 in the period, with Level 3 assets increasingfrom € 22.0 billion at December 31 2017 to € 24.6 billion at December 31 2018, and Level 3 Liabilities increasing from€ 7.1 billion at December 31 2017 to € 7.7 billion at December 31 2018. These moves represent a percentage increase of11 % in Group Level 3 in gross terms.

280
Deutsche Bank 2 – Consolidated Financial StatementsAnnual Report 2018
The change in positive fair value movements from December 31, 2017 to December 31, 2018 represents a 6 % increase andthe change in negative fair value movements represents a 5 % increase. These increases are proportionally smaller than the11 % increase in Group Level 3 primarily due to changes to the underlying Level 3 population as a result of IFRS 9implementation in the first quarter of 2018. A significant subset of positions which moved from fair value through profit andloss to amortized cost due to IFRS 9 were Non-Performing Loans, which had previously contributed materially to both thepositive and negative fair value movement totals given the material valuation uncertainty associated with such assets.
Our sensitivity calculation of unobservable parameters for Level 3 aligns to the approach used to assess valuation uncertaintyfor Prudent Valuation purposes. Prudent Valuation is a capital requirement for assets held at fair value. It provides amechanism for quantifying and capitalizing valuation uncertainty in accordance with the European Commission DelegatedRegulation (EU) 2016/101, which supplements Article 34 of Regulation (EU) No. 575/2013 (CRR), requiring institutions toapply as a deduction from CET 1 for the amount of any additional value adjustments on all assets measured at fair valuecalculated in accordance with Article 105 (14). This utilizes exit price analysis performed for the relevant assets and liabilitiesin the Prudent Valuation assessment. The downside sensitivity may be limited in some cases where the fair value is alreadydemonstrably prudent.
This disclosure is intended to illustrate the potential impact of the relative uncertainty in the fair value of financial instrumentsfor which valuation is dependent on unobservable input parameters. However, it is unlikely in practice that all unobservableparameters would be simultaneously at the extremes of their ranges of reasonably possible alternatives. Hence, the estimatesdisclosed above are likely to be greater than the true uncertainty in fair value at the balance sheet date. Furthermore, thedisclosure is neither predictive nor indicative of future movements in fair value.
For many of the financial instruments considered here, in particular derivatives, unobservable input parameters represent onlya subset of the parameters required to price the financial instrument, the remainder being observable. Hence for theseinstruments the overall impact of moving the unobservable input parameters to the extremes of their ranges might be relativelysmall compared with the total fair value of the financial instrument. For other instruments, fair value is determined based onthe price of the entire instrument, for example, by adjusting the fair value of a reasonable proxy instrument. In addition, allfinancial instruments are already carried at fair values which are inclusive of valuation adjustments for the cost to close outthat instrument and hence already factor in uncertainty as it reflects itself in market pricing. Any negative impact of uncertaintycalculated within this disclosure, then, will be over and above that already included in the fair value contained in the financialstatements.
Breakdown of the sensitivity analysis by type of instrument1
Dec 31, 2018 Dec 31, 2017
in € m.
Positive fair valuemovement from
using reasonablepossible alternatives
Negative fair valuemovement from
using reasonablepossible alternatives
Positive fair valuemovement from
using reasonablepossible alternatives
Negative fair valuemovement from
using reasonablepossible alternatives
Securities:Debt securities 179 118 126 90
Commercial mortgage-backed securities 5 4 6 6Mortgage and other asset-backed securities 38 37 26 28Corporate, sovereign and other debt securities 136 77 94 56
Equity securities 84 67 95 67Derivatives:
Credit 151 116 155 125Equity 257 207 164 138Interest related 346 206 340 173Foreign Exchange 49 26 65 12Other 106 89 106 73
Loans:Loans 475 219 504 320
Other 0 0 0 0Total 1,647 1,046 1,556 9991 Where the exposure to an unobservable parameter is offset across different instruments then only the net impact is disclosed in the table.

281
Deutsche Bank Notes to the Consolidated Balance SheetAnnual Report 2018 Financial Instruments carried at Fair Value
Quantitative Information about the Sensitivity of Significant Unobservable Inputs
The behavior of the unobservable parameters on Level 3 fair value measurement is not necessarily independent, and dynamicrelationships often exist between the other unobservable parameters and the observable parameters. Such relationships,where material to the fair value of a given instrument, are explicitly captured via correlation parameters, or are otherwisecontrolled via pricing models or valuation techniques. Frequently, where a valuation technique utilizes more than one input,the choice of a certain input will bound the range of possible values for other inputs. In addition, broader market factors (suchas interest rates, equity, credit or commodity indices or foreign exchange rates) can also have effects.
The range of values shown below represents the highest and lowest inputs used to value the significant exposures withinLevel 3. The diversity of financial instruments that make up the disclosure is significant and therefore the ranges of certainparameters can be large. For example, the range of credit spreads on mortgage backed securities represents performing,more liquid positions with lower spreads than the less liquid, non-performing positions which will have higher credit spreads.As Level 3 contains the less liquid fair value instruments, the wide ranges of parameters seen is to be expected, as there is ahigh degree of pricing differentiation within each exposure type to capture the relevant market dynamics. There follows a briefdescription of each of the principal parameter types, along with a commentary on significant interrelationships between them.
Credit Parameters are used to assess the creditworthiness of an exposure, by enabling the probability of default and resultinglosses of a default to be represented. The credit spread is the primary reflection of creditworthiness, and represents thepremium or yield return above the benchmark reference instrument (typically LIBOR, or relevant Treasury Instrument,depending upon the asset being assessed), that a bond holder would require to allow for the credit quality difference betweenthat entity and the reference benchmark. Higher credit spreads will indicate lower credit quality, and lead to a lower value fora given bond or other loan-asset that is to be repaid to the holder or lender by the borrower. Recovery Rates represent anestimate of the amount a lender would receive in the case of a default of a loan, or a bond holder would receive in the case ofdefault of the bond. Higher recovery rates will give a higher valuation for a given bond position, if other parameters are heldconstant. Constant Default Rate (CDR) and Constant Prepayment Rate (CPR) allow more complex loan and debt assets tobe assessed, as these parameters estimate the ongoing defaults arising on scheduled repayments and coupons, or whetherthe borrower is making additional (usually voluntary) prepayments. These parameters are particularly relevant when forminga fair value opinion for mortgage or other types of lending, where repayments are delivered by the borrower through time, orwhere the borrower may pre-pay the loan (seen for example in some residential mortgages). Higher CDR will lead to lowervaluation of a given loan or mortgage as the lender will ultimately receive less cash.
Interest rates, credit spreads, inflation rates, foreign exchange rates and equity prices are referenced in some optioninstruments, or other complex derivatives, where the payoff a holder of the derivative will receive is dependent upon thebehavior of these underlying references through time. Volatility parameters describe key attributes of option behavior byenabling the variability of returns of the underlying instrument to be assessed. This volatility is a measure of probability, withhigher volatilities denoting higher probabilities of a particular outcome occurring. The underlying references (interest rates,credit spreads etc.) have an effect on the valuation of options, by describing the size of the return that can be expected fromthe option. Therefore the value of a given option is dependent upon the value of the underlying instrument, and the volatilityof that instrument, representing the size of the payoff, and the probability of that payoff occurring. Where volatilities are high,the option holder will see a higher option value as there is greater probability of positive returns. A higher option value will alsooccur where the payoff described by the option is significant.
Correlations are used to describe influential relationships between underlying references where a derivative or otherinstrument has more than one underlying reference. Behind some of these relationships, for example commodity correlationand interest rate-foreign exchange correlations, typically lie macroeconomic factors such as the impact of global demand ongroups of commodities, or the pricing parity effect of interest rates on foreign exchange rates. More specific relationships canexist between credit references or equity stocks in the case of credit derivatives and equity basket derivatives, for example.Credit correlations are used to estimate the relationship between the credit performance of a range of credit names, and stockcorrelations are used to estimate the relationship between the returns of a range of equities. A derivative with a correlationexposure will be either long- or short-correlation. A high correlation suggests a strong relationship between the underlyingreferences is in force, and this will lead to an increase in value of a long-correlation derivative. Negative correlations suggestthat the relationship between underlying references is opposing, i.e., an increase in price of one underlying reference will leadto a reduction in the price of the other.
An EBITDA (‘earnings before interest, tax, depreciation and amortization’) multiple approach can be used in the valuation ofless liquid securities. Under this approach the enterprise value (‘EV’) of an entity can be estimated via identifying the ratio ofthe EV to EBITDA of a comparable observable entity and applying this ratio to the EBITDA of the entity for which a valuationis being estimated. Under this approach a liquidity adjustment is often applied due to the difference in liquidity between thegenerally listed comparable used and the company under valuation. A higher EV/EBITDA multiple will result in a higher fairvalue.
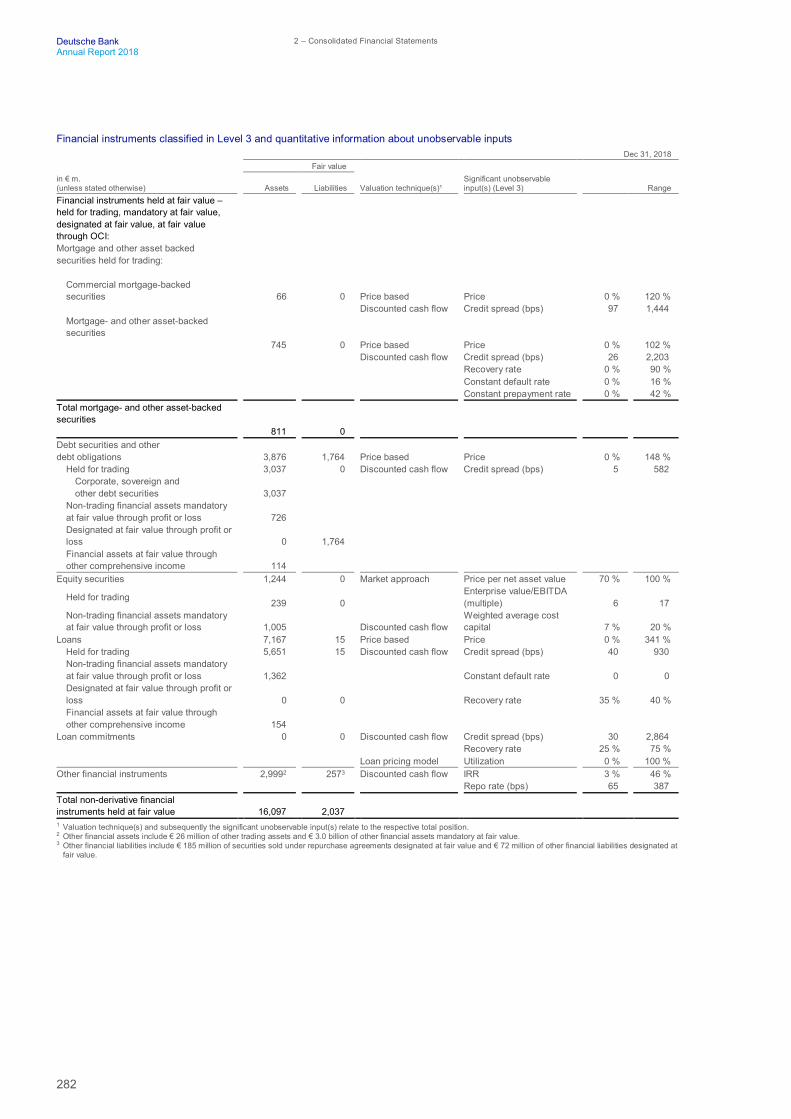
282
Deutsche Bank 2 – Consolidated Financial StatementsAnnual Report 2018
Financial instruments classified in Level 3 and quantitative information about unobservable inputsDec 31, 2018
Fair valuein € m.(unless stated otherwise) Assets Liabilities Valuation technique(s)¹
Significant unobservableinput(s) (Level 3) Range
Financial instruments held at fair value –held for trading, mandatory at fair value,designated at fair value, at fair valuethrough OCI:Mortgage and other asset backedsecurities held for trading:
Commercial mortgage-backedsecurities 66 0 Price based Price 0 % 120 %
Discounted cash flow Credit spread (bps) 97 1,444Mortgage- and other asset-backedsecurities
745 0 Price based Price 0 % 102 % Discounted cash flow Credit spread (bps) 26 2,203
Recovery rate 0 % 90 % Constant default rate 0 % 16 % Constant prepayment rate 0 % 42 %
Total mortgage- and other asset-backedsecurities
811 0Debt securities and otherdebt obligations 3,876 1,764 Price based Price 0 % 148 %
Held for trading 3,037 0 Discounted cash flow Credit spread (bps) 5 582Corporate, sovereign andother debt securities 3,037
Non-trading financial assets mandatoryat fair value through profit or loss 726Designated at fair value through profit orloss 0 1,764Financial assets at fair value throughother comprehensive income 114
Equity securities 1,244 0 Market approach Price per net asset value 70 % 100 %
Held for trading 239 0Enterprise value/EBITDA(multiple) 6 17
Non-trading financial assets mandatoryat fair value through profit or loss 1,005 Discounted cash flow
Weighted average costcapital 7 % 20 %
Loans 7,167 15 Price based Price 0 % 341 %Held for trading 5,651 15 Discounted cash flow Credit spread (bps) 40 930Non-trading financial assets mandatoryat fair value through profit or loss 1,362 Constant default rate 0 0Designated at fair value through profit orloss 0 0 Recovery rate 35 % 40 %Financial assets at fair value throughother comprehensive income 154
Loan commitments 0 0 Discounted cash flow Credit spread (bps) 30 2,864 Recovery rate 25 % 75 %
Loan pricing model Utilization 0 % 100 %Other financial instruments 2,9992 2573 Discounted cash flow IRR 3 % 46 %
Repo rate (bps) 65 387Total non-derivative financialinstruments held at fair value 16,097 2,0371 Valuation technique(s) and subsequently the significant unobservable input(s) relate to the respective total position.2 Other financial assets include € 26 million of other trading assets and € 3.0 billion of other financial assets mandatory at fair value.3 Other financial liabilities include € 185 million of securities sold under repurchase agreements designated at fair value and € 72 million of other financial liabilities designated at
fair value.

283
Deutsche Bank Notes to the Consolidated Balance SheetAnnual Report 2018 Financial Instruments carried at Fair Value
Dec 31, 2018Fair value
in € m.(unless stated otherwise) Assets Liabilities Valuation technique(s)
Significant unobservableinput(s) (Level 3) Range
Financial instruments held at fair value:Market values from derivativefinancial instruments:
Interest rate derivatives 4,264 2,568 Discounted cash flow Swap rate (bps) (124) 2,316 Inflation swap rate 1 % 6 % Constant default rate 0 % 35 % Constant prepayment rate 2 % 43 %
Option pricing model Inflation volatility 0 % 5 % Interest rate volatility 0 % 31 % IR - IR correlation (30) % 90 % Hybrid correlation (59) % 75 %
Credit derivatives 638 964 Discounted cash flow Credit spread (bps) 0 1,541 Recovery rate 0 % 80 %
Correlation pricingmodel Credit correlation 25 % 85 %
Equity derivatives 1,583 1,498 Option pricing model Stock volatility 4 % 96 % Index volatility 11 % 79 % Index - index correlation 1 1 Stock - stock correlation 2 % 89 % Stock Forwards 0 % 63 % Index Forwards 0 % 5 %
FX derivatives 1,034 1,005 Option pricing model Volatility (6) % 34 %Other derivatives 997 (357)1 Discounted cash flow Credit spread (bps) – –
Option pricing model Index volatility 5 % 92 % Commodity correlation 0 % 0 %
Total market values from derivativefinancial instruments 8,516 5,6771 Includes derivatives which are embedded in contracts where the host contract is held at amortized cost but for which the embedded derivative is separated.

284
Deutsche Bank 2 – Consolidated Financial StatementsAnnual Report 2018
Dec 31, 2017Fair value
in € m.(unless stated otherwise) Assets Liabilities Valuation technique(s)¹
Significant unobservableinput(s) (Level 3) Range
Financial instruments held at fair value –held for trading, designated at fair valueand available for sale:Mortgage and other asset backedsecurities held for trading:
Commercial mortgage-backedsecurities 79 0 Price based Price 0 % 102 %
Discounted cash flow Credit spread (bps) 136 2,217Mortgage- and other asset-backedsecurities 714 0 Price based Price 0 % 102 %
Discounted cash flow Credit spread (bps) 12 2,000 Recovery rate 0 % 90 % Constant default rate 0 % 25 % Constant prepayment rate 0 % 29 %
Total mortgage- and other asset-backedsecurities
793 0Debt securities and other debtobligations 3,870 1,307 Price based Price 0 % 176 %
Held for trading 3,559 2 Discounted cash flow Credit spread (bps) 34 500Corporate, sovereign and otherdebt securities 3,559
Designated at fair value through profit orloss 44 1,305
Available-for-sale 267Equity securities 913 0 Market approach Price per net asset value 60 % 100 %
Held for trading 282 0Enterprise value/EBITDA(multiple) 1 14
Designated at fair value through profit orloss 151 Discounted cash flow
Weighted average costcapital 8 % 20 %
Available-for-sale 480Loans 7,397 0 Price based Price 0 % 161 %
Held for trading 4,376 0 Discounted cash flow Credit spread (bps) 190 1,578Designated at fair value through profit orloss 338 0 Constant default rate – –Available-for-sale 2,684 Recovery rate 40 % 40 %
Loan commitments 0 8 Discounted cash flow Credit spread (bps) 5 261 Recovery rate 37 % 75 %
Loan pricing model Utilization 0 % 100 %Other financial instruments 1,7102 1313 Discounted cash flow IRR 1 % 24 %
Repo rate (bps) 224 254Total non-derivative financialinstruments held at fair value 14,683 1,4461 Valuation technique(s) and subsequently the significant unobservable input(s) relate to the respective total position.2 Other financial assets include € 34 million of other trading assets, € 956 million of other financial assets designated at fair value and € 674 million other financial assets
available for sale.3 Other financial liabilities include € 131 million of securities sold under repurchase agreements designated at fair value.
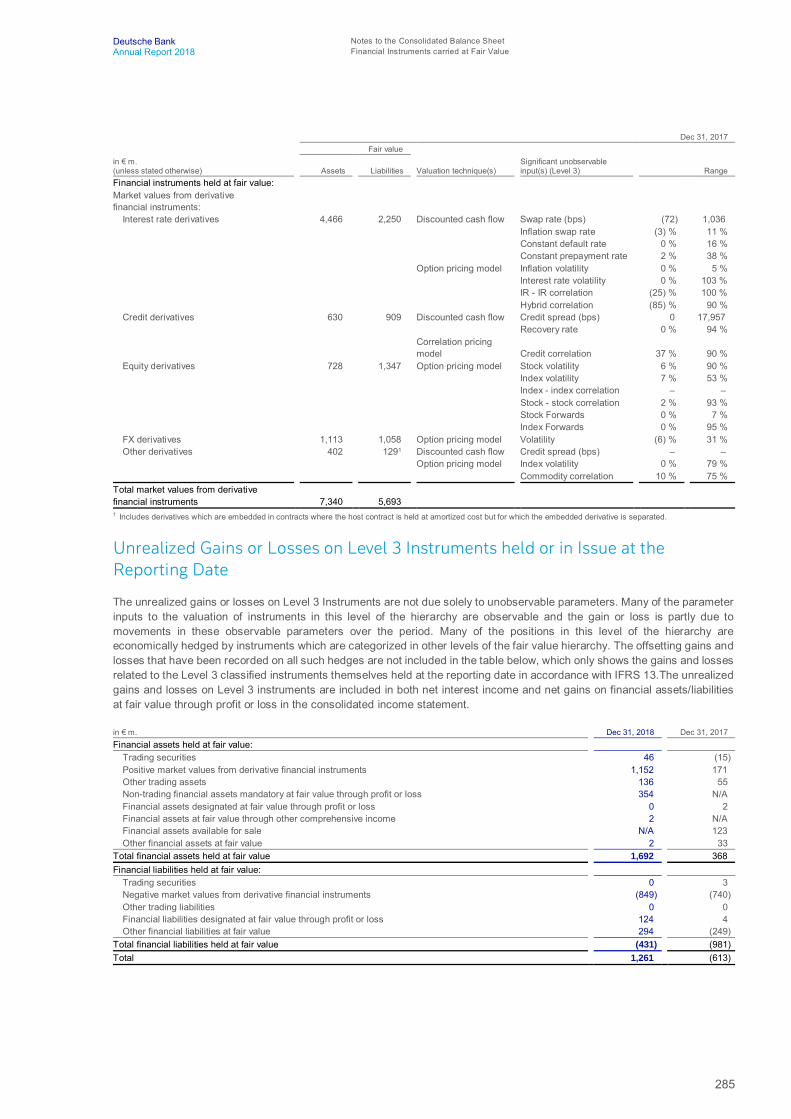
285
Deutsche Bank Notes to the Consolidated Balance SheetAnnual Report 2018 Financial Instruments carried at Fair Value
Dec 31, 2017Fair value
in € m.(unless stated otherwise) Assets Liabilities Valuation technique(s)
Significant unobservableinput(s) (Level 3) Range
Financial instruments held at fair value:Market values from derivativefinancial instruments:
Interest rate derivatives 4,466 2,250 Discounted cash flow Swap rate (bps) (72) 1,036 Inflation swap rate (3) % 11 % Constant default rate 0 % 16 % Constant prepayment rate 2 % 38 %
Option pricing model Inflation volatility 0 % 5 % Interest rate volatility 0 % 103 % IR - IR correlation (25) % 100 % Hybrid correlation (85) % 90 %
Credit derivatives 630 909 Discounted cash flow Credit spread (bps) 0 17,957 Recovery rate 0 % 94 %
Correlation pricingmodel Credit correlation 37 % 90 %
Equity derivatives 728 1,347 Option pricing model Stock volatility 6 % 90 % Index volatility 7 % 53 % Index - index correlation – – Stock - stock correlation 2 % 93 % Stock Forwards 0 % 7 % Index Forwards 0 % 95 %
FX derivatives 1,113 1,058 Option pricing model Volatility (6) % 31 %Other derivatives 402 1291 Discounted cash flow Credit spread (bps) – –
Option pricing model Index volatility 0 % 79 % Commodity correlation 10 % 75 %
Total market values from derivativefinancial instruments 7,340 5,6931 Includes derivatives which are embedded in contracts where the host contract is held at amortized cost but for which the embedded derivative is separated.
Unrealized Gains or Losses on Level 3 Instruments held or in Issue at theReporting Date
The unrealized gains or losses on Level 3 Instruments are not due solely to unobservable parameters. Many of the parameterinputs to the valuation of instruments in this level of the hierarchy are observable and the gain or loss is partly due tomovements in these observable parameters over the period. Many of the positions in this level of the hierarchy areeconomically hedged by instruments which are categorized in other levels of the fair value hierarchy. The offsetting gains andlosses that have been recorded on all such hedges are not included in the table below, which only shows the gains and lossesrelated to the Level 3 classified instruments themselves held at the reporting date in accordance with IFRS 13.The unrealizedgains and losses on Level 3 instruments are included in both net interest income and net gains on financial assets/liabilitiesat fair value through profit or loss in the consolidated income statement.
in € m. Dec 31, 2018 Dec 31, 2017Financial assets held at fair value:
Trading securities 46 (15)Positive market values from derivative financial instruments 1,152 171Other trading assets 136 55Non-trading financial assets mandatory at fair value through profit or loss 354 N/AFinancial assets designated at fair value through profit or loss 0 2Financial assets at fair value through other comprehensive income 2 N/AFinancial assets available for sale N/A 123Other financial assets at fair value 2 33
Total financial assets held at fair value 1,692 368Financial liabilities held at fair value:
Trading securities 0 3Negative market values from derivative financial instruments (849) (740)Other trading liabilities 0 0Financial liabilities designated at fair value through profit or loss 124 4Other financial liabilities at fair value 294 (249)
Total financial liabilities held at fair value (431) (981)Total 1,261 (613)
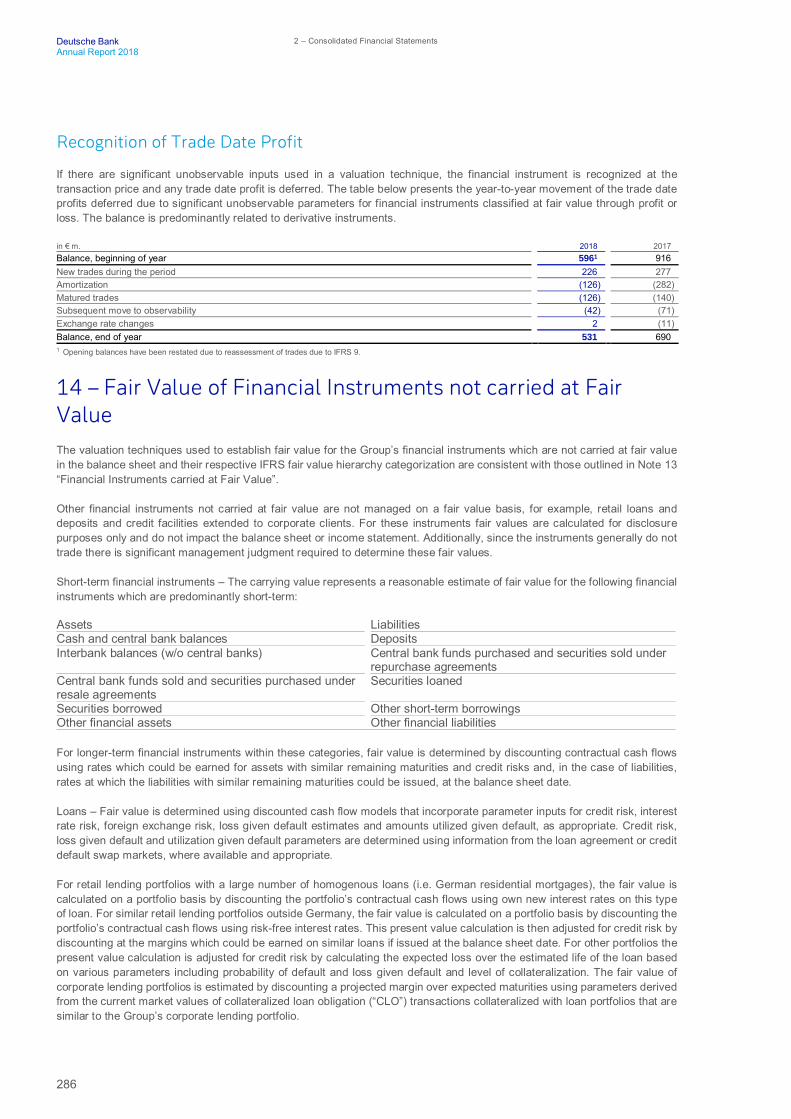
286
Deutsche Bank 2 – Consolidated Financial StatementsAnnual Report 2018
Recognition of Trade Date Profit
If there are significant unobservable inputs used in a valuation technique, the financial instrument is recognized at thetransaction price and any trade date profit is deferred. The table below presents the year-to-year movement of the trade dateprofits deferred due to significant unobservable parameters for financial instruments classified at fair value through profit orloss. The balance is predominantly related to derivative instruments.
in € m. 2018 2017Balance, beginning of year 5961 916New trades during the period 226 277Amortization (126) (282)Matured trades (126) (140)Subsequent move to observability (42) (71)Exchange rate changes 2 (11)Balance, end of year 531 6901 Opening balances have been restated due to reassessment of trades due to IFRS 9.
14 – Fair Value of Financial Instruments not carried at FairValueThe valuation techniques used to establish fair value for the Group’s financial instruments which are not carried at fair valuein the balance sheet and their respective IFRS fair value hierarchy categorization are consistent with those outlined in Note 13“Financial Instruments carried at Fair Value”.
Other financial instruments not carried at fair value are not managed on a fair value basis, for example, retail loans anddeposits and credit facilities extended to corporate clients. For these instruments fair values are calculated for disclosurepurposes only and do not impact the balance sheet or income statement. Additionally, since the instruments generally do nottrade there is significant management judgment required to determine these fair values.
Short-term financial instruments – The carrying value represents a reasonable estimate of fair value for the following financialinstruments which are predominantly short-term:
Assets LiabilitiesCash and central bank balances DepositsInterbank balances (w/o central banks) Central bank funds purchased and securities sold under
repurchase agreementsCentral bank funds sold and securities purchased underresale agreements
Securities loaned
Securities borrowed Other short-term borrowingsOther financial assets Other financial liabilities
For longer-term financial instruments within these categories, fair value is determined by discounting contractual cash flowsusing rates which could be earned for assets with similar remaining maturities and credit risks and, in the case of liabilities,rates at which the liabilities with similar remaining maturities could be issued, at the balance sheet date.
Loans – Fair value is determined using discounted cash flow models that incorporate parameter inputs for credit risk, interestrate risk, foreign exchange risk, loss given default estimates and amounts utilized given default, as appropriate. Credit risk,loss given default and utilization given default parameters are determined using information from the loan agreement or creditdefault swap markets, where available and appropriate.
For retail lending portfolios with a large number of homogenous loans (i.e. German residential mortgages), the fair value iscalculated on a portfolio basis by discounting the portfolio’s contractual cash flows using own new interest rates on this typeof loan. For similar retail lending portfolios outside Germany, the fair value is calculated on a portfolio basis by discounting theportfolio’s contractual cash flows using risk-free interest rates. This present value calculation is then adjusted for credit risk bydiscounting at the margins which could be earned on similar loans if issued at the balance sheet date. For other portfolios thepresent value calculation is adjusted for credit risk by calculating the expected loss over the estimated life of the loan basedon various parameters including probability of default and loss given default and level of collateralization. The fair value ofcorporate lending portfolios is estimated by discounting a projected margin over expected maturities using parameters derivedfrom the current market values of collateralized loan obligation (“CLO”) transactions collateralized with loan portfolios that aresimilar to the Group’s corporate lending portfolio.

287
Deutsche Bank Notes to the Consolidated Balance SheetAnnual Report 2018 Fair Value of Financial Instruments not carried at Fair Value
Securities purchased under resale agreements, securities borrowed, securities sold under repurchase agreements andsecurities loaned – Fair value is derived from valuation techniques by discounting future cash flows using the appropriatecredit risk-adjusted discount rate. The credit risk-adjusted discount rate includes consideration of the collateral received orpledged in the transaction. These products are typically short-term and highly collateralized, therefore the fair value is notsignificantly different to the carrying value.
Long-term debt and trust preferred securities – Fair value is determined from quoted market prices, where available. Wherequoted market prices are not available, fair value is estimated using a valuation technique that discounts the remainingcontractual cash at a rate at which an instrument with similar characteristics could be issued at the balance sheet date.
Estimated fair value of financial instruments not carried at fair value on the balance sheet1
Dec 31, 2018
in € m. Carrying value Fair value
Quotedprices in
active market(Level 1)
Valuationtechnique
observableparameters
(Level 2)
Valuationtechnique
unobservableparameters
(Level 3)Financial assets:Cash and central bank balances 188,731 188,731 188,731 0 0Interbank balances (w/o central banks) 8,881 8,881 78 8,804 0Central bank funds sold and securitiespurchased under resale agreements 8,222 8,223 0 8,223 0Securities borrowed 3,396 3,396 0 3,396 0Loans 400,297 395,900 0 10,870 385,029Securities held to maturity 0 0 0 0 0Other financial assets 80,089 80,193 850 79,343 1Financial liabilities:Deposits 564,405 564,637 516 563,850 272Central bank funds purchased and securitiessold under repurchase agreements 4,867 4,867 0 4,867 0Securities loaned 3,359 3,359 0 3,359 0Other short-term borrowings 14,158 14,159 0 14,159 0Other financial liabilities 100,683 100,683 1,816 98,866 1Long-term debt 152,083 149,128 0 140,961 8,167Trust preferred securities 3,168 3,114 0 3,114 0
Dec 31, 2017
in € m. Carrying value Fair value
Quotedprices in
active market(Level 1)
Valuationtechnique
observableparameters
(Level 2)
Valuationtechnique
unobservableparameters
(Level 3)Financial assets:Cash and central bank balances 225,655 225,655 225,655 0 0Interbank balances (w/o central banks) 9,265 9,265 76 9,189 0Central bank funds sold and securitiespurchased under resale agreements 9,971 9,973 0 9,973 0Securities borrowed 16,732 16,732 0 16,732 0Loans 401,699 403,842 0 24,643 379,199Securities held to maturity 3,170 3,238 3,238 0 0Other financial assets 88,936 88,939 0 88,939 0Financial liabilities:
580,812 580,945 2,108 578,837 (0)
18,105 18,103 0 18,103 06,688 6,688 0 6,688 0
18,411 18,412 0 18,412 0116,101 116,101 1,875 114,226 0159,715 161,829 0 152,838 8,991
DepositsCentral bank funds purchased and securities sold under repurchase agreements Securities loanedOther short-term borrowingsOther financial liabilities²Long-term debtTrust preferred securities 5,491 5,920 0 5,920 01 Amounts generally presented on a gross basis, in line with the Group’s accounting policy regarding offsetting of financial instruments as described in
Note 1 “Significant Accounting Policies and Critical Accounting Estimates”.2 Restatement undertaken represents pure reclass from Note 14 “Fair Value of Financial Instruments not carried at Fair Value” to Note 13 “Financial Instruments carried at Fair
Value”.
Loans – The difference between fair value and carrying value arose predominantly due to an increase in expected defaultrates and reduction in liquidity as implied from market pricing since initial recognition. These reductions in fair value are offsetby an increase in fair value due to interest rate movements on fixed rate instruments.
Long-term debt and trust preferred securities – The difference between fair value and carrying value is due to the effect ofchanges in the rates at which the Group could issue debt with similar maturity and subordination at the balance sheet datecompared to when the instrument was issued.

288
Deutsche Bank 2 – Consolidated Financial StatementsAnnual Report 2018
15 – Financial Assets Available for Salein € m. Dec 31, 2018 Dec 31, 2017Debt securities:
German government N/A 8,131U.S. Treasury and U.S. government agencies N/A 8,092U.S. local (municipal) governments N/A 2,436Other foreign governments N/A 19,275Corporates N/A 6,775Other asset-backed securities N/A 1Mortgage-backed securities, including obligations of U.S. federal agencies N/A 11Other debt securities N/A 359
Total debt securities N/A 45,081Equity securities:
Equity shares N/A 897Investment certificates and mutual funds N/A 97
Total equity securities N/A 994Other equity interests N/A 636Loans N/A 2,685Total financial assets available for sale N/A 49,397
Please also refer to Note 7 “Net Gains (Losses) on Financial Assets Available for Sale” of this report.
16 – Financial assets at fair value through other comprehensiveincomein € m. Dec 31, 2018 Dec 31, 2017Securities purchased under resale agreement 1,097 N/ADebt securities:
German government 7,705 N/AU.S. Treasury and U.S. government agencies 13,118 N/AU.S. local (municipal) governments 101 N/AOther foreign governments 18,152 N/ACorporates 5,606 N/AOther asset-backed securities 27 N/AMortgage-backed securities, including obligations of U.S. federal agencies 103 N/AOther debt securities 181 N/A
Total debt securities 44,993 N/ALoans 5,092 N/ATotal financial assets at fair value through other comprehensive income 51,182 N/A
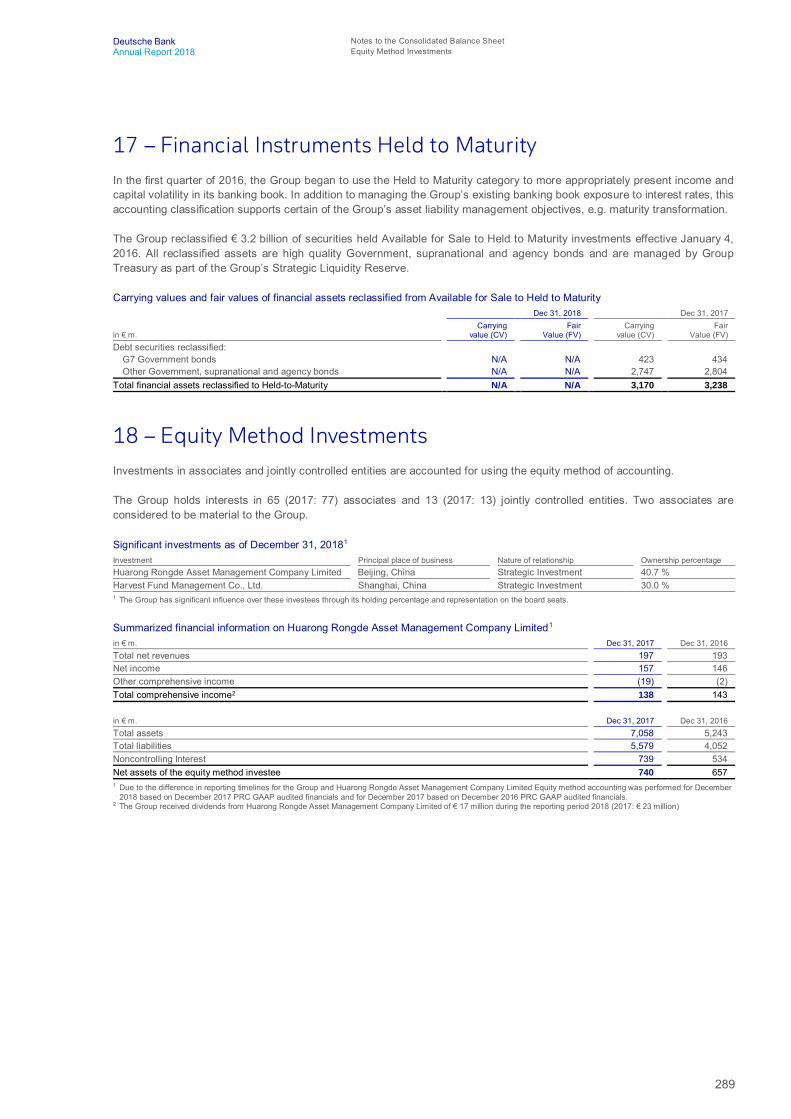
289
Deutsche Bank Notes to the Consolidated Balance SheetAnnual Report 2018 Equity Method Investments
17 – Financial Instruments Held to MaturityIn the first quarter of 2016, the Group began to use the Held to Maturity category to more appropriately present income andcapital volatility in its banking book. In addition to managing the Group’s existing banking book exposure to interest rates, thisaccounting classification supports certain of the Group’s asset liability management objectives, e.g. maturity transformation.
The Group reclassified € 3.2 billion of securities held Available for Sale to Held to Maturity investments effective January 4,2016. All reclassified assets are high quality Government, supranational and agency bonds and are managed by GroupTreasury as part of the Group’s Strategic Liquidity Reserve.
Carrying values and fair values of financial assets reclassified from Available for Sale to Held to MaturityDec 31, 2018 Dec 31, 2017
in € m.Carrying
value (CV)Fair
Value (FV)Carrying
value (CV)Fair
Value (FV)Debt securities reclassified:
G7 Government bonds N/A N/A 423 434Other Government, supranational and agency bonds N/A N/A 2,747 2,804
Total financial assets reclassified to Held-to-Maturity N/A N/A 3,170 3,238
18 – Equity Method InvestmentsInvestments in associates and jointly controlled entities are accounted for using the equity method of accounting.
The Group holds interests in 65 (2017: 77) associates and 13 (2017: 13) jointly controlled entities. Two associates areconsidered to be material to the Group.
Significant investments as of December 31, 20181
Investment Principal place of business Nature of relationship Ownership percentageHuarong Rongde Asset Management Company Limited Beijing, China Strategic Investment 40.7 %Harvest Fund Management Co., Ltd. Shanghai, China Strategic Investment 30.0 %1 The Group has significant influence over these investees through its holding percentage and representation on the board seats.
Summarized financial information on Huarong Rongde Asset Management Company Limited1
in € m. Dec 31, 2017 Dec 31, 2016Total net revenues 197 193Net income 157 146Other comprehensive income (19) (2)Total comprehensive income2 138 143
in € m. Dec 31, 2017 Dec 31, 2016Total assets 7,058 5,243Total liabilities 5,579 4,052Noncontrolling Interest 739 534Net assets of the equity method investee 740 6571 Due to the difference in reporting timelines for the Group and Huarong Rongde Asset Management Company Limited Equity method accounting was performed for December
2018 based on December 2017 PRC GAAP audited financials and for December 2017 based on December 2016 PRC GAAP audited financials.2 The Group received dividends from Huarong Rongde Asset Management Company Limited of € 17 million during the reporting period 2018 (2017: € 23 million)

290
Deutsche Bank 2 – Consolidated Financial StatementsAnnual Report 2018
Reconciliation of total net assets of Huarong Rongde Asset Management Company Limited to the Group’s carrying amount 1
in € m. Dec 31, 2017 Dec 31, 2016Net assets of the equity method investee 740 657Group's ownership percentage on the investee's equity 40.7 % 40.7 %Group's share of net assets 301 268Goodwill 0 0Intangible Assets 0 0Other adjustments (17) (22)Carrying amount2 284 2461 Due to the difference in reporting timelines for the Group and Huarong Rongde Asset Management Company Limited Equity method accounting was performed for December
2018 based on December 2017 PRC GAAP audited financials and for December 2017 based on December 2016 PRC GAAP audited financials.2 There is no impairment loss in 2018 and 2017
Summarized financial information on Harvest Fund Management Co., Ltd.in € m. Dec 31, 20181 Dec 31, 20172
Total net revenues 597 537Net income 162 152Other comprehensive income 1 (1)Total comprehensive income3 163 150
in € m. Dec 31, 2018 Dec 31, 2017Total assets 1,123 1,448Total liabilities 398 853Noncontrolling Interest 45 24Net assets of the equity method investee 681 5711 December 2018 numbers are based on 2018 unaudited financials2 December 2017 numbers are based on 2017 audited financials3 The Group received dividends from Harvest Fund Management Co., Ltd. of € 12 million during the reporting period 2018 (2017: € 7 million)
Reconciliation of total net assets of Harvest Fund Management Co., Ltd. to the Group’s carrying amountin € m. Dec 31, 20181 Dec 31, 20172
Net assets of the equity method investee 681 571Group's ownership percentage on the investee's equity 30 % 30 %Group's share of net assets 204 171Goodwill 17 16Intangible Assets 14 14Other adjustments 1 4Carrying amount3 236 2051 December 2018 numbers are based on 2018 unaudited financials2 December 2017 numbers are based on 2017 audited financials3 There is no impairment loss in 2018 (€ 1 million in 2017)
Aggregated financial information on the Group’s share in associates and joint ventures that are individually immaterialin € m. Dec 31, 2018 Dec 31, 2017Carrying amount of all associates that are individually immaterial to the Group 359 415Aggregated amount of the Group's share of profit (loss) from continuing operations 30 35Aggregated amount of the Group's share of post-tax profit (loss) from discontinued operations 0 0Aggregated amount of the Group's share of other comprehensive income (8) (33)Aggregated amount of the Group's share of total comprehensive income 22 2

291
Deutsche Bank Notes to the Consolidated Balance SheetAnnual Report 2018 Offsetting Financial Assets and Financial Liabilities
19 – Offsetting Financial Assets and Financial LiabilitiesThe Group is eligible to present certain financial assets and financial liabilities on a net basis on the balance sheet pursuantto criteria described in Note 1 “Significant Accounting Policies and Critical Accounting Estimates: Offsetting FinancialInstruments”.
The following tables provide information on the impact of offsetting on the consolidated balance sheet, as well as the financialimpact of netting for instruments subject to an enforceable master netting arrangement or similar agreement as well asavailable cash and financial instrument collateral.
AssetsDec 31, 2018
Netamounts
of financialassets
presentedon the
balancesheet
Amounts not set off on the balance sheet
in € m.
Grossamounts
of financialassets
Grossamounts
set offon the
balancesheet
Impact ofMasterNetting
AgreementsCash
collateral
Financialinstrumentcollateral¹ Net amount
Central bank funds sold and securities purchasedunder resale agreements (enforceable) 8,194 (2,629) 5,565 0 0 (5,565) 0Central bank funds sold and securities purchasedunder resale agreements (non-enforceable) 2,656 0 2,656 0 0 (2,169) 488Securities borrowed (enforceable) 3,157 0 3,157 0 0 (3,055) 102Securities borrowed (non-enforceable) 239 0 239 0 0 (239) 0Financial assets at fair value through profit or loss(enforceable) 435,306 (73,286) 362,020 (250,476) (39,006) (63,733) 8,805
Of which: Positive market values from derivativefinancial instruments (enforceable) 324,348 (19,269) 305,080 (250,231) (38,731) (6,682) 9,436
Financial assets at fair value through profit or loss(non-enforceable) 211,323 0 211,323 0 (1,858) (12,013) 197,452
Of which: Positive market values from derivativefinancial instruments (non-enforceable) 14,978 0 14,978 0 (1,858) (1,277) 11,843
Total financial assets at fair value through profitor loss 646,629 (73,286) 573,344 (250,476) (40,864) (75,746) 206,257Loans at amortized cost 400,297 0 400,297 0 (13,505) (39,048) 347,743Other assets 107,633 (14,189) 93,444 (29,073) (522) (92) 63,757
Of which: Positive market values from derivativesqualifying for hedge accounting (enforceable) 3,451 (423) 3,028 (2,347) (520) (92) 69
Remaining assets subject to netting 1,097 0 1,097 0 0 (621) 475Remaining assets not subject to netting 268,338 0 268,338 0 (227) (1,540) 266,571Total assets 1,438,241 (90,104) 1,348,137 (279,550) (55,118) (128,075) 885,3941 Excludes real estate and other non-financial instrument collateral.

292
Deutsche Bank 2 – Consolidated Financial StatementsAnnual Report 2018
LiabilitiesDec 31, 2018
Netamounts
of financialliabilities
presentedon the
balancesheet
Amounts not set off on the balance sheet
in €
Grossamounts
of financialliabilities
Grossamounts
set offon the
balancesheet
Impact ofMasterNetting
AgreementsCash
collateral
Financialinstrument
collateral Net amountDeposits 564,405 0 564,405 0 0 0 564,405Central bank funds purchased and securities soldunder repurchase agreements (enforceable) 7,145 (3,677) 3,468 0 0 (3,468) 0Central bank funds purchased and securities soldunder repurchase agreements (non-enforceable) 1,399 0 1,399 0 0 (1,140) 259Securities loaned (enforceable) 3,164 0 3,164 0 0 (3,164) 0Securities loaned (non-enforceable) 195 0 195 0 0 (164) 31Financial liabilities at fair value through profit or loss(enforceable) 399,625 (71,469) 328,156 (251,495) (25,232) (40,935) 10,493
Of which: Negative market values from derivativefinancial instruments (enforceable) 309,401 (18,978) 290,423 (250,908) (25,232) (4,805) 9,478
Financial liabilities at fair value through profit or loss(non-enforceable) 87,524 0 87,524 0 (2,301) (11,268) 73,955
Of which: Negative market values from derivativefinancial instruments (non-enforceable) 11,064 0 11,064 0 (1,494) (573) 8,996
Total financial liabilities at fair value through profitor loss 487,149 (71,469) 415,680 (251,495) (27,533) (52,204) 84,448Other liabilities 132,470 (14,957) 117,513 (42,260) (73) (158) 75,022
Of which: Negative market values from derivativesqualifying for hedge accounting (enforceable) 2,537 (615) 1,922 (1,670) (71) (158) 23
Remaining liabilities not subject to netting 173,577 0 173,577 0 0 0 173,577Total liabilities 1,369,503 (90,104) 1,279,400 (293,755) (27,606) (60,297) 897,742
AssetsDec 31, 2017
Netamounts
of financialassets
presentedon the
balancesheet
Amounts not set off on the balance sheet
in € m.
Grossamounts
of financialassets
Grossamounts
set offon the
balancesheet
Impact ofMasterNetting
AgreementsCash
collateral
Financialinstrumentcollateral¹ Net amount
Central bank funds sold and securities purchasedunder resale agreements (enforceable) 8,136 (455) 7,681 0 0 (7,675) 7Central bank funds sold and securities purchasedunder resale agreements (non-enforceable) 2,290 0 2,290 0 0 (2,239) 51Securities borrowed (enforceable) 14,987 0 14,987 0 0 (14,093) 894Securities borrowed (non-enforceable) 1,744 0 1,744 0 0 (1,661) 83Financial assets at fair value through profit or loss
Trading assets 185,127 (465) 184,661 0 (81) (86) 184,495Positive market values from derivative financialinstruments (enforceable) 363,859 (18,237) 345,622 (285,421) (41,842) (7,868) 10,490Positive market values from derivative financialinstruments (non-enforceable) 15,410 0 15,410 0 (1,811) (1,276) 12,323Financial assets designated at fair value throughprofit or loss (enforceable) 125,869 (64,003) 61,865 (728) (773) (56,410) 3,954Financial assets designated at fair value throughprofit or loss (non-enforceable) 29,411 0 29,411 0 0 (20,534) 8,876
Total financial assets at fair value through profitor loss 719,676 (82,706) 636,970 (286,149) (44,508) (86,174) 220,138Loans 401,699 0 401,699 0 (12,642) (40,775) 348,282Other assets 112,023 (10,531) 101,491 (29,854) (569) (94) 70,975
of which: Positive market values from derivativesqualifying for hedge accounting (enforceable) 3,859 (706) 3,153 (2,461) (565) (94) 33
Remaining assets not subject to netting 307,869 0 307,869 0 (390) (70) 307,409Total assets 1,568,425 (93,692) 1,474,732 (316,003) (58,109) (152,782) 947,8391 Excludes real estate and other non-financial instrument collateral.

293
Deutsche Bank Notes to the Consolidated Balance SheetAnnual Report 2018 Offsetting Financial Assets and Financial Liabilities
LiabilitiesDec 31, 2017
Netamounts
of financialliabilities
presentedon the
balancesheet
Amounts not set off on the balance sheet
in €
Grossamounts
of financialliabilities
Grossamounts
set offon the
balancesheet
Impact ofMasterNetting
AgreementsCash
collateral
Financialinstrument
collateral Net amountDeposits 581,873 0 581,873 0 0 0 581,873Central bank funds purchased and securities soldunder repurchase agreements (enforceable) 13,318 (455) 12,863 0 0 (12,863) 0Central bank funds purchased and securities soldunder repurchase agreements (non-enforceable) 5,242 0 5,242 0 0 (4,985) 257Securities loaned (enforceable) 6,688 0 6,688 0 0 (6,688) 0Securities loaned (non-enforceable) 0 0 0 0 0 0 0Financial liabilities at fair value through profit or lossTrading liabilities 72,106 (643) 71,462 0 0 0 71,462
Negative market values from derivative financialinstruments (enforceable) 347,496 (17,928) 329,568 (286,720) (25,480) (6,124) 11,244Negative market values from derivative financialinstruments (non-enforceable) 13,158 0 13,158 0 (1,913) (615) 10,630Financial liabilities designated at fair value throughprofit or loss (enforceable) 104,594 (63,360) 41,234 (728) 0 (40,506) 0Financial liabilities designated at fair value throughprofit or loss (non-enforceable) 23,214 0 23,214 0 1,111 (13,646) 10,679
Total financial liabilities at fair value through profitor loss 560,568 (81,932) 478,636 (287,448) (26,282) (60,891) 104,015Other liabilities 143,514 (11,306) 132,208 (44,815) (31) (87) 87,275
of which: Negative market values from derivativesqualifying for hedge accounting (enforceable) 1,841 (547) 1,294 (1,162) (31) (87) 15
Remaining liabilities not subject to netting 189,122 0 189,122 0 0 0 189,122Total liabilities 1,500,326 (93,692) 1,406,633 (332,263) (26,314) (85,514) 962,542
The column ‘Gross amounts set off on the balance sheet’ discloses the amounts offset in accordance with all the criteriadescribed in Note 1 “Significant Accounting Policies and Critical Accounting Estimates: Offsetting Financial Instruments”.
The column ‘Impact of Master Netting Agreements’ discloses the amounts that are subject to master netting agreements butwere not offset because they did not meet the net settlement/simultaneous settlement criteria; or because the rights of set offare conditional upon the default of the counterparty only. The amounts presented for other assets and other liabilities includecash margin receivables and payables respectively.
The columns ‘Cash collateral’ and ‘Financial instrument collateral’ disclose the cash and financial instrument collateralamounts received or pledged in relation to the total amounts of assets and liabilities, including those that were not offset.
Non-enforceable master netting agreements or similar agreements refer to contracts executed in jurisdictions where the rightsof set off may not be upheld under the local bankruptcy laws.
The cash collateral received against the positive market values of derivatives and the cash collateral pledged towards thenegative mark-to-market values of derivatives are booked within the ‘Other liabilities’ and ‘Other assets’ balances respectively.
The Cash and Financial instrument collateral amounts disclosed reflect their fair values. The rights of set off relating to thecash and financial instrument collateral are conditional upon the default of the counterparty.
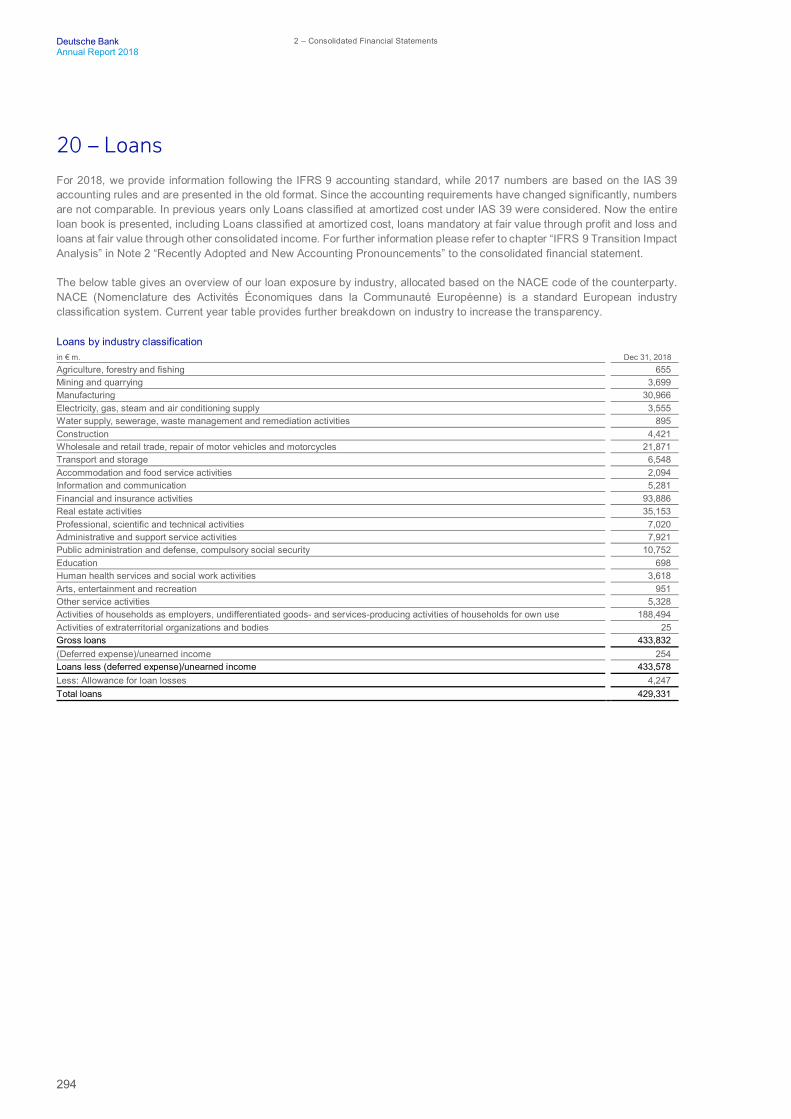
294
Deutsche Bank 2 – Consolidated Financial StatementsAnnual Report 2018
20 – LoansFor 2018, we provide information following the IFRS 9 accounting standard, while 2017 numbers are based on the IAS 39accounting rules and are presented in the old format. Since the accounting requirements have changed significantly, numbersare not comparable. In previous years only Loans classified at amortized cost under IAS 39 were considered. Now the entireloan book is presented, including Loans classified at amortized cost, loans mandatory at fair value through profit and loss andloans at fair value through other consolidated income. For further information please refer to chapter “IFRS 9 Transition ImpactAnalysis” in Note 2 “Recently Adopted and New Accounting Pronouncements” to the consolidated financial statement.
The below table gives an overview of our loan exposure by industry, allocated based on the NACE code of the counterparty.NACE (Nomenclature des Activités Économiques dans la Communauté Européenne) is a standard European industryclassification system. Current year table provides further breakdown on industry to increase the transparency.
Loans by industry classificationin € m. Dec 31, 2018Agriculture, forestry and fishing 655Mining and quarrying 3,699Manufacturing 30,966Electricity, gas, steam and air conditioning supply 3,555Water supply, sewerage, waste management and remediation activities 895Construction 4,421Wholesale and retail trade, repair of motor vehicles and motorcycles 21,871Transport and storage 6,548Accommodation and food service activities 2,094Information and communication 5,281Financial and insurance activities 93,886Real estate activities 35,153Professional, scientific and technical activities 7,020Administrative and support service activities 7,921Public administration and defense, compulsory social security 10,752Education 698Human health services and social work activities 3,618Arts, entertainment and recreation 951Other service activities 5,328Activities of households as employers, undifferentiated goods- and services-producing activities of households for own use 188,494Activities of extraterritorial organizations and bodies 25Gross loans 433,832(Deferred expense)/unearned income 254Loans less (deferred expense)/unearned income 433,578Less: Allowance for loan losses 4,247Total loans 429,331

295
Deutsche Bank Notes to the Consolidated Balance SheetAnnual Report 2018 Allowance for Credit Losses
in € m. Dec 31, 2017Financial intermediation 52,204Manufacturing 27,478
of which:Basic metals and fabricated metal products 4,211Electrical and optical equipment 3,386Transport equipment 3,374Chemicals and chemical products 3,623Machinery and equipment 3,191Food products 2,907
Households (excluding mortgages) 36,524Households – mortgages 150,205Public sector 13,711Wholesale and retail trade 19,252Commercial real estate activities 29,247Lease financing 384Fund management activities 18,708Other 58,167
of which:Renting of machinery and other business activities 26,559Transport, storage and communication 9,243Mining and quarrying of energy-producing materials 2,553Electricity, gas and water supply 3,552
Gross loans 405,879(Deferred expense)/unearned income 259Loans less (deferred expense)/unearned income 405,621Less: Allowance for loan losses 3,921Total loans 401,699
21 – Allowance for Credit LossesThe allowance for credit losses consists of an allowance for loan losses and an allowance for off-balance sheet positions.
Development of allowance for credit losses for financial assets at amortized costDec 31, 2018
Allowance for Credit Losses3
in € m. Stage 1 Stage 2 Stage 3 Stage 3 POCI TotalBalance, beginning of year 462 494 3,638 3 4,596Movements in financial assets including new business (132) 215 440 (17) 507Transfers due to changes in creditworthiness 199 (137) (62) N/M 0Changes due to modifications that did not result inderecognition N/M N/M N/M N/M N/MChanges in models 0 0 0 0 0Financial assets that have been derecognized during theperiod² (6) (17) (972) 0 (995)Recovery of written off amounts 0 0 172 0 172Foreign exchange and other changes (14) (54) 30 17 (21)Balance, end of reporting period 509 501 3,247 3 4,259Provision for Credit Losses excluding country risk1 66 78 379 (17) 5071 Movements in financial assets including new business, transfers due to changes in creditworthiness and changes in models add up to Provision for Credit Losses excluding
country risk.2 This position includes charge offs of allowance for credit losses.3 Allowance for credit losses does not include allowance for country risk amounting to € 6 million as of December 31, 2018.
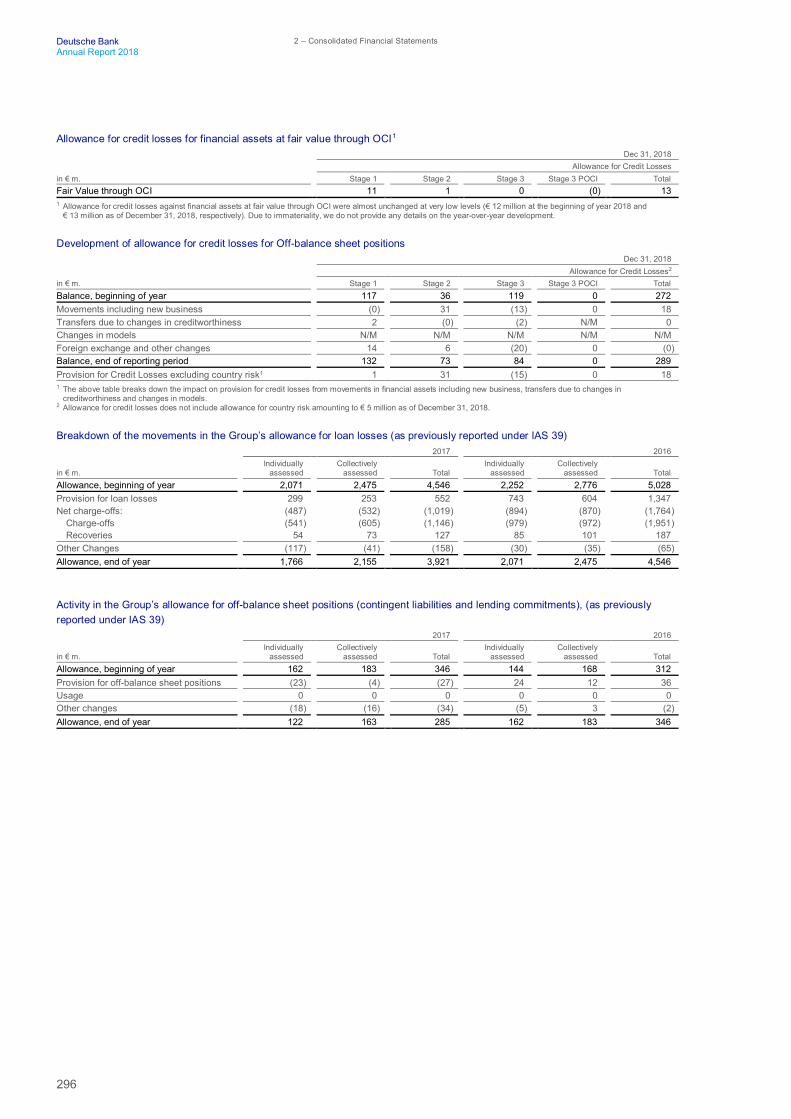
296
Deutsche Bank 2 – Consolidated Financial StatementsAnnual Report 2018
Allowance for credit losses for financial assets at fair value through OCI1
Dec 31, 2018Allowance for Credit Losses
in € m. Stage 1 Stage 2 Stage 3 Stage 3 POCI TotalFair Value through OCI 11 1 0 (0) 131 Allowance for credit losses against financial assets at fair value through OCI were almost unchanged at very low levels (€ 12 million at the beginning of year 2018 and
€ 13 million as of December 31, 2018, respectively). Due to immateriality, we do not provide any details on the year-over-year development.
Development of allowance for credit losses for Off-balance sheet positionsDec 31, 2018
Allowance for Credit Losses2
in € m. Stage 1 Stage 2 Stage 3 Stage 3 POCI TotalBalance, beginning of year 117 36 119 0 272Movements including new business (0) 31 (13) 0 18Transfers due to changes in creditworthiness 2 (0) (2) N/M 0Changes in models N/M N/M N/M N/M N/MForeign exchange and other changes 14 6 (20) 0 (0)Balance, end of reporting period 132 73 84 0 289Provision for Credit Losses excluding country risk1 1 31 (15) 0 181 The above table breaks down the impact on provision for credit losses from movements in financial assets including new business, transfers due to changes in
creditworthiness and changes in models.2 Allowance for credit losses does not include allowance for country risk amounting to € 5 million as of December 31, 2018.
Breakdown of the movements in the Group’s allowance for loan losses (as previously reported under IAS 39)2017 2016
in € m.Individually
assessedCollectively
assessed TotalIndividually
assessedCollectively
assessed TotalAllowance, beginning of year 2,071 2,475 4,546 2,252 2,776 5,028Provision for loan losses 299 253 552 743 604 1,347Net charge-offs: (487) (532) (1,019) (894) (870) (1,764)
Charge-offs (541) (605) (1,146) (979) (972) (1,951)Recoveries 54 73 127 85 101 187
Other Changes (117) (41) (158) (30) (35) (65)Allowance, end of year 1,766 2,155 3,921 2,071 2,475 4,546
Activity in the Group’s allowance for off-balance sheet positions (contingent liabilities and lending commitments), (as previouslyreported under IAS 39)
2017 2016
in € m.Individually
assessedCollectively
assessed TotalIndividually
assessedCollectively
assessed TotalAllowance, beginning of year 162 183 346 144 168 312Provision for off-balance sheet positions (23) (4) (27) 24 12 36Usage 0 0 0 0 0 0Other changes (18) (16) (34) (5) 3 (2)Allowance, end of year 122 163 285 162 183 346

297
Deutsche Bank Notes to the Consolidated Balance SheetAnnual Report 2018 Transfer of Financial Assets, Assets Pledged and Received as Collateral
22 – Transfer of Financial Assets, Assets Pledged and Receivedas CollateralThe Group enters into transactions in which it transfers financial assets held on the balance sheet and as a result may eitherbe eligible to derecognize the transferred asset in its entirety or must continue to recognize the transferred asset to the extentof any continuing involvement, depending on certain criteria. These criteria are discussed in Note 1 “Significant AccountingPolicies and Critical Accounting Estimates”.
Where financial assets are not eligible to be derecognized, the transfers are viewed as secured financing transactions, withany consideration received resulting in a corresponding liability. The Group is not entitled to use these financial assets for anyother purposes. The most common transactions of this nature entered into by the Group are repurchase agreements, securitieslending agreements and total return swaps, in which the Group retains substantially all of the associated credit, equity price,interest rate and foreign exchange risks and rewards associated with the assets as well as the associated income streams.
Information on asset types and associated transactions that did not qualify for derecognitionin € m. Dec 31, 2018 Dec 31, 2017¹Carrying amount of transferred assetsTrading securities not derecognized due to the following transactions:
Repurchase agreements 33,980 43,025Securities lending agreements 41,621 58,076Total return swaps 1,835 2,390Other 6,589 12,661
Total trading securities 84,025 116,153Other trading assets 69 71Non-trading financial assets mandatory at fair value through profit or loss 1,289 N/AFinancial assets available for sale N/A 711Financial assets at fair value through other comprehensive income 4,286 N/ALoans at amortized cost2 408 131Total 90,076 117,066Carrying amount of associated liabilities 46,218 51,9371 Prior year numbers have been restated following reassessments of certain repurchase transactions.2 Loans where the associated liability is recourse only to the transferred assets had a carrying value and fair value of € 0 million at December 31, 2018 and € 108 million at
December 31, 2017. The associated liabilities had the same carrying value and fair value which resulted in a net position of 0.
Carrying value of assets transferred in which the Group still accounts for the asset to the extent of its continuing involvementin € m. Dec 31, 2018 Dec 31, 2017Carrying amount of the original assets transferred
Trading securities 759 0Financial assets designated at fair value through profit or loss 306 291Non-trading financial assets mandatory at fair value through profit or loss 386 N/AFinancial assets available for sale N/A 386
Carrying amount of the assets continued to be recognizedTrading securities 35 0Financial assets designated at fair value through profit or loss 15 15Non-trading financial assets mandatory at fair value through profit or loss 43 N/AFinancial assets available for sale N/A 96
Carrying amount of associated liabilities 117 54
The Group could retain some exposure to the future performance of a transferred asset either through new or existingcontractual rights and obligations and still be eligible to derecognize the asset. This ongoing involvement will be recognizedas a new instrument which may be different from the original financial asset that was transferred. Typical transactions includeretaining senior notes of non-consolidated securitizations to which originated loans have been transferred; financingarrangements with structured entities to which the Group has sold a portfolio of assets; or sales of assets with credit-contingentswaps. The Group’s exposure to such transactions is not considered to be significant as any substantial retention of risksassociated with the transferred asset will commonly result in an initial failure to derecognize. Transactions not considered toresult in an ongoing involvement include normal warranties on fraudulent activities that could invalidate a transfer in the eventof legal action, qualifying pass-through arrangements and standard trustee or administrative fees that are not linked toperformance.

298
Deutsche Bank 2 – Consolidated Financial StatementsAnnual Report 2018
The impact on the Group’s Balance Sheet of on-going involvement associated with transferred assets derecognized in fullDec 31,2018 Dec 31,2017
in € m.Carrying
value Fair value
MaximumExposure
to Loss¹Carrying
value Fair value
MaximumExposure
to Loss¹Loans at amortized cost
Securitization notes 372 372 372 270 270 270Other 14 14 14 13 13 13
Total Loans at amortized cost 385 385 385 284 284 284Financial assets held at Fair Value through the P&L
Securitization notes 22 22 22 0 0 0Non-standard Interest Rate, cross-currency or inflation-linked swap 5 5 5 36 36 36
Total Financial assets held at Fair Value through the P&L 27 27 27 36 36 36Financial assets at fair value through other comprehensive income:
Securitization notes 112 112 112 0 0 0Other 0 0 0 0 0 0
Total Financial assets at fair value through other comprehensive income 112 112 112 0 0 0Total financial assets representing on-going involvement 524 524 524 320 320 320Financial liabilities held at Fair Value through P&L
Non-standard Interest Rate, cross-currency or inflation-linked swap 61 61 0 67 67 0Total financial liabilities representing on-going involvement 61 61 0 67 67 01 The maximum exposure to loss is defined as the carrying value plus the notional value of any undrawn loan commitments not recognized as liabilities.
The impact on the Group’s Statement of Income of on-going involvement associated with transferred assets derecognized in fullDec 31,2018 Dec 31,2017
in € m.Year-to-
date P&LCumulative
P&LGain/(loss)on disposal
Year-to-date P&L
CumulativeP&L
Gain/(loss)on disposal
Securitization notes 9 13 11 3 3 791
Non-standard Interest Rate, cross-currency orinflation-linked swap 21 268 0 46 510 0Net gains/(losses) recognized from on-goinginvolvement in derecognized assets 30 281 11 49 513 791 Typically, sales of assets into securitization vehicles were of assets that were classified as Fair Value through P&L, therefore any gain or loss on disposal is immaterial.
The Group pledges assets primarily as collateral against secured funding and for repurchase agreements, securities borrowingagreements as well as other borrowing arrangements and for margining purposes on OTC derivative liabilities. Pledges aregenerally conducted under terms that are usual and customary for standard securitized borrowing contracts and othertransactions described.
Carrying value of the Group’s assets pledged as collateral for liabilities or contingent liabilities1
in € m. Dec 31, 2018 Dec 31, 2017²Financial assets at fair value through profit or loss 41,816 54,134Financial assets at fair value through other comprehensive income 4,274 N/AFinancial assets available for sale N/A 6,469Loans 75,641 71,404Other 1,364 417Total 123,095 132,4231 Excludes assets pledged as collateral from transactions that do not result in liabilities or contingent liabilities.2 Prior period results have been restated.
Total assets pledged to creditors available for sale or repledge1
in € m. Dec 31, 2018 Dec 31, 2017²Financial assets at fair value through profit or loss 45,640 71,278Financial assets at fair value through other comprehensive income 3,201 N/AFinancial assets available for sale N/A 0Loans 11 0Total 48,851 71,2781 Includes assets pledged as collateral from transactions that do not result in liabilities or contingent liabilities.2 Prior period results have been restated.
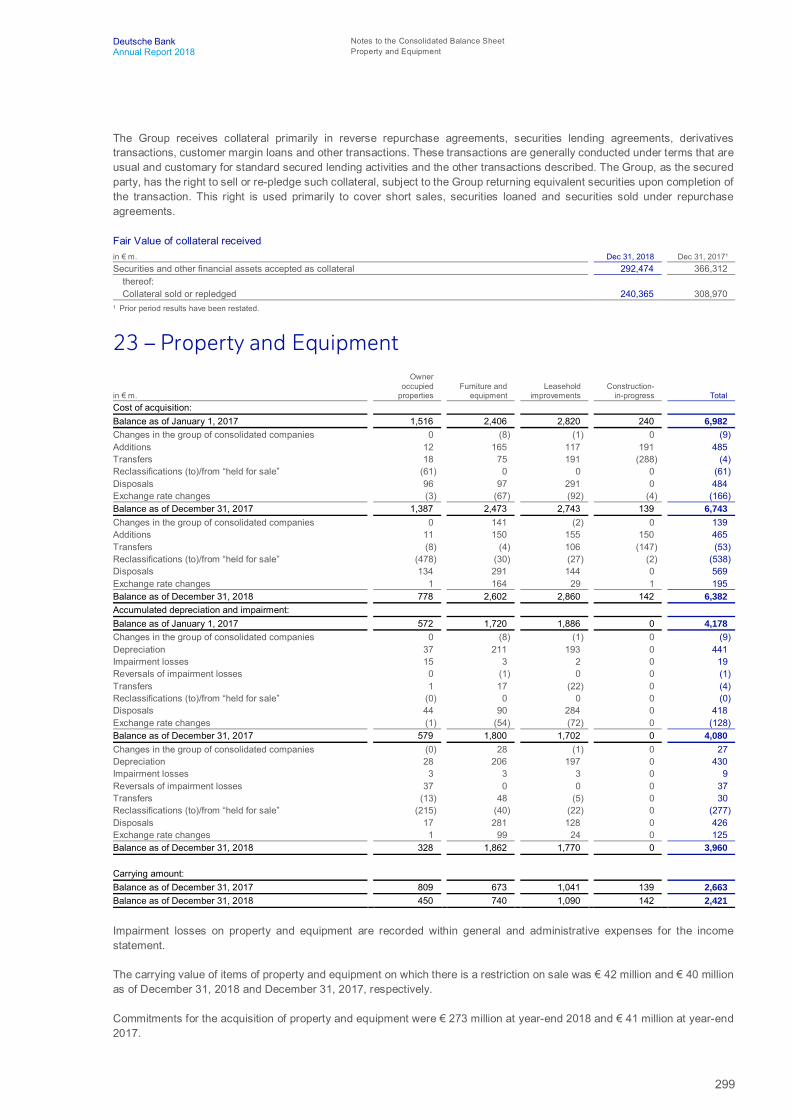
299
Deutsche Bank Notes to the Consolidated Balance SheetAnnual Report 2018 Property and Equipment
The Group receives collateral primarily in reverse repurchase agreements, securities lending agreements, derivativestransactions, customer margin loans and other transactions. These transactions are generally conducted under terms that areusual and customary for standard secured lending activities and the other transactions described. The Group, as the securedparty, has the right to sell or re-pledge such collateral, subject to the Group returning equivalent securities upon completion ofthe transaction. This right is used primarily to cover short sales, securities loaned and securities sold under repurchaseagreements.
Fair Value of collateral receivedin € m. Dec 31, 2018 Dec 31, 2017¹Securities and other financial assets accepted as collateral 292,474 366,312
thereof:Collateral sold or repledged 240,365 308,970
1 Prior period results have been restated.
23 – Property and Equipment
in € m.
Owneroccupied
propertiesFurniture and
equipmentLeasehold
improvementsConstruction-
in-progress TotalCost of acquisition:Balance as of January 1, 2017 1,516 2,406 2,820 240 6,982Changes in the group of consolidated companies 0 (8) (1) 0 (9)Additions 12 165 117 191 485Transfers 18 75 191 (288) (4)Reclassifications (to)/from “held for sale” (61) 0 0 0 (61)Disposals 96 97 291 0 484Exchange rate changes (3) (67) (92) (4) (166)Balance as of December 31, 2017 1,387 2,473 2,743 139 6,743Changes in the group of consolidated companies 0 141 (2) 0 139Additions 11 150 155 150 465Transfers (8) (4) 106 (147) (53)Reclassifications (to)/from “held for sale” (478) (30) (27) (2) (538)Disposals 134 291 144 0 569Exchange rate changes 1 164 29 1 195Balance as of December 31, 2018 778 2,602 2,860 142 6,382Accumulated depreciation and impairment:Balance as of January 1, 2017 572 1,720 1,886 0 4,178Changes in the group of consolidated companies 0 (8) (1) 0 (9)Depreciation 37 211 193 0 441Impairment losses 15 3 2 0 19Reversals of impairment losses 0 (1) 0 0 (1)Transfers 1 17 (22) 0 (4)Reclassifications (to)/from “held for sale” (0) 0 0 0 (0)Disposals 44 90 284 0 418Exchange rate changes (1) (54) (72) 0 (128)Balance as of December 31, 2017 579 1,800 1,702 0 4,080Changes in the group of consolidated companies (0) 28 (1) 0 27Depreciation 28 206 197 0 430Impairment losses 3 3 3 0 9Reversals of impairment losses 37 0 0 0 37Transfers (13) 48 (5) 0 30Reclassifications (to)/from “held for sale” (215) (40) (22) 0 (277)Disposals 17 281 128 0 426Exchange rate changes 1 99 24 0 125Balance as of December 31, 2018 328 1,862 1,770 0 3,960
Carrying amount:Balance as of December 31, 2017 809 673 1,041 139 2,663Balance as of December 31, 2018 450 740 1,090 142 2,421
Impairment losses on property and equipment are recorded within general and administrative expenses for the incomestatement.
The carrying value of items of property and equipment on which there is a restriction on sale was € 42 million and € 40 millionas of December 31, 2018 and December 31, 2017, respectively.
Commitments for the acquisition of property and equipment were € 273 million at year-end 2018 and € 41 million at year-end2017.
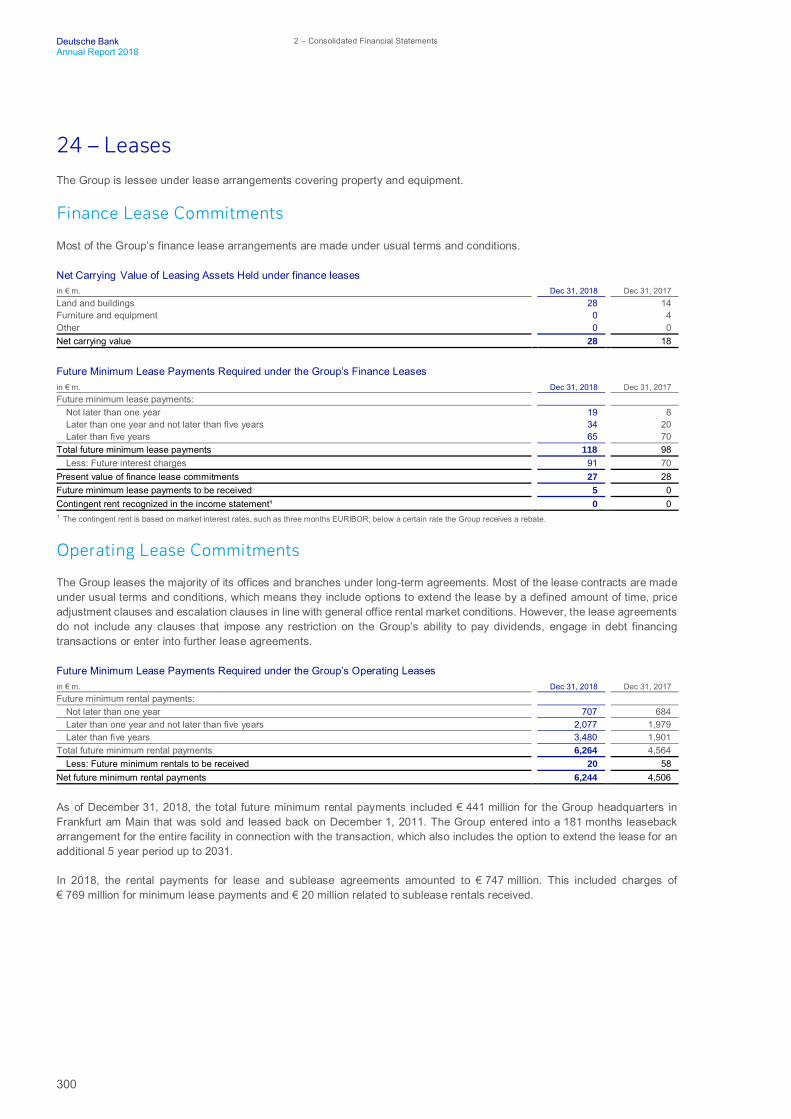
300
Deutsche Bank 2 – Consolidated Financial StatementsAnnual Report 2018
24 – LeasesThe Group is lessee under lease arrangements covering property and equipment.
Finance Lease Commitments
Most of the Group’s finance lease arrangements are made under usual terms and conditions.
Net Carrying Value of Leasing Assets Held under finance leasesin € m. Dec 31, 2018 Dec 31, 2017Land and buildings 28 14Furniture and equipment 0 4Other 0 0Net carrying value 28 18
Future Minimum Lease Payments Required under the Group’s Finance Leasesin € m. Dec 31, 2018 Dec 31, 2017Future minimum lease payments:
Not later than one year 19 8Later than one year and not later than five years 34 20Later than five years 65 70
Total future minimum lease payments 118 98Less: Future interest charges 91 70
Present value of finance lease commitments 27 28Future minimum lease payments to be received 5 0Contingent rent recognized in the income statement¹ 0 01 The contingent rent is based on market interest rates, such as three months EURIBOR; below a certain rate the Group receives a rebate.
Operating Lease Commitments
The Group leases the majority of its offices and branches under long-term agreements. Most of the lease contracts are madeunder usual terms and conditions, which means they include options to extend the lease by a defined amount of time, priceadjustment clauses and escalation clauses in line with general office rental market conditions. However, the lease agreementsdo not include any clauses that impose any restriction on the Group’s ability to pay dividends, engage in debt financingtransactions or enter into further lease agreements.
Future Minimum Lease Payments Required under the Group’s Operating Leasesin € m. Dec 31, 2018 Dec 31, 2017Future minimum rental payments:
Not later than one year 707 684Later than one year and not later than five years 2,077 1,979Later than five years 3,480 1,901
Total future minimum rental payments 6,264 4,564Less: Future minimum rentals to be received 20 58
Net future minimum rental payments 6,244 4,506
As of December 31, 2018, the total future minimum rental payments included € 441 million for the Group headquarters inFrankfurt am Main that was sold and leased back on December 1, 2011. The Group entered into a 181 months leasebackarrangement for the entire facility in connection with the transaction, which also includes the option to extend the lease for anadditional 5 year period up to 2031.
In 2018, the rental payments for lease and sublease agreements amounted to € 747 million. This included charges of€ 769 million for minimum lease payments and € 20 million related to sublease rentals received.

301
Deutsche Bank Notes to the Consolidated Balance SheetAnnual Report 2018 Goodwill and Other Intangible Assets
25 – Goodwill and Other Intangible Assets
Goodwill
Changes in Goodwill
The changes in the carrying amount of goodwill, as well as gross amounts and accumulated impairment losses of goodwill,for the years ended December 31, 2018, and December 31, 2017, are shown below by cash-generating units (“CGU”). As ofJanuary 1, 2016, the structure of the primary CGUs had been changed as a result of the reorganization of business operationsunder an amended segment structure. In the second quarter of 2017 and in accordance with the strategy announcement madeon March 5, 2017, the Group’s business operations were reorganized under a new divisional structure, which also reconfiguredthe existing Global Markets, Corporate Finance and Global Transaction Banking businesses into a single division, Corporate& Investment Bank (CIB). A review of CIB confirmed the previous assessment of two separate CGUs. Consequently, theformer primary CGUs “Global Markets” and “Corporate & Investment Banking” have been grouped as “Sales & Trading” (S&T)and “Global Transaction Banking & Corporate Finance” (GTB & CF). Please also refer to Note 4, “Business Segments andRelated Information” for more information regarding changes in the presentation of segment disclosures.
Goodwill allocated to cash-generating units
in € m.Sales &Trading
GlobalTransaction
Banking &Corporate
Finance
Private andCommercial
Clients Postbank
WealthManage-
ment
AssetManage-
ment Others TotalBalance as ofJanuary 1, 2017 0 532 0 0 564 3,006 1 4,103Goodwill acquired duringthe year 0 0 0 0 0 0 0 0Purchase accountingadjustments 0 0 0 0 0 0 0 0Transfers 6 (6) 0 0 0 0 0 0Reclassification from (to)“held for sale” 0 (3) 0 0 0 0 0 (3)Goodwill related todispositions withoutbeing classified as“held for sale” 0 0 0 0 0 (6) 0 (6)Impairment losses1 (6) 0 0 0 0 0 0 (6)Exchange ratechanges/other 0 (52) 0 0 (22) (231) 0 (306)Balance as ofDecember 31, 2017 0 471 0 0 541 2,768 1 3,782Gross amount of goodwill 2,780 1,485 1,077 2,086 541 3,232 1 11,203Accumulated impairmentlosses (2,780) (1,014) (1,077) (2,086) 0 (464) 0 (7,422)Balance as ofJanuary 1, 2018 0 471 0 0 541 2,768 1 3,782Goodwill acquired duringthe year 0 0 0 0 0 0 0 0Purchase accountingadjustments 0 0 0 0 0 0 0 0Transfers 0 0 0 0 0 0 0 0Reclassification from (to)“held for sale” 0 0 0 0 (4) 0 0 (4)Goodwill related todispositions withoutbeing classified as“held for sale” 0 0 0 0 0 0 0 0Impairment losses1 0 0 0 0 0 0 0 0Exchange ratechanges/other 0 18 0 0 5 74 0 98Balance as ofDecember 31, 2018 0 489 0 0 543 2,843 1 3,876Gross amount of goodwill 2,889 1,539 1,076 2,086 543 3,314 1 11,449Accumulated impairmentlosses (2,889) (1,051) (1,076) (2,086) 0 (471) 0 (7,573)1 Impairment losses of goodwill are recorded as impairment of goodwill and other intangible assets in the income statement.

302
Deutsche Bank 2 – Consolidated Financial StatementsAnnual Report 2018
In addition to the primary CGUs, the segment CIB includes goodwill resulting from the acquisition of a nonintegratedinvestment which is not allocated to the respective segment’ primary CGU. Such goodwill is summarized as “Others” in thetable above.
Changes in goodwill for both 2017 and 2018 mainly reflected exchange rate fluctuations, predominantly related to thetranslation of goodwill held in USD.
In 2016, changes in goodwill mainly included impairments of € 785 million in Sales & Trading (S&T) (€ 285 million) and AssetManagement (€ 500 million). The impairment in S&T was the result of a transfer of certain businesses from Asset Managementto S&T in the second quarter 2016. The transfer resulted in the reassignment of € 285 million of goodwill from AssetManagement based on relative values in accordance with IFRS. The subsequent impairment review of S&T led to animpairment loss of € 285 million of the reassigned goodwill. The goodwill impairment in Asset Management was recorded inthe fourth quarter 2016 in relation to the sale of the Abbey Life business and the formation of a disposal group held for sale.Immediately before its initial classification as a disposal group, the carrying amounts of all assets and liabilities included in theAbbey Life disposal group were measured and recognized in accordance with applicable IFRS. With the sale of Abbey Life toclose for an amount lower than its carrying amount, the proportion of Asset Management CGU goodwill attributable to theAbbey Life business was not expected to be recovered upon sale of the disposal group. Accordingly, the allocated goodwillamount of € 500 million as well as other intangible assets (value of business acquired, VOBA) of € 515 million included in thedisposal group were considered impaired and written-off through Impairment of goodwill and other intangible assets.
Goodwill Impairment Test
For the purposes of impairment testing, goodwill acquired in a business combination is allocated to CGUs. On the basis asdescribed in Note 1 “Significant Accounting Policies and Critical Accounting Estimates”, the Group’s primary CGUs are asoutlined above. “Other” goodwill is tested individually for impairment on the level of each of the nonintegrated investments.Goodwill is tested for impairment annually in the fourth quarter by comparing the recoverable amount of each goodwill-carryingCGU with its carrying amount. In addition, in accordance with IAS 36, the Group tests goodwill whenever a triggering event isidentified. The recoverable amount is the higher of a CGU’s fair value less costs of disposal and its value in use.
The annual goodwill impairment tests conducted in 2018 and 2017 did not result in an impairment loss on the Group’s primarygoodwill-carrying CGUs as the recoverable amounts of these CGUs were higher than the respective carrying amounts.
A review of the Group’s strategy or certain political or global risks for the banking industry such as a return of the Europeansovereign debt crisis, uncertainties regarding the implementation of already adopted regulation and the introduction oflegislation that is already under discussion as well as a slowdown of GDP growth may negatively impact the performanceforecasts of certain of the Group’s CGUs and, thus, could result in an impairment of goodwill in the future.
Carrying Amount
The carrying amount of a primary CGU is derived using a capital allocation model based on the Shareholders’ Equity AllocationFramework of the Group (please refer to Note 4, “Business Segments and Related Information” for more details). Theallocation uses the Group’s total equity at the date of valuation, including Additional Tier 1 Notes (“AT1 Notes”), whichconstitute unsecured and subordinated notes of Deutsche Bank and which are classified as Additional equity components inaccordance with IFRS. Total equity is adjusted for specific effects related to nonintegrated investments, which are testedseparately for impairment as outlined above, and for an add-on adjustment for goodwill attributable to noncontrolling interests.
Recoverable Amount
The Group determines the recoverable amounts of its primary CGUs on the basis of the higher of value in use and fair valueless costs of disposal (Level 3 of the fair value hierarchy). It employs a discounted cash flow (DCF) model, which reflects thespecifics of the banking business and its regulatory environment. The model calculates the present value of the estimatedfuture earnings that are distributable to shareholders after fulfilling the respective regulatory capital requirements. Therecoverable amounts also include the fair value of the AT1 Notes, allocated to the primary CGUs consistent to their treatmentin the carrying amount.
The DCF model uses earnings projections and respective capitalization assumptions based on five-year financial plans aswell as longer term expectations on the impact of regulatory developments, which are discounted to their present value.Estimating future earnings and capital requirements involves judgment and the consideration of past and current performancesas well as expected developments in the respective markets, and in the overall macroeconomic and regulatory environments.Earnings projections beyond the initial five-year period are, where applicable, adjusted to derive a sustainable level and thecash flow to equity is assumed to increase by or converge towards a constant long-term growth rate of up to 3.1 % (2017:3.2 %). This is based on projected revenue forecasts of the CGUs as well as expectations for the development of grossdomestic product and inflation, and is captured in the terminal value.

303
Deutsche Bank Notes to the Consolidated Balance SheetAnnual Report 2018 Goodwill and Other Intangible Assets
Key Assumptions and Sensitivities
Key Assumptions: The DCF value of a CGU is sensitive to the earnings projections, to the discount rate (cost of equity) appliedand, to a much lesser extent, to the long-term growth rate. The discount rates applied have been determined based on thecapital asset pricing model and comprise a risk-free interest rate, a market risk premium and a factor covering the systematicmarket risk (beta factor). The values for the risk-free interest rate, the market risk premium and the beta factors are determinedusing external sources of information. CGU-specific beta factors are determined based on a respective group of peercompanies. Variations in all of these components might impact the discount rates.
Primary goodwill-carrying cash-generating unitsDiscount rate (post-tax)
2018 2017Global Transaction Banking & Corporate Finance 8.8 % 8.8 %Wealth Management 9.0 % 9.1 %Asset Management 9.7 % 10.0 %
Management determined the values for the key assumptions in the following table based on a combination of internal andexternal analysis. Estimates for efficiency and the cost reduction program are based on progress made to date and scheduledfuture projects and initiatives.
Primary goodwill-carrying cash-generating unit Description of key assumptions
Uncertainty associated with key assumptions and potentialevents/circumstances that could have a negative effect
WealthManagement
∂ Strategy continuously monitored to reflect key markettrends and developments including global wealth creationand concentration, digitalization, aging population, transferto next generation, product trends (e.g., ESG) as well ascompetitor activity and benchmarking
∂ Growth plans supported by continuous strengthening ofour risk and control functions
∂ Multi-year organic investment program to expand our front-office staff focused in key growth markets where we havea distinctive and attractive client offering
∂ Continued focus on expanding business with high networth and ultra-high net worth clients via a moresegmented approach
∂ Building out of global investment advisory solutions as wellas increasing revenues from collaboration betweendivisions (esp. CIB)
∂ Continued deployment of balance sheet for WM lendingproposition
∂ Targeted investments in enhancing client experiencethrough new digital offering, efficient on-boarding, broadproduct offering as well as approaching clients with a morenuanced client service model
∂ Benefit from cost savings coming through re-organizationof our product and coverage teams into three regions(Americas, Europe, Emerging Markets)
∂ Major industry threats, i.e., market and exchange ratevolatility, significant technological developments,geopolitical uncertainty
∂ Investors holding assets out of the markets, a retreat tocash or simpler, lower fee products, and reduced tradingactivity
∂ Business/execution risks, i.e., under achievement of netnew money targets from market uncertainty, franchiseinstability, adverse developments, loss of high qualityrelationship managers
∂ Cost savings following efficiency gains and expected IT/process improvements not realized to the extent planned
Asset Management
∂ Deliver strong investment product performance∂ Expand product suite in growth areas (e.g. alternatives,
multi assets, passive, ESG investment schemes) whileconsolidating non-core strategies
∂ Consistent net flows leveraging market share leadership inGermany and the rest of Europe, while expandingcoverage in Asia Pacific and focused growth in theAmericas
∂ Diversification of intermediary coverage towards highgrowth channels and deployment of digital solutions toserve new channels
∂ Further efficiency through improved core operatingprocesses, platform optimization and productrationalization
∂ Anticipation of further headwinds in the asset managementindustry as a result of the changing regulatory environment
∂ Challenging market environment and volatilityunfavorable to our investment strategies
∂ Unfavorable margin development and adversecompetition levels in key markets and products beyondexpected levels
∂ Business/execution risks, e.g., under achievement of netflow targets from market uncertainty, loss of high qualityclient facing employees, unfavorable investmentperformance, lower than expected efficiency gains
∂ Uncertainty around regulation and its potentialimplications not yet anticipated
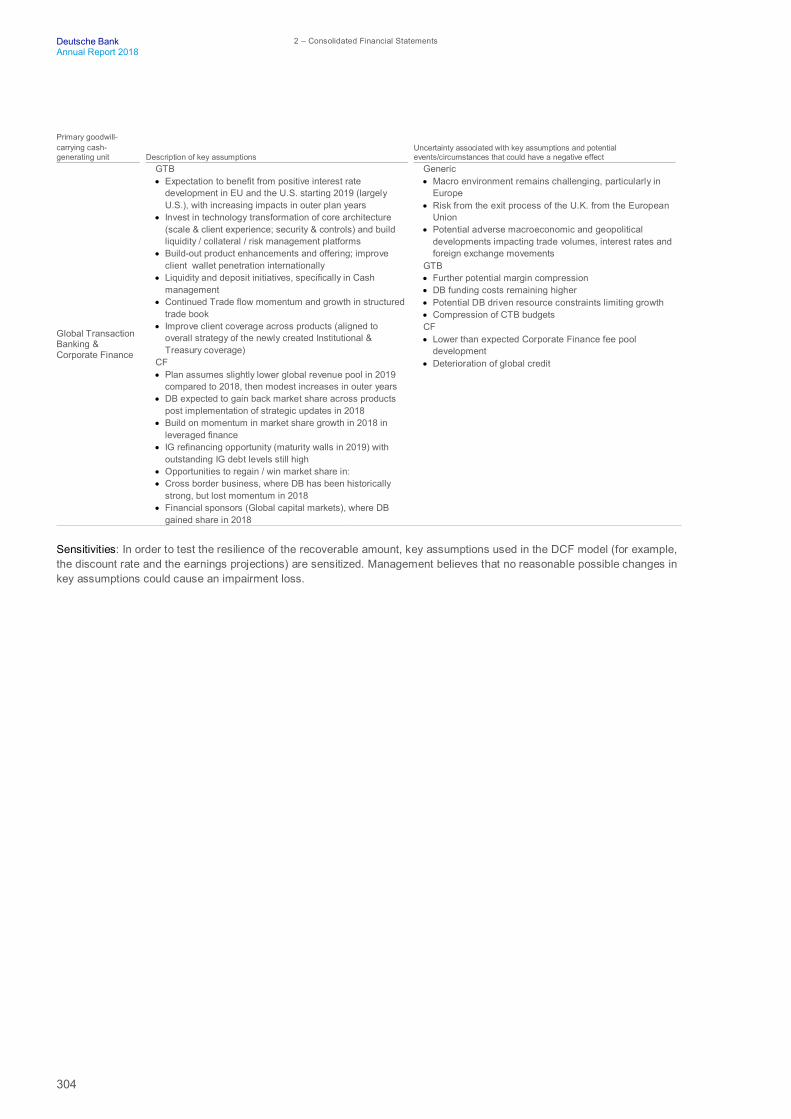
304
Deutsche Bank 2 – Consolidated Financial StatementsAnnual Report 2018
Primary goodwill-carrying cash-generating unit Description of key assumptions
Uncertainty associated with key assumptions and potentialevents/circumstances that could have a negative effect
Global TransactionBanking &Corporate Finance
GTB∂ Expectation to benefit from positive interest rate
development in EU and the U.S. starting 2019 (largelyU.S.), with increasing impacts in outer plan years
∂ Invest in technology transformation of core architecture(scale & client experience; security & controls) and buildliquidity / collateral / risk management platforms
∂ Build-out product enhancements and offering; improveclient wallet penetration internationally
∂ Liquidity and deposit initiatives, specifically in Cashmanagement
∂ Continued Trade flow momentum and growth in structuredtrade book
∂ Improve client coverage across products (aligned tooverall strategy of the newly created Institutional &Treasury coverage)
CF∂ Plan assumes slightly lower global revenue pool in 2019
compared to 2018, then modest increases in outer years∂ DB expected to gain back market share across products
post implementation of strategic updates in 2018∂ Build on momentum in market share growth in 2018 in
leveraged finance∂ IG refinancing opportunity (maturity walls in 2019) with
outstanding IG debt levels still high∂ Opportunities to regain / win market share in:∂ Cross border business, where DB has been historically
strong, but lost momentum in 2018∂ Financial sponsors (Global capital markets), where DB
gained share in 2018
Generic∂ Macro environment remains challenging, particularly in
Europe∂ Risk from the exit process of the U.K. from the European
Union∂ Potential adverse macroeconomic and geopolitical
developments impacting trade volumes, interest rates andforeign exchange movements
GTB∂ Further potential margin compression∂ DB funding costs remaining higher∂ Potential DB driven resource constraints limiting growth∂ Compression of CTB budgetsCF∂ Lower than expected Corporate Finance fee pool
development∂ Deterioration of global credit
Sensitivities: In order to test the resilience of the recoverable amount, key assumptions used in the DCF model (for example,the discount rate and the earnings projections) are sensitized. Management believes that no reasonable possible changes inkey assumptions could cause an impairment loss.

305
Deutsche Bank Notes to the Consolidated Balance SheetAnnual Report 2018 Goodwill and Other Intangible Assets
Other Intangible Assets
Changes of other intangible assets by asset classes for the years ended December 31, 2018, and December 31, 2017
Purchased intangible assets
Internallygeneratedintangible
assets
Total otherintangible
assetsUnamortized Amortized Amortized
in € m.
Retailinvestmentmanageme
ntagreements Other
Totalunamortize
dpurchasedintangible
assets
Customer-related
intangibleassets
Contract-based
intangibleassets
Softwareand
other
Totalamortized
purchasedintangible
assets SoftwareCost of acquisition/manufacture:Balance as of January 1, 2017 1,094 440 1,534 1,431 70 871 2,372 6,235 10,140
Additions 0 0 0 15 0 48 63 1,360 1,423Changes in the group ofconsolidated companies 0 0 0 0 0 (35) (35) (171) (206)Disposals 0 0 0 0 0 21 21 121 142Reclassifications from(to) “held for sale” 0 0 0 (6) 0 0 (6) 0 (6)Transfers 0 (0) (0) 1 0 50 51 (42) 9Exchange rate changes (131) (1) (132) (77) (0) (12) (89) (237) (457)
Balance as of December 31, 2017 963 440 1,402 1,364 70 901 2,335 7,024 10,761Additions 0 0 0 12 0 44 56 1,242 1,298Changes in the group ofconsolidated companies 0 0 0 0 0 (0) (0) 0 (0)Disposals 0 0 0 0 0 126 126 725 851Reclassifications from(to) “held for sale” 0 0 0 0 0 (7) (7) (20) (27)Transfers 0 2 2 (3) 0 (213) (215) 190 (24)Exchange rate changes 48 0 48 10 0 5 15 102 165Balance as of December 31, 2018 1,010 441 1,451 1,384 70 603 2,058 7,814 11,322
Accumulated amortizationand impairment:
Balance as of January 1, 2017 276 424 700 1,363 65 715 2,143 2,418 5,261
Amortization for the year 0 0 0 34 4 27 65 870 9351
Changes in the group ofconsolidated companies 0 0 0 0 0 (35) (35) (171) (206)Disposals 0 0 0 0 0 19 19 81 99Reclassifications from(to) “held for sale” 0 0 0 (4) 0 0 (4) 0 (4)Impairment losses 0 15 15 0 0 0 0 42 572
Reversals of impairment losses 0 0 0 0 0 0 0 0 0Transfers 0 0 0 0 0 41 41 (35) 6Exchange rate changes (33) (0) (33) (72) (0) (12) (84) (129) (246)
Balance as of December 31, 2017 243 439 682 1,321 69 718 2,108 2,914 5,704Amortization for the year 0 0 0 21 1 40 61 1,034 1,0953
Changes in the group ofconsolidated companies 0 0 0 0 0 (0) (0) 0 (0)Disposals 0 0 0 0 0 125 125 724 850Reclassifications from(to) “held for sale”
0 0 0 0 0 (7) (7) (20) (27)
Impairment losses 0 0 0 0 0 0 0 42 424
Reversals of impairment losses 0 0 0 0 0 0 0 0 0Transfers 0 0 0 6 0 (136) (129) 139 10Exchange rate changes 12 0 12 10 0 5 14 57 83Balance as of December 31, 2018 255 439 694 1,358 70 494 1,922 3,442 6,057
Carrying amount:
As of December 31, 2017 719 1 720 43 1 183 227 4,110 5,057
As of December 31, 2018 755 2 757 26 0 109 136 4,372 5,2651 The € 935 million were included in general and administrative expenses.2 Of which € 42 million were related to the impairment of self-developed software, recorded in general and administrative expenses, and € 15 million referring to the impairment
of a non-amortizing trade-mark intangible asset which is included under impairment of goodwill and other intangible asset.3 The € 1.1 billion were included in general and administrative expenses.4 The € 42 million were related to the impairment of self-developed software, recorded in general and administrative expenses.

306
Deutsche Bank 2 – Consolidated Financial StatementsAnnual Report 2018
Amortizing Intangible Assets
In 2018, amortizing other intangible assets increased by a net € 171 million. This was in particular driven by additions tointernally generated intangible assets of € 1.2 billion resulting from the capitalization of expenses incurred in conjunction withthe Group’s development of own-used software. Offsetting were amortization expenses of € 1.1 billion, mostly for thescheduled consumption of capitalized software (€ 1.1 billion). The reassessment of current platform software as well assoftware under construction led to the impairment of self-developed software (€ 42 million). Furthermore, the weakening ofthe Euro against major currencies accounted for positive exchange rate changes of € 82 million increasing the net book valueof amortizing intangible assets.
In 2017, amortizing other intangible assets increased by a net € 291 million. This was mainly driven by additions to internallygenerated intangible assets of € 1.4 billion, offset by amortization expenses of € 935 million, in particular for the scheduledconsumption of capitalized software (€ 897 million). The reassessment of current platform software as well as software underconstruction led to the impairment of self-developed software (€ 42 million). Furthermore, the strengthening of the Euroaccounted for negative exchange rate changes of € 113 million reducing the net book value of amortizing intangible assets.
In 2016, amortizing other intangible assets decreased by a net € 327 million. Main components of this development includedincreases due to additions to internally generated intangible assets of € 1.5 billion, which represent the capitalization ofexpenses incurred in conjunction with the Group’s development of own-used software. These were offset by amortizationexpenses of € 815 million, mostly related to the scheduled asset consumption of self-developed software (€ 679 million), andimpairment charges of € 580 million, mainly reflecting the write-off of the value of business acquired (VOBA; € 515 million) asa consequence of the Abbey Life disposal (Asset Management). Furthermore, the reassessment of current platform softwareas well as software under construction, led to the writedown of self-developed software (€ 60 million). In advance of the saleof the NCOU legacy investment in Maher Terminals’ Port Elizabeth operation in the fourth quarter 2016, its reclassification tothe held-for-sale category in the third quarter 2016 had led to a net reduction of € 497 million in contract-based and tradename other intangible assets.
Other intangible assets with finite useful lives are generally amortized over their useful lives based on the straight-line method.
Useful lives of other amortized intangible assets by asset classUseful lives
in yearsInternally generated intangible assets:Software up to 10Purchased intangible assets:Customer-related intangible assets up to 20Contract-based intangible assets up to 8Other up to 80
Unamortized Intangible Assets
Within this asset class, the Group recognizes certain contract-based and marketing-related intangible assets, which aredeemed to have an indefinite useful life.
In particular, the asset class comprises the below detailed investment management agreements related to retail mutual fundsand certain trademarks. Due to the specific nature of these intangible assets, market prices are ordinarily not observable and,therefore, the Group values such assets based on the income approach, using a post-tax DCF-methodology.
Retail investment management agreements: These assets, amounting to € 755 million, relate to the Group’s U.S. retail mutualfund business and are allocated to the Asset Management CGU. Retail investment management agreements are contractsthat give DWS Group investments the exclusive right to manage a variety of mutual funds for a specified period. Since thesecontracts are easily renewable, the cost of renewal is minimal, and they have a long history of renewal, these agreements arenot expected to have a foreseeable limit on the contract period. Therefore, the rights to manage the associated assets undermanagement are expected to generate cash flows for an indefinite period of time. This intangible asset was recorded at fairvalue based upon a valuation provided by a third party at the date of acquisition of Zurich Scudder Investments, Inc. in 2002.
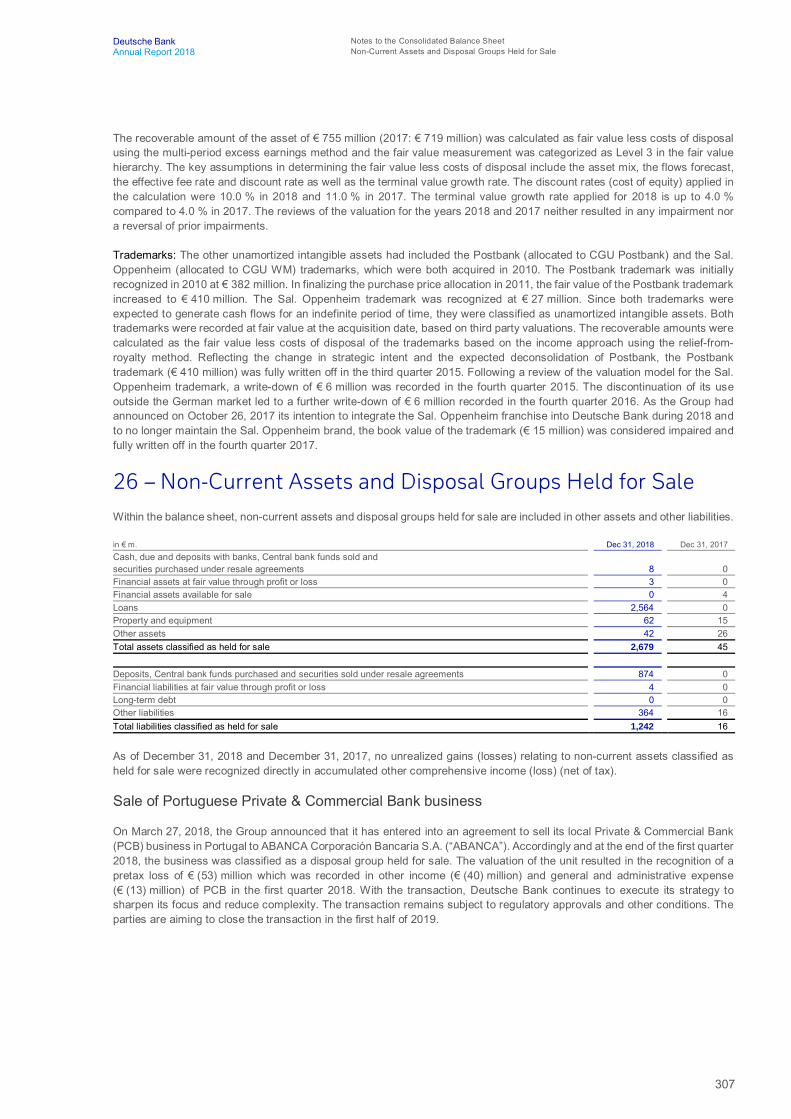
307
Deutsche Bank Notes to the Consolidated Balance SheetAnnual Report 2018 Non-Current Assets and Disposal Groups Held for Sale
The recoverable amount of the asset of € 755 million (2017: € 719 million) was calculated as fair value less costs of disposalusing the multi-period excess earnings method and the fair value measurement was categorized as Level 3 in the fair valuehierarchy. The key assumptions in determining the fair value less costs of disposal include the asset mix, the flows forecast,the effective fee rate and discount rate as well as the terminal value growth rate. The discount rates (cost of equity) applied inthe calculation were 10.0 % in 2018 and 11.0 % in 2017. The terminal value growth rate applied for 2018 is up to 4.0 %compared to 4.0 % in 2017. The reviews of the valuation for the years 2018 and 2017 neither resulted in any impairment nora reversal of prior impairments.
Trademarks: The other unamortized intangible assets had included the Postbank (allocated to CGU Postbank) and the Sal.Oppenheim (allocated to CGU WM) trademarks, which were both acquired in 2010. The Postbank trademark was initiallyrecognized in 2010 at € 382 million. In finalizing the purchase price allocation in 2011, the fair value of the Postbank trademarkincreased to € 410 million. The Sal. Oppenheim trademark was recognized at € 27 million. Since both trademarks wereexpected to generate cash flows for an indefinite period of time, they were classified as unamortized intangible assets. Bothtrademarks were recorded at fair value at the acquisition date, based on third party valuations. The recoverable amounts werecalculated as the fair value less costs of disposal of the trademarks based on the income approach using the relief-from-royalty method. Reflecting the change in strategic intent and the expected deconsolidation of Postbank, the Postbanktrademark (€ 410 million) was fully written off in the third quarter 2015. Following a review of the valuation model for the Sal.Oppenheim trademark, a write-down of € 6 million was recorded in the fourth quarter 2015. The discontinuation of its useoutside the German market led to a further write-down of € 6 million recorded in the fourth quarter 2016. As the Group hadannounced on October 26, 2017 its intention to integrate the Sal. Oppenheim franchise into Deutsche Bank during 2018 andto no longer maintain the Sal. Oppenheim brand, the book value of the trademark (€ 15 million) was considered impaired andfully written off in the fourth quarter 2017.
26 – Non-Current Assets and Disposal Groups Held for SaleWithin the balance sheet, non-current assets and disposal groups held for sale are included in other assets and other liabilities.
in € m. Dec 31, 2018 Dec 31, 2017Cash, due and deposits with banks, Central bank funds sold andsecurities purchased under resale agreements 8 0Financial assets at fair value through profit or loss 3 0Financial assets available for sale 0 4Loans 2,564 0Property and equipment 62 15Other assets 42 26Total assets classified as held for sale 2,679 45
Deposits, Central bank funds purchased and securities sold under resale agreements 874 0Financial liabilities at fair value through profit or loss 4 0Long-term debt 0 0Other liabilities 364 16Total liabilities classified as held for sale 1,242 16
As of December 31, 2018 and December 31, 2017, no unrealized gains (losses) relating to non-current assets classified asheld for sale were recognized directly in accumulated other comprehensive income (loss) (net of tax).
Sale of Portuguese Private & Commercial Bank business
On March 27, 2018, the Group announced that it has entered into an agreement to sell its local Private & Commercial Bank(PCB) business in Portugal to ABANCA Corporación Bancaria S.A. (“ABANCA”). Accordingly and at the end of the first quarter2018, the business was classified as a disposal group held for sale. The valuation of the unit resulted in the recognition of apretax loss of € (53) million which was recorded in other income (€ (40) million) and general and administrative expense(€ (13) million) of PCB in the first quarter 2018. With the transaction, Deutsche Bank continues to execute its strategy tosharpen its focus and reduce complexity. The transaction remains subject to regulatory approvals and other conditions. Theparties are aiming to close the transaction in the first half of 2019.

308
Deutsche Bank 2 – Consolidated Financial StatementsAnnual Report 2018
Disposal of Polish Private & Commercial Bank business
Following the announcement made on December 14, 2017 that Deutsche Bank had entered into an agreement to sell itsPolish Private & Commercial Banking (“PCB”) business from Deutsche Bank Polska S.A. (“DB Polska”), excluding its foreigncurrency denominated retail mortgage portfolio, together with DB Securities S.A., to Santander Bank Polska S.A. (“SantanderBank Polska”, former Bank Zachodni WBK S.A.), the Group obtained all material outstanding regulatory approvals onJuly 17, 2018 to proceed with the designated transaction. Accordingly, in the third quarter 2018 the respective business wasclassified as a disposal group held for sale. Before its classification as a disposal group held for sale, the Group had revaluedthe designated disposal unit and recorded a pre-tax loss of € (157) million included in PCB’s other income of the fourth quarter2017. Updating the revaluation of the unit prior to its disposal in 2018 led to additional net year-to-date pretax charges of€ (17) million recorded in PCB’s net revenues for 2018.
The sale is in line with the Group’s effort to continue to sharpen its focus and reduce complexity. Santander Bank Polska ispart of the Santander Group, with Banco Santander S.A. being its parent company. The transaction was subject to approvalsof the Polish FSA, other regulatory approvals, corporate consents and other conditions and closed in the fourth quarter 2018.
At closing of the transaction, the declaration of backing issued by Deutsche Bank AG in favor of DB Polska was terminatedwith regard to the liabilities included in the divested business. The declaration of backing issued in favor of DB Polska continuesfor the remaining business.
Disposals in 2017
Division Disposal Financial impact1 Date of the disposalCorporate & InvestmentBank
On June 5, 2017, the Group announced thecompletion of the sale of its Argentinesubsidiary Deutsche Bank S.A. to BancoComafi S.A. With outstanding substantialregulatory approvals received in May 2017, theentity had been classified as a disposal groupheld for sale prior to its disposal in June 2017.
The disposal resulted in a pre-tax loss on saleof € 190 million, including the realization of acurrency translation adjustment, which wasrecorded in 2017 and mainly included in C&A.
Second quarter 2017
AssetManagement
In the fourth quarter 2016, the Group hadclassified its fund administration and custodybusiness of Sal. Oppenheim Luxembourg as adisposal group held for sale. The transactionwas subject to customary closing conditionsand regulatory approvals and was completedon December 1, 2017.
Up until its disposal, the revaluation of the unitresulted in an additional impairment loss of€ 5 milion recorded in Other income of 2017.
Fourth quarter 2017
1 Impairment losses and reversals of impairment losses are included in Other income.
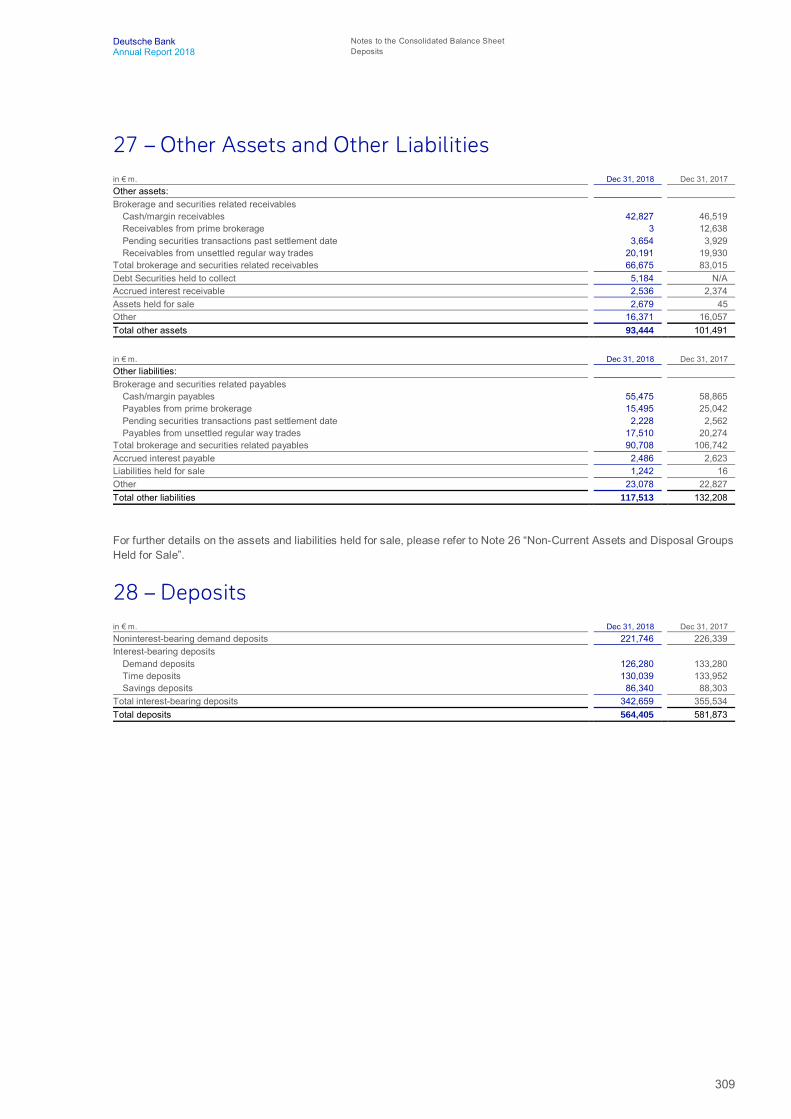
309
Deutsche Bank Notes to the Consolidated Balance SheetAnnual Report 2018 Deposits
27 – Other Assets and Other Liabilitiesin € m. Dec 31, 2018 Dec 31, 2017Other assets:Brokerage and securities related receivables
Cash/margin receivables 42,827 46,519Receivables from prime brokerage 3 12,638Pending securities transactions past settlement date 3,654 3,929Receivables from unsettled regular way trades 20,191 19,930
Total brokerage and securities related receivables 66,675 83,015Debt Securities held to collect 5,184 N/AAccrued interest receivable 2,536 2,374Assets held for sale 2,679 45Other 16,371 16,057Total other assets 93,444 101,491
in € m. Dec 31, 2018 Dec 31, 2017Other liabilities:Brokerage and securities related payables
Cash/margin payables 55,475 58,865Payables from prime brokerage 15,495 25,042Pending securities transactions past settlement date 2,228 2,562Payables from unsettled regular way trades 17,510 20,274
Total brokerage and securities related payables 90,708 106,742Accrued interest payable 2,486 2,623Liabilities held for sale 1,242 16Other 23,078 22,827Total other liabilities 117,513 132,208
For further details on the assets and liabilities held for sale, please refer to Note 26 “Non-Current Assets and Disposal GroupsHeld for Sale”.
28 – Depositsin € m. Dec 31, 2018 Dec 31, 2017Noninterest-bearing demand deposits 221,746 226,339Interest-bearing deposits
Demand deposits 126,280 133,280Time deposits 130,039 133,952Savings deposits 86,340 88,303
Total interest-bearing deposits 342,659 355,534Total deposits 564,405 581,873

310
Deutsche Bank 2 – Consolidated Financial StatementsAnnual Report 2018
29 – ProvisionsMovements by Class of Provisions
in € m.Operational
RiskCivil
LitigationRegulatory
EnforcementRe-
structuring Other1 Total2
Balance as of January 1, 2017 309 2,014 5,607 741 952 9,622Changes in the group of consolidated companies 0 (5) (0) (1) 5 (1)New provisions 84 745 306 601 847 2,584Amounts used 53 1,611 3,576 458 763 6,461Unused amounts reversed 49 134 711 182 118 1,194Effects from exchange rate fluctuations/Unwind of discount (15) (86) (575) (4) (38) (718)Transfers (2) 193 (153) (0) 3 41Balance as of January 1, 2018 275 1,115 897 696 889 3,873Changes in the group of consolidated companies 0 0 0 1 (2) (2)New provisions 27 334 125 427 765 1,677Amounts used 54 673 364 344 862 2,296Unused amounts reversed 41 160 206 185 364 956Effects from exchange rate fluctuations/Unwind of discount 5 42 41 (1) (1) 87Transfers 2 25 6 (9) 9 33Balance as of December 31, 2018 215 684 499 585 433 2,4161 Figures have been restated to reflect the reclassification of € 1.0 billion and € 1.1 billion from Provisions to Deposits in the Group’s consolidated balance sheet as of January
1, 2017 and January 1, 2018, respectively. See Note 1 “Significant Accounting Policies and Critical Accounting Estimates” for more details on the change in accounting policyimpacting Home Savings Contracts.
2 For the remaining portion of provisions as disclosed on the consolidated balance sheet, please see Note 21 “Allowance for Credit Losses”, in which allowances for creditrelated off-balance sheet positions are disclosed.
Classes of Provisions
Operational Risk provisions arise out of operational risk and exclude civil litigation and regulatory enforcement provisions,which are presented as separate classes of provisions. Operational risk is the risk of loss resulting from inadequate or failedinternal processes, people and systems, or from external events. The definition used for the purposes of determiningoperational provisions differs from the risk management definition, as it excludes risk of loss resulting from civil litigation andregulatory enforcement matters. For risk management purposes, operational risk includes legal risk, as payments tocustomers, counterparties and regulatory bodies in civil litigations or regulatory enforcement matters constitute loss events foroperational shortcomings, but excludes business and reputational risk.
Civil Litigation provisions arise out of current or potential claims or proceedings alleging non-compliance with contractual orother legal or regulatory responsibilities, which have resulted or may result in demands from customers, counterparties orother parties in civil litigations.
Regulatory Enforcement provisions arise out of current or potential claims or proceedings alleging non-compliance with legalor regulatory responsibilities, which have resulted or may result in an assessment of fines or penalties by governmentalregulatory agencies, self-regulatory organizations or other enforcement authorities.
Restructuring provisions arise out of restructuring activities. The Group aims to enhance its long-term competitiveness throughmajor reductions in costs, duplication and complexity in the years ahead. For details see Note 10 “Restructuring”.
Other provisions include several specific items arising from a variety of different circumstances, including the provision for thereimbursement of loan processing fees, deferred sales commissions, provisions for bank levies and mortgage repurchasedemands.
Provisions and Contingent Liabilities
The Group recognizes a provision for potential loss only when there is a present obligation arising from a past event that isprobable to result in an economic outflow that can be reliably estimated. Where a reliable estimate cannot be made for suchan obligation, no provision is recognized and the obligation is deemed a contingent liability. Contingent liabilities also includepossible obligations for which the possibility of future economic outflow is more than remote but less than probable. Where aprovision has been taken for a particular claim, no contingent liability is recorded; for matters or sets of matters consisting ofmore than one claim, however, provisions may be recorded for some claims, and contingent liabilities (or neither a provisionnor a contingent liability) may be recorded for others.
311
Deutsche Bank Notes to the Consolidated Balance SheetAnnual Report 2018 Provisions
The Group operates in a legal and regulatory environment that exposes it to significant litigation risks. As a result, the Groupis involved in litigation, arbitration and regulatory proceedings and investigations in Germany and in a number of jurisdictionsoutside Germany, including the United States. In recent years, regulation and supervision in a number of areas have increased,and regulators, governmental bodies and others have sought to subject financial services providers to increasing oversightand scrutiny, which in turn has led to additional regulatory investigations and enforcement actions which are often followed bycivil litigation. This trend has accelerated markedly as a result of the global financial crisis.
In determining for which of the claims the possibility of a loss is probable, or less than probable but more than remote, andthen estimating the possible loss for those claims, the Group takes into consideration a number of factors, including but notlimited to the nature of the claim and its underlying facts, the procedural posture and litigation history of each case, rulings bythe courts or tribunals, the Group’s experience and the experience of others in similar cases (to the extent this is known to theGroup), prior settlement discussions, settlements by others in similar cases (to the extent this is known to the Group), availableindemnities and the opinions and views of legal counsel and other experts.
The provisions the Group has recognized for civil litigation and regulatory enforcement matters as of December 31, 2018 andJanuary 1, 2018 are set forth in the table above. For some matters for which the Group believes an outflow of funds is probable,no provisions were recognized as the Group could not reliably estimate the amount of the potential outflow.
For the matters for which a reliable estimate can be made, the Group currently estimates that, as of December 31, 2018, theaggregate future loss of which the possibility is more than remote but less than probable is approximately € 2.5 billion for civillitigation matters (December 31, 2017: € 2.4 billion) and € 0.2 billion for regulatory enforcement matters (December 31, 2017:€ 0.3 billion). These figures include matters where the Group’s potential liability is joint and several and where the Groupexpects any such liability to be paid by a third party. For other significant civil litigation and regulatory enforcement matters,the Group believes the possibility of an outflow of funds is more than remote but less than probable but the amount is notreliably estimable, and accordingly such matters are not included in the contingent liability estimates. For still other significantcivil litigation and regulatory enforcement matters, the Group believes the possibility of an outflow of funds is remote andtherefore has neither recognized a provision nor included them in the contingent liability estimates.
This estimated possible loss, as well as any provisions taken, is based upon currently available information and is subject tosignificant judgment and a variety of assumptions, variables and known and unknown uncertainties. These uncertainties mayinclude inaccuracies in or incompleteness of the information available to the Group, particularly at the preliminary stages ofmatters, and assumptions by the Group as to future rulings of courts or other tribunals or the likely actions or positions takenby regulators or adversaries may prove incorrect. Moreover, estimates of possible loss for these matters are often notamenable to the use of statistical or other quantitative analytical tools frequently used in making judgments and estimates,and are subject to even greater degrees of uncertainty than in many other areas where the Group must exercise judgmentand make estimates. The estimated possible loss, as well as any provisions taken, can be and often are substantially lessthan the amount initially requested by regulators or adversaries or the maximum potential loss that could be incurred were thematters to result in a final adjudication adverse to the Group. Moreover, in several regions in which the Group operates, anadversary often is not required to set forth the amount it is seeking, and where it is, the amount may not be subject to thesame requirements that generally apply to pleading factual allegations or legal claims.
The matters for which the Group determines that the possibility of a future loss is more than remote will change from time totime, as will the matters as to which a reliable estimate can be made and the estimated possible loss for such matters. Actualresults may prove to be significantly higher or lower than the estimate of possible loss in those matters where such an estimatewas made. In addition, loss may be incurred in matters with respect to which the Group believed the likelihood of loss wasremote. In particular, the estimated aggregate possible loss does not represent the Group’s potential maximum loss exposurefor those matters.
The Group may settle litigation or regulatory proceedings or investigations prior to a final judgment or determination of liability.It may do so to avoid the cost, management efforts or negative business, regulatory or reputational consequences of continuingto contest liability, even when the Group believes it has valid defenses to liability. It may also do so when the potentialconsequences of failing to prevail would be disproportionate to the costs of settlement. Furthermore, the Group may, for similarreasons, reimburse counterparties for their losses even in situations where it does not believe that it is legally compelled to doso.

312
Deutsche Bank 2 – Consolidated Financial StatementsAnnual Report 2018
Current Individual Proceedings
Set forth below are descriptions of civil litigation and regulatory enforcement matters or groups of matters for which the Grouphas taken material provisions, or for which there are material contingent liabilities that are more than remote, or for which thereis the possibility of material business or reputational risk; similar matters are grouped together and some matters consist of anumber of proceedings or claims. The disclosed matters include matters for which the possibility of a loss is more than remotebut for which the Group cannot reliably estimate the possible loss. Sets of matters are presented in English-languagealphabetical order based on the titles the Group has used for them.
Danske Bank Estonia Investigations. Deutsche Bank has received requests for information from regulatory and lawenforcement agencies concerning the Bank’s correspondent banking relationship with Danske Bank, including the Bank’shistorical processing of correspondent banking transactions on behalf of customers of Danske Bank’s Estonia branch prior tocessation of the correspondent banking relationship with that branch in 2015. Deutsche Bank is providing information to andotherwise cooperating with the investigating agencies. The Bank is also conducting an internal investigation into these matters,including of whether any violations of law, regulation or policy occurred and the effectiveness of the related internal controlenvironment.
The Group has not established a provision or contingent liability with respect to this matter.
FX Investigations and Litigations. Deutsche Bank has received requests for information from certain regulatory and lawenforcement agencies globally who investigated trading in, and various other aspects of, the foreign exchange market.Deutsche Bank cooperated with these investigations. Relatedly, Deutsche Bank has conducted its own internal global reviewof foreign exchange trading and other aspects of its foreign exchange business.
On October 19, 2016, the US Commodity Futures Trading Commission (CFTC), Division of Enforcement issued a letter(“CFTC Letter”) notifying Deutsche Bank that the CFTC Division of Enforcement “is not taking any further action at this timeand has closed the investigation of Deutsche Bank” regarding foreign exchange. As is customary, the CFTC Letter states thatthe CFTC Division of Enforcement “maintains the discretion to decide to reopen the investigation at any time in the future.”The CFTC Letter has no binding impact on other regulatory and law enforcement agency investigations regarding DeutscheBank’s foreign exchange trading and practices, which remain pending.
On December 7, 2016, it was announced that Deutsche Bank reached an agreement with CADE, the Brazilian antitrustenforcement agency, to settle an investigation into conduct by a former Brazil-based Deutsche Bank trader. As part of thatsettlement, Deutsche Bank paid a fine of BRL 51 million and agreed to continue to comply with the CADE’s administrativeprocess until it is concluded. This resolves CADE’s administrative process as it relates to Deutsche Bank, subject to DeutscheBank’s continued compliance with the settlement terms.
On February 13, 2017, the US Department of Justice (DOJ), Criminal Division, Fraud Section, issued a letter (“DOJ Letter”)notifying Deutsche Bank that the DOJ has closed its criminal inquiry “concerning possible violations of federal criminal law inconnection with the foreign exchange markets.” As is customary, the DOJ Letter states that the DOJ may reopen its inquiry ifit obtains additional information or evidence regarding the inquiry. The DOJ Letter has no binding impact on other regulatoryand law enforcement agency investigations regarding Deutsche Bank’s foreign exchange trading and practices, which remainpending.
On April 20, 2017, it was announced that Deutsche Bank AG, DB USA Corporation and Deutsche Bank AG New York Branchreached an agreement with the Board of Governors of the Federal Reserve System to settle an investigation into DeutscheBank’s foreign exchange trading and practices. Under the terms of the settlement, Deutsche Bank entered into a cease-and-desist order, and agreed to pay a civil monetary penalty of US$ 137 million. In addition, the Federal Reserve ordered DeutscheBank to “continue to implement additional improvements in its oversight, internal controls, compliance, risk management andaudit programs” for its foreign exchange business and other similar products, and to periodically report to the Federal Reserveon its progress.

313
Deutsche Bank Notes to the Consolidated Balance SheetAnnual Report 2018 Provisions
On June 20, 2018, it was announced that Deutsche Bank AG and Deutsche Bank AG New York Branch reached an agreementwith the New York State Department of Financial Services (DFS) to settle an investigation into Deutsche Bank’s foreign exchangetrading and sales practices. Under the terms of the settlement, Deutsche Bank entered into a consent order, and agreed to paya civil monetary penalty of US$ 205 million. In addition, the DFS ordered Deutsche Bank to continue to implement improvementsin its oversight, internal controls, compliance, risk management and audit programs for its foreign exchange business, and toperiodically report to the DFS on its progress.
Investigations conducted by certain other regulatory agencies are ongoing, and Deutsche Bank has cooperated with theseinvestigations.
On August 6, 2018, the US District Court for the Southern District of New York issued a final order approving Deutsche Bank’sUS$190 million settlement and plaintiffs’ dismissal with prejudice of the consolidated action ( In re Foreign ExchangeBenchmark Rates Antitrust Litigation). The consolidated action was brought on behalf of a putative class of over-the-countertraders and a putative class of central-exchange traders, who are domiciled in or traded in the United States or its territories,and alleged illegal agreements to restrain competition with respect to and to manipulate both benchmark rates and spot rates,particularly the spreads quoted on those spot rates. On July 10, 2018, the US Court of Appeals for the Second Circuit affirmedthe district court’s dismissal of Doris Sue Allen v. Bank of America, et al., a putative class action that tracked the allegationsin the consolidated action and asserted that such purported conduct gave rise to, and resulted in a breach of, defendants’fiduciary duties under the US Employment Retirement Income Security Act of 1974. On September 6, 2018, the US DistrictCourt for the Southern District of New York denied Axiom Investment Advisors, LLC’s (“Axiom”) motion for class certificationin Axiom v. Deutsche Bank AG. Axiom’s motion for voluntary dismissal with prejudice was granted on January 18, 2019. Thisputative class action alleged that Deutsche Bank rejected FX orders placed over electronic trading platforms through theapplication of a function referred to as “Last Look” and that these orders were later filled at prices less favorable to putativeclass members. One US putative class action remains pending against Deutsche Bank. Filed on September 26, 2016,amended on March 24, 2017, and later consolidated with a similar action that was filed on April 28, 2017, the "IndirectPurchasers" action (Contant, et al. v. Bank of America Corp., et al.) tracks the allegations in the consolidated action andasserts that such purported conduct injured “indirect purchasers” of FX instruments. These claims are brought pursuant to theSherman Act and various states’ consumer protection statutes. On March 15, 2018, the court granted Deutsche Bank’s motionto dismiss this action. Plaintiffs filed a motion to replead and proposed an amended complaint on April 5, 2018, which DeutscheBank opposed. On October 25, 2018, the US District Court for the Southern District of New York granted plaintiffs’ motion anda second amended complaint was filed on November 28, 2018. Discovery has commenced in the Indirect Purchasers action.Filed on November 7, 2018, Allianz, et al. v. Bank of America Corporation, et al., was brought on an individual basis by agroup of asset managers who opted out of the settlement in the consolidated action. Plaintiffs filed an amended complaint onMarch 1, 2019. Deutsche Bank’s response to that complaint is due on April 1, 2019. Limited discovery has commencedpending resolution of defendants’ motion to dismiss.
Deutsche Bank also has been named as a defendant in two Canadian class proceedings brought in the provinces of Ontarioand Quebec. Filed on September 10, 2015, these class actions assert factual allegations similar to those made in theconsolidated action in the United States and seek damages pursuant to the Canadian Competition Act as well as other causesof action. Plaintiffs in the Ontario action have moved for class certification and completed service of their class certificationmotion record on June 23, 2017. Deutsche Bank has opposed class certification, and a hearing on the class certificationmotion is scheduled for June 10 to 14, 2019.
Deutsche Bank has also been named as a defendant in two putative class actions filed in Israel. Filed in September 2018,these actions assert factual allegations similar to those made in the consolidated action in the United States and seek damagespursuant to Israeli antitrust law as well as other causes of action. These actions are in preliminary stages.
The Group has not disclosed whether it has established a provision or contingent liability with respect to these matters becauseit has concluded that such disclosure can be expected to prejudice seriously their outcome.
314
Deutsche Bank 2 – Consolidated Financial StatementsAnnual Report 2018
Interbank and Dealer Offered Rates Matters. Regulatory and Law Enforcement Matters. Deutsche Bank has responded torequests for information from, and cooperated with, various regulatory and law enforcement agencies, in connection withindustry-wide investigations concerning the setting of the London Interbank Offered Rate (LIBOR), Euro Interbank OfferedRate (EURIBOR), Tokyo Interbank Offered Rate (TIBOR) and other interbank and/or dealer offered rates.
As previously reported, Deutsche Bank paid € 725 million to the European Commission pursuant to a settlement agreementdated December 4, 2013 in relation to anticompetitive conduct in the trading of interest rate derivatives.
Also as previously reported, on April 23, 2015, Deutsche Bank entered into separate settlements with the DOJ, the CFTC, theUK Financial Conduct Authority (FCA), and the New York State Department of Financial Services (DFS) to resolveinvestigations into misconduct concerning the setting of LIBOR, EURIBOR, and TIBOR. Under the terms of these agreements,Deutsche Bank agreed to pay penalties of US$ 2.175 billion to the DOJ, CFTC and DFS and GBP 226.8 million to the FCA.As part of the resolution with the DOJ, DB Group Services (UK) Limited (an indirectly-held, wholly-owned subsidiary ofDeutsche Bank) pled guilty to one count of wire fraud in the US District Court for the District of Connecticut and DeutscheBank entered into a Deferred Prosecution Agreement with a three year term pursuant to which it agreed (among other things)to the filing of an Information in the US District Court for the District of Connecticut charging Deutsche Bank with one count ofwire fraud and one count of price fixing in violation of the Sherman Act. On April 23, 2018, the Deferred Prosecution Agreementexpired, and the US District Court for the District of Connecticut subsequently dismissed the criminal Information againstDeutsche Bank. The fines referred to above, which include a US$ 150 million fine paid in April 2017 following the March 28,2017 sentencing of DB Group Services (UK) Limited, have been paid in full and do not form part of the Bank’s provisions.
As previously reported, on March 20, 2017, Deutsche Bank paid CHF 5.4 million to the Swiss Competition Commission(WEKO) pursuant to a settlement agreement in relation to Yen LIBOR.
On October 25, 2017, Deutsche Bank entered into a settlement with a working group of US state attorneys general resolvingtheir interbank offered rate investigation. Among other conditions, Deutsche Bank agreed to make a settlement payment ofUS$ 220 million. The settlement amount has been paid in full and does not form part of the Bank’s provisions.
Other investigations of Deutsche Bank concerning the setting of various interbank and/or dealer offered rates remain ongoing.
The Group has not disclosed whether it has established a provision or contingent liability with respect to the remaininginvestigations because it has concluded that such disclosure can be expected to prejudice seriously their outcome.
Overview of Civil Litigations. Deutsche Bank is party to 45 US civil actions concerning alleged manipulation relating to thesetting of various interbank and/or dealer offered rates which are described in the following paragraphs, as well as singleactions pending in each of the UK, Israel and Argentina. Most of the civil actions, including putative class actions, are pendingin the US District Court for the Southern District of New York (SDNY), against Deutsche Bank and numerous other defendants.All but four of the US civil actions were filed on behalf of parties who allege losses as a result of manipulation relating to thesetting of US dollar LIBOR. The four civil actions pending against Deutsche Bank that do not relate to US dollar LIBOR arealso pending in the SDNY, and include one consolidated action concerning Pound Sterling (GBP) LIBOR, one actionconcerning Swiss franc (CHF) LIBOR, one action concerning two Singapore Dollar (SGD) benchmark rates, the SingaporeInterbank Offered Rate (SIBOR) and the Swap Offer Rate (SOR), and one action concerning the Canadian Dealer OfferedRate (CDOR).
Claims for damages for all 45 of the US civil actions discussed have been asserted under various legal theories, includingviolations of the US Commodity Exchange Act, federal and state antitrust laws, the US Racketeer Influenced and CorruptOrganizations Act, and other federal and state laws. The Group has not disclosed whether it has established a provision orcontingent liability with respect to these matters because it has concluded that such disclosure can be expected to prejudiceseriously their outcome.
315
Deutsche Bank Notes to the Consolidated Balance SheetAnnual Report 2018 Provisions
US dollar LIBOR. With three exceptions, all of the US civil actions concerning US dollar LIBOR are being coordinated as partof a multidistrict litigation (the “US dollar LIBOR MDL”) in the SDNY. In light of the large number of individual cases pendingagainst Deutsche Bank and their similarity, the civil actions included in the US dollar LIBOR MDL are now subsumed underthe following general description of the litigation pertaining to all such actions, without disclosure of individual actions exceptwhen the circumstances or the resolution of an individual case is material to Deutsche Bank.
Following a series of decisions in the US dollar LIBOR MDL between March 2013 and December 2016 narrowing their claims,plaintiffs are currently asserting antitrust claims, claims under the US Commodity Exchange Act and state law fraud, contract,unjust enrichment and other tort claims. The court has also issued decisions dismissing certain plaintiffs’ claims for lack ofpersonal jurisdiction and on statute of limitations grounds.
On December 20, 2016, the district court issued a ruling dismissing certain antitrust claims while allowing others to proceed.Multiple plaintiffs have filed appeals of the district court’s December 20, 2016 ruling to the US Court of Appeals for the SecondCircuit, and those appeals are proceeding in parallel with the ongoing proceedings in the district court. Briefing of the appealsis complete.
On July 13, 2017, Deutsche Bank executed a settlement agreement in the amount of US$ 80 million with plaintiffs to resolvea putative class action pending as part of the US dollar LIBOR MDL asserting claims based on alleged transactions inEurodollar futures and options traded on the Chicago Mercantile Exchange (Metzler Investment GmbH v. Credit Suisse GroupAG). The settlement agreement was submitted to the court for preliminary approval on October 11, 2017. The settlementamount is already fully reflected in existing litigation provisions and no additional provisions have been taken for thissettlement. The settlement agreement is subject to further review and approval by the court.
On February 6, 2018, Deutsche Bank executed a settlement agreement in the amount of US$ 240 million with plaintiffs toresolve a putative class action pending as part of the US dollar LIBOR MDL asserting claims based on alleged transactionsin US dollar LIBOR-linked financial instruments purchased over the counter directly from LIBOR panel banks (Mayor & CityCouncil of Baltimore v. Credit Suisse AG). The agreement was submitted to the court for approval, and the court granted finalapproval of the settlement on October 25, 2018. Accordingly, the action is not included in the total number of actions above.The settlement amount, which Deutsche Bank has paid, is no longer reflected in Deutsche Bank’s litigation provisions.
Plaintiff in one of the non-MDL cases proceeding in the SDNY moved to amend its complaint following a dismissal of its claims.On March 20, 2018, the court denied plaintiff’s motion for leave to amend and entered judgment in the action, closing the case.Plaintiff has appealed the court’s decision, and briefing of the appeal is complete.
On January 15 and 31, 2019, plaintiffs filed two putative class action complaints in the SDNY against several financialinstitutions, alleging that the defendants, members of the panel of banks that provided US dollar LIBOR submissions, theorganization that administers LIBOR, and their affiliates, conspired to suppress US dollar LIBOR submissions from February1, 2014 through the present. These actions were subsequently consolidated. A third putative class action complaint was filedon March 4, 2019. These actions are not part of the US dollar LIBOR MDL.
There is a further UK civil action regarding US dollar LIBOR brought by the US Federal Deposit Insurance Corporation, in whicha claim for damages has been asserted pursuant to Article 101 of The Treaty on the Functioning of the European Union, Section 2of Chapter 1 of the UK Competition Act 1998 and US state laws. Deutsche Bank is defending this action.
A further class action regarding LIBOR, EURIBOR and TIBOR has been filed in Israel seeking damages for losses incurred byIsraeli individuals and entities. Deutsche Bank is contesting service and jurisdiction.
Yen LIBOR and Euroyen TIBOR. On July 21, 2017, Deutsche Bank executed a settlement agreement in the amount of US$77 million with plaintiffs to resolve two putative class actions pending in the SDNY alleging manipulation of Yen LIBOR andEuroyen TIBOR (Laydon v. Mizuho Bank, Ltd. and Sonterra Capital Master Fund Ltd. v. UBS AG). The agreement wassubmitted to the court for approval, and the court granted final approval of the settlement on December 7, 2017. Accordingly,these two actions are not included in the total number of actions above. The settlement amount, which Deutsche Bank paid onAugust 1, 2017, is no longer reflected in Deutsche Bank’s litigation provisions.
316
Deutsche Bank 2 – Consolidated Financial StatementsAnnual Report 2018
EURIBOR. On May 10, 2017, Deutsche Bank executed a settlement agreement in the amount of US$ 170 million with plaintiffsto resolve a putative class action pending in the SDNY alleging manipulation of EURIBOR (Sullivan v. Barclays PLC). Theagreement was submitted to the court for approval, and the court granted final approval of the settlement on May 18, 2018.Accordingly, the action is not included in the total number of actions above. The settlement amount, which Deutsche Bank haspaid, is no longer reflected in Deutsche Bank’s litigation provisions.
GBP LIBOR. A putative class action alleging manipulation of the Pound Sterling (GBP) LIBOR remains pending in the SDNY. OnDecember 21, 2018, the court partially granted defendants’ motions to dismiss the action, dismissing all claims against DeutscheBank. On January 22, 2019, the plaintiffs moved for partial reconsideration of the court’s decision; that motion is fully briefed.
CHF LIBOR. A putative class action alleging manipulation of the Swiss Franc (CHF) LIBOR remains pending in the SDNY. It isthe subject of fully briefed motions to dismiss.
SIBOR and SOR. A putative class action alleging manipulation of the Singapore Interbank Offered Rate (SIBOR) and Swap OfferRate (SOR) remains pending in the SDNY. On October 25, 2018, the plaintiff filed a third amended complaint, which is the subjectof a fully briefed motion to dismiss. On December 26, 2018, plaintiff moved the court for leave to file a fourth amended complaint;that motion is fully briefed.
CDOR. A putative class action alleging manipulation of the Canadian Dealer Offered Rate (CDOR) is pending in the SDNY. OnMarch 14, 2019, the court granted defendants’ motions to dismiss the amended complaint, dismissing all actions against DeutscheBank.
Investigations Into Referral Hiring Practices and Certain Business Relationships. Certain regulators and law enforcementauthorities in various jurisdictions, including the US Securities and Exchange Commission and the DOJ, are investigating,among other things, Deutsche Bank’s compliance with the US Foreign Corrupt Practices Act and other laws with respect tothe Bank’s hiring practices related to candidates referred by clients, potential clients and government officials, and the Bank’sengagement of finders and consultants. Deutsche Bank is responding to and continuing to cooperate with these investigations.Certain regulators in other jurisdictions have also been briefed on these investigations. The Group has recorded a provisionwith respect to certain of these regulatory investigations. The Group has not disclosed the amount of this provision becauseit has concluded that such disclosure can be expected to prejudice seriously the outcome of these regulatory investigations.Based on the facts currently known, it is not practicable at this time for the Bank to predict the timing of a resolution.
Kirch. The public prosecutor’s office in Munich (Staatsanwaltschaft München I) has conducted and is currently conductingcriminal investigations in connection with the Kirch case inter alia with regard to former Deutsche Bank Management Boardmembers. The Kirch case involved several civil proceedings between Deutsche Bank AG and Dr. Leo Kirch as well as mediacompanies controlled by him. The key issue was whether an interview given by Dr. Rolf Breuer, then Spokesman of DeutscheBank’s Management Board, in 2002 with Bloomberg television, during which Dr. Breuer commented on Dr. Kirch’s (and hiscompanies’) inability to obtain financing, caused the insolvency of the Kirch companies. In February 2014, Deutsche Bank andthe Kirch heirs reached a comprehensive settlement, which has ended all legal disputes between them.
The allegations of the public prosecutor are that the relevant former Management Board members failed to correct in a timelymanner factual statements made by Deutsche Bank’s litigation counsel in submissions filed in one of the civil cases betweenKirch and Deutsche Bank AG before the Munich Higher Regional Court and the Federal Court of Justice, after allegedly havingbecome aware that such statements were not correct, and/or made incorrect statements in such proceedings, respectively.
On April 25, 2016, following the trial before the Regional Court Munich regarding the main investigation involving JürgenFitschen and four other former Management Board members, the Regional Court acquitted all of the accused, as well as theBank, which was a secondary participant in such proceedings. On April 26, 2016, the public prosecutor filed an appeal. Anappeal is limited to a review of legal errors rather than facts. On October 18, 2016, a few weeks after the written judgmentwas served, the public prosecutor provided notice that it will uphold its appeal only with respect to former Management Boardmembers Jürgen Fitschen, Dr. Rolf Breuer and Dr. Josef Ackermann and that it will withdraw its appeal with respect to formerManagement Board members Dr. Clemens Börsig and Dr. Tessen von Heydebreck for whom the acquittal thereby becomesbinding. On January 24, 2018, the Attorney General’s Office applied to convene an oral hearing before the Federal SupremeCourt to decide about the Munich public prosecutor’s appeal.
The other investigations by the public prosecutor (which also deal with attempted litigation fraud in the Kirch civil proceedings)are ongoing. Deutsche Bank is fully cooperating with the Munich public prosecutor’s office.
The Group does not expect these proceedings to have significant economic consequences for it and has not recorded aprovision or contingent liability with respect thereto.

317
Deutsche Bank Notes to the Consolidated Balance SheetAnnual Report 2018 Provisions
Mortgage-Related and Asset-Backed Securities Matters and Investigation. Regulatory and Governmental Matters.Deutsche Bank, along with certain affiliates (collectively referred in these paragraphs to as “Deutsche Bank”), have receivedsubpoenas and requests for information from certain regulators and government entities, including members of the ResidentialMortgage-Backed Securities Working Group of the US Financial Fraud Enforcement Task Force, concerning its activitiesregarding the origination, purchase, securitization, sale, valuation and/or trading of mortgage loans, residential mortgage-backed securities (RMBS), commercial mortgage-backed securities (CMBS), collateralized debt obligations (CDOs), otherasset-backed securities and credit derivatives. Deutsche Bank is cooperating fully in response to those subpoenas andrequests for information.
On December 23, 2016, Deutsche Bank announced that it reached a settlement-in-principle with the DOJ to resolve potentialclaims related to its RMBS business conducted from 2005 to 2007. The settlement became final and was announced by theDOJ on January 17, 2017. Under the settlement, Deutsche Bank paid a civil monetary penalty of US$ 3.1 billion and agreedto provide US$ 4.1 billion in consumer relief.
In September 2016, Deutsche Bank received administrative subpoenas from the Maryland Attorney General seekinginformation concerning Deutsche Bank’s RMBS and CDO businesses from 2002 to 2009. On June 1, 2017, Deutsche Bankand the Maryland Attorney General reached a settlement to resolve the matter for US$ 15 million in cash and US$ 80 millionin consumer relief (to be allocated from the overall US$ 4.1 billion consumer relief obligation agreed to as part of DeutscheBank’s settlement with the DOJ).
The Group has recorded provisions with respect to some of the outstanding regulatory investigations but not others, a portionof which relates to the consumer relief being provided under the DOJ settlement. The Group has not disclosed the amount ofthese provisions because it has concluded that such disclosure can be expected to prejudice seriously the resolution of thesematters.
Issuer and Underwriter Civil Litigation. Deutsche Bank has been named as defendant in numerous civil litigations brought byprivate parties in connection with its various roles, including issuer or underwriter, in offerings of RMBS and other asset-backedsecurities. These cases, described below, allege that the offering documents contained material misrepresentations andomissions, including with regard to the underwriting standards pursuant to which the underlying mortgage loans were issued,or assert that various representations or warranties relating to the loans were breached at the time of origination. The Grouphas recorded provisions with respect to several of these civil cases, but has not recorded provisions with respect to all of thesematters. The Group has not disclosed the amount of these provisions because it has concluded that such disclosure can beexpected to prejudice seriously the resolution of these matters.
Deutsche Bank is a defendant in a class action relating to its role as one of the underwriters of six RMBS offerings issued byNovastar Mortgage Corporation. No specific damages are alleged in the complaint. The lawsuit was brought by plaintiffsrepresenting a class of investors who purchased certificates in those offerings. The parties reached a settlement to resolvethe matter for a total of US$ 165 million, a portion of which was paid by the Bank. On August 30, 2017, FHFA/Freddie Macfiled an objection to the settlement and shortly thereafter appealed the district court’s denial of their request to stay settlementapproval proceedings, which appeal was resolved against FHFA/Freddie Mac. The court approved the settlement on March7, 2019 over FHFA/Freddie Mac’s objections. The parties have 60 days from entry of the order to file an appeal.
Deutsche Bank is a defendant in three actions related to RMBS offerings brought by the US Federal Deposit InsuranceCorporation (FDIC) as receiver for: (a) Colonial Bank (alleging no less than US$ 213 million in damages against alldefendants), (b) Guaranty Bank (alleging no less than US$ 901 million in damages against all defendants), and (c) CitizensNational Bank and Strategic Capital Bank (alleging an unspecified amount in damages against all defendants). In each ofthese actions, the appellate courts reinstated claims previously dismissed on statute of limitations grounds and petitions forrehearing and certiorari to the US Supreme Court were denied. In the case concerning Colonial Bank, on June 21, 2017, theFDIC filed a second amended complaint, which defendants moved to dismiss on September 7, 2017. On March 2, 2018, thecourt granted in part and denied in part defendants’ motion to dismiss. In the case concerning Guaranty Bank, on September14, 2017, the court granted in part Deutsche Bank’s motion for summary judgment regarding the proper method of calculatingpre-judgment interest. On August 31, 2018, the court vacated the March 2019 trial date. On September 27, 2018, the courtordered that the case must go to mediation before January 11, 2019, and that it is stayed in the meantime. The parties engagedin mediation on November 27, 2018. No settlement was reached during the mediation. The court re-opened the case and, onJanuary 2, 2019, set a trial date of August 26, 2019. In the case concerning Citizens National Bank and Strategic CapitalBank, on July 31, 2017, the FDIC filed a second amended complaint, which defendants moved to dismiss on September 14,2017. The case is stayed pending resolution of defendants’ motion to dismiss.
318
Deutsche Bank 2 – Consolidated Financial StatementsAnnual Report 2018
Deutsche Bank is a defendant in an action brought by Royal Park Investments (as purported assignee of claims of a special-purpose vehicle created to acquire certain assets of Fortis Bank) alleging common law claims related to the purchase ofRMBS. The complaint did not specify the amount of damages sought. On April 17, 2017, the court dismissed the complaint,and on February 13, 2018, the plaintiff filed its appeal. On October 9, 2018, the dismissal was affirmed by the appellate court.Plaintiff filed a motion for leave to appeal to the New York Court of Appeals on November 8, 2018. Defendants filed anopposition on November 21, 2018, which completed the briefing. On January 15, 2019, the New York Court of Appeals deniedthe motion.
In June 2014, HSBC, as trustee, brought an action in New York state court against Deutsche Bank to revive a prior action,alleging that Deutsche Bank failed to repurchase mortgage loans in the ACE Securities Corp. 2006-SL2 RMBS offering. Therevival action was stayed during the pendency of an appeal of the dismissal of a separate action wherein HSBC, as trustee,brought an action against Deutsche Bank alleging breaches of representations and warranties made by Deutsche Bankconcerning the mortgage loans in the same offering. On March 29, 2016, the court dismissed the revival action, and onApril 29, 2016, plaintiff filed a notice of appeal. Plaintiff’s appeal has been adjourned to the appellate court’s September 2019term.
Deutsche Bank is a defendant in two cases brought initially by RMBS investors and subsequently by HSBC, as trustee, inNew York state court. The cases allege breaches of loan-level representations and warranties in the ACE Securities Corp.2006-FM1 and ACE Securities Corp. 2007-ASAP1 RMBS offerings, respectively. Both cases were dismissed on statute oflimitations grounds by the trial court on March 28, 2018. Plaintiff has appealed the dismissals, which appeals remain pending.
In the actions against Deutsche Bank solely as an underwriter of other issuers’ RMBS offerings, Deutsche Bank hascontractual rights to indemnification from the issuers, but those indemnity rights may in whole or in part prove effectivelyunenforceable where the issuers are now or may in the future be in bankruptcy or otherwise defunct.
Trustee Civil Litigation. Deutsche Bank is a defendant in civil lawsuits brought by various groups of investors concerning itsrole as trustee of certain RMBS trusts. The actions generally allege claims for breach of contract, breach of fiduciary duty,breach of the duty to avoid conflicts of interest, negligence and/or violations of the US Trust Indenture Act of 1939, based onthe trustees’ alleged failure to perform adequately certain obligations and/or duties as trustee for the trusts.
Two putative class actions brought by a group of investors, including funds managed by BlackRock Advisors, LLC, PIMCO-Advisors, L.P., and others recently were settled. One of these putative class actions was pending in the Superior Court ofCalifornia until the court dismissed the action with prejudice on January 11, 2019. The second putative class action waspending in the US District Court for the Southern District of New York and was dismissed with prejudice on December 6, 2018.Deutsche Bank was also a defendant in a lawsuit brought by the Western and Southern Life Insurance Company and fiverelated entities, but on September 28, 2017, plaintiffs filed a notice of voluntary dismissal of their claims.
Deutsche Bank is currently a defendant in six separate civil lawsuits – two putative class actions and four individual lawsuits.
The putative class actions were brought by Royal Park Investments SA/NV, concern 10 trusts, and are pending in the USDistrict Court for the Southern District of New York.
In the first case, which plaintiff filed on June 18, 2014, plaintiff alleges that the trusts suffered total realized collateral losses ofmore than US$ 3.1 billion, although the complaint does not specify a damage amount. On March 29, 2018, the court issuedan order denying plaintiff’s renewed motion for class certification, and on August 7, 2018, the court of appeals denied plaintiff’smotion for leave to immediately appeal the denial of class certification. On September 28, 2018, the court denied plaintiff’smotion seeking permission to prove liability and damages using a statistical sample of the loans at issue in the case. Discoveryis ongoing. On August 4, 2017, Royal Park filed a separate, additional class action complaint against the trustee assertingclaims for breach of contract, unjust enrichment, conversion, breach of trust, equitable accounting and declaratory andinjunctive relief arising out of the payment from trust funds of the trustee’s legal fees and expenses in the other, ongoing RoyalPark litigation. On August 13, 2018, the court stayed the action pending resolution of the underlying Royal Park litigation anddenied the trustee’s motion to dismiss without prejudice to its refiling once the stay is lifted.
319
Deutsche Bank Notes to the Consolidated Balance SheetAnnual Report 2018 Provisions
The four individual lawsuits include actions by (a) the National Credit Union Administration Board (“NCUA”), as an investor in37 trusts, which allegedly suffered total realized collateral losses of US$ 8.5 billion; (b) certain CDOs (collectively, “PhoenixLight”) that hold RMBS certificates issued by 43 RMBS trusts, and seeking “hundreds of millions of dollars in damages”; (c)Commerzbank AG, as an investor in 50 RMBS trusts, seeking recovery for alleged “hundreds of millions of dollars in losses;”and (d) IKB International, S.A. in Liquidation and IKB Deutsche Industriebank AG (collectively, “IKB”), as an investor in 30RMBS trusts, seeking more than US$ 268 million of damages. In the NCUA case, NCUA notified the court on August 31, 2018that it was dismissing claims relating to 60 out of the 97 trusts originally at issue; NCUA’s motion for leave to amend itscomplaint and Deutsche Bank’s motion to dismiss the complaint if the court grants NCUA’s motion for leave to amend are fullybriefed as of December 19, 2018. In the Phoenix Light case, the plaintiffs filed an amended complaint on September 27, 2017,and the trustees filed an answer to the complaint on November 13, 2017. On December 7, 2018, the parties filed motions forsummary judgment. In the Commerzbank case, the plaintiff filed an amended complaint on November 30, 2017, and thetrustees filed an answer to the complaint on January 29, 2018. On December 7, 2018, the parties filed motions for summaryjudgment. In the IKB case, the court heard oral argument on the trustee’s motion to dismiss on May 3, 2017, but has not yetissued a decision. On June 20, 2017, the IKB plaintiffs stipulated to the dismissal with prejudice of all claims asserted againstDeutsche Bank concerning four trusts. Discovery is ongoing.
The Group has established contingent liabilities and provisions with respect to certain of these matters but the Group has notdisclosed the amounts because it has concluded that such disclosure can be expected to prejudice seriously the outcome ofthese matters.
Postbank Voluntary Public Takeover Offer. On September 12, 2010, Deutsche Bank announced the decision to make avoluntary takeover offer for the acquisition of all shares in Deutsche Postbank AG (Postbank). On October 7, 2010, the Bankpublished the official offer document. In its takeover offer, Deutsche Bank offered Postbank shareholders consideration of€ 25 for each Postbank share. The takeover offer was accepted for a total of approximately 48.2 million Postbank shares.
In November 2010, a former shareholder of Postbank, Effecten-Spiegel AG, which had accepted the takeover offer, broughta claim against Deutsche Bank alleging that the offer price was too low and was not determined in accordance with theapplicable law of the Federal Republic of Germany. The plaintiff alleges that Deutsche Bank had been obliged to make amandatory takeover offer for all shares in Postbank, at the latest, in 2009. The plaintiff avers that, at the latest in 2009, thevoting rights of Deutsche Post AG in Postbank had to be attributed to Deutsche Bank AG pursuant to Section 30 of the GermanTakeover Act. Based thereon, the plaintiff alleges that the consideration offered by Deutsche Bank AG for the shares inPostbank in the 2010 voluntary takeover offer needed to be raised to € 57.25 per share.
The Regional Court Cologne (Landgericht) dismissed the claim in 2011 and the Cologne appellate court dismissed the appealin 2012. The Federal Court set aside the Cologne appellate court’s judgment and referred the case back to the appellate court.In its judgment, the Federal Court stated that the appellate court had not sufficiently considered the plaintiff’s allegation thatDeutsche Bank AG and Deutsche Post AG “acted in concert” in 2009.
Starting in 2014, additional former shareholders of Postbank, who accepted the 2010 tender offer, brought similar claims asEffecten-Spiegel AG against Deutsche Bank which are pending with the Regional Court Cologne and the Higher RegionalCourt of Cologne, respectively. On October 20, 2017, the Regional Court Cologne handed down a decision granting the claimsin a total of 14 cases which were combined in one proceeding. The Regional Court Cologne took the view that Deutsche Bankwas obliged to make a mandatory takeover offer already in 2008 so that the appropriate consideration to be offered in thetakeover offer should have been € 57.25 per share. Taking the consideration paid into account, the additional considerationper share owed to shareholders which have accepted the takeover offer would thus amount to € 32.25. Deutsche Bankappealed this decision and the appeal has been assigned to the 13th Senate of the Higher Regional Court of Cologne, whichalso is hearing the appeal of Effecten-Spiegel AG.
On November 8, 2017, a hearing took place before the Higher Regional Court of Cologne in the Effecten-Spiegel case. In thathearing, the Higher Regional Court indicated that it disagreed with the conclusions of the Regional Court Cologne and tookthe preliminary view that Deutsche Bank was not obliged to make a mandatory takeover offer in 2008 or 2009. Initially theHigher Regional Court resolved to announce a decision on December 13, 2017. However, this was postponed to February2018 because the plaintiff challenged the three members of the 13th Senate of the Higher Regional Court of Cologne foralleged prejudice. The challenge was rejected by the Higher Regional Court of Cologne at the end of January 2018. InFebruary 2018, the court granted a motion by Effecten-Spiegel AG to re-open the hearing.
320
Deutsche Bank 2 – Consolidated Financial StatementsAnnual Report 2018
The Higher Regional Court informed the parties by notice dated February 19, 2019 that it has doubts that an acting in concertcan be based on the contractual clauses which the Regional Court Cologne found to be sufficient to assume an acting inconcert (and to grant the plaintiffs' claims in October 2017). Against this background, the Higher Regional Court resolved totake further evidence and to call a number of witnesses in both cases who shall be heard from October 30, 2019 until at leastDecember 11, 2019 in weekly hearings. The individuals to be heard include current and former board members of DeutscheBank, Deutsche Post AG and Postbank as well as other persons involved in the Postbank transaction. The court furtherinformed the parties that it is considering to request from Deutsche Bank the production of relevant transaction documents.The hearings to take evidence initially scheduled for March 27, 2019 and (as a precautionary measure) April 3 and May 29,2019 were canceled.
Stefan Krause, a former Deutsche Bank Management Board member, (who is to testify on request of the plaintiffs) has invokedthe right to refuse to give testimony because in February 2018 a law firm representing some plaintiffs in the above-mentionedcivil actions had filed a criminal complaint with the public prosecutor in Frankfurt am Main against certain Deutsche Bankpersonnel alleging that they engaged in fraudulent conduct in connection with the takeover offer. However, the competentpublic prosecutors rejected opening proceedings. The Higher Regional Court Cologne has set March 20, 2019 as the date fora hearing on the legality of the refusal to testify in court.
Deutsche Bank has been served with a large number of additional lawsuits filed against Deutsche Bank shortly before the endof 2017, almost all of which are now pending with the Regional Court Cologne. Some of the new plaintiffs allege that theconsideration offered by Deutsche Bank AG for the shares in Postbank in the 2010 voluntary takeover should be raised to €64.25 per share.
The claims for payment against Deutsche Bank in relation to these matters total almost € 700 million (excluding interest).
The Group has established a contingent liability with respect to these matters but the Group has not disclosed the amount ofthis contingent liability because it has concluded that such disclosure can be expected to prejudice seriously the outcome ofthese matters.
Further Proceedings Relating to the Postbank Takeover. In September 2015, former shareholders of Postbank filed in theRegional Court Cologne shareholder actions against Postbank to set aside the squeeze-out resolution taken in theshareholders meeting of Postbank in August 2015. Among other things, the plaintiffs allege that Deutsche Bank was subjectto a suspension of voting rights with respect to its shares in Postbank based on the allegation that Deutsche Bank failed tomake a mandatory takeover offer at a higher price in 2009. The squeeze out is final and the proceeding itself has no reversaleffect, but may result in damage payments. The claimants in this proceeding refer to legal arguments similar to those assertedin the Effecten-Spiegel proceeding described above. In a decision on October 20, 2017, the Regional Court Cologne declaredthe squeeze-out resolution to be void. The court, however, did not rely on a suspension of voting rights due to an allegedfailure of Deutsche Bank to make a mandatory takeover offer, but argued that Postbank violated information rights of Postbankshareholders in Postbank's shareholders meeting in August 2015. Postbank has appealed this decision.
The legal question of whether Deutsche Bank had been obliged to make a mandatory takeover offer for all Postbank sharesprior to its 2010 voluntary takeover may also impact two pending appraisal proceedings (Spruchverfahren). These proceedingswere initiated by former Postbank shareholders with the aim to increase the cash compensation offered in connection with thesqueeze-out of Postbank shareholders in 2015 and the cash compensation offered and annual guaranteed dividend paid inconnection with the execution of a domination and profit and loss transfer agreement (Beherrschungs- undGewinnabführungsvertrag) between DB Finanz-Holding AG (now DB Beteiligungs-Holding GmbH) and Postbank in 2012. TheRegional Court Cologne issued resolutions indicating that it is inclined to consider a potential obligation of Deutsche Bank tomake a mandatory takeover offer for Postbank at an offer price of € 57.25 when determining the adequate cash compensationin the appraisal proceedings. The cash compensation paid in connection with the domination and profit and loss transferagreement was € 25.18 and was accepted for approximately 0.5 million shares. The squeeze-out compensation paid in 2015was € 35.05 and approximately 7 million shares were squeezed-out.
The Group has not disclosed whether it has established a provision or contingent liability with respect to this matter becauseit has concluded that such disclosure can be expected to prejudice seriously its outcome.
321
Deutsche Bank Notes to the Consolidated Balance SheetAnnual Report 2018 Provisions
Russia/UK Equities Trading Investigation. Deutsche Bank has investigated the circumstances around equity trades enteredinto by certain clients with Deutsche Bank in Moscow and London that offset one another. The total volume of transactionsreviewed is significant. Deutsche Bank's internal investigation of potential violations of law, regulation and policy and into therelated internal control environment has concluded, and Deutsche Bank has assessed the findings identified during theinvestigation; to date it has identified certain violations of Deutsche Bank’s policies and deficiencies in Deutsche Bank's controlenvironment. Deutsche Bank has advised regulators and law enforcement authorities in several jurisdictions (includingGermany, Russia, the UK and the United States) of this investigation. Deutsche Bank has taken disciplinary measures withregards to certain individuals in this matter.
On January 30 and 31, 2017, the DFS and the FCA announced settlements with the Bank related to their investigations intothis matter. The settlements conclude the DFS and the FCA’s investigations into the Bank’s anti-money laundering (AML)control function in its investment banking division, including in relation to the equity trading described above. Under the termsof the settlement agreement with the DFS, Deutsche Bank entered into a consent order, and agreed to pay civil monetarypenalties of US$ 425 million and to engage an independent monitor for a term of up to two years. Under the terms of thesettlement agreement with the FCA, Deutsche Bank agreed to pay civil monetary penalties of approximately GBP 163 million.On May 30, 2017, the Federal Reserve announced its settlement with the Bank resolving this matter as well as additional AMLissues identified by the Federal Reserve. Deutsche Bank paid a penalty of US$ 41 million. Deutsche Bank also agreed toretain independent third parties to assess its Bank Secrecy Act/AML program and review certain foreign correspondentbanking activity of its subsidiary Deutsche Bank Trust Company Americas. The Bank is also required to submit writtenremediation plans and programs.
Deutsche Bank continues to cooperate with regulators and law enforcement authorities, including the DOJ which has its ownongoing investigation into these securities trades. The Group has recorded a provision with respect to the remaininginvestigation. The Group has not disclosed the amount of this provision because it has concluded that such disclosure can beexpected to prejudice seriously the outcome of this matter.
Sovereign, Supranational and Agency Bonds (SSA) Investigations and Litigations. Deutsche Bank has received inquiriesfrom certain regulatory and law enforcement authorities, including requests for information and documents, pertaining to SSAbond trading. Deutsche Bank is cooperating with these investigations.
On December 20, 2018, the European Commission sent a Statement of Objections to Deutsche Bank regarding a potentialbreach of EU antitrust rules in relation to secondary market trading of SSA bonds denominated in US dollars. The sending ofa Statement of Objections is a step in the European Commission’s investigation and does not prejudge the outcome of theinvestigation. Deutsche Bank has proactively cooperated with the European Commission in this matter and as a result hasbeen granted immunity. In accordance with the European Commission’s guidelines, Deutsche Bank does not expect a financialpenalty.
Deutsche Bank is a defendant in several putative class action complaints filed in the US District Court for the Southern Districtof New York by alleged direct and indirect market participants claiming violations of antitrust law and common law related toalleged manipulation of the secondary trading market for SSA bonds. Deutsche Bank has reached an agreement to settle theactions by direct market participants for the amount of US$48.5 million and has recorded a provision in the same amount. Thesettlement is subject to court approval. The action filed on behalf of alleged indirect market participants is in its early stages.
Deutsche Bank is also a defendant in putative class actions filed on November 7, 2017 and December 5, 2017 in the OntarioSuperior Court of Justice and Federal Court of Canada, respectively, claiming violations of antitrust law and the common lawrelating to alleged manipulation of secondary trading of SSA bonds. The complaints rely on allegations similar to those in theUS class actions involving SSA bond trading, and seek compensatory and punitive damages. The cases are in their earlystages.
Deutsche Bank was named as a defendant in several putative class action complaints filed in the US District Court for theSouthern District of New York alleging violations of US antitrust law and a claim for unjust enrichment relating to Mexicangovernment bond trading. The case is in its early stages.
Deutsche Bank has also been named as a defendant in four putative class action complaints filed in February and March 2019in the US District Court for the Southern District of New York alleging violations of antitrust law and common law related toalleged manipulation of the secondary trading market for US Agency bonds. These cases are in the early stages.
Other than as noted above, the Group has not disclosed whether it has established provisions or contingent liabilities withrespect to the matters referred to above because it has concluded that such disclosure can be expected to prejudice seriouslytheir outcome.

322
Deutsche Bank 2 – Consolidated Financial StatementsAnnual Report 2018
Trust Preferred Securities Litigation. Deutsche Bank and certain of its affiliates and former officers are the subject of aconsolidated putative class action, filed in the United States District Court for the Southern District of New York, assertingclaims under the federal securities laws on behalf of persons who purchased certain trust preferred securities issued byDeutsche Bank and its affiliates between October 2006 and May 2008. In a series of opinions, the court dismissed all claimsas to four of the six offerings at issue, but allowed certain alleged omissions claims relating to the November 2007 and February2008 offerings to proceed. The district court limited claims relating to the two offerings remaining in the case to alleged failures(i) to disclose “any known trends or uncertainties that have had or that the registrant reasonably expects will have a materialfavorable or unfavorable impact on net sales or revenues or income from continuing operations” and (ii) to disclose “the mostsignificant factors that make the offering speculative or risky” pursuant to Items 303 and 503 of Regulation S-K. Defendantshave served Answers denying all wrongdoing. On October 2, 2018, the district court certified a plaintiff class as to bothofferings. Merits discovery is ongoing.
The Group has not disclosed whether it has established a provision or contingent liability with respect to this matter becauseit has concluded that such disclosure can be expected to prejudice seriously its outcome.
US Treasury Securities Investigations and Litigations. Deutsche Bank has received inquiries from certain regulatory and lawenforcement authorities, including requests for information and documents, pertaining to US Treasuries auctions, trading, andrelated market activity. Deutsche Bank is cooperating with these investigations.
Deutsche Bank‘s subsidiary Deutsche Bank Securities Inc. (DBSI) was a defendant in several putative class actions allegingviolations of US antitrust law, the US Commodity Exchange Act and common law related to the alleged manipulation of theUS Treasury securities market. These cases have been consolidated in the Southern District of New York. On November 16,2017, plaintiffs filed a consolidated amended complaint, which did not name DBSI as a defendant. On December 11, 2017,the court dismissed DBSI from the class action without prejudice.
The Group has not disclosed whether it has established a provision or contingent liability with respect to these matters becauseit has concluded that such disclosure can be expected to prejudice seriously their outcome.

323
Deutsche Bank Notes to the Consolidated Balance SheetAnnual Report 2018 Credit related Commitments and Contingent Liabilities
30 – Credit related Commitments and Contingent Liabilities
Irrevocable lending commitments and lending related contingent liabilities
In the normal course of business the Group regularly enters into irrevocable lending commitments, including frontingcommitments as well as contingent liabilities consisting of financial and performance guarantees, standby letters of credit andindemnity agreements on behalf of its customers. Under these contracts the Group is required to perform under an obligationagreement or to make payments to the beneficiary based on third party’s failure to meet its obligations. For these instrumentsit is not known to the Group in detail if, when and to what extent claims will be made. In the event that the Group has to payout cash in respect of its fronting commitments, the Group would immediately seek reimbursement from the other syndicatelenders. The Group considers all the above instruments in monitoring the credit exposure and may require collateral to mitigateinherent credit risk. If the credit risk monitoring provides sufficient perception about a loss from an expected claim, a provisionis established and recorded on the balance sheet.
The following table shows the Group’s revocable lending commitments, irrevocable lending commitments and lending relatedcontingent liabilities without considering collateral or provisions. It shows the maximum potential utilization of the Group incase all these liabilities entered into must be fulfilled. The table therefore does not show the expected future cash flows fromthese liabilities as many of them will expire without being drawn and arising claims will be honored by the customers or canbe recovered from proceeds of arranged collateral.
Irrevocable lending commitments and lending related contingent liabilitiesin € m. Dec 31, 2018 Dec 31, 2017Irrevocable lending commitments 167,722 158,253Revocable lending commitments 44,327 45,867Contingent liabilities 51,605 48,212Total 263,654 252,331
Other commitments and other contingent liabilities
The following table shows the Group’s other irrevocable commitments and other contingent liabilities without consideringcollateral or provisions. It shows the maximum potential utilization of the Group in case all these liabilities entered into mustbe fulfilled. The table therefore does not show the expected future cash flows from these liabilities as many of them will expirewithout being drawn and arising claims will be honored by the customers or can be recovered from proceeds of arrangedcollateral.
Other commitments and other contingent liabilitiesin € m. Dec 31, 2018 Dec 31, 2017Other commitments 130 82Other contingent liabilities 74 5Total 204 86
Government Assistance
In the course of its business, the Group regularly applies for and receives government support by means of Export CreditAgency (“ECA”) guarantees covering transfer and default risks for the financing of exports and investments into EmergingMarkets and to a lesser extent, developed markets for Structured Trade & Export Finance and short- and medium-term TradeFinance business. Almost all export-oriented states have established such ECAs to support their domestic exporters. TheECAs act in the name and on behalf of the government of their respective country and are either constituted directly asgovernmental departments or organized as private companies vested with the official mandate of the government to act on itsbehalf. Terms and conditions of such ECA guarantees are broadly similar due to the fact that most of the ECAs act within thescope of the Organization for Economic Cooperation and Development (“OECD”) consensus rules. The OECD consensusrules, an intergovernmental agreement of the OECD member states, define benchmarks intended to ensure that a faircompetition between different exporting nations will take place.

324
Deutsche Bank 2 – Consolidated Financial StatementsAnnual Report 2018
In some countries dedicated funding programs with governmental support are offered for ECA-covered financings. The Groupmakes use of such programs to assist its clients in the financing of exported goods and services. In certain financings, theGroup also receives government guarantees from national and international governmental institutions as collateral to supportfinancings in the interest of the respective governments. The majority of such ECA guarantees received by the Group wereissued either by the Euler-Hermes Kreditversicherungs-AG acting on behalf of the Federal Republic of Germany, by theKorean Export Credit Agencies (Korea Trade Insurance Corporation and The Export-Import Bank of Korea) acting on behalfof the Republic of Korea or by Chinese Export Credit Agency (China Export & Insurance Corporation (Sinosure)) acting onbehalf of the People’s Republic of China.
Irrevocable payment commitments with regard to levies
Irrevocable payment commitments related to bank levy according to Bank Recovery and Resolution Directive (BRRD), theSingle Resolution Fund (SRF) and the German statutory deposit protection amounted to € 595.1 million as of December 31,2018, and to € 412.3 million as of December 31, 2017.
31 – Other Short-Term Borrowingsin € m. Dec 31, 2018 Dec 31, 2017Other short-term borrowings:Commercial paper 2,752 5,274Other 11,406 13,137Total other short-term borrowings 14,158 18,411
32 – Long-Term Debt and Trust Preferred SecuritiesLong-Term Debt by Earliest Contractual Maturity
in € m.Due in
2019Due in
2020Due in
2021Due in
2022Due in
2023Due after
2023
TotalDec 31,
2018
TotalDec 31,
2017Senior debt:Bonds and notes:
Fixed rate 16,275 10,510 18,483 6,949 6,898 18,779 77,894 76,285Floating rate 8,002 4,540 5,347 3,553 2,321 6,732 30,495 33,210
Subordinated debt:Bonds and notes:
Fixed rate 2,057 1,135 0 0 30 2,075 5,297 5,493Floating rate 24 180 0 0 1,202 14 1,420 1,738
Other 20,958 6,263 1,335 557 1,087 6,777 36,977 42,988Total long-term debt 47,317 22,627 25,164 11,060 11,538 34,377 152,083 159,715
The Group did not have any defaults of principal, interest or other breaches with respect to its liabilities in 2018 and 2017.
Trust Preferred Securities1
in € m. Dec 31, 2018 Dec 31, 2017Fixed rate 2,194 4,462Floating rate 975 1,030Total trust preferred securities 3,168 5,4911 Perpetual instruments, redeemable at specific future dates at the Group’s option.

325
Deutsche Bank Notes to the Consolidated Balance SheetAnnual Report 2018 Maturity Analysis of the earliest contractual undiscounted cash flows of Financial Liabilities
33 – Maturity Analysis of the earliest contractual undiscountedcash flows of Financial Liabilities
Dec 31, 2018
in € m. On demandDue within
3 months
Due between3 and 12
monthsDue between1 and 5 years
Due after5 years
Noninterest bearing deposits 221,746 0 0 0 0Interest bearing deposits 126,416 137,089 47,258 21,683 12,059Trading liabilities1 59,922 0 0 0 0Negative market values from derivative financialinstruments1 301,487 0 0 0 0Financial liabilities designated at fair valuethrough profit or loss 16,438 25,838 7,895 2,760 5,724Investment contract liabilities2 0 0 512 0 0Negative market values from derivative financialinstruments qualifying for hedge accounting3 0 609 502 505 306Central bank funds purchased 252 0 0 0 0Securities sold under repurchase agreements 3,151 963 508 1 0Securities loaned 3,358 3 0 0 0Other short-term borrowings 11,067 2,258 1,622 0 0Long-term debt 3 34,449 16,268 80,028 36,085Trust preferred securities 0 36 3,306 0 0Other financial liabilities 96,573 2,762 1,201 369 60Off-balance sheet loan commitments 167,722 0 0 0 0Financial guarantees 22,502 0 0 0 0Total4 1,030,639 204,008 79,073 105,346 54,2341 Trading liabilities and derivatives not qualifying for hedge accounting balances are recorded at fair value. The Group believes that this best represents the cash flow that would
have to be paid if these positions had to be closed out. Trading liabilities and derivatives not qualifying for hedge accounting balances are shown within “on demand” whichGroup’s management believes most accurately reflects the short-term nature of trading activities. The contractual maturity of the instruments may however extend oversignificantly longer periods.
2 These are investment contracts where the policy terms and conditions result in their redemption value equaling fair value.3 Derivatives designated for hedge accounting are recorded at fair value and are shown in the time bucket at which the hedged relationship is expected to terminate.4 The balances in the table do not agree to the numbers in the Group’s balance sheet as the cash flows included in the table are undiscounted. This analysis represents the
worst case scenario for the Group if the Group was required to repay all liabilities earlier than expected. The Group believes that the likelihood of such an event occurring isremote.
Dec 31, 2017
in € m. On demandDue within
3 months
Due between3 and 12
monthsDue between1 and 5 years
Due after5 years
Noninterest bearing deposits 226,339 0 0 0 0Interest bearing deposits 133,378 146,204 45,816 19,194 12,510Trading liabilities1 71,457 0 0 0 0Negative market values from derivative financialinstruments1 342,726 0 0 0 0Financial liabilities designated at fair valuethrough profit or loss 29,207 29,360 4,847 2,599 5,951Investment contract liabilities2 0 0 574 0 0Negative market values from derivative financialinstruments qualifying for hedge accounting3 0 69 336 672 218Central bank funds purchased 174 83 0 0 0Securities sold under repurchase agreements 14,152 2,525 1,348 491 23Securities loaned 6,684 3 0 0 1Other short-term borrowings 11,859 2,326 3,600 0 0Long-term debt 4 7,409 41,820 78,063 41,926Trust preferred securities 0 1,710 3,328 688 0Other financial liabilities 112,961 3,483 554 373 4Off-balance sheet loan commitments 153,700 0 0 0 0Financial guarantees 19,883 0 0 0 0Total4 1,122,525 193,172 102,223 102,080 60,6321 Trading liabilities and derivatives not qualifying for hedge accounting balances are recorded at fair value. The Group believes that this best represents the cash flow that would
have to be paid if these positions had to be closed out. Trading liabilities and derivatives not qualifying for hedge accounting balances are shown within “on demand” whichGroup’s management believes most accurately reflects the short-term nature of trading activities. The contractual maturity of the instruments may however extend oversignificantly longer periods. .
2 These are investment contracts where the policy terms and conditions result in their redemption value equaling fair value.3 Derivatives designated for hedge accounting are recorded at fair value and are shown in the time bucket at which the hedged relationship is expected to terminate.4 The balances in the table do not agree to the numbers in the Group’s balance sheet as the cash flows included in the table are undiscounted. This analysis represents the
worst case scenario for the Group if the Group was required to repay all liabilities earlier than expected. The Group believes that the likelihood of such an event occurring isremote.

326
Deutsche Bank 2 – Consolidated Financial StatementsAnnual Report 2018
Additional Notes
34 – Common Shares
Common Shares
Deutsche Bank’s share capital consists of common shares issued in registered form without par value. Under German law,each share represents an equal stake in the subscribed capital. Therefore, each share has a nominal value of € 2.56, derivedby dividing the total amount of share capital by the number of shares.
Number of sharesIssued and
fully paid Treasury shares OutstandingCommon shares, January 1, 2017 1,379,273,131 (203,442) 1,379,069,689Shares issued under share-based compensation plans 0 0 0Capital increase 687,500,000 0 687,500,000Shares purchased for treasury 0 (490,690,358) (490,690,358)Shares sold or distributed from treasury 0 490,522,710 490,522,710Common shares, December 31, 2017 2,066,773,131 (371,090) 2,066,402,041Shares issued under share-based compensation plans 0 0 0Capital increase 0 0 0Shares purchased for treasury 0 (372,179,750) (372,179,750)Shares sold or distributed from treasury 0 371,206,696 371,206,696Common shares, December 31, 2018 2,066,773,131 (1,344,144) 2,065,428,987
There are no issued ordinary shares that have not been fully paid.
Shares purchased for treasury mainly consist of shares purchased with the intention of being resold in the short-term as wellas held by the Group for a period of time. In addition, the Group has bought back shares for equity compensation purposes.All such transactions were recorded in shareholders’ equity and no revenues and expenses were recorded in connection withthese activities. Treasury stock held as of year-end will mainly be used for future share-based compensation.
Authorized Capital
The Management Board is authorized to increase the share capital by issuing new shares for cash consideration. As ofDecember 31, 2018, Deutsche Bank AG had authorized but unissued capital of € 2,560,000,000 which may be issued in wholeor in part until April 30, 2022. Further details are governed by Section 4 of the Articles of Association.
Authorized capital Consideration Pre-emptive rights Expiration date€ 512,000,000 Cash May be excluded pursuant to Section 186 (3) sentence 4 of the Stock Corporation
Act and may be excluded insofar as it is necessary to grant pre-emptive rights to theholders of option rights, convertible bonds and convertible participatory rights
April 30, 2022
€ 2,048,000,000 Cash May be excluded insofar as it is necessary to grant pre-emptive rights to the holdersof option rights, convertible bonds and convertible participatory rights.
April 30, 2022

327
Deutsche Bank Additional NotesAnnual Report 2018 Employee Benefits
Conditional Capital
The Management Board is authorized to issue once or more than once, participatory notes that are linked with conversionrights or option rights and/or convertible bonds and/or bonds with warrants. The participatory notes, convertible bonds orbonds with warrants may also be issued by affiliated companies of Deutsche Bank AG. For this purpose share capital wasincreased conditionally upon exercise of these conversion and/or exchange rights or upon mandatory conversion.
Conditionalcapital Purpose of conditional capital Expiration date€ 512,000,000 May be used if holders of conversion or option rights that are linked with participatory notes or convertible bonds or bonds
with warrants make use of their conversion or option rights or holders with conversion obligations of convertibleparticipatory notes or convertible bonds fulfill their obligation to convert.
April 30, 2022
€ 51,200,000 May be used to fulfill options that are awarded on or before the expiration date and will only be used to the extent thatholders of issued options make use of their right to receive shares and shares are not delivered out of treasury shares
April 30, 2022
Dividends
The following table presents the amount of dividends proposed or declared for the years ended December 31, 2018, 2017and 2016, respectively.
2018(proposed)¹ 2017 2016²
Cash dividends declared (in € m.) 227,000,000 227,000,000 227,000,000Cash dividends declared per common share (in €) 0.11 0.11 0.111 Cash dividends for 2018 is based on the number of shares issued as of December 31, 2018.2 Dividends for 2016 and 2015 were approved by the annual general meeting in 2017 and were paid simultaneously in 2017.
No dividends have been declared since the balance sheet date.
35 – Employee Benefits
Share-Based Compensation Plans
The Group made grants of share-based compensation under the DB Equity Plan. This plan represents a contingent right toreceive Deutsche Bank common shares after a specified period of time. The award recipient is not entitled to receive dividendsduring the vesting period of the award.
The share awards granted under the terms and conditions of the DB Equity Plan may be forfeited fully or partly if the recipientvoluntarily terminates employment before the end of the relevant vesting period. Vesting usually continues after terminationof employment in cases such as redundancy or retirement.
In countries where legal or other restrictions hinder the delivery of shares, a cash plan variant of the DB Equity Plan was usedfor granting awards.

328
Deutsche Bank 2 – Consolidated Financial StatementsAnnual Report 2018
The following table sets forth the basic terms of these share plans:
Grant year(s) Deutsche Bank Equity Plan Vesting schedule Eligibility2018 Annual Award (CIB)1 1/4: 12 months2 Select employees as
1/4: 24 months2 annual performance-based 1/4: 36 months2 compensation 1/4: 48 months2
Annual Award (non-CIB)1 1/3: 12 months2 Select employees as 1/3: 24 months2 annual performance-based 1/3: 36 months2 compensation
Annual Award 1/5: 12 months2 Members of Management Board (Senior Management)1 1/5: 24 months2 or of Senior Management
1/5: 36 months2
1/5: 48 months2
1/5: 60 months2
Retention/New Hire Individual specification Select employees to attract andretain the best talent
Annual Award – Upfront Vesting immediately at grant3 Regulated employees2017 Annual Award1 1/4: 12 months4 Select employees as
1/4: 24 months4 annual performance-based 1/4: 36 months4 compensation 1/4: 48 months4
Or cliff vesting after 54 months4 Members of Management Boardor of Senior Leadership Cadre
Retention/New Hire Individual specification Select employees to attract and retainthe best talent
Annual Award – Upfront Vesting immediately at grant3 Regulated employees Key Retention Plan (KRP)5 1/2: 50 months6 Material Risk Takers (MRTs)
1/2: 62 months6
Cliff vesting after 43 months Non-Material Risk Takers (non-MRTs)2016 Annual Award 1/4: 12 months4 Select employees as
1/4: 24 months4 annual performance-based 1/4: 36 months4 compensation 1/4: 48 months4
Or cliff vesting after 54 months4 Members of Management Board or ofSenior Leadership Cadre
Retention/New Hire Individual specification Select employees to attract and retainthe best talent
Annual Award – Upfront Vesting immediately at grant3 Regulated employees Key Position Award (KPA)7 Cliff-vesting after 4 years3 Select employees as annual retention
2015/ Annual Award 1/3: 12 months4 Select employees as2014 1/3: 24 months4 annual performance-based
1/3: 36 months4 compensation Or cliff vesting after 54 months4 Members of Management Board or of
Senior Leadership Group Retention/New Hire Individual specification Select employees to attract and retain
the best talent Annual Award – Upfront Vesting immediately at grant8 Regulated employees
1 For employees of certain legal entities, deferred equity is replaced with restricted shares due to local regulatory requirements.2 For members of the Management Board or the Senior Management and all other InstVV-regulated employees a further retention period of twelve months applies.3 For all regulated employees share delivery takes place after a further retention period of twelve months. For awards granted in 2018 this is only applicable to InstVV MRTs.4 For members of the Management Board or of the Senior Leadership Cadre and all other regulated employees a further retention period of six months applies.5 The Key Retention Plan (KRP) is referenced as the “Retention Award Program” in the Bank’s Compensation Report. Equity-based awards granted under this program in
January 2017 are subject to an additional share price hurdle, meaning this award proportion only vests in the event that the Bank’s share price reaches a certain share targetprice prior to vesting.
6 For Material Risk Takers (MRTs) share delivery takes place after a further retention period of twelve months.7 A predefined proportion of the individual’s KPA is subject to an additional share price hurdle, meaning this award proportion only vests in the event that the Bank’s share price
reaches a certain share target price prior to vesting.8 For members of the Management Board share delivery takes place after a retention period of three years. For all other regulated employees share delivery takes place after a
retention period of six months.
Furthermore, the Group offers a broad-based employee share ownership plan entitled Global Share Purchase Plan (“GSPP”).The GSPP offers employees in specific countries the opportunity to purchase Deutsche Bank shares in monthly installmentsover one year. At the end of the purchase cycle, the bank matches the acquired stock in a ratio of one to one up to a maximumof ten free shares, provided that the employee remains at Deutsche Bank Group for another year. In total, about 12,450 stafffrom 20 countries enrolled in the tenth cycle that began in November 2018.
The Group has other local share-based compensation plans, none of which, individually or in the aggregate, are material tothe consolidated financial statements.

329
Deutsche Bank Additional NotesAnnual Report 2018 Employee Benefits
The following table shows the outstanding share award units as of the respective dates, which represent a contingent right toreceive Deutsche Bank common shares after a specified period of time. It also includes the grants under the cash plan variantof the DB Equity Plan.
Share units(in thousands)
Weighted-average
grant date fairvalue per unit
Balance as of December 31, 2016 90,292 € 20.22Balance as of December 31, 2017 137,541 € 14.78Balance as of December 31, 2018 153,117 € 11.15
Share-based payment transactions resulting in a cash payment give rise to a liability, which amounted to approximately€ 12 million, € 23 million and € 15 million for the years ended December 31, 2018, 2017 and 2016, respectively.
As of December 31, 2018, the grant volume of outstanding share awards was approximately € 1.7 billion. Thereof, € 1.2 billionhad been recognized as compensation expense in the reporting year or prior to that. Hence, compensation expense fordeferred share-based compensation not yet recognized amounted to € 0.5 billion as of December 31, 2018.
In addition to the amounts shown in the table above, approximately 4.4 and 9.1 million shares were issued to plan participantsin February and March 2019, resulting from the vesting of DB Equity Plan awards granted in prior years (thereof 0.16 millionunits for February and 0.16 million units for March 2019 vesting cycles under the cash plan variant of this DB Equity Plan).
DWS Share-Based Plans (cash-settled)
In September 2018 one-off IPO related awards under the DWS Stock Appreciation Rights (SAR) Plan was granted to all DWSGroup staff and in addition there were awards for a limited number of DWS senior managers under the DWS Equity (PSU)Plan.
The DWS SAR Plan represents a contingent right to receive a cash payment equal to any appreciation (or gain) in the valueof a set number of notional DWS Shares over a fixed period of time. This award does not provide any entitlement to receiveDWS Shares, voting rights or dividends associated with them.
The DWS Equity Plan is a phantom share plan representing a contingent right to receive a cash payment by referencing tothe value of DWS Shares during a specified period of time.
The award recipient for any share-based compensation plan is not entitled to receive dividends during the vesting period ofthe award.
The share awards granted under the terms and conditions of any share-based compensation plan are forfeited fully or partlyif the recipient voluntarily terminates employment before the end of the relevant vesting period. Vesting usually continues aftertermination of employment in cases such as redundancy or retirement.
The following table set forth the basic terms of the DWS share-based plans:
Grant year(s) Award Type Vesting schedule Eligibility2018DWS Equity Plan
Retention/New Hire Individual Specification Select employees to attract and retainthe best talent
PSU Award(one-off IPO related award)1
For MRTs:1/3: March 20223
1/3: March 20231/3: March 2024
Select Senior Managers
2018DWS SAR Plan
SAR Award(one-off IPO related award)2
For non-MRTs:June 1, 20215
For MRTs:March 1, 20233
All DWS employees4
1 The award and the number of units is subject to the achievement of pre-defined targets (Average Net flows (NNA)2019-2020 and FY 2020 Adjusted CIR (Cost Income Ratio)measured December 2020.
2 The award is subject to a positive IBIT of DWS Group December 2019.3 Depending on their individual regulatory status, a 6 months retention period (AIFMD/UCITS MRTs) or a 12-months retention period (InstVV MRTs) applies after vesting.4 Unless the employee received PSU Award.5 Following vesting / retention period a 4-year exercise period applies.

330
Deutsche Bank 2 – Consolidated Financial StatementsAnnual Report 2018
As of December 31, 2018, the grant volume of outstanding share awards was approximately € 23 million. Thereof, € 4 millionhas been recognized as compensation expense in the reporting year since the award date. Hence, compensation expensefor deferred share-based compensation not yet recognized is approximately € 19 million which is dependent on future shareprice development.
The fair value of the awards have been measured using the Black-Scholes formula. Service and non-market performanceconditions attached to the arrangements were not taken into account in measuring fair value. The inputs used in themeasurement of the fair values at grant date and measurement date of the awards were as follows:
Grant date15 September
2018
Measurementdate
31 December2018
Grant date15 September
2018
Measurementdate
31 December2018
PSU PSU SAR SARUnits 1,272 1,248 2,224 2,192Fair value € 14.56 € 14.18 € 3.95 € 3.35Share price € 23.75 € 23.37 € 23.75 € 23.37Exercise price N/A N/A € 24.65 € 24.65Expected volatility (weighted-average, in %) 36 35 36 35Expected life (weighted-average, in years) 5 5 6 6Expected dividends (in % of income) 65 65 65 65Risk-free interest rate (based on government funds, in %) 0 0 0 0
Given the short timeframe since the IPO of DWS Group, the expected volatility of the DWS share price has been based on anevaluation of the historical volatility for a comparable peer group over the preceding 5-year period. The expected dividendlevel is linked to the latest DWS Group communication.
In addition, the DWS Equity Plan has performance conditions which will determine the nominal amount which can ultimatelyvest under the award. These performance conditions are linked to the DWS Group strategy, specifically with regards to thetarget for net inflows and the adjusted cost income ratio, which will be tested prior to vesting in March 2021.
Post-employment Benefit Plans
Nature of Plans
The Group sponsors a number of post-employment benefit plans on behalf of its employees, both defined contribution plansand defined benefit plans. The Group’s plans are accounted for based on the nature and substance of the plan. Generally, fordefined benefit plans the value of a participant’s accrued benefit is based on each employee’s remuneration and length ofservice; contributions to defined contribution plans are typically based on a percentage of each employee’s remuneration. Therest of this note focuses predominantly on the Group’s defined benefit plans.
The Group’s defined benefit plans are primarily described on a geographical basis, reflecting differences in the nature andrisks of benefits, as well as in the respective regulatory environments. In particular, the requirements set by local regulatorscan vary significantly and determine the design and financing of the benefit plans to a certain extent. Key information is alsoshown based on participant status, which provides a broad indication of the maturity of the Group’s obligations.
Dec 31, 2018in € m. Germany UK U.S. Other TotalDefined benefit obligation related to
Active plan participants 4,599 593 337 623 6,152Participants in deferred status 2,210 2,286 500 97 5,093Participants in payment status 5,144 989 500 242 6,875
Total defined benefit obligation 11,953 3,868 1,337 962 18,120Fair value of plan assets 10,877 4,884 1,074 892 17,727Funding ratio (in %) 91 % 126 % 80 % 93 % 98 %
Dec 31, 2017in € m. Germany UK U.S. Other TotalDefined benefit obligation related to
Active plan participants 4,823 688 363 640 6,514Participants in deferred status 2,196 2,583 536 93 5,408Participants in payment status 5,071 905 502 246 6,724
Total defined benefit obligation 12,090 4,176 1,401 979 18,646Fair value of plan assets 11,003 5,202 1,091 915 18,211Funding ratio (in %) 91 % 125 % 78 % 93 % 98 %

331
Deutsche Bank Additional NotesAnnual Report 2018 Employee Benefits
The majority of the Group’s defined benefit plan obligations relate to Germany, the United Kingdom and the United States.Within the other countries, the largest obligation relates to Switzerland. In Germany and some continental European countries,post-employment benefits are usually agreed on a collective basis with respective employee works councils, unions or theirequivalent. The Group’s main pension plans are governed by boards of trustees, fiduciaries or their equivalent.
Post-employment benefits can form an important part of an employee’s total remuneration. The Group’s approach is that theirdesign shall be attractive to employees in the respective market, but sustainable for the Group to provide over the longer term.At the same time, the Group tries to limit its risks related to provision of such benefits. Consequently the Group has moved tooffer defined contribution plans in many locations over recent years.
In the past the Group typically offered pension plans based on final pay prior to retirement. These types of benefits still forma significant part of the pension obligations for participants in deferred and payment status. Currently, in Germany and theUnited States, the main defined benefit pension plans for active staff are cash account type plans where the Group credits anannual amount to individual accounts based on an employee’s current salary. Dependent on the plan rules, the accountsincrease either at a fixed interest rate or participate in market movements of certain underlying investments to limit theinvestment risk for the Group. Sometimes, in particular in Germany, there is a guaranteed benefit amount within the plan rules,e.g. payment of at least the amounts contributed. Upon retirement, beneficiaries may usually opt for a lump sum or forconversion of the accumulated account balance into an annuity. This conversion is often based on market conditions andmortality assumptions at retirement. In the past, the main defined benefit pension plan in the United Kingdom was redesignedfor active employees still eligible to the plan to reduce the overall long-term risk exposure to the Group. Furthermore recentchanges to pension legislation and taxation in the UK continued to cause increased take-up of cash options and transfervalues out of the defined benefit pension plans.
The Group also sponsors retirement and termination indemnity plans in several countries, as well as some post-employmentmedical plans for a number of current and retired employees, mainly in the United States. The post-employment medical planstypically pay fixed percentages of medical expenses of eligible retirees after a set deductible has been met. In the UnitedStates, once a retiree is eligible for Medicare, the Group contributes to a Health Reimbursement Account and the retiree is nolonger eligible for the Group’s medical program. The Group’s total defined benefit obligation for post-employment medicalplans was € 192 million and € 196 million at December 31, 2018 and December 31, 2017, respectively. In combination withthe benefit structure, these plans represent limited risk for the Group, given the nature and size of the post-retirement medicalplan liabilities of € 192 million versus the size of the Group’s balance sheet at year end 2018.
The following amounts of expected benefit payments from the Group’s defined benefit plans include benefits attributable toemployees’ past and estimated future service, and include both amounts paid from the Group’s external pension trusts andpaid directly by the Group in respect of unfunded plans.
in € m. Germany UK U.S. Other TotalActual benefit payments 2018 437 176 114 76 803Benefits expected to be paid 2019 439 115 81 66 701Benefits expected to be paid 2020 448 92 76 59 675Benefits expected to be paid 2021 460 98 82 59 699Benefits expected to be paid 2022 480 106 82 61 729Benefits expected to be paid 2023 498 116 86 60 760Benefits expected to be paid 2024 – 2028 2,747 694 455 321 4,217Weighted average duration of defined benefitobligation (in years) 14 22 11 12 15
Multi-employer Plans
In Germany, the Group is a member of the BVV Versicherungsverein des Bankgewerbes a.G. (BVV) together with otherfinancial institutions. The BVV offers retirement benefits to eligible employees in Germany as a complement to post-employment benefit promises of the Group. Both employers and employees contribute on a regular basis to the BVV. TheBVV provides annuities of a fixed amount to individuals on retirement and increases these fixed amounts if surplus assetsarise within the plan. According to legislation in Germany, the employer is ultimately liable for providing the benefits to itsemployees. An increase in benefits may also arise due to additional obligations to retirees for the effects of inflation. BVV is amulti-employer defined benefit plan. However, in line with industry practice, the Group accounts for it as a defined contributionplan since insufficient information is available to identify assets and liabilities relating to the Group’s current and formeremployees, primarily because the BVV does not fully allocate plan assets to beneficiaries nor to member companies.According to the BVV’s disclosures, there is no current deficit in the plan that may affect the amount of future Groupcontributions. Furthermore, any plan surplus emerging in the future will be distributed to the plan members, hence it cannotreduce future Group contributions. In June 2016, the BVV’s Annual General Meeting approved a reduction in benefits fromfuture contributions for certain groups of employees. Similar to other participating companies, the Group committed to makeup for reduced benefit levels by increasing contributions to the BVV from January 1, 2017. A corresponding labor agreementhas been signed with the German works council.
332
Deutsche Bank 2 – Consolidated Financial StatementsAnnual Report 2018
The Group’s expenses for defined contribution plans also include annual contributions by DB Privat- und FirmenkundenbankAG to the pension fund for postal civil servants in Germany. Responsibility for the liability for these benefits lies with theGerman government.
Governance and Risk
The Group maintains a Pensions Risk Committee to oversee its pension and related risks on a global basis. This Committeemeets quarterly, reports directly to the Senior Executive Compensation Committee and is supported by the PensionsOperating Committee.
Within this context, the Group develops and maintains guidelines for governance and risk management, including funding,asset allocation and actuarial assumption setting. In this regard, risk management means the management and control ofrisks for the Group related to market developments (e.g., interest rate, credit spread, price inflation), asset investment,regulatory or legislative requirements, as well as monitoring demographic changes (e.g., longevity). Especially during andafter acquisitions or changes in the external environment (e.g., legislation, taxation), topics such as the general plan designor potential plan amendments are considered. Any plan changes follow a process requiring approval by Group HumanResources. To the extent that pension plans are funded, the assets held mitigate some of the liability risks, but introduceinvestment risk.
In the Group’s key pension countries, the Group’s largest post-employment benefit plan risk exposures relate to potentialchanges in credit spreads, interest rates, price inflation and longevity, although these have been partially mitigated throughthe investment strategy adopted.
Overall, the Group seeks to minimize the impact of pensions on the Group’s financial position from market movements, subjectto balancing the trade-offs involved in financing post-employment benefits, regulatory capital and constraints from local fundingor accounting requirements. The Group measures its pension risk exposures on a regular basis using specific metricsdeveloped by the Group for this purpose.
Funding
The Group maintains various external pension trusts to fund the majority of its defined benefit plan obligations. The Group’sfunding policy is to maintain coverage of the defined benefit obligation by plan assets within a range of 90 % to 100 % of theobligation, subject to meeting any local statutory requirements. The Group has also determined that certain plans shouldremain unfunded, although their funding approach is subject to periodic review, e.g. when local regulations or practiceschange. Obligations for the Group’s unfunded plans are accrued on the balance sheet.
For most of the externally funded defined benefit plans there are local minimum funding requirements. The Group can decideon any additional plan contributions, with reference to the Group’s funding policy. There are some locations, e.g. the UnitedKingdom, where the trustees and the Bank jointly agree contribution levels. In most countries the Group expects to receive aneconomic benefit from any plan surpluses of plan assets compared to defined benefit obligations, typically by way of reducedfuture contributions. Given the broadly fully funded position and the investment strategy adopted in the Group’s key fundeddefined benefit plans, any minimum funding requirements that may apply are not expected to place the Group under anymaterial adverse cash strain in the short term. With reference to the Group’s funding policy, the Group considers not re-claiming benefits paid from the Group’s assets as an equivalent to making cash contributions into the external pension trustsduring the year.
For post-retirement medical plans, the Group accrues for obligations over the period of employment and pays the benefitsfrom Group assets when the benefits become due.

333
Deutsche Bank Additional NotesAnnual Report 2018 Employee Benefits
Actuarial Methodology and Assumptions
December 31 is the measurement date for all plans. All plans are valued by independent qualified actuaries using the projectedunit credit method. A Group policy provides guidance to local actuaries to ensure consistency globally on setting actuarialassumptions which are finally determined by the Group’s Pensions Operating Committee. Senior management of the Groupis regularly informed of movements and changes in key actuarial assumptions.
The key actuarial assumptions applied in determining the defined benefit obligations at December 31 are presented below inthe form of weighted averages.
Dec 31, 2018 Dec 31, 2017Germany UK U.S.1 Other Germany UK U.S.1 Other
Discount rate (in %) 1.7 % 2.7 % 4.2 % 2.6 % 1.7 % 2.5 % 3.5 % 2.5 %Rate of price inflation (in %) 1.6 % 3.5 % 2.2 % 1.9 % 1.8 % 3.5 % 2.2 % 2.0 %Rate of nominal increase infuture compensation levels (in %) 2.1 % 4.0 % 2.3 % 2.9 % 2.3 % 4.5 % 2.3 % 3.1 %Rate of nominal increase forpensions in payment (in %) 1.5 % 3.3 % 2.2 % 1.0 % 1.7 % 3.3 % 2.2 % 1.1 %
Assumed life expectancyat age 65
For a male aged 65at measurement date 20.0 23.5 22.2 21.8 19.3 23.6 22.2 21.7For a female aged 65at measurement date 23.6 25.4 23.7 24.1 23.3 25.4 23.7 24.1For a male aged 45at measurement date 22.8 24.8 23.7 23.3 21.9 24.9 23.8 23.1For a female aged 45at measurement date 25.8 26.8 25.2 25.6 25.8 26.9 25.2 25.6
Mortality tables applied
Richttafeln Heubeck 2018G
SAPS (S2) Light with CMI 2017 projections
RP2014White-
collar with MP2018 projections
Country specific
tables
Richttafeln Heubeck 2005G
SAPS (S1) Light with CMI 2016 projections
RP2014White-
collar with MP 2017 projections
Country specific
tables1 Cash balance interest crediting rate in line with the 30-year US government bond yield.
For the Group’s most significant plans in the key countries, the discount rate used at each measurement date is set based ona high quality corporate bond yield curve – derived based on bond universe information sourced from reputable third-partyindex and data providers and rating agencies – reflecting the timing, amount and currency of the future expected benefitpayments for the respective plan. For longer durations where limited bond information is available, reasonable yield curveextrapolation methods are applied using respective actual swap rates and credit spread assumptions. Consistent discountrates are used across all plans in each currency zone, based on the assumption applicable for the Group’s largest plan(s) inthat zone. For plans in the other countries, the discount rate is based on high quality corporate or government bond yieldsapplicable in the respective currency, as appropriate at each measurement date with a duration broadly consistent with therespective plan’s obligations.
In 2017 the Group moved to a more standardized, simpler approach to set its discount rate used to value its defined benefitplans in the Eurozone; similar approaches are generally accepted and are already used for the Group’s other major pensionplans in the United Kingdom and the United States. The refinement resulted in no change in the discount rate and so no effecton the Group’s Consolidated Statement of Comprehensive Income in 2017.
The price inflation assumptions in the eurozone and the United Kingdom are set with reference to market measures of inflationbased on inflation swap rates in those markets at each measurement date. For other countries, the price inflation assumptionsare typically based on long term forecasts by Consensus Economics Inc.
The assumptions for the increases in future compensation levels and for increases to pensions in payment are developedseparately for each plan, where relevant. Each is set based on the price inflation assumption and reflecting the Group’s rewardstructure or policies in each market, as well as relevant local statutory and plan-specific requirements.
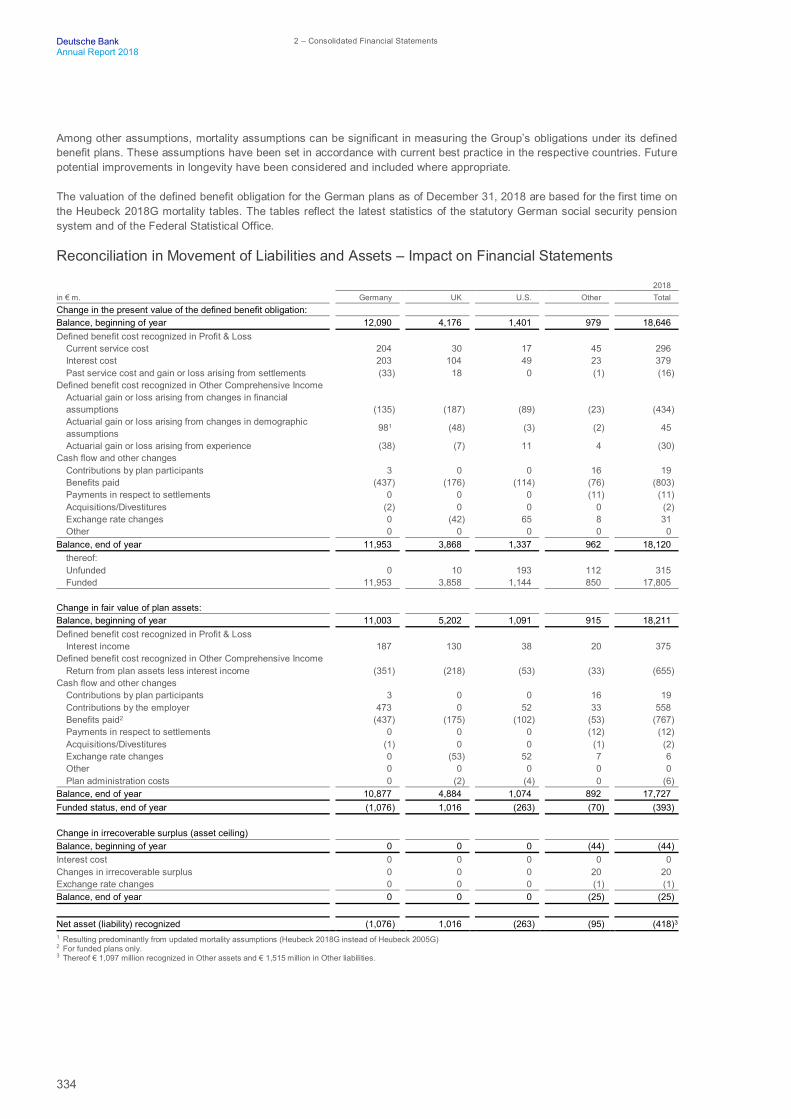
334
Deutsche Bank 2 – Consolidated Financial StatementsAnnual Report 2018
Among other assumptions, mortality assumptions can be significant in measuring the Group’s obligations under its definedbenefit plans. These assumptions have been set in accordance with current best practice in the respective countries. Futurepotential improvements in longevity have been considered and included where appropriate.
The valuation of the defined benefit obligation for the German plans as of December 31, 2018 are based for the first time onthe Heubeck 2018G mortality tables. The tables reflect the latest statistics of the statutory German social security pensionsystem and of the Federal Statistical Office.
Reconciliation in Movement of Liabilities and Assets – Impact on Financial Statements
2018in € m. Germany UK U.S. Other TotalChange in the present value of the defined benefit obligation:Balance, beginning of year 12,090 4,176 1,401 979 18,646Defined benefit cost recognized in Profit & Loss
Current service cost 204 30 17 45 296Interest cost 203 104 49 23 379Past service cost and gain or loss arising from settlements (33) 18 0 (1) (16)
Defined benefit cost recognized in Other Comprehensive IncomeActuarial gain or loss arising from changes in financialassumptions (135) (187) (89) (23) (434)Actuarial gain or loss arising from changes in demographicassumptions 981 (48) (3) (2) 45
Actuarial gain or loss arising from experience (38) (7) 11 4 (30)Cash flow and other changes
Contributions by plan participants 3 0 0 16 19Benefits paid (437) (176) (114) (76) (803)Payments in respect to settlements 0 0 0 (11) (11)Acquisitions/Divestitures (2) 0 0 0 (2)Exchange rate changes 0 (42) 65 8 31Other 0 0 0 0 0
Balance, end of year 11,953 3,868 1,337 962 18,120thereof:Unfunded 0 10 193 112 315Funded 11,953 3,858 1,144 850 17,805
Change in fair value of plan assets:Balance, beginning of year 11,003 5,202 1,091 915 18,211Defined benefit cost recognized in Profit & Loss
Interest income 187 130 38 20 375Defined benefit cost recognized in Other Comprehensive Income
Return from plan assets less interest income (351) (218) (53) (33) (655)Cash flow and other changes
Contributions by plan participants 3 0 0 16 19Contributions by the employer 473 0 52 33 558Benefits paid2 (437) (175) (102) (53) (767)Payments in respect to settlements 0 0 0 (12) (12)Acquisitions/Divestitures (1) 0 0 (1) (2)Exchange rate changes 0 (53) 52 7 6Other 0 0 0 0 0Plan administration costs 0 (2) (4) 0 (6)
Balance, end of year 10,877 4,884 1,074 892 17,727Funded status, end of year (1,076) 1,016 (263) (70) (393)
Change in irrecoverable surplus (asset ceiling)Balance, beginning of year 0 0 0 (44) (44)Interest cost 0 0 0 0 0Changes in irrecoverable surplus 0 0 0 20 20Exchange rate changes 0 0 0 (1) (1)Balance, end of year 0 0 0 (25) (25)
Net asset (liability) recognized (1,076) 1,016 (263) (95) (418)3
1 Resulting predominantly from updated mortality assumptions (Heubeck 2018G instead of Heubeck 2005G)2 For funded plans only.3 Thereof € 1,097 million recognized in Other assets and € 1,515 million in Other liabilities.

335
Deutsche Bank Additional NotesAnnual Report 2018 Employee Benefits
2017in € m. Germany UK U.S. Other TotalChange in the present value of the defined benefit obligation:Balance, beginning of year 11,978 4,496 1,548 1,091 19,113Defined benefit cost recognized in Profit & Loss
Current service cost 213 34 21 50 318Interest cost 202 114 56 25 397Past service cost and gain or loss arising from settlements 34 4 0 (11) 27
Defined benefit cost recognized in Other ComprehensiveIncome
Actuarial gain or loss arising from changes in financialassumptions 76 (43) 65 3 101Actuarial gain or loss arising from changes in demographicassumptions 0 (16) (6) (11) (33)Actuarial gain or loss arising from experience (3) (17) 5 (9) (24)
Cash flow and other changesContributions by plan participants 3 0 0 15 18Benefits paid (413) (245) (99) (83) (840)Payments in respect to settlements 0 0 0 (26) (26)Acquisitions/Divestitures 0 0 0 0 0Exchange rate changes 0 (151) (189) (63) (403)Other 0 0 0 (2) (2)
Balance, end of year 12,090 4,176 1,401 979 18,646thereof:Unfunded 2 12 195 116 325Funded 12,088 4,164 1,206 863 18,321
Change in fair value of plan assets:Balance, beginning of year 10,975 5,352 1,219 973 18,519Defined benefit cost recognized in Profit & Loss
Interest income 187 135 44 22 388Defined benefit cost recognized in Other ComprehensiveIncome
Return from plan assets less interest income (187) 144 32 32 21Cash flow and other changes
Contributions by plan participants 3 0 0 15 18Contributions by the employer 438 0 31 22 491Benefits paid1 (413) (244) (86) (63) (806)Payments in respect to settlements 0 0 0 (26) (26)Acquisitions/Divestitures 0 0 0 0 0Exchange rate changes 0 (183) (147) (58) (388)Other 0 0 0 (1) (1)Plan administration costs 0 (2) (2) (1) (5)
Balance, end of year 11,003 5,202 1,091 915 18,211Funded status, end of year (1,087) 1,026 (310) (64) (435)
Change in irrecoverable surplus (asset ceiling)Balance, beginning of year 0 0 0 0 0Interest cost 0 0 0 0 0Changes in irrecoverable surplus 0 0 0 (46) (46)Exchange rate changes 0 0 0 2 2Balance, end of year 0 0 0 (44) (44)
Net asset (liability) recognized (1,087) 1,026 (310) (108) (479)2
1 For funded plans only2 Thereof € 1,113 million recognized in Other assets and € 1,592 million in Other liabilities.
There are no reimbursement rights for the Group.

336
Deutsche Bank 2 – Consolidated Financial StatementsAnnual Report 2018
Investment Strategy
The Group’s investment objective is to protect the Group from adverse impacts of its defined benefit pension plans on keyfinancial metrics. In the past, the primary focus has been on protecting the plans’ IFRS funded status in the case of adversemarket scenarios. Recently there has been a shift in the investment strategy in selected markets to balance competing keyfinancial metrics. Investment managers manage pension assets in line with investment mandates or guidelines as agreed withthe pension plans’ trustees and investment committees.
For key defined benefit plans for which the Bank aims to protect the IFRS funded status, the Group applies a liability driveninvestment (LDI) approach. Risks from mismatches between fluctuations in the present value of the defined benefit obligationsand plan assets due to capital market movements are minimized, subject to balancing relevant trade-offs. This is achieved byallocating plan assets closely to the market risk factor exposures of the pension liability to interest rates, credit spreads andinflation. Thereby, plan assets broadly reflect the underlying risk profile and currency of the pension obligations. For pensionplans where the LDI approach may impact adversely other key financial metrics, the Group deviates from this primaryinvestment strategy. For example, in 2015, the Group started to adjust the investment strategy for the German main pensionplan assets by reducing the interest rate and credit spread hedges. The Group closely monitors this divergence from theprimary investment strategy and has put in place governance mechanisms to ensure a regular review of the deviation fromthe LDI approach.
Where the desired hedging level for market risks cannot be achieved with physical instruments (i.e. corporate and governmentbonds), derivatives are employed. Derivative overlays mainly include interest rate, inflation swaps and credit default swaps.Other instruments are also used, such as interest rate futures and options. In practice, a completely hedged approach isimpractical, for instance because of insufficient market depth for ultra-long-term corporate bonds, as well as liquidity and costconsiderations. Therefore, plan assets contain further asset categories to create long-term return enhancement anddiversification benefits such as equity, real estate, high yield bonds or emerging markets bonds.
Plan asset allocation to key asset classes
The following table shows the asset allocation of the Group’s funded defined benefit plans to key asset classes, i.e. exposuresinclude physical securities in discretely managed portfolios and underlying asset allocations of any commingled funds used toinvest plan assets.
Asset amounts in the following table include both “quoted” (i.e. Level 1 assets in accordance with IFRS 13 – amounts investedin markets where the fair value can be determined directly from prices which are quoted in active, liquid markets) and “other”(i.e. Level 2 and 3 assets in accordance with IFRS 13) assets.
Dec 31, 2018 Dec 31, 2017in € m. Germany UK U.S. Other Total Germany UK U.S. Other TotalCash and cash equivalents 1,138 715 (12) 77 1,918 1,260 419 26 74 1,779Equity instruments1 1,148 571 107 60 1,886 1,265 582 118 68 2,033Investment-grade bonds2
Government 1,975 699 428 153 3,255 2,212 1,167 367 161 3,907Non-government bonds 5,196 2,805 405 217 8,623 5,189 2,447 472 175 8,283
Non-investment-grade bondsGovernment 175 0 1 19 195 177 0 0 14 191Non-government bonds 166 80 14 22 282 610 70 20 37 737
Structured products 39 6 52 16 113 41 402 51 26 520Insurance 0 0 0 16 16 0 0 0 27 27Alternatives
Real estate 285 52 0 58 395 232 117 0 56 405Commodities 53 0 0 0 53 48 24 0 0 72Private equity 54 0 0 11 65 58 0 0 0 58Other3 1,419 22 0 243 1,684 788 36 0 274 1,098
Derivatives (Market Value)Interest rate (192) 129 13 (6) (56) (191)4 148 37 (4) (10)Credit 13 0 82 0 95 (155) (1) 0 (1) (157)Inflation (608) (194) 0 5 (797) (544)4 (210) 0 6 (748)Foreign exchange 14 (1) 0 1 14 10 1 0 2 13Other 2 0 (16) 0 (14) 3 0 0 0 3
Total fair value of plan assets 10,877 4,884 1,074 892 17,727 11,003 5,202 1,091 915 18,2111 Allocation of equity exposure is broadly in line with the typical index in the respective market, e.g. the equity portfolio’s benchmark of the UK retirement benefit plans is the
MSCI All Countries World Index.2 Investment-grade means BBB and above. Average credit rating exposure for the Group’s main plans is around A.3 Amongst others this position contains commingled funds which could not be segregated into the other asset categories. In particular the increase from 2017 to 2018 is caused
by such positions.4 Comparative 2017 figures have been changed retrospectively to be in line with the current assignment of assets to the derivative categories.

337
Deutsche Bank Additional NotesAnnual Report 2018 Employee Benefits
The following table sets out the Group’s funded defined benefit plan assets only invested in “quoted” assets, i.e. Level 1 assetsin accordance with IFRS 13.
Dec 31, 2018 Dec 31, 2017in € m. Germany UK U.S. Other Total Germany UK U.S. Other TotalCash and cash equivalents 1,162 30 (16) 40 1,216 1,251 22 24 28 1,325Equity instruments1 1,015 571 107 49 1,742 1,154 582 118 58 1,912Investment-grade bonds2
Government 1,013 695 423 52 2,183 1,190 1,163 362 73 2,788Non-government bonds 0 0 0 0 0 0 0 0 0 0
Non-investment-grade bondsGovernment 0 0 0 2 2 1 0 0 0 1Non-government bonds 0 0 0 0 0 0 0 0 0 0
Structured products 0 0 0 0 0 0 0 0 0 0Insurance 0 0 0 0 0 0 0 0 0 0Alternatives
Real estate 0 0 0 0 0 0 0 0 0 0Commodities 0 0 0 0 0 0 0 0 0 0Private equity 0 0 0 0 0 0 0 0 0 0Other 0 0 0 0 0 0 0 0 0 0
Derivatives (Market Value)Interest rate 0 0 (17) 0 (17) 1 0 6 0 7Credit 0 0 0 0 0 0 (1) 0 0 (1)Inflation 0 0 0 0 0 0 0 0 0 0Foreign exchange 0 (1) 0 0 (1) 0 1 0 0 1Other 2 0 0 0 2 3 0 0 0 3
Total fair value of quotedplan assets 3,192 1,295 497 143 5,127 3,600 1,767 510 159 6,0361 Allocation of equity exposure is broadly in line with the typical index in the respective market, e.g. the equity portfolio’s benchmark of the UK retirement benefit plans is the
MSCI All Countries World Index.2 Investment-grade means BBB and above. Average credit rating exposure for the Group’s main plans is around A.
The following tables show the asset allocation of the “quoted” and “other” defined benefit plan assets by key geography inwhich they are invested.
Dec 31, 2018
in € m. GermanyUnited
KingdomUnitedStates
OtherEurozone
Otherdeveloped
countriesEmerging
markets TotalCash and cash equivalents 141 701 65 953 29 29 1,918Equity instruments 252 108 708 360 363 95 1,886Government bonds(investment-grade and above) 870 574 474 650 249 438 3,255Government bonds(non-investment-grade) 0 0 0 4 24 167 195Non-government bonds(investment-grade and above) 718 2,129 2,023 2,9841 657 112 8,623Non-government bonds(non-investment-grade) 4 65 13 186 5 9 282Structured products 38 21 52 2 0 0 113Subtotal 2,023 3,598 3,335 5,139 1,327 850 16,272
Share (in %) 12 22 20 32 8 5 100Other asset categories 1,455Fair value of plan assets 17,7271 Majority of this amount relates to bonds of French, Dutch and Italian corporate bonds.

338
Deutsche Bank 2 – Consolidated Financial StatementsAnnual Report 2018
Dec 31, 2017
in € m. GermanyUnited
KingdomUnitedStates
OtherEurozone
Otherdeveloped
countriesEmerging
markets TotalCash and cash equivalents 294 126 96 1,204 16 43 1,779Equity instruments 349 83 802 317 336 146 2,033Government bonds(investment-grade and above) 1,057 1,087 397 627 253 486 3,907Government bonds(non-investment-grade) 0 0 0 9 23 159 191Non-government bonds(investment-grade and above) 575 1,890 2,196 2,6071 906 109 8,283Non-government bonds(non-investment-grade) 4 44 20 640 19 10 737Structured products 41 422 51 1 5 0 520Subtotal 2,320 3,652 3,562 5,405 1,558 953 17,450
Share (in %) 13 21 20 31 9 5 100Other asset categories 761Fair value of plan assets 18,2111 Majority of this amount relates to bonds of French, Dutch and Italian corporate bonds.
Plan assets include derivative transactions with Group entities with a negative market value of around € 692 million and€ 737 million at December 31, 2018 and December 31, 2017, respectively. There is neither a material amount of securitiesissued by the Group nor other claims on Group assets included in the fair value of plan assets. The plan assets do not includeany real estate which is used by the Group.
In addition, the Group estimates and allows for uncertain income tax positions which may have an impact on the Group’s planassets. Significant judgment is required in making these estimates and the Group’s final net liabilities may ultimately bematerially different.
Key Risk Sensitivities
The Group’s defined benefit obligations are sensitive to changes in capital market conditions and actuarial assumptions.Sensitivities to capital market movements and key assumption changes are presented in the following table. Each market riskfactor or assumption is changed in isolation. Sensitivities of the defined benefit obligations are approximated using geometricextrapolation methods based on plan durations for the respective assumption. Duration is a risk measure that indicates thebroad sensitivity of the obligations to a change in an underlying assumption and provides a reasonable approximation for smallto moderate changes in those assumptions.
For example, the discount rate duration is derived from the change in the defined benefit obligation to a change in the discountrate based on information provided by the local actuaries of the respective plans. The resulting duration is used to estimatethe remeasurement liability loss or gain from changes in the discount rate. For other assumptions, a similar approach is usedto derive the respective sensitivity results.
For defined benefit pension plans, changes in capital market conditions will impact the plan obligations via actuarialassumptions – mainly discount rate and price inflation rate – as well as the plan assets. Where the Group applies a LDIapproach, the Bank’s overall exposure to changes is reduced. Consequently, to aid understanding of the Group’s riskexposures related to key capital market movements, the net impact of the change in the defined benefit obligations and planassets due to a change of the related market risk factor or underlying actuarial assumption is shown; for sensitivities to changesin actuarial assumptions that do not impact the plan assets, only the impact on the defined benefit obligations is shown.
Asset-related sensitivities are derived for the Group’s major plans by using risk sensitivity factors determined by the Group’sMarket Risk Management function. These sensitivities are calculated based on information provided by the plans’ investmentmanagers and extrapolated linearly to reflect the approximate change of the plan assets’ market value in case of a change inthe underlying risk factor.
The sensitivities illustrate plausible variations over time in capital market movements and key actuarial assumptions. TheGroup is not in a position to provide a view on the likelihood of these capital market or assumption changes. While thesesensitivities illustrate the overall impact on the funded status of the changes shown, the significance of the impact and therange of reasonable possible alternative assumptions may differ between the different plans that comprise the aggregatedresults. Even though plan assets and plan obligations are sensitive to similar risk factors, actual changes in plan assets andobligations may not fully offset each other due to imperfect correlations between market risk factors and actuarial assumptions.Caution should be used when extrapolating these sensitivities due to non-linear effects that changes in capital marketconditions and key actuarial assumptions may have on the overall funded status. Any management actions that may be takento mitigate the inherent risks in the post-employment defined benefit plans are not reflected in these sensitivities.

339
Deutsche Bank Additional NotesAnnual Report 2018 Employee Benefits
Dec 31, 2018 Dec 31, 2017in € m. Germany UK U.S. Other Germany UK U.S. OtherDiscount rate (–50 bp):
(Increase) in DBO (840) (430) (40) (50) (875) (465) (40) (55)Expected increase in plan assets1 235 435 35 20 215 505 35 25Expected net impact on funded status (de-)increase (605) 5 (5) (30) (660) 40 (5) (30)
Discount rate (+50 bp):Decrease in DBO 785 385 25 50 810 420 30 50Expected (decrease) in plan assets1 (235) (435) (35) (20) (215) (505) (35) (25)Expected net impact on funded status (de-)increase 550 (50) (10) 30 595 (85) (5) 25
Credit spread (–50 bp):(Increase) in DBO (840) (430) (75) (55) (875) (465) (85) (60)Expected increase in plan assets1 220 125 20 10 150 125 20 10Expected net impact on funded status (de-)increase (620) (305) (55) (45) (725) (340) (65) (50)
Credit spread (+50 bp):Decrease in DBO 785 385 70 50 810 420 80 55Expected (decrease) in plan assets1 (220) (125) (20) (10) (150) (125) (20) (10)Expected net impact on funded status (de-)increase 565 260 50 40 660 295 60 45
Rate of price inflation (–50 bp):2Decrease in DBO 335 325 0 20 345 345 0 20Expected (decrease) in plan assets1 (190) (270) 0 (10) (180) (310) 0 (10)Expected net impact on funded status (de-)increase 145 55 0 10 165 35 0 10
Rate of price inflation (+50 bp):2
(Increase) in DBO (345) (360) 0 (20) (360) (375) 0 (25)Expected increase in plan assets1 190 270 0 10 180 310 0 10Expected net impact on funded status (de-)increase (155) (90) 0 (10) (180) (65) 0 (15)
Rate of real increase in future compensationlevels (–50 bp):
Decrease in DBO, net impact on funded status 60 10 0 10 70 15 0 15
Rate of real increase in future compensationlevels (+50 bp):
(Increase) in DBO, net impact on funded status (60) (10) 0 (15) (70) (15) 0 (15)
Longevity improvements by 10 %:3
(Increase) in DBO, net impact on funded status (295) (110) (25) (10) (305) (130) (25) (15)1 Expected changes in the fair value of plan assets contain the simulated impact from the biggest plans in Germany, the UK, the U.S., Channel Islands, Switzerland and
Belgium which cover over 99 % of the total fair value of plan assets. The fair value of plan assets for other plans is assumed to be unchanged for this presentation.2 Incorporates sensitivity to changes in pension benefits to the extent linked to the price inflation assumption.3 Estimated to be equivalent to an increase of around 1 year in overall life expectancy.
Expected cash flows
The following table shows expected cash flows for post-employment benefits in 2019, including contributions to the Group’sexternal pension trusts in respect of funded plans, direct payment to beneficiaries in respect of unfunded plans, as well ascontributions to defined contribution plans.
2019in € m. TotalExpected contributions to
Defined benefit plan assets 500BVV 65Pension fund for Postbank's postal civil servants 85Other defined contribution plans 280
Expected benefit payments for unfunded defined benefit plans 30Expected total cash flow related to post-employment benefits 960
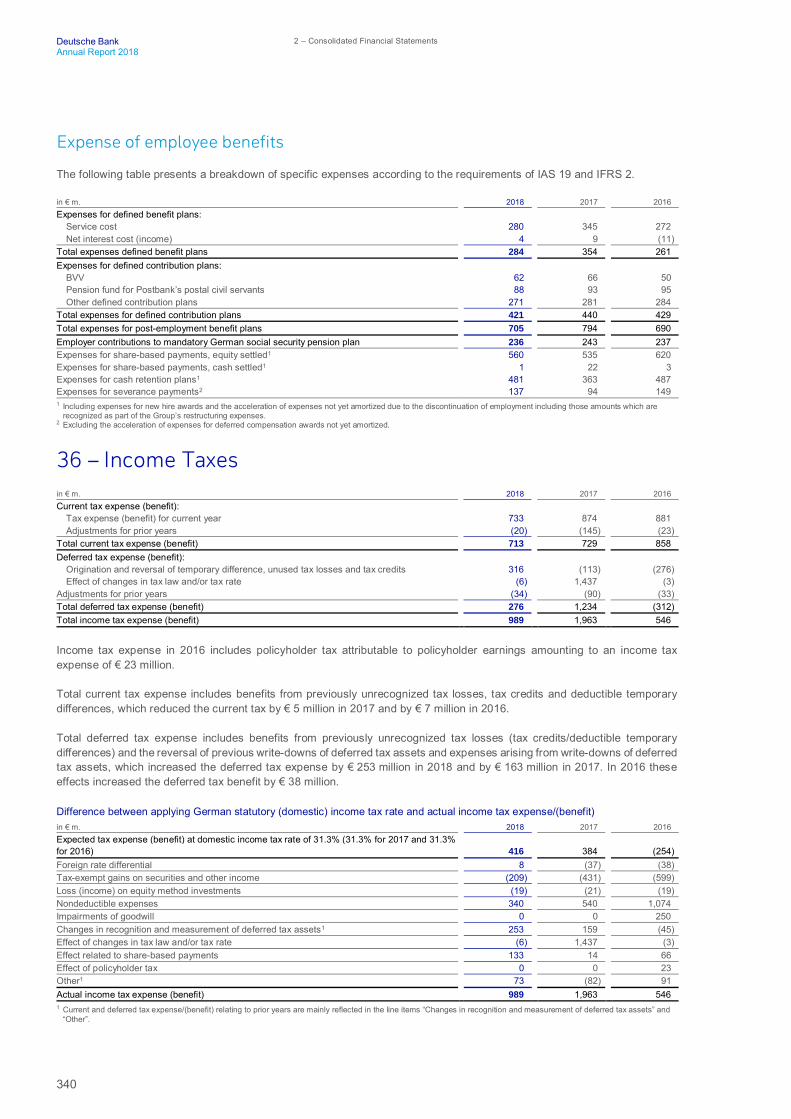
340
Deutsche Bank 2 – Consolidated Financial StatementsAnnual Report 2018
Expense of employee benefits
The following table presents a breakdown of specific expenses according to the requirements of IAS 19 and IFRS 2.
in € m. 2018 2017 2016Expenses for defined benefit plans:
Service cost 280 345 272Net interest cost (income) 4 9 (11)
Total expenses defined benefit plans 284 354 261Expenses for defined contribution plans:
BVV 62 66 50Pension fund for Postbank’s postal civil servants 88 93 95Other defined contribution plans 271 281 284
Total expenses for defined contribution plans 421 440 429Total expenses for post-employment benefit plans 705 794 690Employer contributions to mandatory German social security pension plan 236 243 237Expenses for share-based payments, equity settled1 560 535 620Expenses for share-based payments, cash settled1 1 22 3Expenses for cash retention plans1 481 363 487Expenses for severance payments2 137 94 1491 Including expenses for new hire awards and the acceleration of expenses not yet amortized due to the discontinuation of employment including those amounts which are
recognized as part of the Group’s restructuring expenses.2 Excluding the acceleration of expenses for deferred compensation awards not yet amortized.
36 – Income Taxesin € m. 2018 2017 2016Current tax expense (benefit):
Tax expense (benefit) for current year 733 874 881Adjustments for prior years (20) (145) (23)
Total current tax expense (benefit) 713 729 858Deferred tax expense (benefit):
Origination and reversal of temporary difference, unused tax losses and tax credits 316 (113) (276)Effect of changes in tax law and/or tax rate (6) 1,437 (3)
Adjustments for prior years (34) (90) (33)Total deferred tax expense (benefit) 276 1,234 (312)Total income tax expense (benefit) 989 1,963 546
Income tax expense in 2016 includes policyholder tax attributable to policyholder earnings amounting to an income taxexpense of € 23 million.
Total current tax expense includes benefits from previously unrecognized tax losses, tax credits and deductible temporarydifferences, which reduced the current tax by € 5 million in 2017 and by € 7 million in 2016.
Total deferred tax expense includes benefits from previously unrecognized tax losses (tax credits/deductible temporarydifferences) and the reversal of previous write-downs of deferred tax assets and expenses arising from write-downs of deferredtax assets, which increased the deferred tax expense by € 253 million in 2018 and by € 163 million in 2017. In 2016 theseeffects increased the deferred tax benefit by € 38 million.
Difference between applying German statutory (domestic) income tax rate and actual income tax expense/(benefit)in € m. 2018 2017 2016Expected tax expense (benefit) at domestic income tax rate of 31.3% (31.3% for 2017 and 31.3%for 2016) 416 384 (254)Foreign rate differential 8 (37) (38)Tax-exempt gains on securities and other income (209) (431) (599)Loss (income) on equity method investments (19) (21) (19)Nondeductible expenses 340 540 1,074Impairments of goodwill 0 0 250Changes in recognition and measurement of deferred tax assets1 253 159 (45)Effect of changes in tax law and/or tax rate (6) 1,437 (3)Effect related to share-based payments 133 14 66Effect of policyholder tax 0 0 23Other1 73 (82) 91Actual income tax expense (benefit) 989 1,963 5461 Current and deferred tax expense/(benefit) relating to prior years are mainly reflected in the line items “Changes in recognition and measurement of deferred tax assets” and
“Other”.

341
Deutsche Bank Additional NotesAnnual Report 2018 Income Taxes
The Group is under continuous examinations by tax authorities in various jurisdictions. “Other” in the preceding table includesthe effects of these examinations by the tax authorities.
The domestic income tax rate, including corporate tax, solidarity surcharge, and trade tax, used for calculating deferred taxassets and liabilities was 31.3 % for 2018, 2017 and 2016.
Income taxes charged or credited to equity (other comprehensive income/additional paid in capital)in € m. 2018 2017 2016Actuarial gains/losses related to defined benefit plans 18 (23) 344Net fair value gains (losses) attributable to credit risk related to financialliabilities designated as at fair value through profit or loss (8) 0 0
Financial assets available for sale:Unrealized net gains/losses arising during the period 0 4 20Net gains/losses reclassified to profit or loss 0 99 81
Financial assets mandatory at fair value through other comprehensive income:Unrealized net gains/losses arising during the period 48 0 0Realized net gains/losses arising during the period (reclassified to profit or loss) 86 0 0
Derivatives hedging variability of cash flows:Unrealized net gains/losses arising during the period 1 4 (14)Net gains/losses reclassified to profit or loss 0 42 1
Other equity movement:Unrealized net gains/losses arising during the period 91 2 (71)Net gains/losses reclassified to profit or loss 2 (5) 100
Income taxes (charged) credited to other comprehensive income 238 123 461Other income taxes (charged) credited to equity 1 73 93
Major components of the Group’s gross deferred tax assets and liabilitiesin € m. Dec 31, 20181 Dec 31, 20171
Deferred tax assets:Unused tax losses 2,934 2,985Unused tax credits 160 387Deductible temporary differences:
Trading activities, including derivatives 2,986 3,514Employee benefits, including equity settled share based payments 2,140 2,208Loans and borrowings, including allowance for loans 795 1,015Fair value OCI (IFRS 9) 33 5Intangible Assets 119 119Accrued interest expense 1,133 180Other assets 886 759Other provisions 180 271Other liabilities 21 42
Total deferred tax assets pre offsetting 11,387 11,485Deferred tax liabilities:
Taxable temporary differences:Trading activities, including derivatives 3,038 3,794Employee benefits, including equity settled share based payments 312 266Loans and borrowings, including allowance for loans 345 144Fair value OCI (IFRS 9) 52 89Intangible Assets 453 336Other assets 344 270Other provisions 85 83Other liabilities 40 50
Total deferred tax liabilities pre offsetting 4,669 5,0321 Following the IFRS 9 introduction the presentation was changed and a more granular break down related to the type of temporary differences is provided. Comparatives were
adjusted accordingly.
Deferred tax assets and liabilities, after offsettingin € m. Dec 31, 2018 Dec 31, 2017Presented as deferred tax assets 7,230 6,799Presented as deferred tax liabilities 512 346Net deferred tax assets 6,718 6,453
The change in the balance of deferred tax assets and deferred tax liabilities does not equal the deferred tax expense/(benefit).This is due to (1) deferred taxes that are booked directly to equity, (2) the effects of exchange rate changes on tax assets andliabilities denominated in currencies other than euro, (3) the acquisition and disposal of entities as part of ordinary activitiesand (4) the reclassification of deferred tax assets and liabilities which are presented on the face of the balance sheet ascomponents of other assets and liabilities.
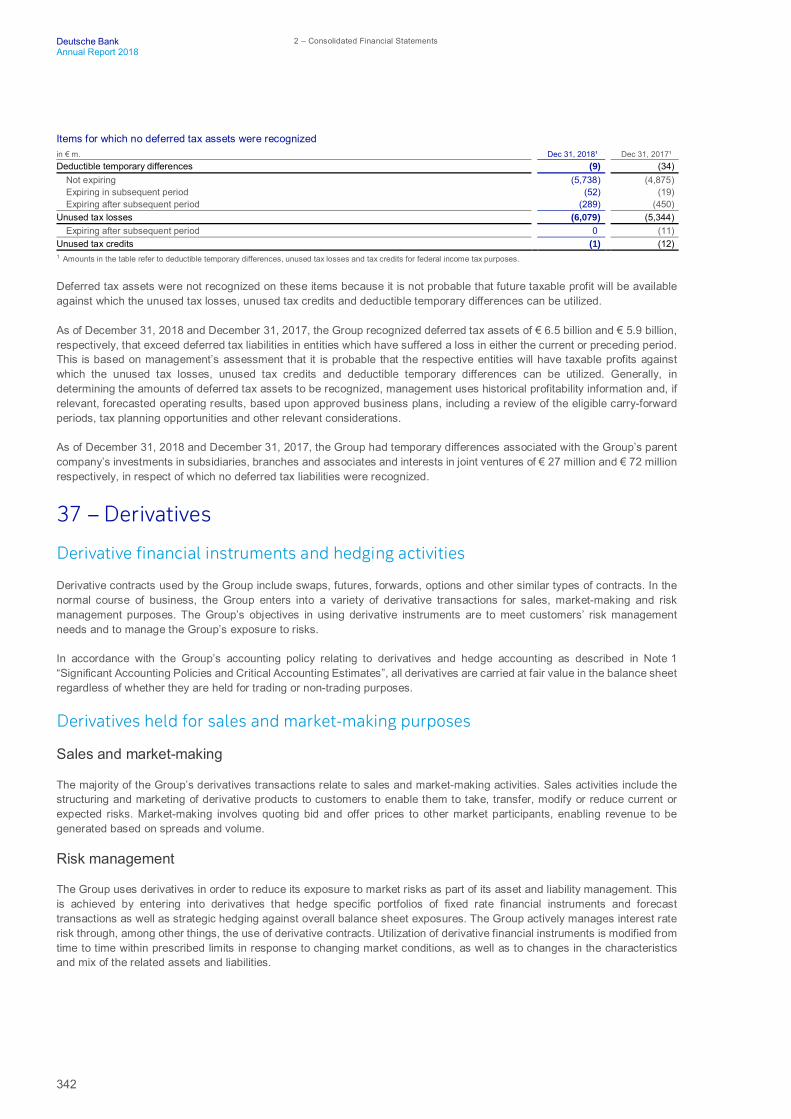
342
Deutsche Bank 2 – Consolidated Financial StatementsAnnual Report 2018
Items for which no deferred tax assets were recognizedin € m. Dec 31, 2018¹ Dec 31, 2017¹Deductible temporary differences (9) (34)
Not expiring (5,738) (4,875)Expiring in subsequent period (52) (19)Expiring after subsequent period (289) (450)
Unused tax losses (6,079) (5,344)Expiring after subsequent period 0 (11)
Unused tax credits (1) (12)1 Amounts in the table refer to deductible temporary differences, unused tax losses and tax credits for federal income tax purposes.
Deferred tax assets were not recognized on these items because it is not probable that future taxable profit will be availableagainst which the unused tax losses, unused tax credits and deductible temporary differences can be utilized.
As of December 31, 2018 and December 31, 2017, the Group recognized deferred tax assets of € 6.5 billion and € 5.9 billion,respectively, that exceed deferred tax liabilities in entities which have suffered a loss in either the current or preceding period.This is based on management’s assessment that it is probable that the respective entities will have taxable profits againstwhich the unused tax losses, unused tax credits and deductible temporary differences can be utilized. Generally, indetermining the amounts of deferred tax assets to be recognized, management uses historical profitability information and, ifrelevant, forecasted operating results, based upon approved business plans, including a review of the eligible carry-forwardperiods, tax planning opportunities and other relevant considerations.
As of December 31, 2018 and December 31, 2017, the Group had temporary differences associated with the Group’s parentcompany’s investments in subsidiaries, branches and associates and interests in joint ventures of € 27 million and € 72 millionrespectively, in respect of which no deferred tax liabilities were recognized.
37 – Derivatives
Derivative financial instruments and hedging activities
Derivative contracts used by the Group include swaps, futures, forwards, options and other similar types of contracts. In thenormal course of business, the Group enters into a variety of derivative transactions for sales, market-making and riskmanagement purposes. The Group’s objectives in using derivative instruments are to meet customers’ risk managementneeds and to manage the Group’s exposure to risks.
In accordance with the Group’s accounting policy relating to derivatives and hedge accounting as described in Note 1“Significant Accounting Policies and Critical Accounting Estimates”, all derivatives are carried at fair value in the balance sheetregardless of whether they are held for trading or non-trading purposes.
Derivatives held for sales and market-making purposes
Sales and market-making
The majority of the Group’s derivatives transactions relate to sales and market-making activities. Sales activities include thestructuring and marketing of derivative products to customers to enable them to take, transfer, modify or reduce current orexpected risks. Market-making involves quoting bid and offer prices to other market participants, enabling revenue to begenerated based on spreads and volume.
Risk management
The Group uses derivatives in order to reduce its exposure to market risks as part of its asset and liability management. Thisis achieved by entering into derivatives that hedge specific portfolios of fixed rate financial instruments and forecasttransactions as well as strategic hedging against overall balance sheet exposures. The Group actively manages interest raterisk through, among other things, the use of derivative contracts. Utilization of derivative financial instruments is modified fromtime to time within prescribed limits in response to changing market conditions, as well as to changes in the characteristicsand mix of the related assets and liabilities.

343
Deutsche Bank Additional NotesAnnual Report 2018 Derivatives
Derivatives qualifying for hedge accounting
The Group applies hedge accounting if derivatives meet the specific criteria described in Note 1 “Significant AccountingPolicies and Critical Accounting Estimates”.
In fair value hedge relationship, the Group uses primarily interest rate swaps and options, in order to protect itself againstmovements in the fair value of fixed-rate financial instruments due to movements in market interest rates. In a cash flow hedgerelationship, the Group uses interest rate swaps in order to protect itself against exposure to variability in interest rates. TheGroup enters into foreign exchange forwards and swaps for hedges of translation adjustments resulting from translating thefinancial statements of net investments in foreign operations into the reporting currency of the parent at period end spot rates.
The Group assesses and measures hedge effectiveness of a hedging relationship based on the change in the fair value orcash flows of the derivative hedging instrument relative to the change in the fair value or cash flows of the hedged itemattributable to the hedged risk. Potential sources of ineffectiveness can be attributed to differences between hedginginstruments and hedged items:
– Mismatches in the terms of hedged items and hedging instruments, for example the frequency and timing of when interestrates are reset, frequency of payment and callable features.
– Difference in the discounting rate applied to the hedged item and the hedging instrument, taking into considerationdifferences in the reset frequency of the hedged item and hedging instrument.
– Derivatives used as hedging instrument with a non-zero fair value at inception date of the hedging relationship, resulting inmismatch in terms with the hedged item.
Interest rate risk
The Group uses interest rate swaps and options to manage its exposure to interest rate risk by modifying the re-pricingcharacteristics of existing and/or forecasted assets and liabilities, including funding and investment activities. The interest rateswaps and options are designated in either a fair value hedge or a cash flow hedge. For fair value hedges, the Group usesinterest rate swaps and options contracts to manage the fair value movements of fixed rate financial instruments due tochanges in benchmark interest. For cash flow hedges, we use interest rate swaps to manage the exposure to cash flowvariability of our variable rate instruments as a result of changes in benchmark interest rates.
The Group manages its interest rate risk exposure on portfolio basis with frequent changes in the portfolio due to the originationof new loans and bonds, repayments of existing loans and bonds, issuance of new funding liabilities and repayment of existingfunding liabilities. Accordingly, a dynamic hedging accounting approach is adopted for the portfolio, in which individual hedgerelationships are designated and de-designated on a more frequent basis (e.g. on a monthly basis).
Foreign exchange risk
The Group manages its foreign currency risk (including U.S. dollar and British pound) from investments in foreign operationthrough net investment hedges using a combination of foreign exchange forwards and swaps as hedging instruments.
As the investments in foreign operations are only hedged to the extent of the notional amount of the hedging derivativeinstrument the Group generally does not expect to incur significant ineffectiveness on hedges of net investments in foreignoperations.
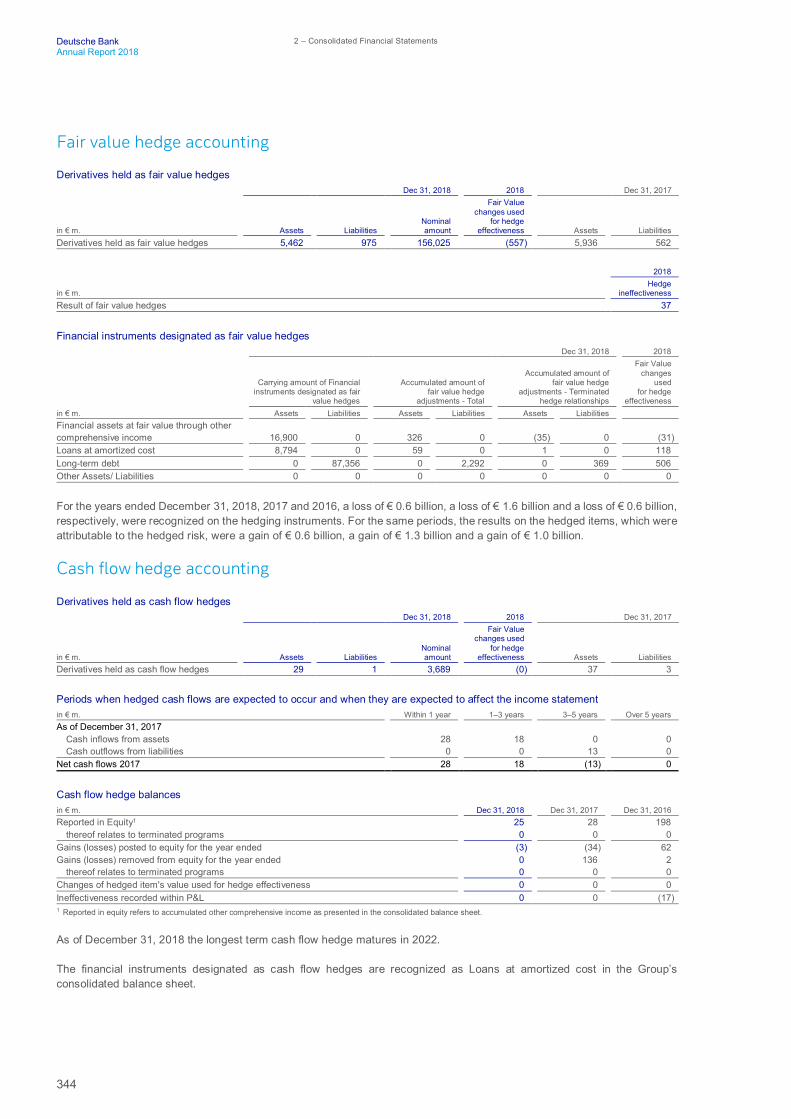
344
Deutsche Bank 2 – Consolidated Financial StatementsAnnual Report 2018
Fair value hedge accounting
Derivatives held as fair value hedgesDec 31, 2018 2018 Dec 31, 2017
in € m. Assets LiabilitiesNominalamount
Fair Valuechanges used
for hedgeeffectiveness Assets Liabilities
Derivatives held as fair value hedges 5,462 975 156,025 (557) 5,936 562
2018
in € m.Hedge
ineffectivenessResult of fair value hedges 37
Financial instruments designated as fair value hedgesDec 31, 2018 2018
Carrying amount of Financialinstruments designated as fair
value hedges
Accumulated amount offair value hedge
adjustments - Total
Accumulated amount offair value hedge
adjustments - Terminatedhedge relationships
Fair Valuechanges
usedfor hedge
effectivenessin € m. Assets Liabilities Assets Liabilities Assets LiabilitiesFinancial assets at fair value through othercomprehensive income 16,900 0 326 0 (35) 0 (31)Loans at amortized cost 8,794 0 59 0 1 0 118Long-term debt 0 87,356 0 2,292 0 369 506Other Assets/ Liabilities 0 0 0 0 0 0 0
For the years ended December 31, 2018, 2017 and 2016, a loss of € 0.6 billion, a loss of € 1.6 billion and a loss of € 0.6 billion,respectively, were recognized on the hedging instruments. For the same periods, the results on the hedged items, which wereattributable to the hedged risk, were a gain of € 0.6 billion, a gain of € 1.3 billion and a gain of € 1.0 billion.
Cash flow hedge accounting
Derivatives held as cash flow hedgesDec 31, 2018 2018 Dec 31, 2017
in € m. Assets LiabilitiesNominalamount
Fair Valuechanges used
for hedgeeffectiveness Assets Liabilities
Derivatives held as cash flow hedges 29 1 3,689 (0) 37 3
Periods when hedged cash flows are expected to occur and when they are expected to affect the income statementin € m. Within 1 year 1–3 years 3–5 years Over 5 yearsAs of December 31, 2017
Cash inflows from assets 28 18 0 0Cash outflows from liabilities 0 0 13 0
Net cash flows 2017 28 18 (13) 0
Cash flow hedge balancesin € m. Dec 31, 2018 Dec 31, 2017 Dec 31, 2016Reported in Equity1 25 28 198
thereof relates to terminated programs 0 0 0Gains (losses) posted to equity for the year ended (3) (34) 62Gains (losses) removed from equity for the year ended 0 136 2
thereof relates to terminated programs 0 0 0Changes of hedged item's value used for hedge effectiveness 0 0 0Ineffectiveness recorded within P&L 0 0 (17)1 Reported in equity refers to accumulated other comprehensive income as presented in the consolidated balance sheet.
As of December 31, 2018 the longest term cash flow hedge matures in 2022.
The financial instruments designated as cash flow hedges are recognized as Loans at amortized cost in the Group’sconsolidated balance sheet.

345
Deutsche Bank Additional NotesAnnual Report 2018 Related Party Transactions
Net investment hedge accounting
Derivatives held as net investment hedges
Dec 31, 2018 2018 Dec 31, 2017
in € m. Assets Liabilities Nominal amount
Fair Valuechanges used
for hedgeeffectiveness Assets Liabilities
Derivatives held as net investment hedges 718 1,710 43,456 (1,380) 612 904
2018
in € m.
Fair valuechanges
recognised inEquity1
Hedgeineffectiveness
Result of net investment hedges 1,742 (345)1 Reported in equity refers to accumulated other comprehensive income as presented in the consolidated balance sheet
For the years ended December 31, 2018, 2017 and 2016, losses of € 345 million, € 348 million and € 437 million, respectively,were recognized due to hedge ineffectiveness which includes the forward point element of the hedging instruments.
Profile of derivatives held as net investment hedges
in € m. Within 1 year 1–3 years 3–5 years Over 5 yearsAs of December 31, 2018
Nominal amount Foreign exchange forwards 28,808 110 13 0Nominal amount Foreign exchange swaps 3,972 5,601 1,982 2,970
Total 32,780 5,711 1,995 2,970
The Group uses a combination a rolling foreign exchange forward strategy and a static foreign currency swap hedging strategy.For the year ended December 31, 2018 the average foreign currency rate for the Group’s foreign currency Euro/USD swapportfolio was 0.82.
38 – Related Party TransactionsParties are considered to be related if one party has the ability to directly or indirectly control the other party or exercisesignificant influence over the other party in making financial or operational decisions. The Group’s related parties include:
– key management personnel, close family members of key management personnel and entities which are controlled,significantly influenced by, or for which significant voting power is held by key management personnel or their close familymembers,
– subsidiaries, joint ventures and associates and their respective subsidiaries, and– post-employment benefit plans for the benefit of Deutsche Bank employees.
Transactions with Key Management Personnel
Key management personnel are those persons having authority and responsibility for planning, directing and controlling theactivities of Deutsche Bank, directly or indirectly. The Group considers the members of the Management Board and of theSupervisory Board of the parent company to constitute key management personnel for purposes of IAS 24.
Compensation expense of key management personnelin € m. 2018 2017 2016Short-term employee benefits 41 39 40Post-employment benefits 10 10 9Other long-term benefits 2 7 7Termination benefits 32 3 0Share-based payment 2 22 12Total 87 81 68

346
Deutsche Bank 2 – Consolidated Financial StatementsAnnual Report 2018
The above table does not contain compensation that employee representatives and former board members on the SupervisoryBoard have received. The aggregated compensation paid to such members for their services as employees of Deutsche Bankor status as former employees (retirement, pension and deferred compensation) amounted to € 1.1 million as ofDecember 31, 2018, € 1.1 million as of December 31, 2017 and € 1.1 million as of December 31, 2016.
Among the Group’s transactions with key management personnel as of December 31, 2018 were loans and commitments of€ 45 million and deposits of € 34 million. As of December 31, 2017, the Group’s transactions with key management personnelwere loans and commitments of € 48 million and deposits of € 123 million.
In addition, the Group provides banking services, such as payment and account services as well as investment advice, to keymanagement personnel and their close family members.
Transactions with Subsidiaries, Joint Ventures and Associates
Transactions between Deutsche Bank AG and its subsidiaries meet the definition of related party transactions. If thesetransactions are eliminated on consolidation, they are not disclosed as related party transactions. Transactions between theGroup and its associated companies and joint ventures and their respective subsidiaries also qualify as related partytransactions.
Transactions for subsidiaries, joint ventures and associates are presented combined in below table as these are not materialindividually.
Loansin € m. 2018 2017Loans outstanding, beginning of year 256 297Movement in loans during the period1 (21) (26)Changes in the group of consolidated companies 0 (1)Exchange rate changes/other (7) (15)Loans outstanding, end of year2 228 256Other credit risk related transactions:Allowance for loan losses 0 0Provision for loan losses 0 0Guarantees and commitments 3 91 Net impact of loans issued and loans repayment during the year is shown as “Movement in loans during the period”.2 Loans past due were € 0 million as of December 31, 2018 and € 0 million as of December 31, 2017. For the total loans the Group held collateral of € 14 million and
€ 14 million as of December 31, 2018 and December 31, 2017, respectively.
Depositsin € m. 2018 2017Deposits outstanding, beginning of year 67 87Movement in deposits during the period1 2 (15)Changes in the group of consolidated companies 0 (0)Exchange rate changes/other (0) (4)Deposits outstanding, end of year 68 671 Net impact of deposits received and deposits repaid during the year is shown as “Movement in deposits during the period”.
Other Transactions
Trading assets and positive market values from derivative financial transactions with associated companies amounted to€ 2 million as of December 31, 2018 and € 6 million as of December 31, 2017. Trading liabilities and negative market valuesfrom derivative financial transactions with associated companies amounted to € 0 million as of December 31, 2018 and€ 0 million as of December 31, 2017.
Other transactions with related parties also reflected the following:
TradeWeb Markets: In the first quarter 2018, the Group ceased to have significant influence over its equity method investmentin TradeWeb Markets LLC and recognized a remeasurement gain of € 84 million equal to the difference between the fair valueand the carrying amount of the investment.
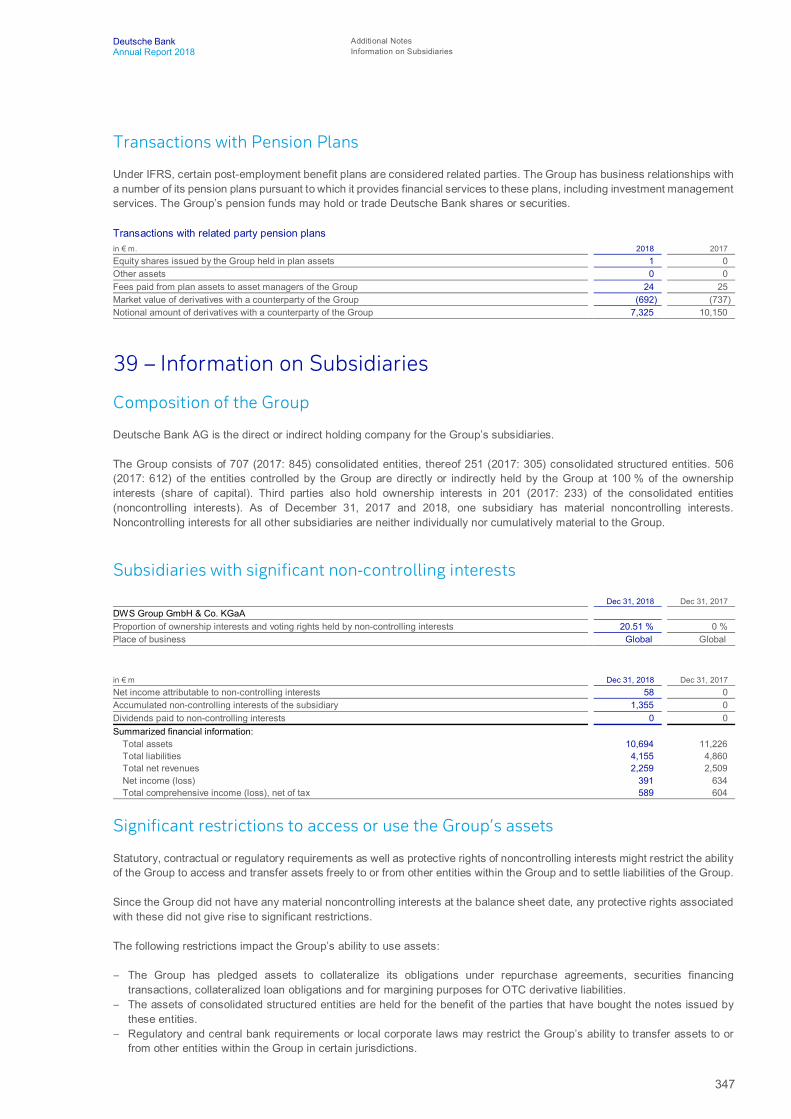
347
Deutsche Bank Additional NotesAnnual Report 2018 Information on Subsidiaries
Transactions with Pension Plans
Under IFRS, certain post-employment benefit plans are considered related parties. The Group has business relationships witha number of its pension plans pursuant to which it provides financial services to these plans, including investment managementservices. The Group’s pension funds may hold or trade Deutsche Bank shares or securities.
Transactions with related party pension plansin € m. 2018 2017Equity shares issued by the Group held in plan assets 1 0Other assets 0 0Fees paid from plan assets to asset managers of the Group 24 25Market value of derivatives with a counterparty of the Group (692) (737)Notional amount of derivatives with a counterparty of the Group 7,325 10,150
39 – Information on Subsidiaries
Composition of the Group
Deutsche Bank AG is the direct or indirect holding company for the Group’s subsidiaries.
The Group consists of 707 (2017: 845) consolidated entities, thereof 251 (2017: 305) consolidated structured entities. 506(2017: 612) of the entities controlled by the Group are directly or indirectly held by the Group at 100 % of the ownershipinterests (share of capital). Third parties also hold ownership interests in 201 (2017: 233) of the consolidated entities(noncontrolling interests). As of December 31, 2017 and 2018, one subsidiary has material noncontrolling interests.Noncontrolling interests for all other subsidiaries are neither individually nor cumulatively material to the Group.
Subsidiaries with significant non-controlling interests
Dec 31, 2018 Dec 31, 2017DWS Group GmbH & Co. KGaAProportion of ownership interests and voting rights held by non-controlling interests 20.51 % 0 %Place of business Global Global
in € m Dec 31, 2018 Dec 31, 2017Net income attributable to non-controlling interests 58 0Accumulated non-controlling interests of the subsidiary 1,355 0Dividends paid to non-controlling interests 0 0Summarized financial information:
Total assets 10,694 11,226Total liabilities 4,155 4,860Total net revenues 2,259 2,509Net income (loss) 391 634Total comprehensive income (loss), net of tax 589 604
Significant restrictions to access or use the Group’s assets
Statutory, contractual or regulatory requirements as well as protective rights of noncontrolling interests might restrict the abilityof the Group to access and transfer assets freely to or from other entities within the Group and to settle liabilities of the Group.
Since the Group did not have any material noncontrolling interests at the balance sheet date, any protective rights associatedwith these did not give rise to significant restrictions.
The following restrictions impact the Group’s ability to use assets:
– The Group has pledged assets to collateralize its obligations under repurchase agreements, securities financingtransactions, collateralized loan obligations and for margining purposes for OTC derivative liabilities.
– The assets of consolidated structured entities are held for the benefit of the parties that have bought the notes issued bythese entities.
– Regulatory and central bank requirements or local corporate laws may restrict the Group’s ability to transfer assets to orfrom other entities within the Group in certain jurisdictions.
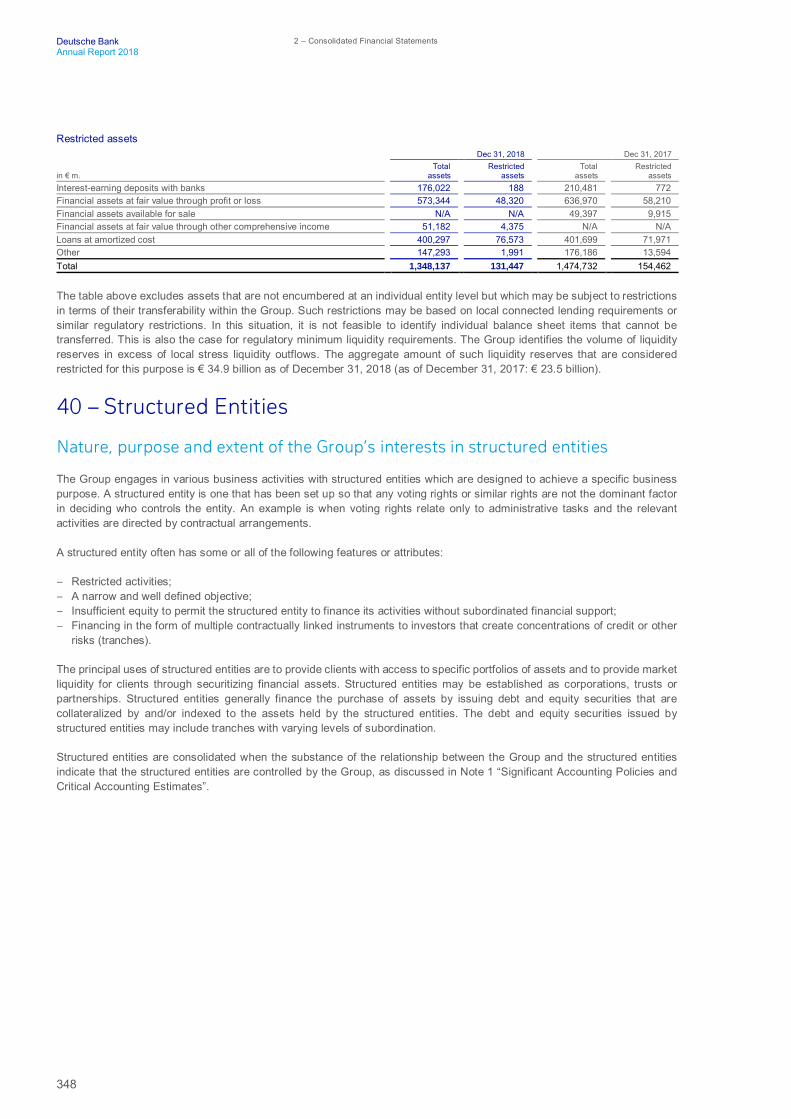
348
Deutsche Bank 2 – Consolidated Financial StatementsAnnual Report 2018
Restricted assetsDec 31, 2018 Dec 31, 2017
in € m.Total
assetsRestricted
assetsTotal
assetsRestricted
assetsInterest-earning deposits with banks 176,022 188 210,481 772Financial assets at fair value through profit or loss 573,344 48,320 636,970 58,210Financial assets available for sale N/A N/A 49,397 9,915Financial assets at fair value through other comprehensive income 51,182 4,375 N/A N/ALoans at amortized cost 400,297 76,573 401,699 71,971Other 147,293 1,991 176,186 13,594Total 1,348,137 131,447 1,474,732 154,462
The table above excludes assets that are not encumbered at an individual entity level but which may be subject to restrictionsin terms of their transferability within the Group. Such restrictions may be based on local connected lending requirements orsimilar regulatory restrictions. In this situation, it is not feasible to identify individual balance sheet items that cannot betransferred. This is also the case for regulatory minimum liquidity requirements. The Group identifies the volume of liquidityreserves in excess of local stress liquidity outflows. The aggregate amount of such liquidity reserves that are consideredrestricted for this purpose is € 34.9 billion as of December 31, 2018 (as of December 31, 2017: € 23.5 billion).
40 – Structured Entities
Nature, purpose and extent of the Group’s interests in structured entities
The Group engages in various business activities with structured entities which are designed to achieve a specific businesspurpose. A structured entity is one that has been set up so that any voting rights or similar rights are not the dominant factorin deciding who controls the entity. An example is when voting rights relate only to administrative tasks and the relevantactivities are directed by contractual arrangements.
A structured entity often has some or all of the following features or attributes:
– Restricted activities;– A narrow and well defined objective;– Insufficient equity to permit the structured entity to finance its activities without subordinated financial support;– Financing in the form of multiple contractually linked instruments to investors that create concentrations of credit or other
risks (tranches).
The principal uses of structured entities are to provide clients with access to specific portfolios of assets and to provide marketliquidity for clients through securitizing financial assets. Structured entities may be established as corporations, trusts orpartnerships. Structured entities generally finance the purchase of assets by issuing debt and equity securities that arecollateralized by and/or indexed to the assets held by the structured entities. The debt and equity securities issued bystructured entities may include tranches with varying levels of subordination.
Structured entities are consolidated when the substance of the relationship between the Group and the structured entitiesindicate that the structured entities are controlled by the Group, as discussed in Note 1 “Significant Accounting Policies andCritical Accounting Estimates”.
349
Deutsche Bank Additional NotesAnnual Report 2018 Structured Entities
Consolidated structured entities
The Group has contractual arrangements which may require it to provide financial support to the following types ofconsolidated structured entities.
Securitization vehiclesThe Group uses securitization vehicles for funding purchase of diversified pool of assets. The Group provides financial supportto these entities in the form of liquidity facility. As of December 31, 2018, and December 31, 2017, there were no outstandingloan commitments to these entities.
FundsThe Group may provide funding and liquidity facility or guarantees to funds consolidated by the group. As ofDecember 31, 2018 and December 31, 2017, the notional value of the liquidity facilities and guarantees provided by the groupto such funds was € 3.0 billion and € 7.2 billion, respectively.
Unconsolidated structured entities
These are entities which are not consolidated because the Group does not control them through voting rights, contract, fundingagreements, or other means. The extent of the Group’s interests to unconsolidated structured entities will vary depending onthe type of structured entities.
Below is a description of the Group’s involvements in unconsolidated structured entities by type.
Repackaging and investment entitiesRepackaging and investment entities are established to meet clients’ investment needs through the combination of securitiesand derivatives. These entities are not consolidated by the Group because the Group does not have power to influence thereturns obtained from the entities. These entities are usually set up to provide a certain investment return pre-agreed with theinvestor, and the Group is not able to change the investment strategy or return during the life of the transaction.
Third party funding entitiesThe Group provides funding to structured entities that hold a variety of assets. These entities may take the form of fundingentities, trusts and private investment companies. The funding is collateralized by the asset in the structured entities. Thegroup’s involvement involves predominantly both lending and loan commitments.
The vehicles used in these transactions are controlled by the borrowers where the borrowers have the ability to decide whetherto post additional margin or collateral in respect of the financing. In such cases, where borrowers can decide to continue orterminate the financing, the borrowers will consolidate the vehicle.
Securitization VehiclesThe Group establishes securitization vehicles which purchase diversified pools of assets, including fixed income securities,corporate loans, and asset-backed securities (predominantly commercial and residential mortgage-backed securities andcredit card receivables). The vehicles fund these purchases by issuing multiple tranches of debt and equity securities, therepayment of which is linked to the performance of the assets in the vehicles.
The Group often transfers assets to these securitization vehicles and provides financial support to these entities in the formof liquidity facilities.
The Group also invests and provides liquidity facilities to third party sponsored securitization vehicles.
The securitization vehicles that are not consolidated into the Group are those where the Group does not hold the power orability to unilaterally remove the servicer or special servicer who has been delegated power over the activities of the entity.

350
Deutsche Bank 2 – Consolidated Financial StatementsAnnual Report 2018
FundsThe Group establishes structured entities to accommodate client requirements to hold investments in specific assets. TheGroup also invests in funds that are sponsored by third parties. A group entity may act as fund manager, custodian or someother capacity and provide funding and liquidity facilities to both group sponsored and third party funds. The funding providedis collateralized by the underlying assets held by the fund.
The Group does not consolidate funds when Deutsche Bank is deemed agent or when another third party investor has theability to direct the activities of the fund.
OtherThese are Deutsche Bank sponsored or third party structured entities that do not fall into any criteria above. These entitiesare not consolidated by the Group when the Group does not hold power over the decision making of these entities.
Income derived from involvement with structured entitiesThe Group earns management fees and, occasionally, performance-based fees for its investment management service inrelation to funds. Interest income is recognized on the funding provided to structured entities. Any trading revenue as a resultof derivatives with structured entities and from the movements in the value of notes held in these entities is recognized in ‘Netgains/losses on financial assets/liabilities held at fair value through profit and loss’.
Interests in unconsolidated structured entitiesThe Group’s interests in unconsolidated structured entities refer to contractual and non-contractual involvement that exposesthe Group to variability of returns from the performance of the structured entities. Examples of interests in unconsolidatedstructured entities include debt or equity investments, liquidity facilities, guarantees and certain derivative instruments in whichthe Group is absorbing variability of returns from the structured entities.
Interests in unconsolidated structured entities exclude instruments which introduce variability of returns into the structuredentities. For example, when the Group purchases credit protection from an unconsolidated structured entity whose purposeand design is to pass through credit risk to investors, the Group is providing the variability of returns to the entity rather thanabsorbing variability. The purchased credit protection is therefore not considered as an interest for the purpose of the tablebelow.
Maximum Exposure to unconsolidated structured entitiesThe maximum exposure to loss is determined by considering the nature of the interest in the unconsolidated structured entity.The maximum exposure for loans and trading instruments is reflected by their carrying amounts in the consolidated balancesheet. The maximum exposure for derivatives and off-balance sheet commitments such as guarantees, liquidity facilities andloan commitments under IFRS 12, as interpreted by the Group, is reflected by the notional amounts. Such amounts or theirdevelopment do not reflect the economic risks faced by the Group because they do not take into account the effects ofcollateral or hedges nor the probability of such losses being incurred. At December 31, 2018, the notional related to the positiveand negative replacement values of derivatives and off-balance sheet commitments were € 372 billion, € 1,311 billion and€ 17 billion respectively. At December 31, 2017, the notional related to the positive and negative replacement values ofderivatives and off-balance sheet commitments were € 327 billion, € 1,146 billion and € 28 billion (comparatives adjusted)respectively.

351
Deutsche Bank Additional NotesAnnual Report 2018 Structured Entities
Size of structured entities
The Group provides a different measure for size of structured entities depending on their type. The following measures havebeen considered as appropriate indicators for evaluating the size of structured entities:
– Funds – Net asset value or assets under management where the Group holds fund units and notional of derivatives whenthe Group’s interest comprises of derivatives.
– Securitizations – notional of notes in issue when the Group derives its interests through notes its holds and notional ofderivatives when the Group’s interests is in the form of derivatives.
– Third party funding entities –Total assets in entities– Repackaging and investment entities – Fair value of notes in issue
For Third party funding entities, size information is not publicly available, therefore the Group has disclosed the greater of thecollateral the Group has received/pledged or the notional of the exposure the Group has to the entity.
The following table shows, by type of structured entity, the carrying amounts of the Group’s interests recognized in theconsolidated statement of financial position as well as the maximum exposure to loss resulting from these interests. It alsoprovides an indication of the size of the structured entities. The carrying amounts presented below do not reflect the truevariability of returns faced by the Group because they do not take into account the effects of collateral or hedges.
Carrying amounts and size relating to Deutsche Bank’s interestsDec 31, 2018
in € m.
Repacka-ging and
InvestmentEntities
Third PartyFundingEntities
Securiti-zations Funds Total
AssetsCash and central bank balances 0 0 0 0 0Interbank balances (w/o central banks) 1 14 0 28 43Central bank funds sold and securitiespurchased under resale agreements 0 508 8 1,397 1,913Securities Borrowed 0 0 0 461 461Total financial assets at fair valuethrough profit or loss 342 4,578 5,956 77,166 88,041
Trading assets 244 3,480 4,567 9,297 17,587Positive market values(derivative financial instruments) 98 571 122 6,516 7,308Non-trading financial assets mandatory at fair valuethrough profit or loss 0 0 0 0 0Financial assets designated at fairvalue through profit or loss 0 526 1,266 61,353 63,145
Financial assets at fair value through other comprehensiveincome 0 286 240 832 1,358Financial assets available for sale N/A N/A N/A N/A N/ALoans at amortized cost 220 40,552 27,322 8,370 76,464Other assets 5 519 216 10,464 11,203Total assets 568 46,456 33,741 98,719 179,483
LiabilitiesTotal financial liabilities at fair valuethrough profit or loss 102 56 3 15,482 15,644
Negative market values(derivative financial instruments) 102 56 3 15,482 15,644
Other short-term borrowings 0 0 0 6,596 6,596Total liabilities 102 56 3 22,078 22,240Off-balance sheet exposure 0 4,363 9,524 3,028 16,915Total 466 50,762 43,261 79,668 174,158
Size of structured entity 2,514 60,525 284,181 2,970,958

352
Deutsche Bank 2 – Consolidated Financial StatementsAnnual Report 2018
Dec 31, 2017
in € m.
Repacka-ging and
InvestmentEntities
Third PartyFundingEntities
Securiti-zations Funds Total
AssetsCash and central bank balances 0 0 0 0 0Interbank balances (w/o central banks) 63 0 0 270 333Central bank funds sold and securitiespurchased under resale agreements 105 229 18 1,827 2,178Securities Borrowed 0 13 0 11,065 11,078Total financial assets at fair valuethrough profit or loss 569 4,057 5,445 60,057 70,128
Trading assets 349 3,490 5,130 12,380 21,349Positive market values(derivative financial instruments) 175 553 105 8,670 9,504Non-trading financial assets mandatory at fair valuethrough profit or loss N/A N/A N/A N/A N/AFinancial assets designated at fairvalue through profit or loss 44 13 210 39,007 39,275
Financial assets at fair value through other comprehensiveincome N/A N/A N/A N/A N/AFinancial assets available for sale 0 1,039 384 730 2,153Loans at amortized cost 146 37,352 18,533 18,050 74,081Other assets 50 192 173 21,087 21,502Total assets 934 42,882 24,552 113,085 181,453
LiabilitiesTotal financial liabilities at fair valuethrough profit or loss 120 73 41 13,486 13,720
Negative market values(derivative financial instruments) 120 73 41 13,486 13,720
Other short-term borrowings 0 0 0 9,533 9,533Total liabilities 120 73 41 23,019 23,253Off-balance sheet exposure 0 10,079 9,256 8,3771 27,7121
Total 814 52,888 33,767 98,4431 185,9121
Size of structured entity 6,833 90,664 281,826 2,181,8101 The comparatives have been adjusted.
Trading assets –Total trading assets as of December 31, 2018 and December 31, 2017 of € 17.6 billion and € 21.3 billion arecomprised primarily of € 4.6 billion and € 5.1 billion in Securitizations and € 9.3 billion and € 12.4 billion in Funds structuredentities respectively. The Group’s interests in securitizations are collateralized by the assets contained in these entities. Wherethe Group holds fund units these are typically in regards to market making in funds or otherwise serve as hedges for notesissued to clients. Moreover the credit risk arising from loans made to Third party funding structured entities is mitigated by thecollateral received.
Financial assets designated at fair value through profit or loss – Reverse repurchase agreements to Funds comprise the majorityof the interests in this category and are collateralized by the underlying securities.
Loans – Loans as of December 31, 2018 and December 31, 2017 consist of € 76.5 billion and € 74.1 billion investment insecuritization tranches and financing to Third party funding entities. The Group’s financing to Third party funding entities iscollateralized by the assets in those structured entities.
Other assets – Other assets as of December 31, 2018 and December 31, 2017 of € 11.2 billion and € 21.5 billion, respectively,consist primarily of prime brokerage receivables and cash margin balances.
Pending Receivables – Pending Receivable balances are not included in this disclosure note due to the fact that thesebalances arise from typical customer supplier relationships out of e.g. brokerage type activities and their inherent volatilitywould not provide users of the financial statements with effective information about Deutsche Bank’s exposures to structuredentities.
Financial Support
Deutsche Bank did not provide non-contractual support during the year to unconsolidated structured entities.

353
Deutsche Bank Additional NotesAnnual Report 2018 Current and Non-Current Assets and Liabilities
Sponsored Unconsolidated Structured Entities where the Group has no interestas of December 31, 2018 and December 31, 2017.
As a sponsor, the Group is involved in the legal set up and marketing of the entity and supports the entity in different ways,namely:
– transferring assets to the entities– providing seed capital to the entities– providing operational support to ensure the entity’s continued operation– providing guarantees of performance to the structured entities.
The Group is also deemed a sponsor for a structured entity if market participants would reasonably associate the entity withthe Group. Additionally, the use of the Deutsche Bank name for the structured entity indicates that the Group has acted as asponsor.
The gross revenues from sponsored entities where the Group did not hold an interest as of December 31, 2018 and December31, 2017 were € (220) million and € 56 million respectively. Instances where the Group does not hold an interest in anunconsolidated sponsored structured entity include cases where any seed capital or funding to the structured entity hasalready been repaid in full to the Group during the year. This amount does not take into account the impacts of hedges and isrecognized in Net gains/losses on financial assets/liabilities at fair value through profit and loss. The aggregated carryingamounts of assets transferred to sponsored unconsolidated structured entities in 2018 were € 4.1 billion for securitization and€ 2.4 billion for repackaging and investment entities. In 2017, they were € 2.1 billion for securitization and € 26 million forrepackaging and investment entities.
41 – Current and Non-Current Assets and Liabilities
Asset and liability line items by amounts recovered or settled within or after oneyear
Asset items as of December 31, 2018Amounts recovered or settled Total
in € m. within one year after one year Dec 31, 2018Cash and central bank balances 188,691 40 188,732Interbank balances (w/o central banks) 8,282 599 8,881Central bank funds sold and securities purchased under resale agreements 5,861 2,361 8,222Securities borrowed 3,396 0 3,396Financial assets at fair value through profit or loss 536,367 36,977 573,344Financial assets at fair value through other comprehensive income 16,725 34,457 51,182Financial assets available for sale N/A N/A N/AEquity method investments 0 879 879Loans at amortized cost 110,828 289,468 400,297Securities held to maturity N/A N/A N/AProperty and equipment 0 2,421 2,421Goodwill and other intangible assets 0 9,141 9,141Other assets 82,588 10,856 93,444Assets for current tax 396 574 970Total assets before deferred tax assets 953,134 387,774 1,340,907Deferred tax assets 7,230Total assets 1,348,137

354
Deutsche Bank 2 – Consolidated Financial StatementsAnnual Report 2018
Liability items as of December 31, 2018Amounts recovered or settled Total
in € m. within one year after one year Dec 31, 2018Deposits 531,700 32,705 564,405Central bank funds purchased and securities sold under repurchase agreements 4,866 1 4,867Securities loaned 3,359 0 3,359Financial liabilities at fair value through profit or loss 410,409 5,271 415,680Other short-term borrowings 14,158 0 14,158Other liabilities 115,511 2,002 117,513Provisions 2,711 0 2,711Liabilities for current tax 286 658 944Long-term debt 47,317 104,766 152,083Trust preferred securities 3,168 0 3,168Total liabilities before deferred tax liabilities 1,133,485 145,403 1,278,887Deferred tax liabilities 512Total liabilities 1,279,400
Asset items as of December 31, 2017Amounts recovered or settled Total
in € m. within one year after one year Dec 31, 2017Cash and central bank balances 225,537 118 225,655Interbank balances (w/o central banks) 8,681 585 9,265Central bank funds sold and securities purchased under resale agreements 9,216 755 9,971Securities borrowed 16,710 22 16,732Financial assets at fair value through profit or loss 623,075 13,895 636,970Financial assets available for sale 9,882 39,514 49,397Equity method investments 0 866 866Loans 113,190 288,510 401,699Securities held to maturity 0 3,170 3,170Property and equipment 0 2,663 2,663Goodwill and other intangible assets 0 8,839 8,839Other assets 95,383 6,108 101,491Assets for current tax 840 375 1,215Total assets before deferred tax assets 1,102,514 365,419 1,467,933Deferred tax assets 6,799Total assets 1,474,732
Liability items as of December 31, 2017Amounts recovered or settled Total
in € m. within one year after one year Dec 31, 2017Deposits 550,987 30,886 581,873Central bank funds purchased and securities sold under repurchase agreements 17,591 515 18,105Securities loaned 6,688 1 6,688Financial liabilities at fair value through profit or loss 473,165 5,471 478,636Other short-term borrowings 18,411 0 18,411Other liabilities 127,388 4,820 132,208Provisions 4,158 0 4,158Liabilities for current tax 366 635 1,001Long-term debt 46,403 113,313 159,715Trust preferred securities 4,825 666 5,491Total liabilities before deferred tax liabilities 1,249,981 156,306 1,406,287Deferred tax liabilities 346Total liabilities 1,406,633
42 – Events after the Reporting PeriodAfter the reporting date no material events occurred which had a significant impact on our results of operations, financialposition and net assets.

355
Deutsche Bank Additional NotesAnnual Report 2018 Regulatory capital Information
43 – Regulatory capital Information
General definitions
The calculation of our regulatory capital incorporates the capital requirements following the “Regulation (EU) No 575/2013 onprudential requirements for credit institutions and investment firms” (Capital Requirements Regulation or “CRR”) and the“Directive 2013/36/EU on access to the activity of credit institutions and the prudential supervision of credit institutions andinvestment firms” (Capital Requirements Directive 4 or “CRD 4”) as implemented into German law. The information in thissection as well as in the section “Development of risk-weighted Assets” is based on the regulatory principles of consolidation.
This section refers to the capital adequacy of the group of entities consolidated for banking regulatory purposes pursuant tothe CRR and the German Banking Act (“Kreditwesengesetz” or “KWG”). Therein not included are insurance companies orcompanies outside the finance sector.
The total regulatory capital pursuant to the effective regulations as of year-end 2018 comprises Tier 1 and Tier 2 (T2) capital.Tier 1 capital is subdivided into Common Equity Tier 1 (CET 1) capital and Additional Tier 1 (AT1) capital.
Common Equity Tier 1 (CET 1) capital consists primarily of common share capital (reduced by own holdings) including relatedshare premium accounts, retained earnings (including losses for the financial year, if any) and accumulated othercomprehensive income, subject to regulatory adjustments (i.e. prudential filters and deductions). Prudential filters for CET 1capital, according to Articles 32 to 35 CRR, include (i) securitization gains on sale, (ii) cash flow hedges and changes in thevalue of own liabilities, and (iii) additional value adjustments. CET 1 capital deductions comprise (i) intangible assets, (ii)deferred tax assets that rely on future profitability, (iii) negative amounts resulting from the calculation of expected lossamounts, (iv) net defined benefit pension fund assets, (v) reciprocal cross holdings in the capital of financial sector entitiesand, (vi) significant and non-significant investments in the capital (CET 1, AT1, T2) of financial sector entities above certainthresholds. All items not deducted (i.e., amounts below the threshold) are subject to risk-weighting.
Additional Tier 1 (AT1) capital consists of AT1 capital instruments and related share premium accounts as well asnoncontrolling interests qualifying for inclusion in consolidated AT1 capital, and during the transitional period grandfatheredinstruments eligible under earlier frameworks. To qualify as AT1 capital under CRR/CRD 4, instruments must have principalloss absorption through a conversion to common shares or a write-down mechanism allocating losses at a trigger point andmust also meet further requirements (perpetual with no incentive to redeem; institution must have full dividend/coupondiscretion at all times, etc.).
Tier 2 (T2) capital comprises eligible capital instruments, the related share premium accounts and subordinated long-termdebt, certain loan loss provisions and noncontrolling interests that qualify for inclusion in consolidated T2 capital. To qualifyas T2 capital, capital instruments or subordinated debt must have an original maturity of at least five years. Moreover, eligiblecapital instruments may inter alia not contain an incentive to redeem, a right of investors to accelerate repayment, or a creditsensitive dividend feature.
Capital instruments that no longer qualify as AT1 or T2 capital under the CRR/CRD 4 fully loaded rules are subject tograndfathering rules during the transitional period and are phased out from 2013 to 2022 with their recognition capped at 40 %in 2018 and the cap decreasing by 10 % every year.
Capital instruments
Our Management Board received approval from the 2017 Annual General Meeting to buy back up to 206.7 million sharesbefore the end of April 2022. Thereof 103.3 million shares can be purchased by using derivatives, this includes 41.3 millionderivatives with a maturity exceeding 18 months. During the period from the 2017 Annual General Meeting until the 2018Annual General Meeting (May 24, 2018), 22.8 million shares have been purchased, of which 4.4 million shares throughexercise of call options. The shares purchased were used for equity compensation purposes in the same period or are to beused in the upcoming period so that the number of shares held in Treasury from buybacks was 1.3 million as of the 2018Annual General Meeting.

356
Deutsche Bank 2 – Consolidated Financial StatementsAnnual Report 2018
The 2018 Annual General Meeting granted our Management Board the approval to buy back up to 206.7 million shares beforethe end of April 2023. Thereof 103.3 million shares can be purchased by using derivatives, this includes 41.3 million derivativeswith a maturity exceeding 18 months. These authorizations substitute the authorizations of the previous year. During theperiod from the 2018 Annual General Meeting until December 31, 2018, 9.3 million shares were purchased. The sharespurchased are to be used in the upcoming period so that the number of shares held in Treasury from buybacks was 1.2 millionas of December 31, 2018.
Since the 2017 Annual General Meeting, and as of December 31, 2018, authorized capital available to the Management Boardis € 2,560 million (1,000 million shares). As of December 31, 2018, the conditional capital against cash stands at € 512 million(200 million shares). Additional conditional capital for equity compensation amounts to € 51.2 million (20 million shares).Further the 2018 Annual General Meeting authorized the issuance of participatory notes and other Hybrid Debt Securities thatfulfill the regulatory requirements to qualify as Additional Tier 1 capital with an equivalent value of € 8.0 billion.
Our legacy Hybrid Tier 1 capital instruments (substantially all noncumulative trust preferred securities) are not recognizedunder fully loaded CRR/CRD 4 rules as Additional Tier 1 capital, mainly because they have no write-down or equity conversionfeature. However, they are recognized as Additional Tier 1 capital under CRR/CRD 4 transitional provisions and can still berecognized as Tier 2 capital under the fully loaded CRR/CRD 4 rules. During the transitional phase-out period the maximumrecognizable amount of Additional Tier 1 instruments from Basel 2.5 compliant issuances as of December 31, 2012 will bereduced at the beginning of each financial year by 10 % or € 1.3 billion, through 2022. For December 31, 2018, this resultedin eligible Additional Tier 1 instruments of € 7.6 billion (i.e. € 4.6 billion newly issued AT1 Notes plus € 3.0 billion of legacyHybrid Tier 1 instruments recognizable during the transition period). € 3.0 billion of the legacy Hybrid Tier 1 instruments canstill be recognized as Tier 2 capital under the fully loaded CRR/CRD 4 rules. Additional Tier 1 instruments recognized underfully loaded CRR/CRD 4 rules amounted to € 4.6 billion as of December 31, 2018. In 2018, the bank has redeemed one legacyHybrid Tier 1 instrument with a notional of U.S. $ 2.0 billion and an eligible equivalent amount of € 1.6 billion and anotherlegacy Hybrid Tier 1 instrument with a notional of € 1.0 billion and an eligible equivalent amount of € 1.0 billion. The firstredemption was already derecognized from regulatory Additional Tier 1 capital in 2017 with the effective date of the call-permission by the ECB.
The total of our Tier 2 capital instruments as of December 31, 2018 recognized during the transition period under CRR/CRD4 was € 6.2 billion. As of December 31, 2018, there were no legacy Hybrid Tier 1 instruments that are counted as Tier 2 capitalunder transitional rules. The gross notional value of the Tier 2 capital instruments was € 7.5 billion. Tier 2 instrumentsrecognized under fully loaded CRR/CRD 4 rules amounted to € 9.2 billion as of December 31, 2018 (including the € 3.0 billionlegacy Hybrid Tier 1 capital instruments only recognizable as Additional Tier 1 capital during the transitional period). In 2018,the bank has redeemed one Tier 2 capital instrument with a notional of JPY 21.0 billion and an eligible equivalent amount of€ 0.1 billion and another Tier 2 capital instrument with a notional of JPY 3.0 billion and an eligible equivalent amount of € 0.0billion. These redemptions were already derecognized from regulatory Tier 2 capital in 2017 with the effective date of the call-permission by the ECB.
Minimum capital requirements
Failure to meet minimum capital requirements can result in supervisory measures such as restrictions of profit distributions orlimitations on certain businesses such as lending. We complied with the regulatory capital adequacy requirements in 2018.

357
Deutsche Bank Additional NotesAnnual Report 2018 Regulatory capital Information
Details on regulatory capital
Own Funds Template (incl. RWA and capital ratios)Dec 31, 2018 Dec 31, 2017
in € m. CRR/CRD 41 CRR/CRD 4Common Equity Tier 1 (CET 1) capital: instruments and reserves
Capital instruments, related share premium accounts and other reserves2 45,515 45,195Retained earnings 16,297 17,977Accumulated other comprehensive income (loss), net of tax 382 660Independently reviewed interim profits net of any foreseeable charge or dividend3 0 (751)Other2 846 33
Common Equity Tier 1 (CET 1) capital before regulatory adjustments 63,041 63,114
Common Equity Tier 1 (CET 1) capital: regulatory adjustmentsAdditional value adjustments (negative amount) (1,504) (1,204)Other prudential filters (other than additional value adjustments) (329) (74)Goodwill and other intangible assets (net of related tax liabilities) (negative amount) (8,566) (6,715)Deferred tax assets that rely on future profitability excluding those arising fromtemporary differences (net of related tax liabilities where the conditions in Art. 38 (3)CRR are met) (negative amount) (2,758) (2,403)Negative amounts resulting from the calculation of expected loss amounts4 (367) (408)Defined benefit pension fund assets (negative amount) (1,111) (900)Direct, indirect and synthetic holdings by an institution of own CET 1 instruments (negative amount) (25) (117)Direct, indirect and synthetic holdings by the institution of the CET 1 instruments of financial sectorentities where the institution has a significant investment in those entities (amount above the10 % / 15 % thresholds and net of eligible short positions) (negative amount) 0 0Deferred tax assets arising from temporary differences (net of related tax liabilities where theconditions in Art. 38 (3) CRR are met) (amount above the 10 % / 15 % thresholds) (negative amount) 0 0Other regulatory adjustments5 (895) (485)
Total regulatory adjustments to Common Equity Tier 1 (CET 1) capital (15,555) (12,306)Common Equity Tier 1 (CET 1) capital 47,486 50,808
Additional Tier 1 (AT1) capital: instrumentsCapital instruments and the related share premium accounts 4,676 4,676Amount of qualifying items referred to in Art. 484 (4) CRR and the related sharepremium accounts subject to phase out from AT1 3,009 3,904
Additional Tier 1 (AT1) capital before regulatory adjustments 7,685 8,579
Additional Tier 1 (AT1) capital: regulatory adjustmentsDirect, indirect and synthetic holdings by an institution of own AT1 instruments (negative amount) (80) (26)Residual amounts deducted from AT1 capital with regard to deduction from CET 1 capital during thetransitional period pursuant to Art. 472 CRR N/M (1,730)Other regulatory adjustments 0 0
Total regulatory adjustments to Additional Tier 1 (AT1) capital (80) (1,756)Additional Tier 1 (AT1) capital 7,604 6,823Tier 1 capital (T1 = CET 1 + AT1) 55,091 57,631
Tier 2 (T2) capital 6,202 6,384Total capital (TC = T1 + T2) 61,292 64,016Total risk-weighted assets 350,432 343,316
Capital ratiosCommon Equity Tier 1 capital ratio (as a percentage of risk-weighted assets) 13.6 14.8Tier 1 capital ratio (as a percentage of risk-weighted assets) 15.7 16.8Total capital ratio (as a percentage of risk-weighted assets) 17.5 18.6N/M – Not meaningful1 With effect from January 1, 2018, the CRR/CRD 4 “transitional” (or “phase-in”) rules under which CET 1 regulatory adjustments were phased in have reached a rate of 100 %,
together with the 100 % phase-out rate of minority interest only recognizable under the transitional rules.2 Our IPO of DWS led to a € 0.9 billion CET 1 contribution which is reflected in ‘Capital instruments, related share premium accounts and other reserves’ at € 0.1 billion and
minority interest in ‘Other’ at € 0.8 billion.3 No interim profits to be recognized as per ECB Decision (EU) 2015/656 in accordance with the Article 26(2) of Regulation (EU) No 575/2013 (ECB/2015/4).4 Based on Article 159 CRR and recent guidance provided by EBA (Q&A 2017_3426) published on January 18, 2019 only unearned credit spread additional value adjustments
are used as specific credit risk adjustments.5 Includes € 0.6 billion capital deduction effective from January 2018 onwards, based on ECB guidance and following the EBA Guidelines on irrevocable payment commitments
related to the Single Resolution Fund and the Deposit Guarantee Scheme. Further includes capital deduction of € 0.3 billion that was imposed on Deutsche Bank effectivefrom October 2016 onwards based on a notification by the ECB pursuant to Article 16(1)(c) and 16(2)(d) of Regulation (EU) No 1024/2013.

358
Deutsche Bank 2 – Consolidated Financial StatementsAnnual Report 2018
Reconciliation of shareholders’ equity to regulatory capitalCRR/CRD 4
in € m. Dec 31, 2018 Dec 31, 2017Total shareholders’ equity per accounting balance sheet1 62,495 63,174Deconsolidation/Consolidation of entities
(33) (58)Of which:Additional paid-in capital (12) (6)Retained earnings (150) (228)Accumulated other comprehensive income (loss), net of tax 130 176
Total shareholders' equity per regulatory balance sheet 62,462 63,116Minority Interests (amount allowed in consolidated CET 1)1 846 33Accrual for dividend and AT1 coupons2 (267) 0Reversal of deconsolidation/consolidation of the position Accumulated other comprehensive income (loss),net of tax, during transitional period 0 (35)Common Equity Tier 1 (CET 1) capital before regulatory adjustments 63,041 63,114Additional value adjustments (1,504) (1,204)Other prudential filters (other than additional value adjustments) (329) (74)Regulatory adjustments relating to unrealized gains and losses pursuant to Art. 467 and 468 CRR 0 (144)Goodwill and other intangible assets (net of related tax liabilities) (8,566) (6,715)Deferred tax assets that rely on future profitability (2,758) (2,403)Defined benefit pension fund assets (1,111) (900)Direct, indirect and synthetic holdings by the institution of the CET 1 instruments of financial sector entitieswhere the institution has a significant investment in those entities 0 0Other regulatory adjustments (1,287) (866)Common Equity Tier 1 capital 47,486 50,8081 Our IPO of DWS led to a € 0.9 billion CET 1 contribution which is reflected in the ‘Total shareholders’ equity per accounting balance sheet’ at € 0.1 billion and ‘Minority
interests’ at € 0.8 billion.2 No interim profits to be recognized as per ECB Decision (EU) 2015/656 in accordance with the Article 26(2) of Regulation (EU) No 575/2013 (ECB/2015/4).
Capital management
Our Treasury function manages solvency, capital adequacy, leverage and bail-in capacity ratios at Group level and locally ineach region, as applicable. Treasury implements our capital strategy, which itself is developed by the Group Risk Committeeand approved by the Management Board. Treasury, directly or through the Group Asset and Liability Committee, which hasbeen established in the first half of the year 2018, manages, among other things, issuance and repurchase of shares andcapital instruments, hedging of capital ratios against foreign exchange swings, setting capacities for key financial resources,design of shareholders’ equity allocation, and regional capital planning. We are fully committed to maintaining our soundcapitalization both from an economic and regulatory perspective. We continuously monitor and adjust our overall capitaldemand and supply in an effort to achieve an appropriate balance of the economic and regulatory considerations at all timesand from all perspectives. These perspectives include book equity based on IFRS accounting standards, regulatory andeconomic capital as well as specific capital requirements from rating agencies.
Treasury manages the issuance and repurchase of capital instruments, namely Common Equity Tier 1, Additional Tier 1 andTier 2 capital instruments as well as TLAC/MREL eligible debt instruments. Treasury constantly monitors the market for liabilitymanagement trades. Such trades represent a countercyclical opportunity to create Common Equity Tier 1 capital by buyingback our issuances below par.
Our core currencies are Euro, US Dollar, Chinese Renminbi and Pound Sterling. Treasury manages the sensitivity of ourcapital ratios against swings in core currencies. The capital invested into our foreign subsidiaries and branches in the othernon-core currencies is largely hedged against foreign exchange swings. Treasury determines which currencies are to behedged, develops suitable hedging strategies in close cooperation with Risk Management and finally executes these hedges.
359
Deutsche Bank Additional NotesAnnual Report 2018 Regulatory capital Information
Resource limit setting
Usage of key financial resources is influenced through the following governance processes and incentives.
Target resource capacities are reviewed in our annual strategic plan in line with our CET 1 and Leverage Ratio ambitions. Ina quarterly process, the Group Asset and Liability Committee, which insofar as it replaced the Group Risk Committee asdecision body, approves divisional resource limits for Total Capital Demand and leverage exposure that are based on thestrategic plan but adjusted for market conditions and the short-term outlook. Limits are enforced through a close monitoringprocess and an excess charging mechanism.
Overall regulatory capital requirements are principally driven by either our CET 1 ratio (solvency) or leverage ratio (leverage)requirements, whichever is the more binding constraint. For the internal capital allocation, the combined contribution of eachsegment to the Group’s Common Equity Tier 1 ratio, the Group’s Leverage ratio and the Group’s Capital Loss under Stressare weighted to reflect their relative importance and level of constraint to the Group. Contributions to the Common EquityTier 1 ratio and the Leverage ratio are measured through Risk-Weighted Assets (RWA) and Leverage Ratio Exposure (LRE)assuming full implementation of CRR/CRD 4 rules. The Group’s Capital Loss under Stress is a measure of the Group’s overalleconomic risk exposure under a defined stress scenario. In our performance measurement, our methodology also appliesdifferent rates for the cost of equity for each of the business segments, reflecting in a more differentiated way the earningsvolatility of the individual business models. This enables improved performance management and investment decisions.
Regional capital plans covering the capital needs of our branches and subsidiaries across the globe are prepared on an annualbasis and presented to the Group Investment Committee. Most of our subsidiaries are subject to legal and regulatory capitalrequirements. In developing, implementing and testing our capital and liquidity, we fully take such legal and regulatoryrequirements into account.
Further, Treasury is represented on the Investment Committee of the largest Deutsche Bank pension fund which sets theinvestment guidelines for this fund. This representation is intended to ensure that pension assets are aligned with pensionliabilities, thus protecting our capital base.

360
Deutsche Bank 2 – Consolidated Financial StatementsAnnual Report 2018
44 – Supplementary Information to the Consolidated FinancialStatements according to Sections 297 (1a) / 315a HGB and thereturn on assets according to Article 26a of the GermanBanking Act
Staff Costs
in € m. 2018 2017Staff costs:Wages and salaries 9,828 10,108Social security costs 1,986 2,145
thereof: those relating to pensions 681 749Total 11,814 12,253
Staff
The average number of effective staff employed in 2018 was 95,566 (2017: 97,733) of whom 41,967 (2017: 42,910) werewomen. Part-time staff is included in these figures proportionately. An average of 53,401 (2017: 54,214) staff members workedoutside Germany.
Management Board and Supervisory Board Remuneration
In accordance with the requirements of the GAS 17, the members of the Management Board collectively received in the 2018financial year compensation totaling € 52,181,136 (2017: € 37,665,535). Of that, € 25,711,111 (2017: € 29,200,000) was forfixed compensation, € 4,200,000 (2017: € 550,000) for functional allowances, € 2,123,102 (2017: € 2,053,520) for fringebenefits and € 20,146,923 (2017: € 5,862,015) for performance-related components.
Former members of the Management Board of Deutsche Bank AG or their surviving dependents received € 22,943,159 and€ 27,694,325 for the years ended December 31, 2018 and 2017, respectively.
The compensation principles for Supervisory Board members are set forth in our Articles of Association. The compensationprovisions, which were newly conceived in 2013, were last amended by resolution of the Annual General Meeting on May 182017 and became effective on October 5, 2017. The members of the Supervisory Board receive fixed annual compensation.The annual base compensation amounts to € 100,000 for each Supervisory Board member. The Supervisory Board Chairmanreceives twice that amount and the Deputy Chairperson one and a half times that amount. Members and chairs of thecommittees of the Supervisory Board are paid additional fixed annual compensation. 75 % of the compensation determinedis disbursed to each Supervisory Board member after submitting invoices within the first three month of the following year.The other 25 % is converted by the company at the same time into company shares (notional shares) according to theprovisions of the Articles of Association. The share value of this number of shares is paid to the respective Supervisory Boardmember in February of the year following his departure from the Supervisory Board or the expiration of his term of officeaccording to the provisions of the Articles of Association, provided that the member does not leave the Supervisory Board dueto important cause which would have justified dismissal. In case of a change in Supervisory Board membership during theyear, compensation for the financial year will be paid on a pro rata basis, rounded up/down to full months. For the year ofdeparture, the entire compensation is paid in cash; a forfeiture regulation applies to 25 % of the compensation for that financialyear. The members of the Supervisory Board received for the financial year 2018 a total remuneration of € 5,766,669 (2017:€ 5,150,000), of which € 4,676,041 will be paid out in spring 2019 (2018: € 3,987,500) according to the provisions of theArticles of Association.
Provisions for pension obligations to former members of the Management Board and their surviving dependents amounted to€ 193,452,137 and € 214,154,039 at December 31, 2018 and 2017, respectively.
Loans and advances granted and contingent liabilities assumed for members of the Management Board amounted to €11,180,396 and € 12,337,886 and for members of the Supervisory Board amounted to € 33,425,239 and € 35,210,035 for theyears ended December 31, 2018 and 2017, respectively. Members of the Supervisory Board repaid € 4,662,819 loans in 2018.

361
Deutsche Bank Additional NotesAnnual Report 2018 Country by Country Reporting
Return on Assets
Article 26a of the German Banking Act defines the return on assets as net profit divided by average total assets. According tothis definition the return on assets was 0.02 % and (0.05) % for the years ended December 31, 2018 and 2017, respectively.
Information on the parent company
Deutsche Bank Aktiengesellschaft is the parent company of Deutsche Bank Group. It is incorporated in Frankfurt am Mainand is registered in the Commercial Register of the District Court Frankfurt am Main under registration number HRB 30000.
Corporate Governance
Deutsche Bank AG has approved the Declaration of Conformity in accordance with section 161 of the GermanCorporation Act (AktG). The declaration is published on Deutsche Bank’s website (www.db.com/ir/en/documents.htm).
Principal accountant fees and services
Breakdown of the fees charged by the Group’s auditorFee category in € m. 2018 2017Audit fees 60 51
thereof to KPMG AG 33 23Audit-related fees 12 18
thereof to KPMG AG 5 13Tax-related fees 5 4
thereof to KPMG AG 2 2All other fees 1 0
thereof to KPMG AG 1 0Total fees 78 73
The Audit fees include fees for professional services for the audit of Deutsche Bank AG’s annual financial statements andconsolidated financial statements and do not include the 2017 audit fees for Postbank and its subsidiaries, as the 2017financials of those entities are not audited by KPMG. The Audit-related fees include fees for other assurance services requiredby law or regulations, in particular for financial service specific attestation, for quarterly reviews, for spin-off audits and formerger audits, as well as fees for voluntary assurance services, like voluntary audits for internal management purposes andthe issuance of comfort letters. Tax-related fees include fees for services relating to the preparation and review of tax returnsand related compliance assistance and advice, tax consultation and advice relating to Group tax planning strategies andinitiatives and assistance with assessing compliance with tax regulations.
45 – Country by Country Reporting§ 26a KWG requires annual disclosure of certain information by country. The disclosed information is derived from the IFRSGroup accounts of Deutsche Bank. It is however not reconcilable to other financial information in this report because of specificrequirements published by Bundesbank on December 16, 2014 which include the requirement to present the countryinformation prior to elimination of cross-border intra group transactions. In line with these Bundesbank requirements, intragroup transactions within the same country are eliminated. These eliminations are identical to the eliminations applied forinternal management reporting on countries and consist mostly of dividends paid.
The geographical location of subsidiaries and branches considers the country of incorporation or residence as well as therelevant tax jurisdiction. For the names, nature of activity and geographical location of subsidiaries and branches, please referto Note 47 “Shareholdings”. In addition, Deutsche Bank AG and its subsidiaries have German and foreign branches, forexample in London, New York and Singapore. The net revenues are composed of net interest revenues and non-interestrevenues.
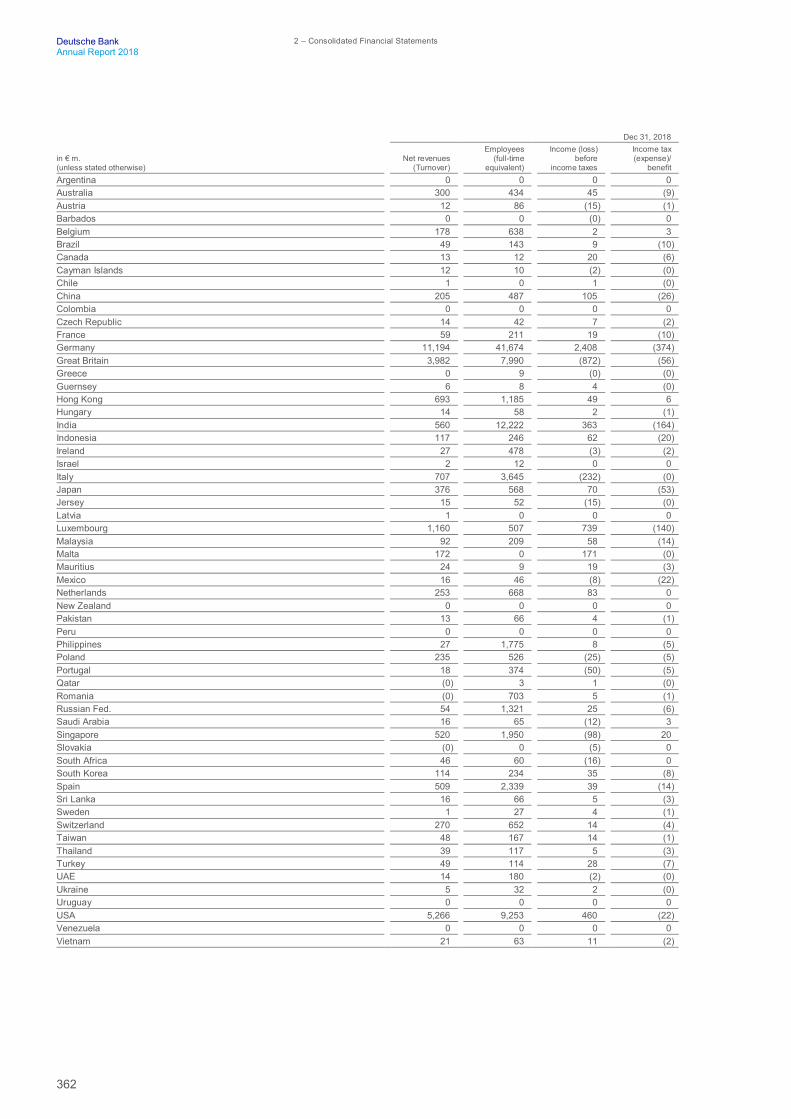
362
Deutsche Bank 2 – Consolidated Financial StatementsAnnual Report 2018
Dec 31, 2018
in € m.(unless stated otherwise)
Net revenues(Turnover)
Employees(full-time
equivalent)
Income (loss)before
income taxes
Income tax(expense)/
benefitArgentina 0 0 0 0Australia 300 434 45 (9)Austria 12 86 (15) (1)Barbados 0 0 (0) 0Belgium 178 638 2 3Brazil 49 143 9 (10)Canada 13 12 20 (6)Cayman Islands 12 10 (2) (0)Chile 1 0 1 (0)China 205 487 105 (26)Colombia 0 0 0 0Czech Republic 14 42 7 (2)France 59 211 19 (10)Germany 11,194 41,674 2,408 (374)Great Britain 3,982 7,990 (872) (56)Greece 0 9 (0) (0)Guernsey 6 8 4 (0)Hong Kong 693 1,185 49 6Hungary 14 58 2 (1)India 560 12,222 363 (164)Indonesia 117 246 62 (20)Ireland 27 478 (3) (2)Israel 2 12 0 0Italy 707 3,645 (232) (0)Japan 376 568 70 (53)Jersey 15 52 (15) (0)Latvia 1 0 0 0Luxembourg 1,160 507 739 (140)Malaysia 92 209 58 (14)Malta 172 0 171 (0)Mauritius 24 9 19 (3)Mexico 16 46 (8) (22)Netherlands 253 668 83 0New Zealand 0 0 0 0Pakistan 13 66 4 (1)Peru 0 0 0 0Philippines 27 1,775 8 (5)Poland 235 526 (25) (5)Portugal 18 374 (50) (5)Qatar (0) 3 1 (0)Romania (0) 703 5 (1)Russian Fed. 54 1,321 25 (6)Saudi Arabia 16 65 (12) 3Singapore 520 1,950 (98) 20Slovakia (0) 0 (5) 0South Africa 46 60 (16) 0South Korea 114 234 35 (8)Spain 509 2,339 39 (14)Sri Lanka 16 66 5 (3)Sweden 1 27 4 (1)Switzerland 270 652 14 (4)Taiwan 48 167 14 (1)Thailand 39 117 5 (3)Turkey 49 114 28 (7)UAE 14 180 (2) (0)Ukraine 5 32 2 (0)Uruguay 0 0 0 0USA 5,266 9,253 460 (22)Venezuela 0 0 0 0Vietnam 21 63 11 (2)

363
Deutsche Bank Additional NotesAnnual Report 2018 Shareholdings
46 – Shareholdings364 Subsidiaries372 Consolidated Structured Entities376 Companies accounted for at equity378 Other Companies, where the holding exceeds 20 %382 Holdings in large corporations, where the holding exceeds 5 % of the
voting rightsThe following pages show the Shareholdings of Deutsche Bank Group pursuant to Section 313 (2) of the GermanCommercial Code (“HGB”) as well as to the Guidelines on disclosure requirements under Part Eight of Regulation(EU) No 575/2013 (Template EU LI3).
Footnotes:
1 Entity fully consolidated under the regulatory scope.2 Entity neither consolidated nor deducted under the regulatory scope.3 Status as shareholder with unlimited liability pursuant to Section 313 (2) Number 6 HGB.4 Entity under the regulatory scope deducted from own funds according to Articles 36 and 48 CRR.5 Controlled.6 Limited Partnership.7 Only specified assets and related liabilities (silos) of this entity were consolidated.8 General Partnership.9 Not controlled.10 Accounted for at equity due to significant influence.11 Classified as Structured Entity not to be accounted for at equity under IFRS.12 Classified as Structured Entity not to be consolidated under IFRS.13 Preliminary Own funds of € 7,085.8m / Result of € 4.6m (Business Year 2018).14 Not consolidated or accounted for at equity as classified as non-trading financial assets mandatory at fair
value through profit or loss.1516171819
Preliminary Own funds of € 7,970.5m / Result of € 63.9m (Business Year 2018).Own funds of € 74.1m / Result of € 7.7m (Business Year 2017).Entity proportionally consolidated under the regulatory scope.Preliminary Own funds of € 0.005m / Result of € 2.0m (Business Year 2018).Preliminary Own funds of € 13.6m / Result of € 22.1m (Business Year 2018).

364
Deutsche Bank 2 – Consolidated Financial StatementsAnnual Report 2018
Subsidiaries
SerialNo. Name of company
Domicile ofcompany
Foot-note Nature of activity
Shareof
Capitalin %
1 Deutsche Bank Aktiengesellschaft Frankfurt am Main 1 Credit Institution2 ABFS I Incorporated Lutherville-
Timonium1 Financial Institution 100.0
3 ABS MB Ltd. Lutherville-Timonium
1 Financial Institution 100.0
4 Acacia (Luxembourg) S.à r.l. Luxembourg 2 Other Enterprise 100.05 Accounting Solutions Holding Company, Inc. Wilmington 2 Other Enterprise 100.06 Alex. Brown Financial Services Incorporated Lutherville-
Timonium1 Financial Institution 100.0
7 Alex. Brown Investments Incorporated Lutherville-Timonium
1 Financial Institution 100.0
8 Alfred Herrhausen Gesellschaft mbH Berlin 2 Other Enterprise 100.09 Ambidexter GmbH Frankfurt 1 Payment Institution 100.010 Argent Incorporated Lutherville-
Timonium1 Financial Institution 100.0
11 Baincor Nominees Pty Limited Sydney 2 Other Enterprise 100.012 Bainpro Nominees Pty Ltd Sydney 1 Ancillary Services Undertaking 100.013 Baldur Mortgages Limited London 1 Financial Institution 100.014 Bankers Trust Investments Limited London 2 Other Enterprise 100.015 Barkly Investments Ltd. St. Helier 1 Financial Institution 100.016 Bayan Delinquent Loan Recovery 1 (SPV-AMC), Inc. Makati City 1 Financial Institution 100.017 Betriebs-Center für Banken AG Frankfurt 1 Ancillary Services Undertaking 100.018 BHW - Gesellschaft für Wohnungswirtschaft mbH Hameln 1 Financial Institution 100.019 BHW Bausparkasse Aktiengesellschaft Hameln 1 Credit Institution 100.020 BHW Holding GmbH Hameln 1 Financial Holding Company 100.021 BHW Kreditservice GmbH Hameln 1 Ancillary Services Undertaking 100.022 Biomass Holdings S.à r.l. Luxembourg 1 Financial Institution 100.023 Birch (Luxembourg) S.à r.l. Luxembourg 2 Other Enterprise 100.024 Blue Cork, Inc. Wilmington 1 Ancillary Services Undertaking 100.025 BNA Nominees Pty Limited Sydney 1 Ancillary Services Undertaking 100.026 Borfield Sociedad Anonima Montevideo 2 Other Enterprise 100.027 BT Globenet Nominees Limited London 2 Other Enterprise 100.028 BTAS Cayman GP George Town 1, 3 Financial Institution 100.029 BTD Nominees Pty Limited Sydney 2 Other Enterprise 100.030 Cape Acquisition Corp. Wilmington 4 Financial Institution 100.031 CapeSuccess Inc. Wilmington 4 Ancillary Services Undertaking 100.032 CapeSuccess LLC Wilmington 4 Financial Institution 82.633 Cardales UK Limited London 2 Other Enterprise 100.034 Career Blazers LLC Wilmington 4 Financial Institution 100.035 Career Blazers Management Company, Inc. Albany 2 Other Enterprise 100.036 Career Blazers Personnel Services of Washington, D.C., Inc. Washington D.C. 2 Other Enterprise 100.037 Career Blazers Personnel Services, Inc. Albany 4 Financial Institution 100.038 Caribbean Resort Holdings, Inc. New York 1, 5 Financial Institution 0.039 Cathay Advisory (Beijing) Co., Ltd. Beijing 2 Other Enterprise 100.040 Cathay Asset Management Company Limited Ebène 1 Financial Institution 100.041 Cathay Capital Company (No 2) Limited Ebène 1 Financial Institution 67.642 Cedar (Luxembourg) S.à r.l. Luxembourg 2 Other Enterprise 100.043 Centennial River 2 Inc. Austin 2 Other Enterprise 100.044 Centennial River Corporation Wilmington 4 Financial Institution 100.045 Charlton (Delaware), Inc. Wilmington 1 Financial Institution 100.046 China Recovery Fund, LLC Wilmington 1 Financial Institution 85.047 Cinda - DB NPL Securitization Trust 2003-1 Wilmington 1, 5 Financial Institution 10.048 Consumo S.p.A. Milan 1 Financial Institution 100.049 Cyrus J. Lawrence Capital Holdings, Inc. Wilmington 1 Financial Institution 100.050 D B Investments (GB) Limited London 1 Financial Holding Company 100.051 D&M Turnaround Partners Godo Kaisha Tokyo 1 Financial Institution 100.052 D.B. International Delaware, Inc. Wilmington 1 Financial Institution 100.053 DAHOC (UK) Limited (in members' voluntary liquidation) London 1 Financial Institution 100.054 DAHOC Beteiligungsgesellschaft mbH Frankfurt 1 Financial Institution 100.055 DB (Barbados) SRL Christ Church 1 Ancillary Services Undertaking 100.056 DB (Malaysia) Nominee (Asing) Sdn. Bhd. Kuala Lumpur 2 Other Enterprise 100.057 DB (Malaysia) Nominee (Tempatan) Sendirian Berhad Kuala Lumpur 2 Other Enterprise 100.058 DB (Pacific) Limited Wilmington 1 Financial Institution 100.059 DB (Pacific) Limited, New York New York 1 Financial Institution 100.060 DB Abalone LLC Wilmington 1 Financial Institution 100.061 DB Alex. Brown Holdings Incorporated Wilmington 1 Financial Institution 100.0

365
Deutsche Bank Additional NotesAnnual Report 2018 Shareholdings
SerialNo. Name of company
Domicile ofcompany
Foot-note Nature of activity
Shareof
Capitalin %
62 DB Alps Corporation Wilmington 1 Financial Institution 100.063 DB Aotearoa Investments Limited George Town 1 Ancillary Services Undertaking 100.064 DB Asia Pacific Holdings Limited (in voluntary liquidation) George Town 1 Financial Institution 100.065 DB Beteiligungs-Holding GmbH Frankfurt 1 Financial Institution 100.066 DB Boracay LLC Wilmington 1 Financial Institution 100.067 DB Capital Investments Sàrl Luxembourg 1 Financial Institution 100.068 DB Capital Markets (Deutschland) GmbH Frankfurt 1 Financial Holding Company 100.069 DB Capital Partners, Inc. Wilmington 1 Financial Institution 100.070 DB Cartera de Inmuebles 1, S.A.U. Pozuelo de Alarcón 1 Ancillary Services Undertaking 100.071 DB Chestnut Holdings Limited George Town 1 Ancillary Services Undertaking 100.072 DB Commodity Services LLC Wilmington 1 Investment Firm 100.073 DB Consorzio S. Cons. a r. l. Milan 1 Ancillary Services Undertaking 100.074 DB Corporate Advisory (Malaysia) Sdn. Bhd. Kuala Lumpur 1 Financial Institution 100.075 DB Delaware Holdings (Europe) Limited George Town 1 Financial Institution 100.076 DB Direkt GmbH Frankfurt 1 Ancillary Services Undertaking 100.077 DB Elara LLC Wilmington 1 Financial Institution 100.078 DB Energy Commodities Limited (in members' voluntary
liquidation) London 1 Ancillary Services Undertaking 100.0
79 DB Energy Trading LLC Wilmington 1 Ancillary Services Undertaking 100.080 DB Enfield Infrastructure Holdings Limited St. Helier 1 Financial Institution 100.081 DB Equipment Leasing, Inc. New York 1 Financial Institution 100.082 DB Equity Limited London 1 Financial Institution 100.083 DB Finance (Delaware), LLC Wilmington 1 Financial Institution 100.084 DB Ganymede 2006 L.P. George Town 1, 3 Financial Institution 100.085 DB Global Technology SRL Bucharest 1 Ancillary Services Undertaking 100.086 DB Global Technology, Inc. Wilmington 1 Ancillary Services Undertaking 100.087 DB Group Services (UK) Limited London 1 Ancillary Services Undertaking 100.088 DB Holdings (New York), Inc. New York 1 Financial Institution 100.089 DB Holdings (South America) Limited Wilmington 1 Financial Institution 100.090 DB HR Solutions GmbH Eschborn 1 Ancillary Services Undertaking 100.091 DB Impact Investment Fund I, L.P. Edinburgh 1, 3 Financial Institution 100.092 DB Industrial Holdings Beteiligungs GmbH & Co. KG Luetzen 1, 3 Financial Institution 100.093 DB Industrial Holdings GmbH Luetzen 1 Financial Institution 100.094 DB Intermezzo LLC Wilmington 1 Financial Institution 100.095 DB International (Asia) Limited Singapore 1 Credit Institution 100.096 DB International Investments Limited London 1 Financial Institution 100.097 DB International Trust (Singapore) Limited Singapore 2 Other Enterprise 100.098 DB Investment Managers, Inc. Wilmington 1 Financial Institution 100.099 DB Investment Partners, Inc. Wilmington 1 Financial Institution 100.0100 DB Investment Resources (US) Corporation Wilmington 1 Financial Institution 100.0101 DB Investment Resources Holdings Corp. Wilmington 1 Financial Institution 100.0102 DB Investment Services GmbH Frankfurt 1 Credit Institution 100.0103 DB Io LP Wilmington 1, 3 Financial Institution 100.0104 DB IROC Leasing Corp. New York 1 Financial Institution 100.0105 DB London (Investor Services) Nominees Limited London 1 Financial Institution 100.0106 DB Management Support GmbH Frankfurt 4 Ancillary Services Undertaking 100.0107 DB Managers, LLC West Trenton 1 Investment Firm 100.0108 DB Nexus American Investments (UK) Limited (in members'
voluntary liquidation) London 1 Financial Institution 100.0
109 DB Nexus Investments (UK) Limited (in members' voluntaryliquidation)
London 1 Financial Institution 100.0
110 DB Nominees (Hong Kong) Limited Hong Kong 4 Ancillary Services Undertaking 100.0111 DB Nominees (Singapore) Pte Ltd Singapore 2 Other Enterprise 100.0112 DB Omega BTV S.C.S. Luxembourg 1, 3 Financial Institution 100.0113 DB Omega Holdings LLC Wilmington 1 Financial Institution 100.0114 DB Omega Ltd. George Town 1 Financial Institution 100.0115 DB Omega S.C.S. Luxembourg 1, 3 Financial Institution 100.0116 DB Operaciones y Servicios Interactivos Agrupación de Interés
Económico Pozuelo de Alarcón 1 Ancillary Services Undertaking 99.9
117 DB Overseas Finance Delaware, Inc. Wilmington 1 Financial Institution 100.0118 DB Overseas Holdings Limited London 1 Financial Institution 100.0119 DB Portfolio Southwest, Inc. Dallas 1 Ancillary Services Undertaking 100.0120 DB Print GmbH Frankfurt 1 Ancillary Services Undertaking 100.0121 DB Privat- und Firmenkundenbank AG Frankfurt 1 Credit Institution 100.0122 DB Private Clients Corp. Wilmington 1 Financial Institution 100.0123 DB Private Wealth Mortgage Ltd. New York 1 Financial Institution 100.0124 DB Re S.A. Luxembourg 4 Reinsurance Undertaking 100.0125 DB Service Centre Limited Dublin 1 Ancillary Services Undertaking 100.0126 DB Service Uruguay S.A. Montevideo 1 Financial Institution 100.0

366
Deutsche Bank 2 – Consolidated Financial StatementsAnnual Report 2018
SerialNo. Name of company
Domicile ofcompany
Foot-note Nature of activity
Shareof
Capitalin %
127 DB Services Americas, Inc. Wilmington 1 Ancillary Services Undertaking 100.0128 DB Servizi Amministrativi S.r.l. Milan 1 Ancillary Services Undertaking 100.0129 DB Strategic Advisors, Inc. Makati City 1 Ancillary Services Undertaking 100.0130 DB Structured Derivative Products, LLC Wilmington 1 Ancillary Services Undertaking 100.0131 DB Structured Products, Inc. Wilmington 1 Financial Institution 100.0132 DB Trustee Services Limited London 2 Other Enterprise 100.0133 DB Trustees (Hong Kong) Limited Hong Kong 2 Other Enterprise 100.0134 DB U.S. Financial Markets Holding Corporation Wilmington 1 Financial Holding Company 100.0135 DB UK Bank Limited London 1 Credit Institution 100.0136 DB UK Holdings Limited London 1 Financial Institution 100.0137 DB UK PCAM Holdings Limited London 1 Financial Institution 100.0138 DB USA Core Corporation West Trenton 1 Ancillary Services Undertaking 100.0139 DB USA Corporation Wilmington 1 Financial Institution 100.0140 DB Valoren S.à r.l. Luxembourg 1 Financial Holding Company 100.0141 DB Value S.à r.l. Luxembourg 1 Financial Institution 100.0142 DB VersicherungsManager GmbH Frankfurt 2 Other Enterprise 100.0143 DB Vita S.A. Luxembourg 4 Insurance Undertaking 75.0144 DBAB Wall Street, LLC Wilmington 1 Ancillary Services Undertaking 100.0145 DBAH Capital, LLC Wilmington 1 Financial Institution 100.0146 DBCIBZ1 George Town 1 Financial Institution 100.0147 DBCIBZ2 George Town 1 Financial Institution 100.0148 DBFIC, Inc. Wilmington 1 Financial Institution 100.0149 DBNZ Overseas Investments (No.1) Limited George Town 1 Financial Institution 100.0150 DBOI Global Services (UK) Limited London 1 Ancillary Services Undertaking 100.0151 DBOI Global Services Private Limited Mumbai 1 Ancillary Services Undertaking 100.0152 DBR Investments Co. Limited George Town 1 Financial Institution 100.0153 DBRE Global Real Estate Management IA, Ltd. George Town 1 Asset Management Company 100.0154 DBRE Global Real Estate Management IB, Ltd. George Town 1 Asset Management Company 100.0155 DBRMSGP1 George Town 1 Financial Institution 100.0156 DBUK PCAM Limited London 1 Financial Holding Company 100.0157 DBUKH No. 2 Limited London 1, 5 Financial Institution 0.0158 DBUSBZ1, LLC Wilmington 2 Other Enterprise 100.0159 DBUSBZ2, S.à r.l. Luxembourg 1 Financial Institution 100.0160 DBX Advisors LLC Wilmington 1 Investment Firm 100.0161 DBX Strategic Advisors LLC Wilmington 1 Investment Firm 100.0162 DBÖ Vermögensverwertung GmbH Vienna 2 Other Enterprise 100.0163 De Meng Innovative (Beijing) Consulting Company Limited Beijing 1 Ancillary Services Undertaking 100.0164 DeAM Infrastructure Limited (in members' voluntary liquidation) London 4 Financial Institution 100.0165 DEBEKO Immobilien GmbH & Co Grundbesitz OHG Eschborn 1, 3 Ancillary Services Undertaking 100.0166 DEE Deutsche Erneuerbare Energien GmbH Duesseldorf 1 Financial Institution 100.0167 Delowrezham de México S. de R.L. de C.V. Mexico City 1 Financial Institution 100.0168 DEUFRAN Beteiligungs GmbH Frankfurt 1 Financial Institution 100.0169 DEUKONA Versicherungs-Vermittlungs-GmbH Frankfurt 1 Ancillary Services Undertaking 100.0170 Deutsche (Aotearoa) Capital Holdings New Zealand Auckland 1 Financial Institution 100.0171 Deutsche (Aotearoa) Foreign Investments New Zealand Auckland 1 Financial Institution 100.0172 Deutsche (Mauritius) Limited Port Louis 2 Other Enterprise 100.0173 Deutsche (New Munster) Holdings New Zealand Limited Auckland 1 Financial Institution 100.0174 Deutsche Access Investments Limited Sydney 1 Ancillary Services Undertaking 100.0175 Deutsche Aeolia Power Production Société Anonyme Paiania 2 Other Enterprise 80.0176 Deutsche Alt-A Securities, Inc. Wilmington 4 Financial Institution 100.0177 Deutsche Alternative Asset Management (France) SAS Paris 2 Other Enterprise 100.0178 Deutsche Alternative Asset Management (UK) Limited London 1 Asset Management Company 100.0179 Deutsche Asia Pacific Holdings Pte Ltd Singapore 1 Financial Holding Company 100.0180 Deutsche Asset Management (India) Private Limited Mumbai 1 Asset Management Company 100.0181 Deutsche Asset Management (Japan) Limited Tokyo 1 Investment Firm 100.0182 Deutsche Asset Management (Korea) Company Limited Seoul 1 Asset Management Company 100.0183 Deutsche Asset Management S.A. Luxembourg 1 Asset Management Company 100.0184 Deutsche Asset Management S.G.I.I.C., S.A. Madrid 1 Asset Management Company 100.0185 Deutsche Australia Limited Sydney 1 Financial Institution 100.0186 Deutsche Bank (Cayman) Limited George Town 1 Credit Institution 100.0187 Deutsche Bank (Chile) Santiago 2 Other Enterprise 100.0188 Deutsche Bank (China) Co., Ltd. Beijing 1 Credit Institution 100.0189 Deutsche Bank (Malaysia) Berhad Kuala Lumpur 1 Credit Institution 100.0190 Deutsche Bank (Suisse) SA Geneva 1 Credit Institution 100.0191 Deutsche Bank (Uruguay) Sociedad Anónima Institución
Financiera Externa Montevideo 1 Credit Institution 100.0
192 DEUTSCHE BANK A.S. Istanbul 1 Credit Institution 100.0193 Deutsche Bank Americas Holding Corp. Wilmington 1 Financial Holding Company 100.0194 Deutsche Bank Bauspar-Aktiengesellschaft Frankfurt 1 Credit Institution 100.0

367
Deutsche Bank Additional NotesAnnual Report 2018 Shareholdings
SerialNo. Name of company
Domicile ofcompany
Foot-note Nature of activity
Shareof
Capitalin %
195 Deutsche Bank Europe GmbH Frankfurt 1 Credit Institution 100.0196 Deutsche Bank Financial Company George Town 1 Financial Institution 100.0197 Deutsche Bank Holdings, Inc. Wilmington 1 Financial Institution 100.0198 Deutsche Bank Insurance Agency Incorporated Lutherville-
Timonium2 Other Enterprise 100.0
199 Deutsche Bank Insurance Agency of Delaware Wilmington 1 Financial Institution 100.0200 Deutsche Bank International Limited St. Helier 1 Credit Institution 100.0201 Deutsche Bank Investments (Guernsey) Limited St. Peter Port 2 Other Enterprise 100.0202 Deutsche Bank Luxembourg S.A. Luxembourg 1 Credit Institution 100.0203 Deutsche Bank Mutui S.p.A. Milan 1 Financial Institution 100.0204 Deutsche Bank México, S.A., Institución de Banca Múltiple Mexico City 1 Credit Institution 100.0205 Deutsche Bank National Trust Company Los Angeles 1 Financial Institution 100.0206 Deutsche Bank Nominees (Guernsey) Limited (in members'
voluntary liquidation) St. Peter Port 2 Other Enterprise 100.0
207 Deutsche Bank Nominees (Jersey) Limited St. Helier 2 Other Enterprise 100.0208 Deutsche Bank Polska Spólka Akcyjna Warsaw 1 Credit Institution 100.0209 Deutsche Bank Representative Office Nigeria Limited Lagos 4 Ancillary Services Undertaking 100.0210 Deutsche Bank S.A. - Banco Alemão Sao Paulo 1 Credit Institution 100.0211 Deutsche Bank Securities Inc. Wilmington 1 Investment Firm 100.0212 Deutsche Bank Securities Limited Toronto 1 Investment Firm 100.0213 Deutsche Bank Services (Jersey) Limited St. Helier 1 Ancillary Services Undertaking 100.0214 Deutsche Bank Società per Azioni Milan 1 Credit Institution 99.9215 Deutsche Bank Trust Company Americas New York 1 Credit Institution 100.0216 Deutsche Bank Trust Company Delaware Wilmington 1 Credit Institution 100.0217 Deutsche Bank Trust Company, National Association New York 1 Financial Institution 100.0218 Deutsche Bank Trust Corporation New York 1 Financial Holding Company 100.0219 Deutsche Bank, Sociedad Anónima Española Madrid 1 Credit Institution 99.8220 Deutsche Capital Finance (2000) Limited George Town 1 Financial Institution 100.0221 Deutsche Capital Hong Kong Limited Hong Kong 1 Financial Institution 100.0222 Deutsche Capital Management Limited Dublin 1 Asset Management Company 100.0223 Deutsche Capital Markets Australia Limited Sydney 1 Investment Firm 100.0224 Deutsche Capital Partners China Limited George Town 1 Financial Institution 100.0225 Deutsche Cayman Ltd. George Town 2 Other Enterprise 100.0226 Deutsche CIB Centre Private Limited Mumbai 1 Ancillary Services Undertaking 100.0227 Deutsche Custody N.V. Amsterdam 4 Financial Institution 100.0228 Deutsche Domus New Zealand Limited Auckland 1 Financial Institution 100.0229 Deutsche Equities India Private Limited Mumbai 1 Securities Trading Firm 100.0230 Deutsche Finance Co 1 Pty Limited Sydney 1 Financial Institution 100.0231 Deutsche Finance Co 2 Pty Limited Sydney 1 Financial Institution 100.0232 Deutsche Finance Co 3 Pty Limited Sydney 1 Financial Institution 100.0233 Deutsche Finance Co 4 Pty Limited Sydney 1 Financial Institution 100.0234 Deutsche Finance No. 2 Limited George Town 1 Financial Institution 100.0235 Deutsche Foras New Zealand Limited Auckland 1 Financial Institution 100.0236 Deutsche Gesellschaft für Immobilien-Leasing mit beschränkter
Haftung Duesseldorf 4 Financial Institution 100.0
237 Deutsche Global Markets Limited Tel Aviv 1 Ancillary Services Undertaking 100.0238 Deutsche Group Holdings (SA) Proprietary Limited Johannesburg 1 Financial Institution 100.0239 Deutsche Group Services Pty Limited Sydney 1 Ancillary Services Undertaking 100.0240 Deutsche Grundbesitz Beteiligungsgesellschaft mbH Eschborn 4 Financial Institution 100.0241 Deutsche Grundbesitz-Anlagegesellschaft mit beschränkter
Haftung Frankfurt 2 Other Enterprise 99.8
242 Deutsche Holdings (BTI) Limited London 1 Financial Institution 100.0243 Deutsche Holdings (Luxembourg) S.à r.l. Luxembourg 1 Financial Holding Company 100.0244 Deutsche Holdings (Malta) Ltd. Valletta 1 Financial Holding Company 100.0245 Deutsche Holdings Limited London 1 Financial Holding Company 100.0246 Deutsche Holdings No. 2 Limited London 1 Financial Institution 100.0247 Deutsche Holdings No. 3 Limited London 1 Financial Institution 100.0248 Deutsche Holdings No. 4 Limited London 1 Financial Institution 100.0249 Deutsche Immobilien Leasing GmbH Duesseldorf 1 Financial Institution 100.0250 Deutsche India Holdings Private Limited Mumbai 1 Financial Holding Company 100.0251 Deutsche International Corporate Services (Ireland) Limited Dublin 1 Financial Institution 100.0252 Deutsche International Corporate Services Limited St. Helier 2 Other Enterprise 100.0253 Deutsche International Custodial Services Limited St. Helier 2 Other Enterprise 100.0254 Deutsche Inversiones Dos S.A. (en Liquidación) Santiago 1 Financial Institution 100.0255 Deutsche Inversiones Limitada Santiago 1 Financial Institution 100.0256 Deutsche Investments (Netherlands) N.V. Amsterdam 1 Financial Institution 100.0257 Deutsche Investments India Private Limited Mumbai 1 Financial Institution 100.0258 Deutsche Investor Services Private Limited Mumbai 2 Other Enterprise 100.0259 Deutsche Knowledge Services Pte. Ltd. Singapore 1 Ancillary Services Undertaking 100.0
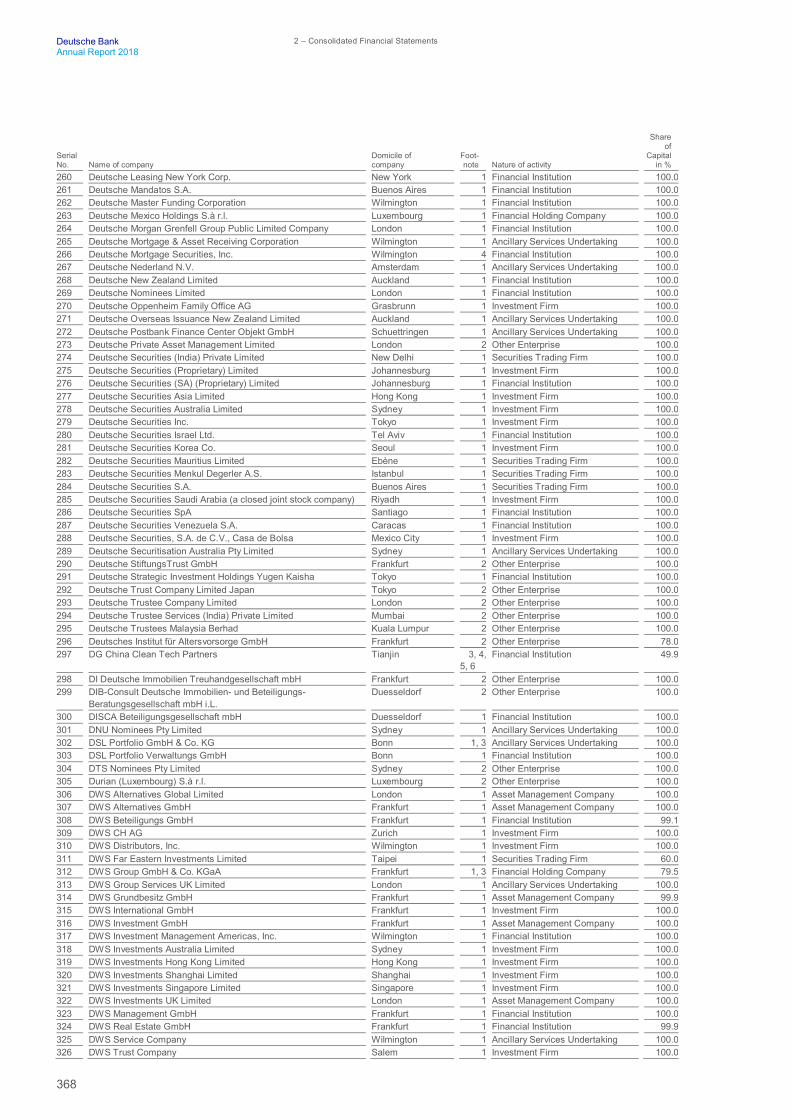
368
Deutsche Bank 2 – Consolidated Financial StatementsAnnual Report 2018
SerialNo. Name of company
Domicile ofcompany
Foot-note Nature of activity
Shareof
Capitalin %
260 Deutsche Leasing New York Corp. New York 1 Financial Institution 100.0261 Deutsche Mandatos S.A. Buenos Aires 1 Financial Institution 100.0262 Deutsche Master Funding Corporation Wilmington 1 Financial Institution 100.0263 Deutsche Mexico Holdings S.à r.l. Luxembourg 1 Financial Holding Company 100.0264 Deutsche Morgan Grenfell Group Public Limited Company London 1 Financial Institution 100.0265 Deutsche Mortgage & Asset Receiving Corporation Wilmington 1 Ancillary Services Undertaking 100.0266 Deutsche Mortgage Securities, Inc. Wilmington 4 Financial Institution 100.0267 Deutsche Nederland N.V. Amsterdam 1 Ancillary Services Undertaking 100.0268 Deutsche New Zealand Limited Auckland 1 Financial Institution 100.0269 Deutsche Nominees Limited London 1 Financial Institution 100.0270 Deutsche Oppenheim Family Office AG Grasbrunn 1 Investment Firm 100.0271 Deutsche Overseas Issuance New Zealand Limited Auckland 1 Ancillary Services Undertaking 100.0272 Deutsche Postbank Finance Center Objekt GmbH Schuettringen 1 Ancillary Services Undertaking 100.0273 Deutsche Private Asset Management Limited London 2 Other Enterprise 100.0274 Deutsche Securities (India) Private Limited New Delhi 1 Securities Trading Firm 100.0275 Deutsche Securities (Proprietary) Limited Johannesburg 1 Investment Firm 100.0276 Deutsche Securities (SA) (Proprietary) Limited Johannesburg 1 Financial Institution 100.0277 Deutsche Securities Asia Limited Hong Kong 1 Investment Firm 100.0278 Deutsche Securities Australia Limited Sydney 1 Investment Firm 100.0279 Deutsche Securities Inc. Tokyo 1 Investment Firm 100.0280 Deutsche Securities Israel Ltd. Tel Aviv 1 Financial Institution 100.0281 Deutsche Securities Korea Co. Seoul 1 Investment Firm 100.0282 Deutsche Securities Mauritius Limited Ebène 1 Securities Trading Firm 100.0283 Deutsche Securities Menkul Degerler A.S. Istanbul 1 Securities Trading Firm 100.0284 Deutsche Securities S.A. Buenos Aires 1 Securities Trading Firm 100.0285 Deutsche Securities Saudi Arabia (a closed joint stock company) Riyadh 1 Investment Firm 100.0286 Deutsche Securities SpA Santiago 1 Financial Institution 100.0287 Deutsche Securities Venezuela S.A. Caracas 1 Financial Institution 100.0288 Deutsche Securities, S.A. de C.V., Casa de Bolsa Mexico City 1 Investment Firm 100.0289 Deutsche Securitisation Australia Pty Limited Sydney 1 Ancillary Services Undertaking 100.0290 Deutsche StiftungsTrust GmbH Frankfurt 2 Other Enterprise 100.0291 Deutsche Strategic Investment Holdings Yugen Kaisha Tokyo 1 Financial Institution 100.0292 Deutsche Trust Company Limited Japan Tokyo 2 Other Enterprise 100.0293 Deutsche Trustee Company Limited London 2 Other Enterprise 100.0294 Deutsche Trustee Services (India) Private Limited Mumbai 2 Other Enterprise 100.0295 Deutsche Trustees Malaysia Berhad Kuala Lumpur 2 Other Enterprise 100.0296 Deutsches Institut für Altersvorsorge GmbH Frankfurt 2 Other Enterprise 78.0297 DG China Clean Tech Partners Tianjin 3, 4,
5, 6 Financial Institution 49.9
298 DI Deutsche Immobilien Treuhandgesellschaft mbH Frankfurt 2 Other Enterprise 100.0299 DIB-Consult Deutsche Immobilien- und Beteiligungs-
Beratungsgesellschaft mbH i.L. Duesseldorf 2 Other Enterprise 100.0
300 DISCA Beteiligungsgesellschaft mbH Duesseldorf 1 Financial Institution 100.0301 DNU Nominees Pty Limited Sydney 1 Ancillary Services Undertaking 100.0302 DSL Portfolio GmbH & Co. KG Bonn 1, 3 Ancillary Services Undertaking 100.0303 DSL Portfolio Verwaltungs GmbH Bonn 1 Financial Institution 100.0304 DTS Nominees Pty Limited Sydney 2 Other Enterprise 100.0305 Durian (Luxembourg) S.à r.l. Luxembourg 2 Other Enterprise 100.0306 DWS Alternatives Global Limited London 1 Asset Management Company 100.0307 DWS Alternatives GmbH Frankfurt 1 Asset Management Company 100.0308 DWS Beteiligungs GmbH Frankfurt 1 Financial Institution 99.1309 DWS CH AG Zurich 1 Investment Firm 100.0310 DWS Distributors, Inc. Wilmington 1 Investment Firm 100.0311 DWS Far Eastern Investments Limited Taipei 1 Securities Trading Firm 60.0312 DWS Group GmbH & Co. KGaA Frankfurt 1, 3 Financial Holding Company 79.5313 DWS Group Services UK Limited London 1 Ancillary Services Undertaking 100.0314 DWS Grundbesitz GmbH Frankfurt 1 Asset Management Company 99.9315 DWS International GmbH Frankfurt 1 Investment Firm 100.0316 DWS Investment GmbH Frankfurt 1 Asset Management Company 100.0317 DWS Investment Management Americas, Inc. Wilmington 1 Financial Institution 100.0318 DWS Investments Australia Limited Sydney 1 Investment Firm 100.0319 DWS Investments Hong Kong Limited Hong Kong 1 Investment Firm 100.0320 DWS Investments Shanghai Limited Shanghai 1 Investment Firm 100.0321 DWS Investments Singapore Limited Singapore 1 Investment Firm 100.0322 DWS Investments UK Limited London 1 Asset Management Company 100.0323 DWS Management GmbH Frankfurt 1 Financial Institution 100.0324 DWS Real Estate GmbH Frankfurt 1 Financial Institution 99.9325 DWS Service Company Wilmington 1 Ancillary Services Undertaking 100.0326 DWS Trust Company Salem 1 Investment Firm 100.0

369
Deutsche Bank Additional NotesAnnual Report 2018 Shareholdings
SerialNo. Name of company
Domicile ofcompany
Foot-note Nature of activity
Shareof
Capitalin %
327 DWS USA Corporation Wilmington 1 Financial Holding Company 100.0328 EC EUROPA IMMOBILIEN FONDS NR. 3 GmbH & CO. KG i.I. Hamburg 2 Other Enterprise 65.2329 Elba Finance GmbH Eschborn 1 Financial Institution 100.0330 Elizabethan Holdings Limited George Town 4 Financial Institution 100.0331 Elizabethan Management Limited George Town 2 Other Enterprise 100.0332 European Value Added I (Alternate G.P.) LLP London 1 Financial Institution 100.0333 Exinor SA (opening faillissement) Bastogne 2 Other Enterprise 100.0334 FARAMIR Beteiligungs- und Verwaltungs GmbH Cologne 1 Financial Institution 100.0335 Fiduciaria Sant' Andrea S.r.L. Milan 2 Other Enterprise 100.0336 Finanzberatungsgesellschaft mbH der Deutschen Bank Berlin 4 Ancillary Services Undertaking 100.0337 Franz Urbig- und Oscar Schlitter-Stiftung Gesellschaft mit
beschränkter Haftung Frankfurt 4 Ancillary Services Undertaking 100.0
338 Fünfte SAB Treuhand und Verwaltung GmbH & Co. Suhl"Rimbachzentrum" KG
Bad Homburg 2 Other Enterprise 74.9
339 G Finance Holding Corp. Wilmington 1 Financial Institution 100.0340 G918 Corp. Wilmington 1 Financial Institution 100.0341 Gemini Technology Services Inc. Wilmington 1 Ancillary Services Undertaking 100.0342 German American Capital Corporation Lutherville-
Timonium1 Financial Institution 100.0
343 Greenwood Properties Corp. New York 1, 5 Financial Institution 0.0344 Grundstücksgesellschaft Frankfurt Bockenheimer Landstraße GbR Troisdorf 2, 3 Other Enterprise 94.9345 Grundstücksgesellschaft Kerpen-Sindorf Vogelrutherfeld GbR Troisdorf 2, 3, 5 Other Enterprise 0.0346 Grundstücksgesellschaft Leipzig Petersstraße GbR Troisdorf 2, 3, 5 Other Enterprise 36.1347 Grundstücksgesellschaft Wiesbaden Luisenstraße/Kirchgasse
GbR Berlin 2, 3 Other Enterprise 64.7
348 HTB Spezial GmbH & Co. KG Cologne 3, 4 Financial Institution 100.0349 Immobilienfonds Büro-Center Erfurt am Flughafen Bindersleben I
GbR Troisdorf 2, 3, 5 Other Enterprise 0.0
350 Immobilienfonds Büro-Center Erfurt am Flughafen Bindersleben IIGbR
Troisdorf 2, 3, 5 Other Enterprise 50.0
351 Immobilienfonds Mietwohnhäuser Quadrath-Ichendorf GbR Troisdorf 2, 3, 5 Other Enterprise 0.0352 Immobilienfonds Wohn- und Geschäftshaus Köln-Blumenberg V
GbR Troisdorf 2, 3, 5 Other Enterprise 0.0
353 IOS Finance EFC, S.A. Madrid 1 Financial Institution 55.3354 ISTRON Beteiligungs- und Verwaltungs-GmbH Cologne 1 Financial Institution 100.0355 IVAF I Manager, S.à r.l. Luxembourg 1 Financial Institution 100.0356 J R Nominees (Pty) Ltd Johannesburg 2 Other Enterprise 100.0357 Joint Stock Company Deutsche Bank DBU Kiev 1 Credit Institution 100.0358 Jyogashima Godo Kaisha Tokyo 1 Financial Institution 100.0359 KEBA Gesellschaft für interne Services mbH Frankfurt 1 Ancillary Services Undertaking 100.0360 Kidson Pte Ltd Singapore 1 Financial Institution 100.0361 Konsul Inkasso GmbH Essen 1 Ancillary Services Undertaking 100.0362 Kradavimd UK Lease Holdings Limited (in members' voluntary
liquidation) London 1 Financial Institution 100.0
363 LA Water Holdings Limited George Town 1 Financial Institution 75.0364 LAWL Pte. Ltd. Singapore 1 Financial Institution 100.0365 Leasing Verwaltungsgesellschaft Waltersdorf mbH Schoenefeld 1 Financial Institution 100.0366 Leonardo III Initial GP Limited London 4 Financial Institution 100.0367 Maher Terminals Holdings (Toronto) Limited Vancouver 1 Financial Institution 100.0368 MEF I Manager, S. à r.l. Luxembourg 1 Financial Institution 100.0369 MHL Reinsurance Ltd. Burlington 4 Reinsurance Undertaking 100.0370 MIT Holdings, Inc. Baltimore 1 Financial Institution 100.0371 MortgageIT Securities Corp. Wilmington 1 Ancillary Services Undertaking 100.0372 MortgageIT, Inc. New York 1 Financial Institution 100.0373 Navegator - SGFTC, S.A. Lisbon 1 Ancillary Services Undertaking 100.0374 Nordwestdeutscher Wohnungsbauträger Gesellschaft mit
beschränkter Haftung Frankfurt 1 Financial Institution 100.0
375 norisbank GmbH Bonn 1 Credit Institution 100.0376 OOO "Deutsche Bank TechCentre" Moscow 1 Ancillary Services Undertaking 100.0377 OOO "Deutsche Bank" Moscow 1 Credit Institution 100.0378 Opal Funds (Ireland) Public Limited Company (in liquidation) Dublin 4 Ancillary Services Undertaking 100.0379 OPB Verwaltungs- und Beteiligungs-GmbH Cologne 4 Financial Institution 100.0380 OPB Verwaltungs- und Treuhand GmbH Cologne 1 Financial Institution 100.0381 OPB-Holding GmbH Cologne 1 Financial Institution 100.0382 OPB-Nona GmbH Frankfurt 1 Financial Institution 100.0383 OPB-Oktava GmbH Cologne 4 Financial Institution 100.0384 OPB-Quarta GmbH Cologne 4 Financial Institution 100.0385 OPB-Quinta GmbH Cologne 4 Financial Institution 100.0386 OPB-Septima GmbH Cologne 4 Financial Institution 100.0
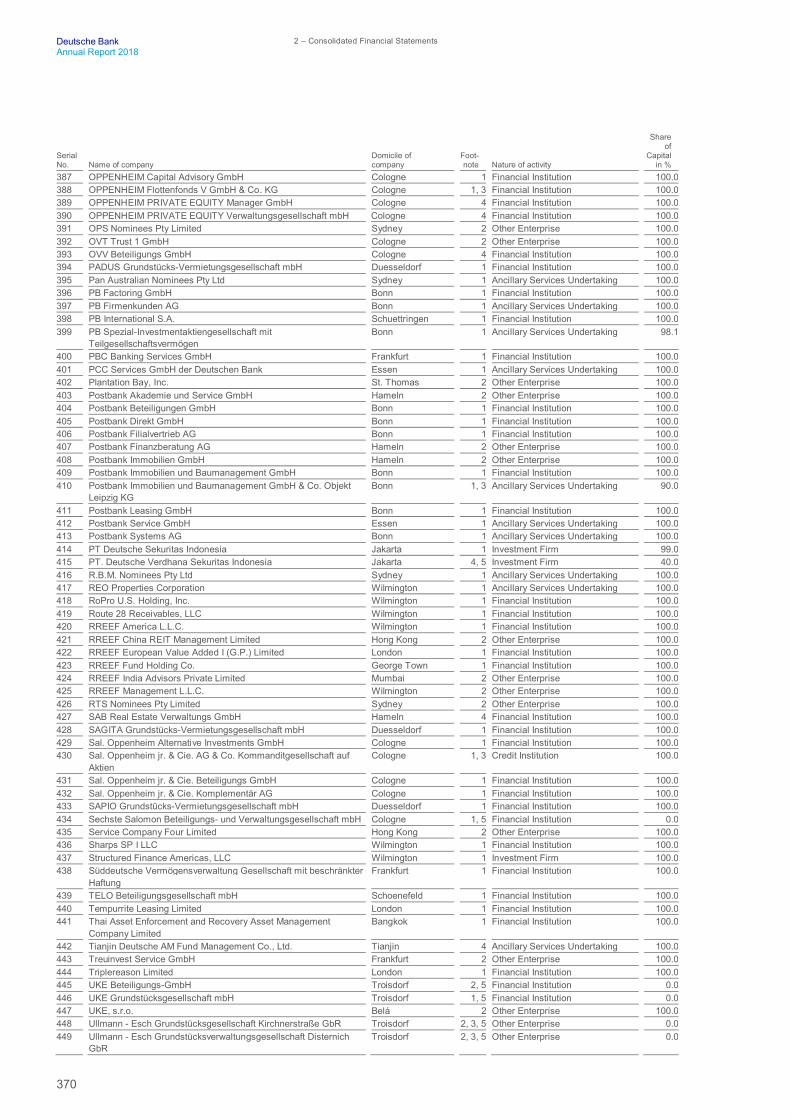
370
Deutsche Bank 2 – Consolidated Financial StatementsAnnual Report 2018
SerialNo. Name of company
Domicile ofcompany
Foot-note Nature of activity
Shareof
Capitalin %
387 OPPENHEIM Capital Advisory GmbH Cologne 1 Financial Institution 100.0388 OPPENHEIM Flottenfonds V GmbH & Co. KG Cologne 1, 3 Financial Institution 100.0389 OPPENHEIM PRIVATE EQUITY Manager GmbH Cologne 4 Financial Institution 100.0390 OPPENHEIM PRIVATE EQUITY Verwaltungsgesellschaft mbH Cologne 4 Financial Institution 100.0391 OPS Nominees Pty Limited Sydney 2 Other Enterprise 100.0392 OVT Trust 1 GmbH Cologne 2 Other Enterprise 100.0393 OVV Beteiligungs GmbH Cologne 4 Financial Institution 100.0394 PADUS Grundstücks-Vermietungsgesellschaft mbH Duesseldorf 1 Financial Institution 100.0395 Pan Australian Nominees Pty Ltd Sydney 1 Ancillary Services Undertaking 100.0396 PB Factoring GmbH Bonn 1 Financial Institution 100.0397 PB Firmenkunden AG Bonn 1 Ancillary Services Undertaking 100.0398 PB International S.A. Schuettringen 1 Financial Institution 100.0399 PB Spezial-Investmentaktiengesellschaft mit
Teilgesellschaftsvermögen Bonn 1 Ancillary Services Undertaking 98.1
400 PBC Banking Services GmbH Frankfurt 1 Financial Institution 100.0401 PCC Services GmbH der Deutschen Bank Essen 1 Ancillary Services Undertaking 100.0402 Plantation Bay, Inc. St. Thomas 2 Other Enterprise 100.0403 Postbank Akademie und Service GmbH Hameln 2 Other Enterprise 100.0404 Postbank Beteiligungen GmbH Bonn 1 Financial Institution 100.0405 Postbank Direkt GmbH Bonn 1 Financial Institution 100.0406 Postbank Filialvertrieb AG Bonn 1 Financial Institution 100.0407 Postbank Finanzberatung AG Hameln 2 Other Enterprise 100.0408 Postbank Immobilien GmbH Hameln 2 Other Enterprise 100.0409 Postbank Immobilien und Baumanagement GmbH Bonn 1 Financial Institution 100.0410 Postbank Immobilien und Baumanagement GmbH & Co. Objekt
Leipzig KG Bonn 1, 3 Ancillary Services Undertaking 90.0
411 Postbank Leasing GmbH Bonn 1 Financial Institution 100.0412 Postbank Service GmbH Essen 1 Ancillary Services Undertaking 100.0413 Postbank Systems AG Bonn 1 Ancillary Services Undertaking 100.0414 PT Deutsche Sekuritas Indonesia Jakarta 1 Investment Firm 99.0415 PT. Deutsche Verdhana Sekuritas Indonesia Jakarta 4, 5 Investment Firm 40.0416 R.B.M. Nominees Pty Ltd Sydney 1 Ancillary Services Undertaking 100.0417 REO Properties Corporation Wilmington 1 Ancillary Services Undertaking 100.0418 RoPro U.S. Holding, Inc. Wilmington 1 Financial Institution 100.0419 Route 28 Receivables, LLC Wilmington 1 Financial Institution 100.0420 RREEF America L.L.C. Wilmington 1 Financial Institution 100.0421 RREEF China REIT Management Limited Hong Kong 2 Other Enterprise 100.0422 RREEF European Value Added I (G.P.) Limited London 1 Financial Institution 100.0423 RREEF Fund Holding Co. George Town 1 Financial Institution 100.0424 RREEF India Advisors Private Limited Mumbai 2 Other Enterprise 100.0425 RREEF Management L.L.C. Wilmington 2 Other Enterprise 100.0426 RTS Nominees Pty Limited Sydney 2 Other Enterprise 100.0427 SAB Real Estate Verwaltungs GmbH Hameln 4 Financial Institution 100.0428 SAGITA Grundstücks-Vermietungsgesellschaft mbH Duesseldorf 1 Financial Institution 100.0429 Sal. Oppenheim Alternative Investments GmbH Cologne 1 Financial Institution 100.0430 Sal. Oppenheim jr. & Cie. AG & Co. Kommanditgesellschaft auf
Aktien Cologne 1, 3 Credit Institution 100.0
431 Sal. Oppenheim jr. & Cie. Beteiligungs GmbH Cologne 1 Financial Institution 100.0432 Sal. Oppenheim jr. & Cie. Komplementär AG Cologne 1 Financial Institution 100.0433 SAPIO Grundstücks-Vermietungsgesellschaft mbH Duesseldorf 1 Financial Institution 100.0434 Sechste Salomon Beteiligungs- und Verwaltungsgesellschaft mbH Cologne 1, 5 Financial Institution 0.0435 Service Company Four Limited Hong Kong 2 Other Enterprise 100.0436 Sharps SP I LLC Wilmington 1 Financial Institution 100.0437 Structured Finance Americas, LLC Wilmington 1 Investment Firm 100.0438 Süddeutsche Vermögensverwaltung Gesellschaft mit beschränkter
Haftung Frankfurt 1 Financial Institution 100.0
439 TELO Beteiligungsgesellschaft mbH Schoenefeld 1 Financial Institution 100.0440 Tempurrite Leasing Limited London 1 Financial Institution 100.0441 Thai Asset Enforcement and Recovery Asset Management
Company Limited Bangkok 1 Financial Institution 100.0
442 Tianjin Deutsche AM Fund Management Co., Ltd. Tianjin 4 Ancillary Services Undertaking 100.0443 Treuinvest Service GmbH Frankfurt 2 Other Enterprise 100.0444 Triplereason Limited London 1 Financial Institution 100.0445 UKE Beteiligungs-GmbH Troisdorf 2, 5 Financial Institution 0.0446 UKE Grundstücksgesellschaft mbH Troisdorf 1, 5 Financial Institution 0.0447 UKE, s.r.o. Belá 2 Other Enterprise 100.0448 Ullmann - Esch Grundstücksgesellschaft Kirchnerstraße GbR Troisdorf 2, 3, 5 Other Enterprise 0.0449 Ullmann - Esch Grundstücksverwaltungsgesellschaft Disternich
GbR Troisdorf 2, 3, 5 Other Enterprise 0.0

371
Deutsche Bank Additional NotesAnnual Report 2018 Shareholdings
SerialNo. Name of company
Domicile ofcompany
Foot-note Nature of activity
Shareof
Capitalin %
450 Ullmann Ullmann Krockow Krockow Esch GbR Troisdorf 2, 3, 5 Other Enterprise 0.0451 Vesta Real Estate S.r.l. Milan 1 Ancillary Services Undertaking 100.0452 VÖB-ZVD Processing GmbH Bonn 1 Payment Institution 100.0453 Wealthspur Investment Ltd. Labuan 4 Financial Institution 100.0454 WEPLA Beteiligungsgesellschaft mbH Frankfurt 1 Financial Institution 100.0455 Whale Holdings S.à r.l. Luxembourg 1 Financial Institution 100.0456 World Trading (Delaware) Inc. Wilmington 1 Financial Institution 100.0

372
Deutsche Bank 2 – Consolidated Financial StatementsAnnual Report 2018
Consolidated Structured Entities
SerialNo. Name of company
Domicile ofcompany
Foot-note Nature of activity
Shareof
Capitalin %
457 Alguer Inversiones Designated Activity Company Dublin 2 Financial Institution458 Alixville Invest, S.L. Madrid 2 Other Enterprise459 Amber Investments S.à r.l. Luxembourg 1 Financial Institution 100.0460 Asset Repackaging Trust Five B.V. Amsterdam 2, 7 Financial Institution461 Atena SPV S.r.l Conegliano 1 Financial Institution 60.0462 Atlas Investment Company 1 S.à r.l. Luxembourg 2 Financial Institution463 Atlas Investment Company 2 S.à r.l. Luxembourg 2 Financial Institution464 Atlas Investment Company 3 S.à r.l. Luxembourg 2 Financial Institution465 Atlas Investment Company 4 S.à r.l. Luxembourg 2 Financial Institution466 Atlas Portfolio Select SPC George Town 4 Financial Institution 0.1467 Atlas SICAV - FIS Luxembourg 2, 7 Other Enterprise468 Australian Corporate Bond Trust Sydney 2, 7 Other Enterprise469 Axia Insurance, Ltd. Hamilton 2, 7 Other Enterprise470 Baltics Credit Solutions Latvia SIA Riga 2 Financial Institution471 Cape Hatteras Marine Inc. Road Town 2 Other Enterprise472 Cathay Capital (Labuan) Company Limited Labuan 2 Other Enterprise473 Cathay Capital Company Limited Ebène 4 Financial Institution 9.5474 Cathay Strategic Investment Company Limited Hong Kong 2 Financial Institution475 Cathay Strategic Investment Company No. 2 Limited George Town 2 Financial Institution476 Cayman Reference Fund Holdings Limited George Town 2 Ancillary Services Undertaking477 Charitable Luxembourg Four S.à r.l. Luxembourg 2 Financial Institution478 Charitable Luxembourg Three S.à r.l. Luxembourg 2 Financial Institution479 Charitable Luxembourg Two S.à r.l. Luxembourg 2 Financial Institution480 Chartley World Inc. Road Town 2 Other Enterprise481 CITAN Beteiligungsgesellschaft mbH Frankfurt 1 Financial Institution 100.0482 City Leasing (Thameside) Limited London 1 Financial Institution 100.0483 City Leasing Limited London 1 Financial Institution 100.0484 CLASS Limited St. Helier 2, 7 Other Enterprise485 Collins Capital Low Volatility Performance II Special Investments,
Ltd. Road Town 2 Financial Institution
486 Crofton Invest, S.L. Madrid 2 Other Enterprise487 Danube Properties S.à r.l., en faillite Luxembourg 2 Other Enterprise 25.0488 Dariconic Designated Activity Company Dublin 2 Financial Institution489 DB Apex Management Limited George Town 1 Financial Institution 100.0490 DB Aster II, LLC Wilmington 1 Ancillary Services Undertaking 100.0491 DB Aster III, LLC Wilmington 1 Ancillary Services Undertaking 100.0492 DB Aster, Inc. Wilmington 1 Financial Institution 100.0493 DB Aster, LLC Wilmington 1 Ancillary Services Undertaking 100.0494 DB Covered Bond S.r.l. Conegliano 1 Financial Institution 90.0495 DB Credit Investments S.à r.l. Luxembourg 1 Financial Institution 100.0496 DB Finance International GmbH Eschborn 1 Financial Institution 100.0497 DB Global Markets Multi-Strategy Fund I Ltd. George Town 4 Financial Institution 100.0498 DB Immobilienfonds 1 Wieland KG Frankfurt 2 Other Enterprise499 DB Immobilienfonds 2 GmbH & Co. KG i.L. Frankfurt 1 Financial Institution 74.0500 DB Immobilienfonds 4 GmbH & Co. KG i.L. Frankfurt 2 Other Enterprise 0.2501 DB Immobilienfonds 5 Wieland KG Frankfurt 2 Other Enterprise502 DB Impact Investment (GP) Limited London 1 Financial Institution 100.0503 DB Litigation Fee LLC Wilmington 1 Financial Institution 100.0504 DB Municipal Holdings LLC Wilmington 1 Ancillary Services Undertaking 100.0505 DB PWM Luxembourg 2, 7 Other Enterprise506 DB PWM II - LiquidAlts UCITS (Euro) Luxembourg 4 Other Enterprise 15.7507 DB RC Holdings, LLC Wilmington 1 Financial Institution 100.0508 DB Real Estate Canadainvest 1 Inc. Toronto 4 Financial Institution 100.0509 DB Safe Harbour Investment Projects Limited (in members'
voluntary liquidation) London 1 Financial Institution 100.0
510 DB SPEARs/LIFERs Trust Wilmington 4, 7 Ancillary Services Undertaking 0.0511 DB STG Lux 10 S.à r.l. Luxembourg 2 Other Enterprise 100.0512 DB STG Lux 11 S.à r.l. Luxembourg 2 Other Enterprise 100.0513 DB STG Lux 12 S.à r.l. Luxembourg 2 Other Enterprise 100.0514 DB STG Lux 9 S.à r.l. Luxembourg 2 Other Enterprise 100.0515 DB Structured Finance 1 Designated Activity Company Dublin 1 Financial Institution 100.0516 DB Structured Finance 2 Designated Activity Company Dublin 1 Financial Institution 100.0517 dbInvestor Solutions 2 Public Limited Company Dublin 2, 7 Financial Institution518 DBRE Global Real Estate Management US IB, L.L.C. Wilmington 1 Financial Institution 100.0519 DBRMS4 George Town 1, 3, 8 Financial Institution 100.0520 DBX ETF Trust Wilmington 2, 7 Other Enterprise

373
Deutsche Bank Additional NotesAnnual Report 2018 Shareholdings
SerialNo. Name of company
Domicile ofcompany
Foot-note Nature of activity
Shareof
Capitalin %
521 De Heng Asset Management Company Limited Beijing 2 Financial Institution522 DeAM Capital Protect 2019 Frankfurt 2 Other Enterprise523 Deloraine Spain SL Madrid 2 Financial Institution524 Deutsche Bank Best Allocation - Protect 80 Luxembourg 2 Other Enterprise525 Deutsche Bank Best Allocation - Protect 90 Luxembourg 2 Other Enterprise526 Deutsche Bank Capital Finance LLC I Wilmington 1 Financial Institution 100.0527 Deutsche Bank Capital Finance Trust I Wilmington 1, 5 Financial Institution 0.0528 Deutsche Bank Contingent Capital LLC II Wilmington 1 Financial Institution 100.0529 Deutsche Bank Contingent Capital LLC V Wilmington 1 Financial Institution 100.0530 Deutsche Bank Contingent Capital Trust II Wilmington 1, 5 Financial Institution 0.0531 Deutsche Bank Contingent Capital Trust V Wilmington 1, 5 Financial Institution 0.0532 Deutsche Bank Luxembourg S.A. - Fiduciary Deposits Luxembourg 2, 7 Other Enterprise533 Deutsche Bank Luxembourg S.A. - Fiduciary Note Programme Luxembourg 2, 7 Other Enterprise534 Deutsche Bank SPEARs/LIFERs, Series DBE-7004 Trust George Town 4 Ancillary Services Undertaking 5.0535 Deutsche Bank SPEARs/LIFERs, Series DBE-7006 Trust George Town 4 Ancillary Services Undertaking 14.3536 Deutsche Bank SPEARs/LIFERs, Series DBE-7007 Trust George Town 4. 9 Ancillary Services Undertaking 100.0537 Deutsche Bank SPEARs/LIFERs, Series DBE-8002 Trust Wilmington 4 Ancillary Services Undertaking 14.2538 Deutsche Colombia S.A.S. Bogotá 1 Securities Trading Firm 100.0539 Deutsche DWS Income Trust - DWS Short Duration High Income
Fund Boston 2 Other Enterprise 100.0
540 Deutsche Postbank Funding LLC I Wilmington 1 Financial Institution 100.0541 Deutsche Postbank Funding LLC II Wilmington 1 Financial Institution 100.0542 Deutsche Postbank Funding LLC III Wilmington 1 Financial Institution 100.0543 Deutsche Postbank Funding Trust I Wilmington 1, 5 Financial Institution 0.0544 Deutsche Postbank Funding Trust II Wilmington 1, 5 Financial Institution 0.0545 Deutsche Postbank Funding Trust III Wilmington 1, 5 Financial Institution 0.0546 Deutsche Services Polska Sp. z o.o. Warsaw 1 Ancillary Services Undertaking 100.0547 Deutsche Strategic Luxembourg 2, 7 Other Enterprise548 DWS Access S.A. Luxembourg 2, 7 Financial Institution549 DWS Garant 80 FPI Luxembourg 2 Other Enterprise550 DWS Invest Luxembourg 2, 7 Other Enterprise551 DWS World Protect 90 Luxembourg 2 Other Enterprise552 DWS Zeitwert Protect Luxembourg 2 Other Enterprise553 Dynamic Infrastructure Securities Fund LP Wilmington 2 Financial Institution554 Earls Four Limited George Town 2, 7 Other Enterprise555 EARLS Trading Limited George Town 2 Financial Institution556 Einkaufszentrum "HVD Dresden" S.à.r.l & Co. KG i.I. Cologne 2 Other Enterprise557 Eirles Three Designated Activity Company Dublin 2, 7 Financial Institution558 Eirles Two Designated Activity Company Dublin 2, 7 Financial Institution559 Elmo Funding GmbH Eschborn 1 Financial Institution 100.0560 Elmo Leasing Vierzehnte GmbH Eschborn 1 Ancillary Services Undertaking 100.0561 Emerald Asset Repackaging Designated Activity Company Dublin 1 Financial Institution 100.0562 Emerging Markets Capital Protected Investments Limited George Town 2, 7 Other Enterprise563 Emeris George Town 2 Securities Trading Firm564 Encina Property Finance Designated Activity Company Dublin 2 Financial Institution565 Epicuro SPV S.r.l. Conegliano 2 Financial Institution566 Erste Frankfurter Hoist GmbH Eschborn 1 Financial Institution 100.0567 Eurohome (Italy) Mortgages S.r.l. Conegliano 2 Financial Institution568 European Strategic Real Estate Fund ICAV Dublin 2 Other Enterprise569 Fondo Privado de Titulizacion Activos Reales 1 B.V. Amsterdam 2 Other Enterprise570 Fondo Privado de Titulización PYMES I Limited Dublin 2 Financial Institution571 FRANKFURT CONSULT GmbH Frankfurt 1 Financial Institution 100.0572 G.O. IB-US Management, L.L.C. Wilmington 1 Financial Institution 100.0573 GAC-HEL, Inc. Wilmington 1 Ancillary Services Undertaking 100.0574 Gladyr Spain, S.L. Madrid 2 Financial Institution575 Global Markets Fundo de Investimento Multimercado Rio de Janeiro 4 Financial Institution 100.0576 Global Markets III Fundo de Investimento Multimercado - Crédito
Privado e Investimento No Exterior Rio de Janeiro 4 Financial Institution 100.0
577 Global Opportunities Co-Investment Feeder, LLC Wilmington 2 Financial Institution578 Global Opportunities Co-Investment, LLC George Town 2 Financial Institution579 Groton Invest, S.L. Madrid 2 Financial Institution580 GWC-GAC Corp. Wilmington 1 Ancillary Services Undertaking 100.0581 Hamildak Designated Activity Company Dublin 2 Financial Institution582 Histria Inversiones Designated Activity Company Dublin 2 Financial Institution583 Iberia Inversiones Designated Activity Company Dublin 2 Financial Institution584 Iberia Inversiones II Designated Activity Company Dublin 2 Financial Institution585 India Debt Opportunities Fund Mumbai 2 Ancillary Services Undertaking586 Infrastructure Holdings (Cayman) SPC George Town 2 Financial Institution587 Inn Properties S.à r.l., en faillite Luxembourg 2 Other Enterprise 25.0

374
Deutsche Bank 2 – Consolidated Financial StatementsAnnual Report 2018
SerialNo. Name of company
Domicile ofcompany
Foot-note Nature of activity
Shareof
Capitalin %
588 Investor Solutions Limited St. Helier 2, 7 Other Enterprise589 Isar Properties S.à r.l., en faillite Luxembourg 2 Other Enterprise 25.0590 IVAF (Jersey) Limited St. Helier 2 Ancillary Services Undertaking591 Kelona Invest, S.L. Madrid 2 Other Enterprise592 Kelsey Street LLC Wilmington 1 Ancillary Services Undertaking 100.0593 KOMPASS 3 Beteiligungsgesellschaft mbH Duesseldorf 4 Financial Institution 50.0594 KOMPASS 3 Erste Beteiligungsgesellschaft mbH & Co. Euro KG
i.L. Duesseldorf 1, 3 Ancillary Services Undertaking 96.1
595 KOMPASS 3 Zweite Beteiligungsgesellschaft mbH & Co. USD KGi.L.
Duesseldorf 1, 3 Ancillary Services Undertaking 97.0
596 Kratus Inversiones Designated Activity Company Dublin 2 Financial Institution597 La Fayette Dedicated Basket Ltd. Road Town 2 Securities Trading Firm598 Ledyard, S.L. Madrid 2 Other Enterprise599 Lenthorp Financial Corp. Road Town 2 Other Enterprise600 Leo Consumo 1 S.r.l. Conegliano 2 Financial Institution601 Leo Consumo 2 S.r.l. Conegliano 1 Financial Institution 70.0602 87 Leonard Development LLC Wilmington 1 Ancillary Services Undertaking 100.0603 Leonardo Charitable 1 Limited George Town 2 Ancillary Services Undertaking604 Leonardo Secondary Opportunities Fund III (Alternate GP of GP),
LP Wilmington 2 Financial Institution
605 Leonardo Secondary Opportunities Fund III (GP) Limited George Town 2 Financial Institution606 Leonardo Secondary Opportunities Fund III (Limited Partner)
Limited George Town 2 Financial Institution
607 Lerma Investments 2018, Sociedad Limitada Madrid 2 Financial Institution608 Life Mortgage S.r.l. Conegliano 2 Financial Institution609 Lindsell Finance Limited St. Julian's 1 Ancillary Services Undertaking 100.0610 Lockwood Invest, S.L. Madrid 2 Financial Institution611 London Industrial Leasing Limited London 1 Financial Institution 100.0612 Lupus alpha Low Beta Risk-Premium Frankfurt 2 Other Enterprise 100.0613 Macondo Spain SL Madrid 2 Other Enterprise 100.0614 Malabo Holdings Designated Activity Company Dublin 2 Financial Institution615 Maxima Alpha Bomaral Limited (in liquidation) St. Helier 2 Securities Trading Firm616 Merlin I George Town 2 Securities Trading Firm617 Merlin XI George Town 2 Securities Trading Firm618 Meseta Inversiones Designated Activity Company Dublin 2 Financial Institution619 Micro-E Finance S.r.l. Rome 2 Financial Institution620 Midsel Limited (in members' voluntary liquidation) London 2 Other Enterprise 100.0621 Moon Leasing Limited (in members' voluntary liquidation) London 1 Financial Institution 100.0622 Motion Picture Productions One GmbH & Co. KG Frankfurt 1, 3 Financial Institution 100.0623 MPP Beteiligungsgesellschaft mbH Frankfurt 1 Financial Institution 100.0624 Natureza Maritima SA Panama City 2 Other Enterprise625 NCW Holding Inc. Vancouver 1 Financial Institution 100.0626 New 87 Leonard, LLC Wilmington 1 Financial Institution 100.0627 Nineco Leasing Limited (in members' voluntary liquidation) London 1 Financial Institution 100.0628 Oasis Securitisation S.r.l. Conegliano 1, 5 Financial Institution 0.0629 Oder Properties S.à r.l., en faillite Luxembourg 2 Other Enterprise 25.0630 OPAL, en liquidation volontaire Luxembourg 2, 7 Other Enterprise631 Opus Niestandaryzowany Sekurytyzacyjny Fundusz Inwestycyjny
Zamkniety Warsaw 2 Financial Institution
632 Oran Limited George Town 2 Financial Institution633 OTTAM Mexican Capital Trust Designated Activity Company Dublin 2, 7 Financial Institution634 Palladium Securities 1 S.A. Luxembourg 2, 7 Financial Institution635 PanAsia Funds Investments Ltd. George Town 2, 7 Financial Institution636 PARTS Funding, LLC Wilmington 1 Financial Institution 100.0637 PD Germany Funding Company II, Ltd. George Town 2 Financial Institution638 PD Germany Funding Company V, Ltd. George Town 2 Financial Institution639 PEIF II SLP Feeder, L.P. Edinburgh 4 Financial Institution 0.7640 Peruda Leasing Limited London 1 Financial Institution 100.0641 PERUS 1 S.à r.l. Luxembourg 2 Financial Institution642 PES Carry and Employee Co-Investment Feeder SCSp Munsbach 4 Financial Institution 1.3643 Philippine Opportunities for Growth and Income (SPV-AMC), INC. Makati City 1 Financial Institution 95.0644 Pinehurst Securities SA Luxembourg 2, 7 Financial Institution645 Primus Solutions ICAV Dublin 2 Other Enterprise646 Private Equity Solutions SCSp Munsbach 1 Financial Institution 99.1647 Quantum 13 LLC Wilmington 1 Ancillary Services Undertaking 100.0648 Quartz No. 1 S.A. Luxembourg 1, 5 Financial Institution 0.0649 Rattray Business Inc. Road Town 2 Other Enterprise650 Reference Capital Investments Limited London 1 Financial Institution 100.0651 REO Properties Corporation II Wilmington 1, 5 Ancillary Services Undertaking 0.0

375
Deutsche Bank Additional NotesAnnual Report 2018 Shareholdings
SerialNo. Name of company
Domicile ofcompany
Foot-note Nature of activity
Shareof
Capitalin %
652 Residential Mortgage Funding Trust Toronto 2 Financial Institution653 Rhine Properties S.à r.l., en faillite Luxembourg 2 Other Enterprise 25.0654 Riviera Real Estate Paris 2 Other Enterprise 100.0655 Romareda Holdings Designated Activity Company Dublin 2 Financial Institution656 RREEF DCH, L.L.C. Wilmington 1 Financial Institution 100.0657 SABRE Securitisation Limited Sydney 2 Other Enterprise658 Samburg Invest, S.L. Madrid 2 Other Enterprise659 SCB Alpspitze UG (haftungsbeschränkt) Frankfurt 2 Financial Institution660 Sebbon Holdings Corp. Road Town 2 Other Enterprise661 Select Access Investments Limited Sydney 2, 7 Other Enterprise662 SHINSEI Trust TBI (PJ Skytree) Tokyo 2 Other Enterprise663 Singer Island Tower Suite LLC Wilmington 1 Ancillary Services Undertaking 100.0664 Sixco Leasing Limited (in members' voluntary liquidation) London 1 Financial Institution 100.0665 SOLIDO Grundstücks-Vermietungsgesellschaft mbH Duesseldorf 1 Financial Institution 100.0666 Somkid Immobiliare S.r.l. Conegliano 2 Other Enterprise 100.0667 SP Mortgage Trust Wilmington 2 Other Enterprise 100.0668 Strategic Global Opportunities Limited - Class A Main USD Nassau 2 Financial Institution669 Swabia 1 Designated Activity Company Dublin 2 Financial Institution670 Swabia 1. Vermögensbesitz-GmbH Eschborn 1 Financial Institution 100.0671 Tagus - Sociedade de Titularização de Creditos, S.A. Lisbon 1 Financial Institution 100.0672 The Canary Star Trust George Town 4 Ancillary Services Undertaking 100.0673 The Emperor Star Trust George Town 4 Ancillary Services Undertaking 100.0674 The India Debt Opportunities Fund Limited Ebène 2 Ancillary Services Undertaking675 Trave Properties S.à r.l., en faillite Luxembourg 2 Other Enterprise 25.0676 TRS Aria LLC Wilmington 4 Financial Institution 100.0677 TRS Birch II LTD George Town 1 Financial Institution 100.0678 TRS Birch LLC Wilmington 2 Other Enterprise 100.0679 TRS Cypress II LTD George Town 1 Financial Institution 100.0680 TRS Elm II LTD George Town 1 Financial Institution 100.0681 TRS Leda LLC Wilmington 4 Financial Institution 100.0682 TRS Maple II LTD George Town 1 Financial Institution 100.0683 TRS Oak II LTD George Town 1 Financial Institution 100.0684 TRS Oak LLC Wilmington 2 Other Enterprise 100.0685 TRS Poplar II LTD George Town 1 Financial Institution 100.0686 TRS Scorpio LLC Wilmington 4 Financial Institution 100.0687 TRS Spruce II LTD George Town 1 Financial Institution 100.0688 TRS SVCO LLC Wilmington 4 Financial Institution 100.0689 TRS Sycamore II LTD George Town 1 Financial Institution 100.0690 TRS Tupelo II LTD George Town 1 Financial Institution 100.0691 TRS Venor LLC Wilmington 4 Financial Institution 100.0692 TRS Walnut II LTD George Town 1 Financial Institution 100.0693 TRS Walnut LLC Wilmington 2 Other Enterprise 100.0694 Vanguard MSCI International Small Companies Index ETF Melbourne 2 Other Enterprise 58.8695 VCJ Lease S.à r.l. Luxembourg 2, 9 Other Enterprise 95.0696 Vermögensfondmandat Flexible (80% teilgeschützt) Luxembourg 2 Other Enterprise697 Wedverville Spain, S.L. Madrid 2 Other Enterprise698 Wendelstein 2017-1 UG (haftungsbeschränkt) Frankfurt 2 Financial Institution699 Wibaux Invest, S.L. Madrid 2 Other Enterprise700 Xtrackers (IE) Public Limited Company Dublin 2, 7 Other Enterprise 0.4701 ZALLUS Beteiligungsgesellschaft mbH Duesseldorf 4 Financial Institution 50.0702 ZARAT Beteiligungsgesellschaft mbH Duesseldorf 4 Financial Institution 50.0703 ZARAT Beteiligungsgesellschaft mbH & Co. Leben II KG i.L. Duesseldorf 1, 3 Ancillary Services Undertaking 98.1704 ZELAS Beteiligungsgesellschaft mbH Duesseldorf 4 Financial Institution 50.0705 ZELAS Beteiligungsgesellschaft mbH & Co. Leben I KG i.L. Duesseldorf 1, 3 Ancillary Services Undertaking 98.2706 Zumirez Drive LLC Wilmington 1 Ancillary Services Undertaking 100.0707 ZURET Beteiligungsgesellschaft mbH Duesseldorf 4 Financial Institution 50.0

376
Deutsche Bank 2 – Consolidated Financial StatementsAnnual Report 2018
Companies accounted for at equity
SerialNo. Name of company
Domicile ofcompany
Foot-note Nature of activity
Shareof
Capitalin %
708 AKA Ausfuhrkredit-Gesellschaft mit beschränkter Haftung Frankfurt Credit Institution 26.9709 Argantis GmbH i.L. Cologne Financial Institution 50.0710 Baigo Capital Partners Fund 1 Parallel 1 GmbH & Co. KG Bad Soden am
Taunus Financial Institution 49.8
711 BANKPOWER GmbH Personaldienstleistungen Frankfurt Other Enterprise 30.0712 Bestra Gesellschaft für Vermögensverwaltung mit beschränkter
Haftung Duesseldorf Financial Institution 49.0
713 BFDB Tax Credit Fund 2011, Limited Partnership New York 9 Financial Institution 99.9714 Comfund Consulting Limited Bangalore Other Enterprise 30.0715 Craigs Investment Partners Limited Tauranga Securities Trading Firm 49.9716 Cyber Defence Alliance Limited London 10 Other Enterprise 0.0717 DB Real Estate Global Opportunities IB (Offshore), L.P. Camana Bay Financial Institution 34.3718 DBG Eastern Europe II L.P. St. Helier Financial Institution 25.9719 Deutsche Börse Commodities GmbH Eschborn Other Enterprise 16.2720 Deutsche Gulf Finance Riyadh Financial Institution 29.1721 Deutsche Regis Partners, Inc. Makati City Securities Trading Firm 49.0722 Deutsche TISCO Investment Advisory Company Limited Bangkok Securities Trading Firm 49.0723 Deutsche Zurich Pensiones Entidad Gestora de Fondos de
Pensiones, S.A. Barcelona Other Enterprise 50.0
724 Deutscher Pensionsfonds Aktiengesellschaft Bonn Other Enterprise 25.1725 DIL Internationale Leasinggesellschaft mbH Duesseldorf Financial Institution 50.0726 Domus Beteiligungsgesellschaft der Privaten Bausparkassen mbH Berlin Financial Holding Company 21.1727 dwins GmbH Frankfurt Other Enterprise 21.2728 Elbe Properties S.à r.l. Luxembourg Other Enterprise 25.0729 eolec Issy-les-Moulineaux Other Enterprise 33.3730 equiNotes Management GmbH Duesseldorf Other Enterprise 50.0731 EVROENERGIAKI S.A. Athens Other Enterprise 40.0732 Fünfte SAB Treuhand und Verwaltung GmbH & Co. "Leipzig-
Magdeburg" KG Bad Homburg Other Enterprise 41.2
733 Fünfte SAB Treuhand und Verwaltung GmbH & Co. Dresden"Louisenstraße" KG
Bad Homburg Other Enterprise 30.6
734 G.O. IB-SIV Feeder, L.L.C. Wilmington Financial Institution 15.7735 German Public Sector Finance B.V. Amsterdam Financial Institution 50.0736 Gesellschaft für Kreditsicherung mit beschränkter Haftung Berlin Financial Institution 36.7737 giropay GmbH Frankfurt Other Enterprise 33.3738 Gordian Knot Limited London Other Enterprise 24.7739 Grundstücksgesellschaft Bürohäuser Köln Rheinhallen GbR Berlin 3 Other Enterprise 15.6740 Grundstücksgesellschaft Karlsruhe Kaiserstraße GbR Troisdorf 3 Other Enterprise 3.4741 Grundstücksgesellschaft Köln Messe 15-18 GbR Troisdorf 3 Other Enterprise 10.5742 Grundstücksgesellschaft Köln Oppenheimstraße GbR Troisdorf 3, 10 Other Enterprise 0.0743 Grundstücksgesellschaft Köln-Merheim Winterberger Straße GbR Troisdorf 3, 10 Other Enterprise 0.0744 Grundstücksgesellschaft Köln-Ossendorf VI GbR Troisdorf 3 Other Enterprise 44.9745 Grundstücksgesellschaft München Synagogenplatz GbR Troisdorf 3, 10 Other Enterprise 0.0746 Grundstücksgesellschaft Schillingsrotter Weg GbR Troisdorf 3, 10 Other Enterprise 0.0747 Harvest Fund Management Co., Ltd. Shanghai Investment Firm 30.0748 Huarong Rongde Asset Management Company Limited Beijing Financial Institution 40.7749 ILV Immobilien-Leasing Verwaltungsgesellschaft Düsseldorf mbH Duesseldorf Financial Institution 50.0750 Immobilienfonds Bürohaus Düsseldorf Grafenberg GbR Troisdorf 3 Other Enterprise 10.0751 Immobilienfonds Bürohaus Düsseldorf Parsevalstraße GbR Cologne 3 Other Enterprise 7.0752 Immobilienfonds Köln-Deutz Arena und Mantelbebauung GbR Troisdorf 3 Other Enterprise 7.7753 Immobilienfonds Köln-Ossendorf II GbR Troisdorf 3 Other Enterprise 9.7754 iSwap Limited London Financial Institution 14.0755 IZI Düsseldorf Informations-Zentrum Immobilien Gesellschaft mit
beschränkter Haftung Duesseldorf Financial Institution 21.1
756 IZI Düsseldorf Informations-Zentrum Immobilien GmbH & Co.Kommanditgesellschaft
Duesseldorf Other Enterprise 22.9
757 KVD Singapore Pte. Ltd. Singapore Financial Institution 30.1758 Lion Residential Holdings S.à r.l. Luxembourg Financial Institution 17.4759 North Coast Wind Energy Corp. Vancouver 9 Other Enterprise 96.7760 P.F.A.B. Passage Frankfurter Allee Betriebsgesellschaft mbH Berlin Other Enterprise 22.2761 PERILLA Beteiligungsgesellschaft mbH Duesseldorf Financial Institution 50.0762 Prestipay S.p.A. Udine Financial Institution 40.0763 Private Equity Gesellschaft bürgerlichen Rechts Cologne 3, 10 Financial Institution 0.0764 Relax Holding S.à r.l. Luxembourg Other Enterprise 20.0765 REON - Park Wiatrowy I Sp. z o.o. Warsaw Other Enterprise 50.0766 REON-Park Wiatrowy II Sp. z o.o. Warsaw Other Enterprise 50.0
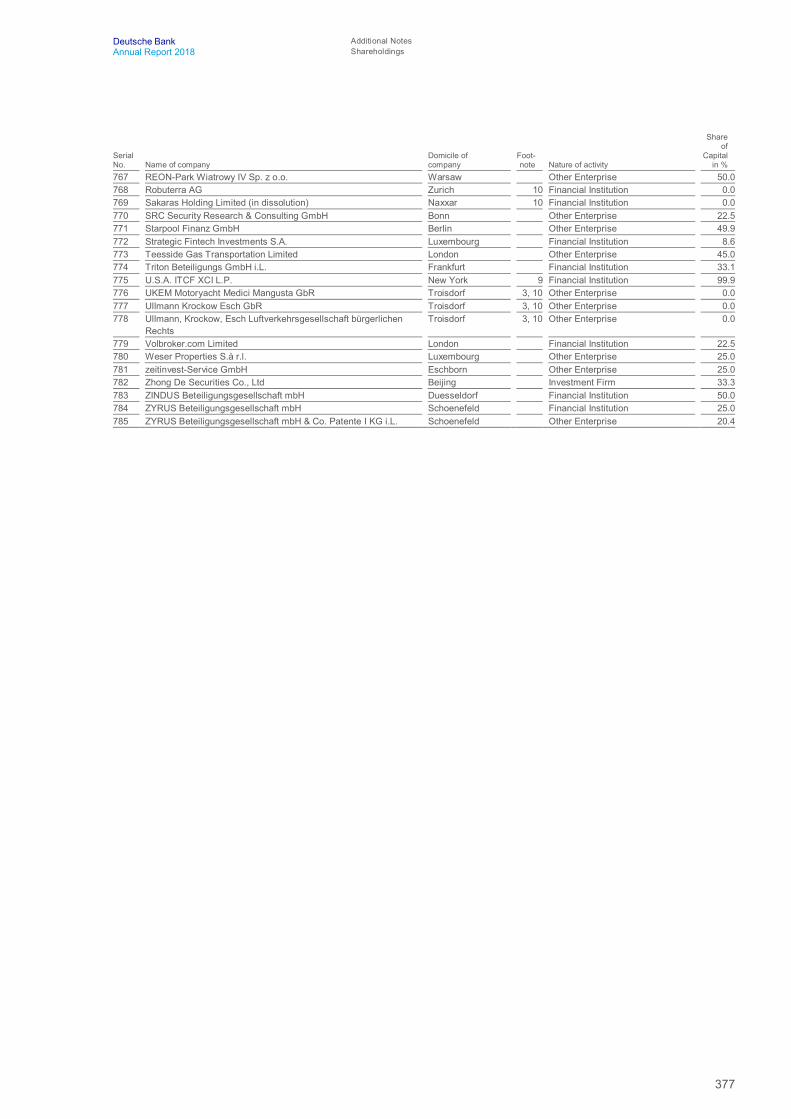
377
Deutsche Bank Additional NotesAnnual Report 2018 Shareholdings
SerialNo. Name of company
Domicile ofcompany
Foot-note Nature of activity
Shareof
Capitalin %
767 REON-Park Wiatrowy IV Sp. z o.o. Warsaw Other Enterprise 50.0768 Robuterra AG Zurich 10 Financial Institution 0.0769 Sakaras Holding Limited (in dissolution) Naxxar 10 Financial Institution 0.0770 SRC Security Research & Consulting GmbH Bonn Other Enterprise 22.5771 Starpool Finanz GmbH Berlin Other Enterprise 49.9772 Strategic Fintech Investments S.A. Luxembourg Financial Institution 8.6773 Teesside Gas Transportation Limited London Other Enterprise 45.0774 Triton Beteiligungs GmbH i.L. Frankfurt Financial Institution 33.1775 U.S.A. ITCF XCI L.P. New York 9 Financial Institution 99.9776 UKEM Motoryacht Medici Mangusta GbR Troisdorf 3, 10 Other Enterprise 0.0777 Ullmann Krockow Esch GbR Troisdorf 3, 10 Other Enterprise 0.0778 Ullmann, Krockow, Esch Luftverkehrsgesellschaft bürgerlichen
Rechts Troisdorf 3, 10 Other Enterprise 0.0
779 Volbroker.com Limited London Financial Institution 22.5780 Weser Properties S.à r.l. Luxembourg Other Enterprise 25.0781 zeitinvest-Service GmbH Eschborn Other Enterprise 25.0782 Zhong De Securities Co., Ltd Beijing Investment Firm 33.3783 ZINDUS Beteiligungsgesellschaft mbH Duesseldorf Financial Institution 50.0784 ZYRUS Beteiligungsgesellschaft mbH Schoenefeld Financial Institution 25.0785 ZYRUS Beteiligungsgesellschaft mbH & Co. Patente I KG i.L. Schoenefeld Other Enterprise 20.4

378
Deutsche Bank 2 – Consolidated Financial StatementsAnnual Report 2018
Other Companies, where the holding exceeds 20 %
SerialNo. Name of company
Domicile ofcompany
Foot-note Nature of activity
Shareof
Capital
in %786 ABATE Grundstücks-Vermietungsgesellschaft mbH Duesseldorf 11 Financial Institution 50.0787 ABRI Beteiligungsgesellschaft mbH Duesseldorf 11 Financial Institution 50.0788 Acamar Holding S.A. Luxembourg 9, 11 Other Enterprise 95.0789 ACHTE PAXAS Treuhand- und Beteiligungsgesellschaft mbH Duesseldorf 11 Other Enterprise 50.0790 ACHTUNDZWANZIGSTE PAXAS Treuhand- und Beteiligungsgesellschaft
mbH Duesseldorf 11 Other Enterprise 50.0
791 ACHTZEHNTE PAXAS Treuhand- und Beteiligungsgesellschaft mbH Duesseldorf 11 Other Enterprise 50.0792 ACIS Beteiligungsgesellschaft mbH Duesseldorf 11 Financial Institution 50.0793 ACTIO Grundstücks-Vermietungsgesellschaft mbH Duesseldorf 11 Financial Institution 50.0794 Adara S.A. Luxembourg 9, 11 Other Enterprise 95.0795 ADEO Beteiligungsgesellschaft mbH Duesseldorf 11 Financial Institution 50.0796 ADLAT Beteiligungsgesellschaft mbH Duesseldorf 11 Financial Institution 50.0797 ADMANU Beteiligungsgesellschaft mbH Duesseldorf 11 Financial Institution 50.0798 Agena S.A. Luxembourg 9, 11 Other Enterprise 95.0799 AGLOM Beteiligungsgesellschaft mbH Duesseldorf 11 Financial Institution 50.0800 AGUM Beteiligungsgesellschaft mbH Duesseldorf 11 Financial Institution 50.0801 ALANUM Beteiligungsgesellschaft mbH Duesseldorf 11 Financial Institution 50.0802 ALMO Beteiligungsgesellschaft mbH Duesseldorf 11 Financial Institution 50.0803 ALTA Beteiligungsgesellschaft mbH Duesseldorf 11 Financial Institution 50.0804 ANDOT Grundstücks-Vermietungsgesellschaft mbH Duesseldorf 11 Financial Institution 50.0805 APUR Beteiligungsgesellschaft mbH Duesseldorf 11 Financial Institution 50.0806 Asia Core Real Estate Fund SCA SICAV-RAIF Luxembourg 11 Other Enterprise 24.0807 ATAUT Beteiligungsgesellschaft mbH Duesseldorf 11 Financial Institution 50.0808 AVOC Beteiligungsgesellschaft mbH Duesseldorf 11 Financial Institution 50.0809 BAKTU Beteiligungsgesellschaft mbH Schoenefeld 11 Financial Institution 50.0810 BALIT Beteiligungsgesellschaft mbH Schoenefeld 11 Financial Institution 50.0811 Banks Island General Partner Inc. Toronto 11 Financial Institution 50.0812 Benefit Trust GmbH Luetzen 1, 12,
13 Financial Institution 100.0
813 BIMES Beteiligungsgesellschaft mbH Schoenefeld 11 Financial Institution 50.0814 BLI Beteiligungsgesellschaft für Leasinginvestitionen mbH Duesseldorf 11 Financial Institution 33.2815 BLI Internationale Beteiligungsgesellschaft mbH Duesseldorf 11 Financial Institution 32.0816 BrisConnections Holding Trust Kedron 14 Other Enterprise 35.6817 BrisConnections Investment Trust Kedron 14 Other Enterprise 35.6818 DB Advisors SICAV Luxembourg 12, 15 Other Enterprise 95.6819 DB Placement, LLC Wilmington 9, 11 Other Enterprise 100.0820 DB RC Investments II, LLC Wilmington 9, 11 Financial Institution 99.9821 Deutsche River Investment Management Company S.à r.l., en faillite clôture Luxembourg 11 Financial Institution 49.0822 DIL Fonds-Beteiligungsgesellschaft mbH i.L. Duesseldorf 12 Financial Institution 100.0823 DONARUM Holding GmbH Duesseldorf 11 Financial Institution 50.0824 DREIUNDZWANZIGSTE PAXAS Treuhand- und Beteiligungsgesellschaft mbH Duesseldorf 11 Other Enterprise 50.0825 DREIZEHNTE PAXAS Treuhand- und Beteiligungsgesellschaft mbH Duesseldorf 11 Other Enterprise 50.0826 DRITTE Fonds-Beteiligungsgesellschaft mbH Duesseldorf 11 Financial Institution 50.0827 DRITTE PAXAS Treuhand- und Beteiligungsgesellschaft mbH Duesseldorf 11 Other Enterprise 50.0828 EINUNDZWANZIGSTE PAXAS Treuhand- und Beteiligungsgesellschaft mbH Duesseldorf 11 Other Enterprise 50.0829 Eisler Capital (TA) Ltd London 14 Other Enterprise 33.3830 ELC Logistik-Centrum Verwaltungs-GmbH Erfurt 11 Financial Institution 50.0831 ELFTE PAXAS Treuhand- und Beteiligungsgesellschaft mbH Duesseldorf 11 Other Enterprise 50.0832 FÜNFTE Fonds-Beteiligungsgesellschaft mbH Duesseldorf 11 Financial Institution 50.0833 FÜNFTE PAXAS Treuhand- und Beteiligungsgesellschaft mbH Duesseldorf 11 Other Enterprise 50.0834 FÜNFUNDZWANZIGSTE PAXAS Treuhand- und Beteiligungsgesellschaft
mbH i.L. Duesseldorf 11 Other Enterprise 50.0
835 FÜNFZEHNTE PAXAS Treuhand- und Beteiligungsgesellschaft mbH Duesseldorf 11 Other Enterprise 50.0836 Glor Music Production GmbH & Co. KG Tegernsee 14 Other Enterprise 26.6837 GLOR Music Production II GmbH & Co. KG Tegernsee 14 Other Enterprise 21.3838 Grundstücksvermietungsgesellschaft Wilhelmstr. mbH i.L. Gruenwald 12 Other Enterprise 100.0839 HR "Simone" GmbH & Co. KG i.I. Jork 14 Other Enterprise 24.3840 Immobilien-Vermietungsgesellschaft Schumacher GmbH & Co. Objekt
Rolandufer KG Berlin 11 Financial Institution 20.5
841 Intermodal Finance I Ltd. George Town 11 Other Enterprise 49.0842 IOG Denali Upton, LLC Dover 14 Other Enterprise 23.0843 IOG NOD I, LLC Dover 14 Other Enterprise 22.5844 Isaac Newton S.A. Luxembourg 9, 11 Other Enterprise 95.0845 Kinneil Leasing Company London 3, 11 Financial Institution 35.0

379
Deutsche Bank Additional NotesAnnual Report 2018 Shareholdings
SerialNo. Name of company
Domicile ofcompany
Foot-note Nature of activity
Shareof
Capital
in %846 M Cap Finance Mittelstandsfonds GmbH & Co. KG Frankfurt 9, 14,
16,17
Financial Institution 77.1
847 Maestrale Projects (Holding) S.A. Luxembourg 11 Financial Institution 49.7848 MCT Südafrika 3 GmbH & Co. KG i.I. Hamburg 14 Other Enterprise 38.4849 Metro plus Grundstücks-Vermietungsgesellschaft mbH Duesseldorf 11 Financial Institution 40.0850 MT "CAPE BEALE" Tankschiffahrts GmbH & Co. KG Hamburg 14 Other Enterprise 32.2851 MT "KING DANIEL" Tankschiffahrts GmbH & Co. KG Hamburg 14 Other Enterprise 30.1852 MT "KING DOUGLAS" Tankschiffahrts GmbH & Co. KG Hamburg 14 Other Enterprise 30.1853 MT "KING EDWARD" Tankschiffahrts GmbH & Co. KG Hamburg 14 Other Enterprise 35.3854 MT "KING ERIC" Tankschiffahrts GmbH & Co. KG Hamburg 14 Other Enterprise 34.5855 NBG Grundstücks-Vermietungsgesellschaft mbH Duesseldorf 11 Financial Institution 50.0856 NEUNTE PAXAS Treuhand- und Beteiligungsgesellschaft mbH Duesseldorf 11 Other Enterprise 50.0857 NEUNZEHNTE PAXAS Treuhand- und Beteiligungsgesellschaft mbH Duesseldorf 11 Other Enterprise 50.0858 New Energy Biomasse Hellas GmbH i.L. Duesseldorf 11 Other Enterprise 50.0859 Nexus Infrastruktur Beteiligungsgesellschaft mbH Duesseldorf 11 Financial Institution 50.0860 NOFA Grundstücks-Vermietungsgesellschaft mbH Duesseldorf 11 Financial Institution 50.0861 OPPENHEIM Buy Out GmbH & Co. KG i.L. Cologne 3, 5,
12 Financial Institution 27.7
862 PADEM Grundstücks-Vermietungsgesellschaft mbH Duesseldorf 11 Financial Institution 50.0863 PAGUS Beteiligungsgesellschaft mbH Duesseldorf 11 Financial Institution 50.0864 PALDO Grundstücks-Vermietungsgesellschaft mbH Duesseldorf 11 Financial Institution 50.0865 PANIS Grundstücks-Vermietungsgesellschaft mbH i.I. Duesseldorf 11 Financial Institution 50.0866 PANTUR Grundstücks-Vermietungsgesellschaft mbH Duesseldorf 11 Financial Institution 50.0867 PAXAS Treuhand- und Beteiligungsgesellschaft mbH Duesseldorf 11 Other Enterprise 50.0868 PEDIS Grundstücks-Vermietungsgesellschaft mbH Duesseldorf 11 Financial Institution 50.0869 PEDUM Beteiligungsgesellschaft mbH Duesseldorf 11 Financial Institution 50.0870 PENDIS Grundstücks-Vermietungsgesellschaft mbH Duesseldorf 11 Financial Institution 50.0871 PENTUM Beteiligungsgesellschaft mbH Duesseldorf 11 Other Enterprise 50.0872 PERGOS Beteiligungsgesellschaft mbH Duesseldorf 11 Financial Institution 50.0873 PERGUM Grundstücks-Vermietungsgesellschaft mbH Duesseldorf 11 Financial Institution 50.0874 PERLIT Mobilien-Vermietungsgesellschaft mbH Duesseldorf 11 Financial Institution 50.0875 PERLU Grundstücks-Vermietungsgesellschaft mbH Duesseldorf 11 Financial Institution 50.0876 PERNIO Grundstücks-Vermietungsgesellschaft mbH Duesseldorf 11 Financial Institution 50.0877 PERXIS Beteiligungsgesellschaft mbH Duesseldorf 11 Financial Institution 50.0878 PETA Grundstücks-Vermietungsgesellschaft mbH Duesseldorf 11 Financial Institution 50.0879 PONTUS Grundstücks-Vermietungsgesellschaft mbH Duesseldorf 11 Financial Institution 50.0880 PRADUM Beteiligungsgesellschaft mbH Duesseldorf 11 Financial Institution 50.0881 PRASEM Beteiligungsgesellschaft mbH Duesseldorf 11 Financial Institution 50.0882 PRATES Grundstücks-Vermietungsgesellschaft mbH Schoenefeld 11 Financial Institution 50.0883 PRISON Grundstücks-Vermietungsgesellschaft mbH Schoenefeld 11 Financial Institution 50.0884 Private Equity Invest Beteiligungs GmbH Duesseldorf 11 Financial Institution 50.0885 Private Equity Life Sciences Beteiligungsgesellschaft mbH Duesseldorf 11 Financial Institution 50.0886 PUDU Grundstücks-Vermietungsgesellschaft mbH Duesseldorf 11 Financial Institution 50.0887 PUKU Grundstücks-Vermietungsgesellschaft mbH Duesseldorf 11 Financial Institution 50.0888 PURIM Grundstücks-Vermietungsgesellschaft mbH Duesseldorf 11 Financial Institution 50.0889 QUANTIS Grundstücks-Vermietungsgesellschaft mbH Schoenefeld 11 Financial Institution 50.0890 QUELLUM Grundstücks-Vermietungsgesellschaft mbH Duesseldorf 11 Financial Institution 50.0891 QUOTAS Grundstücks-Vermietungsgesellschaft mbH Duesseldorf 11 Financial Institution 50.0892 SABIS Grundstücks-Vermietungsgesellschaft mbH Duesseldorf 11 Financial Institution 50.0893 SALIX Grundstücks-Vermietungsgesellschaft mbH Duesseldorf 11 Financial Institution 50.0894 SALUS Grundstücks-Vermietungsgesellschaft mbH Duesseldorf 11 Financial Institution 50.0895 SALUS Grundstücks-Vermietungsgesellschaft mbH & Co. Objekt Dresden KG Duesseldorf 12 Financial Institution 58.5896 SANCTOR Grundstücks-Vermietungsgesellschaft mbH Duesseldorf 11 Financial Institution 50.0897 SANDIX Grundstücks-Vermietungsgesellschaft mbH Duesseldorf 11 Financial Institution 50.0898 SANO Grundstücks-Vermietungsgesellschaft mbH Duesseldorf 11 Financial Institution 50.0899 SARIO Grundstücks-Vermietungsgesellschaft mbH Duesseldorf 11 Financial Institution 50.0900 SATINA Mobilien-Vermietungsgesellschaft mbH Duesseldorf 11 Financial Institution 50.0901 SCANDO Grundstücks-Vermietungsgesellschaft mbH Duesseldorf 11 Financial Institution 50.0902 SCHEDA Grundstücks-Vermietungsgesellschaft mbH i.L. Duesseldorf 11 Financial Institution 50.0903 Schumacher Beteiligungsgesellschaft mbH Duesseldorf 11 Financial Institution 33.2904 SCITOR Grundstücks-Vermietungsgesellschaft mbH Duesseldorf 11 Financial Institution 50.0905 SCITOR Grundstücks-Vermietungsgesellschaft mbH & Co. Objekt
Heiligenstadt KG i.L. Duesseldorf 12, 18 Financial Institution 71.1
906 SCUDO Grundstücks-Vermietungsgesellschaft mbH Duesseldorf 12 Financial Institution 100.0907 SECHSTE Fonds-Beteiligungsgesellschaft mbH Duesseldorf 11 Financial Institution 50.0908 SECHSTE PAXAS Treuhand- und Beteiligungsgesellschaft mbH Duesseldorf 11 Other Enterprise 50.0909 SECHZEHNTE PAXAS Treuhand- und Beteiligungsgesellschaft mbH Duesseldorf 11 Other Enterprise 50.0

380
Deutsche Bank 2 – Consolidated Financial StatementsAnnual Report 2018
SerialNo. Name of company
Domicile ofcompany
Foot-note Nature of activity
Shareof
Capital
in %910 SEDO Grundstücks-Vermietungsgesellschaft mbH Duesseldorf 12 Financial Institution 100.0911 SEGES Grundstücks-Vermietungsgesellschaft mbH Duesseldorf 11 Financial Institution 50.0912 SEGU Grundstücks-Vermietungsgesellschaft mbH Duesseldorf 11 Financial Institution 50.0913 SELEKTA Grundstücksverwaltungsgesellschaft mbH Duesseldorf 11 Financial Institution 50.0914 SENA Grundstücks-Vermietungsgesellschaft mbH Duesseldorf 11 Financial Institution 50.0915 SENA Grundstücks-Vermietungsgesellschaft mbH & Co. Objekt Fehrenbach
KG i.L. Duesseldorf 12 Other Enterprise 94.7
916 SENA Grundstücks-Vermietungsgesellschaft mbH & Co. Objekt Kamenz KG Duesseldorf 9, 11 Financial Institution 100.0917 SERICA Grundstücks-Vermietungsgesellschaft mbH Duesseldorf 11 Financial Institution 50.0918 SIDA Grundstücks-Vermietungsgesellschaft mbH Duesseldorf 11 Financial Institution 50.0919 SIEBTE PAXAS Treuhand- und Beteiligungsgesellschaft mbH Duesseldorf 11 Other Enterprise 50.0920 SIEBZEHNTE PAXAS Treuhand- und Beteiligungsgesellschaft mbH Duesseldorf 11 Other Enterprise 50.0921 SIFA Grundstücks-Vermietungsgesellschaft mbH Duesseldorf 12 Financial Institution 100.0922 SILANUS Grundstücks-Vermietungsgesellschaft mbH Duesseldorf 11 Financial Institution 50.0923 SILEX Grundstücks-Vermietungsgesellschaft mbH Duesseldorf 11 Financial Institution 50.0924 SILEX Grundstücks-Vermietungsgesellschaft mbH & Co. Objekt Berlin KG i.L. Duesseldorf 1, 12 Financial Institution 83.8925 SILIGO Mobilien-Vermietungsgesellschaft mbH Duesseldorf 11 Financial Institution 50.0926 SILUR Grundstücks-Vermietungsgesellschaft mbH Duesseldorf 11 Financial Institution 50.0927 SIMILA Grundstücks-Vermietungsgesellschaft mbH Duesseldorf 11 Financial Institution 50.0928 SOLATOR Grundstücks-Vermietungsgesellschaft mbH Duesseldorf 11 Financial Institution 50.0929 SOLON Grundstücks-Vermietungsgesellschaft mbH Schoenefeld 11 Financial Institution 50.0930 SOLON Grundstücks-Vermietungsgesellschaft mbH & Co. Objekt
Heizkraftwerk Halle KG i.L. Halle/Saale 11 Other Enterprise 30.5
931 SOLUM Grundstücks-Vermietungsgesellschaft mbH Duesseldorf 11 Financial Institution 50.0932 SOMA Grundstücks-Vermietungsgesellschaft mbH Duesseldorf 11 Financial Institution 50.0933 SOREX Grundstücks-Vermietungsgesellschaft mbH Duesseldorf 11 Financial Institution 50.0934 SOSPITA Grundstücks-Vermietungsgesellschaft mbH Duesseldorf 11 Financial Institution 50.0935 SPINO Grundstücks-Vermietungsgesellschaft mbH Duesseldorf 12 Other Enterprise 100.0936 SPLENDOR Grundstücks-Vermietungsgesellschaft mbH Schoenefeld 11 Financial Institution 50.0937 STABLON Grundstücks-Vermietungsgesellschaft mbH i.L. Duesseldorf 12 Financial Institution 100.0938 STAGIRA Grundstücks-Vermietungsgesellschaft mbH Duesseldorf 11 Financial Institution 50.0939 STATOR Heizkraftwerk Frankfurt (Oder) Beteiligungsgesellschaft mbH Schoenefeld 12 Financial Institution 100.0940 SUBLICA Grundstücks-Vermietungsgesellschaft mbH Duesseldorf 11 Financial Institution 50.0941 SUBU Mobilien-Vermietungsgesellschaft mbH Duesseldorf 11 Financial Institution 50.0942 SULPUR Grundstücks-Vermietungsgesellschaft mbH Schoenefeld 11 Financial Institution 50.0943 SUPERA Grundstücks-Vermietungsgesellschaft mbH Duesseldorf 11 Financial Institution 50.0944 SUPLION Beteiligungsgesellschaft mbH Duesseldorf 11 Financial Institution 50.0945 SUSA Mobilien-Vermietungsgesellschaft mbH Duesseldorf 11 Financial Institution 50.0946 SUSIK Grundstücks-Vermietungsgesellschaft mbH Duesseldorf 11 Financial Institution 50.0947 TABA Grundstücks-Vermietungsgesellschaft mbH Schoenefeld 11 Financial Institution 50.0948 TACET Grundstücks-Vermietungsgesellschaft mbH Duesseldorf 11 Financial Institution 50.0949 TAGO Grundstücks-Vermietungsgesellschaft mbH Duesseldorf 11 Financial Institution 50.0950 TAGUS Beteiligungsgesellschaft mbH Duesseldorf 11 Financial Institution 50.0951 TAKIR Grundstücks-Vermietungsgesellschaft mbH Duesseldorf 12 Financial Institution 100.0952 TEBOR Grundstücks-Vermietungsgesellschaft mbH Duesseldorf 11 Financial Institution 50.0953 TEMATIS Grundstücks-Vermietungsgesellschaft mbH i.L. Duesseldorf 12 Financial Institution 100.0954 TERRUS Grundstücks-Vermietungsgesellschaft mbH Duesseldorf 12 Financial Institution 100.0955 TESATUR Beteiligungsgesellschaft mbH Duesseldorf 11 Financial Institution 50.0956 TESATUR Beteiligungsgesellschaft mbH & Co. Objekt Halle I KG Duesseldorf 1, 12,
19 Financial Institution 100.0
957 TESATUR Beteiligungsgesellschaft mbH & Co. Objekt Nordhausen I KG Duesseldorf 1, 12 Financial Institution 100.0958 TIEDO Grundstücks-Vermietungsgesellschaft mbH Duesseldorf 11 Financial Institution 50.0959 TIEDO Grundstücks-Vermietungsgesellschaft mbH & Co. Objekt Lager Nord
KG Duesseldorf 11 Financial Institution 25.0
960 TOSSA Grundstücks-Vermietungsgesellschaft mbH Duesseldorf 12 Financial Institution 100.0961 TRAGO Grundstücks-Vermietungsgesellschaft mbH Duesseldorf 11 Financial Institution 50.0962 TREMA Grundstücks-Vermietungsgesellschaft mbH Berlin 11 Financial Institution 50.0963 TRENTO Grundstücks-Vermietungsgesellschaft mbH Duesseldorf 11 Financial Institution 50.0964 TRINTO Beteiligungsgesellschaft mbH Schoenefeld 11 Financial Institution 50.0965 TRIPLA Grundstücks-Vermietungsgesellschaft mbH Duesseldorf 12 Financial Institution 100.0966 TUDO Grundstücks-Vermietungsgesellschaft mbH Duesseldorf 11 Financial Institution 50.0967 TUGA Grundstücks-Vermietungsgesellschaft mbH Duesseldorf 11 Financial Institution 50.0968 TYRAS Beteiligungsgesellschaft mbH Duesseldorf 11 Financial Institution 50.0969 VARIS Beteiligungsgesellschaft mbH Duesseldorf 11 Financial Institution 50.0970 VCL Lease S.à r.l. Luxembourg 9, 11 Other Enterprise 95.0971 VIERTE Fonds-Beteiligungsgesellschaft mbH Duesseldorf 11 Financial Institution 50.0972 VIERTE PAXAS Treuhand- und Beteiligungsgesellschaft mbH Duesseldorf 11 Other Enterprise 50.0973 VIERUNDZWANZIGSTE PAXAS Treuhand- und Beteiligungsgesellschaft mbH Duesseldorf 11 Other Enterprise 50.0

381
Deutsche Bank Additional NotesAnnual Report 2018 Shareholdings
SerialNo. Name of company
Domicile ofcompany
Foot-note Nature of activity
Shareof
Capital
in %974 VIERZEHNTE PAXAS Treuhand- und Beteiligungsgesellschaft mbH Duesseldorf 11 Other Enterprise 50.0975 Wohnungs-Verwaltungsgesellschaft Moers mbH Duesseldorf 11 Financial Institution 50.0976 Wohnungsgesellschaft HEGEMAG GmbH i.L. Darmstadt 11 Financial Institution 50.0977 XARUS Grundstücks-Vermietungsgesellschaft mbH Schoenefeld 11 Financial Institution 50.0978 XELLUM Grundstücks-Vermietungsgesellschaft mbH Duesseldorf 11 Financial Institution 50.0979 XENTIS Grundstücks-Vermietungsgesellschaft mbH Duesseldorf 11 Financial Institution 50.0980 XERA Grundstücks-Vermietungsgesellschaft mbH Duesseldorf 11 Financial Institution 50.0981 ZABATUS Grundstücks-Vermietungsgesellschaft mbH Duesseldorf 11 Financial Institution 50.0982 ZAKATUR Grundstücks-Vermietungsgesellschaft mbH Duesseldorf 11 Other Enterprise 50.0983 ZARGUS Grundstücks-Vermietungsgesellschaft mbH Duesseldorf 11 Financial Institution 50.0984 ZEA Beteiligungsgesellschaft mbH Schoenefeld 11 Financial Institution 25.0985 ZEHNTE PAXAS Treuhand- und Beteiligungsgesellschaft mbH Duesseldorf 11 Other Enterprise 50.0986 ZENO Grundstücks-Vermietungsgesellschaft mbH Duesseldorf 11 Financial Institution 50.0987 ZEPTOS Grundstücks-Vermietungsgesellschaft mbH Duesseldorf 11 Financial Institution 50.0988 ZEREVIS Grundstücks-Vermietungsgesellschaft mbH Duesseldorf 11 Financial Institution 50.0989 ZERGUM Grundstücks-Vermietungsgesellschaft mbH Duesseldorf 11 Financial Institution 50.0990 ZIDES Grundstücks-Vermietungsgesellschaft mbH Schoenefeld 11 Financial Institution 50.0991 ZIMBEL Grundstücks-Vermietungsgesellschaft mbH Schoenefeld 11 Financial Institution 50.0992 ZINUS Grundstücks-Vermietungsgesellschaft mbH Schoenefeld 11 Financial Institution 50.0993 ZIRAS Grundstücks-Vermietungsgesellschaft mbH Schoenefeld 11 Financial Institution 50.0994 ZITON Grundstücks-Vermietungsgesellschaft mbH Duesseldorf 11 Financial Institution 50.0995 ZITUS Grundstücks-Vermietungsgesellschaft mbH Schoenefeld 11 Financial Institution 50.0996 ZONTUM Grundstücks-Vermietungsgesellschaft mbH Duesseldorf 11 Financial Institution 50.0997 ZORUS Grundstücks-Vermietungsgesellschaft mbH Duesseldorf 11 Financial Institution 50.0998 ZWANZIGSTE PAXAS Treuhand- und Beteiligungsgesellschaft mbH Duesseldorf 11 Other Enterprise 50.0999 ZWEITE Fonds-Beteiligungsgesellschaft mbH Duesseldorf 11 Financial Institution 50.01000 ZWEITE PAXAS Treuhand- und Beteiligungsgesellschaft mbH Duesseldorf 11 Other Enterprise 50.01001 ZWEIUNDZWANZIGSTE PAXAS Treuhand- und Beteiligungsgesellschaft
mbH Duesseldorf 11 Other Enterprise 50.0
1002 ZWÖLFTE PAXAS Treuhand- und Beteiligungsgesellschaft mbH Duesseldorf 11 Other Enterprise 50.01003 ZYLUM Beteiligungsgesellschaft mbH Schoenefeld 11 Financial Institution 25.0

382
Deutsche Bank 2 – Consolidated Financial StatementsAnnual Report 2018
Holdings in large corporations, where the holding exceeds 5 % of the voting rights
SerialNo. Name of company
Domicile ofcompany
Foot-note Nature of activity
Shareof
Capital
in %1004 ABRAAJ Holdings (in provisional liquidation) George Town Financial Institution 8.81005 BBB Bürgschaftsbank zu Berlin-Brandenburg GmbH Berlin Financial Institution 5.61006 BÜRGSCHAFTSBANK BRANDENBURG GmbH Potsdam Financial Institution 8.51007 Bürgschaftsbank Mecklenburg-Vorpommern GmbH Schwerin Financial Institution 8.41008 Bürgschaftsbank Sachsen GmbH Dresden Financial Institution 6.31009 Bürgschaftsbank Sachsen-Anhalt GmbH Magdeburg Financial Institution 8.21010 Bürgschaftsbank Schleswig-Holstein Gesellschaft mit beschränkter Haftung Kiel Financial Institution 5.61011 Bürgschaftsbank Thüringen GmbH Erfurt Financial Institution 8.71012 Bürgschaftsgemeinschaft Hamburg GmbH Hamburg Financial Institution 8.71013 China Polymetallic Mining Limited George Town Other Enterprise 5.71014 MTS S.p.A. Rome Other Enterprise 5.01015 Prader Bank S.p.A. Bolzano Credit Institution 9.01016 Private Export Funding Corporation Wilmington Financial Institution 6.01017 PT Trikomsel OKE Tbk Jakarta Other Enterprise 12.01018 Saarländische Investitionskreditbank Aktiengesellschaft Saarbruecken Credit Institution 11.81019 Silver Creek Low Vol Strategies, Ltd. George Town Securities Trading Firm 10.51020 Yensai.com Co., Ltd. Tokyo Investment Firm 7.1

383
Deutsche Bank ConfirmationsAnnual Report 2018 Report on the Audit of the Consolidated Financial Statements and of the Group Management Report
Confirmations
Independent Auditor’s ReportTo Deutsche Bank Aktiengesellschaft, Frankfurt am Main
Report on the Audit of the Consolidated Financial Statementsand of the Group Management Report
Opinions
We have audited the consolidated financial statements of Deutsche Bank Aktiengesellschaft, Frankfurt am Main, and itssubsidiaries (the Group), which comprise the consolidated balance sheet as at December 31, 2018, and the consolidatedstatement of income, consolidated statement of comprehensive income, consolidated statement of changes in equity andconsolidated statement of cash flows for the financial year from January 1 to December 31, 2018, and notes to the consolidatedfinancial statements, including a summary of significant accounting policies. In addition, we have audited the groupmanagement report of Deutsche Bank Aktiengesellschaft, Frankfurt am Main, for the financial year from January 1 toDecember 31, 2018.
In our opinion, on the basis of the knowledge obtained in the audit,
– the accompanying consolidated financial statements comply, in all material respects, with IFRSs as adopted by the EU,and the additional requirements of German commercial law pursuant to Section 315e (1) HGB [Handelsgesetzbuch –German Commercial Code] and, in compliance with these requirements, give a true and fair view of the assets, liabilities,and financial position of the Group as at December 31, 2018, and of its financial performance for the financial year fromJanuary 1 to December 31, 2018, and
– the accompanying group management report as a whole provides an appropriate view of the Group’s position. In all materialrespects, this group management report is consistent with the consolidated financial statements, complies with Germanlegal requirements and appropriately presents the opportunities and risks of future development.
Pursuant to Section 322(3) sentence 1 HGB, we declare that our audit has not led to any reservations relating to the legalcompliance of the consolidated financial statements and of the group management report.
Basis for the Opinions
We conducted our audit of the consolidated financial statements and of the group management report in accordance withSection 317 HGB and the EU Audit Regulation No 537/2014 (referred to subsequently as “EU Audit Regulation”) and incompliance with German Generally Accepted Standards for Financial Statement Audits promulgated by the Institut derWirtschaftsprüfer [Institute of Public Auditors in Germany] (IDW). Our responsibilities under those requirements and principlesare further described in the “Auditor's Responsibilities for the Audit of the Consolidated Financial Statements and of the GroupManagement Report” section of our auditor’s report. We are independent of the group entities in accordance with therequirements of European law and German commercial and professional law, and we have fulfilled our other Germanprofessional responsibilities in accordance with these requirements. In addition, in accordance with Article 10 (2) point (f) ofthe EU Audit Regulation, we declare that we have not provided non-audit services prohibited under Article 5 (1) of the EUAudit Regulation. We believe that the evidence we have obtained is sufficient and appropriate to provide a basis for ouropinions on the consolidated financial statements and on the group management report.
Key Audit Matters in the Audit of the Consolidated Financial Statements
Key audit matters are those matters that, in our professional judgment, were of most significance in our audit of theconsolidated financial statements for the financial year from January 1 to December 31, 2018. These matters were addressedin the context of our audit of the consolidated financial statements as a whole, and in forming our opinion thereon, and we donot provide a separate opinion on these matters.

384
Deutsche Bank 2 – Consolidated Financial StatementsAnnual Report 2018
Unobservable Inputs used for the Valuation of Level 3 Financial Instruments
With regard to significant accounting policies and critical accounting estimates, we refer to Note 1 of the consolidated financialstatements (sections “Financial Assets and Liabilities at Fair Value through Profit or Loss” and “Financial Assets at Fair Valuethrough Other Comprehensive Income”). For information on Level 3 financial instruments, we refer to Note 13 of theconsolidated financial statements.
The Financial Statement RiskLevel 3 financial instruments consist of financial assets and liabilities. As of the reporting date, the Group reports Level 3financial assets held at fair value in the amount of EUR 24.6bn, representing 3.9 % of the financial assets at fair value and1.8 % of total assets. Level 3 financial liabilities amount to EUR 7.7bn, representing 1.7 % of the financial liabilities at fair valueand 0.5 % of total liabilities, respectively.
By definition, market prices are not observable for the valuation of these financial instruments. The fair values are thereforeto be determined on the basis of accepted valuation methods. These valuation methods may consist of complex models andcan include assumptions and estimates over unobservable inputs which require judgment.
The financial statement risk arises particularly with respect to complex valuation models or unobservable valuation parametersthat are inappropriately used in determining fair values of Level 3 financial instruments.
Our Audit ApproachTo determine our audit approach, we initially evaluated the general suitability and the potential for misstatements in modelsand parameters including unobservable inputs and, where applicable, associated valuation adjustments used for the valuationof Level 3 financial instruments.
Based on our risk assessment, we established an audit approach including control and substantive testing.
In order to assess the adequacy of the Group’s internal controls regarding the valuation of financial instruments anddetermination of unobservable inputs therein we evaluated the design and implementation and tested operating effectivenessof key controls. We also made use of KPMG-internal valuation specialists as needed. Audit procedures included but were notlimited to controls over:
– monthly independent price verification procedures performed by the Group to assure the adequacy of input parametersused for Level 3 financial instruments,
– model validation of valuation models used by the Group including respective governance and– calculation and recording of valuation adjustments for credit risk, funding cost, and others required by accounting standards
to determine fair values.
Where we had findings regarding design or effectiveness of controls, we tested additional compensating controls. Weconsidered our audit results when designing nature and scope of additional substantive audit procedures.
We performed substantive procedures amongst others on a risk-based sample of Level 3 financial instruments. These includein particular:
– performance of independent price verification, with usage of KPMG-internal valuation specialists on selected individualtransactions of financial instruments,
– independent recalculation of selected valuation adjustments and– performance of procedures to determine adequacy of models used, including key inputs and their usage in the respective
pricing models.
Our ObservationsBased on the results of our key controls testing and substantive audit procedures, we consider models and related parametersused for valuing Level 3 financial instruments to be appropriate.
385
Deutsche Bank ConfirmationsAnnual Report 2018 Report on the Audit of the Consolidated Financial Statements and of the Group Management Report
Determination of Probabilities of Default and Loss Given Default in Stage 3 of the homogenousPortfolio under the Accounting Standard IFRS 9
For a qualitative and quantitative description of the significant accounting policies and estimates, including the implications ofthe first-time adoption of IFRS 9, we refer to Note 2 in the consolidated financial statements (section “Recently AdoptedAccounting Standards”). For information on the allowance under IFRS 9, we refer to Note 21 of the consolidated financialstatements.
The Financial Statement RiskDeutsche Bank applied the new accounting standard "IFRS 9 - Financial Instruments" for the first time at the beginning of thefinancial year 2018 in accordance with IFRS requirements. One of the main new aspects of IFRS 9 is that for financial assetsnot measured at fair value, irrevocable loan commitments and guarantees, the provision for loan losses is calculated accordingto expected credit losses instead of incurred credit losses. The calculation reflects an expected credit loss of one year or,depending on the respective stage allocation of the loan, a lifetime expected credit loss. For this purposes, financial assetsare allocated to either stage one, two or three.
The calculation of the expected credit loss in Stage 1 is based on an the probability of default within the next 12 months. Ifthere is a significant increase in credit risk since initial recognition and, in consequence, the loan has been transferred to Stage2, the probability of default is determined based on the remaining lifetime of the financial asset. To determine the allowancefor Stage 3 (credit-impaired loans), the Bank distinguishes between the homogeneous and the non-homogeneous portfolio.The allowance for loans in the homogeneous portfolio is calculated using a time-dependent loss given default. Within the non-homogeneous portfolio, the allowance is calculated using the DCF method.
As of December 31st 2018 Deutsche Bank reports an allowance for credit losses of financial assets in the amount of EUR 4.3bn, thereof for loans classified as Stage 1 EUR 0.5 bn, Stage 2 EUR 0.5 bn and Stage 3 EUR 3.3 bn. The net increase to thecredit loss provisions in the 2018 financial year amounted to EUR 507 mn. Thereof for Stage 1 EUR 66 mn, Stage 2 EUR 78mn and for Stage 3 EUR 362 mn for financial assets.
The financial statement risk arises particularly from the estimation of the probabilities of default for the various stages notbeing appropriate, as these contain assumptions and are used as an essential or central element for measuring riskprovisioning (e.g. 12-month probability of default, lifetime probability of default, criterion for staging). The main estimationuncertainties are based in particular on the qualitative assessment criteria on the borrower to determine the rating. In addition,significant estimation uncertainties arise with regard to the macroeconomic factors to be used to determine the probabilitiesof default.
Furthermore a financial statement risk arises from an inappropriate calculation of the time-dependent loss given default in thehomogenous portfolio stage 3. Under IFRS 9, essentially this is determined using the "Loss Given Default" parameter, whichis derived from the internal liquidation status. In this respect, there arises the risk that not all relevant risk factors are properlyderived.
Our Audit ApproachBased on our risk assessment and our evaluation of the risk of error, we established an audit approach including control andsubstantive testing as a basis for our audit opinion. Accordingly, we have performed the following audit procedures, amongstothers:
First, we assessed the adequacy of the models used to determine a borrower's rating, their transition into a 12-monthprobability of default and adjustment for the remaining lifetime of the loan. For this purpose, we have involved KPMG's internalmodelling specialists. In the next step, we assessed the adequacy and appropriateness of information for evaluating the credit-worthiness of a borrower as well as of the process to incorporate this information into the models.
In this context, we have obtained a comprehensive insight into the internal control system to ensure that the informationrelevant to the models is properly determined and recorded. We put our main focus on the determination of the probabilitiesof default as well as the estimation of macroeconomic variables and their modelling to include them into the probabilities ofdefault.
Furthermore we have assessed the modelling and appropriateness of the process for determining the Stage 3 loss givendefault for the homogenous portfolio.

386
Deutsche Bank 2 – Consolidated Financial StatementsAnnual Report 2018
In our controls testing, we evaluated design, implementation and operating effectiveness of key controls. We performed thefollowing audit procedures as part of our controls testing including, but not limited to:
– The approval of policies and key methodological documents for the allowance calculation,– The determination and recording of probabilities of default and the validation of the models used to determine the
probabilities of default,– The estimation, review and approval of time-dependent migration matrices for the calculation of time-dependent
probabilities of default,– The approval of the selection of relevant macroeconomic factors as well as the review of their appropriateness,– The accuracy of the calculation of the Loss Given Default for the homogenous portfolio in stage 3,– The annual validation of the models used to determine the Loss Given Default in the homogenous portfolio.
For the IT systems and individual data processing systems used in this context, we have verified the effectiveness ofapplication controls with the involvement of our IT specialists.
In addition, we performed substantive audit procedures. For a sample of transactions, chosen consciously from a materialityand risk point of view, we have assessed whether the assumptions on credit quality used in the rating models to determinethe probabilities of default were derived appropriately from internal information and are consistent with externally availableinformation. To audit the adjustment of those probabilities of default to the remaining lifetime we assessed the appropriatedetermination of the corresponding migration matrices. In addition, we reviewed the determination of macroeconomic factorsand their application within the model to determine the allowance for loan losses.
For the time-dependent LGDs in Stage 3 of the homogenous portfolio we have reconstructed the calculation based on anindependent recalculation and checked the correct allocation to individual transactions for a sample of elements that wasselected consciously from a materiality and risk point of view.
Finally, on the basis of a conscious, risk and materiality based sample, we checked the appropriateness of the regularvalidation of the models relevant for determining the allowance for loan losses.
Our ObservationsThe probabilities of default as well as the loss given default in Stage 3 of the homogeneous portfolio used to determine theallowance for losses on financial assets under IFRS 9 have been appropriately derived.
Recognition and Measurement of Deferred Tax Assets
For a description of the significant accounting policies and critical accounting estimates as well as underlying assumptions forthe recognition and measurement of deferred tax assets, we refer to Note 1 of the consolidated financial statements“Significant Accounting Policies and Critical Accounting Estimates” (section “Income Taxes”). For information on deferred taxassets, we refer to Note 36 of the consolidated financial statements.
The Financial Statement RiskThe consolidated financial statements contain deferred tax assets of net EUR 6.7bn.
Recognition and measurement of deferred tax assets contain judgment and besides objective factors also numerous estimatesregarding future taxable profit and the usability of unused tax losses and tax credits.
The financial statement risk arises particularly from future utilization of the deferred tax assets being estimated inappropriately.The estimation of future utilization depends on future taxable profit potential based on the business plan, that is subjected touncertainties and taking into account the expected development of key value-determining assumptions and parametersincluded therein. These include in particular assumptions on the development of pre-tax earnings, the influence of potentialspecial items, and permanent effects which determine the taxable profit available in the future. Such estimates must alsoconsider current political and economic developments (such as the implementation of the referendum on the withdrawal of theUnited Kingdom from the European Union) and jurisdiction specific tax considerations.
Our Audit ApproachWe conducted a risk assessment to gain an understanding of the applicable tax laws and regulations relevant to the Group.Based on that, we performed both tests of related internal key controls and substantive audit procedures with the assistanceof KPMG-internal tax specialists. As part of our audit, we examined, amongst others, the test of design, the implementationand operating effectiveness of internal controls with respect to recognition of deferred tax assets in the Group.

387
Deutsche Bank ConfirmationsAnnual Report 2018 Report on the Audit of the Consolidated Financial Statements and of the Group Management Report
Furthermore, we performed substantive audit procedures amongst others for a risk-based sample of deferred tax assets indifferent countries. This included, but was not limited to:
– the assessment of the Group's methodology used for the recognition and measurement of deferred tax assets inaccordance with IAS 12,
– assessment of the appropriateness of parameters applied to the business plans, including sub-plans for relevant countrieswhere appropriate. In doing so, we scrutinized the appropriateness of the planning parameters applied that are relevant tothe Group's significant subdivisions by considering potential positive and negative indicators regarding recoverability oroccurrence of planning parameters and assumptions, and
– review of the reconciliation from pre-tax income to the planned taxable profit for certain countries.
Our ObservationsThe utilization of the deferred tax assets is assessed to be appropriate on the basis of future taxable income potential on thebasis of the business plan, taking into account the expected development of significant value-determining assumptions andparameters contained therein.
IT Access Management in the financial reporting process
For a description of internal controls over the financial reporting process including IT access management controls, we referto the group management report in section “Internal Control over Financial Reporting”.
The Financial Statement RiskThe financial reporting process is highly dependent on information technology and the completeness and accuracy ofelectronic data due to the size and the complexity of the Group. The inappropriate granting of or ineffective monitoring ofaccess rights to IT systems therefore presents a risk to the accuracy of financial reporting. This risk applies in particular tosystems with access rights which do not correspond to a “need to know” or “need to have” principle, i.e. access is grantedsolely based on the requirements of the role and no further authorization requirement is in place, or the segregation of dutiesprinciple, i.e. between IT and specialist departments as well as between development and application operations.
Unauthorized or extensive access rights and a lack of segregation of duties cause a risk of intended or unintendedmanipulation of data that could have a material effect on the completeness and accuracy of the financial statements. Therefore,the design of and compliance with respective precautions is a significant matter for our audit.
Our Audit ApproachWe obtained an understanding of the Group’s business IT related control environment. Furthermore we conducted a riskassessment and identified IT applications, databases and operating systems that are relevant to our audit.
For relevant IT-dependent controls within the financial reporting process (so-called IT application controls) we identifiedsupporting general IT controls and evaluated their design, implementation, and operating effectiveness. We tested key controlsparticularly in the area of access protection and linkage of such controls to the completeness and accuracy of financialreporting. Our audit procedures included, but were not limited to, the following:
– Tests of controls regarding initial access granted to IT systems for new employees or employees changing roles, whetherthat access was subject to appropriate screening and if it was approved by an authorized person in line with the role basedauthorization concept.
– Test of controls regarding removal of employee or former employee access rights within an appropriate period of time afterhaving changed roles or leaving the company.
– Test of controls regarding the appropriateness of system access rights for privileged or administrative authorizations(superuser) being subject to a restrictive authorization assignment procedure and the regular review thereof.
Moreover, we conducted specific testing procedures in the area of password protection, security settings regardingmodifications for applications, databases, and operating systems, the segregation of specialist department and IT users andthe segregation of employees responsible for program development and those responsible for system operations. Where wehad findings regarding design or effectiveness of controls, we tested additional compensating controls for other compensatingevidence.
Considering the results of our control tests, we decided on the nature and scope of further substantive audit procedures to beperformed. Particularly, where we identified user authorizations not being withdrawn on time after leaving the Bank, weperformed an inspection of the activity log of individual users to determine whether unauthorized activities had occurred thatwould materially affect the completeness and accuracy of financial information processed.

388
Deutsche Bank 2 – Consolidated Financial StatementsAnnual Report 2018
Also, by tests of detail we assessed if program developers had approval rights in the modification process and whether theywere able to carry out any modifications in the productive versions of applications, databases, and operating systems to assessif these responsibilities were functionally segregated. We have also analyzed the segregation of duties on critical trading andpayment systems in order to assess whether the segregation of duties between front and back offices has been adhered to.
Our ObservationsBased on the results of our key controls testing and substantive audit procedures, we consider the IT access management inthe financial reporting process to generally address the requirements for completeness and accuracy of financial reportingrelevant data.
Other Information
Management is responsible for the other information. The other information comprises of the remaining parts in the annualreport, with the exception of the audited consolidated financial statements and the group management report and our auditor’sreport.
Our opinions on the consolidated financial statements and the group management report do not cover the other informationand consequently we do not express an opinion or any other form of assurance conclusion thereon.
In connection with our audit, our responsibility is to read the other information and, in so doing, to consider whether the otherinformation
– is materially inconsistent with the consolidated financial statements, with the group management report, or our knowledgeobtained in the audit, or
– otherwise appears to be materially misstated.
Responsibilities of Management and the Supervisory Board for the ConsolidatedFinancial Statements and the Group Management Report
Management is responsible for the preparation of the consolidated financial statements that comply, in all material respects,with IFRSs as adopted by the EU and the additional requirements of German commercial law pursuant to Section 315e (1)HGB and that the consolidated financial statements, in compliance with these requirements, give a true and fair view of theassets, liabilities, financial position, and financial performance of the Group. In addition, management is responsible for suchinternal control as they have determined necessary to enable the preparation of consolidated financial statements that arefree from material misstatement, whether due to fraud or error.
In preparing the consolidated financial statements, management is responsible for assessing the Group's ability to continueas a going concern. They also have the responsibility for disclosing, as applicable, matters related to going concern. Inaddition, they are responsible for financial reporting based on the going concern basis of accounting unless there is an intentionto liquidate the Group or to cease operations, or there is no realistic alternative but to do so.
Furthermore, management is responsible for the preparation of the group management report that, as a whole, provides anappropriate view of the Group’s position and is, in all material respects, consistent with the consolidated financial statements,complies with German legal requirements, and appropriately presents the opportunities and risks of future development. Inaddition, management is responsible for such arrangements and measures (systems) as they have considered necessary toenable the preparation of the group management report that is in accordance with the applicable German legal requirements,and to be able to provide sufficient appropriate evidence for the assertions in the group management report.
The supervisory board is responsible for overseeing the Group's financial reporting process for the preparation of theconsolidated financial statements and of the group management report.

389
Deutsche Bank ConfirmationsAnnual Report 2018 Report on the Audit of the Consolidated Financial Statements and of the Group Management Report
Auditor’s Responsibilities for the Audit of the Consolidated Financial Statementsand of the Group Management Report
Our objectives are to obtain reasonable assurance about whether the consolidated financial statements as a whole are freefrom material misstatement, whether due to fraud or error, and whether the group management report as a whole provides anappropriate view of the Group’s position and, in all material respects, is consistent with the consolidated financial statementsand the knowledge obtained in the audit, complies with the German legal requirements and appropriately presents theopportunities and risks of future development, as well as to issue an auditor’s report that includes our opinions on theconsolidated financial statements and on the group management report.
Reasonable assurance is a high level of assurance, but is not a guarantee that an audit conducted in accordance with Section317 HGB, and the EU Audit Regulation and in compliance with German Generally Accepted Standards for Financial StatementAudits promulgated by the Institut der Wirtschaftsprüfer (IDW) will always detect a material misstatement. Misstatements canarise from fraud or error and are considered material if, individually or in the aggregate, they could reasonably be expected toinfluence the economic decisions of users taken on the basis of these consolidated financial statements and this groupmanagement report.
We exercise professional judgment and maintain professional skepticism throughout the audit. We also:
– Identify and assess the risks of material misstatement of the consolidated financial statements and the group managementreport, whether due to fraud or error, design and perform audit procedures responsive to those risks, and obtain auditevidence that is sufficient and appropriate to provide a basis for our opinions. The risk of not detecting a materialmisstatement resulting from fraud is higher than for one resulting from error, as fraud may involve collusion, forgery,intentional omissions, misrepresentations, or the override of internal control.
– Obtain an understanding of internal control relevant to the audit of the consolidated financial statements and ofarrangements and measures (systems) relevant to the audit of the group management report in order to design auditprocedures that are appropriate in the circumstances, but not for the purpose of expressing an opinion on the effectivenessof these systems.
– Evaluate the appropriateness of accounting policies used by management and the reasonableness of estimates made bythe management and related disclosures.
– Conclude on the appropriateness of management's use of the going concern basis of accounting and, based on the auditevidence obtained, whether a material uncertainty exists related to events or conditions that may cast significant doubt onthe Group's ability to continue as a going concern. If we conclude that a material uncertainty exists, we are required to drawattention in the auditor's report to the related disclosures in the consolidated financial statements and in the groupmanagement report or, if such disclosures are inadequate, to modify our respective opinions. Our conclusions are basedon the audit evidence obtained up to the date of our auditor's report. However, future events or conditions may cause theGroup to cease to be able to continue as a going concern.
– Evaluate the overall presentation, structure and content of the consolidated financial statements, including the disclosures,and whether the consolidated financial statements present the underlying transactions and events, in a manner that theconsolidated financial statements give a true and fair view of the assets, liabilities, financial position and financialperformance of the Group in compliance with IFRSs as adopted by the EU, and the additional requirements of Germancommercial law pursuant to Section 315e (1) HGB.
– Obtain sufficient appropriate audit evidence regarding the financial information of the entities or business activities withinthe Group to express opinions on the consolidated financial statements and on the group management report. We areresponsible for the direction, supervision and performance of the group audit. We remain solely responsible for our opinions.
– Evaluate the consistency of the group management report with the consolidated financial statements, its conformity withGerman law, and the view of the Group’s position it provides.
– Perform audit procedures on the prospective information presented by management in the group management report. Onthe basis of sufficient appropriate audit evidence we evaluate, in particular, the significant assumptions used bymanagement as a basis for the prospective information, and evaluate the proper derivation of the prospective informationfrom these assumptions. We do not express a separate opinion on the prospective information and on the assumptionsused as a basis. There is a substantial unavoidable risk that future events will differ materially from the prospectiveinformation.
We communicate with those charged with governance regarding, among other matters, the planned scope and timing of theaudit and significant audit findings, including any significant deficiencies in internal control that we identify during our audit.
We also provide those charged with governance with a statement that we have complied with the relevant independencerequirements, and communicate with them all relationships and other matters that may reasonably be thought to bear on ourindependence, and where applicable, the related safeguards.

390
Deutsche Bank 2 – Consolidated Financial StatementsAnnual Report 2018
From the matters communicated with those charged with governance, we determine those matters that were of mostsignificance in the audit of the consolidated financial statements of the current period and are therefore the key audit matters.We describe these matters in our auditor’s report unless law or regulation precludes public disclosure about the matter.
Other Legal and Regulatory Requirements
Further Information pursuant to Article 10 of the EU Audit Regulation
We were elected as group auditor of by the annual general meeting on May 24, 2018. We have been engaged by theSupervisory Board on July 24, 2018. We or our predecessor firms have served as auditor to Deutsche Bank Aktiengesellschaftand its predecessor companies since 1952.
We declare that the opinions expressed in this auditor’s report are consistent with the additional report to the Audit Committeepursuant to Article 11 of the EU Audit Regulation (long-form audit report).
We provided the following services in addition to the financial statement audit, as disclosed in Note 43 – “SupplementaryInformation to the Consolidated Financial Statements according to Sections 297 (1a) / 315a HGB and the return on assetsaccording to Article 26a of the German Banking Act”.
German Public Auditor Responsible for the Engagement
The German Public Auditor responsible for the engagement is Burkhard Böth.
Frankfurt am Main, March 15, 2019
KPMG AGWirtschaftsprüfungsgesellschaft
PukropskiWirtschaftsprüfer
BöthWirtschaftsprüfer

391
Deutsche Bank ConfirmationsAnnual Report 2018 Responsibility Statement by the Management Board
Responsibility Statement by the Management BoardTo the best of our knowledge, and in accordance with the applicable reporting principles, the consolidated financial statementsgive a true and fair view of the assets, liabilities, financial position and profit or loss of the Group, and the Group managementreport includes a fair review of the development and performance of the business and the position of the Group, together witha description of the principal opportunities and risks associated with the expected development of the Group.
Frankfurt am Main, March 12, 2019
Christian Sewing Garth Ritchie Karl von Rohr
Frank Kuhnke Stuart Lewis Sylvie Matherat
James von Moltke Werner Steinmüller Frank Strauß

3Corporate Governance Statement according to Sections 289f and 315d of the German Commercial Code /Corporate Governance Report
393 Management Board and Supervisory Board
408 Reporting and Transparency
408 Related Party Transactions
409 Auditing and Controlling
411 Compliance with the German Corporate Governance Code

393
Deutsche Bank Management Board and Supervisory BoardAnnual Report 2018 Management Board
All information presented in this Corporate Governance Statement according to §§ 289f, 315d German Commercial Code /Corporate Governance Report is shown as of February 15, 2019.
Management Board and Supervisory Board
Management BoardThe Management Board of Deutsche Bank AG is responsible for the management of the company in accordance with the law,the Articles of Association of Deutsche Bank AG and the Terms of Reference for the Management Board with the objective ofcreating sustainable value in the interests of the company. It considers the interests of shareholders, employees and othercompany-related stakeholders. The members of the Management Board are collectively responsible for managing the bank’sbusiness. The Management Board, as the Group Management Board, manages Deutsche Bank Group in accordance withuniform guidelines; it exercises general control over all Group companies.
The Management Board decides on all matters prescribed by law and the Articles of Association and ensures compliance withthe legal requirements and internal guidelines (compliance). It also takes the necessary measures to ensure that adequateinternal guidelines are developed and implemented. The Management Board's responsibilities include, in particular, the bank’sstrategic management and direction, the allocation of resources, financial accounting and reporting, control and riskmanagement, as well as a properly functioning business organization and corporate control. The Management Board decideson the appointments to the senior management level below the Management Board and, in particular, on the appointment ofGlobal Key Function Holders. In appointing people to management functions in the Group, the Management Board takesdiversity into account and strives, in particular, to achieve an appropriate representation of women.
The Management Board works closely together with the Supervisory Board in a cooperative relationship of trust and for thebenefit of the company. The Management Board reports to the Supervisory Board at a minimum within the scope prescribedby law or administrative guidelines, in particular on all issues with relevance for the Group concerning strategy, the intendedbusiness policy, planning, business development, risk situation, risk management, staff development, reputation andcompliance.
A comprehensive presentation of the duties, responsibilities and procedures of our Management Board are specified in itsTerms of Reference, the current version of which is available on our website (www.db.com/ir/en/documents.htm).
Personnel changes to the Management Board and the current members of the Management
Frank Kuhnke was appointed member of the Management Board with effect from January 1, 2019, for a three-year period.In the 2018 financial year, the following members of the Management Board left the Management Board: On April 8, 2018: Management Board Chairman John Cryan. At the end of May 24, 2018: Kimberly Hammonds and Dr. Marcus Schenck. As of December 31, 2018: Nicolas Moreau.
In the following, information is provided on the current members of the Management Board. The information includes the yearin which they were born, year in which they were first appointed and year in which their term expires as well as their currentpositions and area of responsibility according to the current Business Allocation Plan for the Management Board. Alsospecified are their other board mandates or directorships outside of Deutsche Bank Group as well as all memberships inlegally prescribed supervisory boards or other comparable domestic of foreign supervisory bodies of commercial enterprises.The members of our Management Board have generally undertaken not to assume chairmanships of supervisory boards ofcompanies outside Deutsche Bank Group.

394
Deutsche Bank 3 – Corporate Governance ReportAnnual Report 2018
Christian SewingYear of birth: 1970First appointed: 2015Term expires: 2022
Christian Sewing became a member of our Management Board on January 1, 2015, and was President from March 5, 2017to April 8, 2018. He was appointed Chairman of the Management Board with effect from April 8, 2018 and is responsible onthe Management Board according to its Business Allocation Plan for, among other things, Communications & Corporate SocialResponsibility (CSR) and Group Audit as well as the bank’s business in the Americas Region. Furthermore he took onresponsibility for Asset Management (AM) and the EMEA Region as of October 2018. From May to December 2018 our ChiefOperating Officer reported to him. Previously, from September 1, 2017 to April 2018, he was Co-Head of Private & CommercialBank (including Postbank), together with Frank Strauß. Mr. Sewing was also our Regional CEO for Germany until May 2018.
Prior to assuming his role on the Management Board, Mr. Sewing was Global Head of Group Audit and held a number ofpositions before that in Risk, including Deputy Chief Risk Officer (from 2012 to 2013) and Chief Credit Officer (from 2010 to2012) of Deutsche Bank.
From 2005 until 2007, Mr. Sewing was a member of the Management Board of Deutsche Genossenschafts-Hypothekenbank.
Before graduating with a diploma from the Bankakademie Bielefeld and Hamburg, Mr. Sewing completed a bankapprenticeship at Deutsche Bank in 1989.
Mr. Sewing does not have any external directorships subject to disclosure.
Until May 25, 2018 Mr. Sewing was Chairman of the Supervisory Board of Deutsche Bank Privat- und Geschäftskunden AGas well as member of the Supervisory Board of Deutsche Postbank AG. Since May 25, 2018 he is Chairman of the SupervisoryBoard of DB Privat- und Firmenkundenbank AG.
Garth RitchieYear of birth: 1968First appointed: 2016Term expires: 2023
Garth Ritchie became a member of our Management Board on January 1, 2016, and was appointed President as of April 8,2018. He was Co-Head of our Corporate & Investment Bank, together with Dr. Marcus Schenck, from July 2017 to May 2018,and has been its sole Head since May 2018. Mr. Ritchie is responsible for the UK & Ireland Region and was also our RegionalCEO for the UK & Ireland until October 2018 for this region. From May to October 2018, he was responsible for the EMEARegion. He remains the Senior Manager SMF21 (FCA-designated senior management function for an EEA Branch) and isexpected to become a SMF7 (Group Entity Senior Manager) upon authorization of Deutsche Bank AG London as a ThirdCountry Branch.
Mr. Ritchie joined Deutsche Bank in 1996 and became Co-Head of Equities in the Corporate Banking & Securities BusinessDivision in 2009 and its sole Head in 2010. He held various positions in trading and derivatives for over two decades.
Prior to joining Deutsche Bank, Mr. Ritchie held positions at Fergusson Brothers and First National Bank of South Africa.
He holds a Bachelor of Commerce in Finance and Economics from the University of Port Elizabeth (South Africa).
Mr. Ritchie does not have any external directorships subject to disclosure and no other memberships in legally prescribedsupervisory boards or other comparable domestic of foreign supervisory bodies of commercial enterprises.

395
Deutsche Bank Management Board and Supervisory BoardAnnual Report 2018 Management Board
Karl von RohrYear of birth: 1965First appointed: 2015Term expires: 2023
Karl von Rohr became a member of our Management Board on November 1, 2015, and was appointed President as of April 8,2018. He is our Chief Administrative Officer and is responsible for the functions Legal and Group Governance as well asHuman Resources. Furthermore, he has been our Regional CEO for Germany since May 2018.
Mr. von Rohr joined Deutsche Bank in 1997. From 2013 to 2015 he was Global Chief Operating Officer, RegionalManagement. Prior to this, he was Head of Human Resources for Deutsche Bank in Germany and member of the ManagementBoard of Deutsche Bank Privat- und Geschäftskunden AG. During his time at Deutsche Bank, he has held various seniormanagement positions in other divisions in Germany and Belgium.
He studied law at the universities of Bonn (Germany), Kiel (Germany), Lausanne (Switzerland) and at Cornell University(U.S.A.).
Mr. von Rohr was a member of the following Supervisory Boards until July 6, 2018: BVV Versicherungsverein desBankgewerbes a.G. and BVV Versorgungskasse des Bankgewerbes e.V. Furthermore he was until May 25, 2018 member ofthe Supervisory Board of Deutsche Postbank AG.
Since March 3, 2018 Mr. von Rohr is Chairman of the Supervisory Board of DWS Group GmbH & Co. KGaA.
Frank KuhnkeYear of birth: 1967First appointed: 2019Term expires: 2021
Frank Kuhnke became a member of our Management Board on January 1, 2019. He is our Chief Operating Officer and isresponsible for the Chief Information Office, the Chief Security Office, Data Management, Digital Strategy & Innovation,Corporate Services and Operations CIB, as well as Client Data Services.
He joined Deutsche Bank in 1986 and was appointed as Deutsche Bank’s Chief Operating Officer (COO) in April 2018. FromJanuary 2016 until April 2018 he was Divisional Control Officer, Chief Administrative Officer and Head of Operations of thePrivate & Commercial Bank. Prior to that Mr. Kuhnke was Divisional Control Officer for Deutsche Asset & Wealth Management.From 2012 until 2015 he worked in Deutsche Bank’s Non-Core Operations Unit, at first as Chief Risk Officer, later as ChiefOperating Officer. Between 2008 and 2012 he held management positions in Risk, based in London. During his career, hehas worked across several business divisions and infrastructure functions in Tokyo, New York and Germany and has runglobal organizations within Deutsche Bank Group.
Before graduating with a diploma from Bank Akademie Lüneburg, Mr. Kuhnke completed a bank apprenticeship at DeutscheBank.
Mr. Kuhnke does not have any external directorships subject to disclosure.
He is Member of the Supervisory Board of Deutsche Bank Società per Azioni.

396
Deutsche Bank 3 – Corporate Governance ReportAnnual Report 2018
Stuart LewisYear of birth: 1965First appointed: 2012Term expires: 2020
Stuart Lewis became a member of our Management Board on June 1, 2012. He is our Chief Risk Officer and is responsiblefor, among other things, the functions managing Credit Risk, Non-Financial Risk, Market Risk and Liquidity Risk as well as forfurther Risk-Infrastructure units.
He joined Deutsche Bank in 1996. Prior to assuming his current role, Mr. Lewis was Deputy Chief Risk Officer andsubsequently Chief Risk Officer of the Corporate & Investment Bank from 2010 to 2012. Between 2006 and 2010 he wasChief Credit Officer.
Before joining Deutsche Bank in 1996, he worked at Credit Suisse and Continental Illinois National Bank in London.
He studied at the University of Dundee, where he obtained an LLB (Hons), and he holds an LLM from the London School ofEconomics. He also attended the College of Law, Guildford.
Mr. Lewis does not have any external directorships subject to disclosure.
He is Chairman of the Advisory Council of DEUKONA Versicherungs-Vermittlungs-GmbH and Chairman of the SupervisoryBoard of Deutsche Bank Società per Azioni.
Sylvie MatheratYear of birth: 1962First appointed: 2015Term expires: 2023
Sylvie Matherat became a member of our Management Board on November 1, 2015. She is our Chief Regulatory Officer andin this function she is responsible for the areas Compliance, Anti-Financial Crime (AFC), as well as Government & RegulatoryAffairs. Since May 2018, she has also been responsible for the Business Selection and Conflicts Office.
Ms. Matherat joined Deutsche Bank from Banque de France where she was Deputy Director General and responsible forregulation and financial stability issues, payment and settlement infrastructures, banking services, and the Target 2 Securitiesproject. Ms. Matherat previously held various positions at the banking supervisory authority and in the private sector.
She studied public law and finance at the Institut d’Études Politiques de Paris, France, and holds a Master’s degree in lawand political sciences. In 2014 she was awarded the Légion d'Honneur.
Ms. Matherat does not have any external directorships subject to disclosure.
She is Member of the Board of Directors of DB USA Corporation and since March 3, 2018 Member of the Supervisory Boardof DWS Group GmbH & Co. KGaA.

397
Deutsche Bank Management Board and Supervisory BoardAnnual Report 2018 Management Board
James von MoltkeYear of birth: 1969First appointed: 2017Term expires: 2020
James von Moltke became a member of our Management Board on July 1, 2017. He is our Chief Financial Officer and in thisfunction he is responsible for, among other things, Finance, Group Tax, Group Treasury, Investor Relations, as well asCorporate M&A & Corporate Investments.
Before Mr. von Moltke joined Deutsche Bank he served as Treasurer of Citigroup. He started his career at Credit Suisse FirstBoston in London in 1992. In 1995, he joined J.P. Morgan, working at the bank for 10 years in New York and Hong Kong.After next working at Morgan Stanley in New York for four years, where he led the Financial Technology advisory team globally,Mr. von Moltke joined Citigroup as Head of Corporate M&A in 2009. Three years later he became the US-bank’s Global Headof Financial Planning.
He holds a Bachelor of Arts degree from New College, University of Oxford.
Mr. von Moltke has been a member of the following Supervisory Boards since July 6, 2018: BVV Versicherungsverein desBankgewerbes a.G. and BVV Versorgungskasse des Bankgewerbes e.V.
Werner SteinmüllerYear of birth: 1954First appointed: 2016Term expires: 2020
Werner Steinmüller became a member of our Management Board on August 1, 2016. He is our Regional CEO Asia Pacific.
Mr. Steinmüller joined Deutsche Bank in 1991. He was Head of Global Transaction Banking from 2004 to 2016, Chief Opera-ting Officer (COO) of Global Transaction Banking from 2003 to 2004, Head of the Global Banking Division Europe from 1998to 2003, and Co-Head of Corporate Finance Germany from 1996 to 1998.
Prior to joining Deutsche Bank, he worked at Citibank from 1979 to 1991.
He holds a Diploma in Business Administration and Mechanical Engineering from TU Darmstadt.
Mr. Steinmüller does not have any external directorships subject to disclosure.
Mr. Steinmüller was until May 25, 2018 Chairman of the Supervisory Board of Deutsche Postbank AG. Since May 25, 2018Mr. Steinmüller is member of the Supervisory Board of DB Privat- und Firmenkundenbank AG.
Frank StraußYear of birth: 1970First appointed: 2017Term expires: 2020
Frank Strauß became a member of our Management Board on September 1, 2017. He was Co-Head of our Private &Commercial Bank (including Postbank), together with Christian Sewing, until April 8, 2018, and has been its sole Head sincethen. Mr. Strauß was also responsible for Postbank (including integration matters) until May 25, 2018.
Having completed training to become a bank officer in Iserlohn, Mr. Strauß moved to Frankfurt in 1995, where he held variousmanagement positions at Deutsche Bank and Deutsche Bank 24, its former subsidiary. From 2002 onwards he coordinatedEuropean operations in the bank’s Private & Business Clients division. In 2005 he took over responsibility for developing thebank’s Asian operations in Mumbai and Beijing. One year later he was appointed Head of Private & Business Clients Germany.In July 2011 he moved to Postbank, where he became the Management Board member responsible for sales, before assumingthe role of Chairman of the Management Board one year later.
He completed a bank apprenticeship at Deutsche Bank in Iserlohn between 1989 and 1992.
Mr. Strauß does not have any external directorships subject to disclosure.
He was until May 25, 2018 Chairman of the Management Board of Deutsche Postbank AG. Since May 25, 2018 Mr. Straußis Chairman of the Management Board of DB Privat- und Firmenkundenbank AG.

398
Deutsche Bank 3 – Corporate Governance ReportAnnual Report 2018
Supervisory BoardThe Supervisory Board of Deutsche Bank AG appoints, supervises and advises the Management Board and is directly involvedin decisions of fundamental importance to the bank. It works together closely with the Management Board in a cooperativerelationship of trust and for the benefit of the company. The Supervisory Board decides on the appointment and dismissal ofmembers of the Management Board including long-term succession planning for the Management Board based on proposalsof the Chairman’s Committee while taking into account recommendations of the Nomination Committee. Based on proposalsof the Compensation Control Committee, the Supervisory Board determines the total compensation of the individual membersof the Management Board resolves on the compensation system for the Management Board and reviews it regularly.
In accordance with Section 9 (1) of the Articles of Association, the members of the Supervisory Board are elected for theperiod until the conclusion of the General Meeting which adopts the resolutions concerning the ratification of the acts ofmanagement for the fourth financial year following the beginning of the term of office. Here, the financial year in which theterm of office begins is not taken into account. For the election of shareholder representatives, the General Meeting mayestablish that the terms of office of individual members may begin or end on differing dates.
The internal organization of the Supervisory Board and its committees as well as the tasks and profiles of the individualmembers are subject to specific statutory and regulatory requirements that further specify and supplement the corporate-lawregulations concerning corporate governance. Such requirements are founded on, among other things, the German BankingAct (Kreditwesengesetz), the Remuneration Ordinance for Institutions (Institutsvergütungsverordnung), the guidelines of theEuropean Banking Authority and the administrative practices of the European Central Bank as our supervisory authority. Inindividual cases, these are in contradiction to the recommendations of the German Corporate Governance Code (“Code”)and, in such case, this may lead to a statement of exceptions in our Declaration of Conformity.
The Supervisory Board receives reports from the Management Board at least within the scope prescribed by law oradministrative guidelines, in particular on all issues of relevance for the Group concerning strategy, intended business policy,planning, business development, risk situation, risk management, staff development, reputation and compliance. Furthermore,Group Audit informs the Audit Committee regularly, and in the case of severe deficiencies without undue delay, of any seriousdeficiencies identified and of any deficiencies that have not yet been remediated. The Chairman of the Supervisory Board isinformed accordingly of any serious findings against the members of the Management Board. The Supervisory Board andManagement Board adopted an Information Regime, which specifies not only the reporting to the Supervisory Board but alsorules relating to the Supervisory Board’s enquiries and requests for information from employees of the company, as well asthe exchange of information in connection with preparations for the meetings and between the meetings.
The Chairman of the Supervisory Board plays a crucial role in the proper functioning of the Supervisory Board and has aleadership role in this. He can issue internal guidelines and principles concerning the Supervisory Board’s internal organizationand communications, the coordination of the work within the Supervisory Board and the Supervisory Board’s interaction withthe Management Board. Between meetings, the Chairman of the Supervisory Board, and, if expedient, the chairpersons ofthe Supervisory Board committees, maintain regular contact with the Management Board, especially with the Chairman of theManagement Board, and deliberate with him on issues of Deutsche Bank Group’s strategy, planning, the development of itsbusiness, risk situation, risk management, governance, compliance, technical-organizational resources and material litigationcases. The Chairman of the Supervisory Board and – within their respective functional responsibility – the chairpersons of theSupervisory Board committees are informed without delay by the Chairman of the Management Board or by the respectivelyresponsible Management Board member about important events of material significance for the assessment of the situation,development and management of Deutsche Bank Group. The Chairman of the Supervisory Board engages in discussionswith investors on Supervisory Board-related topics when necessary and regularly informs the Supervisory Board of thesubstance of such discussions.
The types of business that require the approval of the Supervisory Board to be transacted are specified in Section 13 of theArticles of Association of Deutsche Bank AG. The Supervisory Board meets, if required, without the Management Board. Afterdue consideration and insofar as materially appropriate, the Supervisory Board, or any of its committees, may, in order toperform their tasks, consult auditors, legal advisors and other internal or external advisors. In performing their tasks, theChairman of the Supervisory Board, the chairpersons of the standing committees and the Supervisory Board members aresupported by the Office of the Supervisory Board, which is independent of the Management Board.
In 2018, a total of 54 meetings of the Supervisory Board and its committees took place. In addition, there was joint attendanceand participation to address agenda items with a cross-committee relevance.
The duties, procedures and committees of the Supervisory Board are specified in its Terms of Reference. The current versionis available on the Deutsche Bank website (www.db.com/ir/en/documents.htm).
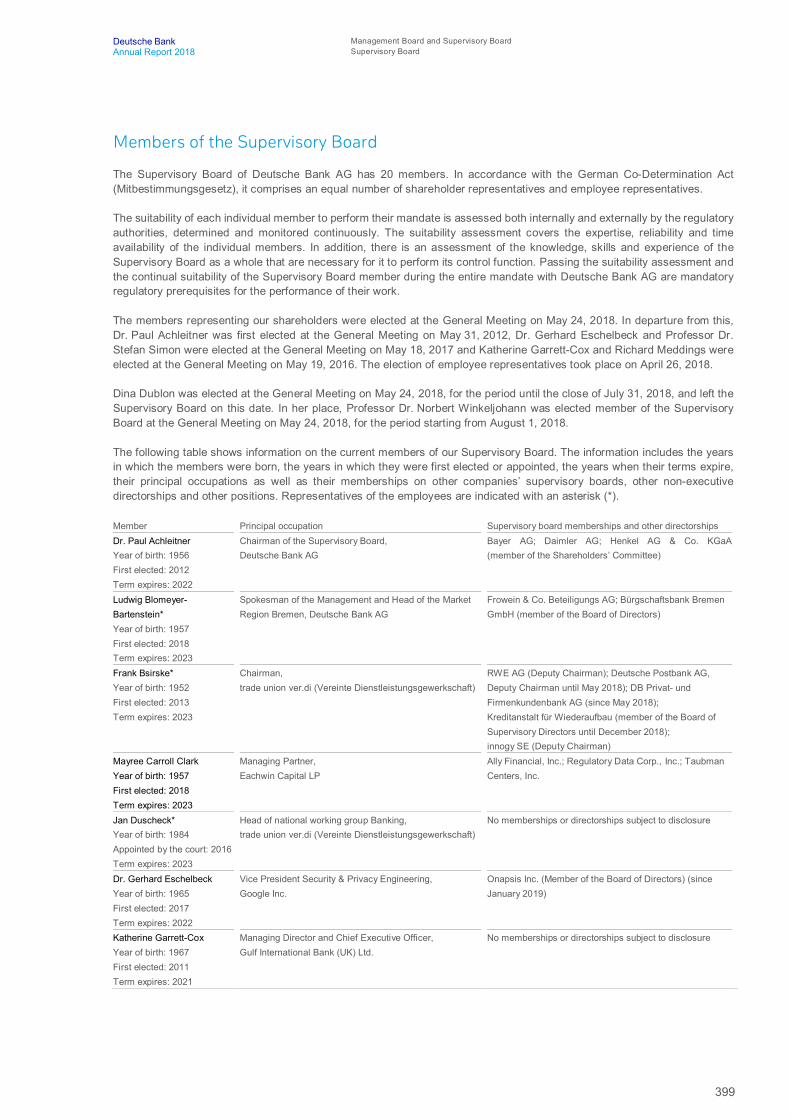
399
Deutsche Bank Management Board and Supervisory BoardAnnual Report 2018 Supervisory Board
Members of the Supervisory Board
The Supervisory Board of Deutsche Bank AG has 20 members. In accordance with the German Co-Determination Act(Mitbestimmungsgesetz), it comprises an equal number of shareholder representatives and employee representatives.
The suitability of each individual member to perform their mandate is assessed both internally and externally by the regulatoryauthorities, determined and monitored continuously. The suitability assessment covers the expertise, reliability and timeavailability of the individual members. In addition, there is an assessment of the knowledge, skills and experience of theSupervisory Board as a whole that are necessary for it to perform its control function. Passing the suitability assessment andthe continual suitability of the Supervisory Board member during the entire mandate with Deutsche Bank AG are mandatoryregulatory prerequisites for the performance of their work.
The members representing our shareholders were elected at the General Meeting on May 24, 2018. In departure from this,Dr. Paul Achleitner was first elected at the General Meeting on May 31, 2012, Dr. Gerhard Eschelbeck and Professor Dr.Stefan Simon were elected at the General Meeting on May 18, 2017 and Katherine Garrett-Cox and Richard Meddings wereelected at the General Meeting on May 19, 2016. The election of employee representatives took place on April 26, 2018.
Dina Dublon was elected at the General Meeting on May 24, 2018, for the period until the close of July 31, 2018, and left theSupervisory Board on this date. In her place, Professor Dr. Norbert Winkeljohann was elected member of the SupervisoryBoard at the General Meeting on May 24, 2018, for the period starting from August 1, 2018.
The following table shows information on the current members of our Supervisory Board. The information includes the yearsin which the members were born, the years in which they were first elected or appointed, the years when their terms expire,their principal occupations as well as their memberships on other companies’ supervisory boards, other non-executivedirectorships and other positions. Representatives of the employees are indicated with an asterisk (*).
Member Principal occupation Supervisory board memberships and other directorshipsDr. Paul AchleitnerYear of birth: 1956First elected: 2012Term expires: 2022
Chairman of the Supervisory Board,Deutsche Bank AG
Bayer AG; Daimler AG; Henkel AG & Co. KGaA(member of the Shareholders’ Committee)
Ludwig Blomeyer-Bartenstein*Year of birth: 1957First elected: 2018Term expires: 2023
Spokesman of the Management and Head of the MarketRegion Bremen, Deutsche Bank AG
Frowein & Co. Beteiligungs AG; Bürgschaftsbank BremenGmbH (member of the Board of Directors)
Frank Bsirske*Year of birth: 1952First elected: 2013Term expires: 2023
Chairman,trade union ver.di (Vereinte Dienstleistungsgewerkschaft)
RWE AG (Deputy Chairman); Deutsche Postbank AG,Deputy Chairman until May 2018); DB Privat- undFirmenkundenbank AG (since May 2018);Kreditanstalt für Wiederaufbau (member of the Board ofSupervisory Directors until December 2018);innogy SE (Deputy Chairman)
Mayree Carroll ClarkYear of birth: 1957First elected: 2018Term expires: 2023
Managing Partner,Eachwin Capital LP
Ally Financial, Inc.; Regulatory Data Corp., Inc.; TaubmanCenters, Inc.
Jan Duscheck*Year of birth: 1984Appointed by the court: 2016Term expires: 2023
Head of national working group Banking,trade union ver.di (Vereinte Dienstleistungsgewerkschaft)
No memberships or directorships subject to disclosure
Dr. Gerhard EschelbeckYear of birth: 1965First elected: 2017Term expires: 2022
Vice President Security & Privacy Engineering,Google Inc.
Onapsis Inc. (Member of the Board of Directors) (sinceJanuary 2019)
Katherine Garrett-CoxYear of birth: 1967First elected: 2011Term expires: 2021
Managing Director and Chief Executive Officer,Gulf International Bank (UK) Ltd.
No memberships or directorships subject to disclosure

400
Deutsche Bank 3 – Corporate Governance ReportAnnual Report 2018
Timo Heider*Year of birth: 1975First elected: 2013Term expires: 2023
Chairman of the General Staff Council of BHWBausparkasse AG / Postbank Finanzberatung AG,Chairman of the General Staff Council of BHWKreditservice GmbH; Deputy Chairman of the Group StaffCouncil of Deutsche Bank AG
Deutsche Postbank AG (until May 2018); BHWBausparkasse AG (Deputy Chairman); Pensionskasse derBHW Bausparkasse AG VVaG (Deputy Chairman)
Martina Klee*Year of birth: 1962First elected: 2008Term expires: 2023
Deputy Chairperson of the Staff Council PWCC CenterFrankfurt, Deutsche Bank AG
Sterbekasse für die Angestellten der Deutsche Bank-Gruppe VVaG
Henriette Mark*Year of birth: 1957First elected: 2003Term expires: 2023
Chairperson of the Combined Staff Council SouthernBavaria; Member of the General Staff Council andmember of the Group Staff Council of Deutsche Bank
No memberships or directorships subject to disclosure
Richard MeddingsYear of birth: 1958Appointed by the court: 2015Term expires: 2021
Executive Chairman of the Board,TSB Bank PLC
HM Treasury (until September 2018); TSB Bank PLC (Non-Executive Chairman of the Board until September 2018);Jardine Lloyd Thompson Group PLC (Non-ExecutiveDirector)
Gabriele Platscher*Year of birth: 1957First elected: 2003Term expires: 2023
Chairperson of the Staff Council Niedersachsen Ost,Deutsche Bank
BVV Versicherungsverein des Bankgewerbes a.G.(Deputy Chairperson);BVV Versorgungskasse des Bankgewerbes e.V.(Deputy Chairperson);BVV Pensionsfonds des Bankgewerbes AG(Deputy Chairperson)
Detlef Polaschek*Year of birth: 1960First elected: 2018Term expires: 2023
Deputy Chairman of the Supervisory Board; Member ofthe General Staff Council; Chairman of the Staff CouncilNiederrhein und Ruhrgebiet Mitte/Ost, Deutsche Bank
No memberships of directorships subject to disclosure
Bernd Rose*Year of birth: 1967First elected: 2013Term expires: 2023
Chairman of the General Staff Council of PostbankFilialvertrieb AG; Member of the Group Staff Council andEuropean Staff Council of Deutsche Bank
Deutsche Postbank AG (until May 2018); DB Privat- undFirmenkunden AG (since December 2018); PostbankFilialvertrieb AG; ver.di Vermögensverwaltungsgesellschaftm.b.H. (Deputy Chairman)
Gerd Alexander SchützYear of birth: 1967First elected: 2017Term expires: 2023
Member of the Management Board,C-QUADRAT Investment AG
MyBucks S.A. (Non-Executive Chairman of the Board ofDirectors) (until February 2018)
Prof. Dr. Stefan SimonYear of birth: 1969Appointed by the court: 2016Term expires: 2022
Self-employed attorney at law with his own law firm,SIMON GmbH
Leop. Krawinkel GmbH & Co. KG (Chairman of the AdvisoryCouncil)
Stephan Szukalski*Year of birth: 1967First elected: 2013**Re-elected: 2018Term expires: 2023
Federal ChairmanGerman Association of Bank Employees (DeutscherBankangestellten-Verband e.V. (DBV))
No memberships or directorships subject to disclosure
John Alexander ThainYear of birth: 1955First elected: 2018Term expires: 2023
Uber Technologies, Inc. (Member of the Board ofDirectors); Enjoy Technology Inc. (Member of the Board ofDirectors)
Michele TrogniYear of birth: 1965First elected: 2018Term expires: 2023
Morneau Shepell Inc. (Member of the Board of Directors);Capital Markets Gateway Inc. (Chairperson of the Board ofDirectors) (since July 2018); Global Atlantic FinancialGroup Ltd. (Non-Executive Director) (since August 2018)
Professor Dr. NorbertWinkeljohannYear of birth: 1957First elected: 2018Term expires: 2023
Self-employed corporate consultant, Norbert WinkeljohannAdvisory & Investments
Bayer AG; Heristo AG (Chairman); GeorgsmarienhütteHolding GmbH; Sievert AG (Chairman since January 2019)
* Employees representatives.** Mr. Szukalski was a member of the Supervisory Board from May 23, 2013 to November 30, 2015.

401
Deutsche Bank Management Board and Supervisory BoardAnnual Report 2018 Supervisory Board
Objectives for the composition of the Supervisory Board, Profile of Requirementsand status of implementation
The Supervisory Board established objectives for its composition in October 2010 and last amended them as specified in thefollowing in February 2018. While taking into account the requirements of Section 5.4.1 (2) sentence 1 of the GermanCorporate Governance Code (the “Code”), the Supervisory Board adopted a Profile of Requirements at its meeting on October26, 2017 and confirmed it at its meeting on July 26, 2018.
The Supervisory Board shall be composed in such a way that its members as a whole possess the knowledge, abilities andexpert experience to properly complete its tasks and the members in their entirety of the Supervisory Board and the AuditCommittee must be familiar with the banking sector. In particular, the Supervisory Board members should have sufficient timeto perform their mandates. The composition of the Supervisory Board should ensure the Supervisory Board’s qualified controlof and advice for the Management Board of an internationally operating, broadly positioned bank and should preserve thereputation of Deutsche Bank Group among the public. In this regard, in particular, attention should be placed on the integrity,personality, willingness to perform, professionalism and independence of the individuals proposed for election. The objectiveis for the Supervisory Board as a whole to have all of the knowledge and experience considered to be essential while takinginto account the activities of Deutsche Bank Group.
The Supervisory Board, as a whole, must possess the expertise required to effectively monitor and advise the ManagementBoard in its management of Deutsche Bank AG and Deutsche Bank Group – also with regard to the observance of the relevantbank supervisory regulations.
As set out in the Profile of Requirements each Supervisory Board member must have an understanding of the fields ofexpertise specified below that is appropriate for the size and complexity of Deutsche Bank AG. Experts shall have profoundexpertise in the individual fields.
The fields of expertise include, in particular, the fields listed below:
– Knowledge in the areas of banking, financial services, financial markets and the financial industry, including the homemarket and the bank’s key markets outside Europe
– Knowledge of the relevant clients for the bank, the market expectations and the operational environment– Risk management (investigation, assessment, mitigation, management and control of financial and non-financial risks,
capital and liquidity management, shareholdings)– Accounting (according to International Financial Reporting Standards (IFRS) and the German Commercial Code (HGB))
and audits of annual financial statements (financial experts: these members of the Supervisory Board must fulfill therequirements as “financial experts” as such term is defined by the implementation rules of the U.S. Securities and ExchangeCommission (SEC) issued pursuant to Section 407 of the Sarbanes-Oxley Act of 2002 and by Section 100 of the GermanStock Corporation Act)
– Corporate and social responsibility, including reporting– Taxation– Internal audit– Compliance and internal controls– Strategic planning, business and risk strategies as well as their implementation– Digitalization– Information technology (IT), IT systems and IT security– Regulatory framework and legal requirements, in particular, knowledge of the legal systems relevant for the bank– Knowledge of the social, political and regulatory expectations in the home market– Selection procedure for management body members and assessment of their suitability– Governance and corporate culture– Human resources and staff management– Compensation and compensation systems (compensation expert)– Management of a large, international regulated company– Internal organization of the bank
Furthermore, consideration is to be given to the amendments to the current version of the Business Allocation Plan for theManagement Board of Deutsche Bank AG as well as to the requirements and expectations of the regulatory authorities.

402
Deutsche Bank 3 – Corporate Governance ReportAnnual Report 2018
In addition the Supervisory Board shall have an adequate number of independent members and shall not have more than twoformer members of the Management Board of Deutsche Bank AG. Under the premise that the performance of the SupervisoryBoard mandate in itself by the representatives of the employees cannot be reason to doubt fulfillment of the independencecriteria according to Section 5.4.2 of the German Corporate Governance Code, the Supervisory Board shall have a total of atleast sixteen members that are independent within the meaning of the Code. In any event, the Supervisory Board shall becomposed such that the number of independent members, within the meaning of Section 5.4.2, among the shareholderrepresentatives will be at least six. The members of the Supervisory Board may not exercise functions on a management bodyof, or perform advisory duties, at major competitors. Important and not just temporary conflicts of interest with respect to amember of the Supervisory Board should lead to a termination of the mandate. Members of the Supervisory Board may nothold more than the allowed number of supervisory board mandates according to Section 25d of the German Banking Act(KWG) or mandates in supervisory bodies of companies which have similar requirements.
There is a regular maximum age limit of 70. In well-founded, individual cases, a Supervisory Board member may be electedor appointed for a period that extends at the latest until the end of the fourth Annual General Meeting that takes place after heor she has reached the age of 70. This age limit was taken into account in the election proposals to the recent GeneralMeetings and shall also be taken into account for the next Supervisory Board elections or subsequent appointments forSupervisory Board positions that become vacant. In October 2015, the Supervisory Board resolved that for members of theSupervisory Board to be elected or appointed in future, the length of each individual Supervisory Board membership shall not,as a rule, exceed 15 years.
The Supervisory Board respects diversity when proposing members for appointment to the Supervisory Board. In light of theinternational operations of Deutsche Bank, care should be taken that the Supervisory Board has an appropriate number ofmembers with long-term international experience. Currently, the professional careers or private lives of eight members of theSupervisory Board are centered outside Germany. Furthermore, all of the shareholder representatives on the SupervisoryBoard have several years of international experience from their current or former activities as management board membersor CEOs or a comparable executive function of corporations or organizations with international operations. In these two ways,the Supervisory Board believes the international activities of the company are sufficiently taken into account. The objective isto retain the currently existing international profile. The resumes of the members of the Supervisory Board are published onDeutsche Bank’s website (www.db.com/ir/en/supervisory-board.htm).
For the election proposals to the General Meeting, the Supervisory Board takes into account the recommendations of theNomination Committee and the legal requirements according to which the Supervisory Board shall be composed of at least30 % women and at least 30 % men. Special importance has already been attached to an appropriate consideration of womenin the selection process since the Supervisory Board elections in 2008. In reviewing potential candidates for a new election orsubsequent appointments to Supervisory Board positions that have become vacant, qualified women shall be included in theselection process and shall be appropriately considered in the election proposals. For many years now, at least 30 % of theSupervisory Board members have been women and, since 2013, 30 % of the shareholder representatives have been women.Currently, six Supervisory Board members are women, i.e. 30 % of all members. The Supervisory Board strives to maintainthis number. It should be taken into account that the Supervisory Board can only influence the composition of the SupervisoryBoard through its election proposals to the General Meeting.
The Supervisory Board believes that it complies with the specified concrete objectives regarding its composition and the Profileof Requirements. The members of the Supervisory Board as a whole possess the knowledge, ability and expert experienceto properly complete their tasks. Diversity is appropriately taken into account. Further details in this context are given in the“Diversity Concept”, which is also part of this Corporate Governance Statement / Corporate Governance Report.
In accordance with Section 5.4.2 of the German Corporate Governance Code, the Supervisory Board determined that it haswhat it considers to be an adequate number of independent members among the shareholder representatives. These arenamely: Dr. Paul Achleitner, Mayree Carroll Clark, Dr. Gerhard Eschelbeck, Katherine Garrett-Cox, Richard Meddings,Professor Dr. Stefan Simon, John Alexander Thain, Michele Trogni and Professor Dr. Norbert Winkeljohann. Currently, theSupervisory Board does not consider Gerd Alexander Schütz independent due to his role as a representative of the largeshareholder HNA. The Supervisory Board considers all of its members representing employees independent within themeaning of the Code, except for Henriette Mark and Gabriele Platscher, as their length of Supervisory Board membership ineach case exceeds the regular limit of 15 years.
Some members of the Supervisory Board are, or were last year, in high-ranking positions at other companies that DeutscheBank has business relations with. Business transactions with these companies are conducted under the same conditions asthose between unrelated third parties. These transactions, in our opinion, do not affect the independence of the SupervisoryBoard members involved.

403
Deutsche Bank Management Board and Supervisory BoardAnnual Report 2018 Standing Committees
Standing CommitteesThe Supervisory Board has established the following eight standing committees. To the extent required, the committeescoordinate their work and consult each other on an ad hoc basis. The committee chairpersons report regularly to theSupervisory Board on the work of the committees. The Report of the Supervisory Board in the Annual Report 2018 providesinformation on the concrete work of the committees over the preceding year.
Chairman’s Committee: It is responsible for, in particular: preparing the meetings of the Supervisory Board and handlingcurrent business between meetings of the Supervisory Board; preparing for decisions by the Supervisory Board on theappointment and dismissal of members of the Management Board, including long-term succession planning for theManagement Board, while taking into account the recommendations of the Nomination Committee; concluding, amending andterminating employment and pension contracts in consideration of the plenary Supervisory Board’s sole authority to decideon the compensation of the members of the Management Board and in consideration of the recommendations of theCompensation Control Committee taking note of and, where necessary, expressing an opinion on contracts and/oramendments to contracts for a General Manager (Generalbevollmächtigter) of Deutsche Bank AG who is designated as anintended member of the Management Board; handling other contractual business with active and former members of theManagement Board pursuant to Section 112 of the German Stock Corporation Act; and approving Management Boardmembers’ mandates, honorary offices or special tasks outside of Deutsche Bank Group, while taking the recommendationsof the Nomination Committee into account. The Chairman’s Committee is also responsible for: approving the hand-over ofconfidential internal data concerning a Management Board member in consultation with the Chairman of the ManagementBoard and/or the Chief Risk Officer, unless they have a conflict of interests; approving contracts with Supervisory Boardmembers pursuant to Section 114 of the German Stock Corporation Act; preparing for decisions of the Supervisory Board inthe field of corporate governance, deciding in the Supervisory Board’s stead on an adjustment of the annual Declaration ofConformity to changed actual circumstances and verifying compliance with the Declaration of Conformity. Its tasks alsoinclude: taking note of and, where necessary, expressing an opinion on the Supervisory Board’s and its committees’ costs forconsultations with auditors, experts, legal advisors and other external advisors; as well as preparing recommendations fordecisions of the Supervisory Board on pursuing claims for damages or taking other measures against incumbent or formermembers of the Management Board. As and when necessary, the Chairman’s Committee draws on the expertise of the Chairof the Integrity Committee.
The Chairman’s Committee held nine meetings in 2018.
The current members of the Chairman’s Committee are Dr. Paul Achleitner (Chairman), Frank Bsirske, Detlef Polaschek andProfessor Dr. Stefan Simon.
Nomination Committee: It is responsible for, in particular, supporting the Supervisory Board in identifying candidates to fill aposition on the bank's Management Board. In doing so, the Nomination Committee takes into account the balance and diversityof the knowledge, skills and experience of all members of the Management Board, prepares a job description with a candidateprofile, and states the time commitment Furthermore, it is responsible in particular for drawing up an objective to promote therepresentation of the under-represented gender on the Supervisory Board as well as a strategy for achieving this and theregular assessment, to be performed at least once a year, of the structure, size, composition and performance of theManagement Board and of the Supervisory Board and making recommendations regarding this to the Supervisory Board. TheNomination Committee supports the Supervisory Board in drawing up guidelines for the individual and collective assessmentof the professional qualifications, personal reliability and time availability of the members of the Management Board andSupervisory Board (“Suitability Guideline”) as well as in monitoring the effectiveness of the Suitability Guideline. Furthermore,the Nomination Committee also supports the Supervisory Board in the regular assessment, to be performed at least once ayear, of the knowledge, skills and experience of the individual members of the Management Board and Supervisory Board aswell as of the respective body collectively in the assessment of the members of the Management Board and SupervisoryBoard in all other cases pursuant to the requirements of the Suitability Guideline; and in the review of the Management Board’sprinciples for selecting and appointing persons to the upper management levels as well as the recommendations made to theManagement Board in this respect. The shareholder representatives on the Nomination Committee prepare the SupervisoryBoard’s proposals for the election or appointment of new shareholder representatives to the Supervisory Board. In this context,they take into account the Profile of Requirements for the Supervisory Board, the criteria specified by the Supervisory Boardfor its composition as well as the balance and diversity of the knowledge, skills and experience of all members of theSupervisory Board, prepare a job description with a candidate profile, and state the time commitment.
The Nomination Committee held six meetings in 2018.
The current members of the Nomination Committee are Dr. Paul Achleitner (Chairman), Frank Bsirske, Detlef Polaschek,Gerd Alexander Schütz and Professor Dr. Stefan Simon.

404
Deutsche Bank 3 – Corporate Governance ReportAnnual Report 2018
Audit Committee: It supports the Supervisory Board in particular in monitoring the financial reporting process, and it can submitrecommendations or suggestions to the Supervisory Board on ensuring the integrity of the financial reporting process.Furthermore, the Audit Committee supports the Supervisory Board in monitoring the effectiveness of the risk managementsystem, particularly of the internal control system and the internal audit system, the auditing of the financial statements,especially with regard to the auditor’s independence and the additional services provided by the auditor, and the ManagementBoard’s prompt remediation – through suitable measures – of the deficiencies identified by the auditor and bank-internalcontrol functions based on internal and external audits, in particular relating to weaknesses in risk controls, as well as non-compliance with policies, laws and regulatory requirements. The Committee is entitled to inspect all business documentationof the bank, including the business information stored on data carriers. The Audit Committee pre-reviews the annual andconsolidated financial statements and management reports as well as the separate non-financial report and the separateconsolidated non-financial report, if they were prepared. It discusses the audit reports with the auditor and prepares thedecisions of the Supervisory Board on establishing the annual financial statements and the approval of the consolidatedfinancial statements as well as the resolution proposal on the appropriation of distributable profit. The Audit Committee submitscorresponding recommendations to the Supervisory Board. It also provides support to the Supervisory Board with regard toengaging any external assurances for the non-financial statement and the consolidated non-financial statement or for theseparate non-financial report and separate consolidated non-financial report. It discusses important changes to the audit andaccounting methods. The Audit Committee also discusses the quarterly financial statements and the report on the limitedreview of the quarterly financial statements with the Management Board and the auditor prior to their publication. Furthermore,the Audit Committee submits proposals to the Supervisory Board for the appointment of the auditor and prepares the proposalof the Supervisory Board to the General Meeting for the election of the auditor. The Audit Committee advises the SupervisoryBoard on issuing the audit mandate to the auditor elected by the General Meeting, submits proposals to the Supervisory Boardfor the auditor’s remuneration and can specify areas of focus for the audit. It supports the Supervisory Board in monitoring theindependence, qualifications and efficiency of the auditor as well as the rotation of the members of the audit team. Mandatesfor non-audit-related services given to the auditor or to companies to which the auditor is related in legal, economic orpersonnel terms need the prior consent of the Audit Committee (in this context, see also the Principal Accountant Fees andServices section in this Corporate Governance Statement / Corporate Governance Report). The Audit Committee issuesguidelines for the employment of staff – including former staff – of the auditor by the company. It arranges to be informedregularly about the work done by Group Audit, the effectiveness of the internal audit system and in particular about its annualaudit plan the focal areas of its auditing activity and on the results of its audits. The Audit Committee is responsible, inparticular, for receiving and handling the quarterly, annual and ad hoc reports of Group Audit. The Management Board informsthe Audit Committee about special audits, substantial complaints and other exceptional measures on the part of German andforeign bank regulatory authorities. The Committee regularly obtains reports on the receipt and handling of complaints fromemployees of the bank and its subsidiaries, from shareholders of Deutsche Bank AG and from third parties. In particularcomplaints concerning accounting, internal accounting controls, auditing and other financial reporting matters must besubmitted to the Committee without undue delay. Reports concerning compliance matters are presented at the meetings ofthe Committee on a regular basis. The Chairman of the Audit Committee is entitled, in addition to the Chairman of theSupervisory Board, to obtain information directly from the Head of Compliance. The Audit Committee is responsible foracknowledging communications about significant reductions in the Compliance budget and for taking receipt of and handlingthe report, which is made at least once a year by the Head of Compliance (Compliance Report). Furthermore, the Committeeis entitled to obtain, through its Chairman, information in connection with its tasks from the auditor, the Management Board,the Head of Group Audit and – with the prior consent of the Management Board – senior managers of the bank reportingdirectly to the Management Board.
The Audit Committee held seven meetings in 2018.
The current members of the Audit Committee are Professor Dr. Norbert Winkeljohann (Chairman), Dr. Paul Achleitner,Katherine Garrett-Cox, Henriette Mark, Gabriele Platscher, Detlef Polaschek, Bernd Rose and Professor Dr. Stefan Simon.
405
Deutsche Bank Management Board and Supervisory BoardAnnual Report 2018 Standing Committees
Risk Committee: It advises the Supervisory Board on overall risk appetite and risk strategy, and monitors the implementationof the stated risk appetite and risk strategy by the senior management level. The Risk Committee monitors the material aspectsof the rating and valuation processes. In undertaking this responsibility, it receives reports from the Management Board aboutthe operations of the bank’s rating systems and about material changes or exceptions to established policies that will materiallyimpact the operations of the bank’s rating systems. The Risk Committee receives reports from the Management Board whichare appropriate to monitor whether the material financial products and services offered by the bank as well as the conditionsin the client business are in line with the bank’s business model and risk structure. If this is not the case, the Risk Committeerequests proposals from the Management Board on how the financial products and services as well as the conditions in theclient business could be structured to bring them into line with the bank’s business model and risk structure, and monitorstheir implementation. On the basis of the reports received from the Management Board, the Risk Committee assesses therisks associated with the financial products and services and takes into account the alignment between the prices assignedto and the profits gained from these products and services. The Risk Committee examines whether the incentives set by thecompensation system take into consideration the company's risk, capital and liquidity structure as well as the likelihood andtiming of earnings. The Risk Committee also performs all of the tasks assigned to it by law or regulatory authorities. It handlesloans which require a resolution by the Supervisory Board pursuant to law or our Articles of Association. In this context, itapproves, among other things, the acquisition of participations as defined by Section 13 (1) d) of the Articles of Association ofDeutsche Bank AG, insofar as the value of the participation does not exceed € 1.5 billion and the participation will probablynot remain in the bank’s full or partial possession for more than twelve months. If this period is exceeded, the Chairperson ofthe Committee informs the Supervisory Board without delay and obtains its approval. The Risk Committee determines thenature, scope, format and frequency of the information which the Management Board is required to submit on strategy andrisks. The Chairperson of the Risk Committee is entitled to obtain, in connection with its activities, information directly from theManagement Board and the Head of Group Audit. At the meetings of the Risk Committee, the Management Board reports oncredit, market, liquidity, operational, litigation and reputational risks. The Management Board also reports on risk strategy,credit portfolios, loans requiring Supervisory Board approval pursuant to law or our Articles of Association, questions of capitalresources and matters of special importance due to the risks they entail (for additional information on the disclosure of the riskmanagement objectives and policies for individual risk categories, please see the Risk Report of the Annual Report).
The Risk Committee held six meetings in 2018.
The current members of the Risk Committee are Mayree Carroll Clark (Chairperson), Dr. Paul Achleitner, Ludwig Blomeyer-Bartenstein, Jan Duscheck, Stephan Szukalski, Michele Trogni and Professor Dr. Norbert Winkeljohann.
Integrity Committee: It continually advises and monitors the Management Board with regard to whether management ensuresthe economically sound, sustainable development of the company while observing the principles of sound, responsiblemanagement, fulfilling the company’s social responsibilities and protecting the natural resources of the environment(environmental, social and governance (ESG) issues), and to whether the business management is aligned to these valueswith the objective of a holistic corporate culture. The Integrity Committee monitors the Management Board’s measures thatensure the company’s compliance with legal requirements, authorities’ regulations and the company’s own in-house policies(preventive compliance control). It regularly reviews the bank’s Code of Conduct and Code of Ethics for Senior FinancialOfficers to foster conduct on the part of company employees that is exemplary in every way, both within and outside thecompany, and that such conduct is not just aligned to the formal compliance with statutory requirements. It supports on requestthe Risk Committee in monitoring and analyzing the legal and reputational risks that are material to the bank. For this purpose,it advises the Management Board on how to generate awareness of the importance of such risks. It supports on request thepreparation of the Chairman’s Committee’s recommendations for Supervisory Board decisions on pursuing recourse claimsor taking other measures against current or former members of the Management Board and these are presented by itsChairperson to the Chairman’s Committee. Furthermore, the Integrity Committee supports the Supervisory Board in themonitoring of the litigation cases with the highest risk and other material cases.
The Integrity Committee held six meetings in 2018.
The current members of the Integrity Committee are Professor Dr. Stefan Simon (Chairman), Dr. Paul Achleitner, LudwigBlomeyer-Bartenstein, Katherine Garrett-Cox, Timo Heider and Gabriele Platscher.

406
Deutsche Bank 3 – Corporate Governance ReportAnnual Report 2018
Compensation Control Committee: It supports the Supervisory Board in the appropriate structuring of the compensationsystems for the members of the Management Board. It also monitors the appropriate structure of the compensation systemsfor the Management Board members and employees and, in particular, the appropriate structure of the compensation for theheads of the risk control function and compliance function and for the employees who have a material influence on the bank'soverall risk profile. The Compensation Control Committee supports the Supervisory Board in monitoring the process to identifyrisk takers in accordance with Section 18 (2) of the Remuneration Ordinance for Institutions (InstitutsVergV) and Group risktakers in accordance with Section 27 (2) sentence 1 of the Remuneration Ordinance for Institutions (InstitutsVergV) as wellas the appropriate structure of the compensation systems for the company’s employees. The Committee assesses the effectsof the compensation systems on risk, capital and liquidity management, while ensuring that the compensation systems arealigned to the business strategy focused on the banks sustainable development, to the risk strategies derived from this andto the compensation strategies at the company and Group levels. It prepares the Supervisory Board’s resolutions on thecompensation of the Management Board, considering, in particular, the effects of the resolutions on the company’s risks andrisk management. The long-term interests of shareholders, investors and other stakeholders as well as the public interest arealso taken into account. It also prepares the Supervisory Board's resolutions on setting the total amount of variablecompensation for the members of the Management Board in accordance with Section 45 (2) sentence 1 No. 5a of the GermanBanking Act (KWG) in consideration of Section 7 of the Ordinance for Remuneration in Financial Institutions (InstitutsVergV)and on setting the appropriate compensation parameters, targets for contributions to performance, payment and deferralperiods as well as the conditions for a full forfeiture or partial reduction of variable compensation. It also checks regularly, atleast annually, whether the adopted specifications are still appropriate. Furthermore, it checks, as part of its support to theSupervisory Board in monitoring the appropriate structure of the compensation systems for employees, regularly, but at leastannually, in particular, whether the total amount of variable compensation has been set in accordance with Section 45 (2)sentence 1 No. 5a of the German Banking Act (KWG) in consideration of Section 7 of the Remuneration Ordinance forInstitutions (InstitutsVergV) and whether the specified principles to assess the compensation parameters, contributions toperformance as well as the payment and deferral periods, including the conditions for a full forfeiture or partial reduction of thevariable compensation, are appropriate. In addition, it supports the Supervisory Board in monitoring whether the internalcontrols and other relevant areas are properly involved in the structuring of the compensation systems. The Committee isauthorized to obtain, via its Chairperson, information relating to the Committee tasks from the Head of Group Audit and fromthe heads of the organizational units responsible for structuring the compensation systems.
The Compensation Control Committee held five meetings in 2018.
The current members of the Compensation Control Committee are Dr. Paul Achleitner (Chairman), Frank Bsirske, DetlefPolaschek and Professor Dr. Stefan Simon.
Strategy Committee: The Committee, which was established by resolution of the Supervisory Board on May 23, 2018, supportsthe Supervisory Board in fulfilling its oversight responsibilities relating to the bank’s strategy. It advises and monitors theManagement Board with regard to the definition of business strategies geared to the sustainable development of the bankand the establishment of processes for planning, implementing, assessing and adjusting the business strategy. It overseesthe Management Board’s work on the strategic perspective, direction and development of the strategy for Deutsche BankGroup and its business divisions, the Management Board’s implementation of the strategic plan and the execution progressagainst strategic milestones and goals, as well as the Management Board’s implementation of major business transformationprojects and their execution. It advises the Management Board as to whether the governance, risk appetite, financial andcapital planning, liquidity and funding management, control environment and resources can support the bank’s strategicobjectives, and advises on divestitures and merger and acquisition strategy, including post-transaction performance tracking,as well as on the impact of changes in the competitive environment. Furthermore, the Strategy Committee advises theManagement Board in preparation for the Supervisory Board meetings at which the Supervisory Board plenum addresses thecompany’s strategy and prepares the Supervisory Board’s decisions on transactions subject to its approval pursuant to Section13 (1) b) and (1) d) of the Articles of Association.
The Strategy Committee held three meetings in 2018.
The current members of the Strategy Committee are John Alexander Thain (Chairman), Dr. Paul Achleitner, Frank Bsirske,Mayree Carroll Clark, Timo Heider, Henriette Mark, Richard Meddings and Detlef Polaschek.
407
Deutsche Bank Management Board and Supervisory BoardAnnual Report 2018 Share Plans
Technology, Data and Innovation Committee: The Committee, which was established by resolution of the Supervisory Boardon May 23, 2018, supports the Supervisory Board in fulfilling its oversight responsibilities relating to the bank’s innovation,data and technology environment. It continually advises and monitors the Management Board with regard to the adequatetechnical and organizational resources and the definition of an adequate plan for IT systems, including their application withgenerally established standards to the arrangement of the IT systems and the related IT processes. This includes in particularthe oversight over the Management Board’s work on the IT strategy and its sustainability outlining the objectives and measuresto be taken to achieve these objectives, the IT governance, the information security management, the user accessmanagement, the implementation of major IT projects and application development, IT operation, including data backup,outsourcing and other external procurement of IT services, data governance and data strategy, including their implementation,and any other material issues which may arise in connection with the IT systems and services or data quality of DeutscheBank AG.
The Technology, Data and Innovation Committee held three meetings in 2018.
The current members of the Technology, Data and Innovation Committee are Michele Trogni (Chairperson), Dr. PaulAchleitner, Jan Duscheck, Dr. Gerhard Eschelbeck, Martina Klee and Bernd Rose.
Mediation Committee: In addition to these eight standing committees, the Mediation Committee, which is required by Germanlaw, makes proposals to the Supervisory Board on the appointment or dismissal of members of the Management Board incases where the Supervisory Board is unable to reach a two-thirds majority decision with respect to the appointment ordismissal. The Mediation Committee only meets if necessary.
The Mediation Committee did not hold any meetings in 2018.
The current members of the Mediation Committee are Dr. Paul Achleitner (Chairman), Frank Bsirske, Detlef Polaschek andProfessor Dr. Stefan Simon.
Further details regarding the Chairman’s Committee, the Nomination Committee, the Audit Committee, the Risk Committee,the Integrity Committee, the Compensation Control Committee, the Strategy Committee and the Technology, Data andInnovation Committee are regulated in separate Terms of Reference. The current versions are available on our website, alongwith the Terms of Reference for the Supervisory Board (see: www.db.com/ir/en/documents.htm).
Share PlansFor information on our employee share programs, please refer to the additional Note 35 “Employee Benefits” to theConsolidated Financial Statements.

408
Deutsche Bank 3 – Corporate Governance ReportAnnual Report 2018
Reporting and Transparency
Directors’ Share OwnershipManagement Board. For information on the share ownership of the Management Board, please refer to our detailedCompensation Report in the Management Report.
Supervisory Board. The members of our Supervisory Board held the following numbers of our shares and share awards underour employee share plans.
Members of the Supervisory BoardNumber of
sharesNumber of
share awardsDr. Paul Achleitner 0 0Ludwig Blomeyer-Bartenstein 3,337 5,5821
Frank Bsirske 0 0Mayree Carroll Clark 40,000 0Jan Duscheck 0 0Dr. Gerhard Eschelbeck 0 0Katherine Garrett-Cox 0 0Timo Heider 0 0Martina Klee 2,442 10Henriette Mark 1,524 0Richard Meddings 0 0Gabriele Platscher 1,365 10Detlef Polaschek 553 10Bernd Rose 0 0Gerd Alexander Schütz 0 0Professor Dr. Stefan Simon 0 0Stephan Szukalski 0 0John Alexander Thain 100,000 0Michele Trogni 15,000 0Professor Dr. Norbert Winkeljohann 0 0Total 164,221 5,6121 Restricted Equity Awards. Mr. Blomeyer-Bartenstein has an entitlement linked to 5,582 shares through Restricted Equity Awards as part of his variable compensation. Of
these awards, 323 are due in 2019 and 5,259 in 2020.
The members of the Supervisory Board held 164,221 shares, amounting to less than 0.01 % of our shares as of February 15,2019.
As listed in the “Number of share awards” column in the table, the members who are employees of Deutsche Bank holdmatching awards granted under the Global Share Purchase Plan, which are scheduled to be delivered to them on November1, 2019, as well as Restricted Equity Awards (deferred share awards), which are granted to employees with deferred variablecompensation. The latter are marked separately in the table, and the further details concerning them as a compensationinstrument are reported in the section “Employee Compensation Report”.
As described in the “Management Report: Compensation Report: Compensation System for Supervisory Board Members”,25 % of each member’s compensation for services as a member of the Supervisory Board for a given prior year is, rather thanbeing paid in cash, converted into notional shares of Deutsche Bank AG in February of the following year. The cash value ofthe notional shares is paid to the member in February of the year following their departure from the Supervisory Board or theexpiration of their term of office, based on the market price of the Deutsche Bank share near the payment date. The table inthe section specified above shows the number of notional shares that will be credited in spring 2019 to members of theSupervisory Board as part of their 2018 compensation.
Related Party Transactions
For information on related party transactions please refer to Note 38 “Related Party Transactions“.

409
Deutsche Bank Auditing and ControllingAnnual Report 2018 Values and leadership principles of Deutsche Bank AG and Deutsche Bank Group
Auditing and Controlling
Audit Committee Financial ExpertThe Supervisory Board determined that Dr. Paul Achleitner, Katherine Garrett-Cox, Richard Meddings, Professor Dr. StefanSimon and Professor Dr. Norbert Winkeljohann, who are currently or were members of its Audit Committee until the end of2018, are “audit committee financial experts”, as such term is defined by the implementation rules of the U.S. Securities andExchange Commission issued pursuant to Section 407 of the Sarbanes-Oxley Act of 2002. These audit committee financialexperts are “independent” of the bank, as defined in Rule 10A-3 under the U.S. Securities Exchange Act of 1934. Inaccordance with the provisions of Sections 107 (4) and 100 (5) of the German Stock Corporation Act (AktG) as well asSection 25d (9) of the German Banking Act (KWG), they have the required expert knowledge in financial accounting andauditing.
Compensation Control Committee Compensation ExpertPursuant to Section 25d (12) of the German Banking Act (KWG), at least one member of the Compensation Control Committeemust have sufficient expertise and professional experience in the field of risk management and risk controlling, in particular,with regard to the mechanisms to align compensation systems to the company’s overall risk appetite and strategy and thebank’s capital base. The Supervisory Board determined that Dr. Paul Achleitner and Professor Dr. Stefan Simon, members ofthe Compensation Control Committee, fulfill the requirements of Section 25d (12) of the German Banking Act (KWG) andtherefore have the required expertise and professional experience in risk management and risk controlling.
For a description of the experience of the Supervisory Board members mentioned in the two foregoing paragraphs, pleasesee “Corporate Governance Statement/Corporate Governance Report: Management Board and Supervisory Board:Supervisory Board” in the Annual Report 2018.
Values and leadership principles of Deutsche Bank AG andDeutsche Bank Group
Deutsche Bank Group Code of Conduct and Code of Ethics for Senior FinancialOfficers
Deutsche Bank Group’s Code of Conduct sets out Deutsche Banks’s purpose, values and beliefs and minimum standards ofconduct that we expect all members of our Management Board and employees to follow. These values and standards governemployee interactions with our clients, competitors, business partners, government and regulatory authorities, andshareholders, as well as with other employees. In addition, the Code forms the cornerstone of our policies, which provideguidance on compliance with applicable laws and regulations.
In accordance with Section 406 of the Sarbanes-Oxley Act of 2002, we adopted a Code of Ethics for Senior Financial Officersof Deutsche Bank AG and Deutsche Bank Group with special obligations that apply to our “senior financial officers”, whichcurrently consist of Deutsche Bank’s Chairman of the Management Board, Chief Financial Officer, Group Controller as wellas certain other senior financial officers. There were no amendments or waivers to this Code of Ethics in 2018.
The current versions of the Code of Conduct as well as the Code of Ethics for Senior Financial Officers of Deutsche Bank AGand Deutsche Bank Group are available from Deutsche Bank’s website: www.db.com/ir/en/documents.htm.
Corporate Governance at Deutsche Bank AG and Deutsche Bank Group
Deutsche Bank established a Group Governance function to define, implement and monitor the corporate governanceframework of Deutsche Bank AG and Deutsche Bank Group and to perform this governance function throughout the Group.Group Governance addresses corporate governance issues in Deutsche Bank AG and Deutsche Bank Group, while focusingclosely on clear organizational structures aligned to the key elements of good corporate governance.

410
Deutsche Bank 3 – Corporate Governance ReportAnnual Report 2018
Deutsche Bank AG and Deutsche Bank Group are committed to ensuring a corporate governance framework in accordancewith international standards and statutory provisions. In support of this objective, Deutsche Bank AG and Deutsche BankGroup have instituted clear corporate governance principles.
Further details on corporate governance are published on Deutsche Bank’s website (www.db.com/ir/en/corporate-governance.htm).
Principal accountant fees and servicesIn accordance with German law, our principal accountant is appointed at our Annual General Meeting based on arecommendation of our Supervisory Board. The Audit Committee of our Supervisory Board prepares such a recommendation.Subsequent to the principal accountant’s appointment, the Audit Committee awards the contract and in its sole authorityapproves the terms and scope of the audit and all audit engagement fees as well as monitors the principal accountant’sindependence. KPMG AG Wirtschaftsprüfungsgesellschaft was our principal accountant for the 2017 and 2018 fiscal years,respectively.
The table set forth below contains the aggregate fees billed for each of the last two fiscal years by KPMG AGWirtschaftsprüfungsgesellschaft and the worldwide member firms of KPMG International in each of the following categories:(1) Audit fees, which are fees for professional services for the audit of our annual financial statements or services that arenormally provided by the accountant in connection with statutory and regulatory filings or engagements for those fiscal years,(2) Audit-related fees, which are fees for assurance and related services that are reasonably related to the performance of theaudit or review of our financial statements and are not reported as Audit fees, (3) Tax-related fees, which are fees forprofessional services rendered for tax compliance, tax consulting and tax planning, and (4) All other fees, which are fees forproducts and services other than Audit fees, Audit-related fees and Tax-related fees. These amounts include expenses andexclude Value Added Tax (VAT).
Fee category in € m. 2018 2017Audit fees 60 51Audit-related fees 12 18Tax-related fees 5 4All other fees 1 0Total fees 1 78 73
The Audit fees include fees for professional services for the audit of our annual financial statements and consolidated financialstatements and do not include the 2017 audit fees for Postbank and its subsidiaries, as the 2017 financials of those entitiesare not audited by KPMG. The Audit-related fees include fees for other assurance services required by law or regulations, inparticular for financial service specific attestation, for quarterly reviews, for spin-off audits and for merger audits, as well asfees for voluntary assurance services, like voluntary audits for internal management purposes and the issuance of comfortletters. Our Tax-related fees include fees for services relating to the preparation and review of tax returns and relatedcompliance assistance and advice, tax consultation and advice relating to Group tax planning strategies and initiatives andassistance with assessing compliance with tax regulations.
United States law and regulations, and our own policies, generally require that all engagements of our principal accountantbe pre-approved by our Audit Committee or pursuant to policies and procedures adopted by it. Our Audit Committee hasadopted the following policies and procedures for consideration and approval of requests to engage our principal accountantto perform non-audit services. Engagement requests must in the first instance be submitted to the Accounting EngagementTeam. If the request relates to services that would impair the independence of our principal accountant, the request must berejected. Our Audit Committee has given its pre-approval for specified assurance, financial advisory and tax services, providedthe expected fees for any such service do not exceed € 1 million. If the engagement request relates to such specified pre-approved services, it may be approved by the Accounting Engagement Team and must thereafter be reported to the AuditCommittee. If the engagement request relates neither to prohibited non-audit services nor to pre-approved non-audit services,it must be forwarded to the Audit Committee for consideration. In addition, to facilitate the consideration of engagementrequests between its meetings, the Audit Committee has delegated approval authority to several of its members who are“independent” as defined by the Securities and Exchange Commission and the New York Stock Exchange. Such membersare required to report any approvals made by them to the Audit Committee at its next meeting.
Additionally, United States law and regulations permit the pre-approval requirement to be waived with respect to engagementsfor non-audit services aggregating to no more than five percent of the total amount of revenues we paid to our principalaccountant, if such engagements were not recognized by us at the time of engagement and were promptly brought to theattention of our Audit Committee or a designated member thereof and approved prior to the completion of the audit. In 2017and 2018, the percentage of the total amount of revenues we paid to our principal accountant for non-audit services that wassubject to such a waiver was less than 5 % for each year.

411
Deutsche Bank Compliance with the German Corporate Governance CodeAnnual Report 2018 Statement on the Suggestions of the German Corporate Governance Code
Compliance with the German Corporate GovernanceCode
Declaration pursuant to Section 161 German Stock CorporationAct (AktG) (Declaration of Conformity 2018)The Declaration of Conformity pursuant to Section 161 of the Stock Corporation Act, last issued by the Supervisory Board andManagement Board on October 26, 2017, was reissued at the meeting of the Supervisory Board on October 25, 2018. TheManagement Board and Supervisory Board state according to Section 161 of the Stock Corporation Act:
The last Declaration of Conformity was issued on October 26, 2017. Since then Deutsche Bank AG has complied and willcontinue to comply in the future with the recommendations of the “Government Commission on the German CorporateGovernance Code” in the version of the Code dated February 7, 2017, published in the Bundesanzeiger on April 24, 2017,subject to the following deviations:
– Relating to No. 5.3.3, according to which the supervisory board shall form a nomination committee composed exclusivelyof shareholder representatives. Section 25 (d) of the German Banking Act stipulates that the nomination committee of thesupervisory board must take on additional tasks that should be performed not solely by the shareholder representatives onthe supervisory board. For this reason, the Nomination Committee of the Supervisory Board of Deutsche Bank AG alsocomprises representatives of the employees. However, it will be ensured that the candidate recommendations for theelection proposals to the General Meeting will be prepared exclusively by the Committee’s shareholder representatives.
– Relating to No. 4.2.3 (2) sentence 6, according to which the amount of compensation for the management board membersshall be capped, both overall and with regard to variable compensation components. The existing employment contracts(in conjunction with equity plan conditions) of the members of the Management Board of Deutsche Bank AG do provide fora limit (cap) in the awarding of total compensation and their variable compensation components. In this context, however,some hold the view that such limits would have to apply not only to the granting and awarding of the compensationcomponents but also to their later payout. Although Deutsche Bank AG does not consider this view to be convincing, westate merely as a precautionary measure that a limit (cap) has not been set for the payout amount of deferred equity-basedcompensation and that therefore Deutsche Bank AG deviates from the recommendation in No. 4.2.3 (2) sentence 6according to this interpretation.
Statement on the Suggestions of the German CorporateGovernance CodeDeutsche Bank voluntarily complies with the suggestions of the Code in the version dated February 7, 2017, with the followingexceptions:
– The representatives appointed by Deutsche Bank to exercise shareholders’ voting rights can be reached by those attendingthe General Meeting until just before voting commences. The representatives are reachable by those not attending until 12noon on the day of the General Meeting using the instruction tool in the Internet (Code No. 2.3.2). In this manner, the riskof any technical disruptions directly before voting takes place can basically be excluded. The broadcast through the Internetalso ends at the latest at this time, which means information useful for forming an opinion can no longer be expected afterthis point by shareholders who only participate through proxies.
– Our broadcast of the General Meeting through the Internet (Code No. 2.3.3) starts with the opening of the General Meetingby the Chairman and covers the report of the Supervisory Board and the report of the Management Board. Theshareholders then have the opportunity to hold their discussions with management. These take place without a publicbroadcast through the Internet.
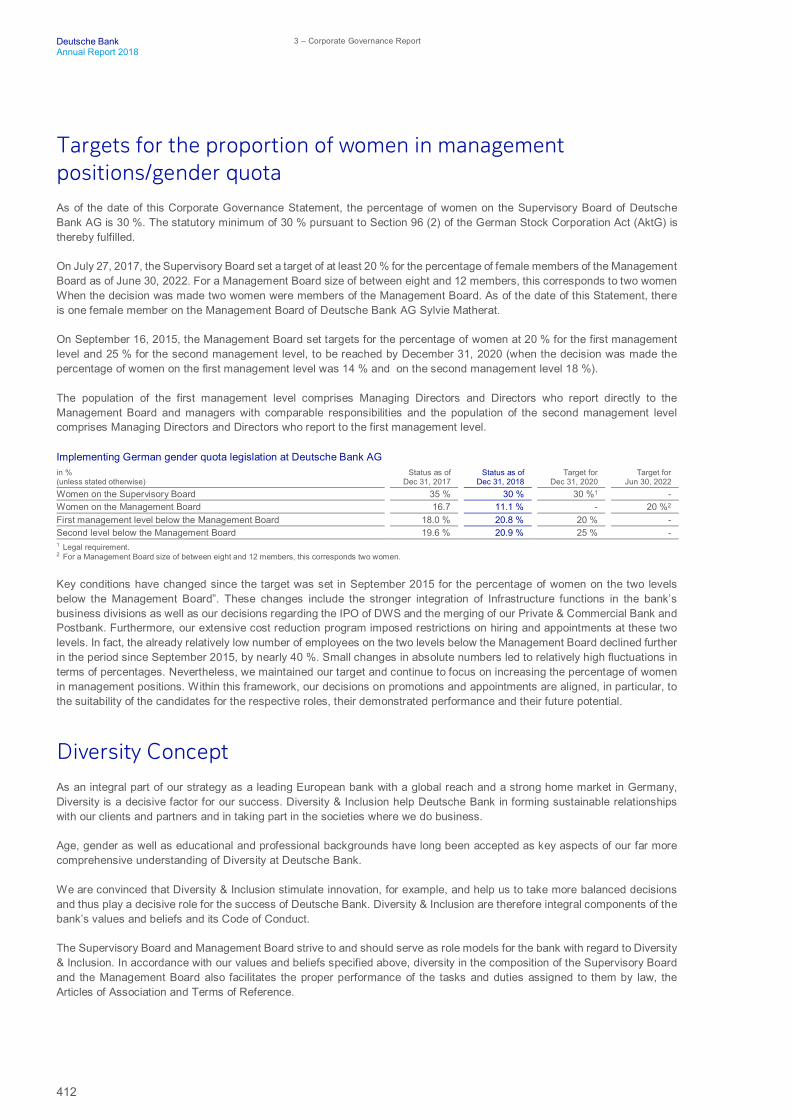
412
Deutsche Bank 3 – Corporate Governance ReportAnnual Report 2018
Targets for the proportion of women in managementpositions/gender quotaAs of the date of this Corporate Governance Statement, the percentage of women on the Supervisory Board of DeutscheBank AG is 30 %. The statutory minimum of 30 % pursuant to Section 96 (2) of the German Stock Corporation Act (AktG) isthereby fulfilled.
On July 27, 2017, the Supervisory Board set a target of at least 20 % for the percentage of female members of the ManagementBoard as of June 30, 2022. For a Management Board size of between eight and 12 members, this corresponds to two womenWhen the decision was made two women were members of the Management Board. As of the date of this Statement, thereis one female member on the Management Board of Deutsche Bank AG Sylvie Matherat.
On September 16, 2015, the Management Board set targets for the percentage of women at 20 % for the first managementlevel and 25 % for the second management level, to be reached by December 31, 2020 (when the decision was made thepercentage of women on the first management level was 14 % and on the second management level 18 %).
The population of the first management level comprises Managing Directors and Directors who report directly to theManagement Board and managers with comparable responsibilities and the population of the second management levelcomprises Managing Directors and Directors who report to the first management level.
Implementing German gender quota legislation at Deutsche Bank AGin %(unless stated otherwise)
Status as ofDec 31, 2017
Status as ofDec 31, 2018
Target forDec 31, 2020
Target forJun 30, 2022
Women on the Supervisory Board 35 % 30 % 30 %1 -Women on the Management Board 16.7 11.1 % - 20 %2
First management level below the Management Board 18.0 % 20.8 % 20 % -Second level below the Management Board 19.6 % 20.9 % 25 % -1 Legal requirement.2 For a Management Board size of between eight and 12 members, this corresponds two women.
Key conditions have changed since the target was set in September 2015 for the percentage of women on the two levelsbelow the Management Board”. These changes include the stronger integration of Infrastructure functions in the bank’sbusiness divisions as well as our decisions regarding the IPO of DWS and the merging of our Private & Commercial Bank andPostbank. Furthermore, our extensive cost reduction program imposed restrictions on hiring and appointments at these twolevels. In fact, the already relatively low number of employees on the two levels below the Management Board declined furtherin the period since September 2015, by nearly 40 %. Small changes in absolute numbers led to relatively high fluctuations interms of percentages. Nevertheless, we maintained our target and continue to focus on increasing the percentage of womenin management positions. Within this framework, our decisions on promotions and appointments are aligned, in particular, tothe suitability of the candidates for the respective roles, their demonstrated performance and their future potential.
Diversity ConceptAs an integral part of our strategy as a leading European bank with a global reach and a strong home market in Germany,Diversity is a decisive factor for our success. Diversity & Inclusion help Deutsche Bank in forming sustainable relationshipswith our clients and partners and in taking part in the societies where we do business.
Age, gender as well as educational and professional backgrounds have long been accepted as key aspects of our far morecomprehensive understanding of Diversity at Deutsche Bank.
We are convinced that Diversity & Inclusion stimulate innovation, for example, and help us to take more balanced decisionsand thus play a decisive role for the success of Deutsche Bank. Diversity & Inclusion are therefore integral components of thebank’s values and beliefs and its Code of Conduct.
The Supervisory Board and Management Board strive to and should serve as role models for the bank with regard to Diversity& Inclusion. In accordance with our values and beliefs specified above, diversity in the composition of the Supervisory Boardand the Management Board also facilitates the proper performance of the tasks and duties assigned to them by law, theArticles of Association and Terms of Reference.
413
Deutsche Bank Compliance with the German Corporate Governance CodeAnnual Report 2018 Diversity Concept
Based on Deutsche Bank’s understanding of Diversity & Inclusion, the values and beliefs and the measures described in thefollowing for their implementation also apply – to the extent legally admissible – to the Supervisory Board and the ManagementBoard of Deutsche Bank AG. The Supervisory Board considers diversity in the company, in particular, when filling positionson the Management Board and Supervisory Board.
At its meeting on July 26, 2018, the Supervisory Board of Deutsche Bank AG approved a Suitability Guideline for selectingmembers of the Supervisory Board and Management Board of Deutsche Bank AG, which also contains diversity principles.This Suitability Guideline implements the “Guidelines on the assessment of the suitability of members of the managementbody and key function holders” issued jointly by the European Banking Authority and European Securities and MarketsAuthority.
Diversity Concept for the Supervisory Board
The Supervisory Board is to be composed in such a way that its members as a whole possess the expertise, skills andprofessional experience required to effectively monitor and advise the Management Board in its management of DeutscheBank AG and Deutsche Bank Group also with regard to the observance of the relevant bank supervisory regulations.
In light of the international operations of Deutsche Bank, care shall be taken, in particular, that the Supervisory Board has anappropriate number of members with many years of international experience.
Also in light of the legal requirements to be observed, the Supervisory Board shall be composed of at least 30 % women andat least 30 % men.
There is an age limit of 70, in principle, for members of the Supervisory Board and the maximum length of each individualSupervisory Board membership shall generally not exceed 15 years.
Implementation
It should be taken into account that the Supervisory Board can only influence the composition of the Supervisory Board throughits proposals to the General Meeting for the election of the shareholder representatives.
Based on a proposal of the Nomination Committee, a profile of requirements was issued for the Supervisory Board andcandidate profiles were issued for the Chairperson of the Supervisory Board, the members of the Supervisory Board and thechairpersons of each of the committees. The profiles summarize the knowledge, abilities and experience required to properlycomplete the tasks of the Supervisory Board of Deutsche Bank AG (collective suitability).
For the election proposals to the General Meeting, the Supervisory Board takes into account the legal requirements accordingto which the Supervisory Board shall be composed of at least 30 % women and at least 30 % men (joint fulfilment byshareholder and employee representatives).
The Nomination Committee also supports the Supervisory Board with the periodic assessment, to be performed at least oncea year, of the knowledge, skills and experience of the individual members of the Supervisory Board as well as of theSupervisory Board in its entirety.
Results achieved in the 2018 financial year
At the end of the financial year, 14 men and six women (30 %) were members of the Supervisory Board. The statutory minimumquota of 30 % was thus fulfilled. The number of women reduced by one versus the prior year’s reporting date resulted fromthe new election of employee representatives to the Supervisory Board in the 2018 financial year.
The age structure is diverse, ranging from 34 to 66 years of age at the end of the financial year and spanning three generations,according to the general definition of the term.
At the end of the financial year the length of experience as member of the Supervisory Board of Deutsche Bank ranged fromunder one year to around 15 years. Seven of the 20 members joined the Supervisory Board in the 2018 financial year.
In accordance with our objectives specified above, all of the shareholder representatives on the Supervisory Board have manyyears of international experience in various companies and functions.

414
Deutsche Bank 3 – Corporate Governance ReportAnnual Report 2018
The diverse range of the members’ educational and professional backgrounds includes banking, business administration,economics, law, history and information technology.
The bank transparently reports on Supervisory Board diversity in addition to the information presented above in this CorporateGovernance Report / Corporate Governance Statement in the section “Management Board and Supervisory Board:Supervisory Board” as well as on the bank’s website: www.db.com (Heading “Investor Relations”, “Corporate Governance”,“Supervisory Board”).
Diversity Concept for the Management Board
Through the composition of the Management Board, it is to be ensured that its members have, at all times, the requiredknowledge, skills and experience necessary to properly perform their tasks. Accordingly, when selecting members for theManagement Board, care is to be taken that they collectively have sufficient expertise and diversity within the meaning of ourobjectives specified above.
By way of resolution of the Supervisory Board, the Management Board should be composed of at least 20 % women by June30, 2022. For a Management Board size of between eight and 12 members, this corresponds to two women.
For the Management Board members, the age limit is reached, in general, when a member reaches the retirement age,according to the rules of the German statutory pension insurance scheme, for the long-term insured to claim an early retirementpension (“Renteneintrittsalter zur vorzeitigen Inanspruchnahme der Altersrente für langjährig Versicherte”). This is currentlyat 63 years of age.
Implementation
In accordance with the law, the Articles of Association and Terms of Reference, the Supervisory Board adopted candidateprofiles for the members of the Management Board, based on a proposal from the Nomination Committee. These profiles takeinto account an “Expertise and Capability Matrix”, specifying, among other things, the required knowledge, skills andexperience to perform the tasks as Management Board member, in order to successfully develop and implement the bank’sstrategy in the respective market or the respective division and as a management body collectively.
In identifying candidates to fill a position on the bank’s Management Board, the Supervisory Board’s Nomination Committeetakes into account the appropriate diversity balance of all Management Board members collectively. Furthermore, it alsoconsiders the targets set by the Supervisory Board in accordance with statutory requirements for the percentage of womenon the Management Board.
The Nomination Committee supports the Supervisory Board with the periodic assessment, to be performed at least once ayear, of the knowledge, skills and experience of the individual members of the Management Board and of the ManagementBoard in its entirety.
Results achieved in the 2018 financial year
At the end of the financial year, the Management Board composed eight men and one woman. The target of 20 % of themembers or two women adopted for June 30, 2022 for the Management Board was therefore not yet met following thedeparture of Kimberly Hammonds during the 2018 financial year. The age structure is diverse, ranging from 47 to 63 years ofage at the end of the financial year and spanning two generations, according to the general definition of the term.
The length of experience as member of the Management Board of Deutsche Bank ranged from one-and-a-half years to aroundsix years. Also with our strategy in mind of being a leading European bank with a global reach and a strong home market inGermany, four of the nine Management Board members as of the end of the financial year have a German background.However, the ethnic diversity of the Management Board does not currently reflect the full diversity of the markets where wedo business or the diversity of our employees.
The diverse range of the members’ educational and professional backgrounds includes banking, business administration,economics, law and engineering.
The bank transparently reports on Management Board diversity in addition to the information presented above in this CorporateGovernance Report / Corporate Governance Statement in the section “Management Board and Supervisory Board:
Management Board” as well as on the bank’s website: www.db.com (Heading “Corporate Governance”, “ManagementBoard”).

4Supplementary Information ( Unaudited)
416 Non-GAAP Financial Measures
420 Declaration of Backing
421 Group Five-Year Record
422 Imprint / Publications

416
Deutsche Bank 4 – Supplementary InformationAnnual Report 2018
Non-GAAP Financial Measures
This document and other documents the Group has published or may publish contain non-GAAP financial measures. Non-GAAP financial measures are measures of the Group’s historical or future performance, financial position or cash flows thatcontain adjustments that exclude or include amounts that are included or excluded, as the case may be, from the most directlycomparable measure calculated and presented in accordance with IFRS in the Group’s financial statements.
Return on Equity RatiosThe Group reports a post-tax return on average shareholders’ equity and a post-tax return on average tangible shareholders’equity, each of which is a non-GAAP financial measure.
The post-tax returns on average shareholders’ equity and average tangible shareholders’ equity are calculated as net income(loss) attributable to Deutsche Bank shareholders as a percentage of average shareholders’ equity and average tangibleshareholders’ equity, respectively.
Net income (loss) attributable to Deutsche Bank shareholders for the segments is a non-GAAP financial measure and isdefined as net income (loss) excluding post-tax income (loss) attributable to noncontrolling interests. For the Group, it reflectsthe reported effective tax rate, which was 74 % for the full year 2018, 160 % for 2017 and (67) % for 2016. For the segments,the applied tax rate was 28 % for all reported periods in 2018, 33 % for all reported periods in 2017 and 35 % for all reportedperiods in 2016.
At the Group level, tangible shareholders' equity is shareholders’ equity as reported in the consolidated balance sheetexcluding goodwill and other intangible assets. Tangible shareholders´ equity for the segments is calculated by deductinggoodwill and other intangible assets from shareholders’ equity as allocated to the segments, as described in Note 4 “BusinessSegments and Related Information” to the consolidated financial statements within the section “Measurement of SegmentProfit and Loss”. Shareholders’ equity and tangible shareholders’ equity are presented on an average basis.
The Group believes that a presentation of average tangible shareholders’ equity makes comparisons to its competitors easier,and refers to this measure in the return on equity ratios presented by the Group. However, average tangible shareholders’equity is not a measure provided for in IFRS, and the Group’s ratios based on this measure should not be compared to othercompanies’ ratios without considering differences in the calculations.
The reconciliation of the aforementioned ratios is set forth in the table below:
2018
in € m.(unless stated otherwise)
Corporate &Investment
Bank
Private &Commercial
BankAsset
Management
Non-CoreOperations
UnitCorporate &
Other TotalIncome (loss) before income taxes (IBIT) 530 829 367 – (396) 1,330Income tax expense 0 0 0 – 0 (989)Net Income (loss) 382 597 264 – (902) 341Net income (loss) attributable tononcontrolling interests 0 0 0 – (75) (75)Net Income attributable to DBshareholders and additionalequity components 382 597 264 – (976) 267
Average shareholders’ equity 43,427 14,514 4,669 – 0 62,610Add (deduct): Average goodwilland other intangible assets (3,090) (2,113) (3,183) – (0) (8,386)Average tangible shareholders’ equity 40,337 12,401 1,485 – 0 54,224Post-tax return on averageshareholders’ equity 1 % 4 % 6 % – N/M 0 %Post-tax return on averagetangible shareholders’ equity 1 % 5 % 18 % – N/M 1 %

417
Deutsche Bank Non-GAAP Financial MeasuresAnnual Report 2018 Adjusted Costs
2017
in € m.(unless stated otherwise)
Corporate &Investment
Bank
Private &Commercial
BankAsset
Management
Non-CoreOperations
UnitCorporate &
Other TotalIncome (loss) before income taxes (IBIT) 1,096 465 732 – (1,066) 1,228Income tax expense 0 0 0 – 0 (1,963)Net Income (loss) 734 312 490 – (2,272) (735)Net income (loss) attributable tononcontrolling interests 0 0 0 – (15) (15)Net Income attributable to DBshareholders and additionalequity components 734 312 490 – (2,287) (751)
Average shareholders’ equity 44,197 14,943 4,687 – 99 63,926Add (deduct): Average goodwilland other intangible assets (2,982) (2,082) (3,816) – (1) (8,881)Average tangible shareholders’ equity 41,215 12,861 871 – 98 55,045Post-tax return on averageshareholders’ equity 2 % 2 % 10 % – N/M (1) %Post-tax return on averagetangible shareholders’ equity 2 % 2 % 56 % – N/M (1) %
2016
in € m.(unless stated otherwise)
Corporate &Investment
Bank
Private &Commercial
BankAsset
Management
Non-CoreOperations
UnitCorporate &
Other TotalIncome (loss) before income taxes (IBIT) 1,973 1,547 (190) (3,187) (952) (810)Income tax expense 0 0 0 0 0 (546)Net Income (loss) 1,290 1,011 (124) (2,085) (1,449) (1,356)Net income (loss) attributable tononcontrolling interests 0 0 0 0 (45) (45)Net Income attributable to DBshareholders and additionalequity components 1,290 1,011 (124) (2,085) (1,495) (1,402)
Average shareholders’ equity 40,312 14,371 4,460 690 2,249 62,082Add (deduct): Average goodwilland other intangible assets (2,568) (1,775) (4,636) (3) (894) (9,876)Average tangible shareholders’ equity 37,744 12,595 (175) 687 1,355 52,206Post-tax return on averageshareholders’ equity 3 % 7 % (3) % N/M N/M (2) %Post-tax return on averagetangible shareholders’ equity 3 % 8 % 71 % N/M N/M (3) %
Adjusted CostsAdjusted costs is one of the Group’s key performance indicators and is a non-GAAP financial measure most directlycomparable to the IFRS financial measure noninterest expenses. Adjusted costs is calculated by deducting from noninterestexpenses under IFRS (i) impairment of goodwill and other intangible assets, (ii) litigation, (iii) policyholder benefits and claimsand (iv) restructuring and severance. Policyholder benefits and claims arose from the Abbey Life Assurance business whichwas sold in late 2016 and so will not occur in future periods. The Group believes that a presentation of noninterest expensesexcluding the impact of these items provides a more meaningful depiction of the costs associated with our operatingbusinesses.
2018
in € m.Corporate &
Investment Bank
Private &Commercial
BankAsset
ManagementNon-Core
Operations UnitCorporate &
OtherTotal
ConsolidatedNoninterest expenses 12,372 8,923 1,735 - 431 23,461Impairment of goodwill and otherintangible assets 0 0 0 - 0 0Litigation provisions 56 (51) 33 - 50 88Policyholder benefits and claims 0 0 0 - 0 0Restructuring and severance 339 121 45 - 58 563Adjusted costs 11,976 8,853 1,657 - 324 22,810

418
Deutsche Bank 4 – Supplementary InformationAnnual Report 2018
2017
in € m.Corporate &
Investment Bank
Private &Commercial
BankAsset
ManagementNon-Core
Operations UnitCorporate &
OtherTotal
ConsolidatedNoninterest expenses 12,892 9,411 1,799 - 593 24,695Impairment of goodwill and otherintangible assets 6 12 3 - 0 21Litigation provisions 44 53 5 - 112 213Policyholder benefits and claims 0 0 0 - 0 0Restructuring and severance 151 399 18 - 2 570Adjusted costs 12,690 8,947 1,774 - 478 23,891
2016
in € m.Corporate &
Investment Bank
Private &Commercial
BankAsset
ManagementNon-Core
Operations UnitCorporate &
OtherTotal
ConsolidatedNoninterest expenses 13,926 9,104 3,205 2,682 525 29,442Impairment of goodwill and otherintangible assets 285 0 1,021 (49) (0) 1,256Litigation provisions 608 56 (0) 1,750 (18) 2,397Policyholder benefits and claims 0 0 374 0 0 374Restructuring and severance 390 205 69 23 (5) 681Adjusted costs 12,643 8,843 1,741 958 549 24,734
Book Value and Tangible Book Value per Basic ShareOutstandingBook value per basic share outstanding and tangible book value per basic share outstanding are non-GAAP financialmeasures that are used and relied upon by investors and industry analysts as capital adequacy metrics. Book value per basicshare outstanding represents the Bank’s total shareholders’ equity divided by the number of basic shares outstanding atperiod-end. Tangible book value represents the Bank’s total shareholders’ equity less goodwill and other intangible assets.Tangible book value per basic share outstanding is computed by dividing tangible book value by period-end basic sharesoutstanding.
Tangible Book Value
in € m.2018 increase (decrease)
from 20172017 increase (decrease)
from 2016(unless stated otherwise) 2018 2017 2016 in € m. in % in € m. in %Total shareholders’ equity (Book value) 62,495 63,174 59,833 (680) (1) 3,341 6Goodwill and other intangible assets (8,372)1 (8,839) (8,982) 467 (5) 143 (2)Tangible shareholders’ equity (Tangiblebook value) 54,122 54,335 50,851 (213) (0) 3,484 71 Excludes Goodwill and other intangible assets attributable to partial sale of DWS.
Basic Shares Outstanding
in € m.2018 increase (decrease)
from 20172017 increase (decrease)
from 2016(unless stated otherwise) 2018 2017 2016 in € m. in % in € m. in %Number of shares
2,066.8 2,066.8 1,545.5 0 0 521.3 33.7Shares outstanding:
Treasury shares (1.3) (0.4) (0.2) (1.0) N/M (0.1) 63.5Vested share awards 39.8 28.5 23.3 11.3 39.5 5.2 22.4
Basic shares outstanding1 2,105.2 2,094.9 1,568.6 10.3 0.5 526.3 33.6
Book value per basic share outstanding in € 29.69 30.16 38.14 (0.47) (1.6) (7.98) (20.9)Tangible book value per basic shareoutstanding in € 25.71 25.94 32.42 (0.23) (0.9) (6.48) (20.0)1 The basic shares outstanding have been adjusted for comparative periods in order to reflect the effect of the bonus component of subscription rights issued in April 2017 in
connection with the capital increase.

419
Deutsche Bank Non-GAAP Financial MeasuresAnnual Report 2018 Fully loaded CRR/CRD 4 Measures
Fully loaded CRR/CRD 4 MeasuresOur regulatory assets, exposures, risk-weighted assets, capital and ratios thereof are calculated for regulatory purposes andare set forth throughout this document under CRR/CRD 4. CRR/CRD 4 provides for “transitional” (or “phase-in”) rules, underwhich capital instruments that are no longer eligible under the new rules are permitted to be phased out as the new rules onregulatory adjustments are phased in, as well as regarding the risk weighting of certain categories of assets.
When referring to Deutsche Bank results according to transitional rules we use the term “CRR/CRD 4”. When referring toresults according to full application of the final CRR/CRD 4 framework (without consideration of applicable transitionalmethodology) we use the term “CRR/CRD 4 fully loaded”. For the calculation of risk-weighted assets (RWA), CRR/CRD 4maintained transitional rules that permitted the grandfathering of equity investments at a risk-weight of 100 %. Thesetransitional arrangements have been considered lastly for December 31, 2017 and expired thereafter, resulting in no differencethereafter for RWA under the fully loaded or transitional regime.
Since 2015 the Common Equity Tier 1 (CET 1) minimum capital requirement applicable to the Group is 4.5 % of risk weightedassets. In addition to this minimum capital requirement, various capital buffer requirements were phased in starting 2016 andwill become fully effective from 2019 onwards. The development and maintenance of a high quality capital base which shouldprimarily consist of Common Equity Tier 1 reflects one of the core elements of the CRR/CRD 4 framework. Specific regulatoryadjustments were subject to transitional rules. For instance, deductions for deferred tax assets that rely on future profitabilityor deductions for indirect and synthetic holdings of own instruments and capital instruments issued by financial sector entitieswere phased in. These phase-in arrangements to the CET 1 were still applicable for December 31, 2017 reporting as thephase-in percentage was at 80 % in 2017. They are not applicable from January 1, 2018 onwards as the phase-in percentageincreased to 100 %. At the same time minority interest only recognizable under the transitional rules is now phased out with a100 % phaseout rate since January 1, 2018.
Transitional arrangements are still applicable for Additional Tier 1 (AT1) and Tier 2 (T2) capital. Capital instruments that nolonger qualify as AT1 or T2 capital under the CRR/CRD 4 fully loaded rules are subject to grandfathering rules during thetransitional period and are being phased out from 2013 to 2022 with their recognition capped at 50 % in 2017, 40 % in 2018and the cap decreasing by ten percentage points every year thereafter.
As the final implementation of CRR/CRD 4 may differ from our expectations, and our competitors’ assumptions and estimatesregarding such implementation may vary, our fully loaded CRR/CRD 4 measures may not be comparable with similarly labelledmeasures used by our competitors.
We believe that these fully loaded CRR/CRD 4 calculations provide useful information to investors as they reflect our progressagainst the new regulatory capital standards and as many of our competitors have been describing CRR/CRD 4 calculationson a fully loaded basis.
For descriptions of these fully loaded CRR/CRD 4 measures and the differences from the most directly comparable measuresunder the CRR/CRD 4 transitional rules, please refer to “Management Report: Risk Report: Risk and Capital Performance:Capital, Leverage Ratio and MREL”, in particular the subsections thereof entitled “Development of Regulatory Capital”,“Development of Risk-Weighted Assets” and “Leverage Ratio”.

420
Deutsche Bank 4 – Supplementary InformationAnnual Report 2018
Declaration of Backing
Deutsche Bank AG ensures, except in the case of political risk, that the following subsidiaries are able to meet theircontractual liabilities:
D B Investments (GB) Limited, London Deutsche Bank Trust Company Americas, NewYork
DB International (Asia) Limited, Singapore Deutsche Holdings (Malta) Ltd., St. Julians
DB Privat- und Firmenkundenbank AG, formerlyDeutsche Bank Privat- und Geschäftskunden AG,Frankfurt am Main
Deutsche Immobilien Leasing GmbH, Düsseldorf
Deutsche Morgan Grenfell Group Public LimitedDeutsche Australia Limited, Sydney Company, London
DEUTSCHE BANK A.Ş., Istanbul Deutsche Securities Inc., Tokyo
Deutsche Bank Americas Holding Corp.,Wilmington
Deutsche Securities Asia Limited, Hong Kong
Deutsche Bank (China) Co., Ltd., Beijing Deutsche Securities Saudi Arabia (a closed jointstock company), Riyadh
Deutsche Bank Europe GmbH, Frankfurt am Main norisbank GmbH, Bonn
Deutsche Bank Luxembourg S.A., Luxembourg Joint Stock Company Deutsche Bank DBU, Kiev
Deutsche Bank (Malaysia) Berhad, Kuala Lumpur OOO “Deutsche Bank”, Moscow
Deutsche Bank Polska Spółka Akcyjna, Warsaw1 Sal. Oppenheim jr. & Cie. AG & Co. KGaA, Köln
Deutsche Bank S.A. – Banco Alemão, São Paulo
Deutsche Bank, Sociedad Anónima Española,Madrid
Deutsche Bank Società per Azioni, Milan
Deutsche Bank (Suisse) SA, Geneva
1 With the transfer from Deutsche Bank Polska Spólka Akcyjna to Santander Bank Polska, of the Polish Private & Commercial Bank business excluding its foreign currencydenominated retail mortgage portfolio, the declaration of backing for Deutsche Bank Polska Spólka Akcyjna was withdrawn and terminated by Deutsche Bank AG with respectto the divested business with effect as of November 10, 2018. In all other respects, the declaration of backing issued in favor of Deutsche Bank Polska Spólka Akcyjnacontinues to apply.

421
Deutsche Bank Group Five-Year RecordAnnual Report 2018 Fully loaded CRR/CRD 4 Measures
Group Five-Year Record
in € m. 2018 2017 2016 2015 2014Net interest income 13,192 12,378 14,707 15,881 14,272Provision for credit losses 525 525 1,383 956 1,134Net interest income after provision for credit losses 12,667 11,853 13,324 14,925 13,138Commissions and fee income 10,039 11,002 11,744 12,765 12,409Net gains (losses) on financial assets/liabilitiesat fair value through profit or loss 1,332 2,926 1,401 3,842 4,299Other noninterest income (loss) 753 141 2,161 1,037 969Total net revenues 25,316 26,447 30,014 33,525 31,949Compensation and benefits 11,814 12,253 11,874 13,293 12,512General and administrative expenses 11,286 11,973 15,454 18,632 14,654Policyholder benefits and claims 0 0 374 256 289Impairment of goodwill and other intangible assets 0 21 1,256 5,776 111Restructuring activities 360 447 484 710 133Total noninterest expenses 23,461 24,695 29,442 38,667 27,699Income (loss) before income taxes 1,330 1,228 (810) (6,097) 3,116Income tax expense 989 1,963 546 675 1,425Net income (loss) 341 (735) (1,356) (6,772) 1,691Net income attributable to noncontrolling interests 75 15 45 21 28Net income (loss) attributable to Deutsche Bank shareholdersand additional equity components 267 (751) (1,402) (6,794) 1,663
in €(unless stated otherwise)Basic earnings per share1,2 (0.01) (0.53) (1.08) (4.52) 1.20Diluted earnings per share1,3 (0.01) (0.53) (1.08) (4.52) 1.17Dividends paid per share4 0.11 0.196 0.00 0.75 0.75Dividends paid per share in U.S.$5 0.13 0.21 0.00 0.84 1.021 The number of average basic shares outstanding has been adjusted for all periods before April 2017 in order to reflect the effect of the bonus element of the subscription
rights issue in connection with the capital increase in April 2017. The number of average basic shares outstanding has been adjusted for 2014 in order to reflect the effect ofthe bonus component of subscription rights issued in connection with the capital increase completed in June 2014.
2 We calculate basic earnings per share for each period by dividing our net income attributable to Deutsche Bank shareholders by the average number of common sharesoutstanding. Earnings were adjusted by € 292 million, € 298 million, € 276 million and € 228 million net of tax for the coupons paid on Additional Tier 1 Notes in April 2018,April 2017, April 2016 and April 2015, respectively.
3 We calculate diluted earnings per share for each period by dividing our net income attributable to Deutsche Bank shareholders by the average number of common sharesoutstanding, both after assumed conversions. Earnings were adjusted by € 292 million, € 298 million, € 276 million and € 228 million net of tax for the coupons paid onAdditional Tier 1 Notes in April 2018, April 2017, April 2016 and April 2015, respectively. No dilutive effect occurred for 2018 as the net income was offset by coupons paid onAdditional Tier 1 Notes. For 2017, 2016 and 2015, there is no dilutive effect as the Group reported a net loss.
4 Dividends declared and paid in the year.5 Dividends declared and paid in US $ were translated from euro into US.$ based on the exchange rates as of the respective payment days.6 The dividend paid in 2017 consisted of € 0.11 for 2016 and of € 0.08 for 2015 that were paid simultaneously in 2017 after the agreement by the annual general meeting in
2017.
2018 2017 2016 2015 2014in € m. in € m. in € m. in € m. in € m.
Total assets 1,348,137 1,474,732 1,590,546 1,629,130 1,708,703Loans at amortized cost 400,297 401,699 408,909 427,749 405,612Deposits 564,405 581,873 550,204 566,974 532,931Long-term debt 152,083 159,715 172,316 160,016 144,837Common shares1 5,291 5,291 3,531 3,531 3,531Total shareholders’ equity 62,495 63,174 59,833 62,678 68,351Common Equity Tier 1 capital (CRR/CRD 4)2 47,486 50,808 47,782 52,429 60,103Common Equity Tier 1 capital (CRR/CRD 4 fully loaded)2 47,486 48,300 42,279 44,101 46,076Tier 1 capital (CRR/CRD 4)2 55,091 57,631 55,486 58,222 63,898Tier 1 capital (CRR/CRD 4 fully loaded)2 52,082 52,921 46,829 48,651 50,695Total regulatory capital (CRR/CRD 4)2 61,292 64,016 62,158 64,522 68,293Total regulatory capital (CRR/CRD 4 fully loaded)2 61,292 63,250 59,502 60,976 63,0721 Capital increased from authorized capital against cash contributions through a public offering with subscription rights in April 2017 and in June 2014.2 Figures presented based on the transitional rules (“CRR/CRD 4”) and the full application (“CRR/CRD 4 fully loaded”) of the CRR/CRD 4 framework.


Deutsche BankAktiengesellschaftTaunusanlage 1260262 Frankfurt am MainGermany
Telephone: +49 69 9 10 [email protected]
Contact for Shareholders+49 800 9 10 80 00
AGM Hotline+49 61 96 8 87 07 04
OnlineAll publications relating to our financial reporting are available at: www.db.com/annual-reports
PublicationPublished on March 22, 2019.
Cautionary statement regarding forward-looking statements
This report contains forward-looking statements. Forward-looking statements are statements that are not historical facts; they include statements about our beliefs and expectations and the assumptions under lying them. These statements are based on plans, estimates and projections as they are currently available to the management of Deutsche Bank. Forward-looking statements therefore speak only as of the date they are made, and we undertake no obligation to update pub-licly any of them in light of new information or future events.
By their very nature, forward-looking statements involve risks and uncertainties. A number of important factors could therefore cause actual results to differ materially from those contained in any forward-looking statement. Such factors include the conditions in the financial markets in Germany, in Europe, in the United States and elsewhere from which we derive a substantial portion of our revenues and in which we hold a substantial portion of our assets, the develop-ment of asset prices and market volatility, potential defaults of borrowers or trading coun-terparties, the implementation of our strategic initiatives, the reliability of our risk management policies, procedures and methods, and other risks referenced in our filings with the U.S. Secu-rities and Exchange Commission. Such factors are described in detail in our SEC Form 20-F of March 22, 2019 under the heading “Risk Factors.” Copies of this document are readily available upon request or can be down loaded from www.db.com/ir.
Imprint / Publications
Deutsche BankAnnual Report 2018
Imprint / Publications

2019Financial Calendar
April 26, 2019Earnings Report as of March 31, 2019
May 23, 2019Annual General Meeting in the Festhalle Frankfurt am Main (Exhibition Center)
May 28, 2019Dividend payment
July 24, 2019Interim Report as of June 30, 2019
October 30, 2019Earnings Report as of September 30, 2019
2020Financial Calendar
January 30, 2020Preliminary results for the 2019 financial year
March 20, 2020Annual Report 2019 and Form 20-F
April 29, 2020Earnings Report as of March 31, 2020
May 20, 2020Annual General Meeting in the Festhalle Frankfurt am Main (Exhibition Center)
May 25, 2020Dividend payment(incaseofadistributableprofitandthe decision of the AGM to pay a dividend)
July 29, 2020Interim Report as of June 30, 2020
October 28, 2020Earnings Report as of September 30, 2020
We are here to enable economic growth and societal progress, by creating positive impact for our clients, our people, our investors and our communities.
Our Purpose This is why we‘re here. This is what we do.