annexure i - inflibnetshodhganga.inflibnet.ac.in/bitstream/10603/12613/11/11_annexure.pdf ·...
TRANSCRIPT

Annexure I
-4-

1. Runa Antony, K.P.Krishnan, Sabu Thomas, Wilson P. Abraham, Thamban Meloth (2009). Phenotypic and molecular identification of Cellulosimicrobium cellulans isolated from Antarctic snow. Antonie van Leeuwenhoek International Journal of General and Molecular Microbiology. 96(4):627-634. (IF 1.6)
2. K.P.Krishnan and P.A.Loka Bharathi (2009). Organic carbon and iron modulate nitrification rates in mangrove swaps of Goa, South west coast of India. Estuarine, Coastal and Shelf Science. 84(3):419-426. (IF:2.07)
3. K.P.Krishnan, Rupesh Kumar Sinha, Kiran Krishna, Shanta Nair and S.M.Singh (2009). Microbially mediated redox transformation of manganese (II) along with some other trace elements: A study from Antarctic lakes. Polar Biology. 32:1765- 1778. (IF:1.73)
4. K.P.Krishnan, S.O. Fernandes, P.A. Loka Bharathi, L. Krishna Kumari, Shanta Nair, Anil K. Pratihari and B. Ramalingeswara Rao (2008). Anoxia over the western continental shelf of India: Bacterial indications of intrinsic nitrification feeding denitrification. Marine Environmental Research. Vol.65, 445-455. (IF: 2.11)
5. Laluraj C.M, K.P.Krishnan, M. Thamban, Rahul Mohan, S.S.Naik, W.Dsouza, R. Ravindra and A. Chaturvedi (2008). Origin and characterisation of micro particles in the ice core from the Central Dronning Maud Land, East Antarctica. Environmental Monitoring and Assessment. DOI 10.1007/s10661-008-0212-y. (IF: 0.79)
6. K.P. Krishnan, Sheryl 0 Fernandes, G.S. Chandan and Loka Bharathi P A (2007). Bacterial contribution to mitigation of iron and manganese in mangrove sediments. Marine Pollution Bulletin Vol.54 Iss.9 1427-1433. (IF: 2.01)
7. K.P. Krishnan, Christabelle E.G. Fernandes, Sheryl Oliveira Fernandes and P.A. Loka Bharathi (2006). Tolerance and immobilization of cobalt by some bacteria from ferromanganese crusts of the Afanasiy Nikitin Seamounts. Geomicrobiology Journal. Vol.23.Issue.1 Pages 31-36. (IF:2.58)
8. Reshma C. Goltekar, K.P. Krishnan, Maria -Judith B.D. De Souza, A. L. Paropkari and P.A. Loka Bharathi (2006). Effect of carbon source concentration and culture duration on retreivability of bacteria from certain estuarine, coastal and offshore areas around the peninsular India. Current Science. Vol.90.No.1.103-106. (IF:0.69)
9. Sheryl Oliveira Fernandes, K.P. Krishnan, V.D. Khedekar and P. A. Loka Bharathi. (2005). Manganese oxidation by bacterial isolates from the Indian Ridge System. 18:483-49. BioMetals. (IF:2.16)
10. Krishnan K.P. and A.V. Saramma (2005). Mixed substrate degradation: Are consortia better than monocultures? Indian Journal of Marine Sciences. Vol.34.No.2.188-191. (IF:0.15)

Annexure II
4,--

Available online at www.sciencedirect.com
'4*0 ScienceDirect
MARINE POLLUTE: WI
ULILETIN ELSEVIER Marine Pollution Bulletin 54 (2007) 1427-1433
www.elseviereom/locate/marpolbul
Bacterial contribution to mitigation of iron and manganese in mangrove sediments
K.P. Krishnan a 'b, Sheryl Oliveira Fernandes a, G.S. Chandan a 'c , P.A. Loka Bharathi a '■
National Institute of Oceanography, Dona Paula. Goa. India
b National Centre for Antarctic and Ocean Research, Vasco du Goma, Goa, India
Department of Applied Geology, ERSAI, jnanosahvadri, Kuvempu University, Karnataka, India
Abstract
The M.andovi and Chapora are two tropical estuaries lying in close geographic proximity on the west coast of India. Seasonal changes in down core variation of Fe, Mn and Total Organic Carbon (TOC) in the mangrove sediments adjoining these estuaries were studied to assess their influence on some of the representative benthic bacteria belonging to heterotrophie and autotrophic groups. Heterotrophic bacteria (IIB) cultured on different nutrient concentrations (0.01%, 0.1% and 25%) together with nitrifiers (NtB; representating auto-troph) were chosen to assess the influence of the above-mentioned abiotic parameters on the former. 'The experimental site located along the Mandovi is under the influence of extensive ferromanganese ore mining, while the control site at Chapora is relatively free from such influences. Geoaccumulation index computed for Mandovi showed that sediments (0-10 cm) were 'uncontaminated to moderately con-taminated' by Fe during the pre monsoon and monsoon seasons, while in the post monsoon season the 4-10 cm fraction was almost completely restored from contamination. Similar computations for Mn showed that in pre monsoon, sediments fell in the 'moderately contaminated' and 'moderately to strongly contaminated' categories, while in the monsoon and post monsoon seasons all the sections were 'Uncontaminated'. The difference observed in correlation between Fe and Mn with the various fractions of heterotrophs and nit-rifiers indicated that though these two elements shared a similar chemistry in the environment, microbes involved in biogeochemical pro-cesses might prefer them differentially. The relationship between TOC and HB 'enumerated on 0.01% dilute nutrient agar remained at r 0.50 , p < 0.05 throughout the year. Hence, it could be apparently linked to their preferred concentration of organic carbon require-ment. A relationship of r = 0.61, p < 0.01 between manganese concentration and heterotrophs recovered on different strengths of nutri-ent agar is suggestive of their response to the metal enrichment. They could thus contribute towards maintaining the level of Mn at par with reference levels at. Chapora. A positive correlation between Mn with NtB (n = 10, p < 0.05, r = 0.58) at the experimental site during the non-monsoon months is suggestive of the latter's contribution to regulation of the metal concentration in the sediment probably through anaerobic nitrification at the expense of manganese. The study therefore supports our hypothesis that both autochthonous auto-trophs and heterotrophs work in tandem to mitigate concentration of Mn and related metals in mangrove sediments. © 2007 Published by Elsevier Ltd.
Keywords.: Iron; Manganese; Mangroves; Helerotrophs; Nitrifiers: Geoaceumulation
1. Introduction
The Mandovi and Chapora are two tropical estuaries lying in close geographic proximity to each other on the west coast of India, but the latter is relatively distanced
Corresponding author. Tel.: +91 0 832 2450281: fax: +91 0 832 2450606.
E-mail address: [email protected] (P.A. Loka Bharathi).
0025-326X/S - see front matter 2007 Published by Elsevier Ltd. doi: .1 0.1016/j.marpolhul.2007.05.023
from pollution. The hydrological characteristics of these two estuarine systems are governed by the monsoon regime. The physical characteristics of the Mandovi and Chapora estuaries have been described earlier (Varma and. Rao, 1975; Varna and Cherian, 1975; Murthy et al., 1976). The estuarine channel of the Mandovi is used to transport large quantities of ferromanganese ores from mines located upstream to the Marmagao harbour (Arabian Sea), while the Chapora is free from movement

;-v ithor's pe,scnal
1428
K.P. Krishnan et al. 1 Marine Pollution Bulletin 54 (2007) 1427-1433
of ferromanganese ore bearing barges. Lush mangrove veg-etation fringes both of the estuarine systems. Though the impacts of iron ore processing on the surface sediments of the Mandovi estuary have been documented earlier by Alagarsamy (2006), its influence on the benthic bacterial flora is sparsely understood.
In this study, an attempt has been made to understand the downeore distributory patterns of heterotrophic and autotrophie bacteria together with total Fc and Mn during monsoon and non-monsoon periods. Retrievable heterotro-phic bacteria were enumerated on various nutrient strengths to estimate the various fractions requiring different carbon and nitrogen requirements. Nitrifiers were enumerated as a representative autotrophic community as they are one of the most iMportant physiological groups in this ecosys-tem responsible for converting ammonia to its oxidized forms.
Geoaccumulation index (/ geo , Willer, 1979) was used to assess the impact of mining on the mangrove sediments. Although /geo was originally devised for use with global standard shale values as background metal levels, Rubio et al. (2000) have shown the use of regional background values to give more appropriate results. In this study, I seo
has been calculated using regional metal concentrations in Chapora mangrove sediments. A comparison between the Mandovi and Chapora mangrove sediments was there-fore made to assess the probable influence of mining on bacterial groups in this region. We hypothesize that bacte-rial populations in the mangrove sediments could play an important role in preventing the concentration of the metal species from accumulating.
2. Materials and methods
2:1. Site description and sampling procedure
Sediment cores were collected from fringing mangrove forests along the Chapora and Mandovi estuaries. The con-trol site in the Chapora estuary was located at Tuvem, whereas the Divar mangrove ecosystem was selected as the experimental site along the Mandovi estuary (Fig. 1). The experimental site is under the influence of ferromanga-nese ore mining. Samples were collected during the months of April (Pre Monsoon), July (Monsoon) and October (Post Monsoon) of 2005 using a PVC hand-held sediment corer. Sub samples were taken at 2 cm intervals from the surface to 10 cm by carefully sectioning the core in the lab.
2.2. Chemical analy,se.s.
Organic carbon was determined by the wet oxidation method with a precision of 0.01% (El Wakeel and Riley, 1957). Sub samples for metal analyses were dried at 60(±2) °C for 48 h and disaggregatcd in an agate mortar before chemical treatment for Fe and Mn analysis. For each sample, a known quantity ( ,,0.2 g) of sediment was
digested in a teflon vessel with a solution (10 ml) of concen-trated (48% GR; Merck), IINO 3 (69% GR; Merck) & HCIO4 (35% GR; Merck) in a ratio of 7:3:1. The sediment was then dried on a hot plate in a fume hood chamber.
An aliquot of 5 ml of the above acid mixture was added and dried on the hot plate for 1 h. Further, 2 ml of concen-trated HCI (35% GR; Merck) was added, followed by 10 ml of HNO3 (69% GR; Merck). The residue was warmed and then transferred to a clean, dry standard flask to make a final volume of 100 ml with double distilled water. The detailed procedure of sediment digestion is given in Balaram et al. (1995). Trace metal concentrations (Fe and Mn) were measured using a flame atomic absorp-tion spectrophotometer (AAS, PerkineElmer Model 5000). The accuracy of the analytical procedures was assessed using the certified reference material MAG-1 (USGS) that yielded results within the reference value range (Flanagan, 1967, 1976).
2.3. Microbial analyses
Sediment core was sectioned at 2 cm intervals in sterile conditions to obtain representative samples at 0-2, 2-4, 4-6, 6•8 and 8-10 cm depths, Sub samples of approxi-mately 5 g wet weight sediment were sampled using sterile syringe cores. The sub samples were transferred to 45 ml of full strength sterile seawater (10 -I dilution). Tween80 (50 nL) was added and the mixture was sonicated at 40 mHz for 10 s. Serial dilutions of the sediment samples were made in autoclaved seawater to yield dilutions from 10-1 to 10-6/7 .
Medium for the isolation of heterotrophic bacteria (HB) was prepared using various nutrient strengths of 0.01, 0.1 and 25%, which correspond to 0.01%, 0.1% and 25% nutrient broth + 2% agar, respectively. A concentration of 100% corresponds to 8 g nutrient broth (HiMedia Laboratories Pvt. Ltd., Bombay. India) per 1000 ml seawa-ter. About 100µl from 10 -2 dilution was plated onto the medium. The plates were incubated for 15 days at room temperature. Bacterial counts in the form of colony form-ing units (CFU) formed on the medium were recorded after a 15-day incubation period at 28(± I) °C. Dry weight of the sediment used for the dilutions was determined by drying the filtered sediment in an oven at 60 °C for 48 h.
Nitrifiers (NtB) were enumerated by the most probable number (MPN) method of Alexander and Clark (1965). Nitrifying media (seawater amended with NII 4C1 of 2 mM final concentration) was distributed in 5 ml quantities in 15 ml screw capped tubes. From each dilution ranging from 10 -1 to 10-617 , 500 gl was inoculated in triplicate in the nitrifying media until the inoculation from the highest dilution into the culture tubes yielded negative results. The culture tubes were incubated in the dark for a period —60 days at 28(±1) °C. After incubation, the tubes were tested for the presence of NCIi . and/or NO -3.. . The combina-tions of positive and negative tubes were scored and MPN was assessed from McCready's table (Rodina, 1972).

MAP OF GOA
ARABIAN SEA
Legend
• Control site ♦ Experimental site
Fig. 2, Down core variation in Fe. (a) refers to the control site while (h)
refers to experimental site (0 - Pre Monsoon, - Monsoon and ■ - Post Monsoon).
in the present study are comparatively higher to those reported by Ray et al. (2006) from the Godavari estuarine mangrove ecosystem on the eastern coastline of India. These authors reported that the average sedimentary Fe
a 0—
F., 4 -
6— o _
8—
1 0
0 2 4 6 8 10 12 14 Fe (%)
10
0 2 4 6 8 10 12 14 Fe (%)
At,)itIOCS
K.P.Krishnan et al. / Marine Pollution Bulletin 54 (2007) 1427-1433
1429
40'
50'
74'E
10'
20'
40'
30'
20'
10'
15' N
Fig. 1. Location of sampling sites in the Chapora and Mandovi estuary.
-4-
Statistical analysis was carried out using Pearson's Cor-relation Coefficient in order to explore the possible associ-ations existing between different variables. The analysis was done using Microsoft Excel 2000. The bacterial param-eters were normalized by log transformation before analyses.
3. Results and discussion
3.1. Down core variation and index of geoaccumulation for iron and manganese
Figs. 2a, b and 3a, b show the down core variation of Fe and Mn during pre monsoon, monsoon and post monsoon seasons. The overall range in sedimentary Fe values ranged between 8% and 12.6% at the experimental site, while it ranged between 4.7% and 9.3% at the control site. The Mn values varied from 0.06% to 0.52% at the experimental site and 0.05-0.48% at the control site. The values reported

rsond Cop7
1430
K.P. Krishnan et al. 1 Marine Pollution Bulletin 54 (2007) 1427-1433
4-
0.2 0.4
0.6 0 0.2 0.4 0.6 Mn (%)
Mn (%)
Fig. 3. Down core variation in Mn. (a) refers to the control site while (b) refers to experimental site (0 Pre Monsoon. +- Monsoon and ■ • Post Monsoon).
and Mn values were 0.004% and 0.001%, respectively. Studies by Alagarsamy (2006) showed that the concentra-tions of Fe varied from 2.2% to 49.7% on the surface sed-iments of the Mandovi estuary, while the concentration of Mn ranged below detection limit to 1.61%. Though reports from the Mandovi estuary , .(Alagarsatny, 2006) showed that metal concentrations were generally low during monsoon, compared to the pre and post monsoon seasons, at the Adjoining mangrove sediments, they were found to vary. .1n the present study, the highest accumulation of Fe was observed during pre monsoon, while the values in the mon-soon and post monsoon seasons were lower and compara-ble. The variation of Mn values was similar to observations made by Alagarsamy (2006) in the surface sediments of the adjoining Mandovi estuary.
Irrespective of the depth, the experimental site showed an enrichment of Fe > 100% of the control site during pre monsoon. Percentage of enrichment has been calcu-lated using the formula:
If a > h: Percentage of enrichment = (a - MI6 * 100
If b > a under washout conditions:
Percentage of enrichment = (b - a)/a * 100
where a is the concentration of Fe/Mn at experimental site and b is the concentration of Fe/Mn at control site.
In general, enrichment increases with depth to reach val-ues >165% at an 8-10 cm interval during pre monsoon. During monsoon, the general enrichment pattern is reversed with the highest enrichment (85.6%) at 0-2 cm. Moreover, observations from statistical analysis indicate that there is no significant correlation between Fe and Mn in the monsoon months, neither at the control nor at the experimental site. However, a direction is suggested in the relationship. It is negative at the experimental site and positive at the control site, perhaps suggesting that under a lower concentration of iron, manganese concentra-tion tends to increase. With a higher concentration of iron up to 12-13%, this trend changes, suggesting that the
increase of both of the elements do not get coupled after a threshold.
During post monsoon, it could be observed that, though the trend in down core variation fairly resembled the mon-soon season, the magnitude fell sharply to show negative enrichment. It was interesting to note that, although the control site was free from the influence of mining, the experimental site showed negative Mn enrichment in all sections during monsoon and post monsoon. This could be due to enhanced fresh water supply to the Mandovi compared to the Chapora. These observations are con-trasted by very high enrichment (393-773%) of Mn at the experimental site during the pre monsoon season, espe-cially in the depth range of 4-6 cm. A positive relation between Fe and Mn during the non-monsoon months (r = 0.64, p < 0.02, n = 10) at the control site and the absence of such a relation at the experimental site showed that, though the chemistry of Fe and Mn are closely related, they could be differentially preferred by organisms, which in turn is influenced by the prevailing environment. Alternatively, the concentration of iron is too high to war-rant any bacterial dependance.
The gcoaccumulation index (I geo ) was originally defined by Midler (1979) for metal concentrations in the <2 µ frac-tion and developed for global standard shale values, which is expressed as follows:
/g„ = log2 (C„/I.58„ )
where C„ is the measured concentration of metal the sediment and B„ is the background value for metal 'n'.
The factor 1.5 is used for the possible variations of the background data due to lithological variations.
The choice of the background value plays an important role in the interpretation of geological data. /„. 0 has been widely utilized as a measure of pollution in freshwater (e.g. Muller, 1980; Singh et al., 1997; K.ralik, 1999) and marine sediments (e.g. Stoffers et al., 1986; Bryan and Langston, 1991 Dickinson et al., 1996). Geoaccumulation index (4,„) of Fe and Mn in the experimental site (control site metal values were taken as reference values) was com-puted based on Willer (1979) for all the depths and sea-sons. The results are plotted in Fig. 4a and b.
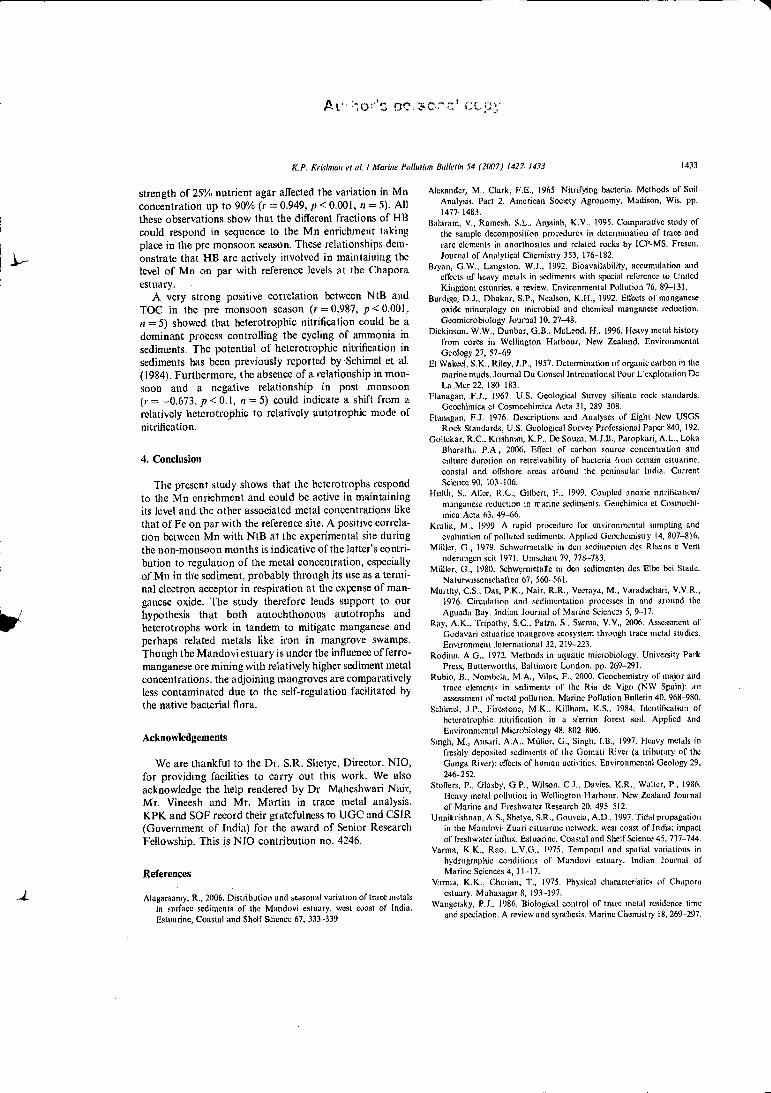
According to the 4,„ classification (Table 1 ), it could he inferred that the sediments in the depth range 0-10 cm fall in the 'uncontaminated to moderately contaminated by iron' category during the pre monsoon and monsoon sea-son. While, in the post monsoon season, though the 0-4 cm still remains 'uncontaminated to moderately con-taminated by iron', the 4-10 cm layer has recovered from Fe contamination and could be termed as 'Uncontami-nated'. The contamination due to Mn is more acute than Fe during the pre monsoon season. During the pre mon-soon, the 0-8 cm section falls under the 'Moderately to strongly contaminated' category, while the 8-10 cm section falls under the 'Moderately contaminated category'. All the depths fall in the 'Uncontaminated' group during the mon-soon and post monsoon and hence could be assessed as free
a
0.5
0
-0.5
-1
b
r's oe is° no 1 copy
K.P. Krishnan et al. l Marine Pollution Bulletin .54 (2007) 1427.4433
1431
Fig. 4. (a) and (b) ./ g,„ values of Fe and Mn, respectively, for the
experimental site at Divar. The y-axis scale and legend to (b) is the sante as that of (a).
Table I Description of sediment quality by geoaccumulation index (Muller. 1979)
/8,„ Value 1,„ Class Description Of sediment quality
>5 6 Extremely contaminated 4-5 5 Strongly to extremely strongly contaminated 3-4 4 Strongly contaminated
2-3 3 Moderately to strongly contaminated
1-2 2 Moderately contaminated
0-1 Uncontaminated to moderately contaminated <0 0 Uncontaminated
from the Mn pollution. These observations could again suggest that, though the elements are closely related, the biogeochemical cycling of M.n could be more efficient and rapid when compared to Fe in the mangrove sediments. Moreover, the mangrove ecosystems play a buffering role by reducing the enrichment levels of Fe and Mn in the sed-iments. The overall assessment could be that, though the Mandovi estuary is under the influence of ferromanganese ore mining with significant impact on the estuarine sediments, the sediments of the adjoining mangroves are comparatively less contaminated, but when strongly con-taminated, could be self-regulatory and recover in the time scale tested.
3.2. Total organic carbon (TOC) and bacterial trophic structure
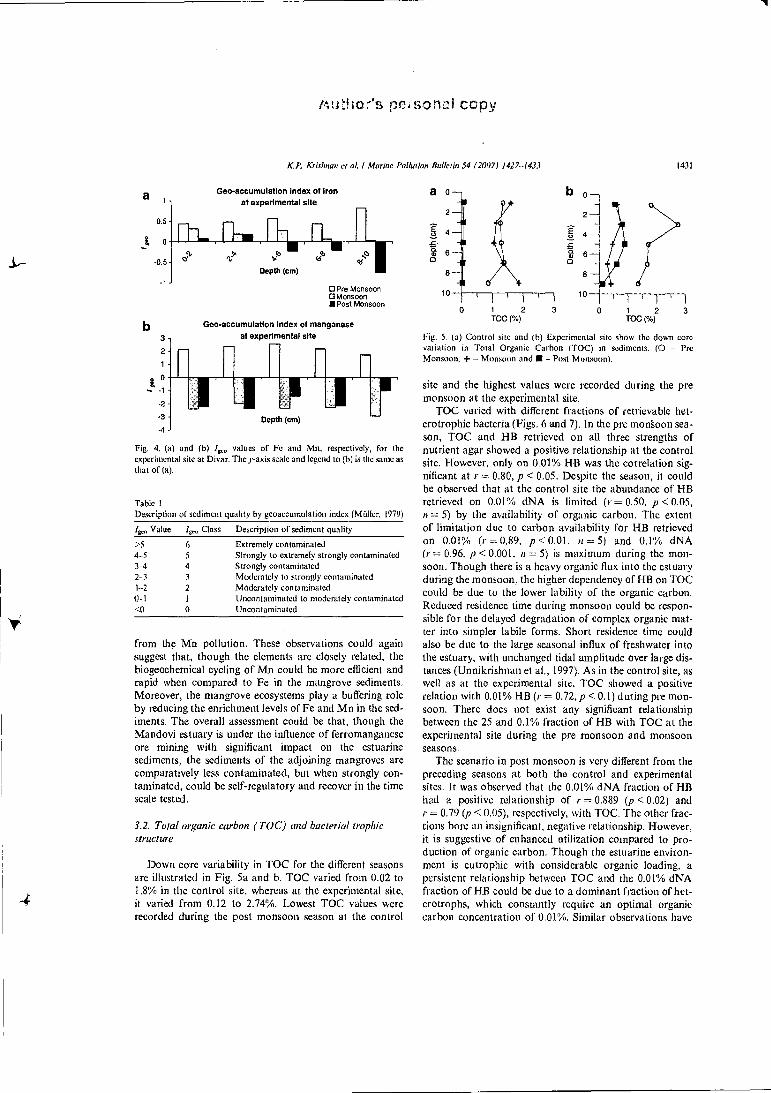
Down core variability in Toc for the different seasons are illustrated in Fig. 5a and b. TOC varied from 0.02 to 1.8% in the control site, whereas at the experimental site, it varied from 0.12 to 2.74%. Lowest TOC values were recorded during the post monsoon season at the control
0 1 2
0 1 2
3 TOC (%)
TOC (%)
Fig. 5. (a) Control site and b) Experimental site show the down core variation in Total Organic Carbon (TOC) in sediments. (0 Pre Monsoon, + - Monsoon and ■ - Post Monsoon).
site and the highest values were recorded during the pre monsoon at the experimental site.
TOC varied with different fractions of retrievable het-crotrophic bacteria (Figs. 6 and 7). In the pre monsoon sea-son, TOC and HB retrieved on all three strengths of nutrient agar showed a positive relationship at the control site. However, only on 0.01% HE was the correlation sig-nificant at r = 0.80, p < 0.05. Despite the season, it could be observed that at the control site the abundance of HB retrieved on 0.01% dNA is limited (r = 0.50. p < 0.05, a = 5) by the availability of organic carbon. The extent of limitation due to carbon availability for HB retrieved on 0.01% (r = 0.89, p < 0.01, rt = 5) and 0.1% dNA (r = 0.96. p< 0.001. a = 5) is maximum during the mon-soon. Though there is a heavy organic flux into the estuary during the monsoon, the higher dependency of HE on TOC could be due to the lower lability of the organic carbon. Reduced residence time during monsoon could be respon-sible for the delayed degradation of complex organic mat-ter into simpler labile forms. Short residence time could also be due to the large seasonal influx of freshwater into the estuary, with unchanged tidal amplitude over large dis-tances (Unnikrishnan et al., 1997). As in the control site, as well as at the experimental site, TOC showed a positive relation with 0.01% HB (r = 0.72, p < 0.1) during pre mon-soon. There does not exist any significant relationship between the 25 and 0.1% fraction of HB with TOC at the experimental site during the pre monsoon and monsoon seasons.
The scenario in post monsoon is very different from the preceding seasons at both the control and experimental sites. It was observed that the 0.01% dNA fraction of HB had a positive relationship of r = 0.889 (p <0.02) and r = 0.79 (p < 0.05), respectively, with TOC. The other frac-tions bore an insignificant, negative relationship. However, it is suggestive of enhanced utilization compared to pro-duction of organic carbon. Though the estuarine environ-ment is eutrophic with considerable organic loading. a persistent relationship between TOC and the 0.01% dNA fraction of HB could be due to a dominant fraction of het-erotrophs, which constantly require an optimal organic carbon concentration of 0.01%. Similar observations have

a d
d
THB (1/100 NA) (CFU x 104 /m1) THB (1/10 NA) (CFU x 104 /m1)
0 40 80 120 160 200 0 1 2 3 4
THB (1/4 NA) (CFU x 10 4 /m1) Nitrifiers (x 102 cells/g sediment)
Author's personal copy
1432 K.P. Kri.slinun et al. I Marine Pollution Bulletin 54 (20071 1427-1433
Fig. 6. Control site shows the down core variation of bacterial groups with different nutritional requirements (0- Pre Monsoon, +.... Monsoon and ■ .... Post Monsoon).
Fig. 7. Experimental site shows the down core variation of bacterial groups with different nutritional requirements (0 ....Pre Monsoon, + .... Monsoon and ■ Post Monsoon).
been made earlier by Goltekar et al. (2006) in the Mandovi estuary, which indicate that bacteria from relatively more dynamic estuarine systems seemed less resilient compared to the coastal and offshore populations, as they were best retrieved only on 1% nutrient strength.
3.3. Relation of sediment geochemistry with bacterial trophic status
It was interesting to note that TOC related positively to Fe (r = 0.67, p < 0.01, n = 15) and Mn (r = 0.92, p < 0.001, n = 15) at the experimental site, whereas the relationships were negative at the control site (r = -0.72, p < 0.001, n = 15 for Fe and r -0.51, .p < 0.05, n = 15 for Mn). These relationships could imply that at the experimental site there is considerable extraneous input of TOC favoring the accumulation of Fe and Mn. Wangersky (1986) has reported that coatings of organic matter prevalent in fine-grained sediments bind a variety of trace elements. Enrich-ment of Mn in the pre monsoon and its subsequent removal in the monsoon indicate that Mn turnover time could be much less, as it is actively removed both by phys-ical processes and biogeochemical sequestration. It could be observed that at the experimental site NtB are higher at the depth ranges of 2-4 cm. and 8-10 cm. Irrespective
of the season, a positive correlation between Mn and NtB (r = 0.61, p < 0.01, a = 15) at the experimental site suggests that Mn could be used actively as a co-factor for the ammonia monoxygenase enzyme. More importantly, it could also serve as an alternate terminal electron accep-tor in anaerobic respiration (Hulth et al., 1999). This rela-tionship disappeared when the Mn levels decreased during the monsoon season and was re-established during the post monsoon season (r = 0.62, p < 0.02, n =10) when the Mn levels increased. Absence of a significant relationship between Fe with various fractions of heterotrophs and nit-ritiers at both the control and experimental sites suggested that Fe is present in excess and perhaps non-limiting. Moreover, Mn(1V) reduction preceeds that of Fe(Ill) because of reduction energetics of the solid phases (Burdigc ct al., 1992).
The relationship between Mn and various fractions of LIB indicate that the latter has a considerable influence in regulating the levels of Mn. At the experimental site, HB cultured on 0.01% dNA related to Mn during pre monsoon (r = 0.826, p < 0.05, n = 5) and further strengthened during the monsoon (r = 0.968, p < 0.001, n = 5). HB on 0.1% dNA also showed a relationship to Mn concentrations (r = 0.951, p < 0.001, n = 5) during the monsoon. How-ever, during post monsoon, the variation in JIB on a higher
A t"
Krishnan et al I Marine Pollution Bulletin 54 (2007) 1427-1433 1433
strength of 25% nutrient agar affected the variation in Mn concentration up to 90% (r = 0.949, p < 0.001, n = 5). All these observations show that the different fractions of HB could respond in sequence to the M.n enrichment taking place in the pre monsoon season. These relationships dem-onstrate that HB are actively involved in maintaining the level of Mn on par with reference levels at the Chapora estuary. •
A very strong positive correlation between NtB and TOC in the pre monsoon season (r = 0.987, p <0.001. n = 5) showed that heterotrophic nitrification could be a dominant process controlling the cycling of ammonia in sediments. The potential of heterotrophic nitrification in sediments has been previously reported by .Schimel et al. (1984). Furthermore, the absence of a relationship in mon-soon and a negative relationship in post monsoon (r = -0.673, p < 0.1, n = 5) could indicate a shift from a relatively heterotrophic to relatively autotrophic mode of nitrification.
4. Conclusion
The present study shows that the hetcrotrophs respond to the Mn enrichment and could he active in maintaining its level and the other associated metal concentrations like that of Fe on par with the reference site. A positive correla-tion between Mn with NtB at the experimental site during the non-monsoon months is indicative of the latter's contri-bution to regulation of the metal concentration, especially of .Mn in the sediment, probably through its use as a termi-nal electron acceptor in respiration at the expense of man-ganese oxide. The study therefore lends support to our hypothesis that both autochthonous autotrophs and heterotrophs work in tandem to mitigate manganese and perhaps related metals like iron in mangrove swamps. Though the Mandovi estuary is under the influence of ferro-manganese ore mining with relatively higher sediment metal concentrations. the adjoining mangroves are comparatively less contaminated due to the self-regulation facilitated by the native bacterial flora.
Acknowledgements
We are thankful to the Dr. S.R. Shetye, Director, NIO, for providing facilities to carry out this work. We also acknowledge the help rendered by Dr. Maheshwari Nair,
Mr. Vineesh and Mr. Martin in trace metal analysis. KPK and SOF record their gratefulness to UGC and CSIR (Government of India) for the award of Senior Research Fellowship. This is NiO contribution no. 4246.
References
Alagarsamy, R., 2006, Distribution and seasonal variation of traee metals in surface sediments of the Mandovi estuary, west coast of India, Estuarine, Coastal and Shelf Science 67. 333-339.
Alexander, M., Clark, RE., 1965. Nitrifying bacteria. Methods of Soil Analysis, Part 2. American Society Agronomy. Madison, Wis. pp.
1477-1483. Balaram, V., Ramesh, SA... Anjaiali, K.V.. 1995. Comparative study of
the sample decomposition procedures in determination of trace and rarc elements in anorlhosites and related rocks by ICP-MS. Frescn.
Journal of Analytical Chemistry 353, 176-182. Bryan, OM., Langston. W.J., 1992. Bioavailahility, accumulation and
effects of heavy metals in sediments with spxxial reference to United
Kingdom estuaries: a review. Environmental Pollution 76, 89-131. Burdige, DJ., Dhakar, S.F., Nealson, K.H., 1992. Effects of manganese
oxide mineralogy on microbial and chemical manganese reduction.
Geomicrobiology Journal 10. 27-48. Dickinson. W.W., Dunbar, G.B.. McLeod, H., 1996. Heavy metal history
from cores in Wellington Harbour, New Zealand. Environmental
Geology 27, 57-49.
El Wakeel, S.K., Riley, 1957: Determination of organic carbon in the marine muds. Journal Du Conseil Intrenational Pour L'exploration Dc
La .Mer 22, 180-4 83. Flanagan, F.J., 1967. U.S. Geological Survey silicate rock standards.
Geochimica et Cosmochimica Acta 31, 289-308. Flanagan, F.J. 1976. Descriptions and Analyses of Eight New USGS
Rock Standards, U.S. Geological Survey Professional Paper 840, 192. Goltekar. R.C.. 'Krishnan, K.P., Dc Souza, M.J.B., Paropkari, A.L., Loka
Bharathi. P.A., 2006, Effect of carbon source concentration and culture duration on retreivability of bacteria from certain estuarine. coastal and offshore areas around the peninsular India. Current
Science 90. 103-106. Hulth, S.. Aller, Gilbert, F.. 1999. Coupled anoxic nitrification/
manganese reduction in marine sediments. Genchimica et Cosmochi-mica Acta 63, 49-66.
Kralik, M., 1999. A rapid procedure for environmental sampling and evaluation of polluted sediments. Applied Geochemistry 1.4, 807-816.
Midler, G., 1979. Schwermetalle in den seditnenten des Rheins c 'Vera
ndcrungen seit 1971. Umseliau 79, 778-783, Muller, G., 1980. Schwermetalle in den sediment= des Elbe bei Stade.
Naturwissensehaften 67, 560-561. Murthy, CS.. Das, P.K., Nair, R.R., Veeraya, M., Varadachari, V.V.R.,
1976. Circulation and sedimentation processes in and around the
Aguada Bay. Indian Journal of Marine Sciences 5, 9.17. Ray. A.K., Tripathy, S.C., 'Palm, S., Surma, V.V., 2006. Assessment of
Godavari estuarine mangrove ecosystem through trace metal studies. Environment international 32. 219-223.
Rodina, A.G., 1972. Methods in aquatic microbiology. University Park Press, 13utterworths, Baltimore London. pp. 269-291.
Rubio, B., Nombela, M.A., Vilas, F., 2000. Geochemistry of major and trace elements in sediments of the Ria de Vigo (NW Spain): an assessment of metal pollution. Marine Pollution Bulletin 40, 968-980.
Schimel, IP., Firestone, M.K., Killham, KS., 1984. Identification of heterotrophie nitrification in a sierran forest soil. Applied and Environmental Microbiology 48. 802-806.
Singh, M., Ansel, A.A., Muller, G., Singh, LB., 1997. Heavy metals in freshly deposited sediments of the Gomati River (a tributary of the Ganga River): effects of human activities. Environmental Geology 29,
246-252. Stoffers, P., Glasby, G.P., Wilson. C.J., Davies, K.R., Walter, P., 1986,
Heavy metal pollution in Wellington Harbour. New Zealand Journal
of Marine and Freshwater Research 20, 495-512. Unniktishnao, A.S., Shetye, S.R., Gouveia, A.D., 1997. Tidal propagation
in the Mandovi-Zuari estuarine network, west coast of India: impact of freshwater influx. Estuarine, Coastal and Shelf Science 45, 737-744.
Vanua, K.K., Rao. L.V.C.1., 1975, Temporal and spatial variations in hydragraphic conditions of Mandovi estuary. Indian Journal of Marine Sciences 4, 11.17.
Vanna. .K.K., Cherian, T., 1975. Physical characteristics of Chapatti
estuary. Maha.sagar 8, 193-197.
Wangersky, 1986. Biological control of trace metal residence time and speeiation. A review and synthesis. Marine Chemistry 18, 269.297.

Autmor's personal copy
Estuarine, Coastal and Shelf Science 84 (2009) 419-426
Contents lists available at ScienceDirect
Estuarine, Coastal and Shelf Science
ELSEVIER' journal hornepage: www.elsevier.com/locate/ecss
Organic carbon and iron modulate nitrification rates in mangrove swamps of Goa, south west coast of India
K.P. Krishnan a ' b , P.A. Loka Bharathi a.*
'National Institute of Oceanography, Coa, India b National Centre for Antarctic' and Ocean Research, Caa, India
ARTICLE INFO
ABSTRACT
it/
Article history: Received 18 February 2009 Accepted 19 July 2009 Available online. 23 July 2009
Keywords: nitrification nitrifiers mangroves organic carbon manganese iron
Nitrification, fuelled by ammonium is the pivotal oxidative pathway to nitrogen cycling. In spite of its ecological significance, the factors regulating nitrification rates in the benthic realm remain poorly understood. The present study therefore examines some of the factors like ammonium, nitrite, nitrate,
organic carbon, iron and manganese on down-core variability in benthic nitrification rates in two different mangrove ecosystems, one under the influence of ferromanganese ore mining (experiment) and the other relatively undisturbed (control). We hypothesize that besides organic carbon, iron could also influence the rate of nitrification. The study also contrasts the distributive pattern of autotrophic and heterotrophic nitrifiers in the two regions. The concentration of iron at the control site ranged from 1.1% to 15.1% while at the experimental site it ranged from 2.9% to 46%. The levels of organic carbon at control and experimental sites ranged from 0.02% to 6.9% and 0.1% to 6.5%, respectively. The nitrification rates at the control and experimental sites are comparable and ranged from 3.2 ± 1.2 to 18.4 ± 1.9 ng at-Ng(sediment) i and 2.7 A:: 1.5 to 18.2 ± 0.6 ng at-Ng(sediment) respectively. While the abundance of heterotrophic nitrifiers at both the sites ranged from 10 2-3 cells g" 1 sediment, the auto-trophic nitrifiers at the experimental site was higher by an order at 10 3 cells g" 1 sediment reflecting the relatively higher retractile nature of organic carbon at the experimental site (Straus and Lamberti, 2000). Though organic carbon and nitrification rates are similar in both the sites, the underlying mechanisms governing the processes could be different. Our studies suggest that at the control site, hetemtrophic nitrifiers govern nitrification rates (r= 0.28, p < 0.05, n =64) using organic carbon (r = 0.32, p <0.01, 11=64). At the experimental site, nitrification was governed more by autotrophic nitrifiers (r = 0.43, p <0.001. n =64) at the expense of iron (r — 0.47, p < 0.001, n —64). Therefore at the experimental site with higher load of iron, autotrophic nitrification could be more important. It is therefore inferred that both the quality of organic carbon and quantity of iron govern nitrification rates in these mangrove swamps.
cra 2009 Elsevier Ltd. All rights reserved.
1. Introduction
Nitrification is a microbial process that converts ammonium (NH4- ) to nitrate (NOT) via nitrite (N0i) and occupies a central position within the global nitrogen cycle. Hence. the factors regu-lating this process are vital to eutrophication as well as to health concerns related to enhanced nitrate levels in aquatic ecosystems. Nitrification also serves as a significant link between nitrogen mineralization and potential nitrogen loss from the benthic system through denitrification (Seitzinger, 1990: Sloth et al., 1992).
Corresponding author. E-mail address: lokaenlo.org (PA. Loka Bharathi).
0272-7714/S - see front matter a) 2009 Elsevier Ltd. All rights reserved. doi:10.1016/1ecss.2009.07.015
Nitrification was traditionally considered to be restricted to aerobic environments (e.g. Froelich et al., 1979), but studies (Mortimer et al., 2004) have shown that nitrification does happen in anoxic environments at the expense of elements like manganese (Mn) and/or iron (Fe). In a recent study, Krishnan et al. (2007) had sug-gested the possibility of anaerobic nitrification in mangroves as a mechanism to ward off the excess manganese entering the sediments as a result of pollution, Nitrification also depends on NH4 regeneration rates, which in turn is positively influenced by temperature (Nixon, 1981). The presence of organic carbon (OC) compounds may diminish the rate and the yield of nitrate formed. by diverting nitrogen from the nitrifiers to the heterotrophs proliferating at the expense of easily assimilable carbon (Delwiche and Finstein, 1965). However, this depends mainly on the

20'
A • or's z,-)ziAonal r:o ,y
420
K.P. Krishnan, PA. Loka Sharathi / Estuarine, Coastal and Shelf Science 84 (2009) 419-426
magnitude of C:N ratio and the quality of organic compound (Straus and Lamberti, 2000). Straus and Lamberti (2000) have hypothe-sized that high C:N and higher levels of labile organic carbon does inhibit nitrification, whereas low C:N and higher levels of refractory organic carbon enhance nitrification rates. Moreover, though mangroves are considered to be productive coastal marine ecosystems (Qasim and Wafar, 1990), nutrient measurements, especially those of nitrogen which is an important factor sustaining this productivity has been sparse (Dham at al., 2002). Hence, in order to understand some of the important factors regulating nitrification rates (Nrate) two different mangrove sites with different ecological setup were studied (south-west coast of India, Fig. 1). We hypothesize that besides organic carbon, iron could also influence the rate of nitrification.
2. Materials and methods
2.1. Site description and sampling procedure
Sediment cores were collected from mangrove swamps along the Chapora and Mandovi estuaries. The control site (15° 38.28' N and 73° 47.71' E) which is relatively free from metal pollution is located at Tuvem in the Chapora estuary, while the experimental site which is under the influence of ferromanganese ore mining is exposed to enrichment of metal ores of Fe and Mn is located at Diwar (15° 30.42' N and 73° 52.28' E) in the Mandovi estuary (Fig. 1). Monthly sampling was carried out at both the control and experimental sites from April 2005 to April 2006 using a PVC hand-held sediment corer. Sediment core was sectioned at 2 cm intervals in sterile conditions to obtain representative samples at 0-2, 2-4, 4-6, 6-8 and 8-10 cm depths.
2.2. Pore water extraction and chemical analyses
After sectioning the cores, each fraction was made into slurry with a known volume of saline and then loaded separately into centrifuge tubes. The tubes were spun at low RPM (5000) at 4'C for 10 min. The water was then carefully siphoned out into a pre-cleaned 100 ml polyethylene bottle and allowed to stand for 15 min in cold conditions in order to sediment out the coarse particles. Further, the diluted pore water was filtered on GF/F and then subsequently on 0.22 g membrane filter. The filtrate was stored in cold for further analysis. By spinning at low temperature and RPM it was ensured that minimal disturbance was caused to the benthic organisms. which on lysis could change the pore water chemistry. NHL NO1 and NO3 were measured spectrophototnetrically as described by Koroleff (1969), Bendschneider and Robinson (1952) and Wood et al. (1967), respectively. OC was determined by the wet oxidation method with a precision of 0.01% (El Wakeel and Riley, 1957). Sub samples for metal analyses were dried at 60(±2)°C for 48 h and disaggregated in an agate mortar before chemical treat-ment for Fe and Mn analysis. The detailed procedure of sediment digestion is given in Ref. Balaram et al. (1995). Trace metal concentrations (Fe and Mn) were measured using a flame atomic absorption spectrophotometer (MS, Perkin Elmer Model 5000). The accuracy of the analytical procedures was assessed using the certified reference material MAG-1 (USGS) that yielded results within the reference value range (Flanagan, 1967, 1976).
2.3. Measurement of nitrification rates
Nate was measured by the method of Schell (1978). Each intact section was transferred to a beaker (500 ml capacity) to which filtered estuarine water was added. Samples were then incubated with 16 N-NH4C1(10% of the ambient) in the dark for 24 h. At the end of the incubation period, samples were gently mixed and pre-screened through a 200 pm mesh net. Samples were then filtered onto Whatman GF/F filter pads (pre-ignited at 400 'C for 4 h) and 200 ml of the filtrate was recovered for the extraction of nitrite. NO1 in the sample was extracted as a dye (1-benzene-azo-2- napthol) by using an organic solvent. 15 N: 14N isotope ratios of the NO2 extracted from the incubation medium were measured by emission spectrometry using a Jasco N-150 Nitrogen analyzer. Mate was calculated according to Lipschultz (1984). All measurements were done in triplicate.
2.9. Microbial analyses
Sub samples of approximately 5 g wet weight sediment were sampled using sterile syringe cores. The sub samples were trans-ferred to 45 n11 full strength sterile seawater (10 -1 dilution). Tween80 (541.) was added and the mixture was sonicated at 40 mHz for 10 s. Serial dilutions of the sediment samples were made in autoclaved seawater to yield dilutions from 10 -1 to 10-6/ -7. Nitrifiers were enumerated by the most probable number (MPN) method of Alexander and Clark (1965) on both inorganic and organic media. Winogradsky's inorganic nitrifying media (seawater amended with NH4CI of 2 mM final concentration) was distributed in 5 ml quantities in 15 ml screw capped tubes. The organic nitri-fying media was prepared by adding 0.01% final concentration of glucose to Winogradsky's inorganic nitrifying media. From each dilution ranging from 10 1 to 10 6/ -7, 500 IA was inoculated in triplicate in the nitrifying media until the inoculation from the highest dilution into the culture tubes yielded negative results. The culture tubes were incubated in the dark for a period -60 days at 28(±1) °C. After incubation, the tubes were tested for the presence of NO2 and/or NO3. The combinations of positive and negative

8 E 10
IS a. 4.1 C1 2
4
6
8
0
Control b ° 2
4
6
10
a o
E
a. a
2
4
6
8
10 0
2
4
6
8
10
C 0
2 -
4 -
6
Control
8 - t..)
Experiment 10
*c 0
2 -
4
6 -
8
10 0 30
- 's p ,Etrsc-, , i,., ; co:
KR Krishnan. PA. Who Bharathi / Estuarine, Coastal and Shelf Science 84 (2009) 419-426 421
tubes were scored and MPN was assessed from McCready's table (Rodina, 1972).
Statistical analysis was carried out using Pearson's Correlation Coefficient and Analysis of Variance in order to explore the possible associations and variances existing between/within different vari-ables. The analysis was done using Microsoft Excel 2000. The bacterial parameters were normalized by log transformation before analyses.
3. Results
3.1. Pare water chemistry
Monthly down-core variation in NH4 ' , NO2 and NO3 at both the control and experimental sites have been illustrated in Fig. 2a, b and c. respectively. Depth compromised pre-monsoon (February-April) average of NHt at the control site was 19.1 ±4 pg at NH1-
NL ' 1 pore water (n 25). Similar values were encountered at the experimental site with NH'4 averaging 19.9 ± 2.4 pg at NI-11-NL I
pore water (n = 25). However, the monsoon season (June-September) was characterized by lower levels of NH1 at both the control (16.8 ± 3.6 pg at NI-11-NL -1 pore water; n = 20) and exper-
imental sites (14.1 ± 2.1 pg at NHS-NL-1 pore water; n = 20).
0 10 20 30 40
pg at NH4*-N Ll pore water
Interestingly, the post-monsoon (October-January) values at the control site showed an increase in NH1' accumulation (17.9 f 7.9 pg at NH1- ,11.-1 pore water; n = 20) as compared to the monsoon, but they still remained lesser than the pre-monsoon values. NH1 -
accumulation at the experimental site was highest (27.8 ± 5.6 pg at NK-Nr 1 pore water; n = 20) during post-monsoon season as compared to monsoon and pre-monsoon seasons. NH1 showed significant monthly variability at the experimental site (p < 0.001. df = 12), while there was no significant variability at the control site. Similar trend was observed inter-seasonally with no variability at the control site but with a significant variation at the experi-mental site (p = 1.5 x 10⁻⁶, df = 2). When compared, the control and experiment sites differed only in the post-monsoon season (p <0.001. df 1) and this could be attributed to the variability observed at 0-2 cm (p < 0.001, df = 1).
Average pre-monsoon NOi concentration at control and experimental sites were 2.4 ± 0.8 and 2.1 10.1 pg at NOi-NL -1 pore water (n = 25), respectively. During monsoon season, NO2 values at control (2.3 ± 0.5 pg at NOi-NL 1 pore water; n = 20) and experi-mental sites (2.7 ± 0.6 pg at NO1-NL-1 pore water; n -20) were comparable to their pre-monsoon counterparts. The post-monsoon nitrite levels at the control site (2.3 f 0.6 pg at NOi-NL -1 pore water; n = 20) showed a similar trend as that of the other seasons,
Fig. 2. Seasonal down-core variation in pore water ammonium (a). nitrite (h) and nitrate (c) at both the control and experimental sires for the pre-monsoon ( • ): monsoon bland post-monsoon (• ) seasons. Only positive standard deviation is shown in the figure.

'It .
422 K.P. Krishnan, P.A. Lake Bharathi / Estuarine, Coastal and Shelf Science 84 (2009)419-926
but experimental site recorded the lowest values (1.81 0.5 pg at NOi-NI..-1 pore water; n = 20) during the post-monsoon season. NOi showed a significant monthly variability at the experimental site (p < 0.1, df = 12) where as the control site was marked by significant down-core variability (p < 0.01, df= 12). Maximum down-core variation was observed during the pre-monsoon season (p< 0.01, df =4). Even though the inter-seasonal variability occurred neither at the experimental nor at the control site, the bottom most layer of the core (8-10 cm) showed significant vari-ation in NO2both at the control and experimental sites.
Levels of NOi at the control site were 9.3 2.9 pg at N0I-NL -1
pore water (n = 25) during the pre-monsoon season, while the monsoon values were lower (6.1 ±1.2 pg at NO3-NL -1 pore water: n = 20). In contrast, highest NOi" values at the experimental site (13.2 ± 2.0 pg at NO3-NL -1 pore water; n = 20) were recorded during the monsoons. The pre- and post-monsoon values were 8.611 pg at NO3-NL-1 pore water; n = 25 and 8 1 2.1 pg at NOi-
NL 1 pore water: n =20, respectively. However highest levels were recorded at the control site (11.5 11.3 pg at N04-NL ' 1 pore water; n = 20) during the post-monsoon season. N05 showed significant monthly variability at both the control (p = 2.9 x 10 " 5 , df = 12) and
the experimental sites (p - 4.4 x 10 -3, cif = 12). Contrary to the pattern of inter-seasonal stability in N0i, NO3 values were signif-icantly variable at both the control (p < 0.1, df = 2) and experi-mental sites (p < 0.01, df = 2). There exists considerable variability at both the control and experimental sites during the monsoon and post-monsoon seasons (p < 0.1, df = 1).
3.2. Iron, manganese and organic carbon
Monthly down-core variation in Fe, Mn and OC at both the control and experimental sites have been illustrated in Fig. 3a, b and c, respectively. Depth compromised average values of Fe at the control site ranged from 6% to 7.4% for the entire sampling period. There was no inter-seasonal variability at the control site but there was considerable down-core variation (p < 0.1, df = 4) irrespective of the month. In contrast, high inter-seasonal vari-ability was observed at the experimental site (p < 0.001, df = 2), with pre-monsoon showing the highest accumulation of Fe (24 ± 3.2%) followed by post-monsoon (18.7 ± 3.6%) and monsoon (10.2 -1 1.9%) seasons, respectively. Maximum disparity between the control and experimental sites was observed during the pre-monsoon season (p < 0.001, df - 2) while the lowest was during the monsoon (p < 0.01, df = 2). The post-monsoon values depicted a transitional stage with considerable variability (p < 0.001, df = 2).
Even though there was significant monthly variability in the accumulation of Mn at both the control (p < 0.01, df .12) and experimental sites (p < 0.01, df =12), there was no significant inter-seasonal variability at both the sites. In general the Mn levels remained =0.5% at the control site throughout the sampling period, whereas at the experimental site it ranged from 1.1(±0.6)% in the post-monsoon to 1.7(±0.6)% in the monsoon season with intermediate values of 1.4(±0.2%) in the pre-monsoon season. Notable difference between the control and experimental sites was observed in the monsoon season (p <0.001, df = 1). The degree of similarity appears to increase as it progresses to post-monsoon season (p < 0.01 =3.4 x 10 -7 , df =1) and further decreases in the pre-monsoon season (p < 0.0001, df = I ).
A study of the OC at the control and experimental sites revealed lowest values of 1.2(±0.1)% and 1.9(±0.3)%, respectively, during the monsoon season. Both the sites showed differences in pre- and post-monsoon OC accumulation. Highest accumulation at the control site was in the pre-monsoon season (3.1 0.8%) while at the experimental site it was in the post-monsoon season (3.4 1%). In contrast, intermediate values were observed at the control site
during post-monsoon (2.9 1 1.3%) and experimental site during pre-monsoon (2.9±03). Though there was no monthly variability at the control and experimental sites there was considerable inter-seasonal variability at both the sites (control, p < 0.01, df = 2; experiment, p < 0.1, df= 2). The control and experimental sites showed similar values during non-monsoon seasons but different levels during the monsoon (p < 0.1, df= 1). This variability could be attributed to that observed in the depth intervals 0-2 cm (p < 0.1, df = 1) and 2-4 cm (p < 0.1, df= 1).
3.3. Nitrification rates
N„te (Fig. 4a) at the control site ranged from 3.2±1.2 ng at-N g(sediment) -1 h -1 in the monsoon to 6 1.1 and 18.4 1.9 ng at-N g(sediment) 1 h " 1 in the post- and pre-monsoon, respectively. The trend was similar at the experimental site with pre-monsoon showing the highest rates (18.2 1 0.6), followed by post-monsoon (5.8±1.1) and monsoon (2.7±1.5) seasons. There was significant monthly and inter-seasonal variation at both the control (p - 7.2 x 10 -71 , df - 12 and p - 9.3 x 10 -26, df - 2) and experi-mental sites (p 6.5 x 10 -73 , df 12 and p = 63 x 10-28, df = 2). There was no down-core variability in Nraic for both the control and experimental sites.
3.4. Autotrophic and heterotrophic nitrifiers
The abundance of autotrophic (AN, )) and heterotrophic nitrifiers (HNtb) is illustrated in Fig. 4b and c. The ANtb abundance at control site fot all the seasons were -10 6 cells g 1 dry weight of sediment, where as at the experimental site highest abundance was encountered during the pre-monsoon season [2.1(±1) x 107
cells g-1 dry weight of sediment] and the lowest abundance was during the monsoon season [3(17) x 10 5 cells g 1 wet weight of sediment]. The post-monsoon recorded a marginal increase [7(±2) x 105 cells g -1 wet weight of sediment]. The seasonal average of HNtb showed that they were one to two orders higher than the ANtb. At the control site, highest abundance of HNtb was during the pre-monsoon season [3.0(1.1.0) x 10 8 cells g " 1 wet weight of sediment], while the lowest was in the post-monsoon season [1.5(±0.4) x 10 8 cells g 1 wet weight of sediment]. The monsoon season recorded intermediate values [2.4(12.3) x 108 cells
g...1 wet weight of sediment]. The abundance of HNtb at
the experimental site was uniform (2.2-2.5 x 10 8 cells g 1 wet weight of the sediment) throughout the monsoon cycle with highest in the pre-monsoon and lowest in the post-monsoon. There was no inter-monthly variation in the abundance of ANtb at the control site while there was significant variability at the experi-mental site (p = 1.31 x 10 -"6, df =12). In contrast, the HNtb abun-dance showed significant monthly variability at both the control (p = 1.7 x 10 -4, df= 12) and experimental sites (p = 1.5 x 10"
..3,
df = 12). Neither ANtb nor HNtb showed any significant down-core variation at the control and experimental sites. There was consid-erable similarity between the control and experimental sites for all the depth intervals for both the AN tb and 1INtb. A comparison of inter-seasonal abundance revealed variability at the experimental site for ANSI, (p =4.2 x 10⁻³ , df= 2) where as the abundance was uniform at the control site. In contrast, the HNtb showed significant monthly variability at the control site (p = 1.4 x 10 -3 , df = 2), while their inter-seasonal abundance at the experimental site was uniform. On comparing the control and experimental sites for the different seasons, the ANtb varied during both the pre-monsoon (p .4.6 x 10-3, df = 1) and monsoon (p =4.8 x 10 -7 . df= 1) seasons while the post-monsoon season was comparable. Similar comparisons for HNtb yielded contrasting results. There was vari-ability only in the post-monsoon season (p = 3.6 x 10 -7, df= 1)

a o
6
"E' io
.5 0 a O 2
2
4
4
6
8
10 0
K.P. Krishnan, PA. Loka Bhamthi / Estuarine. Coastal and Shelf Science 84 (2009) 419-426
Control b -
2-
4-
423
Control
6-
8
• 100 «
O
•
2
4
6
8-
Control
10 0
o. as O 2
4
6
8
10
10 20 30
Fe (%)
C o
2
4
6
8
10
0
2 3
5
Mn (%)
40 50
2
4 5
TOC (%)
Fig. 3. Seasonal down-core variation in iron (a), manganese (b) and OC (c) at both the control and experimental sites for the pre-monsoon (•); monsoon (0) and post-monsoon (•) seasons. Only positive standard deviation is shown in the figure.
whereas the abundance was uniform for both the pre-monsoon and monsoon seasons.
4. Discussion
4.1. Nitrification rates: process and controls
Lack of seasonal monitoring especially in the benthic realm in mangroves has hampered our understanding on these productive coastal marine ecosystems which are vulnerable to human impacts. Most of the studies conducted in the mangrove forests report sporadic measurements, though some studies conducted in Australia (Boto and Wellington, 1988; Trott and Alongi. 1999), Pakistan (Harisson et al., 1997), Mexico (Rivera-Monroy et al., 1995), and India (Krishnamurthy et al., 1975; Dham et al., 2002) discuss seasonal cycles. Further, very few studies have attempted to inves-tigate benthic nitrification and factors governing the same. Nitri-fying bacteria and Nrate in general, may be regulated by many factors including NH4 (Triska et al., 1990; Jones et al., 1995), pH (Saractch-andra, 1978), temperature (Paul and Clark, 1989), oxygen concen-tration (Stenstromm and Podlska, 1980; Triska et al., 1990), competition for NH1 (Verhagene and Laanbroek, 1991), and OC availability (Verhagene and Laanbroek, 1991). In the present study,
multiple regression analysis was employed along with simple correlation analysis to elucidate the factors governing Nrate. The results of the multiple regression analysis are given in Table 1. In general, Nrate was governed by the availability of OC (r = 0.32, p < 0.01, n = 64) at the control site irrespective of season or depth of sampling. This is further supported by a positive correlation of OC with HN tb = 0.28, p < 0.05, n = 64). Depth wise con -elation analysis gives additional insights into these relationships. N rate at the top layer (0-2 cm) of the core from the control site was governed by the abundance of HNth (r - 0.58,p < 0.02, n 12): whereas at the bottom of the core (8-10 cm) it appears to be regulated by both the abun-dance of NNtb (r - 0.46, p < 0.1. rt -12) as well as the OC (r = 0.45, p < 0.1, n = 12). A positive correlation with NO2 (r - 0.48, p < 0.1,
=12) probably indicates that the NH.L - oxidation might be of a higher magnitude than NOi oxidation. In the pre-monsoon season
Nrate increased depth (r = 0.67, p < 0.001, n = 25) and was limited by the availability of N1-4 Cr - 0.57, p < 0.001, n - 25). A scatter plot of OC:DIN vs nitrification rate (Fig. 5) represents three well defined clusters. The cluster representing the pre-monsoon is well differ-entiated from the other two clusters. In the monsoon season, OC to DIN ratio is low (Fig. 5). This favors enhanced Nrate (Straus and Lamberti, 2002), N rate is negatively linked to OC (r = -0.4, p <0.05, n r, 25) suggesting that the bulk fraction of the carbon is labile. In

Control
Experiment
424 K.P. Krishnan, PA. Lob Bharalhi / Estuarine, Coastal and Shelf Science 84 (2009) 419-426
0 2 4 6 8 10
x 103 cells g -1 wet weight sediment
a
E
a. 0
Control b 2
4-
6
6
8
10 0 2 4 6 8 10
x 102 cells g"1 wet weight sediment
5 10 15 20
ng at N g'1 (sediment) h" 1
10 0
Co
2
4
6
I 8
10 0
0 2
4
6
8
10
Pre-monsoon:
-/ Fig. 4. Seasonal down-core variation in nitrification rates (a). autotrophic nitrifiers (b) and heterotrophic nitrifiers (c) at both the control and experimental sites for the pre-monsoon (•); monsoon (0) and post-monsoon (1r ) seasons. Only positive standard deviation is shown in the figure.
addition, there was no single set of factors governing N rate during the monsoon season. However, the recalcitrant fraction of organic carbon is considered to favor enhanced nitrification rates by reducing the utilization pressure on ammonium between hetero-trophs and nitrifiers (Straus and Lamberti, 2000). Though the OC:DIN ratio is high there is no relation between OC and N ra te for the
pre- and post-monsoon season indicating that OC is either unlim-iting or dominated by the recalcitrant fraction (Fig. 5). in general the system evolves from a 'Low OC:DIN - Low Nrate' system in the monsoon season to a 'High OC:DIN - High N rate ' system in the pre-monsoon season with the post-monsoon representing a transition period where the OC:DIN ratio gradually increased. Hence, our study
Table 1 Summary of multiple regression analysis: only the significant factors are listed (P <0.05) in the descending order of their significance; 'r' value is given in brackets.
Season`
Facto, ender Lomidelatien
-:Control (parameters influencing (lie
Experiment (parameters influencing the fa, .Ctor under....consideration);:, : factor underconsideration) '
Nitrification' rate AutDltQphie: iii triflers Neterotrephic•nittifiers
Nitrification rate Atitotrophic nitrifiers I leterot rorifiic nitrifiers
Nitrification rate Autotrophie• niiHfiers Heterotrophic nitrifiers
Nitrification rate .. • Autotraiihic ,,,triflers
• • • • Heterotrophic nitrifiers
Depth (0.67) '3.1C (077 1 ) ,fsiFI,I..(0.64):, 10.61)
Nil NH) (0.58) - Nil
P1114 (0.69) NH.) (0.74) NOi (0,50)
OC (0.76)> H n th (0.68) N,„, (0,82)
NO2 (0.74)
NH) (0.55) Fe (0 34) Nil
NO2 (0.67) Depth (054)> NO2 (0.47) - NH4 (0.71) , Oc (0.62)
Nil Nil Nil
Fe (0.82)>A no, (0.71) 14144 (0.73) > NO2 (0.62)> Depth (0.61) > OC (0.58) > N>> (0.5 t) 1,6,, (0.65)

• • •
Monsoon
0.06 -
0.14
Z 0.10
O
O
•
0.08 -
0.12 - Post monsoon
• 0
•
0 9 o • 1,
• 10
Pre monsoon
•
•
0.04
Author's per - oneJ cc ,py
K.P. Krishnan, PA. Loka Bharathi / Estuarine, Coastal and Shelf Science 84 (2009)419-426 425
0 5 10 15 20
Nitrification rate (ng at N ce sediment h4 )
Fig. 5. OC: DIN vs nitrification rate for both the control and experimental sites. .Pre-monsoon control (• ). monsoon control (C)) and post-monsoon control ( • ), and pre-monsoon experiment (v). monsoon experiment (111) and post-monsoon experiment (0).
indicates that the quality of OC could be a more important proxy to Nrate rather than OC:DIN ratio. In addition multiple regression analysis (Table 1) shows that NY11" is probably the only ion involved in the regulation of M ate. Further, it could also be deduced that maximum fraction of recalcitrant carbon during the pre- and post-monsoon season is accumulated at 4-6 cm.
Nrate at experimental site showed a positive relation with Fe (r = 0.47, p < 0.001, n = 64) and ANtb (r= 0.43, p < 0.001, n=64) which is indicative of anaerobic autotrophic nitrification. Further, a negative relation with NO3 (r 0.25, p < 0.05, n - 64) signifies feedback inhibition indicating that at the experimental site, Nrate is at the optimum. Hence it appears that the control site is dominated by heterotrophic nitrification whereas autotrophic nitrification governs the experimental site. In addition, OC (3.4 ± 1%) and NI-1,1(27.8 ± 5.6 tg at NH4-NL -1 ) peak at the experimental site during the post-monsoon season while at the control site it was during the pre-monsoon season (DC 3.1 ± 0.8% and NHZ 27.8 ± 4 jig at N1-14-NL-1 ), However, the pre-monsoon of the experimental site was marked by highest levels of nitrification rates (18.2 ± 0.6 ng at-N g(sediment) -1 11 -1 ) indicating a decoupling with OC and NHS. These parameters remain coupled during the pre-monsoon season at the control site. Multiple regression analysis (Table 1) shows that NHS (r = 0.55, p < 0.001, n 25) plays a limiting role in the pre-monsoon season even though the OC:DIN ratio is comparatively higher (Fig. 5). Further, the production of nitrite appears to govern the nitrification rates during the monsoon season. Depth wise correlation analysis shows that the abundance of Amb is the major factor governing the NI-ate for most of the depth intervals sampled. Positive relations with ANSI, at 0-2 cm (r 0.54, p < 0.05, n = 12), 2- 4 cm (r = 0.47, p < 0.1, n - 12), 6-8 cm (r - 0.49, p < 0.1, n 12) and 8-10 cm (r = 0.68, p < 0.01, n = 12) is in accordance with the earlier observation. In addition, Fe appears to be the next critical factor regulating Mate at the experimental site with maximum coupling observed at 4-6 cm (r = p <0.001, it = 12) and 6-8 cm (r= 0.6. p < 0.01, n = 12) intervals. The feedback inhibition of NO3 is restricted to the bottom layer of 8-10 cm depth indicating enhanced nitrification potential down the core till this depth??
4.2. Factors governing the abundance and distribution of nitnfiers
Even though there are reports on the occurrence of heterotro-phic nitrification (Verstraete and Alexander, 1972; Castignetti and Holscher, 1984; Barradough and Puri, 1995; Gupta, 1997; Lu et al.,
2008; Ahmad et al., 2008), most of the studies consider nitrification as a purely chemoautotrophic process. In the present study, we were able to observe the production of NOVNOI even when the nitrifying media was amended with 0.01% glucose favoring higher ratios of OC:DIN. Hence, heterotrophic nitrification could contribute to the total NOVN0i pool. Though quantification of heterotrophic nitrification is yet to be done, we tried to explore the factors governing the abundance of H Nrb. The abundance of ANtb and Hrytb at the control and the former at the experimental site were found to be unlimited by any of the factor measured in this study. However, the Hrytb at the experimental site increased with depth (r . 0.33, p <0.01, n_ 64) and were governed by concentration of NH4'(r = 0.23, p < 0.1,11. 64). Since the Am') fraction is dominant at the experimental site it might outcompete the HNtb for NH4. At the control site in the depth interval 0-2 cm, the NOi production is principally governed by the abundance of HNtb (r 0.55, p <0.05, n - 12), while Mn levels in turn govern (r 0.5, p < 0.05, n - 12) the abundance of these nitrifiers. Another significant relationship at the control site was observed at 4-6 cm, where Hrytb and ANtb were found to be mutually exclusive (r- -0.5, p < 0.05, n = 12) with NO2 having a feedback inhibition on the former (r = -0.48, p < 0.1, n = 12). The abundance of ANtb in the depth intervals of 6-8 and 8-10 cm was governed by the levels of Mn (r = 0.55, p < 0.05, n = 12) and Fe (r= 0.54, p <0.05, n = 12). Moreover the autotrophic nitri-fiers govern the production of NOi at 6-8 cm (r = 0.56, p < 0.05, n = 12). Similarly the abundance of HNtb in the deepest section of the core is governed by the availability of Mn (r = 0.47, p < 0.1. n - 12). Similar to the control site, at the experimental site (0-2 cm) the abundance of Hrytb is governed by the levels of Mn in the sediment. The Hrytb at 4-6 cm were governed by the levels of NHZ (r = 0.79, p < 0.001, n - 12) and they could be actively linked to NOJ production (r = 0.46, p < 0.1, it = 12). In a seasonal perspective it was found that at the control site the availability of N1 -13" is the most important factor governing the abundance of ANUS during all the seasons, except for the post-monsoon season when there is a feedback inhibition by NO3 ; the abundance of HNth is probably not limited by any factor under consideration in the present study. At the experimental site, only NHT and OC were found to regulate the abundance of Hrytb during the monsoon season. However, Fe and depth were the two parameters governing the abundance of ANtb
during pre-monsoon and monsoon seasons. Their abundance was not limited by any factor during the post-monsoon season.
5. Conclusion
The role of iron in governing N ratt. in mangrove sediments has been demonstrated. Our studies suggest that heterotrophic nitrifi-cation could be more ubiquitous and significant in mangrove ecosystems. In spite of having similar levels of OC and N eat, at both the sites, the underlying mechanisms governing the processes could be different. Higher abundance of HNIb at both the sites (10 2-3 cells g- I ) and the ANtb at the experimental site (-10 3 cells g-I ) reflect the relatively higher retractile nature of organic carbon at the experi-mental site. We conclude that both the quality of organic carbon and quantity of iron govern nitrification rates in these mangrove swamps.
Acknowledgements
Authors wish to express their gratitude to Dr. Satish R. Shetye, Director, NIO and Dr. Rasik Ravindra. Director. NCAOR for their interest in this work. Our sincere thanks to Prof. McLusky and an anonymous reviewer for critically reviewing the manuscript. KPK records his gratefulness to UGC (Government of India) for the award of Senior Research Fellowship.
25

AtithOi 3 1"--121,1
426
K.P. Krishnan, PA. Loka Bharathi I Estuarine, Coastal and Shelf Science 84 (2009) 419-426
References
Ahmad, N., Haiying. X.U., Liping, C„ Zhipei, L. Shuangjiang, L, 2008. Enhanced bio-logical nutrient removal by the alliance of a heterotrophic nitrifying strain with a nitrogen removing ecosystem. Journal of Environmental Sciences 20, 216-223.
Alexander, M., Clark, FE., 1965. Nitrifying Bacteria. Methods of Soil Analysis. Part 2. American Society Agronomy. Madison. WI. 1477-1483.
Balaram, V., Ramesh.. S.L. Anjaiah. K.V.. 1995. Comparative study of the sample decomposition procedures in determination of trace and rare elements in anorthosites and related rocks by ICP-MS. Fresenius Journal Analytical Chem-istry 353,176-182.
garraclaugh, D.. Puri, G., 1995. The use of 15N pool dilution and enrichment us separate the heterotrophic and autotrophic pathways of nitrification. Soil Biology and Biochemistry 27, 17-22.
Bendschneider, K. Robinson, N.J.. 1952. A new spectrophotometric determination of nitrite in sea water. Journal of Marine Research 11, 87-96.
Boto, K.G., Wellington, J.T.. 1988. Seasonal variations in concentrations and fluxes of dissolved organic and inorganic materials in a tropical, tidally dominated mangrove waterway. Marine Ecology Progress Series 50, 151-160.
Castignetti, D., Holocher, U., 1984. Heterotrophic nitrification among denitrifiers. Applied and Environmental Microbiology 47, 620-623.
Delwiche, CC.. Einstein, MS.. 1965. Carbon and energy sources for the nitrifying autotroph Nitrobacter. Journal of Bacteriology .90, 102-107.
Dham, V.V.. Heredia, AM., Wafar..S., Wafar, M., 2002. Seasonal variations in uptake and in situ regeneration of nitrogen in mangrove waters. Limnology and Oceanography 47, 241-254.
El Waked. S.K, Riley, J.P.,1957. Determination of organic carbon In the marine muds. Journal Du Conseil Intrenational Pour L'expioration De La Mer 22,180-183.
Flanagan, F.J., 1967. U.S. Geological Survey silicate rock standards. Geochimica et Cosmoshimica Acta 31, 289-308.
Flanagan, F.J., 1976. Descriptions and analyses of eight new USGS rock standards. U.S. Geological Survey Professional Paper 840, 192.
Froelich, P.N., Klinkhammer, G.P„ Bender, Mt, Luedtke, N.A., Heath, G.R., Cullen, D., Dauphin. P., Hammond, D., Hartman, B., Maynard, V., 1979. Early oxidation of organic matter in pelagic sediments of the eastern equatorial Atlantic: suboxic diagenesis. Geochimica et Cosmochimica Acta 43, 1075-1090.
Gupta, A.B., 1997. Thiosphaera pantotropha: a sulphur bacterium capable of simul-taneous heterotrophic nitrification and aerobic denitrification. Enzyme and Microbial Technology 21, 589-595.
Harisson, PH., Khan, N.. Yin, IC, Salcem. M., Bano, N., Nisa, M.. Ahmed. Si, Rizvi, N., Azam, F., 1997. Nutrient and phytoplankton dynamics in two mangrove tidal creeks of the Indus river delta, Pakistan. Marine. Ecology Progress Series 157, 13-19.
Jones, J.B., Fisher, S.C., Grimm, N.R. 1995. Nitrification in the hyporheic zone of a desert stream ecosystem. Journal of the North American Benthological Society 14. 249-258.
Koroleff, F..1969. Direct determination of ammonia in natural waters as Indophenol blue. International Conference in the Exploration of the Sea. ICES, Denmark, 1969/C9 4p.
Krishnamurthy, K., Sundararaj, V., Santhanam, R.. 1975. Aspects of an Indian Mangrove. In: Walsh, G., Snedaker, S., Teas. I. (Eds.), Proceedings of the Inter-national Sympasium an Biology and Management of Mangroves. Gainesville, Florida. University of Florida. Institute of Food and Agricultural Sciences, pp. 88-95.
Krishnan, K.P.. Fernandes. 5.0., Chandan, Loka I3harathi, PA., 2007. Bacterial contribution to mitigation of iron and manganese in mangrove sediments. Marine Pollution Bulletin 54, 1427-1433.
Lipschultz. F., 1984. Environmental factors affecting rates of nitrogen cycling. Ph.D. Thesis, Harvard University. Cambridge. Massachusetts.
to, J. Jin, Q., He. Y., Wu, J., Zhao. J., 200B. Biodegradation of nonylphenol ethoxylates by Bacillus sp. LY capable of heterotrophic nitrification. FEMS Microbiology Letters 2B0, 28-33.
Mortimer. R.J.G., Harris, S.J., Krom, M.D., Freitag. T.E.. Prosser, J.I., Barnes, J., Anschutz, P., Hayes. P.J., Davie, I.M.. 2004. Anoxic nitrification in marine sedi-ments. Marine Ecology Progress Series 276, 37-51.
Nixon. S.W., 1981. Remineralization and nutrient cycling in coastal marine ecosys-tems. In: Neilson, 13.J., Cronin, LE. (Eds.), Estuarine and Nutrients. Humana. New Jersey, pp. 111-13B.
Paul, EA.. Clark, EE.,1989. Soil Microbiology and Biochemistry. Academic Press. Inc.. Harcourt Brace Jovanovich, Publishers. San Diego, CA. 275p.
Qasim, S.Z.. Wafar, M.V.M., 1990. Marine resources in the tropics. Resource Management and Optimization 7. 141-169.
Rivera-Monroy. V.H.. Day, J.D., Twilley, R.R.. Vera-Herrera. F., Coronado-Molina. C., 1995. Flux of nitrogen and sediment in a fringe mangrove forest in Terminos Lagoon, Mexico, Estuarine, Coastal Shelf Science 40,139-160.
Rodin, AG., 1972. Methods in Aquatic Microbiology. University Park Press, But-terworths. Baltimore, London. 269-291.
Saractchandra, AU., 1978. Nitrification activities and the changes in the populations of nitrifying bacteria in soil perfused at two different H-ion concentrations. Plant and Soil 50, 99-111.
Schell, D.M., 197B. Chemical and isotopic methods in nitrification studies. In: Schlessinger. D. (Ed.). Microbiology-1978. American Society for Microbiology, Washington D.C, pp. 292-295.
Seitzinger. S.P.. 1990. Denitrification in aquatic sediments. In: Revsbech, N.P., Sorensen, J. (Eds.), Denitrification in Soil and Sediment. Plenum. New York, pp. 301-322.
Sloth, N.P., Nielson, LP., Blackburn. T.H.. 1992. Nitrification in sediment cores measured with acetylene inhibition. Limnnlogy and Oceanography 37,1108-1112.
Sten stromm, K., Podiska. B.A., 1980. The effect of dissolved oxygen concentration on nitrification. Water Research 14, 643-649.
Straits. E.A., Lamberti, C.A., 2000. Regulation of nitrification in aquatic sediments by organic carbon. Limnology and oceanography 45, 1854-1859.
Straus, E.A., lamberti, G.A., 2002. Effect of dissolved organic carbon quality on microbial decomposition and nitrification rates in stream sediments. Fresh-water Biology 47, 65-74.
Triska. F.J., Doff, J.H., Avanzino, kJ., 1990. Influence of exchange flow between the channel and hyporheic zone on nitrate production in a small mountain stream. Canadian Journal of Fisheries and Aquatic Science 47, 2099-2111.
Trott, LA., Alongi, DM., 1999. Variability in surface water chemistry, and phyto-plankton biomass in two tropical, tidally dominated mangrove creeks. Marine and Freshwater Research 50, 451-457.
Verhagene. J.M., Laanbroek, HI. 1991. Competition for ammonium between nitri-fying and heterotrophic bacteria in dual energy-limited chemostats. Applied and Environmental Microbiology 57, 3255-3263.
Verstraete, W., Alexander, M., 1972. Mechanism of nitrification by Arthrobacter sp. Journal of Bacteriology 110. 962-967.
Wood, ED.. Armstrong, FAJ.. Richards, FA. 1967. Determination of nitrate in seawater by cadmium-copper reduction to nitrite, Journal of Matisse Biological Association of United Kingdom 47, 23-31.