annex no.5 verification test for hydro-suction...
TRANSCRIPT

Annex No.5 Verification Test for
Hydro-Suction System for Sediment Removal

i
THE STUDY ON COUNTERMEASURES FOR SEDIMENTATION
IN THE WONOGIRI MULTIPURPOSE DAM RESERVOIR
IN THE REPUBLIC OF INDONESIA
FINAL REPORT
SUPPORTING REPORT I
Annex No.5: Verification Test for Hydro-Suction System for Sediment Removal
Table of Contents
Page
CHAPTER 1 INTRODUCTION..................................................................................................5-1
1.1 Background of Verification Test ....................................................................................5-1 1.2 Objective of Verification Test ........................................................................................5-2
CHAPTER 2 OVERVIEW OF VERIFICATION TEST ..............................................................5-3
2.1 Schedule of Verification Test .........................................................................................5-3 2.2 Location of Verification Test..........................................................................................5-3 2.3 Selection of Hydro-suction System Type.......................................................................5-4 2.4 Equipment of Verification Test ......................................................................................5-4 2.5 Method of Verification Test............................................................................................5-6
CHAPTER 3 GEOTECHNICAL CONDITION OF SEDIMENT IN WONOGIRI
RESERVOIR ..........................................................................................................5-7 3.1 Location of Core Drilling...............................................................................................5-7 3.2 Results of Soil Mechanical Test .....................................................................................5-7
CHAPTER 4 VERIFICATION TEST ..........................................................................................5-9
4.1 Pre-Test ..........................................................................................................................5-9 4.1.1 Purpose ...........................................................................................................5-9 4.1.2 Remarks on Pre-Test .......................................................................................5-9
4.2 Final Test......................................................................................................................5-11 4.2.1 Conditions.....................................................................................................5-11 4.2.2 Head Loss .....................................................................................................5-11 4.2.3 Pipe Flow Velocity and Density....................................................................5-16 4.2.4 Dredging Depth.............................................................................................5-22

ii
4.2.5 Sediment Removal Amount ..........................................................................5-23 4.2.6 Debris and Garbage ......................................................................................5-24
4.3 Applicability to Wonogiri Reservoir Sediment Management ......................................5-25 CHAPTER 5 WONOGIRI RESERVOIR SEDIMENT MANAGEMENT PLAN ....................5-26
5.1 Wonogiri Reservoir Sediment Management Plan ........................................................5-26 5.1.1 In Flooding Time ..........................................................................................5-26 5.1.2 In Power Plant Operation Time.....................................................................5-30 5.1.3 Wonogiri Reservoir Sediment Removal Management Plan..........................5-32
5.2 Cost Estimate ...............................................................................................................5-35 5.2.1 Conditions.....................................................................................................5-35 5.2.2 Cost Estimate ................................................................................................5-35
5.3 Maintenance Plan.........................................................................................................5-41 5.4 Consideration ...............................................................................................................5-42
5.4.1 Combination Plan .........................................................................................5-42 5.4.2 Feature and Cost ...........................................................................................5-42
List of Tables
Table 2.1.1 Schedule of Verification Test ................................................................................5-3 Table 3.2.1 Results of Soil Mechanical Test ...........................................................................5-8 Table 4.1.1 Results of Pre-test ...............................................................................................5-10 Table 4.1.2 Evaluation of Each Excavator ............................................................................5-11 Table 4.2.1 Conditions of Verification Test ...........................................................................5-11 Table 4.2.2 Pipeline Head Loss .............................................................................................5-13 Table 4.2.3 Pipeline Friction Coefficient of High-Density Polyethylene Pipe......................5-15 Table 4.2.4 Soil Coefficient (Criteria) ...................................................................................5-16 Table 4.2.5 Calculation of Soil Coefficient .........................................................................5-17 Table 4.2.6 Soil Coefficient (In final test at Wonogiri Reservoir).........................................5-16 Table 4.2.7 Flow Velocity and Density in Pipeline ...............................................................5-22 Table 4.2.8 Sounding Result of Sediment Removal Amount ................................................5-23 Table 4.2.9 Amount of Sediment in Receiving Tank.............................................................5-23 Table 4.2.10 Calculated Amount of Dredged Sediment ..........................................................5-23 Table 4.2.11 Garbage and Pebbles Removed by Hydro-Suction System................................5-24 Table 5.1.1 Suction Amount in Flooding Time .....................................................................5-28 Table 5.1.2 Stress Index.........................................................................................................5-30 Table 5.1.3 Pipeline Head Loss ...............................................................................................5-6 Table 5.1.4 Suction Amount in Power Plant Operation Time ...............................................5-31 Table 5.1.5 Suction Operation in Wonogiri Reservoir ..........................................................5-32 Table 5.2.1 Cost of the Hydro-suction Sediment Removal System ......................................5-35 Table 5.2.2 Cost of Hydro-suction Sediment Removal System in 11 Years..........................5-36 Table 5.2.3 Cost of Hydro-suction Sediment Removal System in 50 years...........................5-37

iii
Table 5.2.4 The Net Present Value of the Hydro-suction Sediment Removal System Cost.....................................................................................................................5-11
Table 5.2.5 Cost of the Dredger Sediment Removal System ................................................5-38 Table 5.2.6 Cost of the Dredging Sediment Removal System in 11 Years............................5-39 Table 5.2.7 Cost of the Dredger Sediment Removal System in 50 Years .............................5-40 Table 5.2.8 The Net Present Value of the Dredger Sediment Removal System Cost............5-39 Table 5.2.9 Comparison of Cost ............................................................................................5-39 Table 5.3.1 Daily Maintenance Plan......................................................................................5-41 Table 5.3.2 Regular Maintenance Plan..................................................................................5-41 Table 5.4.1 Cost of the Combination System........................................................................5-43 Table 5.4.2 Cost of the Combination System in 11 Years .....................................................5-44 Table 5.4.3 Cost of the Combination System in 50 Years .....................................................5-45 Table 5.4.4 The Net Present Value of the Combination System Cost ...................................5-44
List of Figures
Figure 1.1.1 Schematic Profile of Hydro-Suction System........................................................5-1 Figure 2.2.1 Location of Verification Test ................................................................................5-3 Figure 2.4.1 Plane of Hydro-suction System ............................................................................5-4 Figure 2.5.1 Mode of Dredging ................................................................................................5-6 Figure 3.1.1 Location of Core Drilling .....................................................................................5-7 Figure 4.1.1 Water jet Nozzle .................................................................................................5-10 Figure 4.1.2 Side Rotary Type ................................................................................................5-10 Figure 4.2.1 Piping System.....................................................................................................5-12 Figure 4.2.2 Relation Between Velocity and Head Loss (Clear Water) ..................................5-14 Figure 4.2.3 Relation Between Pipeline Length and Head Loss(Clear Water) .......................5-14 Figure 4.2.4 Pipeline (Ф400mm) Head Loss During Dredging.............................................5-15 Figure 4.2.5 Relationship Between Flow and Density (in Front of Intake) ............................5-18 Figure 4.2.6 Relationship Between Flow and Density (A-2 Area) .........................................5-19 Figure 4.2.7 Relationship Between Flow and Density (A-2 Area) .........................................5-20 Figure 4.2.8 Flow Velocity and Density of Sediment in Pipeline ...........................................5-21 Figure 4.2.9 Relationship Between Absolute Volumetric Concentration and Density ...........5-22 Figure 5.1.1 Dredging Area ....................................................................................................5-27 Figure 5.1.2 Critical Flow Velocity and Density.....................................................................5-29 Figure 5.1.3 Density and Volumetric Consistency..................................................................5-29 Figure 5.1.4 Volumetric Sediment Concentration and Critical Flow Velocity........................5-29 Figure 5.1.5 Plan of Hydro-suction Sediment Removal System ............................................5-33 Figure 5.1.6 Detail of Siphon Barge .......................................................................................5-34 Figure 5.4.1 Plan and Cross Section of Barge ........................................................................5-44
Attachment
Attachment Details of Cost Estimate

The Study on Countermeasures for Sedimentation Final Report in the Wonogiri Multipurpose Dam Reservoir Supporting Report Annex No.5
Nippon Koei Co.,Ltd. July 2007 Yachiyo Engineering Co.,Ltd.
5-1
CHAPTER 1 INTRODUCTION
1.1 Background of Verification Test
The sedimentation problem on the intake of Wonogiri Reservoir is regard as the one that needs to be urgently solved in case its inlet portion is likely to be filled up with sediments, since it has adverse effects on hydropower generation and irrigation water supply to the downstream areas.
Conventional hydraulic dredging has been commonly used to remove sediments in reservoirs in the world because of its reliability. But nowadays there is a tendency not to accept this way owing to the following reasons.
i) Hydraulic dredging is relatively high in cost. ii) Acquisition of sufficient spoil bank for disposal of dredged material is quite
difficult. iii) Request to release sediments from reservoir has been increasing among the people
considering of river environment. Hydro-suction System is much note for the new sediment extractor on above-mentioned subjects in Japan. To remove sediments from reservoir, it utilizes a head between reservoir water surface and outlet point, which is located downstream of dam as illustrated below:
Source: JICA Study Team Figure 1.1.1 Schematic Profile of Hydro-Suction System
This is also useful to remove sediments at around the intake of Wonogiri Reservoir to keep the function with the maintenance-free and sustainable condition.
On the other hand, technologies on Hydro-suction System are still under development and operation of the new system has not yet been practiced in existing reservoir as the permanent measure in Japan. In addition, there are some uncertain matters in applying to Wonogiri Reservoir in this stage. One of them is that a large quantity of vegetative debris and garbage are washed to the front of the intake after flood and most of them finally accumulate on the reservoir bed. Therefore, the new system requires a verification test to certify whether it is effectively applicable to remove the sediments composed of consolidated silt, sand, clay mixed with vegetative debris and garbage in Wonogiri Reservoir. Taking such aspects into consideration, it was determined that the countermeasure for sediment accumulation at and around the intake be selected based on the results of Verification Test in the field.
Sediment
Dam
Reservoir
Sediment Passing Pipe
Anchor Lifting Boat
Head
Suction Pipe

The Study on Countermeasures for Sedimentation Final Report in the Wonogiri Multipurpose Dam Reservoir Supporting Report Annex No.5
Nippon Koei Co.,Ltd. July 2007 Yachiyo Engineering Co.,Ltd.
5-2
1.2 Objective of Verification Test
The objectives of Verification Test are as follows:
i) To confirm whether Hydro-suction System is applicable to the sediment materials containing vegetative debris and garbage in Wonogiri Reservoir
ii) To collect and analyze the basic operational data related to Hydro-suction System iii) To examine and develop Hydro-suction System, which can be operated at low cost
through energy saving

The Study on Countermeasures for Sedimentation Final Report in the Wonogiri Multipurpose Dam Reservoir Supporting Report Annex No.5
Nippon Koei Co.,Ltd. July 2007 Yachiyo Engineering Co.,Ltd.
5-3
CHAPTER 2 OVERVIEW OF VERIFICATION TEST
2.1 Schedule of Verification Test
Verification Test was carried out at the field in Wonogiri Reservoir, being conducted by entrusting it to a qualified Japanese sub-contractor, Damdre Co., Ltd., for the period from September 12th to October 31st, 2005. The detailed schedule of the verification test is shown in Table 2.1.1 below.
Table 2.1.1 Schedule of Verification Test Work Item Aug. Sep. Oct. Nov. Dec.
Planning and Designing of Test Production and Mobilization Transportation and Installation Pre-test. Final Test Demobilization Evaluation and Reporting
Work in Japan Work in Indonesia
As shown in the table above, the verification test was conducted in two (2) stages, namely pre-test and final test. The pre-test aimed to preliminarily confirm the functions of all equipment and devices for the hydro-suction system and to establish the applicable system for the final test. After the pre-test, the final test was conducted to collect the detail operational data using the applicable system.
2.2 Location of Verification Test
Locations of Verification Test were selected at and around the intake as shown in Figure 2.2.1 below. The pre-test and final test were carried out at A-1 and A-2 points, respectively, which are shown in Figure 2.2.1.
0 50 100 mSCALE
B1
B3B4
B2
Area C Area A
Area B
A-1A-2
Source: JICA Study Team
Figure 2.2.1 Location of Verification Test

The Study on Countermeasures for Sedimentation Final Report in the Wonogiri Multipurpose Dam Reservoir Supporting Report Annex No.5
Nippon Koei Co.,Ltd. July 2007 Yachiyo Engineering Co.,Ltd.
5-4
2.3 Selection of Hydro-suction System Type
The hydro-suction system is roughly classified into two (2) types, namely mobile type and fixed type. In case of the fixed type, a dredging area is limited on account of a discharge pipe being embedded at reservoir bottom, while a dredging area of the mobile type is not limited owing to being able to move to any position in reservoir. In addition to this, the fixed type has a weakness for garbage for its rigidity. Consequently, the mobile type was selected for the verification test in Wonogiri Reservoir.
2.4 Equipment of Verification Test
Equipment for Verification Test was mainly composed of Barge, Discharge Pipe ( Φ400mm, High-density polyethylene ), Receiving Tank ( L4.0m x W5.0m x H4.0m ), Storage Tank ( L8.0m x W9.0m x H2.0m ) and Return-to-Reservoir Pipe ( including pump).
The Plane figure of the equipment is shown in Figure 2.4.1. And photos of those equipment were shown in Photo 2.4.1 to 2.4.5.
Receiving Tank, Storage Tank and Return-to-Reservoir Pipe are normally not necessary for the hydro-suction system. Those were added as countermeasure to prevent discharge flow ( including sediment material ) going downstream in consideration of river environment in this test.
Source: JICA Study Team
Figure 2.4.1 Plane of Hydro-suction System

The Study on Countermeasures for Sedimentation Final Report in the Wonogiri Multipurpose Dam Reservoir Supporting Report Annex No.5
Nippon Koei Co.,Ltd. July 2007 Yachiyo Engineering Co.,Ltd.
5-5
Photo 2.4.1 Barge and Discharge Pipe Photo 2.4.2 Discharge Pipe over Crest at Spillway
Photo 2.4.3 Return-to-Reservoir Pipe Photo 2.4.4 Receiving Tank
Photo 2.4.5 Storage Tank
Source: JICA Study Team

The Study on Countermeasures for Sedimentation Final Report in the Wonogiri Multipurpose Dam Reservoir Supporting Report Annex No.5
Nippon Koei Co.,Ltd. July 2007 Yachiyo Engineering Co.,Ltd.
5-6
2.5 Method of Verification Test
Verification Test was carried out following order.
(1) Preliminary Works
Before beginning the hydro-suction system operation, the discharge pipe was filled up with water to cause the siphon phenomenon by using water pump and vacuum pump.
(2) Dredging
In succession to the above preliminary works, it was ensured that the discharge pipe on the barge could move up- and downwards and to the left and right by winch and that the barge could move back and forward using the side winches for an anchor at gunwale and spuds. The dredging area and depth was controlled by handling these equipment as shown Figure 2.5.1 below.
Source: JICA Study Team
Figure 2.5.1 Mode of Dredging
(3) Piping
The discharge pipe was extended into the downstream direction from the barge getting over crest at the spillway. A high-density polyethylene pipe of 400mm in diameter was used for the main pipeline.
(4) Releasing
In consideration of the environmental aspect, discharge water used for the dredging was released into the storage tank through the receiving tank, those were placed on the middle portion of the spillway, in order to prevent it from flowing down. Subsequently, discharge water in the storage tank was returned into the reservoir by operating the return pumps.
Operation Spud
Advance Spud
Rig
ht S
win
g Le
ft Sw
ing
1st layer
3rd layer
5th layer
The Study on Countermeasures for Sedimentation Final Report in the Wonogiri Multipurpose Dam Reservoir Supporting Report Annex No.5
Nippon Koei Co.,Ltd. July 2007 Yachiyo Engineering Co.,Ltd.
5-7
CHAPTER 3 GEOTECHNICAL CONDITION OF SEDIMENT IN WONOGIRI RESERVOIR
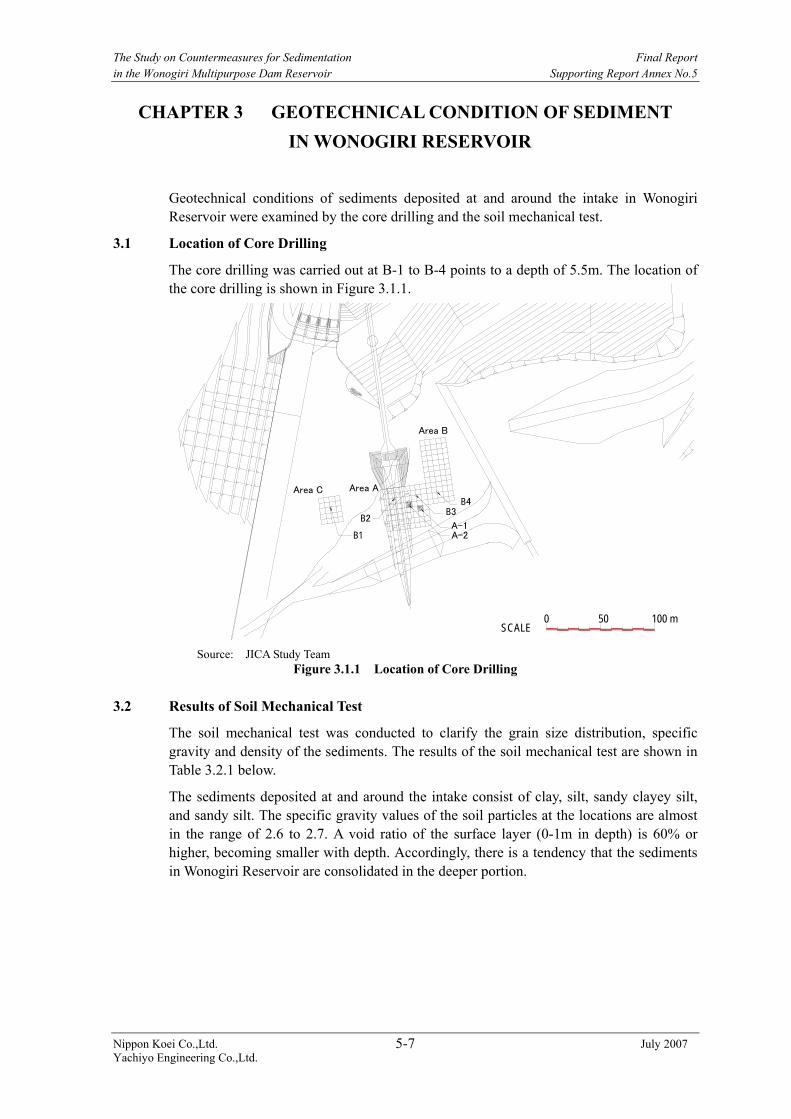
Geotechnical conditions of sediments deposited at and around the intake in Wonogiri Reservoir were examined by the core drilling and the soil mechanical test.
3.1 Location of Core Drilling
The core drilling was carried out at B-1 to B-4 points to a depth of 5.5m. The location of the core drilling is shown in Figure 3.1.1.
0 50 100 mSCALE
B1
B3B4
B2
Area C Area A
Area B
A-1A-2
Source: JICA Study Team
Figure 3.1.1 Location of Core Drilling
3.2 Results of Soil Mechanical Test
The soil mechanical test was conducted to clarify the grain size distribution, specific gravity and density of the sediments. The results of the soil mechanical test are shown in Table 3.2.1 below.
The sediments deposited at and around the intake consist of clay, silt, sandy clayey silt, and sandy silt. The specific gravity values of the soil particles at the locations are almost in the range of 2.6 to 2.7. A void ratio of the surface layer (0-1m in depth) is 60% or higher, becoming smaller with depth. Accordingly, there is a tendency that the sediments in Wonogiri Reservoir are consolidated in the deeper portion.

The Study on Countermeasures for Sedimentation Final Report in the Wonogiri Multipurpose Dam Reservoir Supporting Report Annex No.5
Nippon Koei Co.,Ltd. July 2007 Yachiyo Engineering Co.,Ltd.
5-8
Table 3.2.1 Results of Soil Mechanical Test Point B-1 B-2 B-3 B-4
Depth (m)
Soil
Specific gravity
Void ratio (%)
Soil Specific gravity
Void ratio (%)
Soil Specific gravity
Porosity (%)
Soil Specific gravity
Void ratio (%)
0.0 – 0.5
Clay silt 2.658 63.63 Clay silt 2.690 60.92 Clay 2.616 61.47 Silty clay 2.604 60.36
1.0 – 1.5
Sandy clayey silt
2.620 62.55 Clay 2.640 57.84 Sandy silt 2.653 56.13 Clay 2.619 59.83
2.0 – 2.5
Sandy clayey silt
2.597 61.69 Clay 2.589 52.29 Sandy silt 2.692 56.32 Clay 2.681 60.81
3.0 – 3.5
Sandy clayey silt
2.610 59.67 Sandy clayey silt
2.706 55.98 Silt 2.588 56.53 Sandy clayey silt
2.652 57.47
4.0 – 4.5
Sandy silt
2.661 59.59 Clay 2.655 54.72 Sandy clayey silt
2.587 59.00 Sandy clayey silt
2.634 55.46
5.0 – 5.5
Sandy silt
2.620 53.12 Clay 2.590 53.32 Clay 2.600 52.26 Sandy clayey silt
2.616 53.32
Note: The void ratio (P) is calculated by following equation. P = (1 – γd/γs) x 100 (%) γd : Specific gravity in dry condition (g/cm3) γs : Specific gravity of soil particle (g/cm3)
Source: JICA Study Team

The Study on Countermeasures for Sedimentation Final Report in the Wonogiri Multipurpose Dam Reservoir Supporting Report Annex No.5
Nippon Koei Co.,Ltd. July 2007 Yachiyo Engineering Co.,Ltd.
5-9
CHAPTER 4 VERIFICATION TEST
4.1 Pre-Test
4.1.1 Purpose
Pre-test was carried out to check the functions of all equipment and to select the best excavator for the final test.
4.1.2 Remarks on Pre-Test
(1) Flow Velocity
The maximum flow velocity of 2.2 m/s and flow rate of 16.6 m3/mim. assumed in calculations, were not confirmed due to occurring a trouble of the flexible hose and the high density polyethylene pipe, even though flow velocity of 1.9 m/s and flow rate of 14.5 m3/min. were secured. (shown in Photo 4.1.1 to 4.1.2)
Based on the above-mentioned situation, operation with a pipe internal pressure of less than -2.4 m was judged to be impossible, and the subsequent tests were carried out by operating the system with an internal pressure of -2.4 m or more.
Source: JICA Study Team Source: JICA Study Team Photo 4.1.1 Deformation of the Rubber Photo 4.1.2 Deformation of the High Density
Flexible Jjoint Polyethylene
(2) Excavator
The excavator used for the pre-test were the water jet nozzle and the side rotary type. (Shown in Photo 4.1.3 to 4.1.4 and Figure 4.1.1 to 4.1.2 respectively)
Table 4.1.1 shows the flow rate of the flow velocity in the pipe, density, volumetric concentration, amount of discharged sediments, amount of discharged sediments per unit of time, power consumption, and amount of discharged sediment per unit of power in each operation. A total evaluation of each of the excavator based on the above was made with the results shown in Table 4.1.2. In consideration of the evaluation, the side rotary excavator was selected for the final test.

The Study on Countermeasures for Sedimentation Final Report in the Wonogiri Multipurpose Dam Reservoir Supporting Report Annex No.5
Nippon Koei Co.,Ltd. July 2007 Yachiyo Engineering Co.,Ltd.
5-10
Source: JICA Study Team Source: JICA Study Team
Photo 4.1.3 Water Jet Nozzle Photo 4.1.4 Side Rotary Type
Source: JICA Study Team Source: JICA Study Team Figure 4.1.1 Water jet nozzle Figure4.1.2 Side rotary type
Table 4.1.1 Results of Pre-test
Flow rate
Velo-
city
Density Concen-
tration
Pipe length
Dredging volume
Dredgingvolume per unit
time
Electricity consump-
tion
Dredgin volume per unit electric
power
Water consump-
tion
Water consump-tion per
unit dredging volume
Excavator
m3/min. m/s g/cm3 % m m3 m3/hr kwh m3/kwh m3 m3/m3/
Water jet
nozzle 8~14.3 1.1~1.9 1.027~
1.053 4.72~9.27 360 3.8 11.5 11 0.3 206.0 54.2
Side rotary 8~10.5 1.1~1.4
1.025~
1.058 3.66~8.48 360 8.1 24.5 1 8.1 181.5 22.4
Side rotary
(No power) 9~13.4 1.2~1.8 1.027~
1.048 3.95~7.02 360 4.9 14.8 0 - 217.9 44.5
Note : Absolute volumetric concentration C(%) = (γ-1)/(γs-1) ×100 Volumetric concentration C’(%) = C/(1-P/100) where; γ: density in pipe (g/cm3) γs:specific gravity for soil particle P :soil prosity(%)
Source: JICA Study Team

The Study on Countermeasures for Sedimentation Final Report in the Wonogiri Multipurpose Dam Reservoir Supporting Report Annex No.5
Nippon Koei Co.,Ltd. July 2007 Yachiyo Engineering Co.,Ltd.
5-11
Table 4.1.2 Evaluation of Each Excavator
Excavator Amount of discharged
sediment per unit of time (m3/h)
Amount of discharged
sediment per unit of power (m3/kwh)
Water consumption per unit of discharged sediment (m3/m3)
Blockage by garbage
Jet nozzle 3 3 3 1 Side rotary 1 2 1 2
Side rotary without power 2 1 2 2 Note; 1 ranks above 2 and 3.
Source: JICA Study Team
(3) Evaluation of Pipe
Though deformation occurred in the discharge pipe made of high density polyethylene and rubber flexible joint due to negative pressure, this problem would be dissolved by using high density polyethylene pipe and rubber flexible joint, which have higher strength. The high density polyethylene pipe is considered to be more adequate for the discharge pipe, owing to its lightweight, excellent workability, wear resistance, durability, and low head loss in comparison with steel pipe.
4.2 Final Test
4.2.1 Conditions
The final test using side rotary excavator was carried out for the sixteen (16) different conditions worked out by changing depth and flow rate as shown in Table 4.2.1.
Table 4.2.1 Conditions of Verification Test Excavator Side rotary
Flow rate (m3/min) 9.5,9.9,10.0,10.3,10.9, 11.0 10.3,11.0,11.8,12.0, 12.5 11.3,11.5,11.6,11.7, 12.0Depth of excavation 1 m 2 m 3 m
Number of Conditions 6 5 5 Source: JICA Study Team
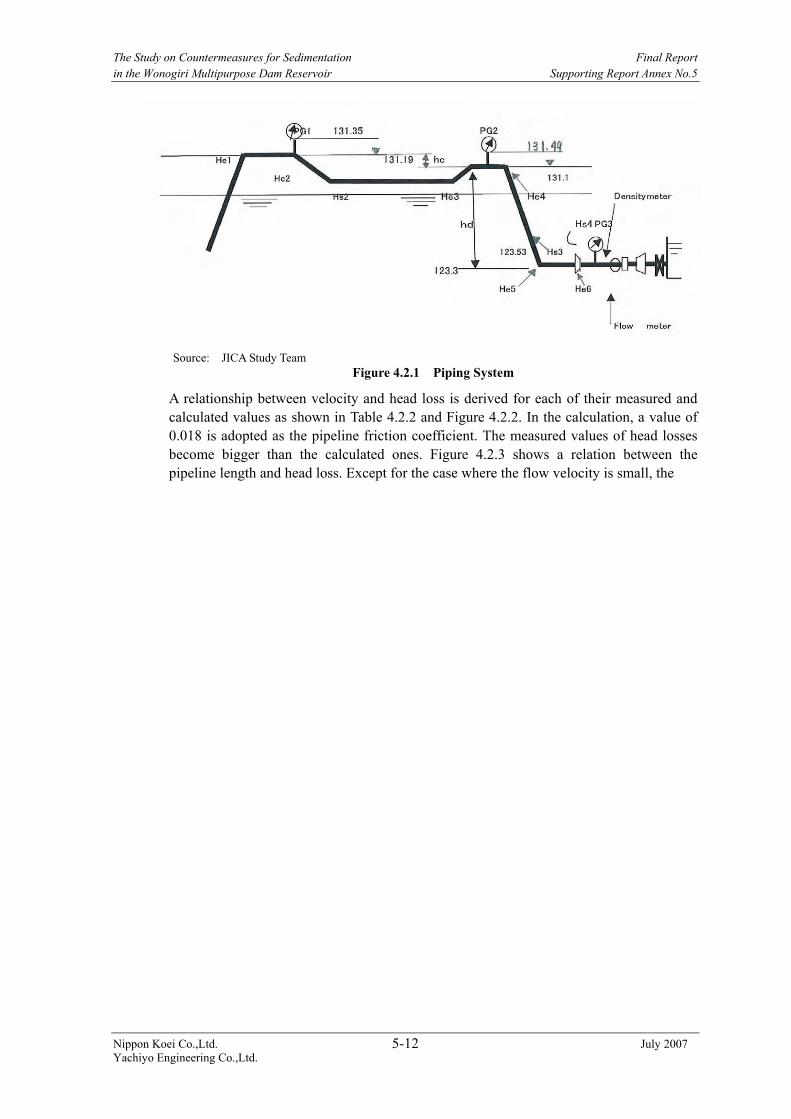
4.2.2 Head Loss
(1) Clear Water Operation
The head loss in the pipeline was derived from the actually measured values with pressure gauges, PG1, PG2, PG3 (See Figure 4.2.1) for the flow rate, which was adjusted by the valve opening. The following “Darcy-Weisbach” formula was used to calculate the head loss:
DL
gvH ×⋅=2
2
λ
where H: Head loss(m) λ: Pipeline friction coefficient L: Pipe length (m) D: Pipe diameter(m)
The Study on Countermeasures for Sedimentation Final Report in the Wonogiri Multipurpose Dam Reservoir Supporting Report Annex No.5
Nippon Koei Co.,Ltd. July 2007 Yachiyo Engineering Co.,Ltd.
5-12
Source: JICA Study Team Figure 4.2.1 Piping System
A relationship between velocity and head loss is derived for each of their measured and calculated values as shown in Table 4.2.2 and Figure 4.2.2. In the calculation, a value of 0.018 is adopted as the pipeline friction coefficient. The measured values of head losses become bigger than the calculated ones. Figure 4.2.3 shows a relation between the pipeline length and head loss. Except for the case where the flow velocity is small, the

The Study on Countermeasures for Sedimentation Final Report in the Wonogiri Multipurpose Dam Reservoir Supporting Report Annex No.5
Nippon Koei Co.,Ltd. July 2007 Yachiyo Engineering Co.,Ltd.
5-13
Tabl
e 4.
2.2
Pipe
line
head
loss
Ta
ble
4.2.
2 Pi
pelin
e H
ead
Los
s
Sour
ce;
JIC
A S
tudy
Tea
m

The Study on Countermeasures for Sedimentation Final Report in the Wonogiri Multipurpose Dam Reservoir Supporting Report Annex No.5
Nippon Koei Co.,Ltd. July 2007 Yachiyo Engineering Co.,Ltd.
5-14
relationship is almost linear. The pipeline friction loss coefficient of the high density polyethylene pipe is derived to be 0.0258 on average from the measurement as shown in Table 4.2.3. Since there were flange connections at 6 points and plastic welding at 11 points on the pipeline, it is considered that the derived higher friction loss coefficient is reasonable.
Source: JICA Study Team
Figure 4.2.2 Relation between Velocity and Head loss (Clear Water)
Source: JICA Study Team Figure 4.2.3 Relation between Pipeline Length and Head Loss (Clear Water)

The Study on Countermeasures for Sedimentation Final Report in the Wonogiri Multipurpose Dam Reservoir Supporting Report Annex No.5
Nippon Koei Co.,Ltd. July 2007 Yachiyo Engineering Co.,Ltd.
5-15
Table 4.2.3 Pipeline Friction Coefficient of High-Density Polyethylene Pipe
Pipeline flow velocity (m/s) 1.41 1.63 1.74 1.26 1.73 0.72 1.16 1.46 Ave.Φ400mm pipeline head loss (m) 1.09 1.45 1.65 0.87 1.63 0.28 0.73 1.05
Calculated value
Pipeline friction coefficient λ 0.018 0.018 0.018 0.018 0.018 0.018 0.018 0.018
Φ400mm pipeline head loss (m) 1.49 2.03 2.25 1.42 2.30 0.42 1.01 1.69
Measured value
Pipeline friction coefficient λ 0.0246 0.0253 0.0245 0.0296 0.0255 0.0272 0.0243 0.0249 0.0258
Source: JICA Study Team
(2) Dredging Operation
The measured values of pipeline head loss during the dredging operation are shown in Figure 4.2.4.
Source: JICA Study Team
Figure 4.2.4 Pipeline (Φ400mm) Head Loss During Dredging
Assuming that the pipeline friction loss factor λ’ in case of mud-flow passing through the pipeline is α times of the factor λ in case of clear water, the following equation is derived:
λ’ = α x λ The following equation is generally used to obtain α.1
α = 1 + β· (γ – 1) where, α: Percentage increase in the pipeline frictional loss factor when conveying
mud-flow β: Soil coefficient (shown in Table 4.2.4) γ: Density of mud-flow (measured values)
1 Integration Standards for Civil Works, Ministry of Land, Infrastructure and Transport

The Study on Countermeasures for Sedimentation Final Report in the Wonogiri Multipurpose Dam Reservoir Supporting Report Annex No.5
Nippon Koei Co.,Ltd. July 2007 Yachiyo Engineering Co.,Ltd.
5-16
Table 4.2.4 Soil Coefficient (Criteria1) Soil property β
Clay/silt 2 Fine sand / Normal sand 3 Coarse sand / Gravel mixed sand 4 Gravel 5
Source: JICA Study Team
In the final test, soil coefficients (β) at each depth are calculated from the pipeline friction coefficient in the operation with clear water and the pipeline head loss in the dredging operation. The detail and average at each depth are shown in Table 4.2.5 and 4.2.6, respectively. It is considered that the calculated soil coefficients are appropriate judging from the soil condition at the final test site.
Table 4.2.6 Soil Coefficient (In final test at Wonogiri Reservoir)
Depth 0 – 1 m 1 – 2 m 2 – 3 m Clay 1.5 - -
Soil Sandy silt - 2.5 4.0
Source: JICA Study Team
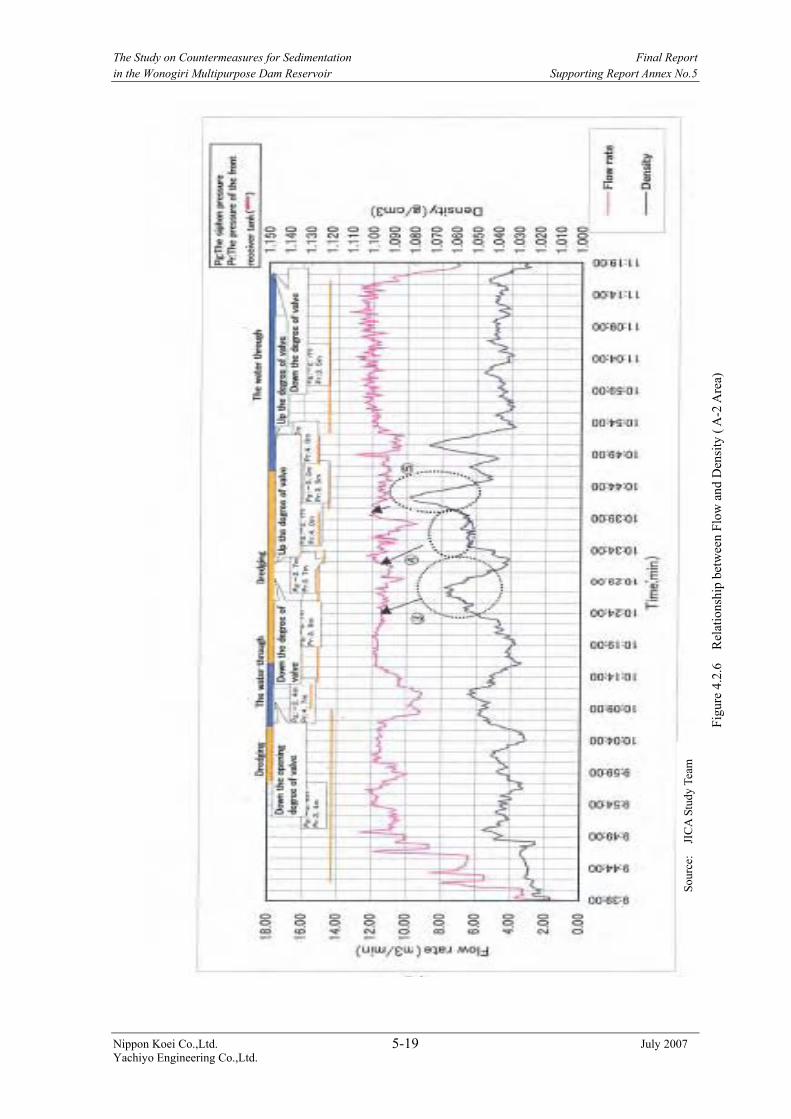
4.2.3 Pipe Flow Velocity and Density
The data on the flow rate and density of sediments in the pipeline that were sucked in front of the intake and at A-2 area are shown in Figures 4.2.5 to 4.2.7 below. The characteristic thereof are derived as follows:
i) During the operation of the final test, the density largely changed as shown in Figures 4.2.5 to 4.2.7. This seems to show the effects of clearance between the sediment surface and suction mouth.
ii) When such peaks in density curve as points ①, ②, ⑥, ⑦, ⑧ and ⑪ shown in Figures 4.2.5 and 4.2.7 take place, dredging work was stopped and clear water was inserted into the pipe, because the flow rate and density showed the values which were likely to cause deformation of the pipe. Since the density showed a value of 1.05 – 1.06 g/cm3 even when clear water had been inserted, it was inferred that sediments had been deposited in the pipe and flow velocity had been close to the critical one.
iii) When such peaks in density curve as points ③, ④, ⑤, ⑨ and ⑩ shown in Figures 4.2.6 to 4.2.7 take place, it was inferred that sediments were moving at a velocity exceeding the critical one, because the density was smaller than those at the points mentioned ii) above on the condition that the flow rate was increasing or constant.

The Study on Countermeasures for Sedimentation Final Report in the Wonogiri Multipurpose Dam Reservoir Supporting Report Annex No.5
Nippon Koei Co.,Ltd. July 2007 Yachiyo Engineering Co.,Ltd.
5-17
Tabl
e 4.
2.5
Cal
cula
tion
of S
oil C
oeff
icie
nt
Sour
ce:
JIC
A S
tudy
Tea
m

The Study on Countermeasures for Sedimentation Final Report in the Wonogiri Multipurpose Dam Reservoir Supporting Report Annex No.5
Nippon Koei Co.,Ltd. July 2007 Yachiyo Engineering Co.,Ltd.
5-18
Figu
re 4
.2.5
R
elat
ions
hip
betw
een
Flow
and
Den
sity
(in
fron
t of I
ntak
e)
Sour
ce:
JIC
A S
tudy
Tea
m
The Study on Countermeasures for Sedimentation Final Report in the Wonogiri Multipurpose Dam Reservoir Supporting Report Annex No.5
Nippon Koei Co.,Ltd. July 2007 Yachiyo Engineering Co.,Ltd.
5-19
Figu
re 4
.2.6
R
elat
ions
hip
betw
een
Flow
and
Den
sity
( A
-2 A
rea)
Sour
ce:
JIC
A S
tudy
Tea
m

The Study on Countermeasures for Sedimentation Final Report in the Wonogiri Multipurpose Dam Reservoir Supporting Report Annex No.5
Nippon Koei Co.,Ltd. July 2007 Yachiyo Engineering Co.,Ltd.
5-20
Figu
re 4
.2.7
R
elat
ions
hip
betw
een
Flow
and
Den
sity
(A-2
Are
a)
Sour
ce:
JIC
A S
tudy
Tea
m

The Study on Countermeasures for Sedimentation Final Report in the Wonogiri Multipurpose Dam Reservoir Supporting Report Annex No.5
Nippon Koei Co.,Ltd. July 2007 Yachiyo Engineering Co.,Ltd.
5-21
The relationship between the pipe flow velocity and density at each peak point is shown in Table 4.2.7 and Figure 4.2.8 with a graph of the critical velocity given by the following equation for each particle size.
Vc = 5 x C1/3 x D1/2 x (4.5 – 1/ds1/2)5/6 where;
Vc: Critical velocity C: Absolute volumetric sediment concentration (%) D: Pipe diameter ds: Representative particle size of sediments (mm)
Notes; a) Volumetric sediment concentration was calculated from a relationship between the absolute volumetric concentration and density, which is shown in Figure 4.2.9.
b) Based on the results of laboratory test for soil samples taken at point B-3, the representative particle size of the dredged sediment was derived at 0.1 mm, which corresponds to a 60% diameter of particle size in the particle size distribution curve.
Source: JICA Study Team
Figure 4.2.8 Flow Velocity and Density of Sediment in Pipeline

The Study on Countermeasures for Sedimentation Final Report in the Wonogiri Multipurpose Dam Reservoir Supporting Report Annex No.5
Nippon Koei Co.,Ltd. July 2007 Yachiyo Engineering Co.,Ltd.
5-22
Table 4.2.7 Flow Velocity and Density in Pipeline Density (g/cm3)
Point Flow Rate (m3/min.)
Measured Velocity
(m/s)
Critical Velocity(Ds=0.1mm)
(m/s) Minimum Maximum 1 11.6 1.54 1.51 1.050 1.091 2 11.4 1.51 1.45 1.040 1.080 3 11.5 1.53 1.35 1.034 1.064 4 11.0 1.46 1.24 1.054 1.057 5 12.0 1.56 1.45 1.045 1.081 6 11.2 1.49 1.45 1.048 1.078 7 10.2 1.35 1.32 1.040 1.060 8 9.9 1.31 1.32 1.034 1.050 9 11.3 1.50 1.32 1.034 1.060 10 11.9 1.58 1.45 1.043 1.078 11 10.7 1.42 1.35 1.043 1.068 Source: JICA Study Team
Source: JICA Study Team
Figure 4.2.9 Relationship between Absolute Volumetric Concentration and Density
The maximum flow values shown at points ①, ②, ⑥, ⑦, ⑧ and ⑪ in Figures 4.2.5 and 4.2.7 above are well agreeable with the critical velocities for a particle size of 0.1 mm, that are estimated applying the above equation. This particle size is in close agreement with the average of the representative particle size of sediments at a depth of 4 m at B-3 point, which is 0.093 mm. Accordingly, it can be said that the above equation to estimate the critical velocity shows good agreement with the results of the final test as a whole.
To keep the stable density in this system, it is needed to be operated with the velocity more than the critical velocity in the pipeline.
4.2.4 Dredging Depth
Based on the measurement with a sounding rod before and after the dredging operation, it is estimated that the suction pipe tip reaches a depth of approximately 4.0 m from surface of sediment deposit. Though a tendency of consolidation was found in the result of the core drilling, there were no serious problems that made the dredging difficult. With this method, it is possible to excavate the sediment to 4m depth where sediment is composed of clay, silt, sandy silt, and sandy clayey silt.

The Study on Countermeasures for Sedimentation Final Report in the Wonogiri Multipurpose Dam Reservoir Supporting Report Annex No.5
Nippon Koei Co.,Ltd. July 2007 Yachiyo Engineering Co.,Ltd.
5-23
4.2.5 Sediment Removal Amount
(1) Sounding Survey
Based on the sounding survey using the sounding rod before and after the operation, it is estimated that the amount of sediment removed is approximately 146 m3 as shown in Table 4.2.8.
Table 4.2.8 Sounding Result of Sediment Removal Amount Area Excavator Volume of Sediment Removed (m3)A-1 Water jet nozzle 3.8 A-1 Side rotary 8.1 A-1 Side rotary (No power) 4.9 A-2 Side rotary 122.2 I-1 Side rotary 7.3
Total 146.2 Source: JICA Study Team
(2) Amount of Sediment in Receiving Tank and Storage Tank
The sediment amount stored in the receiving tank and storage tank is approximately 69 m3 as shown in Table 4.2.9. It is considered that all of the sandy components in the dredged sediment accumulated in the receiving tank, while silt and clay were returned to the reservoir. The amount of the latter soils is calculated approximately at 77m3 (= 146m3 – 69m3).
Table 4.2.9 Amount of Sediment in Receiving Tank Tank Accumulated amount (m3)
Receiving Tank 5.6 Storage Tank 63.5
Total 69.1 Source: JICA Study Team
(3) Sediment amount derived from the measured value of density meter and flow meter
The dredged sediment amount is calculated using the following equation and the calculation results are shown in Table 4.2.10 below:
V=ΣQt x ∆t x ((γ – 1)/(γs – 1)/(1 – P/100)) x 100 where ; V: Dredged amount (m3) Qt: Discharge rate (m3/s) ∆t: Time (13.1 hours) γ: Specific gravity of sediment flow (g/cm3) γs: Specific gravity of soil particle (g/cm3) P: Pressure of soil particle (%)
Table 4.2.10 Calculated Amount of Dredged Sediment Area Excavator Volume of Sediment Volume (m3) A-1 Water jet nozzle 2.4 A-1 Side rotary 5.4 A-1 Side rotary (No power) 3.9 A-2 Side rotary 134.8 I-1 Side rotary 15.4
Total 161.9 Source: JICA Study Team

The Study on Countermeasures for Sedimentation Final Report in the Wonogiri Multipurpose Dam Reservoir Supporting Report Annex No.5
Nippon Koei Co.,Ltd. July 2007 Yachiyo Engineering Co.,Ltd.
5-24
As shown in tables above, the dredged sediment volume derived from the results of sounding data is almost equal to the value calculated based on records of density meter and flow meter. The amount of the sediment during water passing through in the pipe is estimated approximately at 16m3 (= 162m3 – 146m3).
Hence, it is roughly estimated that dredging of 140 to 160 m3 would be possible using the water level difference encountered in this verification test.
4.2.6 Debris and Garbage
In the final test, the garbage shown in Table 4.2.11 and Photos below passed through the pipeline and finally reached the receiving tank. This system is free of clogging after the garbage once passed through the suction mouth. Accordingly, this system has a high reliability to effectively remove the sediments mixed with vegetative debris and garbage in front of the intake structure, although it was one of the issues on the hydro-suction system that was needed to be clarified in this verification test.
If obstruction at the suction mouth such as the screen is eliminated, the excavator can dredge the reservoir deposits whose sizes are slightly less than diameter of hole on the pipe. Hence, it has a possibility to remove more effectively debris and garbage from the reservoir bottom through improvement of the system in the near future.
Table 4.2.11 Garbage and Pebbles Removed by the Hydro-Suction System Sort Dimensions
Pebble Maximum diameter of 130 mm Bamboo, stalk Maximum length of about 600 mm x width of about 50 mm
Plastic Scraps with size of 150 mm x 150 mm Source: JICA Study Team
Removed Pebbles and Garbage Removed Pebbles, Garbage and Sand
Clogging of Return Pump with Garbage Clogging of Valve with Garbage
The Study on Countermeasures for Sedimentation Final Report in the Wonogiri Multipurpose Dam Reservoir Supporting Report Annex No.5
Nippon Koei Co.,Ltd. July 2007 Yachiyo Engineering Co.,Ltd.
5-25
4.3 Applicability to Wonogiri Reservoir Sediment Management
Main results of the verification test are summarized below:
(1) The verification test clarifies that the sediment removal system using a difference in water levels can be applied to dredging of sediments in front of the intake structure at Wonogiri Multipurpose Dam site.
(2) It was found that excavation device, especially a side-rotary type excavator, was of big effect on efficient dredging.
(3) When a flow rate in the sediment passing pipe was around 12m3/min, density and volumetric sediment concentration conveyed by the system were approximately 1.09 g/cm3 and 13%, respectively.
(4) The capacities of this system consisting of a type of the side rotary-type excavator device are as follows: ① Dredging rate per unit of time is about 30 m3/hour. ② Dredging rate per unit of power is about 8 m3/kWh. ③ Water consumption per unit of dredged sediment is19 m3/min. ④ Dredging depth is about 4 m.
(5) Since those values were secured with controlled condition under a maximum, high ability could be expected at full capacity.
(6) Trash including small stones with a maximum diameter of 130mm, bamboo with a maximum length of about 600mm, and vinyl with a size of approximately 150mm x 150mm passed through the siphon system.
(7) The soil coefficient used to estimate the frictional loss factor for sediment materials in Wonogiri Reservoir is around 1.5 for clay and around 2.5 for sandy silt.
Consequently, this hydro-suction system is applicable to sediment removal at the intake structure in Wonogiri Reservoir in order to keep the proper function of the intake structure. In the subsequent study, it is necessary to examine the safety measures against flood, although the verification test was carried out in dry season when no flood takes place.
The Study on Countermeasures for Sedimentation Final Report in the Wonogiri Multipurpose Dam Reservoir Supporting Report Annex No.5
Nippon Koei Co.,Ltd. July 2007 Yachiyo Engineering Co.,Ltd.
5-26
CHAPTER 5 WONOGIRI RESERVOIR SEDIMENT MANAGEMENT PLAN
5.1 Wonogiri Reservoir Sediment Management Plan
The verification test for the hydro-suction system, which was carried out in the field, showed that this system would be applicable to remove sediments at the intake structure in Wonogiri Reservoir. Hereinafter, Wonogiri Reservoir Sediment Plan by the hydro-suction sediment removal system is described.
In consideration of river environment, it is not desirable to operate this system by itself. It is necessary to mitigate discharge water with high concentration as not to reach downstream. Therefore, the use of this system is divided into two(2) ways, one is in flooding time and the other in the power plant operation time.
5.1.1 In Flooding Time
(1) Operation Time
Averting of danger, the operation time is limited the flooding time over 100 m3/s and below 800 m3/s of the inflow.
The averaged flooding time over 100 m3/s and below 800 m3/s of the inflow from December to April in the period of 1993 to 2004 is 732 hours. The operation time is estimated 183 hours excluding night-time and preparation time for operating, which is assumed to be 75 % of the total hours.
(2) Reservoir Water Level
The reservoir water level of the above-mentioned period is roughly estimated EL.133.64 m.
(3) Dredging Area
Dredging area is determined in front of the intake as shown in Figure 5.1.1.
(4) Calculation of Sediment Removal Amount
The “Darcy-Weisbach” formula, as shown below, is used to calculate the pipeline head loss.
. DL
gvH ×⋅⋅=2
2
γλα
where ;
H : Pipeline head loss (m)
Pipeline head loss is necessary to be less than the head between the reservoir water level and the outlet elevation.
H<18.64 m (=133.64 m – 115.00 m )
α:Percentage increase in the pipeline frictional loss factor when conveying mud-flow
α=1+β(γ-1) β:Soil coefficient;4.0 is adopted considering soil test

The Study on Countermeasures for Sedimentation Final Report in the Wonogiri Multipurpose Dam Reservoir Supporting Report Annex No.5
Nippon Koei Co.,Ltd. July 2007 Yachiyo Engineering Co.,Ltd.
5-27
Source: JICA Study Team
Figure 5.1.1 Dredging Area
γ: Density of mud flow
λ:Pipeline friction coefficient at clear water(=0.0258)
L :Pipeline length (m) 500m (=240m (Spillway side)+ 250m (Reservoir side))
D :Diameter of the pipe (φ600 mm)
v : Flow velocity (m/s)
The density of mud-flow is estimated 1.19 on the premise that the flow velocity v = 2.2 m/sec and particle size 0.11mm in Figure 5.1.2. (Based on the results of soil mechanical test at B-3 point.)
The percentage increase of the pipeline frictional loss factor during suction, α is 1.76 (=1+4 x (1.19-1)). The pipeline flow velocity for practical use is estimated 2.7 m/s, 1.2 times of the critical flow velocity so as to ensure suction.
The pipeline head loss H is estimated 11.12 m as follows, and it is small compared to the head between the reservoir water level and the outlet elevation. Consequently, the affordable suction is possible.
H = 1.76 x 1.19 x 0.0258 x 2.22 /19.6 x 500 / 0.6
=11.12 m<18.64 m (=133.64 m – 115.00 m )
The suction rate is calculated using the following equation.
Q’=(π/4) x D x D x V x (C’/100)
where;
Q’:Suction rate per unit time (m3/s)
The Study on Countermeasures for Sedimentation Final Report in the Wonogiri Multipurpose Dam Reservoir Supporting Report Annex No.5
Nippon Koei Co.,Ltd. July 2007 Yachiyo Engineering Co.,Ltd.
5-28
D :Diameter of the pipe (φ600 mm)
V : Practical flow velocity (m/s)
C’:Volumetric sediment concentration (%)
As the volumetric sediment concentration in the density of 1.19, is obtained 25% in Figure 5.1.3, the suction rate is calculated 0.19 m3/s as shown below.
Q’ = (π/4) x 0.6 x 0.6 x 2.7 x (25/100)
= 0.19 m3/s
When the volumetric sediment concentration is 25 % and the diameter of the pipe is φ600 mm, the critical flow velocity is obtained 2.5 m/s in Figure 5.1.4. There will be no problem of sediment accumulation in the pipe with the practical flow velocity exceeding the critical flow velocity.
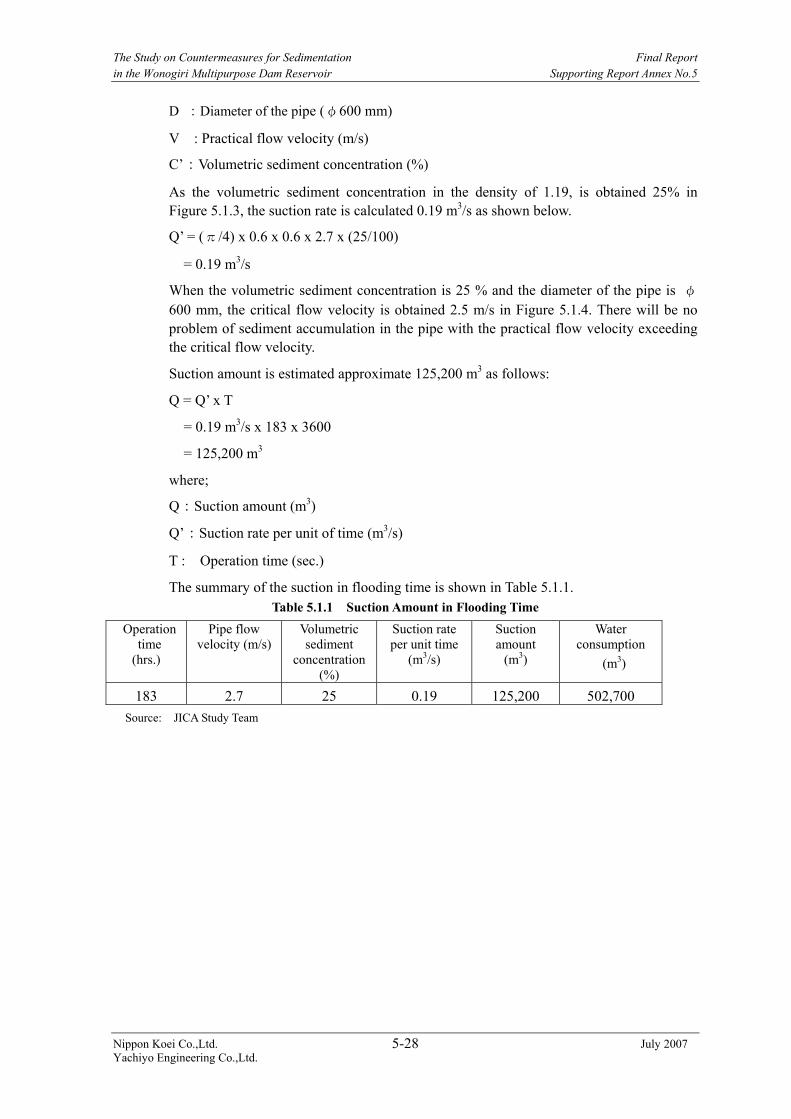
Suction amount is estimated approximate 125,200 m3 as follows:
Q = Q’ x T
= 0.19 m3/s x 183 x 3600
= 125,200 m3
where;
Q:Suction amount (m3)
Q’:Suction rate per unit of time (m3/s)
T : Operation time (sec.)
The summary of the suction in flooding time is shown in Table 5.1.1. Table 5.1.1 Suction Amount in Flooding Time
Source: JICA Study Team
Operation time
(hrs.)
Pipe flow velocity (m/s)
Volumetric sediment
concentration (%)
Suction rate per unit time
(m3/s)
Suction amount
(m3)
Water consumption
(m3)
183 2.7 25 0.19 125,200 502,700

The Study on Countermeasures for Sedimentation Final Report in the Wonogiri Multipurpose Dam Reservoir Supporting Report Annex No.5
Nippon Koei Co.,Ltd. July 2007 Yachiyo Engineering Co.,Ltd.
5-29
1.020
1.040
1.060
1.080
1.100
1.120
1.140
1.160
1.180
1.200
1.220
1.240
1.260
1.280
1.300
1.320
1.00 1.20 1.40 1.60 1.80 2.00 2.20 2.40 2.60
Pipeline flow velocity(m/sec)
Densi
ty(g/cm
3)
particle size 0.10mm
particle size 0.11mm
particle size 0.12mm
particle size 0.13mm
maximum
minimum
⑦⑪
⑧
⑥
①②
⑤⑩
③④
⑨
Source: JICA Study Team
Figure 5.1.2 Critical Flow Velocity and Density
Source: JICA Study Team Figure 5.1.3 Density and Volumetric Consistency
Source: JICA Study Team
Figure 5.1.4 Volumetric Sediment Concentration and Critical Flow Velocity
0.05.0
10.015.020.025.030.035.040.045.050.0
1.000 1.050 1.100 1.150 1.200 1.250 1.300
Density (g/cm3)
Volu
metr
ic c
oncentr
atio
n
(%
)
point B-3

The Study on Countermeasures for Sedimentation Final Report in the Wonogiri Multipurpose Dam Reservoir Supporting Report Annex No.5
Nippon Koei Co.,Ltd. July 2007 Yachiyo Engineering Co.,Ltd.
5-30
5.1.2 In Power Plant Operation Time
As abone-mentioned, this system can remove the sediment amount of 125,200 m3 in flooding time. On the other hand, extremely high concentration of discharge flow as 25% of volumetric sediment concentration, run down to downstream of Wonogiri Dam. And it might be a large impact on the environment of river.
The following index has been proposed for the evaluation of the impact on fish in Canada. This index was introduced and has been used on trial in Japan, and SI of 10 is a standard for water quality management.
SI = loge(SS * T)
where ;
SI : Stress Index
SS : Suspended Solids (mg/l)
T : Duration (hour)
Table 5.1.2 shows SI value of the discharge flow in scale mixed with the suction discharge flow, 25% and 7% of volumetric sediment concentration respectively. And the scale more than 100 m3/s of the flow are estimated for reference. On the assumption of discharge flow scale as 30 m3/s of the average of the power plant discharge flow, the hydro-suction system with 25% of volumetric sediment concentration is limited to less than 3 hour-operation under SI of 10, while in case of 7% of volumetric sediment concentration, it is free from restraint .
4-hour operation time of the hydro-suction system with 7% of volumetric concentration is preferable and affordable to the environment of river because of SI value less than 9.
Table 5.1.2 Stress Index
1 2 3 4 5 6 1 2 3 4 5 6
10m3/s (SS=100) 9.8 10.5 10.9 11.2 11.4 11.6 8.3 9.0 9.4 9.7 9.9 10.1
30m3/s (SS=500) 8.9 9.5 9.9 10.2 10.5 10.6 7.6 8.2 8.7 8.9 9.2 9.3
50m3/s (SS=700) 8.4 9.1 9.5 9.8 10.0 10.2 7.3 8.0 8.4 8.7 9.0 9.1
75m3/s (SS=900) 8.2 8.9 9.3 9.6 9.8 10.0 7.3 8.0 8.4 8.7 8.9 9.1
100m3/s (SS=1,000) 8.0 8.7 9.1 9.4 9.6 9.8 7.3 8.0 8.4 8.6 8.9 9.1
200m3/s (SS=1,500) 7.8 8.5 8.9 9.2 9.4 9.6 7.4 8.1 8.5 8.8 9.1 9.2
300m3/s (SS=2,000) 7.9 8.6 9.0 9.3 9.5 9.7 7.7 8.4 8.8 9.1 9.3 9.5
600m3/s (SS=3,000) 8.1 8.8 9.2 9.5 9.7 9.9 8.0 8.7 9.1 9.4 9.6 9.8
Powerplant
discharge
Spill-outflow
T (hrs.) T (hrs.)
Hydro-suction discharge (25%) Hydro-suction discharge (7%)
Source: JICA Study Team
(1) Operation Time
Operation time is assumed 480 hours, 4 hours time 120 days for a period of five months from December to April in rainy season.
(2) Reservoir Water Level
The reservoir water level during December to April is EL.133.64 m as mentioned in the section of 5.1.1.

The Study on Countermeasures for Sedimentation Final Report in the Wonogiri Multipurpose Dam Reservoir Supporting Report Annex No.5
Nippon Koei Co.,Ltd. July 2007 Yachiyo Engineering Co.,Ltd.
5-31
(3) Calculation of Sediment Removal Amount
The pipeline head loss and sediment removal amount are calculated using the “Darcy-Weisbach” formula, Equation-1 and Equation-2. The results of pipeline head loss and removal sediment amount are shown in Table 5.1.3 and Table 5.1.4, respectively.
. DL
gvH ×⋅⋅=2
2
γλα the “Darcy-Weisbach” formula
Q’=(π/4) x D x D x V x (C’/100) Equation-1
Q = Q’ x T Equation-2 Table 5.1.3 Pipeline Head Loss
α γ λ D L v H 1.4 1.1 0.0258 φ600 500 1.8 8.2 Source: JICA Study Team
where ;
H : Pipeline head loss (m) H<18.64 m (=133.64 m – 115.00 m )
α: Percentage increase in the pipeline frictional loss factor when conveying mud-flow, α=1+β(γ-1) β: Soil coefficient
γ: Density of mud-flow
λ: The pipeline friction coefficient at clear water
L : Pipeline length (m)
D: Diameter of the pipe
v : Flow velocity (m/s)
Q’: Suction rate per unit time (m3/s)
Q: Suction amount (m3) Table 5.1.4 Suction Amount in Power Plant OperationTime
Source: JICA Study Team
Operation time
(hrs.)
Pipe flow velocity
(m/s)
Volumetric sediment
concentration (%)
Suction rate per unit time
(m3/s)
Suction amount
(m3)
Water consumption
(m3)
480 2.2 7 0.04 69,100 1,074,300
The Study on Countermeasures for Sedimentation Final Report in the Wonogiri Multipurpose Dam Reservoir Supporting Report Annex No.5
Nippon Koei Co.,Ltd. July 2007 Yachiyo Engineering Co.,Ltd.
5-32
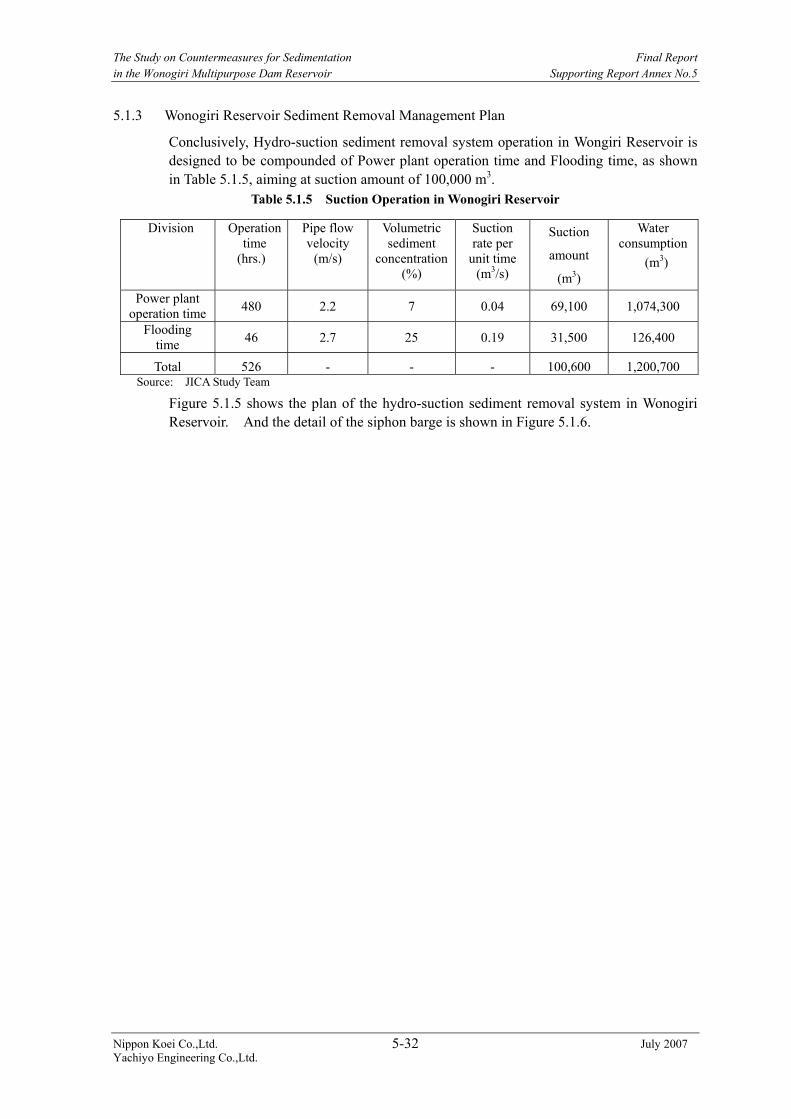
5.1.3 Wonogiri Reservoir Sediment Removal Management Plan
Conclusively, Hydro-suction sediment removal system operation in Wongiri Reservoir is designed to be compounded of Power plant operation time and Flooding time, as shown in Table 5.1.5, aiming at suction amount of 100,000 m3.
Table 5.1.5 Suction Operation in Wonogiri Reservoir
Source: JICA Study Team
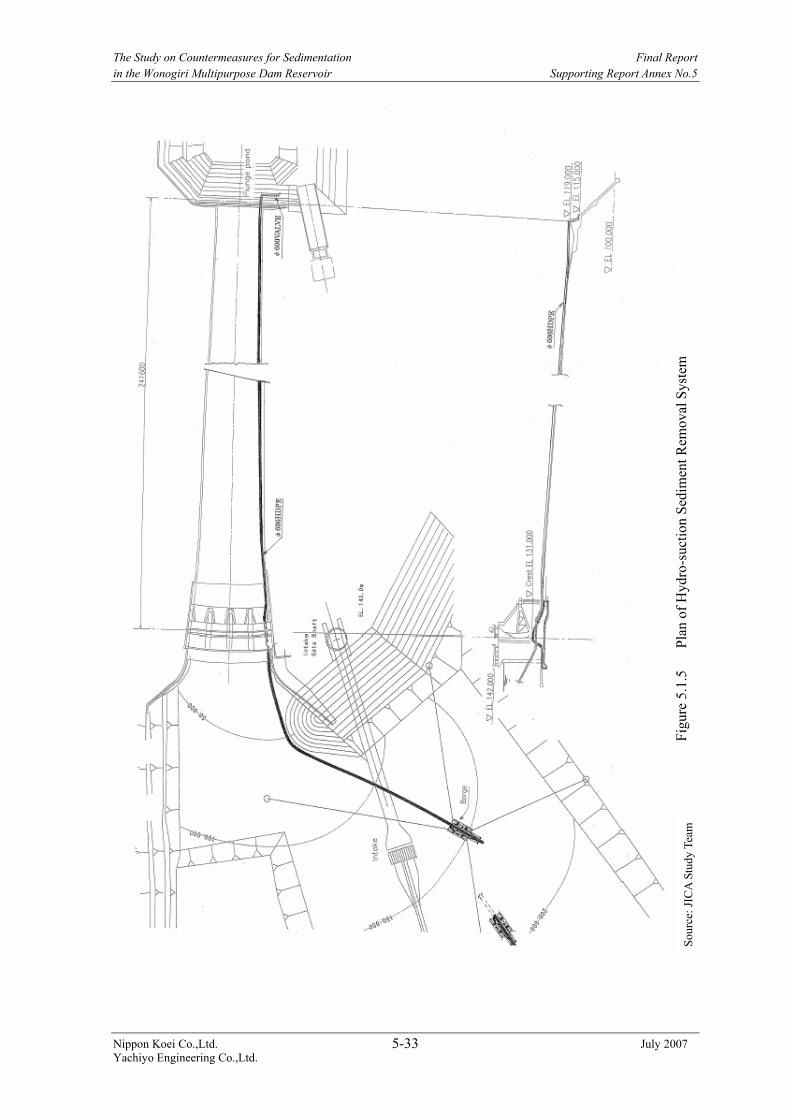
Figure 5.1.5 shows the plan of the hydro-suction sediment removal system in Wonogiri Reservoir. And the detail of the siphon barge is shown in Figure 5.1.6.
Division Operation time
(hrs.)
Pipe flow velocity
(m/s)
Volumetric sediment
concentration (%)
Suction rate per
unit time (m3/s)
Suction
amount
(m3)
Water consumption
(m3)
Power plant operation time 480 2.2 7 0.04 69,100 1,074,300
Flooding time 46 2.7 25 0.19 31,500 126,400
Total 526 - - - 100,600 1,200,700
The Study on Countermeasures for Sedimentation Final Report in the Wonogiri Multipurpose Dam Reservoir Supporting Report Annex No.5
Nippon Koei Co.,Ltd. July 2007 Yachiyo Engineering Co.,Ltd.
5-33
Figu
re 5
.1.5
P
lan
of H
ydro
-suc
tion
Sedi
men
t Rem
oval
Sys
tem
So
urce
: JIC
A S
tudy
Tea
m

The Study on Countermeasures for Sedimentation Final Report in the Wonogiri Multipurpose Dam Reservoir Supporting Report Annex No.5
Nippon Koei Co.,Ltd. July 2007 Yachiyo Engineering Co.,Ltd.
5-34
Plan
Cross section Source: JICA Study Team
Figure 5.1.6 Detail of Siphon Barge
suction pipe
HDPE Pipe
spud
HDPE pipe
suction pipespud
spud barge
barge

The Study on Countermeasures for Sedimentation Final Report in the Wonogiri Multipurpose Dam Reservoir Supporting Report Annex No.5
Nippon Koei Co.,Ltd. July 2007 Yachiyo Engineering Co.,Ltd.
5-35
5.2 Cost Estimate
5.2.1 Conditions
(1) Currency and Exchange Rate
Cost of hydro-suction sediment removal system is estimated in U.S. Dollar. The following exchange rate as of December 2005 is adopted:
US$1.0 = Yen119.63
where, US$ : U.S. Dollar
Yen : Japanese Yen
(2) Discount Rate
A discount rate of 12% is adopted.
5.2.2 Cost Estimate
(1) Cost Components
Cost for hydro-suction sediment removal system comprises i) Equipment cost, ii) Operation and Maintenance cost. The equipment cost consists of i) Siphon Barge and others, ii) Devices. Table 5.2.1 shows the equipment cost and an annual O&M cost of hydro-suction sediment removal system. The cost of Hydro-suction Sediment Removal System in 11 years and 50 years are shown in Table 5.2.2 and 5.2.3, respectively. The net present value of those cost is estimated as shown in Table 5.2.4.
Table 5.2.1 Cost of the Hydro-suction Sediment Removal System
Description Unit Quantity Unit CostUS$
Cost US$,thousand Remarks
Equipment cost Siphon Barge nr 1 2,006,000 2,006 11-year of service life Anchor holding Boat nr 1 222,000 222 22-year of service life Tender Boat nr 1 14,000 14 22-year of service life HDPE Pipe (12m-long) pcs 19 8,939 170 12-year of service life HDPE Pipe (18m-long) pcs 14 10,519 147 12-year of service life Joint pcs 20 3,661 73 6-year of service life Float pcs 35 6,955 243 6-year of service life
Sub Total 2,875 O&M cost
Operation cost unit 1 35,154 35 Suction amount of 100,000m3/year
Maintenance cost unit 1 2,508 3 Annual Maintenance Sub Total 38
Total 2,913 Source: JICA Study Team

The Study on Countermeasures for Sedimentation Final Report in the Wonogiri Multipurpose Dam Reservoir Supporting Report Annex No.5
Nippon Koei Co.,Ltd. July 2007 Yachiyo Engineering Co.,Ltd.
5-36
Table 5.2.2 Cost of Hydro-suction Sediment Removal System in 11 years
Source: JICA Study Team
Table 5.2.4 The Net Present Value of the Hydro-suction Sediment Removal System Cost (Thousand US$)
Description 11-year period 50- year period Cost NPV Cost NPV Equipment Cost 3,192 2,710 14,539 3,629 O&M cost 414 223 1,882 313
Total 3,606 2,933 16,421 3,942 Note : NPV means net present value.
Source: JICA Study Team
1-year 2-year 3-year 4-year 5-year 6-year 7-year 8-year 9-year 10-year 11-year Total
Barge 2,006.2 0.0 0.0 0.0 0.0 0.0 0.0 0.0 0.0 0.0 0.0 2,006.2
Anchor Handling Boat 221.5 0.0 0.0 0.0 0.0 0.0 0.0 0.0 0.0 0.0 0.0 221.5
Tender Boat 13.9 0.0 0.0 0.0 0.0 0.0 0.0 0.0 0.0 0.0 0.0 13.9
HDPE Pipe(12m) 169.8 0.0 0.0 0.0 0.0 0.0 0.0 0.0 0.0 0.0 0.0 169.8
HDPE Pipe(18m) 147.3 0.0 0.0 0.0 0.0 0.0 0.0 0.0 0.0 0.0 0.0 147.3
Joint 73.2 0.0 0.0 0.0 0.0 0.0 73.2 0.0 0.0 0.0 0.0 146.5
Float 243.4 0.0 0.0 0.0 0.0 0.0 243.4 0.0 0.0 0.0 0.0 486.8
Subtotal 2,875.3 0.0 0.0 0.0 0.0 0.0 316.6 0.0 0.0 0.0 0.0 3,192.0
Operation 35.1 35.1 35.1 35.1 35.1 35.1 35.1 35.1 35.1 35.1 35.1 386.4
Maintenance 2.5 2.5 2.5 2.5 2.5 2.5 2.5 2.5 2.5 2.5 2.5 27.6
Subtotal 37.6 37.6 37.6 37.6 37.6 37.6 37.6 37.6 37.6 37.6 37.6 414.0
2,913.0 37.6 37.6 37.6 37.6 37.6 354.3 37.6 37.6 37.6 37.6 3,605.9
2,913.0 2,950.6 2,988.2 3,025.9 3,063.5 3,101.1 3,455.4 3,493.0 3,530.7 3,568.3 3,605.9
(Unit:1000 US$)
Total Cost
Cumulative Cost (A)
Hydro-SuctionSystem
Equipment Cost
Operation andMaintenance cost

The Study on Countermeasures for Sedimentation Final Report in the Wonogiri Multipurpose Dam Reservoir Supporting Report Annex No.5
Nippon Koei Co.,Ltd. July 2007 Yachiyo Engineering Co.,Ltd.
5-37
Tabl
e 5.
2.3
Cos
t of H
ydro
-suc
tion
Sedi
men
t Rem
oval
Sys
tem
in 5
0 Ye
ars
Sour
ce: J
ICA
Stu
dy T
eam
1-ye
ar2-
year
3-ye
ar4-
year
5-ye
ar6-
year
7-ye
ar8-
year
9-ye
ar10
-yea
r11
-yea
r12
-yea
r13
-yea
r14
-yea
r15
-yea
r16
-yea
r17
-yea
r
Bar
ge2,
006.
20.
00.
00.
00.
00.
00.
00.
00.
00.
00.
02,
006.
20.
00.
00.
00.
00.
0
Anc
hor
Han
dlin
g B
oat
221.
50.
00.
00.
00.
00.
00.
00.
00.
00.
00.
00.
00.
00.
00.
00.
00.
0
Ten
der
Boa
t13
.90.
00.
00.
00.
00.
00.
00.
00.
00.
00.
00.
00.
00.
00.
00.
00.
0
HD
PE
Pip
e(12
m)
169.
80.
00.
00.
00.
00.
00.
00.
00.
00.
00.
00.
016
9.8
0.0
0.0
0.0
0.0
HD
PE
Pip
e(18
m)
147.
30.
00.
00.
00.
00.
00.
00.
00.
00.
00.
00.
014
7.3
0.0
0.0
0.0
0.0
Join
t73
.20.
00.
00.
00.
00.
073
.20.
00.
00.
00.
00.
00.
073
.20.
00.
00.
0
Floa
t24
3.4
0.0
0.0
0.0
0.0
0.0
243.
40.
00.
00.
00.
00.
00.
024
3.4
0.0
0.0
0.0
Sub
tota
l2,
875.
30.
00.
00.
00.
00.
031
6.6
0.0
0.0
0.0
0.0
2,00
6.2
317.
131
6.6
0.0
0.0
0.0
Ope
ratio
n35
.135
.135
.135
.135
.135
.135
.135
.135
.135
.135
.135
.135
.135
.135
.135
.135
.1
Mai
nten
ance
2.5
2.5
2.5
2.5
2.5
2.5
2.5
2.5
2.5
2.5
2.5
2.5
2.5
2.5
2.5
2.5
2.5
Sub
tota
l37
.637
.637
.637
.637
.637
.637
.637
.637
.637
.637
.637
.637
.637
.637
.637
.637
.6
2,91
3.0
37.6
37.6
37.6
37.6
37.6
354.
337
.637
.637
.637
.62,
043.
835
4.7
354.
337
.637
.637
.62,
913.
02,
950.
62,
988.
23,
025.
93,
063.
53,
101.
13,
455.
43,
493.
03,
530.
73,
568.
33,
605.
95,
649.
86,
004.
56,
358.
86,
396.
46,
434.
16,
471.
7
18-y
ear
19-y
ear
20-y
ear
21-y
ear
22-y
ear
23-y
ear
24-y
ear
25-y
ear
26-y
ear
27-y
ear
28-y
ear
29-y
ear
30-y
ear
31-y
ear
32-y
ear
33-y
ear
34-y
ear
Bar
ge0.
00.
00.
00.
00.
00.
02,
006.
20.
00.
00.
00.
00.
00.
00.
00.
00.
00.
0
Anc
hor
Han
dlin
g B
oat
0.0
0.0
0.0
0.0
0.0
221.
50.
00.
00.
00.
00.
00.
00.
00.
00.
00.
00.
0
Ten
der
Boa
t0.
00.
00.
00.
00.
013
.90.
00.
00.
00.
00.
00.
00.
00.
00.
00.
00.
0
HD
PE
Pip
e(12
m)
0.0
0.0
0.0
0.0
0.0
0.0
0.0
0.0
169.
80.
00.
00.
00.
00.
00.
00.
00.
0
HD
PE
Pip
e(18
m)
0.0
0.0
0.0
0.0
0.0
0.0
0.0
0.0
147.
30.
00.
00.
00.
00.
00.
00.
00.
0
Join
t0.
00.
00.
073
.20.
00.
00.
00.
00.
00.
073
.20.
00.
00.
00.
00.
00.
0
Floa
t0.
00.
00.
024
3.4
0.0
0.0
0.0
0.0
0.0
0.0
243.
40.
00.
00.
00.
00.
00.
0
Sub
tota
l0.
00.
00.
031
6.6
0.0
235.
42,
006.
20.
031
7.1
0.0
316.
60.
00.
00.
00.
00.
00.
0
Ope
ratio
n35
.135
.135
.135
.135
.135
.135
.135
.135
.135
.135
.135
.135
.135
.135
.135
.135
.1
Mai
nten
ance
2.5
2.5
2.5
2.5
2.5
2.5
2.5
2.5
2.5
2.5
2.5
2.5
2.5
2.5
2.5
2.5
2.5
Sub
tota
l37
.637
.637
.637
.637
.637
.637
.637
.637
.637
.637
.637
.637
.637
.637
.637
.637
.6
37.6
37.6
37.6
354.
337
.627
3.0
2,04
3.8
37.6
354.
737
.635
4.3
37.6
37.6
37.6
37.6
37.6
37.6
6,50
9.3
6,54
7.0
6,58
4.6
6,93
8.9
6,97
6.5
7,24
9.5
9,29
3.3
9,33
1.0
9,68
5.7
9,72
3.4
10,0
77.6
10,1
15.3
10,1
52.9
10,1
90.5
10,2
28.2
10,2
65.8
10,3
03.4
35-y
ear
36-y
ear
37-y
ear
38-y
ear
39-y
ear
40-y
ear
41-y
ear
42-y
ear
43-y
ear
44-y
ear
45-y
ear
46-y
ear
47-y
ear
48-y
ear
49-y
ear
50-y
ear
Tot
alB
arge
0.0
2,00
6.2
0.0
0.0
0.0
0.0
0.0
0.0
0.0
0.0
0.0
0.0
0.0
2,00
6.2
0.0
0.0
10,0
30.9
Anc
hor
Han
dlin
g B
oat
0.0
0.0
0.0
0.0
0.0
0.0
0.0
0.0
0.0
0.0
0.0
221.
50.
00.
00.
00.
066
4.5
Ten
der
Boa
t0.
00.
00.
00.
00.
00.
00.
00.
00.
00.
00.
013
.90.
00.
00.
00.
041
.6
HD
PE
Pip
e(12
m)
0.0
0.0
0.0
0.0
169.
80.
00.
00.
00.
00.
00.
00.
00.
00.
00.
00.
067
9.4
HD
PE
Pip
e(18
m)
0.0
0.0
0.0
0.0
147.
30.
00.
00.
00.
00.
00.
00.
00.
00.
00.
00.
058
9.1
Join
t73
.20.
00.
00.
00.
00.
00.
073
.20.
00.
00.
00.
00.
00.
073
.20.
058
5.8
Floa
t24
3.4
0.0
0.0
0.0
0.0
0.0
0.0
243.
40.
00.
00.
00.
00.
00.
024
3.4
0.0
1,94
7.3
Sub
tota
l31
6.6
2,00
6.2
0.0
0.0
317.
10.
00.
031
6.6
0.0
0.0
0.0
235.
40.
02,
006.
231
6.6
0.0
14,5
38.7
Ope
ratio
n35
.135
.135
.135
.135
.135
.135
.135
.135
.135
.135
.135
.135
.135
.135
.135
.11,
756.
3
Mai
nten
ance
2.5
2.5
2.5
2.5
2.5
2.5
2.5
2.5
2.5
2.5
2.5
2.5
2.5
2.5
2.5
2.5
125.
4
Sub
tota
l37
.637
.637
.637
.637
.637
.637
.637
.637
.637
.637
.637
.637
.637
.637
.637
.61,
881.
7
354.
32,
043.
837
.637
.635
4.7
37.6
37.6
354.
337
.637
.637
.627
3.0
37.6
2,04
3.8
354.
337
.616
,420
.410
,657
.712
,701
.512
,739
.212
,776
.813
,131
.513
,169
.213
,206
.813
,561
.113
,598
.713
,636
.413
,674
.013
,947
.013
,984
.616
,028
.516
,382
.716
,420
.4
Tot
al C
ost
Cum
ulat
ive
Cos
t (A
)
Hyd
ro-
Suc
tion
Sys
tem
Equi
pmen
t C
ost
Ope
ratio
n an
dM
aint
enan
ce c
ost
Hyd
ro-
Suc
tion
Sys
tem
Equi
pmen
t C
ost
Ope
ratio
n an
dM
aint
enan
ce c
ost
Tot
al C
ost
Cum
ulat
ive
Cos
t (A
)
Hyd
ro-
Suc
tion
Sys
tem
Equi
pmen
t C
ost
Ope
ratio
n an
dM
aint
enan
ce c
ost
Tot
al C
ost
Cum
ulat
ive
Cos
t (A
)

The Study on Countermeasures for Sedimentation Final Report in the Wonogiri Multipurpose Dam Reservoir Supporting Report Annex No.5
Nippon Koei Co.,Ltd. July 2007 Yachiyo Engineering Co.,Ltd.
5-38
(2) Cost Comparison with Hydraulic Dredging
For comparison the hydro-suction system with the hydraulic dredging system on cost, the cost of the hydraulic dredging system is estimated. The hydraulic dredging system is assumed below in consideration of a scale of dredging amount of 100,000 m3, and those dredging material is to be flowed downstream through pipeline as well as the hydro-suction system.
a) Dredger ; D600PS Type
b) Pipeline length; 500m
The cost for it also comprises i) Equipment cost, ii) Operation and Maintenance. The equipment cost consists i) Dredger and others, ii) Device. Table 5.2.5 shows the equipment cost and an annual O&M cost of the hydraulic dredging sediment removal system. The cost of hydraulic sediment removal system is also estimated in 11 years and 50 years as well as the case of hydro-suction sediment removal system. The results are shown in Table 5.2.6 and 5.2.7, respectively. Table 5.2.8 shows net present value of them. The currency, exchange rate and discount rate below are adopted as well as the hydro-suction sediment removal system.
a) Currency
U.S. Dollar
b) Exchange rate
US$1.0 = Yen119.63
c) Discount rate
A discount rate of 12%
Table 5.2.5 Cost of the Dredger Sediment Removal System
Description Unit Quantity Unit Cost US$
Cost US$, thousand Remarks
Equipment cost Dredger (D600PS) nr 1 4,208,800 4,209 11-year of service life Anchor holding Boat nr 1 222,000 222 22-year of service life Tender Boat nr 1 14,000 14 22-year of service life HDPE Pipe (6m-long) pcs 77 102,000 102 6-year of service life Joint pcs 36 108,000 108 6-year of service life Float pcs 35 195,000 195 6-year of service life
Sub Total 4,850 O&M cost
Operation cost unit 1 97,572 97 Suction amount of 100,000m3
Maintenance cost unit 1 2,508 3 Sub Total 100
Total 4,950 Source: JICA Study Team

The Study on Countermeasures for Sedimentation Final Report in the Wonogiri Multipurpose Dam Reservoir Supporting Report Annex No.5
Nippon Koei Co.,Ltd. July 2007 Yachiyo Engineering Co.,Ltd.
5-39
Table 5.2.6 Cost of the Dredger Sediment Removal System in 11 Years
Source: JICA Study Team
Table 5.2.8 The Net Present Value of the Dredger Sediment removal System Cost (Thousand US$)
Description 11-year Period 50- year Period Cost NPV Cost NPV Equipment Cost 5,254 4,513 24,990 6,128 O&M Cost 1,101 594 5,006 831
Total 6,355 5,107 29,996 6,959 Note : NPV means net present value. Source: JICA Study Team
The comparison of cost for Hydro-suction system and Hydraulic dredging system is shown in Table 5.2.9. As regards unit cost, Hydro-suction system cost about 3 US$/m3 in 11-year period and about 1 US$/m3 in 50-year period, while they are about 5 US$/m3 and 2 US$/m3 both in 11-year period and 50-year period each for Hydraulic dredging system. There are quite big difference between them both in 11-year period and 50-year period, the hydro-suction system is less 40 % than the hydraulic dredging system.
Table 5.2.9 Comparison of Cost (Thousand US$)
Hydro-suction System Dredger System Period 11-year period 50- year period 11-year period 50- year periodSuction Amount 1,100,000m3 5,000,000m3 1,100,000m3 5,000,000m3 Equipment Cost 2,710 (2.5) 3,629 (0.7) 4,513 (4.1) 6,128 (1.2)O&M Cost 223 (0.2) 313 (0.06) 594 (0.5) 831 (0.2)
Total 2,933 (2.7) 3,942 (0.8) 5,107 (4.6) 6,959 (1.4)Note; the parenthetic value shows the cost per unit suction amount (US$/m3)
Source: JICA Study Team
1-year 2-year 3-year 4-year 5-year 6-year 7-year 8-year 9-year 10-year 11-year Total
Pumped Dredger 4,208.8 0 0 0 0 0 0 0 0 0 0 4,208.8
Anchor Handling Boat 221.5 0 0 0 0 0 0 0 0 0 0 221.5
Tender Boat 13.9 0 0 0 0 0 0 0 0 0 0 13.9
Steel Pipe 102.3 0 0 0 0 0 102.3 0 0 0 0 204.7
Joint 107.7 0 0 0 0 0 107.7 0 0 0 0 215.5
Float 194.9 0 0 0 0 0 194.9 0 0 0 0 389.7
Subtotal 4,849.1 0 0 0 0 0 404.9 0 0 0 0 5,254.0
Operation 97.6 97.6 97.6 97.6 97.6 97.6 97.6 97.6 97.6 97.6 97.6 1,073.7
Maintenance 2.5 2.5 2.5 2.5 2.5 2.5 2.5 2.5 2.5 2.5 2.5 27.6
Subtotal 100.1 100.1 100.1 100.1 100.1 100.1 100.1 100.1 100.1 100.1 100.1 1,101.3
4,949.2 100.1 100.1 100.1 100.1 100.1 505.0 100.1 100.1 100.1 100.1 6,355.3
4,949.2 5,049.4 5,149.5 5,249.6 5,349.7 5,449.8 5,954.9 6,055.0 6,155.1 6,255.2 6,355.3
PumpedDredgingSystem
Operation andMaintenance cost
Total Cost
Cumulative Cost (B)
Equipment Cost

The Study on Countermeasures for Sedimentation Final Report in the Wonogiri Multipurpose Dam Reservoir Supporting Report Annex No.5
Nippon Koei Co.,Ltd. July 2007 Yachiyo Engineering Co.,Ltd.
5-40
Tabl
e 5.
2.7
Cos
t of
the
Dre
dger
Sed
imen
t R
emov
al S
yste
m in
50
Year
s
Sour
ce: J
ICA
Stu
dy T
eam
1-ye
ar2-
year
3-ye
ar4-
year
5-ye
ar6-
year
7-ye
ar8-
year
9-ye
ar10
-yea
r11
-yea
r12
-yea
r13
-yea
r14
-yea
r15
-yea
r16
-yea
r17
-yea
r
Pum
ped
Dre
dger
4,20
8.8
00
00
00
00
00
4,20
8.8
00
00
0
Anc
hor
Han
dlin
g B
oat
221.
50
00
00
00
00
00
00
00
0
Ten
der
Boa
t13
.90
00
00
00
00
00
00
00
0
Ste
el P
ipe
102.
30
00
00
102.
30
00
00
010
2.3
00
0
Join
t10
7.7
00
00
010
7.7
00
00
00
107.
70
00
Flo
at19
4.9
00
00
019
4.9
00
00
00
194.
90
00
Sub
tota
l4,
849.
10
00
00
404.
90
00
04,
209
040
4.9
00
0
Ope
ratio
n97
.697
.697
.697
.697
.697
.697
.697
.697
.697
.697
.697
.697
.697
.697
.697
.697
.6
Mai
nten
ance
2.5
2.5
2.5
2.5
2.5
2.5
2.5
2.5
2.5
2.5
2.5
2.5
2.5
2.5
2.5
2.5
2.5
Sub
tota
l10
0.1
100.
110
0.1
100.
110
0.1
100.
110
0.1
100.
110
0.1
100.
110
0.1
100.
110
0.1
100.
110
0.1
100.
110
0.1
4,94
9.2
100.
110
0.1
100.
110
0.1
100.
150
5.0
100.
110
0.1
100.
110
0.1
4,30
8.9
100.
150
5.0
100.
110
0.1
100.
14,
949.
25,
049.
45,
149.
55,
249.
65,
349.
75,
449.
85,
954.
96,
055.
06,
155.
16,
255.
26,
355.
310
,664
.310
,764
.411
,269
.411
,369
.511
,469
.711
,569
.8
18-y
ear
19-y
ear
20-y
ear
21-y
ear
22-y
ear
23-y
ear
24-y
ear
25-y
ear
26-y
ear
27-y
ear
28-y
ear
29-y
ear
30-y
ear
31-y
ear
32-y
ear
33-y
ear
34-y
ear
Pum
ped
Dre
dger
00
00
00
4,20
8.8
00
00
00
00
00
Anc
hor
Han
dlin
g B
oat
00
00
022
1.5
00
00
00
00
00
0
Ten
der
Boa
t0
00
00
13.9
00
00
00
00
00
0
Ste
el P
ipe
00
010
2.3
00
00
00
102.
30
00
00
0
Join
t0
00
107.
70
00
00
010
7.7
00
00
00
Flo
at0
00
194.
90
00
00
019
4.9
00
00
00
Sub
tota
l0
00
404.
90
235.
44,
208.
80
00
404.
90
00
00
0
Ope
ratio
n97
.697
.697
.697
.697
.697
.697
.697
.697
.697
.697
.697
.697
.697
.697
.697
.697
.6
Mai
nten
ance
2.5
2.5
2.5
2.5
2.5
2.5
2.5
2.5
2.5
2.5
2.5
2.5
2.5
2.5
2.5
2.5
2.5
Sub
tota
l10
0.1
100.
110
0.1
100.
110
0.1
100.
110
0.1
100.
110
0.1
100.
110
0.1
100.
110
0.1
100.
110
0.1
100.
110
0.1
100.
110
0.1
100.
150
5.0
100.
133
5.5
4,30
8.9
100.
110
0.1
100.
150
5.0
100.
110
0.1
100.
110
0.1
100.
110
0.1
11,6
69.9
11,7
70.0
11,8
70.1
12,3
75.2
12,4
75.3
12,8
10.8
17,1
19.7
17,2
19.8
17,3
20.0
17,4
20.1
17,9
25.1
18,0
25.2
18,1
25.3
18,2
25.5
18,3
25.6
18,4
25.7
18,5
25.8
35-y
ear
36-y
ear
37-y
ear
38-y
ear
39-y
ear
40-y
ear
41-y
ear
42-y
ear
43-y
ear
44-y
ear
45-y
ear
46-y
ear
47-y
ear
48-y
ear
49-y
ear
50-y
ear
Tot
al
Pum
ped
Dre
dger
04,
208.
80
00
00
00
00
00
4,20
8.8
00
21,0
44.1
Anc
hor
Han
dlin
g B
oat
00
00
00
00
00
022
1.5
00
00
664.
5
Ten
der
Boa
t0
00
00
00
00
00
13.9
00
00
41.6
Ste
el P
ipe
102.
30
00
00
010
2.3
00
00
00
102.
30
818.
7
Join
t10
7.7
00
00
00
107.
70
00
00
010
7.7
086
1.9
Flo
at19
4.9
00
00
00
194.
90
00
00
019
4.9
01,
558.
8
Sub
tota
l40
4.9
4,20
8.8
00
00
040
4.9
00
023
5.4
04,
208.
840
4.9
024
,989
.6
Ope
ratio
n97
.697
.697
.697
.697
.697
.697
.697
.697
.697
.697
.697
.697
.697
.697
.697
.64,
880.
5
Mai
nten
ance
2.5
2.5
2.5
2.5
2.5
2.5
2.5
2.5
2.5
2.5
2.5
2.5
2.5
2.5
2.5
2.5
125.
4
Sub
tota
l10
0.1
100.
110
0.1
100.
110
0.1
100.
110
0.1
100.
110
0.1
100.
110
0.1
100.
110
0.1
100.
110
0.1
100.
15,
005.
9
505.
04,
308.
910
0.1
100.
110
0.1
100.
110
0.1
505.
010
0.1
100.
110
0.1
335.
510
0.1
4,30
8.9
505.
010
0.1
29,9
95.5
19,0
30.9
23,3
39.8
23,4
39.9
23,5
40.0
23,6
40.1
23,7
40.2
23,8
40.4
24,3
45.4
24,4
45.5
24,5
45.6
24,6
45.8
24,9
81.3
25,0
81.4
29,3
90.3
29,8
95.4
29,9
95.5
Pum
ped
Dre
dgin
gSys
tem
Ope
ratio
n an
dM
aint
enan
ce c
ost
Tot
al C
ost
Cum
ulat
ive
Cos
t (B
)
Equ
ipm
ent
Cos
t
Pum
ped
Dre
dgin
gSys
tem
Equ
ipm
ent
Cos
t
Ope
ratio
n an
dM
aint
enan
ce c
ost
Tot
al C
ost
Cum
ulat
ive
Cos
t (B
)
Pum
ped
Dre
dgin
gSys
tem
Equ
ipm
ent
Cos
t
Ope
ratio
n an
dM
aint
enan
ce c
ost
Tot
al C
ost
Cum
ulat
ive
Cos
t (B
)

The Study on Countermeasures for Sedimentation Final Report in the Wonogiri Multipurpose Dam Reservoir Supporting Report Annex No.5
Nippon Koei Co.,Ltd. July 2007 Yachiyo Engineering Co.,Ltd.
5-41
5.3 Maintenance Plan
(1) Optimum Maintenance Plan
It is quite important to keep in good condition for the hydro-suction sediment removal system, which can be operated at low cost for long time. The maintenance is classified in two kinds, a daily maintenance and a regular maintenance. The daily maintenance is done in a simple way whether equipment works or not, or it does not have any damage judging by its appearance. The regular maintenance covers a replacement according to a schedule.
(2) Check Plan
The following checks are done to each equipment before starting as the daily maintenance. (Table5.3.1 shows each requirement and their check points.)
At check, a checklist is to be used to prevent missing.
① Check by its appearance for the body of Siphon Barge, Anchor Handling Boat and Tender Boat, and HDPE Pipe.
② Check of functions by starting and stopping for equipment as pump, generator, etc.
③ Check of the number and availability of Fire Extinguisher, Life-Jacket, etc.
The check plan for the regular maintenance is shown in Table 5.3.2. Table 5.3.1 Daily Maintenance Plan
I t e m Remarks Siphon Barge Body Damage, Deformation, Crack, Corrosion etc. Pump Sound, Vibrations, Damage, Wear etc. Generator Sound, Vibrations, Damage, Wear, Corrosion etc. Electric Equipment Sound, Vibrations, Damage, Wear, Heat etc. Winch Damage, Wear etc. Excavator Damage, Wear, Corrosion etc. Measurement Gauges
Damage, Deformation, Corrosion etc.
Fire Extinguisher Quantity, Damage, Lifetime, Liquid Leak etc. Life-Jacket Quantity, Damage, Wear etc. Anchor Handling Boat
Damage, Deformation, Crack, Corrosion etc.
Tender Boat Damage, Deformation, Crack, Corrosion etc. HDPE Pipe etc. Damage, Deformation, Wear, Liquid Leak, Corrosion etc.
Source: JICA Study Team
Table 5.3.2 Regular Maintenance Plan
Regular Services Overhaul Regular Exchange Painting
I t e m every 2 months
Every 7 years
every 2 years
every 3 years
every 7 years
every year
Remarks
Siphon Barge Body ○ ○ Deck, Outside, Hold
Pump ○ ○ ○ Shaft, Bearing
Generator ○ ○ ○ Noise, Vibration, Exhaust gas
Electric Equipment ○ ○ Switch, Wiring, Fuse, Distributor, Control board
Winch ○ ○ Shaft, Bearing, Wire rope, Brake, Clutch
Excavator ○ ○ ○ Hydraulic piping
Measurement Gauges ○ ○ Pressure gauge, Flow-meter, Density meter
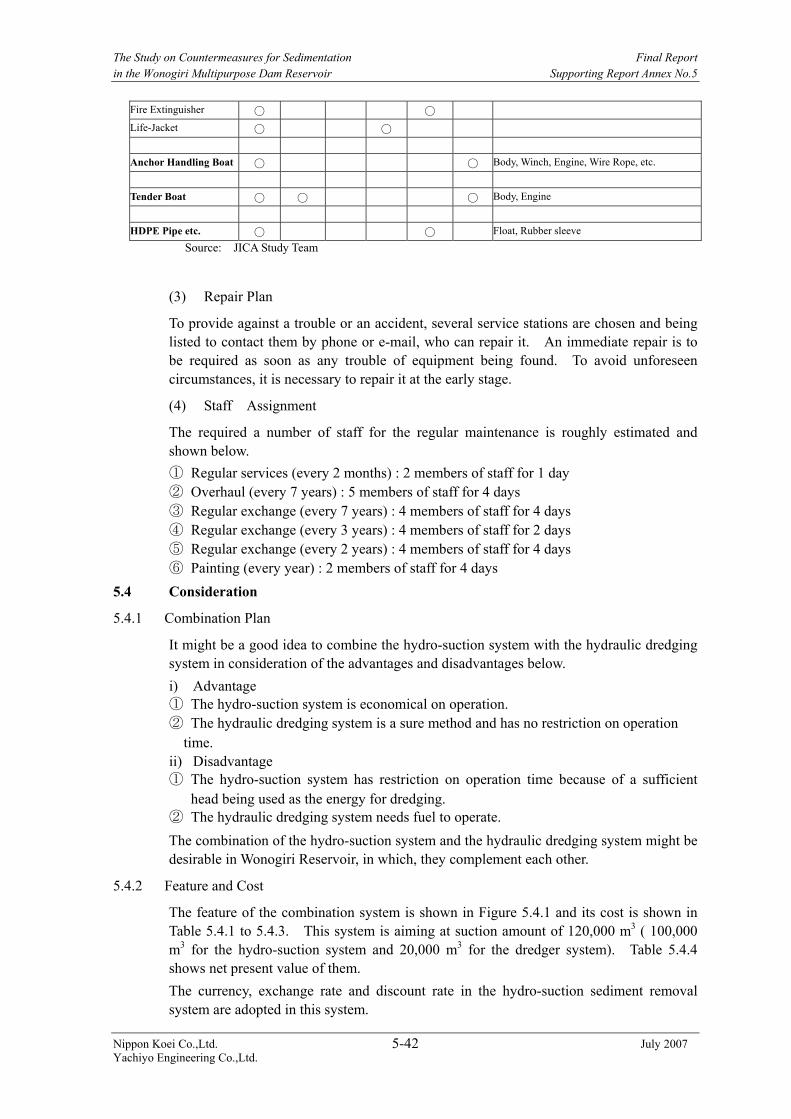
The Study on Countermeasures for Sedimentation Final Report in the Wonogiri Multipurpose Dam Reservoir Supporting Report Annex No.5
Nippon Koei Co.,Ltd. July 2007 Yachiyo Engineering Co.,Ltd.
5-42
Fire Extinguisher ○ ○
Life-Jacket ○ ○
Anchor Handling Boat ○ ○ Body, Winch, Engine, Wire Rope, etc.
Tender Boat ○ ○ ○ Body, Engine
HDPE Pipe etc. ○ ○ Float, Rubber sleeve
Source: JICA Study Team
(3) Repair Plan
To provide against a trouble or an accident, several service stations are chosen and being listed to contact them by phone or e-mail, who can repair it. An immediate repair is to be required as soon as any trouble of equipment being found. To avoid unforeseen circumstances, it is necessary to repair it at the early stage.
(4) Staff Assignment
The required a number of staff for the regular maintenance is roughly estimated and shown below. ① Regular services (every 2 months) : 2 members of staff for 1 day ② Overhaul (every 7 years) : 5 members of staff for 4 days ③ Regular exchange (every 7 years) : 4 members of staff for 4 days ④ Regular exchange (every 3 years) : 4 members of staff for 2 days ⑤ Regular exchange (every 2 years) : 4 members of staff for 4 days ⑥ Painting (every year) : 2 members of staff for 4 days
5.4 Consideration
5.4.1 Combination Plan
It might be a good idea to combine the hydro-suction system with the hydraulic dredging system in consideration of the advantages and disadvantages below. i) Advantage ① The hydro-suction system is economical on operation. ② The hydraulic dredging system is a sure method and has no restriction on operation
time. ii) Disadvantage ① The hydro-suction system has restriction on operation time because of a sufficient
head being used as the energy for dredging. ② The hydraulic dredging system needs fuel to operate. The combination of the hydro-suction system and the hydraulic dredging system might be desirable in Wonogiri Reservoir, in which, they complement each other.
5.4.2 Feature and Cost
The feature of the combination system is shown in Figure 5.4.1 and its cost is shown in Table 5.4.1 to 5.4.3. This system is aiming at suction amount of 120,000 m3 ( 100,000 m3 for the hydro-suction system and 20,000 m3 for the dredger system). Table 5.4.4 shows net present value of them. The currency, exchange rate and discount rate in the hydro-suction sediment removal system are adopted in this system.

The Study on Countermeasures for Sedimentation Final Report in the Wonogiri Multipurpose Dam Reservoir Supporting Report Annex No.5
Nippon Koei Co.,Ltd. July 2007 Yachiyo Engineering Co.,Ltd.
5-43
Table 5.4.1 Cost of the Combination System
Description Unit Quantity Unit CostUS$
Cost US$,thousand Remarks
Equipment cost Barge nr 1 2,591,300 2,591 11-year of service life Anchor Holding Boat nr 1 222,000 222 22-year of service life Tender Boat nr 1 14,000 14 22-year of service life HDPE Pipe (12m-long) pcs 56 7,400 415 12-year of service life HDPE Pipe (18m-long) pcs 14 8,700 121 12-year of service life Joint pcs 56 1,620 91 6-year of service life Float pcs 112 3,670 411 6-year of service life
Sub Total 3,865 O&M cost
Operation Cost unit 1 77,000 77 Suction amount of 120,000m3/year
Maintenance Cost unit 1 2,500 2.5 Annual Maintenance Sub Total 79.5
Total 3,945 Source: JICA Study Team

The Study on Countermeasures for Sedimentation Final Report in the Wonogiri Multipurpose Dam Reservoir Supporting Report Annex No.5
Nippon Koei Co.,Ltd. July 2007 Yachiyo Engineering Co.,Ltd.
5-44
Source: JICA Study Team
Figure 5.4.1 Plan and Cross Section of Barge Table 5.4.2 Cost of the Combination System in 11 Years
Source: JICA Study Team
Table 5.4.4 The Net Present Value of the Combination System Cost (Thousand US$)
Description 11-year period 50- year period Cost NPV Cost NPV Equipment Cost 4,366 3,677 (2.8) 19,821 4,930 (0.8)O&M cost 874 472 (0.4) 3,973 660 (0.1)
Total 5,240 4,149 (3.2) 23,794 5,590 (0.9)Note : NPV means net present value.
the parenthetic value shows the cost per unit suction amount (US$/m3) Source: JICA Study Team
winch
spud
generator
φ400Pipe
winch
suction pipe
winchwinch
pump
spud
φ400 Pipe pressure gauge
flow meter density meter
rotary- excavator
winch generator winch
spud
pump
pressure gauge
flow meter
density meter
suction pipe
generator
rotary- excavator
1-year 2-year 3-year 4-year 5-year 6-year 7-year 8-year 9-year 10-year 11-year Total
Barge 2,591.3 0.0 0.0 0.0 0.0 0.0 0.0 0.0 0.0 0.0 0.0 2,591.3
Anchor Handling Boat 221.5 0.0 0.0 0.0 0.0 0.0 0.0 0.0 0.0 0.0 0.0 221.5
Tender Boat 13.9 0.0 0.0 0.0 0.0 0.0 0.0 0.0 0.0 0.0 0.0 13.9
HDPE Pipe(12m) 414.7 0.0 0.0 0.0 0.0 0.0 0.0 0.0 0.0 0.0 0.0 414.7
HDPE Pipe(18m) 121.2 0.0 0.0 0.0 0.0 0.0 0.0 0.0 0.0 0.0 0.0 121.2
Joint 90.8 0.0 0.0 0.0 0.0 0.0 90.8 0.0 0.0 0.0 0.0 181.6
Float 411.0 0.0 0.0 0.0 0.0 0.0 411.0 0.0 0.0 0.0 0.0 822.0
Subtotal 3,864.4 0.0 0.0 0.0 0.0 0.0 501.8 0.0 0.0 0.0 0.0 4,366.3
Operation 77.0 77.0 77.0 77.0 77.0 77.0 77.0 77.0 77.0 77.0 77.0 846.5
Maintenance 3 3 3 3 3 3 3 3 3 3 3 27.6
Subtotal 79.5 79.5 79.5 79.5 79.5 79.5 79.5 79.5 79.5 79.5 79.5 874.1
3,943.9 79.5 79.5 79.5 79.5 79.5 581.3 79.5 79.5 79.5 79.5 5,240.4
3,944 4,023.4 4,102.8 4,182.3 4,261.8 4,341.2 4,922.5 5,002.0 5,081.4 5,160.9 5,240.4
Total Cost
Cumulative Cost (A)
Hydro-SuctionSystem
Equipment Cost
Operation andMaintenance cost
(Unit:1000 US$)
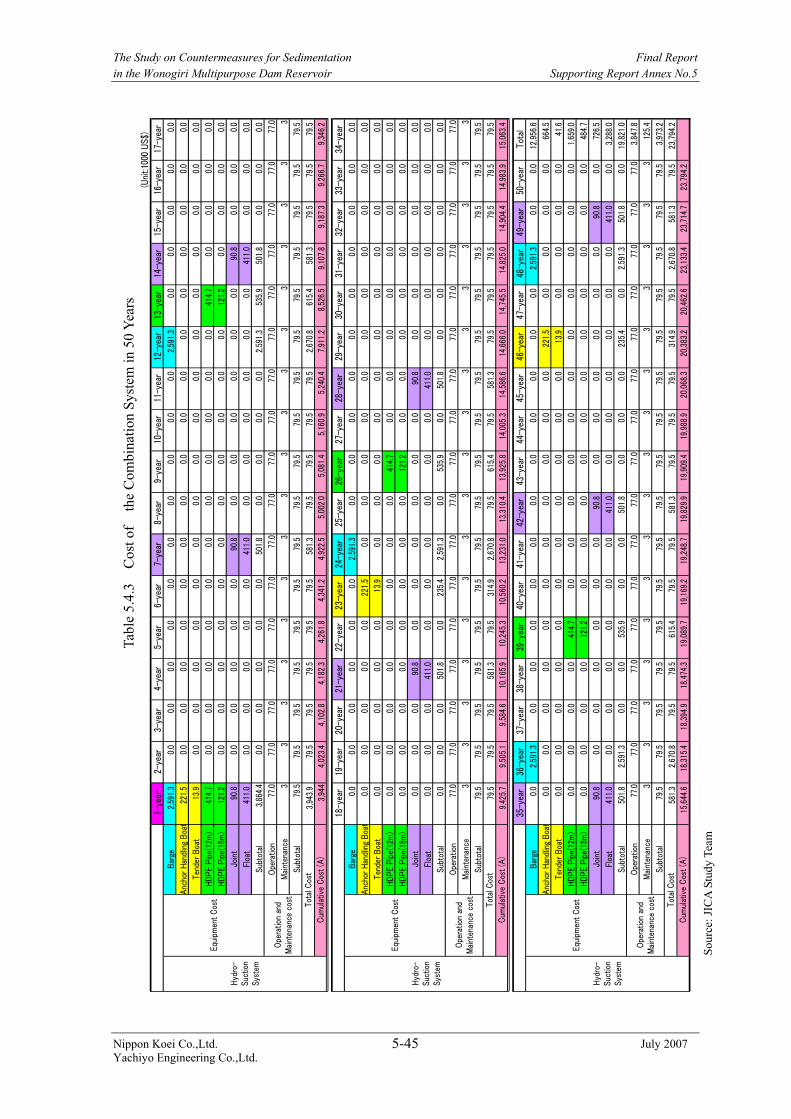
The Study on Countermeasures for Sedimentation Final Report in the Wonogiri Multipurpose Dam Reservoir Supporting Report Annex No.5
Nippon Koei Co.,Ltd. July 2007 Yachiyo Engineering Co.,Ltd.
5-45
1-ye
ar2-
year
3-ye
ar4-
year
5-ye
ar6-
year
7-ye
ar8-
year
9-ye
ar10
-yea
r11
-yea
r12
-yea
r13
-yea
r14
-yea
r15
-yea
r16
-yea
r17
-yea
r
Bar
ge2,
591.
30.
00.
00.
00.
00.
00.
00.
00.
00.
00.
02,
591.
30.
00.
00.
00.
00.
0
Anc
hor
Han
dlin
g B
oat
221.
50.
00.
00.
00.
00.
00.
00.
00.
00.
00.
00.
00.
00.
00.
00.
00.
0
Tend
er B
oat
13.9
0.0
0.0
0.0
0.0
0.0
0.0
0.0
0.0
0.0
0.0
0.0
0.0
0.0
0.0
0.0
0.0
HD
PE
Pip
e(12
m)
414.
70.
00.
00.
00.
00.
00.
00.
00.
00.
00.
00.
041
4.7
0.0
0.0
0.0
0.0
HD
PE
Pip
e(18
m)
121.
20.
00.
00.
00.
00.
00.
00.
00.
00.
00.
00.
012
1.2
0.0
0.0
0.0
0.0
Join
t90
.80.
00.
00.
00.
00.
090
.80.
00.
00.
00.
00.
00.
090
.80.
00.
00.
0
Floa
t41
1.0
0.0
0.0
0.0
0.0
0.0
411.
00.
00.
00.
00.
00.
00.
041
1.0
0.0
0.0
0.0
Subt
otal
3,86
4.4
0.0
0.0
0.0
0.0
0.0
501.
80.
00.
00.
00.
02,
591.
353
5.9
501.
80.
00.
00.
0
Ope
ratio
n77
.077
.077
.077
.077
.077
.077
.077
.077
.077
.077
.077
.077
.077
.077
.077
.077
.0
Mai
nten
ance
33
33
33
33
33
33
33
33
3
Subt
otal
79.5
79.5
79.5
79.5
79.5
79.5
79.5
79.5
79.5
79.5
79.5
79.5
79.5
79.5
79.5
79.5
79.5
3,94
3.9
79.5
79.5
79.5
79.5
79.5
581.
379
.579
.579
.579
.52,
670.
861
5.4
581.
379
.579
.579
.53,
944
4,02
3.4
4,10
2.8
4,18
2.3
4,26
1.8
4,34
1.2
4,92
2.5
5,00
2.0
5,08
1.4
5,16
0.9
5,24
0.4
7,91
1.2
8,52
6.5
9,10
7.8
9,18
7.3
9,26
6.7
9,34
6.2
18-y
ear
19-y
ear
20-y
ear
21-y
ear
22-y
ear
23-y
ear
24-y
ear
25-y
ear
26-y
ear
27-y
ear
28-y
ear
29-y
ear
30-y
ear
31-y
ear
32-y
ear
33-y
ear
34-y
ear
Bar
ge0.
00.
00.
00.
00.
00.
02,
591.
30.
00.
00.
00.
00.
00.
00.
00.
00.
00.
0
Anc
hor
Han
dlin
g B
oat
0.0
0.0
0.0
0.0
0.0
221.
50.
00.
00.
00.
00.
00.
00.
00.
00.
00.
00.
0
Tend
er B
oat
0.0
0.0
0.0
0.0
0.0
13.9
0.0
0.0
0.0
0.0
0.0
0.0
0.0
0.0
0.0
0.0
0.0
HD
PE
Pip
e(12
m)
0.0
0.0
0.0
0.0
0.0
0.0
0.0
0.0
414.
70.
00.
00.
00.
00.
00.
00.
00.
0
HD
PE
Pip
e(18
m)
0.0
0.0
0.0
0.0
0.0
0.0
0.0
0.0
121.
20.
00.
00.
00.
00.
00.
00.
00.
0
Join
t0.
00.
00.
090
.80.
00.
00.
00.
00.
00.
090
.80.
00.
00.
00.
00.
00.
0
Floa
t0.
00.
00.
041
1.0
0.0
0.0
0.0
0.0
0.0
0.0
411.
00.
00.
00.
00.
00.
00.
0
Subt
otal
0.0
0.0
0.0
501.
80.
023
5.4
2,59
1.3
0.0
535.
90.
050
1.8
0.0
0.0
0.0
0.0
0.0
0.0
Ope
ratio
n77
.077
.077
.077
.077
.077
.077
.077
.077
.077
.077
.077
.077
.077
.077
.077
.077
.0
Mai
nten
ance
33
33
33
33
33
33
33
33
3
Subt
otal
79.5
79.5
79.5
79.5
79.5
79.5
79.5
79.5
79.5
79.5
79.5
79.5
79.5
79.5
79.5
79.5
79.5
79.5
79.5
79.5
581.
379
.531
4.9
2,67
0.8
79.5
615.
479
.558
1.3
79.5
79.5
79.5
79.5
79.5
79.5
9,42
5.7
9,50
5.1
9,58
4.6
10,1
65.9
10,2
45.3
10,5
60.2
13,2
31.0
13,3
10.4
13,9
25.8
14,0
05.3
14,5
86.6
14,6
66.0
14,7
45.5
14,8
25.0
14,9
04.4
14,9
83.9
15,0
63.4
35-y
ear
36-y
ear
37-y
ear
38-y
ear
39-y
ear
40-y
ear
41-y
ear
42-y
ear
43-y
ear
44-y
ear
45-y
ear
46-y
ear
47-y
ear
48-y
ear
49-y
ear
50-y
ear
Tota
lB
arge
0.0
2,59
1.3
0.0
0.0
0.0
0.0
0.0
0.0
0.0
0.0
0.0
0.0
0.0
2,59
1.3
0.0
0.0
12,9
56.6
Anc
hor
Han
dlin
g B
oat
0.0
0.0
0.0
0.0
0.0
0.0
0.0
0.0
0.0
0.0
0.0
221.
50.
00.
00.
00.
066
4.5
Tend
er B
oat
0.0
0.0
0.0
0.0
0.0
0.0
0.0
0.0
0.0
0.0
0.0
13.9
0.0
0.0
0.0
0.0
41.6
HD
PE
Pip
e(12
m)
0.0
0.0
0.0
0.0
414.
70.
00.
00.
00.
00.
00.
00.
00.
00.
00.
00.
01,
659.
0
HD
PE
Pip
e(18
m)
0.0
0.0
0.0
0.0
121.
20.
00.
00.
00.
00.
00.
00.
00.
00.
00.
00.
048
4.7
Join
t90
.80.
00.
00.
00.
00.
00.
090
.80.
00.
00.
00.
00.
00.
090
.80.
072
6.5
Floa
t41
1.0
0.0
0.0
0.0
0.0
0.0
0.0
411.
00.
00.
00.
00.
00.
00.
041
1.0
0.0
3,28
8.0
Subt
otal
501.
82,
591.
30.
00.
053
5.9
0.0
0.0
501.
80.
00.
00.
023
5.4
0.0
2,59
1.3
501.
80.
019
,821
.0
Ope
ratio
n77
.077
.077
.077
.077
.077
.077
.077
.077
.077
.077
.077
.077
.077
.077
.077
.03,
847.
8
Mai
nten
ance
33
33
33
33
33
33
33
33
125.
4
Subt
otal
79.5
79.5
79.5
79.5
79.5
79.5
79.5
79.5
79.5
79.5
79.5
79.5
79.5
79.5
79.5
79.5
3,97
3.2
581.
32,
670.
879
.579
.561
5.4
79.5
79.5
581.
379
.579
.579
.531
4.9
79.5
2,67
0.8
581.
379
.523
,794
.215
,644
.618
,315
.418
,394
.918
,474
.319
,089
.719
,169
.219
,248
.719
,829
.919
,909
.419
,988
.920
,068
.320
,383
.220
,462
.623
,133
.423
,714
.723
,794
.2
(Uni
t:100
0 U
S$)
Hyd
ro-
Suct
ion
Syst
em
Equi
pmen
t C
ost
Ope
ratio
n an
dM
aint
enan
ce c
ost
Tota
l Cos
t
Cum
ulat
ive
Cos
t (A
)
Hyd
ro-
Suct
ion
Syst
em
Equi
pmen
t C
ost
Ope
ratio
n an
dM
aint
enan
ce c
ost
Tota
l Cos
t
Cum
ulat
ive
Cos
t (A
)
Tota
l Cos
t
Cum
ulat
ive
Cos
t (A
)
Hyd
ro-
Suct
ion
Syst
em
Equi
pmen
t C
ost
Ope
ratio
n an
dM
aint
enan
ce c
ost
Tabl
e 5.
4.3
Cos
t of
the
Com
bina
tion
Syst
em in
50
Year
s
Sour
ce: J
ICA
Stu
dy T
eam

Attachment Details of Cost Estimate

The Study on Countermeasures for Sedimentation Final Report in the Wonogiri Multipurpose Dam Reservoir Supporting Report Annex No.5(Attachment)
Nippon Koei Co.,Ltd. 5-A-1 July 2007 Yachiyo Engineering Co.,Ltd.
Details of Hydro-suction System
I t e m Description Unit Quantity Unit Cost Quantity Remarks
Dredging works 1.Siphon dredging m3 100,000 0.3 27,310 refer to Table C-1
Sub total 27,310
2.Placement and removal for Float m 250.0 1.2 300 refer to Table C-2
3.Placement and removal for Pipeline on the lan m 250.0 11.0 2,750 refer to Table C-3
Sub total 3,050
4.Tender Boat set 1 2,494 2,494 refer to Table C-4
Sub total 32,854 ①
Site management cost ①×7% 2,300
Indirect cost 2,300 ②
Net cost 35,154 ③=①+②
Maintenance cost 2,508
Summary
US$1.00 ¥119.63
I t e m Description Unit Quantity Unit Cost Cost RemarksSiphon Barge φ600 day 1.0 353 353 refer to Table UC-1
Anchor Handling Boat D3t 44kw day 1.0 18 18 refer to Table UC-2Contingency % 0.5 371 2
Total m3 1,365.0 0.3 373 unit cost estimate
I t e m Description Unit Quantity Unit Cost Cost RemarksAnchor Handling Boat D3t 44kw day 0.6 18 11 refer to Table UC-2
Crew person 4.0 16 64Contingency % 0.5 74 0.4
Total m 60.0 1.2 75 unit cost estimate
I t e m Description Unit Quantity Unit Cost Cost RemarksCrane 20t suspension day 1.1 368 405Truck 8t carrying day 0.4 334 134Crew person 7.6 16 121
Contingency % 0.5 659 3
Total m 60.0 11.0 662 unit cost estimate
I t e m Description Unit Quantity Unit Cost Cost RemarksTender Boat D30 PS3.0t day 73.0 34 2,482 refer to Table UC-3Contingency % 0.5 2,482 12
Total 2,494
Table C-1 Siphon Dredging (per m3)
Table C-2 Cost of Placement and removal for Float (per m)
Table C-3 Cost of Placement and removal for Pipeline on the land (Φ600mm L=6m)
Table C-4 Tender Boat (D30 PS3.0t)

The Study on Countermeasures for Sedimentation Final Report in the Wonogiri Multipurpose Dam Reservoir Supporting Report Annex No.5(Attachment)
Nippon Koei Co.,Ltd. 5-A-2 July 2007 Yachiyo Engineering Co.,Ltd.
US$1.00 ¥119.63
I t e m Description Unit Quantity Unit Cost (US$) Cost (US$) RemarksFuel Light Oil L 294.00 0.8 221 42L/h
Captain person 1.20 24.2 29Chief Crew person 1.20 21.9 26
Crew person 4.80 15.9 76Total 353
I t e m Description Unit Quantity Unit Cost Cost RemarksFuel Heavy Oil (A) L 39.00 0.5 18
I t e m Description Unit Quantity Unit Cost Cost RemarksFuel Heavy Oil (A) L 16.80 0.5 8 ※7×2.4
Chief Crew person 1.20 21.9 26Total 34
Heavy Oil Consumption per kilowatt 0.322(L/h)30 × 0.7355 ≒ 22 PS → KW※22 × 0.322 ≒ 7
Table UC-3 Tender Boat (D30 PS3.0t) (2.4hours/day)
Table UC-1 Siphon Barge Operation (7.0hours/1day)
Table UC-2 Anchor Handling Boat (D3t 44kw) Operation (4.0hours/day)

The Study on Countermeasures for Sedimentation Final Report in the Wonogiri Multipurpose Dam Reservoir Supporting Report Annex No.5(Attachment)
Nippon Koei Co.,Ltd. 5-A-3 July 2007 Yachiyo Engineering Co.,Ltd.
Details of Dredger System
I t e m Description Unit Quantity Unit Cost Cost Remarks
Dredging works 1.Hydraulic dredging m3 100,000 0.9 89,520 refer to Table C-1
Sub total 89,520
2.Placement and removal for Float m 250.0 1.2 300 refer to Table C-2
3.Placement and removal for Pipeline on the lan m 250.0 11.0 2,750 refer to Table C-3
Sub total 3,050
4.Tender Boat set 1 2,494 2,494 refert to Table C-4
Sub total 95,064 ①
Site management cost 2,508
Indirect cost 2,508 ②
Net cost 97,572 ③=①+②
Maintenance cost 2,508
Summary
US$1.00 ¥119.63
I t e m Description Unit Quantity Unit Cost Cost RemarksPump dredger D1,100ps day 1.0 1,198 1,198 refer to Table UC-1
Anchor Handling Boat D3t 44kw day 1.0 18 18 refer to Table UC-2Contingency % 0.5 1,216 6
Total m3 1,365.0 0.9 1,222 unit cost estimate
I t e m Description Unit Quantity Unit Cost Cost RemarksAnchor Handling Boat D3t 44kw day 0.6 18 11 refer to Table UC-2
Crew person 4.0 16 64Contingency % 0.5 74 0.4
Total m 60.0 1.2 75 unit cost estimate
I t e m Description Unit Quantity Unit Cost Cost RemarksCrane 20t suspension day 1.1 368 405Truck 8t carrying day 0.4 334 134Crew person 7.6 16 121
Contingency % 0.5 659 3
Total m 60.0 11.0 662 unit cost estimate
I t e m Description Unit Quantity Unit Cost Cost RemarksTender Boat D30 PS3.0t day 73.0 34 2,482 refer to Table UC-3Contingency % 0.5 2,482 12
Total 2,494
Table C-4 Tender Boat (D30 PS3.0t)
Table C-1 Hydraulic Dredging (per m3)
Table C-2 Cost of Placement and removal for Float (per m)
Table C-3 Cost of Placement and removal for Pipeline on the land (Φ560mm L=6m)

The Study on Countermeasures for Sedimentation Final Report in the Wonogiri Multipurpose Dam Reservoir Supporting Report Annex No.5(Attachment)
Nippon Koei Co.,Ltd. 5-A-4 July 2007 Yachiyo Engineering Co.,Ltd.
US$1.00 ¥119.63
I t e m Description Unit Quantity Unit Cost Cost RemarksFuel Heavy Oil (A) L 2,156.00 0.5 1,009 168L/h
Captain person 1.20 24 29Chief Crew person 1.20 22 26
Crew person 8.40 16 133Total 1,198
I t e m Description Unit Quantity Unit Cost Cost RemarksFuel Heavy Oil (A) L 39.00 0.5 18
18
I t e m Description Unit Quantity Unit Cost Cost RemarksFuel Heavy Oil (A) L 16.80 0.5 8 ※7×2.4
Chief Crew person 1.20 21.9 26Total 34
Heavy Oil Consumption per kilowatt 0.322(L/h)30 × 0.7355 ≒ 22 PS → KW※22 × 0.322 ≒ 7
Table UC-3 Tender Boat (D30 PS3.0t) Operation (2.4hours/day)
Table UC-1 Pump Dredger (1,100ps) Operation (7.0hours/1day)
Table UC-2 Anchor Handling Boat (D3t 44kw) Operation (4.0hours/day)

The Study on Countermeasures for Sedimentation Final Report in the Wonogiri Multipurpose Dam Reservoir Supporting Report Annex No.5(Attachment)
Nippon Koei Co.,Ltd. 5-A-5 July 2007 Yachiyo Engineering Co.,Ltd.
Details of Combination System
Item Description Unit Quantity Unit Cost Quantity Remarks
Dredging works 1.Siphon dredging (L500m 798m3/day) m
3100,000.0 0.5 46,729 refer to Table C-1
2.Pump dredging (L1,000m 861m3/day) m3 20,000.0 0.8 16,350 refer to Table C-1
Sub total 63,079
3.Placement and removal for Float m 750.0 1.2 936 refer to Table C-2
4.Placement and removal for Pipeline on the lan m 250.0 11.0 2,760 refer to Table C-3
Sub total 3,695
5.Tender Boat set 1.0 5,147 5,147 refer to Table C-4
Sub total 71,922 ①
Site management cost ①*7% 5,035
Indirect cost 5,035 ②
Net cost 76,956 ③=①+②
Maintenance cost 2,508
Summary

The Study on Countermeasures for Sedimentation Final Report in the Wonogiri Multipurpose Dam Reservoir Supporting Report Annex No.5(Attachment)
Nippon Koei Co.,Ltd. 5-A-6 July 2007 Yachiyo Engineering Co.,Ltd.
US$1.00 ¥119.63
I t e m Description Unit Quantity Unit Cost Cost Remarks
L500m 798m3/day
Siphon φ400 day 1.0 353 353 refer to Table UC-1
Anchor Handling Boat D3t 44kw day 1.0 18 18 refer to Table UC-2
Contingency % 0.5 371 2
Total 798.0 0.5 373 unit cost estimate
L1,000m 861m3/day
Pump D600ps day 1.0 682 682 refer to Table UC-1
Anchor Handling Boat D3t吊44kw day 1.0 18 18 refer to Table UC-2
Contingency % 0.5 700 4
Total 861.0 0.8 704 unit cost estimate
I t e m Description Unit Quantity Unit Cost Cost Remarks
Anchor Handling Boat D3t 44kw day 0.6 18 11 refer to Table UC-2
Crew person 4.0 16 64
Contingency % 0.5 74 0
Total m 60.0 1.2 75 unit cost estimate
I t e m Description Unit Quantity Unit Cost Cost Remarks
Crane 20t suspension day 1.1 368 405
Truck 8t carrying day 0.4 334 134
Crew person 7.6 16 121
Contingency % 0.5 659 3
Total m 60.0 11.0 662 unit cost estimate
I t e m Description Unit Quantity Unit Cost Cost Remarks
Tender Boat D30 PS3.0t day 150.0 34 5,122 refer to Table UC-3
Contingency % 0.5 5,122 26
Total 5,147
Table C-1 Pumped Siphon Dredging (per m3)
Table C-2 Cost of Placement and removal for Float (per m)
Table C-3 Cost of Placement and removal for Pipeline on the land (Φ400mm L=18m)
Table C-4 Tender Boat (D30 PS3.0t)

The Study on Countermeasures for Sedimentation Final Report in the Wonogiri Multipurpose Dam Reservoir Supporting Report Annex No.5(Attachment)
Nippon Koei Co.,Ltd. 5-A-7 July 2007 Yachiyo Engineering Co.,Ltd.
US$1.00 ¥119.63
Description Unit Quantity Unit Cost Cost Remarks
Fuel Light Oil L 294.00 0.8 221 42L/h
Captain 人 1.20 24.2 29
Chief Crew 人 1.20 21.9 26
Crew 人 4.80 15.9 76
Total 353
Fuel Heavy Oil L 1176.00 0.5 550 168L/h
Captain 人 1.20 24.2 29
Chief Crew 人 1.20 21.9 26
Crew 人 4.80 15.9 76
Total 682
Description Unit Quantity Unit Cost Cost Remarks
Heavy Oil L 39.00 0.5 18 42L/h
18
Description Unit Quantity Unit Cost Cost Remarks
Heavy Oil (A)L
16.80 0 8 ※7×2.4
person1.20 22 26
34
Table UC-3 Tender Boat (D30 PS3.0t) Operation (2.4hours/1day)
Heavy Oil Consumption per kilowatt 0.322(L/h)
30 × 0.7355 ≒ 22 PS → KW
※22 × 0.322 ≒ 7
Total
Fuel
Chief Crew
I t e m
I t e m
Table UC-1 Pumped Siphon Barge Operation (7.0hours/1day)
Siphon
Pump
Table UC-2 Anchor Handling Boat (D3t 44kw) Operation (4.0jours/1day)
Fuel
I t e m