annex a. research methodology - columbia universitymh2245/xcsurveys/aceh_method.pdf · annex a....
TRANSCRIPT

Annex A. Research Methodology 1. Overview The GAM Reintegration Needs Assessment was conducted from early November 2005 to late February 2006. It made use of multiple methods, integrating quantitative and qualitative data. Three primary data sources were utilised: First, qualitative fieldwork in ten districts (kabupaten) took place between November and January. Three teams of researchers visited one district each in three rounds of fieldwork.1 Each visit lasted for approximately ten days, and included visits to at least two sub-districts (kecamatan). Each field visit covered at least four villages. In total 28 villages, 22 sub-districts, and 10 districts were covered. Qualitative research locations were selected in order to capture variation in factors that might impact on reintegration dynamics and socio-economic needs, rather than to be representative of Aceh as a whole. Second, survey data collected by IOM on pardoned prisoners was analysed to understand better the socio-economic characteristics of pardoned prisoners. This survey is ongoing as IOM continues to identify and register the up to 2,000 eligible political prisoners. At the time of writing (early March 2006), 1956 prisoners have registered and received benefits. The data used in this report is based on the 1782 prisoners registered and surveyed by mid-February 2006. Third, a quantitative survey of 642 active GAM was implemented in partnership with the Aceh Monitoring Mission (AMM) in February 2006. Locations and informants were carefully sampled to be representative of the broader combatant and non-combatant GAM population. The GAM survey was implemented in the field by the AMM district offices. 2. Qualitative Fieldwork Qualitative methods contribute by helping to shed light on the reasons why events or phenomena occur. The intensive time spent in villages and speaking with both GAM returnees and receiving communities, helps to understanding current reintegration dynamics. Furthermore, it allows for a far more sophisticated understanding of how reintegration dynamics and socio-economic needs interact than approaches that utilize survey methods alone.2 Another advantage of qualitative methods is that it allows for the research process and questions to develop iteratively. The relatively recent return of GAM to villages the research began meant that it was difficult to know exactly what themes and questions to explore. Undertaking the qualitative research prior to the
1 One district was visited by each team in each round, with the exception of the visit to central Aceh, which covered Aceh Tengah and Bener Meriah districts. 2 During the preparation stage of the study, needs assessments of insurgent groups conducted in other countries were reviewed. The vast majority of these employed only quantitative survey methods.

quantitative research allowed for a more nuanced quantitative survey, with the research teams able to develop a set of question appropriate to the current (dynamic) context. The qualitative research was undertaken between early November and late January 2006. Three teams of three researchers visited one district each in three rounds of research. Each visit lasted for approximately ten days, and included visits to at least two sub-districts and four villages.3 Table 1 lists the research rounds and locations. Table 1: Qualitative Research Locations
Round District Sub-district Number of villages
Aceh Selatan 1. Bakongan Timur 2. Kluet Tengah 3. Samadua
1 2 2
Aceh Tengah & Bener Meriah
1. Silih Narah 2. Laut Tawar 3. Permata
1 1 2
First (November)
Aceh Timur 1. Banda Alam
2. Peureulak Alam 3. Serba Jadi
1 2 2
Aceh Jaya
1. Kreung Sabee 2. Lamno
2 2
Aceh Utara 1. Nisam 2. Seunuddon
2 2
Second (December)
Pidie 1. Muara Tiga 2. Tiro/Truseb
2 2
Aceh Barat Daya 1. Kuala Batee 2. Babahrot 3. Manggeng
2 1 1
Aceh Besar 1. Peukan Bada 2. Indrapuri
2 2
Third (January)
Aceh Tamiang 1. Manyek Payek 2. Seruway
2 2
Total 10 22 38 2.1 Location Selection Qualitative research locations were selected in order to capture variation in factors that we thought might impact on reintegration dynamics and socio-economic needs. There were three levels of selection: at the district, sub-district and village level. Districts were selected by the research coordination team, with selection balancing two objectives: first, districts were selected to be as representative of Aceh as a whole as possible; second, some districts in Aceh are more significant than others to the peace process, because of varying numbers of returnees, levels of tension, and so on. Efforts were made to ensure coverage of the most significant districts. For the first objective, the
3 Village names are not given to ensure informant anonymity.

main criterion was to select districts based on variation in geographic location and ethnic composition. In this way, a balance of east, west and central mountainous districts were chosen. For the second objective, the three main criteria for ‘significance’ were: (a) numbers of returnees; (b) past levels of tension/conflict; and, (c) current issues related to the peace process. In each district, the respective research teams choose their sub-district locations. Again, the main aim was to capture variation in dynamics and potential socio-economic needs. The teams utilised two main criteria:
1. Both sub-districts should have high rates of return (of combatants and prisoners); 2. Sub-districts should be chosen to ensure variation in factors likely to affect the
needs of GAM combatants, returnees and receiving villages. There are many potential factors that may be of importance. The most important of these include:
o Geographic location (e.g. accessibility); o Types/levels of employment; o Ethnic diversity; o Conflict history.
In each sub-district, the respective research teams choose their village research locations, utilizing three criteria:
1. One village should have a high number of returnees; the other village should have some returnees, but fewer.
2. If possible, the villages should also vary in terms of the type of returnee and the composition of the receiving community (e.g. number of former combatants compared to political prisoners and the presence of other conflict-affected groups, including surrendered GAM and anti-separatist fronts and minority groups).
3. If possible, the villages should also vary in terms of local socio-economic conditions (e.g. one should be poorer/more remote than the other).
Research teams spent at least 24 hours in each of the villages selected. Importantly, in most villages the research teams would stay overnight, either in the houses of GAM returnees or of receiving communities. This helped build the confidence of villagers and also enabled the researchers to conduct in-depth interviews with hosts and to cross-check information. In addition to the formal qualitative fieldwork, data from supervision and monitoring trips by the World Bank team in Banda Aceh was also used in the report. This included a number of trips to central Aceh in December and January to assess the needs of recently returned IDPs. Discussions with stakeholders in Banda Aceh and, to a lesser extent, Jakarta, also provided insights and helped shape the conclusions and recommendation of the report.

2.2 Informant Selection The qualitative research targeted two main groups of informants: GAM returnees and receiving communities. Table 2 summarizes the number of interviews and focus group discussions (FGDs) held with informants in each district.
Table 2: Number of In-depth Interviews and FGDs by district District In-depth
Interviews FGDs
Aceh Barat Daya 25 14 Aceh Besar 29 9 Aceh Jaya 17 8 Aceh Selatan 16 14 Aceh Tamiang 13 9 Aceh Timur 23 5 Aceh Tengah & Bener Meriah
50 9
Pidie 42 10 Aceh Utara 27 12 Total 242 90
GAM returnees included those active in GAM who recently returned from the mountains as well as political prisoners released after the MoU. Depending on the amount of GAM returnees in each village, the number of GAM returnees interviewed in each village ranged from one to over 30 (including those interviewed in focus group discussions). In each district, interviews were also held with district-level GAM leaders, including those representing GAM at the AMM. The receiving communities included a wide range of individuals. Those interviewed included, village heads, village secretaries, mukim (traditional leaders) and other community leaders, youth, women (often in separate focus group discussions), widows, conflict victims, the families of GAM returnees, and minority groups. This broad group also included government officials (district and sub-district level officials, the police and military), NGO staff, development program staff, the local media, as well as members of anti-separatist fronts. 2.3 Research Instruments The qualitative research utilized three different research instruments: in-depth interviews, focus group discussions, and participant observation. Overall, 242 in-depth interviews and 90 FGDs were completed (see breakdown above). Researchers noted their observations in their field notebooks. The primary research tool was in-depth interviews as these were more amenable to discussion of what was often material of a sensitive nature. In-depth interviews were utilized for three main purposes. First, they were used to obtain background information at the district, sub-district and village level. Second, in-depth interviews were used to
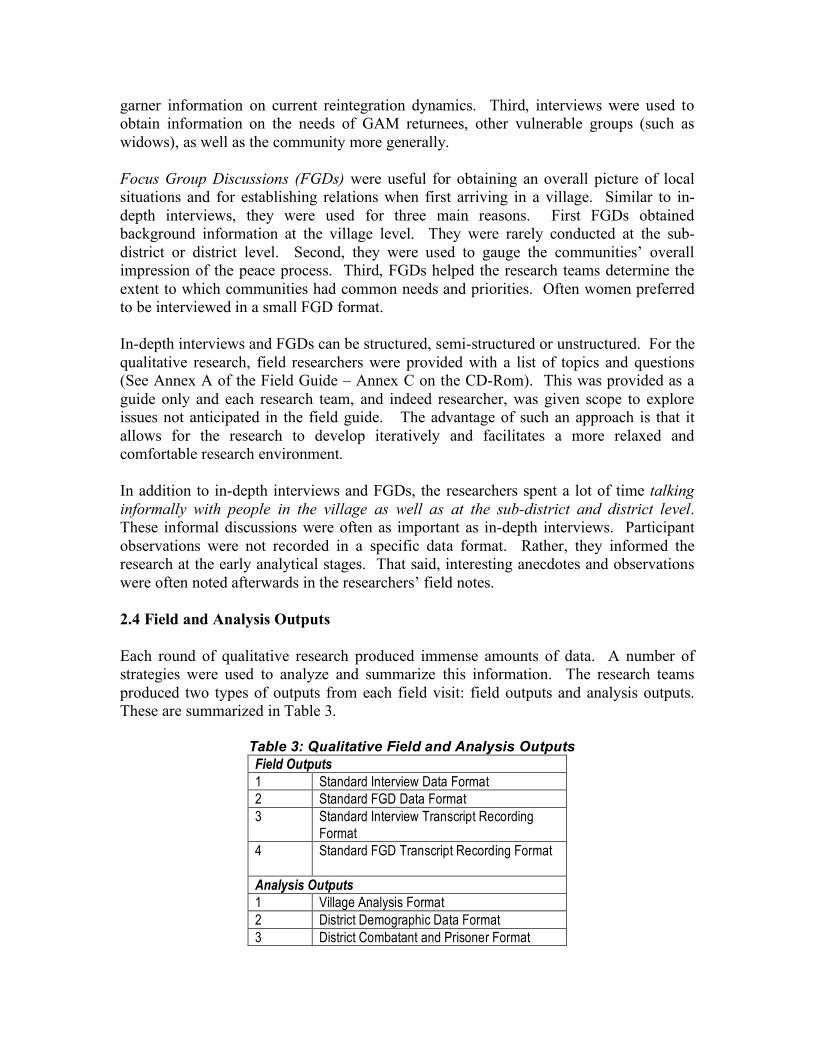
garner information on current reintegration dynamics. Third, interviews were used to obtain information on the needs of GAM returnees, other vulnerable groups (such as widows), as well as the community more generally. Focus Group Discussions (FGDs) were useful for obtaining an overall picture of local situations and for establishing relations when first arriving in a village. Similar to in-depth interviews, they were used for three main reasons. First FGDs obtained background information at the village level. They were rarely conducted at the sub-district or district level. Second, they were used to gauge the communities’ overall impression of the peace process. Third, FGDs helped the research teams determine the extent to which communities had common needs and priorities. Often women preferred to be interviewed in a small FGD format. In-depth interviews and FGDs can be structured, semi-structured or unstructured. For the qualitative research, field researchers were provided with a list of topics and questions (See Annex A of the Field Guide – Annex C on the CD-Rom). This was provided as a guide only and each research team, and indeed researcher, was given scope to explore issues not anticipated in the field guide. The advantage of such an approach is that it allows for the research to develop iteratively and facilitates a more relaxed and comfortable research environment. In addition to in-depth interviews and FGDs, the researchers spent a lot of time talking informally with people in the village as well as at the sub-district and district level. These informal discussions were often as important as in-depth interviews. Participant observations were not recorded in a specific data format. Rather, they informed the research at the early analytical stages. That said, interesting anecdotes and observations were often noted afterwards in the researchers’ field notes. 2.4 Field and Analysis Outputs Each round of qualitative research produced immense amounts of data. A number of strategies were used to analyze and summarize this information. The research teams produced two types of outputs from each field visit: field outputs and analysis outputs. These are summarized in Table 3. Table 3: Qualitative Field and Analysis Outputs
Field Outputs 1 Standard Interview Data Format 2 Standard FGD Data Format 3 Standard Interview Transcript Recording
Format 4 Standard FGD Transcript Recording Format
Analysis Outputs 1 Village Analysis Format 2 District Demographic Data Format 3 District Combatant and Prisoner Format

4 Life Story Analysis Piece 5 Quote Summary 6 Cases/Boxes 7 Field Report
Each team produced transcripts of all interviews and FGDs conducted, and recorded basic data on village, sub-district and district socio-economic characteristics. From these, interesting dynamics, cases studies and quotes were extracted. The field research teams then produced a field report for each district for each round. A total of nine district reports were completed.4 These follow a common outline similar to that used in the overall report, including information on: (a) the characteristics of GAM returnees (b) local reintegration dynamics, (c) GAM returnee and community needsand (d) conclusions and recommendations. They are available as separate working papers and are included as part of this CD-Rom annex. 3. Quantitative Methods I: IOM Political Prisoner Survey Quantitative methods allow for the detection of trends. Where the qualitative fieldwork was useful in developing hypotheses, and in understanding the processes and causal mechanisms that determined particular events or outcomes, the surveys allowed for an assessment of how generalizable and representative our conflict cases were. Survey data was particularly useful for the needs section of the paper; quantitative analysis allowed us to rank different needs and helped in the comparative analysis of the needs of different informant groups. The survey data was also used to test preliminary conclusions from the qualitative fieldwork, such as the finding that land was not considered a priority issue for GAM returnees. Large samples allowed for province-wide coverage. The assessment utilized two quantitative data sources: the IOM political prisoner survey as well as a survey of GAM members conducted in partnership with AMM. The IOM survey was primarily conducted in August when the government, as stipulated in the MoU, pardoned and amnestied political prisoners. On the August 17th, 283 political prisoners were pardoned as part of the Independence Day celebrations. On the August 17th, 1401 political prisoners were amnestied. IOM teams traveled to the prisons to register and survey those released. Prisoners were also provided with a benefits package and health check. Since this initial ‘August wave’ of registration and surveying, IOM in partnership with the government has continued to register political prisoners that slipped through the initial identification and registration process. At the time of writing (early March 2006), 1956 prisoners had registered. However, the data used in this report is based on the 1782 political prisoners registered as of mid-February 2006. This survey was a census, which allows for statistically valid inferences at all levels. The survey asks questions on: (a) demographic and household characteristics; (b) household assets and income; (c) health status; (d) education and employment; and (e) future plans. 4 The district report for central Aceh covers both Aceh Tengah and Bener Meriah.

4. Quantitative Methods II: World Bank/AMM GAM Survey The quantitative survey of 642 GAM members was implemented in partnership with AMM in February 2006. It was conducted in 71 randomly selected sub-districts in all districts in Aceh. The survey and sampling strategy was designed to allow statistically valid inferences to be made about the overall GAM returnee population across the whole of Aceh. The survey was developed based on emerging findings and categories from the qualitative fieldwork. It also, as far as possible, followed the questions asked in the IOM survey so as to ensure comparability. GAM members were asked questions on: (a) demographic and household characteristics; (b) the return process; (c) occupations; (d) household assets and land; (e) health status and access; (f) future employment and needs for assistance; and (g) the MoU and the peace process. Informants were carefully sampled to be representative of the broader combatant population. 4.1 Sampling Strategy Since it was impossible to construct a full sampling frame of GAM members (with locations of every combatant) given the current political condition in Aceh, we used a three-stage sampling strategy. In the first stage, we conducted a sample of sub-districts using a probability proportional to size (pps) methodology, followed by simple random sampling at the levels of villages and individuals. At the village level, where possible, the sample was stratified by male and female active GAM. Since most of the questions in the survey are categorical, with either two (Yes/No) or three (Yes/No/Don’t know) answers, we used the sampling for proportions formula to calculate the necessary sample size.5 For a 95% statistical power and a 5% margin of error, and taking the conservative assumption that the expected proportion is around 50%, we obtain a sample size of 400.6 To adjust for the multi-stage sampling strategy used, we need to inflate the sample size with the design effect. We assume a design effect of 1.5, providing us with a total sample size of 600. We translated this sample size requirement into our sampling strategy by dividing the cluster sizes for the sub-districts, villages, and individuals into 71, 3, and 3 respectively, giving a total sample size of 639. The choice of the cluster sizes tried to minimize overall variance by maximizing the cluster sizes of those clusters whose variances are greatest. It is reasonable to assume that in Aceh, variances are largest between sub-districts, then between villages, and finally within villages. 5 Cochran, W. (1963). Sampling Techniques. New York: John Wiley and Sons. 6 For an estimate with a 95% power, the formula for sample size calculation is:
2
)1(4
d
ppn
!"#=
where n = sample size, p= expected sample proportion, and d =margin of error (Cochran 1963).

4.2 Sampling Procedures This section describes the sampling procedure for the three-stage sampling of respondents. In the first stage, we sampled sub-districts with probability proportional to size. Here, the definition of “size” was the (estimated) number of GAM members (the estimation procedure is described below). Since we planned to survey at least nine GAM members per sub-district, we excluded from our population sub-districts with less than ten GAM members. We then drew our sample and stopped when the ceiling of ten sub-districts per-AMM office was exceeded.7 Due to its disproportionate number of GAM members, the Pidie office was treated as a special case and more than ten sub—districts were covered In the second stage, we sampled villages with equal probability. After the sub-districts were selected, lists of all villages in each sampled sub-district, randomly ordered, were generated. The village names were obtained from the recently issued 2005 Potensi Desa (PODES) survey. A field officer would then visit the first three villages in the list after confirming with sub-district informant(s) that GAM members did reside in these villages. In the third stage, we randomly drew three GAM members in each village with equal probability. To capture the voice of female GAM members, we tried to stratify further by gender at the village level: when available, one of the three GAM members interviewed must be female. 4.3 Estimating the Numbers of Active GAM at the Sub-district Level An important step before we could proceed with the first stage of sampling was to estimate the number of GAM members in each sub-district. This allowed us to determine the “probability weights” of each sub-district. The political reality in Aceh, especially given the sensitivities with regard to the true number of GAM members, meant it was difficult for the researchers to obtain such numbers. Therefore, we took the practical approach of relying on best estimates made by each of the AMM offices. The quality and level of detail of these estimates vary from one office to another. Based on their level of details, estimates can be categorized into three types: numeric (i.e. estimated number of GAM members in each sub-district); ratio (i.e. the share of a sub-district’s GAM members to the district total); and qualitative (i.e. a qualitative indication, from zero to three stars suggesting the density of GAM members in the sub-district). Of the 21 districts in Nanggroe Aceh Darussalam (NAD), the AMM offices provided numeric estimates for all sub-districts in ten districts. In four districts, AMM offices provided ratio estimates while in another five sub-districts, qualitative estimates were provided. In two districts, no sub-district-level estimates were provided. Table 4 below provides the types of sub-district level estimates of the number of ex-combatants and other GAM members provided by the district offices. 7 It was agreed that each AMM office will be responsible for no more than 90 respondents or equal to 10 sub-districts.

Table 4: Sub-district estimates of GAM returnees by type
Type of estimates Districts
Numeric Pidie, Bener Meriah, Aceh Tengah, Bireuen, Gayo Lues, Aceh Tenggara, Nagan Raya, Aceh Barat Daya, Aceh Selatan, Aceh Singkil
Ratio Aceh Jaya, Aceh Timur, Langsa, Aceh Tamiang
Qualitative Aceh Besar, Kota Sabang, Aceh Utara, Lhoksemauwe, Aceh Barat
Unavailable Kota Banda Aceh, Simeulue Except in districts where the AMM offices reported numeric estimates, no district-level figures were available. This necessitated making estimates of the number of GAM members in the remaining districts. This was done through a linear regression of the actual number of GAM members (as reported by seven AMM offices) on the number of GAM members as reported by GAM.8 We then used the coefficients obtained from this regression to predict the numbers of GAM members in other districts where district-level numbers were not available. The numbers obtained from the projection above were used to find estimates of the number of GAM members in the sub-districts. For the four districts that provided ratio estimates, we simply multiplied these estimates with the projected district figures. For the other five districts, where only qualitative assessments were available, we utilized existing information to estimate the meaning of the asterisks. Generally, we took one star as indicating 50 combatants, and two stars as 150. We then subtracted the number that had been established for one- and two-starred district-level projections, and divided them equally across the three-star sub-districts. For two districts located within one AMM office (Aceh Besar and Banda Aceh), we used the prisoner origins data from the International Organization for Migration (IOM) prisoner survey to estimate the distribution of GAM members between the two districts. This was necessary because the numbers reported by GAM were summarized at the AMM-office level, not at the district level. The same IOM political prisoner dataset was also used to estimate the within-district distribution in Aceh Jaya. Finally, for Simeulue, we estimated the number of GAM members by dividing our projected number equally across the sub-districts.
8 While GAM have not announced the number of combatant and non-combatant GAM, in order to allow for the delivery of jadup (social security) payments they have announced the proportional split across districts. We use these reported proportions to estimate actual numbers. We did not use Pidie in our initial regression of actual versus reported because it appears to be an outlier.

4.4 Survey Implementation9 The survey was implemented by teams from the AMM district offices. Several practical challenges led to modifications of the originally proposed sampling methodology. Whilst in some areas it was possible to proceed as planned, in other places it was more difficult. Sub-district level sampling was implemented as planned in all areas, but below that level some adaptation was necessary. In many places, it was necessary to contact local GAM former authorities in order to gain permission to survey ex-combatants. In some cases (e.g., Aceh Selatan and Aceh Utara), this led to GAM presenting a list of GAM members, from which a random sample living in the pre-selected sub-district was interviewed. This introduced some possible bias where local GAM field commanders may have steered surveyors away from some potential respondents. In other cases (e.g. Bireuen), some deviation from the randomly generated list of village sites was necessary, given long journey times and a lack of available information over how many villages did not contain any GAM members. After many wasted journeys, tight deadlines forced some survey teams to visit villages neighboring those on the list in order to find GAM members to interview. 4.5 Analysis At the end of the data collection process, we managed to gather information from 642 respondents. Data on these respondents were then entered into the database. To minimize errors on entry, a double-entry procedure was conducted where all data was entered twice, compared, and then verified by examining items where the two database differed. Afterwards, sampling weights were assigned. The sampling weights are calculated based on the three-stage sampling procedure above. The intermediate weights of a unit at every stage are, essentially, the inverse of the probability that the unit is selected at that stage.10 The First-Stage Sub-district Weights In the first stage, each sub-district was sampled with a probability equal to its “size” – where the size is defined the estimated number of GAM members. The weight for a sub-district in the first stage is, hence, the inverse of its probability-weight:
h
h
sd
mn
MIW
!=
9 This section is adapted from a write-up by Adam Burke of the Aceh Monitoring Mission (AMM) who supervised the implementation of the survey. 10 Martin, M.O., Mullis, I.V.S., & Chrostowski, S.J. (eds.). (2004). TIMMS 2003 Technical Report. Chestnut Hill, MA: TIMSS & PIRLS International Study Center, Boston College.

where h
sdIW = weights for h-th sub-district, n = the number of sampled drawn, mh = the
“size” (i.e., the estimated number of GAM members) of the h-th sub-district, and
!=
=N
h
hmM
1
is the total of the sub-district sizes (or the estimated total number of GAM members). The Second-Stage Village Weights In the second stage, each village was sampled with equal probability. The weight for a village in the second stage is:
h
h
ih
v
l
LIW =
,
where ih
vIW
, = weights for h-th sub-district and i-th village, Lh= total number of population village in the h-th sub-district, and lh = the number of villages sampled in h-th district. In this analysis, lh is 3. The Third-Stage Respondent Weights In the third stage, each respondent was sampled with equal probability. At this stage, the respondents were stratified by gender. The weight (for each stratum) in the third stage is:
ih
mf
ih
mfjih
mfrk
KIW
,
)(
,
)(,,
)(, =
where jih
mfrIW ,,
)(, = weights for female (male) GAM members the h-th sub-district, i-th
village, and , and j-th respondent; ih
mfK,
)( = female (male) GAM member population in the
h-th sub-district, i-th village; and ih
mfk,
)( = the total female (male) sampled GAM member in the h-th sub-district, i-th village. The subscript f or m indicates female or male stratum. If both male and female combatants are present in a village, ih
fk, is 1, and ih
mk
, is 2. The weight of an individual response is the product of the three intermediate weights, namely:
h
sd
ih
v
jih
mfr
jih
mfr IWIWIWW !!=,,,
)(,
,,
)(, 4. Integration of Methods A mixed methods approach, that combines quantitative and qualitative research, combines the advantages of both methods. The quantitative data allows for statistically valid inferences at the macro provincial level. The qualitative methods provide an understanding of why phenomena occurred, and helped in the interpretation of the quantitative findings. For example, one question in the quantitative survey indicated that the vast majority of returnees were interested in becoming either “small traders” or “big

traders”. The qualitative survey provided an understanding of why such livelihoods are desired. Field data suggests that GAM returnees want the freedom to be their own boss, and they see trading as one of the most obvious and easiest ways of achieving this. The report integrates data from the three sources. At various points of the assessment, the qualitative and quantitative data sources informed each other. The structure of the report was developed based on the initial fieldwork, including the results of the piloting of instruments before the research proper began. The nine district reports, which summarize the qualitative findings, were used as a basis for an initial draft of the synthesis report. This meant the main themes and the general narrative was developed based solely on the qualitative data. At this stage, points where the quantitative data could be incorporated were identified. The survey of active GAM was developed based on emerging findings and categories from the qualitative fieldwork and so as to allow for comparability with the prisoner data. Findings from the quantitative surveys (of active GAM and of political prisoners) were then integrated to test further, and quantify, the qualitative findings. In writing the final report, an iterative approach was used with different sources of data used to generate hypotheses that could be tested (or findings fleshed out) by the other forms of data. Where data sources pointed to different conclusions, the data was triangulated further. A series of public and private consultations in Jakarta and Banda Aceh provided feedback and helped add nuance to many of the findings, as well as identifying new analytical paths for exploration.