annex 1 healthy islands monitoring framework annex 1 healthy islands monitoring framework for...
TRANSCRIPT
1
ANNEX 1
Healthy Islands monitoring framework
For Pacific Health Ministers’ Review (Version as of 24 July 2017)
Principles Agreed principles of the framework included: a strong link to the Sustainable Development Goals
(SDGs); no duplication with other existing regional frameworks; minimization of country's reporting
burden; indicators with a range of process and outcome measures; and focusing on a set of core/minimum
indicators, and countries can choose to expand from this set.
Healthy Islands indicators The Healthy Islands monitoring framework comprises 48 mandatory indicators. The 48
mandatory indicators have been separated into two main types: 33 core (to be updated every one to two
years) and 15 complementary (to be updated as survey data are updated, generally every five to ten
years). The indicators cover a range of process and outcome measures (Appendix 1). Process measures
are likely to be of more interest to policy-makers and are more sensitive to change, and, as such, are
appropriate for annual reporting. Outcome measures of interest to policy-makers have also been included
to provide countries with inspirational targets and goal-setting; however, these are less likely to vary on
an annual basis. Where possible, indicator definitions have been sourced from global frameworks to
ensure harmonization and adherence to international standards, notably the SDG Pacific Headline
Indicators (Appendix 2). In addition to the mandatory indicators, 31 optional indicators are proposed (to
be selectively reported on, subject to national priorities and reporting systems). Countries will not be
required to provide data on these optional indicators as part of this framework, but rather are encouraged
to incorporate these into their national reporting frameworks where appropriate.
Data collection and validation process Of the 48 core and complementary indicators, 42 (88%) are already being collected and reported as
part of existing regional or global monitoring mechanisms. The most recent data have been prepopulated
in the Excel data entry forms, along with hyperlinks to the source databases. Columns have been
provided for countries to record their own national data against these regional and global figures.
By using regional and global data based on standardized definitions and methods, comparability between
countries is ensured. Including national data promotes the continued use of, and investments in
strengthening, national health information systems.

2
Table 1. Healthy Islands indicators
No. Indicator name Definitiona
Links to regional and global
monitoring frameworks Data sources
b
Data
availabilityc
1. Strong leadership, governance and accountability
CORE indicators
1.1 Health worker density Skilled health worker* density per
10 000 population
* Defined as physicians, nurses and
midwives
2030 Agenda for Sustainable
Development and the SDGs
(SDG indicator 3.c.1); Resolution
WHA67.24; Global Strategy on
Human Resources for Health:
Workforce 2030
Primary source: World Health Statistics
SDG Dashboard; WHO Regional Office for
the Western Pacific Health Information and
Intelligence Portal (HIIP)
Country database: Administrative
information systems (health worker
registry); national health workforce database
Published reports: WHO World Health
Statistics 2017: Monitoring Health for the
SDGs
Very high
1.2 Health expenditure per
capita
Per capita total expenditure on
health* (US$)
* Includes government and other sources
of funds
Pacific Community National
Minimum Development Indicators
(SPC NMDI) (PH-HS-1.3)
Primary source: SPC NMDI, HIIP
Country database: Administrative
information systems; National Health
Accounts
Published reports: OECD Health at a
Glance
Very high
1.3 Evidence of annual
health review, plan and
budget
Evidence of a formally
communicated, annual health plan
with budget, with formal review
processes in place
– Primary source: Report from key
informant Low
1.4 International Health
Regulations (IHR) core
capacity score
Average of 13 IHR core capacity
scores
2030 Agenda for Sustainable
Development and the SDGs (SDG
indicator 3.d.1); IHR (2005)
Primary source: World Health Statistics
SDG Dashboard
Country database: Annual IHR monitoring
questionnaire
Published reports: WHO World Health
Statistics 2017: Monitoring Health for the
SDGs
High
1.5 Death registration
coverage
Percentage of deaths that are
registered (with age and sex) in a
given time period (one year)
Regional Action Framework on
Civil Registration and Vital
Statistics (CRVS) (Goal 1)
Primary source: United Nations Statistics
Division (UNSD) coverage of civil
registration system
Country database: CRVS systems;
population-based (preferably nationally
representative) survey; census
Very high

3
No. Indicator name Definitiona
Links to regional and global
monitoring frameworks Data sources
b
Data
availabilityc
2. Avoidable diseases and premature deaths are reduced
CORE indicators
2.5 Tobacco excise taxes
Evidence of legislation to reduce
affordability of tobacco products by
increasing tobacco excise taxes
2011 UN Political Declaration on
Noncommunicable Diseases
(NCDs); Western Pacific Regional
Action Plan for the Prevention and
Control of NCDs (2014–2020);
WHO Framework Convention on
Tobacco Control (WHO FCFC)
(Tobacco Free Pacific)
Primary source: Pacific MANA
Dashboard/Report from key informant
Regional or global database: WHO Global
Health Observatory (GHO) data repository
Published reports: WHO Report on the
Global Tobacco Epidemic, 2015
High
2.6 Excise tax on alcoholic
drinks
Evidence of an inflation-adjusted
alcohol excise taxation system on
beer, wine and spirits
2011 UN Political Declaration on
NCDs; Western Pacific Regional
Action Plan for the Prevention and
Control of NCDs (2014–2020);
Global Strategy to Reduce the
Harmful Use of Alcohol
Primary source: Pacific MANA
Dashboard/Report from key informant
Regional or global database: WHO GHO
data repository
Published reports: WHO Global Status
Report on Alcohol and Health 2014
Indicator
updated since
last reporting
round
2.7 Excise tax on the retail
price of sugary-
sweetened beverages
(SSBs)
Excise duties levied on imported
and/or locally-produced SSBs of at
least 20% of retail price; or fiscal
import tax imposed on raw materials
for local producers to an equivalent
level
2011 UN Political Declaration on
NCDs; Western Pacific Regional
Action Plan for the Prevention and
Control of NCDs (2014–2020)
Primary source: Pacific MANA
Dashboard/Report from key informant
Low
2.8 Access to essential NCD
drugs
Essential NCD drugs available and
accessible in public health sector
primary care facilities
2011 UN Political Declaration on
NCDs; Western Pacific Regional
Action Plan for the Prevention and
Control of NCDs (2014–2020)
Primary source: Pacific MANA
Dashboard/Report from key informant
Regional or global database: WHO GHO
data repository
Indicator
updated since
last reporting
round
2.10 Service coverage for
people with increased
risk for CVD
Proportion of eligible persons
receiving drug therapy and
counselling to prevent heart attacks
and strokes
2011 UN Political Declaration on
NCDs; Global Action Plan for the
Prevention and Control of NCDs
2013–2020; Western Pacific
Regional Action Plan for the
Prevention and Control of NCDs
(2014–2020)
Primary source: Population-based
(preferably nationally representative) risk
factor survey; routine facility information
systems
Published reports: WHO Global Status
Report on NCDs 2014
Very low
2.13 HIV prevalence among
the general population
Estimated number of people living
with HIV, whether or not they have
developed symptoms of AIDS
Declaration of Commitment
on HIV/AIDS (United Nations
General Assembly Special Session)
Primary source: UNAIDS country reports,
HIIP
Country database: Active facility-based
surveillance system with key population
estimates; key population health surveys;
national population health surveys
Regional or global database: WHO GHO
data repository
Very high
4
No. Indicator name Definitiona
Links to regional and global
monitoring frameworks Data sources
b
Data
availabilityc
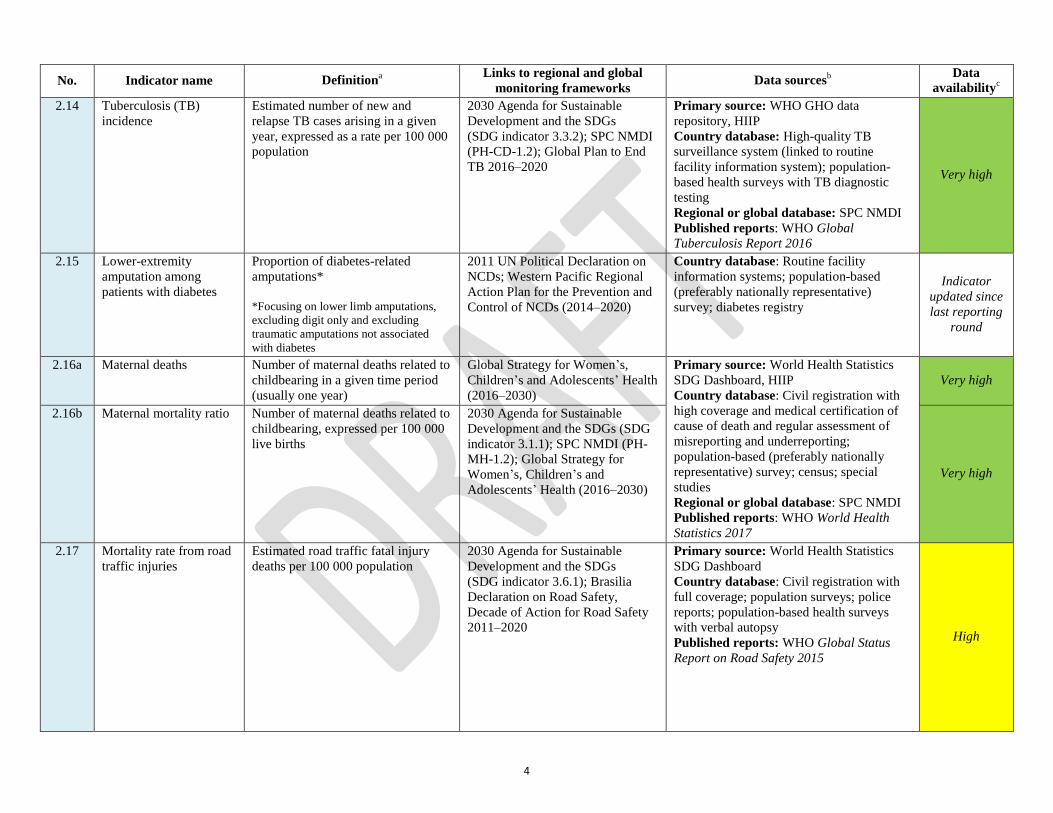
2.14 Tuberculosis (TB)
incidence
Estimated number of new and
relapse TB cases arising in a given
year, expressed as a rate per 100 000
population
2030 Agenda for Sustainable
Development and the SDGs
(SDG indicator 3.3.2); SPC NMDI
(PH-CD-1.2); Global Plan to End
TB 2016–2020
Primary source: WHO GHO data
repository, HIIP
Country database: High-quality TB
surveillance system (linked to routine
facility information system); population-
based health surveys with TB diagnostic
testing
Regional or global database: SPC NMDI
Published reports: WHO Global
Tuberculosis Report 2016
Very high
2.15 Lower-extremity
amputation among
patients with diabetes
Proportion of diabetes-related
amputations*
*Focusing on lower limb amputations,
excluding digit only and excluding
traumatic amputations not associated
with diabetes
2011 UN Political Declaration on
NCDs; Western Pacific Regional
Action Plan for the Prevention and
Control of NCDs (2014–2020)
Country database: Routine facility
information systems; population-based
(preferably nationally representative)
survey; diabetes registry
Indicator
updated since
last reporting
round
2.16a Maternal deaths Number of maternal deaths related to
childbearing in a given time period
(usually one year)
Global Strategy for Women’s,
Children’s and Adolescents’ Health
(2016–2030)
Primary source: World Health Statistics
SDG Dashboard, HIIP
Country database: Civil registration with
high coverage and medical certification of
cause of death and regular assessment of
misreporting and underreporting;
population-based (preferably nationally
representative) survey; census; special
studies
Regional or global database: SPC NMDI
Published reports: WHO World Health
Statistics 2017
Very high
2.16b Maternal mortality ratio Number of maternal deaths related to
childbearing, expressed per 100 000
live births
2030 Agenda for Sustainable
Development and the SDGs (SDG
indicator 3.1.1); SPC NMDI (PH-
MH-1.2); Global Strategy for
Women’s, Children’s and
Adolescents’ Health (2016–2030)
Very high
2.17 Mortality rate from road
traffic injuries
Estimated road traffic fatal injury
deaths per 100 000 population
2030 Agenda for Sustainable
Development and the SDGs
(SDG indicator 3.6.1); Brasilia
Declaration on Road Safety,
Decade of Action for Road Safety
2011–2020
Primary source: World Health Statistics
SDG Dashboard
Country database: Civil registration with
full coverage; population surveys; police
reports; population-based health surveys
with verbal autopsy
Published reports: WHO Global Status
Report on Road Safety 2015
High

5
No. Indicator name Definitiona
Links to regional and global
monitoring frameworks Data sources
b
Data
availabilityc
2.18a Deaths due to suicide
among adults
Absolute number of deaths due to
suicide among the adult (aged 18+
years) population in a specified time
period (usually one year)
WHO’s comprehensive Mental
Health Action Plan 2013–2020
Primary source: WHO Pacific Islands
Mental Health Network (PIMHnet)
questionnaire, HIIP
Country database: Civil registration with
high coverage; special studies;
administrative reporting systems (police
reports, hospital records)
Published reports: WHO Mental Health
Atlas
Very high
2.18b Adult suicide mortality
rate
Suicide rate per 100 000 population
in a specified period (age-
standardized)
2030 Agenda for Sustainable
Development and the SDGs (SDG
indicator 3.6.1); WHO’s
comprehensive Mental Health
Action Plan 2013–2020
High
2.19 Risk of premature death
from target NCDs
Percent of 30-year-olds who would
die before their 70th birthday from
any of cardiovascular disease,
cancer, diabetes, or chronic
respiratory disease, assuming that
s/he would experience current
mortality rates at every age and s/he
would not die from any other cause
of death (e.g., injuries or HIV/AIDS)
2030 Agenda for Sustainable
Development and the SDGs (SDG
indicator 3.4.1); 2011 UN Political
Declaration on NCDs; Global
Action Plan for the Prevention and
Control of NCDs 2013–2020;
Western Pacific Regional Action
Plan for the Prevention and Control
of NCDs (2014–2020)
Primary source: World Health Statistics
SDG Dashboard
Country database: Civil registration with
high coverage; population-based health
surveys with verbal autopsy
Published reports: WHO World Health
Statistics 2017: Monitoring Health for the
SDGs
High
2.20 Life expectancy at birth:
both sexes
Average number of years that a
newborn could expect to live if s/he
were to pass through life exposed to
the sex- and age-specific death rates
prevailing at the time of his/her birth,
for a specific year, in a given
country, territory or geographical
area
SPC NMDI (PH-VS-1.4) Primary source: SPC NMDI, HIIP
Country database: Civil registration with
high coverage; household surveys and
population census; sample registration
system Very high
COMPLEMENTARY indicators
2.1 Smoking prevalence Age-standardized prevalence of
tobacco smoking among persons
aged 15+ years
2030 Agenda for Sustainable
Development and the SDGs (SDG
indicator 3.a.1); WHO Framework
Convention on Tobacco Control
(WHO FCFC) (Tobacco Free
Pacific)
Primary source: World Health Statistics
SDG Dashboard
Country database: STEPS survey;
population-based health survey
Published reports: WHO Report on the
Global Tobacco Epidemic, 2015
Very high
2.2 Heavy episodic drinking Adults (aged 15+ or 18+ years)* who
report drinking six (60g) or more
standard drinks in a single drinking
occasion
*Age range will depend on survey
instrument used
2011 UN Political Declaration on
NCDs; Western Pacific Regional
Action Plan for the Prevention and
Control of NCDs (2014–2020);
WHO Global Strategy to Reduce
the Harmful Use of Alcohol
Primary source: WHO GHO Global
Information System on Alcohol and Health
(GISAH)
Country database: STEPS survey;
population-based health survey
Published reports: WHO Global Status
Report on Alcohol and Health 2014
Very high

6
No. Indicator name Definitiona
Links to regional and global
monitoring frameworks Data sources
b
Data
availabilityc
2.3 Insufficiently physically
active adults
Age-standardized prevalence of
insufficiently physically active
persons aged 18+ years
2011 UN Political Declaration on
NCDs; Global Action Plan for the
Prevention and Control of NCDs
2013–2020; Western Pacific
Regional Action Plan for the
Prevention and Control of NCDs
(2014–2020)
Primary source: WHO GHO data
repository
Country database: STEPS survey;
population-based health survey
Published reports: WHO Global Status
Report on NCDs 2014
Very high
2.4 Intimate partner violence Percentage of currently partnered
girls and women aged 15–49 years
who have experienced physical
and/or sexual violence by their
current intimate partner in the last 12
months
SPC NMDI (PH-GEN-1.12);
2030 Agenda for Sustainable
Development and the SDGs (SDG
indicator 5.2.1); Declaration on the
Elimination of Violence against
Women; UN Resolution 58/147,
“Elimination of domestic violence
against women”
Primary source: SPC NMDI
Country database: Population-based
(preferably nationally representative) survey
Regional or global database: World Health
Statistics SDG Dashboard
Published reports: WHO Global and
Regional Estimates of Violence Against
Women: Prevalence and Health Effects of
Intimate Partner Violence and Non-partner
Sexual Violence
High
2.9 Cervical cancer
screening
Coverage of the national cervical
cancer screening program
2011 UN Political Declaration on
NCDs; Global Action Plan for the
Prevention and Control of NCDs
2013–2020; Western Pacific
Regional Action Plan for the
Prevention and Control of NCDs
(2014–2020)
Primary source: WHO GHO data
repository
Country database: Population-based
(preferably nationally representative)
surveys; facility-based data; cancer registry
Published reports: WHO Global Status
Report on NCDs 2014
High
2.11 Service coverage for
people with severe
mental health disorders
Percentage of persons with a severe
mental health disorder who are using
services
WHO’s comprehensive Mental
Health Action Plan 2013–2020
Primary source: Population-based
(preferably nationally representative)
survey; facility information systems.
Published reports: WHO Mental Health
Atlas
Very low
2.12 Contraceptive
prevalence
Percentage of women aged 15-49
years who are sexually active, who
are currently using, or whose sexual
partner is using, at least one method
of contraception, regardless of
method used
SPC NMDI (PH-MH-1.4);
Global Strategy for Women’s,
Children’s and Adolescents’ Health
(2016–2030)
Primary source: SPCI NMDI
Country database: Population-based
(preferably nationally representative)
survey; routine facility information systems;
health facility assessments and surveys
Very high

7
No. Indicator name Definitiona
Links to regional and global
monitoring frameworks Data sources
b
Data
availabilityc
3. Children are nurtured in body and mind
CORE indicators
3.5 Birth registration
coverage
Estimated level of coverage of birth
registration
2030 Agenda for Sustainable
Development and the SDGs (SDG
indicator 16.9.1); Global Strategy
for Women’s, Children’s and
Adolescents’ Health (2016–2030);
CRVS Regional Action Framework
(Goal 1)
Primary source: WHO GHO data
repository, UNSD coverage of CRVS
systems
Country database: CRVS system;
population-based (preferably nationally
representative) survey; census
Published reports: UNICEF State of the
World’s Children; WHO World Health
Statistics 2017
Very high
3.6 Evidence of healthy food
policies in schools
Evidence of nationally endorsed
policies relating to the provision and
promotion of healthy food choices in
schools
2011 UN Political Declaration on
NCDs; Western Pacific Regional
Action Plan for the Prevention and
Control of NCDs (2014–2020)
Primary source: Pacific MANA
Dashboard/Report from key informant
Published reports: WHO School Policy
Framework
Very low
3.8 Births attended by
skilled health personnel
Percentage of live births attended by
skilled health personnel during a
specified time period (usually one
year)
2030 Agenda for Sustainable
Development and the SDGs
(SDG indicator 3.1.2); SPC NMDI
(PH-MH-1.3); Global Strategy for
Women’s, Children’s and
Adolescents’ Health (2016–2030)
Primary source: World Health Statistics
SDG Dashboard, HIIP
Country database: Routine facility
information systems; population-based
(preferably nationally representative) survey
Regional or global database: SPC NMDI
Published reports: UNICEF State of the
World’s Children; WHO World Health
Statistics 2017
Very high
3.9 Immunization coverage
for DTP3
One-year-olds who have received
three doses of the combined
diphtheria, tetanus toxoid and
pertussis vaccine in a given year
SPC NMDI (PH-CH-1.2);
Global Vaccine Action Plan
2011–2020
Primary source: WHO/UNICEF Joint
Reporting Form (JRF)
Country database: Administrative data;
Immunization surveys
Regional or global database: SPC NMDI
Published reports: UNICEF State of the
World’s Children; WHO World Health
Statistics 2017
Very high
3.10 Immunization coverage
for measles
Percentage of children aged under
1 year who have received at least one
dose of measles-containing vaccine
in a given year
SPC NMDI (PH-CH-1.1);
Global Vaccine Action Plan
2011–2020
Primary source: WHO/UNICEF Joint
Reporting Form (JRF)
Country database: Administrative data;
immunization surveys
Regional or global database: SPC NMDI
Published reports: UNICEF State of the
World’s Children; WHO World Health
Statistics 2017
Very high

8
No. Indicator name Definitiona
Links to regional and global
monitoring frameworks Data sources
b
Data
availabilityc
3.11 Human papillomavirus
(HPV) vaccine coverage
among adolescents
Female adolescents (aged 13–15
years) who have had three doses of
HPV vaccine
Global Vaccine Action Plan
2011–2020
Primary source: Administrative data;
immunization surveys Very low
3.12 HIV prevalence among
pregnant women
Pregnant women aged 15–24 years
who are tested for HIV during an
antenatal care (ANC) visit and have
positive test results
SPC NMDI (PH-SXH-1.2);
Declaration of Commitment
on HIV/AIDS (UNGASS)
Primary source: UNAIDS Country reports
Country database: Facility information
systems; surveillance system
Regional or global database: SPC NMDI;
WHO GHO data repository
High
3.13 Adolescent birth rate Annual number of births to women
aged 15–19 years per 1000 women in
that age group
2030 Agenda for Sustainable
Development and the SDGs (SDG
indicator 3.7.2); SPC NMDI (PH-
MH-1.5); Global Strategy for
Women’s, Children’s and
Adolescents’ Health (2016–2030)
Primary source: World Health Statistics
SDG Dashboard, HIIP
Country database: Facility information
systems; household surveys
Regional or global database: SPC NMDI
Published reports: WHO World Health
Statistics 2017
Very high
3.14 Low birthweight among
newborns
Percentage of live born infants that
weigh less than 2500 grams in a
given time period (usually one year)
SPC NMDI (PH-CH-1.4);
Global Strategy for Women’s,
Children’s and Adolescents’ Health
(2016–2030)
Primary source: SPC NMDIs, HIIP
Country database: Administrative
information systems; population-based
health surveys
Published reports: UNICEF State of the
World’s Children
Very high
3.15 Neonatal mortality rate Probability that a child born in a
specific year or period will die
during the first 28 completed days of
life if subject to age-specific
mortality rates of that period,
expressed per 1000 live births
2030 Agenda for Sustainable
Development and the SDGs
(SDG indicator 3.2.2); SPC NMDI
(PH-VS-1.3); Global Strategy for
Women’s, Children’s and
Adolescents’ Health (2016–2030)
Primary source: World Health Statistics
SDG Dashboard, HIIP
Country database: Administrative
information system; population-based health
surveys
Regional or global database: SPC NMDI
Published reports: UNICEF State of the
World’s Children
Very high
3.17 Under-five mortality rate Probability of a child born in a
specific year or period dying before
reaching the age of 5 years, if subject
to age-specific mortality rates of that
period, expressed per 1000 live births
2030 Agenda for Sustainable
Development and the SDGs
(SDG indicator 3.2.1); SPC NMDI
(PH-VS-1.1); Global Strategy for
Women’s, Children’s and
Adolescents’ Health (2016–2030)
Primary source: World Health Statistics
SDG Dashboard, HIIP
Country database: Administrative
information system; population-based health
surveys
Regional or global database: SPC NMDI
Published reports: UNICEF State of the
World’s Children
Very high
3.18 Child and adolescent
suicide mortality rate
Suicide rate per 100 000 population
in a specified period time period
(usually one year) for children and
adolescents (aged less than 18 years)
Global Strategy for Women’s,
Children’s and Adolescents’ Health
(2016–2030)
Primary source: Civil registration with full
coverage; special studies; administrative
reporting systems (police reports, hospital
records) Low
9
No. Indicator name Definitiona
Links to regional and global
monitoring frameworks Data sources
b
Data
availabilityc
COMPLEMENTARY indicators
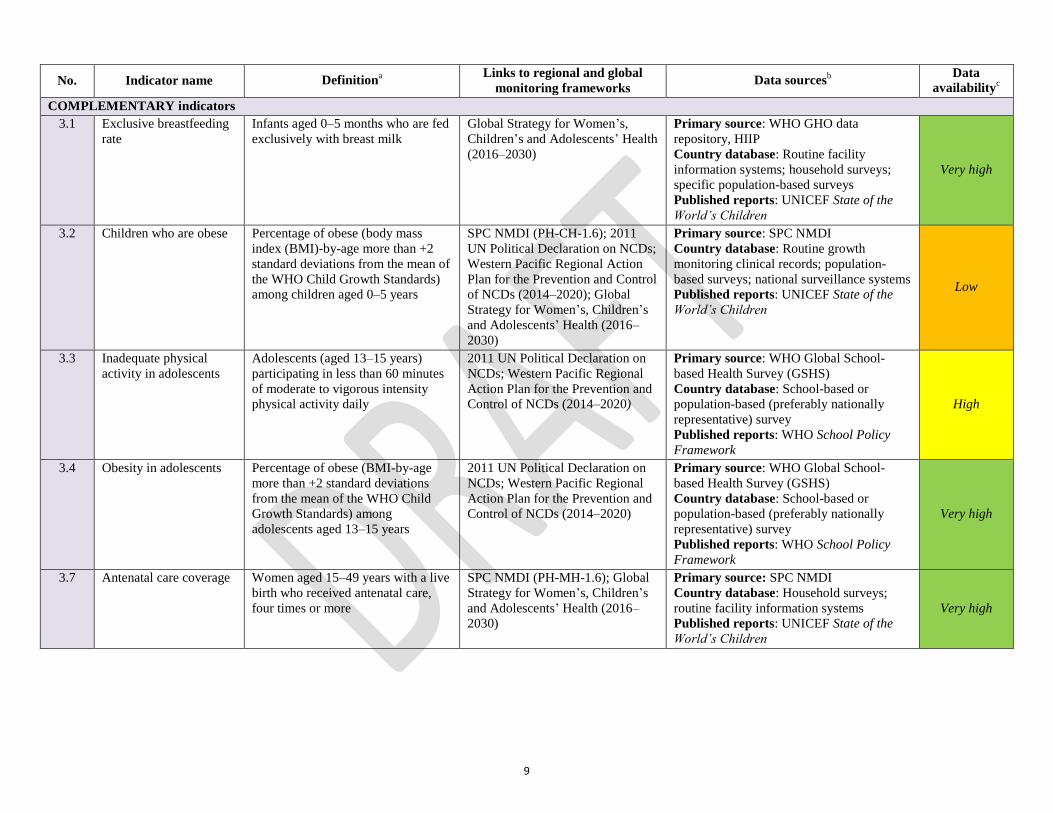
3.1 Exclusive breastfeeding
rate
Infants aged 0–5 months who are fed
exclusively with breast milk
Global Strategy for Women’s,
Children’s and Adolescents’ Health
(2016–2030)
Primary source: WHO GHO data
repository, HIIP
Country database: Routine facility
information systems; household surveys;
specific population-based surveys
Published reports: UNICEF State of the
World’s Children
Very high
3.2 Children who are obese Percentage of obese (body mass
index (BMI)-by-age more than +2
standard deviations from the mean of
the WHO Child Growth Standards)
among children aged 0–5 years
SPC NMDI (PH-CH-1.6); 2011
UN Political Declaration on NCDs;
Western Pacific Regional Action
Plan for the Prevention and Control
of NCDs (2014–2020); Global
Strategy for Women’s, Children’s
and Adolescents’ Health (2016–
2030)
Primary source: SPC NMDI
Country database: Routine growth
monitoring clinical records; population-
based surveys; national surveillance systems
Published reports: UNICEF State of the
World’s Children
Low
3.3 Inadequate physical
activity in adolescents
Adolescents (aged 13–15 years)
participating in less than 60 minutes
of moderate to vigorous intensity
physical activity daily
2011 UN Political Declaration on
NCDs; Western Pacific Regional
Action Plan for the Prevention and
Control of NCDs (2014–2020)
Primary source: WHO Global School-
based Health Survey (GSHS)
Country database: School-based or
population-based (preferably nationally
representative) survey
Published reports: WHO School Policy
Framework
High
3.4 Obesity in adolescents Percentage of obese (BMI-by-age
more than +2 standard deviations
from the mean of the WHO Child
Growth Standards) among
adolescents aged 13–15 years
2011 UN Political Declaration on
NCDs; Western Pacific Regional
Action Plan for the Prevention and
Control of NCDs (2014–2020)
Primary source: WHO Global School-
based Health Survey (GSHS)
Country database: School-based or
population-based (preferably nationally
representative) survey
Published reports: WHO School Policy
Framework
Very high
3.7 Antenatal care coverage Women aged 15–49 years with a live
birth who received antenatal care,
four times or more
SPC NMDI (PH-MH-1.6); Global
Strategy for Women’s, Children’s
and Adolescents’ Health (2016–
2030)
Primary source: SPC NMDI
Country database: Household surveys;
routine facility information systems
Published reports: UNICEF State of the
World’s Children
Very high

10
No. Indicator name Definitiona
Links to regional and global
monitoring frameworks Data sources
b
Data
availabilityc
3.16 Children who are stunted Percentage of stunting (height-for-
age less than −2 standard deviations
of the WHO Child Growth Standards
median) among children aged 0–5
years
2030 Agenda for Sustainable
Development and the SDGs
(SDG indicator 2.2.1); SPC NMDI
(PH-CH-1.5); Global Strategy for
Women’s, Children’s and
Adolescents’ Health (2016–2030)
Primary source: World Health Statistics
SDG Dashboard, HIIP
Country database: Routine growth
monitoring clinical records; population-
based surveys; national surveillance systems
Regional or global database: SPC NMDI
Published reports: UNICEF State of the
World’s Children; WHO World Health
Statistics 2017: Monitoring Health for the
SDGs
High
4. Ecological balance is promoted
CORE indicators
4.2 Resilience to climate
change and natural
disasters
Total dollar value linked with new
projects implemented in the past year
that have established integrated low-
carbon, climate-resilient, disaster risk
reduction development strategies
– Primary source: Report from key
informant Indicator
updated since
last reporting
round
4.3 Population using
improved drinking-water
sources
Population using improved drinking-
water sources in a specified time
period (usually one year)
2030 Agenda for Sustainable
Development and the SDGs
(SDG indicator 6.1.1); SPC NMDI
(PH-ENV-1.2)
Primary source: World Health Statistics
SDG Dashboard, HIIP
Country database: Administrative or
regulatory frameworks; household surveys;
population census
Regional or global database: SPC NMDI
Published reports: WHO World Health
Statistics 2017: Monitoring Health for the
SDGs
Very high
4.4 Population using
improved sanitation
facilities
Population using improved sanitation
facilities in a specified time period
(usually one year)
2030 Agenda for Sustainable
Development and the SDGs
(SDG indicator 6.2.1); SPC NMDI
(PH-ENV-1.4)
Primary source: World Health Statistics
SDG Dashboard, HIIP
Country database: Administrative or
regulatory frameworks; household surveys;
population census
Regional or global database: SPC NMDI
Published reports: WHO World Health
Statistics 2017: Monitoring Health for the
SDGs Very high
11
No. Indicator name Definitiona
Links to regional and global
monitoring frameworks Data sources
b
Data
availabilityc
COMPLEMENTARY indicators
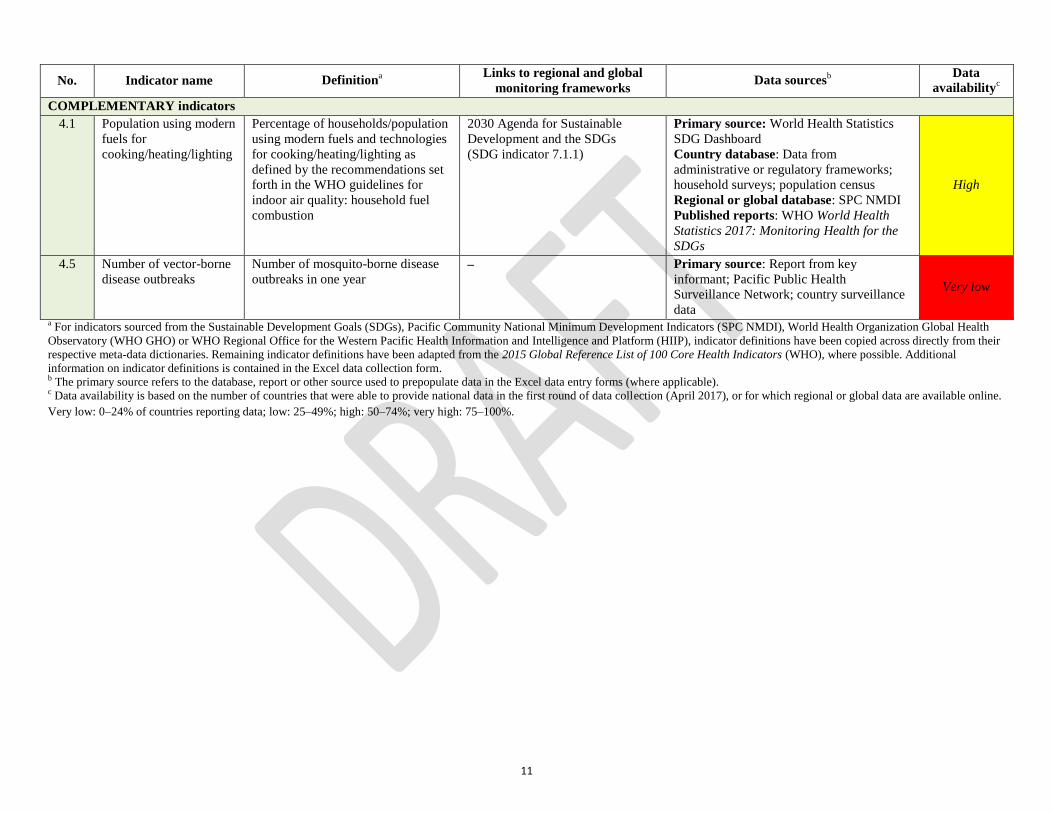
4.1 Population using modern
fuels for
cooking/heating/lighting
Percentage of households/population
using modern fuels and technologies
for cooking/heating/lighting as
defined by the recommendations set
forth in the WHO guidelines for
indoor air quality: household fuel
combustion
2030 Agenda for Sustainable
Development and the SDGs
(SDG indicator 7.1.1)
Primary source: World Health Statistics
SDG Dashboard
Country database: Data from
administrative or regulatory frameworks;
household surveys; population census
Regional or global database: SPC NMDI
Published reports: WHO World Health
Statistics 2017: Monitoring Health for the
SDGs
High
4.5 Number of vector-borne
disease outbreaks
Number of mosquito-borne disease
outbreaks in one year – Primary source: Report from key
informant; Pacific Public Health
Surveillance Network; country surveillance
data
Very low
a For indicators sourced from the Sustainable Development Goals (SDGs), Pacific Community National Minimum Development Indicators (SPC NMDI), World Health Organization Global Health
Observatory (WHO GHO) or WHO Regional Office for the Western Pacific Health Information and Intelligence and Platform (HIIP), indicator definitions have been copied across directly from their
respective meta-data dictionaries. Remaining indicator definitions have been adapted from the 2015 Global Reference List of 100 Core Health Indicators (WHO), where possible. Additional
information on indicator definitions is contained in the Excel data collection form. b The primary source refers to the database, report or other source used to prepopulate data in the Excel data entry forms (where applicable). c Data availability is based on the number of countries that were able to provide national data in the first round of data collection (April 2017), or for which regional or global data are available online.
Very low: 0–24% of countries reporting data; low: 25–49%; high: 50–74%; very high: 75–100%.
12
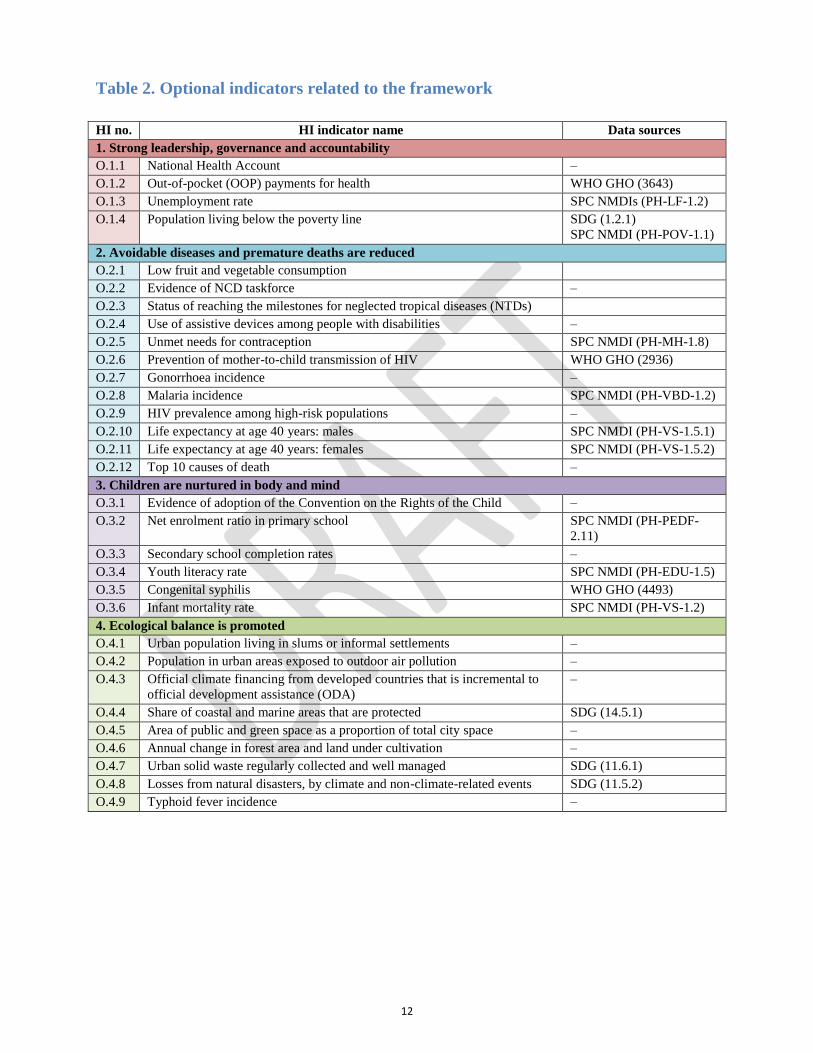
Table 2. Optional indicators related to the framework
HI no. HI indicator name Data sources
1. Strong leadership, governance and accountability
O.1.1 National Health Account –
O.1.2 Out-of-pocket (OOP) payments for health WHO GHO (3643)
O.1.3 Unemployment rate SPC NMDIs (PH-LF-1.2)
O.1.4 Population living below the poverty line SDG (1.2.1)
SPC NMDI (PH-POV-1.1)
2. Avoidable diseases and premature deaths are reduced
O.2.1 Low fruit and vegetable consumption
O.2.2 Evidence of NCD taskforce –
O.2.3 Status of reaching the milestones for neglected tropical diseases (NTDs)
O.2.4 Use of assistive devices among people with disabilities –
O.2.5 Unmet needs for contraception SPC NMDI (PH-MH-1.8)
O.2.6 Prevention of mother-to-child transmission of HIV WHO GHO (2936)
O.2.7 Gonorrhoea incidence –
O.2.8 Malaria incidence SPC NMDI (PH-VBD-1.2)
O.2.9 HIV prevalence among high-risk populations –
O.2.10 Life expectancy at age 40 years: males SPC NMDI (PH-VS-1.5.1)
O.2.11 Life expectancy at age 40 years: females SPC NMDI (PH-VS-1.5.2)
O.2.12 Top 10 causes of death –
3. Children are nurtured in body and mind
O.3.1 Evidence of adoption of the Convention on the Rights of the Child –
O.3.2 Net enrolment ratio in primary school SPC NMDI (PH-PEDF-
2.11)
O.3.3 Secondary school completion rates –
O.3.4 Youth literacy rate SPC NMDI (PH-EDU-1.5)
O.3.5 Congenital syphilis WHO GHO (4493)
O.3.6 Infant mortality rate SPC NMDI (PH-VS-1.2)
4. Ecological balance is promoted
O.4.1 Urban population living in slums or informal settlements –
O.4.2 Population in urban areas exposed to outdoor air pollution –
O.4.3 Official climate financing from developed countries that is incremental to
official development assistance (ODA)
–
O.4.4 Share of coastal and marine areas that are protected SDG (14.5.1)
O.4.5 Area of public and green space as a proportion of total city space –
O.4.6 Annual change in forest area and land under cultivation –
O.4.7 Urban solid waste regularly collected and well managed SDG (11.6.1)
O.4.8 Losses from natural disasters, by climate and non-climate-related events SDG (11.5.2)
O.4.9 Typhoid fever incidence –

13
Appendix 1: Healthy Islands indicators across the results chain
Risk factors and behaviours Inputs and processes Outputs Outcomes Impact
Avoidable diseases and
premature deaths are reduced
(2.1) Smoking prevalence
(2.2) Heavy episodic
drinking
(2.3) Insufficiently physically
active adults
(2.4) Intimate partner
violence
Children are nurtured in body
and mind
(3.1) Exclusive breastfeeding
rate
(3.2) Children who are obese
(3.3) Inadequate physical
activity in adolescents
(3.4) Obesity in adolescents
Ecological balance is promoted
(4.1) Population using
modern fuels for
cooking/heating/lighting
Strong leadership, governance
and accountability
(1.1) Health worker density
(1.2) Health expenditure per
capita
(1.3) Evidence of annual
health review, plan and
budget
(1.4) International Health
Regulations (IHR) core
capacity score
(1.5) Death registration
coverage
Avoidable diseases and
premature deaths are reduced
(2.5) Tobacco excise taxes
(2.6) Excise tax on alcoholic
drinks
(2.7) Excise tax on sugary-
sweetened beverages (SSBs)
Children are nurtured in body
and mind
(3.5) Birth registration
coverage
(3.6) Evidence of healthy
food policies in schools
Ecological balance is promoted
(4.2) Resilience to climate
change and natural disasters
Avoidable diseases and
premature deaths are reduced
(2.8) Access to essential
NCD drugs
(2.9) Cervical cancer
screening
(2.10) Service coverage for
people with increased risk
for CVD
(2.11) Service coverage for
people with severe mental
health disorders
(2.12) Contraceptive
prevalence
Children are nurtured in body
and mind
(3.7) Antenatal care coverage
Ecological balance is promoted
(4.3) Population using
improved drinking-water
sources
(4.4) Population using
improved sanitation facilities
Avoidable diseases and
premature deaths are reduced
(2.13) HIV prevalence among
the general population
(2.14) Tuberculosis (TB)
incidence
(2.15) Lower-extremity
amputation among patients
with diabetes
Children are nurtured in body
and mind
(3.8) Births attended by
skilled health personnel
(3.9) Immunization coverage
for DTP3
(3.10) Immunization coverage
for measles
(3.11) HPV vaccine coverage
among adolescents
(3.12) HIV prevalence among
pregnant women
Ecological balance is promoted
(4.5) Number of vector-borne
disease outbreaks
Avoidable diseases and
premature deaths are reduced
(2.16a & 2.16b) Maternal
mortality
(2.17) Mortality rate from
road traffic injuries
(2.18a & 2.18b) Adult suicide
mortality rate
(2.19) Risk of premature
mortality from target
noncommunicable diseases
(NCDs)
(2.20) Life expectancy at
birth: both sexes
Children are nurtured in body
and mind
(3.13) Adolescent birth rate
(3.14) Low birth weight
among newborns
(3.15) Neonatal mortality rate
(3.16) Children who are
stunted
(3.17) Under-five mortality
rate
(3.18) Child and adolescent
suicide rate

14
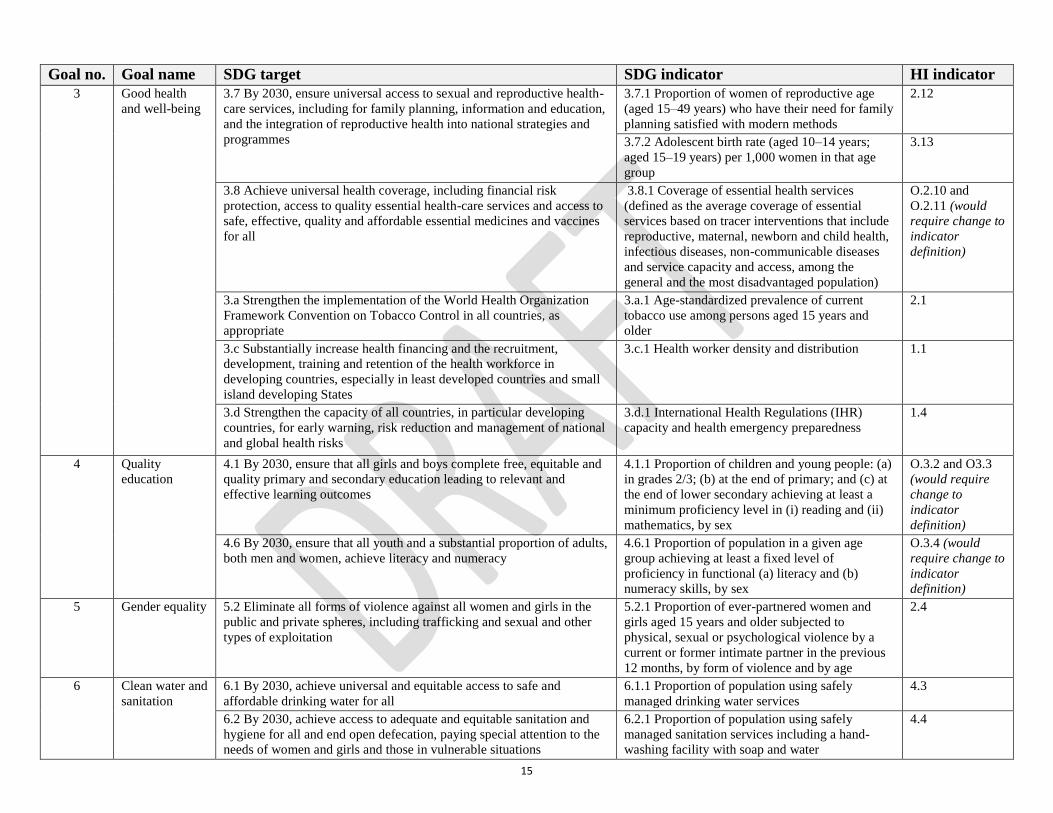
Appendix 2: Health related SDG Pacific Headline Indicators (as of March 2017)
Goal no. Goal name SDG target SDG indicator HI indicator
1 No poverty 1.2 By 2030, reduce at least by half the proportion of men, women and
children of all ages living in poverty in all its dimensions according to
national definitions
1.2.1 Proportion of population living below the
national poverty line, by sex and age
O.1.4
2 Zero hunger 2.2 By 2030, end all forms of malnutrition, including achieving, by
2025, the internationally agreed targets on stunting and wasting in
children under 5 years of age, and address the nutritional needs of
adolescent girls, pregnant and lactating women and older persons
2.2.1 Prevalence of stunting (height for age <-2
standard deviation from the median of the World
Health Organization (WHO) Child Growth
Standards) among children under 5 years of age
3.16
2.2.2 Prevalence of malnutrition (weight for
height >+2 or <-2 standard deviation from the
median of the WHO Child Growth Standards)
among children under 5 years of age, by type
(wasting and overweight)
3.2 (would
require change to
definition to
weight-for-height
from BMI-to-age)
3
Good health
and well-being
3.1 By 2030, reduce the global maternal mortality ratio to less than 70
per 100,000 live births
3.1.1 Maternal mortality ratio 2.16b
3.1.2 Proportion of births attended by skilled
health personnel
3.8
3.2 By 2030, end preventable deaths of newborns and children under 5
years of age, with all countries aiming to reduce neonatal mortality to at
least as low as 12 per 1,000 live births and under-5 mortality to at least
as low as 25 per 1,000 live births
3.2.1 Under-five mortality rate 3.17
3.2.2 Neonatal mortality rate 3.15
3.3 By 2030, end the epidemics of AIDS, tuberculosis, malaria and
neglected tropical diseases and combat hepatitis, water-borne diseases
and other communicable diseases
3.3.2 Tuberculosis incidence per 100,000
population
2.14
3.3.5 Number of people requiring interventions
against neglected tropical diseases
O.2.3 (would
require change to
indicator
definition)
3.4 By 2030, reduce by one third premature mortality from non-
communicable diseases through prevention and treatment and promote
mental health and well-being
3.4.1 Mortality rate attributed to cardiovascular
disease, cancer, diabetes or chronic respiratory
disease
2.19
3.5 Strengthen the prevention and treatment of substance abuse,
including narcotic drug abuse and harmful use of alcohol
3.5.2 Harmful use of alcohol, defined according to
the national context as alcohol per capita
consumption (aged 15 years and older) within a
calendar year in litres of pure alcohol
2.2 (would
require change to
indicator
definition)
15
Goal no. Goal name SDG target SDG indicator HI indicator
3 Good health
and well-being
3.7 By 2030, ensure universal access to sexual and reproductive health-
care services, including for family planning, information and education,
and the integration of reproductive health into national strategies and
programmes
3.7.1 Proportion of women of reproductive age
(aged 15–49 years) who have their need for family
planning satisfied with modern methods
2.12
3.7.2 Adolescent birth rate (aged 10–14 years;
aged 15–19 years) per 1,000 women in that age
group
3.13
3.8 Achieve universal health coverage, including financial risk
protection, access to quality essential health-care services and access to
safe, effective, quality and affordable essential medicines and vaccines
for all
3.8.1 Coverage of essential health services
(defined as the average coverage of essential
services based on tracer interventions that include
reproductive, maternal, newborn and child health,
infectious diseases, non-communicable diseases
and service capacity and access, among the
general and the most disadvantaged population)
O.2.10 and
O.2.11 (would
require change to
indicator
definition)
3.a Strengthen the implementation of the World Health Organization
Framework Convention on Tobacco Control in all countries, as
appropriate
3.a.1 Age-standardized prevalence of current
tobacco use among persons aged 15 years and
older
2.1
3.c Substantially increase health financing and the recruitment,
development, training and retention of the health workforce in
developing countries, especially in least developed countries and small
island developing States
3.c.1 Health worker density and distribution 1.1
3.d Strengthen the capacity of all countries, in particular developing
countries, for early warning, risk reduction and management of national
and global health risks
3.d.1 International Health Regulations (IHR)
capacity and health emergency preparedness
1.4
4 Quality
education
4.1 By 2030, ensure that all girls and boys complete free, equitable and
quality primary and secondary education leading to relevant and
effective learning outcomes
4.1.1 Proportion of children and young people: (a)
in grades 2/3; (b) at the end of primary; and (c) at
the end of lower secondary achieving at least a
minimum proficiency level in (i) reading and (ii)
mathematics, by sex
O.3.2 and O3.3
(would require
change to
indicator
definition)
4.6 By 2030, ensure that all youth and a substantial proportion of adults,
both men and women, achieve literacy and numeracy
4.6.1 Proportion of population in a given age
group achieving at least a fixed level of
proficiency in functional (a) literacy and (b)
numeracy skills, by sex
O.3.4 (would
require change to
indicator
definition)
5 Gender equality 5.2 Eliminate all forms of violence against all women and girls in the
public and private spheres, including trafficking and sexual and other
types of exploitation
5.2.1 Proportion of ever-partnered women and
girls aged 15 years and older subjected to
physical, sexual or psychological violence by a
current or former intimate partner in the previous
12 months, by form of violence and by age
2.4
6 Clean water and
sanitation
6.1 By 2030, achieve universal and equitable access to safe and
affordable drinking water for all
6.1.1 Proportion of population using safely
managed drinking water services
4.3
6.2 By 2030, achieve access to adequate and equitable sanitation and
hygiene for all and end open defecation, paying special attention to the
needs of women and girls and those in vulnerable situations
6.2.1 Proportion of population using safely
managed sanitation services including a hand-
washing facility with soap and water
4.4
16
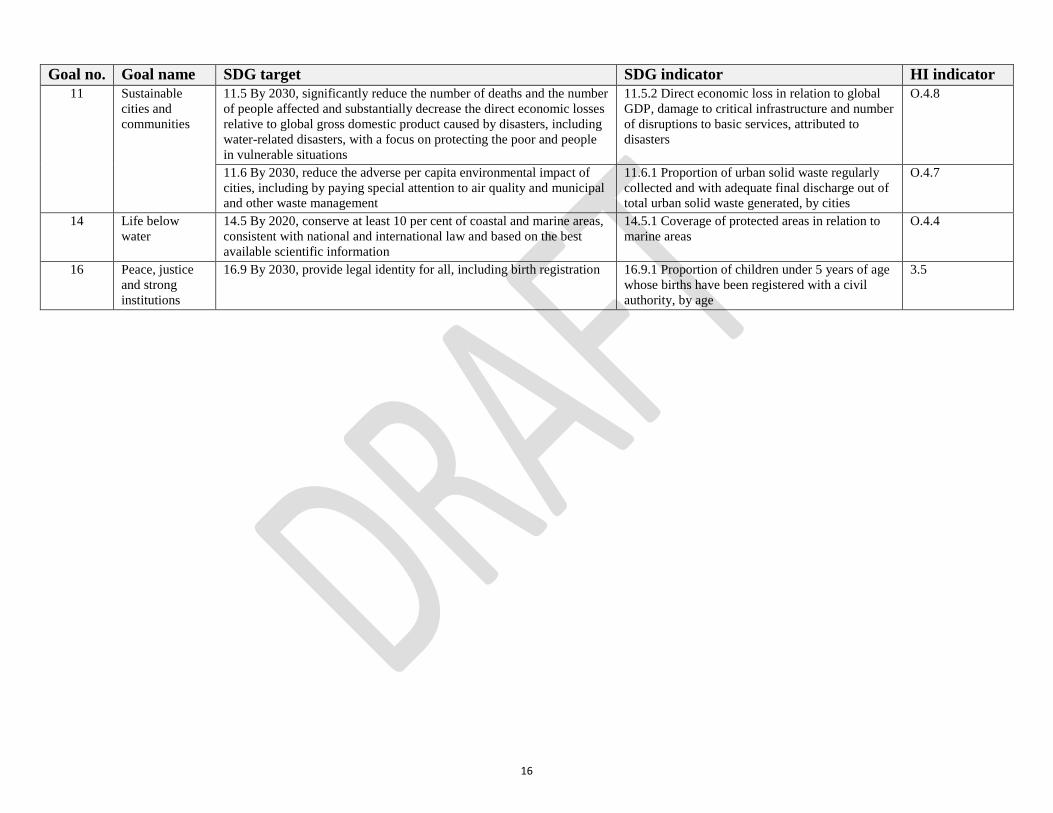
Goal no. Goal name SDG target SDG indicator HI indicator
11 Sustainable
cities and
communities
11.5 By 2030, significantly reduce the number of deaths and the number
of people affected and substantially decrease the direct economic losses
relative to global gross domestic product caused by disasters, including
water-related disasters, with a focus on protecting the poor and people
in vulnerable situations
11.5.2 Direct economic loss in relation to global
GDP, damage to critical infrastructure and number
of disruptions to basic services, attributed to
disasters
O.4.8
11.6 By 2030, reduce the adverse per capita environmental impact of
cities, including by paying special attention to air quality and municipal
and other waste management
11.6.1 Proportion of urban solid waste regularly
collected and with adequate final discharge out of
total urban solid waste generated, by cities
O.4.7
14 Life below
water
14.5 By 2020, conserve at least 10 per cent of coastal and marine areas,
consistent with national and international law and based on the best
available scientific information
14.5.1 Coverage of protected areas in relation to
marine areas
O.4.4
16 Peace, justice
and strong
institutions
16.9 By 2030, provide legal identity for all, including birth registration 16.9.1 Proportion of children under 5 years of age
whose births have been registered with a civil
authority, by age
3.5