anna strutt, peter minor and allan rae
TRANSCRIPT

A Dynamic CGE Analysis of the Trans-
Pacific Partnership Agreement: Potential
Impacts on the New Zealand Economy
Anna Strutt, Peter Minor and Allan Rae
University of Waikato, ImpactECON and Massey University
The Global EPAs Research Conference:
The Economic Impacts of New Generation Trade
Agreements, Tokyo
16-17 January 2017

Outline of the presentation
1. Brief background
2. Overview of the modelling approach
3. Analysis of results for the TPP reform scenario modelled
4. Some concluding comments
2

1. Background
• Our study was prepared for the New Zealand Ministry of Foreign Affairs and Trade (MFAT)
– Models some impacts of the TPP on the New Zealand economy
– Published September 2015
– The modelling report, along with other analysis of TPP, is available on MFAT’s website: www.tpp.mfat.govt.nz
3

2. Overview of the modelling approach
• We use the Dynamic GTAP model (GDyn)
– Based on the Global Trade Analysis Project (GTAP) global CGE model
• Database used as a starting point for our modelling is GTAP version 8.1
– Aggregated to 31 sectors and 21 countries/regions
– Selection of sectors and regions in the aggregation reflects our focus on the TPP and the NZ economy
4

Baseline to 2030
• We first develop a baseline scenario for GDyn through to 2030
• Included in the baseline are:
– Forecasts of key exogenous variables including GDP growth, population and labour force growth
– Tariff reductions already committed to in other key trade agreements
• Analysis of TPP reform is then undertaken relative to the baseline ‘business as usual’ projection
5

TPP scenarios modelled
• We model some potential impacts on the New Zealand economy due to changes that may be brought about by the TPP through:
– Reductions in tariff and quota barriers on goods trade
– Reductions in non-tariff barriers (NTBs) to goods trade
– Improvements in trade facilitation
– Reductions in barriers to services trade
6

Scenarios modelled
• We model two scenarios, each with 12 TPP members
• Scenario A includes:
– Tariff reductions and some dairy tariff rate quota (TRQ) expansion
• Scenario B includes:
– Scenario A plus reductions in NTBs
– Reductions in NTBs for goods trade (Kee et al. 2012)
– Improvements in trade facilitation (Minor 2013 and Hummels 2013)
– Reductions in barriers to services trade (CEPII 2011)
7

Details of TPP scenarios
8
Note: Group A—New Zealand, Australia, Chile, Singapore and Brunei; Group B—Canada, Japan, and the United States; Group C—Mexico, Peru, Malaysia, Vietnam.

Average tariff equivalents faced by New Zealand exports to TPP (%), 2030
9
-2
0
2
4
6
8
10
12
14
Base
Scenario A

3. Analysis of results for the TPP reform scenarios modelled
• We begin with an overview of aggregate impacts on the NZ economy
– Including decomposition of these
• Then turn to some sectoral results
10

Impact on New Zealand’s real GDP and welfare, 2030
11
Scenario A Scenario B
Real GDP (% ) 0.21 1.42
Real GDP
US$m 2007 459 3,062 Welfare (EV) US$m 2007
371 1,805

Impact on New Zealand’s real GDP (%),2015-2030
12

Decomposition of New Zealand’s real GDP growth impact (%), Scenario B
13
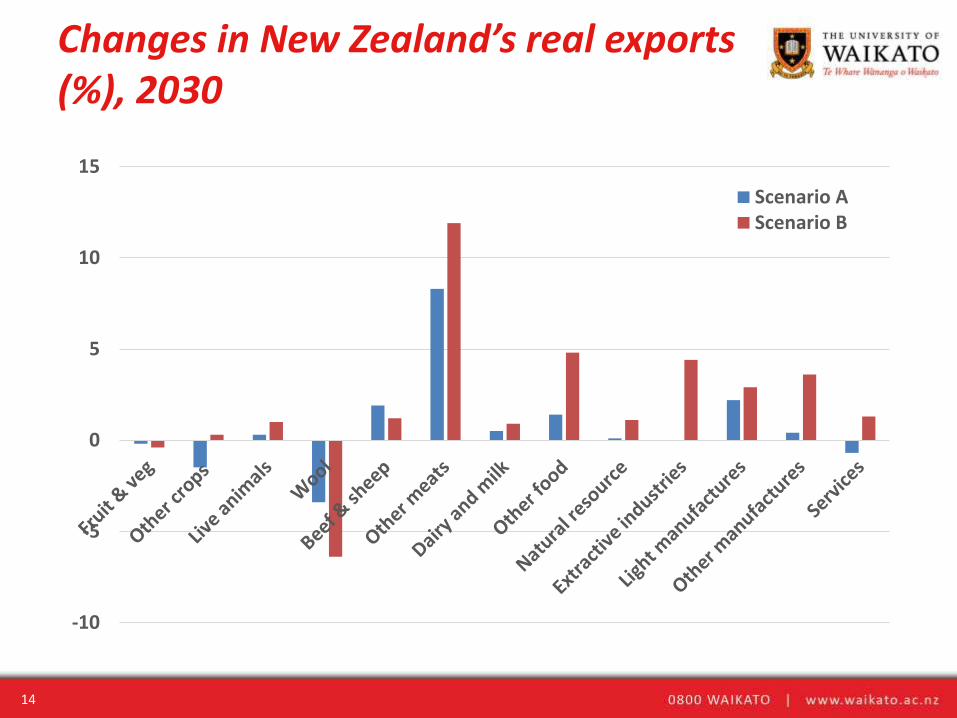
Changes in New Zealand’s real exports (%), 2030
14
-10
-5
0
5
10
15
Scenario AScenario B

Changes in New Zealand’s real output (%), 2030
15
-4
-3
-2
-1
0
1
2
3
4Scenario AScenario B

4. Concluding comments
• Our study indicates that the TPP trade liberalisation modelled is likely to offer overall gains for the New Zealand economy:
– With particularly strong gains when NTBs are also liberalised
• We acknowledge some limitations of the modelling and also the current uncertain political environment
16
