anna janusz, studies on a plant-based, high protein fruit beverage1033704/fulltext01.pdf ·...
TRANSCRIPT

Degree project work
Studies on a plant-based, high protein fruit beverage
Author: Anna Janusz Supervisor: Olof Böök (Aventure AB), Håkan Andersson (LNU) Examiner: Kjell Edman Date: 2016-05-25 Subject: Chemistry Level: First cycle Course code: 2KE01E Nr: 2016:L8
i
Abstract Introduction and Background Aventure AB has created a "between-meal beverage" with high protein and energy content aimed at older and/or physically active individuals. Aventure AB wished to transform this high energy drink to a plant-based product, because of the growing trend of plant-based diets. Aim The aim of this project was to replace the protein source in the beverage ”Skaka & smaka - strawberry taste”, while maintaining good flavour and texture. The original beverage contains whey protein, which was to be replaced with a vegetable source. Materials and methods A new plant-based beverage was developed from the original recipe. Four different alternative protein sources were added and evaluated with regard to taste, visual look, pH, dry matter, viscosity, brix, protein and energy content. To beverages based on different protein sources, four different juice concentrates were added in varying combinations and concentrations. Aromas were also added and a change of the fruit-purée recipe was made. The salt concentration was modified. The final product was evaluated through a consumer sensory analysis at a sports centre in Lund. The participants were asked to judge it by first impression, colour, odour, flavour, texture and overall impression on a 9-point hedonic scale. 76 individuals participated and compared the original beverage with the new plant-based one. Results and Discussion A beverage containing pea protein with a combination of a new fruit purée with a reduced amount of strawberries but an increased amount of bananas was selected as the most promising candidate. Further improvement of this beverage included addition of a juice concentrate mixture (6 mL/100 g), containing 50 % apple concentrate + 50 % lime concentrate. The salt content in the beverage was 0.03 g salt/100 g beverage. The sensory analysis revealed a significant difference regarding the first impression and flavour in favour of the original beverage, while a significant difference in colour appeared in favour of the new one containing pea protein. 19.6 % of the participating women, and 22.5 % of the men claimed that they would buy the new plant-based beverage. Conclusion A plant-based version of Skaka & smaka has been developed, and the sensory analysis indicates that the new product has potential on today's market. However, the beverage requires further development to satisfy all the needs within the target group.

ii
Keywords High-energy beverage, plant-based protein, malnutrition, physically active, sensory analysis. Thanks I would like to thank Olof Böök, my main supervisor at Aventure AB for giving me the opportunity to carry out this project and for being committed all the way through. I wish to acknowledge Evangelia Mitsou from Kemicentrum at Lund University who has been a great support in the laboratory and tutored me through the analysis. I would also like to thank Gerdahallen and all the participants for making the sensory analysis possible. Finally, I would like to thank Håkan Andersson, my internal supervisor who has been of great help during the writing process.

iii
Swedish summary Introduktion och bakgrund Aventure AB är ett företag som har skapat en mellanmålsdryck med högt energiinnehåll och som är rik på protein. Denna dryck kan både äldre samt fysiskt aktiva nyttja för att tillgodose sitt dagliga näringsbehov. Att äta vegetabiliskt är en trend som har vuxit under de senaste åren. Därför ville Aventure AB skapa en vegetabilisk produkt genom att byta ut den befintliga proteinkällan till ett vegetabiliskt proteinalternativ. Syfte Projektets syfte var att byta proteinkälla i drycken Skaka & smaka – jordgubbssmak men samtidigt behålla en god smak och textur. Originaldrycken innehåller vassleprotein och ska ersättas av en vegetabilisk proteinkälla. Syftet med bytet var att bredda målgruppen. Material och metoder Den nya vegetabiliska produkten utvecklades från dryckens originalrecept. Fyra alternativa proteinkällor testades i drycken och deras egenskaper analyserades i form av smak, utseende, pH, viskositet, brix, torrsubstans samt protein och energiinnehåll. Till dessa drycker tillsattes juicekoncentrat i olika kombinationer och koncentrationer. Vidare tillsattes aromer och en förändring i receptet tillhörande fruktpurén gjordes. Även en modifiering av saltkoncentrationen utfördes. Efter att ha utvecklat en dryck som ansågs ha goda sensoriska egenskaper, utfördes en sensorisk konsumentanalys på Gerdahallen i Lund gällande första intryck, doft, färg, smak, textur och helhetsintryck vilket jämfördes med originaldrycken. I den sensoriska analysen deltog 76 frivilliga personer. Resultat och diskussion Den dryck som ansågs vara mest lovande utifrån ett smaktest utfört tillsammans med handledaren, var baserad på ärtprotein i kombination med en ny fruktpuré som hade minskad mängd jordgubbar och ökad mängd banan. Till drycken sattes en blandning av 50 % äppelkoncentrat + 50 % limekoncentrat tills pH sjunkit till 4.3. Drycken innehöll 0.03 g NaCl/ 100 g dryck. 19.6 % av de deltagande kvinnorna samt 22.5 % av männen angav att de kunde tänka sig att köpa den nya drycken. En signifikant skillnad mellan dryckerna avseende på första intryck och smak konstaterades till originaldryckens fördel, medan färg gav en signifikant skillnad med fördel till den nya drycken. Slutsats Den nya vegetabiliska produkten med högt proteininnehåll har potential på dagens marknad. Dock kräver produkten mer utveckling för att kunna presentera en dryck som kan tillfredsställa fler individer inom målgruppen.

iv
Contents 1. Introduction ________________________________________________________ 1!
1.1. Aim ____________________________________________________________ 1!
2. Background ________________________________________________________ 2!2.1. Nutrition and the elderly ____________________________________________ 2!
2.1.1. Body changes _________________________________________________ 2!2.1.2. Recommendations _____________________________________________ 2!
2.2. Physical activity __________________________________________________ 3!2.2.1 Recommendations ______________________________________________ 3!
2.3. The product - Skaka & smaka ________________________________________ 4!2.3.1 Strawberry taste _______________________________________________ 4!2.3.2. Raspberry and blueberry taste ___________________________________ 5!
2.4. Protein sources ___________________________________________________ 5!2.4.1. Plant protein _________________________________________________ 5!
2.5. Protein properties _________________________________________________ 7!2.5.1. Solubility ____________________________________________________ 7!2.5.2. Emulsification ________________________________________________ 7!2.5.3. Viscosity _____________________________________________________ 7!2.5.4. Flavour binding _______________________________________________ 7!
2.6.!Analytical measurements ___________________________________________ 8!2.6.1.!Protein analyser _______________________________________________ 8!2.6.2.!Bomb calorimeter _____________________________________________ 8!
2.7. Sensory analysis __________________________________________________ 8!
3. Materials and Methods ______________________________________________ 10!3.1. Sample preparation _______________________________________________ 10!
3.1.1. Preparation of oat base (10 %) __________________________________ 10!3.1.2. Addition of protein to oat base __________________________________ 10!3.1.3. Preparation of fruit purée ______________________________________ 10!3.1.4. Development of the beverage Skaka & smaka – strawberry taste _______ 11!3.1.5. Development of the beverage Skaka & smaka – New tastes ____________ 13!
3.2. Analytical measurement ___________________________________________ 14!3.2.1. pH ________________________________________________________ 14!3.2.2. Dry matter __________________________________________________ 14!3.2.3. Viscosity ____________________________________________________ 14!3.2.4. Brix _______________________________________________________ 14!3.2.5. Freeze dryer _________________________________________________ 15!3.2.6. Protein analyser _____________________________________________ 15!3.2.7. Bomb calorimeter ____________________________________________ 15!
3.3. Sensory analysis _________________________________________________ 15!

v
3.4. Statistical analysis ________________________________________________ 16!
4. Results and Discussion ______________________________________________ 17!4.1. Adding protein to oat-base _________________________________________ 17!4.2. Development of the beverage Skaka & smaka – Strawberry taste ___________ 19!
4.2.1. Taste improvement ____________________________________________ 21!4.3. Final product ___________________________________________________ 30!4.4. Development of the beverage Skaka & smaka – New tastes _______________ 30!
4.4.1. “Havet” ____________________________________________________ 30!4.4.2. “Skogsbär” _________________________________________________ 30!
4.5. Sensory analysis and statistics ______________________________________ 30!4.5.1. First impression ______________________________________________ 31!4.5.2. Colour _____________________________________________________ 32!4.5.3. Odour ______________________________________________________ 33!4.5.4. Texture/ Mouth feel ___________________________________________ 34!4.5.5. Flavour ____________________________________________________ 35!4.5.6. Overall impression ___________________________________________ 37!
4.6. Discussion ______________________________________________________ 38!
5. Conclusion ________________________________________________________ 40!
References ___________________________________________________________ 41!
Appendixes ___________________________________________________________ I!Appendix A Results from Thermo Electroporation FLASH EA 1112 Series N/Protein analyser after analysing the protein content in solutions containing different protein sources. ____________________________________________________________ I!Appendix B Results from Thermo Electroporation FLASH EA 1112 Series N/Protein analyser after analysing the protein content in the beverages containing different protein sources. Value marked in red is deviant and allowed to be removed according to Grubbs test. _______________________________________________________ II!Appendix C Results from the instrument, Parr 6200 Calorimeter, from the analysis of energy content in the beverages. ________________________________________ III!Appendix D Questionnaire for sensory analysis at Gerdahallen, Lund 9-10/5 – 16 _ IV!Appendix E Information sheet for beverage during sensory analysis at Gerdahallen, Lund 9-10/5 – 16 __________________________________________________ VIII!Appendix F Statistical results from the ANOVAs made in MiniTab-16. _________ X!

1
1. Introduction Low protein intake is a relatively common problem among the older generation (1). One strategy to overcome this is via protein enrichment to foods and beverages. Aventure AB has developed a "between-meal beverage” with an extra addition of whey protein to increase protein and energy content. The beverage has been evaluated by elderly patients at various hospitals in Skåne, Sweden. However, the use of such a beverage needs not be limited to the elderly, and Aventure AB identified that physically active individuals could be another target group for this product (2). Vegetarian or vegan diets are among the fastest growing trends (3). Vegetarian diets are typically rich in fibre, folic acid, vitamins C and E, potassium, magnesium, phytochemicals and unsaturated fats. The vegan diets contain less saturated fat and cholesterol and more dietary fibre. These kinds of foods have been found to lower serum cholesterol levels and blood pressure, which is associated with a lower risk of cardiovascular diseases (4). To be able to reach this market segment too, Aventure AB wanted to develop a plant-based product that is still high in energy with a balance of all macronutrients, and a high protein content. 1.1. Aim The aim of this project was to replace the protein source in the beverage ”Skaka & smaka - strawberry taste”, and to maintain a good flavour and texture. The original beverage contains whey protein, which shall be replaced with a vegetable source.

2
2. Background 2.1. Nutrition and the elderly Of the elderly who live at a nursing home, up to 16 % exhibit protein and/or carbohydrate malnutrition. Up to 65 % of the elderly who are hospitalised suffer from malnutrition (1). With respect to the overall energy-malnutrition, up to 85 % of older age are affected in the long-term care (5). When suffering from malnutrition, the risk of illness, infections, depression, decreased body strength and mortality increases (6). 2.1.1. Body changes Different body changes, both physiological and mental, can be a reason to why malnutrition is more common among the elderly. Satiety may come faster during a meal with higher age (7). This can be due to a sensitive bowel which affects the levels of cholecystokinin (CCK) (8). CCK is a peptide hormone and is secreted when the food reaches duodenum, contributing to the sensation of satiety by signalling to the appetite-regulating centres of the brain (8). With ageing, the five sensory memories deteriorate, and up to 50 % of the older individuals have impaired sense of taste and smell. The two factors; increased feeling of satiety and impaired sensory senses - may contribute to a lower appetite (7). When ageing, the body composition is changed, see Figure 1. The amount of muscles will decrease while the amount of fat will increase, and this change is called sarcopenia (9). The muscle mass and bone density are inextricably linked to each other, which means; decreased muscle mass results and reduced bone density. Reduced bone density increases the risk for osteoporosis and bone fractures (10). The sarcopenia arises from hormonal changes but also from a combination of factors such as unbalanced, non-customised diets and sedentary living (11).
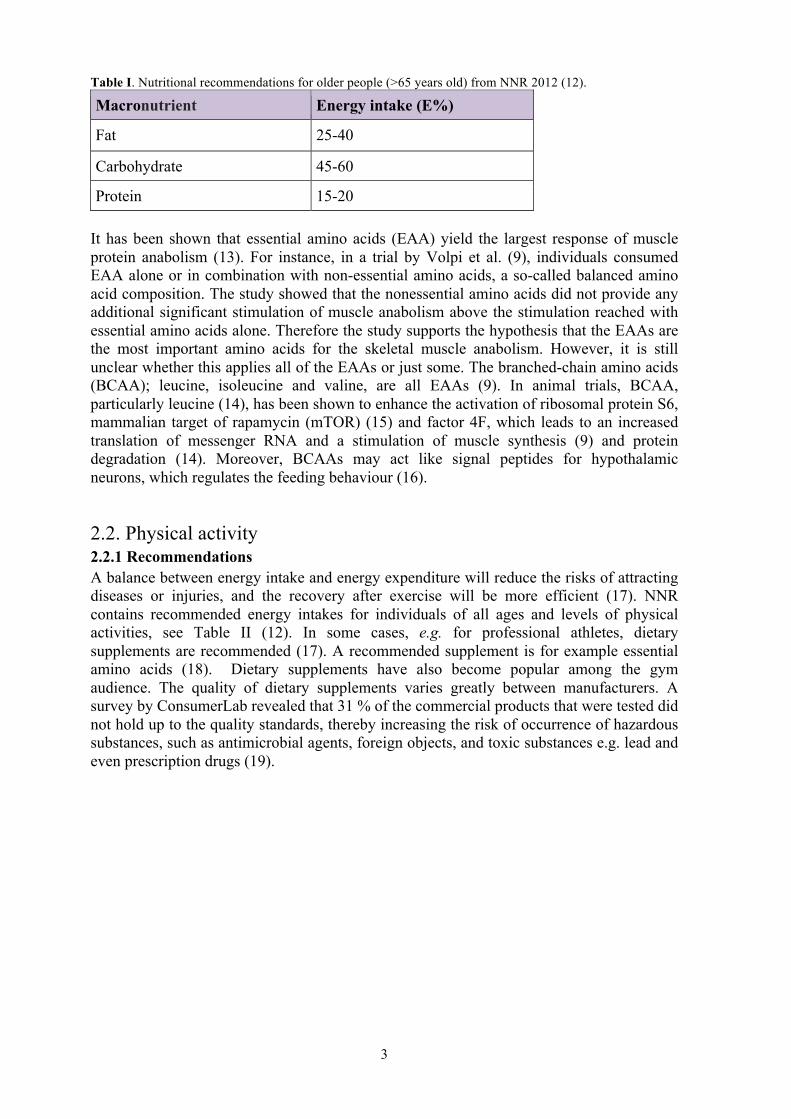
Figure 1. Changes in body composition between the age of 22 and 78, in percentage (%). The figure is used with permission from The Journal Nutrients and the authors Nowson, C and O´Connell, S. (10). 2.1.2. Recommendations The recommended distribution of intake of dietary macronutrients for individuals over 65 years old, according to the Nordic Nutrition Recommendations (NNR 2012), is shown in Table I. The recommended consumption of fats and carbohydrates is the same for older and for younger adults. However, the recommended protein intake is higher for the elderly. Younger adults are advised to consume 15 E% protein, while individuals 65 years and above are recommended to consume 18 E%. NNR 2012 also suggests reduced consumption of red meat and increased consumption of legumes and other protein-rich foods from the plant kingdom (12).
3
Table I. Nutritional recommendations for older people (>65 years old) from NNR 2012 (12).
Macronutrient Energy intake (E%)
Fat 25-40
Carbohydrate 45-60
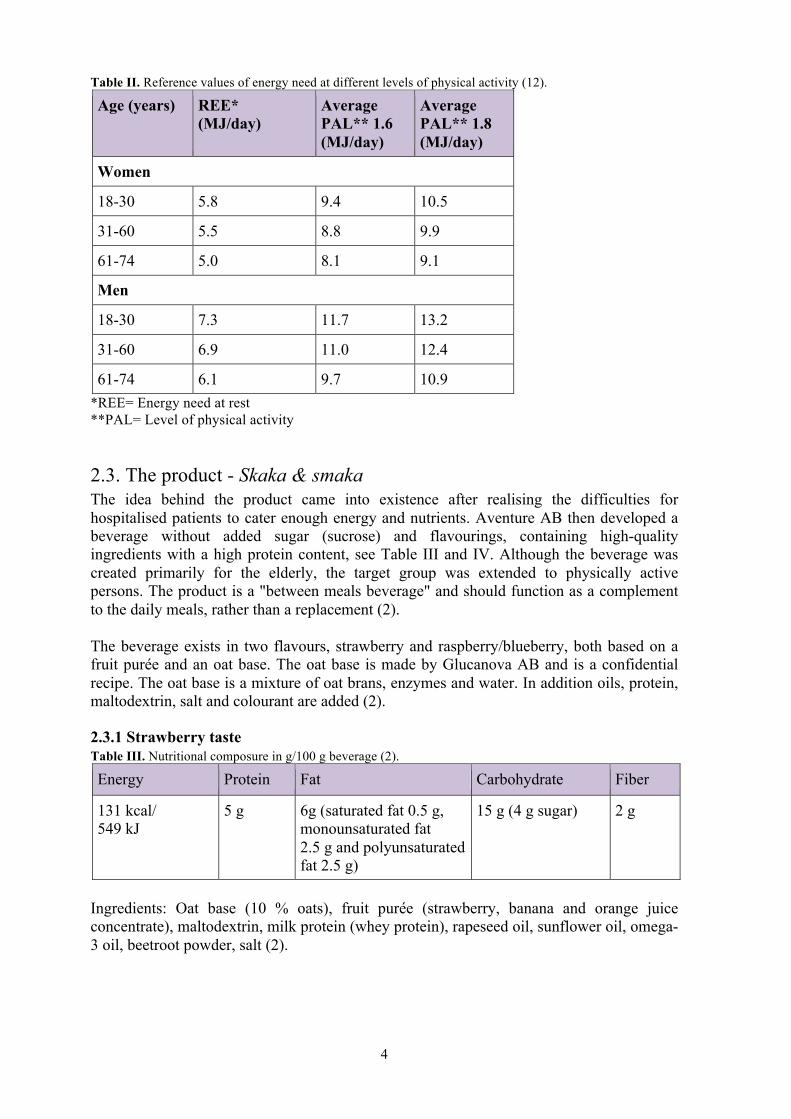
Protein 15-20 It has been shown that essential amino acids (EAA) yield the largest response of muscle protein anabolism (13). For instance, in a trial by Volpi et al. (9), individuals consumed EAA alone or in combination with non-essential amino acids, a so-called balanced amino acid composition. The study showed that the nonessential amino acids did not provide any additional significant stimulation of muscle anabolism above the stimulation reached with essential amino acids alone. Therefore the study supports the hypothesis that the EAAs are the most important amino acids for the skeletal muscle anabolism. However, it is still unclear whether this applies all of the EAAs or just some. The branched-chain amino acids (BCAA); leucine, isoleucine and valine, are all EAAs (9). In animal trials, BCAA, particularly leucine (14), has been shown to enhance the activation of ribosomal protein S6, mammalian target of rapamycin (mTOR) (15) and factor 4F, which leads to an increased translation of messenger RNA and a stimulation of muscle synthesis (9) and protein degradation (14). Moreover, BCAAs may act like signal peptides for hypothalamic neurons, which regulates the feeding behaviour (16). 2.2. Physical activity 2.2.1 Recommendations A balance between energy intake and energy expenditure will reduce the risks of attracting diseases or injuries, and the recovery after exercise will be more efficient (17). NNR contains recommended energy intakes for individuals of all ages and levels of physical activities, see Table II (12). In some cases, e.g. for professional athletes, dietary supplements are recommended (17). A recommended supplement is for example essential amino acids (18). Dietary supplements have also become popular among the gym audience. The quality of dietary supplements varies greatly between manufacturers. A survey by ConsumerLab revealed that 31 % of the commercial products that were tested did not hold up to the quality standards, thereby increasing the risk of occurrence of hazardous substances, such as antimicrobial agents, foreign objects, and toxic substances e.g. lead and even prescription drugs (19).
4
Table II. Reference values of energy need at different levels of physical activity (12).
Age (years) REE* (MJ/day)
Average PAL** 1.6 (MJ/day)
Average PAL** 1.8 (MJ/day)
Women
18-30 5.8 9.4 10.5
31-60 5.5 8.8 9.9
61-74 5.0 8.1 9.1
Men
18-30 7.3 11.7 13.2
31-60 6.9 11.0 12.4
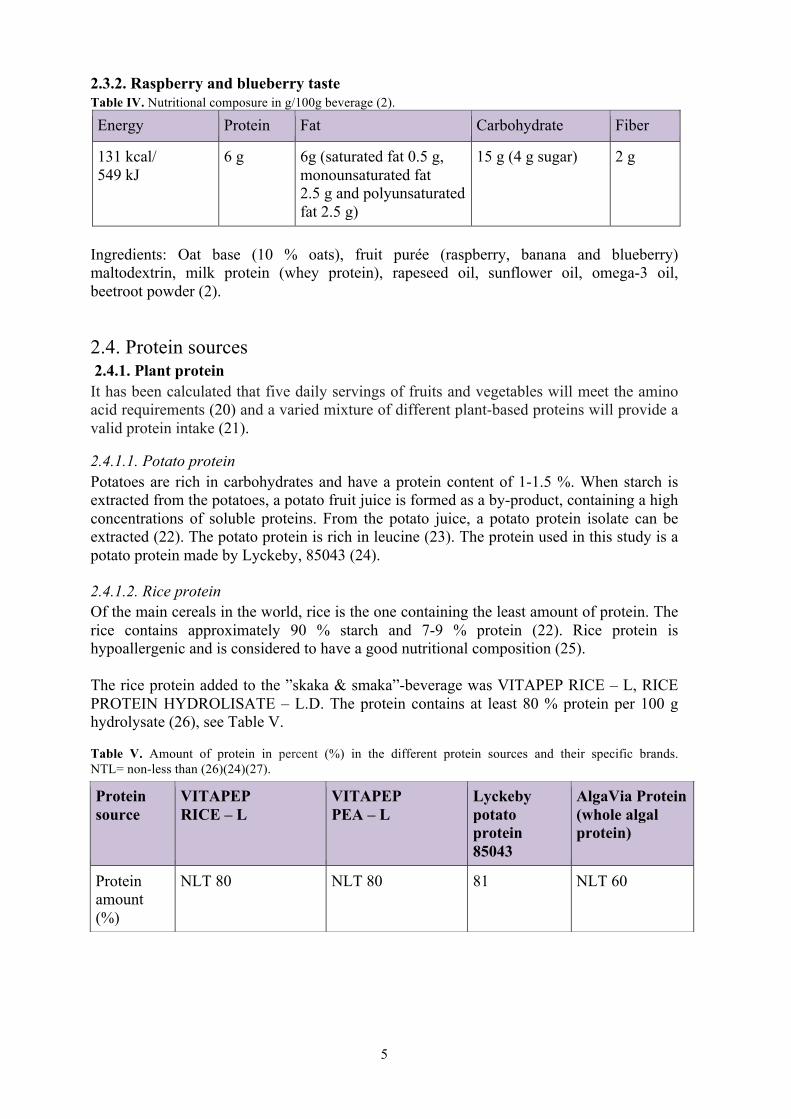
61-74 6.1 9.7 10.9 *REE= Energy need at rest **PAL= Level of physical activity 2.3. The product - Skaka & smaka The idea behind the product came into existence after realising the difficulties for hospitalised patients to cater enough energy and nutrients. Aventure AB then developed a beverage without added sugar (sucrose) and flavourings, containing high-quality ingredients with a high protein content, see Table III and IV. Although the beverage was created primarily for the elderly, the target group was extended to physically active persons. The product is a "between meals beverage" and should function as a complement to the daily meals, rather than a replacement (2). The beverage exists in two flavours, strawberry and raspberry/blueberry, both based on a fruit purée and an oat base. The oat base is made by Glucanova AB and is a confidential recipe. The oat base is a mixture of oat brans, enzymes and water. In addition oils, protein, maltodextrin, salt and colourant are added (2). 2.3.1 Strawberry taste Table III. Nutritional composure in g/100 g beverage (2).
Energy Protein Fat Carbohydrate Fiber
131 kcal/ 549 kJ
5 g 6g (saturated fat 0.5 g, monounsaturated fat 2.5 g and polyunsaturated fat 2.5 g)
15 g (4 g sugar) 2 g
Ingredients: Oat base (10 % oats), fruit purée (strawberry, banana and orange juice concentrate), maltodextrin, milk protein (whey protein), rapeseed oil, sunflower oil, omega-3 oil, beetroot powder, salt (2).
5
2.3.2. Raspberry and blueberry taste Table IV. Nutritional composure in g/100g beverage (2).
Energy Protein Fat Carbohydrate Fiber
131 kcal/ 549 kJ
6 g 6g (saturated fat 0.5 g, monounsaturated fat 2.5 g and polyunsaturated fat 2.5 g)
15 g (4 g sugar) 2 g
Ingredients: Oat base (10 % oats), fruit purée (raspberry, banana and blueberry) maltodextrin, milk protein (whey protein), rapeseed oil, sunflower oil, omega-3 oil, beetroot powder (2). 2.4. Protein sources 2.4.1. Plant protein It has been calculated that five daily servings of fruits and vegetables will meet the amino acid requirements (20) and a varied mixture of different plant-based proteins will provide a valid protein intake (21). 2.4.1.1. Potato protein Potatoes are rich in carbohydrates and have a protein content of 1-1.5 %. When starch is extracted from the potatoes, a potato fruit juice is formed as a by-product, containing a high concentrations of soluble proteins. From the potato juice, a potato protein isolate can be extracted (22). The potato protein is rich in leucine (23). The protein used in this study is a potato protein made by Lyckeby, 85043 (24). 2.4.1.2. Rice protein Of the main cereals in the world, rice is the one containing the least amount of protein. The rice contains approximately 90 % starch and 7-9 % protein (22). Rice protein is hypoallergenic and is considered to have a good nutritional composition (25). The rice protein added to the ”skaka & smaka”-beverage was VITAPEP RICE – L, RICE PROTEIN HYDROLISATE – L.D. The protein contains at least 80 % protein per 100 g hydrolysate (26), see Table V. Table V. Amount of protein in percent (%) in the different protein sources and their specific brands. NTL= non-less than (26)(24)(27).
Protein source
VITAPEP RICE – L
VITAPEP PEA – L
Lyckeby potato protein 85043
AlgaVia Protein (whole algal protein)
Protein amount (%)
NLT 80 NLT 80 81 NLT 60
6
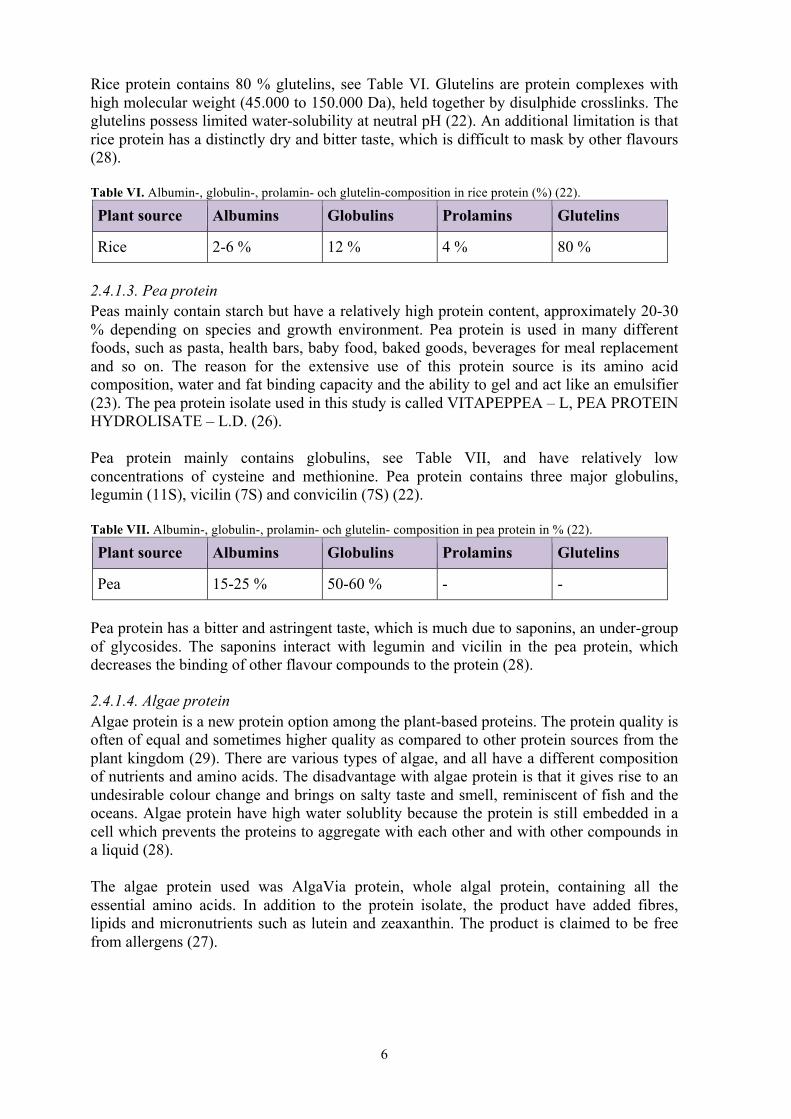
Rice protein contains 80 % glutelins, see Table VI. Glutelins are protein complexes with high molecular weight (45.000 to 150.000 Da), held together by disulphide crosslinks. The glutelins possess limited water-solubility at neutral pH (22). An additional limitation is that rice protein has a distinctly dry and bitter taste, which is difficult to mask by other flavours (28). Table VI. Albumin-, globulin-, prolamin- och glutelin-composition in rice protein (%) (22).
Plant source Albumins Globulins Prolamins Glutelins
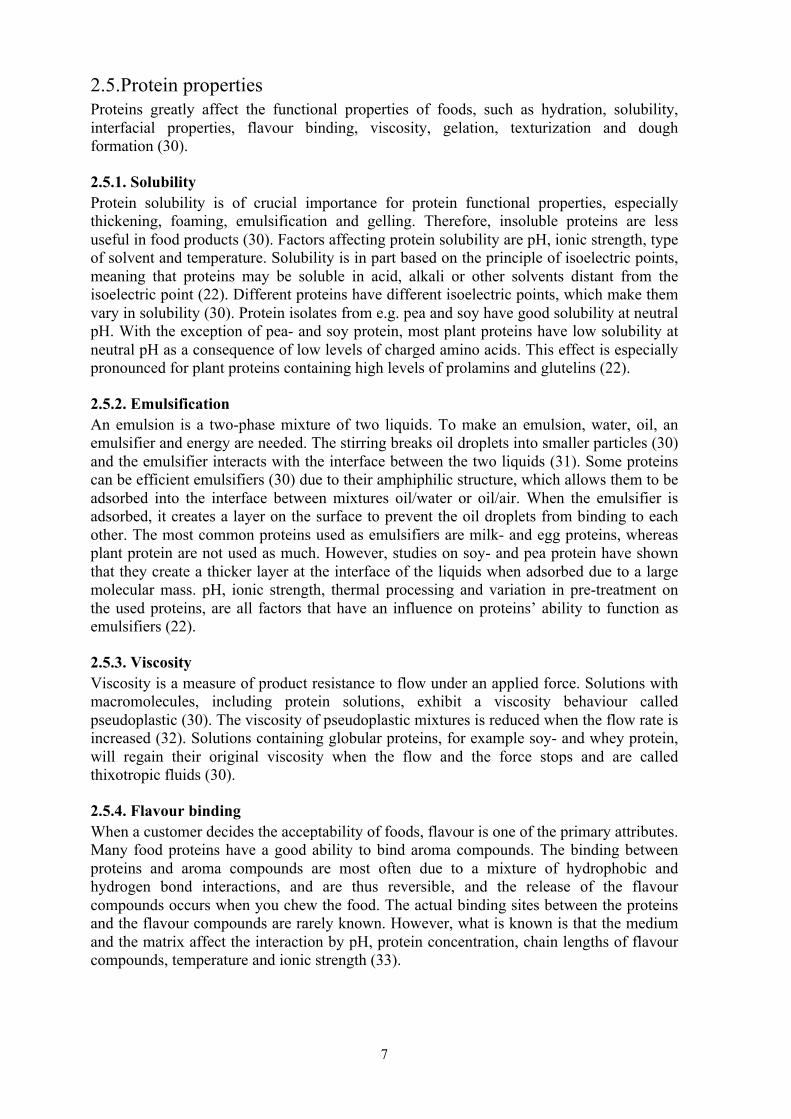
Rice 2-6 % 12 % 4 % 80 % 2.4.1.3. Pea protein Peas mainly contain starch but have a relatively high protein content, approximately 20-30 % depending on species and growth environment. Pea protein is used in many different foods, such as pasta, health bars, baby food, baked goods, beverages for meal replacement and so on. The reason for the extensive use of this protein source is its amino acid composition, water and fat binding capacity and the ability to gel and act like an emulsifier (23). The pea protein isolate used in this study is called VITAPEPPEA – L, PEA PROTEIN HYDROLISATE – L.D. (26). Pea protein mainly contains globulins, see Table VII, and have relatively low concentrations of cysteine and methionine. Pea protein contains three major globulins, legumin (11S), vicilin (7S) and convicilin (7S) (22). Table VII. Albumin-, globulin-, prolamin- och glutelin- composition in pea protein in % (22).
Plant source Albumins Globulins Prolamins Glutelins
Pea 15-25 % 50-60 % - - Pea protein has a bitter and astringent taste, which is much due to saponins, an under-group of glycosides. The saponins interact with legumin and vicilin in the pea protein, which decreases the binding of other flavour compounds to the protein (28). 2.4.1.4. Algae protein Algae protein is a new protein option among the plant-based proteins. The protein quality is often of equal and sometimes higher quality as compared to other protein sources from the plant kingdom (29). There are various types of algae, and all have a different composition of nutrients and amino acids. The disadvantage with algae protein is that it gives rise to an undesirable colour change and brings on salty taste and smell, reminiscent of fish and the oceans. Algae protein have high water solublity because the protein is still embedded in a cell which prevents the proteins to aggregate with each other and with other compounds in a liquid (28). The algae protein used was AlgaVia protein, whole algal protein, containing all the essential amino acids. In addition to the protein isolate, the product have added fibres, lipids and micronutrients such as lutein and zeaxanthin. The product is claimed to be free from allergens (27).
7
2.5.Protein properties Proteins greatly affect the functional properties of foods, such as hydration, solubility, interfacial properties, flavour binding, viscosity, gelation, texturization and dough formation (30). 2.5.1. Solubility Protein solubility is of crucial importance for protein functional properties, especially thickening, foaming, emulsification and gelling. Therefore, insoluble proteins are less useful in food products (30). Factors affecting protein solubility are pH, ionic strength, type of solvent and temperature. Solubility is in part based on the principle of isoelectric points, meaning that proteins may be soluble in acid, alkali or other solvents distant from the isoelectric point (22). Different proteins have different isoelectric points, which make them vary in solubility (30). Protein isolates from e.g. pea and soy have good solubility at neutral pH. With the exception of pea- and soy protein, most plant proteins have low solubility at neutral pH as a consequence of low levels of charged amino acids. This effect is especially pronounced for plant proteins containing high levels of prolamins and glutelins (22). 2.5.2. Emulsification An emulsion is a two-phase mixture of two liquids. To make an emulsion, water, oil, an emulsifier and energy are needed. The stirring breaks oil droplets into smaller particles (30) and the emulsifier interacts with the interface between the two liquids (31). Some proteins can be efficient emulsifiers (30) due to their amphiphilic structure, which allows them to be adsorbed into the interface between mixtures oil/water or oil/air. When the emulsifier is adsorbed, it creates a layer on the surface to prevent the oil droplets from binding to each other. The most common proteins used as emulsifiers are milk- and egg proteins, whereas plant protein are not used as much. However, studies on soy- and pea protein have shown that they create a thicker layer at the interface of the liquids when adsorbed due to a large molecular mass. pH, ionic strength, thermal processing and variation in pre-treatment on the used proteins, are all factors that have an influence on proteins’ ability to function as emulsifiers (22). 2.5.3. Viscosity Viscosity is a measure of product resistance to flow under an applied force. Solutions with macromolecules, including protein solutions, exhibit a viscosity behaviour called pseudoplastic (30). The viscosity of pseudoplastic mixtures is reduced when the flow rate is increased (32). Solutions containing globular proteins, for example soy- and whey protein, will regain their original viscosity when the flow and the force stops and are called thixotropic fluids (30). 2.5.4. Flavour binding When a customer decides the acceptability of foods, flavour is one of the primary attributes. Many food proteins have a good ability to bind aroma compounds. The binding between proteins and aroma compounds are most often due to a mixture of hydrophobic and hydrogen bond interactions, and are thus reversible, and the release of the flavour compounds occurs when you chew the food. The actual binding sites between the proteins and the flavour compounds are rarely known. However, what is known is that the medium and the matrix affect the interaction by pH, protein concentration, chain lengths of flavour compounds, temperature and ionic strength (33).
8
2.6. Analytical measurements 2.6.1. Protein analyser The protein content is usually analysed by quantifying the presence of nitrogen (N). The nitrogen is then converted it into protein content with the help of a conversion factor. A method suitable for automation and used in this work is called the Dumas method (34). With the help of gas chromatography, the released nitrogen can be quantified. Chromatography is a separation technology based on the distribution of a sample between a moving phase, called the mobile phase, and a stationary phase. Gas chromatography is a method using a column technique. The sample will be transported through the column by the mobile phase, which is a gas. The stationary phase is either an immobilized liquid or a solid packed tube and separates the compounds depending on their chemical and physical properties. Compound transport rate through the column will vary and at the end of the column the chemical compounds are detected (35). 2.6.2. Bomb calorimeter Bomb calorimetry is a commonly used method for analysing the energy content of foods. The underlying principle is the measurement of heat released from the complete combustion of organic substances into carbon dioxide and water using oxygen. The method uses a closed, insulated container which contains the food sample. The container is immersed in water within the calorimeter. When the sample is burned, the energy is released and create a temperature change in the water. The instrument notes the temperature change and along with Hess' Law, the energy content can be obtained (36). Hess' Law says that the change in enthalpy (ΔH) in a chemical reaction is independent of the reaction pathway between the reactants and the products (37). 2.7. Sensory analysis The type of analysis used to quantify the consumers’ preference or degree of liking or disliking a product is called affective analysis or consumer test. The analysis has the purpose to evaluate the response from the potential target group and should therefore be carried out by a relevant and representative group of individuals. This type of analysis differs from a descriptive analysis, which is performed by a trained test panel. The difference is that the consumers evaluate the product in its whole and do not go into specific details. The consumer test requires a larger sample size because of the high variability of individuals that may depend on personal background, experiences, culture, attitude and habits. The sample size should be around 70-150 individuals (38). During a consumer test, a 9-point hedonic scale is the most commonly used when rating the food samples. In a hedonic rating scale, the participants give their opinion by choosing one of nine alternatives that fit their opinion. Number one represents "strongly dislike" and 9 represents "strongly like". This type of scale is useful both for the participants because of its simplicity, but also for the evaluators as it allows numerically based conclusions (38). From the results of the sensory analysis the ANOVA test was used. ANOVA is a statistic technique used for comparing the means of different samples. The ANOVA tests a null hypothesis (H0), which is; there is no significant difference between the samples. The analysis had a 95 % confidence interval, which means that the p-value is smaller than 0.05, H0 will be rejected, and a significant difference between samples will be confirmed, when calculating the ANOVA (39).

9
Minitab-16 is a statistical program developed at the Pennsylvania State University, USA. Minitab-16 was used during this study to conduct the statistical analysis. From the results of the ANOVAs, box plots were created, see the box plot-construction in Figure 2 (39).
Figure 2. The figure illustrates the components of a default box plot.

10
3. Materials and Methods 3.1. Sample preparation 3.1.1. Preparation of oat base (10 %) To prepare the oat base, a commercial flour mix, called LWO (liquid whole oat) containing flour from oat bran and enzymes, from Glucanova AB, Lund Sweden was used. 100 g LWO was weighed out in a beaker at an OHAUS Pioneer™ weight scale. In a second beaker, 900 g water with a temperature of 65 °C was weighed out. The LWO and the water were mixed and stirred with a whisk until no lumps remained. The mixture was put in a 65 °C-water bath with an electrical stirrer for one hour. The mixture was then heated in a microwave oven until boiling. During the heating, the mixture was stirred 1-2 times with a spoon. After the mixture had been boiled, it was placed in an ice-bath until the temperature was lowered to 20 °C. The cold mixture was homogenised, and the pH, viscosity and dry matter were measured. The target value for pH was around 6.6, a viscosity of 15-25 cp (centipoints) and a dry matter of about 10 %. 3.1.2. Addition of protein to oat base Four different plant protein sources were selected for testing: potato protein, rice protein, pea protein and algae protein. The original beverage contains 5 g whey protein/100 g beverage, and therefore this concentration became the reference value for the upcoming experiments. In the experiments, 250 g scale was used. 237.5 g LWO was weighed out into four different beakers. The protein sources were weighed out to 12.5 g (5 g/100 g), also in four different beakers. Each protein source was mixed with the LWO, stirred together and then homogenised. pH, viscosity and dry matter were measured, and the tastes of the solutions were evaluated. The protein solutions were subsequently transferred to small beakers and stored in a fridge before preceding the trials. As the algae protein source has a lower protein content than the other three sources, see Table V, the amount was adjusted to normalise the protein content. The same routine was followed as before, but instead of using 5 g/100 g, 8.75 g/100 g of algae protein were added to the LWO. The protein solutions were freeze-dried, and the protein content was analysed to determine the actual value as compared to the theoretical one. 3.1.3. Preparation of fruit purée The target flavour used in this project was strawberry, from a fruit purée made from Swedish fruits and berries, see ingredients in Table VIII. The ingredients were weighed out in a beaker on an OHAUS Pioneer™ weight scale. The fruits were mixed with a stick blender and then homogenised. The fruit mixture was forced through a strainer to make a purée. pH and brix (the sugar content of an aqueous solution), was measured and then the purée was stored in a fridge. The pH was around 3.6 and the brix around 18 °Bx.
11
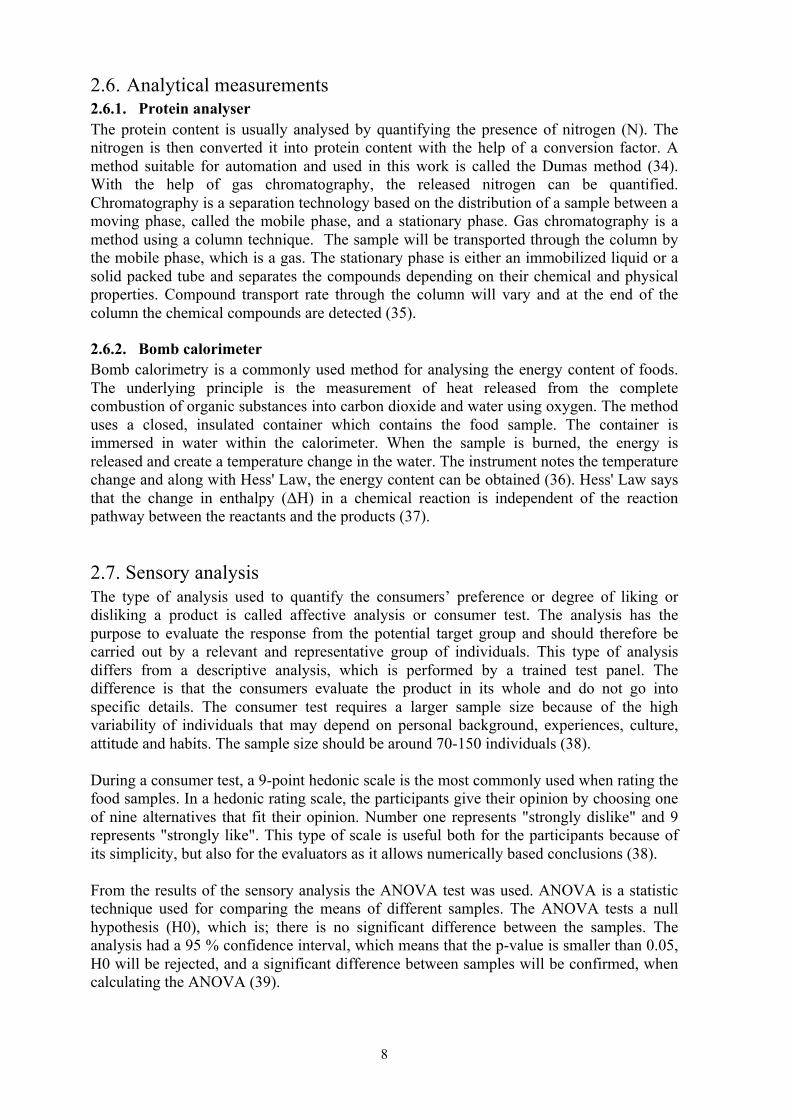
Table VIII. The distribution of ingredients in the Strawberry flavour-fruit purée.
Strawberry 67.3 %
Banana purée 22.4 %
Orange juice 10.3 %
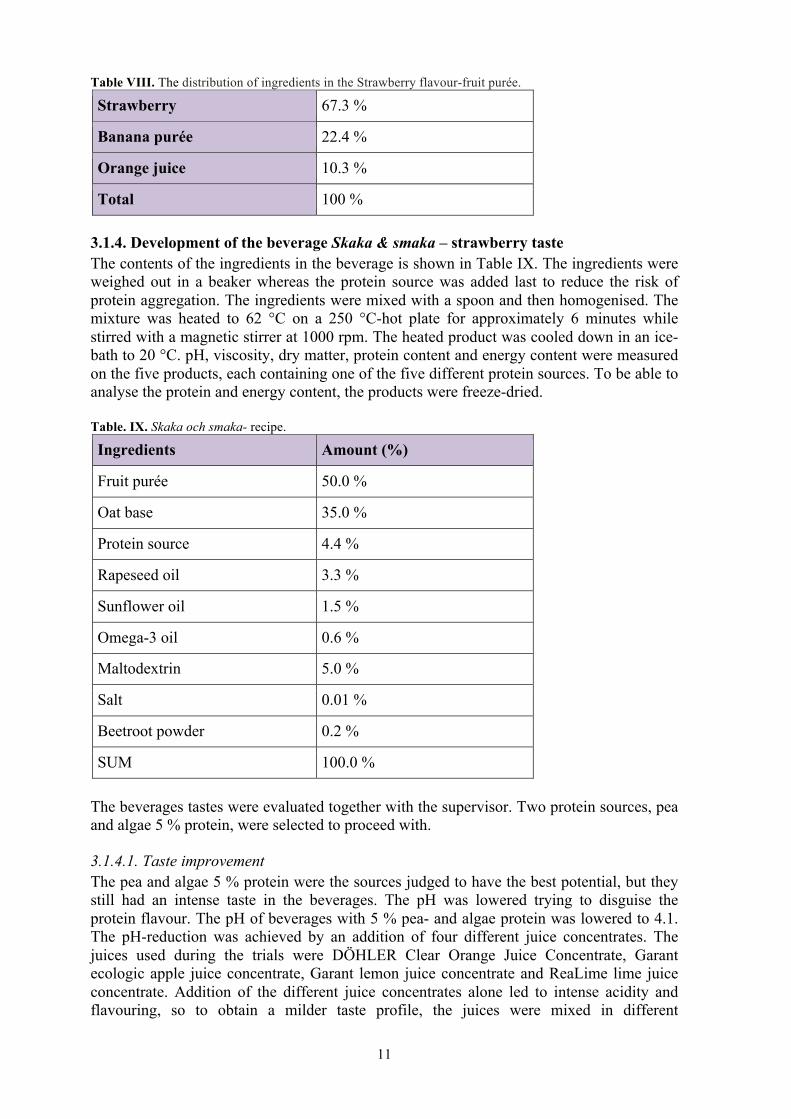
Total 100 % 3.1.4. Development of the beverage Skaka & smaka – strawberry taste The contents of the ingredients in the beverage is shown in Table IX. The ingredients were weighed out in a beaker whereas the protein source was added last to reduce the risk of protein aggregation. The ingredients were mixed with a spoon and then homogenised. The mixture was heated to 62 °C on a 250 °C-hot plate for approximately 6 minutes while stirred with a magnetic stirrer at 1000 rpm. The heated product was cooled down in an ice-bath to 20 °C. pH, viscosity, dry matter, protein content and energy content were measured on the five products, each containing one of the five different protein sources. To be able to analyse the protein and energy content, the products were freeze-dried. Table. IX. Skaka och smaka- recipe.
Ingredients Amount (%)
Fruit purée 50.0 %
Oat base 35.0 %
Protein source 4.4 %
Rapeseed oil 3.3 %
Sunflower oil 1.5 %
Omega-3 oil 0.6 %
Maltodextrin 5.0 %
Salt 0.01 %
Beetroot powder 0.2 %
SUM 100.0 % The beverages tastes were evaluated together with the supervisor. Two protein sources, pea and algae 5 % protein, were selected to proceed with. 3.1.4.1. Taste improvement The pea and algae 5 % protein were the sources judged to have the best potential, but they still had an intense taste in the beverages. The pH was lowered trying to disguise the protein flavour. The pH of beverages with 5 % pea- and algae protein was lowered to 4.1. The pH-reduction was achieved by an addition of four different juice concentrates. The juices used during the trials were DÖHLER Clear Orange Juice Concentrate, Garant ecologic apple juice concentrate, Garant lemon juice concentrate and ReaLime lime juice concentrate. Addition of the different juice concentrates alone led to intense acidity and flavouring, so to obtain a milder taste profile, the juices were mixed in different
12
combinations and concentrations and prior to their addition to the beverages. The first mixture contained 50 % lime + 50 % lemon, and the second mixture contained 50 % lime + 50 % orange. After adding the juice combinations to the two beverages the taste was evaluated. After the evaluation, two new juice mixtures were created. To the beverage with pea protein, 33.3 % lime- + 33.3 % lemon- + 33.3 % apple concentrate was added. To the algae protein 5 %, a mixture of 33.3% lime- + 33.3% orange- + 33.3 % apple concentrate was added. The algae protein 5 % was excluded from the trials and the reference pH was changed from 4.1 to 4.3, as the beverage with pea protein had a higher pH (4.5) in itself, as compared to the beverage with the algae protein (pH 4.2). A decreased amount of the juice mixtures was required to lower the pH and perhaps maintain a strawberry flavour in the beverage, without a dominating juice flavour. The experiments to mix different juices were continued. To the beverage with pea protein, two new combinations of juice concentrates were created, added and tasted. The first combination contained 25 % lemon concentrate + 25 % lime concentrate + 50 % apple concentrate. The second combination contained 25 % lime concentrate + 75 % apple concentrate. The salt content of the beverage was increased from 0.01 g to 0.02 g/100 g. Even when the reference pH was increased, the strawberry flavour was reduced when adding the juice mixtures. Therefore, three different aromas were added. The aromas were added along with the two new juice combinations and added with the other ingredients before homogenisation and heating. The aromas that were used were: GivaudanCollections Strawberry 0.2 % (liquid), Stringer Flavours Strawberry 0.5 % (liquid) and Symrise strawberry flavour 0.2 % (powder). The taste of the beverages were evaluated, and two of the aromas were removed from the trial; GivaudanCollections Strawberry 0.2 % (liquid) and Stringer Flavours Strawberry 0.5 % (liquid). The salt concentration was changed from 0.02 g to 0.04 g/100 g. A new concentration of the Symrise strawberry flavour (powder) was tried. The concentration was increased from 0.2 % to 0.4 %. The increased aroma concentration was added to the beverage along with a new juice mixture containing 50 % lime- + 50 % apple concentrate. The aromas were not as expected and therefore two new ones, GivaudanCollections Modifier Flavour 0.1 % and Symrise strawberry flavour 0.2 % (liquid), were introduced. Besides adding the aromas alone, a mixture of the GivaudanCollections Modifier Flavour 0.1 % and the Symrise strawberry flavour 0.2 % was evaluated. The previous increase of the salt was found to be too high, and it was thus reduced to 0.03 g/100 g. The aromas did not give the expected effect, so to enhance the strawberry flavour, the fruit purée-recipe was modified. The new recipe is shown in Table X and includes more bananas and less strawberries.

13
Table X. Ingredients in the first modified Strawberry flavour-fruit purée.
Strawberry 64.3 %
Banana purée 25.4 %
Orange juice 10.3 %
Total 100 % The fruit purée-recipe was modified once more, see the recipe in Table XI. The second modification includes more bananas and less strawberries. The salt concentration and the juice mixture was maintained as before. Table XI. Ingredients in the second modified Strawberry flavour-fruit purée.
Strawberry 61.3 %
Banana purée 28.4 %
Orange juice 10.3 %
Total 100 % 3.1.5. Development of the beverage Skaka & smaka – New tastes 3.1.5.1. “Havet” "Havet" is a new beverage flavour inspired by the ocean and the tropics, see the fruit purée-recipe in Table XII. The development of this flavour is a project of Evangelia Mitsou, an international master student in food technology and nutrition at Kemicentrum, Lund University. The new purée flavour, which is still under development, was tested along with the beverage containing the plant-based proteins, pea- and algae 5 % protein. The beverage was based on the same recipe as the strawberry flavour, see Table IX, except for the exclusion of beetroot powder. Table XII. The distribution of ingredients in the ”Havet”-fruit purée.
Mango purée 22.78 %
Sea buckthorn purée 9.29 %
Banana purée 6.7 %
Apple juice concentrate 4.47 %
Water 1.34 %
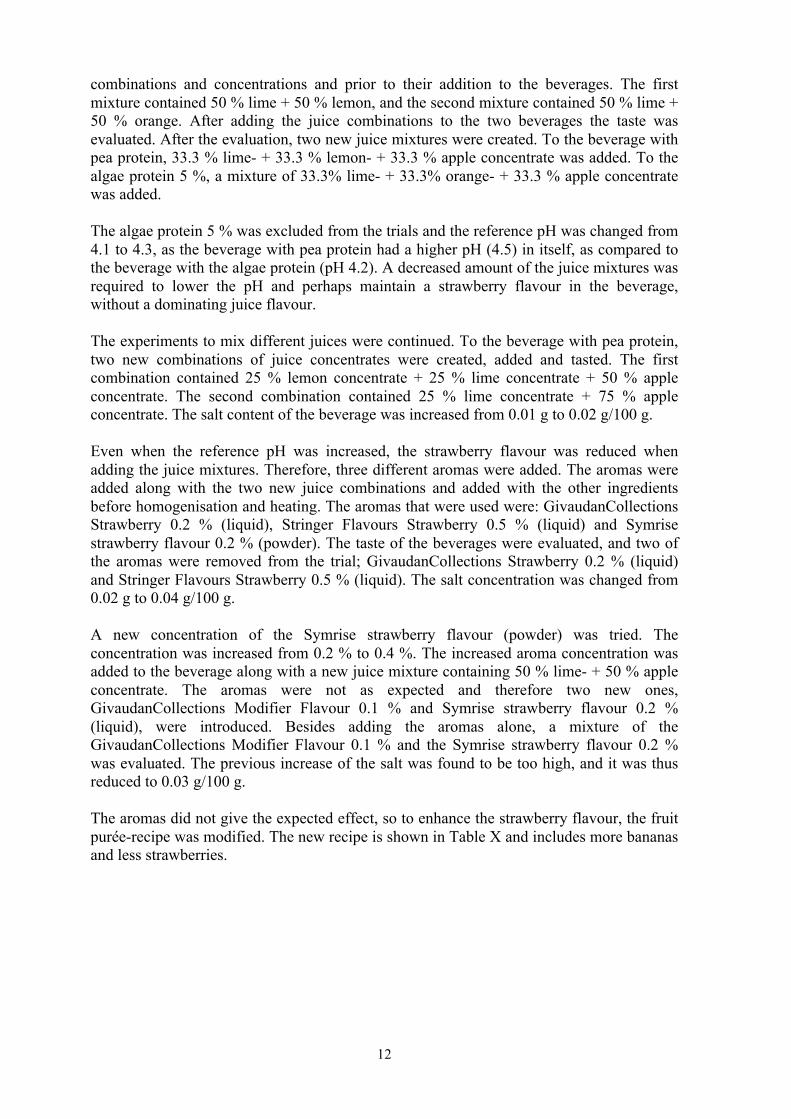
Total 100 % 3.1.5.2. “Skogsbär” "Skogsbär" is a new flavour that is inspired by the forest, see composition in Table XIII. The development of this flavour is also a work of Evangelia Mitsou. A beverage based on the "skogsbär"-purée along with pea protein and algae 5 % protein was made and evaluated. The same recipe was used as for the strawberry flavour, see Table IX.
14
Table XIII. The distribution of ingredients in the ”Skogsbär”-fruit purée. Blackcurrant 16 %
Blackberry 21.4 %
Lingonberry 44.4 %
Banana purée 16 %
Lime juice concentrate 2.2 %
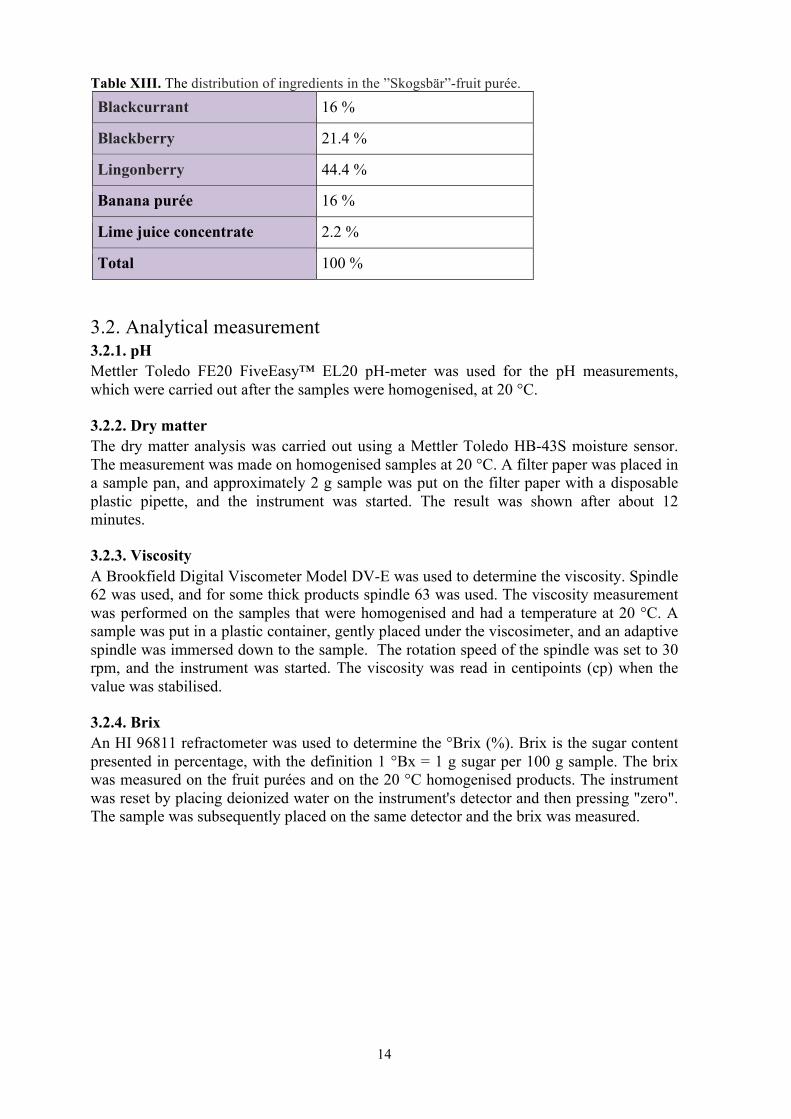
Total 100 % 3.2. Analytical measurement 3.2.1. pH Mettler Toledo FE20 FiveEasy™ EL20 pH-meter was used for the pH measurements, which were carried out after the samples were homogenised, at 20 °C. 3.2.2. Dry matter The dry matter analysis was carried out using a Mettler Toledo HB-43S moisture sensor. The measurement was made on homogenised samples at 20 °C. A filter paper was placed in a sample pan, and approximately 2 g sample was put on the filter paper with a disposable plastic pipette, and the instrument was started. The result was shown after about 12 minutes.
3.2.3. Viscosity A Brookfield Digital Viscometer Model DV-E was used to determine the viscosity. Spindle 62 was used, and for some thick products spindle 63 was used. The viscosity measurement was performed on the samples that were homogenised and had a temperature at 20 °C. A sample was put in a plastic container, gently placed under the viscosimeter, and an adaptive spindle was immersed down to the sample. The rotation speed of the spindle was set to 30 rpm, and the instrument was started. The viscosity was read in centipoints (cp) when the value was stabilised. 3.2.4. Brix An HI 96811 refractometer was used to determine the °Brix (%). Brix is the sugar content presented in percentage, with the definition 1 °Bx = 1 g sugar per 100 g sample. The brix was measured on the fruit purées and on the 20 °C homogenised products. The instrument was reset by placing deionized water on the instrument's detector and then pressing "zero". The sample was subsequently placed on the same detector and the brix was measured.
15
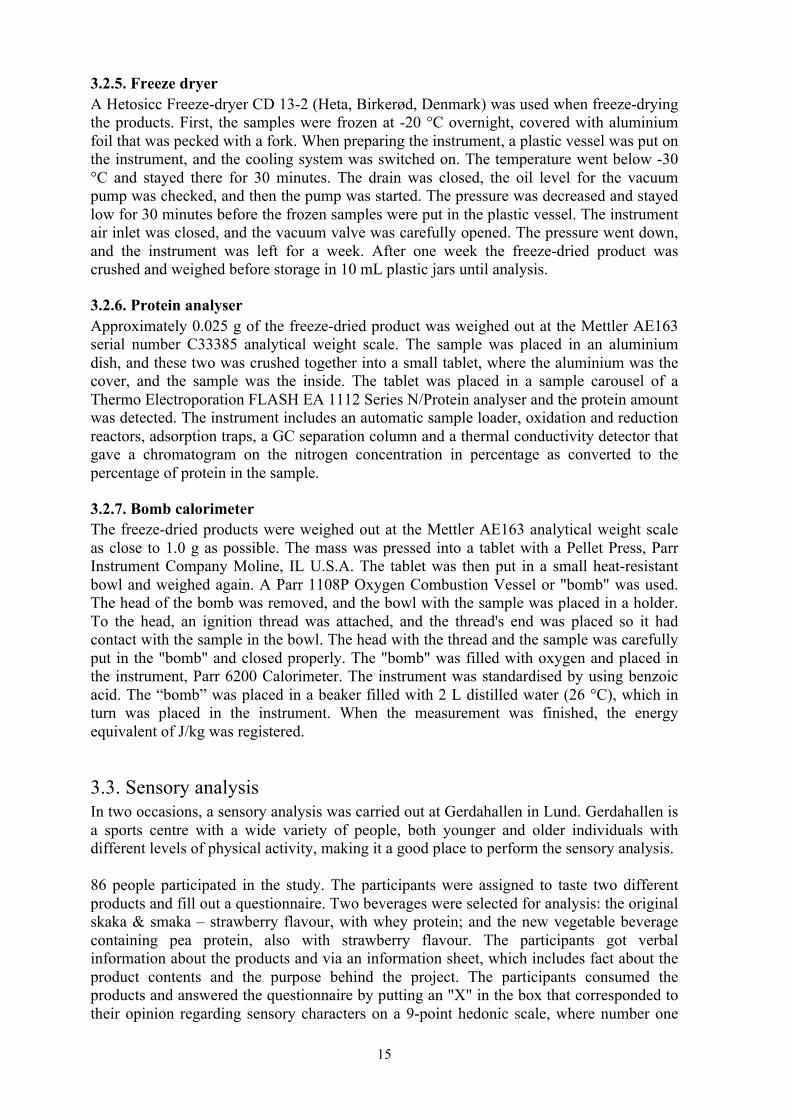
3.2.5. Freeze dryer A Hetosicc Freeze-dryer CD 13-2 (Heta, Birkerød, Denmark) was used when freeze-drying the products. First, the samples were frozen at -20 °C overnight, covered with aluminium foil that was pecked with a fork. When preparing the instrument, a plastic vessel was put on the instrument, and the cooling system was switched on. The temperature went below -30 °C and stayed there for 30 minutes. The drain was closed, the oil level for the vacuum pump was checked, and then the pump was started. The pressure was decreased and stayed low for 30 minutes before the frozen samples were put in the plastic vessel. The instrument air inlet was closed, and the vacuum valve was carefully opened. The pressure went down, and the instrument was left for a week. After one week the freeze-dried product was crushed and weighed before storage in 10 mL plastic jars until analysis. 3.2.6. Protein analyser Approximately 0.025 g of the freeze-dried product was weighed out at the Mettler AE163 serial number C33385 analytical weight scale. The sample was placed in an aluminium dish, and these two was crushed together into a small tablet, where the aluminium was the cover, and the sample was the inside. The tablet was placed in a sample carousel of a Thermo Electroporation FLASH EA 1112 Series N/Protein analyser and the protein amount was detected. The instrument includes an automatic sample loader, oxidation and reduction reactors, adsorption traps, a GC separation column and a thermal conductivity detector that gave a chromatogram on the nitrogen concentration in percentage as converted to the percentage of protein in the sample. 3.2.7. Bomb calorimeter The freeze-dried products were weighed out at the Mettler AE163 analytical weight scale as close to 1.0 g as possible. The mass was pressed into a tablet with a Pellet Press, Parr Instrument Company Moline, IL U.S.A. The tablet was then put in a small heat-resistant bowl and weighed again. A Parr 1108P Oxygen Combustion Vessel or "bomb" was used. The head of the bomb was removed, and the bowl with the sample was placed in a holder. To the head, an ignition thread was attached, and the thread's end was placed so it had contact with the sample in the bowl. The head with the thread and the sample was carefully put in the "bomb" and closed properly. The "bomb" was filled with oxygen and placed in the instrument, Parr 6200 Calorimeter. The instrument was standardised by using benzoic acid. The “bomb” was placed in a beaker filled with 2 L distilled water (26 °C), which in turn was placed in the instrument. When the measurement was finished, the energy equivalent of J/kg was registered. 3.3. Sensory analysis In two occasions, a sensory analysis was carried out at Gerdahallen in Lund. Gerdahallen is a sports centre with a wide variety of people, both younger and older individuals with different levels of physical activity, making it a good place to perform the sensory analysis. 86 people participated in the study. The participants were assigned to taste two different products and fill out a questionnaire. Two beverages were selected for analysis: the original skaka & smaka – strawberry flavour, with whey protein; and the new vegetable beverage containing pea protein, also with strawberry flavour. The participants got verbal information about the products and via an information sheet, which includes fact about the product contents and the purpose behind the project. The participants consumed the products and answered the questionnaire by putting an "X" in the box that corresponded to their opinion regarding sensory characters on a 9-point hedonic scale, where number one
16
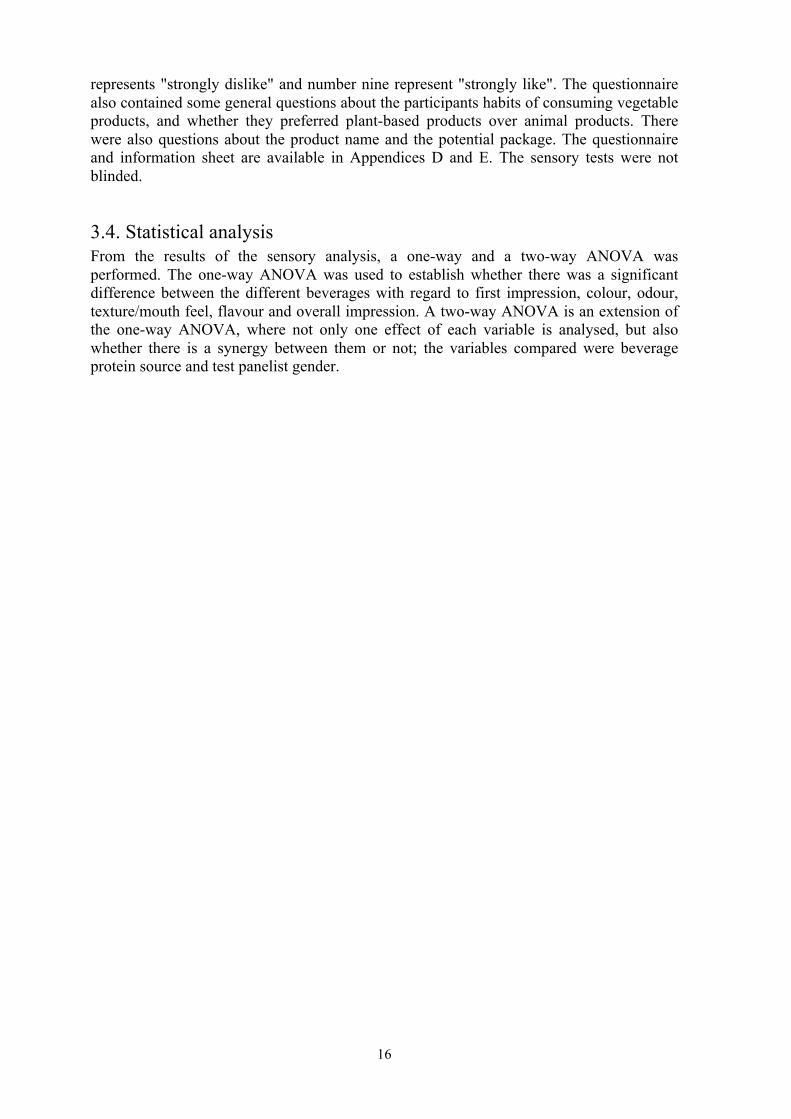
represents "strongly dislike" and number nine represent "strongly like". The questionnaire also contained some general questions about the participants habits of consuming vegetable products, and whether they preferred plant-based products over animal products. There were also questions about the product name and the potential package. The questionnaire and information sheet are available in Appendices D and E. The sensory tests were not blinded. 3.4. Statistical analysis From the results of the sensory analysis, a one-way and a two-way ANOVA was performed. The one-way ANOVA was used to establish whether there was a significant difference between the different beverages with regard to first impression, colour, odour, texture/mouth feel, flavour and overall impression. A two-way ANOVA is an extension of the one-way ANOVA, where not only one effect of each variable is analysed, but also whether there is a synergy between them or not; the variables compared were beverage protein source and test panelist gender.
17
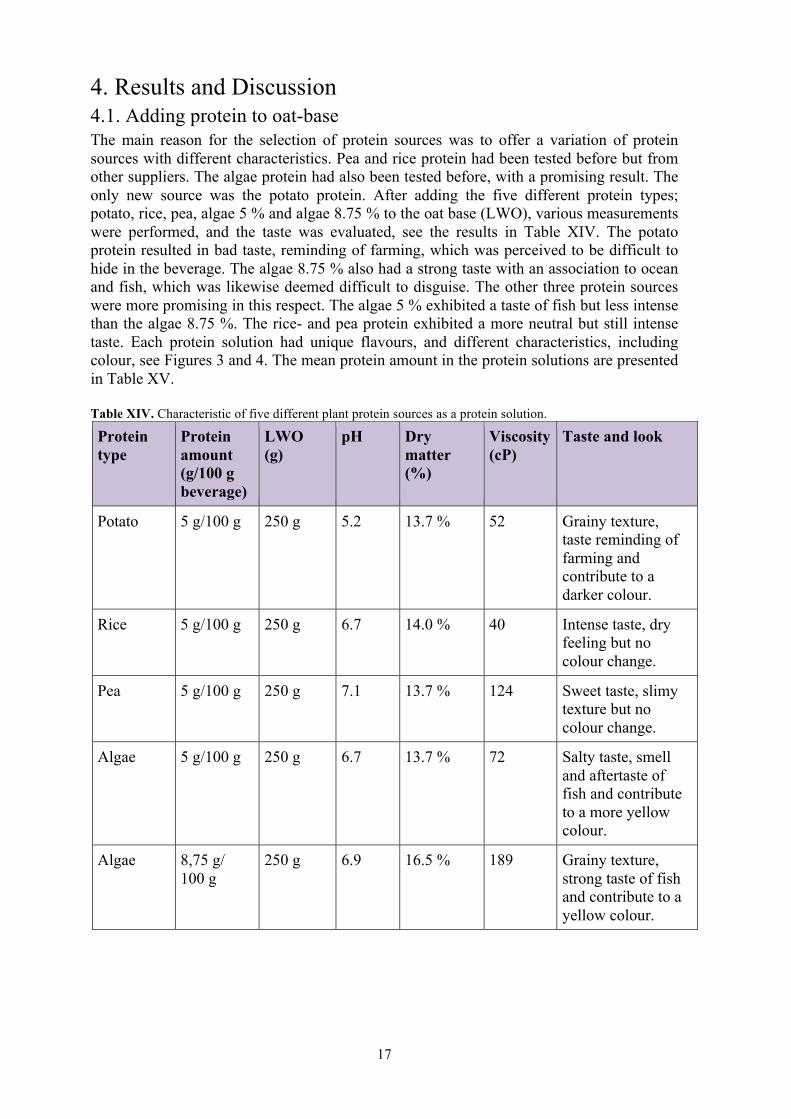
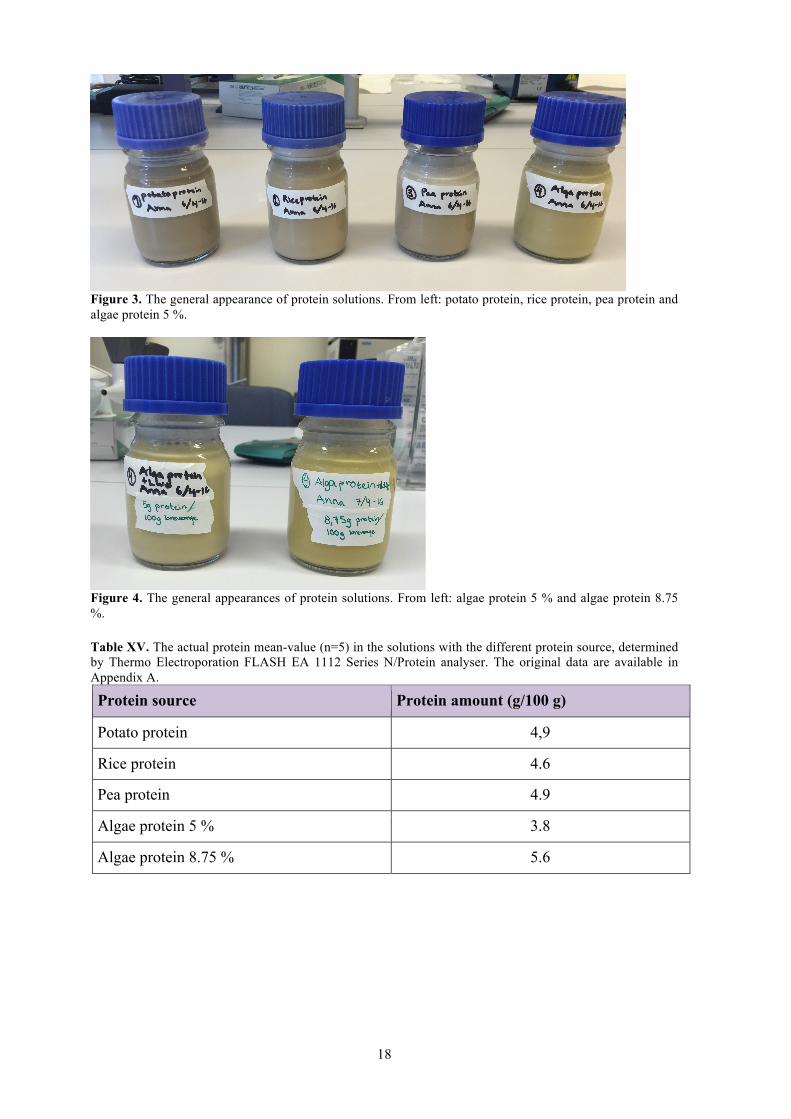
4. Results and Discussion 4.1. Adding protein to oat-base The main reason for the selection of protein sources was to offer a variation of protein sources with different characteristics. Pea and rice protein had been tested before but from other suppliers. The algae protein had also been tested before, with a promising result. The only new source was the potato protein. After adding the five different protein types; potato, rice, pea, algae 5 % and algae 8.75 % to the oat base (LWO), various measurements were performed, and the taste was evaluated, see the results in Table XIV. The potato protein resulted in bad taste, reminding of farming, which was perceived to be difficult to hide in the beverage. The algae 8.75 % also had a strong taste with an association to ocean and fish, which was likewise deemed difficult to disguise. The other three protein sources were more promising in this respect. The algae 5 % exhibited a taste of fish but less intense than the algae 8.75 %. The rice- and pea protein exhibited a more neutral but still intense taste. Each protein solution had unique flavours, and different characteristics, including colour, see Figures 3 and 4. The mean protein amount in the protein solutions are presented in Table XV. Table XIV. Characteristic of five different plant protein sources as a protein solution.
Protein type
Protein amount (g/100 g beverage)
LWO (g)
pH Dry matter (%)
Viscosity (cP)
Taste and look
Potato 5 g/100 g 250 g 5.2 13.7 % 52 Grainy texture, taste reminding of farming and contribute to a darker colour.
Rice 5 g/100 g 250 g 6.7 14.0 % 40 Intense taste, dry feeling but no colour change.
Pea 5 g/100 g 250 g 7.1 13.7 % 124 Sweet taste, slimy texture but no colour change.
Algae 5 g/100 g 250 g 6.7 13.7 % 72 Salty taste, smell and aftertaste of fish and contribute to a more yellow colour.
Algae 8,75 g/ 100 g
250 g 6.9 16.5 % 189 Grainy texture, strong taste of fish and contribute to a yellow colour.
18
Figure 3. The general appearance of protein solutions. From left: potato protein, rice protein, pea protein and algae protein 5 %.
Figure 4. The general appearances of protein solutions. From left: algae protein 5 % and algae protein 8.75 %. Table XV. The actual protein mean-value (n=5) in the solutions with the different protein source, determined by Thermo Electroporation FLASH EA 1112 Series N/Protein analyser. The original data are available in Appendix A.
Protein source Protein amount (g/100 g)
Potato protein 4,9
Rice protein 4.6
Pea protein 4.9
Algae protein 5 % 3.8
Algae protein 8.75 % 5.6

19
4.2. Development of the beverage Skaka & smaka – Strawberry taste The five proteins sources were added to the respective beverages. pH, dry matter and viscosity were measured, and the taste of the product was evaluated, see the results in Table XVI. A major problem of using plants protein in this context is its intense flavour profile, which was found difficult to disguise. The potato protein and algae protein 8.75 % gave the strongest and most distinctive protein taste, just as in the protein solutions. The rice protein also gave a strong protein taste, which overshadowed the original beverage flavour. The two remaining protein sources, pea protein and algae protein 5 %, gave a noticeable protein taste, although it did not override the original berry flavour of the beverage. The appearance of the beverages with the different protein sources are shown in Figure 5. They all exhibited nice red, strawberry colour but in different shades. The algae protein and potato protein had a more yellow-red colour, while rice and pea protein had a more pinkish-red tone. Table XVI. Characteristics of different plant protein sources used in the development of the beverage.
Protein source pH Dry matter (%) Viscosity (cP) Taste and look
Potato protein 4.0 27,3 979 Dark colour, grainy texture
and strong protein taste.
Rice protein 4.4 26,9 688 Strong protein taste.
Pea protein 4.6 26,7 1154 More strawberry taste than
protein taste.
Algae protein 5 % 4.3 27,3 860 Strawberry taste but had a protein (fish) aftertaste
and smell. Contribute to a more yellow
colour.
Algae protein 8.75 % 4.5 30,9 1678 Strong protein (fish) taste, after taste and smell. Contribute to a yellow colour.

20
Figure 5. The appearances of the beverages with different plant protein sources. From the left: Potato protein, rice protein, pea protein, algae protein 5 % and algae protein 8.75 %. The amount of protein in the completed beverages was analysed. The theoretical protein content was the same as for the protein solution, 5 g/100 g besides algae protein 8.75 %, where 8.75 g were added. The actual mean protein contents are presented in Table XVII. The actual protein content differs with approximately 1 g/100 g from the theoretical protein content. This small reduction may be due to the heating of the product. If the final product should contain 5 g protein/100 g beverage, more protein would need to be added to compensate for the protein loss. Table XVII. The actual protein mean-value (n=5) in the beverage with the different protein source, determined by Thermo Electroporation FLASH EA 1112 Series N/Protein analyser.
Protein source Protein amount (g/100 g)
Potato protein 4.4
Rice protein 3.9
Pea protein 4.1
Algae protein 5 % 3.2
Algae protein 8.75 % 5.4 In addition to the protein analysis, the energy amount was analysed. The original product has an energy value of 131 kcal/100 g beverage. Measurements of the new beverages showed energy contents between 162-168 kcal/100 g beverage, depending on the protein source, with an exception for algae protein 8.75%: 187 kcal/100 g beverage. The results of the mean energy in the beverage with the different protein sources are shown in Table XVIII. The increased energy content is likely due to the modified fruit purée with increased amount of banana purée.

21
Table XVIII. Mean energy value (n=3) (kcal) in the beverage with different protein sources. The original data are available in Appendix C.
Protein source Energy (kcal/100 g beverage)
Potato protein 168
Rice protein 168
Pea protein 162
Algae protein 5 % 165
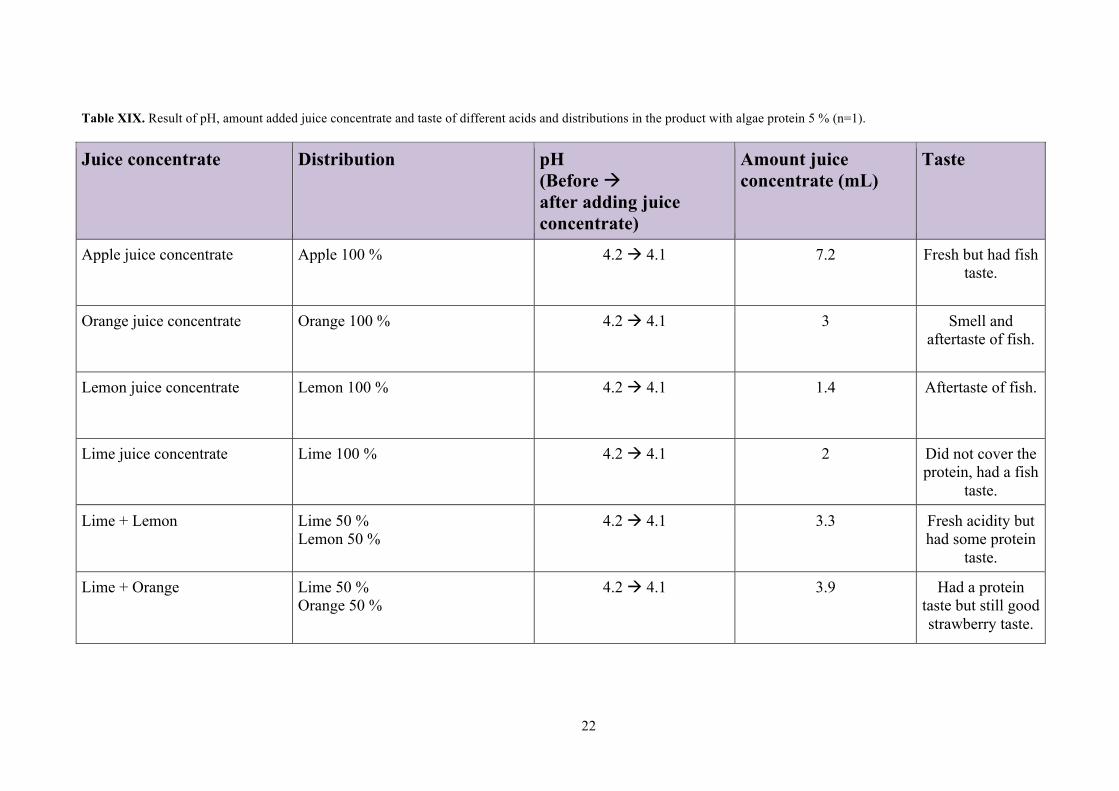
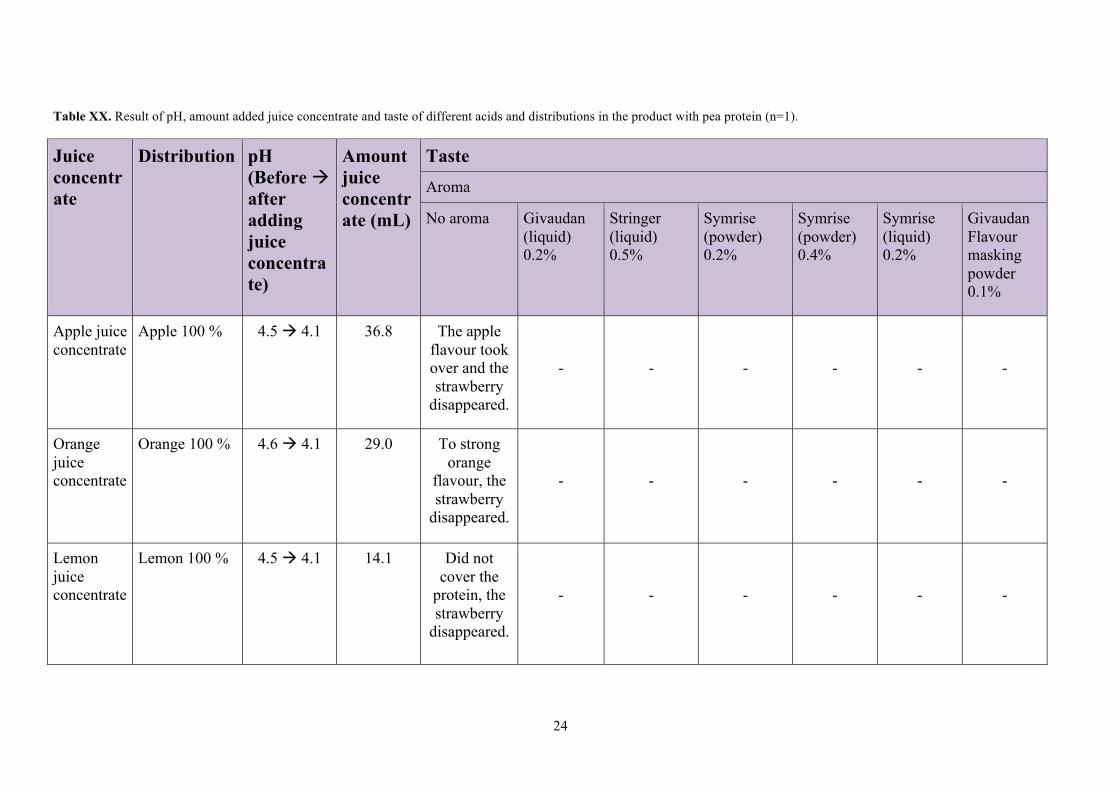
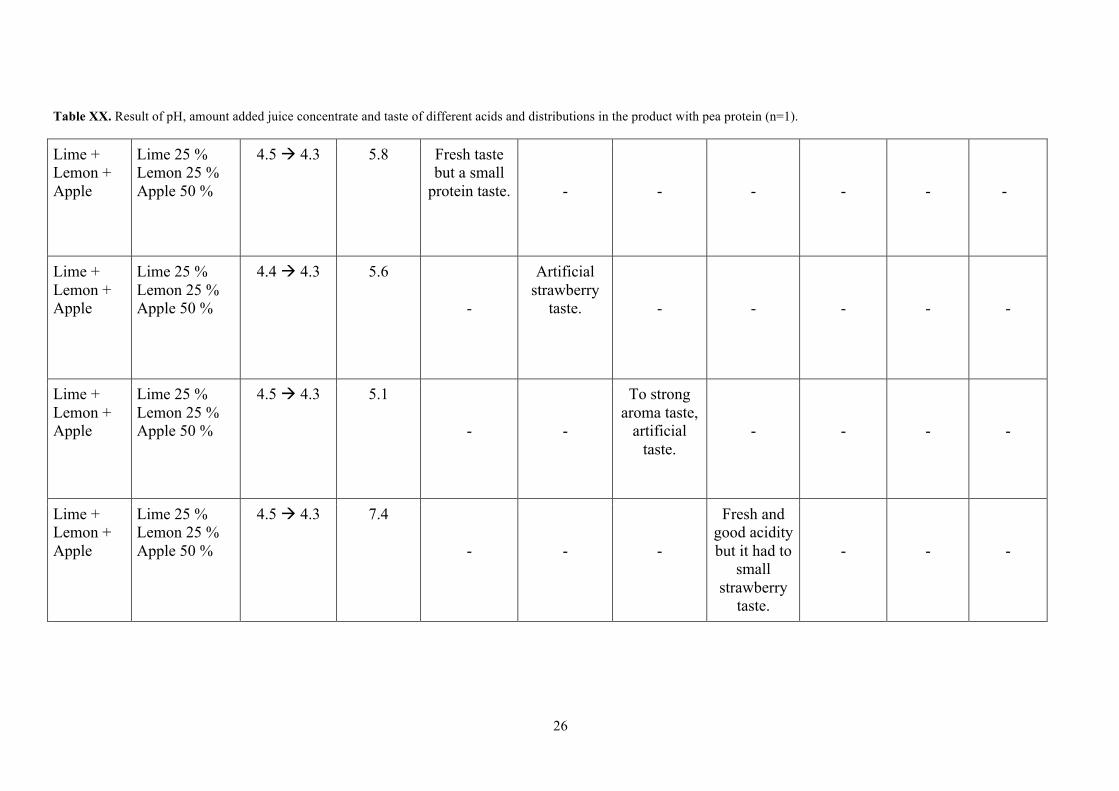
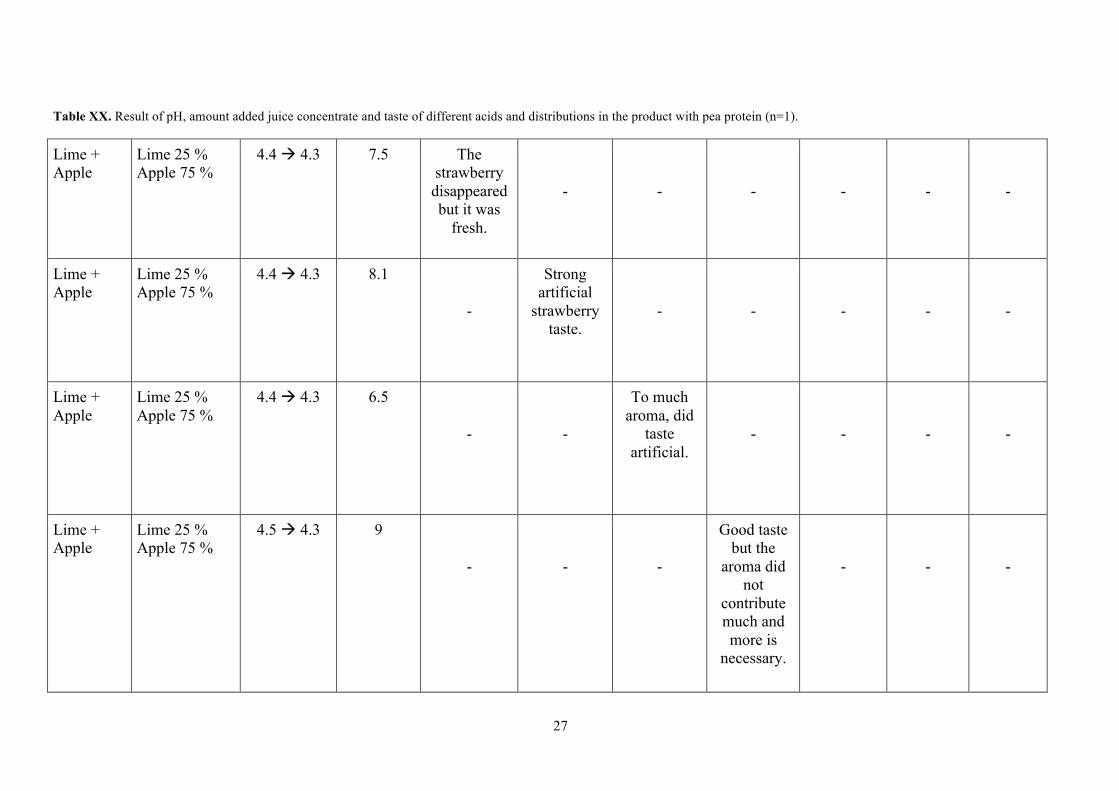
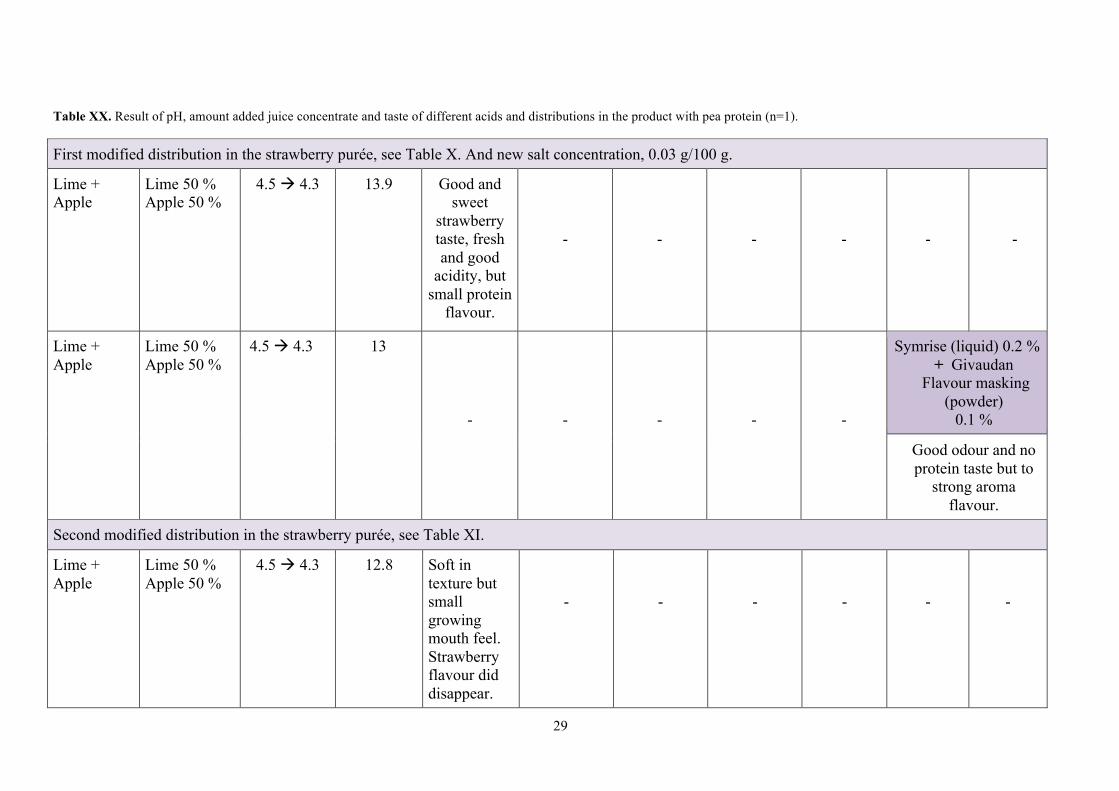
Algae protein 8.75 % 187 4.2.1. Taste improvement The algae protein is an attractive alternative to milk protein. Therefore, the protein is believed to have great potential to becoming a popular option in beverages, but more work is necessary to achieve a good taste. The taste, especially the aftertaste of ocean and fish, was too intense, which was the reason why the protein source was excluded. In the future, beverages containing algae protein might well emerge. However, the market depends on the consumers, and how willing they are to compromise on taste for obtaining a plant-based product. To see the results when adding juice concentrates see Table XIX. The pea protein taste was more disguised than the algae 5 %. When adding the juice concentrate mixtures, the taste of juice concentrate overshadowed the original beverage taste and therefore an addition of aromas was made. The idea of adding aromas was to elevate the strawberry flavour in the beverage to offset the enhancing acidity. The majority of the aromas gave an elevated strawberry taste while others; Symrise strawberry flavour (powder) required an increased dosage. Altogether, the aromas contributed to an undesired artificial strawberry taste. Due to the failed attempt of adding aromas, the distribution of the fruits in the fruit purée was modified. More bananas and less strawberries were added to give enhanced sweetness, roundness and reduced acidity. Two trials were performed, see Table X and Table XI. The first modified purée recipe resulted in a beverage with good strawberry flavour and freshness. The purée had pH 3.7 and the brix was measured to 18.1 °B. The second modified purée resulted in a too high amount of bananas, giving rise to a growing mouth feel, and the strawberry flavour was no longer as pronounced as before. The purée had pH 3.6 and a sugar content at 17.3 °B. The salt concentration was modified to find the optimal amount in order to enhance the strawberry flavour, which resulted in 0.03 g/100 g beverage. The results after adding the the juice mixtures, flavourings, salt and changed fruit purée recipe are shown in Table XX.
22
Table XIX. Result of pH, amount added juice concentrate and taste of different acids and distributions in the product with algae protein 5 % (n=1).
Juice concentrate Distribution pH (Before ! after adding juice concentrate)
Amount juice concentrate (mL)
Taste
Apple juice concentrate
Apple 100 % 4.2 ! 4.1 7.2 Fresh but had fish taste.
Orange juice concentrate
Orange 100 % 4.2 ! 4.1 3 Smell and aftertaste of fish.
Lemon juice concentrate
Lemon 100 % 4.2 ! 4.1 1.4 Aftertaste of fish.
Lime juice concentrate
Lime 100 % 4.2 ! 4.1 2 Did not cover the protein, had a fish
taste.
Lime + Lemon
Lime 50 % Lemon 50 %
4.2 ! 4.1 3.3 Fresh acidity but had some protein
taste.
Lime + Orange Lime 50 % Orange 50 %
4.2 ! 4.1 3.9 Had a protein taste but still good strawberry taste.
23
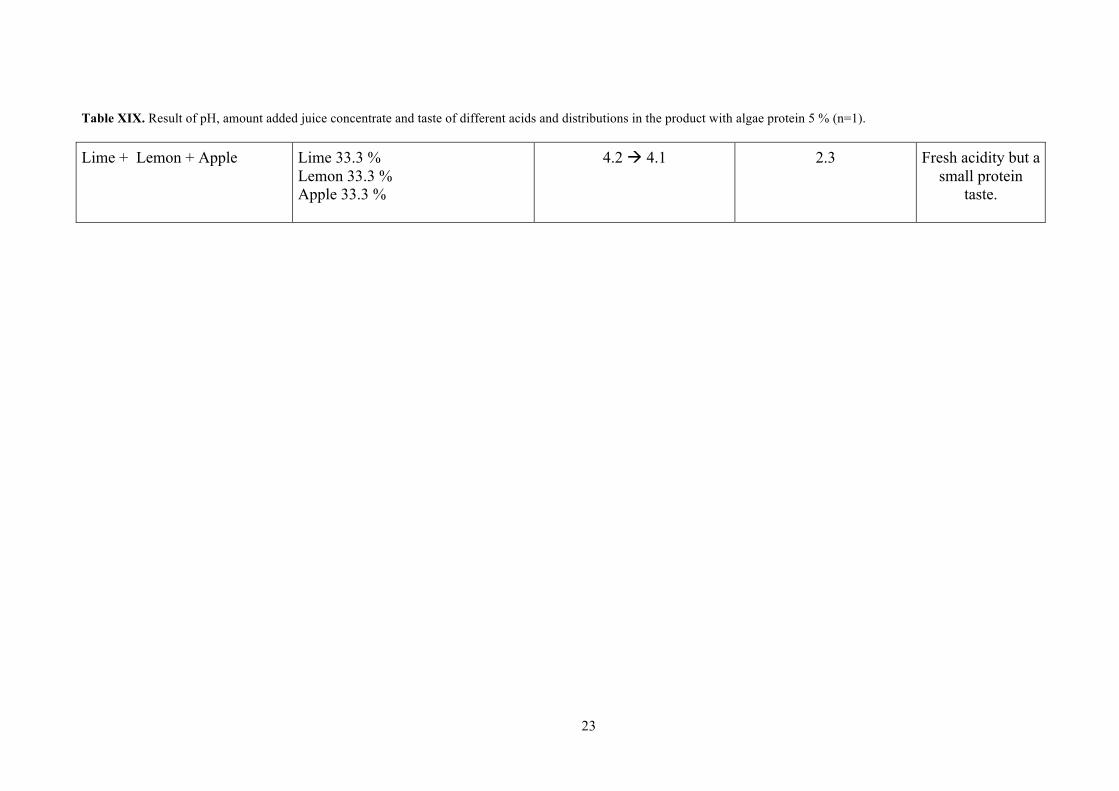
Table XIX. Result of pH, amount added juice concentrate and taste of different acids and distributions in the product with algae protein 5 % (n=1).
Lime + Lemon + Apple
Lime 33.3 % Lemon 33.3 % Apple 33.3 %
4.2 ! 4.1 2.3 Fresh acidity but a small protein
taste.
24
Table XX. Result of pH, amount added juice concentrate and taste of different acids and distributions in the product with pea protein (n=1).
Juice concentrate
Distribution pH (Before ! after adding juice concentrate)
Amount juice concentrate (mL)
Taste
Aroma
No aroma Givaudan (liquid) 0.2%
Stringer (liquid) 0.5%
Symrise (powder) 0.2%
Symrise (powder) 0.4%
Symrise (liquid) 0.2%
Givaudan Flavour masking powder 0.1%
Apple juice concentrate
Apple 100 % 4.5 ! 4.1 36.8 The apple flavour took over and the strawberry
disappeared.
-
-
-
-
-
-
Orange juice concentrate
Orange 100 % 4.6 ! 4.1 29.0 To strong orange
flavour, the strawberry
disappeared.
-
-
-
-
-
-
Lemon juice concentrate
Lemon 100 % 4.5 ! 4.1 14.1 Did not cover the
protein, the strawberry
disappeared.
-
-
-
-
-
-

25
Table XX. Result of pH, amount added juice concentrate and taste of different acids and distributions in the product with pea protein (n=1).
Lime juice concentrate
Lime 100 % 4.5 ! 4.1 18.6 Fresh odour but strong lime taste,
the strawberry
disappeared.
-
-
-
-
-
-
Lime + Lemon
Lime 50 % Lemon 50 %
4.5 ! 4.1 17.7 Fresh but the strawberry
disappeared. Had to high
acidity.
-
-
-
-
-
-
Lime + Orange
Lime 50 % Orange 50 %
4.5 ! 4.1 13 Fresh but the strawberry
disappeared. Had to high
acidity.
-
-
-
-
-
-
Lime + Lemon + Apple
Lime 33.3 % Lemon 33.3 % Apple 33.3 %
4.5 ! 4.1 15.7 Fresh, but little to high acidity. Had
some strawberry
taste.
-
-
-
-
-
-
New salt concentration, 0.02 g/100 g
26
Table XX. Result of pH, amount added juice concentrate and taste of different acids and distributions in the product with pea protein (n=1).
Lime + Lemon + Apple
Lime 25 % Lemon 25 % Apple 50 %
4.5 ! 4.3 5.8 Fresh taste but a small
protein taste.
-
-
-
-
-
-
Lime + Lemon + Apple
Lime 25 % Lemon 25 % Apple 50 %
4.4 ! 4.3 5.6 -
Artificial strawberry
taste.
-
-
-
-
-
Lime + Lemon + Apple
Lime 25 % Lemon 25 % Apple 50 %
4.5 ! 4.3 5.1 -
-
To strong aroma taste,
artificial taste.
-
-
-
-
Lime + Lemon + Apple
Lime 25 % Lemon 25 % Apple 50 %
4.5 ! 4.3 7.4 -
-
-
Fresh and good acidity but it had to
small strawberry
taste.
-
-
-
27
Table XX. Result of pH, amount added juice concentrate and taste of different acids and distributions in the product with pea protein (n=1).
Lime + Apple
Lime 25 % Apple 75 %
4.4 ! 4.3 7.5 The strawberry disappeared but it was
fresh.
-
-
-
-
-
-
Lime + Apple
Lime 25 % Apple 75 %
4.4 ! 4.3 8.1 -
Strong artificial
strawberry taste.
-
-
-
-
-
Lime + Apple
Lime 25 % Apple 75 %
4.4 ! 4.3 6.5 -
-
To much aroma, did
taste artificial.
-
-
-
-
Lime + Apple
Lime 25 % Apple 75 %
4.5 ! 4.3 9 -
-
-
Good taste but the
aroma did not
contribute much and more is
necessary.
-
-
-

28
Table XX. Result of pH, amount added juice concentrate and taste of different acids and distributions in the product with pea protein (n=1).
New salt concentration, 0.04 g/100 g
Lime + Apple
Lime 50 % Apple 50 %
4.5 ! 4.3 12.2 Fresh, acidity but minimal
strawberry taste.
-
-
-
-
-
-
Lime + Apple
Lime 50 % Apple 50 %
4.5 ! 4.3 12.4 -
-
-
-
Good odour but artificial,
candy-like strawberry
taste.
-
-
Lime + Apple
Lime 50 % Apple 50 %
4.5 ! 4.3 11.7 -
-
-
-
-
Some artificial
odour and taste but
still good.
-
Lime + Apple
Lime 50 % Apple 50 %
4.5 ! 4.3 12.1 -
-
-
-
-
-
Subdued and real
strawberry taste. Not so high in acidity.
29
Table XX. Result of pH, amount added juice concentrate and taste of different acids and distributions in the product with pea protein (n=1).
First modified distribution in the strawberry purée, see Table X. And new salt concentration, 0.03 g/100 g.
Lime + Apple
Lime 50 % Apple 50 %
4.5 ! 4.3 13.9 Good and sweet
strawberry taste, fresh and good
acidity, but small protein
flavour.
-
-
-
-
-
-
Lime + Apple
Lime 50 % Apple 50 %
4.5 ! 4.3 13 -
-
-
-
-
Symrise (liquid) 0.2 % + Givaudan
Flavour masking (powder)
0.1 %
Good odour and no protein taste but to
strong aroma flavour.
Second modified distribution in the strawberry purée, see Table XI.
Lime + Apple
Lime 50 % Apple 50 %
4.5 ! 4.3 12.8 Soft in texture but small growing mouth feel. Strawberry flavour did disappear.
-
-
-
-
-
-

30
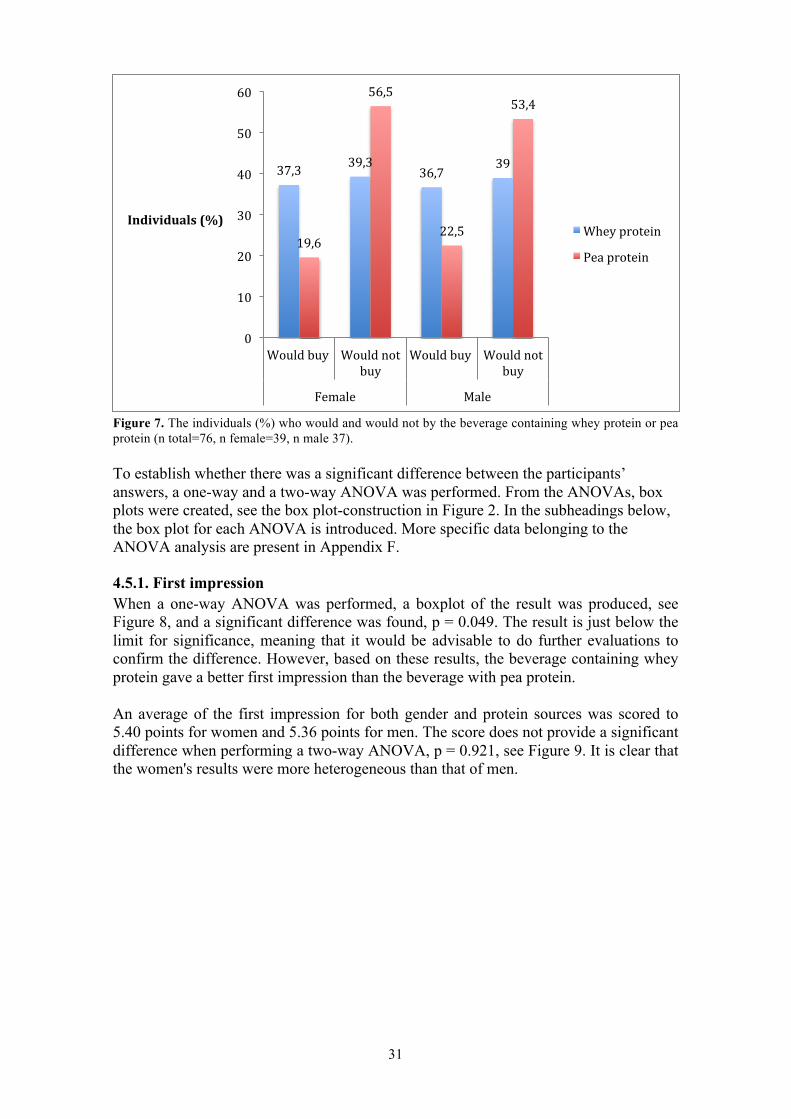
4.3. Final product Finally, one combination of ingredients was to be chosen for the upcoming sensory evaluation. The product was selected along with the supervisor based on taste and texture. The selected main ingredients were pea protein together with the first modified fruit purée, as shown in Table X. The salt concentration was 0.03 g salt/100 g beverage. Approximately 6 mL of a juice concentrate containing 50 % apple concentrate + 50 % lime concentrate was added per 100 g of beverage. The appearance of the final product is shown in Figure 6. This product has a good strawberry flavour with good acidity, but unfortunately, an underlying protein flavour remains, contributing to a sense of bitterness. The final product had pH 4.3 and a dry matter content of 27.8 % along with a viscosity of 684 cp. The beverage had an energy value of 164 kcal/100 g beverage, see Table XXI. The actual protein value was analysed to 4.1 g protein/100 g beverage including the protein from the oat flour mix, see Table XIX, and the protein value is equivalent with 10 E%. 4.4. Development of the beverage Skaka & smaka – New tastes 4.4.1. “Havet” The Algae protein 5 % had an intense taste of protein and fish. On the contrary, the pea protein had great potential in the new purée, but the bitter protein taste went through the sweet, tropical flavour from the purée. It was considered too time consuming to produce a good taste, why it was decided that the experiments with this new flavour would not continue. 4.4.2. “Skogsbär” Neither of the protein sources tasted well with this flavour combination. The beverage contains berries that are not high in acidity, and this contributes to a higher pH. A higher pH, in turn, contributes to a more distinct protein flavour. The beverage with algae protein 5 % tasted fish, and the original berry taste disappeared completely. The pea protein also contributed to a strong bitter protein taste, and a dry mouth sensation. The aftertaste had a faint berry flavour, but overall it did not taste good. Therefore, it was decided that the experiments with this new flavour would be discontinued. 4.5. Sensory analysis and statistics The sensory analysis was compiled. 86 people participated in the analysis, but due to incorrect completion of the questionnaire, 10 people, 8 female and 2 male, were excluded, leading to a total number of 76 participants. Of the 76 individuals who participated, 39 (51.3 %) were female, and 37 (48.7 %) were male. Those who participated in the sensory analysis answered a question if they would consider buying each product, see the result in Figure 7.
Figure 6. The appearance of the final product.
31
Figure 7. The individuals (%) who would and would not by the beverage containing whey protein or pea protein (n total=76, n female=39, n male 37). To establish whether there was a significant difference between the participants’ answers, a one-way and a two-way ANOVA was performed. From the ANOVAs, box plots were created, see the box plot-construction in Figure 2. In the subheadings below, the box plot for each ANOVA is introduced. More specific data belonging to the ANOVA analysis are present in Appendix F. 4.5.1. First impression When a one-way ANOVA was performed, a boxplot of the result was produced, see Figure 8, and a significant difference was found, p = 0.049. The result is just below the limit for significance, meaning that it would be advisable to do further evaluations to confirm the difference. However, based on these results, the beverage containing whey protein gave a better first impression than the beverage with pea protein. An average of the first impression for both gender and protein sources was scored to 5.40 points for women and 5.36 points for men. The score does not provide a significant difference when performing a two-way ANOVA, p = 0.921, see Figure 9. It is clear that the women's results were more heterogeneous than that of men.
37,3$ 39,3$ 36,7$ 39$
19,6$
56,5$
22,5$
53,4$
0$
10$
20$
30$
40$
50$
60$
Would$buy$$ Would$not$buy$$
Would$buy$$ Would$not$buy$$
Female$ Male$
Individuals*(%)* Whey$protein$Pea$protein$

32
Figure 8. Boxplot from a one-way ANOVA regarding protein source and first impression. Number 1 represents “strongly dislike” and 9 represent “strongly like” (n=76 individuals).
Figure 9. Boxplot from a two-way ANOVA regarding gender, protein source and first impression. Number 1 represents “strongly dislike” and 9 represent “strongly like” (n total=76, n female=39, n male=37). 4.5.2. Colour The result from the one-way ANOVA with regard to the source of protein, confirmed a pronounced significant difference, p = 0.000, see Figure 10. The mean value for whey protein was 5.36 while the mean value for pea protein was 7.38. This means that even though the beverage with whey protein gave a better first impression, more participants liked the colour of the beverage with pea protein the most. The results from the two-way ANOVA showed no significant difference, p = 0.783, see Figure 11. The average value was 6.32 for men and 6.42 for women. The boxplot reveals a greater spread of scoring for the whey protein for both men and women, while the participants are more consistent regarding the pea protein's colour.
Whey proteinPea protein
9
8
7
6
5
4
3
2
1
0
Protein
Firs
t im
pres
sion
Boxplot of First impression
GenderProtein
WomenMenWhey proteinPea proteinWhey proteinPea protein
9
8
7
6
5
4
3
2
1
0
Firs
t im
pres
sion
Boxplot of First impression

33
Figure 10. Boxplot from a one-way ANOVA regarding protein source and colour. Number 1 represents “strongly dislike” and 9 represent “strongly like” (n=76 individuals).
Figure 11. Boxplot from a two-way ANOVA regarding gender, protein source and colour. Number 1 represents “strongly dislike” and 9 represent “strongly like” (n total=76, n female=39, n male=37). 4.5.3. Odour No significant difference was found between the odours of the beverages. With regard to the protein source, the p-value was confirmed to 0.561, see boxplot in Figure 12, and with regard to the gender and protein source, Figure 13, the p-value was 0.335. Within all the groups the mean value was between 5.58-5.88. A large spread within the groups was noticed. Several participants commented that they felt no odour, and depending on whether they consider smelling nothing, is good or bad, it affects the results. Therefore, the questionnaire should be modified to clarify this.
Whey proteinPea protein
9
8
7
6
5
4
3
2
Protein
Colo
r
Boxplot of Color
GenderProtein
WomenMenWhey proteinPea proteinWhey proteinPea protein
9
8
7
6
5
4
3
2
Colo
r
Boxplot of Color

34
Figure 12. Boxplot from a one-way ANOVA regarding protein source and odour. Number 1 represents “strongly dislike” and 9 represent “strongly like” (n=76 individuals).
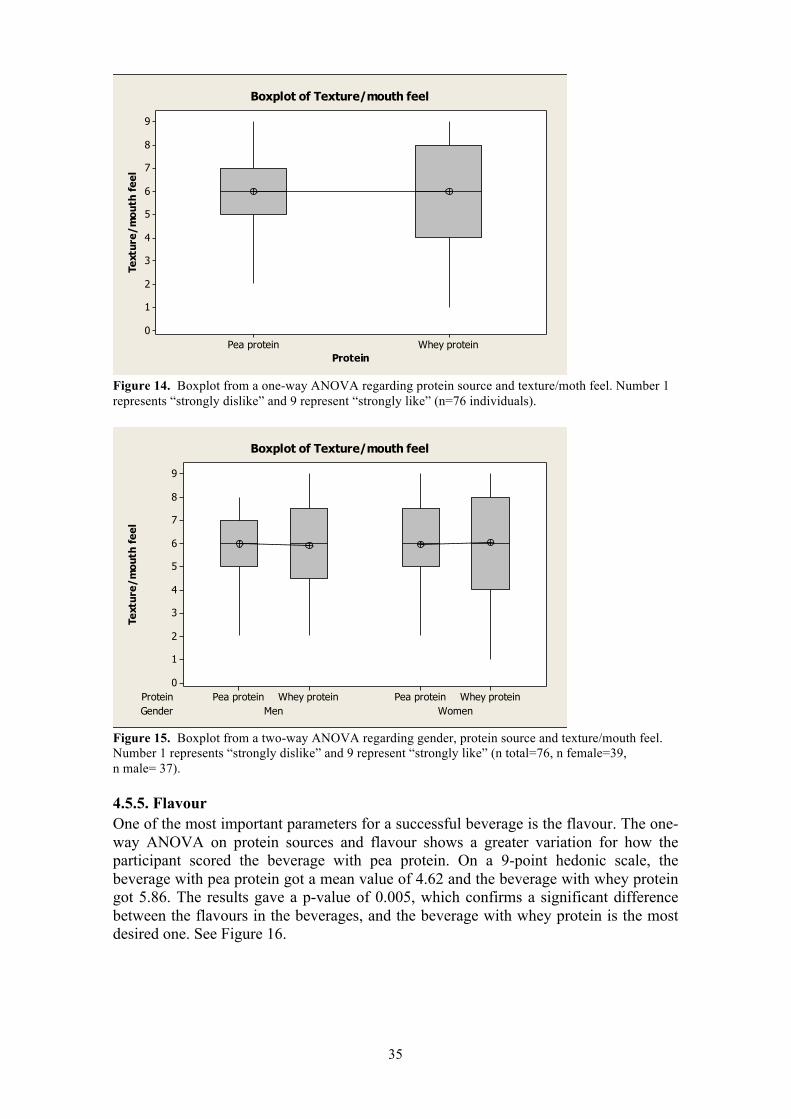
Figure 13. Boxplot from a two-way ANOVA regarding gender, protein source and odour. Number 1 represents “strongly dislike” and 9 represent “strongly like” (n total=76, n female=39, n male=37). 4.5.4. Texture/ Mouth feel The texture/mouth feel was evaluated by the participants. The average of all groups are similar, 5.98 ± 0.02. The mean and median coincide, indicating that the scoring is symmetrical, which means that the results may be located near the centre of a normal distribution curve. See Figure 14 and 15. The boxplots shows a greater variation in the preferences of the participants with regard to the beverage containing whey protein than compared to the pea protein. Some of the participants believed that the beverage with whey protein was too thick in texture and favoured a more loose/watery beverage. Despite this, there was no significant difference, p = 1.00, between the groups with regard to protein source in the beverages, and neither between the genders, p = 0.923.
Whey proteinPea protein
9
8
7
6
5
4
3
2
Protein
Odo
ur
Boxplot of Odour
GenderProtein
WomenMenWhey proteinPea proteinWhey proteinPea protein
9
8
7
6
5
4
3
2
Odo
ur
Boxplot of Odour
35
Figure 14. Boxplot from a one-way ANOVA regarding protein source and texture/moth feel. Number 1 represents “strongly dislike” and 9 represent “strongly like” (n=76 individuals).
Figure 15. Boxplot from a two-way ANOVA regarding gender, protein source and texture/mouth feel. Number 1 represents “strongly dislike” and 9 represent “strongly like” (n total=76, n female=39, n male= 37). 4.5.5. Flavour One of the most important parameters for a successful beverage is the flavour. The one-way ANOVA on protein sources and flavour shows a greater variation for how the participant scored the beverage with pea protein. On a 9-point hedonic scale, the beverage with pea protein got a mean value of 4.62 and the beverage with whey protein got 5.86. The results gave a p-value of 0.005, which confirms a significant difference between the flavours in the beverages, and the beverage with whey protein is the most desired one. See Figure 16.
Whey proteinPea protein
9
8
7
6
5
4
3
2
1
0
Protein
Text
ure/
mou
th f
eel
Boxplot of Texture/mouth feel
GenderProtein
WomenMenWhey proteinPea proteinWhey proteinPea protein
9
8
7
6
5
4
3
2
1
0
Text
ure/
mou
th f
eel
Boxplot of Texture/mouth feel
36
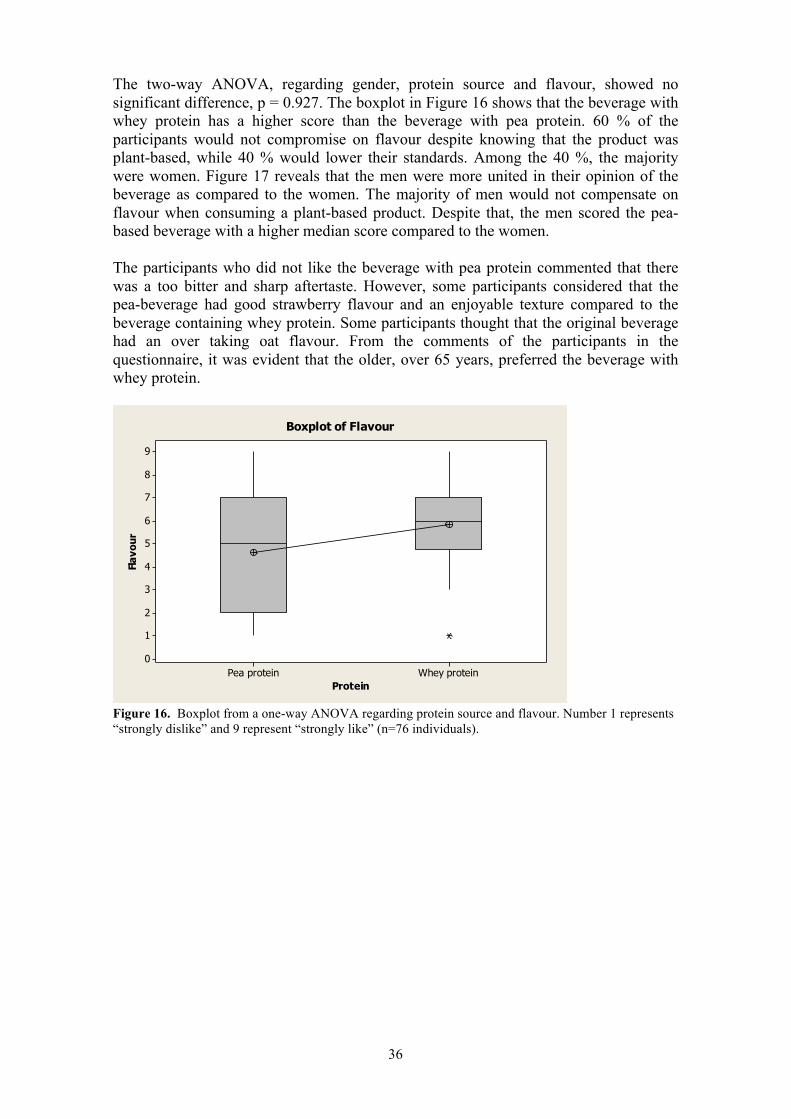
The two-way ANOVA, regarding gender, protein source and flavour, showed no significant difference, p = 0.927. The boxplot in Figure 16 shows that the beverage with whey protein has a higher score than the beverage with pea protein. 60 % of the participants would not compromise on flavour despite knowing that the product was plant-based, while 40 % would lower their standards. Among the 40 %, the majority were women. Figure 17 reveals that the men were more united in their opinion of the beverage as compared to the women. The majority of men would not compensate on flavour when consuming a plant-based product. Despite that, the men scored the pea-based beverage with a higher median score compared to the women. The participants who did not like the beverage with pea protein commented that there was a too bitter and sharp aftertaste. However, some participants considered that the pea-beverage had good strawberry flavour and an enjoyable texture compared to the beverage containing whey protein. Some participants thought that the original beverage had an over taking oat flavour. From the comments of the participants in the questionnaire, it was evident that the older, over 65 years, preferred the beverage with whey protein.
Figure 16. Boxplot from a one-way ANOVA regarding protein source and flavour. Number 1 represents “strongly dislike” and 9 represent “strongly like” (n=76 individuals).
Whey proteinPea protein
9
8
7
6
5
4
3
2
1
0
Protein
Flav
our
Boxplot of Flavour

37
Figure 17. Boxplot from a two-way ANOVA regarding gender, protein source and flavour. Number 1 represents “strongly dislike” and 9 represent “strongly like” (n total=76, n female=39, n male=37). 4.5.6. Overall impression In the last question in the questionnaire, the participants gave their opinion about the overall impression and was supposed to sum their earlier answers. The one-way ANOVA, see Figure 18, rendered p = 0.072. This difference is thus insignificant. The two-way ANOVA, see Figure 19, gave a p-value at 0.751, meaning that no significant difference between gender, protein source and the overall impression was evident.
Figure 18. Boxplot from a one-way ANOVA regarding protein source and overall impression. Number 1 represents “strongly dislike” and 9 represent “strongly like” (n=76 individuals)..
GenderProtein
WomenMenWhey proteinPea proteinWhey proteinPea protein
9
8
7
6
5
4
3
2
1
0
Flav
our
Boxplot of Flavour
Whey proteinPea protein
9
8
7
6
5
4
3
2
1
0
Protein
Ove
rall
impr
essi
on
Boxplot of Overall impression

38
Figure 19. Boxplot from a two-way ANOVA regarding gender, protein source and overall impression. Number 1 represents “strongly dislike” and 9 represent “strongly like” (n total=76, n female=39, n=male 37). 4.6. Discussion In retrospect, some aspects of this work could have benefited from a different strategy. A blinded sensory analysis during the consumer test would potentially give a more accurate result, pertaining to more correct and truthful answer regarding the liking or disliking of the beverages. During the sensory analysis, the original beverage with whey protein was compared with the new beverage with pea protein, whereas both beverages should have been made in the laboratory. In the current situation, the beverage with whey protein was made in a factory, and the beverage with pea protein was made in the laboratory, giving the two products different characters. It would also be wise to compare the pea protein beverage with a beverage also containing a vegetable protein source. In that case, the result would probably be more accurate because the beverages would not differ in the large extent as they did with respect to the sensory aspects. When performing the sensory analysis, a 9 point hedonic scale was used. In hindsight, a ”line scale” could have been a better choice, as there was some uncertainties from the participants on how they should score their opinions. Therefore, it would be more clear both for the participants and for the one who compiles the results, if the scale was changed. When calculating the statistics, it became apparent that a more structured method for the sensory analysis was needed. Instead of planning the statistics calculations from the sensory analysis it needed to be the other way around. Because of using the wrong method, the statistics were difficult to calculate. Despite some missteps along the way, the study worked out well as a whole. The chemical analysis gave relevant facts and promising results. The practical design around these methods worked as intended.
GenderProtein
WomenMenWhey proteinPea proteinWhey proteinPea protein
9
8
7
6
5
4
3
2
1
0
Ove
rall
impr
essi
on
Boxplot of Overall impression

39
If more time had been found, it would have been exciting to investigate other protein sources and their characteristics in the beverage, such as e.g. chia protein. Chia products are growing on the market; they have a mild taste profile and possess good gelling abilities. In addition to investigating more various protein sources, it would be interesting to combine different protein sources. Apart from changing the protein sources, it would have been interesting to add the proteins in different flavours to investigate if other fruits and berries could disguise the protein taste better than the strawberries. Two new flavours were tested during this project, but more time was needed to obtain a good camouflage for the protein taste.

40
5. Conclusion The target audience; all those who needs more energy in the everyday life, gave a positive response regarding the basic product concept. For that reason, it will be worthwhile to continue this study and develop a good product.

41
References 1. L Wells J, C Dumbrell A. Nutrition and aging: assessment and treatment of compromised nutritional status in frail elderly patients. Div Geriatr Med Dep Med Univ West Ont Lond Can. 2006;79. 2. Aventure AB [Internet]. Available from: http://www.aventureab.com 3. Vegetarian Times [Internet]. [cited 2016 May 17]. Available from: http://www.vegetariantimes.com/article/vegetarianism-in-america/ 4. Craig WJ. Health effects of vegan diets. Am J Clin Nutr. 2009 May 1;89(5):1627S – 1633S. 5. Culp KR, Cacchione PZ. Nutritional status and delirium in long-term care elderly individuals. Appl Nurs Res. 2008 May;21(2):66–74. 6. Langborger R. Sensory studies of an energy dense drink for elderly people. 2015 [cited 2016 Apr 14]; Available from: http://stud.epsilon.slu.se/8110/ 7. Folkhälsomyndigheterna [Internet]. 2016. Available from: http://www.folkhalsomyndigheten.se/pagefiles/12743/A2012-01-Halsan-bland-55-84-åringar-Enligt-HLV-rev.pdf 8. Geissler C, Powers H. Human Nutrition. 12 edition. Churchill Livingstone Elsevier; 2011. 9. Volpi E, Kobayashi H, Sheffield-Moore M, Mittendorfer B, Wolfe RR. Essential amino acids are primarily responsible for the amino acid stimulation of muscle protein anabolism in healthy elderly adults. Am J Clin Nutr. 2003;78(2):250–8. 10. Nowson C, O’Connell S. Protein Requirements and Recommendations for Older People: A Review. Nutrients. 2015 Aug 14;7(8):6874–99. 11. Paddon-Jones D. Amino acid ingestion improves muscle protein synthesis in the young and elderly. AJP Endocrinol Metab. 2003 Oct 28;286(3):321E – 328. 12. Nordiska näringsrekommendationer (NNR). 2012. 13. Landi F, Calvani R, Tosato M, Martone A, Ortolani E, Savera G, et al. Protein Intake and Muscle Health in Old Age: From Biological Plausibility to Clinical Evidence. Nutrients. 2016 May 14;8(5):295. 14. Shimomura Y, Yamamoto Y, Bajotto G, Sato J, Murakami T, Shimomura N, et al. Nutraceutical effects of branched-chain amino acids on skeletal muscle. J Nutr. 2006;136(2):529S – 532S. 15. Zheng L, Wei H, Cheng C, Xiang Q, Pang J, Peng J. Supplementation of branched-chain amino acids to a reduced-protein diet improves growth performance in piglets: involvement of increased feed intake and direct muscle growth-promoting effect. Br J Nutr. 2016 Apr 15;1–10.

42
16. Koehnle TJ, Russell MC, Morin AS, Erecius LF, Gietzen DW. Diets deficient in indispensable amino acids rapidly decrease the concentration of the limiting amino acid in the anterior piriform cortex of rats. J Nutr. 2004;134(9):2365–71. 17. Mielgo-Ayuso J, Maroto-Sánchez B, Luzardo-Socorro R, Palacios G, Palacios Gil-Antuñano N, González-Gross M. Evaluation of nutritional status and energy expenditure in athletes. Nutr Hosp. 2015;31(Suppl 3):227–36. 18. Børsheim E, Tipton KD, Wolf SE, Wolfe RR. Essential amino acids and muscle protein recovery from resistance exercise. Am J Physiol - Endocrinol Metab. 2002 Oct 1;283(4):E648–57. 19. Maughan RJ. Quality Assurance Issues in the Use of Dietary Supplements, with Special Reference to Protein Supplements. J Nutr. 2013 Nov 1;143(11):1843S – 1847S. 20. McDougall J. Plant Foods Have a Complete Amino Acid Composition * Response. Circulation. 2002 Jun 25;105(25):197e – 197. 21. Millward DJ. The nutritional value of plant-based diets in relation to human amino acid and protein requirements. Proc Nutr Soc. 1999;58(02):249–60. 22. Day L. Proteins from land plants – Potential resources for human nutrition and food security. Trends Food Sci Technol. 2013 Jul;32(1):25–42. 23. Hughes BP. The amino-acid composition of potato protein and of cooked potato. Br J Nutr. 1958;12(02):188–95. 24. Potatisprotein [Internet]. Lyckeby. 2016. Available from: http://www.lyckeby.com 25. F. Shih F, W. Diagle K. Preparation and Characterization of Rice Protein Isolates. In U.S Department of Agriculture, Southern Research Center, New Orlieans, Louisiana 70124; 2000. 26. PEVESA biotech [Internet]. 2016. Available from: http://www.pevesa.es 27. AlgaVia [Internet]. 2016. Available from: http://algavia.com/ingredients/proteins/ 28. Delaunay C. Development of non-diary, energy-dense drink for elderly. Internship report in Aventure AB, Lund, Sweden. 29. 2014 2015; 29. Becker EW. Micro-algae as a source of protein. Biotechnol Adv. 2007 Mar;25(2):207–10. 30. Damodaran S, L. Parkin K, Fennema R. O. Fennema’s Food Chemistry. Fourth Edition. CRC Press. Taylor & Francis Group LLC; 31. Nationalencyklopedin, emulsion. [Internet]. NE Nationalencyklopedin AB. 2016. Available from: http://www.ne.se.proxy.lnu.se/uppslagsverk/encyklopedi/lång/emulsion 32. Nationalencyklopedin, reologi. [Internet]. NE Nationalencyklopedin AB. 2016. Available from: www.ne.se.proxy.lnu.se/uppslagsverk/encyklopedi/lång/reologi

43
33. Guichard E. Flavour retention and release from protein solutions. Biotechnol Adv. 2006 Mar;24(2):226–9. 34. Ribadeau-Dumas B, Grappin R. Milk protein analysis. Le Lait. 1989;69(5):357–416. 35. Nielsen SS. Food Analysis. Fourth edition. New York, USA: Springer; 36. Nationalencyklopedin, bombkalorimeter. [Internet]. [cited 2016 Aug 8]. Available from: www.ne.se.proxy.lnu.se/uppslagsverk/encyklopedi/lång/bombkalorimeter 37. Nationalencyklopedin, Hess lag. [Internet]. [cited 2016 Aug 8]. Available from: www.ne.se.proxy.lnu.se/uppslagsverk/encyklopedi/lång/hess-lag 38. Svensson L. Design and performance of Small scale sensory consumer tests. 2012 [cited 2016 May 11]; Available from: http://stud.epsilon.slu.se/id/eprint/5045 39. Minitab-16 [Internet]. 2016. Available from: http://www.minitab.com/en-us/

I I
Appendixes Appendix A Results from Thermo Electroporation FLASH EA 1112 Series N/Protein analyser after analysing the protein content in solutions containing different protein sources.

II
Appendix B Results from Thermo Electroporation FLASH EA 1112 Series N/Protein analyser after analysing the protein content in the beverages containing different protein sources. Value marked in red is deviant and allowed to be removed according to Grubbs test.
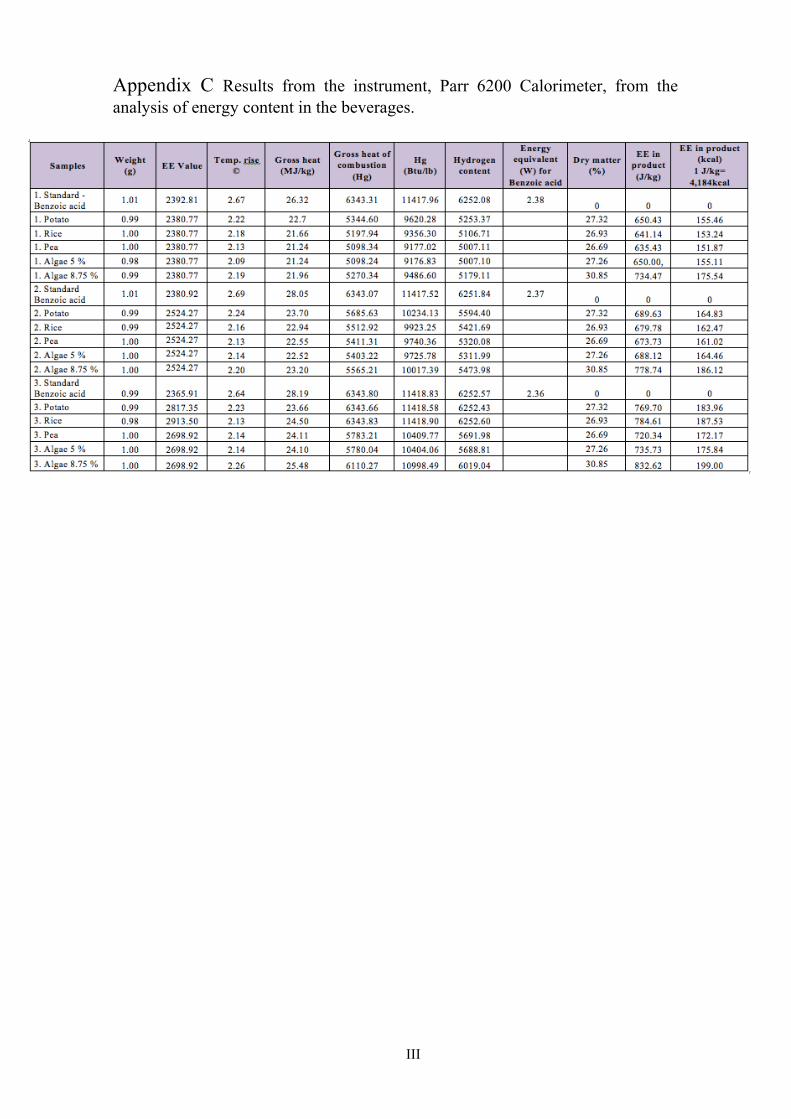
III
Appendix C Results from the instrument, Parr 6200 Calorimeter, from the analysis of energy content in the beverages.
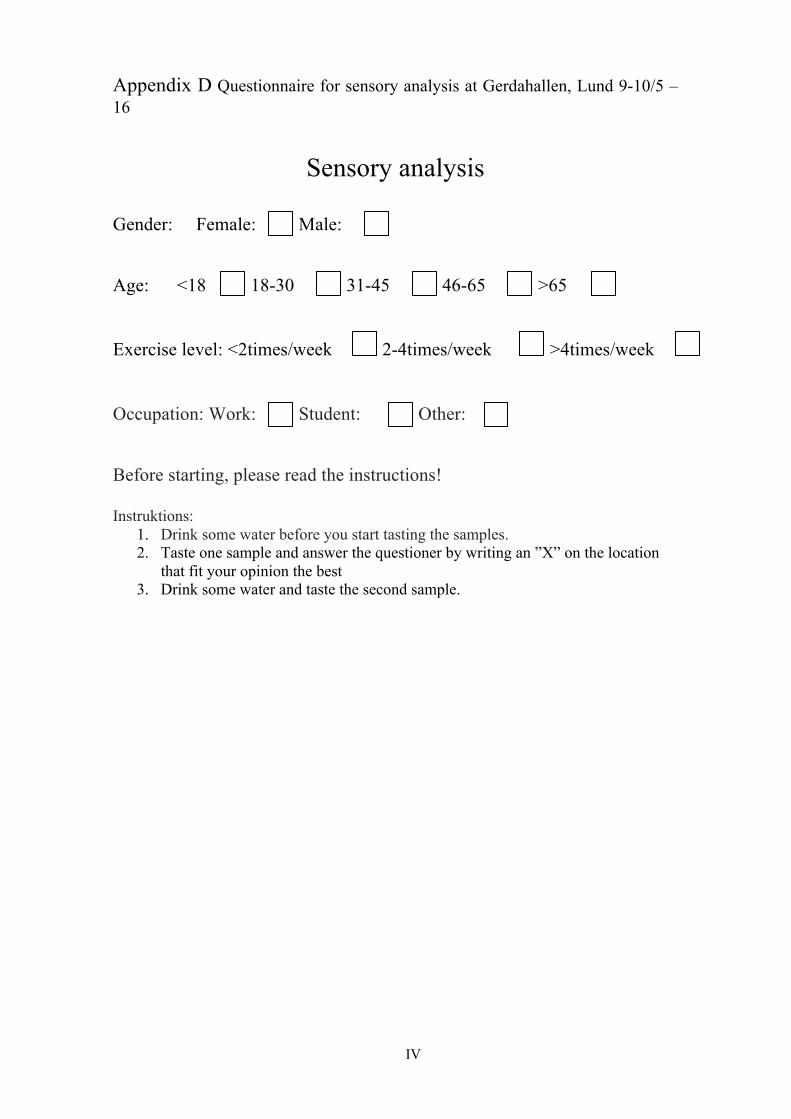
IV
Appendix D Questionnaire for sensory analysis at Gerdahallen, Lund 9-10/5 – 16
Sensory analysis
Gender: Female: Male: Age: <18 18-30 31-45 46-65 >65 Exercise level: <2times/week 2-4times/week >4times/week Occupation: Work: Student: Other: Before starting, please read the instructions! Instruktions:
1. Drink some water before you start tasting the samples. 2. Taste one sample and answer the questioner by writing an ”X” on the location
that fit your opinion the best 3. Drink some water and taste the second sample.

V
You taste sample nr: 1. What´s your first impression?
Strongly dislike Strongly like Comments:
2. What do you think about the color? Strongly dislike Strongly like Comments:
3. What do you think about the odour? Strongly dislike Strongly like Comments:
4. What do you think about the texture/mouthfeel? Strongly dislike Strongly like Comments:
5. What do you think about the flavour? Strongly dislike Strongly like Comments:
6. What do you think about the overall impression? Strongly dislike Strongly like Comments:
7. Would you buy this beverage? YES NO If NO, please write why:
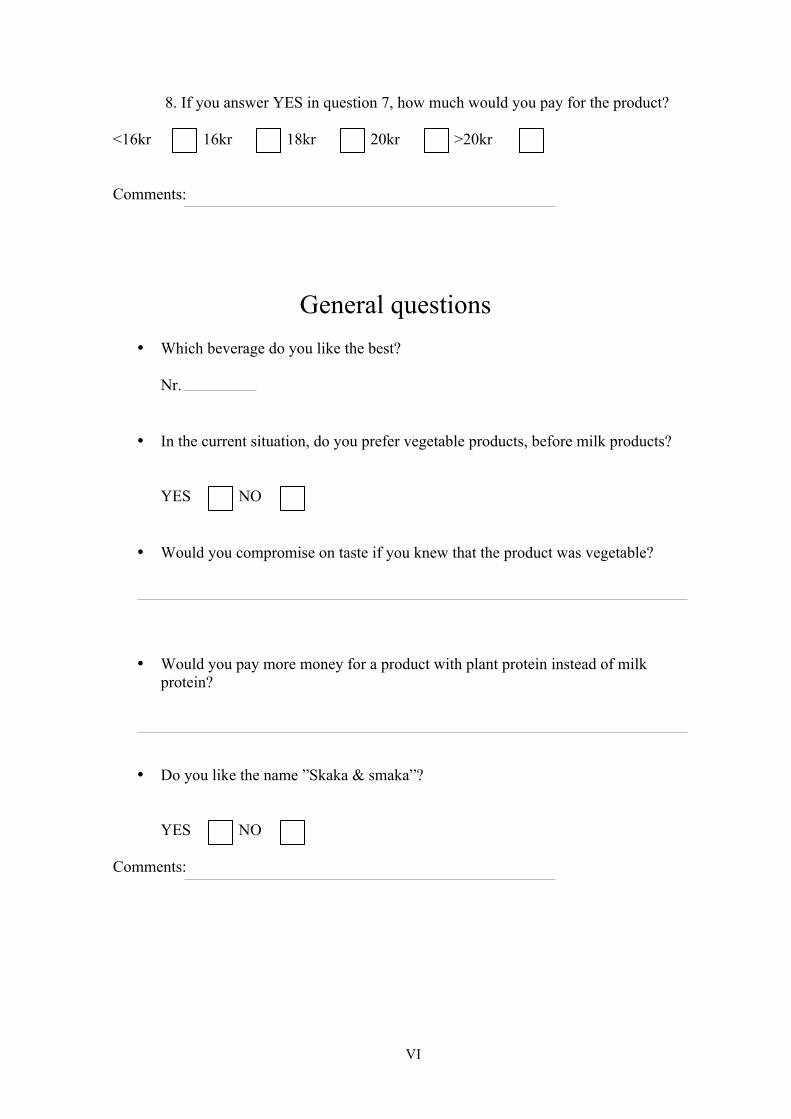
VI
8. If you answer YES in question 7, how much would you pay for the product?
<16kr 16kr 18kr 20kr >20kr
Comments:
General questions
• Which beverage do you like the best?
Nr.
• In the current situation, do you prefer vegetable products, before milk products?
YES NO
• Would you compromise on taste if you knew that the product was vegetable?
• Would you pay more money for a product with plant protein instead of milk protein?
• Do you like the name ”Skaka & smaka”?
YES NO
Comments:

VII
• Would you like the name ”Spring” on the product instead?
YES NO
Comments:
• Do you like the kind of package that is available as a prototype? YES NO
Comments:
Thank you for your participation!
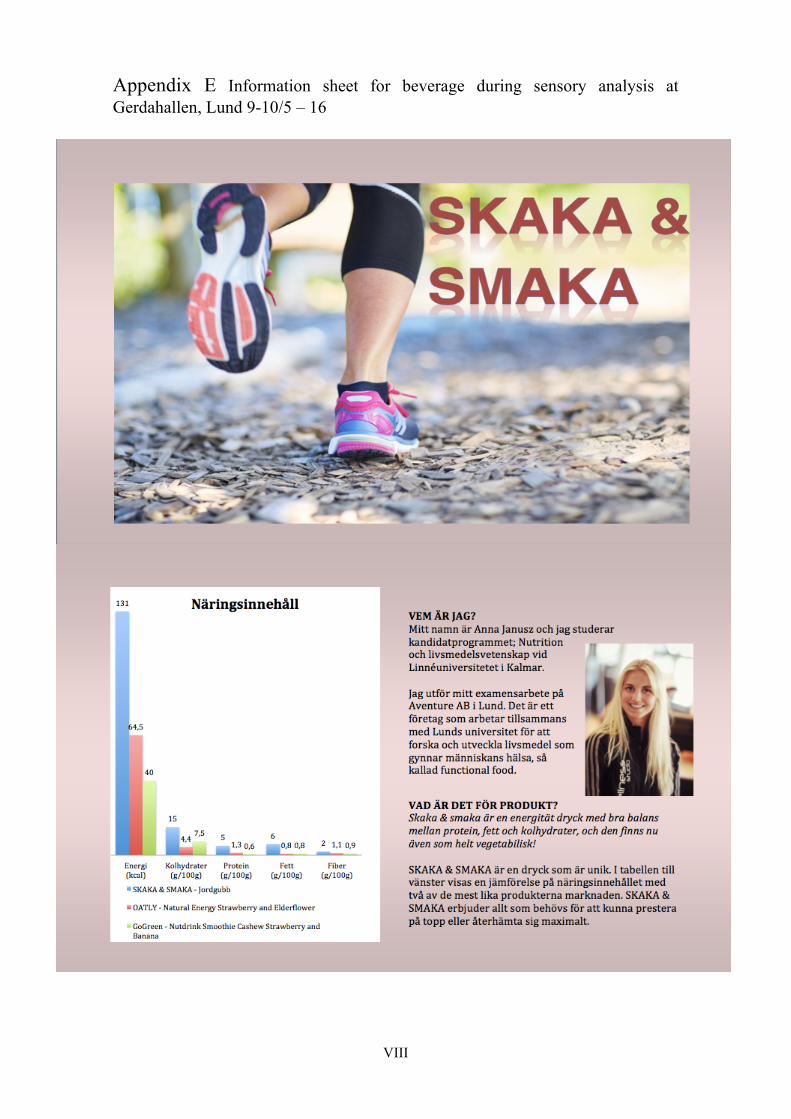
VIII
Appendix E Information sheet for beverage during sensory analysis at Gerdahallen, Lund 9-10/5 – 16
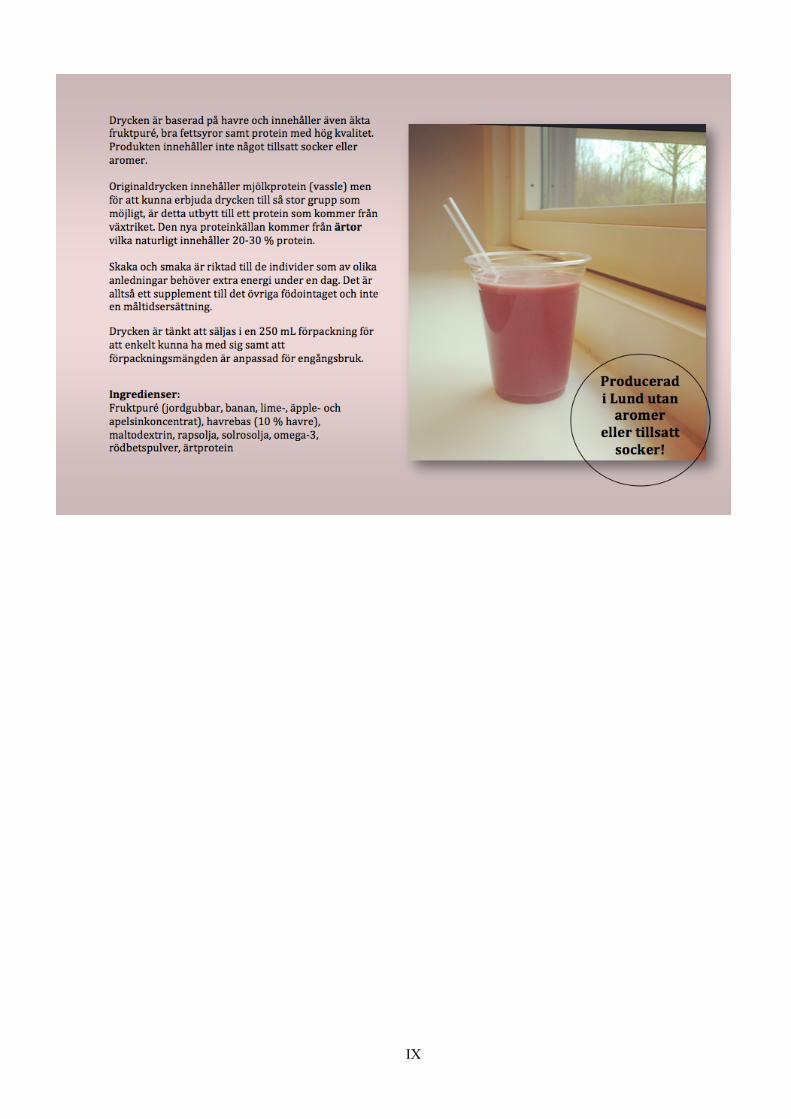
IX

X
Appendix F Statistical results from the ANOVAs made in MiniTab-16.

XI
Two-way ANOVA: Odour versus Gender; Protein
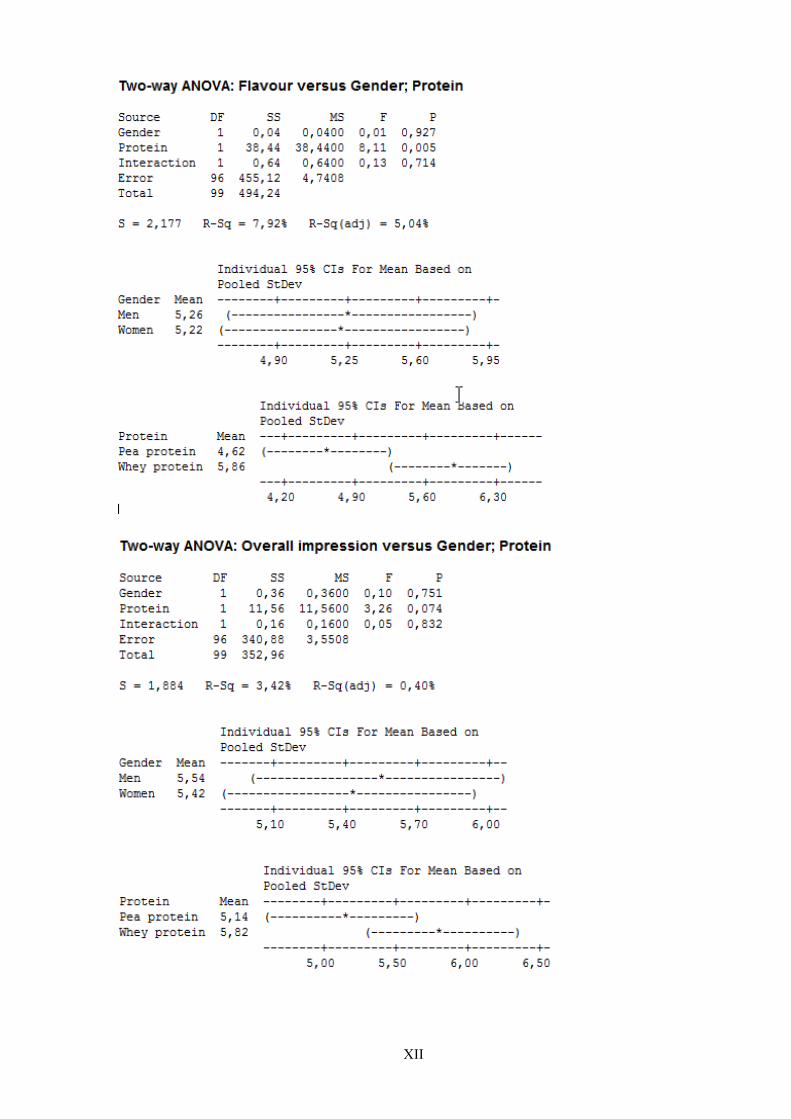
XII