ankle injuries dan o’connell, md department of family practice
TRANSCRIPT

ANKLE INJURIESANKLE INJURIES
Dan O’Connell, MD
Department of Family Practice

Photo footPhoto foot


ANKLE SPRAINS- Grade ANKLE SPRAINS- Grade 1,2,31,2,3
Grade I sprain - mild stretching of a ligament with microscopic tears. Mild swelling/tenderness. Jt stable, can bear wt.
Grade II sprain -incomplete tear of a ligament; mod pain, swelling, ecchymosis. Mild-mod jt instability, decreased ROM. Weight bearing and ambulation are painful.
Grade III sprain - complete tear of a ligament. Severe pain, swelling, ecchymosis. Significant mechanical instability on exam and significant loss of function and motion. Patients are unable to bear weight or ambulate

Diagnosis ankle injuryDiagnosis ankle injury
Hx- mechanism of injury, walking afterward and PREVIOUS INJURY
PE/Inspection/Palpation/RotationWt bearing

PEPE
Start in non-tender area- forefoot, prox fibulaDistal 6 cm (2 ½ inches) post lat malleolusDistal 6 cm (2 ½ inches) post med malleolusHave pt take 4 steps – limping is OK if wt is
transferred

Normal anatomy of ankleNormal anatomy of ankle

Tib/fib/ATFLTib/fib/ATFL
Lat/Medial viewLat/Medial view

Black and whiteBlack and white

OTTAWA ANKLE RULESOTTAWA ANKLE RULES
Meta-analysis- 27 studies, 15000+ pts
To assess Sensitivity/Specificity, pooled likelihood ratio

Pooled sens/specPooled sens/spec

Table 3. Pooled sensitivity (bootstrapped) and Table 3. Pooled sensitivity (bootstrapped) and distribution of specificity in 27 studies (39 2×2 distribution of specificity in 27 studies (39 2×2
tables) of Ottawa ankle rules in diagnosis of ankle tables) of Ottawa ankle rules in diagnosis of ankle fractures. Values are percentages fractures. Values are percentages
All studies (n=39) Sens 97.6 (96.4 to 98.9) Spec 31.5 (23.8-44.4)
Type of assessment: Ankle (n=15) 98.0 (96.3 to 99.3)
39.8 (27.9-47.7)
Foot (n=10) 99.0 (97.3 to 100) 37.8 (24.7-70.1)
Combined (n=14) 96.4 (93.8 to 98.6) 26.3 (19.4-34.3)

Number of tests Chance of a fracture in test
Scenario Sensitivity Specificity Positive Negative Positive Negative
Ideal specificity 0.98 0.9 198 802 1 in 2 1 in 400
Best specificity 0.98 0.7 348 652 1 in 4 1 in 326
Average specificity
0.98 0.4 648 352 1 in 7 1 in 176
Worst specificity 0.98 0.1 898 102 1 in 9 1 in 51
Outcomes predicted from a cohort of 1000 people presenting with possible fractured ankle, in which 100 (10%) actually have a broken ankle
Sensitivity/specificitySensitivity/specificity

Likelihood ratio – Negitive and Likelihood ratio – Negitive and positivepositive
The likelihood ratio for a positive result (LR+) tells you how much the odds of the disease increase when a test is positive. The likelihood ratio for a negative result (LR-) tells you how much the odds of the disease decrease when a test is negative.

Likelihood ratio – Negitive and Likelihood ratio – Negitive and positivepositive
The likelihood ratio of a positive test result (LR+) =
sensitivity / ( 1- specificity).
The likelihood ratio of a negative test result (LR-) = (1- sensitivity) / specificity.

Positive Likelihood ratioPositive Likelihood ratio
Sensitivity/ (1-specificity)
97.6 / (1-31.5) = 97.6/68.5 = 1.43

Negative Likelihood ratioNegative Likelihood ratio
(1-Sensitivity)/ Specificity
(1-97.6) / 31.5 = 0.0897.6/68.5 = 1.43

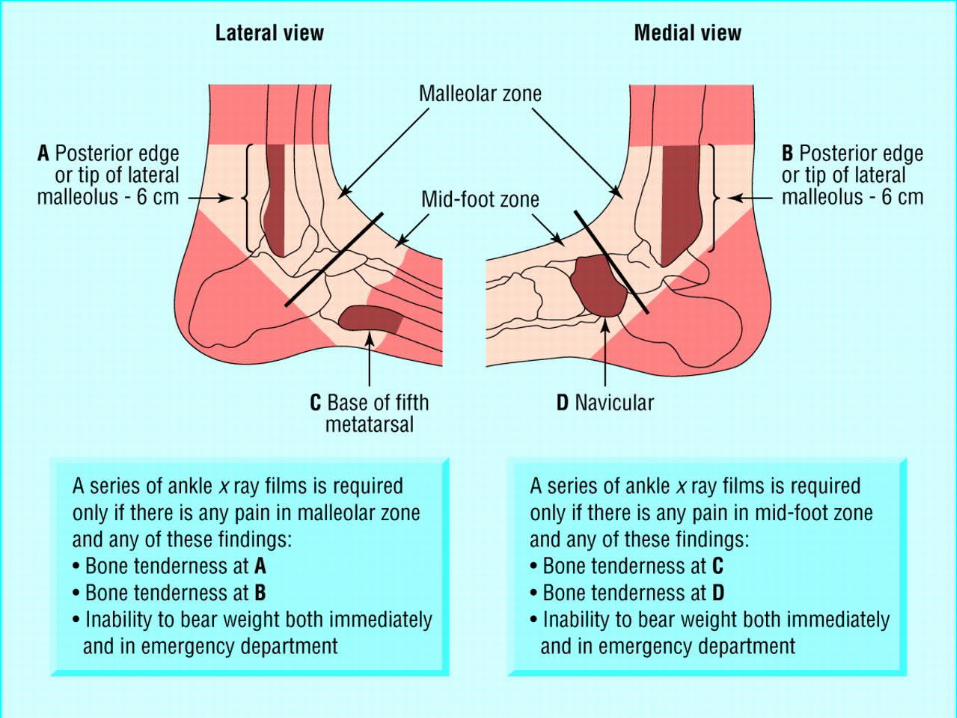
Ottawa rules – ankle injuryOttawa rules – ankle injury
Pain in the malleolar zone and any of these findings: 1.bone tenderness at A, - post. Lat. malleolus
2. bone tenderness at B - post.med. malleolus 3.inability to bear weight immediately and in ED

Ottawa rules – foot injuryOttawa rules – foot injury
Foot radiographic series is indicated if pain in the midfoot zone and any of these findings:
1.bone tenderness at C – Base 5th metatarsal 2.bone tenderness at D - navicular bone 3.inability to bear weight immediately and in ED

Ankle injuries in basketball: injury rate and Ankle injuries in basketball: injury rate and risk factors.risk factors.
AU - McKay GD; Goldie PA; Payne WR; Oakes BWAU - McKay GD; Goldie PA; Payne WR; Oakes BWSO - Br J Sports Med 2001SO - Br J Sports Med 2001
RESULTS: A total of 10 393 basketball participations were observed and 40 ankle injuries documented.
The rate of ankle injury was 3.85 per 1000 participations, with almost half (45.9%) missing one week or more of competition and the most common mechanism being landing (45%).
Over half (56.8%) of the ankle injured basketball players did not seek professional treatment.
Three risk factors for ankle injury were identified: (1) players with a history of ankle injury were almost five times more likely to sustain an ankle injury (odds ratio (OR) 4.94, 95% confidence interval (CI) 1.95 to 12.48); (2) players wearing shoes with air cells in the heel were 4.3 times more likely to injure an ankle than those wearing shoes without air cells (OR 4.34, 95% CI 1.51 to 12.40); (3) players who did not stretch before the game were 2.6 times more likely to injure an ankle than players who did (OR 2.62, 95% CI 1.01 to 6.34). There was also a trend toward ankle tape decreasing the risk of ankle injury in players with a history of ankle injury (p = 0.06). CONCLUSIONS: Ankle injuries occurred at a rate of 3.85 per 1000 participations. The three identified risk factors, and landing, should all be considered when preventive strategies for ankle injuries in basketball are being formulated.
Ankle injuries in basketball: injury rate Ankle injuries in basketball: injury rate and risk factors.and risk factors.
AU - McKay GD; Goldie PA; Payne WR; Oakes BWAU - McKay GD; Goldie PA; Payne WR; Oakes BWSO - Br J Sports Med 2001SO - Br J Sports Med 2001
Three risk factors for ankle injury were identified:
(1) players with a history of ankle injury were almost five times more likely to sustain an ankle injury (odds ratio (OR) 4.94, 95% (CI) 1.95 to 12.48);
(2) players wearing shoes with air cells in the heel were 4.3 times more likely to injure an ankle than those wearing shoes without air cells (OR 4.34, 95% CI 1.51 to 12.40);
(3) players who did not stretch before the game were 2.6 times more likely to injure an ankle than players who did (OR 2.62, 95% CI 1.01 to 6.34).
There was also a trend toward ankle tape decreasing the risk of ankle injury in players with a history of ankle injury (p = 0.06).

Ankle injuries in basketball: injury rate Ankle injuries in basketball: injury rate and risk factors.and risk factors.
AU - McKay GD; Goldie PA; Payne WR; Oakes BWAU - McKay GD; Goldie PA; Payne WR; Oakes BWSO - Br J Sports Med 2001SO - Br J Sports Med 2001
CONCLUSIONS: Ankle injuries occurred at a rate of 3.85 per 1000 participations.
The three identified risk factors, and landing, should all be considered when preventive strategies for ankle injuries in basketball are being formulated.

RICE vs PRICESRICE vs PRICES
RestIceCompressionElevation
ProtectRestIceCompressionElevationSupport