ankle bracing's effect on lower extremity biomechanics
TRANSCRIPT

Lakehead University
Knowledge Commons,http://knowledgecommons.lakeheadu.ca
Electronic Theses and Dissertations Electronic Theses and Dissertations from 2009
2018
Ankle bracing's effect on lower extremity
biomechanics during athletic
performance measures: an exploratory study
Henderson, Zachariah J.
http://knowledgecommons.lakeheadu.ca/handle/2453/4302
Downloaded from Lakehead University, KnowledgeCommons
Ankle Bracing’s Effect on Lower Extremity Biomechanics During Athletic Performance
Measures: An Exploratory Study
By
Zachariah J. Henderson
Supervisor: Dr. Paolo Sanzo
Committee: Dr. Carlos Zerpa and Dr. Derek Kivi
In partial fulfilment of the requirements
for the degree of Master of Science in Kinesiology
SCHOOL OF KINESIOLOGY
LAKEHEAD UNIVERSITY
THUNDER BAY, ONTARIO, CANADA
August, 2018

BIOMECHANICS OF ANKLE BRACING ii
Abstract
Introduction: Ankle braces are commonly worn in athletic populations to prevent ankle injuries. Restriction of ankle range of motion (ROM) is considered the main mechanism by which ankle braces prevent ankle injuries. The effects of restricting normal ankle ROM on lower extremity injury, biomechanics, and athletic performance, however, remains unclear. Although the research is conflicting, increases in non-ankle lower extremity injuries when wearing ankle braces has been observed, in addition to changes in lower extremity kinematics, kinetics, vertical jump height, and agility. Decreases in vertical jump height when wearing ankle braces have previously been attributed to restriction of ankle ROM and altered lower extremity kinematics. No studies, however, have considered the effect that ankle braces may have on muscular activation of the lower extremity, specifically proximal musculature of the knee and hip joint, on athletic performance. As such, the purpose of this study was to examine the effects of softshell and semi-rigid ankle braces on muscle electromyography (EMG), kinetics, and performance during a vertical jump test and cutting task.
Methods: 42 physically active individuals (23 male, 19 female) were recruited into the study. Participants completed a Vertical Jump Test and cutting task on two separate days under three bilateral conditions: wearing no ankle braces, ASO® EVO® (AE) softshell ankle braces, or Active Ankle T1™ (T1) semi-rigid ankle braces. Vertical jump height, and mean EMG activity of the peroneus longus (PL), lateral gastrocnemius (LG), biceps femoris (BF), rectus femoris (RF), and gluteus medius (GM) muscles was collected during the landing and takeoff phase of the Vertical Jump Test. Similarly, time to compete the cutting task, as well as mean EMG activity of the peroneus longus (PL), lateral gastrocnemius (LG), biceps femoris (BF), rectus femoris (RF), and gluteus medius (GM) muscles was collected during the deceleration and propulsive phase of the cutting task. Ground reaction forces and impulse were also collected during each task and phase. Due to missing data, repeated measures one-way ANOVAs were conducted to compare the independent variable (brace condition) on each dependent variable. The alpha level was set at p < .05 for the performance measures. After a Bonferroni adjustment, the alpha level was set at p < .01, p < .01, and p < .017 for EMG, GRF, and impulse variables, respectively.
Results: There was a significant decrease in vertical jump height when wearing ankle braces, F(2, 80) = 15.796, p < .001, ηp2 = .283. Bonferroni pairwise comparisons analysis revealed a significant decrease in vertical jump height when wearing the AE (2.09 (95% CI, 0.9 to 3.28) cm, p < .001) and T1 (2.12 (95% CI, 1.058 to 3.193) cm, p < .001) ankle braces, compared to no braces. There was a significant decrease in LG mean EMG activity during takeoff when wearing ankle braces, F(2, 68) = 5.597, p < .001, ηp2 = .141. Bonferroni pairwise comparisons analysis revealed a significant decrease in LG mean EMG activity when wearing the T1 ankle braces (-7.34 (95% CI, -13.307 to -1.376) %MVC, p = .012), compared to no braces. There was a significant increase in peak lateral GRF during takeoff, F(1.118, 43.585) = 39.80, p < .001, ηp2= .505. Bonferroni pairwise comparisons analysis revealed a significant increase in peak lateral GRF when wearing the AE (6.64 (95% CI, 4.066 to 9.233) %BW, p < .001) and T1 (6.76 (95% CI, 4.131 to 9.404) %BW, p < .001) ankle braces, compared to no braces.
There was a significant decrease in peak lateral GRF, F(2, 74) = 5.746, p < .001, ηp2 = .134. Bonferroni pairwise comparisons analysis revealed a significant decrease in peak lateral
BIOMECHANICS OF ANKLE BRACING iii
GRF during landing when wearing the T1 ankle braces (-2.59 (95% CI, -4.432 to -0.764) %BW, p < .001), compared to no braces.
There was a significant increase in time to complete the cutting task, F(2, 76) = 17.242, p < .001, partial η2 = 0.312. Bonferroni pairwise comparisons analysis revealed a significant increase in time to complete the cutting task when wearing the AE (0.16 (95% CI, .062 to .265) sec, p < .001) and T1 (0.2(95% CI, .113 to .286) sec, p < .001) ankle braces, compared to no braces.
Conclusion: Based on the results of this study, both softshell and semi-rigid ankle braces significantly decreased vertical jump and cutting task performance. Furthermore, ankle braces decreased EMG activity of ankle musculature and altered GRFs during vertical jumping. Further research is needed to determine how changes in EMG activity and kinetics may affect injury, as well as performance during vertical jumping and cutting. Clinicians, athletes, trainers, and any users or prescribers of ankle braces should weigh the pros and cons of prophylactically bracing the ankle, especially from a performance perspective.

BIOMECHANICS OF ANKLE BRACING iv
Acknowledgements
As many before me would probably attest to, it is difficult to put the experience that is grad school into words. Excitement, frustration, and seemingly endless nights of work (among many other things), all dot the roller coaster that is grad school. It is even more difficult to express gratitude to all the people that helped me persist through this degree. First, I have to thank numerous times over my parents, Lesagh and Randy, for their personal (and financial) support. Without them, this degree would not have been possible. I would also like to thank Dr. Sanzo for his guidance, input, expertise, and supervision on both my Master’s and undergraduate thesis. Without you, I don’t think I would have developed the passion for research that I now have. Many thanks as well to my committee members, Dr. Zerpa and Dr. Kivi, for their valuable input and technical assistance on the project. Although my name may be on the title page, a Master’s degree is very much a group project; thank you to all the Duññ Bros, fellow grad students, and front desk employees for your company, friendship, advice, and assistance with procrastination. Noreen (and all the baristas at The Study): thank you for always supplying the fuel for my academic pursuits. I also have to thank the faculty gym regulars who let me informally pick their brains every morning for seven years. To everyone who was a participant in this project, thank you for volunteering your time to science. Lastly, I would like to thank the late Brad Reeson. You taught me how to work hard, and that life is the most important thing you can train for. Without you, I don’t think I would have become the person that I am today.
“What you are as a person is far more important than what you are as a basketball player.”
John Wooden
"It is possible to make no mistakes and still lose. That is not weakness, that is life."
Jean-Luc Picard
#FG
Contents
Abstract .......................................................................................................................................... ii
Acknowledgements ...................................................................................................................... iv
List of Figures ............................................................................................................................... ix
List of Tables ................................................................................................................................ ix
List of Abbreviations .................................................................................................................. xi
Chapter One: Introduction .......................................................................................................... 1 Overview ..................................................................................................................................... 1 The Ankle Joint .......................................................................................................................... 2
Ankle sprains .......................................................................................................................... 4 Ankle sprain classification ...................................................................................................... 7
Chronic Ankle Instability........................................................................................................... 9 Ankle Braces and Taping ........................................................................................................ 13
Protective mechanisms.......................................................................................................... 15 Range of motion restriction .............................................................................................. 15 Improved proprioception. ................................................................................................. 19
Ankle Bracing and Injury Prevention ..................................................................................... 21 Biomechanics of Ankle Bracing .............................................................................................. 25
Kinetics ................................................................................................................................. 26 Ground reaction forces. ..................................................................................................... 26 Jumping ............................................................................................................................. 27 Cutting tasks...................................................................................................................... 28
Kinematics ............................................................................................................................ 29 Kinetics and kinematics of ankle bracing ............................................................................. 29
Jump landings ................................................................................................................... 29 Cutting tasks...................................................................................................................... 32
Electromyography ................................................................................................................. 35 Landing. ............................................................................................................................ 36 Cutting............................................................................................................................... 37 Perturbations. .................................................................................................................... 38 Performance ...................................................................................................................... 39
Ankle Bracing and Athletic Performance ............................................................................... 41 Purpose of Research ................................................................................................................ 47 Research Questions .................................................................................................................. 48
Chapter Two: Methodology ....................................................................................................... 50

BIOMECHANICS OF ANKLE BRACING vi
Participant Inclusion and Exclusion Criteria......................................................................... 50 Research Recruitment Procedures .......................................................................................... 50 Screening Measures ................................................................................................................. 51
Physical Activity Readiness Questionnaire .......................................................................... 51 Functional Ankle Ability Measure........................................................................................ 52
Instrumentation ........................................................................................................................ 52 Electromyography ................................................................................................................. 52 Advanced Medical Technologies Incorporated force platform ............................................ 53 LabChart® software .............................................................................................................. 53 Brower timing gates .............................................................................................................. 54 Vertical Jump Test. ............................................................................................................... 55 Cutting task ........................................................................................................................... 55
Procedures ................................................................................................................................ 56 Data Processing........................................................................................................................ 66
Vertical Jump Test ................................................................................................................ 66 Lateral cutting task. ............................................................................................................... 67 Electromyography data. ........................................................................................................ 68
Preliminary Data Analysis ....................................................................................................... 68 Electromyography data ......................................................................................................... 68 Force platform data. .............................................................................................................. 68 Performance data. ................................................................................................................. 68
Statistical Analysis ................................................................................................................... 69
Chapter Three: Vertical Jump Test Results ............................................................................ 71 Demographics........................................................................................................................... 71 Missing Data ............................................................................................................................ 71 Takeoff and Flight Phase ........................................................................................................ 71
Reliability. ............................................................................................................................. 71 Descriptive statistics. ............................................................................................................ 72 Inferential statistics. .............................................................................................................. 73
Question one: Is there a difference amongst ankle brace conditions in vertical jump height for the Vertical Jump Test? .................................................................................... 73 Question two: Is there a difference amongst ankle brace conditions in measures of lower extremity EMG activity and kinetics during the takeoff phase of the Vertical Jump Test?........................................................................................................................................... 75
Landing..................................................................................................................................... 82 Reliability .............................................................................................................................. 82 Descriptive statistics. ............................................................................................................ 83 Inferential statistics. .............................................................................................................. 84
Question three: Is there a difference amongst ankle brace conditions in measures of lower extremity EMG activity and kinetics during the landing phase of the Vertical Jump Test?........................................................................................................................................... 84
BIOMECHANICS OF ANKLE BRACING vii
Chapter Four: Lateral Cutting Task Results ........................................................................... 92 Missing Data ............................................................................................................................ 92 Deceleration ............................................................................................................................. 92
Reliability .............................................................................................................................. 92 Descriptive statistics. ............................................................................................................ 93 Inferential statistics. .............................................................................................................. 95
Question four: Is there a difference amongst ankle brace conditions in time to complete the cutting task? ................................................................................................................ 95 Question five: Is there a difference amongst ankle brace conditions in measures of lower extremity EMG activity and kinetics during the deceleration phase of the cutting task? . 96
Propulsive ............................................................................................................................... 103 Reliability ............................................................................................................................ 103 Descriptive statistics. .......................................................................................................... 104 Inferential statistics. ............................................................................................................ 105
Question six: Is there a difference amongst ankle brace conditions in measures of lower extremity EMG activity and kinetics during the propulsive phase of the cutting task? . 105
Chapter Five: Discussion .......................................................................................................... 113 Takeoff and Flight Phase ...................................................................................................... 113 Landing................................................................................................................................... 119 Cutting Task ........................................................................................................................... 125 Limitations .............................................................................................................................. 128 Delimitations .......................................................................................................................... 130 Future Research ..................................................................................................................... 131
Chapter Six: Conclusion .......................................................................................................... 131
References .................................................................................................................................. 133
Appendices ................................................................................................................................. 158 Appendix A ............................................................................................................................. 159
Recruitment Poster .............................................................................................................. 159 Appendix B ............................................................................................................................. 161
Information Letter ............................................................................................................... 161 Appendix C ............................................................................................................................. 165
Consent Form ...................................................................................................................... 165 Appendix D ............................................................................................................................. 167
Physical Activity Readiness Questionnaire (Par-Q) ........................................................... 167 Appendix E ............................................................................................................................. 169
Functional Ankle Ability Measure (FAAM) ...................................................................... 169

BIOMECHANICS OF ANKLE BRACING viii
Appendix F ............................................................................................................................. 173 Background Questionnaire.................................................................................................. 173
Appendix G ............................................................................................................................. 175 Vertical Jump Test Diagram and Set-up With Vertec ™ Device ....................................... 175
Appendix H ............................................................................................................................. 177 Cutting Task Diagram and Set-up....................................................................................... 177
Appendix I .............................................................................................................................. 179 Borg Rating of Perceived Exertion ..................................................................................... 179
Appendix J .............................................................................................................................. 181 Pilot Study ........................................................................................................................... 181

BIOMECHANICS OF ANKLE BRACING ix
List of Figures
Figure 1. Joints of the ankle region. (3)
Figure 2. Lateral ankle ligaments. (4)
Figure 3. Medial ankle ligaments. (5)
Figure 4. ASO® EVO® softshell ankle brace. (14)
Figure 5. Active Ankle T1™ semi-rigid ankle brace. (15)
Figure 6. Instrumentation set-up. (54)
Figure 7. Electrode location one. (58)
Figure 8. Electrode location two. (59)
Figure 9. Electrode location three. (60)
Figure 10. Electrode location four. (61)
Figure 11. Electrode location five. (62)
Figure 12. Cutting task. (65)
Figure 13. Vertical Jump Test takeoff and landing. (67)
Figure 14. Lateral cutting task first contact anteroposterior GRF. (67)
Figure 15. Differences in vertical jump height activity across brace conditions. (74)
Figure 16. Differences in LG mean EMG activity across brace conditions-Takeoff. (76)
Figure 17. Differences in peak lateral GRF across brace conditions-Takeoff. (81)
Figure 18. Differences in peak lateral GRF across brace conditions-Landing. (90)
Figure 19. Differences in lateral cutting task time across brace conditions. (96)

BIOMECHANICS OF ANKLE BRACING x
List of Tables
Table 1. Intervention sequences. (56)
Table 2. Participant demographic information. (71)
Table 3. Intraclass correlations for Vertical Jump Test performance and takeoff dependent variables. (72)
Table 4. Electromyography and GRF descriptive statistics for the takeoff phase of the Vertical Jump Test. (73)
Table 5. Intraclass correlations for Vertical Jump Test landing dependent variables. (83)
Table 6. Electromyography and GRF descriptive statistics for the landing phase of the Vertical Jump Test. (84)
Table 7. Intraclass correlations for cutting task performance and deceleration dependent variables. (93)
Table 8. Electromyography and GRF descriptive statistics for the deceleration phase of the cutting task. (94)
Table 9. Intraclass correlations for deceleration dependent variables. (104)
Table 10. Electromyography and GRF descriptive statistics for the propulsive phase of the cutting task. (105)

BIOMECHANICS OF ANKLE BRACING xi
List of Abbreviations
AE — ASO® EVO® softshell ankle brace
ATFL — Anterior talofibular ligament
BF — Biceps femoris muscle
CAD — Canadian dollars
CAI — Chronic ankle instability
CAIT — Cumberland Ankle Instability Tool
CFL — Calcaneofibular ligament
EMG — Electromyography
GM — Gluteus medius muscle
GRF — Ground reaction force
ICC — Intraclass correlation coefficient
LG — Lateral gastrocnemius muscle
MVC — Maximum Voluntary Contraction
mV — Millivolts
N — Newtons
PL — Peroneus longus muscle
PTFL — Posterior talofibular ligament
RF — Rectus femoris muscle
ROM — Range of motion
SEBT — Star Excursion Balance Test
T1 — Active Ankle T1™ semi-rigid ankle brace
TA — Tibialis anterior muscle
USD — United States dollars
V — Volts

BIOMECHANICS OF ANKLE BRACING 1
Chapter One: Introduction
Overview
Ankle sprains make up the majority of musculoskeletal injuries seen in sport (Ferran &
Maffulli, 2006) and represent the most frequently reported injury in the National Collegiate
Athletics Association (Roos, Kerr, & Mauntel, 2016). As such, the prevention of ankle sprains
and ankle injuries is of the utmost importance to an athlete, so that he/she can remain healthy and
perform at his/her best. Various preventative methods are employed by athletes and healthcare
providers in an attempt to prevent and treat ankle injuries, including ankle braces (Bahr, Lian, &
Bahr, 1997; Kaminski et al., 2013).
While ankle braces are a commonly accepted method of preventing and/or treating ankle
injuries, their use is not without controversy. Clinicians have long speculated that extended use
of an ankle brace may be detrimental to muscular activation and strength about the ankle
(Cordova & Ingersoll, 2003). Recent systematic reviews, however, have concluded that ankle
braces can effectively prevent and treat ankle injuries in athletic populations (Leppänen,
Aaltonen, Parkkari, Heinonen, & Kujala, 2014; Petersen et al., 2013). As such, the National
Athletic Trainers Association (NATA) recommends that all players returning to play from an
ankle sprain wear an ankle brace (Kaminski et al., 2013). Despite their widespread use and
recommendation, the effect that ankle bracing has on proximal joints is not well understood.
Wearing ankle braces has been noted to increase the incidence of non-ankle lower extremity
injuries (McGuine, Brooks, & Hetzel, 2011; Robbins & Waked, 1998; Yang et al., 2005), as well
as negatively affect athletic performance (Ambegaonkar et al., 2011; Henderson, Sanzo, &
Zerpa, 2016; Parsley, Chinn, Lee, Ingersoll, & Hertel, 2013; Smith, Claiborne, & Liberi, 2016).
As such, it has been suggested that further research be completed on the effects of ankle bracing
BIOMECHANICS OF ANKLE BRACING 2
on lower extremity and lumbar spine biomechanics (McGuine et al., 2011), as well as athletic
performance measures (Ambegaonkar et al., 2011).
The Ankle Joint
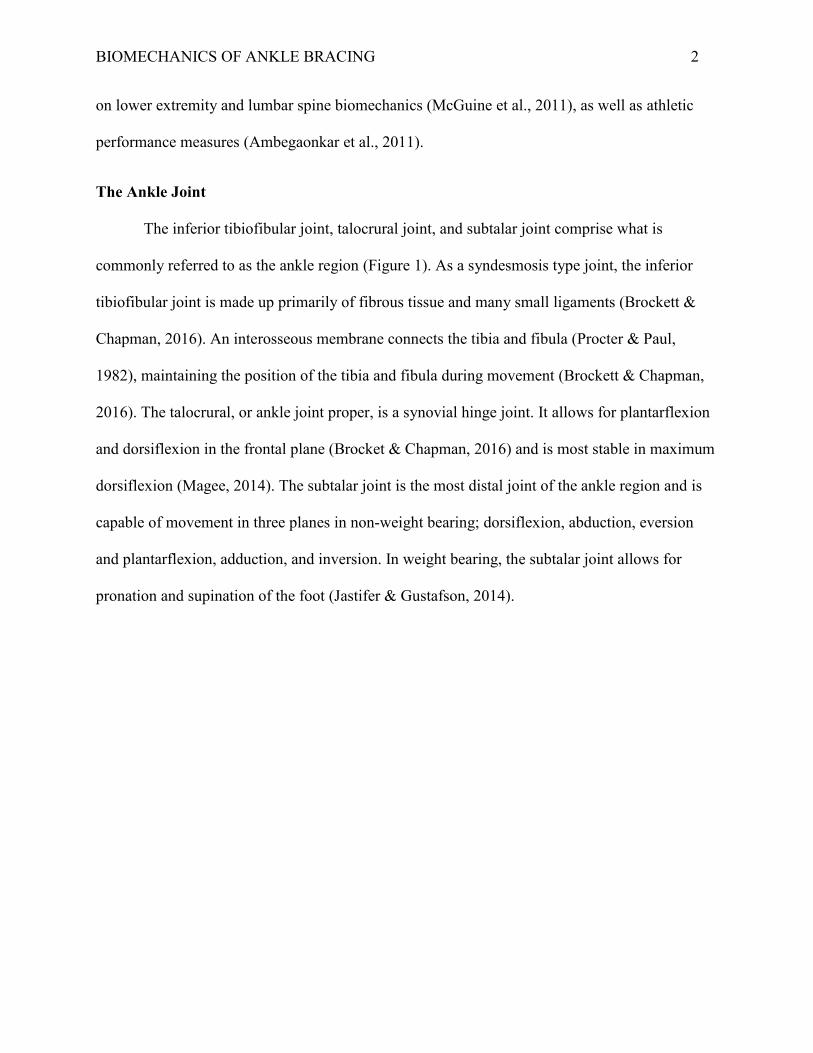
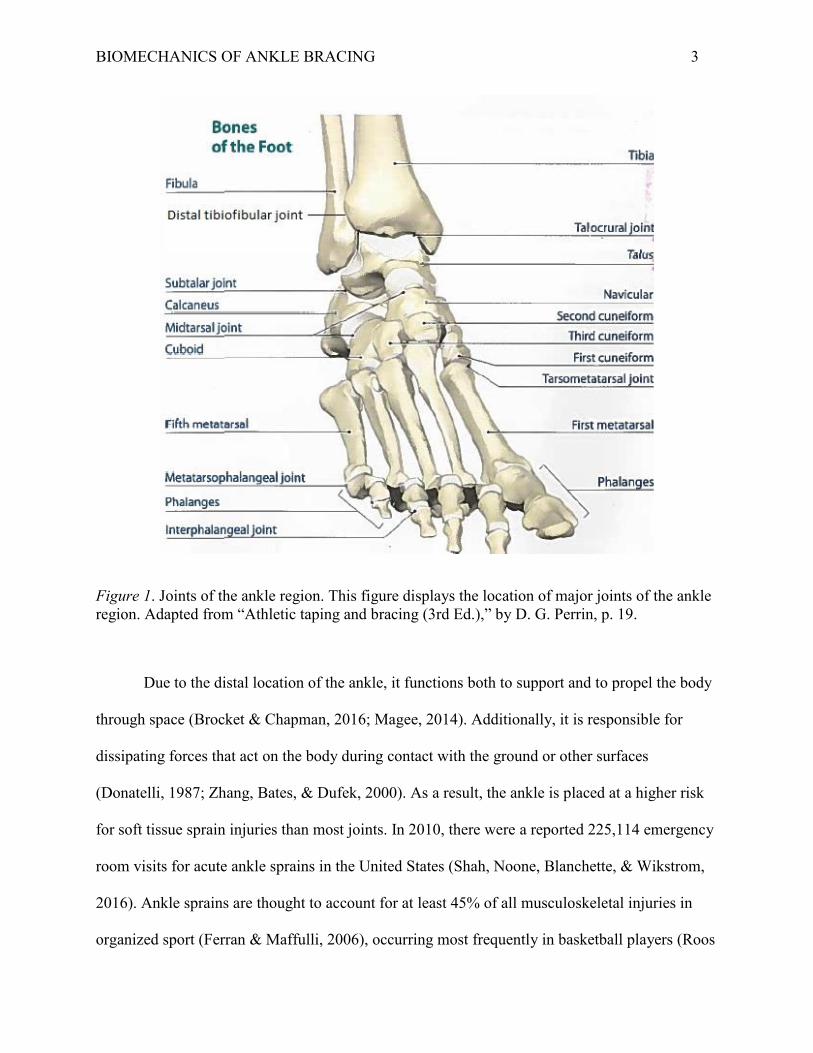
The inferior tibiofibular joint, talocrural joint, and subtalar joint comprise what is
commonly referred to as the ankle region (Figure 1). As a syndesmosis type joint, the inferior
tibiofibular joint is made up primarily of fibrous tissue and many small ligaments (Brockett &
Chapman, 2016). An interosseous membrane connects the tibia and fibula (Procter & Paul,
1982), maintaining the position of the tibia and fibula during movement (Brockett & Chapman,
2016). The talocrural, or ankle joint proper, is a synovial hinge joint. It allows for plantarflexion
and dorsiflexion in the frontal plane (Brocket & Chapman, 2016) and is most stable in maximum
dorsiflexion (Magee, 2014). The subtalar joint is the most distal joint of the ankle region and is
capable of movement in three planes in non-weight bearing; dorsiflexion, abduction, eversion
and plantarflexion, adduction, and inversion. In weight bearing, the subtalar joint allows for
pronation and supination of the foot (Jastifer & Gustafson, 2014).
BIOMECHANICS OF ANKLE BRACING 3
Figure 1. Joints of the ankle region. This figure displays the location of major joints of the ankle region. Adapted from “Athletic taping and bracing (3rd Ed.),” by D. G. Perrin, p. 19.
Due to the distal location of the ankle, it functions both to support and to propel the body
through space (Brocket & Chapman, 2016; Magee, 2014). Additionally, it is responsible for
dissipating forces that act on the body during contact with the ground or other surfaces
(Donatelli, 1987; Zhang, Bates, & Dufek, 2000). As a result, the ankle is placed at a higher risk
for soft tissue sprain injuries than most joints. In 2010, there were a reported 225,114 emergency
room visits for acute ankle sprains in the United States (Shah, Noone, Blanchette, & Wikstrom,
2016). Ankle sprains are thought to account for at least 45% of all musculoskeletal injuries in
organized sport (Ferran & Maffulli, 2006), occurring most frequently in basketball players (Roos

BIOMECHANICS OF ANKLE BRACING 4
et al., 2016). Furthermore, approximately 85% of all ankle sprains are classified as inversion type
ankle sprains (Ferran & Maffulli, 2006).
Ankle sprains. Acute ankle sprains occur when one or more of the supporting ligaments
of the ankle is stretched or torn (Figures 2 and 3). The most common mechanism of injury is
excessive inversion of the foot while in plantarflexion, coupled with external rotation of the leg,
forefoot abduction, and internal rotation of the hindfoot (Martin, Davenport, Paulseth, Wukich,
& Godges, 2013). Often, this can occur when landing on an unstable surface from a jump or
when making a sharp change in direction (Bahr, Karlsen, Liam, & Øvrebø, 1994; Ferran &
Maffulli, 2006). The ligaments most often affected with a lateral ankle sprain include the anterior
talofibular ligament (ATFL), calcaneofibular ligament (CFL), and the posterior talofibular
ligament (PTFL).
Figure 2. Lateral ankle ligaments. This figure displays the major ligaments, tendons, and bones of the lateral aspect of the foot and ankle. Adapted from “Foundations of athletic training (5th ed.),” by M. K. Anderson and G. P. Parr, p. 691.

BIOMECHANICS OF ANKLE BRACING 5
Figure 3. Medial ankle ligaments. This figure displays the major ligaments, tendons, and bones of the lateral aspect of the foot and ankle. Adapted from “Foundations of athletic training (5th ed.),” by M. K. Anderson and G. P. Parr, p. 691.
The ATFL is the weakest and most commonly affected ligament in an acute lateral ankle
sprain (van den Bekerom, Oostra, Golanó, & van Dijk, 1994; Sauer, Jungfer, & Jungbluth, 1978;
van Dijk, 2008). It connects the anterior and distal portion of the lateral malleolus to the body of
the talus. When the ankle is in plantarflexion, the ATFL functions to limit displacement of the
talus. Thus, it is also responsible for limiting inversion while the ankle is plantarflexed (van den
Bekerom et al., 2008). As such, it is the primary ligament affected when the ankle is
plantarflexed and inverted at the moment of injury (Holmer, Sondergaard, Konradsen, Nielson,
& Jorgensen, 1994).
The CFL connects the lateral and distal portion of the lateral malleolus to the calcaneus,
traversing both the talocrural and subtalar joints (Martin et al., 2013), with the fibres of the
ligament running parallel to the axis of the subtalar joint (Safran, Benedetti, Bartolozzi, &
BIOMECHANICS OF ANKLE BRACING 6
Mandelbaum, 1999). As such, it is the first ligament to be affected when the ankle is in inverted
and dorsiflexed at the moment of injury (Colville, Marder, Boyle, & Zarins, 1990).
The PTFL is the strongest of the lateral ankle ligaments, connecting the posterior medial
aspect of the medial malleolus to the lateral tubercle of the talus (van den Bekerom et al., 2008).
Due to its anatomical properties, it is rarely injured with a lateral ankle sprain. Rather, the PTFL
is usually injured when the foot is in dorsiflexion and external rotation at the moment of injury
(Butler & Walsh, 2004).
While each lateral ligament has a primary mechanism of injury, multiple ligaments and
structures can be affected depending on the severity of the injury. For example, in an acute ankle
sprain involving plantarflexion and inversion, the ATFL is the first ligament to be stressed. As
the ATFL is compromised and the inversion angle increases, the CFL can be compromised
(Anderson & Parr, 2013). Furthermore, the lateral ankle ligaments are not the only structures that
can be affected by the ankle sprain. If the inversion stress is great enough, the deltoid ligament
on the medial aspect of the foot can be compressed resulting in injury (van Dijk, Bossuyt, &
Marti, 1996). Although not as common, the deltoid ligament can also be damaged if the injury
mechanism involves dorsiflexion and eversion (Anderson & Parr, 2013). Damage to the
articular structures, syndesmosis, strains of the peroneus longus (PL) and brevis tendons, neuritis
of the intermediate and medial dorsal cutaneous nerves, peroneal nerve, and posterior tibial
nerve, avulsion fractures of the base of the fifth metatarsal, as well as the lateral and medial
malleoli can all occur concurrently with an acute ankle sprain (Fallat, Grimm, & Sarraco, 1998;
Nitz, Dobner, & Kersey, 1985).

BIOMECHANICS OF ANKLE BRACING 7
Ankle sprain classification. Acute lateral ankle sprains are often classified on a three
grade system of severity, as described by Dutton (2012), Magee (2014), and Reid (1992).
Persons presenting with a grade one sprain generally experience tenderness over the injured
ATFL with palpation. Any edema will be minimal and localized to the area of the ATFL. Partial
to full weight bearing is usually possible. There is no significant tearing of the ATFL with a
grade one sprain; as such, no instability will be present during ligament stress testing. Recovery
from a grade one sprain can range from two to 10 days (Reid, 1992).
With a grade two acute lateral ankle sprain, the ATFL and CFL may be compromised and
tender on palpation. There may be moderate edema, local to the ATFL and CFL. Persons with a
grade two ankle sprain often have difficulty bearing weight on the affected limb without external
support or crutches. As such, a noticeable limp will be present during gait. Furthermore, persons
suffering from a grade two ankle sprain will be unable to run or hop and have difficulty with
dorsiflexion and plantarflexion. A partial or full tear of the ATFL, as well as a partial tear of the
CFL is possible with a grade two sprain. This results in slight instability during ligament stress
testing. Recovery from a grade two sprain can range from 10 to 30 days (Reid, 1992).
With a grade three ankle sprain, the ATFL, CFL, and PTFL may be injured and tender on
palpation. Significant edema will be present locally and possibly on the medial and posterior
aspect of the foot. Weight bearing is not possible without significant discomfort and most people
will present with little to no active range of motion (ROM) at the ankle. A full tear of at least two
ligaments, as well as a partial tear of a third ligament may be present with a grade three sprain.
As such, there will be defined instability during ligament stress testing. In some cases, persons
with a grade three sprain may report hearing or experiencing a snapping sensation at the time of
injury. Recovery from a grade three sprain can range from 30 to 90 days (Reid, 1992).

BIOMECHANICS OF ANKLE BRACING 8
Several interventions for treating acute ankle sprains exist; however, the degree to which
these interventions are supported by the literature varies. The NATA and American Physical
Therapy Association recommend the application of cryotherapy to control edema, minimize
secondary injury, and manage pain during the acute phase of an ankle sprain (Kaminski et al.,
2013; Martin et al., 2013). Non-steroidal anti-inflammatory medications may also be used to
reduce edema and pain following an ankle sprain (Kaminski et al., 2013; Mazieres, Rouanet,
Velicy, Scarsi, & Reiner, 2005; Slatyer, Hensley, & Lopert, 1997). In the case of grade one and
grade two ankle sprains, external support, such as a softshell ankle brace is recommended to
allow for progressive weight bearing on the affected limb as soon as possible (Kaminski et al.,
2013; Martin et al., 2013). Manual therapy, such as lymphatic drainage and joint mobilizations
may also be used to reduce edema and improve ROM and weight bearing ability (Martin et al.,
2013). A therapeutic exercise program involving ROM, strength, and balance training should be
started as soon as possible following the acute phase of injury (Kaminski et al., 2013). In grade
three sprains, complete immobilization or casting of the ankle and lower leg may be necessary
(Martin et al., 2013). Immobilization should last for a minimum of 10 days, after which
therapeutic exercises should be implemented (Kaminski et al., 2013). Limited evidence exists
both for (Wilson, 1972) and against (Man, Morrissey, & Cywinski, 2007) the use of
electrotherapeutic modalities.
Because ankle sprains and injuries are relatively common, many people do not see a
healthcare provider following what he/she believes to be an ankle sprain (Robbins & Waked,
1998). Furthermore, it has been reported that many athletes do not follow a proper rehabilitation
program, returning to play when he/she is still experiencing symptoms, or with the assistance of
an ankle brace or tape (Stasinopoulos, 2004). This poses a significant danger to athletes; the risk

BIOMECHANICS OF ANKLE BRACING 9
for re-injury is greatly increased up to 12 months post injury, as the injured ligaments proceed
through the phases of soft tissue healing and return to their pre-injury strength (Bahr & Bahr,
1997). As such, the greatest predisposing factor to an ankle sprain is a previous ankle sprain
(Beynnon, Murphy, & Alosa, 2002).
Chronic Ankle Instability
Repeated trauma to the ligamentous structures of the ankle can lead to chronic ankle
instability (CAI). By definition, CAI refers to constant lateral ankle instability, which can result
in many ankle sprains over time (Hertel, 2002). Chronic ankle instability can be further divided
into mechanical instability and functional instability. Mechanical instability refers to instability
that is the result of ligamentous laxity following an injury (Tropp, Odenrisk, & Gillquist, 1985).
In comparison, functional ankle instability generally refers to the feeling of giving way in the
ankle (Freeman, 1965), characterised by deficits in proprioception and neuromuscular activity
(Hertel, 2000).
Mechanical CAI is often attributed to pathological laxity of the talocrural and subtalar
joints (Hertel, 2002; Martin, Kaplan, Kahler, Dussault, & Randolph, 1996) and results from
ligamentous injury to the ATFL and CFL (Rasmussen & Tovborg-Jensen, 1982). As the ATFL
and CFL function to provide mechanical stability to the talocrural and subtalar joints (van den
Bekerom et al., 2008), damage to these structures, especially complete ruptures, can lead to
instability. In turn, this can increase the risk of injury at the ankle (Boardman & Liu, 1997;
Hertel, 2002), alter kinematics of proximal structures during jumping (Gribble & Robinson,
2009) and hopping (Gribble, Hertel, & Deneger, 2007), and alter lower extremity muscle
activation (Feger, Donovan, Hart, & Hertel, 2014; Feger, Donovan, Hart, and Hertel, 2015).

BIOMECHANICS OF ANKLE BRACING 10
Resulting from ligamentous laxity, arthrokinematic and osteokinematic impairments
could lead to mechanical CAI. Mulligan (1995) suggested that following an acute inversion
ankle sprain, the lateral malleolus and fibula may sublux anteriorly and inferiorly. This
hypothesis is supported by Hubbard and Hertel (2008) and Mavi, Yildirim, Grunes, Pestamalci,
and Gumusburun (2002). Since the ATFL originates on the lateral malleolus and inserts onto the
talus, the resultant anterior and/or inferior displacement of the lateral malleolus creates laxity in
the ATFL by bringing the origin closer to the insertion, allowing for greater inversion of the
ankle. This malpositioning can lead to frequent episodes of instability and repeated ankle injury.
As such, this may place other lower quadrant structures in vulnerable positions (Mulligan, 1995).
In addition to malpositioning of the fibula and lateral malleolus, restricted dorsiflexion
has been demonstrated in persons diagnosed with CAI (Drewes, McKeon, Kerrigan, & Hertel,
2009; Hoch, Staton, Mckeon, Mattacola, & McKeon, 2012) and persons with previous lower
body injuries (Wiesler, Hunter, Martin, Curl, & Hoen, 1996). Green, Refshauge, Crosbie, and
Adams (2001) inferred that changes in the movement of the talus on the tibia could be the cause
of this observed restriction in dorsiflexion. The implication of reduced dorsiflexion is that the
talus is unable to tightly fit within the ankle mortise, allowing the talus to invert and the tibia and
mid foot to internally rotate with reduced mechanical resistance (Hertel, 2002; Thonnard,
Bragard, Willems, & Plaghki, 1996). By not providing adequate mechanical resistance to
inversion and rotation, the mechanism for a lateral ankle sprain may be enhanced.
While no universal definition of functional CAI exists, it is generally referred to as
instability during dynamic tasks resulting from neuromuscular deficits (Konradsen, 2002).
During gait, altered lower extremity motor recruitment patterns have been identified in ankles
with CAI. Santilli et al. (2005) examined muscle activation of the PL muscle in athletes with

BIOMECHANICS OF ANKLE BRACING 11
CAI, comparing each participant’s unstable ankle to his/her healthy ankle. A significant decrease
in PL activity during the stance phase of gait was recorded for the unstable ankle. Feger et al.
(2015) also examined PL, as well as tibialis anterior (TA), lateral gastrocnemius (LG), biceps
femoris (BF), rectus femoris (RF) and gluteus medius (GM) muscle activation during gait in
ankles with CAI and the corresponding lower limb. Unlike Santilli et al., Feger et al. compared
persons with CAI to a matched control group with no ankle instability. In contrast to Santilli et
al., PL was significantly more active during the stance phase in unstable ankles, compared to
healthy ankles. Additionally, activation of the PL and RF occurred significantly earlier during
the stance phase. Although not significant, TA, LG, BF, and GM were also activated earlier in
the CAI group, relative to the healthy control group. While these studies present contradictory
findings, both observed significant differences in muscular activation patterns in ankles with
CAI, suggesting that unstable ankles can influence motor programing and muscular activation of
the lower extremity during gait.
Alterations in muscular activation patterns of the lower extremity in persons with CAI
have also been observed during balance, lunging, and hopping tasks. Feger et al., (2014) had
participants with and without CAI perform a forward lunge exercise, lateral hopping exercise,
single leg-eyes closed balance test, and the Star Excursion Balance Test (SEBT) while
monitoring activation of the TA, PL, LG, BF, RF, and GM. During the lunge exercise, there was
a decrease in total reflexive muscle activity of the corresponding limb after ground contact in
persons with CAI. A similar decrease was observed during the SEBT and single limb balance
test. During the forward lunge and lateral hopping exercises, a total decrease in preparatory
muscular activation prior to ground contact was also observed in the CAI group, further
indicating that CAI can affect muscular activation and motor programming.

BIOMECHANICS OF ANKLE BRACING 12
In addition to reduced muscular activation of the unstable ankle and corresponding lower
limb, alteration in muscular activation of the unaffected limb has been reported in persons with a
history of ankle sprains. Bullock-Saxton, Janda, and Bullock (1994) examined muscular
activation of the hamstrings, gluteus maximus, and erector spinae muscles during prone hip
extension in persons with and without a history of grade one and grade two ankle sprains.
Compared to the healthy control group, the onset of gluteus maximus activation was significantly
slower on both the injured and uninjured sides. The authors attributed this delay in gluteus
maximus muscle activation to altered mechanoreceptor input, suggesting that altered afferent
feedback from the ankle could influence motor planning and muscle recruitment further up the
kinetic chain.
Mechanoreceptors are sensory structures that detect changes in speed and force of a
movement, providing afferent feedback to the central nervous system (CNS). In muscles, these
include muscle spindles and Golgi tendon organs. Muscle spindles primarily serve to detect
changes in muscle length during movement (Powers & Howley, 2012). Therefore, muscle
spindles may play a key role in generating stretch reflex responses; more specifically, reflexes
designed to contract lower extremity muscles to maintain foot posture when on an uneven
surface (Freeman, Dean, & Hanham, 1965). Damage to the mechanoreceptors in the ankle from
an ankle sprain have been hypothesized to cause proprioceptive deficits in the ankle (Konradsen
& Ravn, 1990) in addition to increasing postural sway (Konradsen & Ravn, 1991). Furthermore,
the loss of eversion strength due to a reduction in motor unit recruitment has been observed when
the peroneal muscles are torn following an inversion ankle sprain (Kleinrensink et al., 1994). As
such, current recommendations for CAI involve addressing functional deficits (i.e., strength,
proprioception, balance), while promoting typical movement patterns (i.e., walking, running,
BIOMECHANICS OF ANKLE BRACING 13
stepping; Kamiski et al., 2013). When used in conjunction with a functional rehabilitation
program, ankle braces are thought to increase afferent feedback from sensory structures in the
foot (Feuerbach, Grabiner, Koh, & Weiker, 1994), and are often worn by persons with CAI to
provide additional mechanical stability to the ankle during movement (Barlow, Donovan, Hart,
& Hertel, 2015).
Ankle Braces and Taping
Taping of the ankle joint is a common practice in sport as a treatment and preventative
measure for ankle sprains (Paris, 1992) and represents the most popular method of ankle injury
prevention (Stasinopoulos, 2004). Ankle taping, however, is expensive and requires qualified
personnel to apply (Bot & van Mechelen, 1999; Burks, Bean, Marcus, & Barker, 1991). Despite
this, it is not uncommon for teams in jumping sports to have mandatory bracing or taping
policies (Pedowitz, Reddy, Parekh, Huffman, & Sennet, 2008). It is estimated that, at Lakehead
University alone, up to $300 CAD per basketball player can be spent annually on athletic tape; in
addition to hundreds of athletic trainer hours spent taping. Such expenses are not restricted to
Lakehead University; in 1991, an estimated $16,000 USD was spent to tape the entire University
of Utah football player’s ankles for one season (Burks et al., 1991). Adjusted for inflation, this
would equal $29,316 USD in 2018. The overall cost of ankle taping represents a significant
budgetary and time constraint on both institutions and their personnel. As such, reusable ankle
braces have become a popular alternative to ankle taping (Frey, Feder, & Sleight, 2010;
Pienkowski, McMorrow, Shapiro, Caborn, & Stayton, 1995).
Several models of ankle braces are available commercially (Frey et al., 2010). Most ankle
braces are classified as either a softshell ankle brace or a semi-rigid ankle brace. Softshell ankle
braces, such as the ASO® EVO® (AE; Figure 4), generally have a lace-up design and are built

BIOMECHANICS OF ANKLE BRACING 14
of a nylon material. Additional features may, or may not, include heel-lock or horseshoe straps
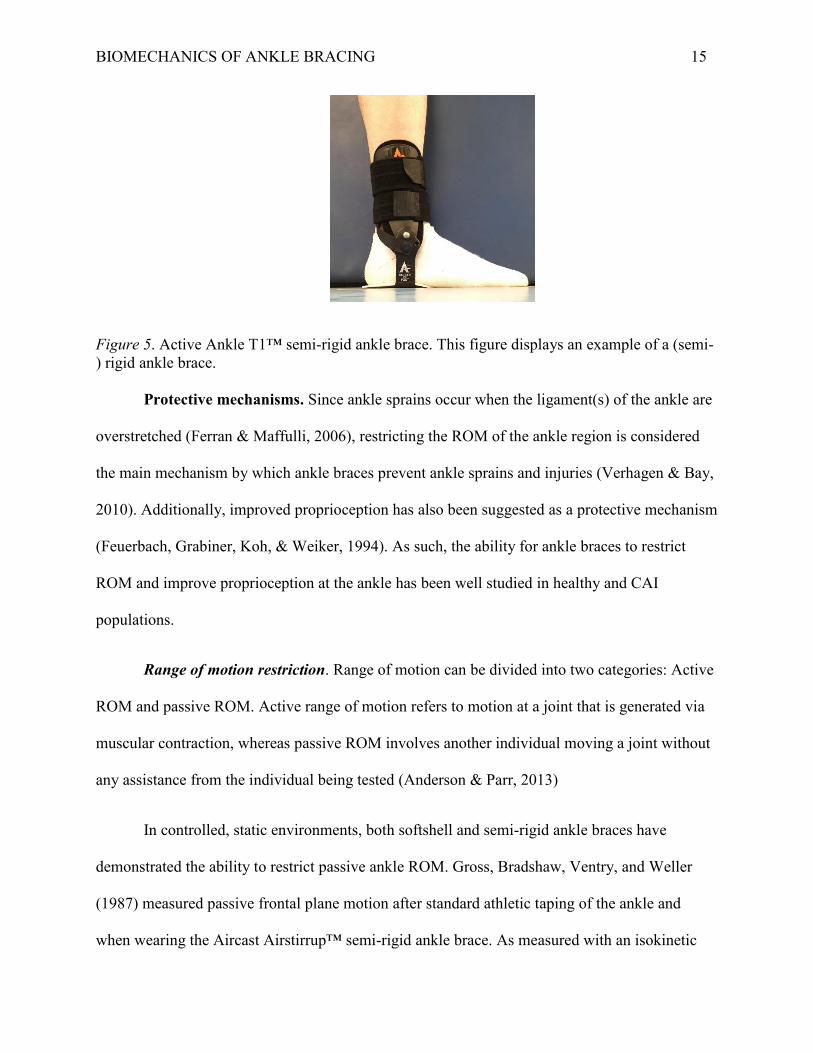
(Gudibanda & Wang, 2005). Semi-rigid ankle braces, such as the Active Ankle T1™ (T1; Figure
5) have a hinge that sits underneath the heel, while the medial and lateral aspect of a semi-rigid
brace is composed of a rigid shell (MacKean, Bell, & Burnham, 1995). Theoretically, this allows
for unrestricted movement in the sagittal plan, while restricting movement in the frontal plane
(Mackean et al., 1995). As such, there are structural differences between brace styles that affect
how they function. Despite their structural differences, both styles of braces are commonly used
across sports (Stasinopoulos, 2004).
Figure 4. ASO® EVO® softshell ankle brace. This figure displays an example of a softshell brace.
BIOMECHANICS OF ANKLE BRACING 15
Figure 5. Active Ankle T1™ semi-rigid ankle brace. This figure displays an example of a (semi-) rigid ankle brace. Protective mechanisms. Since ankle sprains occur when the ligament(s) of the ankle are
overstretched (Ferran & Maffulli, 2006), restricting the ROM of the ankle region is considered
the main mechanism by which ankle braces prevent ankle sprains and injuries (Verhagen & Bay,
2010). Additionally, improved proprioception has also been suggested as a protective mechanism
(Feuerbach, Grabiner, Koh, & Weiker, 1994). As such, the ability for ankle braces to restrict
ROM and improve proprioception at the ankle has been well studied in healthy and CAI
populations.
Range of motion restriction. Range of motion can be divided into two categories: Active
ROM and passive ROM. Active range of motion refers to motion at a joint that is generated via
muscular contraction, whereas passive ROM involves another individual moving a joint without
any assistance from the individual being tested (Anderson & Parr, 2013)
In controlled, static environments, both softshell and semi-rigid ankle braces have
demonstrated the ability to restrict passive ankle ROM. Gross, Bradshaw, Ventry, and Weller
(1987) measured passive frontal plane motion after standard athletic taping of the ankle and
when wearing the Aircast Airstirrup™ semi-rigid ankle brace. As measured with an isokinetic

BIOMECHANICS OF ANKLE BRACING 16
device, passive ROM in the frontal plane was significantly reduced by 28% in healthy
individuals after the application of athletic tape. After 10 minutes of continuous running,
however, the ability for athletic tape to reduce passive inversion ROM at the ankle was
insignificantly reduced by 5°. In comparison, ankle bracing was able to restrict passive ROM in
the frontal plane by 38% immediately after application. A similar reduction was present after 10
minutes of continuous running, suggesting that a semi-rigid ankle brace may maintain its ability
to restrict passive inversion ROM at the ankle after exercise better than athletic taping.
Greene and Roland (1989) investigated the effects of the Donjoy® Ankle Ligament
Protector semi-rigid ankle brace on active ankle ROM. Healthy individuals with no recent
history of ankle sprains had his/her active ROM in the frontal plane assessed with and without
the semi-rigid ankle brace. As measured with an isokinetic device, total active ROM in the
frontal plane was reduced significantly by 30%. This mean reduction in total active ROM was
also observed after a 20 minute dynamic exercise session, indicating that the ability for the semi-
rigid ankle brace to restrict ROM did not decrease after exercise. More recently, Tang, Wu,
Liao, and Chan (2010) measured the ability of the Aircast Airstirrup™ semi-rigid ankle brace to
restrict motion during a 30° perturbation. Participants stood in weight bearing on an inversion
platform while either the left or right side of the platform unexpectedly dropped to 30°, creating
a dynamic supination of the foot. In healthy participants, ankle inversion displacement was
significantly reduced by 6° during the perturbation, compared to when he/she was barefoot.
Additionally, plantarflexion displacement significantly decreased by 3° when wearing the ankle
brace. As such, in persons with no reported instability of the ankle, semi-rigid ankle reduced
motion in the frontal and sagittal planes.
BIOMECHANICS OF ANKLE BRACING 17
In persons with CAI, Eils et al. (2002) compared four softshell and six semi-rigid ankle
braces and their ability to restrict passive and dynamic ankle ROM. Using an isokinetic device,
semi-rigid and softshell ankles braces significantly reduced passive ankle ROM in the frontal
plane compared to the no ankle brace control condition. A much larger reduction was evident in
the semi-rigid ankle brace models compared to the softshell ankle brace models. Similar
reductions of passive ankle supination and pronation ROM was present in both brace types.
Although passive ankle ROM in the sagittal plane was reduced with both styles of braces, the
semi-rigid ankle brace models reduced plantarflexion and dorsiflexion motion more than the
softshell ankle braces. This is surprising, given that most semi-rigid ankle braces are designed to
allow for unrestricted plantarflexion and dorsiflexion (MacKean et al. 1995). As expected, semi-
rigid ankle brace models were more effective for reducing supination during a sudden ankle
perturbation than their softshell counterparts. While semi-rigid ankle braces restricted ankle
ROM more than softshell ankle braces, none of the softshell ankle brace models incorporated
heel-lock or horseshoe straps. Since the purpose of the heel-lock and horseshoe straps is to
further reduce sagittal and frontal plane motion of the ankle, a greater restriction of movement
may have been observed in softshell ankle braces with heel-lock and horseshoe strap designs.
A softshell ankle brace with heel-lock straps was included in Alfuth, Klein, Koch, and
Rosenbaum’s (2014) investigation of dynamic and passive stabilization when wearing an ankle
brace. Healthy participants had his/her ankle supination measured with an in-shoe goniometer
during an unexpected 30° ankle perturbation. The maximum supination angle when not wearing
the ankle brace was 41.8°. When wearing the Aircast AirGo™ softshell ankle brace, the
maximum supination angle was significantly reduced to 24.6°. The maximum supination angle
was reduced to 27.1° and 23.6°, respectively, when wearing the Darco Body Armor® Embrace
BIOMECHANICS OF ANKLE BRACING 18
and McDavid Ankle X™ semi-rigid braces, respectively. Passive ROM was also assessed using
an isokinetic device; all braces significantly reduced passive ROM in the frontal plane compared
to the no ankle brace control condition. A significant reduction of passive internal rotation was
observed when wearing all three ankle braces. Additionally, passive plantarflexion was
significantly reduced when wearing the softshell and semi-rigid ankle braces, with the softshell
ankle brace providing the most passive restriction in the sagittal plane. When compared to Eils et
al. (2002), it appears that incorporation of a heel-lock strap in the design of a softshell ankle
brace can significantly improve the restrictive properties in both the sagittal and frontal planes.
Although this study only examined healthy individuals and one softshell ankle brace model,
similar restrictive properties in a softshell ankle brace were reported by Miller, Needle, Swanik,
Gustavsen, and Kaminski (2012).
Miller et al. (2012) compared the passive ankle ROM restriction capabilities of the AE
softshell ankle brace and standard athletic taping, both forms of external ankle supports that
incorporated heel-lock strap designs. To compare ankles with and without CAI, both ankles of
each participant were categorized by the score on the 30-point Cumberland Ankle Instability
Tool (CAIT) and self reported ankle sprain history. Ankles were assigned to either the healthy
control group (CAIT score greater than 28, no previous ankle sprains), previous history group
(CAIT score greater than 28, previous ankle sprain), or unstable ankle group (CAIT score less
than 24, previous ankle sprains). Using an isokinetic device, participant’s maximum inversion,
eversion, and anterior displacement were measured after the application of an external support,
after 20 minutes of jumping, running, and agility exercise, and after the removal of the external
ankle support. In all groups, the AE ankle brace and standard athletic taping significantly
restricted inversion and eversion motion, as well as anterior displacement before exercise. This
BIOMECHANICS OF ANKLE BRACING 19
reduction was also present after exercise; however, it was slightly reduced compared to the pre-
exercise values. As such, it appeared that external devices that incorporated heel lock straps to
restrict sagittal plane motion were able to maintain this restriction after the completion of the
exercise.
The aforementioned studies examining ankle bracing and ROM restriction lend support
to the notion that ankle braces significantly reduce passive and active ROM in all planes, as well
as supination movement of the ankle during a perturbation. Results from Simpson, Cravens,
Higbie, Theodorou, and Delrey (1999), however, suggested that this may not be the case. During
a lateral cutting task, plantarflexion was reduced when wearing the Aircast Airstirrup™,
MalleoLoc® semi-rigid ankle brace, and the Swede-o®® softshell ankle brace compared to the
no brace control condition. Despite this, no significant differences were observed in the dynamic
supination angle between the three ankle braces and the no brace control condition. As all study
participants had at least one previous ankle sprain, the authors suggested that the lack of
reduction in supination angle could have been the result of participants being hesitant about
performing the task in the no ankle brace control condition. Despite the results of this study, it
appears that ankle braces are effective for restricting ROM at the ankle.
Improved proprioception. Another suggested mechanism by which ankle bracing
decreases the risk of injury is by improving proprioception at the ankle (Olmsted, Vela, Denegar,
& Hertel, 2004). Although definitions vary, proprioception generally refers to the awareness of
the body or a body part, such as the ankle, in space (Johnson & Soucacos, 2010). As such,
proprioception is heavily reliant on afferent feedback from receptors in muscle, tendons, and skin
during movement (Lephart, Pincivero, & Rozzi, 1998). Freeman et al. (1965) suggested that,
after an ankle sprain, the mechanoreceptors of the ankle are damaged. As such, this leads to

BIOMECHANICS OF ANKLE BRACING 20
improper ankle joint positioning, placing the ankle in a vulnerable position for further injury. By
applying an ankle brace, it is thought that cutaneous receptors in the contacted skin area become
more active, increasing afferent feedback to the central nervous system, resulting in improved
joint positioning awareness (Feuerbach et al., 1994).
The effect that a semi-rigid ankle brace compared to anesthetizing the ATFL and CFL on
joint repositioning capabilities was investigated by Feuerbach et al. (1994). The right (dominant)
foot in healthy participants was passively placed into a total of nine different positions,
incorporating all three planes of motion. After being passively placed into each position by the
researcher, participants were then required to actively recreate the position. Participants
completed the protocol without an ankle brace and then repeated it when wearing the Aircast
Airstirrup™ semi-rigid ankle brace. Participants then repeated the protocol with the ATFL and
CFL anesthetized. When wearing a semi-rigid ankle brace without having the ATFL and CFL
anesthetized, absolute error in joint position replication was significantly reduced, supporting the
notion that mechanoreceptors in the ankle contributed to joint positioning awareness when
stimulated by an ankle brace. No difference in absolute error, however, was observed following
the anesthetizing the ATFL and CFL. As such, mechanoreceptors in the lateral ligament complex
may not contribute significantly to ankle proprioception. Rather, the authors suggested that
stimulation of the cutaneous receptors in the skin may be responsible for improved ankle
proprioception when wearing an ankle brace.
The results of Feuerbach et al.’s (1994) study are also supported by Heit, Lephart, and
Rozzi (1996). The ability of healthy participants to actively reproduce ankle positions with the
right ankle was examined when wearing the Swede-o® softshell ankle brace compared to the
application of standard athletic taping of the ankle and when barefoot. Participants were

BIOMECHANICS OF ANKLE BRACING 21
passively moved into either 30° of plantarflexion or 30° of inversion using an isokinetic device.
Participants where then required to actively recreate the position. The use of a Swede-o® ankle
brace significantly improved the participant’s ability to reproduce active plantarflexion angle, yet
there was no significant improvement in his/her ability to reproduce the inversion angle. Again,
the authors hypothesized that this improvement in joint position was the result of enhanced
stimulation of the cutaneous receptors in the skin and mechanoreceptors in the ankle ligaments.
This effect may be specific to plantarflexion, however, as the softshell ankle brace failed to
improve inversion position reproduction.
Ankle Bracing and Injury Prevention
Irrespective of the mechanism by which ankle braces prevent ankle injuries, the current
epidemiological evidence suggests that, overall, they are effective. Recent systematic reviews by
Leppänen et al. (2014) and Petersen et al. (2013) concluded that in the athletic populations,
wearing ankle braces reduced the overall risk of ankle injuries. As such, the NATA currently
recommends that all athletes returning to play from an ankle injury wear ankle braces (Kaminski
et al., 2013). While the majority of epidemiological studies support wearing ankle braces to
reduce the risk of ankle injury, a few studies have not come to this conclusion. Furthermore, it
appears that the ability for ankle braces to reduce the risk of ankle injury may be dependent upon
whether or not the person has a prior history of ankle injury.
In a sample of 52 female volleyball players with and without a prior history of ankle
sprains, Stasinopoulos (2004) investigated the effectiveness of three different interventions for
reducing the incidence of ankle sprains: technique training, proprioceptive training, and wearing
the Aircast Airstirrup™ semi-rigid ankle brace. The technique training focused on attacking and
blocking approaches with an emphasis placed on the final approach step and ensuring that
BIOMECHANICS OF ANKLE BRACING 22
players jumped straight up when attacking the ball. Proprioceptive training had players perform
exercise on a balance board for 30 minutes per day. The ankle brace group was instructed to
wear the Aircast Airstirrup™ ankle brace bilaterally for all games and practices. All three
interventions reduced the number of ankle sprains, with technique training being the most
effective and the Aircast Airstirrup™ ankle brace being the least effective. Despite this, in
players who sustained more than four ankle sprains in his/her career, the Aircast Airstirrup™
ankle brace did not reduce the incidence of ankle sprains. In comparison, technique and
proprioceptive training still decreased the number of ankle injuries in persons who sustained
more than four ankle sprains. As such, the results of this study suggested that neuromuscular
deficits may arise from repeated ankle sprains, and that addressing these deficits may be more
beneficial for preventing repeated ankle sprains than the use of ankle braces.
Frey et al. (2010) conducted a prospective comparative study examining the effect of
ankle bracing on ankle injury rates in 999 high school volleyball players. A total of five softshell
and semi-rigid braces were examined. Compared to players who did not wear ankle braces,
players who wore ankle braces did not experience a significant reduction in ankle injuries. When
comparing male and female participants, there were significantly more injuries in female players
who wore softshell ankle braces, compared to males wearing the same softshell ankle brace.
Additionally, there were significantly more ankle injuries in women who wore semi-rigid ankle
braces, compared to women who wore softshell ankle braces. Furthermore, when controlling for
participants who had a previous history of ankle injury, the Active Ankle T2™ and Aircast
Airsport™ semi-rigid ankle braces only reduced the risk of ankle injury in persons without a
previous history of ankle injury. Based on this study, it appears that sex and brace style may
influence the effectiveness of ankle braces for reducing ankle injuries. The results of this study
BIOMECHANICS OF ANKLE BRACING 23
also lend support to Stasinopoulos (2004), in that the ability of ankle braces to reduce ankle
injuries may be decreased in persons who sustained previous ankle sprains or injuries. There is
research, however, to suggest that ankle braces are only effective in persons with a previous
history of ankle sprains.
Surve, Schwellnus, Noakes, and Lombard (1994) conducted a randomized prospective
clinical trial examining the relationship between Aircast Airstirrup™ semi-rigid ankle braces and
ankle injuries in competitive soccer players. In persons with no history of ankle sprains (n =
246), compared to the no prior history and no brace control group, the Aircast Airstirrup™ ankle
braces did not reduce the number of ankle sprains during one season. Conversely, in persons
with a prior history of ankle sprains (n = 258), wearing the Aircast Airstirrup™ ankle braces
significantly reduced the incidence of ankle sprains compared to the prior history and no brace
control group. In addition to recording the incidence of ankle sprains, Surve et al. also
documented the severity of all ankle injuries that occurred during the study. There was no
difference in the severity of ankle sprains between the no history ankle brace group and the
control group. Persons with a prior history of ankle sprains, however, who wore semi-rigid ankle
braces experienced fewer severe (grade two and three) ankle sprains than the control group.
Surve et al. (1994) noted that semi-rigid ankle braces were more effective for decreasing
injury severity in persons who had a prior history of ankle sprain than persons who did not. The
same cannot be said for softshell ankle braces. McGuine, Hetzel, Wilson, and Brooks (2012)
conducted a randomized controlled trial of 2,081 high school basketball players, comparing the
incidence and severity of lower extremity injuries in persons who wore softshell ankle braces to
persons who did not. Over the course of a full season, persons who wore AE ankle braces
experienced significantly less ankle injuries than those who did not wear ankle braces. Despite
BIOMECHANICS OF ANKLE BRACING 24
reducing the number of ankle injuries, however, softshell ankle braces did not reduce the severity
of ankle injuries. Unlike Surve et al., these differences were still present when controlling for a
prior history of ankle injuries and sex. Additionally, incidence and severity of lower extremity
injuries were similar between the ankle brace and no ankle brace control conditions.
McGuine et al. (2012) did not report any differences in lower extremity injuries between
the softshell ankle brace and no ankle brace control conditions, although this was not the result
of a previous study. McGuine, Brooks, and Hetzel (2011) conducted a similar study of high
school basketball players (n = 1460) and noted that AE ankle braces significantly reduced ankle
injuries compared to the no ankle brace control condition. The severity of ankle injuries was also
similar between ankle brace and no ankle brace conditions. Again, these results did not change
significantly when controlling for prior ankle injury and sex. Unlike McGuine et al. (2012),
however, there was a non-significant 85% increase in lower extremity injuries that were not
ankle related when wearing a softshell ankle brace. The majority of these injuries were acute
musculoskeletal strains of the lower leg, upper leg, and hip. As such, McGuine et al. (2011)
suggested that further research be done on the effects of ankle braces on lower extremity and
lumbar spine biomechanics.
Although McGuine et al. (2011) found that ankle braces were effective for reducing ankle
injuries, it is not the first study to suggest that wearing prophylactic equipment may increase the
risk of injury. Yang et al. (2005) conducted a 3 year prospective cohort study examining
prophylactic equipment use in high school athletes and its relation with lower extremity injury
rates and severity. A total of 19,728 athletes from 12 different sports were surveyed regarding
his/her use of prophylactic equipment such as knee braces, knee pads, and ankle braces. Athletes
were also asked about their previous history of injury. Injury and exposure reports were filled out

BIOMECHANICS OF ANKLE BRACING 25
weekly by designated data collectors at the athlete’s institution. Overall, lower extremity injury
rates were reduced when wearing prophylactic equipment, especially when wearing knee pads.
Despite this, when controlling for the type of equipment, knee braces and ankle braces were
associated with a greater risk of any lower extremity injury. The authors speculated that the
reduction in injuries when wearing knee pads, compared to knee and ankle braces were the result
of design; knee pads provide protection without the use of rigid materials or significant ROM
restriction, whereas braces can often incorporate rigid materials and restrict ROM. Furthermore,
braces may slip out of position, unfavourably altering their function. While it is important to
acknowledge the many limitations of this study (i.e., self reported, consistency of prophylactic
equipment use, intensity of practice), given the results of McGuine et al. (2011), more research
investigating the effects of prophylactic equipment use on the biomechanics of the lower
extremity and injury is warranted.
Biomechanics of Ankle Bracing
Biomechanically, much is known about the regional effects of wearing ankle braces. As
previously mentioned, restriction of ankle ROM is considered the primary protective mechanism
of an ankle brace (Verhagen & Bay, 2010). The effects of restricting normal ankle ROM on
kinetics, kinematics, and electromyography (EMG) of the lower extremity, however, are not well
understood. During a jump landing, many biomechanical factors have been associated with
reduced ground reaction forces (GRFs). These factors include: larger knee flexion angles (Dufek
& Bates, 1990; Wernli, Ng, Phan, Davey, & Grisbrook, 2016), lower extremity extensor and
flexor, eccentric and concentric contraction (Devita & Skelly, 1992), and increased dorsiflexion
and plantarflexion ROM (Gross & Nelson, 1988). As such, both kinematic and EMG variables
may play a role in reducing the GRFs. How these variables are affected by an ankle brace
BIOMECHANICS OF ANKLE BRACING 26
remains unclear. Decreased quadriceps muscle activity and increased soleus muscle activity was
observed when plantarflexion was artificially reduced during the eccentric portion of a squat
(Macrum, Bell, Boling, Lewek, & Padua, 2012). Given that ankle braces have been shown to
restrict dorsiflexion and plantarflexion, similar changes in lower extremity muscular activation,
as well as kinematic changes may be present during other athletic tasks. As such, the body’s
ability to naturally attenuate GRFs during a jump landing or cutting task may be affected.
Furthermore, this may also lead to reductions in performance during athletic performance
measures, such as when assessing vertical jump height. Despite this, few studies have explored
the kinetics and kinematics when wearing ankle braces during jumping, cutting, and agility tasks
or maneuvers. Furthermore, no studies have examined the effects of ankle braces on proximal
lower extremity muscular activation during jumping, cutting, agility tasks, or maneuvers.
Kinetics. In biomechanics, kinetics refers to the study of forces such as shear, torque, and
GRFs (Hall, 2012). Much of the literature examining the kinetics of wearing ankle braces has
investigated the effects on GRFs.
Ground reaction forces. Ground reaction forces are based on Newton’s Third Law of
Motion; for every action, there is an equal and opposite reaction (Hall, 2012). Applied to the
human body, GRFs represent the force exerted by the ground on bodily contact, measured in
vertical (Fz), anteroposterior (Fy), and mediolateral planes (Fx; Nilsson & Thorstensson, 1989). It
is theorized that if external loads and forces, such as GRFs, exceed that which can be dissipated
by the musculoskeletal system, injury to the lower extremity may occur (Dufek & Bates, 1990).
This makes the magnitude, as well as the time over which the force is applied (impulse)
important from an injury perspective. When landing from a 30 cm jump, GRFs have been shown
to be an average of 4.6 bodyweights greater than standing (McNair & Prapayessis, 1999). During
BIOMECHANICS OF ANKLE BRACING 27
normal running gait, GRFs during foot impact have been shown to be 1.6 to2.3 times that of
bodyweight, while GRFs during the propulsive phase averaged 2.5 to 2.8 times that of
bodyweight (Munro, 1987). Given the magnitude of GRF generated during these tasks,
effectively attenuating these forces may play a key role in preventing lower extremity injury.
Jumping. Recently, Castro, Goethel, Gáspari, Crozara, and Gonҫalves (2017)
investigated GRFs during a basketball rebound jump in 11 adolescent basketball players when
wearing bilateral Horse Jump® softshell ankle braces. After performing a vertical jump to a
standardized height for each participant, a basketball was hung overhead, to approximately 95%
of the vertical jump height. In a countermovement fashion using both hands, participants were
instructed to jump up and touch the basketball. To measure GRFs, participants performed each
jump on a force platform. Each participant performed the task with and without bilateral Horse
Jump® ankle braces. During takeoff, Horse® jump ankle braces did not affect peak vertical GRF
or vertical impulse, nor were lateral and medial GRF peaks affected. A significant reduction,
however, was observed upon landing in lateral and medial GRF peaks, but not vertical peak GRF
or impulse.
Riemann, Schmitz, Gale, and McCaw (2002) also investigated GRFs during a jump when
wearing ankle braces. Unlike Castro et al. (2017), Riemann et al. utilized a single leg drop
landing, in addition to an exercise bout to gauge the ability for ankle braces to maintain any
potential effects on GRFs after usage. Fourteen physically active college students performed a
stiff and soft single leg drop landing under three bilateral conditions on 3 separate days: no ankle
support control, Aircast Airstirrup™ semi-rigid ankle brace, and standard athletic taping
(modified Gibney technique) of the ankle. Participant’s then ran on a treadmill for 20 minutes at
65-70% of his/her heart rate reserve, before performing the landings once again. When wearing
BIOMECHANICS OF ANKLE BRACING 28
the Aircast Airstirrup™ ankle braces, the time to maximum vertical GRF was significantly less
than the no ankle support control condition, before and after exercise and during both types of
landings. As such, while the magnitude of vertical GRF was not affected, the rate at which this
peak value was reached increased. The authors suggested that this may be due to the reduction
of ankle ROM provided by the application of athletic taping to the ankle, as well as the use of the
semi-rigid ankle braces. Only GRF data were collected in this study, making any mechanisms
behind this speculative at best. Therefore, the implications of reaching maximum vertical GRF
magnitude more quickly are unknown.
Cutting tasks. Cloak, Galloway, and Wyon (2010) compared mediolateral GRFs during a
sidestep cutting task with and without bilateral Aircast Airstirrup™ semi-rigid ankle braces. Ten
healthy, male basketball players approached a force platform at speeds between 4.5 and 5.5
metres per second. When the dominant foot made contact with the force platform, participants
cut 45° from the original plane. When wearing the Aircast Airstirrup™ ankle braces, peak
mediolateral GRF was significantly reduced, compared to the no ankle brace condition. No other
GRF variables were reported. de Comargo Neves Sacco et al. (2006), however, performed a
similar study (n = 8) using a basketball cutting maneuver, separating the time in contact with the
force plate into two phases: foot contact and propulsive. While no significant differences were
found between the Aircast Airstirrup™ ankle braces, athletic taping, and no ankle brace
conditions at the point of foot contact, there was a significant reduction in peak vertical GRF
during the propulsion phase, as well as the time to reach peak vertical GRF. Impulse measures
were not significantly different between conditions. This is interesting to note, given that GRF is
related to the ability to produce power in the lower extremity (Cordova & Armstrong, 1996).
Although time to complete the maneuver was not recorded, decreased GRF at the propulsive

BIOMECHANICS OF ANKLE BRACING 29
phase of cutting may be indicative of reduced power, thus impacting on speed and performance.
Without data concerning time to peak GRF, however, this is speculative and only represents one
possibility. Therefore, the mechanisms behind any such change in GRF during the propulsive
phase or performance remains unclear without additional kinetic and/or kinematic data.
Kinematics. In biomechanics, kinematics describes motion without reference to the
forces causing motion. Linear and angular kinematic variables include distance, displacement,
acceleration, and velocity. (Hall, 2012). The majority of research examining lower extremity
kinematics when wearing ankle braces has focused on position and movement of the hip and
knee. An even larger focus has been placed on the kinematics of the knee when wearing ankle
braces, as large internal and external rotation ROM at the knee joint (Noyes, Mooar, Matthews,
& Butler, 1983), increased knee extension (Podraza & White, 2010), and knee abduction angle
(Hewett, Torg, & Boden, 2009) has been associated with anterior cruciate ligament injury
(ACL). As such, if ankle braces were to increase these variables, mechanisms of ACL injury may
be promoted.
Kinetics and kinematics of ankle bracing.
Jump landings. Landing from a jump is a physical task required in many sports and is one
of the predominant mechanisms of noncontact knee (Boden et al., 2000) and ankle injuries
(Caulfield & Garret, 2004; McKay et al., 2001). In kinetic and kinematic analyses of the knee
and hip when wearing ankle braces, results have been mixed. Hodgson, Tis, Cobb, and Higbie
(2005) examined the effect of semi-rigid ankle braces on lower extremity kinematics and kinetics
during a simulated, two foot jump landing. Twelve healthy female collegiate volleyball players,
all of which had experience wearing the Active Ankle T2™ semi-rigid ankle brace, suspended
themselves 0.61 metres above a force platform. This was accomplished by having the participant
BIOMECHANICS OF ANKLE BRACING 30
hang from an adjustable bar, from which the participant would let go and land with the left foot
in contact with the force platform. Participants completed two drop landings with and without
bilateral Active Ankle T2™ ankle braces. No significant differences were found in knee and hip
kinematics when completing the task with or without Active Ankle T2™ ankle braces. Peak
vertical GRF and loading rate during toe contact, however, was significantly greater when
wearing the Active Ankle T2™ ankle braces. This was accompanied by a significant decrease in
ankle angle change at touchdown. As such, it would appear that the Active Ankle T2™ ankle
braces restrict ankle ROM during landing, potentially increasing vertical GRF by reducing total
displacement of the ankle.
Similar results were noted by Simpson et al. (2013) using softshell ankle braces. Sixteen
healthy, athletic females suspended themselves 0.43 metres above the ground by hanging on to
an adjustable bar. Participants then let go of the bar and landed with the dominant foot on the
force platform. Participants completed the hanging drop with and without bilateral ASO®
softshell ankle braces. At landing, plantarflexion angle was significantly reduced by 8° when
wearing the ASO® ankle braces. Participants also generated a significantly larger peak vertical
GRF and mediolateral GRF value when wearing the ASO® ankle braces, compared to landing
without ankle braces. Furthermore, the point at which maximum vertical GRF was reached was
6.4 milliseconds earlier when wearing an ankle brace. As with Hodgson et al. (2005), the ankle
was in significantly less plantarflexion at touchdown compared to the no brace condition. As
such, this may have resulted in larger peak vertical GRF due to the restriction of ankle ROM and
displacement. Participants experienced significantly less internal and external knee rotation at
landing, in addition to a significant 3° increase in knee flexion in the ASO® ankle brace
condition, which hypothetically should help reduce GRFs. As semi-rigid ankle braces did not

BIOMECHANICS OF ANKLE BRACING 31
affect knee or hip kinetics (Hodgson et al., 2005), this would suggest a compensatory strategy at
the knee involving increased knee flexion to make up for reduced plantarflexion and dorsiflexion
provided by a softshell ankle brace, perhaps in an attempt to reduce GRFs. Therefore, it appears
that softshell and semi-rigid ankle braces may increase vertical GRF, but affect proximal
biomechanics in different manners.
Support for an adaptive compensatory strategy at the knee to attenuate GRFs can be
found in DiStefano, Padua, Brown, and Guskiewicz’s (2008) investigation of the kinetic and
kinematic effects of wearing AE ankle braces during a 30 cm high broad jump landing. Thirty
seven healthy, recreational basketball and volleyball players performed broad jump landings
under two different conditions: with and without bilateral AE ankle braces. When horizontal
distance to the force platform was standardized to half of the participant’s height, ankle ROM
was significantly decreased at ground contact, in line with previous research (Simpson et al.,
2013; Hodgson et al., 2005). Similar to Simpson et al. (2013), knee flexion angle increased by 3°
at ground contact when wearing the AE ankle braces, compared to the no ankle brace control
condition. No change, however, was observed in GRF variables when wearing the AE softshell
ankle braces, compared to no ankle braces, suggesting that the increase in knee flexion
experienced when wearing AE ankle braces may effectively attenuate GRFs. Given these results,
kinematic changes that occur when wearing softshell and semi-rigid ankle braces may be
interrelated with kinetic variables. Softshell and semi-rigid ankle braces, however, may produce
very different kinetic and kinematic changes during a two-foot jump landing and, therefore,
requires additional investigation.
Although optimal landing technique may involve two feet, this is not always possible in a
dynamic, uncontrolled game environment. Rather, athletes may be required to land on one leg,

BIOMECHANICS OF ANKLE BRACING 32
depending on the situation. The majority of ACL injuries that involve landing from a jump
occur when the athlete lands on one leg in end range knee extension, creating a significant valgus
force and externally rotated position of the knee (Olsen, Myklebust, Engebretsen, & Bahr, 2004).
Cordova, Takahashi, Kress, Brucker, and Finch (2010) investigated the effects of the McDavid
Ultra™ semi-rigid ankle brace and standard athletic taping of the ankle on lower extremity
kinetics and kinematics during a 30.5 cm single leg drop landing. Thirteen healthy males
completed the drop landing when wearing the McDavid Ultra™ ankle brace, standard athletic
taping (basketweave technique), and with no ankle support on the dominant leg. The McDavid
Ultra™ ankle brace and no ankle support conditions produced similar peak vertical GRF values
at the first point of impact, however, both the McDavid Ultra™ ankle brace and taping
conditions reached peak GRF significantly faster than the no ankle support condition. This effect
was also present at the second point of impact. Furthermore, the McDavid Ultra™ ankle brace
and taping significantly reduced ankle ROM at landing, while the semi-rigid ankle brace also
significantly reduced knee displacement by 2.5°. Along with Simpson et al.’s (2013) findings,
this would suggest altered knee kinematics in response to the reduction in plantarflexion and
dorsiflexion; however, given the role of knee flexion in the attenuation of GRF (Devita & Skelly,
1992) and knee extension in ACL injuries, this effect may be maladaptive. Similar effects are
also present in kinetic and kinematic studies of cutting tasks when wearing semi-rigid ankle
braces.
Cutting tasks. The need to perform quick changes in direction is an important component
of many sports (Bompa & Haff, 2009) and is a common ankle sprain mechanism (McKay et al.,
2001). As such, the effect of ankle braces on kinetics and kinematics during cutting and agility

BIOMECHANICS OF ANKLE BRACING 33
like tasks has also been investigated. As with studies examining jump landings when wearing
ankle braces, results have been inconsistent.
Using a 90° cutting task, Klem et al. (2016) explored the kinetic and kinematic effects of
wearing softshell and semi-rigid ankle braces during a quick change in directions. To perform
the cutting task, competitive female basketball players (n = 20) approached a force platform at
full speed from a 45° angle. Participant’s planted her left foot on the force platform before
immediately cutting 90° away from the force platform. All participants performed the cutting
task under three bracing conditions: no ankle braces, wearing bilateral AE ankle braces, and
bilateral Active Ankle T2™ semi-rigid ankle braces. The Active Ankle T2™ ankle braces
significantly restricted maximum inversion angle but not dorsiflexion, while the AE ankle braces
did not affect either measure. A significant increase was observed in anterior shear and
compressive forces at the knee during the deceleration phase of cutting when wearing the AE
ankle braces, compared to when not wearing an ankle brace under the control condition.
Conversely, anterior shear forces at the knee were significantly reduced when wearing the Active
Ankle T2™ ankle braces. A significant increase in knee internal rotation was also present when
wearing both the AE and Active Ankle T2™ ankle braces. Again, this study suggested that
softshell and semi-rigid ankle braces may produce significant changes in lower extremity
kinetics and kinematics, although semi-rigid angle braces may affect sagittal plane kinematics
less than their softshell counterparts.
With respect to shear forces at the knee, West, Ng, and Campbell (2013) reported similar
findings in 15 competitive volleyball players. For the cutting task component of their kinetic and
kinematic evaluation of semi-rigid ankle braces, participants ran towards a force platform, before
cutting 90° away from the platform. The cutting task was performed with and without bilateral

BIOMECHANICS OF ANKLE BRACING 34
Active Ankle T2™ semi-rigid ankle braces. Not unlike Klem et al. (2016), a decrease in shear
forces at the knee was observed when wearing the Active Ankle T2™ ankle brace, albeit in the
lateral direction. No differences, however, were observed in lower extremity kinematics, aligning
with the results of Greene, Stuelcken, Smith, and Vanwanseele (2014).
In their studies, Klem et al. (2016) and West et al. (2013) employed a 90° cutting task.
Greene et al. (2014), however, used a 45° sidestep cutting task to evaluate lower extremity
kinetics and kinematics when wearing a generic softshell ankle brace on the right ankle. Healthy
netballers (n = 10) ran 5 metres towards a force platform; contacting the force platform with the
right foot and sidestepping to the left at an angle of 45° to the approach plane. No kinematic or
kinetic differences were observed between conditions, suggesting that a softshell ankle brace
does not affect kinematics or kinetics during a sidestep cutting tasks.
Running. Although running for extended periods of time is a requirement of many sports,
there is limited research examining the effects of ankle braces on running in the sagittal plane.
Recently, however, Tamura et al. (2017) examined the effects of the ankle bracing and athletic
taping of the ankle on lower extremity kinematics and total energy expenditure during treadmill
running. Thirteen physically active individuals completed a continuous 30 minute treadmill run
at his/her own pace under four bilateral conditions: ASO® softshell ankle brace, Active Ankle
T2™ semi-rigid ankle brace, ankle tape (basketweave), and no brace/tape. Kinematic, as well as
metabolic data were collected at 5 minute intervals during the 30 minutes of continuous running.
All ankle support conditions significantly decreased total inversion and eversion movement,
although the Active Ankle T2™ ankle brace was the only condition to significantly restrict
inversion. Furthermore, the ASO® ankle brace and ankle tape significantly decreased maximum
plantarflexion and velocity at toe off. Proximal to the ankle, knee kinematics were unaffected in

BIOMECHANICS OF ANKLE BRACING 35
the braced conditions, although all conditions resulted in significantly more hip abduction during
initial contact than the no brace/tape condition. Finally, the Active Ankle T2™ ankle brace and
tape resulted in significantly higher energy expenditure than the ASO® ankle brace or no
brace/tape condition. Given that the Active Ankle T2™ ankle brace did not significantly affect
plantarflexion or dorsiflexion, while the ASO® softshell ankle brace did, the increased energy
expenditure seen in the Active Ankle T2™ and not the ASO® condition is surprising. As the
Active Ankle T2™ ankle brace did affect maximum ankle inversion, this could indicate that
pronation and supination of the foot is being affected during the gait cycle, resulting in increased
hip abduction. As this increase in hip abduction was observed in in all conditions, however,
additional factors such as muscle activation may influence lower extremity kinematics and GRFs
when wearing ankle braces.
Electromyography. Electromyography is the measurement of neuromuscular activity of
the human body and can be used to measure the quantity and timing of muscle contraction
(Criswell, 2010). Electromyography of regional ankle muscles, such as the PL muscle, while
wearing an ankle brace during a perturbation task has been well studied. The EMG activity and
effect on the proximal lower extremity muscles when wearing ankle braces during functional
tasks, however, has not been explored.
Relatively little research has been done on normal EMG characteristics of a vertical jump
as well. When examining the effects of internal and external focus on vertical jump height,
Wulf, Dufek, Lozano, and Pettigrew (2010) noted that root mean square error values of anterior
lower extremity muscles (RF, vastus lateralis, TA) were greater than that for the posterior
muscles (BF, LG) during takeoff. When performing a vertical jump, the onset of muscle
activation during takeoff has been shown to occur in a proximal to distal manner relative to the

BIOMECHANICS OF ANKLE BRACING 36
joint that the muscle acts on. The gluteal and quadriceps muscle groups generate the majority of
power during a vertical jump, which is then transferred to the ground via the biarticular
gastrocnemius and smaller plantar-flexors. These muscles, however, will also generate power to
a degree and have been shown to be responsible for as much as 25% of vertical jump height
(Pandy & Zajac, 1991). As such, the activation of proximal and distal musculature is required for
optimal jump performance (Pandy & Zajac, 1991). Upon landing, the quadriceps muscles
activation is 1.5-5 times greater than that for the hamstring muscles, based on a percentage of
maximal voluntary contraction (MVC). Furthermore, males will contract the hamstring muscles
at a significantly higher percentage of MVC than females at the point of landing (Urabe et al.,
2005).
At foot strike, cutting tasks are characterised by quadriceps muscle activation beyond
MVC levels, submaximal hamstring activation, and a knee flexion angle of approximately 22°
(Colby et al., 2000; Houck, 2003). High quadriceps muscle activation, however, can result in an
increased anterior tibial displacement and shear forces at the knee, potentially increasing the risk
for ACL injury (Colby et al., 2000). Therefore, the simultaneous co-activation of the antagonistic
hamstring muscles is necessary to help support the ligaments of the knee and maintain stability
of the joint (Draganich, Jaeger, & Kralj, 1989). As with jumping, this makes the timing, as well
as the magnitude of muscle activation an important component of performance and injury
prevention, especially in the female population, who exhibit lower hamstring muscle activation
(Malinzak, Colby, Kirkendall, Yu, & Garret, 2001).
Landing. Considering the importance of proximal to distal force transfer, as well as
magnitude and timing of muscular contraction for performance and injury prevention, research
examining these variables when wearing ankle braces is scarce. Hopper, McNair, and Elliot
BIOMECHANICS OF ANKLE BRACING 37
(1999) conducted the only study to investigate the effects of the Swede-o® softshell ankle brace
on vertical GRFs and EMG activity of the TA, gastrocnemius, and PL muscles during a single-
leg, height standardized landing task. Compared to landings with no braces, the Swede-o® ankle
brace produced significantly less EMG activity in the gastrocnemius and PL muscle groups,
while peak vertical GRF was unaffected. Although kinematic data of the lower extremity was not
collected, this study provides evidence that EMG activity of the lower extremity may be affected
by wearing ankle braces during a landing task, although peak vertical GRFs were not negatively
affected. Given the changes in knee kinematics observed by DiStefano et al. (2008), Klem et al.
(2016), and Simpson et al. (2013), and the biarticulated nature of the gastrocnemius muscle,
more proximal musculature could be attenuating GRFs and requires further investigation.
Cutting. Focusing on activation of the peroneal muscles, Gribble, Radel, and Armstrong
(2004) examined the effects of wearing the ASO® softshell ankle brace during a side shuffle task
involving a change in direction and dynamic supination of the foot. Fifteen healthy female
athletes had the EMG activity of the right PL muscle evaluated immediately after application of
the brace and during a side shuffle task when wearing the ASO® ankle brace. Electromyographic
activity was also collected when not wearing an ankle brace for the left PL muscle, representing
the control condition. Participants were then instructed to wear the ankle brace for an additional
2 weeks, after which he/she was evaluated again. After 2 weeks of wearing the ankles brace,
participants were instructed to not wear the ankle braces for 2 weeks, after which they were once
again evaluated. No significant effect of time or ankle brace was noted; however, it is important
to note that the authors examined EMG of the PL during the entire shuffle task, rather than when
changing direction. Ankle sprains can occur when the foot is in a fixed or planted position
(Ferran & Maffulli, 2006), as it is when changing direction. Thus, the effects that ankle braces
BIOMECHANICS OF ANKLE BRACING 38
have on EMG in this planted position may be more relevant with respect to injury prevention
mechanisms than EMG throughout the entire task.
Cordova, Armstrong, Rankin, James, and Yeasting (1998) also examined the effects of
wearing ankle braces during a lateral shuffling task, specifically EMG of the PL, TA, and LG
muscles, as well as the associated GRFs. In comparison to Gribble et al. (2004), Cordova et al.
(1998) examined EMG at the point of the change in direction. Twenty four healthy, active males
performed a lateral shuffling task under three conditions: no ankle braces, bilateral Aircast
Airstirrup™ semi-rigid ankle braces, and bilateral T1 ankle braces. For the side shuffling task,
participants side shuffled at 80-90% of maximum speed towards a force platform; making
contact with the force platform, participants immediately reversed his/her direction, creating a
dynamic supination of the foot and ankle, and side shuffled back to the start. Compared to the
control condition, wearing the Aircast Airstirrup™ nor T1 ankle braces affected GRFs at the
point of contact with the force platform. There was, however, a reduction in PL EMG activity
during the moment of peak impact force when wearing either semi-rigid ankle brace. The authors
interpreted this reduction in PL EMG activity in two ways: 1) the reduction in PL EMG was
beneficial and suggested that the ankle brace effectively reduced the stress that would normally
be placed on the PL muscle, or 2) the reduction in PL EMG activity was detrimental; as the PL
muscle functioned to resist inversion of the foot (Tortora & Nielson, 2010). A reduction in the
PL EMG activity may then hinder a potential natural protective mechanism to ankle supination.
Perturbations. The reduction in PL EMG activity observed by Cordova et al. (1998)
supports a commonly held hypothesis that wearing an ankle brace or braces may be detrimental
to the natural muscular function of the ankle (Cordova & Ingersoll, 2003; Feuerbach & Grabiner,
1993). Since the PL muscle functions to evert and plantarflex the ankle (Tortora & Nielson,
BIOMECHANICS OF ANKLE BRACING 39
2010), the PL muscle may protect the ankle during inversion movements by acting as an
antagonistic muscle to ankle inversion (Konradsen, Voight, & Hojsgaard, 1997). It has been
theorized that use of an ankle brace or braces, especially long term use, can reduce strength and
timing at which the PL muscle contracts, as the ankle adapts to being supported by an ankle
brace (Cordova & Ingersoll, 2003; Feuerbach & Grabiner, 1993). This theory has been explored
using perturbations to simulate an ankle sprain.
As with other areas of ankle bracing research, the results from studies examining the
EMG activity of the PL muscle during a sudden perturbation are mixed. Cordova et al. (2000)
investigated both the long term and short term effects of semi-rigid and softshell ankle braces on
PL muscle latency (timing) during a 35° perturbation. When wearing the T1 ankle brace or the
McDavid 199™ softshell ankle brace on the dominant extremity, no differences in the timing of
the PL contraction were observed in healthy individuals. Similar results were present after
wearing each ankle brace for eight hours per day for eight weeks. In a comparable study,
Cordova and Ingersoll (2003) found that the PL EMG activity significantly increased during a
perturbation task immediately after the application of the McDavid 199™ ankle brace, and after
8 weeks of wearing the T1 ankle brace. Conversely, Shima, Maeda, and Hirohashi (2005) found
that the activation of the PL muscle was delayed in both healthy and unstable ankles when
wearing a generic softshell ankle brace during a 25° perturbation task. Given the discrepancies
seen in PL EMG activity in studies examining lateral shuffling and perturbation tasks, more
research is needed on the effects of ankle braces on the PL muscle during dynamic tasks,
especially athletic performance measures.
Performance. To date, there has only been one published study that has investigated the
performance, kinematic, and EMG effects of wearing ankle braces. Smith et al. (2016)

BIOMECHANICS OF ANKLE BRACING 40
investigated the effects of a McDavid 195T™ softshell ankle brace on Vertec™ measured
vertical jump height, lower extremity kinematics, and EMG activity of the soleus and
gastrocnemius muscles. When wearing the McDavid 195T™ ankle brace bilaterally, varsity
athletes (n = 20) experienced a significant reduction in vertical jump height of .92 in (2.33 cm),
from the no ankle brace control condition. A significant reduction in ankle ROM, hip flexion,
and soleus muscle activity was also observed when wearing the McDavid 195T ankle braces.
The authors suggested that the reduction in soleus muscle activity was the result of decreased
ankle ROM, along with a reduction in hip flexion, this decrease contributed to the observed
reduction in vertical jump height. As this is the only study to investigate lower extremity EMG
activity during a vertical jump, more research is needed to determine the extent to which altered
EMG activity variables contributed to a decrease in vertical jump height. Many kinetic and
kinematic variables, however, have been linked to vertical jump height performance. These
include segmental angular displacement of the upper leg and trunk (Hsieh & Cheng, 2016),
production of mechanical power (Aragón-Vargas & Gross, 1997), ankle angle at take-off
(Aragón-Vargas & Gross, 1997), and minimum angle of the hip, knee, and ankle joint (Hsieh &
Cheng, 2016). Given the observed decrease in hip flexion when wearing a softshell ankle brace,
it is conceivable that wearing an ankle brace may alter the EMG activity of the muscles of the
hip, altering important variables that may impact on vertical jump height performance.
Recent unpublished pilot data (Henderson & Sanzo, 2017; see Appendix J) has suggested
that EMG activity of the lower extremity and lumbar spine is altered when wearing ankle braces
during athletic performance tasks. Ten healthy, active individuals had his/her vertical jump
height and cutting task time assessed under three conditions: no ankle brace, bilateral AE
softshell ankle braces, and bilateral T1 ankle braces. During these tasks, the EMG of the PL, LG,
BIOMECHANICS OF ANKLE BRACING 41
BF, RF, GM, and ES was also collected. No differences were observed between conditions with
respect to the time to complete the lateral cutting task, although a significant decrease in RF
EMG activity was present during the deceleration phase of the cut. Similar to the findings
reported by Smith et al. (2016), compared to wearing no ankle braces, a nonsignificant reduction
of 1.87 cm in vertical jump height was observed when wearing the T1 ankle braces.
Accompanying this reduction was a nonsignificant decrease in RF, GM, and ES EMG activity
when wearing the T1 ankle braces. As such, it is conceivable that this reduction in RF, GM, and
ES EMG activity may be contributing to the reduction observed in the vertical jump height.
Because of the low sample size and lack of kinematic data, it is difficult to determine the degree
to which this reduction in EMG activity may have affected vertical jump height. Irrespective of
the mechanism, however, reductions in vertical jump height when wearing ankle braces have
been demonstrated in the available literature.
Ankle Bracing and Athletic Performance
Due to their restrictive properties, many athletes subjectively perceive that ankle braces
can reduce athletic performance (Rosenbaum et al., 2005). Given the importance of performance
in high level sport, if wearing ankle braces were to negatively affect performance, this may
reduce adherence to a prescribed ankle brace. Over the last few decades, a moderate amount of
studies objectively investigated the effects of ankle bracing on athletic performance measures,
such as vertical jump height and agility. Despite this, a consensus on whether or not ankle braces
affect athletic performance has not been reached (Cordova, Scott, Ingersoll, & LeBlanc, 2005),
with many studies presenting different conclusions. Reasons for this may include methodological
differences between studies, as well as the brace models that were investigated.
BIOMECHANICS OF ANKLE BRACING 42
To gauge the effect that ankle braces may have on athletic performance, several studies
have used vertical jump height and time to complete an agility task as dependant variables.
Henderson et al. (2016) assessed vertical jump height and time to complete the T-test Agility
Test in 14 varsity jumping sport athletes when wearing the AE ankle brace and T1 semi-rigid
ankle brace bilaterally. As measured with a Vertec™ device, countermovement vertical jump
height was significantly decreased by 2.35 cm when wearing the T1 ankle braces, compared to
the no ankle brace control condition. Similar effects were observed when wearing the AE ankle
braces, although this reduction did not reach significance. Time to complete the T-test Agility
Test was not significantly different between conditions.
Parsley et al. (2013) observed similar changes in countermovement vertical jump height
when wearing the prototype Seattle Ankle Orthosis prototype external ankle brace, AE ankle
brace, and Aircast Airsport™ semi-rigid ankle braces on both ankles. Twenty four physically
active males experienced a significant decrease of 1.3-1.8 cm in all of the brace conditions,
compared to when not wearing an ankle brace. As with Henderson et al. (2016), agility time was
not affected, although the Modified Southeast Missouri Agility Run was used rather than the T-
test Agility Test. Based on the results of these studies, it appeared that countermovement vertical
jump height was impaired when wearing the semi-rigid and softshell ankle brace, while time to
complete the agility task was unaffected when wearing the softshell or semi-rigid ankle braces.
Nonetheless, research employing different methodologies and ankle braces presents evidence
contrary to this conclusion.
As part of their investigation on the effects of ankle braces and ankle tape on athletic
performance, Ambegaonkar et al. (2011) employed the Sargent Chalk Jump Test and Right-
Boomerang Run Test to measure countermovement vertical jump height and agility time,

BIOMECHANICS OF ANKLE BRACING 43
respectively. Ten healthy participants performed each test under four conditions: no ankle braces,
standard ankle athletic taping (basketweave), Swede-o® Ankle Lok™ softshell ankle braces, and
Aircast Airstirrup™ semi-rigid ankle braces worn bilaterally. Vertical jump height was
unaffected by wearing ankle braces or tape; however, agility time increased significantly by 0.59
seconds when wearing the Aircast Airstirrup™ ankle braces. These results suggested that vertical
jump height was unaffected by the softshell or semi-rigid ankle braces, but agility performance
was negatively affected; the opposite findings of Henderson et al. (2016) and Parsley et al.
(2013). Further complicating matters, some studies have found no effect of ankle brace on
performance.
Verbruggee (1996) investigated the effects of standard athletic taping applied to the ankle
compared to the Aircast Airstirrup™ semi-rigid ankle brace on vertical jump height, agility time,
and sprint time. Twenty six male collegiate athletes completed the Chalk Vertical Jump Test,
Barrow and McGee Agility Run, and the 40 yard dash under three conditions in a random order:
no ankle support, standard athletic taping (modified Gibney technique), and Aircast Airstirrup™
ankle brace worn on both ankles. No significant difference was observed between conditions
with respect to agility time or sprint speed. There was an average decrease in vertical jump
height of 1.52 cm when wearing the semi-rigid ankle brace compared to the no brace control
condition, although this difference did not reach significance.
Similarly, insignificant reductions in vertical jump height were observed by MacKean et
al. (1995) and Macpherson, Sitler, Kimura, and Horodyski (1995). MacKean et al. (1995) had 11
female basketball players perform a Wall Vertical Jump Test, jump shot, sprint drill, and
treadmill run. In a randomized order, participants completed these tasks when wearing no ankle
support, the T1 and Aircast Airstirrup™ semi-rigid ankle braces, Swede-o® softshell ankle

BIOMECHANICS OF ANKLE BRACING 44
brace, and standard athletic tape. Compared to wearing no ankle support, wearing the T1 and
Aircast Airstirrup™ resulted in a reduced vertical jump height by approximately 2 cm.
Additionally, sprint times were slightly slower in the ankle support conditions. Performing the
treadmill run when wearing the Aircast Airstirrup™ ankle braces also slightly, but significantly
increased energy expenditure and oxygen consumption. Macpherson et al. (1995) conducted a
comparable study with 25 male high school varsity football players. When wearing the Aircast
Airstirrup™ ankle brace or Donjoy Rocket Sock softshell ankle brace bilaterally during a Chalk
Vertical Jump Test, sprint, and shuttle run, no significant differences were observed compared to
the no brace control condition. The Aircast Airstirrup™ ankle braces, however, produced mean
values that were 2.64 cm less than the no ankle brace control condition. Although these studies
observed differences that did not reach significance, given the effects that even small decreases
in performance can have in competitive sport, these decreases cannot be ignored. More recent
literature, however, presents little differences between ankle brace and no ankle brace conditions.
Leonard and Rotay (2014) compared the effects of standard ankle athletic taping and
generic softshell ankle braces on countermovement vertical jump height, power, and agility. In
10 athletic and nine non-athletic individuals, the effects on countermovement vertical jump
height was similar across conditions, as measured by a Vertec™ device. Likewise, power
generation and time to complete the Illinois Agility Test were not affected by wearing bilateral
ankle taping or bracing. It is important to note that this study did not incorporate a semi-rigid
ankle brace, which based on Henderson et al. (2016), MacKean et al. (1995), Parsley et al
(2013)., and Verbrugee et al. (1996) appeared to affect vertical jump height more than softshell
ankle braces. Furthermore, the brand of softshell ankle brace was not indicated, making it
difficult to make comparisons to other studies based on the characteristics of the ankle brace. The
BIOMECHANICS OF ANKLE BRACING 45
results of this study are in line, however, with literature that assessed the effect of ankle braces
on athletic performance in persons with CAI and a history of ankle sprains.
To assess the effects of ankle braces on sports performance, Rosebaum et al. (2005)
conducted a comprehensive study of 10 different ankle braces inducing both objective and
subjective measures. Thirty four participants, each self-reporting CAI, completed a 10 second
obstacle course involving four tasks: maximum vertical jump, single leg-inclined hopping,
sprinting, and a sidestep cutting task. Participants performed the obstacle course wearing four
different softshell ankle brace models, four different semi-rigid ankle brace models, one rigid
ankle brace model, and without ankle braces in a randomized order. Wearing no brace produced
the highest vertical jump height, although not by a significant margin; both bilateral softshell and
semi-rigid ankle braces produced similar values for all tasks when evaluated separately. With
respect to the subjective measures, participants generally preferred the softshell ankle braces
from a comfort and performance perspective, while participants preferred the semi-rigid ankle
braces from an ease of use perspective. Irrespective of these measures, participants reported
feeling similar levels of stability when wearing semi-rigid and softshell ankle braces, suggesting
that any kind of support may be subjectively beneficial for persons with CAI during athletic
performance.
Wiley and Nigg (1996) also examined participants with unstable ankles in their
investigation of the effects of the Melloeloc semi-rigid ankle brace on athletic performance
measures and ankle ROM. Both athletic performance and ROM were assessed before and after a
standardized aerobic exercise session. For the athletic performance measures, 12 adolescent
participants with a positive Anterior Drawer Test of the ankle and previous history of ankle
sprain performed a vertical jump and a figure eight running test under two conditions: no ankle
BIOMECHANICS OF ANKLE BRACING 46
brace and wearing bilateral Melloeloc ankle braces. When participants performed a vertical jump
with a five step, running approach, vertical jump height was similar when wearing no ankle
braces and when wearing the Malleoloc ankle braces. This remained true before and after the
exercise session. Additionally, no significant differences were observed in the time to complete
the figure eight running task between the no ankle brace and Malleoloc ankle brace conditions,
before and after the exercise session. There was, however, a small improvement in time to
complete the figure eight running test when wearing the Malleoloc ankle braces post exercise
session, as compared to before the exercise session. As participants had clinically unstable
ankles, this suggested that the Malleoloc semi-rigid ankle brace may help maintain subjective
feelings of stability as fatigue sets in, encouraging participants to maintain intensity. Conversely,
this may be the result of participants becoming accustomed to the ankle braces.
The only study that has investigated both immediate and short term (1 week) effects of
ankle braces on athletic performance measures was conducted by Pienkowski, Shapiro, Caborn,
and Stayton (1995). Twelve adolescent male basketball players performed a wall vertical jump,
standing long jump, cone run, and shuttle run under four conditions: no brace, wearing the
Swede-o® Universal softshell ankle braces, Kallassy softshell ankle braces, or Aircast
Airstirrup™ semi-rigid ankle braces. At the beginning of the week, participants performed each
task under the corresponding condition. Participants implemented the corresponding condition
for all games and practices for one week, after which all tasks were assessed again. This was
done for all four conditions (4 weeks total). No significant differences were seen between
conditions for any of the athletic performance tasks. There was, however, a small improvement
in all athletic performance measures after 1 week of use, which suggested that participants were
adapting to the ankle braces. Again, this could suggest a compensatory strategy to counteract
BIOMECHANICS OF ANKLE BRACING 47
ROM restriction at the ankle; however, a reduction in ROM does not appear to affect
performance on an obstacle course.
Using the SEBT and a military style obstacle course, Newman, Croy, Hart, and Saliba
(2012) evaluated the effects of the McDavid Ultralite 195 softshell ankle brace on performance
in military cadets. Thirty-seven military cadets performed the Star Excursion Balance Test
(SEBT) and military obstacle course when wearing no ankle braces, and when wearing unilateral
and bilateral ankle braces. The obstacle course involved a variety of tasks including: balance,
crawling, running, and climbing. Unilateral and bilateral ankle bracing produced significant
differences in anterior and posterior reach distance. Despite this, the time to complete the
obstacle course was not affected by either unilateral or bilateral ankle bracing. As there was a
reduction in SEBT, this indicated that mobility and ROM was affected when wearing an ankle
brace, although this reduction did not seem to manifest in a reduction on the time to complete a
military obstacle course. Therefore, as unilateral and bilateral ankle bracing produced similar
obstacle course results, this may suggest biomechanical adaptations to counteract reduced
mobility in the ankle.
Purpose of Research
While ankle braces have been proven effective for reducing ankle injuries, there is still
controversy surrounding the effects that they may have on other areas of the body. Although
results have been inconsistent, studies have noted decreases in athletic performance and
increases in non-ankle lower extremity injuries when wearing ankle braces. These results have
been attributed to ankle braces unfavourably altering kinematics and kinetics (Smith et al., 2016).
Little attention, however, has been given to the effects that ankle braces may have on the EMG
activity of the lower extremity muscles, specifically muscles of the knee and hip joints. Given

BIOMECHANICS OF ANKLE BRACING 48
observed changes in knee flexion angles (Hodgson et al., 2005; Simpson et al., 2013) when
wearing ankle braces, it is possible that EMG activity of the lower extremity may be similarly
affected by wearing ankle braces. The implications of altered EMG activity when wearing ankle
braces would be two-fold: 1) the ability to generate torque about the hip and extension at the
knee are critical to vertical jump performance (Aragón-Vargas, & Gross, 1997), thus changes in
EMG activity of the knee and hip musculature may affect vertical jump height; and 2) muscular
activation of the lower extremity is important for attenuating GRFs (Devita & Skelly, 1992) and
maintaining knee stability (Draganich, Jaeger, & Kralj, 1989). As such, altered EMG activity of
the lower extremity when wearing ankle braces may affect the body’s ability to attenuate GRFs
and maintain knee stability, both of which are important for injury prevention. As ankle braces
represent the most common method of ankle injury prevention (Stasinopoulos, 2004), it is
essential that athletes and healthcare providers are aware of all possible effects of wearing
braces, including those involving EMG activity of the lower extremity, forces, and athletic
performance. Therefore, the purpose of this study was to determine if wearing semi-rigid and
softshell ankle braces affected vertical jump height and the time to complete a lateral cutting
task, as well as lower extremity EMG activity and kinetics during these measures.
Research Questions
The following questions were used to guide this study:
1) Is there a difference amongst ankle brace conditions in vertical jump height for the
Vertical Jump Test?
2) Is there a difference amongst ankle brace conditions in measures of lower extremity
EMG activity and kinetics during the takeoff phase of the Vertical Jump Test?
BIOMECHANICS OF ANKLE BRACING 49
3) Is there a difference amongst ankle brace conditions in measures of lower extremity
EMG activity and kinetics during the landing phase of the Vertical Jump Test?
4) Is there a difference amongst ankle brace conditions in time to complete the cutting
task?
5) Is there a difference amongst ankle brace conditions in measures of lower extremity
EMG activity and kinetics during the deceleration phase of the cutting task?
6) Is there a difference amongst ankle brace conditions in measures of lower extremity
EMG activity and kinetics during the propulsive phase of the cutting task?
For questions one and four, a one-way ANOVA for repeated measures was conducted to
compare the independent variable (brace condition) on vertical jump height, as well as time to
complete the lateral cutting task. For questions two and three, a one-way ANOVA for repeated
measures was conducted to compare the independent variable (brace condition) on mean EMG
activity of the PL, LG, BF, RF, and GM muscles, peak vertical, mediolateral, and anteroposterior
GRFs, and total vertical impulse. For questions five and six, a one-way ANOVA for repeated
measures was conducted to compare the independent variable (brace condition) on mean EMG
activity of the PL, LG, BF, RF, and GM muscles, peak vertical, mediolateral, and anteroposterior
GRFs, and total vertical, anteroposterior, and mediolateral impulse.

BIOMECHANICS OF ANKLE BRACING 50
Chapter Two: Methodology
A limited number of studies have examined the effects of ankle braces on lower
extremity muscle activity, kinetics, and performance during athletic performance measures. As
such, this study was designed and conducted with the intent of filling this gap in the literature.
Participant Inclusion and Exclusion Criteria
Participants were included into the study if they: 1) were male or female, physically
active individuals; 2) participated in at least 150 minutes of moderate to vigorous aerobic activity
each week, 3) had previous experience with “jumping” and/or “cutting” sports (i.e., basketball,
volleyball, soccer) and; 3) were between the ages of 18-30 years. This specific population was
selected to represent a physically active group that may/may not have experience using ankle
braces and to maximize recruitment potential.
Participants were excluded from this study if they: 1) suffered from a diagnosed or self
reported ankle injury over the last 6 months (e.g., sprain, fracture, tendonitis); 2) were currently
suffering from an acute and/or chronic lower extremity or lumbar spine injury (i.e., strain or
sprain) that precluded them from participating in jumping or running activities; 3) had undergone
any lower extremity or lumbar spine surgical procedure in the last six months; and 4) were
allergic or sensitive to adhesive tape or any of the material present in the AE and T1 ankle braces
(i.e., Velcro or plastic).
Research Recruitment Procedures
Participants were recruited via purposive and convenience sampling, as the targeted
population was physically active individuals in Thunder Bay and Northwestern Ontario. A total
of 42 participants were recruited into the study. Based on pilot data and a priori analysis, this

BIOMECHANICS OF ANKLE BRACING 51
number was sufficient to detect a medium to large effect size with 80% power at α=.05 (two-
tailed) in the Vertical Jump Test and cutting task performance measures. Participants were
recruited using recruitment posters containing an overview of the study and contact information
for the researcher (see Appendix A). These posters were posted in visible, high traffic areas
throughout the Sanders Building at Lakehead University, in addition to the School of
Kinesiology and Lakehead University social media accounts. Participants were also recruited
through word of mouth, where he/she was encouraged to contact the researcher if he/she was
interested in participating in the study. When a potential participant contacted the researcher and
expressed interest in participating in the study, he/she was provided with information pertaining
to the study including: an information letter (see Appendix B), informed consent form (see
Appendix C), Physical Activity Readiness Questionnaire (PAR-Q) form (see Appendix D), and
Functional Ankle Ability Measure (FAAM) outcome questionnaire (see Appendix E) for his/her
perusal. The researcher also provided answers to any questions that the participant had about the
study. The researcher then set up testing sessions with the participant at mutually agreeable
times.
Screening Measures
Physical Activity Readiness Questionnaire. The Physical Activity Readiness
Questionnaire is a pre-screening form developed by the Canadian Society for Exercise
Physiology (CSEP) to identify any medical conditions that may make physical activity unsafe for
an individual (CSEP, 2013). The PAR-Q was completed by participants prior to participating in
any physical components of this study. Although no participants did not pass the PAR-Q pre-
screen, if a participant answered yes to any of the questions on the PAR-Q, he/she would have
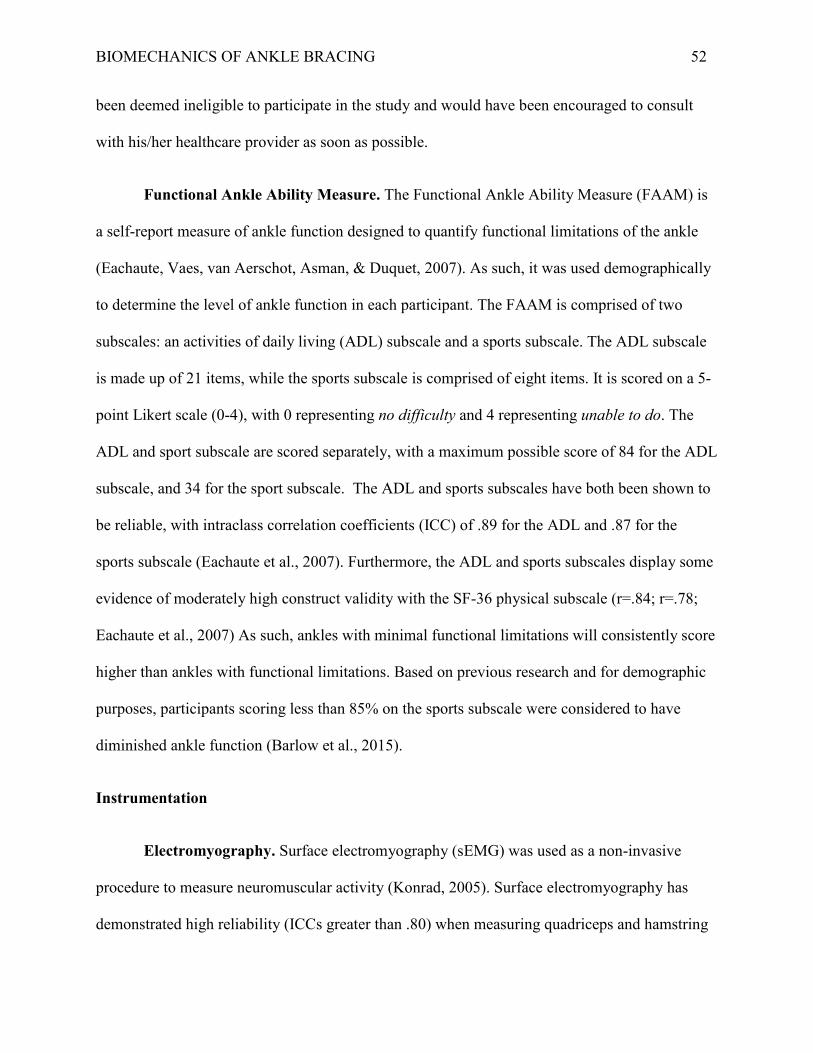
BIOMECHANICS OF ANKLE BRACING 52
been deemed ineligible to participate in the study and would have been encouraged to consult
with his/her healthcare provider as soon as possible.
Functional Ankle Ability Measure. The Functional Ankle Ability Measure (FAAM) is
a self-report measure of ankle function designed to quantify functional limitations of the ankle
(Eachaute, Vaes, van Aerschot, Asman, & Duquet, 2007). As such, it was used demographically
to determine the level of ankle function in each participant. The FAAM is comprised of two
subscales: an activities of daily living (ADL) subscale and a sports subscale. The ADL subscale
is made up of 21 items, while the sports subscale is comprised of eight items. It is scored on a 5-
point Likert scale (0-4), with 0 representing no difficulty and 4 representing unable to do. The
ADL and sport subscale are scored separately, with a maximum possible score of 84 for the ADL
subscale, and 34 for the sport subscale. The ADL and sports subscales have both been shown to
be reliable, with intraclass correlation coefficients (ICC) of .89 for the ADL and .87 for the
sports subscale (Eachaute et al., 2007). Furthermore, the ADL and sports subscales display some
evidence of moderately high construct validity with the SF-36 physical subscale (r=.84; r=.78;
Eachaute et al., 2007) As such, ankles with minimal functional limitations will consistently score
higher than ankles with functional limitations. Based on previous research and for demographic
purposes, participants scoring less than 85% on the sports subscale were considered to have
diminished ankle function (Barlow et al., 2015).
Instrumentation
Electromyography. Surface electromyography (sEMG) was used as a non-invasive
procedure to measure neuromuscular activity (Konrad, 2005). Surface electromyography has
demonstrated high reliability (ICCs greater than .80) when measuring quadriceps and hamstring
BIOMECHANICS OF ANKLE BRACING 53
muscle activity during dynamic tasks (Fauth, Petushek, Feldmann, Hsu, & Garceau, 2010). A
Delsys Trigno™ Wireless EMG system and Trigno™ IM sensors were used for this study. The
Delsys Trigno™ EMG system and accompanying sensors are capable of collecting 16 EMG
channels simultaneously, with a transmitting range of 20 metres (Delsys Inc., 2012). For the
purposes of this study, the Delsys Trigno™ Wireless EMG system was connected to an interface
board, which was connected to a PowerLab (16/30) data acquisition unit. Electromyographic
activity of the PL, LG, BF, RF, and GM muscles, measured in millivolts (mV) was collected.
Advanced Medical Technologies Incorporated force platform. A force platform was
used to measure kinetic variables. The AMTI force platform has demonstrated excellent
reliability (ICC=.94) when assessing vertical GRF during a vertical jump (Cordova &
Armstrong, 1996). For the purposes of this study, designated channels for vertical,
anteroposterior, and mediolateral GRFs were connected to a PowerLab (16/30) data acquisition
unit. Vertical, anteroposterior, and mediolateral forces were measured in Volts (V). These values
were then converted to Newtons (N); an external load cell was regularly used to calibrate the
force platform and determine the appropriate V to N ratio in LabChart®. See figure 6 for force
plate and EMG set-up.
LabChart® software. For this study, EMG and GRF data were simultaneously
collected in real time by LabChart© software.. For the purposes of this study, three channels (Fz,
Fy, and Fx) collecting GRF data from the AMTI force platform, and five channels (PL, LG, BF,
RF, GM) collecting EMG data from the Delsys Trigno™ Wireless EMG system were fed into
the PowerLab unit for real time synchronization. Labchart® software was used to rectify, filter,
and extract all EMG and force platform data.
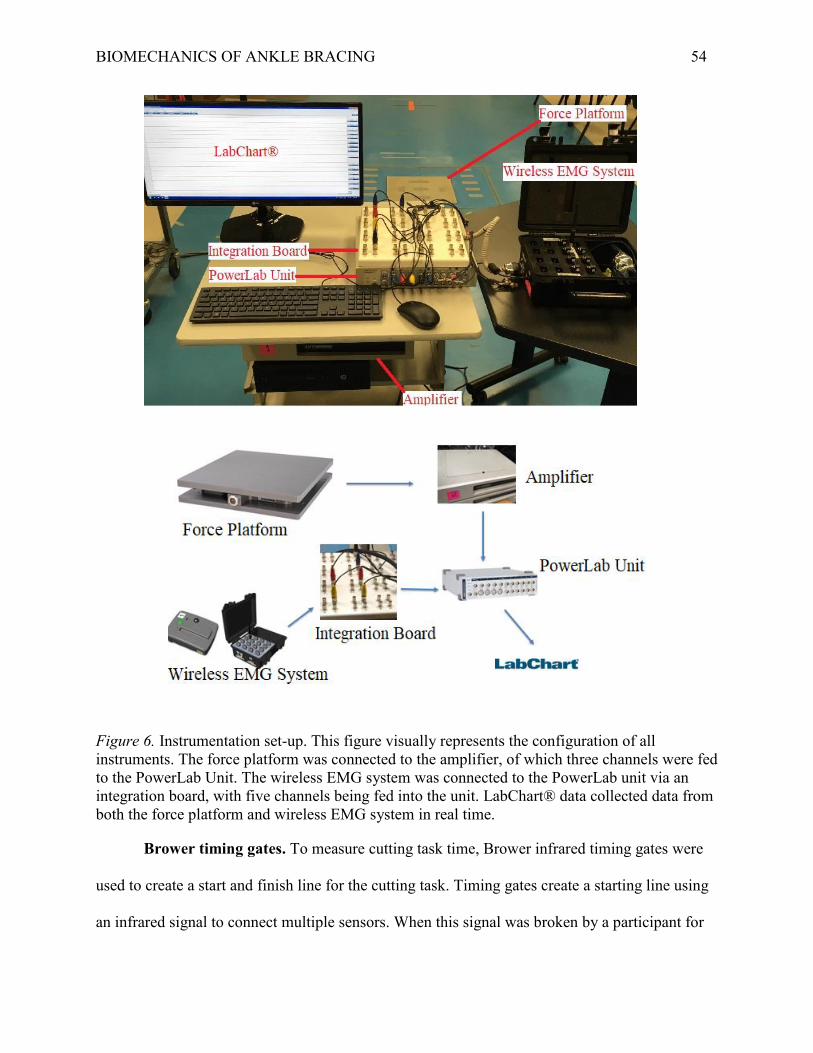
BIOMECHANICS OF ANKLE BRACING 54
Figure 6. Instrumentation set-up. This figure visually represents the configuration of all instruments. The force platform was connected to the amplifier, of which three channels were fed to the PowerLab Unit. The wireless EMG system was connected to the PowerLab unit via an integration board, with five channels being fed into the unit. LabChart® data collected data from both the force platform and wireless EMG system in real time.
Brower timing gates. To measure cutting task time, Brower infrared timing gates were
used to create a start and finish line for the cutting task. Timing gates create a starting line using
an infrared signal to connect multiple sensors. When this signal was broken by a participant for
BIOMECHANICS OF ANKLE BRACING 55
the first time, the timer started. When the participant crossed the line again, the time between
infrared disruptions was recorded as the cutting task time. Timing gates have been shown to have
a high intra trial reliability, with a coefficient of variation (CV) of 0.69 to 1.2% when measuring
10 metre sprint speed (Cronin & Templeton, 2008).
Vertical Jump Test. Vertical jump height is a widely-used measure of lower body power
and is pertinent to anaerobic and jumping sports (Aragón-Vargas, 2000; CSEP, 2013). Several
methods have been developed over the last decade; however, the CSEP procedures for vertical
jump was used in this study (see Appendix G) with the addition of a Vertec™ device (see
Appendix G). This is due to the relative ease of use, standardization of procedures, availability of
normative data, and low use of special equipment (CSEP, 2013). Furthermore, the Vertec™
device has demonstrated good intrasession and intersession reliability for males (ICC=.94;
ICC=.90) and females (ICC=.87; ICC=.80) when measuring a countermovement vertical jump
height (Nuzzo, Anning, & Scharfenberg, 2011). For the purposes of this study, vertical jump
height (in) was recorded and converted to cm.
Cutting task. For the purposes of this study, a cutting task was used to assess lateral
cutting (see Appendix H). Due to laboratory constraints, the cutting task was adapted from the T-
Test Agility Test as it incorporates movement in both the sagittal and frontal planes (Pauole,
Madole, Garhammer, Lacourse, & Rozenek, 2000). A similar modified test, however, was used
by Klem et al. (2016). This task was developed specifically for this study and, as a result, no
psychometric properties are available with respect to its ability to reliably measure agility,
although the full T-Test Agility Test has demonstrated excellent reliability (ICC=.98; Pauole et
al., 2000). For the purposes of this study, time (sec) to complete the cutting task was recorded.
BIOMECHANICS OF ANKLE BRACING 56
Procedures
Two testing sessions were required to collect data. The first session lasted approximately
60 minutes and the second session lasted approximately 45 minutes. Testing took place in room
SB-1028 in the Sanders Building at Lakehead University. At the first testing session, the
researcher provided an overview of the study, and completed the informed consent process with
the participant, answering any questions that he/she had. If the participant chose to partake in the
study, he/she signed the consent form and filled out the FAAM and PAR-Q. Once these forms
were completed, descriptive, and background information (see Appendix F) were recorded
including: age (years), height (centimetres), mass (kilograms), and experience wearing an ankle
brace (yes/no).
Following the collection of descriptive and background data, the participant was assigned
to one of six intervention sequences, based upon the order in which he/she was recruited, to
counterbalance the intervention order. The athletic performance measures of the study were
performed under each of three possible conditions: no brace control, bilateral AE softshell ankle
braces, and bilateral T1 ankle braces. As such, six possible intervention orders and groups were
possible (see Table 1).
Table 1. Intervention sequences. Order Sequence
1 no brace, AE, T1 2 no brace, T1, AE 3 AE, no brace, T1 4 AE, T1, no brace 5 T1, no brace, AE 6 T1, AE, no brace
Following group assignment and collection of baseline information, the participant
completed a 5 minute warmup on a cycle ergometer at an intensity of 10-12 on the Borg Scale of
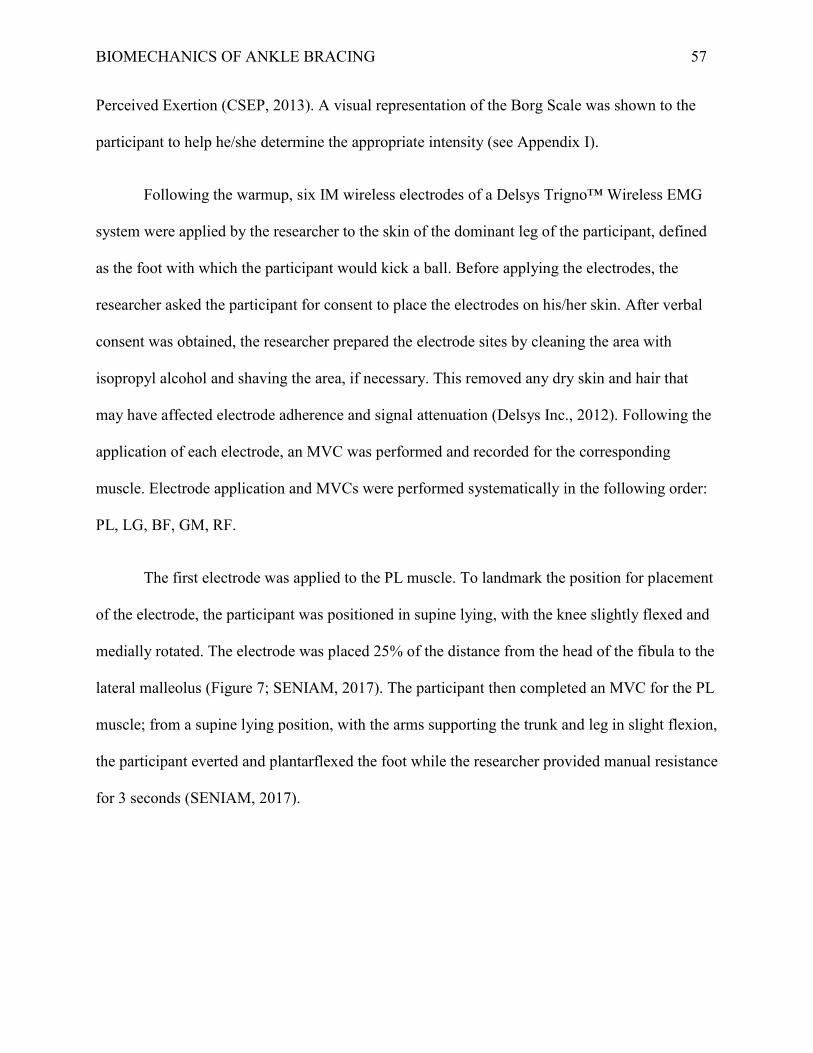
BIOMECHANICS OF ANKLE BRACING 57
Perceived Exertion (CSEP, 2013). A visual representation of the Borg Scale was shown to the
participant to help he/she determine the appropriate intensity (see Appendix I).
Following the warmup, six IM wireless electrodes of a Delsys Trigno™ Wireless EMG
system were applied by the researcher to the skin of the dominant leg of the participant, defined
as the foot with which the participant would kick a ball. Before applying the electrodes, the
researcher asked the participant for consent to place the electrodes on his/her skin. After verbal
consent was obtained, the researcher prepared the electrode sites by cleaning the area with
isopropyl alcohol and shaving the area, if necessary. This removed any dry skin and hair that
may have affected electrode adherence and signal attenuation (Delsys Inc., 2012). Following the
application of each electrode, an MVC was performed and recorded for the corresponding
muscle. Electrode application and MVCs were performed systematically in the following order:
PL, LG, BF, GM, RF.
The first electrode was applied to the PL muscle. To landmark the position for placement
of the electrode, the participant was positioned in supine lying, with the knee slightly flexed and
medially rotated. The electrode was placed 25% of the distance from the head of the fibula to the
lateral malleolus (Figure 7; SENIAM, 2017). The participant then completed an MVC for the PL
muscle; from a supine lying position, with the arms supporting the trunk and leg in slight flexion,
the participant everted and plantarflexed the foot while the researcher provided manual resistance
for 3 seconds (SENIAM, 2017).
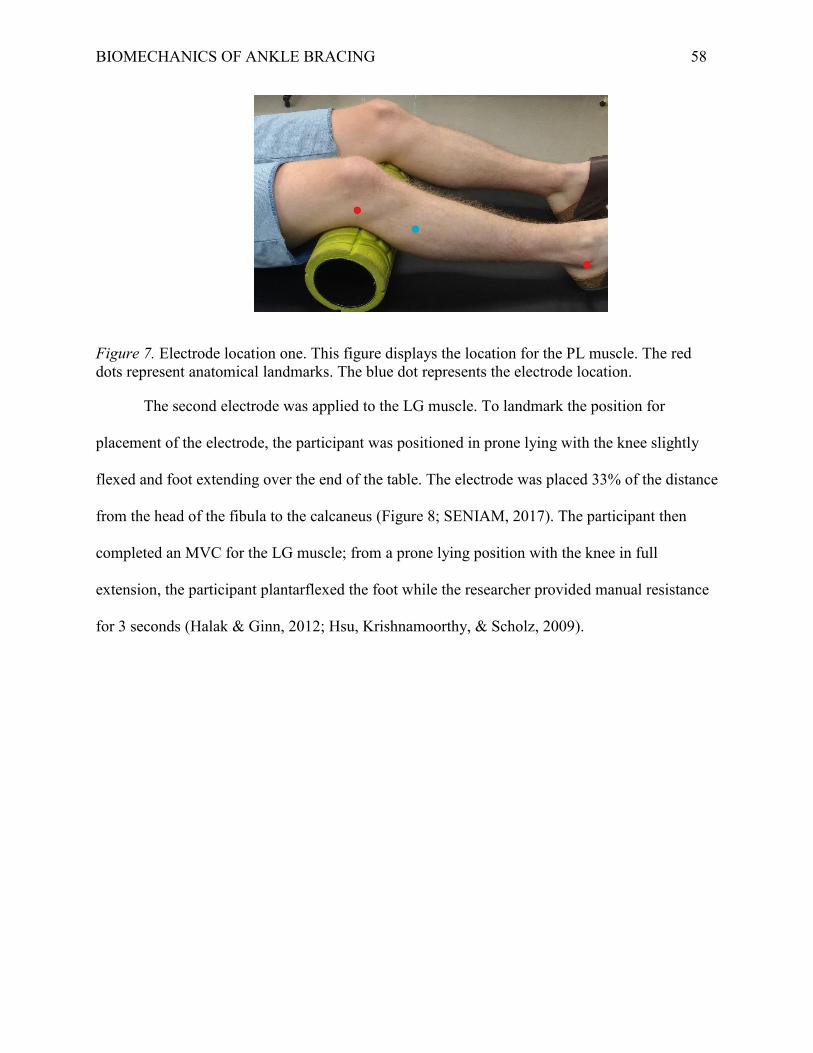
BIOMECHANICS OF ANKLE BRACING 58
Figure 7. Electrode location one. This figure displays the location for the PL muscle. The red dots represent anatomical landmarks. The blue dot represents the electrode location.
The second electrode was applied to the LG muscle. To landmark the position for
placement of the electrode, the participant was positioned in prone lying with the knee slightly
flexed and foot extending over the end of the table. The electrode was placed 33% of the distance
from the head of the fibula to the calcaneus (Figure 8; SENIAM, 2017). The participant then
completed an MVC for the LG muscle; from a prone lying position with the knee in full
extension, the participant plantarflexed the foot while the researcher provided manual resistance
for 3 seconds (Halak & Ginn, 2012; Hsu, Krishnamoorthy, & Scholz, 2009).

BIOMECHANICS OF ANKLE BRACING 59
Figure 8. Electrode location two. This figure displays the location for the LG muscle. The red dots represent anatomical landmarks. The blue dot represents the electrode location.
The third electrode was applied to the BF muscle. To landmark the position for
placement of the electrode, the participant was positioned in prone lying, with the knee in a
flexed position that was less than 90° and in minimal lateral rotation. The electrode was placed
halfway between the ischial tuberosity and the lateral epicondyle of the tibia (Figure 9;
SENIAM, 2017). The participant then completed an MVC for the BF muscle; in prone lying and
slight lateral rotation, the participant flexed the knee (from 60°) while the researcher provided
manual resistance for 3 seconds (Halak & Ginn, 2012; Hsu et al., 2009).

BIOMECHANICS OF ANKLE BRACING 60
Figure 9. Electrode location three. This figure displays the location for the BF muscle. The red dots represent anatomical landmarks. The blue dot represents the electrode location.
The fourth electrode was applied to the GM muscle. To landmark the position for
placement of the electrode, the participant was positioned in side lying. The electrode was placed
halfway between the iliac crest and the greater trochanter (Figure 10; SENIAM, 2017). The
participant then completed an MVC for the GM muscle; in a side lying position, the participant
abducted the hip 25° while the researcher provided manual resistance for 3 seconds (Bolga &
Uhl, 2007; Halak & Ginn, 2012)

BIOMECHANICS OF ANKLE BRACING 61
Figure 10. Electrode location four. This figure displays the location for the GM muscle. The red dots represent anatomical landmarks. The blue dot represents the electrode location.
The final electrode was applied to the RF muscle. To landmark the position for placement
of the electrode, the participant was positioned in supine lying. With the upper body supported
by the participant’s arms and the hip in slight flexion, the electrode was placed halfway between
the anterior superior iliac spine and the superior border of the patella (Figure 11; SENIAM,
2017). The participant then completed an MVC for the RF muscle; in a seated position, with the
hips flexed to 90°, the participant extended the knee (from 60°) while the researcher provided
manual resistance for 3 seconds (Halak & Ginn, 2012; Hsu et al., 2009)

BIOMECHANICS OF ANKLE BRACING 62
Figure 11. Electrode location five. This figure displays the location for the RF muscle. The red dots represent anatomical landmarks. The blue dot represents the electrode location.
After recording the EMG activity while completing the MVC, the participant applied the
ankle braces (if necessary). Ankle braces were sized and applied by the participant based on the
manufacturer’s guidelines. These instructions were available in print form for the participant, and
verbally stated to the participant by the researcher. A selection of ankle brace sizes was supplied
by the researcher. The researcher supervised the application of all braces to ensure braces were
applied properly. The participant was allowed to adjust the ankle braces during the testing
session, if required, to maintain the manufacturer’s described fit. Ankle braces were applied
without modifying the participant’s normal training shoe.
Following ankle brace application (if necessary), the researcher familiarized the
participant with the Vertical Jump Test via verbal explanation and visual demonstration. To
perform the Vertical Jump Test, the participant positioned the dominant foot over the AMTI
force platform. While maintaining contact with the force platform, the participant adjusted
his/her legs to a comfortable width. If necessary, the Vertec™ device was adjusted so that it was
an appropriate distance from the participant without having it contact the force platform. The
participant initiated the jump by flexing at the hip and knees and lowering into a 45° squatted

BIOMECHANICS OF ANKLE BRACING 63
position. While descending, the participant moved his/her arms in a counterweight fashion. In
this position, the participant’s form was visually evaluated by the researcher to ensure consistent
form across trials and participants; if the participant’s position was not acceptable, the researcher
stopped the test. Participants held this 45° squatted position for 2 seconds, before jumping and
touching the Vertec™ device as high as possible. At landing, the participant’s weight was to be
evenly distributed over both feet, with the dominant foot, in its entirety, contacting the force
platform. A trial was considered successful if the participant paused for 2 seconds in the 45°
squatted position and landed on two feet, with the dominant foot in contact with the force
platform.
A maximum of five submaximal attempts were allowed for the participant to become
comfortable with the test, ensure equipment was in working order, and allow the researcher to
provide feedback regarding the participant’s form. Once the participant was familiar with the
test, he/she performed the first of three recorded trials. The researcher began collecting EMG and
GRF data and notified the participant; when the participant was ready, he/she performed a
maximal effort jump. The EMG and GRF data were collected during takeoff and landing, and
ceased after the system weight normalized. If the researcher deemed the jump satisfactory, the
height was recorded for the flight phase of the jump, in addition to EMG and GRF data. The
participant then performed the test for two more recorded trials, spaced approximately 1 minute
apart.
After completing the Vertical Jump Test under the first condition, a 5 minute rest period
was provided. The purpose of this rest period was to allow the participant to transition to the next
component of the testing protocol and allow for physical recovery. If the application of ankle
braces was required, the participant did so during this time. Once the participant transitioned to
BIOMECHANICS OF ANKLE BRACING 64
the next condition, testing procedures mirrored that of the first condition, as described in detail
previously. After the completion of the second set of trials, another 5 minute rest period took
place, allowing the participant to transition to the last condition. Testing procedures followed the
same procedures outlined for the previous two conditions.
Following completion of the Vertical Jump Test under all three conditions, the participant
removed any ankle braces (if necessary) and electrodes. Once ankle braces and electrodes were
removed, the participant completed a 5 minute cooldown on a cycle ergometer at a perceived
exertion level of 10-12 on the Borg Scale. A visual aid was provided to the participant during
this time to help he/she attain the desired intensity. The testing session concluded after
completion of the 5 minute cooldown.
The second testing session was performed as soon as possible following the completion
of the first session, with a minimum of 24 hours between sessions and a maximum of 10 days.
All participants were asked to wear the same footwear that were worn for the first testing
session. The second testing session began with the warmup, application of the electrodes, MVCs,
and application of the appropriate braces (as per the pre-selected order). After the electrodes and
ankle braces (if necessary) had been applied, the cutting task was explained to the participant
(Figure 12). The participant began the test five metres away from the force platform, where the
starting line and timing gates were set up. The participant positioned him/herself in an athletic
position, with his/her dominant limb forward in a staggered stance. When the participant was
ready to start the test, he/she crossed cross the timing gate, initializing the timing mechanism.
The participant ran forwards toward the force platform; a cone was positioned directly in front of
the force platform for the participant to touch. The participant touched the cone, simultaneously
planting the dominant foot on the force platform. Immediately after touching the cone, the

BIOMECHANICS OF ANKLE BRACING 65
participant side shuffled to his/her left or right for three metres, based on the planting foot,
towards another cone; the direction that the participant side shuffled was the same for all
subsequent trials. The participant touched this cone and then side shuffled back to the first cone.
After touching the first cone and force plate for the second time, the participant backpedaled
towards the starting line. The test concluded once the participant crossed the timing gate at the
start line.
Figure 12. Cutting task. This figure displays the set up for the cutting task.
The participant was asked to complete at least two submaximal tests to familiarize
him/herself with the cutting task, and to ensure that the equipment was functioning properly.
Once the participant was familiar with the test, he/she performed the first of three recorded trials.
The researcher began collecting EMG and GRF data and notified the participant; when the
participant was ready, he/she initiated the test by crossing the timing gate. The EMG and GRF
data were collected from the moment the researcher notified the participant, to when the
participant crossed the timing gate at the finish. If the participant successfully contacted the force
platform with the entire foot, EMG, GRFs, and time to complete the lateral cutting task was
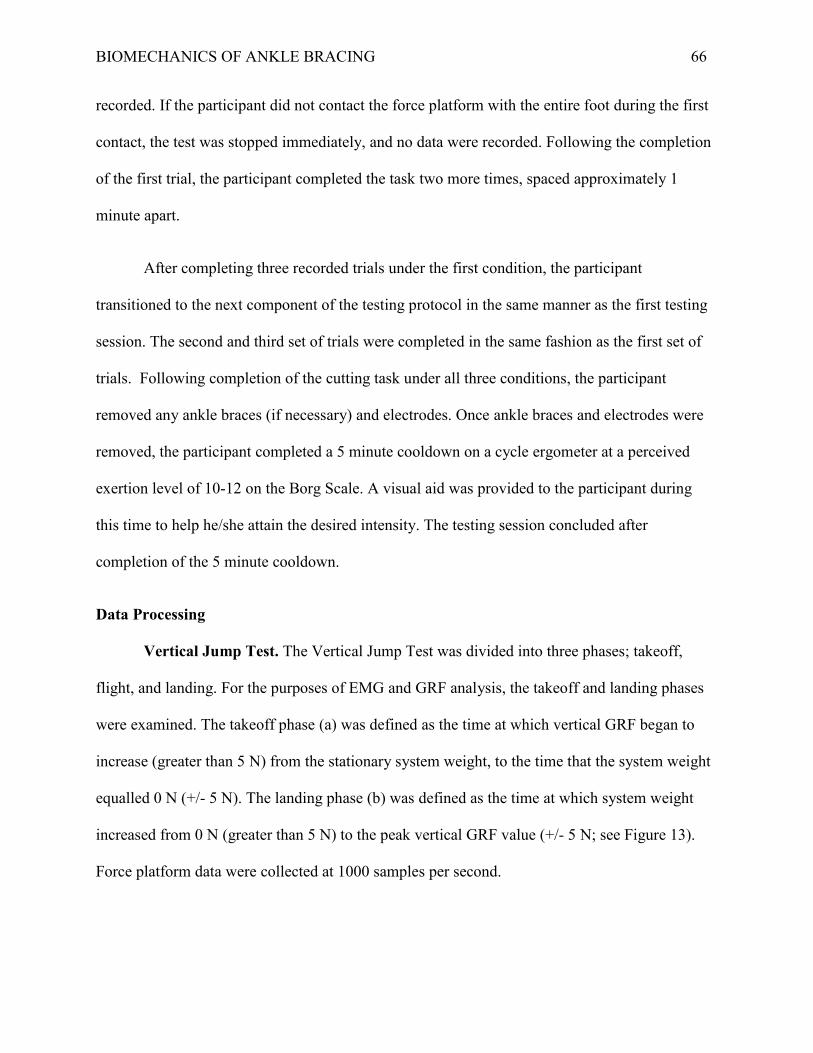
BIOMECHANICS OF ANKLE BRACING 66
recorded. If the participant did not contact the force platform with the entire foot during the first
contact, the test was stopped immediately, and no data were recorded. Following the completion
of the first trial, the participant completed the task two more times, spaced approximately 1
minute apart.
After completing three recorded trials under the first condition, the participant
transitioned to the next component of the testing protocol in the same manner as the first testing
session. The second and third set of trials were completed in the same fashion as the first set of
trials. Following completion of the cutting task under all three conditions, the participant
removed any ankle braces (if necessary) and electrodes. Once ankle braces and electrodes were
removed, the participant completed a 5 minute cooldown on a cycle ergometer at a perceived
exertion level of 10-12 on the Borg Scale. A visual aid was provided to the participant during
this time to help he/she attain the desired intensity. The testing session concluded after
completion of the 5 minute cooldown.
Data Processing
Vertical Jump Test. The Vertical Jump Test was divided into three phases; takeoff,
flight, and landing. For the purposes of EMG and GRF analysis, the takeoff and landing phases
were examined. The takeoff phase (a) was defined as the time at which vertical GRF began to
increase (greater than 5 N) from the stationary system weight, to the time that the system weight
equalled 0 N (+/- 5 N). The landing phase (b) was defined as the time at which system weight
increased from 0 N (greater than 5 N) to the peak vertical GRF value (+/- 5 N; see Figure 13).
Force platform data were collected at 1000 samples per second.
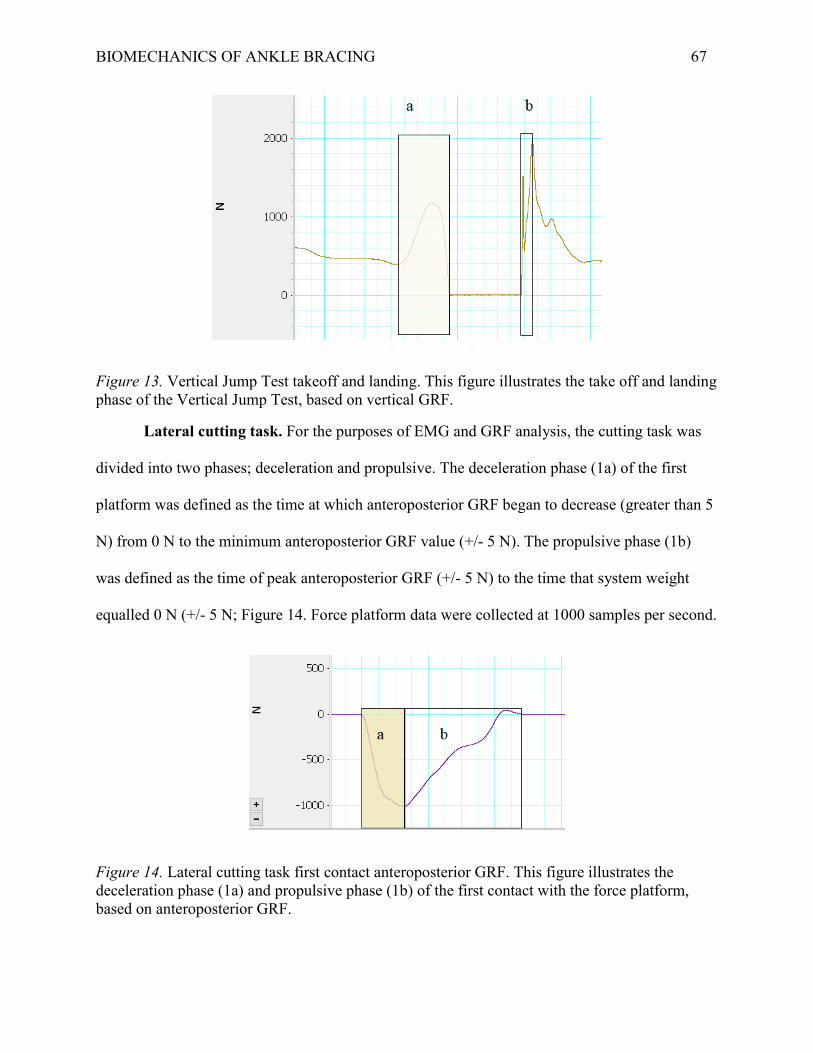
BIOMECHANICS OF ANKLE BRACING 67
Figure 13. Vertical Jump Test takeoff and landing. This figure illustrates the take off and landing phase of the Vertical Jump Test, based on vertical GRF.
Lateral cutting task. For the purposes of EMG and GRF analysis, the cutting task was
divided into two phases; deceleration and propulsive. The deceleration phase (1a) of the first
platform was defined as the time at which anteroposterior GRF began to decrease (greater than 5
N) from 0 N to the minimum anteroposterior GRF value (+/- 5 N). The propulsive phase (1b)
was defined as the time of peak anteroposterior GRF (+/- 5 N) to the time that system weight
equalled 0 N (+/- 5 N; Figure 14. Force platform data were collected at 1000 samples per second.
Figure 14. Lateral cutting task first contact anteroposterior GRF. This figure illustrates the deceleration phase (1a) and propulsive phase (1b) of the first contact with the force platform, based on anteroposterior GRF.

BIOMECHANICS OF ANKLE BRACING 68
Electromyography data. Raw EMG data were bandpass filtered with a low and high
cut-off frequency of 500 Hz and 10 Hz, respectively. This was done to minimize movement
artifact associated with dynamic movements, and based on recommendations by Stegeman and
Hermens (1998) and Merletti, Farina, Hermens, Freriks, and Harlaar (1999) for the processing of
sEMG for dynamic movements. Following bandpass filtering, the data were full wave rectified
to create a linear envelope (Kamen & Gabriel, 2010).
Preliminary Data Analysis
All electromyographic and force data were extracted from LabChart© and transferred to
a Microsoft Excel spreadsheet for the purposes of data management and preliminary analysis.
Electromyography data. Mean EMG activity (mV) for the 3 seconds MVC was first
calculated. Mean EMG activity (mV) for each muscle during each phase of the Vertical Jump
Test and cutting task was then calculated and averaged across the three recorded trials after being
checked for reliability using a two-way, mixed effects intraclass correlation (Shrout & Fleiss,
1979; Koo & Li, 2016). The average of the three trials for each condition and phase was then
expressed as a percentage of MVC (%MVC; Halaki & Ginn, 2012).
Force platform data. Force platform data for each phase of the Vertical Jump Test and
cutting task were averaged across the three recorded trials after being checked for reliability
using a two-way, mixed effects intraclass correlation (Shrout & Fleiss, 1979; Koo & Li, 2016).
The average of the three trials for each condition and phase was then expressed as a percentage
of bodyweight (%BW).
Performance data. Vertical jump height (cm) was averaged across the three recorded
trials for each condition after being checked for reliability using a two-way, mixed effects
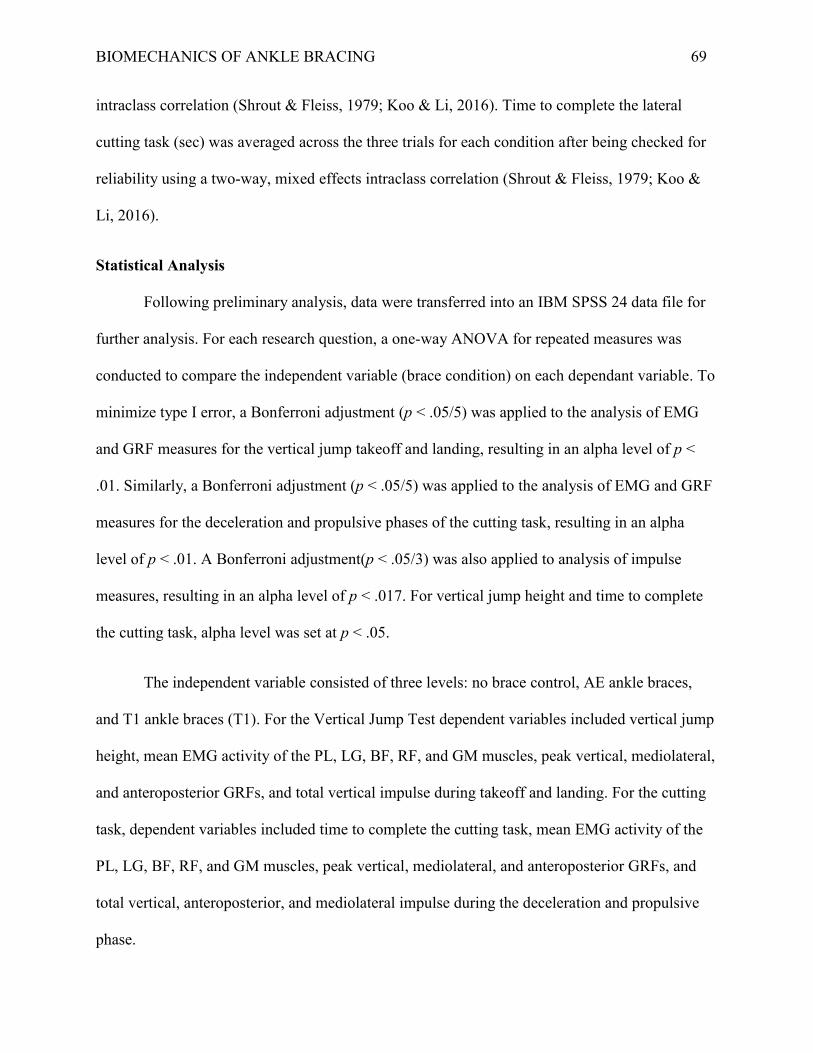
BIOMECHANICS OF ANKLE BRACING 69
intraclass correlation (Shrout & Fleiss, 1979; Koo & Li, 2016). Time to complete the lateral
cutting task (sec) was averaged across the three trials for each condition after being checked for
reliability using a two-way, mixed effects intraclass correlation (Shrout & Fleiss, 1979; Koo &
Li, 2016).
Statistical Analysis
Following preliminary analysis, data were transferred into an IBM SPSS 24 data file for
further analysis. For each research question, a one-way ANOVA for repeated measures was
conducted to compare the independent variable (brace condition) on each dependant variable. To
minimize type I error, a Bonferroni adjustment (p < .05/5) was applied to the analysis of EMG
and GRF measures for the vertical jump takeoff and landing, resulting in an alpha level of p <
.01. Similarly, a Bonferroni adjustment (p < .05/5) was applied to the analysis of EMG and GRF
measures for the deceleration and propulsive phases of the cutting task, resulting in an alpha
level of p < .01. A Bonferroni adjustment(p < .05/3) was also applied to analysis of impulse
measures, resulting in an alpha level of p < .017. For vertical jump height and time to complete
the cutting task, alpha level was set at p < .05.
The independent variable consisted of three levels: no brace control, AE ankle braces,
and T1 ankle braces (T1). For the Vertical Jump Test dependent variables included vertical jump
height, mean EMG activity of the PL, LG, BF, RF, and GM muscles, peak vertical, mediolateral,
and anteroposterior GRFs, and total vertical impulse during takeoff and landing. For the cutting
task, dependent variables included time to complete the cutting task, mean EMG activity of the
PL, LG, BF, RF, and GM muscles, peak vertical, mediolateral, and anteroposterior GRFs, and
total vertical, anteroposterior, and mediolateral impulse during the deceleration and propulsive
phase.

BIOMECHANICS OF ANKLE BRACING 70
For all variables, boxplots were visually inspected to determine the presence of outliers;
all analyses were performed with and without outliers to determine if they influenced the results.
The data were then checked for normality using the Shapiro-Wilk test for normality. If data were
not normally distributed, the Friedman’s test was conducted, in addition to a one-way ANOVA
for repeated measures. Data were assessed for sphericity using Mauchly's Test of Sphericity. If
the data violated the assumption of sphericity, a Greenhouse-Geisser correction was applied.
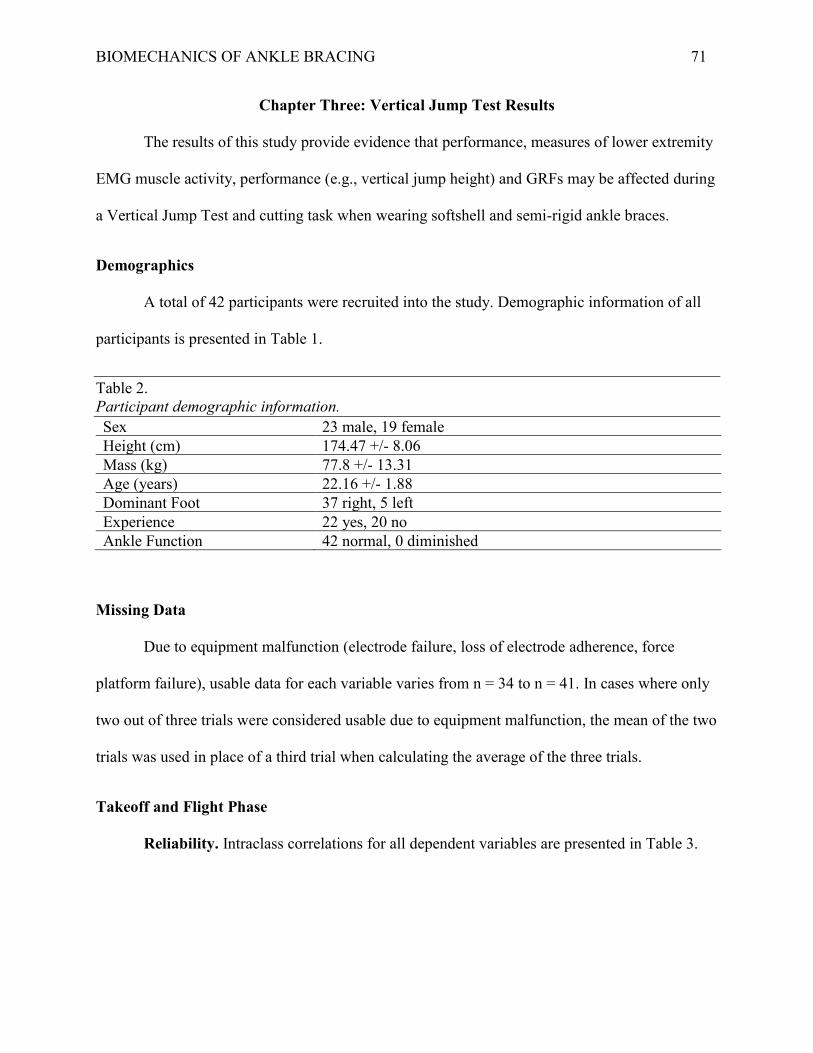
BIOMECHANICS OF ANKLE BRACING 71
Chapter Three: Vertical Jump Test Results
The results of this study provide evidence that performance, measures of lower extremity
EMG muscle activity, performance (e.g., vertical jump height) and GRFs may be affected during
a Vertical Jump Test and cutting task when wearing softshell and semi-rigid ankle braces.
Demographics
A total of 42 participants were recruited into the study. Demographic information of all
participants is presented in Table 1.
Table 2. Participant demographic information. Sex 23 male, 19 female Height (cm) 174.47 +/- 8.06 Mass (kg) 77.8 +/- 13.31 Age (years) 22.16 +/- 1.88 Dominant Foot 37 right, 5 left Experience 22 yes, 20 no Ankle Function 42 normal, 0 diminished
Missing Data
Due to equipment malfunction (electrode failure, loss of electrode adherence, force
platform failure), usable data for each variable varies from n = 34 to n = 41. In cases where only
two out of three trials were considered usable due to equipment malfunction, the mean of the two
trials was used in place of a third trial when calculating the average of the three trials.
Takeoff and Flight Phase
Reliability. Intraclass correlations for all dependent variables are presented in Table 3.
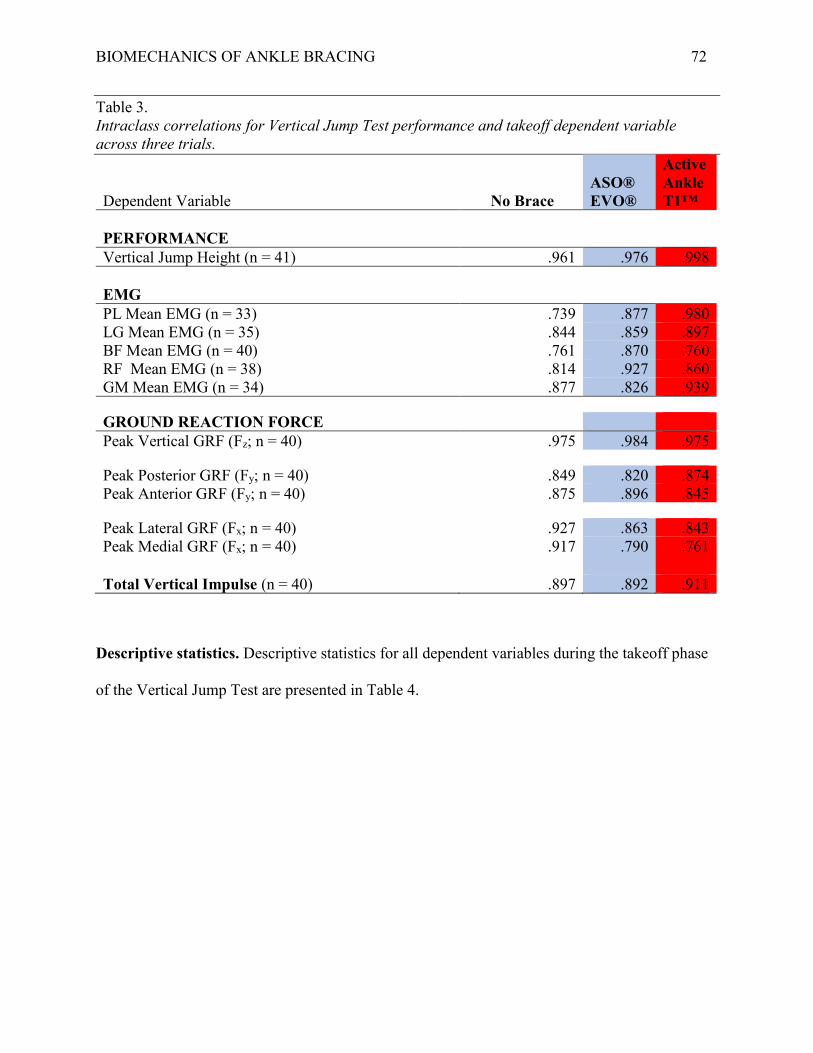
BIOMECHANICS OF ANKLE BRACING 72
Table 3. Intraclass correlations for Vertical Jump Test performance and takeoff dependent variable across three trials.
Dependent Variable No Brace ASO® EVO®
Active Ankle T1™
PERFORMANCE Vertical Jump Height (n = 41) .961 .976 .998 EMG PL Mean EMG (n = 33) .739 .877 .980 LG Mean EMG (n = 35) .844 .859 .897 BF Mean EMG (n = 40) .761 .870 .760 RF Mean EMG (n = 38) .814 .927 .860 GM Mean EMG (n = 34) .877 .826 .939
GROUND REACTION FORCE Peak Vertical GRF (Fz; n = 40) .975 .984 .975
Peak Posterior GRF (Fy; n = 40) .849 .820 .874 Peak Anterior GRF (Fy; n = 40) .875 .896 .845
Peak Lateral GRF (Fx; n = 40) .927 .863 .843 Peak Medial GRF (Fx; n = 40) .917 .790 .761
Total Vertical Impulse (n = 40) .897 .892 .911
Descriptive statistics. Descriptive statistics for all dependent variables during the takeoff phase
of the Vertical Jump Test are presented in Table 4.

BIOMECHANICS OF ANKLE BRACING 73
Table 4. Electromyography and kinetic descriptive statistics for the takeoff phase of the Vertical Jump Test.
No Brace ASO® EVO® Active Ankle T1™
Dependant Variable Mean SD n Mean SD n Mean SD n EMG (%MVC) PL Mean EMG 69.22 15.21 33 65.42 14.71 33 66.93 15.61 33 LG Mean EMG 73.45 34.83 35 70.67 35.99 35 66.11 36.47 35 BF Mean EMG 30.53 14.54 40 33.05 20.22 40 32.89 19.5 40 RF Mean EMG 98.81 38.67 38 91.65 34.66 38 98.58 38.59 38 GM Mean EMG 55.33 34.07 34 53.98 35.07 34 55.35 34.13 34
GRF (%BW) Peak Vertical GRF (Fz) 115.3 12.57 40 115.77 12.85 40 115.41 13.33 40
Peak Posterior GRF (Fy) 10.31 5.69 40 10.71 5.37 40 10.68 6.05 40 Peak Anterior GRF (Fy) 13.51 5.88 40 13.21 5.87 40 13.25 6.06 40
Peak Lateral GRF (Fx) 10.31 5.69 40 16.95 4.95 40 17.07 5.18 40 Peak Medial GRF (Fx) 0.198 2.61 40 2.21 2.8 40 2.58 2.96 40
Total Vertical Impulse (N·s) 286.1 70.2 40 284.62 68.7 40 288.87 65.17 40
Inferential statistics.
Question one: Is there a difference amongst ankle brace conditions in vertical jump height for
the Vertical Jump Test?
As assessed by boxplot inspection, there was one outlier in the T1 condition. This outlier
was considered to be a true value and, therefore, was included in the analysis. Furthermore, the
analysis was conducted with and without outlier data and produced similar results. The data were
normally distributed, as assessed by Shapiro-Wilk’s Test (p > .05). A one-way ANOVA for

BIOMECHANICS OF ANKLE BRACING 75
Question two: Is there a difference amongst ankle brace conditions in measures of lower
extremity EMG activity and kinetics during the takeoff phase of the Vertical Jump Test?
Peroneus longus mean EMG activity-takeoff. As assessed by boxplot inspection, there
were four outliers in the no brace condition, four outliers in the AE condition, and five outliers in
the T1 condition. The analysis was completed with and without the outliers. These outliers were
found to influence the results; thus, they were removed from the analysis due to type I error
concerns. The data were not normally distributed, as assessed by Shapiro-Wilk’s Test (p < .05).
As such, nonparametric and parametric testing was conducted to compare the effect of the
independent variable (brace condition) on PL mean EMG activity during the takeoff phase. The
Friedman’s test revealed no significant change in PL mean EMG activity during the takeoff
phase, χ2(2) = 0.970, p = .616. A one-way ANOVA for repeated measures was also conducted.
There was no significant change in PL mean EMG activity during the takeoff F(2, 64) = 2.66, p
= .077. Descriptive statistics are presented in Table 4.
Lateral gastrocnemius mean EMG activity-takeoff. As assessed by boxplot inspection,
there were two outliers in the no brace condition. The analysis was completed with and without
the outliers. These outliers were found to influence the results; thus, they were removed from the
analysis due to type II error concerns. The data were not normally distributed, as assessed by
Shapiro-Wilk’s Test (p < .05). As such, nonparametric parametric and parametric testing was
conducted to compare the effect of the independent variable (brace condition) on LG mean EMG
activity during the takeoff phase. The Friedman’s test revealed a significant change in LG mean
EMG activity during the takeoff phase, χ2(2) = 9.314, p < .001. A one-way ANOVA for repeated
measures was also conducted. There was a similar, significant change in LG mean EMG activity
during the takeoff phase, F(2, 68) = 5.597, p < .001, ηp2 = .141. Lateral gastrocnemius mean


BIOMECHANICS OF ANKLE BRACING 77
mean EMG activity during the takeoff phase. The Friedman’s test revealed no significant change
in BF mean EMG activity during the takeoff phase, χ2(2) = 2.450, p = .294. A one-way ANOVA
for repeated measures was also conducted. The assumption of sphericity was not met, as assessed
by Mauchly’s Test of Sphericity, χ2(2) = 12.317, p = .002. Therefore, a Greenhouse-Geisser
correction was applied. As with the Friedman’s test, there was no significant change in BF mean
EMG activity during the takeoff phase, F(1.566, 61.088) = 1.057, p = .339. Descriptive statistics
are presented in Table 4.
Rectus femoris mean EMG activity-takeoff. As assessed by boxplot inspection, there was
one outlier in the T1 condition. The analysis was completed with and without the outlier. The
outlier did not influence the results; thus, it was included in the analysis. The data were not
normally distributed, as assessed by Shapiro-Wilk’s Test (p < .05). As such, nonparametric and
parametric testing was conducted to compare the effect of the independent variable (brace
condition) on RF mean EMG activity during the takeoff phase. The Friedman’s test revealed a
significant change in RF mean EMG activity during the takeoff phase, χ2(2) = 21.211, p <.001.
Due to type I error concerns, however, a one-way ANOVA for repeated measures was also
conducted. The assumption of sphericity was not met, as assessed by Mauchly’s Test of
Sphericity, χ2(2) = 6.701, p = .035. Therefore, a Greenhouse-Geisser correction was applied.
Unlike the Friedman’s test, there was no significant change in RF mean EMG activity during the
takeoff phase, F(1.710, 63.255) = 2.845, p = .074. Descriptive statistics are presented in Table 4.
Gluteus medius mean EMG activity-takeoff. As assessed by boxplot inspection, there
were two outliers in the no brace condition, three outliers in the AE condition, and two outliers in
the T1 condition. The analysis was completed with and without the outliers. These outliers did
not influence the results; thus, they were included in the analysis. The data were not normally
BIOMECHANICS OF ANKLE BRACING 78
distributed, as assessed by Shapiro-Wilk’s Test (p < .05). As such, nonparametric and parametric
testing was conducted to compare the effect of the independent variable (brace condition) on GM
mean EMG activity during the takeoff phase. The Friedman’s test revealed no significant change
in GM mean EMG activity during the takeoff phase, χ2(2) = 2.294, p = .318. A one-way
ANOVA for repeated measures was also conducted. The assumption of sphericity was not met,
as assessed by Mauchly’s Test of Sphericity, χ2(2) = 8.088, p = .018. Therefore, a Greenhouse-
Geisser correction was applied. As with the Friedman’s test, there was no significant change in
GM mean EMG activity during the takeoff phase, F(1.635, 53.950) = 0.377, p = .672.
Descriptive statistics are presented in Table 4.
Peak vertical GRF-takeoff. As assessed by boxplot inspection, there was one outlier in
the AE condition. The analysis was completed with and without the outlier. The outlier did not
influence the results; thus, it was included in the analysis. The data were normally distributed, as
assessed by Shapiro-Wilk’s Test (p > .05). As such, a one-way ANOVA for repeated measures
was conducted to compare the effect of the independent variable (brace condition) on peak
vertical GRF during the takeoff phase. The assumption of sphericity was not met, as assessed by
Mauchly’s Test of Sphericity, χ2(2) = 6.591, p = .037. Therefore, a Greenhouse-Geisser
correction was applied. As with the Friedman’s test, there was no significant change in peak
vertical GRF during the takeoff phase, F(1.725, 67.285) = 0.374, p = .618. Descriptive statistics
are presented in Table 4.
Peak posterior GRF-takeoff. As assessed by boxplot inspection, there were two outliers
in the no brace condition, one outlier in the AE condition, and four outliers in the T1 condition.
The analysis was completed with and without the outliers. These outliers did not influence the
results; thus, they were included in the analysis. The data were not normally distributed for the
BIOMECHANICS OF ANKLE BRACING 79
no brace or T1 conditions, as assessed by Shapiro-Wilk’s Test (p < .05). The data were normally
distributed for the AE condition, as assessed by Shapiro-Wilk’s Test (p >.05). As such,
nonparametric and parametric testing was conducted to compare the effect of the independent
variable (brace condition) on peak posterior GRF during the takeoff phase. The Friedman’s test
revealed no significant change in peak posterior GRF during the takeoff phase, χ2(2) = 4.550, p
= .103. A one-way ANOVA for repeated measures was also conducted. The assumption of
sphericity was not met, as assessed by Mauchly’s Test of Sphericity, χ2(2) = 7.433, p = .024.
Therefore, a Greenhouse-Geisser correction was applied. As with the Friedman’s test, there was
no significant change in peak posterior GRF during the takeoff phase, F(1.698, 66.233) = 0.454,
p = .605. Descriptive statistics are presented in Table 4.
Peak anterior GRF-takeoff. As assessed by boxplot inspection, there were no outliers.
The data were normally distributed as assessed by Shapiro-Wilk’s Test (p > .05). A one-way
ANOVA for repeated measures was conducted to compare the effect of the independent variable
(brace condition) on peak anterior GRF during the takeoff phase. There was no significant
change in peak anterior GRF during the takeoff phase, F(2, 78) = 0.341, p = .712. Descriptive
statistics are presented in Table 4.
Peak lateral GRF-takeoff. As assessed by boxplot inspection, there were two outliers in
the no brace condition. The analysis was completed with and without the outliers. The outliers
did not influence the results; thus, they were included in the analysis. The data were not normally
distributed for the no brace condition as assessed by Shapiro-Wilk’s Test (p < .05). The data
were normally distributed for the AE and T1 conditions as assessed by Shapiro-Wilk’s Test (p
>.05). As such, nonparametric and parametric testing was conducted to compare the effect of the
independent variable (brace condition) on peak lateral GRF activity during the takeoff phase.
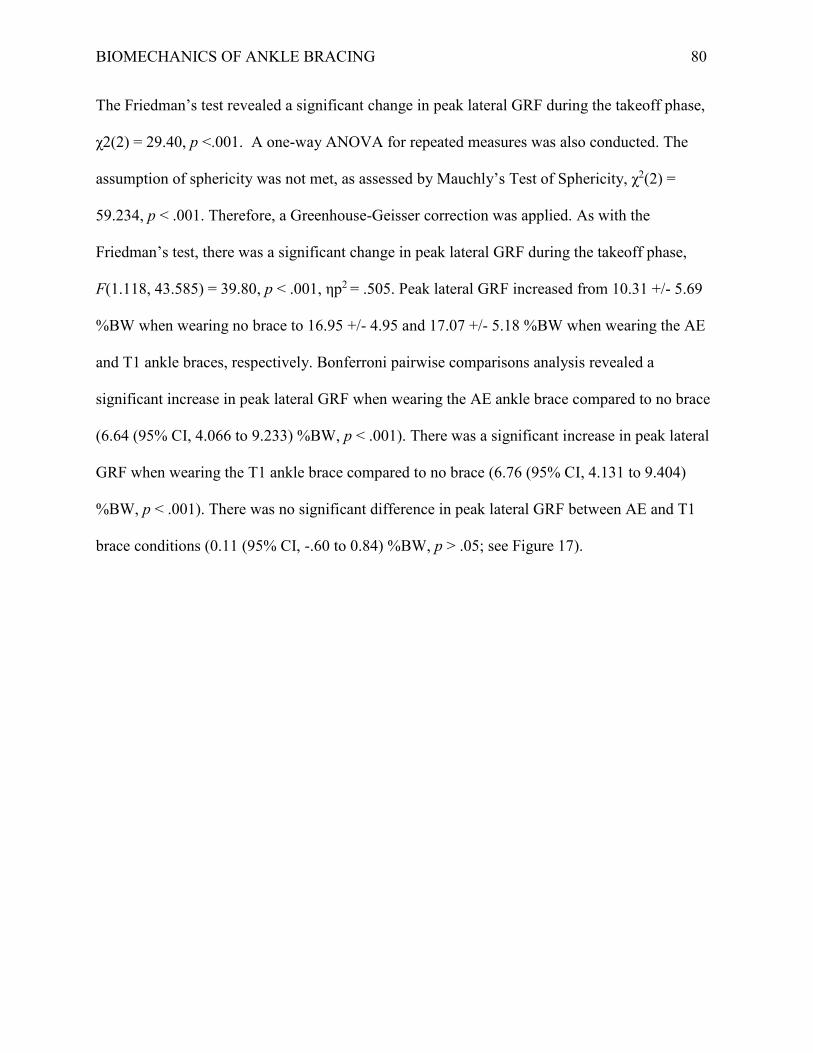
BIOMECHANICS OF ANKLE BRACING 80
The Friedman’s test revealed a significant change in peak lateral GRF during the takeoff phase,
χ2(2) = 29.40, p <.001. A one-way ANOVA for repeated measures was also conducted. The
assumption of sphericity was not met, as assessed by Mauchly’s Test of Sphericity, χ2(2) =
59.234, p < .001. Therefore, a Greenhouse-Geisser correction was applied. As with the
Friedman’s test, there was a significant change in peak lateral GRF during the takeoff phase,
F(1.118, 43.585) = 39.80, p < .001, ηp2 = .505. Peak lateral GRF increased from 10.31 +/- 5.69
%BW when wearing no brace to 16.95 +/- 4.95 and 17.07 +/- 5.18 %BW when wearing the AE
and T1 ankle braces, respectively. Bonferroni pairwise comparisons analysis revealed a
significant increase in peak lateral GRF when wearing the AE ankle brace compared to no brace
(6.64 (95% CI, 4.066 to 9.233) %BW, p < .001). There was a significant increase in peak lateral
GRF when wearing the T1 ankle brace compared to no brace (6.76 (95% CI, 4.131 to 9.404)
%BW, p < .001). There was no significant difference in peak lateral GRF between AE and T1
brace conditions (0.11 (95% CI, -.60 to 0.84) %BW, p > .05; see Figure 17).
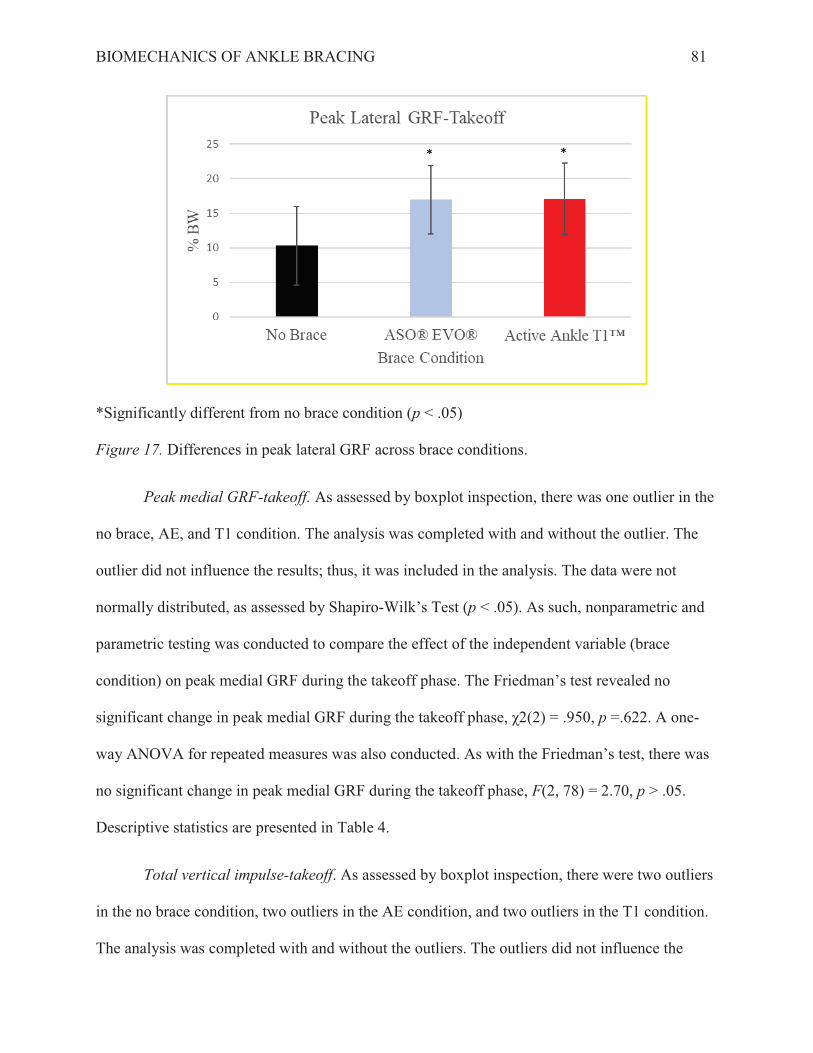
BIOMECHANICS OF ANKLE BRACING 82
results; thus, they were included in the analysis. The data were normally distributed in the no
brace and T1 conditions, as assessed by Shapiro-Wilk’s Test (p > .05). The data were not
normally distributed in the AE condition as assessed by Shapiro-Wilk’s Test (p < .05). As such,
nonparametric and parametric testing was conducted to compare the effect of the independent
variable (brace condition) on total vertical impulse during the takeoff phase. The Friedman’s test
revealed no significant change in total vertical impulse during the takeoff phase, χ2(2) = 1.40, p
= .497. A one-way ANOVA for repeated measures was also conducted. As with the Friedman’s
test, there was no significant change in total vertical impulse during the takeoff phase, F(2, 78) =
0.854, p > .05. Descriptive statistics are presented in Table 4.
Landing
Reliability. Intraclass correlations for all dependent variables are presented in Table 5.

BIOMECHANICS OF ANKLE BRACING 83
Table 5. Intraclass correlations for Vertical Jump Test landing dependent variables across three trials.
Dependent Variable No Brace ASO® EVO®
Active Ankle T1™
EMG PL Mean EMG (n = 30) .836 .662 .899 LG Mean EMG (n = 34) .518 .634 .612 BF Mean EMG (n = 39) .593 .666 .762 RF Mean EMG (n = 38) .779 .542 .774 GM Mean EMG (n = 35) .732 .636 .651
GROUND REACTION FORCE Peak Vertical GRF (Fz; n = 40) .716 .774 .794
Peak Posterior GRF (Fy; n = 40) .233 .621 .509 Peak Anterior GRF (Fy; n = 40) .681 .663 .668
Peak Lateral GRF (Fx; n = 38) .519 .465 .632 Peak Medial GRF (Fx; n = 49) .618 .514 .523
Total Vertical Impulse (n = 40) .347 .429 .651
Descriptive statistics. Descriptive statistics for all dependant variables during the
landing phase of the Vertical Jump Test are presented in Table 6.
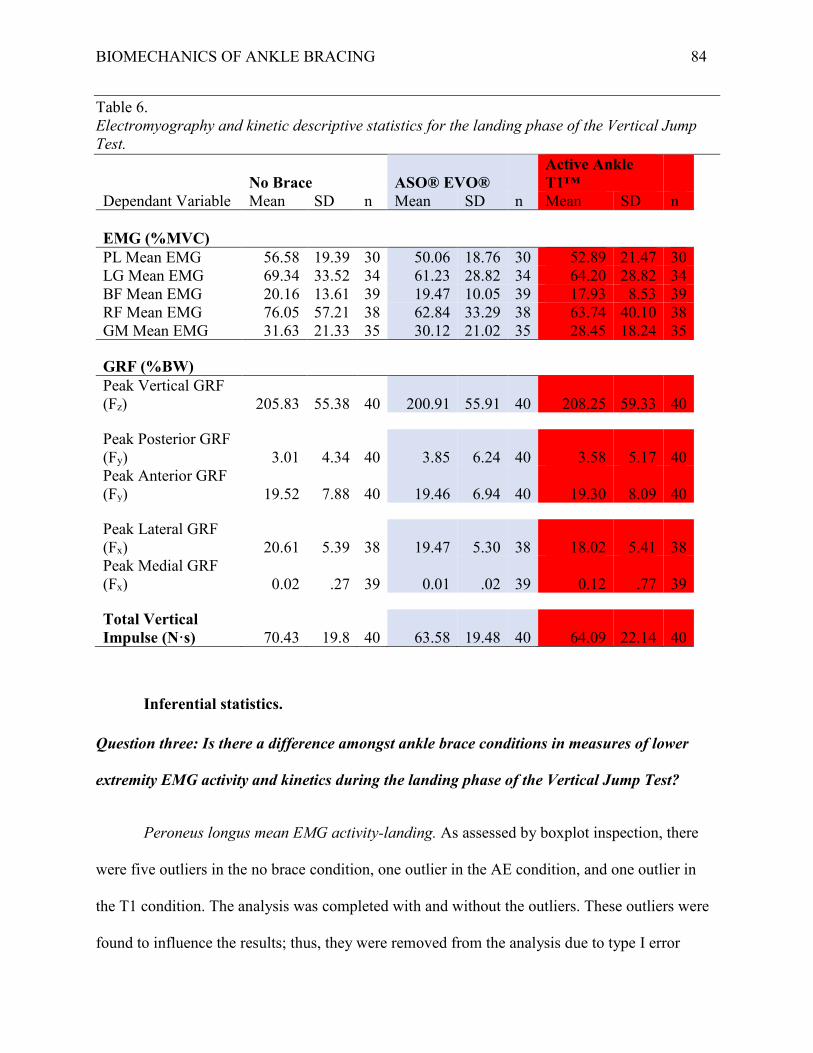
BIOMECHANICS OF ANKLE BRACING 84
Table 6. Electromyography and kinetic descriptive statistics for the landing phase of the Vertical Jump Test.
No Brace ASO® EVO® Active Ankle T1™
Dependant Variable Mean SD n Mean SD n Mean SD n EMG (%MVC) PL Mean EMG 56.58 19.39 30 50.06 18.76 30 52.89 21.47 30 LG Mean EMG 69.34 33.52 34 61.23 28.82 34 64.20 28.82 34 BF Mean EMG 20.16 13.61 39 19.47 10.05 39 17.93 8.53 39 RF Mean EMG 76.05 57.21 38 62.84 33.29 38 63.74 40.10 38 GM Mean EMG 31.63 21.33 35 30.12 21.02 35 28.45 18.24 35
GRF (%BW) Peak Vertical GRF (Fz) 205.83 55.38 40 200.91 55.91 40 208.25 59.33 40
Peak Posterior GRF (Fy) 3.01 4.34 40 3.85 6.24 40 3.58 5.17 40 Peak Anterior GRF (Fy) 19.52 7.88 40 19.46 6.94 40 19.30 8.09 40
Peak Lateral GRF (Fx) 20.61 5.39 38 19.47 5.30 38 18.02 5.41 38 Peak Medial GRF (Fx) 0.02 .27 39 0.01 .02 39 0.12 .77 39
Total Vertical Impulse (N·s) 70.43 19.8 40 63.58 19.48 40 64.09 22.14 40
Inferential statistics.
Question three: Is there a difference amongst ankle brace conditions in measures of lower
extremity EMG activity and kinetics during the landing phase of the Vertical Jump Test?
Peroneus longus mean EMG activity-landing. As assessed by boxplot inspection, there
were five outliers in the no brace condition, one outlier in the AE condition, and one outlier in
the T1 condition. The analysis was completed with and without the outliers. These outliers were
found to influence the results; thus, they were removed from the analysis due to type I error
BIOMECHANICS OF ANKLE BRACING 85
concerns. The data were normally distributed, as assessed by Shapiro-Wilk’s Test (p > .05). As
such, one-way ANOVA for repeated measures was conducted to compare the effect of the
independent variable (brace condition) on PL mean EMG activity during the landing phase.
There was no significant change in PL mean EMG activity during the landing phase, F(2, 58) =
2.301, p = .109. Descriptive statistics are presented in Table 6.
Lateral gastrocnemius mean EMG activity-landing. As assessed by boxplot inspection,
there were two outliers in the no brace condition. The analysis was completed with and without
the outliers. These outliers did not influence the results; thus, they were included in the analysis.
The data were not normally distributed in the no brace condition, as assessed by Shapiro-Wilk’s
Test (p < .05). The data were normally distributed in the AE and T1 conditions, as assessed by
Shapiro-Wilk’s Test (p > .05). As such, nonparametric and parametric testing was conducted to
compare the effect of the independent variable (brace condition) on LG mean EMG activity
during the landing phase. The Friedman’s test revealed no significant change in LG mean EMG
activity during the landing phase, χ2(2) = 1.235, p = .539. A one-way ANOVA for repeated
measures was also conducted. As with the Friedman’s test, there was no significant change in
LG mean EMG activity during the landing phase, F(2.049, 66) = 2.049, p = .137. Descriptive
statistics are presented in Table 6.
Biceps femoris mean EMG activity-landing. As assessed by boxplot inspection, there
were two outliers in the no brace condition, one outlier in the AE condition, and one outlier in
the T1 condition. The analysis was completed with and without the outliers. These outliers did
not influence the results; thus, they were included in the analysis. The data were not normally
distributed, as assessed by Shapiro-Wilk’s Test (p < .05). As such, nonparametric and parametric
testing was conducted to compare the effect of the independent variable (brace condition) on BF

BIOMECHANICS OF ANKLE BRACING 86
mean EMG activity during the landing phase. The Friedman’s test revealed no significant change
in LG mean EMG activity during the landing phase, χ2(2) = 1.436, p = .488. A one-way
ANOVA for repeated measures was also conducted. As with the Friedman’s test, there was no
significant change in BF mean EMG activity, F(2, 76) = 1.172, p = .315. Descriptive statistics
are presented in Table 6.
Rectus femoris mean EMG activity-landing. As assessed by boxplot inspection, there
were four outliers in the no brace condition, two outliers in the AE condition, and two outliers in
the T1 condition. The analysis was completed with and without the outliers. These outliers did
not influence the results; thus, they were included in the analysis. The data were not normally
distributed, as assessed by Shapiro-Wilk’s Test (p < .05). As such, nonparametric and parametric
testing was conducted to was conducted to compare the effect of the independent variable (brace
condition) on RF mean EMG activity during the landing phase. The Friedman’s test revealed no
significant change in RF mean EMG activity during the landing phase, χ2(2) = 4.00, p = .135. A
one-way ANOVA for repeated measures was also conducted. The assumption of sphericity was
not met, as assessed by Mauchly’s test of sphericity, χ2(2) = 27.023, p < .001. Therefore, a
Greenhouse-Geisser correction was applied. As with the Friedman’s test, there was no significant
change in RF mean EMG activity during the landing phase, F(1.309, 48.431) = 2.466, p = .114.
Descriptive statistics are presented in Table 6.
Gluteus medius mean EMG activity-landing. As assessed by boxplot inspection, there
were two outliers in the no brace condition and three outliers in the AE condition. The analysis
was completed with and without the outliers. These outliers did not influence the results; thus,
they were included in the analysis. The were not normally distributed in the no brace or AE
conditions, as assessed by Shapiro-Wilk’s Test (p < .05). The data were normally distributed in
BIOMECHANICS OF ANKLE BRACING 87
the T1 condition, as assessed by Shapiro-Wilk’s Test. As such, nonparametric and parametric
testing was conducted to compare the effect of the independent variable (brace condition) on GM
mean EMG activity during the landing phase. The Friedman’s test revealed no significant change
in GM mean EMG activity during the landing phase, χ2(2) = 1.771, p = .412. As with the
Friedman’s test, there was no significant change in GM mean EMG activity, F(2, 68) = 0.800, p
= .800. Descriptive statistics are presented in Table 6.
Peak Vertical GRF-landing. As assessed by boxplot inspection, there was one outlier in
the AE condition. The analysis was completed with and without the outlier .This outlier did not
influence the results; thus, it was included in the analysis. The data were normally distributed in
the no brace condition, as assessed by Shapiro-Wilk’s Test (p > .05). This outlier did not
influence the results; thus, it was included in the analysis. The data were not normally distributed
in the AE and T1 condition, as assessed by Shapiro-Wilk’s Test (p < .05). As such,
nonparametric and parametric testing was conducted to compare the effect of the independent
variable (brace condition) on peak vertical GRF during the landing phase. The Friedman’s test
revealed no significant change in peak vertical GRF during the landing phase, χ2(2) = 1.850, p =
.397. A one-way ANOVA for repeated measures was also conducted. As with the Friedman’s
test, there was no significant change in peak vertical GRF, F(2, 78) = 0.561, p = .573.
Descriptive statistics are presented in Table 6.
Peak posterior GRF-landing. As assessed by boxplot inspection, there were two outliers
in the no brace condition and five outliers in the AE condition. The analysis was completed with
and without the outliers. These outliers did not influence the results; thus, they were included in
the analysis. The data were not normally distributed, as assessed by Shapiro-Wilk’s Test (p <
.05). As such, nonparametric and parametric testing was conducted to compare the effect of the

BIOMECHANICS OF ANKLE BRACING 88
independent variable (brace condition) on peak posterior GRF during the landing phase. The
Friedman’s test revealed no significant change in peak posterior GRF during the landing phase,
χ2(2) = 0.450, p = .799. A one-way ANOVA for repeated measures was also conducted. The
assumption of sphericity was not met, as assessed by Mauchly’s test of sphericity, χ2(2) =
14.618, p < .001. Therefore, a Greenhouse-Geisser correction was applied. As with the
Friedman’s test, there was no significant change in peak posterior GRF during the landing phase,
F(1.516, 59.120) = 0.623, p = .497. Descriptive statistics are presented in Table 6.
Peak anterior GRF-landing. As assessed by boxplot inspection, there was one outlier in
the no brace condition and one outlier in the AE condition. The analysis was completed with and
without the outliers. These outliers did not influence the results; thus, they were included in the
analysis. The data were normally distributed in the no brace and T1 conditions, as assessed by
Shapiro-Wilk’s Test (p > .05). The data were not normally distributed in the AE condition, as
assessed by Shapiro-Wilk’s Test (p < .05). As such, nonparametric and parametric testing was
conducted to compare the effect of the independent variable (brace condition) on peak anterior
GRF during the landing phase. The Friedman’s test revealed no significant change in peak
anterior GRF during the landing phase, χ2(2) = 0.450, p = .799. A one-way ANOVA for repeated
measures was also conducted. As with the Friedman’s test, there was no significant change in
peak anterior GRF during the landing phase, F(2, 78) = 0.040, p = .961. Descriptive statistics are
presented in Table 6.
Peak lateral GRF-landing. As assessed by boxplot inspection, there was one outlier in
the no brace condition, one outlier in the AE condition, and one outlier in the T1 condition. The
analysis was completed with and without the outliers. These outliers were found to influence the
results; thus, they were removed from the analysis due to type II error concerns. The data were
BIOMECHANICS OF ANKLE BRACING 89
normally distributed as assessed by Shapiro-Wilk’s Test (p > .05). As such, a one-way ANOVA
for repeated measures was conducted to compare the effect of the independent variable (brace
condition) on peak lateral GRF during the landing phase. There was a significant change in peak
lateral GRF during the landing phase, F(2, 74) = 5.746, p = .005, partial η2 = .134. Peak lateral
GRF decreased from 20.61 +/- 5.39 %BW when wearing no brace to 19.47 +/- 5.30 and 18.02
+/- 5.41 %BW when wearing the AE and T1 ankle braces, respectively. Bonferroni pairwise
comparisons analysis revealed a significant decrease in peak lateral GRF when wearing the T1
ankle brace compared to no brace (-2.59 (95% CI, -4.432 to -0.764) %BW, p = .003). There was
no significant difference in peak lateral GRF between no brace and AE conditions (-1.40 (95%
CI, -.3.20 to 0.304) %BW, p = .135), or AE and T1 conditions (-1.14 (95% CI, -3.314 to 1.108)
%BW, p > .05; see Figure 18).
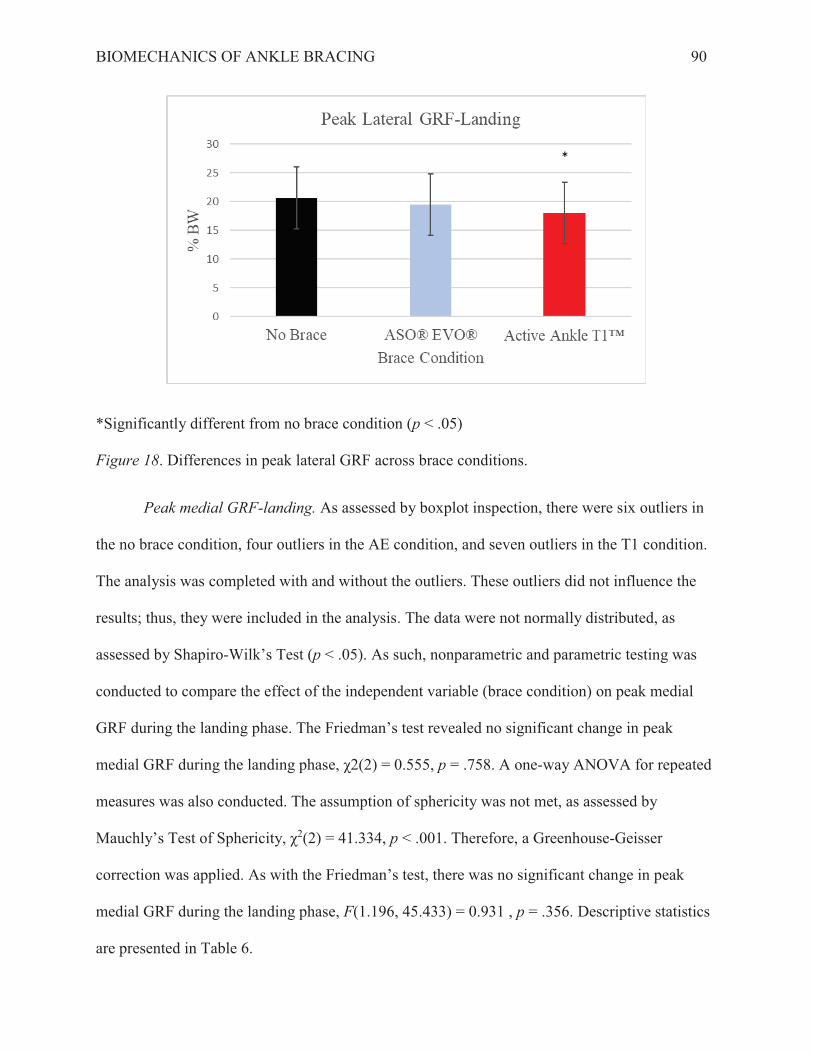
BIOMECHANICS OF ANKLE BRACING 91
Total vertical impulse-landing. As assessed by boxplot inspection, there were two
outliers in the AE condition. The analysis was completed with and without the outliers. These
outliers did not influence the results; thus, they were included in the analysis. The data were
normally distributed, as assessed by Shapiro-Wilk’s Test (p > .05). As such, a one-way ANOVA
for repeated measures was conducted to compare the effect of the independent variable (brace
condition) on total vertical impulse during the landing phase. There was no significant change in
total vertical impulse during the landing phase, F(2, 78) = 3.265, p = .043. Descriptive statistics
are presented in Table 6.
BIOMECHANICS OF ANKLE BRACING 92
Chapter Four: Lateral Cutting Task Results
Missing Data
Due to equipment malfunction (electrode failure, loss of electrode adherence, force
platform failure), usable data for each variable varies from n = 26 to n = 34. In cases where only
two out of three trials were considered usable due to equipment malfunction, the mean of the two
trials was used in place of a third trial when calculating the average of the three trials.
Deceleration
Reliability. Intraclass correlations for all dependent variables are presented in Table 7.

BIOMECHANICS OF ANKLE BRACING 93
Table 7. Intraclass correlations for cutting task performance and deceleration dependent variables across three trials.
Dependent Variable No Brace ASO® EVO®
Active Ankle T1™
PERFORMANCE Lateral Cutting Task Time (n = 39) .806 .967 .970 EMG PL Mean EMG (n = 33) .725 .650 .762 LG Mean EMG (n = 30) .413 .736 .508 BF Mean EMG (n = 30) .735 .584 .650 RF Mean EMG (n = 29) .431 .670 .508 GM Mean EMG (n = 26) .553 .786 .628
GROUND REACTION FORCE Peak Vertical GRF (Fz; n = 34) .796 .833 .798
Peak Posterior GRF (Fy; n = 34) .202 .643 .324 Peak Anterior GRF (Fy; n = 34) .890 .254 .824
Peak Lateral GRF (Fx; n = 34) .567 .697 .675 Peak Medial GRF (Fx; n = 34) .276 .482 .472
Total Vertical Impulse (n = 34) .769 .640 .772 Total Anteroposterior Impulse (n = 34) .341 .413 .436 Total Mediolateral Impulse (n = 34) .339 .445 .300
Descriptive statistics. Descriptive statistics for all dependant variables during the
deceleration phase of the cutting task are presented in Table 8.
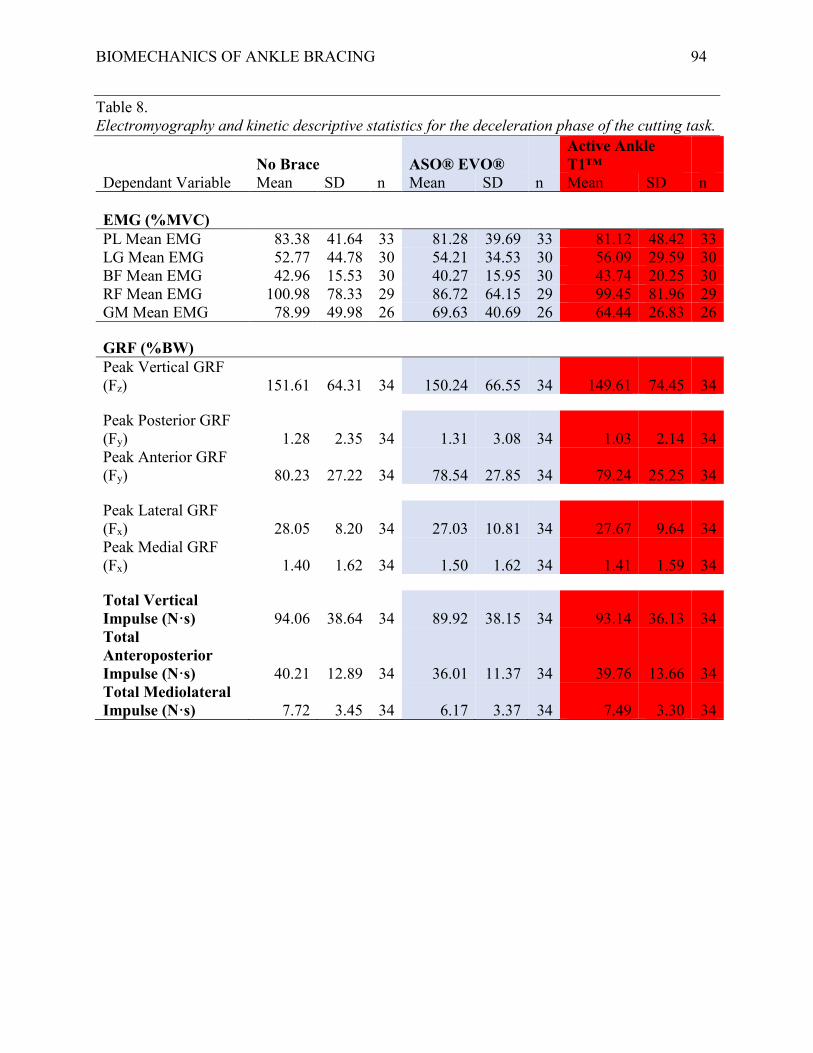
BIOMECHANICS OF ANKLE BRACING 94
Table 8. Electromyography and kinetic descriptive statistics for the deceleration phase of the cutting task.
No Brace ASO® EVO® Active Ankle T1™
Dependant Variable Mean SD n Mean SD n Mean SD n EMG (%MVC) PL Mean EMG 83.38 41.64 33 81.28 39.69 33 81.12 48.42 33 LG Mean EMG 52.77 44.78 30 54.21 34.53 30 56.09 29.59 30 BF Mean EMG 42.96 15.53 30 40.27 15.95 30 43.74 20.25 30 RF Mean EMG 100.98 78.33 29 86.72 64.15 29 99.45 81.96 29 GM Mean EMG 78.99 49.98 26 69.63 40.69 26 64.44 26.83 26
GRF (%BW) Peak Vertical GRF (Fz) 151.61 64.31 34 150.24 66.55 34 149.61 74.45 34
Peak Posterior GRF (Fy) 1.28 2.35 34 1.31 3.08 34 1.03 2.14 34 Peak Anterior GRF (Fy) 80.23 27.22 34 78.54 27.85 34 79.24 25.25 34
Peak Lateral GRF (Fx) 28.05 8.20 34 27.03 10.81 34 27.67 9.64 34 Peak Medial GRF (Fx) 1.40 1.62 34 1.50 1.62 34 1.41 1.59 34
Total Vertical Impulse (N·s) 94.06 38.64 34 89.92 38.15 34 93.14 36.13 34 Total Anteroposterior Impulse (N·s) 40.21 12.89 34 36.01 11.37 34 39.76 13.66 34 Total Mediolateral Impulse (N·s) 7.72 3.45 34 6.17 3.37 34 7.49 3.30 34

BIOMECHANICS OF ANKLE BRACING 95
Inferential statistics.
Question four: Is there a difference amongst ankle brace conditions in time to complete the
cutting task?
As assessed by boxplot inspection, there was one outlier in the no brace condition, one
outlier in the AE condition, and one outlier in the T1 condition. The analysis was completed with
and without the outliers. These outliers did not influence the results; thus, they were included in
the analysis. The data were normally distributed, as assessed by Shapiro-Wilk’s Test (p > .05).
As such, a one-way ANOVA for repeated measures was conducted to compare the effect of the
independent variable (brace condition) on lateral cutting task time. There was a significant
change in time to complete the lateral cutting task, F(2, 76) = 17.242, p < .001, ηp2 = .312. Mean
time to complete the cutting task increased from 6.17 +/- .71 sec when wearing no brace to 6.33
+/- .76 and 6.37 +/- 0.75 sec when wearing the AE and T1 ankle braces, respectively. Bonferroni
pairwise comparisons analysis revealed a significant increase in time to complete the cutting task
when wearing the AE ankle brace compared to no brace (0.16 (95% CI, .062 to .265) sec, p <
.001). Additionally, there was a significant increase in time to complete the cutting task when
wearing the T1 ankle brace compared to no brace (0.2(95% CI, .113 to .286) sec, p < .001).
There was no significant difference in time to complete the cutting task between AE and T1
ankle brace conditions (0.03 (95% CI, -.048 .to .120) sec, p > .05; see Figure 19).

BIOMECHANICS OF ANKLE BRACING 97
Friedman’s test, there was no significant change in PL mean EMG activity during the
deceleration phase, F(2, 64) = 0.227, p = .798. Descriptive statistics are presented in Table 8.
Lateral gastrocnemius mean EMG activity-deceleration. As assessed by boxplot
inspection, there were two outliers in the no brace condition and one outlier in the AE condition.
The outlier in the AE condition was removed from the analysis due to measurement error
concerns. The analysis was completed with and without the remaining outliers. These outliers
did not influence the results; thus, they were included in the analysis. The data were normally
distributed in the no brace and T1 conditions, as assessed by Shapiro-Wilk’s Test (p > .05). As
such, nonparametric and parametric testing was conducted to compare the effect of the
independent variable (brace condition) on LG mean EMG activity during the deceleration phase.
The Friedman’s test revealed no significant change in LG mean EMG activity during the
deceleration phase, χ2(2) = 4.867, p = .088. A one-way ANOVA for repeated measures was also
conducted. As with the Friedman’s test, there was no significant change in LG mean EMG
activity during the deceleration phase, F(2, 58) = 0.182, p = .834. Descriptive statistics are
presented in Table 8.
Biceps femoris mean EMG activity-deceleration. As assessed by boxplot inspection, there
was one outlier in the no brace condition and one outlier in the AE condition. The data were
normally distributed in the T1 condition, as assessed by Shapiro-Wilk’s Test (p > .05). The
analysis was completed with and without the outliers. These outliers did not influence the results;
thus, they were included in the analysis. The data were not normally distributed in the no brace
and AE conditions, as assessed by Shapiro-Wilk’s Test (p < .05). As such, nonparametric and
parametric testing was conducted to compare the effect of the independent variable (brace
condition) on BF mean EMG activity during the deceleration phase. The Friedman’s test
BIOMECHANICS OF ANKLE BRACING 98
revealed no significant change in BF mean EMG activity during the deceleration phase, χ2(2) =
2.40, p = .301. A one-way ANOVA for repeated measures was also conducted. As with the
Friedman’s test, there was no significant change in BF mean EMG activity during the
deceleration phase, F(2, 58) = 0.690, p = .505. Descriptive statistics are presented in Table 8.
Rectus femoris mean EMG activity-deceleration. As assessed by boxplot inspection, there
were four outliers in the no brace condition, one outlier in the AE condition, and four outliers in
the T1 condition. The analysis was completed with and without the outliers. These outliers did
not influence the results; thus, they were included in the analysis. The data were not normally
distributed, as assessed by Shapiro-Wilk’s Test (p < .05). As such, nonparametric and parametric
testing was conducted to compare the effect of the independent variable (brace condition) on RF
mean EMG activity during the deceleration phase. The Friedman’s test revealed no significant
change in RF mean EMG activity during the deceleration phase, χ2(2) = 0.276, p = .871. A one-
way ANOVA for repeated measures was also conducted. The assumption of sphericity was not
met, as assessed by Mauchly’s Test of Sphericity, χ2(2) = 13.645, p < .001. Therefore, a
Greenhouse-Geisser correction was applied. As with the Friedman’s test, there was no significant
change in RF mean EMG activity during the deceleration phase, F(1.271, 35.95) = 1.449, p
=.243. Descriptive statistics are presented in Table 8.
Gluteus medius mean EMG activity-deceleration. As assessed by boxplot inspection,
there were two outliers in the no brace condition, one outlier in the AE condition, and one outlier
in the T1 condition. The analysis was completed with and without the outliers. These outliers did
not influence the results; thus, they were included in the analysis. The data were normally
distributed in the T1 condition, as assessed by Shapiro-Wilk’s Test (p > .05). The data were not
normally distributed in the no brace and AE conditions, as assessed by Shapiro-Wilk’s Test (p <
BIOMECHANICS OF ANKLE BRACING 99
.05 As such, nonparametric and parametric testing was conducted to compare the effect of the
independent variable (brace condition) on GM mean EMG activity during the deceleration phase.
The Friedman’s test revealed no significant change in GM mean EMG activity during the
deceleration phase, χ2(2) = 3.308, p = .191. A one-way ANOVA for repeated measures was also
conducted. As with the Friedman’s test, there was no significant change in GM mean EMG
activity during the deceleration phase, F(2, 50) = 2.281, p =.113. Descriptive statistics are
presented in Table 8.
Peak vertical GRF-deceleration. As assessed by boxplot inspection, there were four
outliers in the no brace condition, three outliers in the AE condition, and four outliers in the T1
condition. The analysis was completed with and without the outliers. These outliers did not
influence the results; thus, they were included in the analysis. The data were not normally
distributed, as assessed by Shapiro-Wilk’s Test (p < .05). As such, nonparametric and parametric
testing was conducted to compare the effect of the independent variable (brace condition) on
peak vertical GRF during the deceleration phase. The Friedman’s test revealed no significant
change in peak vertical GRF during the deceleration phase, χ2(2) = 0.765, p = .682. A one-way
ANOVA for repeated measures was also conducted. As with the Friedman’s test, there was no
significant change in peak vertical GRF during the deceleration phase, F(2, 66) = 0.105, p =
.901. Descriptive statistics are presented in Table 8.
Peak posterior GRF-deceleration. As assessed by boxplot inspection, there were three
outliers in the no brace condition, three outliers in the AE condition, and one outlier in the T1
condition. The analysis was completed with and without the outliers. These outliers did not
influence the results; thus, they were included in the analysis. The data were not normally
distributed, as assessed by Shapiro-Wilk’s Test (p < .05 As such, nonparametric and parametric

BIOMECHANICS OF ANKLE BRACING 100
testing was conducted to compare the effect of the independent variable (brace condition) on
peak posterior GRF during the deceleration phase. The Friedman’s test revealed no significant
change in peak posterior GRF during the deceleration phase, χ2(2) = 0.235, p = .889. A one-way
ANOVA for repeated measures was also conducted. The assumption of sphericity was not met,
as assessed by Mauchly’s Test of Sphericity, χ2(2) = 9.436, p = .009. Therefore, a Greenhouse-
Geisser correction was applied. As with the Friedman’s test, there was no significant change in
peak posterior GRF during the deceleration phase, F(1.603, 52.574) = 0.331, p = .670.
Descriptive statistics are presented in Table 8.
Peak anterior GRF-deceleration. As assessed by boxplot inspection, there was one
outlier in the no brace condition. The analysis was completed with and without the outlier. This
outlier did not influence the results; thus, is was included in the analysis. The data were normally
distributed in the AE condition, as assessed by Shapiro-Wilk’s Test (p > .05). The data were not
normally distributed in the no brace and T1 conditions, as assessed by Shapiro-Wilk’s Test (p <
.05). As such, nonparametric and parametric testing was conducted to compare the effect of the
independent variable (brace condition) on peak anterior GRF during the deceleration phase. The
Friedman’s test revealed no significant change in peak anterior GRF during the deceleration
phase, χ2(2) = 2.882, p = .237. A one-way ANOVA for repeated measures was also conducted.
As with the Friedman’s test, there was no significant change in peak anterior GRF during the
deceleration phase, F(2, 66) = 0.385, p = .682. Descriptive statistics are presented in Table 8.
Peak lateral GRF-deceleration. As assessed by boxplot inspection, there were four
outliers in the no brace condition, two outliers in the AE condition, and two outliers in the T1
condition. The analysis was completed with and without the outliers. These outliers did not
influence the results; thus, they were included in the analysis. The data were not normally
BIOMECHANICS OF ANKLE BRACING 101
distributed, as assessed by Shapiro-Wilk’s Test (p < .05 As such, nonparametric and parametric
testing was conducted to compare the effect of the independent variable (brace condition) on
peak lateral GRF during the deceleration phase. The Friedman’s test revealed no significant
change in peak lateral GRF during the deceleration phase, χ2(2) = 0.412, p = .814. A one-way
ANOVA for repeated measures was also conducted. As with the Friedman’s test, there was no
significant change in peak lateral GRF during the deceleration phase, F(2, 66) = 0.354, p = .704.
Descriptive statistics are presented in Table 8.
Peak medial GRF-deceleration. As assessed by boxplot inspection, there were two
outliers in the no brace condition, one outlier in the AE condition, and one outlier in the T1
condition. The analysis was completed with and without the outliers. These outliers did not
influence the results; thus, they were included in the analysis. The data were not normally
distributed, as assessed by Shapiro-Wilk’s Test (p < .05 As such, nonparametric and parametric
testing was conducted to compare the effect of the independent variable (brace condition) on
peak medial GRF during the deceleration phase. The Friedman’s test revealed no significant
change in peak medial GRF during the deceleration phase, χ2(2) = 1.647, p = .439. A one-way
ANOVA for repeated measures was also conducted. As with the Friedman’s test, there was no
significant change in peak medial GRF during the deceleration phase, F(2, 66) = .069, p = .933.
Descriptive statistics are presented in Table 8.
Total vertical impulse-deceleration. As assessed by boxplot inspection, there were three
outliers in the no brace condition, one outlier in the AE condition, and one outlier in the T1
condition. The analysis was completed with and without the outliers. These outliers did not
influence the results; thus, they were included in the analysis. The data were not normally
distributed, as assessed by Shapiro-Wilk’s Test (p < .05). ). As such, nonparametric and

BIOMECHANICS OF ANKLE BRACING 102
parametric testing was conducted to compare the effect of the independent variable (brace
condition) on total vertical impulse during the deceleration phase. The Friedman’s test revealed
no significant change in total vertical impulse during the deceleration phase, χ2(2) = 2.176, p =
.337. A one-way ANOVA for repeated measures was also conducted. As with the Friedman’s
test, there was no significant change in total vertical impulse during the deceleration phase, F(2,
66) = 1.285, p = .283. Descriptive statistics are presented in Table 8.
Total anteroposterior impulse-deceleration. As assessed by boxplot inspection, there
was one outlier in the AE condition and one outlier in the T1 condition. The analysis was
completed with and without the outliers. These outliers did not influence the results; thus, they
were included in the analysis. The data were normally distributed in the no brace and T1
conditions, as assessed by Shapiro-Wilk’s Test (p > .05). The data were not normally distributed
in the AE condition, as assessed by Shapiro-Wilk’s Test (p < .05). As such, nonparametric and
parametric testing was conducted to compare the effect of the independent variable (brace
condition) on total anteroposterior impulse during the deceleration phase. The Friedman’s test
revealed no significant change in total anteroposterior impulse during the deceleration phase,
χ2(2) = 4.647, p = .098. A one-way ANOVA for repeated measures was also conducted. The
assumption of sphericity was not met, as assessed by Mauchly’s Test of Sphericity, χ2(2) =
7.491, p = .024. Therefore, a Greenhouse-Geisser correction was applied. As with the
Friedman’s test, there was no significant change in total anteroposterior impulse during the
deceleration phase, F(1.655, 54.604) = 4.161, p = .27. Descriptive statistics are presented in
Table 8.
Total mediolateral impulse-deceleration. As assessed by boxplot inspection, there was
one outlier in the no brace condition, one outlier in the AE condition, and five outliers in the T1

BIOMECHANICS OF ANKLE BRACING 103
condition. The analysis was completed with and without the outliers. These outliers did not
influence the results; thus, they were included in the analysis. The data were normally distributed
in the AE and T1 conditions, as assessed by Shapiro-Wilk’s Test (p > .05). The data were not
normally distributed in the no brace condition, as assessed by Shapiro-Wilk’s Test (p < .05). As
such, nonparametric and parametric testing was conducted to compare the effect of the
independent variable (brace condition) on total mediolateral impulse during the deceleration
phase. The Friedman’s test revealed no significant change in total mediolateral impulse during
the deceleration phase, χ2(2) = 5.706, p = .058. A one-way ANOVA for repeated measures was
also conducted. As with the Friedman’s test, there was no significant change in total mediolateral
impulse during the deceleration phase, F(2, 66) = 3.802, p = .027. Descriptive statistics are
presented in Table 8.
Propulsive
Reliability. Intraclass correlations for all dependent variables are presented in Table 9.
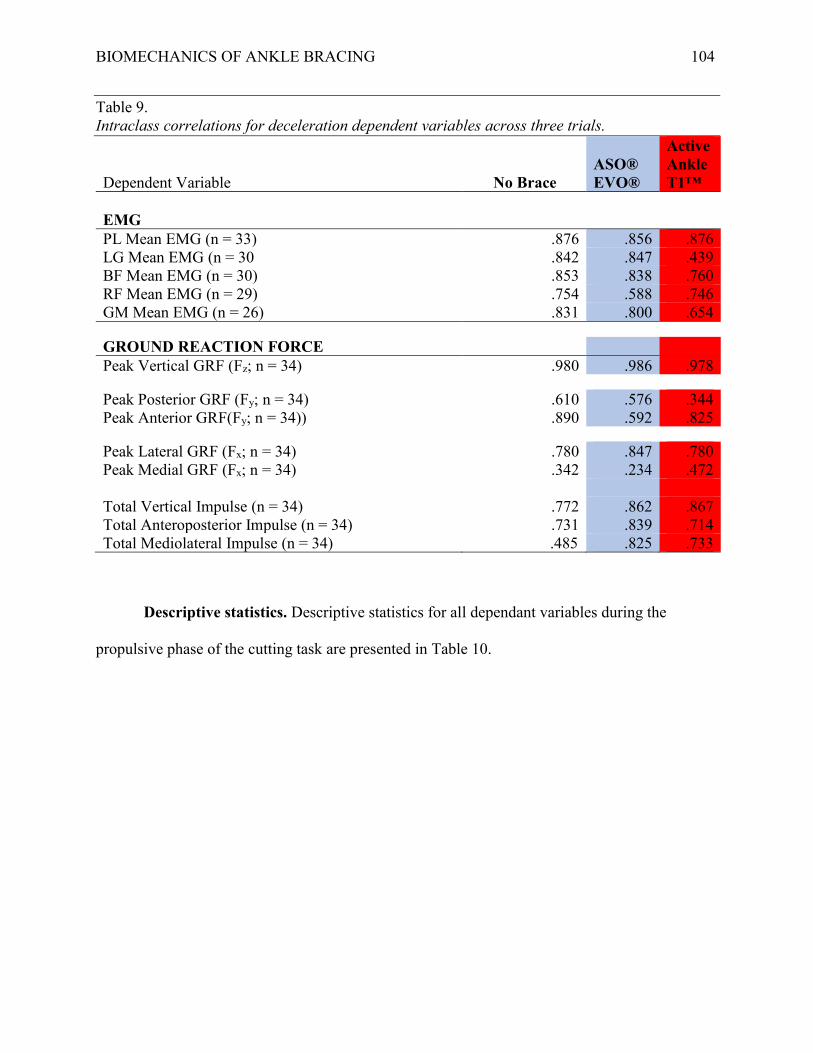
BIOMECHANICS OF ANKLE BRACING 104
Table 9. Intraclass correlations for deceleration dependent variables across three trials.
Dependent Variable No Brace ASO® EVO®
Active Ankle T1™
EMG PL Mean EMG (n = 33) .876 .856 .876 LG Mean EMG (n = 30 .842 .847 .439 BF Mean EMG (n = 30) .853 .838 .760 RF Mean EMG (n = 29) .754 .588 .746 GM Mean EMG (n = 26) .831 .800 .654
GROUND REACTION FORCE Peak Vertical GRF (Fz; n = 34) .980 .986 .978
Peak Posterior GRF (Fy; n = 34) .610 .576 .344 Peak Anterior GRF(Fy; n = 34)) .890 .592 .825
Peak Lateral GRF (Fx; n = 34) .780 .847 .780 Peak Medial GRF (Fx; n = 34) .342 .234 .472
Total Vertical Impulse (n = 34) .772 .862 .867 Total Anteroposterior Impulse (n = 34) .731 .839 .714 Total Mediolateral Impulse (n = 34) .485 .825 .733
Descriptive statistics. Descriptive statistics for all dependant variables during the
propulsive phase of the cutting task are presented in Table 10.
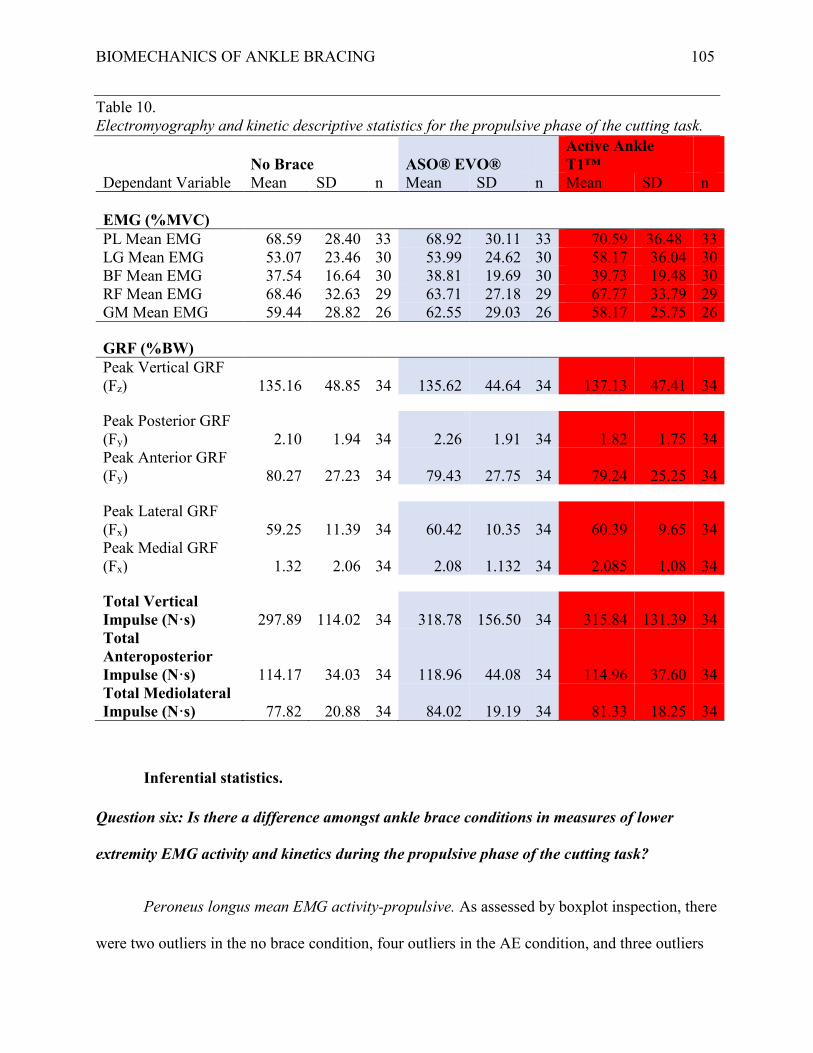
BIOMECHANICS OF ANKLE BRACING 105
Table 10. Electromyography and kinetic descriptive statistics for the propulsive phase of the cutting task.
No Brace ASO® EVO® Active Ankle T1™
Dependant Variable Mean SD n Mean SD n Mean SD n EMG (%MVC) PL Mean EMG 68.59 28.40 33 68.92 30.11 33 70.59 36.48 33 LG Mean EMG 53.07 23.46 30 53.99 24.62 30 58.17 36.04 30 BF Mean EMG 37.54 16.64 30 38.81 19.69 30 39.73 19.48 30 RF Mean EMG 68.46 32.63 29 63.71 27.18 29 67.77 33.79 29 GM Mean EMG 59.44 28.82 26 62.55 29.03 26 58.17 25.75 26
GRF (%BW) Peak Vertical GRF (Fz) 135.16 48.85 34 135.62 44.64 34 137.13 47.41 34
Peak Posterior GRF (Fy) 2.10 1.94 34 2.26 1.91 34 1.82 1.75 34 Peak Anterior GRF (Fy) 80.27 27.23 34 79.43 27.75 34 79.24 25.25 34
Peak Lateral GRF (Fx) 59.25 11.39 34 60.42 10.35 34 60.39 9.65 34 Peak Medial GRF (Fx) 1.32 2.06 34 2.08 1.132 34 2.085 1.08 34
Total Vertical Impulse (N·s) 297.89 114.02 34 318.78 156.50 34 315.84 131.39 34 Total Anteroposterior Impulse (N·s) 114.17 34.03 34 118.96 44.08 34 114.96 37.60 34 Total Mediolateral Impulse (N·s) 77.82 20.88 34 84.02 19.19 34 81.33 18.25 34
Inferential statistics.
Question six: Is there a difference amongst ankle brace conditions in measures of lower
extremity EMG activity and kinetics during the propulsive phase of the cutting task?
Peroneus longus mean EMG activity-propulsive. As assessed by boxplot inspection, there
were two outliers in the no brace condition, four outliers in the AE condition, and three outliers

BIOMECHANICS OF ANKLE BRACING 106
in the T1 condition. The analysis was completed with and without the outliers. These outliers did
not influence the results; thus, they were included in the analysis. The data were not normally
distributed, as assessed by Shapiro-Wilk’s Test (p < .05). As such, nonparametric and parametric
testing was conducted to compare the effect of the independent variable (brace condition) on PL
mean EMG activity during the propulsive phase. The Friedman’s test revealed no significant
change in PL mean EMG activity during the deceleration phase, χ2(2) = 1.267, p = .531. A one-
way ANOVA for repeated measures was also conducted. The assumption of sphericity was not
met, as assessed by Mauchly’s Test of Sphericity, χ2(2) = 7.787, p = .020. Therefore, a
Greenhouse-Geisser correction was applied. As with the Friedman’s test, there was no significant
change in PL mean EMG activity during the propulsive phase, F(1.637, 52.368) = 0.457, p =
.597. Descriptive statistics are presented in Table 10.
Lateral gastrocnemius mean EMG activity-propulsive. As assessed by boxplot
inspection, there was one outlier in the T1 condition. The analysis was completed with and
without the outlier. The outlier did not influence the results; thus, it was included in the analysis.
The data were normally distributed in the no brace and AE conditions, as assessed by Shapiro-
Wilk’s Test (p > .05). The data were not normally distributed in the T1 condition, as assessed by
Shapiro-Wilk’s Test (p < .05 As such, nonparametric and parametric testing was conducted to
compare the effect of the independent variable (brace condition) on LG mean EMG activity
during the propulsive phase. The Friedman’s test revealed no significant change in LG mean
EMG activity during the propulsive phase, χ2(2) = 1.40, p = .497. A one-way ANOVA for
repeated measures was also conducted. The assumption of sphericity was not met, as assessed by
Mauchly’s Test of Sphericity, χ2(2) = 27.365, p < .001. Therefore, a Greenhouse-Geisser
correction was applied. As with the Friedman’s test, there was no significant change in LG mean
BIOMECHANICS OF ANKLE BRACING 107
EMG activity during the propulsive phase, F(1.232, 35.724) = 1.088, p =.318. Descriptive
statistics are presented in Table 10.
Biceps femoris mean EMG activity-propulsive. As assessed by boxplot inspection, there
was one outlier in the no brace condition, two outliers in the AE condition, and one outlier in the
T1 condition. The analysis was completed with and without the outliers. These outliers did not
influence the results; thus, they were included in the analysis. The data were not normally
distributed, as assessed by Shapiro-Wilk’s Test (p < .05). As such, nonparametric and parametric
testing was conducted to compare the effect of the independent variable (brace condition) on BF
mean EMG activity during the propulsive phase. The Friedman’s test revealed no significant
change in LG mean EMG activity during the propulsive phase, χ2(2) = 0.467, p = .792. A one-
way ANOVA for repeated measures was also conducted. As with the Friedman’s test, there was
no significant change in BF mean EMG activity during the propulsive phase, F(2, 58) = 0.397, p
= .674. Descriptive statistics are presented in Table 10.
Rectus femoris mean EMG activity-propulsive. As assessed by boxplot inspection, there
was one outlier in the no brace condition and one outlier in the AE condition. Upon inspection of
the raw data, these outliers were removed due to measurement error concerns. The data were
normally distributed in the AE condition, as assessed by Shapiro-Wilk’s Test (p > .05). The data
were not normally distributed in the no brace and T1 conditions, as assessed by Shapiro-Wilk’s
Test (p < .05). As such, nonparametric and parametric testing was conducted to compare the
effect of the independent variable (brace condition) on RF mean EMG activity during the
propulsive phase. The Friedman’s test revealed no significant change in RF mean EMG activity
during the propulsive phase, χ2(2) = 0.483, p = .786. As with the Friedman’s test, there was no

BIOMECHANICS OF ANKLE BRACING 108
significant change in RF mean EMG activity during the propulsive phase, F(2, 56) = 1.027, p =
.365. Descriptive statistics are presented in Table 10.
Gluteus medius mean EMG activity-propulsive. As assessed by boxplot inspection, there
was one outlier in the no brace condition, one outlier in the AE condition, and one outlier in the
T1 condition. The analysis was completed with and without the outliers. These outliers did not
influence the results; thus, they were included in the analysis. The data were not normally
distributed, as assessed by Shapiro-Wilk’s Test (p < .05). As such, nonparametric and parametric
testing was conducted to compare the effect of the independent variable (brace condition) on GM
mean EMG activity during the propulsive phase. The Friedman’s test revealed no significant
change in GM mean EMG activity during the propulsive phase, χ2(2) = 2.769, p = .250. A one-
way ANOVA for repeated measures was also conducted. As with the Friedman’s test, there was
no significant change in GM mean EMG activity during the propulsive phase, F(2, 50) = 1.158,
p = .322. Descriptive statistics are presented in Table 10.
Peak vertical GRF-propulsive. As assessed by boxplot inspection, there were three
outliers in the no brace condition, four outliers in the AE condition, and two outliers in the T1
condition. The analysis was completed with and without the outliers. These outliers did not
influence the results; thus, they were included in the analysis. The data were not normally
distributed, as assessed by Shapiro-Wilk’s Test (p < .05). As such, nonparametric and parametric
testing was conducted to compare the effect of the independent variable (brace condition) on
peak vertical GRF during the propulsive phase. The Friedman’s test revealed no significant
change in peak vertical GRF during the propulsive phase, χ2(2) = 0.706, p = .703. A one-way
ANOVA for repeated measures was also conducted. As with the Friedman’s test, there was no

BIOMECHANICS OF ANKLE BRACING 109
significant change in peak vertical GRF during the propulsive phase, F(2, 66) = 0.821, p = .444.
Descriptive statistics are presented in Table 10.
Peak posterior GRF-propulsive. As assessed by boxplot inspection, there were two
outliers in the no brace condition and two outliers in the T1 condition. . The analysis was
completed with and without the outliers. These outliers did not influence the results; thus, they
were included in the analysis. The data were normally distributed, as assessed by Shapiro-Wilk’s
Test (p > .05). As such, a one-way ANOVA for repeated measures was conducted to compare
the effect of the independent variable (brace condition) on peak posterior GRF during the
propulsive phase. There was no significant change in peak posterior GRF during the propulsive
phase, F(2, 66) = 1.896, p = .158. Descriptive statistics are presented in Table 10.
Peak anterior GRF-propulsive. As assessed by boxplot inspection, there was one outlier
in the no brace condition. The analysis was completed with and without the outlier. This outlier
did not influence the results; thus, it was included in the analysis. The data were normally
distributed, as assessed by Shapiro-Wilk’s Test (p > .05). As such, a one-way ANOVA for
repeated measures was conducted to compare the effect of the independent variable (brace
condition) on peak anterior GRF during the propulsive phase. There was no significant change in
peak anterior GRF during the propulsive phase, F(2, 66) = .180 p = .835. Descriptive statistics
are presented in Table 10.
Peak lateral GRF-propulsive. As assessed by boxplot inspection, there were two outliers
in the no brace condition, three outliers in the AE condition, and three outliers in the T1
condition. The analysis was completed with and without the outliers. These outliers did not
influence the results; thus, they were included in the analysis. The data were normally
distributed, as assessed by Shapiro-Wilk’s Test (p > .05). As such, a one-way ANOVA for

BIOMECHANICS OF ANKLE BRACING 110
repeated measures was conducted to compare the effect of the independent variable (brace
condition) on peak lateral GRF during the propulsive phase. The assumption of sphericity was
not met, as assessed by Mauchly’s Test of Sphericity, χ2(2) = 7.962, p = .019. Therefore, a
Greenhouse-Geisser correction was applied. There was no significant change in peak lateral GRF
during the propulsive phase, F(1.639, 54.087) = .869, p = .406. Descriptive statistics are
presented in Table 10.
Peak medial GRF-propulsive. As assessed by boxplot inspection, there were four outliers
in the no brace condition, three outliers in the AE condition, and three outliers in the T1
condition. . The analysis was completed with and without the outliers. These outliers did not
influence the results; thus, they were included in the analysis. The data were normally distributed
in the T1 condition, as assessed by Shapiro-Wilk’s Test (p > .05). The data were not normally
distributed in the no brace and AE conditions, as assessed by Shapiro-Wilk’s Test (p < .05). As
such, nonparametric and parametric testing was conducted to compare the effect of the
independent variable (brace condition) on peak medial GRF during the propulsive phase. The
Friedman’s test revealed no significant change in peak medial GRF during the propulsive phase,
χ2(2) = 3.059, p = .217. A one-way ANOVA for repeated measures was also conducted. The
assumption of sphericity was not met, as assessed by Mauchly’s Test of Sphericity, χ2(2) =
35.299, p < .001. Therefore, a Greenhouse-Geisser correction was applied As with the
Friedman’s test, there was no significant change in peak medial GRF during the propulsive
phase, F(1.199, 39.565) = 2.898, p = .09. Descriptive statistics are presented in Table 10.
Total vertical impulse-propulsive. As assessed by boxplot inspection, there were three
outliers in the no brace condition, two outliers in the AE condition, and two outliers in the T1
condition. The analysis was completed with and without the outliers. These outliers did not
BIOMECHANICS OF ANKLE BRACING 111
influence the results; thus, they were included in the analysis. The data were not normally
distributed, as assessed by Shapiro-Wilk’s Test (p < .05). As such, nonparametric and parametric
testing was conducted to compare the effect of the independent variable (brace condition) on
total vertical impulse during the propulsive phase. The Friedman’s test revealed no significant
change in total vertical impulse during the propulsive phase, χ2(2) = 2.176, p = .337. A one-way
ANOVA for repeated measures was also conducted. As with the Friedman’s test, there was no
significant change in total vertical impulse during the propulsive phase, F(2, 66) = 2.615, p =
.081. Descriptive statistics are presented in Table 10.
Total anteroposterior impulse-propulsive. As assessed by boxplot inspection, there was
one outlier in the T1 condition. The analysis was completed with and without the outlier. This
outlier did not influence the results; thus, it was included in the analysis. The data were normally
distributed in the no brace and T1 condition, as assessed by Shapiro-Wilk’s Test (p > .05). The
data were not normally distributed in the AE and T1 conditions, as assessed by Shapiro-Wilk’s
Test (p < .05). As such, nonparametric and parametric testing was conducted to compare the
effect of the independent variable (brace condition) on total anteroposterior impulse during the
propulsive phase. The Friedman’s test revealed no significant change in total anteroposterior
impulse during the propulsive phase, χ2(2) = 1.588, p = .452. A one-way ANOVA for repeated
measures was also conducted. As with the Friedman’s test, there was no significant change in
total anteroposterior impulse during the propulsive phase, F(2, 66) = 1.023, p = .365. Descriptive
statistics are presented in Table 10.
Total mediolateral impulse-propulsive. As assessed by boxplot inspection, there was one
outlier in the no brace condition and one outlier in the AE condition. The analysis was completed
with and without the outliers. These outliers did not influence the results; thus, they were
BIOMECHANICS OF ANKLE BRACING 112
included in the analysis. The data were normally distributed in the no brace and T1 conditions, as
assessed by Shapiro-Wilk’s Test (p > .05). The data were not normally distributed in the AE
condition, as assessed by Shapiro-Wilk’s Test (p < .05). As such, nonparametric and parametric
testing was conducted to compare the effect of the independent variable (brace condition) on
total mediolateral impulse during the propulsive phase. The Friedman’s test revealed no
significant change in total mediolateral impulse during the propulsive phase, χ2(2) = 1.235, p =
.539. A one-way ANOVA for repeated measures was also conducted. The assumption of
sphericity was not met, as assessed by Mauchly’s Test of Sphericity, χ2(2) = 11.687, p = .003.
Therefore, a Greenhouse-Geisser correction was applied. As with the Friedman’s test, there was
no significant change in total mediolateral impulse during the propulsive phase, F(1.531, 50.537)
= 2.580, p = .099. Descriptive statistics are presented in Table 10.

BIOMECHANICS OF ANKLE BRACING 113
Chapter Five: Discussion
The purpose of the current study was to determine if wearing semi-rigid or softshell ankle
braces affects vertical jump height and time to complete a cutting task, as well as kinetics and
lower extremity EMG activity during these measures in healthy, active individuals with jumping
and running sport experience. Although previous literature examining the effects of ankle
bracing on athletic performance is conflicting, the results of the current study lend support to the
notion that ankle braces significantly decreases athletic performance. Additionally, while the
body of research examining the effects of ankle braces on EMG and kinetic variables during
athletic performance is limited, the results of the current study suggest that ankle bracing can
significantly affect these variables during vertical jumping. The following section will discuss
the results and implications of the current study in greater detail.
Takeoff and Flight Phase
Compared to wearing no ankle braces, there was a significant reduction of 2.1 cm and
2.13 cm in vertical jump height when wearing AE and T1 ankle braces, respectively. The
performance results of the Vertical Jump Test are in line with recent research by Henderson et al.
(2016), Smith et al. (2016), and Parsley et al. (2013). Henderson et al. did not observe a
significant change in vertical jump height when wearing AE ankle braces, although there was a
mean decrease of 1.47 cm when wearing the AE ankle braces. They did, however, observe a
significant decrease in vertical jump height of 2.35 cm when wearing the T1 ankle brace,
compared to the no brace condition. Smith et al. recorded a similar reduction in vertical jump
height of 2.33 cm, albeit when wearing McDavid 195T softshell ankle braces. Furthermore,
Parsley et al. observed a significant decrease in vertical jump height of 1.4 cm when wearing
both the AE ankle brace and Aircast Airsport™ semi-rigid ankle brace.
BIOMECHANICS OF ANKLE BRACING 114
As softshell ankle braces function to restrict motion in both the frontal and sagittal planes
(Gudibanda & Wang, 2005), the reduction in vertical jump height observed in the current study
when wearing softshell ankle braces, as well as others, is not unexpected. Although the
musculature producing movement at the ankle joint is not a large generator of power relative to
the musculature of the knee and hip (Prilutsky & Zatsiorsky, 1994), the ankle joint represents the
last major joint in a proximal to distal model of muscular activation and joint reversals during a
maximum vertical jump (Pandy & Zajac, 1991). As a biarticulated muscle performing both knee
flexion and ankle plantarflexion (Tortora & Nielson, 2010), the gastrocnemius muscle plays a
role in transferring mechanical energy from the hip and knee to the ankle during a vertical jump
(Prilutsky & Zatsiorsky, 1994). Considering ankle braces have been demonstrated to reduce
ankle ROM during dynamic jumping tasks (Cordova et al., 2010; DiStefano et al., 2008;
Hodgson et al., 2005; Simpson et al., 2003; Smith et al., 2016), theoretically this would reduce
the elongation and stretch of the gastrocnemius muscle during the eccentric portion of the
vertical jump, thereby reducing the length from which a concentric contraction of the
gastrocnemius muscle would be initiated. Based on the length-tension relationship, this would
reduce the amount of force that could be generated and transferred, as contribution of the parallel
and series elastic components to tension development is decreased via reduced elongation of the
gastrocnemius muscle (Hamill, Knutzen, & Derrick, 2015). In turn, vertical jump height would
be reduced.
With respect to the decrease in LG mean EMG activity observed when wearing the T1
ankle braces but not the AE ankle braces, two explanations are possible. Previous literature has
suggested that plantar-flexor EMG activity is reduced when wearing an ankle brace, due to an
ankle brace restricting ankle ROM (Smith et al., 2016). Therefore, it is possible that the T1 ankle
BIOMECHANICS OF ANKLE BRACING 115
brace restricts plantarflexion more than the AE ankle brace, resulting in decreased LG activation.
Alternatively, although not providing more plantarflexion restriction than the AE ankle brace, the
design of the T1 ankle brace, specifically the heel pad and hinge, may influence the EMG
activity of the LG muscle by altering sensory feedback. As studies have shown that softshell
ankle braces, such as the AE ankle brace, generally restrict motion in the sagittal plane more than
semi-rigid ankle braces during dynamic tasks (Cordova et al., 2010; Tamura et al., 2017), the
latter may be more likely; support for this rationale can be found in research examining the
effects of cutaneous and tactile stimulation on musculature of the of the foot during gait.
Many receptors, including Meissner’s corpuscles, Pacinian corpuscles, Merkel disk
receptors, and Ruffini endings are located on the plantar aspect of the foot, therefore, the heel
and sole represent a highly sensitive area to cutaneous and tactile stimulation (Zehr et al., 2014).
As such, the cutaneous receptors of the foot will detect changes in contact pressure (Magnusson,
Enbom, Johansson, & Pyykkö, 1990). In combination with feedback from mechanoreceptors and
nociceptors, this information serves to modulate reflexes that contribute to and are involved in
locomotion (Kennedy & Inglis, 2002). Previous research has noted that decreased tactile
stimulation of the heel facilitates medial gastrocnemius muscle activity during gait (Nurse &
Nigg, 2001). On the other hand, increased tactile stimulation during the stance phase of gait may
result in corrective postural changes, including facilitation of the TA muscle (Zehr et al., 2014),
which is responsible for dorsiflexion and inversion of the ankle (Tortora & Nielson, 2010). As
such, it is logical to suggest that the heel pad of the T1 ankle brace would alter cutaneous
feedback of the heel, and, if the TA muscle was facilitated, this would likely result in inhibition
of the antagonist muscle, the gastrocnemius (Tortora & Nielson, 2010). As TA EMG was not
measured in the current study, it is difficult to ascertain if this facilitation/inhibition interaction
BIOMECHANICS OF ANKLE BRACING 116
occurred; however, as LG mean EMG activity did decrease in the T1 ankle brace condition
during takeoff, relative to no brace, this rationale may provide some explanation as to why this
occurred.
While no significant change in LG mean EMG activity was observed in the current study
when wearing the AE softshell ankle braces during the takeoff phase of the Vertical Jump Test,
there was a slight decrease of 2.78 %MVC relative to the no brace condition. Additionally, there
was a tendency towards a decrease in PL mean EMG activity of 3.8 %MVC when wearing AE
ankle braces. Since PL is a synergistic muscle that assists with plantarflexion (Tortora &
Nielson, 2010), this would suggest and support the notion that the length of the muscle, and,
therefore, EMG activity, is being reduced as a result of softshell ankle braces restricting motion
in the sagittal plane (Smith et al., 2016). Smith et al. (2016) noted a similar trend in the
gastrocnemius muscle EMG activity when wearing softshell ankle braces as the current study.
They also noted a significant reduction in soleus muscle EMG activity, another synergistic
muscle to plantarflexion, during a vertical jump test when wearing softshell ankle braces. They
postulated that these reductions in plantar-flexor muscle activity and decreased ankle ROM
contributed to the reduction in vertical jump height when wearing the softshell ankle braces. As
Pandy and Zajac (1991) noted that the gastrocnemius muscle can be responsible for up to 25% of
vertical jump height, the overall reduction in plantar-flexor muscle activity concurrently with
vertical jump height would suggest a relationship. The exact mechanism behind the reduction in
vertical jump height, however, remains unclear when examining the kinetic data of the current
study. Although the reduction of plantar-flexor muscle activity and ROM should theoretically
reduce the amount of force transferred and generated at the ankle, the results of the current study
do not support this rationale. When wearing the AE softshell ankle braces, peak vertical GRF
BIOMECHANICS OF ANKLE BRACING 117
was not significantly affected during the takeoff phase of the Vertical Jump Test, nor was total
vertical impulse. Given the small decrease in plantar-flexor muscle activity observed in the
current study and similar vertical GRF across conditions, it is unlikely that this reduction
contributed to a reduction in overall vertical jump height.
The likelihood of a small reduction in plantarflexion ROM contributing to a reduction in
vertical jump height is further decreased when examining the effects of a semi-rigid ankle braces
on vertical jump height. Although studies are conflicting with respect to semi-rigid ankle braces
ability to restrict sagittal plane motion, semi-rigid ankle braces are designed to allow for
unrestricted movement in the sagittal plane (i.e., plantarflexion and dorsiflexion; Mackean et al.,
1995) relative to the AE ankle brace. As predictive models of vertical jump performance
predominantly involve sagittal plane kinematics and kinetics (Aragón-Vargas & Gross, 1997),
theoretically, semi-rigid ankle braces should not affect kinematic factors that would contribute to
a reduction in vertical jump height. In the current study, however, the T1 ankle braces reduced
vertical jump height more than the AE ankle braces relative to the no brace condition, although
theoretically allowing for greater plantarflexion and dorsiflexion ROM (Mackean et al., 1995).
This reduction in vertical jump height was also accompanied by a significant reduction in LG
mean EMG activity of 7.34% of MVC, which was not present in the AE condition. Again, peak
vertical and total vertical impulse were not affected during the takeoff phase of the Vertical Jump
Test, indicating that the decrease in vertical jump height was not the result of decreased force
production at the ankle.
Although no changes were observed in measures of vertical GRF, there was a significant
increase in peak lateral GRF during the takeoff phase of the Vertical Jump Test when wearing
both the AE and T1 ankle braces, compared to the no brace condition. This increase amounted to
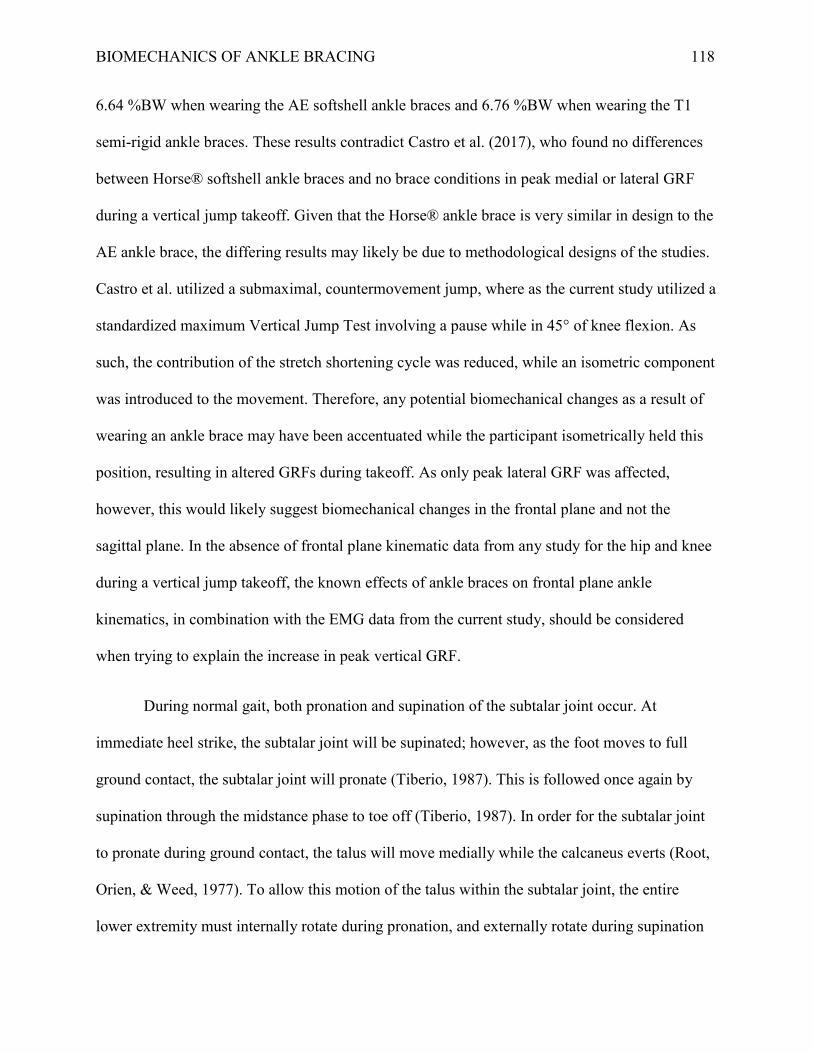
BIOMECHANICS OF ANKLE BRACING 118
6.64 %BW when wearing the AE softshell ankle braces and 6.76 %BW when wearing the T1
semi-rigid ankle braces. These results contradict Castro et al. (2017), who found no differences
between Horse® softshell ankle braces and no brace conditions in peak medial or lateral GRF
during a vertical jump takeoff. Given that the Horse® ankle brace is very similar in design to the
AE ankle brace, the differing results may likely be due to methodological designs of the studies.
Castro et al. utilized a submaximal, countermovement jump, where as the current study utilized a
standardized maximum Vertical Jump Test involving a pause while in 45° of knee flexion. As
such, the contribution of the stretch shortening cycle was reduced, while an isometric component
was introduced to the movement. Therefore, any potential biomechanical changes as a result of
wearing an ankle brace may have been accentuated while the participant isometrically held this
position, resulting in altered GRFs during takeoff. As only peak lateral GRF was affected,
however, this would likely suggest biomechanical changes in the frontal plane and not the
sagittal plane. In the absence of frontal plane kinematic data from any study for the hip and knee
during a vertical jump takeoff, the known effects of ankle braces on frontal plane ankle
kinematics, in combination with the EMG data from the current study, should be considered
when trying to explain the increase in peak vertical GRF.
During normal gait, both pronation and supination of the subtalar joint occur. At
immediate heel strike, the subtalar joint will be supinated; however, as the foot moves to full
ground contact, the subtalar joint will pronate (Tiberio, 1987). This is followed once again by
supination through the midstance phase to toe off (Tiberio, 1987). In order for the subtalar joint
to pronate during ground contact, the talus will move medially while the calcaneus everts (Root,
Orien, & Weed, 1977). To allow this motion of the talus within the subtalar joint, the entire
lower extremity must internally rotate during pronation, and externally rotate during supination
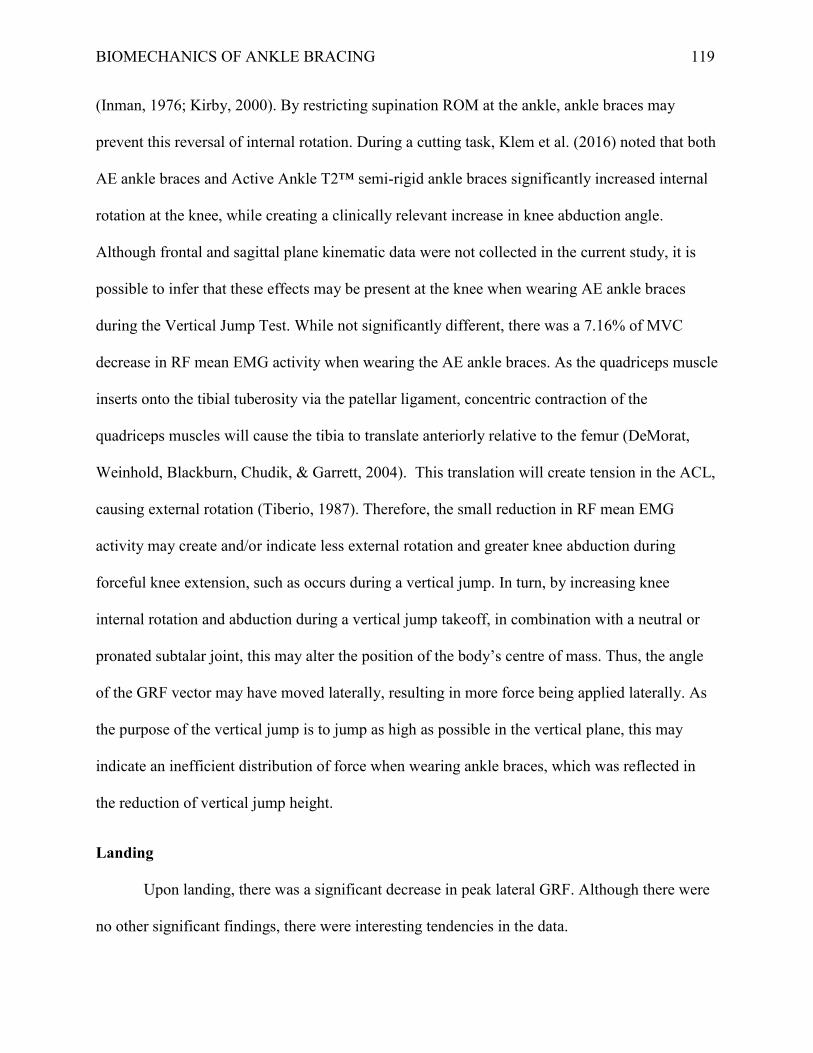
BIOMECHANICS OF ANKLE BRACING 119
(Inman, 1976; Kirby, 2000). By restricting supination ROM at the ankle, ankle braces may
prevent this reversal of internal rotation. During a cutting task, Klem et al. (2016) noted that both
AE ankle braces and Active Ankle T2™ semi-rigid ankle braces significantly increased internal
rotation at the knee, while creating a clinically relevant increase in knee abduction angle.
Although frontal and sagittal plane kinematic data were not collected in the current study, it is
possible to infer that these effects may be present at the knee when wearing AE ankle braces
during the Vertical Jump Test. While not significantly different, there was a 7.16% of MVC
decrease in RF mean EMG activity when wearing the AE ankle braces. As the quadriceps muscle
inserts onto the tibial tuberosity via the patellar ligament, concentric contraction of the
quadriceps muscles will cause the tibia to translate anteriorly relative to the femur (DeMorat,
Weinhold, Blackburn, Chudik, & Garrett, 2004). This translation will create tension in the ACL,
causing external rotation (Tiberio, 1987). Therefore, the small reduction in RF mean EMG
activity may create and/or indicate less external rotation and greater knee abduction during
forceful knee extension, such as occurs during a vertical jump. In turn, by increasing knee
internal rotation and abduction during a vertical jump takeoff, in combination with a neutral or
pronated subtalar joint, this may alter the position of the body’s centre of mass. Thus, the angle
of the GRF vector may have moved laterally, resulting in more force being applied laterally. As
the purpose of the vertical jump is to jump as high as possible in the vertical plane, this may
indicate an inefficient distribution of force when wearing ankle braces, which was reflected in
the reduction of vertical jump height.
Landing
Upon landing, there was a significant decrease in peak lateral GRF. Although there were
no other significant findings, there were interesting tendencies in the data.
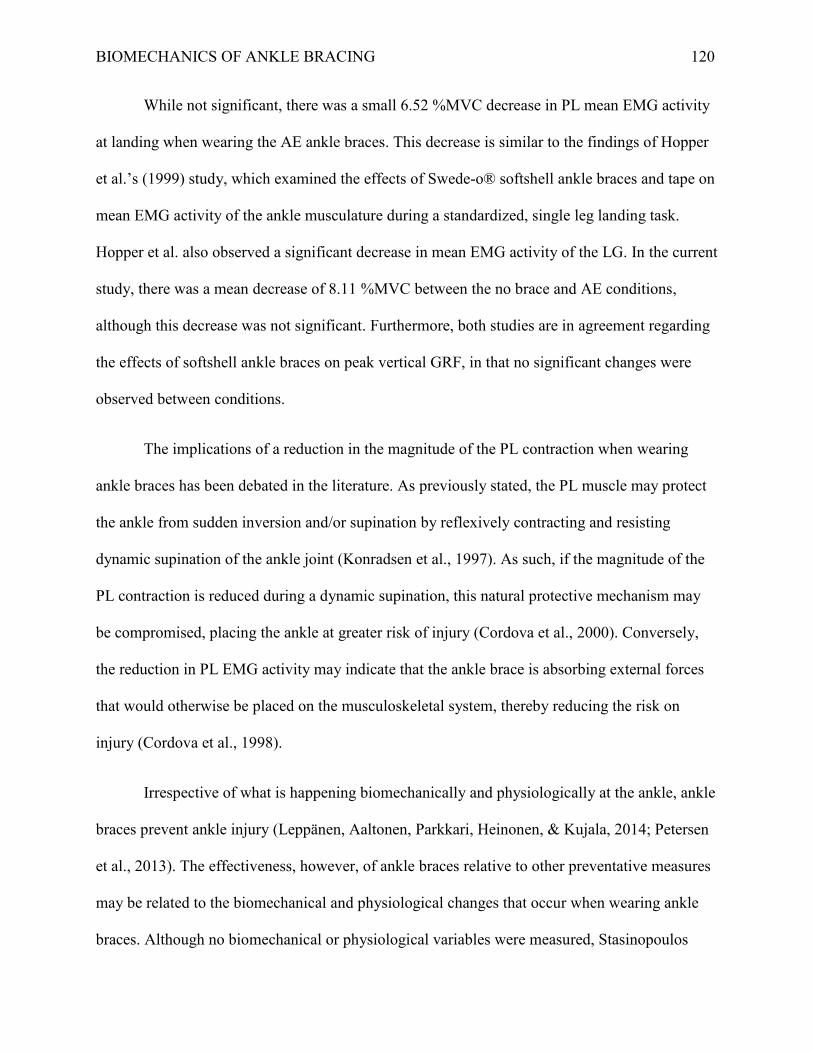
BIOMECHANICS OF ANKLE BRACING 120
While not significant, there was a small 6.52 %MVC decrease in PL mean EMG activity
at landing when wearing the AE ankle braces. This decrease is similar to the findings of Hopper
et al.’s (1999) study, which examined the effects of Swede-o® softshell ankle braces and tape on
mean EMG activity of the ankle musculature during a standardized, single leg landing task.
Hopper et al. also observed a significant decrease in mean EMG activity of the LG. In the current
study, there was a mean decrease of 8.11 %MVC between the no brace and AE conditions,
although this decrease was not significant. Furthermore, both studies are in agreement regarding
the effects of softshell ankle braces on peak vertical GRF, in that no significant changes were
observed between conditions.
The implications of a reduction in the magnitude of the PL contraction when wearing
ankle braces has been debated in the literature. As previously stated, the PL muscle may protect
the ankle from sudden inversion and/or supination by reflexively contracting and resisting
dynamic supination of the ankle joint (Konradsen et al., 1997). As such, if the magnitude of the
PL contraction is reduced during a dynamic supination, this natural protective mechanism may
be compromised, placing the ankle at greater risk of injury (Cordova et al., 2000). Conversely,
the reduction in PL EMG activity may indicate that the ankle brace is absorbing external forces
that would otherwise be placed on the musculoskeletal system, thereby reducing the risk on
injury (Cordova et al., 1998).
Irrespective of what is happening biomechanically and physiologically at the ankle, ankle
braces prevent ankle injury (Leppänen, Aaltonen, Parkkari, Heinonen, & Kujala, 2014; Petersen
et al., 2013). The effectiveness, however, of ankle braces relative to other preventative measures
may be related to the biomechanical and physiological changes that occur when wearing ankle
braces. Although no biomechanical or physiological variables were measured, Stasinopoulos

BIOMECHANICS OF ANKLE BRACING 121
(2004) found that jump takeoff and landing technique training, as well as proprioceptive training,
was more effective in preventing ankle injuries than semi-rigid ankle braces. Furthermore, the
Active Ankle T2™ semi-rigid ankle braces proved ineffective in reducing ankle sprains in
persons who had incurred more than three ankle sprains, while technique training and
proprioceptive training remained effective (Stasinopoulos, 2004). As persons with CAI have
been shown to experience decreased activation of the ankle musculature and stabilizers (Santilli
et al., 2005), the fact that an active exercise and training program was effective in preventing
ankle injuries in this population, while ankle braces were not, supports factors such as the
magnitude of the PL contraction at least contributing to ankle sprain prevention. Given that a
decrease in PL mean EMG activity was observed in the current study during a maximal vertical
jump landing, this may indicate that ankle braces, although effective, should be combined with
other prevention strategies.
Many competitive sports teams have policies that require players to wear ankle braces
irrespective of their level of ankle function (Pedowitz et al., 2008). When considered with the
fact that up to 86% of ankle sprains in volleyball occur when landing from a jump (Bahr et al.,
1994), the implications of a reduction in PL mean EMG activity become even more relevant,
especially when examining the effects that T1 ankle braces have on vertical GRF in the current
study, as well as others. Although Cordova et al. (1998) hypothesized that a reduction in PL
EMG activity could indicate that ankle braces were absorbing external forces, peak vertical GRF
remained unchanged in the current study when wearing AE or T1 ankle braces. Furthermore,
Cordova et al. (2000) observed no change in peak vertical GRF when wearing the McDavid
Ultra semi-rigid ankle braces during a standardized drop landing. Hopper et al. (1999) observed
no change in peak vertical GRF, alongside a significant reduction in PL EMG activity when
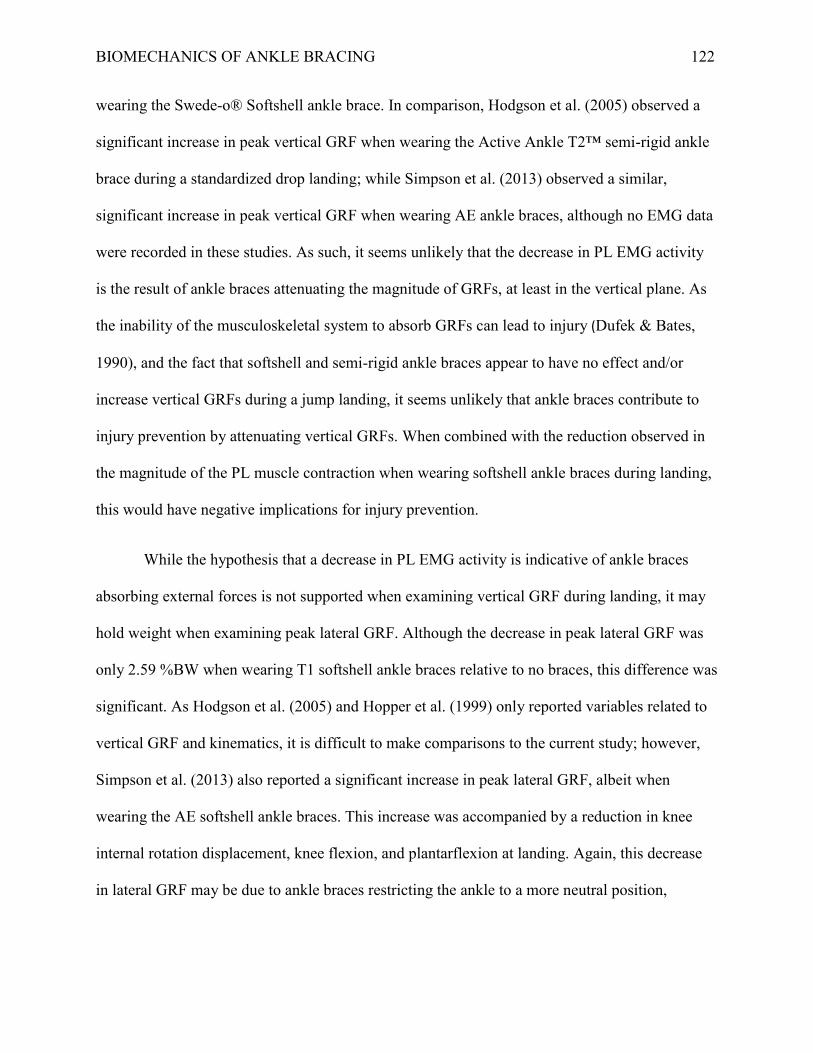
BIOMECHANICS OF ANKLE BRACING 122
wearing the Swede-o® Softshell ankle brace. In comparison, Hodgson et al. (2005) observed a
significant increase in peak vertical GRF when wearing the Active Ankle T2™ semi-rigid ankle
brace during a standardized drop landing; while Simpson et al. (2013) observed a similar,
significant increase in peak vertical GRF when wearing AE ankle braces, although no EMG data
were recorded in these studies. As such, it seems unlikely that the decrease in PL EMG activity
is the result of ankle braces attenuating the magnitude of GRFs, at least in the vertical plane. As
the inability of the musculoskeletal system to absorb GRFs can lead to injury (Dufek & Bates,
1990), and the fact that softshell and semi-rigid ankle braces appear to have no effect and/or
increase vertical GRFs during a jump landing, it seems unlikely that ankle braces contribute to
injury prevention by attenuating vertical GRFs. When combined with the reduction observed in
the magnitude of the PL muscle contraction when wearing softshell ankle braces during landing,
this would have negative implications for injury prevention.
While the hypothesis that a decrease in PL EMG activity is indicative of ankle braces
absorbing external forces is not supported when examining vertical GRF during landing, it may
hold weight when examining peak lateral GRF. Although the decrease in peak lateral GRF was
only 2.59 %BW when wearing T1 softshell ankle braces relative to no braces, this difference was
significant. As Hodgson et al. (2005) and Hopper et al. (1999) only reported variables related to
vertical GRF and kinematics, it is difficult to make comparisons to the current study; however,
Simpson et al. (2013) also reported a significant increase in peak lateral GRF, albeit when
wearing the AE softshell ankle braces. This increase was accompanied by a reduction in knee
internal rotation displacement, knee flexion, and plantarflexion at landing. Again, this decrease
in lateral GRF may be due to ankle braces restricting the ankle to a more neutral position,

BIOMECHANICS OF ANKLE BRACING 123
altering the position of the body’s centre of mass and the angle at which the GRF vector is
applied, as well as the joint kinematics proximal to the ankle.
Although not significant, compared to the no brace condition, total vertical impulse was
6.85 N·s and 6.34 N·s less when wearing the AE and T1 ankle braces, respectively. Since total
vertical impulse was not measured in previous studies examining the effect of ankle braces on
GRFs during landing, it is difficult to compare the nonsignificant decrease in total vertical
impulse observed in the current study when wearing ankle braces. Previous studies, however,
have examined the time to peak vertical GRF along with ankle kinematics during landing. As
impulse is the integral of force and time (Hamill et al., 2015) combined with kinematic data from
other studies, inferences could be made to explain why there was a reduction in total vertical
impulse when wearing the T1 ankles braces compared to no braces.
As peak vertical GRF did not increase significantly across brace conditions, the decrease
in total vertical impulse could be the result of ankle braces decreasing the average force applied
during landing. Alternatively, it may also be the result of ankle braces altering the time over
which force is applied. When landing from a vertical jump with two feet, the force-time curve
will generally have two peaks; peak one is created from the metatarsal heads impacting the
ground after toe contact, and peak two represents contact of the calcaneus with the ground
(Abián, Alegre, Lara, Rubio, & Aguado, 2008). As such, landing will normally occur in a “toe to
heel” fashion (Bressel & Cronin, 2013). Based on this style of landing, the degree to which the
ankle is plantarflexed during toe contact will affect the time to which the second peak is
observed; less plantarflexion would create less distance between the heel and the ground when
the toe makes contact, therefore, decreasing the time to heel contact after toe contact.
Conversely, a larger plantarflexion angle at landing would increase this distance and
BIOMECHANICS OF ANKLE BRACING 124
simultaneously increase the time to heel contact after toe contact (Riemann et al., 2002). As both
softshell and semi-rigid ankle braces have been shown to reduce plantarflexion angle and
displacement at landing (Cordova et al., 2010; DiStefano et al., 2008; Hodgson et al., 2005;
Simpson et al., 2003), and simultaneously decrease the time to peak vertical GRF variables
(Cordova et al., 2010; Hodgson et al., 2005; Simpson et al., 2013), it is logical to suggest that the
same thing occurred in the current study. As time to peak vertical GRF was not reported for the
current study, however, this rationale is speculative. Additionally, because mean GRF was not
reported, it is unknown if the average force applied may also have been affected.
An explanation as to why the T1 ankle brace resulted in a decrease in total vertical
impulse, while the AE ankle brace did not, may again be found in the design of the T1 ankle
brace. As previously discussed, altered cutaneous input as the result of the heel pad of the T1
ankle brace may facilitate the TA muscle, which would promote dorsiflexion, thereby reducing
the degree to which the foot was plantarflexed at landing. Therefore, this would have reduced the
time to reach peak vertical GRF, contributing to the reduction in total vertical impulse.
As with the decrease observed in PL mean EMG activity during landing when wearing
the AE ankle braces, a reduction in total vertical impulse may be interpreted as having a positive,
as well as negative effect on injury (Simpson et al., 2013). Negative, in that excessive vertical
GRF loading has been suggested to lead to overuse injuries of the lower extremity (Dixon,
Collop, & Batt, 2000; Dufek & Bates, 1990; Seegmiller & McCaw, 2003; Yeow, Ng, Lee, &
Gow, 2010). Positive, in that larger vertical GRF values and the speed at which vertical GRF is
applied is essential for promoting bone growth and strengthening the skeletal system (Nigg,
2001). Therefore, longitudinal studies are required to determine the potential effects of softshell
BIOMECHANICS OF ANKLE BRACING 125
and semi-rigid ankle braces on joint and bone health across the lifespan and at different ages of
skeletal maturity (Simpson et al., 2013).
In addition to the potential effect on overuse injuries, the implications of the current study
should also be examined within the context of acute knee injuries. The majority of ACL injuries
involve a non-contact mechanism, such as landing from a jump or pivoting (Boden, Dean,
Feagin, & Garret, 2000; Olsen et al., 2004). When ACL injuries occur during landing, the knee is
often in, or close to a fully extended position (Boden et al., 2000). The contraction of the
quadriceps muscle associated with greater knee extension angles has been implicated in ACL
injuries, in that the quadricep muscles will translate the tibia anteriorly relative to the femur,
placing strain on the ACL (Boden et al., 2000; DeMorat, Weinhold, Blackburn, Chudik &
Garret, 2004; Draganich & Vahey, 1990). Although nonsignificant, there was a large decrease in
RF mean EMG of 13.21 %MVC and 12.31 %MVC when wearing the AE and T1 ankle braces,
respectively. DiStefano et al. (2008) found that knee flexion angle increased by 3° at landing
when wearing the AE softshell ankle braces, hypothesizing that this increase in knee flexion was
a compensatory strategy for the reduction in ankle dorsiflexion. As such, the non-significant
decrease in RF mean EMG activity observed across conditions during landing could be
indicative of a reduction in knee flexion angle at landing, resulting in decreased strain being
placed on the ACL when wearing ankle braces.
Cutting Task
Compared to wearing no ankle brace, there was a significant increase in time to complete
the cutting task when wearing ankle braces. This amounted to times that were 0.16 seconds and
0.20 seconds slower when wearing the AE and T1 ankle braces, respectively. As the cutting task
was developed specifically for the current study and primarily to elicit a quick change in
BIOMECHANICS OF ANKLE BRACING 126
direction, it is difficult to compare the performance results of the cutting task to previous
literature, although EMG characteristics of the task were similar to Colby et al. (2000) and
Houck (2003). Therefore, for the purposes of the discussion, comparison will be made to studies
utilizing tests that have been validated as measures of agility. Additionally, as a kinematic
analysis of wearing ankle braces during an agility test is not present in the literature, comparison
will be made to studies examining the kinematics of cutting tasks.
This reduction in performance on a cutting task is comparable to the research of
Ambegaonkar et al. (2011), who observed a significant increase in time to complete the Right-
Boomerang Run Test when wearing the Aircast Airstirrup™ semi-rigid ankle braces. The results,
however, contradict the majority of research that suggests softshell and semi-rigid ankle braces
do not affect agility performance. Henderson et al. (2016), Leonard and Rotay (2014),
Macpherson et al. (1995), Parsley et al. (2013) all concluded that, in individuals with healthy
ankles, softshell and semi-rigid ankle bracing did not affect agility performance. Additionally, all
of the studies mentioned came to this conclusion using different tests of agility, indicating that
any change in agility performance may be dependent upon the type of test and type of ankle
brace used.
Ambegaonkar et al. (2011) hypothesized that the increased time to complete the Right-
Boomerang Run Test when wearing ankle braces was due to a restriction in ROM at the ankle;
participants were not able to change directions as quickly due to the ankle braces limiting the
mobility of the ankle. Based on the results of the current study, however, this explanation is
unlikely. During the deceleration and propulsive phases of the cutting task, peak anterior and
posterior GRF, and peak medial and lateral GRF were not affected when wearing ankle braces.
Additionally, impulse measures were not significantly affected during the deceleration and

BIOMECHANICS OF ANKLE BRACING 127
propulsive phases of the cutting task, indicating that force and time in contact with the force
platform remained relatively stable across conditions. Given that the time to complete the cutting
task was slower in the AE and T1 conditions, despite no change in GRF variables, ankle braces
may be affecting other components of the task. Previous literature examining the effects of ankle
braces on kinematics during cutting tasks has focused largely on the change in direction
component of the task used (Klem et al., 2016; Greene et al., 2014; West et al., 2013). As agility
tests normally involve multiplanar movement, including movement in the sagittal plane,
consideration should be given to the effect that ankle braces may have on running in the sagittal
plane.
As previously stated, the foot alternates between a pronated and supinated position during
gait (Tiberio, 1987), which is anatomically possible due to internal and external rotation of the
lower extremity (Inman, 1976; Kirby, 2000). Therefore, a restriction in pronation and supination
could result in kinematic changes proximal to the ankle during gait. Although Tamura et al.
(2017) did not find any changes in sagittal plane kinematics at the knee or hip during treadmill
running when wearing softshell or semi-rigid ankle braces, there was a significant increase in the
knee abduction angle at initial foot contact when wearing AE ankle braces and Active Ankle
T2™ semi-rigid ankle braces, relative to wearing no braces. This was accompanied by a
significant increase in total energy expenditure when wearing the Active Ankle T2™ ankle
braces, which had previously been reported by Mackean et al. (1995) when wearing Aircast
Airstirrup™ semi-rigid ankle braces. As such, a restriction of frontal plane ROM at the ankle
may result in greater displacement of the hip in the frontal plane, creating a less efficient gait
pattern when wearing ankle braces. As such, this may have resulted in a slower time to complete
the cutting task when wearing ankle braces. Further research is needed, however, to determine

BIOMECHANICS OF ANKLE BRACING 128
the effects of ankle bracing on running and sprinting kinematics, especially the role that fatigue
and/or sporting conditions may have on any potential effects.
An important consideration regarding the results of the current study, as well as injury
risk, is the relatively large between trial variability of the jump landing and cutting task variables
across conditions. Previous literature has identified high trial-to-trial variability for kinematic
and EMG variables during jump landings (Fagenbaum & Darling, 2003). Given the heterogenous
nature of the population (experienced and non-experienced ankle brace users, multiple types and
levels of sport), in addition to an uncontrolled landing height, this variability was to be expected
in the current study. This variability, however, may suggest less than optimal landing mechanics
and neuromuscular control during jump landings in the study population. Stasinopoulos (2004)
suggested that, even in elite level sport, takeoff and landing technique may be sub-par, given the
significant decrease in ankle sprains experienced by participants who took part in a technical
jump training program. Additionally, Pienkowski et al. (1995) noted that improvements in
athletic performance occurred after participants completed a one week adaptation period to
softshell and semi-rigid ankle braces. Therefore, based on this information, inexperienced ankle
brace users may want to consider an “adjustment period,” and/or jump training program, to offset
potential changes to lower extremity biomechanics and performance that were observed in the
current study when wearing ankle braces.
Limitations
With respect to the interpretation and generalizability of the results of the current study,
some limitations must be taken into consideration. As this was an exploratory study, the analysis
did not control for independent variables such as sex, ankle bracing experience, or sport, which
could influence the dependent variables collected in the current study. Additionally, a univariate
BIOMECHANICS OF ANKLE BRACING 129
analysis was selected over a multivariate analyses, potentially increasing the chance of a type I
error.
In terms of the procedures, although the Vertical Jump Test was based on an established
protocol, due to the incorporation of a pause, the external validity of the test may be called into
question. In an athletic situation, such as basketball or volleyball, a jump would normally
incorporate a counterbalance movement to take advantage of the stretch shortening cycle (Hamill
et al., 2015), which the Vertical Jump Test removed. Additionally, by constricting the landing to
one foot off-one foot on the force platform, this introduced a constraint that would not be present
in a real world situation, potentially resulting in the participant adjusting their jump form and
impacting on the overall jump height accordingly. This constraint was also present during the
lateral cutting task, which required participants to approach the force platform before planting
the dominant foot on the force platform. Again, participants may have altered their form, speed,
and technique accordingly to remain within the constraints of the task. Furthermore, the results
of the current study are only representative of the participant’s dominant extremity, again due to
participants only contacting the platform with the dominant foot, as well as only having
electrodes on the dominant lower extremity.
As the three trials for each condition were averaged for each variable, the high variability
between trials for EMG and kinetic variables during the landing phase and cutting task may have
attenuated extreme values, improving the validity of each value. The Vertical Jump Test and
cutting task emphasized performance and were very reliable in terms of measuring vertical jump
height and time to complete the cutting task. Form for the vertical jump was standardized for the
takeoff phase, likely resulting in the high trial to trial reliability for all measures during the
takeoff phase. Due to this emphasis on performance, however, variables such as fatigue,

BIOMECHANICS OF ANKLE BRACING 130
individual landing technique, and participants’ proficiency with the movements may have
contributed to the variability in EMG and kinetic measures from trial to trial during the landing
phase and cutting task. Furthermore, as variables such as height and speed were not controlled,
any fluctuation in these variables would likely have influenced EMG and kinetic measures.
Delimitations
Delimitations of the study must also be taken into consideration. Rather than using a
homogeneous, one sport population, a heterogenous population incorporating a wide variety of
sports, as well as ankle bracing experience was selected. This was done in an effort to maximize
sample size. As such, the results of the current study may not be entirely representative of a
single sport or athletic population, but may have implications in a broader sport context.
Although analyzing the maximum or median value of the three trials would have limited the
influence of high trial to trial variability on the results, the mean value of each variable was used
in the interest of external validity, as over the course of a game or practice, athletes may make
movements, such as a jump or cut many times (Bompa & Haff, 2009), potentially resulting in
fatigue and decreased performance.
For the analysis, a univariate analysis was selected over a multivariate analysis due to the
research questions, exploratory nature of the study, and lack of comparable studies or models.
This also allowed data for some variables to remain in the analysis, despite their being missing
data for other variables. Furthermore, running a MANOVA prior to an ANOVA does not
necessarily control for type 1 error, due to the alpha level of the ANOVA only being less than or
equal to the alpha level for the MANOVA when the MANOVA’s null hypothesis is accepted
(Bird & Hadzi-Pavlovic, 1983). Rather, a Bonferroni adjustment was used to control for type 1
error.
BIOMECHANICS OF ANKLE BRACING 131
Future Research
As the current study was the first to incorporate EMG of proximal lower extremity
musculature when assessing the effects of ankle braces during athletic performance measures,
more research is needed to support the results of the current study. Further research should
incorporate kinematic analysis to improve the interpretation of the EMG and kinetic data.
Additionally, future research should consider using a homogenous athletic population, as well as
a pathological population, such as CAI, as ankle brace use is not limited to healthy individuals.
Although not directly analyzed as part of the current study, sex differences in muscular
activation during landing should also be addressed. Female athletes are 1.7 times more likely to
sustain an ACL injury than male athletes (Montalvo et al., 2018). Many reasons for this
difference have been suggested, including an overreliance on the quadriceps muscles by females
to stabilize the knee joint (Hewett, Ford, Hoogenbook, & Myer, 2010; Hewett, Stroupe, Nance,
& Noyes, 1996). As such, females also display lower hamstring activation relative to males when
landing from a jump (Urabe et al., 1999). Descriptively, females displayed similar RF mean
EMG activity to male counter parts in the no brace control condition during landing, but greater
RF mean EMG activity in the AE condition. Additionally, although males displayed much higher
BF mean EMG activity in the no brace control and T1 conditions during landing, the BF mean
EMG activity was almost identical in the T1 condition. Given the differences in injury rates
between males and females when wearing ankle braces (Frey et al. 2010), further research should
consider the role that sex may have on ankle bracing’s effects on lower extremity biomechanics.
Chapter Six: Conclusion
The purpose of the current study was to determine if wearing semi-rigid and softshell
ankle braces affects vertical jump height and time to complete a lateral cutting task, as well as
BIOMECHANICS OF ANKLE BRACING 132
kinetics and lower extremity EMG activity during these measures. The current study builds on
and supports previous work examining the effects of softshell and semi-rigid ankles braces on
vertical jump height and agility tasks, and adds to the limited literature examining lower
extremity EMG and kinetics during athletic performance tasks.
The results of the current study are in line with previous studies, in that vertical jump
height was significantly decreased by wearing softshell and semi-rigid ankle braces.
Furthermore, semi-rigid ankle braces significantly decreased mean EMG activity of the LG
muscle during the takeoff phase of the Vertical Jump Test. Additionally, softshell and semi-rigid
ankle braces significantly increased peak lateral GRF during the takeoff phase. During the
landing phase, semi-rigid ankle braces significantly decreased peak lateral GRF. Softshell and
semi-rigid ankle braces significantly increased time to complete a cutting task, but did no
significantly affect any EMG or kinetic variables during the cutting task.
Based on the findings of the current study, softshell and semi-rigid ankle braces decrease
vertical jump height and cutting performance. Softshell and semi-rigid ankle braces may also
influence the EMG activity and kinetic variables associated with lower extremity injury during a
vertical jump landing, although this is still unclear. Any effects on EMG or kinetics, however,
may be dependent on brace design and function. Further, more comprehensive research is needed
incorporating kinematic, kinetic, and EMG analysis to determine the exact mechanisms behind
the observed decrease in performance, and potential implications for injury and injury
prevention. In the mean time, clinicians, athletes, trainers, and any users or prescribers of ankle
braces should weigh the pros and cons of prophylactically bracing the ankle, especially from a
performance perspective.
BIOMECHANICS OF ANKLE BRACING 133
References
Abián, J; Alegre, L M; Lara, A J; Rubio, J A; Aguado, X. (2008). Landing differences between
men and women in a maximal vertical jump amplitude test. Journal of Sports Medicine
and Physical Fitness, 48, 305-310.
Alfuth, M., Klein, D., Koch, R., & Rosenbaum, D. (2014). Biomechanical comparison of 3 ankle
braces with and without free rotation in the sagittal plane. Journal of Athletic Training,
49, 608-616.
Advanced Medical Technologies, Inc. (AMTI). (1987). Biomechanics platform set instruction
manual. Newton, MA.
Anderson, M. K., & Parr, G. P. (2013). Foundations of athletic training (5th ed.). Baltimore &
Philadelphia, U.S.A: Lippincott Williams & Wilkins.
Ambegaonkar, J. P., Redmond, C. J., Winter, C., Ambegaonkar, S. J., Thompson, B., & Guyer,
S. M. (2011). Ankle stabilizers affect agility but not vertical jump or dynamic balance
performance. Foot and Ankle Specialist, 4, 354-360.
Aragón-Vargas, L. F. (2002). Evaluation of four vertical jump tests: Methodology, reliability,
validity, and accuracy. Measurement in Physical Education and Exercise Science, 4, 215-
228. doi: http://dx.doi.org/10.1207/S15327841MPEE0404_2
Aragón-Vargas, L. F., & Gross, M. M. (1997). Kinesiological factors in vertical jump
performance: Differences among individuals. Journal of Applied Biomechanics, 13, 24-
44.
Bachman, L. M., Kolb, E., Koller, M. T., Steurer, J., ter Riet, G. (2003). Accuracy of Ottawa
ankle rules to exclude fractures of the ankle and mid-foot: a systematic review. British
Medical Journal, 326, 417-424. https://doi.org/10.1136/bmj.326.7386.417
BIOMECHANICS OF ANKLE BRACING 134
Bahr, R., & Bahr, I. A. (1997) Incidence of acute volleyball injuries: a prospective cohort study
of injury mechanisms and risk factors. Scandinavian Journal of Medicine and Science in
Sports, 7, 166-171. doi: 10.1111/j.1600-0838.1997.tb00134.x
Bahr, R., Karlsen, R., Liam, Ø., & Øvrebø. (1994). Incidence and mechanisms of acute ankle
inversion injuries in volleyball. American Journal of Sports Medicine, 22, 595-600.
Bahr, R., Lian, O., & Bahr, I. A. (1997). A twofold reduction in the incidence of ankle sprains in
volleyball after introduction of an injury prevention program: A prospective cohort study.
Scandinavian Journal of Medicine and Science in Sports, 7, 172-177.
Barlow, G., Donovan, L., Hart, J. M., & Hertel, J. (2015). Effect of lace-up braces on
electromyography measures during walking in adults with chronic ankle instability.
Physical Therapy in Sport, 16, 16-21. https://doi.org/10.1016/j.ptsp.2014.02.002
van den Bekerom, M. P. J., Oostra, R. J., Golanó, P., & van Dijk, C. N. (2008). The anatomy in
relation to injury of the lateral collateral ligaments of the ankle: A current concepts
review. Clinical Anatomy, 21, 619-626. doi: 10.1002/ca.20703
Beynnon, B. D., Murphy, D. F., & Alosa, D. M. (2002). Predictive factors for lateral ankle
sprains: a literature review. Journal of Athletic Training, 37, 376-380.
Bird, K. D. & Hadzi-Pavlovic, D. (1983). Simultaneous test procedures and the choice of a test
statistic in MANOVA. Psychological Health Bulletin, 93, 167-178.
Boardman, D. L., & Liu, S. H. (1997). Contribution of the anterolateral joint capsule to the
mechanical stability of the Ankle. Clinical Orthopaedics and Related Research, 341,
224-232.

BIOMECHANICS OF ANKLE BRACING 135
Boden, B. P., Dean, S. G., Feagin, J. A. Jr., & Garret, W. E. (2000). Mechanisms of anterior
cruciate ligament injury. Orthopedics, 23, 573-578. doi: 10.3928/0147-7447-20000601-
15
Bompa, T. O., & Haff, G. G. (2009). Periodization: Theory and methodology of training.
Champaign, IL: Human Kinetics.
Bot, S. D. M., & van Mechelen, W. (1999). The effect of ankle bracing on athletic performance.
Sports Medicine, 27, 171-178.
Bressel, E., & Cronin, J. (2013). The landing phase of a jump strategy to minimize injuries.
Journal of Physical Education, Recreation, and Dance, 76(2), 20-35.
https://doi.org/10.1080/07303084.2005.10607332
Bullock-Saxton, J. E., Janda, V., & Bullock, M. I. (1994). The influence of ankle sprain injury on
muscle activation during hip extension. International Journal of Sports Medicine, 15,
330-334.
Burks, R. T., Bean, B. G., Marcus, R., & Barker, H. B. (1991). Analysis of athletic performance
with prophylactic ankle devices. American Journal of Sports Medicine, 12, 104-106. doi:
10.1177/036354659101900202
de Comargo Neves Sacco, I., Takahasi, H. Y., Suda, E. Y., Battistella, L. R., Kavamoto, C. A.,
Lopes, J. A. A., & de Vasconcelos, J. C. P. (2006). Ground reaction force in basketball
cutting maneuvers with and without ankle bracing and taping. Sao Paulo Medical
Journal. 124, 245-252.

BIOMECHANICS OF ANKLE BRACING 136
Cloak, R., Galloway, S., & Wyon, M. (2010). The effect of ankle bracing on peak mediolateral
ground reaction force during cutting maneuvers in collegiate male basketball players.
Journal of Strength and Conditioning Research, 24, 2429-2433. doi:
10.1519/JSC.0b013e3181e2e0d5
Colby, S., Francisco, A., Yu, B., Kirkendall, D., Finch, M., & Garret, W. (2000).
Electromyographic and kinematic analysis of cutting maneuvers: Implications for
anterior cruciate ligament injury. American Journal of Sports Medicine, 28, 234-240.
Cordova, M. L., Armstrong, L., Rankin, C. W., James, M., & Yeasting, R. A. (1998). Ground
reaction forces and emg activity with ankle bracing during inversion stress. Medicine and
Science in Sport and Exercise. 30, 1363-1370.
Cordova., M. L., & Armstrong, L. (1996). Reliability of ground reaction forces during a vertical
jump: implications for functional strength assessment. Journal of Athletic Training, 31,
342-345.
Cordova, M. L., Cardona, C. V., Ingersoll, C. D., & Sandrey, M. A. (2000). Long-term ankle
brace use does not affect peroneus longus muscle latency during sudden inversion in
normal subjects. Journal of Athletic Training, 35, 407-411.
Cordova, M. L., & Ingersoll, C. D. (2003). Peroneus longus stretch reflex amplitude increases
after ankle brace application. British Journal of Sports Medicine, 37, 258-262.
doi:10.1136/bjsm.37.3.258
Cordova, M., Scott, B. D., Ingersoll, C. D., & LeBlanc, M. J. (2005). Effects of ankle support on
lower-extremity functional performance: a meta-analysis. Medicine and Science in Sports
and Exercise, 37, 635-641.
BIOMECHANICS OF ANKLE BRACING 137
Cordova, M. L., Takahashi, Y., Kress, G. M., Brucker, J. B., & Finch, A. E. (2010). Influence of
external ankle support on lower extremity joint mechanics during drop landings. Journal
of Sport Rehabilitation, 19, 136-148.
Criswell, E. (2011). Introduction to surface electromyography (2nd ed.). Sudbury, USA: Jones
and Bartlett Publishers.
Cronin, J. B., & Templeton, R. L. (2008). Timing light height affects sprint times. Journal of
Strength and Conditioning Research, 22, 318-320. doi: 10.1519/JSC.0b013e31815fa3d3.
CSEP. (2013). Canadian society for exercise physiology- physical activity training for health. Ottawa, Canada: Canadian Society for Exercise Physiology.
Delsys Inc.. (2012). Delsys Trigno Wireless system: User’s guide. Boston, MA: Delsys Inc. DeMorat, G., Weinhold, P., Blackburn, T., Chudik, S., & Garret, W. (2004). Aggressive
quadriceps loading can induce noncontact anterior cruciate ligament injury. American
Journal of Sports Medicine, 32, 477-483. doi: 10.1177/0363546503258928
Devita, P., & Skelly, W. A. (1992). Effect of landing stiffness on joint kinetics and energetics in
the lower extremity. Medicine and Science in Sports and Exercise, 24, 108-115.
van Dijk, C. N. (1994). On diagnostic strategies in patient with severe ankle sprain (Thesis).
University of Amsterdam.
van Dijk, C. N., Bossuyt, P. M. M., & Marti, R. K. Medial ankle pain after lateral ligament
rupture. Journal of Bone and Joint Surgery, 78, 562-564.
DiStefano, L. J. Padua, D. A., Brown, C. N., & Guskiewicz, K. M. (2008). Lower extremity
kinematics and ground reaction forces after prophylactic lace-up ankle bracing. Journal
of Athletic Training, 43, 234-241. doi: 10.4085/1062-6050-43.3.234.

BIOMECHANICS OF ANKLE BRACING 138
Dixon, S. J., Collop, A. C., & Batt, M. E. (2000). Surface effects on ground reaction forces and
lower extremity kinematics in running. Medicine and Science in Sports and Exercise, 32,
1921-1926.
Donatelli, R. (1987). Abnormal biomechanics of the foot and ankle. Journal of Orthopedic and
Sports Physical Therapy, 9, 11-16.
Donnell-Fink, L. A., Klara, K., Collins, J. E., Yang, H. Y., Goczalk, M. G., Natz, J. N., &
Losina, E. Effectiveness of knee injury and anterior cruciate ligament tear prevention
programs: a meta-analysis. PLOS ONE, 10(12). 1-17.
https://doi.org/10.1371/journal.pone.0144063
Draganich, L. F., Jaeger, R. J., Kralj, A. R. (1989). Coactivation of the hamstrings and
quadriceps during extension of the knee. Journal of Bone and Joint Surgery, 71a, 1075-
1081.
Draganich, L. F., & Vahey, J. W. (1990). An in vitro study of anterior cruciate ligament strain
induced by quadriceps and hamstrings forces. Journal of Orthopaedic Research, 8, 57- 61. https://doi.org/10.1002/jor.1100080107
Drewes, L. K., McKeon, P. O., Kerrigan, C., & Hertel, J. (2009). Dorsiflexion deficit during
jogging with chronic ankle instability. Journal of Science and Medicine in Sport, 12, 685- 687. DOI: https://doi.org/10.1016/j.jsams.2008.07.003
Dufek, J. S., & Bates, B. T. (1990). The evaluation and prediction of impact forces during
landings. Medicine and Science in Sports and Exercise, 22, 370-377.
Dutton, M. (2012). Dutton’s orthopaedic examination, evaluation, and intervention (3rd ed.).
United States: McGraw-Hill.
BIOMECHANICS OF ANKLE BRACING 139
Eachaute, C., Vaes, P., Van Aerschot, L., Asman, S., & Duquet, W. (2007). The clinometric
qualities of patient-assessed instruments for measuring chronic ankle instability: A
systematic review. BMC Musculoskeletal Disorders, 8(6). doi: 10.1186/1471-2474-8-6
Eils, E., Demming, C., Kollmeier, G., Thorwesten, L., Völker, K., & Rosenbaum, D. (2002).
Comprehensive testing of 10 different ankle braces. Evaluation of passive and rapidly
induced stability in subjects with chronic ankle instability. Clinical Biomechanics, 17,
526-535. http://dx.doi.org/10.1016/S0268-0033(02)00066-9
Fallat, L., Grimm, D. J., & Saracco, J. A. (1998). Sprained ankle syndrome: Prevalence and
analysis of 639 acute injuries. Journal of Foot and Ankle Surgery, 37, 280-285.
Fagenbaum, R., & Darling, W. G. (2003). Jump landing strategies in male and female college
athletes and implications of such strategies for anterior cruciate ligament injury.
American Journal of Sports Medicine, 31, 233-240. doi:
10.1177/03635465030310021301
Feuerbach, J. W., Grabiner, M. D., Koh, T. J., & Weiker, G. G. (1994). Effect of an ankle
orthosis and ankle ligament anesthesia on ankle joint proprioception. American Journal
of Sports Medicine, 22, 223-229. doi: 10.1177/036354659402200212
Feger, M. A., Donovan, L., Hart, J. M., & Hertel, J. (2014). Lower extremity muscle activation
during functional exercises in patients with and without chronic ankle instability. PM &
R: The Journal of Injury, Function, and Rehabilitation, 6, 602-611. doi:
10.1016/j.pmrj.2013.12.013
Feger, M. A., Donovan, L., Hart, J. M., & Hertel, J. (2015). Lower extremity muscle activation
in patients with or without chronic ankle instability during walking. Journal of Athletic
Training, 50, 350-357. doi: 10.4085/1062-6050-50.2.06
BIOMECHANICS OF ANKLE BRACING 140
Ferran, N. A., Maffulli, N. (2006). Epidemiology of sprains of the lateral ankle ligament
complex. Foot and Ankle Clinics, 11, 659-662.
http://dx.doi.org/10.1016/j.fcl.2006.07.002
Fauth, M., Petushek, E., Feldmann, C., Hsu, B., & Garceau, L. (2010). Reliability of surface
electromyography during maximal voluntary isometric contractions, jump landings, and
cutting. Journal of Strength and Conditioning Research, 24, 1131-1137.
doi:10.1519/JSC.0b013e3181cc2353
Freeman, M. A. R. (1965). Instability of the foot after injuries to the lateral ligament of the ankle.
Journal of Bone and Joint Surgery, 47B, 669-677.
Freeman, M. A. R., Dean, M. R. E., & Hanham, I. W. F. (1965). The etiology and prevention of
functional instability of the foot. Journal of Bone and Joint Surgery, 47B, 678-685.
Frey, C., Feder, K. S., & Sleight, J. (2010). Prophylactic ankle brace use in high school
volleyball players: A prospective study. Foot and Ankle International, 31, 296-300.
doi:10.3113/FA1.2010.0296
Green, T., Refshauge, K., Crosbie, J., & Adams, R. (2001). A randomized controlled trial of a
passive accessory joint mobilization on acute ankle inversion sprains. Physical Therapy,
81, 984-994.
Greene, T. A., & Roland, C. (1989). A comparative isokinetic evaluation of a functional ankle
orthosis on talocalcaneal function. Journal of Orthopaedic and Sports Physical Therapy,
11, 245-252.
BIOMECHANICS OF ANKLE BRACING 141
Greene, A. J., Stuelcken, M. C., Smith, R. M., & Vanwanseele, B. (2014). The effect of external
ankle support on the kinematics and kinetics of the lower limb during a side step cutting
task in netballers. BMC Sports Science, Medicine, and Rehabilitation, 6(42). 1-10. doi:
10.1186/2052-1847-6-42
Gribble, P. A., Hertel, J , & Denegar, C. R . (2007). Chronic ankle instability and fatigue create
proximal joint alterations during performance of the Star Excursion Balance Test.
International Journal of Sports Medicine, 28, 236–242. doi: 10.1055/s-2006-924289
Gribble, P. A., Radel, S., & Armstrong, C. W. (2006) The effects of ankle bracing on the
activation of the peroneal muscles during a lateral shuffling movement. Physical Therapy
in Sport, 7(1), 14-21. http://dx.doi.org/10.1016/j.ptsp.2005.10.003
Gribble, P. A., & Robinson, R. H. (2009). Alteration in knee kinematics and dynamic stability
associated with chronic ankle instability. Journal of Athletic Training, 44, 350-355.
Gross, M. T., Bradshaw, M. K., Ventry, L. C., & Weller, K. H. (1987). Comparison of support
provided by ankle taping and semirigid orthosis. Journal of Orthopaedic and Sports
Physical Therapy, 9, 33-39. doi: 10.2519/jospt.1987.9.1.33
Gross, T. S., & Nelson, R. C. (1988). The shock attenuation role of the ankle during landing
from a vertical jump. Medicine and Science in Sports and Exercise, 20, 506-514.
Gudibanda, A., & Wang, Y. (2005). Effect of the ankle stabilizing orthosis on foot and ankle
kinematics during cutting maneuvers. Research in Sports Medicine, 13(2), 111-126.
doi:10.1080/15438620590956115

BIOMECHANICS OF ANKLE BRACING 142
Halaki, M., & Ginn, K. (2012). Normalization of EMG signals: To normalize or not to normalize
and what to normalize to? In G. R. Naik (Ed.), Computational Intelligence in
Electromyography Analysis - A Perspective on Current Applications and Future
Challenges (175-194). InTech. doi: 10.5772/49957
Hall, S. J. (2012). Basic biomechanics (6th ed.). New York, New York: McGraw-Hill.
Hamill, J., Knutzen, K. M., & Derrick, T. R. (2015). Biomechanical basis of human movement
(4th ed.). Philadelphia, U.S.A.: Lippincott Williams & Wilkens.
Heit, E. J., Lephart, S. M., & Rozzi, S. L. (1996). The effect of ankle bracing and taping on joint
position sense in the stable ankle. Journal of Sport Rehabilitation, 5, 206-213.
http://dx.doi.org/10.1123/jsr.5.3.206
Henderson, Z., & Sanzo, P. (2017). The Biomechanical Effects of Ankle Bracing During
Performance Measures ─ A Pilot Study. Unpublished manuscript, School of Kinesiology,
Lakehead University, Thunder Bay, Canada.
Henderson, Z., Sanzo, P., & Zerpa, C. (2016). The effect of prophylactic ankle bracing on
physical performance measures in jumping athletes. International Journal of Sports
Science, 6, 138-145. doi: 10.5923/j.sports.20160604.02
Hertel, J. (2000). Functional instability following lateral ankle sprain. Sports Medicine, 29, 161-
371.
Hertel, J. (2002). Functional anatomy, pathomechanics, and pathophysiology of lateral ankle
instability. Journal of Athletic Training, 37, 364-375.
Hewett, T. E., Ford, K. R., Hoogenboom, B. J., & Myer, G. D. (2010). Understanding and
preventing ACL injuries: Current biomechanical and epidemiological considerations –
update 2010. North American Journal of Sports Physical Therapy, 5, 234-251.

BIOMECHANICS OF ANKLE BRACING 143
Hewett, T. E., Lindenfield, T. N., Riccobene, J. V., & Noyes, F. R. (1999). The effect of
neuromuscular training on the incidence of knee injury in female athletes: a prospective
study. American Journal of Sports Medicine, 27, 699-706. DOI:
https://doi.org/10.1177/03635465990270060301
Hewett, T. E., Stroupe, A. L., Nance, T. A., & Noyes, F. R. (1996). Plyometric training in female
athletes. Decreased impact forces and increased hamstring torques. American Journal of
Sports Medicine, 27, 699-706.
Hewett, T. E., Torg, J. S., & Boden, B. P. (2009). Video analysis of trunk and knee motion
during non-contact anterior cruciate ligament injury in female athletes: Lateral trunk and
knee abduction motion are combined components of the injury mechanism. British
Journal of Sports Medicine, 43, 417-422.
Hoch, M. C., Staton, G. S., Medina Mckeon, J. M., Mattacola, C. G., & McKeon, O. (2012).
Dorsiflexion and dynamic postural control deficits are present in those with chronic ankle
instability. Journal of Science and Medicine in Sport, 15, 574-579.
https://doi.org/10.1016/j.jsams.2012.02.009
Hodgson, B., Tis, L., Cobb, S., & Higbie, E. (2005). The effect of external ankle support on
vertical ground-reaction force and lower body kinematics. Journal of Sport
Rehabilitation, 14, 301-312. http://dx.doi.org/10.1123/jsr.14.4.301
Holmer, P., Sondergaard, L., Konradsen, L., Nielson, P. T., & Jorgensen, L. N. (1994).
Epidemiology of sprains in the lateral ankle and foot. Foot and Ankle International, 15,
72-74.

BIOMECHANICS OF ANKLE BRACING 144
Hopper, D. M., McNair., P., & Elliot, B. C. (1999) Landing in netball: Effects of taping and
bracing the ankle. British Journal of Sports Medicine. 33, 409-413.
doi:10.1136/bjsm.33.6.409
Houck, J. (2003). Muscle activation patterns of selected lower extremity muscles during stepping
and cutting tasks. Journal of Electromyography and Kinesiology, 13, 545-554.
http://dx.doi.org/10.1016/S1050-6411(03)00056-7
Hsu, W. L., Krishnamoorthy, V., Scholz, J. P. (2009). An alternative test of electromyographic
normalization in patients. Muscle and Nerve, 33, 232-241.
https://dx.doi.org/10.1002/mus.20458
Hubbard, T. J., & Hertel, J. (2008). Anterior positional fault of the fibular after sub-acute lateral
ankle sprains. Manual Therapy, 13(1). 63-67. doi: 10.1016/j.math.2006.09.008
Jastifer, J. R., & Gustafson, P. A. (2014). The subtalar joint: Biomechanics and functional
representations in the literature. The Foot, 24, 203-209.
http://dx.doi.org/10.1016/j.foot.2014.06.003
Inman, V. T. (1976). The joints of the ankle. Baltimore: Williams & Wilkins.
Johnson, M. B., & Johnson, C. L. (1993). Electromyographic response of peroneal muscles in
surgical and nonsurgical injured ankles during sudden inversion. Journal of Orthopaedic
and Sports Physical Therapy, 18, 497-501.
Johnson, E. O., & Soucacos, P. N. (2010). Proprioception. In International Encyclopedia of
Rehabilitation.
Jones, D. C. (1993). Tendon disorders of the foot and ankle. Journal of the American Academy of
Orthopaedic Surgeons, 1, 87-94.
Kamen, G., & Gabriel, D. A. (2010). Essentials of electromyography. Windsor: Human Kinetics.

BIOMECHANICS OF ANKLE BRACING 145
Kaminski, T.W., Hertel, J., Amendoloa, N., Docherty, C. L., Dolan, M. G. Hopkins, J. T.,
Nussbaum, E., Poppy, W., & Richie, D. (2013). National athletic trainers association
position statement: Conservative management and prevention of ankle sprains in athletes.
Journal of Athletic Training, 48, 528-545. doi: 10.4085/1062-6050-48.02
Kennedy, P. M., & Inglis, T. J. (2002). Distribution and behaviour of glabrous cutaneous
receptors in the human foot sole. Journal of Physiology, 538, 995-1002. DOI:
10.1013/jphysiol.2001.013087
Kirby, K. A. (2000). Biomechanics off the normal and abnormal foot. Journal of the American
Podiatric Medical Association. 90(1), 30-34. DOI: 10.7547/87507315-90-1-30
Kleinrensink, G. J., Stoeckart, R., Meulstee, J., Kaulesar Sukul, D. M., Vleeming, A., Snijders,
C. J., & van Noort, A.(1994). Lowered motor conduction velocity of the peroneal nerve
after inversion trauma. Medicine and Science in Sports and Exercise, 26, 877-883.
Klem, N-R., Wild, C. Y., Williams, S. A., & Ng, L. (2016). Effect of external ankle support on
ankle and knee biomechanics during the cutting maneuver in basketball players.
American Journal of Sports Medicine. Advance online publication. doi:
10.1177/0363546516673988
Konrad, K. (2005). The ABC of EMG: a practical introduction to kinesiological
electromyography. USA: Noraxon.
Konradsen, L. (2002). Factors contributing to chronic ankle instability: kinesthesia and joint
position sense. Journal of Athletic Training, 37, 381–385.
Konradsen, L., & Ravn, J. B. (1990). Ankle instability caused by prolonged peroneal reaction
time. Acta Orthopaedica Scandinavica, 61, 388-390.

BIOMECHANICS OF ANKLE BRACING 146
Konradsen, L., & Ravn, J. B. (1991). Prolonged peroneal reaction time in ankle instability.
International Journal of Sports Medicine, 12, 290-292. doi: 10.1055/s-2007-1024683
Koo, T. K., & Li, M. Y. (2016). A guideline of selecting and reporting intraclass correlation
coefficients for reliability research. Journal of Chiropractic Medicine, 15, 155-163. DOI:
10.1016/j.jcm.2016.02.012
Leonard, T. & Rotay, J. (2014). Effects of ankle taping and bracing on agility, vertical jump, and
power. Keystone Journal of Undergraduate Research, 2(1), 23-28.
Lephart, S. M., Pincivero, D. M., & Rozzi, S. L. (1998). Proprioception of the ankle and knee.
Sports Medicine, 25, 149-155. https://doi.org/10.2165/00007256-199825030-00002
Leppänen, M., Aaltonen, S., Parkkari, J., Heinonen, A., & Kujala, U. M. (2014). Interventions to
prevent sports related injuries: A systematic review and meta-analysis of randomized
controlled trials. Sports Medicine,44, 473-486. doi: 11007/s40279-013-0136-8
MacKean, L. C., Bell, G., & Burnham, R. S. (1995). Prophylactic ankle bracing vs. taping:
effects on functional performance in female basketball players. Journal of Orthopaedic
and Sports Physical Therapy, 22(2), 77-81.
Macpherson, K., Sitler, M., Kimura, I., & Horodyski, M. (1995). Effects of a semirigid and
softshell prophylactic ankle stabilizer on selected performance tests among high school
football players. Journal of Orthopaedic & Sports Physical Therapy, 21(3), 147-152.
Macrum, E., Bell, D. R., Boling, M., Lewek, M., & Padua, D. (2012). Effect of limiting ankle-
dorsiflexion range of motion on lower extremity kinematics and muscle-activation
patterns during a squat. Journal of Sport Rehabilitation, 21, 144-150.
Magee, D. J. (2014). Orthopedic physical assessment (6th ed.). St. Louis, Missouri: Elsevier
Saunders.
BIOMECHANICS OF ANKLE BRACING 147
Magnusson, M., Enbom, H., Johansson, R. & Pyykkö, I. (1990). Significance of pressure input
from the human feet in anterior-posterior postural control. Acta Otolaryngol, 110, 182-
188.
Malinzak, R., Colby, S. M., Kirkendall, D. T., Yu, B., & Garret, W. E. A. (2001). Comparison of
knee joint motion patterns between men and women in selected athletic tasks. Clinical
Biomechanics, 16, 438-445.
Man, I. O., Morrissey, M. C., & Cywinski, J. K. (2007). Effect of neuromuscular electrical
stimulation on ankle swelling in the early period of ankle sprain. Physical Therapy, 87,
53-65. http://dx.doi.org/10.2522/ptj.20050244
Martin, R. L., Davenport, T. E., Paulseth, S., Wukich, D. K., & Godges, J. J. (2013). Ankle
stability and movement coordination impairments: Ankle ligament sprains. Journal of
Orthopaedic and Sports Physical Therapy, 43(9), A1-A40. doi: 10.2519/jospt.2013.0305.
Mavi, A., Yildirim, H., Grunes, T., Pestamalci, E., & Gumusburun, E. (2002). The fibular
incisura of the tibia with recurrent sprained ankle on magnetic resonance imaging. Saudi
Medical Journal, 23, 845-849.
Mazieres, B., Rouanet, S., Velicy, J., Scarsi, C., & Reiner, V. (2005). Topical ketoprofen patch
(100 mg) for the treatment of ankle sprain a randomized, double-blind, placebo-
controlled study. American Journal of Sports Medicine, 33, 551-523. doi:
10.1177/0363546504268135
McGuine, T. A., Brooks, A., & Hetzel, S. (2011). The effect of lace-up ankle braces on injury
rates in high school basketball players. American Journal of Sports Medicine, 39, 1840-
1848. doi: 10.1177/0363546511406242

BIOMECHANICS OF ANKLE BRACING 148
McGuine, T. A., Hetzel., S., Wilson, J., & Brooks, A. (2012). The effect of lace-up ankle braces
on injury rates in high school football players. American Journal of Sports Medicine, 40,
49-57. doi: 10.1177/0363546511422332
McKay, G. D., Goldie, P. A., Payne, W. R. & Oakes. (2001). Ankle injuries in basketball: injury
rate and risk factors. British Journal of Sports Medicine, 35, 103-108.
doi:10.1136/bjsm.35.2.103
McNair, P. J., & Prapavessis, H. (1999). Normative data of vertical ground reaction forces
during landing from a jump. Journal of Science and Medicine in Sport, 2, 86-88.
https://doi.org/10.1016/S1440-2440(99)80187-X
Merletti, R. D., Farina, H. J., Hermens, H. J., Freriks, B., & Harlaar, J. (1999). European
recommendations for signal processing methods for surface electromyography. In H. J.
Hermens, B. Freriks, R. Merletti, D. F. Stegeman, J. H. Block, G. Rau., C. Disselhorst-
Klug, & G. Hagg (Eds.), European recommendations for surface electromyography (57-
70). Enschede, Netherlands: Roessingh Research and Development.
Miller, H., Needle, A. R., Swanik, B., Gustavsen, G. A., & Kaminski, T. W. (2012). Role of
external prophylactic support in restricting accessory ankle motion after exercise. Foot
and Ankle International, 33, 862-869. https://doi.org/10.3113/FAI.2012.0862
Montalvo, A. M., Schneider, D. K., Yut, L., Webster, K. E., Beynnon, B., Kocher, M. S., &
Myer, G. D. (2018). “What’s my risk of sustaining an ACL injury while playing sports?”
A systematic review with meta-analysis. British Journal of Sports Medicine, Advance
online publication. DOI: 10.1136/bjsports-2016-096274
Mulligan, B. (1995). Manual therapy: “NAGS”, “SNAGS”, “MWMS” etc. (3rd ed. ed.)
Wellington: Plane View Services Ltd.

BIOMECHANICS OF ANKLE BRACING 149
Munro, C. F., (1987). Ground reaction forces in running: a reexamination. Journal of
Biomechanics, 20, 147-155. https://doi.org/10.1016/0021-9290(87)90306-X
Nilsson, J., & Thorstensson, A. (1989). Ground reaction forces at different speeds of human
walking and running. Acta Physiologica, 136, 217-227. doi: 10.1111/j.1748-
1716.1989.tb08655.x
Nigg, B. M. (2001). The role of impact forces and foot pronation: a new paradigm. Clinical
Journal of Sports Medicine, 11(1), 2-9. 2–9. doi:10.1097/00042752-200101000-00002
Nitz, A. J., Dobner, J. J., & Kersey, D. (1985). Nerve injury and grades II and III ankle sprains.
American Journal of Sports Medicine, 13, 177-182.
https://doi.org/10.1177/036354658501300306
Noyes, F. R., Mooar, P. A., Matthews, D. S., & Butler, D. L. (1983). The symptomatic anterior
cruciate-deficient knee. Part 1: The long-term functional disability in athletically active
individuals. Journal of Bone and Joint Surgery, 65, 154-162.
Noyes, F. R., Mooar, P. A., Matthews, D. S., & Butler, D. L. The symptomatic anterior cruciate-
deficient knee. Part 1: The long-term functional disability in athletically active
individuals. Journal of Bone and Joint Surgery, 65, 154-162.
Nuzzo, J. L., Anning, J. H., & Scharfenberg, J. M. (2011). The reliability of three devices used
for measuring vertical jump height. Journal of Strength and Conditioning Research, 25,
2580-2590. doi: 10.1519/JSC.0b013e3181fee650
Nurse, M. A., & Nigg B. M. (2001). The effect of changes in foot sensation on plantar pressure
and muscle activity. Clinical Biomechanics, 16, 719-727. https://doi.org/10.1016/S0268-
0033(01)00090-0
BIOMECHANICS OF ANKLE BRACING 150
Olmsted, L. C., Vela, L. I., Denegar, C. R. & Hertel, J. (2004). Prophylactic ankle taping and
bracing: A numbers-needed-to-treat and cost-benefit analysis. Journal of Athletic
Training, 39, 95-100.
Olsen, O. E., Myklebust, G., Engebretsen, L., & Bahr, R. (2004). Injury mechanisms for anterior
cruciate ligament injuries in team handball: a systematic video analysis. American
Journal of Sports Medicine, 32, 1002-1012. doi: 10.1177/0363546503261724
Pandy, M. G., & Zajac, F. E. (1991). Optimal muscular coordination strategies for jumping.
Journal of Biomechanics, 24(1), 1-10. https://doi.org/10.1016/0021-9290(91)90321-D
Paris, D. L. (1992). The effects of the Swedo-o, New Cross, and McDavid ankle braces and
adhesive ankle taping on speed, balance, agility, and vertical jump. Journal of Athletic
Training, 27, 253-256.
Parsley, A., Chinn, L., Lee, S. Y., Ingersoll, C., & Hertel, J. (2013). Effect of 3 different ankle
braces on functional performance and ankle range of motion. Athletic Training and
Sports Health Care, 5(2), 69-75.
Paule, K., Madole, K., Garhammer, J., Lacourse, M., & Rozenek, R. (2000). The reliability and
validity of the t-test as a measure of agility, leg power, and leg speed in college-aged men
and women. Journal of Strength and Conditioning Research, 14(4), 443-450.
Pedowitz., D. I., Reddy, S., Parekh, S. G., Huffman, R., & Sennet, B. J. (2008). Prophylactic
bracing decreases ankle injuries in collegiate female volleyball players. American
Journal of Sports Medicine, 36, 324-327. doi: 10.1177/0363546507308358
Perrin, D. H. (2012). Athletic taping and bracing (3rd ed.). Champaign, Il: Human Kinetics

BIOMECHANICS OF ANKLE BRACING 151
Petersen, W., Rembitzki, I. V., Koppenburg, A. G., Ellermann, A., Liebau, C., Brüggemann. G.
P., & Best, R. (2013). Treatment of acute ligament injuries: A systematic review.
Arthroscopy and Sports Medicine, 133, 1129-1141. doi: 11007/s00402-013-1742-5
Pienkowski, D., McMorrow, M., Shapiro, R., Caborn, D. M. N., & Stayton, J. (1995). The effect
of ankle stabilizers on athletic performance: a randomized prospective study. American
Journal of Sports Medicine, 23, 757-762.
Powers, S. K., & Howley, E. T. (2012). Exercise physiology: Theory and application to fitness
and performance (8th ed.). New York, New York: McGraw-Hill
Prilutsky, B. I., & Zatsiorsky, V. M. (1994). Tendon action of two joint muscles: transfer of
mechanical energy between joints during jumping, landing and running. Journal of
Biomechanics, 27(1), 25-34.
Procter, P., & Paul, J. (1982). Ankle joint biomechanics. Journal of Biomechanics, 15, 627-634.
Rasmussen, O., & Tovborg-Jensen, I. (1982). Mobility of the ankle joint: Recording of rotary
movements in the talocrural joint in vitro with and without the lateral collateral ligaments
of the ankle. Acta Orthopaedica Scandinavica, 53, 155-160.
http://dx.doi.org/10.3109/17453678208992194
Reid, D. C. (1992). Sports injury and rehabilitation. New York, NY: Churchill and Livingston.
Robbins, S., & Waked, E. (1998). Factors associated with ankle injuries: Preventative measures.
Sports Medicine, 25(1), 63-72.
Roos, K. G., Kerr, Z. Y., & Mauntel, T. C. (2016). The epidemiology of lateral ligament
complex ankle sprains in national collegiate athletic association sports. American Journal
of Sports Medicine, 45, 201-208. http://dx.doi.org/11177%2F0363546516660980

BIOMECHANICS OF ANKLE BRACING 152
Root, M. L., Orien, W. P., & Weed, J. H. (1977). Normal and abnormal function of the foot. Los
Angeles: Clinical Biomechanics Corporation.
Rosenbaum, D., Kamps, N., Bosch, K., Thorwesten, L., Vӧlker, K., & Eils, E. (2005). The
influence of external ankle braces on subjective and objective parameters of performance
in a sports-related agility course. Knee Surgery Sports Traumatology Arthroscopy, 13,
419-425. doi: 10.1007/s00167-004-0584-7 ·
Safran, M. R., Benedetti, R. S., Bartolozzi, A. R. 3rd., & Mandelbaum, B. R. (1999). Lateral
ankle sprains: A comprehensive review: Part 1: Etiology, pathoanatomy,
histopathogenesis, and diagnosis. Medicine and Science in Sports and Exercise, 31, 429-
437.
Smith, B., Claiborne, T., & Liberi, V. (2016). Ankle bracing decreases vertical jump height and
alters lower extremity kinematics. International Journal of Athletic Therapy and
Training, 21(2), 39-46. https://doi.org/11123/ijatt.2014-0143
Santilli, V., Franscarelli, M. A., Paoloni, M., Franscarelli, F., Cameroto, F., De Natale, L., & De
Santos, F. (2005). Peroneus longus muscle activation pattern during gait cycle in athletes
affected by functional ankle instability: A surface electromyographic study. American
Journal of Sports Medicine, 33, 1183-1187. doi: 10.1177/0363546504274147
Seegmiller, J. G., & McCaw, S. T. (2003). Ground reaction forces among gymnasts and
recreation athletes in drop landings. Journal of Athletic Training, 38, 311-314.
SENIAM. (2014). Surface electromyography for the non-invasive assessment of muscles.
Retrieved from http://seniam.org/
BIOMECHANICS OF ANKLE BRACING 153
Shah, S., Thomas, A.C., Noone, J. M., Blanchette, C. M., & Wikstrom, E. A. (2016). Incidence
and cost of ankle sprains in United States emergency departments. Primary Care, 8, 547-
552. https://doi.org/10.1177/1941738116659639
Shima, N., Maeda, A., & Hirohashi, K. (2005). Delayed latency of peroneal reflex to sudden
inversion with ankle taping or bracing. International Journal of Sports Medicine, 26,
476-480. doi: 10.1055/s-2004-821064
Shrout, P. E., & Fleiss, J. L. (1979). Intraclass correlations: uses in assessing rater reliability.
Psychological Bulletin, 86, 420-428.
Simpson, K. J., Cravens, S., Higbie, E., Theodorou, C., & Delrey, P. (1999). A comparison of the
Sport Stirrup, Malleoloc, and Swede-o® ankle orthoses for the foot-ankle kinematics of a
rapid lateral movement. International Journal of Sports Medicine, 20, 396-402.
Simpson, K. J., Yom, J. P., Fu, Y-C., Arnett, S. W., O’Rourke, S., & Brown, C. N. (2013). Does
wearing a prophylactic ankle brace during drop landings affect lower extremity
kinematics and ground reaction forces? Journal of Applied Biomechanics, 29, 205-213.
http://dx.doi.org/10.1123/jab.29.2.205
Sitler, M., Ryan, J., Wheeler, B., McBride, J., Arciero, R., Anderson, J., & Horodyski, M.
(1994). The efficacy of a semirigid ankle stabilizer to reduce acute ankle injuries in
basketball. American Journal of Sports Medicine, 22, 454-461. doi:
10.1177/036354659402200404
Slatyer, M. A., Hensley, M. J., & Lopert, R. (1997). A randomized controlled trial of piroxicam
in the management of acute ankle sprain in Australian regular army recruits: The kapooka
ankle sprain. American Journal of Sports Medicine, 25, 544-553. doi:
10.1177/036354659702500419

BIOMECHANICS OF ANKLE BRACING 154
Smith, B., Claiborne, T., & Liberi, V. (2016). Ankle bracing decreases vertical jump height and
alters lower extremity kinematics. International Journal of Athletic Therapy and
Training, 21(2), 39-46. https://doi.org/11123/ijatt.2014-0143
Stasinopoulos, D. (2004). Comparison of three preventative methods in order to reduce the
incidence of ankle inversion sprains among female volleyball players. British Journal of
Sports Medicine, 38, 182-185. doi: 10.1136/bjsm.2002.003947
Stegeman, D. F., & Hermens, H. J. (1998). Standard for surface electromyography: the European
Project (SENIAM). In: Hermens H.J., Rau G., Disselhorst-Klug C., Freriks B. (Eds.), Surface Electromyography Application Areas and Parameters (108-112). Proceedings of the Third General SENIAM Workshop on surface electromyography.
Stickley, C. D. (2017). The effects of ankle braces and taping on lower extremity running
kinematics and energy expenditure in healthy, non-injured adults. Gait and Posture, 58,
108-114. https://doi.org/10.1016/j.gaitpost.2017.07.041
Surve, I., Schwellnus, M. P., Noakes, T., & Lombard, C. (1994). A fivefold reduction in the
incidence of recurrent ankle sprains in soccer players using the sport-stirrup orthosis. American Journal of Sports Medicine, 22, 601-606.
Tamura, K., Radzak, K. N., Vogelpohl, R. E., Wisthoff, B. A., Oba, Y., Hetzler, R. K., &
Stickley, C. D. (2017). The effects of ankle braces and taping on lower extremity running
kinematics and energy expenditure in healthy, non-injured adults. Gait and Posture, 58,
108-114. DOI: https://doi.org/10.1016/j.gaitpost.2017.07.041
Tang, Y. M., Wu., Z. H., Liao, W. H., & Chan, K. M. (2010). A study of semi-rigid support on
ankle supination sprain kinematics. Scandinavian Journal of Medicine and Science in
Sports, 20, 822-826. doi: 10.1111/j.1600-0838.2009.00991.x

BIOMECHANICS OF ANKLE BRACING 155
Thonnard, J. L., Bragard, D., Willems, P. A., & Plaghki, L. (1996). Stability of the braced ankle-
A biomechanical investigation. American Journal of Sports Medicine, 24, 356-361.
https://doi.org/10.1177/036354659602400318
Tiberio, D. (1987). The effect of excessive subtalar joint pronation on patellofemoral mechanics:
A theoretical model. Journal of Orthopaedic and Sports Physical Therapy.
Tortora, G. J., & Nielson, M. (2010). Principles of human anatomy (4th ed.). Jefferson City,
U.S.A: John Wiley and Sons, Inc.
Tropp, H., Odenrisk, P., & Gillquist, J. (1985). Stabilometry recordings in functional and
mechanical instability of the ankle joint. International Journal of Sports Medicine, 6,
180-182. doi: 10.1055/s-2008-1025836
Urabe, Y., Kobayashi, R., Sumida, S., Tanaka., K., Yoshida, N., Nishiwaki, G. A., Tsutsumi, E.,
& Ochi, M. (2005). Electromyographic analysis of the knee during jump landing in male
and female athletes. The Knee, 12, 129-134. https://doi.org/10.1016/j.knee.2004.05.002
Vanesky, K., Docherty, C. L., Dapena, J., & Schrader, J. (2006). Prophylactic ankle braces and knee varus-valgus and internal-external rotation torque. Journal of Athletic Training, 41, 239-244.
Van Ingen Schenau, G. J., Bobbert, M. F., Huijing, P. A., & Woitiez, R. D. (1985). The
instantaneous torque-angular velocity relation in plantar flexion during jumping.
Medicine and Science in Sports and Exercise, 17, 422-426. 9, 160-165.
Verbruggee, J. D. (1996). The effects of semirigid air-stirrup bracing vs. adhesive ankle taping
on motor performance. Journal of Orthopaedic & Sports Physical Activity, 23(5), 320-
325.
BIOMECHANICS OF ANKLE BRACING 156
Verhagen, E. A. L. M., & Bay, K. (2010). Optimising ankle sprain prevention: a critical review
and practical appraisal of the literature. British Journal of Sports Medicine, 44, 1082-
1088. doi: 10.1136/bjsm.2010.076406
West, T., Ng, L., & Campbell, A. (2013). The effect of ankle bracing on knee kinetics and
kinematics during volleyball specific tasks. Scandinavian Journal of Medicine and
Science in Sports, 24, 958-963. doi:10.1136/bjsm.33.6.409
Wernli, K., Ng, L.,Phan, X., Davey, P., & Grisbrook, T. (2016). The relationship between
landing sound, vertical ground reaction force, and kinematics of the lower limb during
drop landings in healthy men. Journal of Orthopaedic and Sports Physical Therapy, 46,
194-199. doi: 10.2519/jospt.2016.6041
Wiesler, E. R., Hunter, D.M, Martin, D. F., Curl, W. W., & Hoen, H. (1996). Ankle flexibility
and injury patterns in dancers. American Journal of Sports Medicine, 24, 754-757. doi: 10.1177/036354659602400609
Wiley, J. P., & Nigg, B. M. (1996). The effect of an ankle orthosis on ankle range of motion and
performance. Journal of Orthopaedic & Sports Physical Therapy, 23, 362-369.
Wilson, D. H. (1972). Treatment of soft-tissue injuries by pulsed electrical energy. British
Medical Journal, 2, 269-270.
Wulf, G., Dufek, J. S., Lozano, L., Pettigrew, C. (2010). Increased jump height and reduced emg
activity with an external focus. Human Movement Science, 29, 440-448.
https://doi.org/10.1016/j.humov.2009.11.008
BIOMECHANICS OF ANKLE BRACING 157
Yang, J., Marshall, S. W., Bowling, J. M., Runyan, C. W., Mueller, F. O., & Lewis, M. A.
(2005). Use of discretionary protective equipment and rate of lower extremity injury in
high school athletes. American Journal of Epidemiology, 161, 511-519.
doi:10.1093/aje/kwi077
Yeow, C. H., Ng, Y. H., Lee., P. V., & Goh, J. C. (2010). Tibial cartilage damage and
deformation at peak displacement compression during simulated landing impact.
American Journal of Sports Medicine, 38, 816-823. doi:10.1177/0363546509350465
Yu, B., Lin, C-F., & Garret, W. E. (2006). Lower extremity biomechanics during the landing of a
stop-jump task. Clinical Biomechanics, 21, 297-305.
http://doi.org/10.1016/j.clinbiomech.2005.11.003
Zehr, E. P., Nakajima, T., Barss, T., Klarner, T., Miklosovic, S., Mezzarane, R. A., Nurse, M., &
Komiyama, T. (2014). Cutaneous stimulation of discrete regions of the sole during
locomotion produces “sensory steering” of the foot. BMC Sports Science, Medicine, and
Rehabilitation. 6(33), https://doi.org/10.1186/2052-1847-6-33
Zhang, S. N., Bates, B. T., & Dufek, J. S. (2000). Contribution of lower extremity joints to
energy dissipation during landings. Medicine and Science in Sports and Exercise, 32,
812-819. doi:10.1097/00005768-200004000-00014

Appendices

BIOMECHANICS OF ANKLE BRACING 159
Appendix A
Recruitment Poster
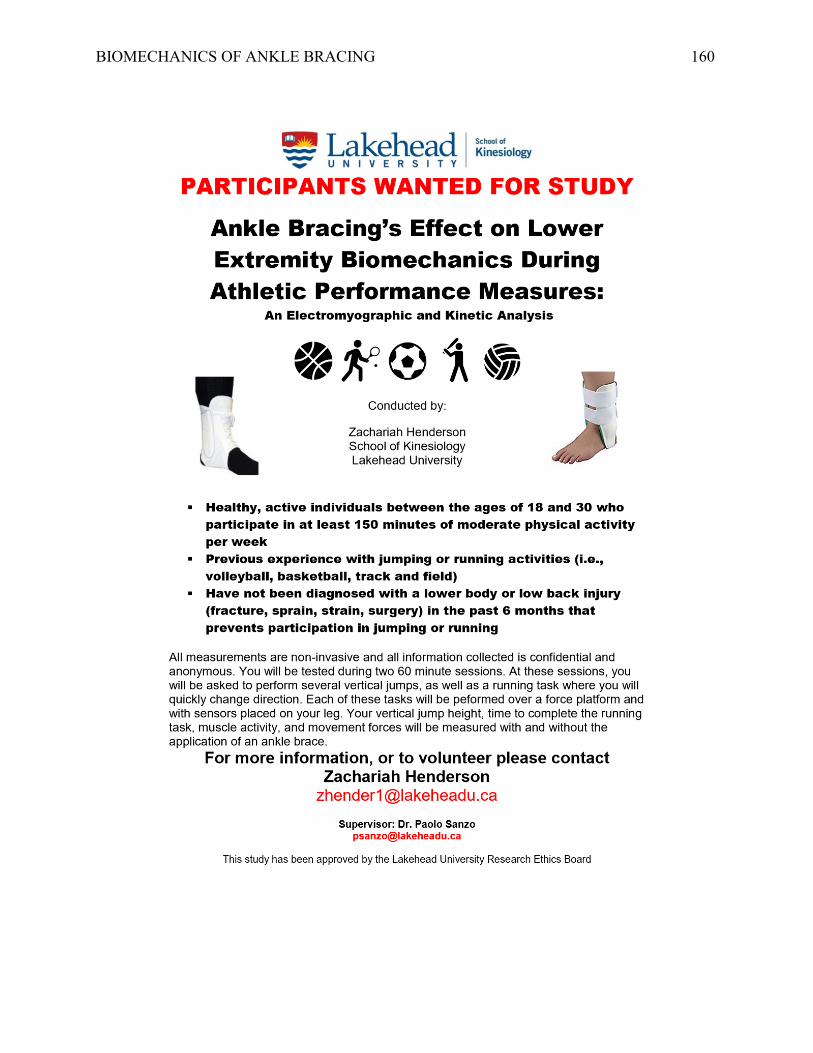
BIOMECHANICS OF ANKLE BRACING 160

BIOMECHANICS OF ANKLE BRACING 161
Appendix B
Information Letter

BIOMECHANICS OF ANKLE BRACING 162
BIOMECHANICS OF ANKLE BRACING 163
BIOMECHANICS OF ANKLE BRACING 164

BIOMECHANICS OF ANKLE BRACING 165
Appendix C
Consent Form

BIOMECHANICS OF ANKLE BRACING 166

BIOMECHANICS OF ANKLE BRACING 167
Appendix D
Physical Activity Readiness Questionnaire (Par-Q)
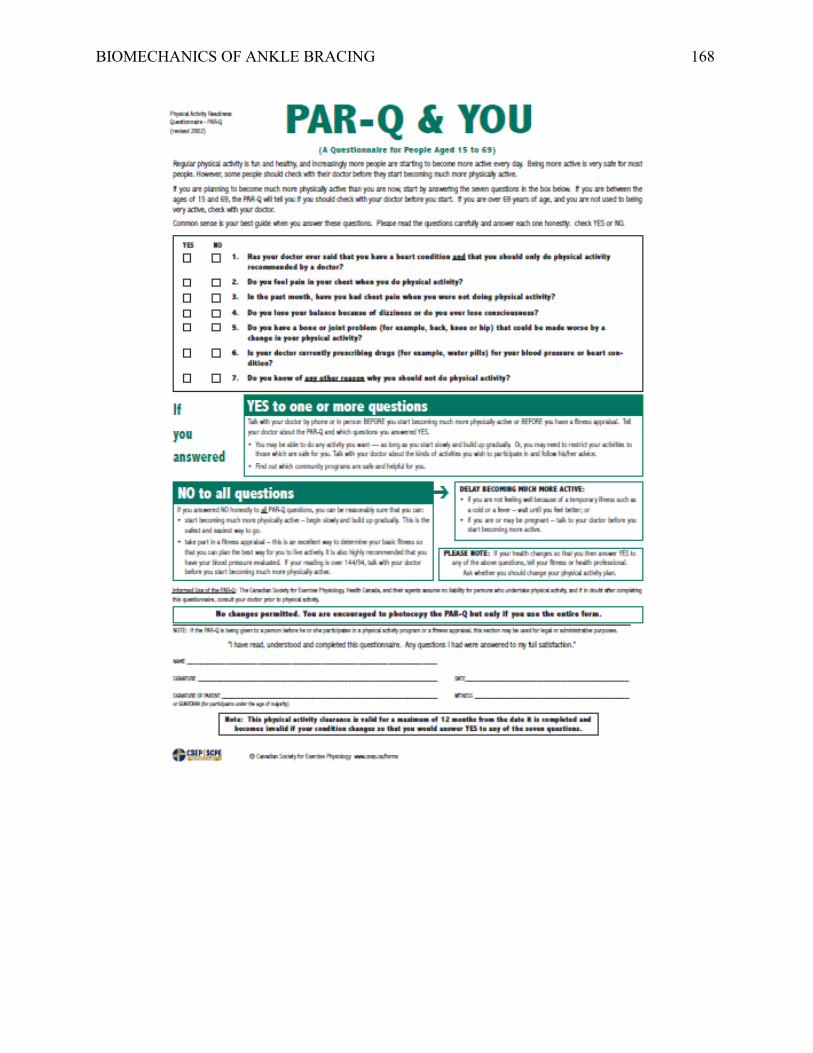
BIOMECHANICS OF ANKLE BRACING 168

BIOMECHANICS OF ANKLE BRACING 169
Appendix E
Functional Ankle Ability Measure (FAAM)
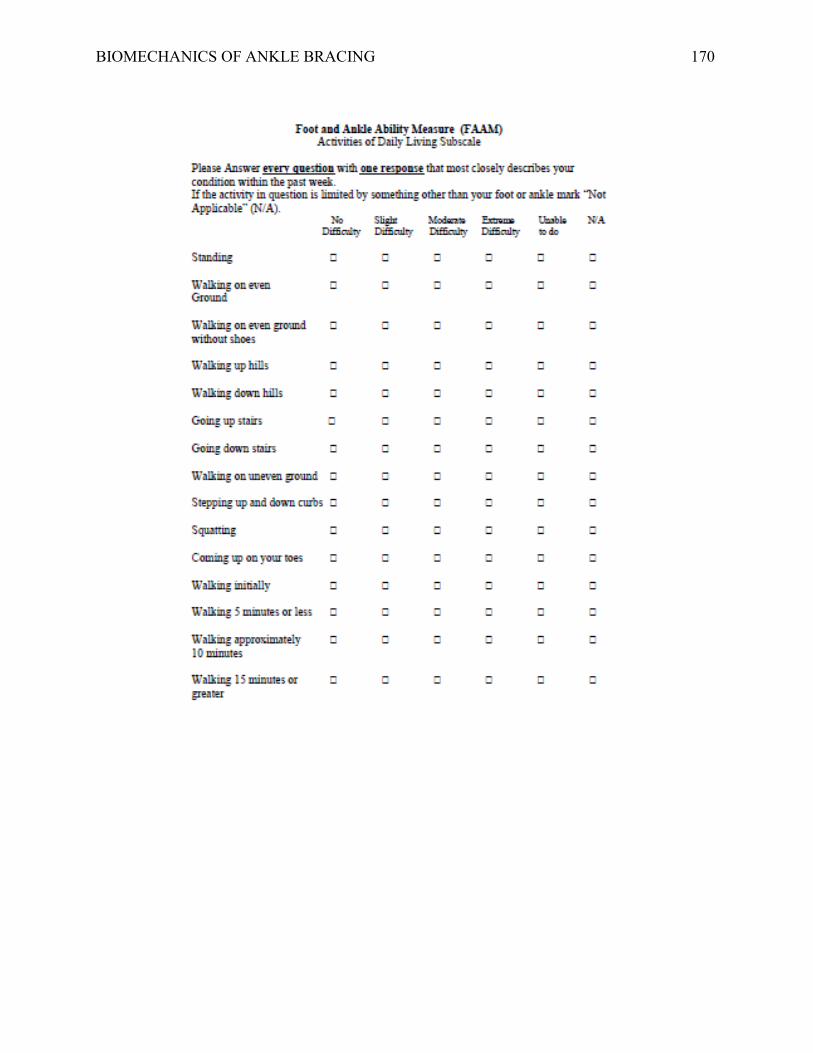
BIOMECHANICS OF ANKLE BRACING 170

BIOMECHANICS OF ANKLE BRACING 171
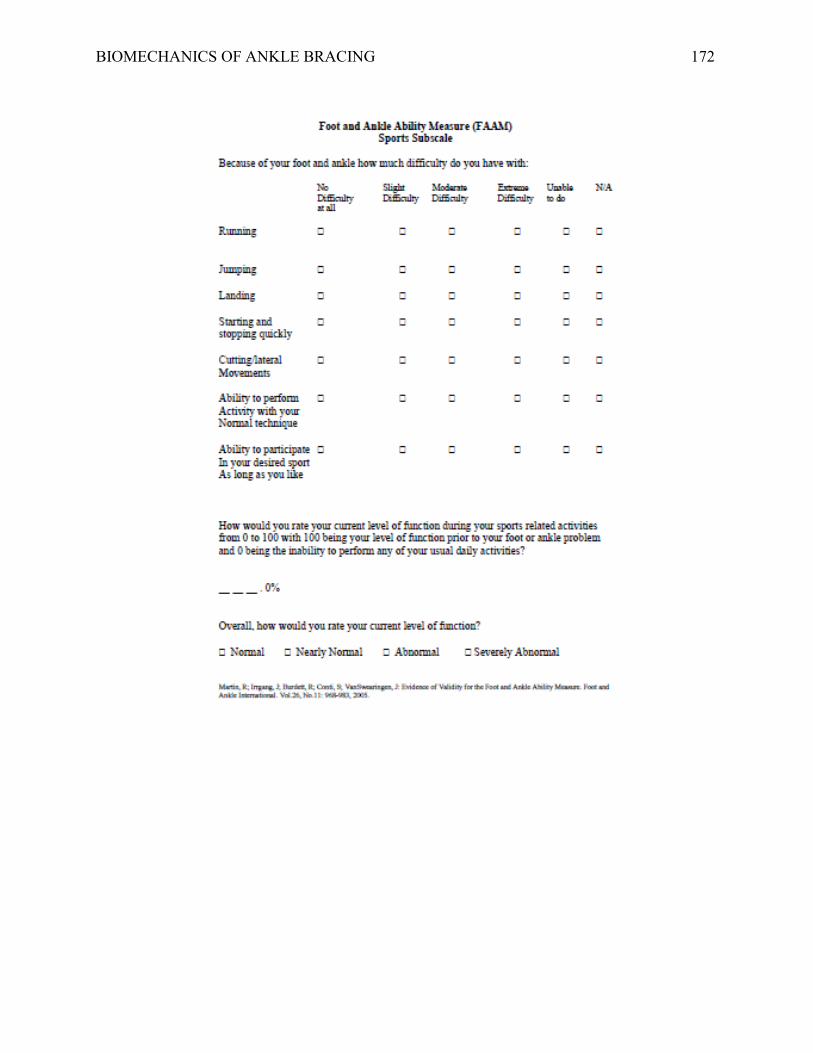
BIOMECHANICS OF ANKLE BRACING 172

BIOMECHANICS OF ANKLE BRACING 173
Appendix F
Background Questionnaire

BIOMECHANICS OF ANKLE BRACING 174
Background Questionnaire
Participant I.D. Sex Age (years) Height (cm) Weight (kg) Dominant foot (L/R)
1) Have you ever taped your ankle(s) or used an ankle brace(s)? If so, what kind and for
how long?
2) What sport or activity would you say you participate in the most?
3) Of the braces you used, what one did you prefer? Why?

BIOMECHANICS OF ANKLE BRACING 175
Appendix G
Vertical Jump Test Diagram and Set-up With Vertec ™ Device
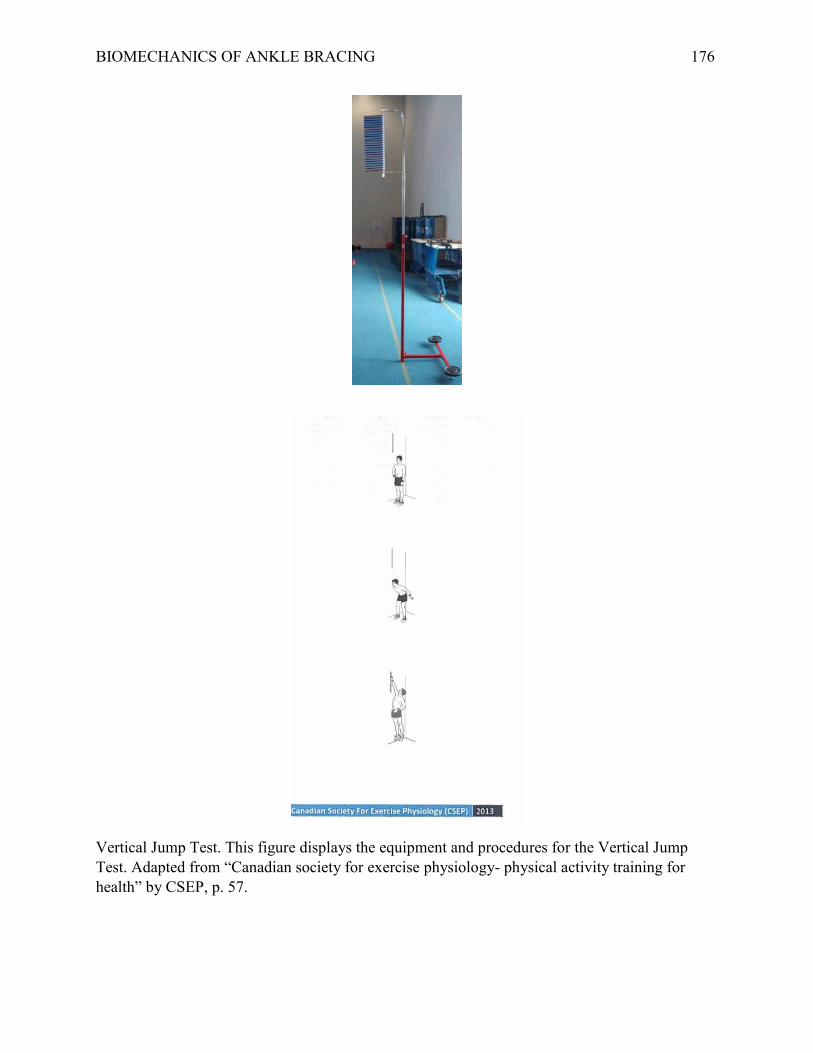
BIOMECHANICS OF ANKLE BRACING 176
Vertical Jump Test. This figure displays the equipment and procedures for the Vertical Jump Test. Adapted from “Canadian society for exercise physiology- physical activity training for health” by CSEP, p. 57.

BIOMECHANICS OF ANKLE BRACING 177
Appendix H
Cutting Task Diagram and Set-up
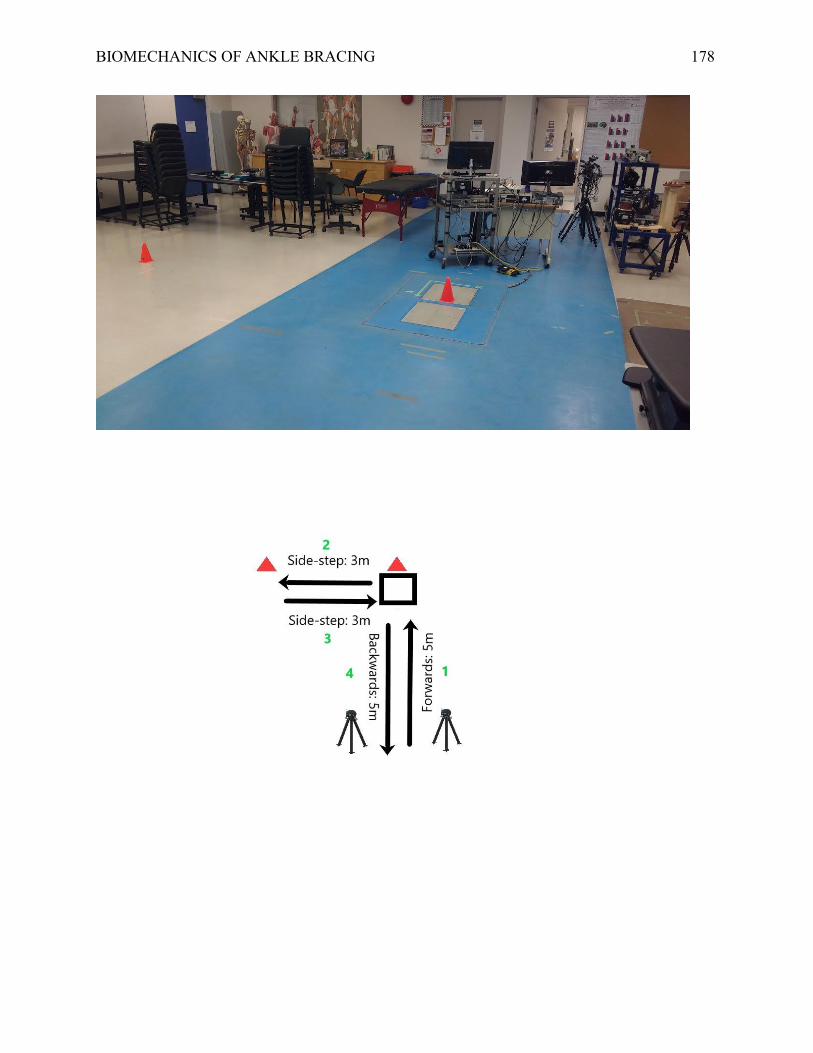
BIOMECHANICS OF ANKLE BRACING 178

BIOMECHANICS OF ANKLE BRACING 179
Appendix I
Borg Rating of Perceived Exertion

BIOMECHANICS OF ANKLE BRACING 180
BORG RPE. This figure visually represents the BORG rating of perceived exertion scale. Adapted from “Perceived Exertion (Borg Rating of Perceived Exertion Scale)” by The Centers for Disease Control and Prevention. Retrieved from https://www.cdc.gov/physicalactivity/basics/measuring/exertion.htm

BIOMECHANICS OF ANKLE BRACING 181
Appendix J
Pilot Study

BIOMECHANICS OF ANKLE BRACING 182
The Biomechanical Effects of Ankle Bracing During
Performance Measures─ A Pilot Study
Zachariah Henderson
Dr. Paolo Sanzo
Lakehead University
KINE-5070
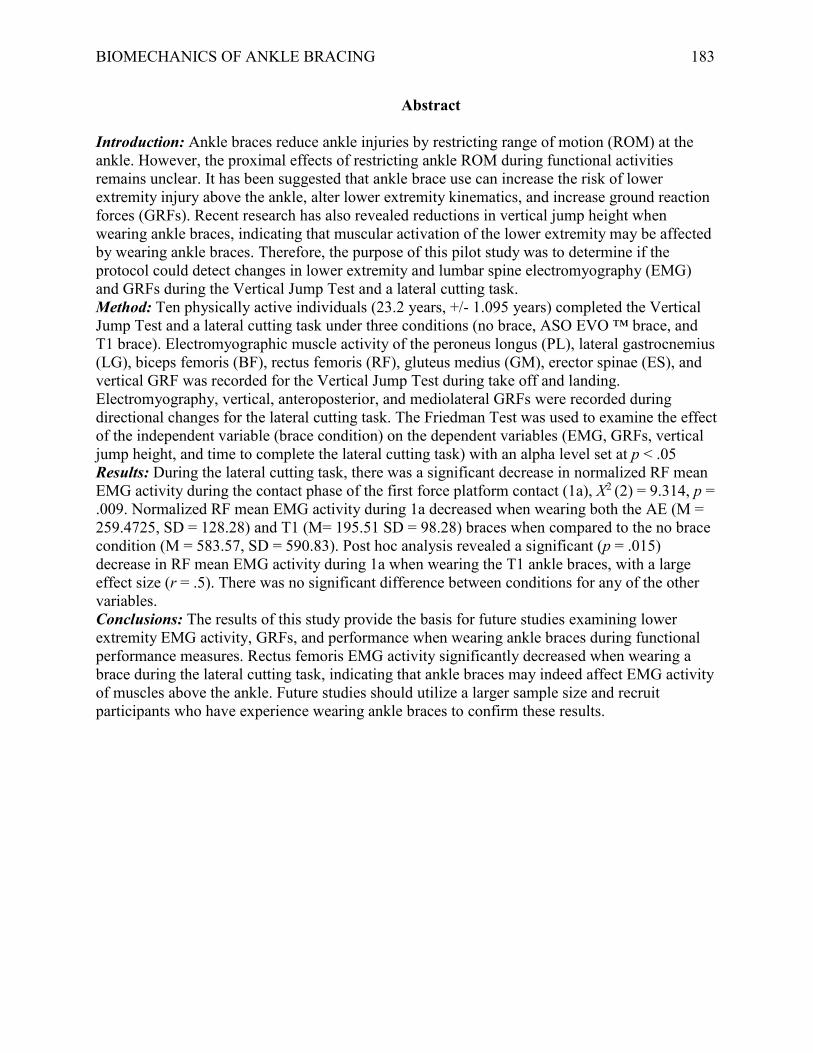
BIOMECHANICS OF ANKLE BRACING 183
Abstract
Introduction: Ankle braces reduce ankle injuries by restricting range of motion (ROM) at the ankle. However, the proximal effects of restricting ankle ROM during functional activities remains unclear. It has been suggested that ankle brace use can increase the risk of lower extremity injury above the ankle, alter lower extremity kinematics, and increase ground reaction forces (GRFs). Recent research has also revealed reductions in vertical jump height when wearing ankle braces, indicating that muscular activation of the lower extremity may be affected by wearing ankle braces. Therefore, the purpose of this pilot study was to determine if the protocol could detect changes in lower extremity and lumbar spine electromyography (EMG) and GRFs during the Vertical Jump Test and a lateral cutting task. Method: Ten physically active individuals (23.2 years, +/- 1.095 years) completed the Vertical Jump Test and a lateral cutting task under three conditions (no brace, ASO EVO ™ brace, and T1 brace). Electromyographic muscle activity of the peroneus longus (PL), lateral gastrocnemius (LG), biceps femoris (BF), rectus femoris (RF), gluteus medius (GM), erector spinae (ES), and vertical GRF was recorded for the Vertical Jump Test during take off and landing. Electromyography, vertical, anteroposterior, and mediolateral GRFs were recorded during directional changes for the lateral cutting task. The Friedman Test was used to examine the effect of the independent variable (brace condition) on the dependent variables (EMG, GRFs, vertical jump height, and time to complete the lateral cutting task) with an alpha level set at p < .05 Results: During the lateral cutting task, there was a significant decrease in normalized RF mean EMG activity during the contact phase of the first force platform contact (1a), X2 (2) = 9.314, p = .009. Normalized RF mean EMG activity during 1a decreased when wearing both the AE (M = 259.4725, SD = 128.28) and T1 (M= 195.51 SD = 98.28) braces when compared to the no brace condition (M = 583.57, SD = 590.83). Post hoc analysis revealed a significant (p = .015) decrease in RF mean EMG activity during 1a when wearing the T1 ankle braces, with a large effect size (r = .5). There was no significant difference between conditions for any of the other variables. Conclusions: The results of this study provide the basis for future studies examining lower extremity EMG activity, GRFs, and performance when wearing ankle braces during functional performance measures. Rectus femoris EMG activity significantly decreased when wearing a brace during the lateral cutting task, indicating that ankle braces may indeed affect EMG activity of muscles above the ankle. Future studies should utilize a larger sample size and recruit participants who have experience wearing ankle braces to confirm these results.
BIOMECHANICS OF ANKLE BRACING 184
Introduction
Sprains of the lateral ankle ligaments represent the most frequently reported injury in the National Collegiate Athletics Association (NCAA; Roos, Kerr, & Mauntel, 2016). Currently, the National Athletic Trainers Association recommends that ankle braces be worn by athletes returning to play from an ankle sprain (Kaminski et al., 2013). Recent systematic reviews by Leppänen, Aaltonen, Parkkari, Heinonen, and Kujala, (2014) and Petersen et al. (2013) of ankle bracing and ankle injury have concluded that, in athletic populations, both softshell and semi-rigid ankle braces can effectively prevent and treat ankle injuries. In a study of ankle brace use and ankle injury prevention in basketball players, however, McGuine et al. (2011) noted an 85% increase in non-ankle injuries of the lower extremity when wearing softshell ankle braces. Furthermore, recent research has revealed decreases in vertical jump height when wearing softshell and semi-rigid ankle braces (Henderson, Sanzo, & Zerpa, 2016; Parsley, Chinn, Lee, Ingersoll, & Hertel, 2013; Smith, Claiborne, & Liberi, 2016). Decreases in agility performance when wearing softshell and semi-rigid ankle braces have also been observed by Ambegaonkar et al. (2011). As such, it has been suggested that further research be done on the effects of ankle braces on lower extremity and lumbar spine biomechanics (McGuine et al., 2011), as well as performance measures (Ambegaonkar et al., 2011). The primary cause of lateral ankle sprains is over-stretching of the lateral ankle ligaments (Ferran & Maffulli, 2006). As such, restricting the range of motion (ROM) of the ankle joint has long been considered the main mechanism by which ankle braces prevent ankle sprains (Verhagen & Bay, 2010). Ankle braces function in different ways to provide ROM restriction at the ankle, depending on the style of ankle brace. Softshell style ankle braces have a lace-up design, and may, or may not, feature heel-lock and horseshoe straps to restrict frontal and sagittal plane motions (Gudibanda & Wang, 2005). Conversely, semi-rigid style ankle braces allow for free motion in the sagittal plane via a hinge that sits underneath the heel. Unlike the softshell ankle brace, a plastic shell is present on the medial and lateral aspect of a semi-rigid ankle brace to restrict eversion and inversion (West, Ng, & Campbell, 2013). In physically active individuals, softshell ankle braces have been shown to effectively restrict plantarflexion and dorsiflexion during jump landing (DiStefano, Padua, Brown, & Guskiewicz, 2008), vertical jump take off (Smith et al., 2016), and agility like cutting tasks (Gudibanda & Wang, 2005). Semi-rigid ankle bracing has also demonstrated the ability to significantly restrict ankle inversion in competitive female basketball players during agility like cutting tasks (Klem, Wild, Williams, & Ng, 2016). While both semi-rigid and softshell ankle braces have been shown to restrict ankle ROM during functional tasks, the kinetic and proximal effects of restricting ankle ROM during jumping and agility like cutting tasks are not well understood. The kinetic variable ground reaction forces (GRFs) represents the force exerted by the ground on a body (Nilsson & Thorstensson, 1989). It has been theorized that if GRFs exceed that which can be dissipated by the musculoskeletal system, injury to the lower extremity may occur (Dufek & Bates, 1990). Larger knee flexion angles (Dufek & Bates, 1990; Wernli, Ng, Phan, Davey, & Grisbrook, 2016), lower extremity extensor and flexor, eccentric and concentric contraction (Devita & Skelly, 1992), and increased dorsiflexion and plantarflexion ROM (Gross & Nelson, 1988) have been attributed to reduced GRFs during jump landings. During the squat, artificial reduction of plantarflexion ROM during the eccentric portion has been shown to result
BIOMECHANICS OF ANKLE BRACING 185
in decreased quadriceps muscle activity and increased soleus muscle activity (Macrum, Bell, Boling, Lewek, & Padua, 2012). As ankle braces are known to restrict dorsiflexion and plantarflexion, a similar reduction in quadriceps muscle activation may be present when wearing ankle braces during other functional tasks. Thus, the ability to attenuate GRFs when wearing ankle braces may be reduced during jump landings and other functional tasks, in addition to potential performance decreases. Despite this, no studies have examined the effects of ankle braces on muscular activation above the ankle during jumping, lateral cutting, or agility tasks. Furthermore, a limited number of studies have investigated the effects of ankle braces on kinetics and lower extremity kinematics during jumping, lateral cutting, and agility tasks. In kinetic and kinematic studies of wearing ankle braces during functional tasks, results have been mixed. Hodgson, Tis, Cobb, and Higbie (2005) examined the effect of semi-rigid ankle braces on lower extremity kinematics and kinetics during a 0.61 metre drop landing in female collegiate volleyball players. No differences were found in knee and hip kinematics when completing the task with or without Active Ankle T2™ semi-rigid ankle braces; however, vertical GRF was significantly greater in the Active Ankle T2™ condition. In comparison, DiStefano et al. (2008) explored the kinematic and kinetic effects of wearing softshell ankle braces in recreational basketball and volleyball players during a 30 centimetre (cm) high broad jump landing. When broad jump distance was standardized to half of the participant’s height, knee flexion angle increased by 3 degrees at ground contact when wearing the AE softshell ankle braces. Ground reaction forces were not affected by wearing the AE ankle braces. Although these studies used different methodologies, it appears that wearing softshell and semi-rigid ankle braces may produce different kinematic and kinetic changes during jump landings. These differences are also present in kinematic and kinetic studies of agility and cutting when wearing softshell and semi-rigid ankle braces. Klem et al. (2016) investigated the kinetic and kinematic effects of semi-rigid and softshell ankle braces in competitive female basketball players when performing a 90 degree cutting maneuver. Anterior shear forces at the knee were significantly increased during the deceleration phase of cutting when wearing the AE ankle brace, compared to the no brace control condition. Alternatively, when wearing the Active Ankle T2™ ankle brace, anterior shear forces were significantly reduced. Furthermore, knee internal rotation was significantly increased when wearing both the AE and Active Ankle T2™ ankle braces. These results contradict that of West et al. (2013) who also included a 90 degree cutting task in their kinetic and kinematic evaluation of semi-rigid ankle braces. In competitive female volleyball players, knee kinematics and GRFs were not significantly altered when wearing the Active Ankle™ T2 ankle brace. Similar to Klem et al. (2016), there was a decrease in lateral shear force at the knee when wearing Active Ankle T2™ ankle braces. Thus, it appears that a semi-rigid ankle brace may be effective in reducing shear forces at the knee during a 90 degree cutting maneuver. The effects on lower extremity kinematics, however, remains unclear.
When performing a vertical jump, several kinematic and kinetic variables have been associated with improved vertical jump height including: segmental angular displacement of the upper leg and trunk (Hsieh & Cheng, 2016), production of mechanical power (Aragón-Vargas & Gross, 1997), ankle angle at take-off (Aragón-Vargas & Gross, 1997), and minimum angle of the hip, knee, and ankle joint (Hsieh & Cheng, 2016). Therefore, potential alteration of lower
BIOMECHANICS OF ANKLE BRACING 186
extremity kinematics and kinetics by an ankle brace could impact vertical jump height by affecting these variables. Smith et al. (2016) investigated the effects of a McDavid 195T softshell ankle brace on Vertec™ measured vertical jump height, lower extremity kinematics, and EMG activity of the soleus and gastrocnemius muscles. In 20 varsity athletes, vertical jump height was reduced by .92 inches (in) when wearing the McDavid 195T ankle brace, representing a significant decrease. A reduction in ankle ROM and soleus muscle activity was also observed. The authors suggested that the reduction in soleus muscle activity was the result of decreased ankle ROM, which contributed to the reduction in vertical jump height. To the author’s knowledge, this is the only study examining the effect of ankle bracing on performance measures that also included the measurement of EMG activity; however, the reduction in vertical jump height is consistently resonated in recent research.
Using a Vertec™ device, Henderson et al. (2016) noted a significant 2.95 cm decrease in
vertical jump height when jumping sport athletes wore T1 semi-rigid ankle braces. A similar, though insignificant reduction in jump height was also observed when wearing AE ankle braces. No differences were observed between the no brace control, AE, or T1 conditions with respect to agility time, as measured by the T-test Agility Test. Parsley et al. (2013) had similar results examining functional performance when wearing a prototype external ankle brace, AE ankle braces, and Aircast Airsport™ semi-rigid ankle braces. In physically active males, vertical jump height was significantly reduced by 1.3-1.8 cm in all brace conditions, compared to the no brace control condition. Agility, as measured by the SEMO agility run, was not significantly affected. From these studies, it appears that vertical jump height is impaired, while agility time is not affected when wearing any type of ankle brace.The research using different ankle braces and methodologies presents conflicting evidence to this conclusion.
Ambegaonkar et al. (2011) investigated the effects of ankle tape, the Swedo-O Ankle
Lok™ softshell ankle bracse, and Aircast Air-Stirrup™ semi-rigid ankle braces on vertical jump height and agility time. In healthy participants, vertical jump height was not affected as measured by the Sargent Jump Test. When wearing the Aircast Air-Stirrup™ ankle braces, however, agility time was increased by an average of .59 seconds during the Right-Boomerang Run Test. These results suggested that agility performance is negatively affected by wearing a semi-rigid ankle brace, whereas vertical jump performance remained unaffected; the opposite findings of Henderson et al. (2016) and Parsley et al. (2013). Furthering this discrepancy, Leonard and Rotay (2014) examined the effects of ankle tape, and generic softshell ankle braces on vertical jump height, power, and agility. As measured with a Vertec™ device, there was no difference in vertical jump height across conditions in athletic and non-athletic individuals. No significant differences were observed between conditions for the vertical jump power test, or for the Illinois Agility Test. As Ambegaonkar et al. and Leonard and Rotay used different ankle brace models compared to other studies, it appeared that the type and model of brace may affect results, furthering the need for research in this area.
Currently, no studies have examined GRFs and EMG activity of the lower extremity and lumbar spine musculature during performance measures, such as vertical jump and lateral cutting when wearing softshell and semi-rigid ankle braces. Given observed changes in the lower extremity kinematics, kinetics, and performance in some studies, EMG of the lower extremity and lumbar spine may be similarly affected when wearing ankle braces. Furthermore, it appears
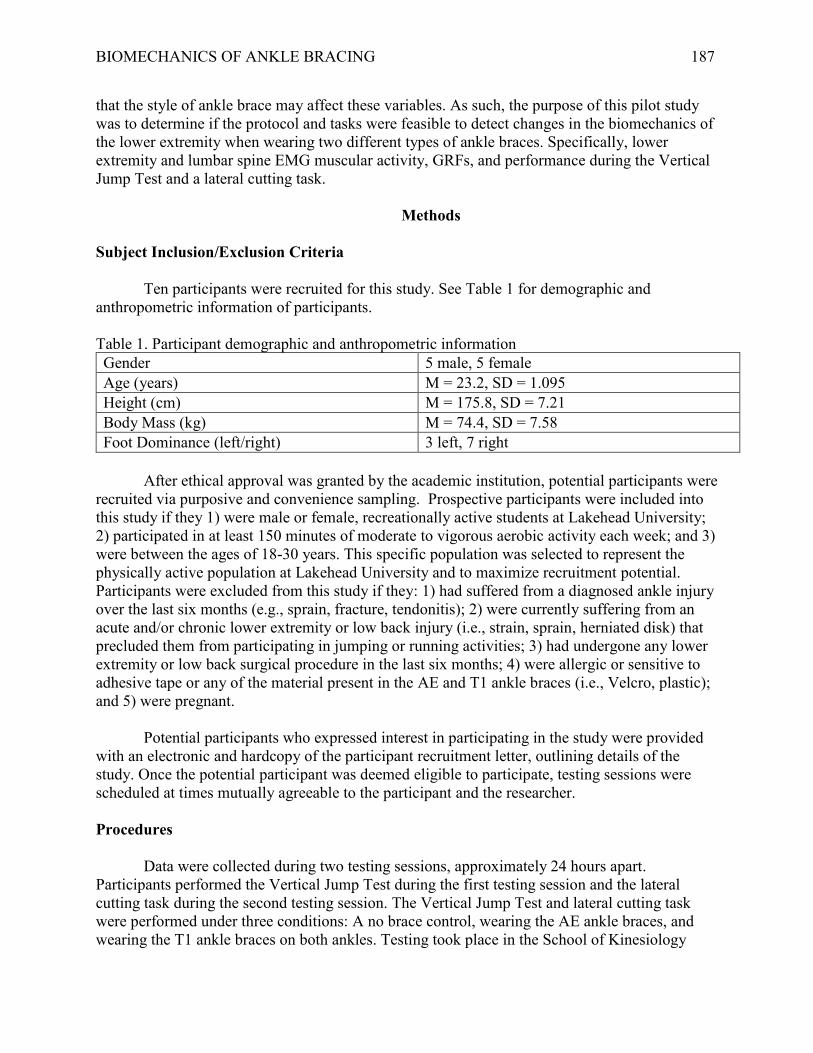
BIOMECHANICS OF ANKLE BRACING 187
that the style of ankle brace may affect these variables. As such, the purpose of this pilot study was to determine if the protocol and tasks were feasible to detect changes in the biomechanics of the lower extremity when wearing two different types of ankle braces. Specifically, lower extremity and lumbar spine EMG muscular activity, GRFs, and performance during the Vertical Jump Test and a lateral cutting task.
Methods
Subject Inclusion/Exclusion Criteria
Ten participants were recruited for this study. See Table 1 for demographic and anthropometric information of participants. Table 1. Participant demographic and anthropometric information Gender 5 male, 5 female Age (years) M = 23.2, SD = 1.095 Height (cm) M = 175.8, SD = 7.21 Body Mass (kg) M = 74.4, SD = 7.58 Foot Dominance (left/right) 3 left, 7 right
After ethical approval was granted by the academic institution, potential participants were
recruited via purposive and convenience sampling. Prospective participants were included into this study if they 1) were male or female, recreationally active students at Lakehead University; 2) participated in at least 150 minutes of moderate to vigorous aerobic activity each week; and 3) were between the ages of 18-30 years. This specific population was selected to represent the physically active population at Lakehead University and to maximize recruitment potential. Participants were excluded from this study if they: 1) had suffered from a diagnosed ankle injury over the last six months (e.g., sprain, fracture, tendonitis); 2) were currently suffering from an acute and/or chronic lower extremity or low back injury (i.e., strain, sprain, herniated disk) that precluded them from participating in jumping or running activities; 3) had undergone any lower extremity or low back surgical procedure in the last six months; 4) were allergic or sensitive to adhesive tape or any of the material present in the AE and T1 ankle braces (i.e., Velcro, plastic); and 5) were pregnant.
Potential participants who expressed interest in participating in the study were provided with an electronic and hardcopy of the participant recruitment letter, outlining details of the study. Once the potential participant was deemed eligible to participate, testing sessions were scheduled at times mutually agreeable to the participant and the researcher. Procedures
Data were collected during two testing sessions, approximately 24 hours apart.
Participants performed the Vertical Jump Test during the first testing session and the lateral cutting task during the second testing session. The Vertical Jump Test and lateral cutting task were performed under three conditions: A no brace control, wearing the AE ankle braces, and wearing the T1 ankle braces on both ankles. Testing took place in the School of Kinesiology

BIOMECHANICS OF ANKLE BRACING 188
Multipurpose Lab at Lakehead University. Participants were asked to wear appropriate clothing and footwear for physical activity. At the first testing session, the researcher provided a verbal overview of the study and answered any questions that the participant had. Once verbal consent was obtained, the participant signed the consent form and filled out a Physical Activity Readiness Questionnaire (PAR-Q) to determine if he/she was fit to exercise. Following written consent and the completion of the PAR-Q, demographic data were recorded including: age (years), height (cm), weight (kg), and foot dominance.
After obtaining written informed consent and recording the demographic information,
participants completed a five minute warmup on a cycle ergometer, at an intensity of 10-12 on the Borg Scale of Perceived Exertion (CSEP, 2013). After the warmup, the wireless electrodes of a Delsys TrignoTM Wireless EMG system were applied to the skin of the dominant leg of the participant, defined as the leg that the participant would kick a ball with. Electrodes were applied in order to collect EMG data from the: peroneus longus (PL), lateral gastrocnemius (LG), biceps femoris (BF), gluteus medius (GM), erector spinae (ES), and rectus femoris (RF) muscles. Electrode location was based on the Surface Electromyography for the Non-Invasive Assessment of Muscle (SENIAM; 2016) guidelines (Figure 1). Before applying the electrodes, the skin underlying the electrode sites were prepared by shaving and cleaning the area with isopropyl alcohol to help improve signal attenuation (Delsys Inc., 2012). Standard adhesive interfaces were used to attach the electrode to the participant’s skin. Following electrode application, participants completed maximal voluntary contractions (MVC) for all corresponding muscles. To perform each MVC, the researcher provided manual resistance while the participant contracted the specified muscle for three seconds.
Figure 1. Electrode location. This figure displays the location for all 6 electrodes. The black lines represent anatomical landmarks. Yellow dots represent electrode locations.
After the MVCs were recorded, the researcher familiarized the participant with the Vertical Jump Test. The Vertical Jump Test was based on the CSEP (2013) guidelines and used to assess vertical jump height. Before beginning the Vertical Jump Test, the participant’s

BIOMECHANICS OF ANKLE BRACING 189
standing reach height was recorded; participants stood erect over an AMTI force platform, perpendicular to a Vertec™ device. The participant then raised his/her arm overhead, touching as high as possible on the Vertec™ device with his/her arm that corresponded with the dominant leg. This height (in) was recorded, and then converted to cm by the researcher. After standing reach was recorded, the participant moved into position to perform his/her practice and recorded jumps.
To perform the Vertical Jump Test, the participant positioned his/her feet approximately
shoulder width apart, with the dominant foot on the force platform. The participant initiated the jump by bending at the hip and knees and lowering into a 45 degree semi-squat position. While descending, the participant moved his/her arms in a counterweight fashion. In this position, the participant’s form was visually evaluated by the researcher; if the participant’s position was not acceptable (45 degrees), the researcher would stop the test. The participant held the 45 degree semi-squat position for two seconds, before jumping and touching the Vertec™ device as high as possible. Participants were required to land evenly on both feet, with the dominant foot on the force platform. If the participant landed off balance, the trial was not recorded.
Submaximal attempts were practiced for participants to become comfortable with the test
procedure and allow the researcher to provide feedback regarding form. Once a participant was familiar with the test, he/she performed the first of three recorded trials. The researcher began collecting EMG and GRF data and notified the participant; after standing still for 3 seconds, the participant performed a maximal effort jump. If all key form components of the jump were met, vertical jump height (in), EMG activity, and GRF data were recorded. The participant then performed the test two more times, each spaced approximately one minute apart to allow for physical recovery.
After completion of the Vertical Jump Test with no ankle braces, participants had a five minute rest period. During this time, the participant applied an AE ankle brace to both ankles. Ankle braces were applied and appropriately sized based on the manufacturer’s guidelines. Participants were allowed to adjust the ankle braces during the testing session, if required, to maintain the manufacturer’s described fit. Ankle braces were applied without modifying the participant’s normal training shoe.
Following the application of the AE ankle braces, the Vertical Jump Test was performed
in the same manner as the control condition. After completion of the Vertical Jump Test with the AE ankle braces, another five-minute rest period was used to allow the participant to remove the AE ankle braces, apply T1 ankle braces, and physically recover from the task. Application of the T1 ankle braces followed the same procedures as the AE ankle braces. After application of the T1 ankle braces, the Vertical Jump Test was performed in the same manner as the previous two conditions. The testing session was concluded after completion of the Vertical Jump Test with the T1 ankle braces.
The second testing session occurred approximately 24 hours after the first testing session.
Testing began in the same manner as the first session. Following the warmup and application of the electrodes, the lateral cutting task was explained to the participant (Figure 3). To perform the lateral cutting task, the participant positioned themselves at the start line, five metres away from

BIOMECHANICS OF ANKLE BRACING 190
the force platform. Here, Brower™ timing gates were set up, which were used to electronically record lateral cutting task time. As with the Vertical Jump Test, participants completed submaximal practice attempts to familiarize his/her self with the lateral cutting task procedure. To begin the lateral cutting task, the participant positioned themselves in an athletic stance position, with his/her dominant limb forward. The researcher began collecting EMG and GRF data and notified the participant; when the participant was ready, he/she initiated the test by crossing the timing gates. The participant ran forwards toward the force platform; a cone was positioned directly in front of the force platform for the participant to touch. The participant touched the cone, simultaneously planting the dominant foot on the force platform. Immediately after touching the cone, the participant side shuffled to his/her left or right, based on the planting foot, for three metres towards another cone. The participant touched this cone and then side shuffled back to the first cone. After touching the first cone and landing on the force plate for the second time, the participant then backpedaled towards the starting line. Participants cut the same direction for all trials. The test concluded once the participant crossed the timing gate at the starting line.
Figure 3. Lateral cutting task. This figure displays the set up for the lateral cutting task.
Ground reaction forces, EMG activity, and time to complete the lateral cutting task was recorded if the participant successfully touched the force platform twice and completed the test in its entirety. After the completion of three recorded trials with no brace, the testing session mirrored that of the first testing session; participants completed the lateral cutting task when wearing the AE and T1 ankle braces. The testing session was completed after the lateral cutting task had been performed under all three conditions. Data Processing
Force platform and EMG data were collected simultaneously using PowerLab (16/30) hardware, Delsys Trigno™ Wireless EMG system, Delsys EMG Works™ software, and LabChart™ data acquisition software. An interface board was used to time synchronize force platform and EMG data. LabChart software was used to analyze EMG and GRF data. Raw EMG

BIOMECHANICS OF ANKLE BRACING 191
was rectified and filtered using a lowpass filter (12 Hz). Mean EMG activity for each muscle, measured in volts (V), was calculated and expressed as a percentage of MVC. Maximum GRFs, measured in newtons (N), were calculated and expressed as a percentage of bodyweight. Vertical jump. For the purposes of EMG and GRF analysis, the Vertical Jump Test was divided into two phases; take off and landing. The take off phase was defined as the time at which vertical GRF began to increase (greater than 5 N) from the stationary system weight, to the time that system weight equaled 0 (+/- 5 N). The landing phase was defined as the time at which system weight increased from zero (greater than 5N) to the time that system weight returned to stationary level (+/- 5 N; see Figure 4).
Figure 4. Vertical jump phases. This figure illustrates the take-off and landing phase of the Vertical Jump Test, based on vertical GRF. Lateral cutting task. For the purposes of EMG and GRF analysis, the lateral cutting task was divided into two phases, based on two different force platform contacts. The first contact with the force platform involved deceleration in the sagittal plane, followed by lateral movement in the frontal plane. The deceleration phase (1a) of the first platform contact was defined as the time at which anteroposterior GRF began to increase (greater than 5 N) from 0 N to the time at which maximum anteroposterior GRF was reached (Houck, 2003). The propulsive phase (1b) was defined as the time between maximum anteroposterior GRF and a reading of 0 N (+/- 5 N) (Figure 5). The second force platform contact involved decelerating in the frontal plane, followed by backward movement in the sagittal plane. The deceleration phase (2a) for the second force platform contact was defined as the time at which mediolateral GRF began to increase (greater than 5 N) from 0 N to the time at which maximum mediolateral GRF was reached. The propulsive phase (2b) was defined as the time between maximum mediolateral GRF and a reading of 0 N (+/- 5 N; see Figure 6).

BIOMECHANICS OF ANKLE BRACING 192
Figure 5. Lateral cutting task first contact anteroposterior GRF. This figure illustrates the deceleration phase (1a) and propulsive phase (1b) of the first contact with the force platform, based on anteroposterior GRF.
Figure 6. Lateral cutting task second Contact Mediolateral GRF. This figure illustrates the deceleration phase (2a) and propulsive phase (2b) of the second contact with the force platform, based on mediolateral GRF.
Statistical Analysis
Statistical analysis was performed using Statistical Package for the Social Sciences (SPSS) 24. Dependant variable values were averaged from the three trials for each participant. The Friedman Test was conducted to see if the independent variable (no brace, AE, and T1) affected each dependant variable. Alpha level was set at p < .05. Post hoc analysis was performed using a Wilcoxon signed-rank test. A Bonferroni correction was applied to each pairwise comparison, resulting in a significance level of p = .017. Effect size was calculated by dividing the Z value by the square root of the number of observations (n = 30). One participant’s lateral cutting task RF EMG data were excluded from the analysis due to equipment malfunction.

BIOMECHANICS OF ANKLE BRACING 193
Results Descriptive Statistics
Descriptive statistics for performance measures are listed in Table 2. Descriptive statistics for EMG and GRF variables during the Vertical Jump Test are listed in Tables 3 and 4. Descriptive statistics for EMG and GRF variables during the lateral cutting task are listed in Tables 5-8. Table 2 Performance Measures Descriptive Statistics
BRACE TYPE NO BRACE ASO EVO AAT1 MEAN SD MEAN SD MEAN SD
VERTICAL JUMP HEIGHT (cm) 265.19 17.19 264.51 16.19 263.32 16.75 CUTTING TASK TIME (sec) 6.49 0.69 6.38 0.72 6.36 0.75
*Significant difference between conditions (p<.05). Table 3 Vertical Jump Take Off Descriptive Statistics
BRACE TYPE NO BRACE ASO EVO AAT1 MEAN SD MEAN SD MEAN SD
NORMALIZED PERONEUS LONGUS MEAN EMG 178.93 283.34 172.47 119.27 173.27 115.16 NORMALIZED L. GASTROCNEMIUS MEAN EMG 209.86 102.81 191.76* 92.26 201.62 94.90 NORMALIZED BICEPS FEMORIS MEAN EMG 53.66 23.76 53.87 21.76 73.38 92.18 NORMALIZED GLUTEUS MEDIUS MEAN EMG 161.32 98.65 142.97 69.96 134.97 52.65 NORMALIZED ERECTOR SPINAE MEAN EMG 256.10 283.34 163.29 119.27 180.09 115.16 NORMALIZED RECTUS FEMORIS MEAN EMG 458.53 220.10 414.08 173.95 410.77 185.23 NORMALIZED MAXIMUM VERTICAL GRF 112.46 9.17 111.22 9.81 111.44 11.38
All EMG values are expressed as a percentage of MVC. All GRF values are expressed as a percentage of bodyweight. *Significant difference between conditions (p<.05). Table 4 Vertical Jump Landing Descriptive Statistics
BRACE TYPE NO BRACE ASO AAT1 MEAN SD MEAN SD MEAN SD
NORMALIZED PERONEUS LONGUS MEAN EMG 223.00 185.56 165.99 80.98 195.25 147.66 NORMALIZED L. GASTROCNEMIUS MEAN EMG 167.54 79.86 195.57 122.32 171.39 92.75 NORMALIZED BICEPS FEMORIS MEAN EMG 54.30 29.40 55.19 30.85 45.96 22.31 NORMALIZED GLUTEUS MEDIUS MEAN EMG 203.85 47.63 67.59 35.39 66.09 36.80 NORMALIZED ERECTOR SPINAE MEAN EMG 122.12 112.44 124.92 180.68 136.65 190.11 NORMALIZED RECTUS FEMORIS MEAN EMG 405.72 274.64 277.71 156.49 318.21 203.85 NORMALIZED MAXIMUM VERTICAL GRF 154.11 33.05 153.89 23.93 163.23 24.68
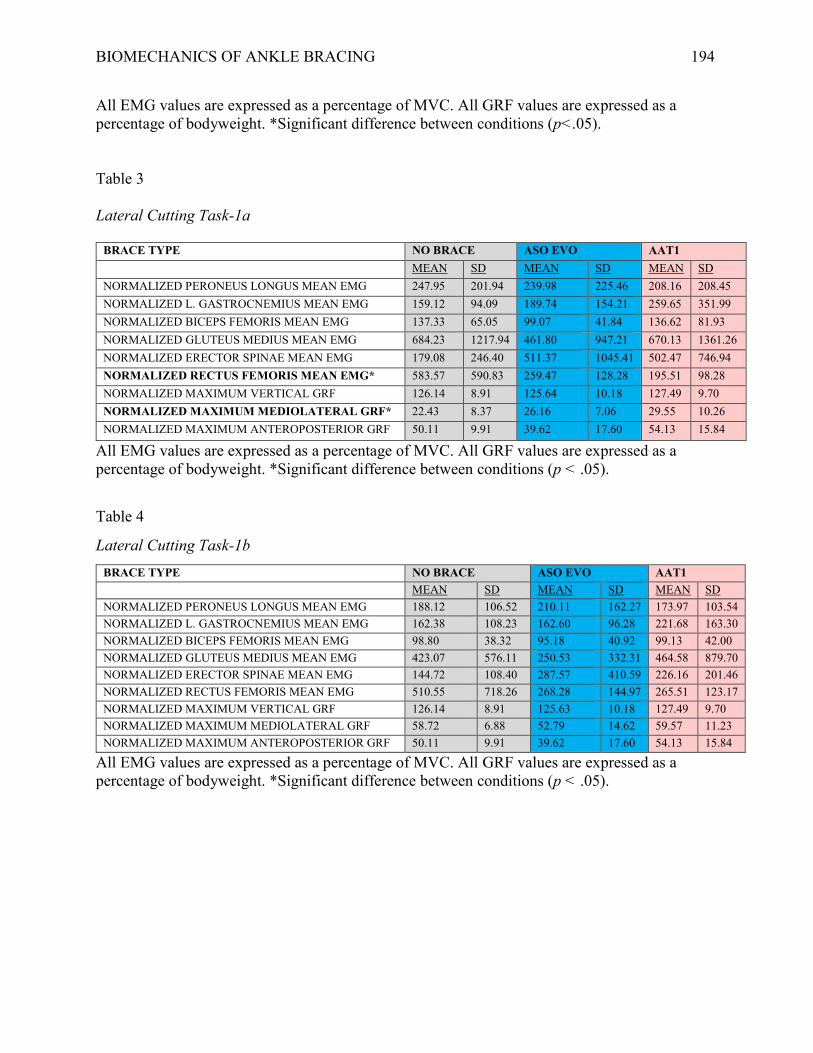
BIOMECHANICS OF ANKLE BRACING 194
All EMG values are expressed as a percentage of MVC. All GRF values are expressed as a percentage of bodyweight. *Significant difference between conditions (p<.05). Table 3 Lateral Cutting Task-1a
BRACE TYPE NO BRACE ASO EVO AAT1 MEAN SD MEAN SD MEAN SD
NORMALIZED PERONEUS LONGUS MEAN EMG 247.95 201.94 239.98 225.46 208.16 208.45 NORMALIZED L. GASTROCNEMIUS MEAN EMG 159.12 94.09 189.74 154.21 259.65 351.99 NORMALIZED BICEPS FEMORIS MEAN EMG 137.33 65.05 99.07 41.84 136.62 81.93 NORMALIZED GLUTEUS MEDIUS MEAN EMG 684.23 1217.94 461.80 947.21 670.13 1361.26 NORMALIZED ERECTOR SPINAE MEAN EMG 179.08 246.40 511.37 1045.41 502.47 746.94 NORMALIZED RECTUS FEMORIS MEAN EMG* 583.57 590.83 259.47 128.28 195.51 98.28 NORMALIZED MAXIMUM VERTICAL GRF 126.14 8.91 125.64 10.18 127.49 9.70 NORMALIZED MAXIMUM MEDIOLATERAL GRF* 22.43 8.37 26.16 7.06 29.55 10.26 NORMALIZED MAXIMUM ANTEROPOSTERIOR GRF 50.11 9.91 39.62 17.60 54.13 15.84
All EMG values are expressed as a percentage of MVC. All GRF values are expressed as a percentage of bodyweight. *Significant difference between conditions (p < .05).
Table 4
Lateral Cutting Task-1b BRACE TYPE NO BRACE ASO EVO AAT1
MEAN SD MEAN SD MEAN SD NORMALIZED PERONEUS LONGUS MEAN EMG 188.12 106.52 210.11 162.27 173.97 103.54 NORMALIZED L. GASTROCNEMIUS MEAN EMG 162.38 108.23 162.60 96.28 221.68 163.30 NORMALIZED BICEPS FEMORIS MEAN EMG 98.80 38.32 95.18 40.92 99.13 42.00 NORMALIZED GLUTEUS MEDIUS MEAN EMG 423.07 576.11 250.53 332.31 464.58 879.70 NORMALIZED ERECTOR SPINAE MEAN EMG 144.72 108.40 287.57 410.59 226.16 201.46 NORMALIZED RECTUS FEMORIS MEAN EMG 510.55 718.26 268.28 144.97 265.51 123.17 NORMALIZED MAXIMUM VERTICAL GRF 126.14 8.91 125.63 10.18 127.49 9.70 NORMALIZED MAXIMUM MEDIOLATERAL GRF 58.72 6.88 52.79 14.62 59.57 11.23 NORMALIZED MAXIMUM ANTEROPOSTERIOR GRF 50.11 9.91 39.62 17.60 54.13 15.84
All EMG values are expressed as a percentage of MVC. All GRF values are expressed as a percentage of bodyweight. *Significant difference between conditions (p < .05).
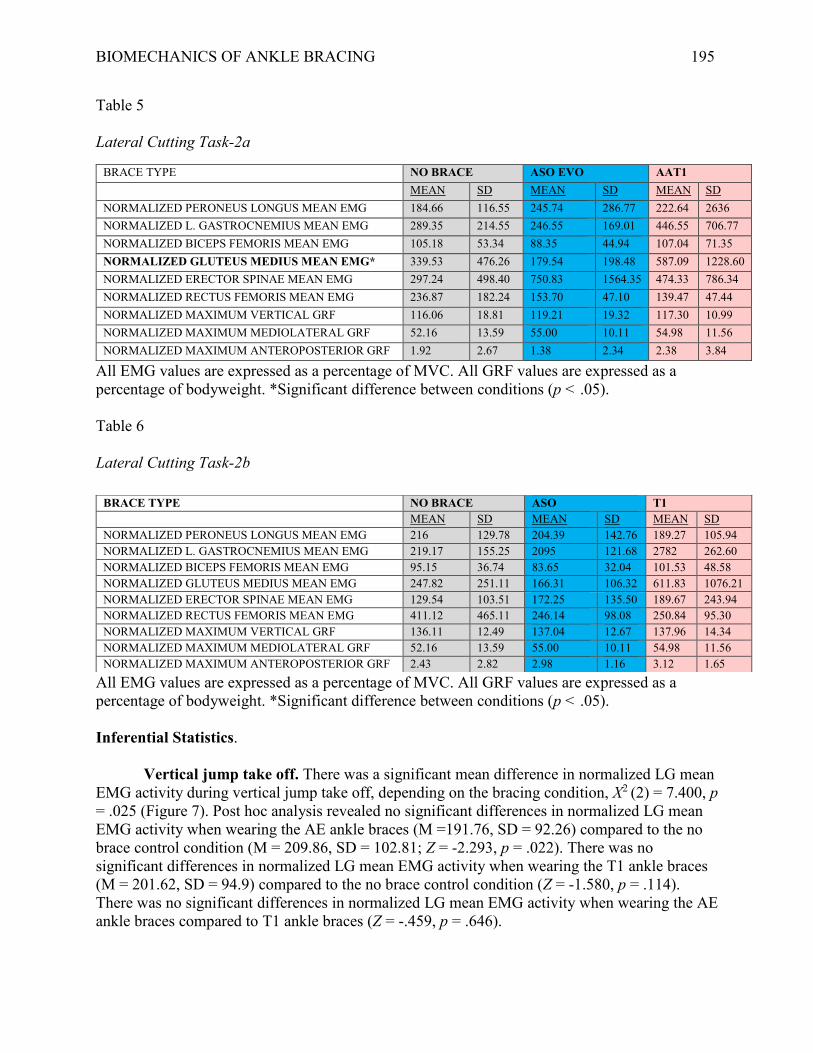
BIOMECHANICS OF ANKLE BRACING 195
Table 5 Lateral Cutting Task-2a
BRACE TYPE NO BRACE ASO EVO AAT1 MEAN SD MEAN SD MEAN SD
NORMALIZED PERONEUS LONGUS MEAN EMG 184.66 116.55 245.74 286.77 222.64 2636 NORMALIZED L. GASTROCNEMIUS MEAN EMG 289.35 214.55 246.55 169.01 446.55 706.77 NORMALIZED BICEPS FEMORIS MEAN EMG 105.18 53.34 88.35 44.94 107.04 71.35 NORMALIZED GLUTEUS MEDIUS MEAN EMG* 339.53 476.26 179.54 198.48 587.09 1228.60 NORMALIZED ERECTOR SPINAE MEAN EMG 297.24 498.40 750.83 1564.35 474.33 786.34 NORMALIZED RECTUS FEMORIS MEAN EMG 236.87 182.24 153.70 47.10 139.47 47.44 NORMALIZED MAXIMUM VERTICAL GRF 116.06 18.81 119.21 19.32 117.30 10.99 NORMALIZED MAXIMUM MEDIOLATERAL GRF 52.16 13.59 55.00 10.11 54.98 11.56 NORMALIZED MAXIMUM ANTEROPOSTERIOR GRF 1.92 2.67 1.38 2.34 2.38 3.84
All EMG values are expressed as a percentage of MVC. All GRF values are expressed as a percentage of bodyweight. *Significant difference between conditions (p < .05). Table 6 Lateral Cutting Task-2b
All EMG values are expressed as a percentage of MVC. All GRF values are expressed as a percentage of bodyweight. *Significant difference between conditions (p < .05). Inferential Statistics.
Vertical jump take off. There was a significant mean difference in normalized LG mean EMG activity during vertical jump take off, depending on the bracing condition, X2 (2) = 7.400, p = .025 (Figure 7). Post hoc analysis revealed no significant differences in normalized LG mean EMG activity when wearing the AE ankle braces (M =191.76, SD = 92.26) compared to the no brace control condition (M = 209.86, SD = 102.81; Z = -2.293, p = .022). There was no significant differences in normalized LG mean EMG activity when wearing the T1 ankle braces (M = 201.62, SD = 94.9) compared to the no brace control condition (Z = -1.580, p = .114). There was no significant differences in normalized LG mean EMG activity when wearing the AE ankle braces compared to T1 ankle braces (Z = -.459, p = .646).
BRACE TYPE NO BRACE ASO T1 MEAN SD MEAN SD MEAN SD
NORMALIZED PERONEUS LONGUS MEAN EMG 216 129.78 204.39 142.76 189.27 105.94 NORMALIZED L. GASTROCNEMIUS MEAN EMG 219.17 155.25 2095 121.68 2782 262.60 NORMALIZED BICEPS FEMORIS MEAN EMG 95.15 36.74 83.65 32.04 101.53 48.58 NORMALIZED GLUTEUS MEDIUS MEAN EMG 247.82 251.11 166.31 106.32 611.83 1076.21 NORMALIZED ERECTOR SPINAE MEAN EMG 129.54 103.51 172.25 135.50 189.67 243.94 NORMALIZED RECTUS FEMORIS MEAN EMG 411.12 465.11 246.14 98.08 250.84 95.30 NORMALIZED MAXIMUM VERTICAL GRF 136.11 12.49 137.04 12.67 137.96 14.34 NORMALIZED MAXIMUM MEDIOLATERAL GRF 52.16 13.59 55.00 10.11 54.98 11.56 NORMALIZED MAXIMUM ANTEROPOSTERIOR GRF 2.43 2.82 2.98 1.16 3.12 1.65
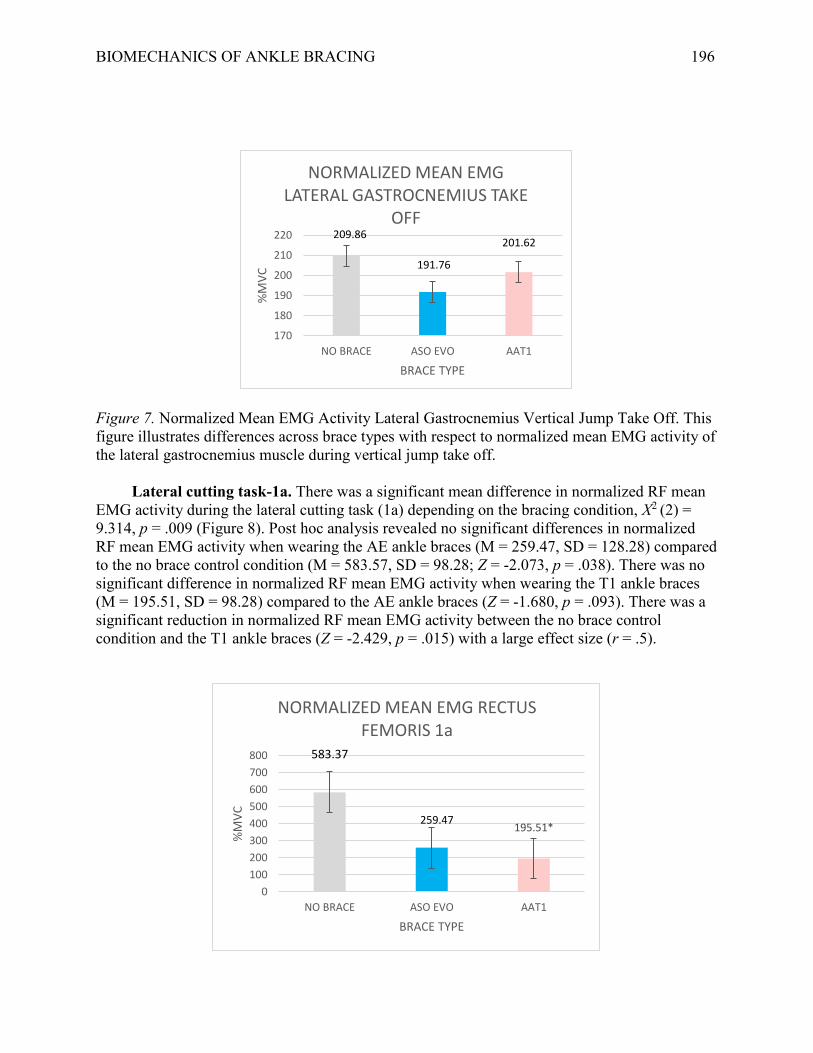
BIOMECHANICS OF ANKLE BRACING 196
Figure 7. Normalized Mean EMG Activity Lateral Gastrocnemius Vertical Jump Take Off. This figure illustrates differences across brace types with respect to normalized mean EMG activity of the lateral gastrocnemius muscle during vertical jump take off. Lateral cutting task-1a. There was a significant mean difference in normalized RF mean EMG activity during the lateral cutting task (1a) depending on the bracing condition, X2 (2) = 9.314, p = .009 (Figure 8). Post hoc analysis revealed no significant differences in normalized RF mean EMG activity when wearing the AE ankle braces (M = 259.47, SD = 128.28) compared to the no brace control condition (M = 583.57, SD = 98.28; Z = -2.073, p = .038). There was no significant difference in normalized RF mean EMG activity when wearing the T1 ankle braces (M = 195.51, SD = 98.28) compared to the AE ankle braces (Z = -1.680, p = .093). There was a significant reduction in normalized RF mean EMG activity between the no brace control condition and the T1 ankle braces (Z = -2.429, p = .015) with a large effect size (r = .5).
209.86
191.76
201.62
170
180
190
200
210
220
NO BRACE ASO EVO AAT1
%M
VC
BRACE TYPE
NORMALIZED MEAN EMG LATERAL GASTROCNEMIUS TAKE
OFF
583.37
259.47195.51*
0
100
200
300
400
500
600
700
800
NO BRACE ASO EVO AAT1
%M
VC
BRACE TYPE
NORMALIZED MEAN EMG RECTUS FEMORIS 1a
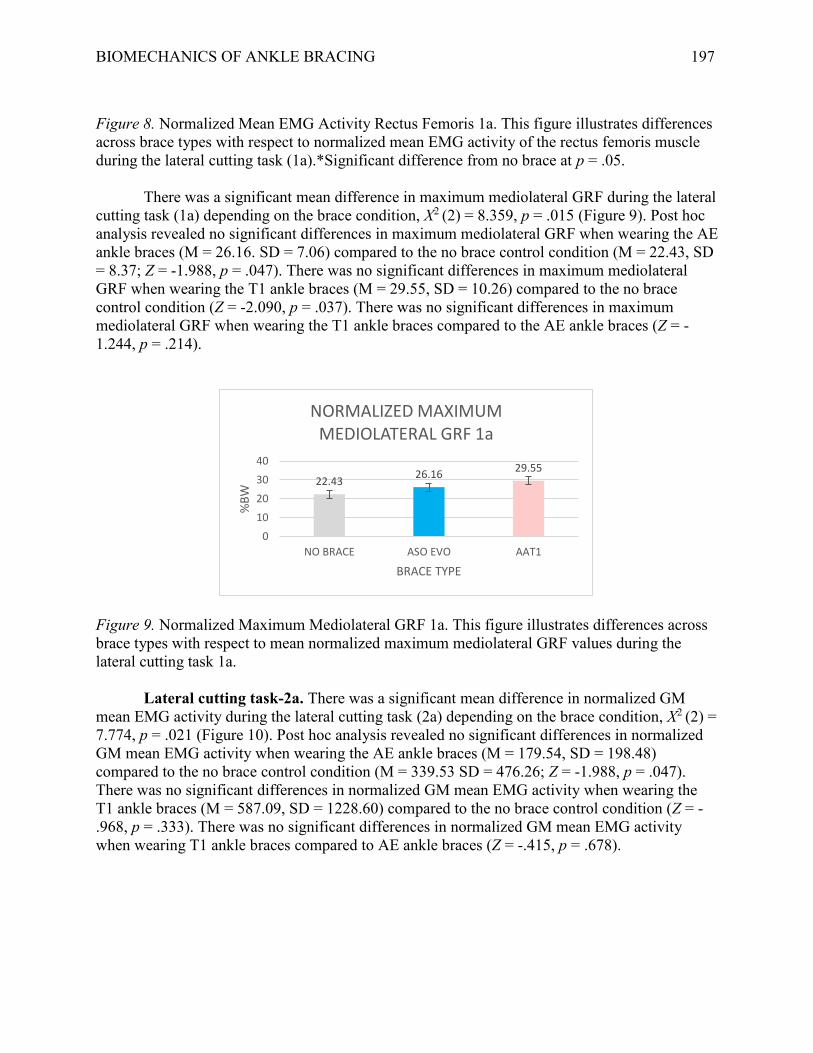
BIOMECHANICS OF ANKLE BRACING 197
Figure 8. Normalized Mean EMG Activity Rectus Femoris 1a. This figure illustrates differences across brace types with respect to normalized mean EMG activity of the rectus femoris muscle during the lateral cutting task (1a).*Significant difference from no brace at p = .05.
There was a significant mean difference in maximum mediolateral GRF during the lateral cutting task (1a) depending on the brace condition, X2 (2) = 8.359, p = .015 (Figure 9). Post hoc analysis revealed no significant differences in maximum mediolateral GRF when wearing the AE ankle braces (M = 26.16. SD = 7.06) compared to the no brace control condition (M = 22.43, SD = 8.37; Z = -1.988, p = .047). There was no significant differences in maximum mediolateral GRF when wearing the T1 ankle braces (M = 29.55, SD = 10.26) compared to the no brace control condition (Z = -2.090, p = .037). There was no significant differences in maximum mediolateral GRF when wearing the T1 ankle braces compared to the AE ankle braces (Z = -1.244, p = .214).
Figure 9. Normalized Maximum Mediolateral GRF 1a. This figure illustrates differences across brace types with respect to mean normalized maximum mediolateral GRF values during the lateral cutting task 1a.
Lateral cutting task-2a. There was a significant mean difference in normalized GM mean EMG activity during the lateral cutting task (2a) depending on the brace condition, X2 (2) = 7.774, p = .021 (Figure 10). Post hoc analysis revealed no significant differences in normalized GM mean EMG activity when wearing the AE ankle braces (M = 179.54, SD = 198.48) compared to the no brace control condition (M = 339.53 SD = 476.26; Z = -1.988, p = .047). There was no significant differences in normalized GM mean EMG activity when wearing the T1 ankle braces (M = 587.09, SD = 1228.60) compared to the no brace control condition (Z = -.968, p = .333). There was no significant differences in normalized GM mean EMG activity when wearing T1 ankle braces compared to AE ankle braces (Z = -.415, p = .678).
22.4326.16
29.55
0
10
20
30
40
NO BRACE ASO EVO AAT1
%B
W
BRACE TYPE
NORMALIZED MAXIMUM MEDIOLATERAL GRF 1a
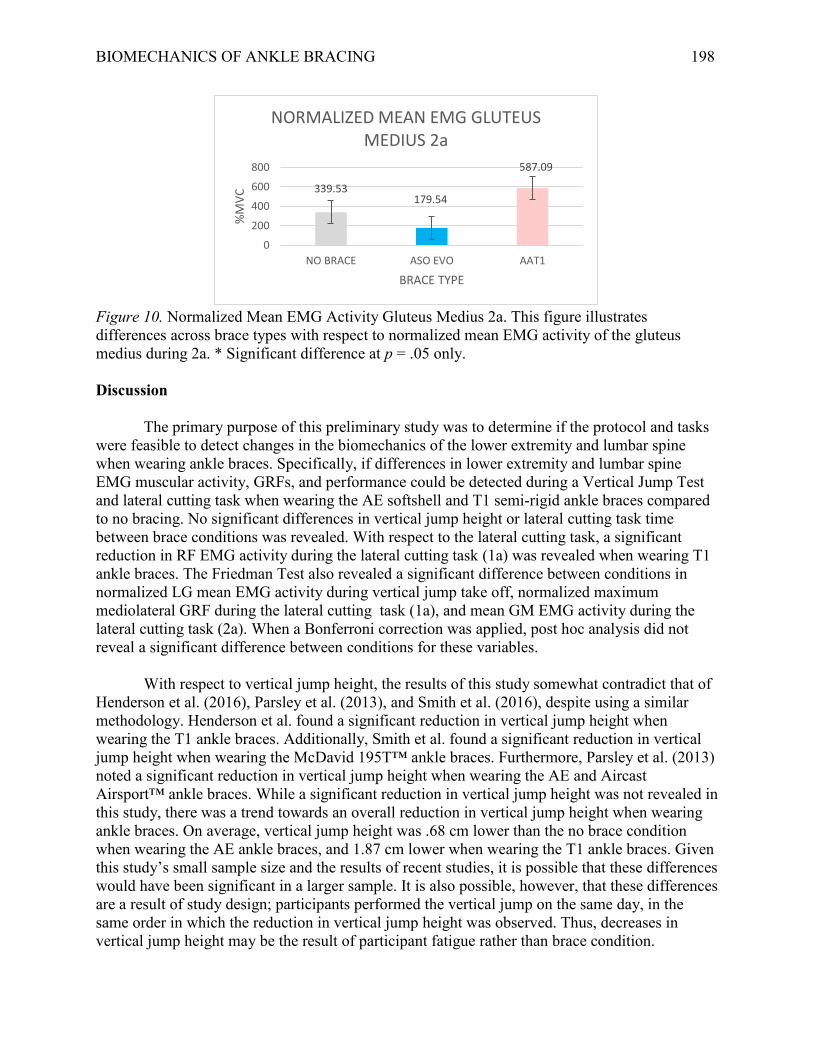
BIOMECHANICS OF ANKLE BRACING 198
Figure 10. Normalized Mean EMG Activity Gluteus Medius 2a. This figure illustrates differences across brace types with respect to normalized mean EMG activity of the gluteus medius during 2a. * Significant difference at p = .05 only. Discussion
The primary purpose of this preliminary study was to determine if the protocol and tasks were feasible to detect changes in the biomechanics of the lower extremity and lumbar spine when wearing ankle braces. Specifically, if differences in lower extremity and lumbar spine EMG muscular activity, GRFs, and performance could be detected during a Vertical Jump Test and lateral cutting task when wearing the AE softshell and T1 semi-rigid ankle braces compared to no bracing. No significant differences in vertical jump height or lateral cutting task time between brace conditions was revealed. With respect to the lateral cutting task, a significant reduction in RF EMG activity during the lateral cutting task (1a) was revealed when wearing T1 ankle braces. The Friedman Test also revealed a significant difference between conditions in normalized LG mean EMG activity during vertical jump take off, normalized maximum mediolateral GRF during the lateral cutting task (1a), and mean GM EMG activity during the lateral cutting task (2a). When a Bonferroni correction was applied, post hoc analysis did not reveal a significant difference between conditions for these variables. With respect to vertical jump height, the results of this study somewhat contradict that of Henderson et al. (2016), Parsley et al. (2013), and Smith et al. (2016), despite using a similar methodology. Henderson et al. found a significant reduction in vertical jump height when wearing the T1 ankle braces. Additionally, Smith et al. found a significant reduction in vertical jump height when wearing the McDavid 195T™ ankle braces. Furthermore, Parsley et al. (2013) noted a significant reduction in vertical jump height when wearing the AE and Aircast Airsport™ ankle braces. While a significant reduction in vertical jump height was not revealed in this study, there was a trend towards an overall reduction in vertical jump height when wearing ankle braces. On average, vertical jump height was .68 cm lower than the no brace condition when wearing the AE ankle braces, and 1.87 cm lower when wearing the T1 ankle braces. Given this study’s small sample size and the results of recent studies, it is possible that these differences would have been significant in a larger sample. It is also possible, however, that these differences are a result of study design; participants performed the vertical jump on the same day, in the same order in which the reduction in vertical jump height was observed. Thus, decreases in vertical jump height may be the result of participant fatigue rather than brace condition.
339.53179.54
587.09
0
200
400
600
800
NO BRACE ASO EVO AAT1
%M
VC
BRACE TYPE
NORMALIZED MEAN EMG GLUTEUS MEDIUS 2a

BIOMECHANICS OF ANKLE BRACING 199
The observed decrease in LG EMG activity when wearing the AE ankle braces is somewhat in line with previous research. Smith et al. (2016) observed a significant decrease in soleus EMG activity during a vertical jump when wearing the McDavid 195T™ ankle braces. Additionally, a decrease that approached significance (p = .06) was observed in the gastrocnemius muscle EMG activity. As such, the reduction in LG EMG activity during take off observed in this study is not surprising. While not the same muscle, both the gastrocnemius and soleus insert on the calcaneus and contribute to plantarflexion of the foot (Tortora & Nielson, 2010). Therefore, the reduction in dorsiflexion and plantarflexion ROM by an ankle brace (DiStefano et al., 2008; Gudibanda & Wang, 2005) is the likely cause of reduced plantarflexor EMG activity (Smith et al., 2016). Furthermore, Smith et al. (2016) suggested that this reduction in ankle ROM and soleus activity contributed to the decreased vertical jump height; however, a significant reduction in vertical jump height was not observed in this study.
Smith et al. (2016) suggested that the reduced ankle ROM and soleus muscle EMG activity resulted in the reduction in vertical jump height observed in their study. Although an important factor, ankle angle at take off only accounts for 21% of the variance in the vertical jump performance (Aragón-Vargas & Gross, 1997). In comparison, models that included hip power, hip torque, and knee extension strength accounted for up to 60% of the explained variance in vertical jump performance (Aragón-Vargas & Gross, 1997). During vertical jumping, the RF muscle is responsible for both knee extension and hip flexion (Jacobs, Bobbert, & van Ingen Schenau, 1996; Tortora & Nielson, 2010). Though not significant, a decrease of 44.5% and 47.47% in RF EMG activity during the Vertical Jump Test take off was recorded in this study when wearing AE and T1 ankle braces, respectively. Because EMG muscular activity has been linearly associated with force production (Onishi et al., 2000), a reduction in RF EMG activity may indicate a reduction in knee extension force and hip power, resulting in a decreased vertical jump height. To a degree, this was the case in this study.
No difference in time to complete the lateral cutting task was observed between conditions. The lateral cutting task was unique to this study, therefore, it is difficult to make direct comparison to studies that have used timed agility tests. The results are in line with Henderson et al. (2016) who used the T-test Agility Test, in which the lateral cutting task in this study is partially based on. Interestingly, there was a relatively large reduction in RF EMG muscular activity during the lateral cutting task (1a) when wearing the ASO EVO ™ ankle braces. Furthermore, a significant reduction in RF EMG activity was revealed when wearing the T1 ankle braces. The reduction of RF EMG activity when ankle ROM is restricted during an eccentric movement is comparable to the findings reported by Macrum et al. (2012). Vastus medialis and vastus lateralis muscles EMG activity decreased during the squat when ankle plantarflexion was artificially restricted. Thus, it appears that altering kinematics at the ankle during functional tasks can affect EMG activity above the ankle, specifically in the quadriceps muscles. As this study did not examine kinematic variables, it is unknown if the reduction in RF EMG activity when wearing the ankle braces is due to altered knee and/or hip kinematics, or some other mechanism.
Maximum vertical GRF during the Vertical Jump Test was not significantly affected in this study by wearing the AE ankle braces or T1 ankle braces. In agreement with DiStefano et al.
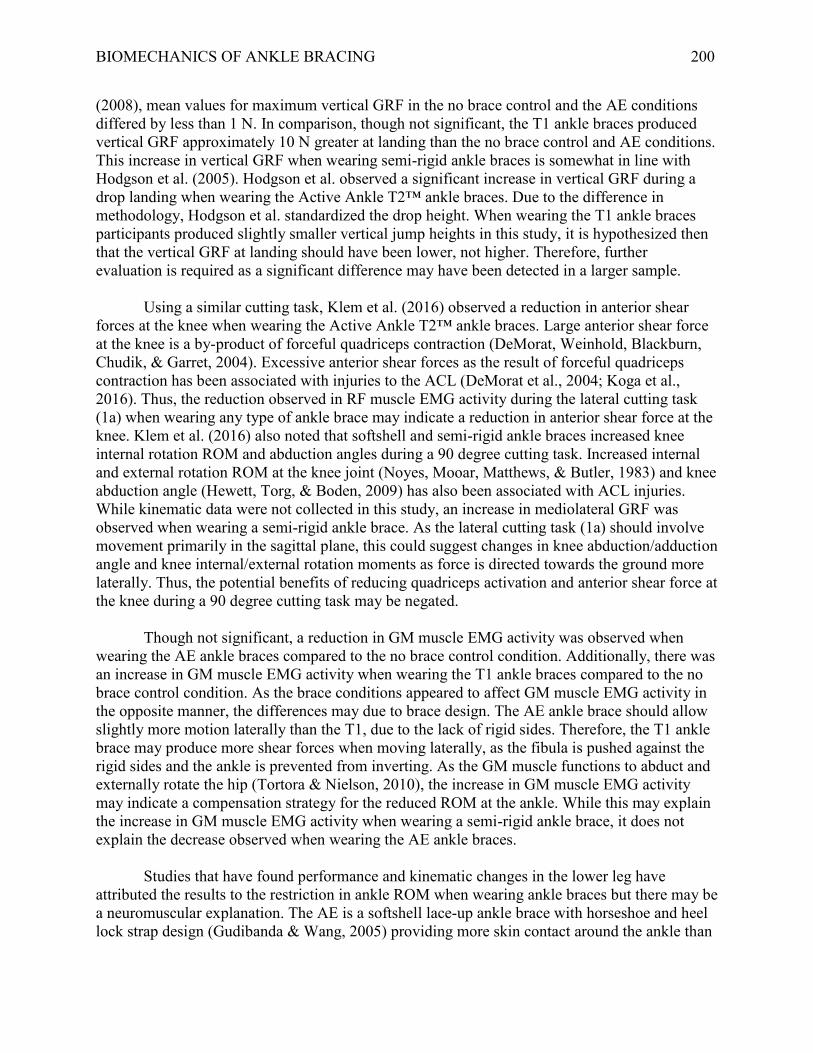
BIOMECHANICS OF ANKLE BRACING 200
(2008), mean values for maximum vertical GRF in the no brace control and the AE conditions differed by less than 1 N. In comparison, though not significant, the T1 ankle braces produced vertical GRF approximately 10 N greater at landing than the no brace control and AE conditions. This increase in vertical GRF when wearing semi-rigid ankle braces is somewhat in line with Hodgson et al. (2005). Hodgson et al. observed a significant increase in vertical GRF during a drop landing when wearing the Active Ankle T2™ ankle braces. Due to the difference in methodology, Hodgson et al. standardized the drop height. When wearing the T1 ankle braces participants produced slightly smaller vertical jump heights in this study, it is hypothesized then that the vertical GRF at landing should have been lower, not higher. Therefore, further evaluation is required as a significant difference may have been detected in a larger sample.
Using a similar cutting task, Klem et al. (2016) observed a reduction in anterior shear
forces at the knee when wearing the Active Ankle T2™ ankle braces. Large anterior shear force at the knee is a by-product of forceful quadriceps contraction (DeMorat, Weinhold, Blackburn, Chudik, & Garret, 2004). Excessive anterior shear forces as the result of forceful quadriceps contraction has been associated with injuries to the ACL (DeMorat et al., 2004; Koga et al., 2016). Thus, the reduction observed in RF muscle EMG activity during the lateral cutting task (1a) when wearing any type of ankle brace may indicate a reduction in anterior shear force at the knee. Klem et al. (2016) also noted that softshell and semi-rigid ankle braces increased knee internal rotation ROM and abduction angles during a 90 degree cutting task. Increased internal and external rotation ROM at the knee joint (Noyes, Mooar, Matthews, & Butler, 1983) and knee abduction angle (Hewett, Torg, & Boden, 2009) has also been associated with ACL injuries. While kinematic data were not collected in this study, an increase in mediolateral GRF was observed when wearing a semi-rigid ankle brace. As the lateral cutting task (1a) should involve movement primarily in the sagittal plane, this could suggest changes in knee abduction/adduction angle and knee internal/external rotation moments as force is directed towards the ground more laterally. Thus, the potential benefits of reducing quadriceps activation and anterior shear force at the knee during a 90 degree cutting task may be negated.
Though not significant, a reduction in GM muscle EMG activity was observed when wearing the AE ankle braces compared to the no brace control condition. Additionally, there was an increase in GM muscle EMG activity when wearing the T1 ankle braces compared to the no brace control condition. As the brace conditions appeared to affect GM muscle EMG activity in the opposite manner, the differences may due to brace design. The AE ankle brace should allow slightly more motion laterally than the T1, due to the lack of rigid sides. Therefore, the T1 ankle brace may produce more shear forces when moving laterally, as the fibula is pushed against the rigid sides and the ankle is prevented from inverting. As the GM muscle functions to abduct and externally rotate the hip (Tortora & Nielson, 2010), the increase in GM muscle EMG activity may indicate a compensation strategy for the reduced ROM at the ankle. While this may explain the increase in GM muscle EMG activity when wearing a semi-rigid ankle brace, it does not explain the decrease observed when wearing the AE ankle braces.
Studies that have found performance and kinematic changes in the lower leg have
attributed the results to the restriction in ankle ROM when wearing ankle braces but there may be a neuromuscular explanation. The AE is a softshell lace-up ankle brace with horseshoe and heel lock strap design (Gudibanda & Wang, 2005) providing more skin contact around the ankle than
BIOMECHANICS OF ANKLE BRACING 201
the T1 ankle brace. Motor programming during agility tasks relies on central nervous system (CNS) input and afferent feedback from the involved distal structures (Craig, 2004). When wearing ankle braces, it is thought that cutaneous receptors in the contacted skin become more active, increasing afferent feedback to the CNS (Feuerbach, Grabiner, Koh, & Weiker, 1994). During gait, a non-noxious cutaneous stimuli, which an ankle brace would provide, to the tibial and sural nerves has been shown to have an inhibitory response in RF muscle when transitioning from the swing to the stance phases (Yang & Stein, 1990). Furthermore, Bullock-Saxton, Janda, and Bullock (1994) noted a delayed activation of the gluteus maximus muscle during hip extension in subjects with a previous history of unilateral ankle sprains. As such, they suggested that alterations in afferent feedback, stemming from an ankle sprain, can influence motor programing above the ankle. As gluteus medius activity was reduced in the AE condition, but increased in T1 condition during the lateral cutting task (2a), it is possible that differences in afferent feedback provided by each ankle brace may alter motor programs utilized for locomotion. Limitations As the sample size of this pilot study was low (n = 10), the results have limited clinical application. Furthermore, the non-parametric nature of the Friedman Test limits the power of any findings. The Friedman Test revealed significant differences between conditions for four variables. When a post-hoc analysis was performed and a Bonferroni correction applied, however, only one variable reached significance The purpose of a Bonferroni correction is to reduce the chances of a Type 1 error when conducting multiple pairwise comparisons (Armstrong, 2014). As such, a lower p value was used (p = .017) to determine significance when performing post hoc analysis. Although post hoc analysis produced p values <.05, p values were not less than .017. Therefore, given the nonparametric nature of the Friedman Test and low sample size (n = 10), it is possible that the Friedman Test produced a type 1 error for these variables.
Some participants had difficulty selectively activating the intended muscles when
performing the MVCs. As a result, this could have affected the results. In terms of methodology for the Vertical Jump Test, participants took off and landed with only one foot on the force platform. Thus, GRFs are only representative of the participant’s dominant extremity. Participants were instructed to take off and land evenly on both feet; however, if participants favoured one side when taking off, this could have influenced GRF data during the Vertical Jump Test. During the lateral cutting task, some participants noted that there was not enough traction on or around the force platform, and were sliding when contacting with the force platform. As such, this could have affected GRF during the lateral cutting task. Electromyography may have also been affected if gait was altered to compensate for the sliding. None of the participants in the study had previously worn ankle braces. Therefore, results may be different in persons who have experience wearing ankle braces. Conclusions
The methodology revealed significant differences and trends in EMG and GRF when comparing the no brace controlled condition to the braced conditions. Furthermore, EMG
BIOMECHANICS OF ANKLE BRACING 202
activity of the lower leg musculature during the vertical jump take off and lateral cutting task (1a) was in line with previous literature. Muscle activation patterns during the lateral cutting task were also similar to those observed by Houck (2003). This study provides the basis for future research, using a similar methodology, on the relationship between lower extremity and lumbar spine EMG muscle activity, GRF, and performance measures when wearing ankle braces. The addition of a non-slip surface on and around the force platform should be implemented in future studies. In addition to using a larger sample size, future studies should investigate EMG activity, GRFs, and performance when wearing ankle braces in populations with experience wearing ankle braces or pathological and injured populations.
BIOMECHANICS OF ANKLE BRACING 203
References
Ambegaonkar, J. P., Redmond, C. J., Winter, C., Ambegaonkar, S. J., Thompson, B., & Guyer,
S. M. (2011). Ankle stabilizers affect agility but not vertical jump or dynamic balance
performance. Foot and Ankle Specialist, 4, 354-36.
Aragón-Vargas, L. F., & Gross, M. M. (1997). Kinesiological factors in vertical jump
performance: Differences among individuals. Journal of Applied Biomechanics, 13, 24-
44.
Armstrong, R. A. (2014). When to use the Bonferroni correction. Ophthalmic and Physiological
Optics, 34. 502-508. doi: 10.1111/opo.12131
Craig, B. W. (2004). What is the scientific basis of speed an agility? Strength and Conditioning
Journal, 26(3), 13-14.
CSEP. (2013). Canadian society for exercise physiology- physical activity training for health.
Ottawa, Canada: Canadian Society for Exercise Physiology.
Delsys Inc. (2012). Delsys Trigno Wireless system: User’s guide.
Boston, MA: Delsys Inc. DeMorat, G., Weinhold, P., Blackburn, T., Chudik, S., & Garret, W. (2004). Aggressive
quadriceps loading can induce noncontact anterior cruciate ligament injury. American
Journal of Sports Medicine, 32, 477-483. doi: 10.1177/0363546503258928
Devita, P., & Skelly, W. A. (1992). Effect of landing stiffness on joint kinetics and energetics in
the lower extremity. Medicine and Science in Sports and Exercise, 24, 108-115.
Dufek, J. S., & Bates, B. T. (1990). The evaluation and prediction of impact forces during
landings. Medicine and Science in Sports and Exercise, 22, 370-377.
BIOMECHANICS OF ANKLE BRACING 204
DiStefano, L. J. Padua, D. A., Brown, C. N., & Guskiewicz, K. M. (2008). Lower extremity
kinematics and ground reaction forces after prophylactic lace-up ankle bracing. Journal
of Athletic Training, 43, 234-241.
Ferran, N. A., Maffulli, N. (2006). Epidemiology of sprains of the lateral ankle ligament
complex. Foot and Ankle Clinics, 11, 659-662. http://dx.doi.org/11016/j.fcl.2006.07.002
Feuerbach, J. W., Grabiner, M. D., Koh, T. J., & Weiker, G. G. (1994). Effect of an ankle
orthosis and ankle ligament anesthesia on ankle joint proprioception. American Journal of
Sports Medicine, 22, 223-229. doi: 10.1177/036354659402200212
Gross, T. S., & Nelson, R. C. (1988). The shock attenuation role of the ankle during landing
from a vertical jump. Medicine and Science in Sports and Exercise, 20, 506-514.
Gudibanda, A., & Wang, Y. (2005). Effect of the ankle stabilizing orthosis on foot and ankle
kinematics during cutting maneuvers. Research in Sports Medicine, 13(2), 111-126.
doi:11080/15438620590956115
Hewett, T. E., Torg, J. S., & Boden, B. P. (2009). Video analysis of trunk and knee motion
during non-contact anterior cruciate ligament injury in female athletes: Lateral trunk and
knee abduction motion are combined components of the injury mechanism. British
Journal of Sports Medicine, 43, 417-422.
Hodgson, B., Tis, L., Cobb, S., & Higbie, E. (2005). The effect of external ankle support on
vertical ground-reaction force and lower body kinematics. Journal of Sport
Rehabilitation, 14, 301-312. http://dx.doi.org/11123/jsr.14.4.301

BIOMECHANICS OF ANKLE BRACING 205
Houck, J. (2003). Muscle activation patterns of selected lower extremity muscles during stepping
and cutting tasks. Journal of Electromyography and Kinesiology, 13, 545-554. doi:
http://dx.doi.org/10.1016/S1050-6411(03)00056-7
Hsieh, C. T., & Cheng, L. (2016). Kinematic factors in countermovement jump for female
volleyball players with different skill levels. International Journal of Sports Science, 6,
6-1 doi: 15923/j.sports.20160601.02
Jacobs, R., Bobbert, M. F., & van Ingen Schenau, G. J. (1996). Mechanical output from
individual muscles during explosive leg extensions: The role of biarticular muscles.
Journal of Biomechanics, 29, 513-523.
Kaminski, T.W., Hertel, J., Amendoloa, N., Docherty, C. L., Dolan, M. G. Hopkins, J. T.,
Nussbaum, E., Poppy, W., & Richie, D. (2013). National athletic trainers association
position statement: Conservative management and prevention of ankle sprains in athletes.
Journal of Athletic Training, 48, 528-545. doi: 14085/1062-6050-48.02
Klem, N-R., Wild, C. Y., Williams, S. A., & Ng, L. (2016). Effect of external ankle support on
ankle and knee biomechanics during the cutting maneuver in basketball players.
American Journal of Sports Medicine. Advance online publication. doi:
11177/0363546516673988
Koga, H., Muneta, T., Bahr, R., Engebretsen, L., & Krosshaug, T. (2016). ACL injury
mechanisms: Lessons learned from video analysis. In V. Musahl, J. Karlsson, R. Kuroda,
& S. Zaffagnini (Eds.). Rotary knee instability: An evidence based approach (27-36).
Switzerland: Springer.
BIOMECHANICS OF ANKLE BRACING 206
Leppänen, M., Aaltonen, S., Parkkari, J., Heinonen, A., & Kujala, U. M. (2014). Interventions to
prevent sports related injuries: A systematic review and meta-analysis of randomized
controlled trials. Sports Medicine,44, 473-486. doi: 11007/s40279-013-0136-8
Macrum, E., Bell, D. R., Boling, M., Lewek, M., & Padua, D. (2012). Effect of limiting ankle-
dorsiflexion range of motion on lower extremity kinematics and muscle-activation
patterns during a squat. Journal of Sport Rehabilitation, 21, 144-150.
Nilsson, J., & Thorstensson, A. (1989). Ground reaction forces at different speeds of human
walking and running. Acta Physiologica, 136, 217-227. doi: 10.1111/j.1748-
1716.1989.tb08655.x
Noyes, F. R., Mooar, P. A., Matthews, D. S., & Butler, D. L. (1983). The symptomatic anterior
cruciate-deficient knee. Part 1: The long-term functional disability in athletically active
individuals. Journal of Bone and Joint Surgery, 65, 154-162.
Onishi, H., Yagi, R., Akasaka, K., Momose, K., Ihashi, K., & Yanda, Y. (2000). Relationship
between emg signals and force in human vastus lateralis muscle using multiple bipolar
wire electrodes. Journal of Electromyography and Kinesiology, 10, 59-67.
https://doi.org/10.1016/S1050-6411(99)00020-6
Parsley, A., Chinn, L., Lee, S. Y., Ingersoll, C., & Hertel, J. (2013). Effect of 3 different ankle
braces on functional performance and ankle range of motion. Athletic Training and
Sports Health Care, 5(2), 69-75.
Petersen, W., Rembitzki, I. V., Koppenburg, A. G., Ellermann, A., Liebau, C., Brüggemann. G.
P., & Best, R. (2013). Treatment of acute ligament injuries: A systematic review.
Arthroscopy and Sports Medicine, 133, 1129-1141. doi: 11007/s00402-013-1742-5
BIOMECHANICS OF ANKLE BRACING 207
Roos, K. G., Kerr, Z. Y., & Mauntel, T. C. (2016). The epidemiology of lateral ligament
complex ankle sprains in national collegiate athletic association sports. American Journal
of Sports Medicine, 45, 201-208. http://dx.doi.org/11177%2F0363546516660980
SENIAM. (2014). Surface electromyography for the non-invasive assessment of muscles.
Retrieved from http://seniam.org/ Smith, B., Claiborne, T., & Liberi, V. (2016). Ankle bracing decreases vertical jump height and
alters lower extremity kinematics. International Journal of Athletic Therapy and
Training, 21(2), 39-46. https://doi.org/11123/ijatt.2014-0143
Tortora, G. J., & Nielson, M. (2010). Principles of human anatomy (4th ed.). Jefferson City,
U.S.A: John Wiley and Sons, Inc.
Verhagen, E. A. L. M., & Bay, K. (2010). Optimising ankle sprain prevention: a critical review
and practical appraisal of the literature. British Journal of Sports Medicine, 44, 1082-
1088. doi: 11136/bjsm.201076406
Wernli, K., Ng, L., Phan, X., Davey, P., & Grisbrook, T. (2016). The relationship between
landing sound, vertical ground reaction force, and kinematics of the lower limb during
drop landings in healthy men. Journal of Orthopaedic and Sports Physical Therapy, 46,
194-199. doi: 10.2519/jospt.2016.6041
West, T., Ng, L., & Campbell., A. (2013). The effect of ankle bracing on knee kinetics and
kinematics during volleyball specific tasks. Scandinavian Journal of Medicine and
Science in Sports, 24, 958-963. doi: 11111/sms.12130
Yang, J. F., & Stein, R. B. (1990). Phase-dependent reflex reversal in human leg muscles during
walking. Journal of Neurophysiology, 63, 1109-1117.