anisotropic velocities of gas hydrate-bearing sediments in ...filled with 100-percent gas hydrate,...
TRANSCRIPT
A B
(3X HORIZONTALEXAGGERATION)
Core NGHP–01–10B–08YData collected at 100 bar
0.1
0.3
0.4
0.5
0.6
0.7
0.8
0.91.1 1.2 1.3 1.4 1.5 1.6 1.7
0.0
0.2
SE
CT
ION
DE
PT
H, I
N M
ET
ER
S
GAMMA DENSITY(g/cc)
X-RAY IMAGE
2, 2
1, 1
U.S. Department of the InteriorU.S. Geological Survey
Scientific Investigations Report 2009–5141
Anisotropic Velocities of Gas Hydrate-Bearing Sediments in Fractured Reservoirs

Anisotropic Velocities of Gas Hydrate-Bearing Sediments in Fractured Reservoirs
By Myung W. Lee
Scientific Investigations Report 2009–5141
U.S. Department of the InteriorU.S. Geological Survey

U.S. Department of the InteriorKEN SALAZAR, Secretary
U.S. Geological SurveySuzette M. Kimball, Acting Director
U.S. Geological Survey, Reston, Virginia: 2009
For more information on the USGS—the Federal source for science about the Earth, its natural and living resources, natural hazards, and the environment, visit http://www.usgs.gov or call 1-888-ASK-USGS
For an overview of USGS information products, including maps, imagery, and publications, visit http://www.usgs.gov/pubprod
To order this and other USGS information products, visit http://store.usgs.gov
Any use of trade, product, or firm names is for descriptive purposes only and does not imply endorsement by the U.S. Government.
Although this report is in the public domain, permission must be secured from the individual copyright owners to reproduce any copyrighted materials contained within this report.
Suggested citation:Lee, M.W., 2009, Anisotropic velocities of gas hydrate-bearing sediments in fractured reservoirs: U.S. Geological Survey Scientific Investigations Report 2009–5141, 13 p.

iii
Contents
Abstract ...........................................................................................................................................................1Introduction.....................................................................................................................................................1Theory .............................................................................................................................................................3
Isotropic Velocities ...............................................................................................................................3Anisotropic Velocities ..........................................................................................................................3
Modeling..........................................................................................................................................................5Fractures in High-Porosity Shale .......................................................................................................5Fractures in Sandstone ........................................................................................................................7
Gas Hydrate Saturations ..............................................................................................................................9Discussion .....................................................................................................................................................10Conclusions...................................................................................................................................................11Acknowledgments .......................................................................................................................................12References Cited..........................................................................................................................................12
Figures 1. NGHP Expedition 01 site map .............................................................................................................2 2. X-ray image of gas hydrate-bearing sediments and schematic diagram showing
laminated two-component sediment package ................................................................................4 3. Isotropic velocities of gas hydrate-bearing sediments and anisotropic velocities
for horizontal fracture in shale ...........................................................................................................6 4. Modeling elastic velocities for fractures in shale ..........................................................................7 5. Group and phase velocities for a horizontal fracture .....................................................................8 6. Isotropic velocities of gas hydrate-bearing sediment and anisotropic velocities
for horizontal fractures in sandstone ................................................................................................8 7. Modeling elastic velocities for fractures in sandstone ..................................................................9 8. Measured logging-while-drilling P-wave velocities and P- and S-wave velocities ...............10 9. Gas hydrate saturations estimated from wireline velocities .......................................................11
Table 1. Constants used for modeling ..............................................................................................................6

AbstractDuring the Indian National Gas Hydrate Program
Expedition 01 (NGHP–01), one of the richest marine gas hydrate accumulations was discovered at drill site NGHP–01–10 in the Krishna-Godavari Basin, offshore of southeast India. The occurrence of concentrated gas hydrate at this site is primarily controlled by the presence of frac-tures. Gas hydrate saturations estimated from P- and S-wave velocities, assuming that gas hydrate-bearing sediments (GHBS) are isotropic, are much higher than those estimated from the pressure cores. To reconcile this difference, an aniso-tropic GHBS model is developed and applied to estimate gas hydrate saturations. Gas hydrate saturations estimated from the P-wave velocities, assuming high-angle fractures, agree well with saturations estimated from the cores. An anisotropic GHBS model assuming two-component laminated media—one component is fracture filled with 100-percent gas hydrate, and the other component is the isotropic water-saturated sediment—adequately predicts anisotropic velocities at the research site.
IntroductionGas hydrates are a type of clathrate in which water mol-
ecules surround gas molecules to form an ice-like crystalline solid. In situ physical characteristics of gas hydrate-bearing sediments (GHBS) have been investigated extensively because of their widespread occurrence in most of the world oceans, as well as in permafrost regions (Kvenvolden, 1993), and their recognition as a negative feedback control on global tempera-ture fluctuations (Archer, 2007), as a potential energy resource (Ruppel, 2007), and as a factor in sea-floor stability and safety issues (Nixon and Grozic, 2007).
As part of the Indian energy resource program, the Indian National Gas Hydrate Program Expedition 01 (NGHP–01) in 2006 was designed to investigate the geologic and geo-chemical controls on gas hydrate occurrences offshore of the Indian Peninsula and along the Andaman convergent margin.
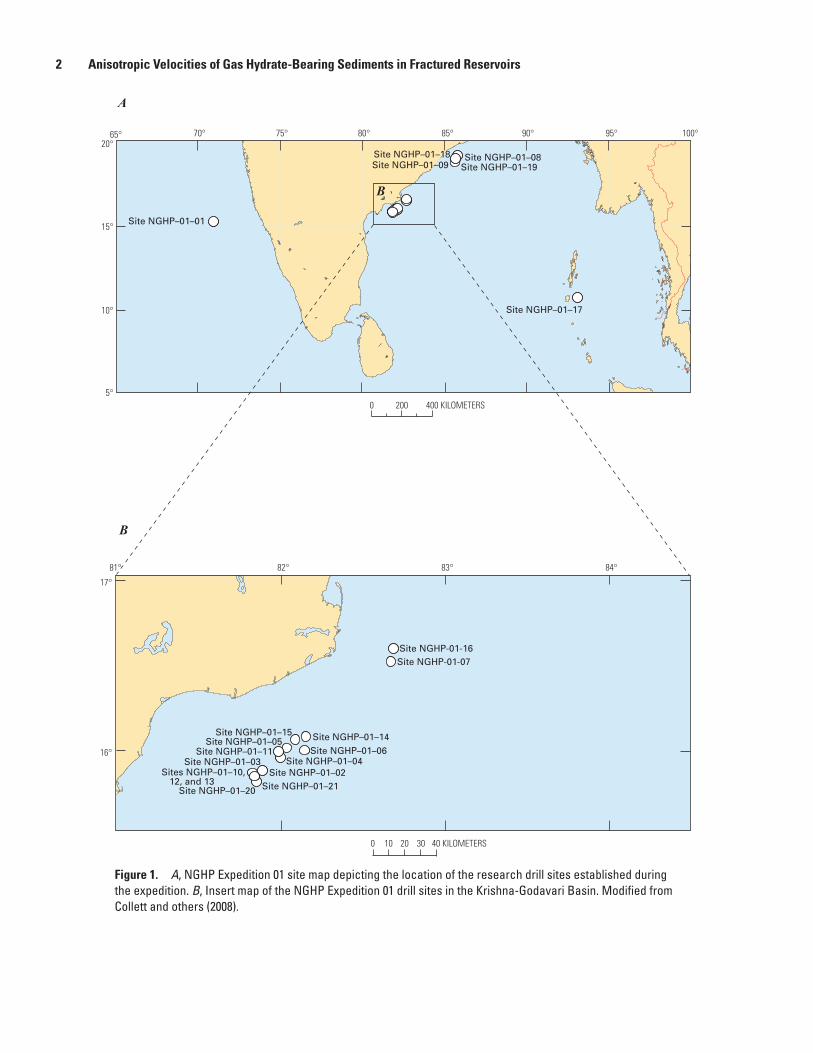
A general description on geological and geophysical studies related to the gas hydrate occurrence in the offshore regions of India is well documented in Rao (2001). A total of 39 holes were drilled at 21 sites (fig. 1), some of which were cored as part of the expedition. One of the richest marine gas hydrate accumulations was discovered at drill site NGHP–01–10 in the Krishna-Godavari Basin (Collett and others, 2008). The initial site report used logging data and infrared images of recovered cores to infer the presence of gas hydrate within the depth interval from ≈25 to ≈160 m below the sea floor (mbsf). The gas hydrate existed as solid nodules, as fracture fill in high-angle and subhorizontal veins, and was disseminated through-out the cores.
The gas hydrate saturations estimated from the logging-while-drilling (LWD) resistivity log reached as much as 80 percent of the pore space (Collett and others, 2008), whereas the highest saturations estimated from the pressure core at the nearby wells are about 26 percent of the pore space. The large difference of gas hydrate estimations is speculated to be caused by the anisotropic nature of the reservoir due to fractures at this site (Lee and Collett, 2009).
Well logs have been extensively used to characterize the in situ gas hydrate-bearing sediments including their satura-tions (for example, Collett, 2000, 2002; Guerin and others, 1999; Helgerud and others, 1999; Hyndman and others, 2001; Lee and Collett, 2005). The majority of investigations have been focused on the unfractured sandstone reservoirs and dispersed gas hydrate in the shale, but few investigations analyzed well logs acquired within the fractured reservoirs.
The purpose of this report is to derive a realistic fracture model to predict P- and S-wave velocities and to compare gas hydrate saturations estimated from the P- and S-wave veloci-ties with those estimated from pressure cores by incorporat-ing anisotropic properties of fractured reservoir. Transverse isotropic theory for laminated media (for example, Backus, 1962; Postma, 1955; White and Angona, 1955) and anisotropy theory by Thomsen (1986, 1995) are used to describe elastic velocities for the fractured reservoir, and gas hydrate satura-tions are estimated from P- and S-wave velocities assuming isotropic and anisotropic GHBS.
Anisotropic Velocities of Gas Hydrate-Bearing Sediments in Fractured Reservoirs
By Myung W. Lee
2 Anisotropic Velocities of Gas Hydrate-Bearing Sediments in Fractured Reservoirs
Figure 1. A, NGHP Expedition 01 site map depicting the location of the research drill sites established during the expedition. B, Insert map of the NGHP Expedition 01 drill sites in the Krishna-Godavari Basin. Modified from Collett and others (2008).
16°
17°
5°
10°
15°
20°65° 70° 75° 80° 85° 90° 95° 100°
82° 83° 84°81°
0 200 400 KILOMETERS
0 10 20 30 40 KILOMETERS
Site NGHP–01–01
Site NGHP–01–08Site NGHP–01–09
Site NGHP–01–17
Site NGHP–01–18Site NGHP–01–19
Site NGHP–01–02Site NGHP–01–03 Site NGHP–01–04
Site NGHP–01–05Site NGHP–01–06
Site NGHP-01-07
Sites NGHP–01–10, 12, and 13
Site NGHP–01–11
Site NGHP–01–14Site NGHP–01–15
Site NGHP-01-16
Site NGHP–01–20 Site NGHP–01–21
B
A
B

Theory 3
Theory
Isotropic Velocities
Velocities of isotropic GHBS, whereby the gas hydrate fills the sediment’s pore space, are calculated using the three-phase Biot equation (Lee, 2007). Lee (2008) derived the following bulk (k) and shear moduli (µ) of the GHBS applicable for low-frequency well-log and seismic data:
k K Kma p p av
ma s
= − +
= −
( )
( )
1
1
2
(1)
with
1
1
1
K K K Kav
p
ma
w
w
h
h
pas
as
=−
+ +
=+
+
( )
( )
( )
,
pas
as
=+
+( )
( )
1
1,
and
sas
as
=+
+( )
( )
1
1
where α is the consolidation parameter (Pride and others, 2004; Lee, 2005) with
=
++
1 2
1; as = w + εh, w = (1 – Ch ), and
h = Ch. Kma
, Kw, and K
h are the bulk moduli of grain, water,
and gas hydrate respectively; µma is shear modulus of the grain.The parameter ε accounts for the reduced impact of
hydrate formation relative to compaction in terms of stiffen-ing the host-sediment framework, and Lee and Waite (2008) recommended ε = 0.12 for modeling velocities of GHBS.
The P-wave (Vp ) and S-wave velocities (Vs ) of the GHBS are given by:
Vk
pb
= + 4 3
/ and Vsb
=
(2)
where rb is the bulk density of GHBS given by
rb = rs(1 – ) + rw(1 – Ch ) + rh Ch.
The use of equations 1 and 2 for computing velocities of GHBS is referred to as the simplified three-phase equation (STPE) in this report. For water-saturated sediments, STPE is the same as the Gassmann equation.
The consolidation parameter α depends on the effective pressure and degree of consolidation. Mindlin (1949) showed that the bulk and shear moduli depend on the one-third power of the effective pressure. On the basis of the theory by Mindlin (1949), the depth (or effective pressure) dependent α is pro-posed by the following equation using the exponent n:
αi = α0( p0 / pi ) n ≈ α0(d0 / di )
n (3)
where α0 is the consolidation parameter at the effective pressure
p0 or depth d0,and αi is the consolidation parameter at the effective pressure
pi or depth di.
The use of n =1/3 in equation (3) is similar to the Mindlin relation.
Anisotropic Velocities
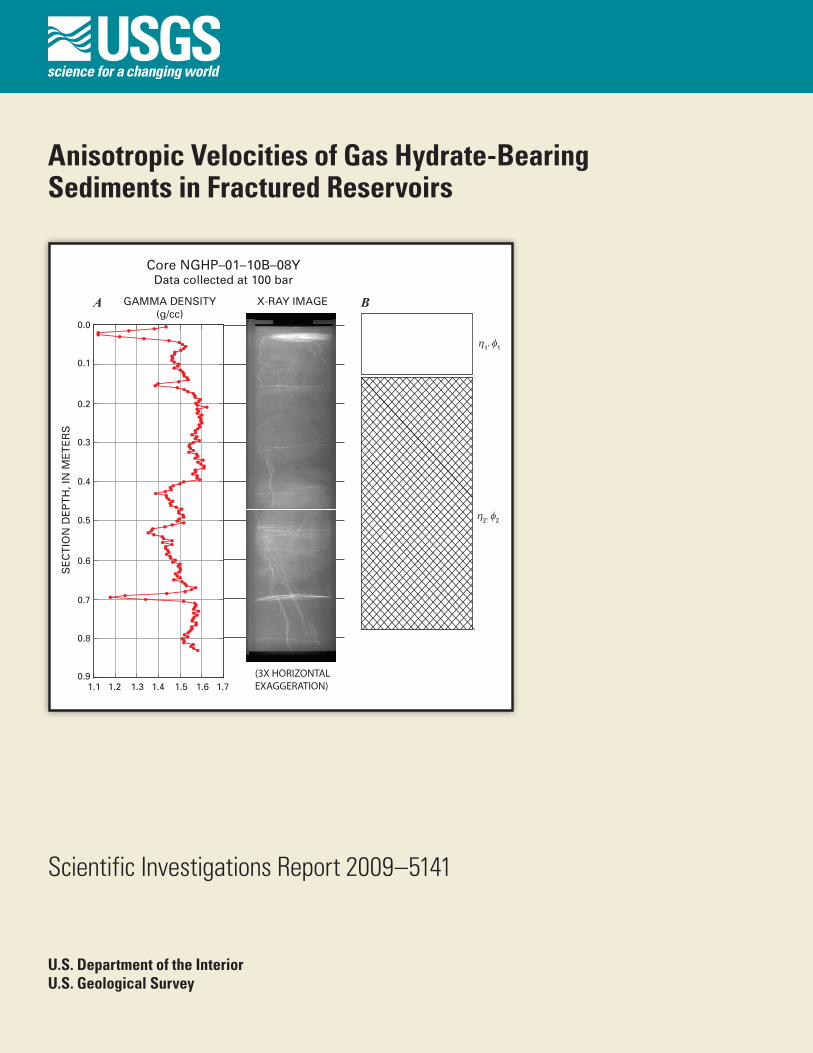
Out of 21 holes drilled in the Indian Ocean during NGHP–01, Collett and others (2008) identified four gas hydrate accumulations within the fractured shale. Figure 2A shows an X-ray image for recovered core at drill site NGHP–01–10B at the depth of 50.1 mbsf. The light color in the image denotes the presence of gas hydrate, and figure 2A shows five or six layers of gas hydrate and wispy subvertical veins within a relatively homogeneous matrix (Collett and others, 2008). Figure 2B shows a schematic diagram for modeling the fractured reservoir.
Elastic anisotropy due to aligned cracks in porous rock has been investigated extensively (for example, Eshelby, 1957; Walsh, 1969; Watt and others, 1976; Hudson, 1980; Thomsen, 1995). Because it is assumed that the fracture is filled with 100-percent gas hydrate, the fractured reservoir can be modeled as a laminated elastic media (White and Angona, 1955) rather than saturated aligned cracks embedded in porous media (for example, see Thomsen, 1995). In this report, a fractured reservoir is modeled as a layered media composed of two components as shown in figure 2B. The first component is fractures filled with 100-percent gas hydrate, and its charac-teristics are given by P-wave velocity (VP1), S-wave velocity (Vs1), and density (r1); the second component is isotropic medium with P-wave velocity (VP2), S-wave velocity (Vs2), and density (r2). Anisotropic P- and S-wave velocities can be computed using equations shown in White (1965). Because the fracture is filled with 100-percent gas hydrate, the elastic constants for the fracture are identical to those of the pure gas hydrate.
Let’s define 1 and 2 to be the volume fraction of component 1 and volume fraction of component 2, respectively. Phase velocities of transverse isotropic media caused from frac-tures can be computed using the following definition:
< > ≡ +
< > ≡ +⎛⎝⎜
⎞⎠⎟
−−
G G G
GG G
1 1 2 2
1 1
1
2
2
1
where G is any elastic constant such as density of the
component 1 and component 2.

4 Anisotropic Velocities of Gas Hydrate-Bearing Sediments in Fractured Reservoirs
The P- and S-wave velocities of transverse isotropic media can be calculated from the following equations using the Lamé constants and µ (White, 1965):
Ay= < +
+( ) > + <+( ) > <
+( ) >−4
2
1
2 21 2
( ) (4)
C = <+( ) >−1
21
F = <+( ) > <
+( ) >−1
2 21
L = < >−1 1
N = < >
= < >
VA C L Q
P = + + +⎛⎝⎜
⎞⎠⎟
sin cos/2 2 1 2
2
VA C L Q
SV = + + +⎛
⎝⎜⎞⎠⎟
sin cos/2 2 1 2
2
VN L
SH = +⎛
⎝⎜⎞⎠⎟
sin cos/2 2 1 2
Q A L C L F L= − − − + +[( )sin ( ) cos ] ( ) sin cos2 2 2 2 2 24
where is the angle between the wavefront normal and the
vertical axis (perpendicular to the layering); VP is the anisotropic P-wave velocity,
VSH is the horizontally polarized S-wave (SH) velocity,
and
VSV is the vertically polarized S-wave (SV) velocity.
Generally, transverse isotropic elastic media is described using Thomsen’s parameters. Thomsen (1986, 1995) described an anisotropic elastic media using the three parameters γ, , and ε. Using these parameters, velocities are given by:
Figure 2. A, X-ray image of gas hydrate-bearing sediments at the depth of 50.1 meters below sea floor at the drill site NGHP–01–10B (modified from Collett and others, 2008). B, Schematic diagram showing laminated two-component sediment package. Parameter 1 is the volume fraction of component 1, 2 is the volume fraction of component 2, and is porosity.
A B
(3X HORIZONTALEXAGGERATION)
Core NGHP–01–10B–08YData collected at 100 bar
0.1
0.3
0.4
0.5
0.6
0.7
0.8
0.91.1 1.2 1.3 1.4 1.5 1.6 1.7
0.0
0.2
SE
CT
ION
DE
PT
H, I
N M
ET
ER
S
GAMMA DENSITY(g/cc)
X-RAY IMAGE
2, 2
1, 1

Modeling 5
V
V
V
p o
SH
o
SV
o
2 2 2 4
2 2 2
2 2
1 2 2
1 2
1
= + +
= +
=
( sin sin )
( ) ( sin )
( ) ++−⎡
⎣⎢
⎤
⎦⎥
2 2 2 2
2
o
o
( )sin cos
(5)
where 0 and 0 are the P- and S-wave velocities at =0 or in the symmetry direction.
Thomsen’s parameters are related to White’s equation by the following equations (Thomsen, 1986):
= −
= + − −−
= −
N L
L
F L C L
C C L
A C
C
2
2
2
2 2( ) ( )
( ) (6)
The velocities shown in equations 4 and 5 are phase veloc-ities. Unless incident angle is 0° or 90°, the phase and group velocities are different. If the dip of the fracture is not 0° or 90°, the group velocities should be used to calculate the saturations.
Thomsen (1986) derived the relation between group and phase velocities for transversely isotropic media. Let g be the angle between the ray direction and the vertical axis and GVp, GVS
H, and GVSV be the group velocities of P-wave, horizontally
polarized shear-wave, and vertically polarized S-wave veloci-ties, respectively. Then
V GV
V GV
V GV
p p g
SH
SH
g
SV
SV
g
( ) ( )
( ) ( )
( ) ( )
=
=
=
(7)
Note that equation 7 does not mean that group velocity equals phase velocity. Equation 7 indicates that if the corresponding wavefront normal angle is calculated using the following formula for a given ray angle g, then equation 7 is applicable to compute group velocity:
tan
tan
tan
g
V
dV
d
V
dV
d
=+
⎛⎝⎜
⎞⎠⎟
−⎛⎝⎜
⎞⎠⎟
1
1
(8)
For weakly anisotropic media, group velocities are (Thomsen, 1986):
For P-wave: tan g = tan [1 + 2 + 4(ε – )sin2]
For SH-wave: tan g = tan [1 + 2] (9)
For SV-wave: tan g = tan 1
2 1 22 2
2+− −⎡
⎣⎢
⎤
⎦⎥
o
o
( )( sin
For more details for the group and phase velocities, consult Thomsen (1986).
Modeling
Fractures in High-Porosity Shale
Figure 3 shows modeled P- and S-wave velocities for a fractured shale reservoir using the elastic constants shown in table 1. The model parameters for the fracture filled with 100-percent gas hydrate are VP1 = 3.744 km/s, VS1 = 1.946 km/s, and r1 = 0.926 g/cm3; parameters for 100-percent water-saturated sediment are VP2 = 1.503 km/s, VS2 = 0.166 km/s, and r2 = 1.563 g/cm3; 2 = 0.65 and CV2 = 0.6, where Cv is clay volume fraction. Velocities of water-saturated sediments were calculated using the STPE with = 100. Velocities of shale in this fracture model represent the velocities of shallow marine sediments.
Figure 3 shows a polar plot of P- and S-wave phase velocities with respect to the phase angle for a horizontal fracture whose volume fraction is 15 percent of the sediment volume, or the volume of a fracture filled with 100-percent gas hydrate is 15 percent of the total sediment volume. The P-wave velocity at the phase angle of 0° or equivalent for a horizontal fracture is 1.64 km/s, whereas the P-wave velocity at the phase angle of 90° or equivalent for vertical fractures is 1.83 km/s (about an 11-percent increase). The minimum SH-wave velocity of 0.186 km/s occurs at the phase angle of 0°, whereas the maximum SH-wave velocity of 0.621 km/s occurs at the phase angle of 90° (about a 200-percent increase). These anisotropic velocities can be calculated using Thomsen’s parameters using equation 5, and these parameters are = 5.09, = –0.0729, and ε = 0.1169, which are calculated from equation 6. The magnitude of these parameters increases with increasing fracture density (or gas hydrate volume).
For comparison, velocities for isotropic GHBS (gas hydrate accumulates in the pore space of the sediments) having 15-percent gas hydrate volume content are shown in figure 3. Velocities are computed using the STPE with a constant = 100 and the same parameters for the water-saturated sediments for the fracture model. Depending on the phase angle, the isotropic velocities are smaller or larger than the anisotropic velocities.
Figure 4 shows calculated velocities for isotropic GHBS along with transversely isotropic velocities for the fractured reservoir with respect to volume fraction of gas hydrate. Isotropic velocities of GHBS are calculated from the STPE with = 100 and CV = 0.6, which are the same as those for water-saturated sediment of the fracture model. For isotropic medium, the volume fraction of gas hydrate (Vh) is given by Vh = Sh, where Sh is the gas hydrate saturation in the pore space and is given by the volume fraction of fractures for a fractured reservoir. In the case that there is no gas hydrate either in the pore or fracture, the two velocities are the same. Because the maximum volume fraction for the isotropic medium is limited by porosity, maximum volume fraction for the isotropic GHBS is 0.65. For 100-percent gas hydrate saturation in the fracture, the velocities are velocities of pure methane gas hydrate.

6 Anisotropic Velocities of Gas Hydrate-Bearing Sediments in Fractured Reservoirs
As shown in figure 4A, the effect of anisotropy is much more pronounced on the S-wave velocities as expected from figure 3. When the fracture orientation is perpendicular to the direction of measurement (incident angle is 0°), the S-wave velocities are almost constant except at very high volumes of gas hydrate saturations above 80 percent. On the other hand, in the case that the fracture is parallel to the direction of mea-surement, the S-wave velocities increase rapidly at low satura-tion and increase monotonically as gas hydrate saturation further increases. For all ranges of fracture volume, velocities modeled for isotropic GHBS lie between two velocities mod-eled for anisotropic GHBS.
Figure 4B shows the relation between modeled aniso-tropic P- and S-wave velocities along with the measured relation at drill site NGHP–01–10D. Based on the theoretical
curves for P- and S-wave velocities by angle of incidence, the measured data do not exhibit isotropic behavior. A series of theoretical curves were calculated to determine the fracture orientation representative of the measured data. Assuming a fracture dip of 85°, or ray angle of 85°, the modeled P- and S-wave velocity relation is similar to the measured data, espe-cially within the shaded area.
The velocity at the ray angle of 85° is the group velocity, not the phase velocity shown in figure 3. Because energy is transmitted with the group velocity, the group velocity should be used to analyze measured velocities. As shown in equation 9, the relation between the ray angle and phase angle depends on Thomsen’s parameters, which depend on the fracture volume and elastic properties of sediments encasing the fracture. Con-sequently, for a given ray angle, the phase angle to be used in calculating the group velocity varies with gas hydrate saturation. Assuming the fracture volume is 15 percent of the sediment (same as for figure 3), group and phase velocities using equa-tions 7 and 8 are calculated and are shown in figure 5.
Because the P-wave velocity has only a small amount of anisotropy, the phase and group velocities are similar to those shown in figure 5A. In other words, the phase angle can be interchanged into the ray angle without significant error in the P-wave velocity. However, group and phase velocities for the horizontally polarized shear wave are quite different as shown in figure 5B. For ray angles less than about 60°, the group velocities are almost the same. A greater change of group velocity occurs for ray angles greater than 60°. In other words, the SH-wave velocities are insensitive to the
Table 1. Constants used for modeling.
[Subscript s, h, c, and w are sand, gas hydrate, clay, and water, respectively; K, µ, and r are bulk modulus, shear modulus, and density, respectively. The bulk and shear moduli of gas hydrate are calculated at 11°C and 1 MPa from Helgerud and others (2009) and others are from Lee (2005). The bulk and shear moduli of gas hydrate yield the P- and S-wave velocities of pure gas hydrate as 3.744 km/s and 1.946 km/s, respectively. MPa; Mega Pascals, GPa, Giga Pascals]
Bulk modulus Shear modulus DensityKs
= 38 GPa µs = 44 GPa rs = 2,650 kg/m3
Kc = 20.9 GPa µc = 6.85 GPa rc = 2,580 kg/m3
Kh = 8.27 GPa µh = 3.49 GPa rh = 922 kg/m3
Kw = 2.29 GPa µw = 0 rw = 1,000 kg/m3
Figure 3. Isotropic velocities of gas hydrate-bearing sediment and anisotropic velocities for horizontal fracture having a 15-percent bulk volume of gas hydrate with respect to the angle of incident. The model represents fractures in high-porosity shale. A, P-wave velocity. B, Horizontally polarized (VS
H ) and vertically polarized S-wave velocity (VSV ).
P-WAVE S-WAVEA B
120
9060
30
0
330
300270
240
210
180
150
12090
60
30
0
330
300270
240
210
180
150
VE
LOC
ITY,
IN K
ILO
ME
TE
RS
PE
R S
EC
ON
D
VE
LOC
ITY,
IN K
ILO
ME
TE
RS
PE
R S
EC
ON
D
2
1
2
0.8
0.4
0.0
0.4
0.8
Bulk volume of gas hydrate = 15%Anisotropic P-wave velocityIsotropic P-wave velocity
Bulk volume of gas hydrate = 15%Anisotropic SH-wave velocityAnisotropic SV-wave velocityIsotropic S-wave velocity
EXPLANATION EXPLANATION

Modeling 7
dip of the fracture, if the dip is less than ≈60°. However, this observation for SH-waves cannot be generalized, because the relation between ray angle and SH-velocity is a complicated function of porosity and fracture density.
Fractures in Sandstone
Figure 6 shows modeled P- and S-wave velocities for a fractured reservoir in sandstone using elastic constants shown in table 1. The model parameters for the fracture filled with 100-percent gas hydrate in sandstone are identical to those for the fracture in shale. Parameters for 100-percent water-saturated sandstone are VP2 = 1.950 km/s, VS2 = 0.650 km/s, r2 = 1.986 g/cm3, 2 = 0.4 , and CV2 = 0.1. Velocities of sandstone in this fracture model represent the velocities of host sediments at depths of around 600–800 m, typical host sediments of GHBS at the Alaska North Slope (Lee, 2005).
Figure 6 show a polar plot of P- and S-wave velocities with respect to the angle of incidence for a horizontal fracture whose volume fraction is 15 percent. The P-wave velocity at the incident angle of 0° is 2.108 km/s, whereas the P-wave
velocity at the incident angle of 90° is 2.144 km/s (less than 2-percent increase). The SH-wave velocity at the incident angle of 0° is 0.720 km/s, whereas the SH-wave velocity at the incident angle of 90° is 0.826 km/s (about a 16-percent increase). These anisotropic velocities can be calculated using Thomsen’s parameters using equation 5, and these parameters are calculated using equation 6 as = 0.01573, = –0.0340, and ε = 0.0204.
For comparison, velocities for isotropic GHBS having 15-percent gas hydrate volume content are shown in figure 6. Velocities of isotropic GHBS are computed using the STPE with = 30 and the same parameters for the water-saturated sediments used for the fracture model (that is r2 = 1.986 g/cm3, 2 = 0.4, and CV2 = 0.1). The isotropic P-wave velocity is 2.347 km/s and S-wave velocity is 0.871 km/s, which are larger than the maximum anisotropic P- and S-wave velocities. Unlike velocities for the fractured shale reservoir, velocities of aniso-tropic velocities in sandstone are insensitive to the orientation of fractures.
Figure 7A shows calculated velocities for isotropic GHBS along with transversely isotropic velocities for the fracture reservoir in sandstone with respect to volume fraction
Figure 4. Modeling elastic velocities for anisotropic gas hydrate-bearing sediments (GHBS) caused by fracture in high-porosity shale and for isotropic GHBS. A, Relation between gas hydrate saturation and bulk volume of gas hydrate in sediments. B, Relation between S-wave velocity and P-wave velocity.
VOLUME FRACTION OF GAS HYDRATE S-WAVE VELOCITY, IN KILOMETERS PER SECOND
0.0 0.2 0.4 0.6 0.8 1.0 0.01
2
3
4
1
0
2
3
4
0.5 1.0 1.5 2.0
VE
LOC
ITY,
IN K
ILO
ME
TE
RS
PE
R S
EC
ON
D
P-W
AV
E V
ELO
CIT
Y, IN
KIL
OM
ET
ER
S P
ER
SE
CO
ND
Purehydrate
A B
Incident angle of 0° (horizontal fracture)Incident angle of 90° (vertical fracture)Isotropic GHBS
Incident angle of 0° (horizontal fracture)Incident angle of 90° (vertical fracture)Incident angle of 85°Isotropic GHBSMeasured at site NGHP−01−10D
EXPLANATION EXPLANATION
Water-saturatedsediment
P-wave
S-wave

8 Anisotropic Velocities of Gas Hydrate-Bearing Sediments in Fractured Reservoirs
Figure 6. Isotropic velocities of gas hydrate-bearing sediment and anisotropic velocities for horizontal fracture having a 15-percent bulk volume of gas hydrate with respect to the angle of incidence. The model represents fractures in clean sandstone. A, P-wave velocity. B, Horizontally polarized (VS
H) and vertically polarized S-wave velocity (VS
V).
Figure 5. Group and phase velocities for a horizontal fracture having 15-percent bulk volume of gas hydrate (or fracture volume) with respect to phase and ray angles. A, P-wave velocity. B, SH-wave velocity.
P-WAVE SH-WAVEBAV
ELO
CIT
Y,IN
KIL
OM
ET
ER
S P
ER
SE
CO
ND
2
1
2
12090
60
30
0
330
300270
240
210
180
150
VE
LOC
ITY,
IN K
ILO
ME
TE
RS
PE
R S
EC
ON
D
0.8
0.4
0.0
0.4
0.8
120
9060
30
0
330
300270
240
210
180
150
Bulk volume of gas hydrate = 15%Phase velocityGroup velocity
Bulk volume of gas hydrate = 15%Phase velocityGroup velocity
EXPLANATION EXPLANATION
1.2
0.6
0.0
0.6
1.2
P-WAVEA S-WAVEB
9060
30
0
330
300270
240
210
180
150
12090
60
30
0
330
300270
240
210
180
150
120
VE
LOC
ITY,
IN K
ILO
ME
TE
RS
PE
R S
EC
ON
D
VE
LOC
ITY,
IN K
ILO
ME
TE
RS
PE
R S
EC
ON
D
3
2
1
0
1
2
3
Bulk volume of gas hydrate = 15%Anisotropic velocityIsotropic velocity
Bulk volume of gas hydrate = 15%Anisotropic SH-velocityAnisotropic SV-velocityIsotropic velocity
EXPLANATION EXPLANATION

Gas Hydrate Saturations 9
Figure 7. Modeling elastic velocities for anisotropic gas hydrate-bearing sediments (GHBS) caused by fracture in clean sandstone and for isotropic GHBS. A, Relation between gas hydrate saturation and bulk volume of gas hydrate in sediments. B, Relation between S-wave velocity and P-wave velocity.
of gas hydrate. Because the maximum volume fraction for the isotropic medium is limited by porosity, maximum volume fraction for the isotropic GHBS is 0.4. For a given gas hydrate content, the isotropic velocities are always larger than anisotropic velocities, and the orientation of frac-tures is insensitive to the amount of gas hydrate. For a given velocity, gas hydrate saturations estimated from the isotropic GHBS model are much less than those estimated from the anisotropic GHBS model.
Figure 7B shows the relation between P- and S-wave velocities of GHBS. The modeled relations using the isotropic and anisotropic GHBS are similar. Consequently, the relation between P- and S-wave velocities is not a good indicator for identifying fractured reservoirs in sandstone.
Because the fast and slow velocities of S-waves are almost identical, the presence of fractures in sandstone is dif-ficult to detect on the basis of elastic velocities. The relation between velocity and saturation that is estimated indepen-dently from the velocity, such as saturations estimated from the nuclear magnetic resonance (NMR) log, can be used to identify the presence of fractures, although the orientation of the fractures may not be determined.
Gas Hydrate Saturations The modeled velocities shown in figure 4 can be used
to estimate gas hydrate saturations from measured velocities. Because the measured porosity m is assumed to be an aver-aged value of the porosity of the water-saturated part of sedi-ments and the porosity of the fracture filled with gas hydrate, the porosity of the water-saturated sediment is dependent on the amount of fracture (or gas hydrate). Therefore, an appro-priate porosity for component 2 used to calculate velocities of water-saturated sediment is:
2 1=
−−
m h
h
V
V (10)
Equation 10 indicates that the porosity of water-saturated sedi-ment is the same as the measured porosity of sediment in the absence of gas hydrate. As the volume of gas hydrate increases, the porosity of water-saturated sediment decreases to account for the presence of fractures.
The density porosity calculated from the density log assumes that the densities of gas hydrate and water are the same. Because the density of gas hydrate is less than that
0.0 0.2 0.4 0.6 0.8 1.0 0.5 1.0 1.5 2.0 2.5
VOLUME FRACTIONOF GAS HYDRATE
S-WAVE VELOCITY,IN KILOMETERS PER SECOND
5
4
3
2
1
0
4
3
2
VE
LOC
ITY,
IN K
ILO
ME
TE
RS
PE
R S
EC
ON
D
P-W
AV
E V
ELO
CIT
Y,IN
KIL
OM
ET
ER
S P
ER
SE
CO
ND
P-wave
S-wave
EXPLANATION EXPLANATION
Incidence angle 0° (horizontal fracture)
Incidence angle 90° (vertical fracture)
Isotropic GHBS
Incidence angle 0° (horizontal fracture)
Incidence angle 90° (vertical fracture)
Isotropic GHBS
A B

10 Anisotropic Velocities of Gas Hydrate-Bearing Sediments in Fractured Reservoirs
of water, the calculated density porosity is not accurate for high-porosity sediments at high gas hydrate saturations. To compute accurate density porosity, the gas hydrate saturations are required. Consequently, estimating gas hydrate saturation and calculating density porosity are iterative processes, and the density porosity is updated using the estimated Sh as:
new mw ma
w h h h maS S=
−− + −
⎡
⎣⎢
⎤
⎦⎥( )1 (11)
where rw, rh, and rma are density of water, gas hydrate, and grains, respectively. The updated new is used for m in equation 10.
Figure 8 shows wireline P- and S-wave velocities mea-sured at drill site NGHP–10–10D along with logging-while-drilling (LWD) P-wave velocity at site NGHP–01–10A. Wireline velocities were measured only for the gas hydrate interval. Figure 9 shows the gas hydrate saturations esti-mated assuming isotropic GHBS and anisotropic GHBS from wireline P- and S-wave velocities. The STPE parameters used for the estimation of gas hydrate assuming isotropic GHBS is = 70(200 / di)
1/3 and Cv calculated from the gamma log. The gas hydrate saturation estimated from the fracture model is an average value of fracture reservoir and water-saturated sedi-ments and is calculated as Sh = Vh/new. As implied in figure 4, the gas hydrate saturations estimated assuming isotropic GHBS are between the two gas hydrate estimates: one assum-ing that the fracture is vertical and one assuming that the frac-ture is horizontal. Also shown as solid dots are the gas hydrate saturations estimated from the pressure cores. In this report, saturations estimated from the pressure cores are considered as reference saturations because pressure cores capture all the mass in samples. Gas hydrate saturations are estimated from the P-wave velocities by assuming vertical fractures agree bet-ter with those estimated from the pressure cores. However, the estimations from the pressure cores differ significantly from those estimated using the S-wave velocities assuming either isotropic or anisotropic GHBS. If the fractures are vertical, the orientation of the P-wave sensor does not matter for the velocity, because the particle motion of the P-wave is parallel to the fractures. On the other hand, the direction of particle motion of the S-wave is critical to estimate the velocities. Generally, it is not possible to accurately estimate gas hydrate saturation from the S-wave velocities without knowing the orientation of the S-wave sensor relative to the fracture. Because the orientation of the dipole sonic imager (DSI) tool is not available, it is assumed that the motion of the wireline S-wave is parallel to the fracture plane. That is, VS
H shown in equation 4 is used as the theoretical S-wave velocity. Overall, the gas hydrate saturations assuming horizontal fracture agree well with those estimated assuming isotropic GHBS and agree well with that estimate from the pressure cores except the core at ≈74 mbsf.
Figure 8. Measured logging-while-drilling (LWD) P-wave velocities at drill site NGHP–01–10A and wireline P- and S-wave velocities at drill site NGHP–01–10D. Calculated baseline velocities are shown in red.
Discussion
The model results indicate that the elastic characteristics of fractures in shale differ significantly from those in sand-stone. The primary reason is that the elastic properties of pure methane are much higher than those of high-porosity shales, which are the most common host sediments for shallow marine GHBS, such as GHBS at drill site NGHP–01–10. On the other hand, the elastic velocities of sandstone reservoirs at moderate depths, such as GHBS at the Alaska North Slope, are much higher than those of shale at shallow depth; anisotropic effects of fractures in sandstone are not significant. However, to analyze the anisotropic elastic velocities due to fractures, the velocities of host sediments at a given locality should be accurately incorporated.
Gas hydrates at drill site NGHP–01–10 were inferred from LWD and wireline logs, and from recovered cores using X-ray images, cold spots, chlorinity anomaly, and moussey and soupy textures (Collett and others, 2008). The gas hydrate existed as solid nodules, high-angle and subhorizontal veins as fracture fill, and was disseminated throughout the cores. How-ever, large differences exist among the various gas hydrate saturations. For example, the maximum gas hydrate satura-tion estimated from the pressure core is about 25.4 percent at
DEPTH BELOW SEA FLOOR,IN METERS
0 50 100 150 200
VE
LOC
ITY,
IN K
ILO
ME
TE
RS
PE
R S
EC
ON
D
3
2
1
0
S-wave
P-wave
EXPLANATIONLWD P-wave velocity at site 10A
Wireline velocity at site 10D
Modeled baseline velocity

Conclusions 11
Figure 9. Gas hydrate saturations estimated from wireline velocities at drill site NGHP–01–10D assuming both anisotropic (vertical and horizontal fractures) and isotropic gas hydrate-bearing sediments (GHBS). A, From P-wave velocity. B, From S-wave velocity.
the depth of 117.4 mbsf at drill site NGHP–01–10B, which is shown in figure 9. The highest gas hydrate saturation assum-ing isotropic GHBS is about 80 percent, which was estimated from the LWD resistivity log as indicated in the initial report (Collett and others, 2008) or from S-wave velocities shown in figure 9.
Gas hydrate saturations estimated from the pressure cores depend only on the bulk volume of gas hydrate irrespective of whether gas hydrate fills the fractures or is dispersed through-out the sediments. The cumulative random measurement error in gas hydrate saturations from the pressure cores at drill site NGHP–01–10 is estimated slightly less than 5 percent (95-per-cent confidence interval) (M. Holland, written commun., 2009). The largest contributions of error are from porosity and ambient pressure. However, the loss of pressure and mass during core recovery occurred in only one sample at drill site NGHP–01–10 (Collett and others, 2008). Also, porosity was accurately measured. Therefore, these estimates can be used as reference saturations. Gas hydrate saturations from wireline P-wave velocities, assuming high-angle fractures, generally agree with those estimated from the pressure core, but are not consistent to those estimated from S-wave velocities due to uncertainties in the particle motion relative to the fracture orientation.
ConclusionsThe anisotropic elastic velocities caused by fractures filled
with 100-percent gas hydrate are modeled using laminated media and are applied to analyze velocities measured at drill site NGHP–01–10. From this study, the following conclusions can be drawn.
Fractures in shale at shallow depth filled with 100-percent gas hydrate significantly affect elastic velocities, particularly S-wave velocity, relative to the orientation of the fractures. On the other hand, velocities for fractured sandstone gas hydrate reser-voirs are insensitive to the fracture orientation. However, to ana-lyze the elastic velocities for fractured reservoirs, the velocities of host sediment at a given locality should be accurately modeled.
Assuming that velocities for gas hydrate-bearing sedi-ments (GHBS) are isotropic could overestimate gas hydrate saturations for the fractured reservoirs, and the overestimation generally increases as the dip of the fracture increases.
An anisotropic GHBS model assuming two-component laminated media—one component is a fracture filled with 100-percent gas hydrate, and the other component is the iso-tropic water-saturated sediment—adequately predicts anisotro-pic velocities at drill site NGHP–01–10.
DEPTH BELOW SEA FLOOR, IN METERS DEPTH BELOW SEA FLOOR, IN METERS
50 100 150 50 100 150
GA
S H
YD
RA
TE
SA
TU
RA
TIO
N
GA
S H
YD
RA
TE
SA
TU
RA
TIO
N
0.8
0.6
0.4
0.2
0.0 0.0
0.2
0.4
0.6
0.8
B S-WAVEA P-WAVE
EXPLANATIONAssuming isotropic GHBSAssuming vertical fractureAssuming horizontal fracturePressure core at site 10BPressure core at site 10D

12 Anisotropic Velocities of Gas Hydrate-Bearing Sediments in Fractured Reservoirs
Acknowledgments
I would like to thank the Science Team of the Indian NGHP Expedition 01 and the Indian Governments for the release of the data. I thank T.S. Collett for his continuous support and encouragement throughout this investigation and W.F. Agena and L. Burke for their many helpful comments and suggestions. This study was partially funded by the U.S. Geological Survey, Energy Resources program and the U.S. Department Energy under the Interagency Agreement No. DE–A126–05NT42496.
References Cited
Archer, D., 2007, Methane hydrate stability and anthropogenic climate change: Biogeoscience, v. 5, p. 5,321−5,344.
Backus, G.E., 1962, Long-wave elastic anisotropy produced by horizontal layering: Journal of Geophysical Research, v. 67, p. 4,427–4,440.
Collett, T.S., 2000, Quantitative well-log analysis of in-situ natural gas hydrates: Golden, Colorado School of Mines, Ph.D. dissertation, 535 p.
Collett, T.S., 2002, Energy resource potential of natural gas hydrates: American Association of Petroleum Geologists Bulletin, v. 86, p. 1,971–1,992.
Collett, T.S., Riedel, M., Cochran, J., and others, 2008, Indian National Gas Hydrate Program Expedition 01 initial reports: New Deli, India, Director General of Hydrocarbons, Minis-try of Petroleum and Natural Gas, variously paged.
Eshelby, J.D., 1957, The determination of elastic field of an ellipsoidal inclusion, and related problem: Proceedings of Royal Society, v. A241, p. 376–396.
Guerin, Gilles, Goldberg, D., and Melster, A., 1999, Charac-terization of in situ elastic properties of gas hydrate-bearing sediments on the Blake Ridge: Journal of Geophysical Research, v. 104, p. 17,781–17,796.
Helgerud, M.B., Dvorkin, J., Nur, A., Sakai, A., and Collett, T., 1999, Elastic-wave velocity in marine sediments with gas hydrates: Effective medium modeling: Geophysical Research Letters, v. 26, p. 2,021–2,024.
Helgerud, M.B., Waite, W.F., Kirby, S.H., and Nur, A., 2009, Elastic wave speeds and moduli in polycrystal-line ice Ih, sI methane hydrate, and sII methane-ethane hydrate: Journal of Geophysical Research, v. 114, B02212, doi:10.1029/2008JB006132.
Hudson, J.A., 1980, Overall properties of a cracked solid: Mathematical Proceedings of the Cambridge Philosophical Society, v. 88, p. 925–934.
Hyndman, R.D., Spence, G.D., Chapman, R., Riedel, M., and Edwards, R.N., 2001, Geophysical studies of marine gas hydrate in northern Cascadia, in Paul, C.K, and Dillon, W.P., eds., Natural gas hydrate: Occurrence, distribution, and detection: American Geophysical Union, Geophysical Monograph 124, p. 273–295.
Kvenvolden, K.A., 1993, A primer of gas hydrates, in Howell, D.G., ed., The future of energy gases: U.S. Geological Survey Professional Paper 1570, p. 555–561.
Lee, M.W., 2005, Well log analysis to assist the interpreta-tion of 3-D seismic data at the Milne Point, North Slope of Alaska: U.S. Geological Survey Scientific Investigations Report 2005–5048, 18 p.
Lee, M.W., 2007, Velocities and attenuations of gas hydrate-bearing sediments: U.S. Geological Survey Scientific Inves-tigations Report 2007–5264, 11 p.
Lee, M.W., 2008, Models for gas hydrate-bearing sediments inferred from hydraulic permeability and elastic veloci-ties: U.S. Geological Survey Scientific Investigations Report 2008–5219, 15 p.
Lee, M.W., and Collett, T.S., 2005, Assessments of gas hydrate concentrations estimated from sonic logs in the Mallik 5L–38 well, N.W.T., Canada, in Dallimore, S.R., and Collett, T.S., eds., Scientific results for Mallik 2002 gas hydrate production research well program, Mackenzie Delta, Northwest Territo-ries, Canada: Geological Survey of Canada, Bulletin 585, 10 p.
Lee, M.W., and Collett, T.S., 2009, Gas hydrate satu-rations estimated from fractured reservoir at Site NGHP–01–10, Krishna-Godavari Basin, India: Journal of Geophysical Research.
Lee, M.W., and Waite, W.F., 2008, Estimating pore-space gas hydrate saturations from well-log acoustic data: Geochemistry, Geophysics, Geosystems, v. 9, Q07008, doi:10,1029/2008GC002081, 8 p.

References Cited 13
Publishing support provided by: Denver Publishing Service Center, Denver, Colorado Manuscript approved for publication, April 2, 2009 Edited by Tom Judkins Graphics and layout by Joy Monson
For more information concerning this publication, contact: Team Chief Scientist, USGS Central Energy Resources Box 25046, Mail Stop 939 Denver, CO 80225 (303) 236-1647
Or visit the Central Energy Resources Team Web site at: http://energy.cr.usgs.gov/
This publication is available online at: http://pubs.usgs.gov/sir/2009/5141/
Mindlin, R.D., 1949, Compliance of elastic bodies in con-tact: Journal of Applied Mechanics Transactions, v. 71, p. 259–268.
Nixon, M.F., and Grozic, J.L.M., 2007, Submarine slope fail-ure due to gas hydrate dissociation: a preliminary quantifi-cation: Canadian Geotechnical Journal, v. 44, p. 314−325.
Postma, G.W., 1955, Wave propagation in a stratified medium: Geophysics, v. 20, p. 780–806.
Pride, S.R., Berryman, J.G., and Harris, J.M., 2004, Seismic attenuation to wave-induced flow: Journal of Geophysical Research, v. 109, B01201, doi :10.1029/2003JB002639.
Rao, Y.H., 2001, Gas hydrate investigations along the conti-nental margins of India: Hyderabad, India, National Geo-physical Research Institute, Ph. D. dissertation, 184 p.
Ruppel, Carolyn, 2007, Tapping methane hydrates for uncon-ventional natural gas: Elements, v. 3, p. 193–199.
Thomsen, Leon, 1986, Weak elastic anisotropy: Geophysics, v. 51, p. 1,954–1,966.
Thomsen, Leon, 1995, Elastic anisotropy due to aligned cracks in porous rock: Geophysical Prospecting, v. 43, p. 805–829.
Walsh, J.P., 1969, New analysis of attenuation in partially melted rock: Journal of Geophysical Research, v. 17, p. 4,333–4,337.
Watt, J.P., Davies, G.F., and O’Connell, R., 1976, The elastic properties of composite material: Review of Geophysics and Space Physics, v. 14, p. 541–570.
White, J.E., 1965, Seismic waves—radiation, transmission, and attenuation: New York, McGraw-Hill, 302 p.
White, J.E., and Angona, F.A., 1955, Elastic wave velocities in laminated media: Journal of Acoustical Society of America, v. 27, p. 310–317.

Lee—A
nisotropic Velocities of Gas H
ydrate-Bearing Sedim
ents in Fractured Reservoirs—Scientific Investigations Report 2009–5141