andrew street, jacqueline o’reilly, padraic ward and anne...
TRANSCRIPT
chapter sevenDRG-based hospital payment and effi ciency: Theory, evidence, and challenges
Andrew Street, Jacqueline O’Reilly,
Padraic Ward and Anne Mason
7.1 Introduction
Diagnosis-related groups (DRGs) were fi rst used to pay hospitals in 1983 under the Medicare Program in the United States. This development was born out of a need to move away from an approach to hospital fi nancing based on fee-for-service payments, which was seen as inherently ineffi cient and increasingly expensive. Since then, DRG-based hospital payment has been widely adopted internationally with the explicit objective of improving effi ciency, principally because of its three overarching strengths, summarized here (see Chapter 2 for further details).
1. By relating provider revenue directly to their workload, DRG-based hospital payment offers greater transparency in the fi nancing of health care.
2. Payments are based on patient characteristics (predominantly demographic and clinical). Fundamental to effective DRG-based hospital payment is an accurate description of the type of patients treated (casemix).
3. DRG-based hospital payment is a form of ‘yard stick competition’, designed to encourage greater effi ciency in the absence of market competition.
Concentrating on the third strength, this chapter considers the relationship between DRG-based hospital payment and effi ciency from theoretical and empirical perspectives. It thus fi rst discusses the concepts ‘effi ciency’ and ‘yard stick competition’. Different hospital payment models are then compared in section 7.2, with the intention of indicating in each case the incentives for hospitals to pursue effi cient behaviour, particularly in terms of maximizing
94 Diagnosis-Related Groups in Europe
output and minimizing cost. The empirical evidence regarding the impact of DRG-based hospital payment on effi ciency is reviewed in section 7.3 by look-ing at studies that consider effi ciency as defi ned by economists and those that focus on indicators of effi cient practice. Finally, the chapter outlines in section 7.4 some key challenges associated with the use of DRG-based hospital pay-ment. While economic theory suggests that this hospital payment system may provide incentives to encourage effi ciency, there could be barriers (such as the system’s particular design and operation) to realizing these incentives in practice.
‘Effi ciency’ is a widely used term that can have various meanings. Economists make distinctions between technical, cost- and allocative effi ciency. Technical effi ciency is defi ned as maximizing output for given input levels or, in this context, treating as many patients as possible given the resources available. Hospitals are cost-effi cient when they minimize costs for any given output level (closely related to, but distinct from, technical effi ciency). Allocative effi ciency can be defi ned for both outputs and inputs. The optimal output mix depends on the value of each output, which requires judgements to be made on the relative values of an appendectomy operation, a heart bypass and all other health care interventions. The optimal mix of inputs depends on the relative price of each input type, such as the salaries of doctors and nurses. Alongside these economic terms, reference is often made to things thought to be indicative of effi cient behaviour, which – in the hospital sector – might include the number and type of patients treated, unit costs and length of stay, for example. The extent to which DRGs contribute to achieving these forms of effi ciency depends on how they are used for payment purposes, which helps to determine the incentives hospitals face to pursue effi cient behaviour.
Yard stick competition is designed to encourage providers to reduce their costs in contexts in which they face limited competitive pressure (Shleifer, 1985). If providers outperform others they benefi t directly by retaining the generated fi nancial surplus; if they underperform they generate defi cits and, ultimately, risk bankruptcy. All providers, including the most effi cient, are incentivized to continually reduce costs. Yard stick competition is effective when regulated prices are virtually independent of an individual provider’s costs. Ideally, prices should refl ect the supply costs of effi cient providers, determined across all providers within the same industry.
However, it is not straightforward to identify effi cient providers, especially if the regulator is poorly informed about the provider’s costs, the exogenous infl uences on these costs and the level of effort expended by the provider (that is, their effi ciency). This asymmetry of information is particularly problematic in the health care sector. In practice, price is often determined on the basis of the average cost of all or a sample of providers (see Chapter 5), although it may remain preferable to base it on ‘best practice’, set at the level of effi cient high-quality providers that deliver care at costs below the average costs in other hospitals. In England, such ‘best practice tariffs’ have recently been introduced for certain high-volume areas (such as cholecystectomy, hip fractures, cataracts, and stroke), with signifi cant unexplained variation in quality of clinical practice and clear evidence of what constitutes best practice (see Chapter 12).
DRG-based hospital payment and effi ciency 95
7.2 Hospital payment models
To understand the role of DRG-based hospital payment in enhancing effi ciency, we compare (simplifi ed versions of) the three main forms of provider payment models used in hospital fi nancing: cost-based reimbursement (also known as fee-for-service payment), the global budget model, and DRG-based payment.
7.2.1 Cost-based or fee-for-service reimbursement
With cost-based reimbursement, payments to hospitals are based on the cost incurred by each individual patient (plus potentially a profi t margin). The main method of cost control is to specify a price list that details the unit payment for each ‘item of service’ (for example, medication, X-ray, procedure). Hospitals must therefore provide itemized bills for every patient treated, but there is no incentive to limit what treatments they provide per insured patient – the more diagnostic tests they perform, the more they get paid.
Stated formally, with cost-based reimbursement, hospital revenue (RC) amounts to the number of patients treated (Qi) multiplied by the unit cost of treatment (ci), where i indicates a particular patient:
∑I
[Qi × ci] + ZCRC =
i = 1
(1)
ZC captures all other forms of revenue that hospitals receive, such as funds for teaching and research. In the hospital sector, cost-based reimbursement was primarily used in the United States during the 1960s and 1970s. This fuelled escalation in health care costs as hospitals engaged in a ‘medical arms race’, spending ever more on technologies and facilities to attract patients. Hospitals knew that they could reclaim the costs from health insurance companies as well as Medicare and Medicaid, the public insurance programmes for older people and those with low incomes.
7.2.2 Global budgets
Cost control is one of the key advantages of global budget arrangements, which have been used in many European health care systems, at least if the budget constraint is credible and binding, and a separation exists between a payer (also known as ‘purchaser’) and hospitals as providers of care. This division has traditionally been present in social health insurance systems and, since the 1990s, increasingly also in tax-funded systems (Robinson et al., 2005). A fi xed payment is agreed in advance for a target level of activity – often specifi ed at specialty level. Figure 7.1 illustrates the case in which a hospital receives a fi xed payment (R
–) for
carrying out a pre-specifi ed volume of health service activity (Q). Diffi culties arise if there are deviations from the pre-specifi ed volume. Some
form of penalty must be imposed if the volume is not achieved. If the pre-specifi ed volume – usually defi ned as the number of hospital cases – is exceeded

96 Diagnosis-Related Groups in Europe
(‘overperformance’), the funder must either provide extra money or the hospital will refuse to do extra work, thereby creating waiting lists. ‘Cost and volume’ contracts were developed to deal with these problems, and we return to a DRG-based hospital payment form of these in the following subsection (7.2.3).
In more advanced global budget systems, activity is specifi ed by specialty. Negotiations between the payer (whether this is a sickness fund or a health authority) and the hospital revolve around the monetary value of each specialty-level contract (Bs) and how much activity (Qs) – usually defi ned as cases per specialty – will be provided under this contract. The local specialty-level price ( ps) is the by-product of negotiations relating to total contract value and the volume of activity. In formal terms, with the approach to fi nancing that uses global budgets, hospital revenue comprises the sum of its contracts across specialties (Bs):
∑ ∑RG = Bs + ZG = [Qs × ps] + ZGS
s = 1 s = 1
S
(2)
where ZG captures all other forms of revenue that hospitals receive within the framework of these payment arrangements.
7.2.3 DRG-based hospital payment
There are two key features of DRG-based hospital payment. (1) Activity is de-scribed using DRGs rather than by specialty. For instance, payment is made for a patient receiving a hip replacement rather than a patient treated in trauma and orthopaedics. (2) The reimbursement per DRG is to a large extent fi xed in
Figure 7.1 Hospital revenues under global budgets
Source: Street et al., 2007.

DRG-based hospital payment and effi ciency 97
advance, as patient characteristics (especially the main diagnosis) determine the DRG category with its fi xed ‘price’. As this constituted a major shift from the ‘retrospective’ system of cost-based reimbursement, payment by DRGs was thus termed ‘prospective’ in the United States – a term which was inappropriate for systems with a global budget approach to fi nancing (where instead ‘activity-based’ was used to describe the new payment system). As shown in Chapter 4, the ‘prospective’ nature of DRGs is also weaker if to a large extent procedures determine the DRG classifi cation. However, whether driven by diagnosis or pro-cedure, the ‘price’ of a DRG is wholly or at least partially independent of an individual provider’s costs (see Chapter 5). In many jurisdictions, this fi xed price is set nationally rather than locally (see Chapter 6).
The relationship between the unit price and amount of activity can take a number of forms. The main ones discussed here are:
1. linear payments, whereby the total payment equals price multiplied by quantity;
2. mixed payments, whereby hospitals receive additional payments (often in the form of lump sums) that are unrelated to activity levels;
3. marginal payments, whereby different prices are payable for the same type of activity, depending on the quantity provided;
4. mixed and marginal payments, which are a combination of (2) and (3).
To understand the differences between these payment arrangements, we con-sider how the total revenue received by a particular hospital is calculated.
Linear payments
With the most straightforward DRG-based hospital payment system, using linear payments, hospital revenue is determined simply by multiplying activity in each DRG (Qj) by the fi xed price per DRG ( p̂j), where j indicates a DRG:
∑j = 1
]ˆ[Qj ×RA = pj
J
(3)
Using this formulation, hospital revenue increases linearly with activity, as illustrated in Figure 7.2. If the hospital treats Q0 patients it receives revenue amounting to only R0; if Q1 patients are treated, revenue increases to R1. Clearly, then, the revenue consequences of changes in activity are much more trans-parent than within a system based on global budget arrangements.
Mixed payments
In almost all countries that have introduced DRG-based hospital payment, hos-pital revenue is not determined solely by the number of patients treated. Hos-pitals also receive revenue in other forms – for instance, to fund teaching and research, to compensate for different geographical costs, or to cover some ele-ment of the fi xed costs of providing services. It has been formally demonstrated that such a ‘mixed’ hospital payment system creates better incentives than ‘pure’ systems (Ellis & McGuire, 1986; Barnum et al., 1995). The composition

98 Diagnosis-Related Groups in Europe
of these other revenue forms is a matter of negotiation between the payer (or ‘purchaser’) and the hospital sector, and may vary between hospitals, between countries and over time. We defi ne ZA as capturing all these sources of revenue not related to health care activity within the category ‘DRG-based hospital pay-ment’. Then the revenue function becomes:
[Qj × pj] + ZA= ∑RA ˆj = 1
J
(4)
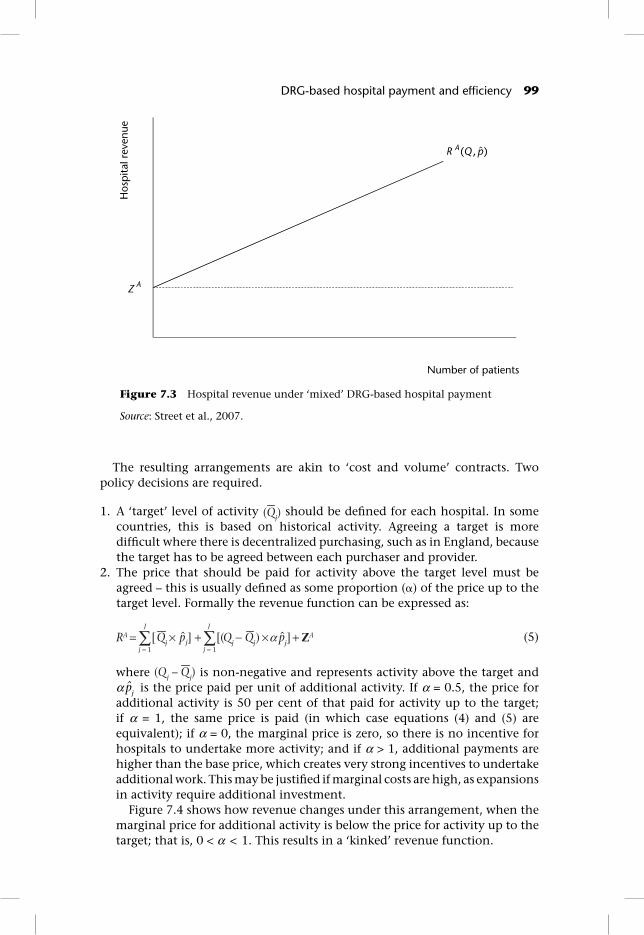
Figure 7.3 shows how this arrangement changes the relationship between revenue and activity. Hospitals receive a fi xed amount ZA irrespective of the number of patients treated. On top of this, hospitals receive revenue in line with activity – but the unit price (p̂j) will be lower within the framework of this ‘mixed’ arrangement than within a ‘pure’ DRG-based system.
Marginal payments
DRG-based hospital payment can be modifi ed to allow incentives to vary with supply. Quite often, DRG-based hospital payment is introduced to stimulate activity beyond existing levels. But unconstrained growth in activity may be undesirable. First, it undermines control over global expenditure – under the simple formulation (see equation (3)), expenditure may simply keep rising in line with activity. Second, hospitals may be able to expand activity at low marginal cost – perhaps because they have underutilized resources available – and, thus, this differential pricing may be used to exploit economies of scale. If so, there is an argument for reducing the unit price for additional activity.
Figure 7.2 Hospital revenue under ‘pure’ DRG-based hospital payment
Source: Street et al., 2007.
DRG-based hospital payment and effi ciency 99
The resulting arrangements are akin to ‘cost and volume’ contracts. Two policy decisions are required.
1. A ‘target’ level of activity (Qj) should be defi ned for each hospital. In some countries, this is based on historical activity. Agreeing a target is more diffi cult where there is decentralized purchasing, such as in England, because the target has to be agreed between each purchaser and provider.
2. The price that should be paid for activity above the target level must be agreed – this is usually defi ned as some proportion (�) of the price up to the target level. Formally the revenue function can be expressed as:
∑ ∑ +×+×= ])[(][ α ZAˆjp p̂jQj Qj − QjRA
j = 1 j = 1
J J
(5)
where (Qj – Qj) is non-negative and represents activity above the target and α p̂j is the price paid per unit of additional activity. If α = 0.5, the price for additional activity is 50 per cent of that paid for activity up to the target; if α = 1, the same price is paid (in which case equations (4) and (5) are equivalent); if α = 0, the marginal price is zero, so there is no incentive for hospitals to undertake more activity; and if α > 1, additional payments are higher than the base price, which creates very strong incentives to undertake additional work. This may be justifi ed if marginal costs are high, as expansions in activity require additional investment.
Figure 7.4 shows how revenue changes under this arrangement, when the marginal price for additional activity is below the price for activity up to the target; that is, 0 < α < 1. This results in a ‘kinked’ revenue function.
Figure 7.3 Hospital revenue under ‘mixed’ DRG-based hospital payment
Source: Street et al., 2007.

100 Diagnosis-Related Groups in Europe
7.2.4 Summary
Table 7.1 summarizes the main differences between the three hospital payment systems. Of course, it is important to be cognisant that the hospital payment systems implemented in practice are usually more complicated variants of the simplifi ed models in the previous subsections.
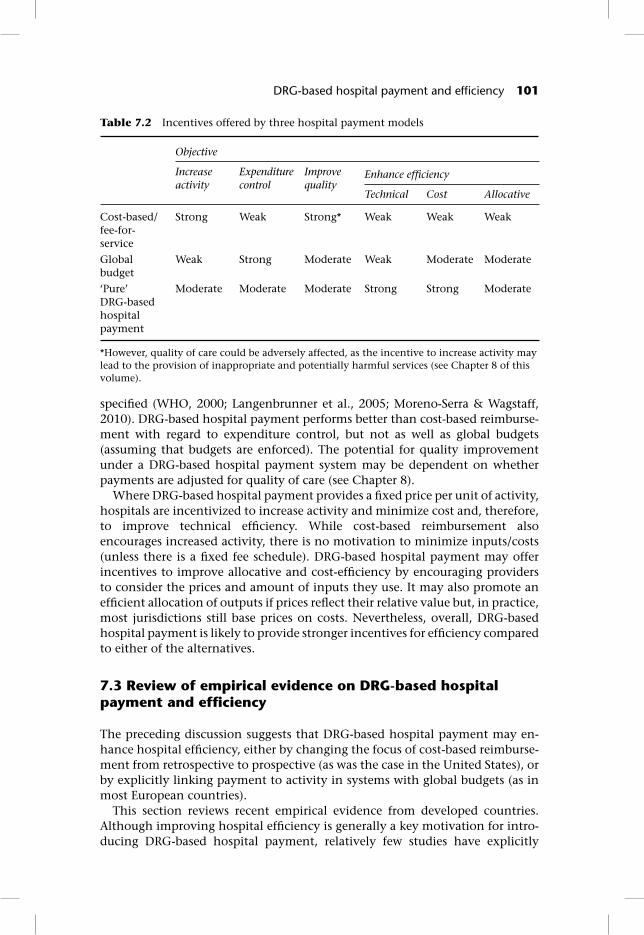
The three models offer different incentives for achieving objectives relating to activity levels, expenditure control, quality of care and the three types of effi ciency (Table 7.2). Incentives to increase activity exist in both cost-based and DRG-based hospital payment systems, with the relative strength of the incentives depending on how closely the link between reimbursement and activity levels is
Figure 7.4 Hospital revenue under ‘mixed’ DRG-based hospital payment with marginal pricing
Source: Street et al., 2007.
Table 7.1 Main differences across hospital payment systems
System Description of patients
Amount of activity
Price per unit of activity
Basic formulation of revenue function
Cost-based/fee-for-service
Individual Unrestricted Item of service ∑ [Qi × ci]RC =
i = 1
I
Global budget Per hospital/ specialty
Target/ historical
Locally agreed
1 1
S S
s s= =∑ ∑ [Qs × ps]RG = Bs =
‘Pure’ DRG-based hospital payment
DRG Unrestricted Fixed prospectively [Qj × pj]∑
=j 1
ˆRA = J
Source: Adapted from Street et al., 2007.
DRG-based hospital payment and effi ciency 101
specifi ed (WHO, 2000; Langenbrunner et al., 2005; Moreno-Serra & Wagstaff, 2010). DRG-based hospital payment performs better than cost-based reimburse-ment with regard to expenditure control, but not as well as global budgets (assuming that budgets are enforced). The potential for quality improvement under a DRG-based hospital payment system may be dependent on whether payments are adjusted for quality of care (see Chapter 8).
Where DRG-based hospital payment provides a fi xed price per unit of activity, hospitals are incentivized to increase activity and minimize cost and, therefore, to improve technical effi ciency. While cost-based reimbursement also encourages increased activity, there is no motivation to minimize inputs/costs (unless there is a fi xed fee schedule). DRG-based hospital payment may offer incentives to improve allocative and cost-effi ciency by encouraging providers to consider the prices and amount of inputs they use. It may also promote an effi cient allocation of outputs if prices refl ect their relative value but, in practice, most jurisdictions still base prices on costs. Nevertheless, overall, DRG-based hospital payment is likely to provide stronger incentives for effi ciency compared to either of the alternatives.
7.3 Review of empirical evidence on DRG-based hospital payment and effi ciency
The preceding discussion suggests that DRG-based hospital payment may en-hance hospital effi ciency, either by changing the focus of cost-based reimburse-ment from retrospective to prospective (as was the case in the United States), or by explicitly linking payment to activity in systems with global budgets (as in most European countries).
This section reviews recent empirical evidence from developed countries. Although improving hospital effi ciency is generally a key motivation for intro-ducing DRG-based hospital payment, relatively few studies have explicitly
Table 7.2 Incentives offered by three hospital payment models
Objective
Increase activity
Expenditure control
Improve quality
Enhance effi ciency
Technical Cost Allocative
Cost-based/ fee-for-service
Strong Weak Strong* Weak Weak Weak
Global budget
Weak Strong Moderate Weak Moderate Moderate
‘Pure’ DRG-based hospital payment
Moderate Moderate Moderate Strong Strong Moderate
*However, quality of care could be adversely affected, as the incentive to increase activity may lead to the provision of inappropriate and potentially harmful services (see Chapter 8 of this volume).

102 Diagnosis-Related Groups in Europe
identifi ed and quantifi ed its impact. Rather, most research has concentrated on indicators of effi ciency – such as activity and costs – which are more easily mea-sured, but by defi nition provide only a partial picture. It is important to note, moreover, that the different starting points in the United States and Europe also imply different hypotheses about the impact of DRG-based payment; that is, moving from cost-based reimbursement to DRGs weakens the activity incentive and strengthens the expenditure control incentive – while the opposite is the case when moving from global budgets to DRG-based payment.
7.3.1 Impact on effi ciency
Studies of the impact of DRG-based payment on hospital-level effi ciency typically focus on technical effi ciency and/or the broader concept of productiv-ity (which incorporates scale, as well as technical, effi ciency; see Coelli et al., 2005; Street & Häkkinen, 2010). Data envelopment analysis (DEA) – a well-established non-parametric method – is the most commonly applied approach, although some studies use regression-based (parametric) stochastic frontier analysis. Both methods have advantages and disadvantages (inter alia, Jacobs et al., 2006; Street & Häkkinen, 2010; Street et al., 2010) yet, reassuringly, stud-ies that applied both techniques produce broadly consistent results (Gerdtham et al., 1999a, b; Dismuke & Sena, 1999).
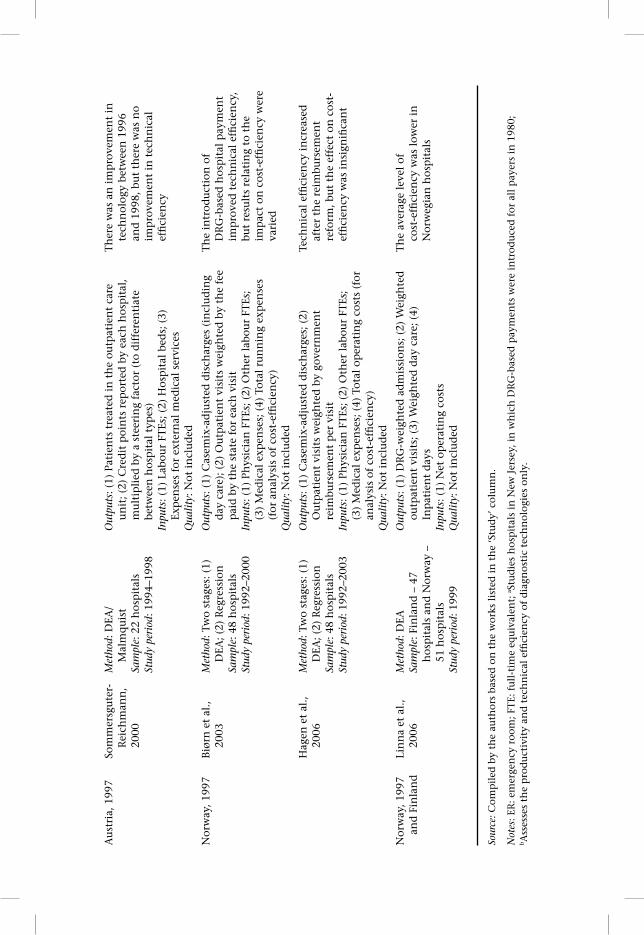
Given the challenges inherent in undertaking cross-country effi ciency com-parisons, all but two of the studies summarized in Table 7.3 adopted a longitudi-nal perspective, comparing hospital effi ciency before and after the introduction of a DRG system. However, the length of follow-up periods varies, complicating interpretation: where the time horizon is short, changes may not be sustained; conversely, a longer time frame may fail to establish a causal relationship, par-ticularly if other reforms are implemented in the interim. Several studies expli-citly highlight the diffi culty in attributing changes in effi ciency, or any of its indicators, to the introduction of DRG-based payment (Farrar et al., 2007; Audit Commission, 2008). Moreover, few studies assess the quality of care, despite the potential trade-off between quality and effi ciency (see Chapter 8 of this volume).
Methodological caveats aside, fi ndings relating to the impact of DRG-based payment on hospital effi ciency are mixed. The reformed hospital payment system was associated with improved technical effi ciency in Portugal (albeit narrowly assessed; Dismuke & Sena, 1999, 2001), Sweden (Gerdtham et al., 1999a, b) and Norway (Biørn et al., 2003; Hagen et al., 2006). By contrast, no positive impact was observed in the United States (Borden, 1988; Chern & Wan, 2000) and there were technological improvements but no technical effi ciency gains in Austria (Sommersguter-Reichmann, 2000). The limited evidence on time-series changes to cost-effi ciency – confi ned to Norwegian data – is also mixed (Biørn et al., 2003; Hagen et al., 2006). These divergent results may be explained by the country-specifi c starting points and contexts in which the hospital payment reforms were implemented, including different incumbent reimbursement mechanisms, the specifi cation of DRG-based payment, and/or the simultaneous introduction of other health care reforms.

Ta
ble
7.3
Su
mm
ary
of r
ecen
t st
ud
ies
exam
inin
g th
e im
pac
t of
DR
G-b
ased
hos
pit
al p
aym
ent
on h
osp
ital
effi
cie
ncy
Cou
ntry
, Yea
r of
ch
ange
to
DR
G-
base
d ho
spit
al
paym
ent
Stud
yM
etho
dolo
gyV
aria
bles
Res
ults
/Con
clus
ions
Un
ited
Sta
tes,
19
83B
ord
en, 1
988a
Met
hod:
DEA
, rat
io a
nd
re
gres
sion
an
alys
is
Sam
ple:
52 h
osp
ital
s in
N
ew J
erse
ySt
udy
peri
od: 1
979–
1984
Out
puts
: (1)
Cas
es t
reat
ed i
n e
ach
of
the
eigh
t D
RG
ca
tego
ries
wit
h t
he
hig
hes
t vo
lum
es; (
2) C
ases
tr
eate
d i
n t
he
rem
ain
ing
DR
G c
ateg
orie
sIn
puts
: (1)
Tot
al F
TEs
; (2)
Nu
rsin
g FT
Es; (
3) O
ther
non
-p
ayro
ll e
xpen
ses;
(4)
Bed
sQ
ualit
y: N
ot i
ncl
ud
ed
Th
e h
osp
ital
pay
men
t re
form
did
n
ot h
ave
a p
osit
ive
effe
ct o
n
tech
nic
al e
ffi c
ien
cy
Ch
ern
& W
an,
2000
Met
hod:
DEA
Sam
ple:
80
hos
pit
als
in
Vir
gin
iaSt
udy
peri
od: 1
984
& 1
993
Out
puts
: (1)
Cas
emix
-ad
just
ed i
np
atie
nt
dis
char
ges;
(2
) V
isit
s to
th
e ER
an
d o
utp
atie
nt
faci
liti
esIn
puts
: (1)
Bed
s an
d s
ervi
ce c
omp
lexi
ty; (
2) N
on-
ph
ysic
ian
FT
Es a
nd
wei
ghte
d n
um
ber
of p
art-
tim
e p
erso
nn
el; (
3) O
per
atin
g ex
pen
ses
excl
ud
ing
pay
roll
, cap
ital
an
d d
epre
ciat
ion
Qua
lity:
Not
in
clu
ded
Th
ere
was
no
stat
isti
call
y si
gnifi
can
t d
iffe
ren
ce i
n
tech
nic
al e
ffi c
ien
cy b
etw
een
19
84 a
nd
199
3, b
ut
the
per
cen
tage
of
effi
cien
t h
osp
ital
s w
as h
igh
er i
n 1
993
Port
uga
l, 1
990
Dis
mu
ke &
Se
na,
199
9b
Met
hod:
Tw
o st
ages
: (1)
D
EA a
nd
max
imu
m
like
lih
ood
est
imat
ion
of
sto
chas
tic
inp
ut
req
uir
emen
t fr
onti
er;
(2)
Reg
ress
ion
Sam
ple:
2 D
RG
s: (
1) H
eart
Fa
ilu
re a
nd
Sh
ock;
(2)
Sp
ecifi
c C
ereb
rova
scu
lar
Dis
ord
ers
exce
pt
Tran
sien
t Is
chae
mic
A
ttac
kSt
udy
peri
od: 1
992–
1994
Out
puts
: (1)
Nu
mbe
r of
liv
e d
isch
arge
s w
ith
in e
ach
D
RG
; (2)
Nu
mbe
r of
dea
d d
isch
arge
s w
ith
in e
ach
D
RG
Inpu
ts: U
tili
zati
on o
f: (
1) C
AT
sca
nn
er;
(2)
Elec
troc
ard
iogr
am; (
3) E
choc
ard
iogr
amQ
ualit
y: D
isti
ngu
ish
es b
etw
een
des
irab
le o
utp
uts
(l
ive
dis
char
ges)
an
d u
nd
esir
able
ou
tpu
ts (
dea
d
dis
char
ges)
Perc
enta
ge p
aid
th
rou
gh D
RG
s h
ad a
pos
itiv
e im
pac
t on
p
rod
uct
ivit
y
Con
tinu
ed o
verl
eaf

Cou
ntry
, Yea
r of
ch
ange
to
DR
G-
base
d ho
spit
al
paym
ent
Stud
yM
etho
dolo
gyV
aria
bles
Res
ults
/Con
clus
ions
Port
uga
l, 1
990
Dis
mu
ke &
Se
na,
200
1b
Met
hod:
Mal
mq
uis
t-Lu
enbe
rger
in
dex
Sa
mpl
e: 2
DR
Gs
Stud
y pe
riod
: 199
2–19
94
Out
puts
: (1)
Nu
mbe
r of
liv
e d
isch
arge
s w
ith
in e
ach
D
RG
; (2)
Nu
mbe
r of
dea
d d
isch
arge
s w
ith
in e
ach
D
RG
Inpu
ts: U
tili
zati
on o
f: (
1) C
AT
sca
nn
er;
(2)
Elec
troc
ard
iogr
am; (
3) E
choc
ard
iogr
amQ
ualit
y: A
s p
er D
ism
uke
& S
ena,
199
9
DR
G-b
ased
pay
men
t ap
pea
rs
to h
ave
imp
rove
d t
he
pro
du
ctiv
ity
of t
he
dia
gnos
tic
tech
nol
ogie
s co
nsi
der
ed
Swed
en, E
arly
19
90s
Ger
dth
am
et a
l., 1
999b
Met
hod:
Tw
o st
ages
: (1)
M
odifi
ed
DEA
; (2)
R
egre
ssio
nSa
mpl
e: 2
6 co
un
ty
cou
nci
lsSt
udy
peri
od: 1
993
& 1
994
Out
puts
: (1)
Su
rgic
al d
isch
arge
s; (
2) S
hor
t-te
rm
inte
rnal
med
icin
e d
isch
arge
s; (
3) S
urg
ical
op
erat
ion
s in
sh
ort-
term
car
e; (
4) P
hys
icia
n v
isit
s in
sh
ort-
term
su
rgic
al c
are;
(5)
Ph
ysic
ian
vis
its
in
inte
rnal
med
icin
eIn
puts
: (1)
Tot
al c
ost
for
shor
t-te
rm c
are;
(2)
Bed
sQ
ualit
y: N
ot i
ncl
ud
ed
Hos
pit
al s
ervi
ces
wer
e m
ore
effi
cien
t in
cou
nty
cou
nci
ls
wit
h i
nte
rnal
mar
kets
an
d
outp
ut-
base
d r
eim
burs
emen
t,
com
par
ed t
o th
ose
wit
h
a bu
dge
t-ba
sed
ap
pro
ach
. Po
ten
tial
cos
t-sa
vin
gs o
f ap
pro
xim
atel
y 13
% b
y sw
itch
ing
from
bu
dge
t- t
o ou
tpu
t-ba
sed
rei
mbu
rsem
ent
Ger
dth
am
et a
l., 1
999a
Met
hod:
Mu
ltip
le-o
utp
ut
stoc
has
tic
ray
fron
tier
m
odel
Sam
ple:
26
cou
nty
co
un
cils
Stud
y pe
riod
: 19
89–1
995
Dep
ende
nt v
aria
bles
: (1)
Op
erat
ion
s; (
2) D
isch
arge
s;
(3)
Phys
icia
n v
isit
sIn
depe
nden
t va
riab
les:
(1)
Cos
t; (
2) A
vail
able
bed
s;
(3)
Year
; (4)
Var
iabl
es t
o ca
ptu
re t
he
lead
eff
ects
of
refo
rm; (
5) V
aria
bles
for
th
e n
ew r
eim
burs
emen
t sy
stem
; (6)
Pol
itic
al m
ajor
ity;
(7)
Pro
por
tion
of
pop
ula
tion
age
d o
ver
70 y
ears
; (8)
Pro
por
tion
of
pri
vate
vis
its;
(9)
Un
iver
sity
hos
pit
alQ
ualit
y: N
ot i
ncl
ud
ed
Mov
e to
ou
tpu
t-ba
sed
hos
pit
al
pay
men
t in
crea
sed
tec
hn
ical
ef
fi ci
ency
by
9.7%
on
ave
rage
Ta
ble
7.3
C
onti
nued
Cou
ntry
, Yea
r of
ch
ange
to
DR
G-
base
d ho
spit
al
paym
ent
Stud
yM
etho
dolo
gyV
aria
bles
Res
ults
/Con
clus
ions
Au
stri
a, 1
997
Som
mer
sgu
ter-
Rei
chm
ann
, 20
00
Met
hod:
DEA
/
Mal
mq
uis
tSa
mpl
e: 2
2 h
osp
ital
sSt
udy
peri
od: 1
994–
1998
Out
puts
: (1)
Pat
ien
ts t
reat
ed i
n t
he
outp
atie
nt
care
u
nit
; (2)
Cre
dit
poi
nts
rep
orte
d b
y ea
ch h
osp
ital
, m
ult
ipli
ed b
y a
stee
rin
g fa
ctor
(to
dif
fere
nti
ate
betw
een
hos
pit
al t
ypes
)In
puts
: (1)
Lab
our
FTEs
; (2)
Hos
pit
al b
eds;
(3)
Ex
pen
ses
for
exte
rnal
med
ical
ser
vice
sQ
ualit
y: N
ot i
ncl
ud
ed
Th
ere
was
an
im
pro
vem
ent
in
tech
nol
ogy
betw
een
199
6 an
d 1
998,
bu
t th
ere
was
no
imp
rove
men
t in
tec
hn
ical
ef
fi ci
ency
Nor
way
, 199
7B
iørn
et
al.,
2003
Met
hod:
Tw
o st
ages
: (1)
D
EA; (
2) R
egre
ssio
nSa
mpl
e: 4
8 h
osp
ital
sSt
udy
peri
od: 1
992–
2000
Out
puts
: (1)
Cas
emix
-ad
just
ed d
isch
arge
s (i
ncl
ud
ing
day
car
e); (
2) O
utp
atie
nt
visi
ts w
eigh
ted
by
the
fee
pai
d b
y th
e st
ate
for
each
vis
itIn
puts
: (1)
Ph
ysic
ian
FT
Es; (
2) O
ther
lab
our
FTEs
; (3
) M
edic
al e
xpen
ses;
(4)
Tot
al r
un
nin
g ex
pen
ses
(for
an
alys
is o
f co
st-e
ffi c
ien
cy)
Qua
lity:
Not
in
clu
ded
Th
e in
trod
uct
ion
of
DR
G-b
ased
hos
pit
al p
aym
ent
imp
rove
d t
ech
nic
al e
ffi c
ien
cy,
but
resu
lts
rela
tin
g to
th
e im
pac
t on
cos
t-ef
fi ci
ency
wer
e va
ried
Hag
en e
t al
., 20
06M
etho
d: T
wo
stag
es: (
1)
DEA
; (2)
Reg
ress
ion
Sam
ple:
48
hos
pit
als
Stud
y pe
riod
: 199
2–20
03
Out
puts
: (1)
Cas
emix
-ad
just
ed d
isch
arge
s; (
2)
Ou
tpat
ien
t vi
sits
wei
ghte
d b
y go
vern
men
t re
imbu
rsem
ent
per
vis
itIn
puts
: (1)
Ph
ysic
ian
FT
Es; (
2) O
ther
lab
our
FTEs
; (3
) M
edic
al e
xpen
ses;
(4)
Tot
al o
per
atin
g co
sts
(for
an
alys
is o
f co
st-e
ffi c
ien
cy)
Qua
lity:
Not
in
clu
ded
Tech
nic
al e
ffi c
ien
cy i
ncr
ease
d
afte
r th
e re
imbu
rsem
ent
refo
rm, b
ut
the
effe
ct o
n c
ost-
effi
cien
cy w
as i
nsi
gnifi
can
t
Nor
way
, 199
7 an
d F
inla
nd
Lin
na
et a
l.,
2006
Met
hod:
DEA
Sam
ple:
Fin
lan
d –
47
hos
pit
als
and
Nor
way
–
51 h
osp
ital
sSt
udy
peri
od: 1
999
Out
puts
: (1)
DR
G-w
eigh
ted
ad
mis
sion
s; (
2) W
eigh
ted
ou
tpat
ien
t vi
sits
; (3)
Wei
ghte
d d
ay c
are;
(4)
In
pat
ien
t d
ays
Inpu
ts: (
1) N
et o
per
atin
g co
sts
Qua
lity:
Not
in
clu
ded
Th
e av
erag
e le
vel
of
cost
-effi
cie
ncy
was
low
er i
n
Nor
weg
ian
hos
pit
als
Sour
ce: C
omp
iled
by
the
auth
ors
base
d o
n t
he
wor
ks l
iste
d i
n t
he
‘Stu
dy’
col
um
n.
Not
es: E
R: e
mer
gen
cy r
oom
; FT
E: f
ull
-tim
e eq
uiv
alen
t; a S
tud
ies
hos
pit
als
in N
ew J
erse
y, i
n w
hic
h D
RG
-bas
ed p
aym
ents
wer
e in
trod
uce
d f
or a
ll p
ayer
s in
198
0;
b Ass
esse
s th
e p
rod
uct
ivit
y an
d t
ech
nic
al e
ffi c
ien
cy o
f d
iagn
osti
c te
chn
olog
ies
only
.
106 Diagnosis-Related Groups in Europe
Taking the fi rst of these, the potential for effi ciency gains may depend on the pre-existing hospital payment system. Thus, where global budgets preceded DRG-based payment (as in Sweden, Portugal and Norway, detailed in Table 7.3), hospitals’ technical effi ciency apparently improved (although Linna and colleagues (2006) found lower cost-effi ciency in Norwegian hospitals com-pared to their Finnish counterparts, despite the latter being understood to operate within a global budget framework). Conversely, DRG-based payment did not improve technical effi ciency when it replaced retrospective, cost-based reimbursement (as in the United States) or per diem payments (as in Austria).
This apparent greater potential for effi ciency gains when moving from global budgets cannot be regarded as defi nitive, because the operation of the national DRG-based payment system may itself act as a constraint. Hence, initial effi -ciency improvements in Sweden were subsequently negated when ceilings were imposed on hospital-activity levels (Gerdtham et al., 1999a, b; Anell, 2005; Kastberg & Siverbo, 2007), and analogous restrictions may also help to explain the lack of improvements in the United States and Austria (US Congress Offi ce of Technology Assessment, 1985; Sommersguter-Reichmann, 2000; Böcking et al., 2005). Finally, it is diffi cult to isolate the impact of DRG-based payment when it is introduced as part of a wider health care reform programme, as was the case in Sweden when an internal market was also established (Gerdtham et al., 1999a, b).
7.3.2 Impact on indicators of effi ciency: Activity, length of stay and costs
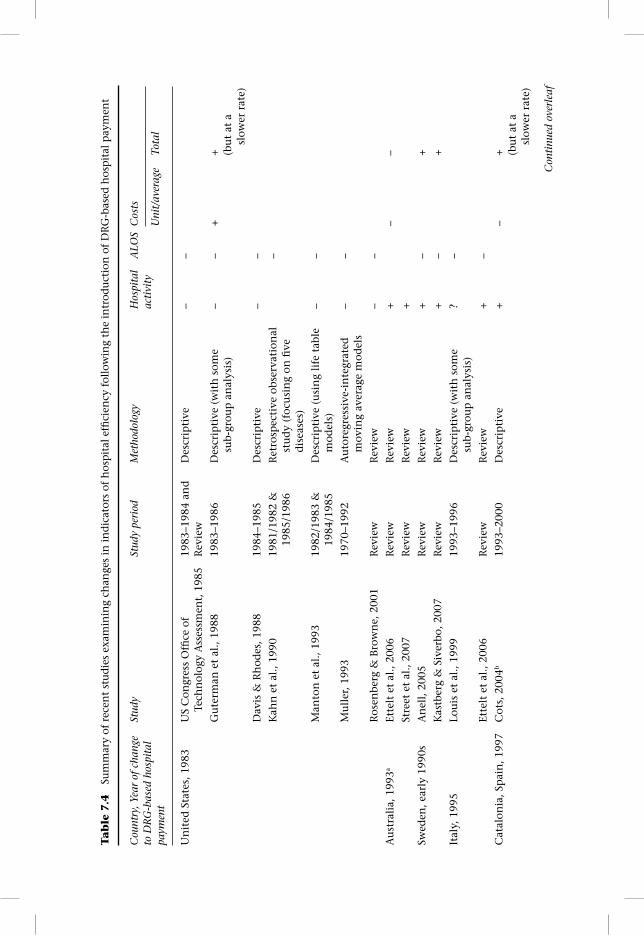
Table 7.4 summarizes studies that examined country-specifi c changes in indica-tors of effi ciency. Following the introduction of DRG-based payment, hospital admissions increased in Australia (Ettelt et al., 2006; Street et al., 2007), Denmark (Street et al., 2007), England (Farrar et al., 2007; Audit Commission, 2008; Farrar et al., 2009), France (Or, 2009), Germany (Böcking et al., 2005; Hensen et al., 2008), Norway (Biørn et al., 2003; Kjerstad, 2003; Hagen et al., 2006; Magnussen et al., 2007), Spain (Cots, 2004, cited in Ellis & Vidal-Fernández, 2007) and, at least initially, in Sweden (Anell, 2005; Kastberg & Siverbo, 2007). However, in line with the hypotheses derived from the incentives indicated in Table 7.2, activity did not increase in the United States (US Congress Offi ce of Technology Assess-ment, 1985; Davis & Rhodes, 1988; Guterman et al., 1988; Manton et al., 1993; Muller, 1993; Rosenberg & Browne, 2001). Results for Italy are mixed (Louis et al., 1999; Ettelt et al., 2006), while Moreoa-Serra & Wagstaff (2010) found no effect on activity countries in central and eastern Europe and central Asia that had in-troduced DRGs or other activity-based reimbursement systems. Of course, the aforementioned points regarding country-specifi c contexts and the diffi culties in assigning causality also apply here.
The fi na ncial incentive to minimize costs under DRG-based hospital payment has often contributed to a shift from inpatient to day-case and/or outpatient settings (for example, in the United States and England, see Rosenberg & Browne, 2001 and Farrar et al., 2009, respectively) – this may also improve the quality of care, as well as effi ciency, ceteris paribus. Indeed, DRG-based tariffs
Tab
le 7
.4
Sum
mar
y of
rec
ent
stu
dies
exa
min
ing
chan
ges
in in
dica
tors
of
hos
pit
al e
ffi c
ien
cy f
ollo
win
g th
e in
trod
uct
ion
of
DR
G-b
ased
hos
pit
al p
aym
ent
Cou
ntry
, Yea
r of
cha
nge
to D
RG
-bas
ed h
ospi
tal
paym
ent
Stud
ySt
udy
peri
odM
etho
dolo
gyH
ospi
tal
acti
vity
ALO
SC
osts
Uni
t/av
erag
eTo
tal
Un
ited
Sta
tes,
198
3U
S C
ongr
ess
Offi
ce
of
Tech
nol
ogy
Ass
essm
ent,
198
519
83–1
984
and
Rev
iew
Des
crip
tive
–
–
Gu
term
an e
t al
., 19
8819
83–1
986
Des
crip
tive
(w
ith
som
e su
b-gr
oup
an
alys
is)
––
++ (b
ut
at a
sl
ower
rat
e)
Dav
is &
Rh
odes
, 198
819
84–1
985
Des
crip
tive
––
Kah
n e
t al
., 19
9019
81/1
982
&
1985
/198
6R
etro
spec
tive
obs
erva
tion
al
stu
dy
(foc
usi
ng
on fi
ve
dis
ease
s)
–
Man
ton
et
al.,
1993
1982
/198
3 &
19
84/1
985
Des
crip
tive
(u
sin
g li
fe t
able
m
odel
s)
––
Mu
ller
, 199
319
70–1
992
Au
tore
gres
sive
-in
tegr
ated
m
ovin
g av
erag
e m
odel
s–
–
Ros
enbe
rg &
Bro
wn
e, 2
001
Rev
iew
Rev
iew
––
Au
stra
lia,
199
3aEt
telt
et
al.,
2006
Rev
iew
Rev
iew
+
––
Stre
et e
t al
., 20
07R
evie
wR
evie
w+
Swed
en, e
arly
199
0sA
nel
l, 2
005
Rev
iew
Rev
iew
+–
+
Kas
tber
g &
Siv
erbo
, 200
7R
evie
wR
evie
w+
–+
Ital
y, 1
995
Lou
is e
t al
., 19
9919
93–1
996
Des
crip
tive
(w
ith
som
e su
b-gr
oup
an
alys
is)
?–
Ette
lt e
t al
., 20
06R
evie
wR
evie
w+
–
Cat
alon
ia, S
pai
n, 1
997
Cot
s, 2
004b
1993
–200
0D
escr
ipti
ve+
–+ (b
ut
at a
sl
ower
rat
e)
Con
tinu
ed o
verl
eaf

Ta
ble
7.4
C
onti
nued
Cou
ntry
, Yea
r of
cha
nge
to D
RG
-bas
ed h
ospi
tal
paym
ent
Stud
ySt
udy
peri
odM
etho
dolo
gyH
ospi
tal
acti
vity
ALO
SC
osts
Uni
t/av
erag
eTo
tal
Nor
way
, 199
7B
iørn
et
al.,
2003
1992
–200
0D
escr
ipti
ve+
Kje
rsta
d, 2
003
1995
–199
8D
iffe
ren
ce-in
-dif
fere
nce
mod
el+
Hag
en e
t al
., 20
0619
92–2
000
Des
crip
tive
+M
agn
uss
en e
t al
., 20
07R
evie
wR
evie
w+
Au
stri
a, 1
997
Th
eurl
& W
inn
er, 2
007
1989
–200
3Ec
onom
etri
c m
odel
wit
h
fi xe
d e
ffec
ts–
Den
mar
k, 2
002
Stre
et e
t al
., 20
07R
evie
wR
evie
w+
Ger
man
y, 2
003
Böc
kin
g et
al.
, 200
5R
evie
wR
evie
w+
–
Sch
reyö
gg e
t al
., 20
0520
03–2
004
and
R
evie
wD
escr
ipti
ve–
Hen
sen
et
al.,
2008
c20
03–2
006
Des
crip
tive
+–
Engl
and
, 200
3/20
04Fa
rrar
et
al.,
2007
2002
/200
3 &
20
05/2
006
Dif
fere
nce
-in
-dif
fere
nce
fr
amew
ork
+–
–
Au
dit
Com
mis
sion
, 200
820
03/2
004
&
2006
/200
7D
escr
ipti
ve+
–?
Farr
ar e
t al
., 20
0920
03/2
004
&
2005
/200
6D
iffe
ren
ce-i
n-d
iffe
ren
ce
anal
ysis
+–
–
Fran
ce, 2
004/
2005
Or,
200
920
05 a
nd
Rev
iew
Des
crip
tive
+
OEC
D c
oun
trie
sFo
rgio
ne
& D
’An
nu
nzi
o, 1
999
1984
–198
6 &
19
94–1
996
Des
crip
tive
–+
Var
iou
s co
un
trie
s in
ce
ntr
al a
nd
eas
tern
Eu
rop
e as
wel
l as
ce
ntr
al A
sia
Mor
eno-
Serr
a &
Wag
staf
f, 2
010
1990
–200
4D
iffe
ren
ce-i
n-d
iffe
ren
ce
mod
el=
–+
Sour
ce: C
omp
iled
by
the
auth
ors
base
d o
n t
he
wor
ks l
iste
d i
n t
he
‘Stu
dy’
col
um
n.
Not
es: T
he
chan
ges
follo
win
g th
e in
trod
ucti
on o
f DR
G-b
ased
hos
pita
l pay
men
t ar
e de
not
ed b
y +
for
an in
crea
se, –
for
a de
crea
se, =
for
no
chan
ge, a
nd
? fo
r m
ixed
eff
ects
; a D
RG
-bas
ed h
ospi
tal p
aym
ent
was
intr
oduc
ed in
Vic
tori
a in
199
3; b
Not
inte
nde
d as
a s
tudy
of t
he
effe
ct o
f DR
G-b
ased
hos
pita
l pay
men
t; c R
elat
es t
o de
rmat
olog
y.

DRG-based hospital payment and effi ciency 109
can be used to explicitly incentivize hospitals to increase day-case activity, as for example in England, where a common national tariff has been applied to most elective activity across inpatient and day-case settings (Epstein & Mason, 2006; Street et al., 2007). In the United States, the shift towards outpatient care may also be explained by the operation (until 2000) of a parallel retrospective cost-based reimbursement system for such treatment (Rosenberg & Browne, 2001).
Average length of stay generally declined following the move to DRG-based payment (for example, Kahn et al., 1990; Böcking et al., 2005; Moreno-Serra & Wagstaff, 2010), although some argue that this was merely consistent with a general trend (Rosenberg & Browne, 2001; Schreyögg et al., 2005). Discharge rates to post-acute institutions (typically less costly than acute facilities) usually increased. On average, the recorded severity of patients remaining in acute settings increased (Böcking et al., 2005), and assuming this was not simply changed coding practice, suggests limited potential for further reductions in length of stay ceteris paribus (Guterman et al., 1988; Rosenberg & Browne, 2001).
Finally, in the majority of cases, the introduction of DRG-based hospital payment was associated with higher total costs, partly due to higher activity levels (Forgione & D’Annunzio, 1999; Anell, 2005; Kastberg & Siverbo, 2007; Moreno-Serra & Wagstaff, 2010), whereas unit costs appear to have declined (Böcking et al., 2005; Farrar et al., 2009). In the United States the overall impact was reduced infl ation in aggregate costs (Guterman et al., 1988). The initial ex-perience with DRG-based payment in the Netherlands has been a lower rate of increase where prices are negotiated rather than set centrally and there is increased competition among hospitals and health insurers (see Chapter 23 of this volume).
In short, in some cases, hospital-level effi ciency has improved following the introduction of DRG-based hospital payment, but establishing causation is diffi cult, due to confounding factors. Elsewhere its theoretically benefi cial effects may have been somewhat offset by other features of the national health care system – such as limitations on activity and/or expenditure, or the pre-existing reimbursement system – leading to mixed results.
7.4 What are the key challenges?
7.4.1 Categorization problems may lead to unfair reimbursement or patient selection
Like any categorization system, DRGs cannot group patients perfectly on the basis of their expected resource requirements. Much hea lth care is highly individualized, so defi ning a ‘standardized package of care’ is not straightfor-ward. This would not create hospital payment problems if differences across providers were random, but if the differences across providers are systematic, then the reimbursement system becomes potentially unfair and may encourage hospitals to engage in up-coding or to ‘dump’ (that is, avoid) high-cost patients. These adverse consequences could be avoided, however, if the fi nancial risks of such cases were shared between payer and hospital (see Part Two of this volume, along with chapters 5 and 6).

110 Diagnosis-Related Groups in Europe
7.4.2 Independence in price-setting
In some countries, the number of hospitals may be insuffi cient to ensure that prices are independent of each hospital’s costs. This has two implications. First, the regulator may be unable to determine whether costs are contaminated by ineffi cient behaviour, especially if provision is concentrated in only one or two hospitals. DRG-based hospital payment is then in danger of reducing to cost-based reimbursement – which embodies little incentive to improve effi ciency. Second, this form of reimbursement may encourage collusion between providers in their reporting behaviour or in their efforts to reduce their costs. The likelihood of such behaviour increases if there are few providers that are well informed about each other’s behaviour. Collusion will limit the scope for DRG-based hospital payment to deliver effi ciency improvements. Where data are collected on a sampling basis, as in Germany, the sample must be representative of all hospitals; otherwise, unfair reimbursement may result (see chapters 5 and 14).
7.4.3 Control of expenditure
DRG-based hospital payment that adopts a simple price-per-unit-of-activity approach offers direct incentives to suppliers to increase activity levels. If marginal cost is lower than marginal revenue, the more providers ‘do’, the larger their fi nancial surplus/profi t. Increases in activity levels may therefore place severe pressure on funders’ budgets. Consequently, a number of countries attempt to contain expenditure by a system of operating DRG-based hospital payment within a global budget framework (for example, Catalonia (Spain) and Sweden – see chapters 22 and 19, respectively). In France, local-level contracts were found to be more effective at controlling spending than macro-level mechanisms (see Chapter 13).
7.5 Conclusions
DRG-based hospital payment systems have the potential to enhance effi ciency in the delivery of hospital services, more so than other hospital payment models. This is because there are clear incentives for hospitals to work harder, because they are paid according to the number of patients they treat, as well as to control their costs, because the prices they face are set independently of their own costs. These payment characteristics encourage providers to improve their technical and cost-effi ciency and to seek allocative effi ciency in their choice of input mix. In theory, DRG-based hospital payment can be used to support allocative effi ciency in the overall mix of outputs produced by the hospital sector as a whole. This requires the price attached to each DRG to refl ect its societal value. In practice, though, DRG prices are based on costs in almost all countries, so the pursuit of allocative effi ciency in this sense has not been a feature of DRG-based hospital payment policy.
Empirical evidence is mixed in terms of the extent to which DRG-based hospital payment has improved effi ciency. This is partly because of cross-
DRG-based hospital payment and effi ciency 111
country heterogeneity in how DRG-based hospital payment systems are operated (detailed in Part Two of this volume) and because attribution is complicated by the existence of confounding factors (such as changes being part of a wider reform package, or the country-specifi c design and operation of the reimbursement regime). It is generally agreed that DRG-based hospital payment affects indicators of effi ciency, such as activity and length of stay, although the same caveats apply. Unintended consequences may include skimping (on quality), cost-shifting, patient selection or up-coding to higher priced DRGs (see Chapter 6).
While we have outlined simplifi ed forms of DRG-based hospital payment, in practice the payment arrangements implemented in each country can be quite sophisticated (see the country-specifi c chapters in Part Two of this book). More complex formulations may refl ect concerns over the ability of DRG classifi cations to describe casemix accurately, if the need to moderate incen-tives to undertake more activity in the pursuit of quality, or other regulatory objectives, such as an equitable geographical distribution of hospital pro-vision. Such sophistication is not surprising: the provision of hospital care is a complex process, often requiring packages of care tailored to the individual patient and delivered under conditions of crisis and uncertainty, requiring co-ordination of health professionals both within and beyond the hospital. In the face of such complexity, the method by which payments are made must be sophisticated enough to provide clear incentives for what is desirable and to avoid creating perverse responses. Compared to cost-based reimburse-ment and global budgets, DRG-based hospital payment is able to embody such sophistication and, thereby, to provide clearer incentives for hospitals to improve their effi ciency.
7.7 References
Anell, A. (2005). Swedish health care under pressure. Health Economics, 14:S237–54.Audit Commission (2008). The Right Result? Payment by Results 2003–2007. London: Audit
Commission (http://www.audit-commission.gov.uk/SiteCollectionDocuments/AuditCommissionReports/NationalStudies/The_right_result_PbR_2008.pdf, accessed 29 June 2011).
Barnum, H., Kutzin, J., Saxenian, H. (1995). Incentives and provider payment methods. International Journal of Health Planning & Management, 10:23–45.
Biørn, E., Hagen, T.P., Iversen, T., Magnussen, J. (2003). The effect of activity-based fi nancing on hospital effi ciency: a panel data analysis of DEA effi ciency scores 1992–2000. Health Care Management Science, 6:271–83.
Böcking, W., Ahrens, U., Kirch, W., Milakovic, M. (2005). First results of the introduction of DRGs in Germany and overview of experience from other DRG countries. Journal of Public Health, 13:128–37.
Borden, J.P. (1988). An assessment of the impact of diagnosis-related group (DRG)-based reimbursement on the technical effi ciency of New Jersey hospitals using data envelopment analysis. Journal of Accounting and Public Policy, 7:77–96.
Chern, J.Y., Wan, T.T. (2000). The impact of the prospective payment system on the technical effi ciency of hospitals. Journal of Medical Systems, 24:159–72.
Coelli, T.J., Rao, D.S.P., O’Donnell, C.J. (2005). An Introduction to Effi ciency and Productivity Analysis. New York, NY: Springer Science+Business Media.

112 Diagnosis-Related Groups in Europe
Cots, F. (2004). La sostenibilidad del sistema hospitalario en Cataluña. El balance de una década [Viability of the hospital system in Catalonia. Balance after a decade]. Gaceta Sanitaria, 18:64–7.
Davis, C., Rhodes, D.J. (1988). The impact of DRGs on the cost and quality of health care in the United States. Health Policy, 9:117–31.
Dismuke, C., Sena, V. (1999). Has DRG payment infl uenced the technical effi ciency and productivity of diagnostic technologies in Portuguese public hospitals? An empirical analysis using parametric and non-parametric methods. Health Care Management Science, 2:107–16.
Dismuke, C., Sena, V. (2001). Is there a trade-off between quality and productivity? The case of diagnostic technologies in Portugal. Annals of Operations Research, 107:101–16.
Ellis, R.P., McGuire, T.G. (1986). Provider behaviour under prospective reimbursement: cost sharing and supply. Journal of Health Economics, 5:129–51.
Ellis, R.P., Vidal-Fernández, M. (2007). Activity-based payments and reforms of the English hospital payment system. Health Economics, Policy and Law, 2:435–44.
Epstein, D., Mason, A. (2006). Costs and prices for inpatient care in England: mirror twins or distant cousins? Health Care Management Science, 9:233–42.
Ettelt, S., Thomson, S., Nolte, E., Mays, N. (2006). Reimbursing Highly Specialised Hospital Services: The Experience of Activity-Based Funding in Eight Countries. London: London School of Hygiene & Tropical Medicine.
Farrar, S., Sussex, J., Yi, D. et al. (2007). National Evaluation of Payment by Results. Aberdeen: University of Aberdeen Health Economics Research Unit.
Farrar, S., Yi, D., Sutton, M. et al. (2009). Has payment by results affected the way that English hospitals provide care? Difference-in-differences analysis. British Medical Journal, 339 b3047doi:10.1136/bmj.b3047.
Forgione, D.A., D’Annunzio, C.M. (1999). The use of DRGs in health care payment systems around the world. Journal of Health Care Finance, 26:66–78.
Gerdtham, U., Löthgren, M., Tambour, M., Rehnberg, C. (1999a). Internal markets and health care effi ciency: a multiple-output stochastic frontier analysis. Health Economics, 8:151–64.
Gerdtham, U., Rehnberg, C., Tambour, M. (1999b). The impact of internal markets on health care effi ciency: evidence from health care reforms in Sweden. Applied Economics, 31:935–45.
Guterman, S., Eggers, P.W., Riley, G., Greene, T.F., Terrell, S.A. (1988). The fi rst 3 years of Medicare prospective payment: an overview. Health Care Financing Review, 9:67–77.
Hagen, T.P., Veenstra, M., Stavem, K. (2006). Effi ciency and Patient Satisfaction in Norwegian Hospitals. Oslo: Health Organization Research Norway (HORN Working Paper 2006:1).
Hensen, P., Beissert, S., Bruckner-Tuderman, L. et al. (2008). Introduction of diagnosis-related groups in Germany: evaluation of impact on inpatient care in a dermatological setting. European Journal of Public Health, 18:85–91.
Jacobs, R., Smith, P.C., Street, A. (2006). Measuring Effi ciency in Health Care: Analytic Techniques and Health Policy. Cambridge: Cambridge University Press.
Kahn, K.L., Keeler, E.B., Sherwood, M.J. et al. (1990). Comparing outcomes of care before and after implementation of the DRG-based prospective payment system. Journal of the American Medical Association, 264:1984–8.
Kastberg, G., Siverbo, S. (2007). Activity-based fi nancing of health care – experiences from Sweden. International Journal of Health Planning and Management, 22:25–44.
Kjerstad, E. (2003). Prospective funding of general hospitals in Norway: incentives for higher production? International Journal of Health Care Finance and Economics, 3:231–51.

DRG-based hospital payment and effi ciency 113
Langenbrunner, J.C., Orosz, E., Kutzin, J., Wiley, M.M. (2005). Purchasing and paying providers, in J. Figueras, R. Robinson, E. Jakubowski, eds. Purchasing to Improve Health Systems Performance. Maidenhead: Open University Press.
Linna, M., Häkkinen, U., Magnussen, J. (2006). Comparing hospital cost effi ciency between Norway and Finland. Health Policy, 77:268–78.
Louis, D.Z., Yuen, E.J., Braga, M. et al. (1999). Impact of a DRG-based hospital fi nanc-ing system on quality and outcomes of care in Italy. Health Services Research, 34:405–15.
Magnussen, J., Hagen, T.P., Kaarboe, O.M. (2007). Centralized or decentralized? A case study of Norwegian hospital reform. Social Science & Medicine, 64:2129–37.
Manton, K.G., Woodbury, M.A., Vertrees, J.C., Stallard, E. (1993). Use of Medicare services before and after introduction of the prospective payment system. Health Services Research, 28:269–92.
Moreno-Serra, R., Wagstaff, A. (2010). System-wide impacts of hospital payment reforms: evidence from central and eastern Europe and central Asia. Journal of Health Economics, 29:585–602.
Muller, A. (1993). Medicare prospective payment reforms and hospital utilization: temporary or lasting effects? Medical Care, 31:296–308.
Or, Z. (2009). Activity-based payment in France. Euro Observer, 11:5–6.Robinson, R., Jakubowski, E., Figueras, J. (2005). Organization of purchasing in Europe, in
J. Figueras, R. Robinson, E. Jakubowski, eds. Purchasing to Improve Health Systems Performance. Maidenhead: Open University Press.
Rosenberg. M.A., Browne, M.J. (2001). The impact of the inpatient prospective payment system and diagnosis-related groups: a survey of the literature. North American Actuarial Journal, 5:84–94.
Schreyögg, J., Tiemann, O., Busse, R. (2005). The DRG reimbursement system in Germany. Euro Observer, 7:4–6.
Shleifer, A. (1985). A theory of yard stick competition. Rand Journal of Economics, 16:319–27.
Sommersguter-Reichmann, M. (2000). The impact of the Austrian hospital fi nancing reform on hospital productivity: empirical evidence on effi ciency and technology changes using a non-parametric input-based Malmquist approach. Health Care Management Science, 3:309–21.
Street, A., Häkkinen, U. (2010). Health system productivity and effi ciency, in P.C. Smith, E. Mossialos, I. Papanicolas, S. Leatherman, eds. Performance Measurement for Health System Improvement: Experiences, Challenges and Prospects. Cambridge: Cambridge University Press.
Street, A., Scheller-Kreinsen, D., Geissler, A., Busse, R. (2010). Determinants of Hospital Costs and Performance Variation: Methods, Models and Variables for the EuroDRG Project. Berlin: Universitätsverlag der Technischen Universität Berlin (working Papers in Health Policy and Management Volume 3).
Street, A., Vitikainen, K., Bjorvatn, A., Hvenegaard, A. (2007). Introducing Activity-Based Financing: A Review of Experience in Australia, Denmark, Norway and Sweden. York: University of York Centre for Health Economics (CHE Research Paper 30).
Theurl, E., Winner, H. (2007). The impact of hospital fi nancing on the length of stay: evidence from Austria. Health Policy, 82:375–89.
US Congress Offi ce of Technology Assessment (1985). Medicare’s Prospective Payment System: Strategies for Evaluating Cost, Quality, and Medical Technology. Washington, DC: United States Government Printing Offi ce.
WHO (2000). The World Health Report 2000 – Health Systems: Improving Performance. Geneva: World Health Organization.

114 Diagnosis-Related Groups in Europe
7.8 Summary of terms used in the equations
Symbol Description
RC, RG, RA Hospital revenue under, respectively, cost-based reimbursement (C), global budgets (G) and DRG-based funding (A)
ZC, ZG, ZA All sources of revenue not related to health to care activity under cost-based reimbursement, global budgets and DRG-based funding
Q ActivityQ Target activityI Individual patientS SpecialtyJ DRGC Unit costBs Specialty contract valueps Locally agreed specialty-level pricep̂j Prospectively fi xed DRG price
α Proportion of fi xed DRG price paid for additional activity