andolfatto filippo master thesis - the modern store: usage of multimodal technologies for the...
TRANSCRIPT

Master’s Degree in Cognitive Science
The modern store: usage of multimodal technologies for the improvement of the retail experience
Tutor Student
Professor Liliana Albertazzi Filippo Andolfatto

�2

Master’s Degree in Cognitive Science 1INTRODUCTION 5CHAPTER 1. User Experience Design: definition and principles 91.1 Definitions of User Experience Design 91.2 The Six principles of User Centered Design 111.3 Conclusions 14CHAPTER 2. Digital Signage Networks 152.1 What’s a Digital Signage in Deep 172.2 Why adopting Digital Signage 202.3 Fields of application of Digital Signage 212.5 State of the art of Digital Signage 222.4 Conclusion 33CHAPTER 3. Digital Signage Networks: New Trends 353.1 Digital Signage networks as element of a holistic retail experience: online and offline become similar and indistinguishable 363.2 Multimodality of the interaction/experience 383.3 Adaptability of the experience and the understanding of context 403.4 Integration of sensors and software logs in an analytics framework423.6 Social Media integration on the digital signage network 433.7 Conclusion 45CHAPTER 4. TouchDomain - The design process of a complex Digital Signage Network 474.1 The Design process 484.2 Principal Milestones 50CHAPTER 5. Usage of TouchDomain in a fashion store 655.1 TouchDomain in a Fashion Shop Scenario: the user journey 665.2 The Social Login as a key for the store 675.3 Gaming & Exploration 705.4 Chill-outing & Purchase 79CHAPTER 6. Conclusion 83
�3

Bibliography 87Webliography 91Acknowledgements 93
�4

INTRODUCTION
In the last decade, the rise of the internet, the development of social media
networks and the advent of smartphones have changed our way of buying and
dealing with brands. Nowadays, we can buy our favourite trousers just with a
few taps on the phone on our way to work, share our purchases on our social
media channels before and after shopping to estimate our “likeability” and so
on.
In this complex scenario made of several “online factors & variable”,
local and real stores keep on playing a relevant role in the battle among
brands for the conquer (and understanding) of customers. Apple®, with its
own stores around the world is an example of how physical stores are part of
the brand strategy and philosophy that other competitors cannot ignore.
There are several rising trends that are affecting the in-store retail experience:
• Brands (especially high-end brand) are trying to break down the walls
between online stores and physical ones in order to achieve a stronger and
seamless brand reputation;
• Brands are trying to reach a better knowledge of the complex buyer
personas (customer’s categories) thanks to algorithms that analyze user
�5

preferences’ traced through social media channels, online stores, search
engines and finally real stores;
• Retail experience, as well as Online-Experience is moving in the direction
of adaptability based on those customer needs that could arise during the
buying process. According to Bettercout and Gwinner [1996] customizing
the delivery of service on the frontline is a key to customer satisfaction. For
example, a woman that has just bought a pair of jeans could be interested
in buying a t-shirt. In an e-commerce scenario (think of Amazon) these
kind of interactions with the customer occur regularly, whereas in an off-
line store this is still a developing trend that every brand is trying to follow
in several ways, using different technologies.
In this context, Practix, a software company based in Rovereto (TN)
specialized in the design and development of software for multitouch screen is
crafting TouchDomain (www.TouchDomain.it), a cloud-based CMS (Content
Management System) which can manage multimedia contents such as videos,
photos, presentations, pdf files, web pages etc. and can display them on big
interactive screens. Subsequently, thanks to a complex analytical framework,
the store manager and the store team would be able to find out selling trends
based on user interactions.
�6

I started to collaborate with Practix in January 2015 when I took part in the
design of the product working as UX Designer. In the last year have been
working hard on this product using several design techniques that helped us
to understand the customer and final user needs and to create a product that
people use.
The whole overview on the development processes listed explained before
gave me a clear idea of different problems involved in this kind of modern
and innovative product development and this thesis aims to summarizing
them.
�7

�8

CHAPTER 1. User Experience Design: definition and principles
Experience is a human condition, a mixture of memory & cognitive processes.
Experience differs for every person. According to Kelway [2012], this
complexity has led us to a place where a design discipline can grow and justify
its existence due to the importance of the quality of experiences that people
(customers, users or patients) can feel whilst using or interacting with ”digital”
products [Kelway 2012].
1.1 Definitions of User Experience Design
The term User Experience Design (Shortly UX Design) was coined in the
mid-90s by Donald Norman, co-founder of the Nielsen Norman Group,
professor at KAIST (Korea), IDEO fellow, and a design theorist, studying the
fundamentals of modern design. As he admitted, he created this expression
giving that human interface and usability were too narrow [Norman 1998]. The
author wanted to cover all aspects of the person’s experience with the system
�9
including industrial design, graphics, the interface, the physical interaction, and
the manual [Norman 1988]. User Experience Design was defined always by
Norman as a discipline based on the needs and interests of the user, with an
emphasis on making products usable and understandable [Norman 1988].
Customers and their own needs must dominate over the interface design and
they got to be interrogated at any step of the development process [Norman
1988].
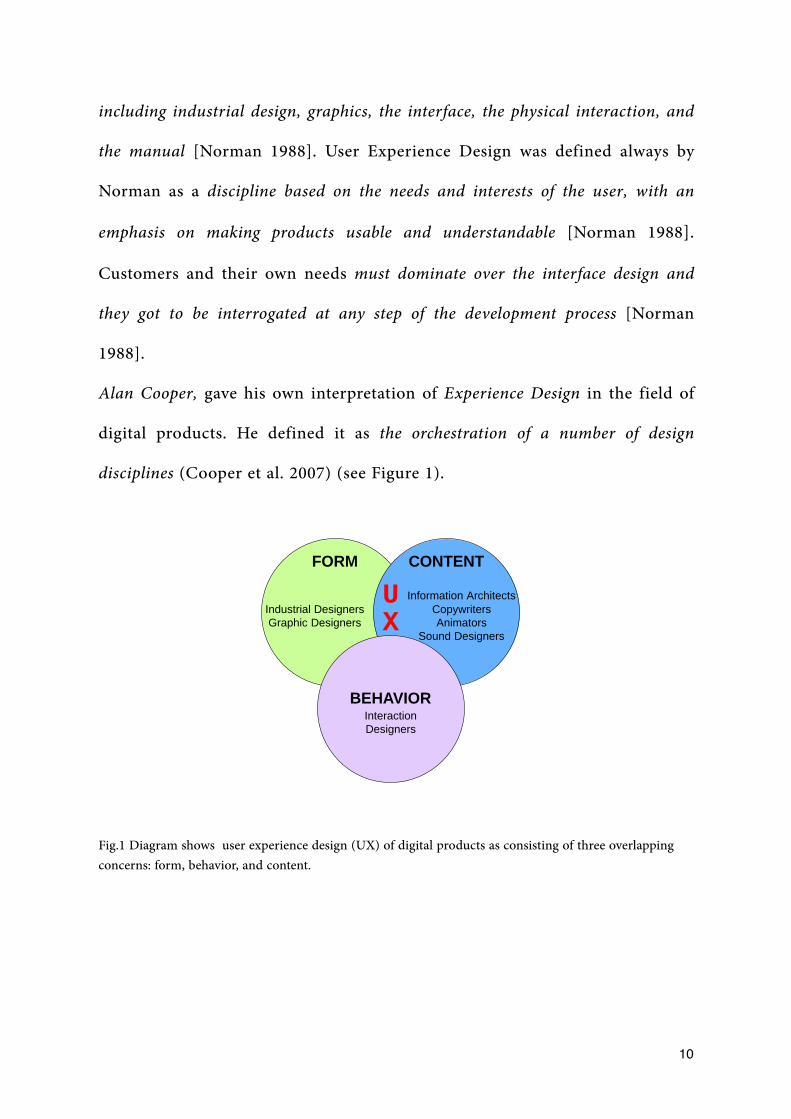
Alan Cooper, gave his own interpretation of Experience Design in the field of
digital products. He defined it as the orchestration of a number of design
disciplines (Cooper et al. 2007) (see Figure 1).
Fig.1 Diagram shows user experience design (UX) of digital products as consisting of three overlapping concerns: form, behavior, and content.
�10

1.2 The Six principles of User Centered Design
ISO (the International Organization for Standardization) is a worldwide
federation that works in order to prepare International Standards defined as
ISO 9241-210:2010: a set of rules. It provides requirements and
recommendations for human-centred design principles and activities throughout
the life cycle of computer-based interactive systems. It is intended to be used by
those managing design processes, and is concerned with ways in which both
hardware and software components of interactive systems can enhance human–
system interaction (ISO 9241-210 2010).
In the same document they explain the six principles that define a user
centered design process:
1. The design is based upon an explicit understanding of users, tasks and
environment:
In every step of the design and development processes the team should
understand these three variable in order to design a product properly.
For example, the requirements and user needs that distinguish an inte r f a c e
for listening to music in mobility such as a mp3 player, could not coincide
with the CAD-Software ones. (See Table. 1);
�11
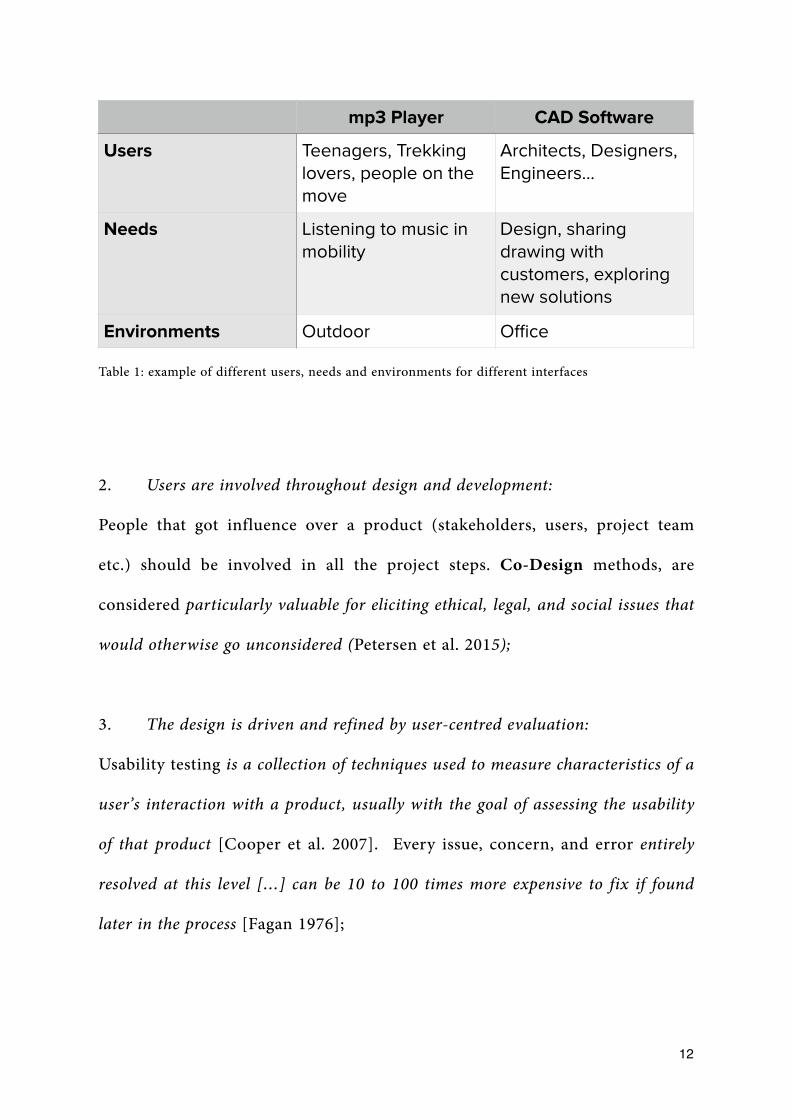
Table 1: example of different users, needs and environments for different interfaces
2. Users are involved throughout design and development:
People that got influence over a product (stakeholders, users, project team
etc.) should be involved in all the project steps. Co-Design methods, are
considered particularly valuable for eliciting ethical, legal, and social issues that
would otherwise go unconsidered (Petersen et al. 2015);
3. The design is driven and refined by user-centred evaluation:
Usability testing is a collection of techniques used to measure characteristics of a
user’s interaction with a product, usually with the goal of assessing the usability
of that product [Cooper et al. 2007]. Every issue, concern, and error entirely
resolved at this level […] can be 10 to 100 times more expensive to fix if found
later in the process [Fagan 1976];
mp3 Player CAD Software
Users Teenagers, Trekking lovers, people on the move
Architects, Designers, Engineers…
Needs Listening to music in mobility
Design, sharing drawing with customers, exploring new solutions
Environments Outdoor Office
�12

4. The process is iterative:
The standard defines this principle without any ambiguity: a good product
cannot be designed properly without iterations. Every product needs several
rounds of design and user evaluation tests to improve both its User
Experience and code quality.
5. The Design addresses the whole user experience
Figure 2 shows how the entire user experience is based on several factors as
usability, desirability, brand experience etc. perceived by the customer during
the interaction with the product.
fig.2 Picture that represents the “whole User Experience”
�13
USEFULNESSUX USEFULNESS
USABILITY
DESIRABILITY
BRANDEXPERIENCE
is easy to use
its aesthetics is amazing
I got a good brand perception
6. The Design team includes multidisciplinary skills and perspectives:
In the vast majority of teams collaboration represents a company activity that
happen between people with similar skill sets. This behaviour do not help
them nor in the error neither in the solution research.
Creating heterogeneous teams with higher collaboration levels is mandatory
to avoid previously described problems.
1.3 Conclusions
In this chapter we discussed what does User Experience Design means and
how it works. In the next one we will deepen the concept of Digital Signage
networks, exploring why they are important and showing also some market
statistics. At last we will list and analyze the state of the art of Digital Signage
Technologies.
�14
CHAPTER 2. Digital Signage Networks
TouchDomain is a platform that can be associated to the concept of Digital
Signage or Digital Signage Networks, an important new channel for
communicating with consumers in retail shopping environments [Burke 2009].
Signs are becoming ubiquitous, in part because LCD displays have decreased
in cost more than tenfold over the past decade. LCD based digital signages are
appearing worldwide and digital menu boards are replacing static backlit menus
in fast-food restaurants. These dynamic wall and overhead displays can change
throughout the day, promoting different items for breakfast, lunch, and dinner.
[…] In retail outlets, point-of-sale digital signs have proven effective in driving
sales, and malls and shopping centers now regularly use them for interactive
directory services [Want et al. 2012].
Several studies have proved that the benefits of the adoption of a digital
signage network include an increased product knowledge and brand awareness
among the consumers and the ability to influence customer behavior, with a
consequent potential increase in sales..
�15

From Arbitron Digital Place-Based Video Study 2010 [Williams 2010], a
research which goal is to set universe estimates for digital place-based video by
benchmarking the size and profile of total viewers across the United States we
extracted the data contained in table 2 here below:
table 2. Data from Arbitron Digital Place-Based Video Study 2010
The first aim of this chapter is to analyze what a Digital Signage Network is
and to describe its technological elements. Then, we will go through some
statistics in order to understand the business importance of its adoption.
Finally, we will list and index the state of the art in the field of Digital Signage
Reach
The availability of digital place-based video has reached a critical mass. 70% of U.S. residents aged 12 or older have seen a digital video display in a public venue in the past month; 52% recall seeing one in the past week.
Comparison to Other MediaDigital video in public venues reaches more Americans each month (70%) than video over the Internet (43%) or Facebook (41%).
Top Venues for Overall Viewers
The top Live places to reach consumers with digital video are grocery stores (28% of the U.S. population aged 12 or older), shopping malls (27%), large retail or department stores (20%), medical ofLices (20%) and movie theaters (19%).
Advertising EngagementViewers are engaged with the content; nearly half (47%) of those who have seen a digital place-based video in the past month speciLically recall seeing an ad.
Effect on Purchase Patterns
Digital video ads have an effect on purchase patterns. Nearly one in Live (19%) of those who have seen a digital video ad say they have made an unplanned purchase after seeing an item featured on the screen.
�16

in terms of technology and Human Computer Interaction to give a clear and
exhaustive overview of the topic.
2.1 What’s a Digital Signage in Deep
The Digital Signage is based on various methods of using computers and TV
Screens (as well as other kind of technologies) that are as efficient as possible
in business and interaction terms. For the companies it represents a brand
new way of communicating, informing, engaging and interacting with a wide
range of people with different needs. The content is rapidly updated, tested
and changed thanks to the adoption of cloud and other distributed
technologies.
However, in these modern digital signage systems content files and data
streams are not enough. Information and instructions are needed to control
how, where and when the content files and streams are displayed in screens. This
control information is stored in scheduling and playlist files [Lundstrøm 2008]
or in the most advanced networks it is gathered live from the environment as
the customers interacts with the system and their needs are predicted.
�17
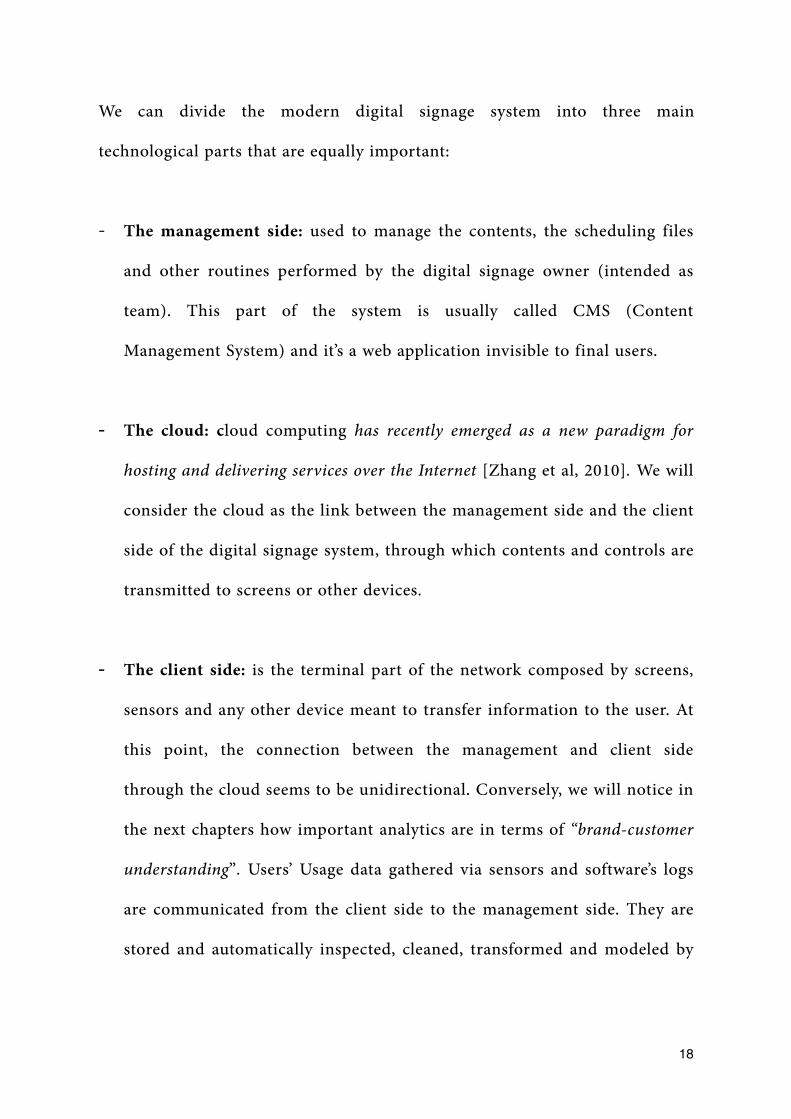
We can divide the modern digital signage system into three main
technological parts that are equally important:
- The management side: used to manage the contents, the scheduling files
and other routines performed by the digital signage owner (intended as
team). This part of the system is usually called CMS (Content
Management System) and it’s a web application invisible to final users.
- The cloud: cloud computing has recently emerged as a new paradigm for
hosting and delivering services over the Internet [Zhang et al, 2010]. We will
consider the cloud as the link between the management side and the client
side of the digital signage system, through which contents and controls are
transmitted to screens or other devices.
- The client side: is the terminal part of the network composed by screens,
sensors and any other device meant to transfer information to the user. At
this point, the connection between the management and client side
through the cloud seems to be unidirectional. Conversely, we will notice in
the next chapters how important analytics are in terms of “brand-customer
understanding”. Users’ Usage data gathered via sensors and software’s logs
are communicated from the client side to the management side. They are
stored and automatically inspected, cleaned, transformed and modeled by
�18
the management server with the goal of discovering useful information,
suggesting conclusions, and supporting decision-making . 1
Actually we can consider a Digital Signage Network as a bidirectional system.
Figure 3 represents its main components.
fig.3 Bidirectional representation of a Digital Signage Network
https://en.wikipedia.org/wiki/Data_analysis1
�19

2.2 Why adopting Digital Signage
“Digital Signage is becoming a reputable marketing resource as technology advances continue to
improve capabilities. Despite businesses in the past being hesitant to incorporate signage into
their marketing strategy, forward-thinking corporates are now seizing the opportunity to attract
attention, leverage up-sells and influence purchase decisions.” - [Anderson 2009]
In this section we will explain and understand why the Digital Signage is
becoming an important topic in terms of business for bigger and smaller
brands:
1. More than 25% of organizations deems "multichannel campaign
management" to be one of their highest priorities and Digital Signage
is part of this strategy: Multichannel Retail Report 2012 published by
Consultancy on September, 2012 is based on a survey of 1,000 consumers
in the UK and 1,000 consumers in the US. It underlines how the vast
majority of UK consumers see the ability to purchase from a retailer from
different channels as important (Multichannel Retail Report 2012). Digital
Signage networks are considered an integral part of this strategy.
2. 63% of people report that Digital Signage attracts their attention:
Implementing a digital signage system offers a lot of opportunities for
organizations to promote their latest products and services thanks to the
customer’s attention that a screen is able to attract;
�20

3. Higher recall rate: “[..] digital signage has a recall rate higher than any
other form of traditional media with 83% of people recalling at least one ad
seen on a digital billboard in the past 30 days.” [Williams 2010]
4. Digital Signage reaches the public: According to Williams [2010] 70% of
US residents aged 12 or older have seen a digital video display in a public
venue in the past month […]. Public venues currently displaying OOH
digital signage include health clubs, shopping malls, medical offices,
restaurants, bars, coffee houses, movie theaters, and large retailer/
department stores.
5. Digital signage increase overall sales volume by 31.8%: Digital Signage
creates an immersive and integrated in-store experience, maximizing
cross-sells, upsells and impulse purchases by quickly adapting and
deploying content in real time.
2.3 Fields of application of Digital Signage
We could identify the the three main fields of application of Digital Signage
Networks as:
�21

• Informative: used to communicate timetables, waiting time, weather
information, maps and directions;
• Educative and formative: used as interactive and supporting tool
during lessons of any topic and level. Applied also on continuing
education courses.
• Persuasive: Applied to marketing campaigns with ad-hoc promotional
messages, Digital Signage Networks are able to direct customers toward
specific areas, to increase the duration of their visit and finally to
improve sales rate.
2.5 State of the art of Digital Signage
As we mentioned in 2.2, Digital Signage could be applied on various
technologies: in this section we will introduce some examples of
representative technologies applied to Digital Signage field that we could
consider as the state-of-the-art intended as the highest level of general
development, as of a device, technique, or scientific field achieved at a particular
time - Wikipedia
�22

1- NG CONNECT (1):
What it is:
Interactive Kiosk with a persuasive goal.
How it works:
On the top of the screen it displays the name of the shopping center and the
weather info. The central part is sub-divided into two main areas. As we
could observe in the picture beside, in the first area (ADS AREA) customers
will usually see advertisement. In the second one discounts would be
continuously updated during the day. The
Customer is able to save discounts by leaning-
on a smartphone on a specific NFC-area of the
kiosk. According to E. Haselsteiner et al
[2010] Near Field Communication (NFC)
technology is a wireless communication
interface with a working distance limited to
about 10 cm that enable the communication of
data between two different devices [Haselsteiner
et al 2010].
�23
Shopping Center name
10:00
ADS AREA
Discounts
NFC AREA
Fig. 4 Wireframe that represents the NG-CONNECT persuasive interface
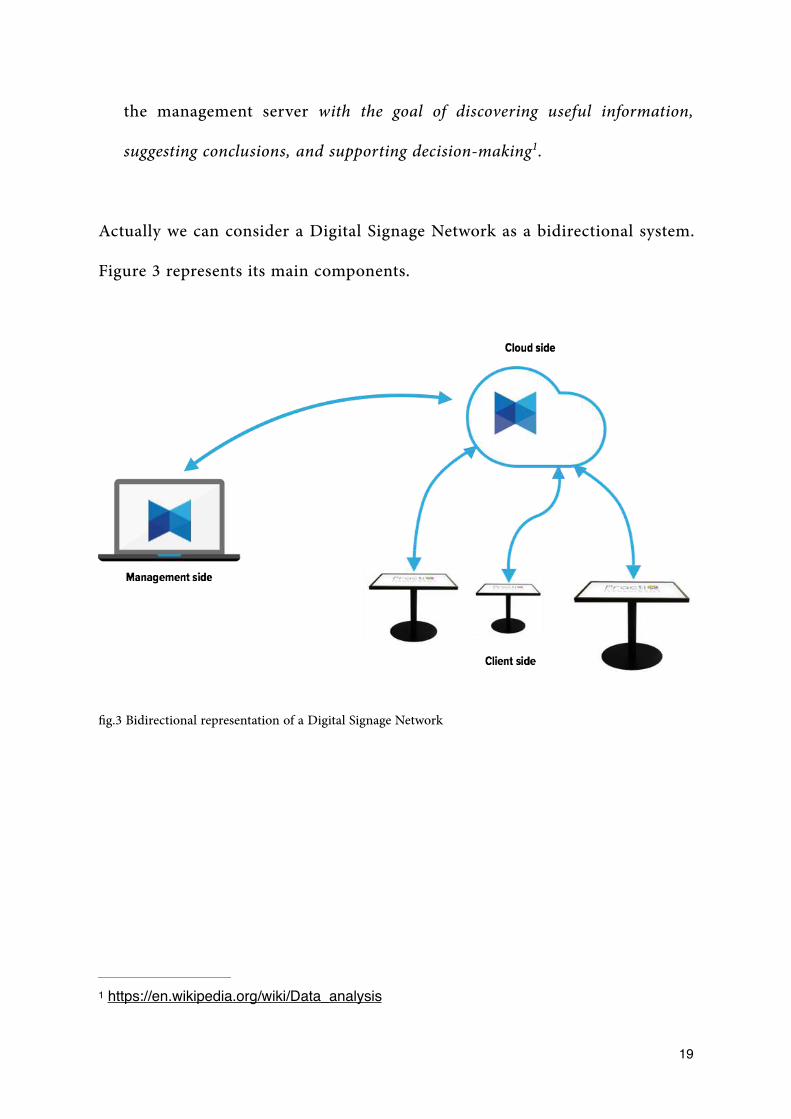
2- NG CONNECT (2):
What it is:
Interactive Kiosk with an informative goal.
How it works:
On the top of the screen the name of the store is displayed.
The central part is sub-divided into two main areas. As in NG CONNECT 1,
in the first area customers will usually see advertisement one dedicated to
advertisement. whereas in the second one NFC sensors enable customers to
display information about products swiped on the NFC area
�24
STORE NAME 10:00
ADS AREA
NFC AREA
INFO 1INFO 2INFO3 INFO 4__________________PRICE: 2,00€
BOTTLE INFO
STORE NAME 10:00
ADS AREA
NFC AREA
INFO 1INFO 2INFO3 INFO 4__________________PRICE: 2,00€
BOTTLE INFO
DETAIL
Fig. 5 Wireframe that represents the NG-CONNECT informative interface
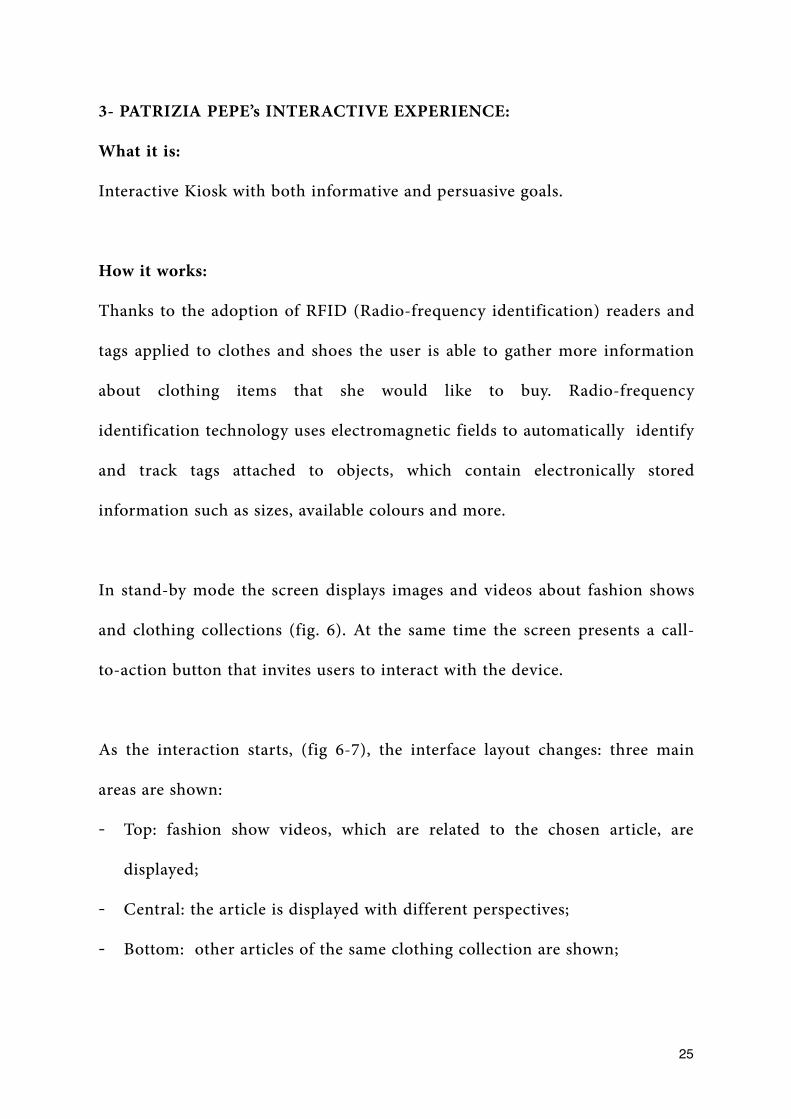
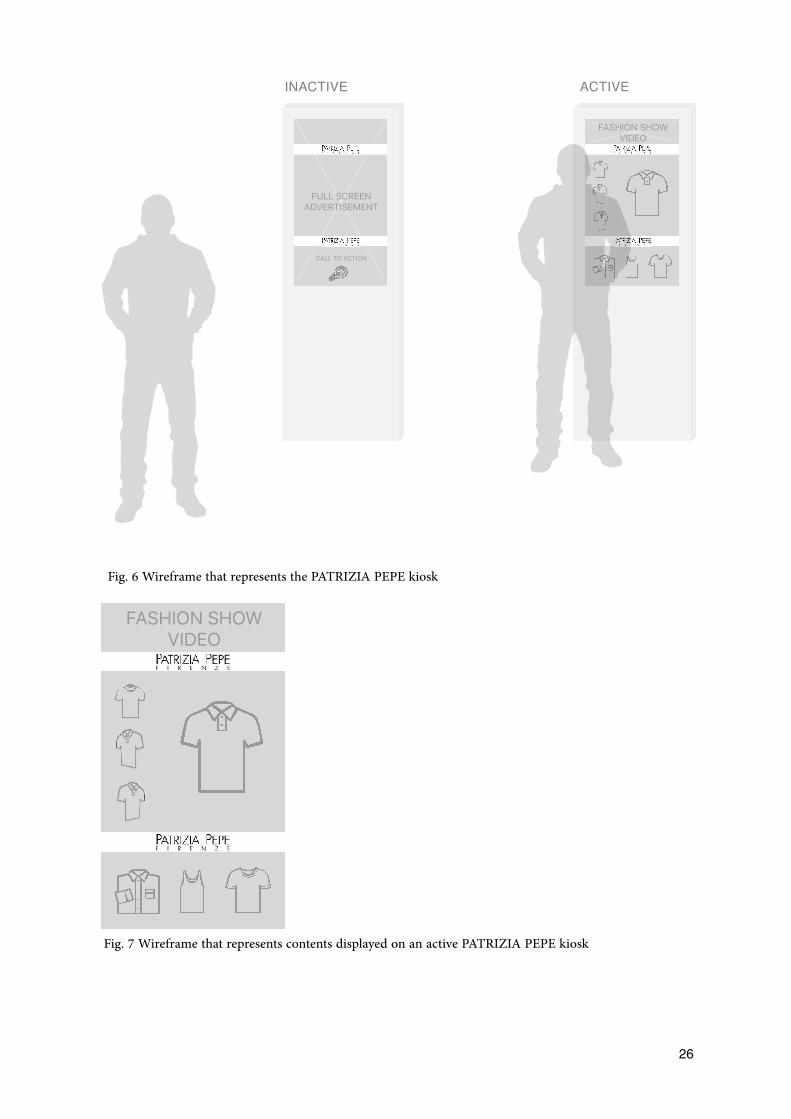
3- PATRIZIA PEPE’s INTERACTIVE EXPERIENCE:
What it is:
Interactive Kiosk with both informative and persuasive goals.
How it works:
Thanks to the adoption of RFID (Radio-frequency identification) readers and
tags applied to clothes and shoes the user is able to gather more information
about clothing items that she would like to buy. Radio-frequency
identification technology uses electromagnetic fields to automatically identify
and track tags attached to objects, which contain electronically stored
information such as sizes, available colours and more.
In stand-by mode the screen displays images and videos about fashion shows
and clothing collections (fig. 6). At the same time the screen presents a call-
to-action button that invites users to interact with the device.
As the interaction starts, (fig 6-7), the interface layout changes: three main
areas are shown:
- Top: fashion show videos, which are related to the chosen article, are
displayed;
- Central: the article is displayed with different perspectives;
- Bottom: other articles of the same clothing collection are shown;
�25
�26
FULL SCREEN ADVERTISEMENT
FASHION SHOW VIDEO
CALL TO ACTION
INACTIVE ACTIVE
FASHION SHOW VIDEO
Fig. 6 Wireframe that represents the PATRIZIA PEPE kiosk
Fig. 7 Wireframe that represents contents displayed on an active PATRIZIA PEPE kiosk
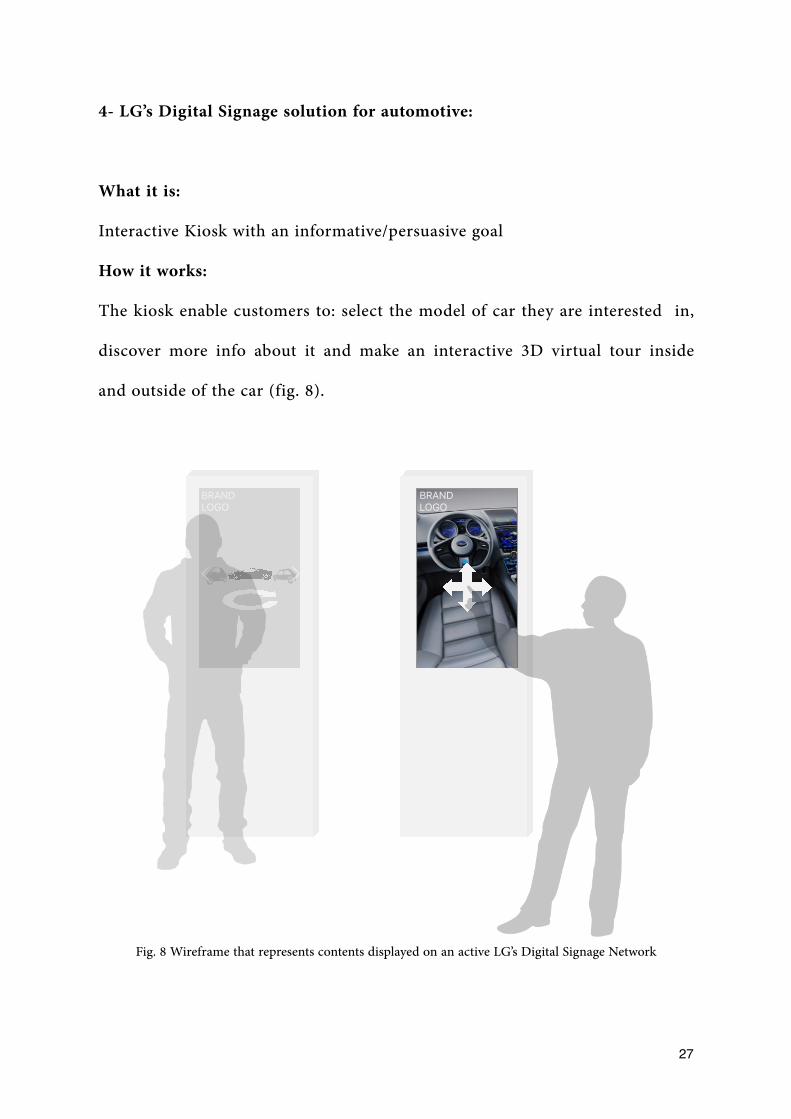
4- LG’s Digital Signage solution for automotive:
What it is:
Interactive Kiosk with an informative/persuasive goal
How it works:
The kiosk enable customers to: select the model of car they are interested in,
discover more info about it and make an interactive 3D virtual tour inside
and outside of the car (fig. 8).
�27
BRANDLOGO
BRANDLOGO
Fig. 8 Wireframe that represents contents displayed on an active LG’s Digital Signage Network
5- FabbricaDigitale EXPO 2015:
What it is:
Interactive Totem with an informative goal. It was installed in Milan during
the EXPO Exhibition in 2015.
How it works:
The kiosk is composed of two different screens with two different scopes:
The upper screen is used firstly to display ads and informative messages.
The position helps to reach a wider public with important information.
The screen on the bottom displays a map with two different view’s options:
- “Services around you”: next POI (Point of interest) are highlighted;
- “Explore EXPO”: it’s a path-finder that helps visitors to get to a
POI or a Pavillion inside the exhibition;
�28

�29
advertisement
way-finder
Fig. 9 Wireframe that represents the setup of screens at EXPO 2015

6- Topshop’s magic mirror:
What it is:
A mirror that uses 3d mapping techniques to display “digital clothes” as an
overlay on the customer’s real-time video.
How it works:
On January 2010, 3D mapping appeared in our living room thanks to
Microsoft Kinect®, a line of motion sensing input devices by Microsoft for Xbox
360 and Xbox One video game consoles and Windows PCs. Based around a
webcam-style add-on peripheral, it enable users to control and interact with
their console/computer without the need for a game controller, through a
natural user interface using gestures and spoken commands (Microsoft , 2009).
In less than two years this technology had a great success and it has been
“adopted” and installed inside stores and commercial centers.
Top Shop’s Magic Mirror allows customers to virtually try on different
clothing articles and accessories: customers have the chance to preview
products without trying them physically on.
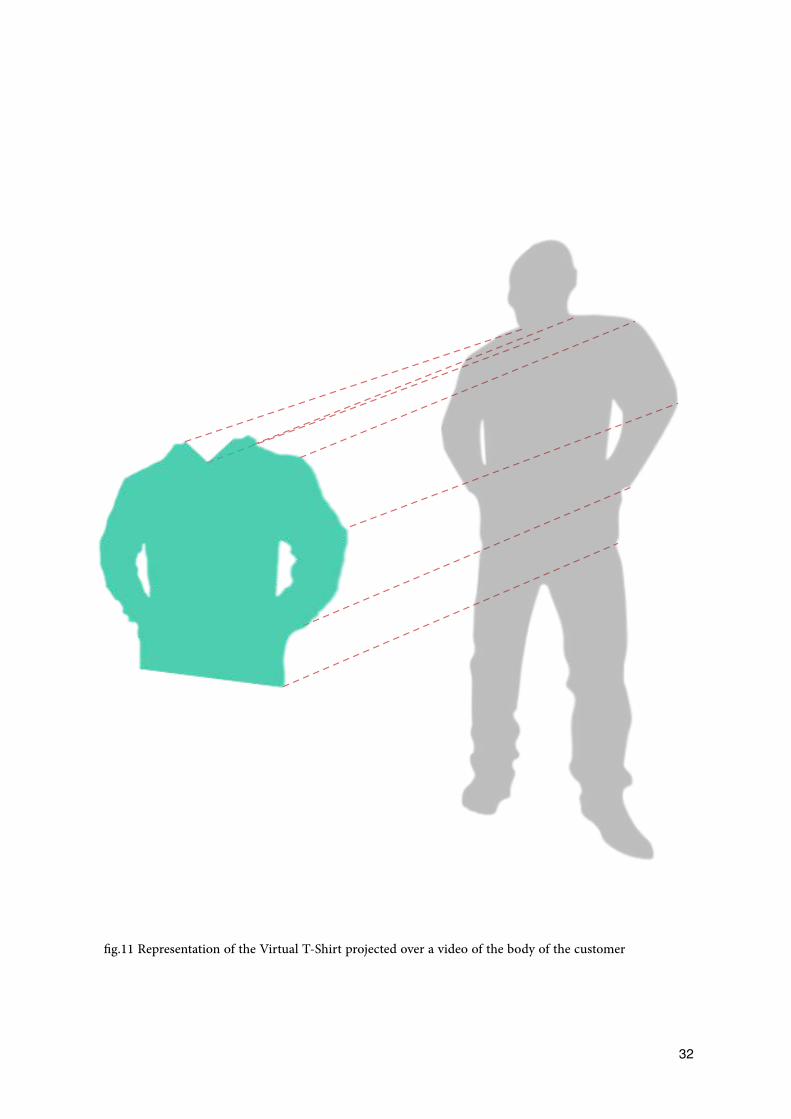
Kinect creates a 3D map of the shopper (fig 10), then it adds an overlay over
the video acquired with the camera. The results is a 3D-projection of a t-shirt
(as in Fig. 10) on the customer’s body (Fig.11).
�30
�31
Microsoft Kinect sensor
Shopper
3D Overlay
Fig. 10 Example of image acquisition with Microsoft Kinect
�32
fig.11 Representation of the Virtual T-Shirt projected over a video of the body of the customer
2.4 Conclusion
In this chapter we introduced several examples of Digital Signage Networks,
in order to try to show in how many fields this technology can be applied,
with different purposes and “way of interact with”.
We will now concentrate on the new trends that Digital Signage technology is
experiencing
�33

�34

CHAPTER 3. Digital Signage Networks: New Trends
There are at least four brand new trends that arise from the world of research
and business about the future of Digital Signage Networks inside stores:
• Digital Signage networks as element of a holistic retail experience where
online and offline stores become similar, complementary and
indistinguishable;
• Multimodality of the experience
• Adaptability of the experience;
• Integration of sensors in an analytics framework;
• Social Media
We will analyze them in this chapter in order to give a strong background of
the future of digital signage technologies.
�35

3.1 Digital Signage networks as element of a holistic retail experience: online and offline become similar and indistinguishable
The customer is interacting with (the) brand… they don’t care about the
channel. I’m the same customer in each interaction; the whole of the experience
should be greater than the sum of its parts [Mcmullin and Starmer 2010].
Our day-to-day activities are changing, they are becoming cross-channel
experiences that require us not only to move from medium to medium, from
device to device, but across domains [Resmini and Rosati 2011].
The digital purchasing process could start digital with an online ads banner
informing us that there’s a new product, ending up in the physical shop,
picking the product at the retail store and viceversa.
The distance between our digital and real life decreased enormously in the
last decade. In the United States, 53% of consumers reportedly buy products off-
line after they research them online, whereas another 43% start their research
online, either at their desktop computer or through a mobile device, but then
find themselves in need to call a customer service number or speak with a
human operator to complete the transaction, usually because they cannot find
the information they are looking online [Mcmullin and Starmer 2010]. This
constant shifting, this moving back and forth between what is digital and what is
�36
physical turns every communication into a cross-channel communication and
pushes customers toward a holistic and ubiquitous approach to products and
services [Resmini and Rosati 2011]. Again, Resmini and Rosati [2011] argue
that we should think about an emergent information-based system where old
and new media and physical and digital environments are designed, delivered,
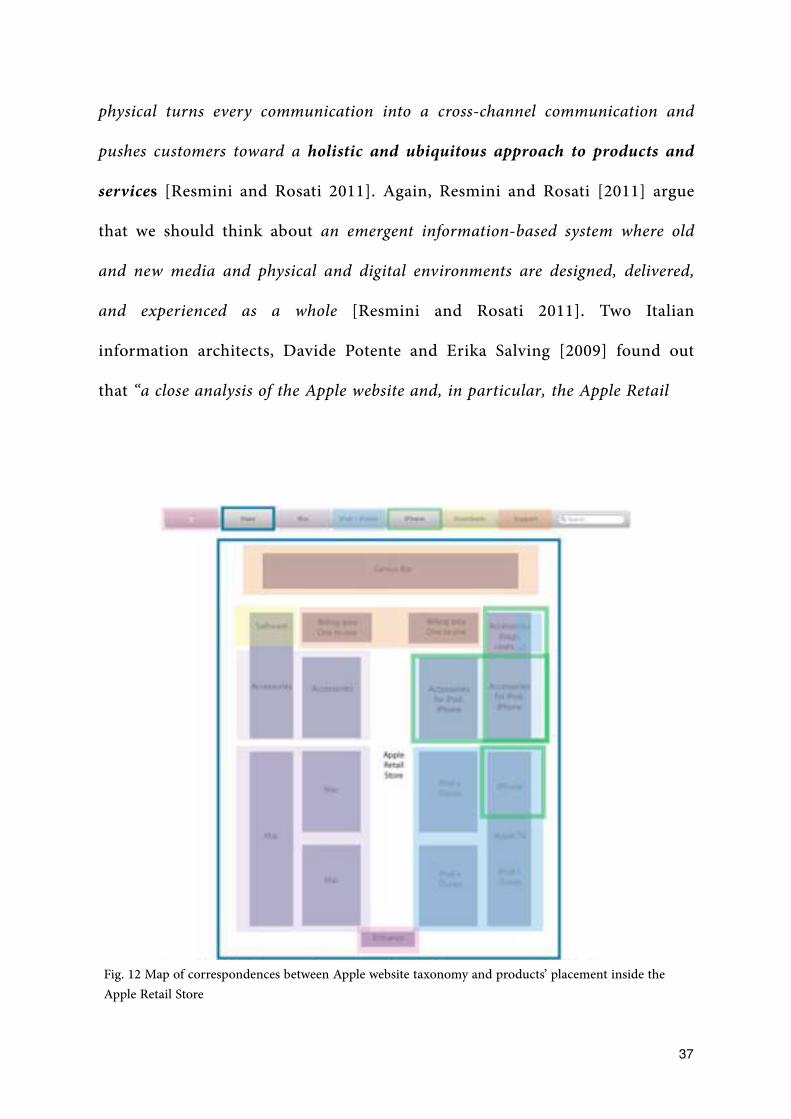
and experienced as a whole [Resmini and Rosati 2011]. Two Italian
information architects, Davide Potente and Erika Salving [2009] found out
that “a close analysis of the Apple website and, in particular, the Apple Retail
�37
Fig. 12 Map of correspondences between Apple website taxonomy and products’ placement inside the Apple Retail Store
Store highlights the role of information architecture in building bridge
experiences (fig. 12). Information Architecture can cross various contexts of
experience with the objective of defining a unique human- information
interaction model by means of proper organization of information flows and
tasks (Potente, Salving 2009).
Again, the online experience and the store layout, combined with
technologies installed inside it, share a common information organization and
their differences should be relegated to obvious and necessary characteristics
of the interface. We should take this consideration into account when
designing a modern information system such as a digital signage network.
3.2 Multimodality of the interaction/experience
In the first decade of 21st century, digital signage networks were merely a TV
network able to broadcast only advertising content used in substitution of
printed advertisement. Users were “passive audiences” in a world where the
number of tv-screens installed in public spaces as squares, stores and
commercial centers able to attract their attention were increasing day by day.
�38
The need for a useful, interactive and immersive experience arose with the
advent of vertical and horizontal touchscreen, mobile devices, NUIs (Natural
User Interfaces) such as Microsoft Kinect® and 2D and 3D projector.
Some interactive displays allow users to navigate the content by pressing
buttons located nearby. The use of the touchscreen experienced a resurgence
in popularity in the past five years as a result of the success of mobile devices
that use this interactive interface, namely, the iPhone and Android
smartphones, as well as the increasingly popular tablet computers and e-book
readers. An interesting consequence of this popularity is that people who see
non-interactive digital signage are touching the screens and expecting a reaction.
Even for signs that have a traditional touch capability, users are likely to try
using multitouch gestures to zoom in and out on the display [Want et al. 2012].
NUIs and cam-based systems are interfaces that use camera or 3D mapping
technology to track users movements and using motion-tracing information
to control the interface. This creates immersive experiences such as Topshop’s
magic mirror (see chapter 2).
Mobile devices often become an integral part of the user experience with a
digital signage network. They could be used as controller, to store information
with a quick data-transmission via NFC or WI-FI networks between the kiosk
and the personal device. Furthermore there are innovative ways to use mobile
�39
devices as keys to have access to social profile credentials without typing any
password or other sensible data on a big screen placed in a public space.
3.3 Adaptability of the experience and the understanding of context
In computer science, the term adaptive system that are context-aware refers to
a process in which an interactive system adapts its behavior to individual users
based on information acquired about its user(s), the context of use and its
environment. Although adaptive systems have been long-discussed in academia
and have been an aspiration for computer scientists and researchers [Itzkovitch
2012].
Adaptability is a key factor in terms of user experience and it is based on the
concept of “Context” and “Context awareness” where:
- Context is defined as the situation within which something exists or
happens, and that can help explain it - Cambridge Dictionary
- […] context awareness is a term that describes the ability of the computer
to sense and act upon information about its environment, such as location,
time, temperature or user identity. This information can be used not only
to tag information as it is collected in the field, but also to enable selective
�40
responses such as triggering alarms or retrieving information relevant to
the task at hand [Ryan et al 1998]
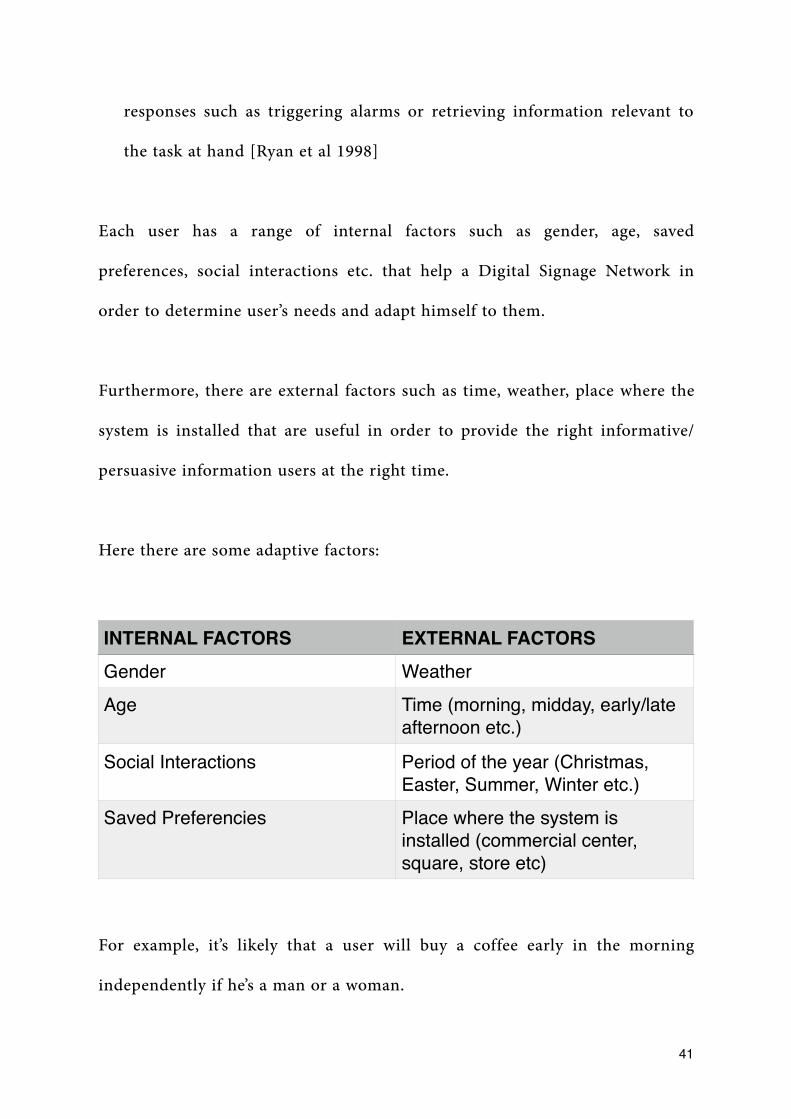
Each user has a range of internal factors such as gender, age, saved
preferences, social interactions etc. that help a Digital Signage Network in
order to determine user’s needs and adapt himself to them.
Furthermore, there are external factors such as time, weather, place where the
system is installed that are useful in order to provide the right informative/
persuasive information users at the right time.
Here there are some adaptive factors:
For example, it’s likely that a user will buy a coffee early in the morning
independently if he’s a man or a woman.
INTERNAL FACTORS EXTERNAL FACTORSGender WeatherAge Time (morning, midday, early/late
afternoon etc.)
Social Interactions Period of the year (Christmas, Easter, Summer, Winter etc.)
Saved Preferencies Place where the system is installed (commercial center, square, store etc)
�41

The main business value of Context-aware applications is to make things
simpler by decreasing the cognitive load. Users are able of doing tasks quicker
and better because they can concentrate in the main task without taking
distractive decisions.
3.4 Integration of sensors and software logs in an analytics framework
As we underlined in chapter 2, digital signage networks are bidirectional in
the sense that they are able not only to transmit content but also to gather
data through sensors and software logs.
In a service like the one described in this thesis, sensors are:
- Camera-based video acquisition sensors: Low cost cameras installed in
proximity of terminal devices. They are usually used in analysis of
Temporal metrics of a person’s dwell time, display in-view time and
attention time are extracted. The system also determines demographic
metrics of the gender and age group (Ravnik et al 2012).
- Motion-Tracking sensors are usually used to determine the same metrics
but with more precision. Always Ravnik et al use this technologies in their
analysis and they found that that 35% of customers specifically looked-at the
display, having the average attention time of 0.7 s. Interestingly, the attention
�42
time was substantially higher for men (1.2 s) than for women (0.4 s). Age
group comparison reveals that children (1–14 years) are the most responsive
to the digital signage. Finally, the analysis shows that the average attention
time is significantly higher when displaying the dynamic content (0.9 s) when
compared with the static content (0.6 s). [Ravnik and Solina 2012].
- Software logs: usually used to determine the number of interactions,
duration of it, number of opened contents etc. They are usually used in
bundle with sensors to reach an higher level of accuracy;
Usually all data gathered from a digital signage installation are analyzed with
machine learning and data mining algorithms and techniques in order to
discover patterns in large data sets.
Moreover, usage data must be cross-checked with sales and transaction
volume data in order to determine the success or unsuccess of a digital
signage campaign.
3.6 Social Media integration on the digital signage network
Social medias provide a more personal and customizable way to get users
involved through digital signage display. Restaurants, hotels, and even office
spaces are incorporating live social media into their content rotation, showcasing
�43

customers’ tweets, Instagram photos, and more to drive engagement [Bovet
2015].
Social media integration increase the involvement: over time, digital signage
that lacks interaction tends to blend into the background after a while,
becoming just another advertisement to viewers. By incorporating live social
media feeds, brands can recapture viewers’ attention by letting them have a
say in their display’s content.
Social media generates always new fresh contents: Creating new and fresh
contents is one of the most expensive (both in money and time terms)
challenges for social media managers and marketers. Users’ posts will create
fresh, automated content will little to no work [Bovet 2015] on the brand side.
Social media is free word-of-mouth marketing for your brand: 84% of consumers
say they either completely or somewhat trust recommendations from family,
colleagues, and friends about products – making these recommendations the
information source ranked highest for trustworthiness. [Nielsen 2013] and 74%
of consumers identify word-of-mouth as a key influencer in their purchasing
decision. [Ogilvy/Google/TNS 2014].
Digital signage offers a great platform for feedback: Brands are opening up a
new channel for buyers feedbacks.
�44
Here we described the usage of social media integration only under a “user-
content generation” light. In the next chapter we’ll see how Practix is using
social media on digital signage networks to create customized experiences.
3.7 Conclusion
In the last two chapters we analyzed exhaustively the rising trends that are
emerging from the digital signage scenario in order to have a complete
overview of the state of the art and future integrations. In the next chapter we
will go through the design process of TouchDomain and we’ll retrieve a lot of
examples taken from the last two chapters and how we integrated in the
software.
�45

�46

CHAPTER 4. TouchDomain - The design process of a complex Digital Signage Network
My collaboration with Practix started on January 2015, when TouchDomain
was still a software at the embryonal stage. It was already possible to integrate
NUI (Natural User Interfaces) such as Microsoft Kinect® and other important
features that other digital signage services do not provide yet, even after years
of development.
In section 4.1 we will go through the methods that we adopted as standard
routines in our design and in the development process at Practix.
Consequently, in section 4.2 we will illustrate some milestones that we
reached in the last months with a particular focusing on the human-computer
interaction point of view.
�47
4.1 The Design process
The design process is a sequence of procedures that every company refines
over years of researching. It’s an iterative standardized path created with the
aim of guiding the design team on the creation process, from the very raw
idea or first intuition to the final product refinement and release.
In our company we developed a routine that goes through seven different
steps:
1. Business request (optional): TouchDomain as other B2B (Business to
Business) software has been developed in order to satisfy a business
request expressed by a customer. Clients and commercial partners are
our “eye on the market” and they are able to understand how to create
user experiences that will fit into it. This step is not mandatory: not
every feature designed and developed for TouchDomain came from a
business request.
2. User-needs (mandatory): every feature in a software must connect a
business value to one or more user needs (intended as final users, i.e.
buyers) in order to become useful, successful and ensure acceptance
from the user base. Understanding and “translating” them in a feature is
one of the challenges of the design team’s work;
�48
3. Design (mandatory): Design is meant as the rationalization and the
ideation of a feature.
4. Prototyping (almost mandatory): a prototype is a draft version of a
product that allows you to explore your ideas and show the intention
behind a feature or the overall design concept to users before investing time
and money into development . A prototype can be anything from paper 2
drawings (low-fidelity) to a “real piece of software” that allows click-
through of a few pieces of content to a fully functioning application
(high-fidelity). It is much cheaper to change a product early in the
development process than to modify it after developers already
developed the website, application or any other piece of software.
5. Testing (mandatory): In his book “About Face 3: Essentials of
Interaction Design” [2007], Alan Cooper defines usability tests as a
collection of techniques used to measure characteristics of a user’s
interaction with a product, usually with the goal of assessing the usability
of that product. Basically, usability testing (or user-testing) is focused on
measuring how well users can complete specific, standardized tasks, as
well as which problems they encounter while running the test.
http://www.usability.gov/how-to-and-tools/methods/prototyping.html2
�49

6. Iteration (mandatory): It is common to move back and forth between
steps and to iterate the whole process several times until you have a solid
design solution [Cooper et al. 2007].
7. Release (mandatory)
4.2 Principal Milestones
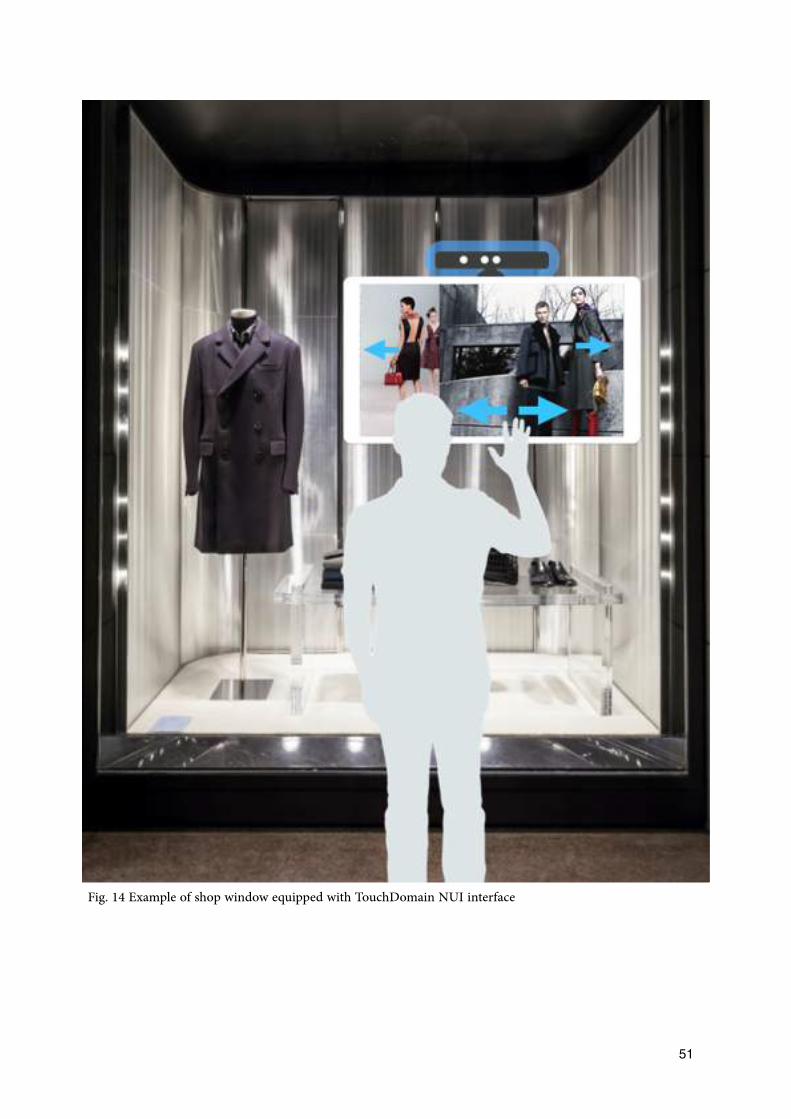
Alpha Release - February 2105
The first Alpha version of TouchDomain was released on February 2015. The
design process started just a few weeks before. The software was a simple
presentation tool (called slideshow project) which displayed .pdf (Portable
Document Format) files on vertical and horizontal oriented screens. The user
�50
Fig. 13 User-Skeleton tracked with Microsoft Kinect
�51
Fig. 14 Example of shop window equipped with TouchDomain NUI interface

is able to control the pages’ flows via touchscreen or NUI (Natural User
Interface) such as Microsoft Kinect® (Fig14).
This application suits perfectly for the use during both opening and closing
hours to engage shoppers inside and outside the shop.
Beta Release - March/April 2105
In the second release we worked hard on the design and the development of a
multiuser and multitouch interface that let users discover contents about the
store such as catalogues, pictures, videos and presentations in an organized
and captivating way. We called this project “Multi-content Presenter” since it
can display different contents to more users at the same time.
�52
Multiuser Interface
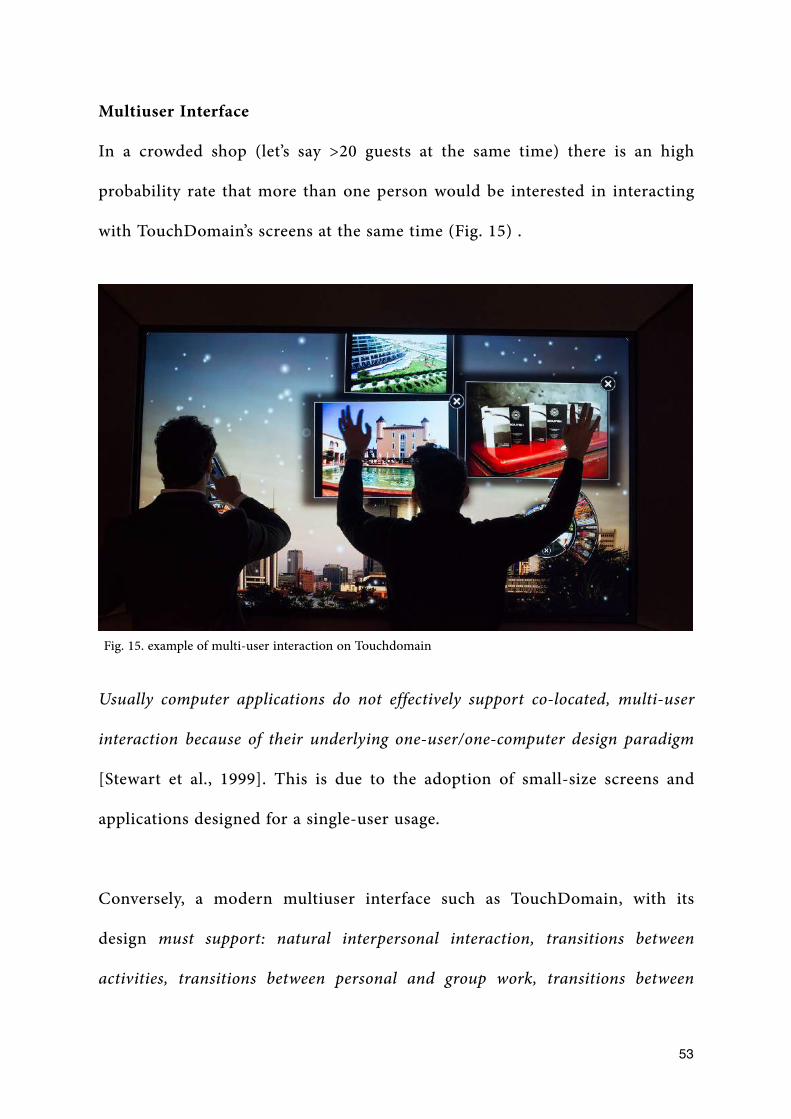
In a crowded shop (let’s say >20 guests at the same time) there is an high
probability rate that more than one person would be interested in interacting
with TouchDomain’s screens at the same time (Fig. 15) .
Usually computer applications do not effectively support co-located, multi-user
interaction because of their underlying one-user/one-computer design paradigm
[Stewart et al., 1999]. This is due to the adoption of small-size screens and
applications designed for a single-user usage.
Conversely, a modern multiuser interface such as TouchDomain, with its
design must support: natural interpersonal interaction, transitions between
activities, transitions between personal and group work, transitions between
�53
Fig. 15. example of multi-user interaction on Touchdomain

multitouch surfaces collaboration and external work, the use of physical objects
(Scott S. et al 2003).
INTERPERSONAL INTERACTION:
The multitouch surfaces system is supposed to have an ergonomic form factor
suitable for the collaborative activity being performed by the users. It must
support group and environment awareness in order to guarantee a fluid
interpersonal interaction inside a group of 2 to 4 users.
The awareness of an environment is created and sustained through the
perception-action cycle. When a person enter an environment (i.e.: a shop) in
order to do a particular task, they bring with them a general understanding of
the situation and a basic idea of what they are looking for. The information
that they then pick up from the environment can be interpreted in light of
existing knowledge to help the person determine the current state of the
environment—that is, what is happening—and also help them to predict what
will happen next (Gutwin and Greenberg 2000).
TRANSITIONS BETWEEN PERSONAL AND GROUP WORK
In TouchDomain both personal activities and group activities are involved in
the user interaction on the multitouch screen. For example, we investigated
the usage of two different messages inside personal areas for personal
activities and inside a centered Group Dialog Windows for group activities.
Location and orientation of these messages are crucial to attract the attention
of the user or the group when involved in the interaction.
Example of Personal to Group Interaction - Closing action of an application
�54
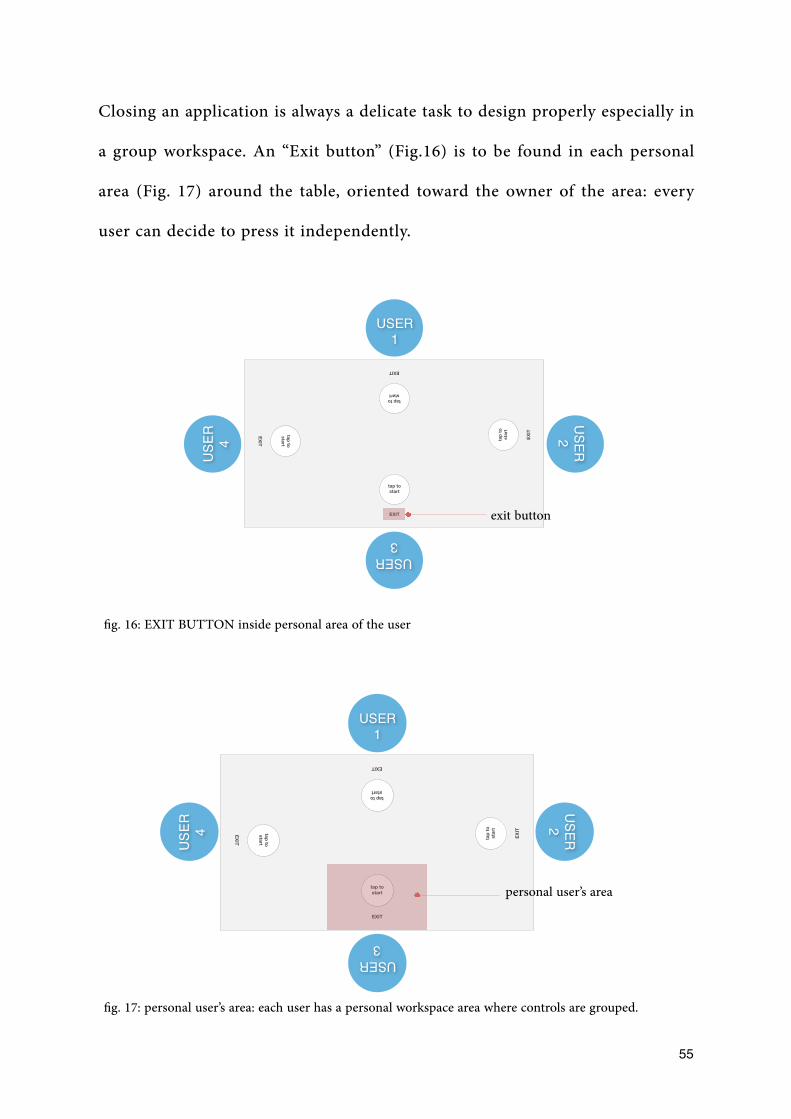
Closing an application is always a delicate task to design properly especially in
a group workspace. An “Exit button” (Fig.16) is to be found in each personal
area (Fig. 17) around the table, oriented toward the owner of the area: every
user can decide to press it independently.
�55
EXIT
tap tostart
EXIT
tap tostart
EXIT
tap tostart
EXIT
tap
tost
art
exit button
USER 1
USER
2
USER 3
USE
R
4
fig. 16: EXIT BUTTON inside personal area of the user
EXIT
tap tostart
EXIT
tap tostart
EXIT
tap tostart
EXIT
tap
tost
art
personal user’s area
USER 1
USER
2
USER 3
USE
R
4
fig. 17: personal user’s area: each user has a personal workspace area where controls are grouped.

Once EXIT is pressed/selected by one of the customers, a lighter layer will
obscure the interface and highlight the Group Dialog Window. The aim of
this “separation layer” is to create a clear cognitive and interactive contrast
and separation between personal and group decisions. The Group Dialog
Window is placed at the center of the screen and it continuously rotates by
360°. Both position and orientation are neutral if compared with user’s
positions around the table (Fig. 18).
This design pattern was developed in order to elicit an urgency of cooperation
between users around the table in order to push them to make a shared
decision.
�56
EXIT
tap tostart
EXIT
tap tostart
EXIT
tap tostart
EXIT
tap
tost
art
ARE YOU SURE?
USER 1
USER
2
USER 3
USE
R
4
Group Dialog Window
Light overlay
Fig. 18: Example of Group Dialog Window
SUPPORTING TRANSITIONS BETWEEN MULTITOUCH SURFACES
COLLABORATION AND EXTERNAL WORK
TouchDomain should be able to incorporate work generated externally to the
multitouch surfaces system into the current multitouch surfaces activity (Scott S.
et al 2003).
We designed it as a tool which can ferry the customer experience from real to
digital world and viceversa.
TouchDomain allows buyers to transfer previously generated files, such as
pictures taken in the shop with their smartphone on the multitouch surfaces
system thanks to the adoption of QR-Codes and other communication
services as RFID and NFC.
Transferring files either across a network or using storage devices is often
more complicated and cumbersome than necessary. Transferring data from one
display to another should be as simple as saying “I want this information
displayed there” while gesturing to the appropriate data and display. (Scott S. et
al 2003). This is the experience that we tried to reach with TouchDomain.
SUPPORT THE USE OF PHYSICAL OBJECTS
Multitouch surfaces must support those practices that mix together the use of
real objects with digital information systems and use the first ones as gates for
the seconds. Thanks to the installation of RFID tags inside shoes and clothes
users automatically get access to information related to the product placed on
the interactive screen (Fig. 19).
�57

TouchDomain 1.0 Release - Summer/Autumn 2105
In the last release of the software we tried to integrate the use of social media
on our Digital Signage System. In order to make this happen, we added a
feature that allows customers to post contents displayed on the screen on their
social networks channels.
During the design process we met several challenges in solving privacy-related
problems. We will describe them in the next pages.
“HOW TO LOGIN“ INTO A SOCIAL MEDIA ON A 144” INCH DISPLAY
INTO A PUBLIC SPACE
Competitors’ solutions usually use touch-keyboards to allow users to login
into their social media networks (i.e.: Facebook® ). We believe that displaying
the standard online form into a big-size screen causes:
�58
Fig.19 A customer uses a shoe as gate to get access to augmented digital information
• A broken interaction-flow: customers would like to log in into Facebook® to
post a picture or other contents. The login interaction should not take too
long: entering an email address and a password on a big screen with a wide
keyboard increases the probability of mistyping errors, which could
interrupt the customers’ flow
• Privacy-related problems: moreover, users would not accept to show their
own email and password to any other person inside the store (Fig. 20). This
kind of interfaces could hack their privacy.
The two points described above gave us a good incentive to design a better
way to login into Facebook® on a wide screen display installed in a public
space.
�59

MOBILE SOCIAL LOGIN
According to WE ARE SOCIAL (2014) , in Italy, the smartphone penetration 3
as a percentage of the total population is equal to 41%. Moreover 26% of the
http://www.slideshare.net/wearesocialsg/social-digital-mobile-around-the-world-3
january-2014?ref=http://iquii.com/2014/01/13/statistiche-e-trend-su-internet-social-media-e-mobile-per-il-2014-in-italia-e-nel-mondo/
�60
Fig.20: a user is typing his Facebook password on a wide interactive screen while another person is observing the operation

world population has at least a social account. Facebook is the most used with
1.276 millions of accounts.
Laying on these assumptions we developed a feature called Mobile Social
Login where:
• The customer’s personal device becomes the instrument to login into
Facebook®;
• Mail and password are typed on the personal device and not on the big-size
screen in order to protect the customer’s privacy;
• We developed this feature on Facebook® as a pilot study, in order to
evaluate its efficiency and user acceptance. In the future we will integrate
other social media platforms, such as Twitter® and Pinterest®.
How Mobile Social Login works
We will develop a scenario in order to describe the feature. Scenarios are a
method of design problem solving by concretization: making use of a specific
story to both construct and illustrate design solutions [Cooper et al. 2007].
�61

Introducion
Arianna is 31 years old woman and she loves fashion. She’s not “internet
addicted” but she has a smartphone and a personal account on Facebook®. She
will stay a week in Milan for a convention.
Scenario
She is walking on a central street when she is attracted by the Digital Signage
installed outside the new XYZ ’S shop (XYZ is a fantasy name for a brand in
the fashion industry). She decides to visit the shop and she goes inside it.
�62
Fig. 21: Detail of the call-to-action that invites Arianna to scan the QR-Code to logging in into her personal Facebook account

Arianna notices that the big-size screen on the wall is displaying the clothing
of the latest XYZ’s collection. She approaches the screen and she notices a QR-
Code that invites her to “Login with Facebook and share our amazing
contents®” (Fig. 21).
She takes her smartphone from the bag and she scans the QR-Code.
Once scanned, the code loads a webpage on her smartphone where
TouchDomain asks her the permission to get access to Facebook. Arianna
accepts without hesitation and in less than 15 seconds her Facebook accounts
is “connected” with TouchDomain (Fig.22) .
Now she can post all the contents displayed on the screen on her own
Facebook’s timeline and get real time feedbacks about her posts. Furthermore,
�63
Fig. 22: Arianna just performed the Mobile Social Login on her smartphone

in this way she implicitly helps XYZ in reaching the social audience of
Arianna (Fig.23).
In this section we described how a simple interaction, such as logging in into
a personal social network can be performed in a privacy-safe way thanks to
the use of common technological elements such as a QR-Code and a
smartphone. In the next chapter we will describe the application of
TouchDomain® in the fashion industry scenario in order to explore different
uses of such a framework.
�64
Fig. 23: Arianna’s Post on her Facebook’s timeline helps XYZ to reach a wider audience on this social media channel
CHAPTER 5. Usage of TouchDomain in a fashion store
In this chapter we will describe the adoption of a Digital Signage Network in a
fashion shop scenario. We’ll understand that the experience inside the shop is
an integration of real and virtual moments: sometimes technology is
prominent, sometimes it works in the background in order to create
knowledge, awareness, entertainment and socialization in and between
customers.
We will use the scenario design technique previously introduced in chapter 4,
in order to explain our design choices in a simple and intuitive manner.
�65
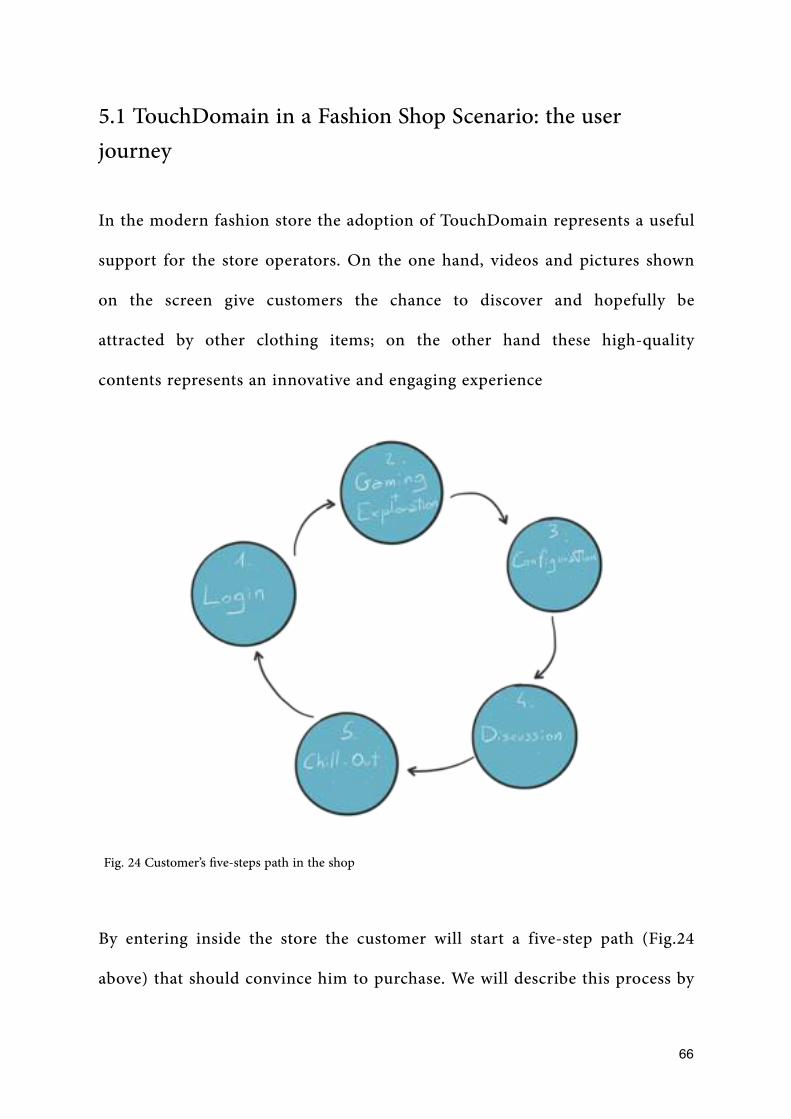
5.1 TouchDomain in a Fashion Shop Scenario: the user journey
In the modern fashion store the adoption of TouchDomain represents a useful
support for the store operators. On the one hand, videos and pictures shown
on the screen give customers the chance to discover and hopefully be
attracted by other clothing items; on the other hand these high-quality
contents represents an innovative and engaging experience
By entering inside the store the customer will start a five-step path (Fig.24
above) that should convince him to purchase. We will describe this process by
�66
Fig. 24 Customer’s five-steps path in the shop

using the scenario technique with the support of sketches and pictures in
order to explain this experience as clearly as possible
5.2 The Social Login as a key for the store
Mark is a tourist from the US. He is going to spend ten days in Rome. He is
enjoying the historical center of the Italian capital when his attention is
attracted by the store of a famous Italian fashion brand. He decides to have a
look inside (Fig. 25).
�67
Fig. 25 Diezel store from the outside

The sliding doors open in order to let him go inside. A store assistant
welcomes Mark and invites him to scan the QR-Code displayed on a little
screen at the entrance desk. By capturing the QR-Code, he gets a little
discount for the next purchase (Fig. 26).
�68
Fig. 26 Mark is scanning the QR-Code in exchange of a little discount

Mark accepts the offer. He takes his smartphone and captures the code with
the camera. The QR-Code loads the Facebook® Mobile Social Login page. (see
chapter 4 section 4.2).
Just a few seconds after the login he receives the discount bonus for the next
purchase (Fig. 27). The digital coupon will be retrieved during the payment
process by and enables him to get the discount.
Mark has just completed the Mobile Social Login. Now it’s time to visit the
shop and find interesting products.
�69
Fig. 27 Example of digital coupon
5.3 Gaming & Exploration
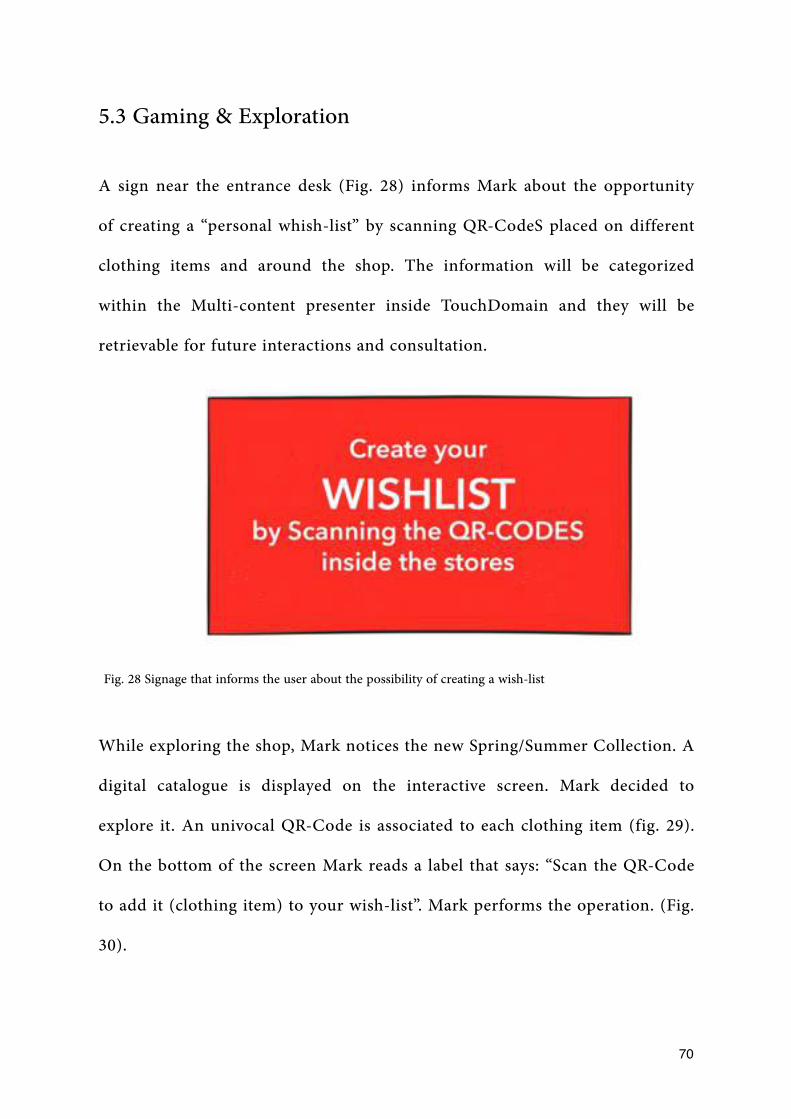
A sign near the entrance desk (Fig. 28) informs Mark about the opportunity
of creating a “personal whish-list” by scanning QR-CodeS placed on different
clothing items and around the shop. The information will be categorized
within the Multi-content presenter inside TouchDomain and they will be
retrievable for future interactions and consultation.
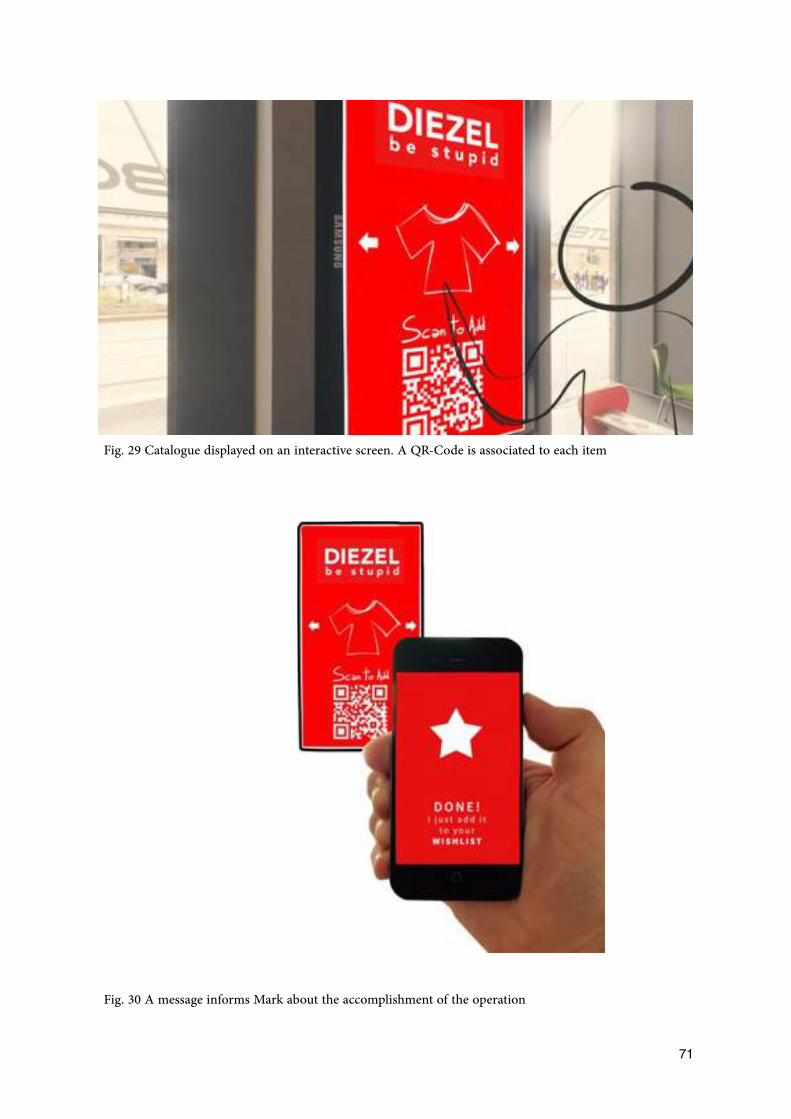
While exploring the shop, Mark notices the new Spring/Summer Collection. A
digital catalogue is displayed on the interactive screen. Mark decided to
explore it. An univocal QR-Code is associated to each clothing item (fig. 29).
On the bottom of the screen Mark reads a label that says: “Scan the QR-Code
to add it (clothing item) to your wish-list”. Mark performs the operation. (Fig.
30).
�70
Fig. 28 Signage that informs the user about the possibility of creating a wish-list
�71
Fig. 29 Catalogue displayed on an interactive screen. A QR-Code is associated to each item
Fig. 30 A message informs Mark about the accomplishment of the operation

Mark finds a bag on a stand just a few step away from the screen.
He thinks by himself: “I could gift it to Clara” (Clara is Mark’s girlfriend).
Again he noticed a QR-Code on applied on the stand and he scans it. This
time the web browser of his smartphones shows a menu with two buttons (Fig.
31).
�72
Fig. 31 A two buttons menu opened on the smartphone web browser
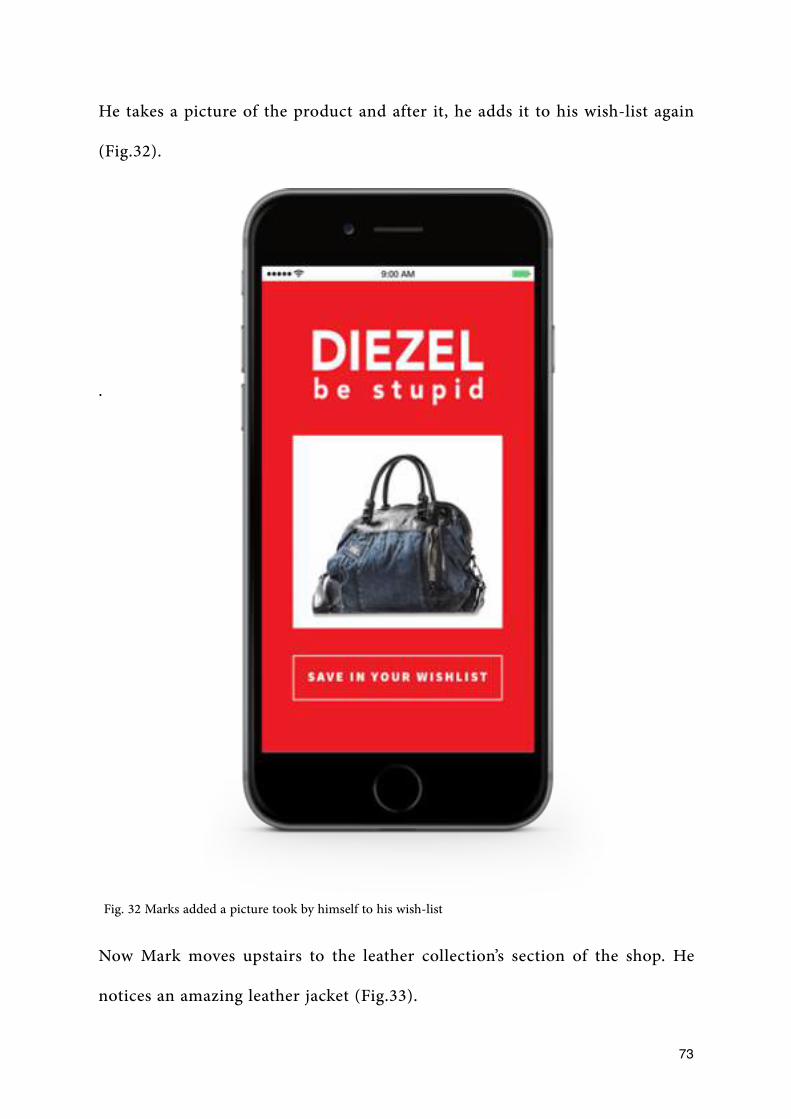
He takes a picture of the product and after it, he adds it to his wish-list again
(Fig.32).
.
Now Mark moves upstairs to the leather collection’s section of the shop. He
notices an amazing leather jacket (Fig.33).
�73
Fig. 32 Marks added a picture took by himself to his wish-list
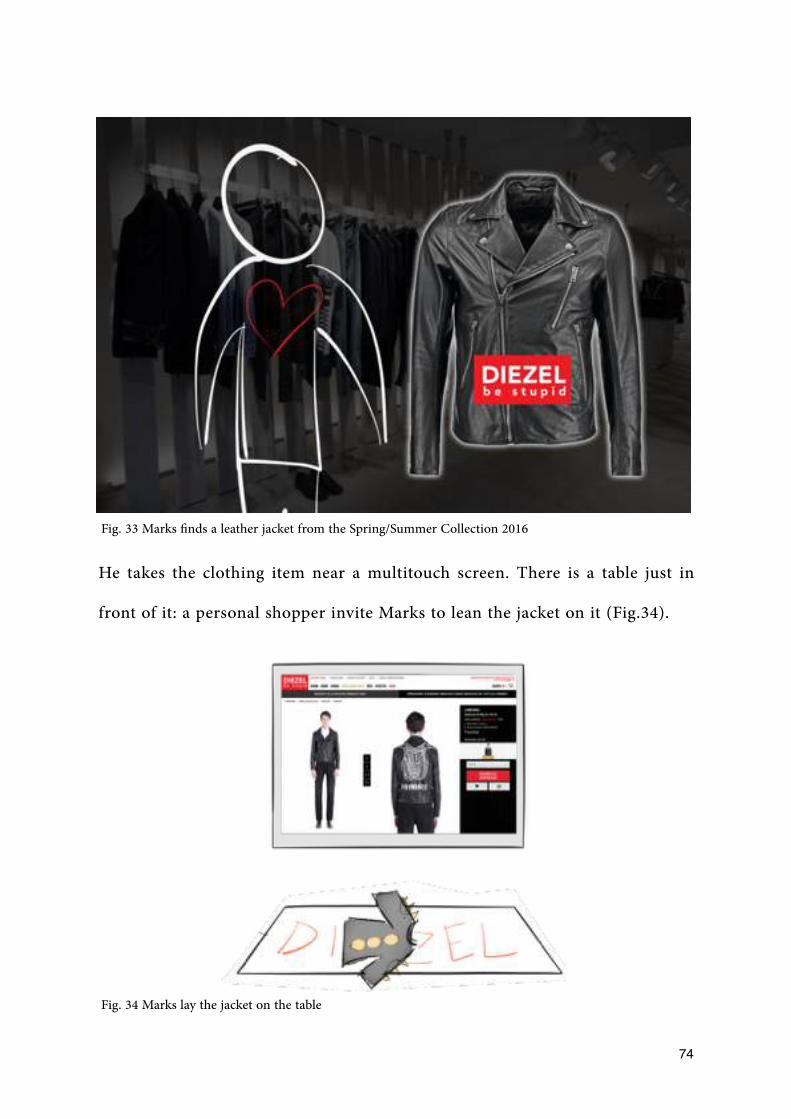
He takes the clothing item near a multitouch screen. There is a table just in
front of it: a personal shopper invite Marks to lean the jacket on it (Fig.34).
�74
Fig. 33 Marks finds a leather jacket from the Spring/Summer Collection 2016
Fig. 34 Marks lay the jacket on the table
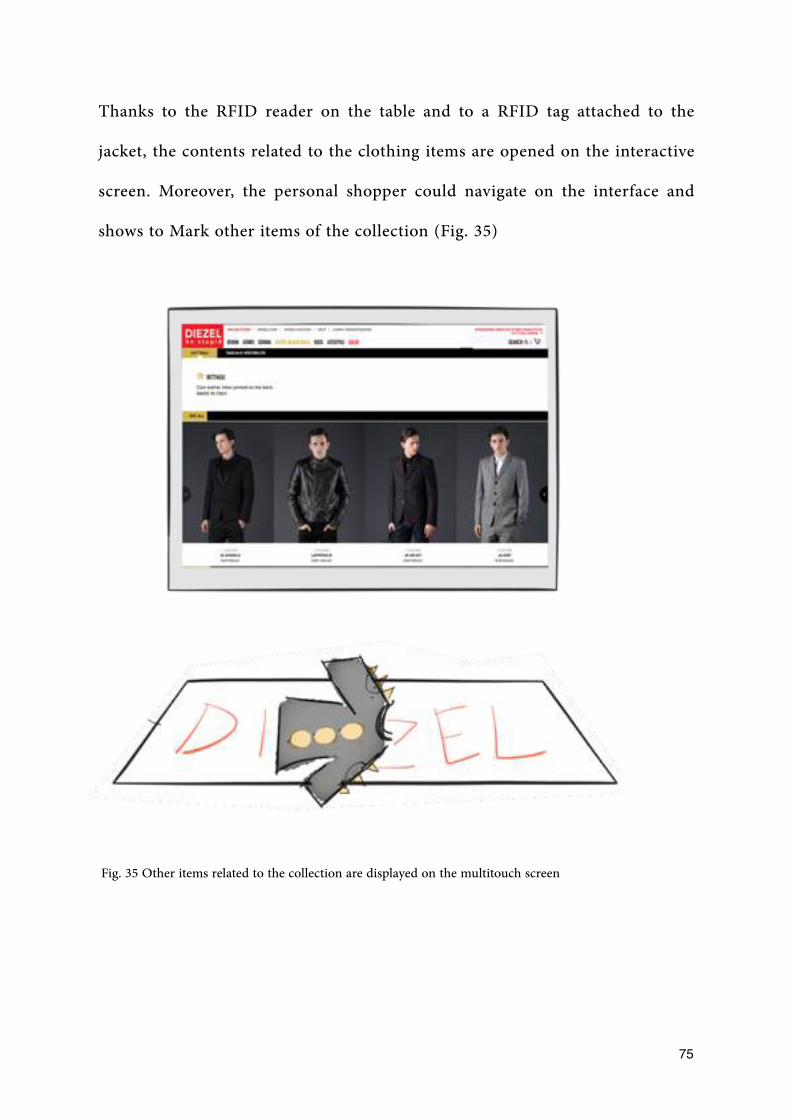
Thanks to the RFID reader on the table and to a RFID tag attached to the
jacket, the contents related to the clothing items are opened on the interactive
screen. Moreover, the personal shopper could navigate on the interface and
shows to Mark other items of the collection (Fig. 35)
�75
Fig. 35 Other items related to the collection are displayed on the multitouch screen

Mark decides that it’s time to try the jacket. He goes to the fitting room. After
wearing the jacket, he goes towards the Magic Mirror. Here Mark scans the
QR-Code in order to initialize the interaction (Fig. 36).
�76
Fig. 36 The magic mirror equipped with a Microsoft Kinect device

Once scanned, TouchDomain is able to “recognize” Mark. The interface
informs mark that it will record him in 3-2-1 seconds (Fig. 37).
�77
Fig. 37 Magic Mirror informs Mark about the recording of a video that will start in a while
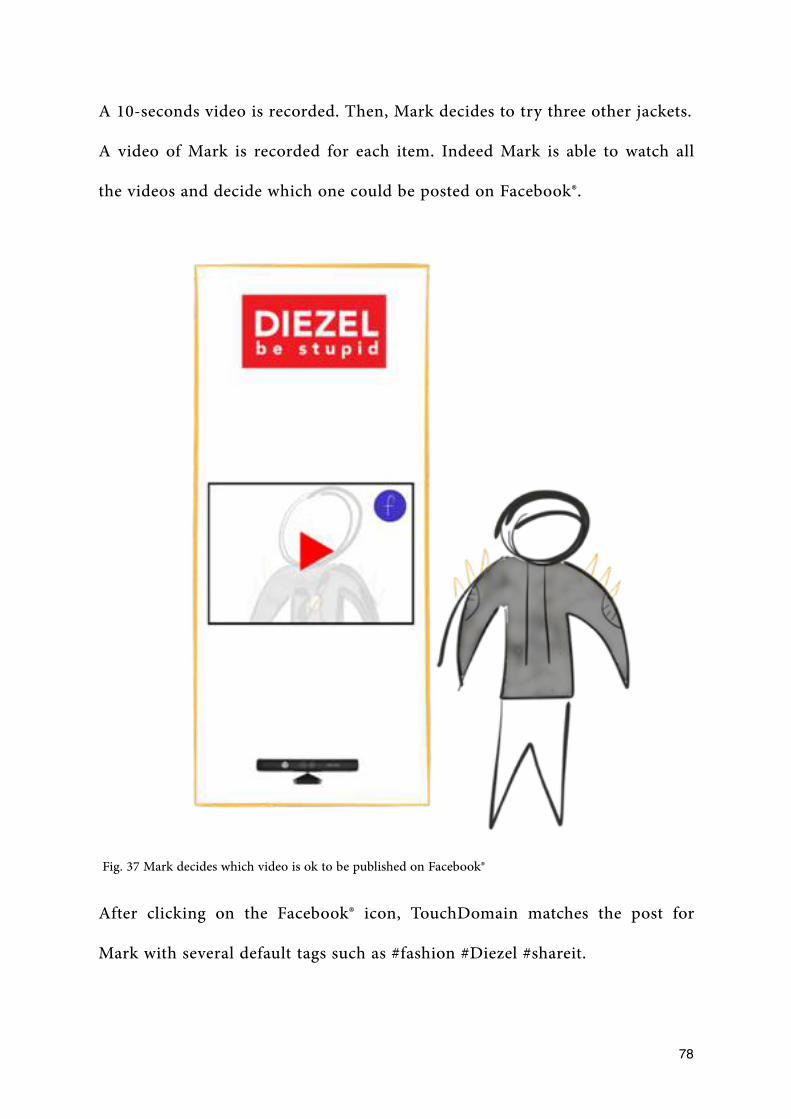
A 10-seconds video is recorded. Then, Mark decides to try three other jackets.
A video of Mark is recorded for each item. Indeed Mark is able to watch all
the videos and decide which one could be posted on Facebook®.
After clicking on the Facebook® icon, TouchDomain matches the post for
Mark with several default tags such as #fashion #Diezel #shareit.
�78
Fig. 37 Mark decides which video is ok to be published on Facebook®
5.4 Chill-outing & Purchase
Mark decides to take a drink in the lounge zone of the shop. Here, a bartender
offers him a cocktail. Mark accepts it and he takes a seat nearby one of the
interactive tables available.
Mark meets another visitor of the store, Giulia and after a small talk he
decides to show her his wish-list.
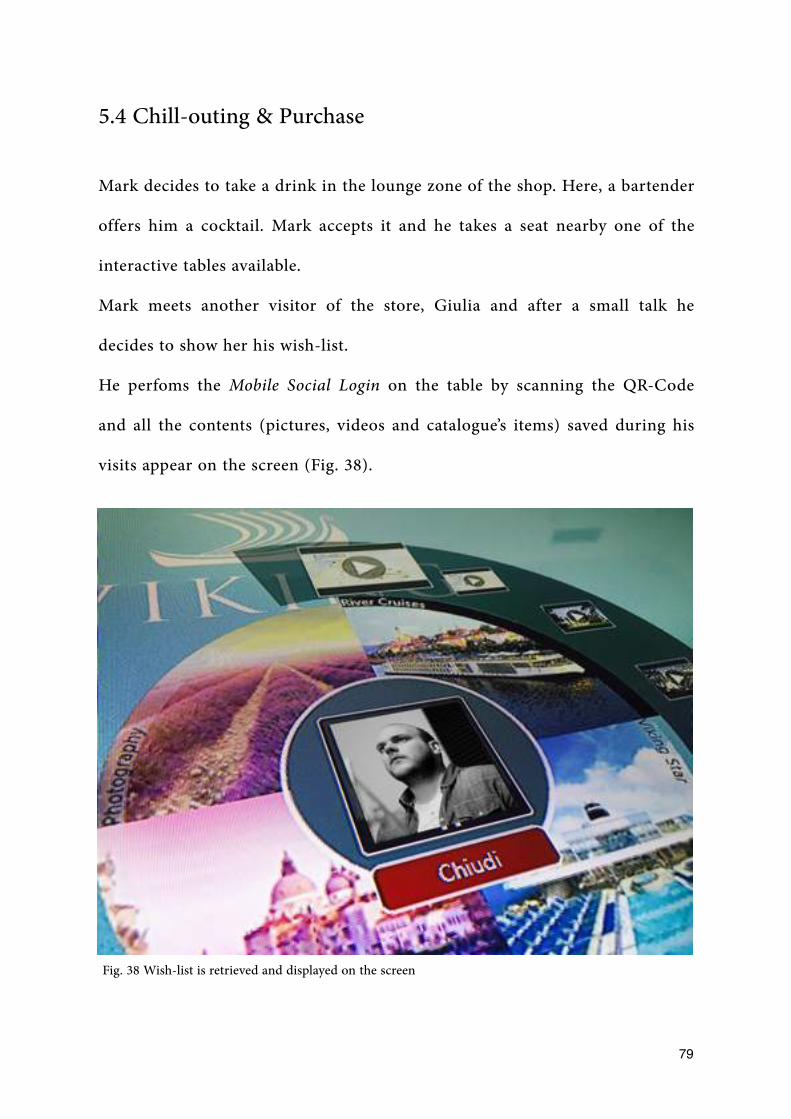
He perfoms the Mobile Social Login on the table by scanning the QR-Code
and all the contents (pictures, videos and catalogue’s items) saved during his
visits appear on the screen (Fig. 38).
�79
Fig. 38 Wish-list is retrieved and displayed on the screen

He opens the video about the leather jacket trial and he stares surprised at the
25 like that his video received in less than half an hour (Fig.39).
The success of the video persuades Marks to purchase the leather jacket. He
says goodbye to Giulia and he approaches the cash desk.
The check-out assistant asks for the coupon that Mark received at the shop
entrance. The cashier asks Mark to scan the QR-Code available on the desk.
�80
Fig. 39 The interface displays the 25 likes received from Mark’s Faceook® friends

Once the operation proceeded, the coupon is automatically retrieved by Once
that the operation is done the coupon is automatically retrieved by
TouchDomain and it discounts the final price (Fig. 40)
Mark is satisfied by his shopping. It’s time to leave the shop with the bag in
his hands. When exiting the shop Mark notices his video on the big screen at
the entrance (The one he posted on Facebook®) (Fig. 41). He’s really happy
and impressed about his experience at the Diesel ’s shop .
�81
Fig. 40 A 20% discount is automatically applied from the Cash register

�82
Fig. 41 The video that Mark recorded during his leather jacket’s trial is displayed on the big size screen
CHAPTER 6. Conclusion
The usage of Digital Signage Networks is one of the hottest topics in the shop
experience. Statistics and growing industry investments support the
innovation of benefits related to their adoptions. Moreover, the cost reduction
of screens, interactive surfaces and NUI has encouraged the diffusion of this
interactive media
As we discussed in chapter 1, User Experience Design is mandatory for the
development of new softwares, hardwares and experiences in this current,
innovative and disruptive scenario. Furthermore, the adoption of Digital
Signage Networks is not optional in an integrated communication strategy of
modern brands (chapter 2 and 3).
TouchDomain, the software designed and developed by Practix, is trying to
“surf this wave of innovation”: on the one hand, by anticipating new trends like
the integration with social media channels such as Facebook®, on the other
hand, by improving the experiences previously designed by other firms.
�83
TouchDomain aims at becoming a technology where contents are not
influenced by the software: the results should be a system able to adapt to any
kind of market, product and brand.
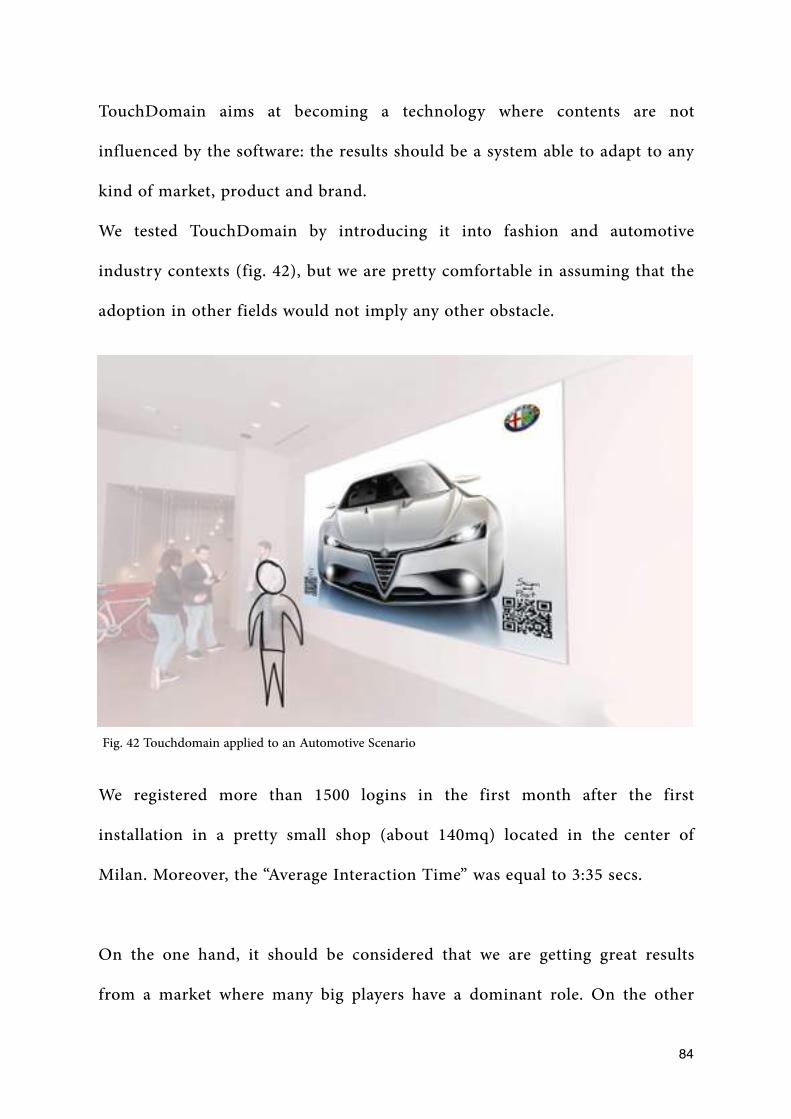
We tested TouchDomain by introducing it into fashion and automotive
industry contexts (fig. 42), but we are pretty comfortable in assuming that the
adoption in other fields would not imply any other obstacle.
We registered more than 1500 logins in the first month after the first
installation in a pretty small shop (about 140mq) located in the center of
Milan. Moreover, the “Average Interaction Time” was equal to 3:35 secs.
On the one hand, it should be considered that we are getting great results
from a market where many big players have a dominant role. On the other
�84
Fig. 42 Touchdomain applied to an Automotive Scenario

hand, these results prove us that we can take advantage of the speed of a little
startup such as Practix.
In 2016 we will continue the design and iteration process started in 2015 in
order to release new brand features and to improve the old one.
�85

�86

Bibliography
Bettencourt, A., Gwinner, K. (1996), Customization of the Service Experience:
The Role of the Frontline Employee. Published in INTERNATIONAL JOURNAL
OF SERVICE INDUSTRY MANAGEMENT 7(2):3-20 · MAY 1996, pp 1-2.
Kelway, J. (2012), Six Circles – An experience design framework [KINDLE
VERSION]. published in UX MAGAZINE, JANUARY 2012 pp 3.
Norman D., (1988), The Design of Everyday Things. New York, NY. published
by Basic Books.
Cooper, A. et al (2007), About Face: the essentials of interaction design. New
Jersey, NJ. Published by Wiley Publishing
Fagan, M.E. (1976), “Design and Code inspection”, published in IBM SYSTEMS
JOURNAL, VOL15, NO 3, 1976 pp 1-5;
Burke, R., (2009), “Behavioral Effects of Digital Signage”. Published in Journal
of Advertising Research, June 1, 2009.
�87
Want, R. et al. (2012), Interactive Digital Signage. Published in Computer
(Volume:45 , Issue: 5 );
Lundstrøm, L., (2008), “Digital Signage Broadcasting: Content Management
and Distribution Techniques” London. Published by Focal Press; 1 edition
(January 17, 2008)
Zhang, Q. et al, (2010), “Cloud computing: state-of-the-art and research
challenges”, published in Journal of Internet Services and Applications
May 2010, Volume 1, Issue 1
Econsultancy, (2012), Multichannel Retail Report 2012. Retrieved on https://
econsultancy.com/reports/the-multichannel-retail-survey/
Ernst Haselsteiner et al. (2010), Security in Near Field Communication (NFC)
Strengths and Weaknesses. Retrieved on http://events.iaik.tugraz.at/
RFIDSec06/Program/papers/002%20-%20Security%20in%20NFC.pdf
"Project Natal" 101". Microsoft. June 1, 2009. Archived from the original on
June 1, 2009. Retrieved on http://blog.seattlepi.com/digitaljoystick/2009/06/01/
e3-2009-microsoft-at-e3-several-metric-tons-of-press-releaseapalloza/.
�88
Resmini, A., Rosati L., (2011), Pervasive Information Architecture: Designing
Cross-Channel User Experiences. Published by Morgan Kaufmann Publishers;
Potente, D., Salving, E., (2009) Apple, Ikea and their integrated Information
Architecture. This article is based on the authors’ presentation at the European
IA Summit held in Amsterdam in September of 2008.
Ryan, N. S., et al (1998) Human-Computer giraffe interaction —- HCI in the
field - Workshop on Human-Compute interaction on mobile devices.
Retrieved on http://www.dcs.gla.ac.uk/johnson/papers/mobile/HCI1MD.html
Ravnik, R., Solina F. (2012) Audience Measurement of Digital Signage:
Quantitative Study in Real-World Environment Using Computer Vision,
Interact. Comput. (2013) 25 (3): 218-228.
Stewart, J., Bederson, B.B, and Druin, A. (1999). Single Display Groupware: A
Model for Co- present Collaboration. In Proceedings of the ACM Conference
on Human Factors in Computing Systems (CHI) ‘99, pp. 286-293.
Stacey D. Scott, Karen D. Grant, Regan L. Mandryk (2003). System Guidelines
for Co-located, Collaborative Work on a Multitouch surfaces Display. ECSCW
2003 pp 159-178
�89

�90

Webliography
Norman, D. (1998) Whither "User Experience”?. Retrieved from http://
peterme.com/index112498.html
Williams, D. (2010), Arbitron Digital Place-Based Video Study 2010. Retrieved
on http://www.arbitron.com/downloads/2010_digital_video_display_study.pdf
Anderson C. (2015) 10 key stats accelerating digital signage adoption. Retrieved
on: http://www.digitalsignagetoday.com/blogs/10-key-stats-accelerating-
digital-signage-adoption/
Mcmullin J., Starmer, S., (2010) . Leaving Flatland: designing services and
systems across Channels. Retrieved on http://www.slideshare.net/jessmcmullin/
leaving-flatland-crosschannel-customer-experience-design
Itzkovitch (2012), Designing with sensors: Creating An Adaptive System To
Enhance UX. Retrieved on https://www.smashingmagazine.com/2012/12/
creating-an-adaptive-system-to-enhance-ux/
�91

Bovet, C. (2015) Five reasons to integrate social media & digital signage.
Retrieved on http://www.sixteen-nine.net/2015/03/24/five-reasons-to-
integrate-social-media-digital-signage/
Nielsen Group, (2013) Under the influence: consumers trust on advertisement.
Retrieved on http://www.nielsen.com/us/en/insights/news/2013/under-the-
influence-consumer-trust-in-advertising.html
Ogilvy/Google/TNS, (2014) Consumer behavior comes under the spotlight in
new study. Retrieved on http://www.ogilvy.com/News/Press-Releases/
June-2014-Consumer-behavior-comes-under-the-spotlight-in-new-study.aspx
Prototyping. Definition available on http://www.usability.gov/how-to-and-
tools/methods/prototyping.html
�92

Acknowledgements
First of all, this thesis is dedicated to my parents, for their unconditional
support, patience and love.
Secondly, this thesis could not exist without the collaboration with the whole
Practix Team (in particular Daniel and Agostino).
A special appreciation goes to my tutor, Professor Liliana Albertazzi, for the
time and passion spent reading and editing these pages.
Last but not least: a big thank you to Ilaria, Elena and Silvia for their patience
in revising my English.
�93

�94

�95