andd eennvviirroonnmmeenntt rreeppoorrtt 22001166 · andd eennvviirroonnmmeenntt rreeppoorrtt...
TRANSCRIPT

HHEEAALLTTHH,, SSAAFFEETTYY aanndd
EENNVVIIRROONNMMEENNTT RREEPPOORRTT 22001166
vvooeessttaallppiinnee
TTuubbuullaarrss
KKIINNDDBBEERRGG
Health, Safety and
Environment Policy
Accident Statistics
Trends of Accident Indices
International
Accident Indices
Environmental
Balance Sheet
Material and Energy
Balance Sheet
Trends of
Input/Output Indices
voestalpine Tubulars GmbH & Co KG www.voestalpine.com/tubulars
Health, Safety and Environment Report
voestalpine Tubulars GmbH & Co KG
Alpinestraße 17
8652 Kindberg-Aumühl
The current Health, Safety and Environment Report of the company voestalpine Tubulars
GmbH & Co KG, with location in Kindberg, specifies the company’s safety, environmental
measures and statistics for the year 2016.

Management Policy
Our Management System is based on the requirements of national and international standards or
specifications such as the ISO 9001, the API Specification Q1, the ISO 14001, the ISO 50001 and the
BS OHSAS 18001, and, at the same time, adheres to all statutory and legal requirements.
The focal points of the Management System are the following criteria:
quality; environment; energy; safety and health protection.
Quality means to us:
Flawless products
Customer orientation and customer satisfaction
Fulfilment of customer requirements
Clear responsibilities and controlled processes
Flexibility and reliable delivery
Safety and health protection means to us:
Safe work places, working equipment and facilities
Protection of employees – awareness-raising activities
Minimization of accident risk - accident prevention - accident avoidance
Health promotion - tidiness & cleanliness
Environment protection means to us:
Conservation of resources - minimization of emissions
Avoidance of impact on the environment
Legal conformity – Legal compliance
Energy management means to us:
Increase of energy efficiency - reduction of energy costs
Use of renewable resources
Recycling management and sustainability
The effectiveness and the continuous improvement process of the Management System is based on
the high qualifications and a high degree of personal responsibility of each employee, risk-based
thinking concerning all relevant processes, as well as modern and state-of-the-art production
facilities.
Kindberg, March 2017

Accident Statistics 2016
Accident-Indices:
In the accident statistics, five key accident indicators are evaluated. The
following key accident indicators relate to wage-earners only.
2015 2016
Accident rate Accidents per 100 employees 6.62 7.65
Frequency of accidents Accidents per 1 million hours 41.97 47.35
Severity of accidents Lost time per accident 78.31 84.58
Lost time due to accidents Lost time in % of working time 0.33 0.40
Lost hours due to accidents per year and per employee 5.18 6.47
Accident rate – Lost time due to accidents – Lost hours due to accidents:
Frequency of accidents – Severity of accidents:
In the year 2016,
1,393,763 production hours
were performed in the
Kindberg plant.
The monthly average, of
voestalpine Tubulars employed:
863 blue collar workers
The accident rate lies at
7.65 accidents per
100 employees in 2016.
The working hours lost
due to accidents at work
amounted to 0.40% of the
total hours worked
in 2016.
The working hours lost
due to accidents at work
were on average 6.47
hours per year and
employee in 2016.
The frequency of
accidents amounted to
47.35 accidents
per 1 million working
hours in 2016.
The average working
time lost per accident
(accident severity)
amounted to
84.58 hours in 2016.

Industrial accidents 2016, according to the number of working days missed by
injured employees:
In 2016, a total of 66 accidents at work were reported, of which 23 were
negligible, 31 minor, 7 moderate and 5 were serious accidents.
Nearly half of the accidents (47%) were ‘minor accidents’ with a related
sick leave duration of between 4 to 19 days.
Causes of accidents and injuries classified under parts of the body 2016:
When analysing the causes of accidents, 19 of the reported accidents relate to
persons injured by falling and 15 accidents were caused by mashing and
crushing.
As regards injured parts of the body, the highest percentage concerned damage
to hands (33 accidents), followed by 11 accidents resulting in injuries to the legs,
and 7 accidents concerned damage to the eyes.
Negligible accidents:
up to 3 days
Minor accidents:
4 to 19 days
Moderate accidents:
20 to 45 days
Serious accidents:
more than 45 days
Negligible accidents34.8%
Minor accidents47.0%
Moderate accidents
10.6%
Serious accidents7.6%

Trends of Accident Indices:
ACCIDENT RATE
Compared to 2015, the
accident rate in 2016
increased by 15.56%.
SEVERITY OF ACCIDENTS
Compared to 2015,
the severity of accidents in
2016 increased by 8.01%.
LOST TIME DUE
TO ACCIDENTS
Compared to 2015,
the lost time due to
accidents in 2016
increased by 24.90%.

International Accident Indices:
TRIR and LTIF illustrated in international accident statistics.
TRIR
Total Recordable
Incident Rate
Ratio of accidents with
mandatory reporting
TRIR (2016) = 5.05
LTIF
Lost Time Injury
Frequency
Ratio of total hours lost
to accidents at work to
hours worked
LTIF (2016) = 0.33%
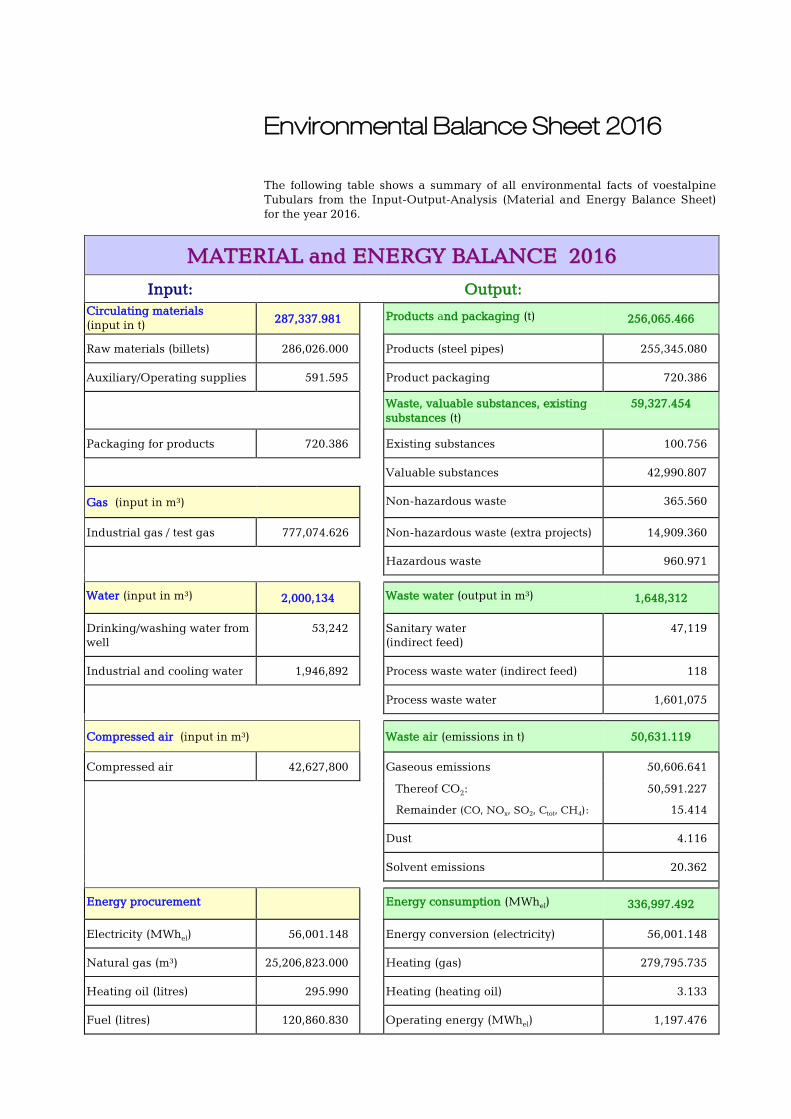
Environmental Balance Sheet 2016
The following table shows a summary of all environmental facts of voestalpine
Tubulars from the Input-Output-Analysis (Material and Energy Balance Sheet)
for the year 2016.
MMAATTEERRIIAALL aanndd EENNEERRGGYY BBAALLAANNCCEE 22001166
Input: Output:
Circulating materials
(input in t) 287,337.981 Products and packaging (t) 256,065.466
Raw materials (billets) 286,026.000 Products (steel pipes) 255,345.080
Auxiliary/Operating supplies 591.595 Product packaging 720.386
Waste, valuable substances, existing
substances (t)
59,327.454
Packaging for products 720.386 Existing substances 100.756
Valuable substances 42,990.807
Gas (input in m³) Non-hazardous waste 365.560
Industrial gas / test gas 777,074.626 Non-hazardous waste (extra projects) 14,909.360
Hazardous waste 960.971
Water (input in m³) 2,000,134 Waste water (output in m³) 1,648,312
Drinking/washing water from
well
53,242 Sanitary water
(indirect feed)
47,119
Industrial and cooling water 1,946,892 Process waste water (indirect feed) 118
Process waste water 1,601,075
Compressed air (input in m³) Waste air (emissions in t) 50,631.119
Compressed air 42,627,800 Gaseous emissions 50,606.641
Thereof CO2:
Remainder (CO, NOx, SO
2, C
tot, CH
4):
50,591.227
15.414
Dust 4.116
Solvent emissions 20.362
Energy procurement Energy consumption (MWhel) 336,997.492
Electricity (MWhel) 56,001.148 Energy conversion (electricity) 56,001.148
Natural gas (m³) 25,206,823.000 Heating (gas) 279,795.735
Heating oil (litres) 295.990 Heating (heating oil) 3.133
Fuel (litres) 120,860.830 Operating energy (MWhel) 1,197.476

Waste:
We distinguish the following waste types as: existing materials, non-hazardous
waste, hazardous waste and valuable substances.
Waste type Waste fractions Total 2016 in t
Existing substances Glass, metal packaging, organic
waste, cardboard packaging, light
fraction packaging
100.756
Non-hazardous
waste
Waste wood, construction waste,
mineral waste, thermal mix,
commercial waste, plastic waste,
abrasives, etc.
365.560
Non-hazardous
waste (extra projets)
Construction waste, concrete waste,
excavation waste, waste wood, etc.
14,909.360
Hazardous waste Emulsions, oil-water mixtures,
waste oils, oil sludge, operating
supplies contaminated with oil,
electronic waste, phosphating
sludge, paint and varnish residues,
mineral waste
960.971
Valuable substances Scrap, shavings, scale 42,990.807
Total 2016: 59,327.454
Wastewater:
After going through various stages of treatment, the process wastewater goes
directly into the river Mürz. There are four different wastewater flows:
Wastewater flow Volume
2016 in m3
Volume in
m3 per hour
Limit in m3
per hour
Seamless pipe plant 839,110 95.79 150
CT plant 751,806 85.82 160
Upsetting installation 3,553 0.41 8
Phosphatizing installation 6,606 0.75 2
Total wastewater 2016: 1,601,075
Wastewater treatment technologies used:
Seamless pipe plant: sedimentation and cooling
CT plant: gravel filter and cooling
Upsetting installation: pressure-release flotation
Phosphating installation: neutralization plant
Adherence to the threshold values of wastewater streams is
controlled by both the company internal chemical laboratory and
external testing institutes.
Emissions:
The majority of the emissions are caused by the combustion of natural gas used in
thermal processes, and a small percentage by use of diesel vehicles.
All industrial waste is
collected separately, stored
in accordance with existing
regulations and handed over
to duly authorized waste
disposal or recycling
companies!
Wastewater load 2016 kg per year
Filterable substances 14,547.55
COD 15,690.56
Hydrocarbons 265.95
Phosphorous 407.33
Iron 86.18
Ammonium 0.21
Aluminium 1.14
Nickel 1.12
Manganese 2.71

Material Required quantity 2016 Gaseous emissionen in t
Natural gas 25,206,823 m3 50,286.099
Diesel fuel 120,506 litres 320.542
Total 2016: 50,606.641
The use of paint containing solvents and pure solvents resulted in solvent
emissions to the amount of 20.362 tons in 2016.
Energy:
Energy consumption consists of the use of natural gas, electric energy and fuel.
Energy supply Required quantity 2016 Energy consumption in MWh
Electricity 56,001.148 MWhel 56,001.148
Natural gas 25,206,823 m3 279,795.735
Heating oil 295.99 litres 3.133
Fuel 120,860.83 litres 1,197.476
Total 2016: 336,997.492
Material and Energy Balance of the production of 1 ton of steel pipe (2016):
Erhitzen - Walzen - Adjustieren - Stauchen - Wärmebehandeln - Prüfen -
Gewindeschneiden -
Production: Heating – Rolling – Straightening – Finishing
Upsetting – Heat Treatment – Testing – Threading
Coupling production – Conserving
Energy supply: - Electricity: 0.219 MWh - Natural gas: 98.717 m3 - Heating oil: 0.001 l - Fuel: 0.473 l Water: 7.834 m3
- Drinking water from well: 0.209 m3 - Industrial and cooling water: 7.625 m3
Compressed air:
166.942 m3
Billets: 1,120.155 kg
Operating supplies: 2.317 kg - Oil - Lubrications - Paint and lacquer - Solvents - Corrosives - Metal working agents - Phosphate agents - Cleaning agents
Energy consumption 1.320 MWh
Wastewater: 6.455 m3 - Indirect sanitary water: 0.185 m3 - Direct waste water: 6.270 m3
Recyclable: 168.364 kg
Non-hazardous waste (extra projects): 53.389 kg
Hazardous waste: 3.763 kg
Packaging: 2.821 kg
Steel pipe: 1,000 kg
Emissions: 198.285 kg - CO2: 198.129 kg - CO: 0.0049 kg - NOx : 0.0405 kg - SO2 : 0.0020 kg - C
ges : 0.0128 kg - Dust: 0.016 kg - Solvent emissions: 0.080 kg
Recyclable waste: 0.395 kg
- Electricity: 0.219 MWh - Natural gas: 1.096 MWh - Fuel: 0.005 MWh
Non-hazardous waste: 1.432 kg
Of 50,606.641 tons of
gaseous emissions, the
major part (i.e. 99.97%)
comprises 50,591.227 tons of
CO2-emissions.

Trends of Input Indices from 1998 to 2016:
The specific input and output values relate to the corresponding absolute values in proportion to the
volume of production.
Trends of Output Indices from 1998 to 2016:

Imprint
Content, design and layout:
Management Systems Department
Contact:
Harald Kohlhofer
T.+ 050304 23 366
F.+ 050304 63 346
voestalpine Tubulars GmbH & Co KG
Alpinestraße 17
8652 Kindberg-Aumühl
T.+43/50304/23-0
F.+43/50304/63-0
www.voestalpine.com/tubulars