and other high elevation bird species in atlantic canada · the bicknell’s thrush is one of the...
TRANSCRIPT

Developing a protocol for monitoring the Bicknell’s Thrush (Catharus bicknelli)
and other high elevation bird species in Atlantic Canada
Becky Whittam and Melanie Ball
Bird Studies Canada - Atlantic Region
P.O. Box 6227 Sackville, NB E4L 1G6
(506) 364-5047
With funding from
Species At Risk Implementation and Recovery Program Parks Canada
And
Canadian Wildlife Service
March 31, 2002

High Elevation Bird Monitoring page 2
Table of Contents Executive Summary ........................................................................................................ 3 Introduction..................................................................................................................... 4 Methods............................................................................................................................ 4 Analyses and Results ...................................................................................................... 6 Route Choice.................................................................................................. 6 Number of Routes .......................................................................................... 6 Factors affecting bird vocalizations ............................................................... 7 Likelihood of Bicknell’s Thrush detection .................................................... 7 10- versus 15-minute point count protocols................................................... 8 Playback......................................................................................................... 8 Habitat............................................................................................................ 9 Discussion ........................................................................................................................ 9 Number of Routes .......................................................................................... 9 Factors affecting Bicknell’s Thrush vocalizations......................................... 9 Likelihood of Bicknell’s Thrush detection .................................................. 10 10- versus 15-minute point count protocols................................................. 10 Playback....................................................................................................... 10 Habitat.......................................................................................................... 11 Recommended Protocol................................................................................................ 11 Acknowledgements ....................................................................................................... 12 Literature Cited ............................................................................................................ 13 Tables ............................................................................................................................. 14 Figures............................................................................................................................ 19 Appendix A. Location of all survey stops ................................................................... 24

High Elevation Bird Monitoring page 3 Executive Summary The goal of this project was to develop a protocol for a volunteer-based survey of Bicknell’s Thrush (Catharus bicknelli)and other high elevation bird species in Atlantic Canada. The two objectives of the survey would be to: 1) monitor populations of high elevation species; and 2) characterize Bicknell’s Thrush habitat in Atlantic Canada. Eighteen routes consisting of 5 stops spaced 250 m were run in June 2001 in the highlands of Nova Scotia, in order to test short (10-minute) and long (15-minute) protocols, and to determine whether time of day, date, weather, and/or playback affect the detectability of the four target species (Bicknell’s Thrush, Swainson’s Thrush, Blackpoll Warbler and Fox Sparrow). Qualitative habitat data were also collected along each stop for each route. Using the data collected during this study, along with data collected in New Brunswick in 1997, a power analysis indicated that a sufficiently powerful survey protocol (power of 0.90 or more and a declining trend of 3%/year, at a significance level of 0.85) could be accomplished using 65 routes surveyed once per year over 20 years. Results of generalized linear models indicated that neither day of year, route, observer, time of day, temperature, wind, cloud or precipitation influenced vocalizations by any of the four target species. The likelihood of detecting Bicknell’s Thrush increased on each successive run of a route, although the Probability of Occurrence of Bicknell’s Thrush on any given run of a point was relatively high, at 0.66. There was no difference in the mean number of individual target species detected using the short versus the long protocol, although the Relative Abundance of Bicknell’s Thrush was higher using the long versus the short protocol. Bicknell’s Thrush vocalizations peaked between 4-4:30 am and 8-8:30 pm. While playback did not significant increase the number of Bicknell’s Thrush detected, there was a tendency for more Bicknell’s Thrush to be detected for the first time following playback compared with before playback. Bicknell’s Thrush did not appear to habituate to playback using data from multiple runs of the same route. Stops where Bicknell’s Thrush were present were categorized more often as having dense conifer stems compared with stops where Bicknell’s Thrush were absent. Hardwood stems were sparse in all cases. Stops where Bicknell’s Thrush were present also tended to fall into the shorter canopy height category compared with stops where Bicknell’s Thrush were not present. All types of stops (whether Bicknell’s Thrush were present or absent) were categorized as predominantly spruce/fir. We recommend a monitoring program involving 65 routes run once per year, either in the morning or evening in mid-June, with each route consisting of 5 stops spaced 250 m. At each stop, a 10-minute protocol consisting of silent listening and playback should be used. Routes where Bicknell’s Thrush are not detected should be revisited during the peak survey period to verify the presence or absence of the species for more accurate habitat characterization.

High Elevation Bird Monitoring page 4 Introduction The main goal of this project was to develop a protocol for a volunteer-based survey of Bicknell’s Thrush (Catharus bicknelli) and other high elevation bird species in Atlantic Canada. This habitat is under threat by climate change (causing loss of red spruce and balsam fir), development (ski areas, cell tower and wind power development) as well as industry, and is often not well covered by existing bird monitoring programs like the Christmas Bird Count and Breeding Bird Survey. The Bicknell’s Thrush is one of the rarest songbirds in North America, with a population of between 5,000-15,000 pairs (Nixon 1998). It is listed as a species of "High responsibility, High Concern" by Partners in Flight Canada (Downes et al. 2000), and as a Species of Special Concern by the Committee on the Status of Endangered Wildlife In Canada (COSEWIC). Furthermore, it is listed as Globally Vulnerable by the IUCN (Stattersfield and Capper 2000). These designations are largely a result of the species' fragmented populations, and the fact that very little is known about its population status and breeding biology, because of its shy habits, remote breeding habitat, and only very recent designation as a full species (Ouellet 1992, AOU 1995). A monitoring program is urgently needed to help determine the status of the Bicknell’s Thrush population: is it increasing, decreasing, or remaining stable? Secondarily, a survey could help provide information on habitat used by the Bicknell’s Thrush in Atlantic Canada. Therefore, the main objectives of this project were: 1. To use the Bicknell’s Thrush population in Cape Breton Highlands National Park (CBHNP) and nearby Cape North to develop and test a protocol for a volunteer-based survey of high elevation bird species, with particular emphasis on the Bicknell’s Thrush, and secondary emphasis on Fox Sparrow (Passerella iliaca), Swainson's Thrush (Catharus ustulatus) and Blackpoll Warbler (Dendroica striata). Specifically, we wanted to determine: a) how many routes are required to achieve appropriate statistical power to detect population change over time; b) how long a point count needs to be; c) how many times a route needs to be surveyed in a season; d) whether time of day (morning versus evening) affects survey results; e) whether date affects results; and f) whether or not playback is necessary to increase the ability to detect Bicknell’s Thrush. 2. To submit new Bicknell’s Thrush records to the Parks Canada GIS database for use in mapping Bicknell’s Thrush habitat in Atlantic Canada. Methods Along with a field crew, we scouted eighteen survey routes between 4 and 11 June in five general areas: Pacquet Lake Trail (CBHNP), Lac a Simeon Trail (CBHNP), Tipover Lake Trail (CBHNP), French Mountain (CBHNP), and Money Point Road, Cape North (Figs. 1-6). We chose routes based on habitat suitability, and almost always placed them in areas known (from previous research; R. Knapton and D. Busby, unpubl. data) to have Bicknell’s Thrush. Each route consisted of 5 stops separated by 250 m. We waypointed each stop along each route (NAD 83; see Appendix A). We also collected basic qualitative habitat information for each stop using the Mountain BirdWatch protocol (VINS 2001): at each stop, we categorized conifer, hardwood,

High Elevation Bird Monitoring page 5 and understorey stem density as dense, moderate or sparse, and we also categorized each stop by tree dominance (conifer & hardwood co-dominant, hardwood dominant, or spruce/fir dominant) and canopy height (1-3m, 3-5m, 5-7m, or 7-9m). Routes were run between 11 - 27 June. We collected weather data (cloud, precipitation, temperature) for every survey, and noted the time we started and finished each route. We attempted to survey each route 8 times: twice in the morning (3:30-6:30 am) and evening (7:00-10:00 pm) within a 36 hour period, alternating between long and short survey protocols (see below), then repeated again about one week later. For example, for a single route we might attempt to run it Monday evening (long protocol), Tuesday morning (long protocol), Tuesday evening (short protocol) and Wednesday morning (short protocol). We did not vary the order of protocols (i.e. we almost always ran them long pm, long am, short pm, short am). We then attempted to repeat this series of 4 survey runs approximately one week later. We tested both long and short survey protocols. The long protocol was 15 minutes in total, beginning with 10 minutes of silent listening, followed by a 30 second broadcast of Bicknell’s Thrush vocalizations and another 5 minutes of silent listening. The short protocol was 10 minutes in total, beginning with 5 minutes of silent listening, and then a 30 second broadcast of Bicknell’s Thrush vocalizations, then another 5 minutes of silent listening. The Bicknell’s Thrush broadcast tape consisted of a 30 second sequence of calls and songs, originally recorded by Dan Busby. The same model of sound equipment was used for almost all surveys (Sony CFS-E2 Radio-Cassette Recorder; recommended by the Vermont Mountain Birdwatch program). An alternate unit (Sony CFD-S22), which was less portable but equally audible, was used when four researchers were working simultaneously as we only had three CFS-E2s. On each survey stop, we concentrated on detecting the four target species: Bicknell’s Thrush, Fox Sparrow, Swainson’s Thrush, and Blackpoll Warbler. If a target species was detected we recorded the time it began to vocalize, its approximate position in relation to a 100 m radius study plot, and the number of minutes it continued to vocalize following detection (in minute-by-minute intervals). We did not distinguish between songs and calls. Whenever possible, we also noted the presence of any non-target bird species seen or heard during the stop. The same person surveyed the same routes as much as possible. Each surveyor surveyed only one route per period (i.e. morning/evening). Five different people conducted surveys throughout the length of the project (Sean Blaney, Beth Flanigan, Nev Garrity, Mike Russell, and Becky Whittam), but generally only three to four people conducted surveys on any given day (BF, MR, BW). Each surveyor was trained to recognize the four target species using the Mountain BirdWatch training tape and by practicing in the field with knowledgeable biologists.

High Elevation Bird Monitoring page 6 Analyses and Results Route Choice We established 18 routes, all of which had at least one of the four target species: 15 had Bicknell’s Thrush, 18 had Swainson’s Thrush, 16 had Blackpoll Warbler, and 12 had Fox Sparrow. Because of unfavourable weather conditions, limited personnel, and situations that posed a risk to the surveyors (i.e. presence of a bear) we were unable to run all survey routes 8 times. We ran each route an average of 5.8 times (range 4-8; Table 1), and we ran each route during at least 2 mornings (one short one long) and 2 evenings (one short, one long). In total, we completed 105 surveys along these 18 routes. Figure 1 shows the location of our survey routes in CBHNP and Cape North. Figs. 2-6 show in detail each stop along each route at the five main areas under study (Simeon Lake, French Mountain, Pacquet Lake, Tipover Lake, and Cape North), and indicate which stops had Bicknell’s Thrushes at least once and which did not. The mean proportion of survey runs that had Bicknell’s Thrushes was 0.71±0.09 (range 0.25-1.0). In other words, on any given run of a route, we had a 71% chance of encountering a Bicknell’s Thrush. In addition to those birds detected on survey routes, we also found five previously unrecorded locations for Bicknell’s Thrush in CBHNP (Appendix A, “incidental” detections). In total, including both incidental detections and birds detected on survey routes, we recorded 53 different locations for Bicknell’s Thrush in CBHNP (Appendix A). In order to determine if the 18 routes from the five areas could be considered statistically independent, i.e. no grouping effect of routes by area, we did a nested ANOVA by area and route. Cape North and French Mountain, which each had 4 routes, were tested in one ANOVA, and Simeon Lake, Pacquet Lake, and Lac a Simeon, which each had 3 routes, were tested in another ANOVA. In both groups, routes were significantly different from each other (F=49.25, F0.05 (2),15,3, P<0.0005 and F=49.25, F 0.05(2)6,2=7.26, P<0.0005, respectively) warranting testing them as independent units. Number of Routes Using the count data from Cape Breton in 2001 and data from New Brunswick for 1997 provided by Steve Holmes, we calculated an average mean (0.81) and standard deviation (0.83) of Bicknell’s Thrush detected. Using MONITOR, a power analysis program developed by James Gibbs (1995), we ran a number of simulations varying the number of routes, the number of runs of a route and the number of years over which the project would take place. We decided that our goal would be the ability to detect a 3% decline in the population at 90% power with a significance level of α = 0.15 (Eagle et al. 2000). The power analysis indicated that a sufficiently powerful survey protocol (power of 0.90 or more and a trend of 3%/year, at a significance level of 0.85) could be accomplished using 65 routes, surveyed once per year over 20 years (Table 2).

High Elevation Bird Monitoring page 7 Factors affecting bird vocalizations To determine whether or not date had any effect on survey results, we compared the mean number of Bicknell’s Thrush detected per protocol using only those routes for which each protocol was run twice (separated by a mean of 6.58 days). Such data were available only for the long pm, long am, and short pm protocols. For each of these three protocols, the mean number of Bicknell’s Thrush declined slightly from the first to the second run, although the variation around the mean was high (Fig.7). In order to gauge any potential difference between birds heard in the morning versus the evening we calculated Relative Abundance by point, or the number of birds heard or seen at each point divided by the total number of times each point was surveyed. We compared am versus pm (data from both the long and short protocol were used) using a Wilcoxin rank-sum test for paired data. The test showed no statistical difference in the number of Bicknell’s Thrush heard at the same point surveyed at different times (T_=281, T 0.05(2),38=235, p=0.20). We also ran several generalized linear models to determine if measurements for day of year, route, observer, time of day, as well as temperature, wind, cloud and precipitation at the beginning and end of the survey were influencing bird vocalizations. Generalized linear models are useful for analyzing large amounts of data because they allow the researcher to choose what kind of model best fits the type of data and they do not require transforming the data; for example we used a quasi-poisson model because we were analyzing count data and we used a log-link because of the many zeros present within the data. These models determine how much of the variation in the data is accounted for by the measurements by giving a dispersion and a t-value, i.e. how well the model fits the data and the significance of each measurement within that model. The dispersion value was very high, indicating that much of the variation in bird vocalization was due to factors other than those that were measured. The t-values were for the most part not significant, or only significant for one species (Table 3). However, “route” was significant for 3 of the 4 species, indicating that some birds were more likely to be found on some routes. Likelihood of Bicknell’s Thrush detection To examine whether or not increasing numbers of runs of a route increased the likelihood of detecting Bicknell’s Thrush, we calculated the running maximum number of Bicknell’s Thrush detected on subsequent runs of the same route. For example, if a route was run four times, and the number of Bicknell’s Thrush detected on each run (in order of running) was 2,0,5,3, then the running maximum would be: 2,2,5,5. We averaged the running maximums for all routes, using only data from the long protocol, and combining morning and evening surveys. The maximum number of Bicknell’s Thrush detected per route increased steadily through four runs, but again, the variation around the mean was high in each case (Fig. 8). We also calculated Probability of Occurrence, or the number of points on which a Bicknell’s Thrush was detected in the first run of a survey route divided by the number of times a bird was

High Elevation Bird Monitoring page 8 heard again in subsequent runs of the same area (Nixon 2001). The Probability of Occurrence of Bicknell’s Thrush on any given point in Nova Scotia was 0.66; this is quite a bit greater than the probability of occurrence found previously in New Brunswick (0.40, Nixon et al. 2001), indicating that there is a high level of variability between sites and years. 10 versus 15 minute point count protocols We compared the number of individuals heard during 10 minute versus 15-minute point count protocols for all species by route, using a Wilcoxin rank-sum test. None of the resulting p-values were significant (Bicknell’s Thrush p=0.198, Swainson’s Thrush p=0.340, Fox Sparrow p=0.388, Blackpoll Warbler p=0.164) (Table 4), indicating that there may not be a significant difference between the numbers of individuals found on the same route using the short protocol versus the long protocol. We also calculated Relative Abundance for Bicknell’s Thrush by point and compared 10 minute and 15 minute protocols to determine which captured the greatest Relative Abundance of birds. The result was significant using the Wilcoxin rank-sum test for paired data (T_=145, T0.05 (2),42 =319, p<0.05), indicating that the longer protocol does detect a greater Relative Abundance of Bicknell’s Thrushes. Graphs of peak vocalization time for Bicknell’s Thrush in Cape Breton during the 2001 season show a distinct peak in song for a 30 minute period from 4-4:30 am and 8-8:30 pm (Figs. 9 and 10). These short windows for best hearing Bicknell’s Thrush are similar across the species’ breeding range and were one of the major reasons the Mountain Birdwatch program chose a 5-minute protocol for each point count (VINS 2001). Playback To determine whether or not playback increased the number of Bicknell’s Thrush detected, we examined individual Bicknell’s Thrush detections. Using data from all short protocol runs of all routes (n = 49), we calculated the number of birds that were detected “before & after playback”, “before but not after playback”, and “after but not before playback”. Out of a total of 87 detections, most birds (37%) were detected both before and after playback; only 21.8% were detected before, but not after playback, and 35.6% were detected after, but not before playback. We also examined the effects of playback using a slightly different method. We divided the short protocol into two, five-minute periods, and the long protocol into three, five-minute periods. Since the short protocol involved playback before the second five-minute period, whereas the long protocol didn’t involve playback until after the second five-minute period, the proportion of Bicknell’s Thrush detected in that second five-minute period could be compared between the short and long protocols to determine whether playback has any effect (hypothesizing that, if playback is important, a larger proportion of Bicknell’s Thrush detections would occur in that second five minute period using the short protocol than using the long protocol). Indeed, this appeared to be the case, with 36% of Bicknell’s Thrush detected in the

High Elevation Bird Monitoring page 9 second five-minute period when it was preceded by playback (i.e. short protocol) compared to only 27% when it was not (i.e. long protocol) (Table 5). However, this difference was not significant (chi-square = 1.70, df = 1, p > 0.10). In order to determine if individuals might be becoming habituated to playback over time we did a Friedman’s test comparing the number of birds heard at the same points of each route over time (i.e. on successive runs of the same route). Out of the 96 tests done, we had one significant result for Swainson’s Thrush on Route 4, which was no longer significant after a Bonferroni correction, indicating that playback did not cause a decline in the number of birds heard over time. Habitat Stops where Bicknell’s Thrush were present were categorized more often as having dense conifer stems compared with stops where the birds were not present (Table 6). Understorey stem density of stops where Bicknell’s Thrushes were present tended to be either sparse or dense compared with stops where the birds were not present (Table 6). Hardwood stems were sparse in all cases (Table 6). Stops where Bicknell’s Thrushes were present also tended to fall into the shorter canopy height category compared with stops where Bicknell’s Thrush were not present (Table 7). Canopy dominance did not appear to differ between stops with and without Bicknell’s Thrush; all types of stops were characterized as predominantly spruce/fir (Table 8). Discussion Number of Routes The preliminary results from the power analysis suggest that 65 routes surveyed once per year should provide sufficient power for detecting population change. However, because both sets of data used in this study were from non-randomly chosen sites (i.e. chosen because of the known presence of Bicknell’s Thrush), this power analysis will not reflect the results more likely obtained from the stratified random sampling that will occur during the actual monitoring program. Given this caveat, the power analysis will be redone over the next two years of the monitoring program in order to determine more appropriate estimates of power. Factors affecting Bicknell’s Thrush Vocalizations Generalized linear modeling suggests that most of the environmental variables measured while doing the counts are not significantly affecting vocalizing by any of the four species. Route was important, however, indicating that there is some variation among routes in different areas. The relatively poor fit of the model indicates that another factor, or factors such as pairing status, may be influencing the vocalization behaviour of these species.

High Elevation Bird Monitoring page 10 Likelihood of Bicknell’s Thrush detection While variation was high, the maximum number of Bicknell’s Thrush recorded on any given route increased slightly, although not significantly, with each additional run of a route, suggesting that multiple runs are necessary in order to exhaustively survey the number of birds on a route. Nixon et al. (2001) also found that the cumulative number of points where Bicknell’s Thrush were detected increased steadily, with no leveling off, over six visits, leading to a low probability of detection (0.40) on any given visit. It is difficult to imagine a volunteer survey requiring six or more visits to a site, however, and because population trends are the goal of this monitoring program rather than population size, one or two runs of a route would suffice. Given that fewer Bicknell’s Thrush are detected, in general, on the second run of a particular protocol (separated by 6.5 days), one run of each route should suffice. Neither Bicknell’s nor Swainson’s thrush appeared to be detected more often in the morning compared with the evening, either in terms of absolute numbers heard or relative abundance. This is an important result, as it suggests that surveys can be run during either of these two periods, making it easier for volunteers to choose a convenient survey time. Blackpoll Warbler and Fox Sparrow, however, appeared to be detected more often in the evening compared to the morning, although these differences were not significant. 10 versus 15 minute point count protocols Despite the fact that there was no statistical difference in the absolute number of Bicknell’s Thrush detected in the short and long protocols, our results do show that on average, the long protocol detected 1.5 to 2 times as many Bicknell’s Thrush compared with the short protocol and the Relative Abundance of Bicknell’s Thrush was greater on long vs. short protocols. The other target species (Swainson’s Thrush, Blackpoll Warbler, Fox Sparrow) showed very little difference between numbers detected on short and long protocols. These species may be more likely to be singing constantly during the survey period, whereas Bicknell’s Thrush may sing less predictably. One potential problem with using the longer protocol is an increased chance of missing birds on the last few stops of the survey. The window of time for peak Bicknell’s Thrush vocalizations in the morning is 4-5:30 and 7:30-9:00 in the evening (Figs.9,10). Only the short protocol allows for all points to fall within the 1.5 hour time frame when Bicknell’s Thrush vocalizations are greatest. Playback Our results do not definitively prove that playback significantly increases the number of Bicknell’s Thrush detections, although playback may improve the detectability of Bicknell’s Thrush to a small extent. Our results, however, may be confounded by the fact that we always
High Elevation Bird Monitoring page 11 ran the short protocol after the long protocol, and fewer Bicknell’s Thrush were detected using the short protocol (87) than in the first ten minutes of the long protocol (111, or 97 when corrected for the slight difference in number of runs of the long protocol compared to the short protocol; see Table 3). However, there was no significant decrease in the numbers of Bicknell’s Thrush detected on a point over time, indicating that habituation of Bicknell’s Thrush to playback may not be an issue. Rimmer et al. (1996) found that playback increased the efficiency of detecting Bicknell’s Thrush. Consequently, playback is used by participants in Mountain BirdWatch, although only when birds are not detected by point counts alone (Lambert et al. 2001). Furthermore, Bicknell’s Thrushes detected after playback in Mountain Birdwatch are not included in trend analysis (Lambert et al. 2002). Habitat More detailed habitat measurements at point counts are required in order to better elucidate the habitat use of this species. Our qualitative measures of habitat did not show any clear trends, except that conifer stem density was greater at sites that had Bicknell’s Thrush compared with those that didn’t. This may reflect a preference for overall stem density as well as conifer stem density. Our study involved routes that were chosen because they were known or suspected to have Bicknell’s Thrush. The habitat did not vary greatly between sites, and we did not include any controls in the habitat analysis. As a result, there was very little variation between our habitat measurements on sites that did and did not have Bicknell’s Thrush. Furthermore, our qualitative measures were so broad that any variation that might have existed was likely not recorded. Routes must be chosen randomly from available habitat, and must not be chosen based on knowledge of Bicknell’s Thrush presence, in order to gather unbiased data on population trends and habitat selection by this species. Because the monitoring protocol is designed to detect population trend and not absolute presence or absence of Bicknell’s Thrush in an area it will not provide enough data to allow a proper habitat analysis unless routes where Bicknell’s Thrush were not detected are revisited at least once. Therefore, during years when habitat analyses are done (see below), technicians will attempt to re-run routes where no Bicknell’s Thrush were found in order to get a better estimate of presence/absence of the bird. This information will then be used in the habitat analysis, but not for the monitoring program. Technicians will then do quantitative measurements on habitat following Nixon (2001) and Connolly (2000), and in conjunction with the methods chosen by the Mountain Birdwatch program. Recommended Protocol In 2002, suitable areas in Nova Scotia, New Brunswick and PEI will be chosen using a GIS model based on current information on the elevation and habitat preferences of Bicknell’s Thrush (Nixon et al. 2001 and D. Busby pers. com.). Additional constraints on suitable areas will include: availability of roads or trails; areas at, or exceeding, the 1-km transect length and

High Elevation Bird Monitoring page 12 50m radius of each transect; and access to land. Using stratified random sampling, final routes will be chosen that satisfy the GIS criteria as well as practical limitations (VINS 2001). We recommend the following protocol:
1. 65 or more routes monitored once, starting 30 minutes before dawn or at dusk, during mid-June in order to provide data for population trends.
2. Each 1 km route should consist of 5 points with 250 m between points. 3. Each point along each route should consist of 5 minutes of silent listening, a playback
component of 30 seconds and then 5 more minutes of silent listening. 4. On routes where no Bicknell’s Thrushes are found during the first visit, technicians
will attempt to re-run the route during the peak period to better determine presence/absence of the bird for habitat analyses. Field technicians will measure habitat in July every 2-5 years, or volunteers will be asked to record basic habitat characteristics each year.
Because routes were chosen non-randomly for this study, this recommended protocol should still be considered tentative. 2002 should be considered another pilot year during which sites will be chosen using stratified random sampling and the power analysis will be re-run with these new independent data; it is likely that the number of routes required for sufficient power will increase.
Acknowledgements Thanks to Park’s Canada’s Species At Risk Implementation and Recovery Program and the Canadian Wildlife Service (CWS) for financial support. Dan Busby (CWS) provided the initial impetus for the study. James Bridgland, Sheldon Lambert, and Derek Quann of Cape Breton Highlands National Park provided scientific and logistical support while in the park. Thanks to Richard Knapton and Rob Boone of the University College of Cape Breton for discussions on Bicknell’s Thrush fieldwork, for sharing the Big Intervale cabin with us, and for keeping us safe from “Big Red”. Kim Mawhinney provided a liaison between the Parks Canada Species At Risk program and other parks programs. Thanks to Dawn Allen of Parks Canada for creating the maps used in this report and providing GIS layers required for random route selection in 2002. Thanks to intrepid field workers Beth Flanigan and Mike Russell for their excellent surveying and hiking skills. Nev Garrity and Dan Busby spent several days helping to train the field crew in survey techniques, and Nev Garrity and Sean Blaney helped with fieldwork for one week. Thanks to the Canadian Wildlife Service for providing logistical support to us while completing this report. Yves Aubry, J.P. Savard, Erica Dunn, Brian Collins, Dan Lambert and Steve Holmes provided constructive comments on earlier drafts of this document.

High Elevation Bird Monitoring page 13 Literature Cited Downes, C.M., E. H. Dunn and C. M. Francis. 2000. Canadian Landbird Monitoring Strategy:
monitoring needs and priorities into the new millennium. Partners In Flight-Canada, Ottawa.
Eagle, P.C., J.P.Gibbs, S. Droege. 2000. Power Analysis of Wildlife Monitoring Programs:
Exploring the trade-offs between survey design variables and sample size requirements. Available online at: http://www.pwrc.usgs.gov/resshow/droege3rs/salpower.htm
Lambert, J. D., K. P. McFarland, C. C. Rimmer, and S. D. Faccio. 2001. Mountain BirdWatch
2000. Final Report to the U.S. Fish and Wildlife Service by the Vermont Institute of Natural Science. Available online at: www.vinsweb.org/conservation/citizenscience/2000fullreport.html.
Lambert, J.D., S.D. Faccio, B. Hanscom. 2002. Mountain BirdWatch 2001. Final Report to the
U.S. Fish and Wildlife Service by the Vermont Institute of Natural Science. Available online at: www.vinsweb.org/conservation/citizenscience/2001fullreport.html.
Nixon, E.A. 1998. Status report on Bicknell’s Thrush, Catharus bicknelli, in Canada. COSEWIC, Environment Canada, Ottawa. 53pp. Nixon, E.A., S. B. Holmes, and A. W. Diamond. 2001. Bicknell’s Thrushes (Catharus bicknelli)
in New Brunswick clear cuts: their habitat associations and co-occurrence with Swainson’s Thrushes (Catharus ustulatus). Wilson Bulletin 113: 33-40.
Ouellet, H. 1993. Bicknell’s Thrush: taxonomic status and distribution. Wilson Bulletin 105:
545-754. Rimmer, C. C., J. L. Atwood, K. P. McFarland, and L. R. Nagy. 1996. Population density, vocal
behavior, and recommended survey methods for Bicknell’s Thrush. Wilson Bulletin 108: 639-649.
Stattersfield, A.J. and D. R. Capper. 2000. Threatened birds of the world: the official source for
birds on the IUCN red list. Cambridge: BirdLife International. VINS 2001. Mountain BirdWatch protocol. Unpublished survey protocol by the Vermont
Institute of Natural Sciences. Available online at: www.vinsweb.org/conservation/citizenscience/mb_procedures.html
High Elevation Bird Monitoring page 14
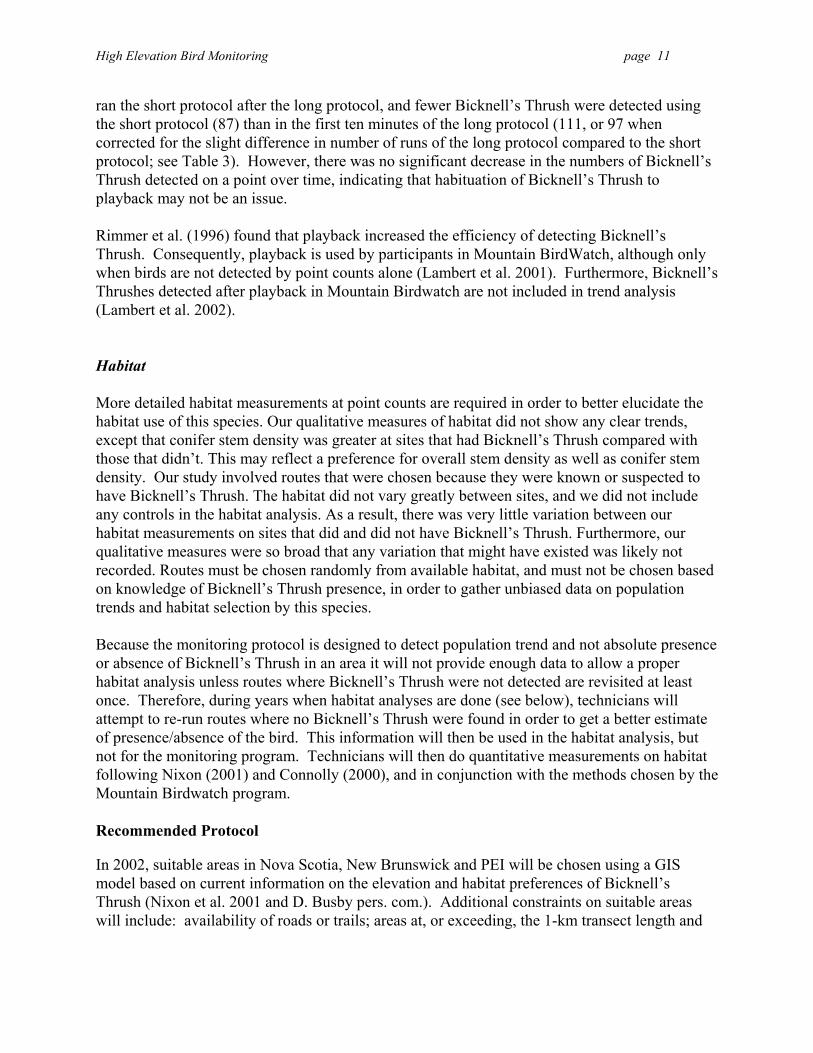
Table 1. Number of morning and evening surveys, along with total number of surveys, run for each survey route in 2001. “max BITH” refers to the maximum number of Bicknell’s Thrush detected on any given run of a route. See Appendix A for specific route locations. r CN - CN -
CN -
CN -
BL -RT LT SL - SL - SL - PL -
PL -
PL -RT T T T SK -
oute # name # am # pm total max BITH comments 1 Cape North 1 4 3 7 16 Lost 1 evening to rain 2 Cape North 2 4 3 7 9 Lost 1 evening to rain 3 Cape North 3 4 3 7 11 Lost 1 evening to rain 4 Cape North 4 4 3 7 3 Lost 1 evening to rain 5 Benjies Lake 4 3 7 7 Lost 1 evening to lack of time
- 6 Radio Tower 4 3 7 1 Lost 1 evening to lack of time - 7 La Tourbiere 4 3 7 0 Lost 1 evening to lack of time
1 Simeon Lake 1 3 3 6 0 Lost 1 AM & 1 PM to bear 2 Simeon Lake 2 3 3 6 3 Lost 1 AM & 1 PM to bear 3 Simeon Lake 3 2 2 4 1 1 Paquet Lake 1 2 2 4 11 2 Paquet Lake 2 4 4 8 4 3 Paquet Lake 3 2 2 4 1
- 14 Bog/Radio Tower 4 4 8 5O - 1 Tipover Lake 1 2 2 4 1O - 2 Tipover Lake 2 2 2 4 6O - 3 Tipover Lake 3 2 2 4 7
1 Skyline 2 3 5 0

High Elevation Bird Monitoring page 15 Table 2. Power analysis for High Elevation Bird Monitoring project. “Routes monitored” are the number of routes considered in the study, “within year effort” is the number of times each route is surveyed per year, and “number of years” is the length of time over which the study is conducted. MONITOR requires a mean and standard deviation from count data over multiple years. On each route we calculated the mean and then subtracted that mean from each count along the same route; using the results we pooled the data and calculated the standard deviation for all routes. By “de-meaning” the counts the spatial variation is removed, i.e. differences due to habitat and random error in counting methodology, and the temporal variation is left which allows pooling of the data. The significance level was 0.15. Routes Within Year Number of Increasing Power Decreasing Power Monitored Effort Years Trend Trend 55 1 10 5% 0.87 10% 0.78 55 1 15 3% 0.92 7% 0.89 55 1 20 2% 0.92 3% 0.85 60 1 10 5% 0.89 10% 0.78 60 1 15 3% 0.91 7% 0.93 60 1 20 2% 0.92 3% 0.89 65 1 10 5% 0.89 10% 0.84 65 1 15 3% 0.93 6% 0.86 65 1 20 2% 0.96 3% 0.91 70 1 10 5% 0.93 10% 0.84 70 1 15 3% 0.95 5% 0.85 70 1 20 2% 0.95 3% 0.93 75 1 10 5% 0.93 10% 0.86 75 1 15 3% 0.96 5% 0.86 75 1 20 2% 0.96 3% 0.95

High Elevation Bird Monitoring page 16 Table 3. Generalized Linear Model t-value results for Bicknell’s Thrush (BITH), Swainson’s Thrush (SWTH), Fox Sparrow (FOSP) and Blackpoll Warbler (BLWA). Highlighted values are significant (α<0.05). Measurements BITH SWTH FOSP BLWA
Day -0.32 -0.72 0 2.07 Route -4.13 -5.90 0 -5.28 Observer -1.68 3.29 0 0.02 Time Start 1.17 -0.45 0 -0.86 Time End 1.31 0.42 0 0.85 Temp. Start 0.58 -0.07 0 0.41 Temp. End -0.42 0.62 0 -0.15 Wind Start -2.28 -4.60 0 -1.05 Wind End 1.86 4.71 0 1.81 Cloud Start 0.66 2.54 0 -0.22 Cloud End 0.79 -2.82 0 1.33 Precipitation Start 2.52 -0.27 0 0.81 Precipitation End -2.32 0 0 -0.36 Table 4. Mean (± SE) number of target species detected per protocol, using data from the first run only. BITH = Bicknell’s Thrush, SWTH = Swainson’s Thrush, BPWA = Blackpoll Warbler, FOSP = Fox Sparrow. Sample sizes are given in brackets. BITH SWTH BPWA FOSP Long pm (N = 21)
3.28 ± 0.88 2.89 ± 0.60 1.56 ± 0.51 1.11 ± 0.40
Long am (N = 18)
3.39 ± 1.03 4.67 ± 1.06 1.44 ± 0.36 0.78 ± 0.37
Short pm (N = 15)
1.5 ± 0.49 4.06 ± 0.90 1.61 ± 0.57 0.72 ± 0.24
Short am (N = 18)
2.11 ± 0.60 3.94 ± 0.96 1.17 ± 0.46 0.50 ± 0.29

High Elevation Bird Monitoring page 17 Table 5. The number (and percent) of Bicknell’s Thrush detections (corrected for the number of runs; see below) occurring in five minute intervals for the short protocol (playback after 5 minutes) and the long protocol (playback after 10 mintues). A detection is defined as the first time an individual Bicknell’s Thrush was detected on any given run of a route. The total number of stops where the long protocol was employed was 280 (56 routes x 5 stops), and the total number of stops where the short protocol was employed was 245 (49 routes x 5 stops). A correction factor of 0.875 (245/280) was therefore applied to the number of detections under the long protocol. The chi-square test compares the number of detections in the two periods of the short protocol with the number of detections in the first two periods of the long protocol. Short Protocol Long Protocol N % N % (all 3
periods)
% (first two periods only)
1-5 minutes 56 64 81 52 73 6-10 minutes 31 36 30 19 27 11-15 minutes N/A N/A 46 29
Chi-square = 1.70, df = 1, p > 0.10 Table 6. Number (percent in brackets) of stops with Bicknell’s Thrush present and absent for which conifer, hardwood and understorey stem densities were categorized as dense, moderate or sparse. Conifer stem density Hardwood stem
density Understorey stem density
Present Absent Present Absent Present Absent Dense 26 (55.3) 15 (34.9) 4 (8.5) 2 (4.7) 23 (48.9) 12 (27.9) Moderate 10 (21.3) 21 (48.8) 11 (23.4) 6 (14) 4 (8.5) 17 (39.5) Sparse 11 (23.4) 7 (16.3) 32 (68.1) 35 (81.4) 20 (42.6) 14 (32.6)
Chi-square = 7.58, df = 2, p = 0.02 2.1, df = 2, p = 0.35 12.41, df = 2, p = 0.002 Table 7. Number (percent in brackets) of stops with Bicknell’s Thrush present and absent that fell into four categories of canopy height. BITH present BITH absent 1-3 m 18 (38.3) 9 (20.9) 3-5 m 24 (51.1) 22 (51.2) 5-7 m 4 (8.5) 11 (25.6) 7-9 m 1 (2.1) 1 (2.3) Chi-square = 6.19, df = 3, p = 0.10

High Elevation Bird Monitoring page 18 Table 8. Number (percent in brackets) of stops with Bicknell’s Thrush present and absent that fell into three categories of canopy dominance. BITH present BITH absent Conifer & hardwood codominant 11 (23.4) 6 (14) Hardwood dominant 2 (4.3) 2 (4.7) Spruce/fir dominant 34 (72.3) 35 (81.4)
Chi-square = 1.31, df = 2, p = 0.52
High Elevation Bird Monitoring page 19
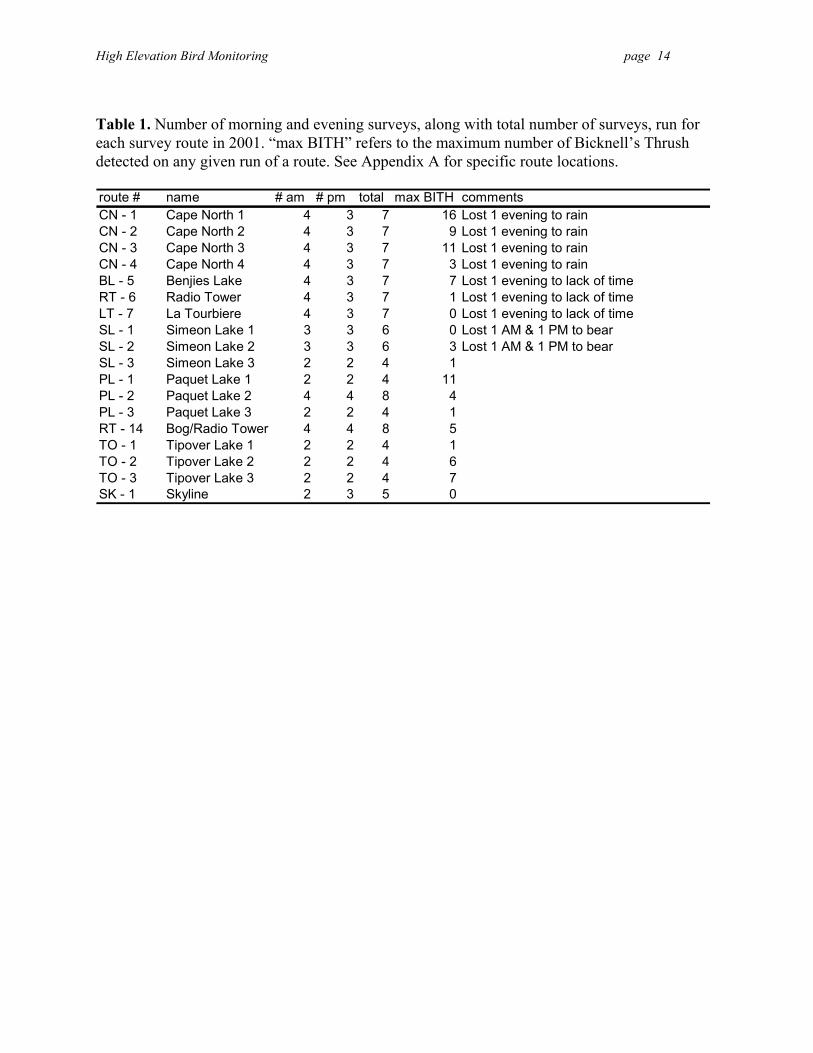
Figure 1. Our five study areas in Cape Breton Highlands National Park (grey border) and Cape North, NS. Stops along survey routes are illustrated by filled circles (Bicknell’s Thrush present) and open circles (Bicknell’s Thrush absent). Figures 2-6 (below) show each of the five study areas in detail.
Figure 2

High Elevation Bird Monitoring page 20
Figure 3
Figure 4

High Elevation Bird Monitoring page 21
Figure 5
Figure 6

High Elevation Bird Monitoring page 22
0
1
2
3
4
5
6
7
8
1 2 1 2 1 2
Mea
n #
BITH
Long am (8) Long pm (8) Short am (9)
Figure 7. Change in the mean (± SE) number of Bicknell’s Thrushes detected per route on the first and second run of a given protocol (separated by 6.5 days on average). Sample sizes are given in brackets.
0123456789
first (14) second (14) third (8) fourth (9)
Run Number
Mea
n of
max
BIT
H de
tect
ed
Figure 8. Change in the maximum number of Bicknell’s Thrushes detected per route with successive runs. Data are from the long protocol only, and are averaged across routes. Samples sizes are given in brackets.

High Elevation Bird Monitoring page 23
0.00.20.40.60.81.01.21.41.61.82.0
3:30-4am 4-4:30am 4:30-5am 5-5:30am 5:30-6am
Figure 9. Mean number of Bicknell’s Thrush heard per minute within each 30 minute morning period.
0.00.20.40.60.81.01.21.41.61.8
6:30-7pm
7-7:30pm
7:30-8pm
8-8:30pm
8:30-9pm
9-9:30pm
9:30-10pm
Figure 10. Bicknell’s Thrush heard per minute within each 30 minute evening period.

High Elevation Bird Monitoring page 24 Appendix A. Location (degree decimals, NAD 83) of all survey stops, as well as five incidental detections of Bicknell’s Thrushes in Cape Breton Highlands National Park. Also noted is whether or not Bicknell’s Thrushes were detected on each stop (“Bicknell’s Thrush detected?”). lat long route#-station site Bicknell’s Thrush
detected? comments
47.01673 -60.4231 CN1-005 Cape North 1 yes 47.01453 -60.4233 CN1-004 Cape North 1 yes 47.01228 -60.423 CN1-003 Cape North 1 yes 47.01002 -60.423 CN1-002 Cape North 1 yes 47.00935 -60.4263 CN1-001 Cape North 1 yes 47.00746 -60.4245 CN2-001 Cape North 2 yes 47.00552 -60.4263 CN2-002 Cape North 2 yes 47.00388 -60.4286 CN2-003 Cape North 2 yes 47.00208 -60.4306 CN2-004 Cape North 2 yes 47.00014 -60.4322 CN2-005 Cape North 2 yes 46.99823 -60.4339 CN3-001 Cape North 3 yes 46.99614 -60.4351 CN3-002 Cape North 3 yes 46.99464 -60.4375 CN3-003 Cape North 3 no 46.99285 -60.4396 CN3-004 Cape North 3 yes 46.99062 -60.4386 CN3-005 Cape North 3 no 46.98838 -60.4387 CN4-001 Cape North 4 yes 46.98642 -60.4403 CN4-002 Cape North 4 no 46.98444 -60.4419 CN4-003 Cape North 4 yes
46.9824 -60.4432 CN4-004 Cape North 4 yes 46.98017 -60.4441 CN4-005 Cape North 4 yes 46.74591 -60.822 BL5-001 Benjies Lake yes 46.74699 -60.8192 BL5-002 Benjies Lake yes 46.74639 -60.8161 BL5-003 Benjies Lake yes 46.74578 -60.8129 BL5-004 Benjies Lake yes 46.74515 -60.8098 BL5-005 Benjies Lake no
46.7273 -60.8413 RT6-005 Radio Tower no 46.72944 -60.8422 RT6-004 Radio Tower no
46.7315 -60.8434 RT6-003 Radio Tower no 46.73098 -60.8465 RT6-002 Radio Tower no 46.72961 -60.8491 RT6-001 Radio Tower yes 46.74164 -60.8271 LT7-001 La Tourbiere no 46.74019 -60.8296 LT7-002 La Tourbiere no 46.73883 -60.8321 LT7-003 La Tourbiere no 46.73748 -60.8348 LT7-004 La Tourbiere no 46.73602 -60.8373 LT7-005 La Tourbiere no 46.64846 -60.8751 SL1-005 Simeon Lake 1 no 46.64836 -60.8784 SL1-004 Simeon Lake 1 no 46.64752 -60.8814 SL1-003 Simeon Lake 1 no 46.64634 -60.8842 SL1-002 Simeon Lake 1 no 46.64621 -60.8846 SL1-001 Simeon Lake 1 no
46.6464 -60.8878 SL2-005 Simeon Lake 2 yes 46.64616 -60.8911 SL2-004 Simeon Lake 2 yes 46.64478 -60.8937 SL2-003 Simeon Lake 2 yes 46.64362 -60.8966 SL2-002 Simeon Lake 2 no 46.64239 -60.8993 SL2-001 Simeon Lake 2 yes
46.6426 -60.9025 SL3-001 Simeon Lake 3 yes

High Elevation Bird Monitoring page 25 46.64262 -60.9057 SL3-002 Simeon Lake 3 no 46.64239 -60.9089 SL3-003 Simeon Lake 3 no 46.64246 -60.9122 SL3-004 Simeon Lake 3 no 46.64125 -60.9149 SL3-005 Simeon Lake 3 no
46.7213 -60.8404 RT2-002 Radio Tower 2 yes 46.7192 -60.8393 RT2-003 Radio Tower 2 yes
46.71698 -60.8387 RT2-004 Radio Tower 2 yes 46.71488 -60.8376 RT2-005 Radio Tower 2 yes 46.72345 -60.8396 RT2-001 Radio Tower 2 no 46.73068 -60.5354 TL1-001 Tipover Lake 1 no 46.73132 -60.5327 TL1-002 Tipover Lake 1 no 46.73217 -60.5297 TL1-003 Tipover Lake 1 no 46.73379 -60.5274 TL1-004 Tipover Lake 1 yes 46.73532 -60.525 TL1-005 Tipover Lake 1 no 46.72903 -60.5378 TL2-005 Tipover Lake 2 yes tipover cabin and TL2-005 46.72681 -60.5378 TL2-004 Tipover Lake 2 yes 46.72903 -60.5401 TL2-003 Tipover Lake 2 yes 46.72681 -60.5425 TL2-002 Tipover Lake 2 no 46.72524 -60.5447 TL2-001 Tipover Lake 2 no 46.72361 -60.547 TL3-001 Tipover Lake 3 no
46.722 -60.5493 TL3-002 Tipover Lake 3 yes 46.72036 -60.5519 TL3-003 Tipover Lake 3 yes 46.71875 -60.5542 TL3-004 Tipover Lake 3 yes 46.71685 -60.5567 TL3-005 Tipover Lake 3 yes 46.73803 -60.8809 SK1-001 Skyline no 46.74025 -60.8805 SK1-002 Skyline no 46.74246 -60.881 SK1-003 Skyline no 46.74467 -60.8814 SK1-004 Skyline no 46.74554 -60.8844 SK1-005 Skyline no 46.82435 -60.4649 PL1-001 Paquet Lake 1 no 46.82311 -60.4677 PL1-002 Paquet Lake 1 yes
46.8216 -60.4701 PL1-003 Paquet Lake 1 yes 46.82035 -60.4729 PL1-004 Paquet Lake 1 yes 46.82003 -60.4761 PL1-005 Paquet Lake 1 yes 46.82593 -60.4496 PL2-001 Paquet Lake 2 no 46.82581 -60.4529 PL2-002 Paquet Lake 2 no 46.82605 -60.4562 PL2-003 Paquet Lake 2 yes 46.82494 -60.459 PL2-004 Paquet Lake 2 yes 46.82374 -60.4618 PL2-005 Paquet Lake 2 yes 46.82618 -60.4463 PL3-001 Paquet Lake 3 yes 46.82767 -60.4439 PL3-002 Paquet Lake 3 no 46.82973 -60.4427 PL3-003 Paquet Lake 3 yes 46.83161 -60.4409 PL3-004 Paquet Lake 3 no 46.83267 -60.438 PL3-005 Paquet Lake 3 no 46.71524 -60.4876 LONG-L Incidental yes Long Lake (Glasgow Lakes) 46.71378 -60.4806 LONGL2 Incidental yes Long Lake (Glasgow Lakes) 46.81313 -60.4747 LONGL3 Incidental yes Long Lake (Glasgow Lakes) 46.81667 -60.463 BRA PON Incidental yes Branch Pond 46.81982 -60.5115 LOI TRA Incidental yes Lake of Islands Trail Junction