ancillary service markets - monitoring analytics · section 9 ancillary services 2013 onitorin...
TRANSCRIPT

Section 9 Ancillary Services
2013 Quarterly State of the Market Report for PJM: January through June 223© 2013 Monitoring Analytics, LLC
Ancillary Service MarketsThe United States Federal Energy Regulatory Commission (FERC) defined six ancillary services in Order No. 888: 1) scheduling, system control and dispatch; 2) reactive supply and voltage control from generation service; 3) regulation and frequency response service; 4) energy imbalance service; 5) operating reserve – synchronized reserve service; and 6) operating reserve – supplemental reserve service.1 Of these, PJM currently provides regulation, energy imbalance, synchronized reserve, and operating reserve – supplemental reserve services through market-based mechanisms. PJM provides energy imbalance service through the Real-Time Energy Market. PJM provides the remaining ancillary services on a cost basis. Although not defined by the FERC as an ancillary service, black start service plays a comparable role. Black start service is provided on the basis of incentive rates or cost.2
The Market Monitoring Unit (MMU) analyzed measures of market structure, conduct and performance for the PJM Regulation Market, the two regional Synchronized Reserve and Non-Synchronized Reserve Markets, and the PJM DASR Market for the first six months of 2013.
Table 9‑1 The Regulation Market results were indeterminate for January through June, 2013
January through June 2013Market Element Evaluation Market Design
Market Structure Not Competitive
Participant Behavior CompetitiveMarket Performance To Be Determined To Be Determined
•The Regulation Market structure was evaluated as not competitive for January through June 2013 because the Regulation Market had one or more pivotal suppliers which failed PJM’s three pivotal supplier (TPS) test in 90 percent of the hours in January through June, 2013.
•Participant behavior in the Regulation Market was evaluated as competitive for January through June, 2013 because market power mitigation requires
1 75 FERC ¶ 61,080 (1996).2 For more details, see the 2012 State of the Market Report for PJM, Volume II, Section 9, “Ancillary Service Markets.”
competitive offers when the three pivotal supplier test is failed and there was no evidence of generation owners engaging in anti-competitive behavior.
•Market performance was evaluated as indeterminate, after the introduction of the new market design. It is too early to reach a definitive conclusion about performance under the new market design because important parts of the design is inefficient and because there is not yet enough information on performance.
•Market design was evaluated as indeterminate, after the introduction of the new market design. While the market design continues to include the incorrect definition of opportunity cost, overall the changes were positive. The market design also includes the incorrect definition of the marginal benefits factor for purposes of settlement. It is too early to reach a definitive conclusion about the new market design because there is not yet enough information about actual implementation of the design.
Table 9‑2 The Synchronized Reserve Markets results were competitiveMarket Element Evaluation Market Design
Market Structure: Regional Markets Not Competitive
Participant Behavior CompetitiveMarket Performance Competitive Effective
•The Synchronized Reserve Market structure was evaluated as not competitive because of high levels of supplier concentration. The MMU estimates that the Synchronized Reserve Market would have had one or more pivotal suppliers which failed the three pivotal supplier test in 6.1 percent of the hours in January through June, 2013.
•Participant behavior was evaluated as competitive because the market rules require competitive, cost based offers.
•Market performance was evaluated as competitive because the interaction of the participant behavior with the market design results in competitive prices.
2013 Quarterly State of the Market Report for PJM: January through June
224 Section 9 Ancillary Services © 2013 Monitoring Analytics, LLC
•Market design was evaluated as effective because market power mitigation rules result in competitive outcomes despite high levels of supplier concentration.
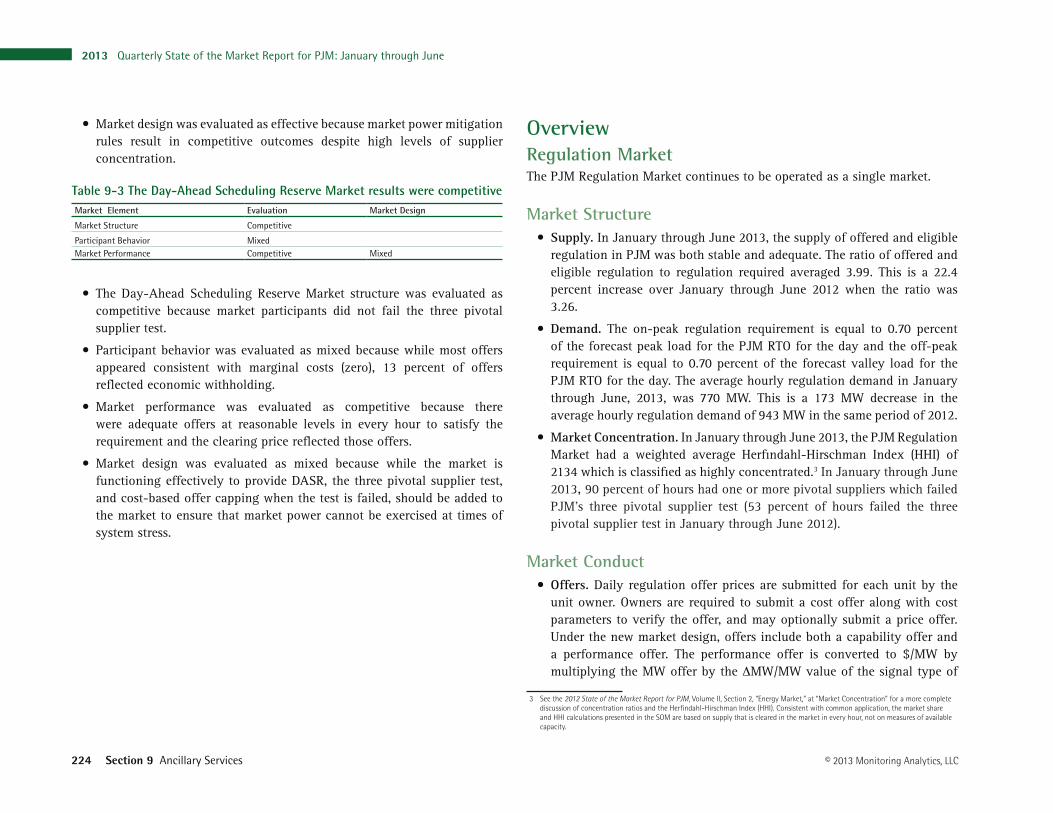
Table 9‑3 The Day‑Ahead Scheduling Reserve Market results were competitiveMarket Element Evaluation Market Design
Market Structure Competitive
Participant Behavior MixedMarket Performance Competitive Mixed
•The Day-Ahead Scheduling Reserve Market structure was evaluated as competitive because market participants did not fail the three pivotal supplier test.
•Participant behavior was evaluated as mixed because while most offers appeared consistent with marginal costs (zero), 13 percent of offers reflected economic withholding.
•Market performance was evaluated as competitive because there were adequate offers at reasonable levels in every hour to satisfy the requirement and the clearing price reflected those offers.
•Market design was evaluated as mixed because while the market is functioning effectively to provide DASR, the three pivotal supplier test, and cost-based offer capping when the test is failed, should be added to the market to ensure that market power cannot be exercised at times of system stress.
OverviewRegulation MarketThe PJM Regulation Market continues to be operated as a single market.
Market Structure
•Supply. In January through June 2013, the supply of offered and eligible regulation in PJM was both stable and adequate. The ratio of offered and eligible regulation to regulation required averaged 3.99. This is a 22.4 percent increase over January through June 2012 when the ratio was 3.26.
•Demand. The on-peak regulation requirement is equal to 0.70 percent of the forecast peak load for the PJM RTO for the day and the off-peak requirement is equal to 0.70 percent of the forecast valley load for the PJM RTO for the day. The average hourly regulation demand in January through June, 2013, was 770 MW. This is a 173 MW decrease in the average hourly regulation demand of 943 MW in the same period of 2012.
•Market Concentration. In January through June 2013, the PJM Regulation Market had a weighted average Herfindahl-Hirschman Index (HHI) of 2134 which is classified as highly concentrated.3 In January through June 2013, 90 percent of hours had one or more pivotal suppliers which failed PJM’s three pivotal supplier test (53 percent of hours failed the three pivotal supplier test in January through June 2012).
Market Conduct
•Offers. Daily regulation offer prices are submitted for each unit by the unit owner. Owners are required to submit a cost offer along with cost parameters to verify the offer, and may optionally submit a price offer. Under the new market design, offers include both a capability offer and a performance offer. The performance offer is converted to $/MW by multiplying the MW offer by the ΔMW/MW value of the signal type of
3 See the 2012 State of the Market Report for PJM, Volume II, Section 2, “Energy Market,” at “Market Concentration” for a more complete discussion of concentration ratios and the Herfindahl-Hirschman Index (HHI). Consistent with common application, the market share and HHI calculations presented in the SOM are based on supply that is cleared in the market in every hour, not on measures of available capacity.

Section 9 Ancillary Services
2013 Quarterly State of the Market Report for PJM: January through June 225© 2013 Monitoring Analytics, LLC
the unit. Owners must also specify which signal type the unit will be following, RegA or RegD.4 As of June 30, 2013, there were 20 resources (eight generation and 12 demand response) offering performance regulation and following the RegD signal.
•Price and Cost. The weighted Regulation Market Clearing Price for the PJM Regulation Market for January through June 2013 was $31.80. This is an increase of $17.90, or 128.8 percent, from the weighted average price for regulation in January through June 2012. The cost of regulation from January through June 2013 was $36.47. This is an $18.12 (98.7 percent) increase from the same time period in 2012.
Synchronized Reserve MarketAlthough PJM has retained the two synchronized reserve markets it implemented on February 1, 2007, their definition has changed. The RFC Synchronized Reserve Zone has now merged with the former Southern Synchronized Reserve Zone into the RTO Reserve Zone. The former Mid-Atlantic Synchronized Reserve Zone has incorporated Dominion to become the Mid-Atlantic Dominion Reserve Zone. PJM further retains the right to define new zones or subzones “as needed for system reliability.”5
Market Structure
•Supply. In January through June, 2013, the supply of offered and eligible synchronized reserve was both stable and adequate. The contribution of DSR to the Synchronized Reserve Market remains significant. Demand side resources are relatively low cost, and their participation in this market lowers overall Synchronized Reserve prices.
•Demand. PJM made a minor change to the default hourly required synchronized reserve requirements on October 1, 2012. When the RFC Zone became the RTO Zone on October 1, 2012, the synchronized reserve requirement increased from 1,350 MW to 1,375 MW. Although the Mid-Atlantic Subzone became the Mid-Atlantic Dominion Subzone on October 1, 2012, the requirement remained at 1,300 MW. The integration
4 See the 2012 State of the Market Report for PJM, Volume II, Appendix F “Ancillary Services Markets.”5 See PJM. “Manual 11, Energy and Ancillary Services Market Operations,” Revision 60 (June 1, 2013), p. 74.
of East Kentucky Power Cooperative (EKPC) into PJM on June 1, 2013 had no impact on the Synchronized Reserve Market requirement because the largest contingencies remain in the Mid-Atlantic Dominion Subzone. The EKPC integration did, however, increase the availability of both Tier 1 and Tier 2 MW available throughout the RTO.
In early June 2013, PJM implemented a modification to the way the transfer interface defines the Mid-Atlantic Dominion Subzone within the RTO Zone. The change makes calculations of the unit DFAX values across the interface consistent with the way these values are calculated in the energy market. Additionally PJM changed the reserve interface from Bedington – Black Oak to AP South. The net effect of these changes was to increase the amount of Tier 1 available in the RTO and decrease the amount of Tier 2 required in the Mid-Atlantic Dominion Subzone.
•Market Concentration. For January through June 2013, the average weighted HHI for cleared synchronized reserve in the Mid-Atlantic Dominion Subzone was 4002 which is classified as highly concentrated. The average weighted cleared Synchronized Reserve Market HHI for the Mid-Atlantic Subzone in January through June, 2012, was 3010, which is classified as “highly concentrated.”6 In January through June, 2013, 37 percent of hours had a maximum market share greater than 40 percent, compared to 56 percent of hours in January through June, 2012.
In the Mid-Atlantic Dominion Subzone, in January through June, 2013, the MMU estimates that 6.1 percent of hours that cleared a synchronized reserve market would have had three or fewer pivotal suppliers. In January through June, 2012, the MMU estimates that 40 percent of hours would have had three or fewer pivotal suppliers. The MMU concludes from these TPS results that the Mid-Atlantic Dominion Subzone Synchronized Reserve Market in January through June 2013 was characterized by structural market power.
6 See Section 2, “Energy Market” at “Market Concentration” for a more complete discussion of concentration ratios and the Herfindahl-Hirschman Index (HHI).

2013 Quarterly State of the Market Report for PJM: January through June
226 Section 9 Ancillary Services © 2013 Monitoring Analytics, LLC
Market Conduct
•Offers. Daily cost based offer prices are submitted for each unit by the unit owner, and PJM adds opportunity cost calculated using the average of 5-minute LMPs, which together comprise the total offer for each unit to the Synchronized Reserve Market. The synchronized reserve offer made by the unit owner is subject to an offer cap of marginal cost plus $7.50 per MW, plus lost opportunity cost. All suppliers are paid the higher of the market clearing price or their offer plus their unit specific opportunity cost.
Market Performance
•Price. The weighted average price for Tier 2 synchronized reserve in the Mid-Atlantic Subzone was $6.38 per MW in January through June, 2013, an increase of $0.05 per MW over January through June, 2012. The total cost of synchronized reserves per MW in January through June 2013 was $12.89, a $4.73 increase from the $8.16 cost of synchronized reserve in January through June 2012. The market clearing price was 48 percent of the total synchronized reserve cost per MW in January through June, 2013, down from 77 percent in January through June, 2012.
•Adequacy. A synchronized reserve deficit occurs when the combination of Tier 1 and Tier 2 synchronized reserve is not adequate to meet the synchronized reserve requirement. Neither PJM Synchronized Reserve Market experienced a deficit in January through June period of 2013.
DASRThe purpose of the DASR Market is to satisfy supplemental (30-minute) reserve requirements with a market-based mechanism that allows generation resources to offer their reserve energy at a price and compensates cleared supply at a single market clearing price. The DASR 30-minute reserve requirements are determined for each reliability region.7 If the DASR Market does not result in procuring adequate scheduling reserves, PJM is required to schedule additional operating reserves.
7 See PJM. “Manual 13: Emergency Operations,” Revision 53, (June 1, 2013); pp 11-12.
Market Structure
•Concentration. The MMU calculates that in January through June, 2013, zero hours in the DASR market would have failed the three pivotal supplier test. The current structure of PJM’s DASR Market does not include the three pivotal supplier test. The MMU recommends that the three pivotal supplier test be incorporated in the DASR market.
•Demand. In 2013, the required DASR is 6.91 percent of peak load forecast, down from 7.03 percent in 2012.
Market Conduct
•Withholding. Economic withholding remains an issue in the DASR Market. The direct marginal cost of providing DASR is zero, but there is an opportunity cost associated with this direct marginal cost. As of June 30, 2013, thirteen percent of offers reflected economic withholding. PJM rules require all units with reserve capability that can be converted into energy within 30 minutes to offer into the DASR Market.8 Units that do not offer have their offers set to zero.
•DSR. Demand side resources are eligible to participate in the DASR Market, but no demand resource cleared the DASR Market in January through June, 2013.
Market Performance
•Price. The weighted DASR market clearing price in January through June, 2013 was $0.06 per MW. In January through June, 2012, the weighted price of DASR was $0.41 per MW.
Black Start ServiceBlack start service is necessary to help ensure the reliable restoration of the grid following a blackout. Black start service is the ability of a generating unit to start without an outside electrical supply, or is the demonstrated ability of
8 See PJM. “Manual 11, Energy and Ancillary Services Market Operations,” Revision 60 (June 1, 2013), p. 144.

Section 9 Ancillary Services
2013 Quarterly State of the Market Report for PJM: January through June 227© 2013 Monitoring Analytics, LLC
a generating unit to automatically remain operating at reduced levels when disconnected from the grid.9
In January through June 2013, black start credits were $58.5 million. Black start zonal credits in January through June 2013 ranged from $0.03 per MW in the ATSI zone (total credits: $70,284) to $11.42 per MW in the AEP zone (total credits: $48,178,521).
Ancillary services costs per MW of load: January through June 2002 - 2013Table 9-4 shows PJM ancillary services costs for January through June, 2002, through 2013, on a per MW of load basis. The Scheduling, System Control, and Dispatch category of costs is comprised of PJM Scheduling, PJM System Control and PJM Dispatch; Owner Scheduling, Owner System Control and Owner Dispatch; Other Supporting Facilities; Black Start Services; Direct Assignment Facilities; and ReliabilityFirst Corporation charges. Supplementary Operating Reserve includes Day-Ahead Operating Reserve; Balancing Operating Reserve; and Synchronous Condensing.
Table 9‑4 History of ancillary services costs per MW of Load10: January through June 2002 through 2013
Year RegulationScheduling, Dispatch,
and System Control ReactiveSynchronized
ReserveSupplementary
Operating Reserve Total2002 $0.37 $0.55 $0.23 $0.00 $0.59 $1.752003 $0.57 $0.61 $0.24 $0.14 $0.81 $2.372004 $0.53 $0.66 $0.26 $0.16 $0.93 $2.532005 $0.57 $0.51 $0.27 $0.11 $0.60 $2.052006 $0.48 $0.48 $0.29 $0.08 $0.32 $1.652007 $0.61 $0.46 $0.30 $0.09 $0.50 $1.952008 $0.73 $0.37 $0.30 $0.08 $0.66 $2.142009 $0.37 $0.43 $0.37 $0.04 $0.50 $1.712010 $0.37 $0.38 $0.36 $0.06 $0.75 $1.922011 $0.33 $0.38 $0.41 $0.11 $0.80 $2.032012 $0.20 $0.44 $0.47 $0.03 $0.65 $1.792013 $0.26 $0.41 $0.65 $0.03 $0.73 $2.09
9 OATT Schedule 1 § 1.3BB.10 Results in this table differ slightly from the results reported previously because accounting load is used in the denominator in this table.
ConclusionThe design of the Regulation Market changed significantly effective October 1, 2012. While the market design continues to include the incorrect definition of opportunity cost, overall the changes were positive. It is too early to reach a definitive conclusion about performance under the new market design because there is not yet enough information on performance. It is essential that the Regulation Market incorporate the consistent implementation of the marginal benefit factor in optimization, pricing and settlement. But the experience of the last quarter of 2012 and the first two quarters of 2013 is cause for optimism with respect the performance of the Regulation Market under the new market design.
The structure of each Synchronized Reserve Market has been evaluated and the MMU has concluded that these markets are not structurally competitive as they are characterized by high levels of supplier concentration and inelastic demand. (The term Synchronized Reserve Market refers only to Tier 2 synchronized reserve.) As a result, these markets are operated with market-clearing prices and with offers based on the marginal cost of producing the service plus a margin. As a result of these requirements, the conduct of market participants within these market structures has been consistent with competition, and the market performance results have been competitive. Compliance with calls to respond to actual spinning events has been an issue. Compliance with the synchronized reserve must-offer requirement has also been an issue.
The MMU concludes that the structure of the DASR Market was competitive in the first six months of 2013, although concerns remain about economic withholding and the absence of the three pivotal supplier test in this market.
The benefits of markets are realized under these approaches to ancillary service markets. Even in the presence of structurally noncompetitive markets, there can be transparent, market clearing prices based on competitive offers that account explicitly and accurately for opportunity cost. This is consistent with the market design goal of ensuring competitive outcomes that provide
2013 Quarterly State of the Market Report for PJM: January through June
228 Section 9 Ancillary Services © 2013 Monitoring Analytics, LLC
appropriate incentives without reliance on the exercise of market power and with explicit mechanisms to prevent the exercise of market power.
Overall, the MMU concludes that it is not yet possible to reach a definitive conclusion about the new Regulation Market design, but there is reason for optimism. The MMU concludes that the Synchronized Reserve Market results were competitive in the first six months of 2013. The MMU concludes that the DASR Market results were competitive in the first six months of 2013.
Regulation MarketThe PJM Regulation Market continues to be operated as a single market. Significant technical and structural changes were made to the Regulation Market in 2012. On May 7, 2012, PJM switched to an improved optimizer called the Ancillary Services Optimizer (ASO). On October 1, 2012, PJM made additional technical changes to the optimized solution and, to comply with FERC Order No. 755, implemented Performance Based Regulation.11 On November 16, 2012, FERC modified the PJM market design that was introduced on October 1, 2012.12
Regulation Market Changes for Performance Based RegulationRegulation is a key part of PJM’s effort to minimize ACE so as to keep the reportable metrics CPS1 and BAAL within acceptable limits. On October 20, 2011, FERC issued Order No. 755 directing PJM and other RTOs/ISOs to modify their regulation market rules to make use of and properly compensate a mix of fast and traditional response regulation resources.”13 Order No. 755 also sought to correct “certain practices of some RTOs and ISOs result in economically inefficient economic dispatch of frequency regulation resources.”14
11 For a description of the full history of the changes to the tariff provisions governing the Regulation Market, see the 2011 State of the Market Report for PJM, Volume II, Section 9, “Ancillary Service Markets.”
12 PJM Interconnection, L.L.C., 139 FERC ¶ 61,130 (2012)13 Order No. 755 at P 3. FERC ordered PJM “to compensate frequency regulation resources based on the actual service provided, including
a capacity payment that includes the marginal unit’s opportunity costs and a payment for performance that reflects the quantity of frequency regulation service provided by a resource when the resource is accurately following the dispatch signal.”
14 Id. at P 2.
A driver for the new market design was the assumption that new, fast response technologies could be used, in combination with traditional resources, to reduce the total amount of resources needed to meet regulation requirements and thereby reduce the cost of regulation. Order No. 755 required that the new and traditional resources be purchased in a single market, with compensation for both capacity (MW) and miles (total MW per minute measured in ΔMW/MW) provided.15 Prior to October 1, 2012, regulation consisted of energy that could be added or removed within five minutes following a traditional (RegA) signal. On October 1, 2012, the PJM introduced a single market that included two distinct types of frequency response: RegA (traditional and slower oscillation signal) and RegD (faster oscillation signal). Within this new market design, resources can choose to follow RegA or RegD.
In a market defined in terms of units of RegA equivalent regulation service, the marginal benefits factor of all units following the RegA signal is one, while the marginal benefits factor of units following the RegD signal depends on how much RegD following resources are used. Under PJM’s August 15, 2012, proposal, the benefits factor can be as high as 2.9 but never lower than zero. Effective regulation is a function of two components, the benefits factor, which itself is a function of the amount of RegD regulation already committed; and the historical performance of the unit as measured by the 100-hour average of performance scores. A unit’s regulation capability MW multiplied by its benefits factor, and modified by its performance score, results in that unit’s effective RegA signal following regulation MW.
FERC’s November 16, 2012 order only partially accepted the market design in PJM’s August 15, 2012, filing. FERC’s November 16, 2012, order fixed the marginal benefits factor for RegD resources at a value of 1.0 for purposes of payment. This has created a dichotomy in the PJM regulation market between the marginal value of RegD resources in the dispatch, and the resulting market price and payments to resources in the settlement process in PJM’s regulation market through the second quarter of 2013.
15 Id. at PP 99, 131 & 177
Section 9 Ancillary Services
2013 Quarterly State of the Market Report for PJM: January through June 229© 2013 Monitoring Analytics, LLC
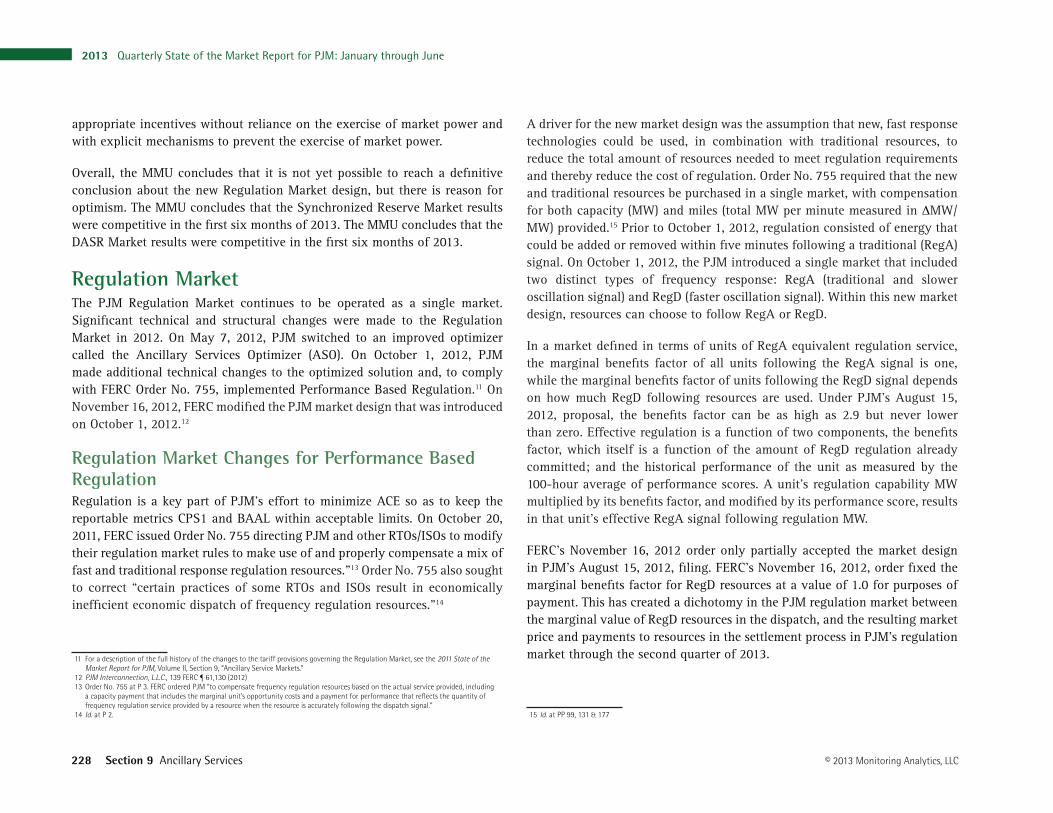
Performance tracking is an essential element of the performance based Regulation Market. Regulation performance scores (0.0 to 1.0) measure the response of a regulating unit to its chosen regulation signal (RegA or RegD) every ten seconds by measuring: delay – the time delay of the regulation response to a change in the regulation signal; correlation – the relationship between the regulating resource output and the regulation signal; and precision – the difference in energy provided from the difference in energy requested.16 An hourly performance score is calculated and multiplied by the MW cleared when calculating payment. Additionally, hourly scores are stored and used as part of a 100 hour rolling average historical performance score to obtain an effective capability MW and performance MW used in clearing. Figure 9-1 shows the average performance score by unit type and signal followed.
16 A full specification of each of the three criteria used in the performance score is presented in PJM “Manual 12: Balancing Operations” Rev. 27 (December 20, 2012); 4.5.6, p 52.
Figure 9‑1 Average performance score grouped by unit type and regulation signal type: January through June 2013
0%
10%
20%
30%
40%
50%
60%
70%
80%
90%
100%
Perce
ntage
of R
esou
rce (S
ignal)
Type
MW
Performance Score Range
RegA
Steam (RegA)
Hydro (RegA)
DSR (RegA)
CT (RegA)
RegD
0.50-0.59 0.60-0.69 0.70-0.79 0.80-0.89 0.90-0.99 1.00
Using a performance score to measure the accuracy of a regulating resource, a mileage ratio to compare the effective MW of differing types of resources, and effective MW as a means of translating the value of actual MW for high performance units are the reasons that the required regulation has been lowered from 1.0 percent to 0.7 percent of forecast peak load.
The performance based Regulation Market requires that unit owners provide two-part offers for their regulation resources, an offer for regulation capability in terms of $/MW and a regulation performance offer in terms of $/ΔMW. In addition, unit owners must enter the regulation signal type the unit will follow, RegA or RegD. Owners may enter price based offers subject to a combined offer cap of $100/MW.
2013 Quarterly State of the Market Report for PJM: January through June
230 Section 9 Ancillary Services © 2013 Monitoring Analytics, LLC
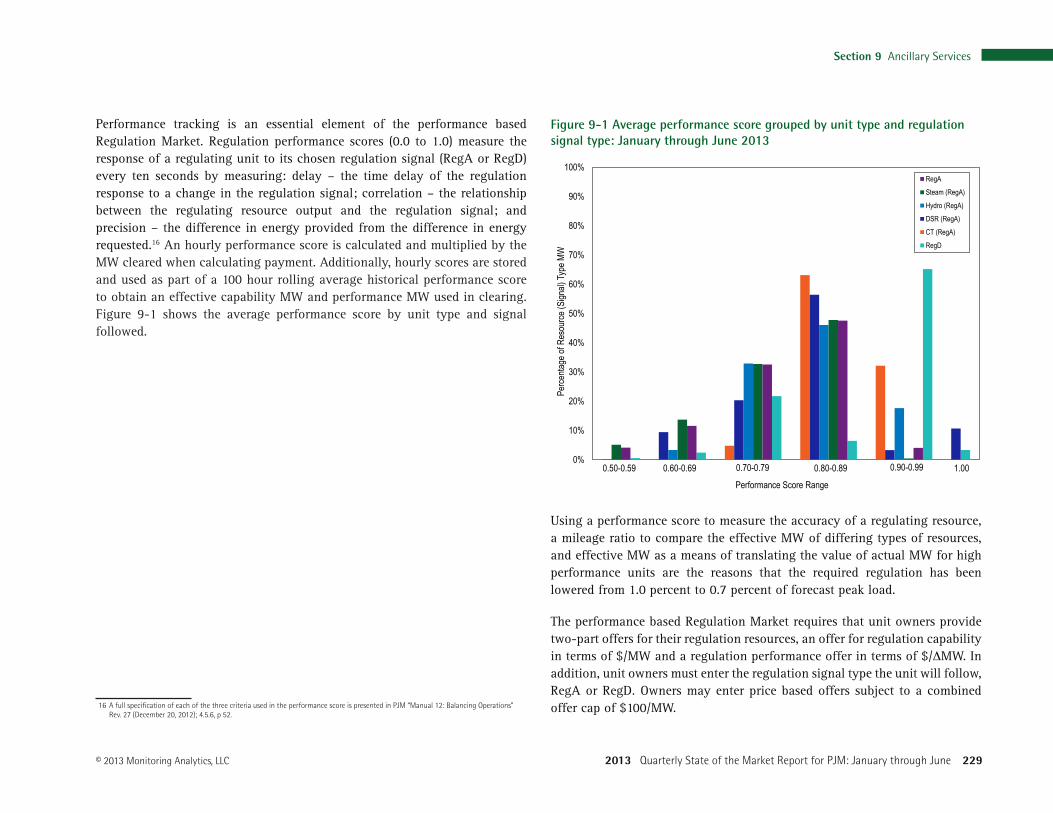
Market Structure
SupplyTable 9-5 shows capability, average daily offer and average hourly eligible MW for all hours. The hourly regulation capability decreased in January through June 2013, to 8,262 MW from 9,298 MW during the same time period of 2012.
Table 9‑5 PJM regulation capability, daily offer17 and hourly eligible: January through June 2012 and 201318
PeriodRegulation
Capability (MW)Average Daily
Offer (MW)Percent of
Capability OfferedAverage Hourly
Eligible (MW)Percent of
Capability Eligible2013 (Jan-Jun) 8,262 4,327 52% 1,752 21%2012 (Jan-Jun) 9,298 6,736 72% 3,009 32%
The supply of regulation can be affected by regulating units retiring from service. Table 9-6 shows what the impact on the Regulation Market would be if all units retire that are requesting retirement through the end of 2015.
Table 9‑6 Impact on PJM Regulation Market of currently regulating units scheduled to retire through 2015
Current Regulation Units, January
through June 2013Settled MW, January
through June 2013Units Scheduled To
Retire Through 2015
Settled MW of Units Scheduled To Retire
Through 2015
Percent Of Regulation MW To
Retire Through 2015281 3,326,236 32 33,926 1.02%
The cost of each unit is calculated in market clearing using its offer price, lost opportunity cost, capability MW, and the miles to MW ratio of the signal type they choose to follow, modified by resource benefit factor and historic performance score. As of October 1, 2012, a regulation resource’s total offer is equal to the sum of its total capability ($/MW) and performance offer ($/MW). As of October 1, 2012, the within hour five minute clearing price for regulation is determined by the total offer, including the actual within hour lost opportunity cost, of the most expensive cleared regulation resource 17 Average Daily Offer MW excludes units that have offers but are unavailable for the day.18 Total offer capability is defined as the sum of the maximum daily offer volume for each offering unit during the period, without regard
to the actual availability of the resource or to the day on which the maximum was offered.
in each interval. The total clearing price for the hour is the simple average of the twelve interval prices within the hour. The total clearing price of the hour (RMCP) is in two parts, the performance clearing price (RMPCP) and the capability clearing price (RMCCP). The performance clearing price ($/MW) is equal to the most expensive performance offer cleared for the hour. The capability clearing price ($/MW) is equal to the difference between the total clearing price for the hour and the performance clearing price for the hour.
Since the implementation of Regulation Performance on October 1, 2012, both regulation price and regulation cost per MW are higher than they were prior to October 1, 2012. Since the implementation of shortage pricing and changing the regulation requirement to 0.70 percent of peak load forecast (from one percent of peak load forecast prior to October 1) the price and cost of regulation have remained high. The weighted average regulation price for January through June, 2013 was $31.80. The regulation cost for January through June, 2013, was $36.47. The ratio of price to cost is significantly higher at 87 percent (compared with 76 percent in Q2 of 2012), meaning that more of the costs which used to come from LOC as a result of low load forecasts are now part of the price.
Starting October 1, a growing number of resources have followed the RegD signal. As of June 30, 2013, there were 20 resources (eight generation and 12 demand response) following the RegD signal, an increase of six resources (three generation and three demand response) from March 31, 2013. For January through June 2013, the weighted-average HHI of the set of RegD resources was 5864 (highly concentrated).
In the period from January 1, 2013 through June 30, 2013, the marginal benefits factor (contribution to ACE correction) for cleared RegD following resources has ranged from 1.743 to 2.899 with an average over all hours of 2.610.
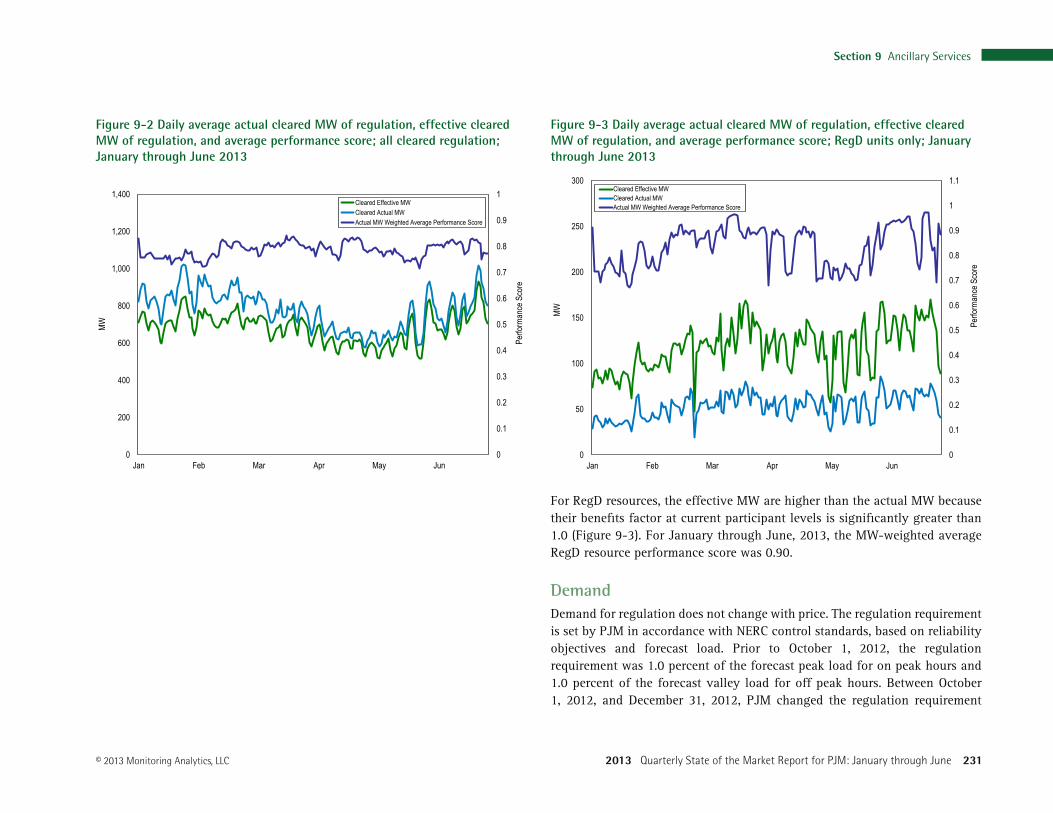
Although the benefits factor for traditional (RegA following) resources is 1.0, the effective MW of RegA following resources is lower than the offered MW because the performance score is less than 1 (Figure 9-2). For January through June, 2013, the MW-weighted average RegA performance score was 0.79.
Section 9 Ancillary Services
2013 Quarterly State of the Market Report for PJM: January through June 231© 2013 Monitoring Analytics, LLC
Figure 9‑2 Daily average actual cleared MW of regulation, effective cleared MW of regulation, and average performance score; all cleared regulation; January through June 2013
0
0.1
0.2
0.3
0.4
0.5
0.6
0.7
0.8
0.9
1
0
200
400
600
800
1,000
1,200
1,400
Jan Feb Mar Apr May Jun
Perfo
rman
ce S
core
MW
Cleared Effective MWCleared Actual MWActual MW Weighted Average Performance Score
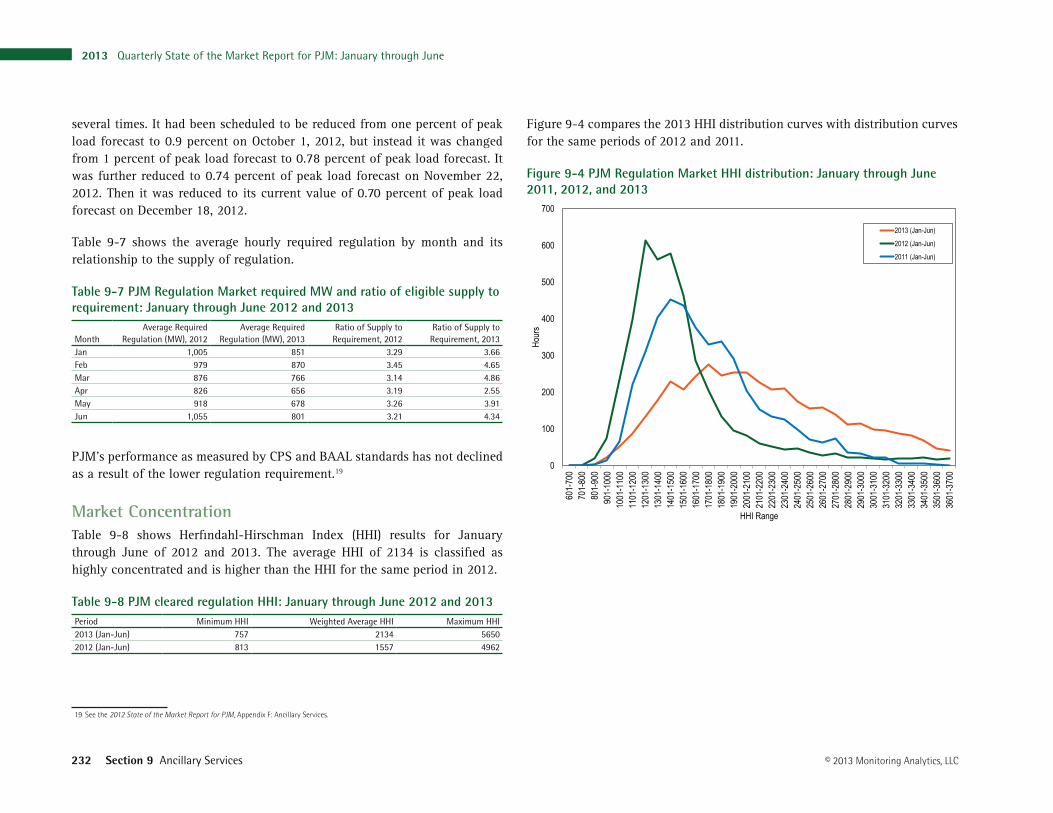
Figure 9‑3 Daily average actual cleared MW of regulation, effective cleared MW of regulation, and average performance score; RegD units only; January through June 2013
0
0.1
0.2
0.3
0.4
0.5
0.6
0.7
0.8
0.9
1
1.1
0
50
100
150
200
250
300
Jan Feb Mar Apr May Jun
Perfo
rman
ce S
core
MW
Cleared Effective MWCleared Actual MWActual MW Weighted Average Performance Score
For RegD resources, the effective MW are higher than the actual MW because their benefits factor at current participant levels is significantly greater than 1.0 (Figure 9-3). For January through June, 2013, the MW-weighted average RegD resource performance score was 0.90.
DemandDemand for regulation does not change with price. The regulation requirement is set by PJM in accordance with NERC control standards, based on reliability objectives and forecast load. Prior to October 1, 2012, the regulation requirement was 1.0 percent of the forecast peak load for on peak hours and 1.0 percent of the forecast valley load for off peak hours. Between October 1, 2012, and December 31, 2012, PJM changed the regulation requirement
2013 Quarterly State of the Market Report for PJM: January through June
232 Section 9 Ancillary Services © 2013 Monitoring Analytics, LLC
several times. It had been scheduled to be reduced from one percent of peak load forecast to 0.9 percent on October 1, 2012, but instead it was changed from 1 percent of peak load forecast to 0.78 percent of peak load forecast. It was further reduced to 0.74 percent of peak load forecast on November 22, 2012. Then it was reduced to its current value of 0.70 percent of peak load forecast on December 18, 2012.
Table 9-7 shows the average hourly required regulation by month and its relationship to the supply of regulation.
Table 9‑7 PJM Regulation Market required MW and ratio of eligible supply to requirement: January through June 2012 and 2013
MonthAverage Required
Regulation (MW), 2012Average Required
Regulation (MW), 2013Ratio of Supply to
Requirement, 2012Ratio of Supply to
Requirement, 2013Jan 1,005 851 3.29 3.66Feb 979 870 3.45 4.65Mar 876 766 3.14 4.86Apr 826 656 3.19 2.55May 918 678 3.26 3.91Jun 1,055 801 3.21 4.34
PJM’s performance as measured by CPS and BAAL standards has not declined as a result of the lower regulation requirement.19
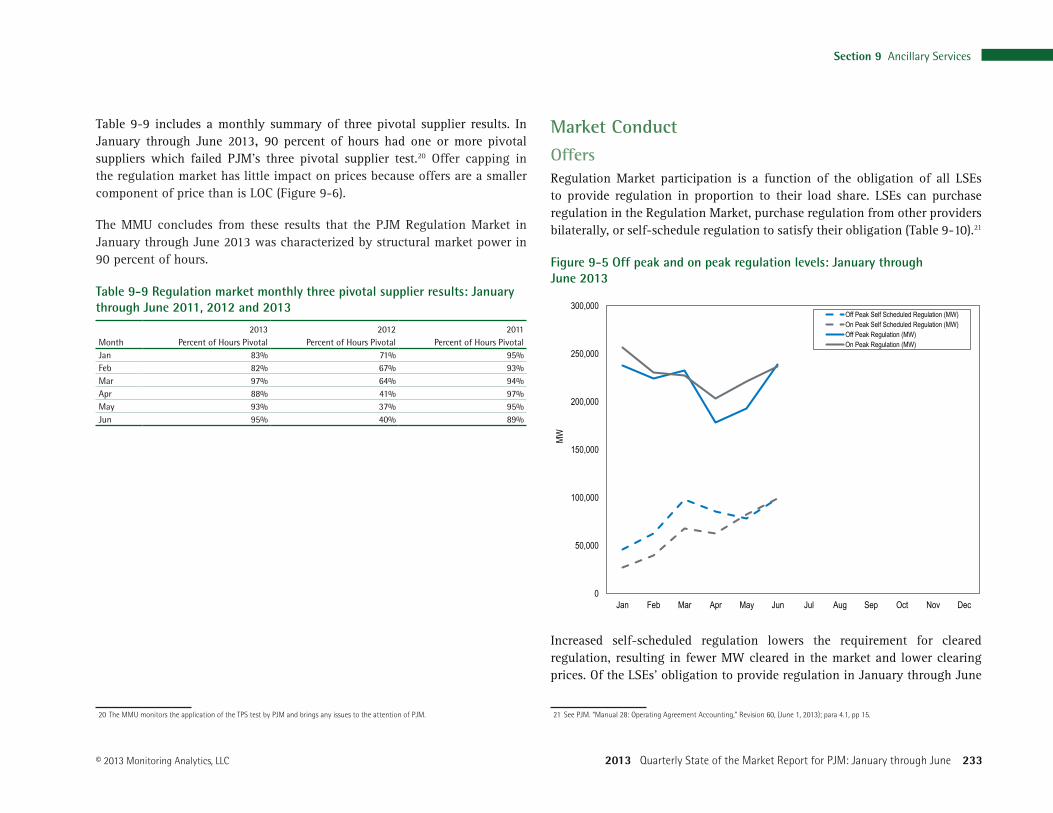
Market ConcentrationTable 9-8 shows Herfindahl-Hirschman Index (HHI) results for January through June of 2012 and 2013. The average HHI of 2134 is classified as highly concentrated and is higher than the HHI for the same period in 2012.
Table 9‑8 PJM cleared regulation HHI: January through June 2012 and 2013Period Minimum HHI Weighted Average HHI Maximum HHI2013 (Jan-Jun) 757 2134 56502012 (Jan-Jun) 813 1557 4962
19 See the 2012 State of the Market Report for PJM, Appendix F: Ancillary Services.
Figure 9-4 compares the 2013 HHI distribution curves with distribution curves for the same periods of 2012 and 2011.
Figure 9‑4 PJM Regulation Market HHI distribution: January through June 2011, 2012, and 2013
0
100
200
300
400
500
600
700
601
-700
701
-800
801
-900
901-
1000
1001
-110
011
01-1
200
1201
-130
013
01-1
400
1401
-150
015
01-1
600
1601
-170
017
01-1
800
1801
-190
019
01-2
000
2001
-210
021
01-2
200
2201
-230
023
01-2
400
2401
-250
025
01-2
600
2601
-270
027
01-2
800
2801
-290
029
01-3
000
3001
-310
031
01-3
200
3201
-330
033
01-3
400
3401
-350
035
01-3
600
3601
-370
0
Hour
s
HHI Range
2013 (Jan-Jun)
2012 (Jan-Jun)
2011 (Jan-Jun)
Section 9 Ancillary Services
2013 Quarterly State of the Market Report for PJM: January through June 233© 2013 Monitoring Analytics, LLC
Table 9-9 includes a monthly summary of three pivotal supplier results. In January through June 2013, 90 percent of hours had one or more pivotal suppliers which failed PJM’s three pivotal supplier test.20 Offer capping in the regulation market has little impact on prices because offers are a smaller component of price than is LOC (Figure 9-6).
The MMU concludes from these results that the PJM Regulation Market in January through June 2013 was characterized by structural market power in 90 percent of hours.
Table 9‑9 Regulation market monthly three pivotal supplier results: January through June 2011, 2012 and 2013
2013 2012 2011Month Percent of Hours Pivotal Percent of Hours Pivotal Percent of Hours PivotalJan 83% 71% 95%Feb 82% 67% 93%Mar 97% 64% 94%Apr 88% 41% 97%May 93% 37% 95%Jun 95% 40% 89%
20 The MMU monitors the application of the TPS test by PJM and brings any issues to the attention of PJM.
Market Conduct
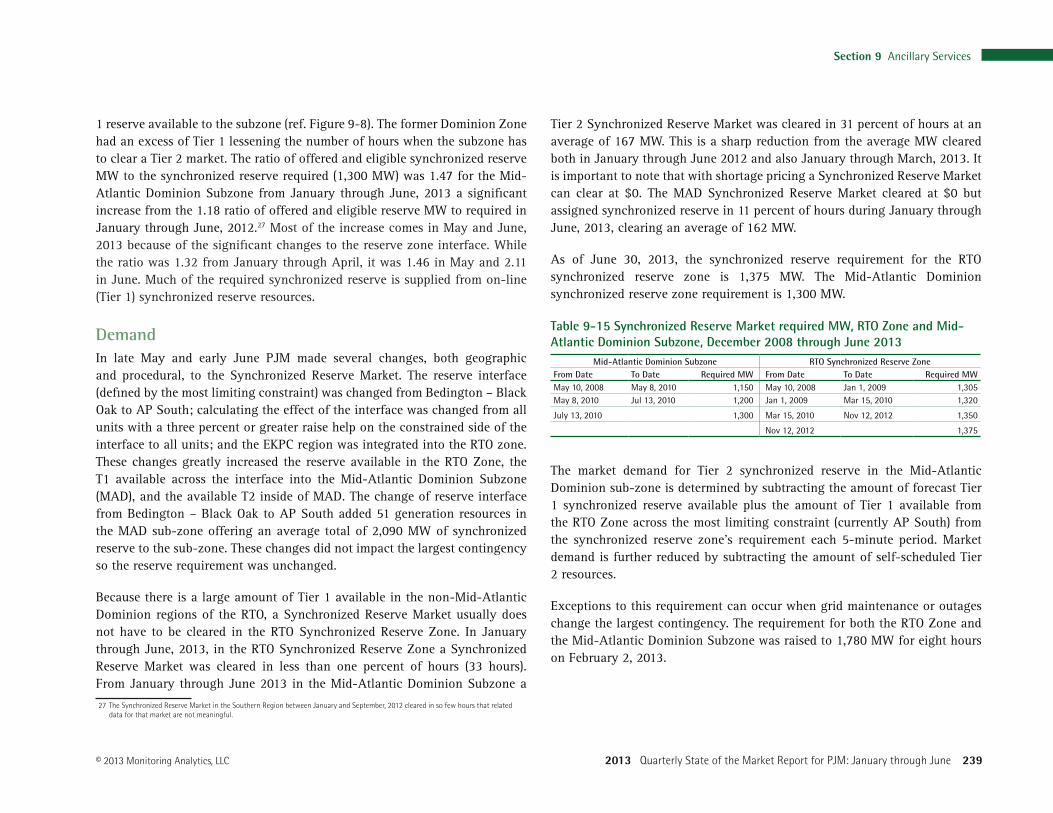
OffersRegulation Market participation is a function of the obligation of all LSEs to provide regulation in proportion to their load share. LSEs can purchase regulation in the Regulation Market, purchase regulation from other providers bilaterally, or self-schedule regulation to satisfy their obligation (Table 9-10).21
Figure 9‑5 Off peak and on peak regulation levels: January through June 2013
0
50,000
100,000
150,000
200,000
250,000
300,000
Jan Feb Mar Apr May Jun Jul Aug Sep Oct Nov Dec
MW
Off Peak Self Scheduled Regulation (MW)On Peak Self Scheduled Regulation (MW)Off Peak Regulation (MW)On Peak Regulation (MW)
Increased self-scheduled regulation lowers the requirement for cleared regulation, resulting in fewer MW cleared in the market and lower clearing prices. Of the LSEs’ obligation to provide regulation in January through June
21 See PJM. “Manual 28: Operating Agreement Accounting,” Revision 60, (June 1, 2013); para 4.1, pp 15.

2013 Quarterly State of the Market Report for PJM: January through June
234 Section 9 Ancillary Services © 2013 Monitoring Analytics, LLC
of 2013, 64.9 percent was purchased in the spot market, 31.7 percent was self-scheduled, and 3.4 percent was purchased bilaterally (Table 9-10).
Table 9‑10 Regulation sources: spot market, self‑scheduled, bilateral purchases: January through June 2012 and 2013
Year MonthSpot
Regulation (MW)Self‑Scheduled
Regulation (MW)Bilateral
Regulation (MW)Total
Regulation (MW)2013 Jan 413,304 72,880 8,070 494,2532013 Feb 338,990 102,005 12,808 453,8032013 Mar 275,880 165,987 17,554 459,4212013 Apr 219,793 147,858 13,860 381,5102013 May 235,849 161,270 16,934 414,0532013 Jun 254,215 198,617 22,816 475,6472012 Jan 553,686 164,806 21,261 739,7532012 Feb 481,004 175,757 20,456 677,2172012 Mar 477,564 144,408 19,683 641,6552012 Apr 426,564 124,750 21,083 572,3972012 May 542,585 97,574 17,849 658,0082012 Jun 582,078 140,769 22,309 745,156
Demand resources offered and cleared regulation for the first time in November 2011. In April 2012, a tariff change allowing demand resources to offer 0.1 MW facilitated participation by demand resources. Although their impact remains small, the participation of demand resources in regulation is growing.
Market Performance
PriceThe weighted average RMCP for January through June, 2013, was $31.80. This is a 128.8 percent increase from the January through June 2012 weighted average RMCP of $13.90. Figure 9-6 shows the daily average Regulation Market clearing price and the opportunity cost component for the marginal units in the PJM Regulation Market.
Figure 9‑6 PJM Regulation Market daily weighted average market‑clearing price, marginal unit opportunity cost and offer price (Dollars per MWh): January through June 2013
$0.00
$20.00
$40.00
$60.00
$80.00
$100.00
$120.00
$140.00
$160.00
$180.00
$200.00
Jan Feb Mar Apr May Jun Jul Aug Sep Oct Nov Dec
Weighted average Regulation Market clearing priceWeighted average opportunity costWeighted average offer price

Section 9 Ancillary Services
2013 Quarterly State of the Market Report for PJM: January through June 235© 2013 Monitoring Analytics, LLC
Table 9-11 shows monthly average regulation market clearing price, average marginal unit offer price, and average marginal unit LOC.
Table 9‑11 PJM Regulation Market monthly weighted average market‑clearing price, marginal unit opportunity cost and offer price (Dollars per MWh): January through June 2013
MonthWeighted Average Regulation
Market Clearing PriceWeighted Average Regulation
Marginal Unit OfferWeighted Average Regulation
Marginal Unit LOCJan $39.94 $7.72 $39.62Feb $29.51 $9.37 $23.01Mar $31.64 $5.02 $27.10Apr $26.49 $5.07 $14.48May $33.42 $4.32 $30.52Jun $29.81 $4.41 $20.18
Total scheduled regulation MW, total regulation charges, regulation price and regulation cost are shown in Table 9-12.
Table 9‑12 Total regulation charges: January through June 2013 and 2012
Year MonthScheduled
Regulation (MW)Total Regulation
Charges ($)
Weighted Average Regulation Market
Price ($/MW)
Cost of Regulation
($/MW)
Price as Percentage
of Cost2013 Jan 494,253 $22,870,690 $39.94 $46.27 86%2013 Feb 453,803 $15,273,604 $29.51 $33.66 88%2013 Mar 459,421 $16,678,410 $31.64 $36.30 87%2013 Apr 381,510 $11,930,098 $26.49 $31.27 85%2013 May 414,053 $15,599,491 $33.42 $37.68 89%2013 Jun 475,647 $15,999,677 $29.81 $33.64 89%2012 Jan 739,753 $13,338,201 $13.41 $18.03 74%2012 Feb 677,217 $10,108,296 $11.89 $14.93 80%2012 Mar 641,655 $11,109,763 $12.61 $17.31 73%2012 Apr 572,397 $9,038,430 $13.01 $15.79 82%2012 May 658,008 $16,248,950 $17.44 $24.69 71%2012 Jun 745,156 $14,181,461 $14.91 $19.03 78%
A breakdown of the cost of regulation into its capability, performance, and opportunity cost components is shown in Table 9-13.
Table 9‑13 Components of regulation cost: January through June 2013
MonthScheduled
Regulation (MW)Cost of Regulation Capability ($/MW)
Cost of Regulation Performance ($/MW)
Opportunity Cost ($/MW)
Total Cost ($/MW)
Jan 494,253 $33.74 $6.25 $6.28 $46.27 Feb 453,803 $25.50 $4.10 $4.06 $33.66 Mar 459,421 $28.31 $3.46 $4.53 $36.30 Apr 381,510 $23.21 $3.36 $4.69 $31.27 May 414,053 $30.44 $3.01 $4.22 $37.68 Jun 475,647 $26.80 $3.09 $3.74 $33.64
Table 9-14 provides a comparison of the average price and cost for PJM Regulation. The difference between the Regulation Market price and the actual cost of regulation was less in January through June 2013 than it was in January through June 2012. This is an improvement which resulted from the use of pricing based on real-time LMP instead of forecast LMP as had been done prior to shortage pricing in October 1, 2012.
Table 9‑14 Comparison of average price and cost for PJM Regulation, January through June 2007 through 2013
PeriodWeighted Regulation
Market PriceWeighted Regulation
Market CostRegulation Price as Percent Cost
2007 $36.86 $52.91 70%2008 $42.09 $64.43 65%2009 $23.56 $29.87 79%2010 $18.08 $32.07 56%2011 $15.53 $30.89 50%2012 $13.90 $18.35 76%2013 $31.80 $36.47 87%

2013 Quarterly State of the Market Report for PJM: January through June
236 Section 9 Ancillary Services © 2013 Monitoring Analytics, LLC
Primary ReserveReserves are provided by generating capability that is standing by ready for service if an unforeseen event causes a need for it. NERC defines reporting and response requirements for disturbance events in “NERC Performance Standard BAL-002-0, Disturbance Control Performance.” and PJM defines its corresponding obligations in Manual 12.22 NERC defines contingency reserves as energy available in 15 minutes. PJM calls this Primary Reserve and specifies it as energy available within 10 minutes. Units in a shutdown state may satisfy the primary reserve requirement if they can start within 10 minutes. PJM retains a separate synchronized reserve requirement.
22 See PJM. “Manual 12: Balancing Operations” Revision 27, Attachment D, “Disturbance Control Performance/Standard” (December 20, 2012), p. 84.
RequirementsPJM must satisfy the contingency reserve requirements specifications of the ReliabilityFirst Corporation and VACAR. For the RTO reserve zone the primary reserve requirement is 150 percent of the largest contingency in the PJM footprint, currently 2,063 MW. Of that 2,063 MW, PJM requires that at least 1,375 MW be on line and synchronized to the grid (Figure 9-7).
Figure 9‑7 PJM RTO geography and primary reserve requirement: January through June 2013

Section 9 Ancillary Services
2013 Quarterly State of the Market Report for PJM: January through June 237© 2013 Monitoring Analytics, LLC
Because of constrained deliverability within the RTO, PJM imposes a further restriction by creating a sub-zone within the RTO called the Mid-Atlantic Dominion Subzone. Of the 2,063 MW requirement for primary reserve in the RTO, 1,700 MW must be deliverable to the Mid-Atlantic Dominion Subzone. Of the 1,375 MW of synchronized reserve in the RTO, 1,300 MW must be deliverable to the Mid-Atlantic Dominion Subzone. The Mid-Atlantic Dominion Subzone is defined approximately by the geography in Figure 9-7. Between January 1, 2013 and May 31, 2013 the reserve interface had been defined by the set of all resources with a three percent or greater DFAX raise help on the constrained side of the Bedington - Black Oak constraint. From June 1, 2013 through June 30, 2013 PJM implemented several changes including changing the constraint interface from Bedington - Black Oak to AP South and calculating the impact of the constraint as the set of all resources with greater than zero percent DFAX raise help on the constrained side of the interface.23 The effect of these changes to the reserve interface has been to significantly increase the supply of Tier 1 synchronized reserve in the Mid-Atlantic Dominion Subzone thereby decreasing the amount of Tier 2 synchronized reserve required to purchase (Figure 9-8). On June 1, 2013, PJM integrated the East Kentucky Power Cooperative transmission system. Since this is on the unconstrained side of the AP South constraint it had the effect of increasing the amount of Tier 1 MW available without increasing the reserve requirement.
The primary reserves requirement is not satisfied by a single market but by several products across the RTO Zone and Mid-Atlantic Dominion Subzone. The two requirements of the Mid-Atlantic Dominion Reserve Zone, primary reserve (1,700 MW) and synchronized reserve (1,300 MW) are satisfied by a set of energy products optimized to minimize total cost (Figure 9-8). The components of the Mid-Atlantic Dominion Primary Reserve Zone are Tier 1 synchronized reserve which is priced at $0 unless there is a shortage event or a spinning event, Tier 2 synchronized reserve which is satisfied by the Synchronized Reserve Market and priced economically, Demand Response (DR) which is priced at the Synchronized Reserve Market clearing price, non-
23 The specific constrained interface may be revised by PJM to meet system reliability needs. Additional subzones may be defined by PJM to meet system reliability needs. PJM will notify stakeholders in such an event. See PJM, “Manual 11, Energy and Ancillary Services Market Operations,” Revision 60 (June 1, 2013), p. 78.
synchronized reserve (limited to no more than 50 percent of the primary reserve requirement) which is priced only when it must be dispatched at an optimized clearing price by the ASO, and synchronized reserve available in the Mid-Atlantic Dominion Reserve Zone from the RTO Reserve Zone across the most limiting constraint.
Figure 9‑8 Components of Mid‑Atlantic Dominion Subzone Primary Reserve (Daily Averages): January through June, 2013
0
500
1,000
1,500
2,000
2,500
3,000
Jan Feb Mar Apr May JunMW
Mid-Atlantic Dominion Synchronized Reserve Requirement (MW)
Mid-Atlantic Dominion Primary Reserve Requirement (MW)
Tier 1 Synchronized Reserve (MW)
Synchronized Reserve Available from RTO Zone (MW)
Demand Side Response (MW)
Synchronized Reserve (MW)
Non-Synchronized Reserve (MW)
Figure 9-8 shows that Tier 1 Synchronized Reserve remains the major contributor to satisfying the reserve requirements. Synchronized reserve available inside the subzone from the RTO Zone is also a major contributor. Both of these components have a price of $0.00 unless a Tier 2 Synchronized Reserve or Non-Synchronized Reserve market is cleared in the RTO Zone. Non-synchronized reserve clears a separate market less frequently because (like DASR) it is available without redispatch from CTs and some hydro units. Tier 2 synchronized reserve is dispatched at a market clearing price.

2013 Quarterly State of the Market Report for PJM: January through June
238 Section 9 Ancillary Services © 2013 Monitoring Analytics, LLC
In 111 hours between January 1 and June 30, 2013 the Non-Synchronized Reserve Market for the Mid-Atlantic Dominion Subzone cleared at greater than $0.00 averaging $12.61. Non-synchronized reserve only clears when synchronized reserve also clears.
Shortage PricingOn October 1, 2012 PJM introduced shortage pricing which made major changes to the structure and operation of the PJM reserve markets. PJM now has two markets to satisfy the primary reserve requirement; the Synchronized Reserve Market (Tier 2), and the new Non-Synchronized Reserve Market. The Synchronized Reserve Market dispatches Tier 2 synchronized reserve plus demand response to satisfy the synchronized reserve requirement minus the Tier 1 MW available. Both Tier 1 and Tier 2 consist of units on-line synchronized to the grid. Units offering synchronized reserve which clear the Synchronized Reserve Market are Tier 2 units. The primary reserve requirement is then satisfied by Tier 1 plus Tier 2 plus Non-Synchronized reserve.
If IT SCED and RT SCED forecast a primary reserve or synchronized reserve shortage, then PJM will implement shortage pricing through the inclusion of primary reserve or synchronized reserve penalty factors. 24
With shortage pricing, PJM began specifying that all on-line, non-emergency, generation capacity resources must offer synchronized reserve in accordance with the resources’ capability to provide these reserves. As of the end of June, 2013, a significant number of participants with generation resources have not complied with this requirement for a wide variety of reasons.
If PJM issues a Primary Reserve Warning, Voltage Reduction Warning, or Manual Load Dump Warning, all off line non-emergency generation capacity resources available to provide energy must submit an offer for Tier 2 synchronized reserve.25 This rule ensures that IT-SCED and RT-SCED will be able to make accurate estimates of the amount of Primary Reserve available.
24 See the 2012 State of the Market Report for PJM, Volume II, “Ancillary Service Markets” for more details on the impact of shortage pricing on the Reserve Markets.
25 See PJM. “Manual 11: Energy and Ancillary Services Market Operations” Revision 60, (June 1, 2013), p. 72.
From January through June, 2013 no reserve zone or sub-zone experienced a reserve shortage.
Synchronized Reserve MarketPrior to October 1, 2012, PJM operated two synchronized reserve markets because of differing synchronized reserve requirements specified by two different reliability regional authorities, ReliabilityFirst Corporation and VACAR. Those two synchronized reserve zones (Southern and RFC) are now merged into one zone, the RTO Synchronized Reserve Zone, with its requirements structured to satisfy both regional specifications.26
Market Structure
SupplyFor the first six months of 2013, the supply of offered and eligible synchronized reserve was stable and adequate in both the RTO Zone and the Mid-Atlantic Dominion Subzone. The contribution of demand resources to the Synchronized Reserve Market remains significant. Demand side resources (DR) are relatively low cost, and their participation lowers overall Synchronized Reserve prices. PJM has limited the amount of DR to 25 percent of the synchronized reserve requirement since it was introduced into the market in August 2006. On December 6, 2012, PJM increased this amount to 33 percent of the synchronized reserve requirement.
Total MW of cleared synchronized reserve increased in January through June of 2013 over 2012 (from 451,695 MW to 533,175 MW). The DSR share of the total Synchronized Reserve Market increased from 22 percent in January through June of 2012 to 43.6 percent in the same time period of 2013. Demand side resources satisfied 100 percent of the Tier 2 Synchronized Reserve market in 14 percent of cleared hours in January through June of 2013 compared to 8 percent of hours in during the same time period of 2012. The merging of the former Mid-Atlantic subzone with Dominion into the new Mid-Atlantic Dominion subzone, plus the changes made in June, 2013 has made more Tier
26 See the 2012 State of the Market Report for PJM, Volume II, “Ancillary Service Markets” for more details on the impact of shortage pricing on the Synchronized Reserve Markets.
Section 9 Ancillary Services
2013 Quarterly State of the Market Report for PJM: January through June 239© 2013 Monitoring Analytics, LLC
1 reserve available to the subzone (ref. Figure 9-8). The former Dominion Zone had an excess of Tier 1 lessening the number of hours when the subzone has to clear a Tier 2 market. The ratio of offered and eligible synchronized reserve MW to the synchronized reserve required (1,300 MW) was 1.47 for the Mid-Atlantic Dominion Subzone from January through June, 2013 a significant increase from the 1.18 ratio of offered and eligible reserve MW to required in January through June, 2012.27 Most of the increase comes in May and June, 2013 because of the significant changes to the reserve zone interface. While the ratio was 1.32 from January through April, it was 1.46 in May and 2.11 in June. Much of the required synchronized reserve is supplied from on-line (Tier 1) synchronized reserve resources.
DemandIn late May and early June PJM made several changes, both geographic and procedural, to the Synchronized Reserve Market. The reserve interface (defined by the most limiting constraint) was changed from Bedington – Black Oak to AP South; calculating the effect of the interface was changed from all units with a three percent or greater raise help on the constrained side of the interface to all units; and the EKPC region was integrated into the RTO zone. These changes greatly increased the reserve available in the RTO Zone, the T1 available across the interface into the Mid-Atlantic Dominion Subzone (MAD), and the available T2 inside of MAD. The change of reserve interface from Bedington – Black Oak to AP South added 51 generation resources in the MAD sub-zone offering an average total of 2,090 MW of synchronized reserve to the sub-zone. These changes did not impact the largest contingency so the reserve requirement was unchanged.
Because there is a large amount of Tier 1 available in the non-Mid-Atlantic Dominion regions of the RTO, a Synchronized Reserve Market usually does not have to be cleared in the RTO Synchronized Reserve Zone. In January through June, 2013, in the RTO Synchronized Reserve Zone a Synchronized Reserve Market was cleared in less than one percent of hours (33 hours). From January through June 2013 in the Mid-Atlantic Dominion Subzone a
27 The Synchronized Reserve Market in the Southern Region between January and September, 2012 cleared in so few hours that related data for that market are not meaningful.
Tier 2 Synchronized Reserve Market was cleared in 31 percent of hours at an average of 167 MW. This is a sharp reduction from the average MW cleared both in January through June 2012 and also January through March, 2013. It is important to note that with shortage pricing a Synchronized Reserve Market can clear at $0. The MAD Synchronized Reserve Market cleared at $0 but assigned synchronized reserve in 11 percent of hours during January through June, 2013, clearing an average of 162 MW.
As of June 30, 2013, the synchronized reserve requirement for the RTO synchronized reserve zone is 1,375 MW. The Mid-Atlantic Dominion synchronized reserve zone requirement is 1,300 MW.
Table 9‑15 Synchronized Reserve Market required MW, RTO Zone and Mid‑Atlantic Dominion Subzone, December 2008 through June 2013
Mid‑Atlantic Dominion Subzone RTO Synchronized Reserve ZoneFrom Date To Date Required MW From Date To Date Required MWMay 10, 2008 May 8, 2010 1,150 May 10, 2008 Jan 1, 2009 1,305May 8, 2010 Jul 13, 2010 1,200 Jan 1, 2009 Mar 15, 2010 1,320
July 13, 2010 1,300 Mar 15, 2010 Nov 12, 2012 1,350
Nov 12, 2012 1,375
The market demand for Tier 2 synchronized reserve in the Mid-Atlantic Dominion sub-zone is determined by subtracting the amount of forecast Tier 1 synchronized reserve available plus the amount of Tier 1 available from the RTO Zone across the most limiting constraint (currently AP South) from the synchronized reserve zone’s requirement each 5-minute period. Market demand is further reduced by subtracting the amount of self-scheduled Tier 2 resources.
Exceptions to this requirement can occur when grid maintenance or outages change the largest contingency. The requirement for both the RTO Zone and the Mid-Atlantic Dominion Subzone was raised to 1,780 MW for eight hours on February 2, 2013.
2013 Quarterly State of the Market Report for PJM: January through June
240 Section 9 Ancillary Services © 2013 Monitoring Analytics, LLC
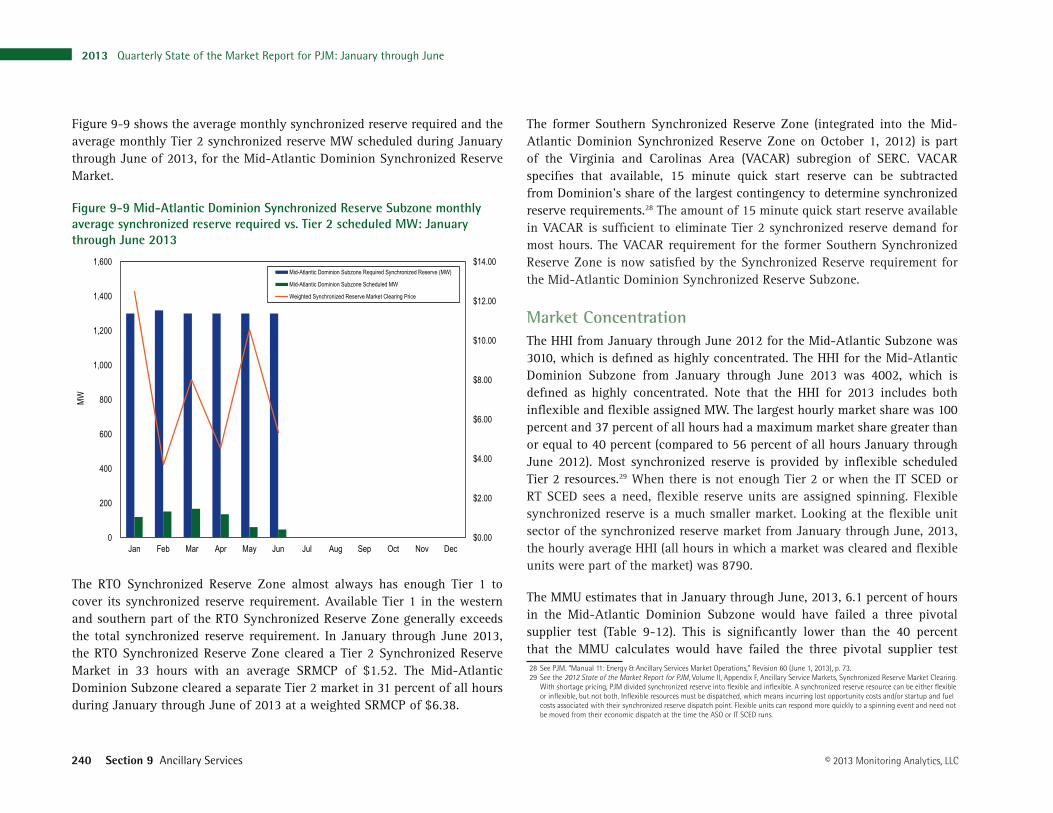
Figure 9-9 shows the average monthly synchronized reserve required and the average monthly Tier 2 synchronized reserve MW scheduled during January through June of 2013, for the Mid-Atlantic Dominion Synchronized Reserve Market.
Figure 9‑9 Mid‑Atlantic Dominion Synchronized Reserve Subzone monthly average synchronized reserve required vs. Tier 2 scheduled MW: January through June 2013
$0.00
$2.00
$4.00
$6.00
$8.00
$10.00
$12.00
$14.00
0
200
400
600
800
1,000
1,200
1,400
1,600
Jan Feb Mar Apr May Jun Jul Aug Sep Oct Nov Dec
MW
Mid-Atlantic Dominion Subzone Required Synchronized Reserve (MW)
Mid-Atlantic Dominion Subzone Scheduled MW
Weighted Synchronized Reserve Market Clearing Price
The RTO Synchronized Reserve Zone almost always has enough Tier 1 to cover its synchronized reserve requirement. Available Tier 1 in the western and southern part of the RTO Synchronized Reserve Zone generally exceeds the total synchronized reserve requirement. In January through June 2013, the RTO Synchronized Reserve Zone cleared a Tier 2 Synchronized Reserve Market in 33 hours with an average SRMCP of $1.52. The Mid-Atlantic Dominion Subzone cleared a separate Tier 2 market in 31 percent of all hours during January through June of 2013 at a weighted SRMCP of $6.38.
The former Southern Synchronized Reserve Zone (integrated into the Mid-Atlantic Dominion Synchronized Reserve Zone on October 1, 2012) is part of the Virginia and Carolinas Area (VACAR) subregion of SERC. VACAR specifies that available, 15 minute quick start reserve can be subtracted from Dominion’s share of the largest contingency to determine synchronized reserve requirements.28 The amount of 15 minute quick start reserve available in VACAR is sufficient to eliminate Tier 2 synchronized reserve demand for most hours. The VACAR requirement for the former Southern Synchronized Reserve Zone is now satisfied by the Synchronized Reserve requirement for the Mid-Atlantic Dominion Synchronized Reserve Subzone.
Market ConcentrationThe HHI from January through June 2012 for the Mid-Atlantic Subzone was 3010, which is defined as highly concentrated. The HHI for the Mid-Atlantic Dominion Subzone from January through June 2013 was 4002, which is defined as highly concentrated. Note that the HHI for 2013 includes both inflexible and flexible assigned MW. The largest hourly market share was 100 percent and 37 percent of all hours had a maximum market share greater than or equal to 40 percent (compared to 56 percent of all hours January through June 2012). Most synchronized reserve is provided by inflexible scheduled Tier 2 resources.29 When there is not enough Tier 2 or when the IT SCED or RT SCED sees a need, flexible reserve units are assigned spinning. Flexible synchronized reserve is a much smaller market. Looking at the flexible unit sector of the synchronized reserve market from January through June, 2013, the hourly average HHI (all hours in which a market was cleared and flexible units were part of the market) was 8790.
The MMU estimates that in January through June, 2013, 6.1 percent of hours in the Mid-Atlantic Dominion Subzone would have failed a three pivotal supplier test (Table 9-12). This is significantly lower than the 40 percent that the MMU calculates would have failed the three pivotal supplier test 28 See PJM. “Manual 11: Energy & Ancillary Services Market Operations,” Revision 60 (June 1, 2013), p. 73.29 See the 2012 State of the Market Report for PJM, Volume II, Appendix F, Ancillary Service Markets, Synchronized Reserve Market Clearing.
With shortage pricing, PJM divided synchronized reserve into flexible and inflexible. A synchronized reserve resource can be either flexible or inflexible, but not both. Inflexible resources must be dispatched, which means incurring lost opportunity costs and/or startup and fuel costs associated with their synchronized reserve dispatch point. Flexible units can respond more quickly to a spinning event and need not be moved from their economic dispatch at the time the ASO or IT SCED runs.
Section 9 Ancillary Services
2013 Quarterly State of the Market Report for PJM: January through June 241© 2013 Monitoring Analytics, LLC
in January through June, 2012. The reason for the decline is the increasing significance of demand response in the supply of synchronized reserve. Demand response MW were 43.6 percent of the settled synchronized reserve Tier 2 MW in January through June, 2013. These results indicate that the Mid-Atlantic Dominion Sub-zone, the only synchronized reserve market that clears on a regular basis, is not structurally competitive.
Table 9‑16 Mid‑Atlantic Dominion Subzone30 Synchronized Reserve Market monthly three pivotal supplier results: 2010, 2011, 2012, and 2013
Month2013 Percent
of Hours Pivotal2012 Percent
of Hours Pivotal2011 Percent
of Hours Pivotal2010 Percent
of Hours PivotalJan 1% 45% 92% 64%Feb 11% 40% 99% 49%Mar 7% 38% 74% 65%Apr 8% 33% 83% 31%May 10% 15% 46% 45%Jun 0% 29% 14% 10%
Jul 10% 19% 23%
Aug 3% 25% 18%
Sep 4% 56% 17%
Oct 9% 73% 54%
Nov 17% 84% 83%
Dec 25% 88% 40%
Market Conduct
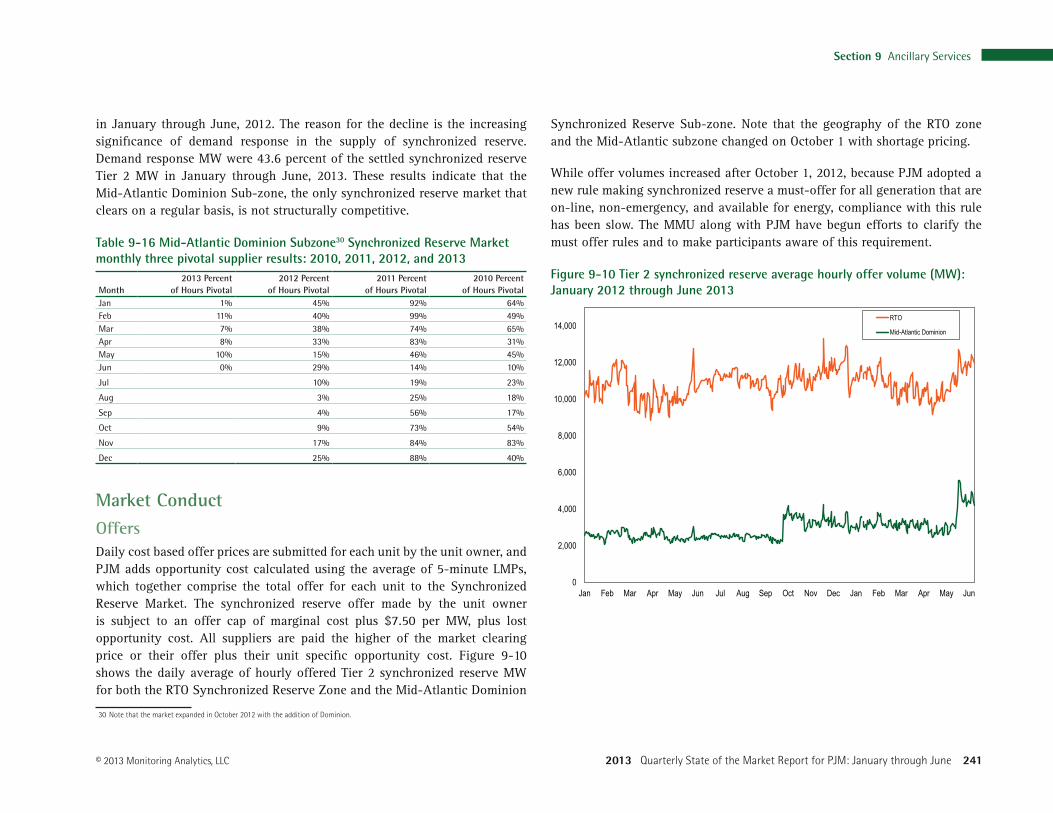
OffersDaily cost based offer prices are submitted for each unit by the unit owner, and PJM adds opportunity cost calculated using the average of 5-minute LMPs, which together comprise the total offer for each unit to the Synchronized Reserve Market. The synchronized reserve offer made by the unit owner is subject to an offer cap of marginal cost plus $7.50 per MW, plus lost opportunity cost. All suppliers are paid the higher of the market clearing price or their offer plus their unit specific opportunity cost. Figure 9-10 shows the daily average of hourly offered Tier 2 synchronized reserve MW for both the RTO Synchronized Reserve Zone and the Mid-Atlantic Dominion
30 Note that the market expanded in October 2012 with the addition of Dominion.
Synchronized Reserve Sub-zone. Note that the geography of the RTO zone and the Mid-Atlantic subzone changed on October 1 with shortage pricing.
While offer volumes increased after October 1, 2012, because PJM adopted a new rule making synchronized reserve a must-offer for all generation that are on-line, non-emergency, and available for energy, compliance with this rule has been slow. The MMU along with PJM have begun efforts to clarify the must offer rules and to make participants aware of this requirement.
Figure 9‑10 Tier 2 synchronized reserve average hourly offer volume (MW): January 2012 through June 2013
0
2,000
4,000
6,000
8,000
10,000
12,000
14,000
Jan Feb Mar Apr May Jun Jul Aug Sep Oct Nov Dec Jan Feb Mar Apr May Jun
RTO
Mid-Atlantic Dominion
2013 Quarterly State of the Market Report for PJM: January through June
242 Section 9 Ancillary Services © 2013 Monitoring Analytics, LLC
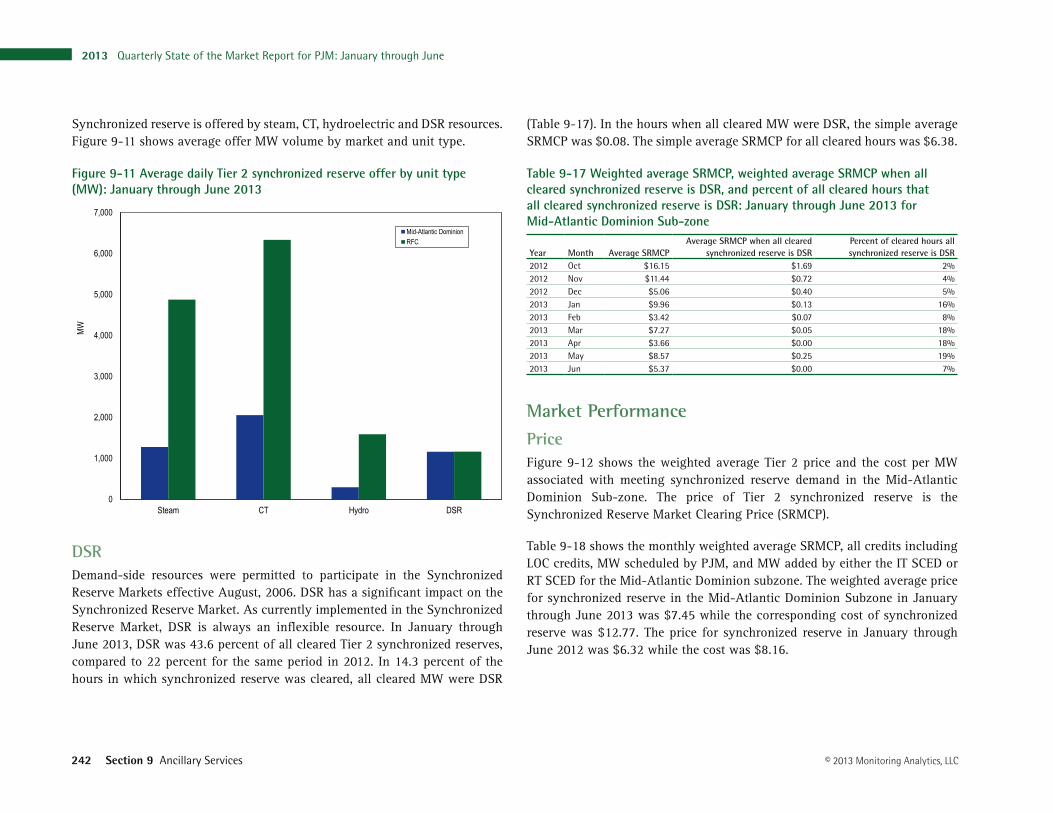
Synchronized reserve is offered by steam, CT, hydroelectric and DSR resources. Figure 9-11 shows average offer MW volume by market and unit type.
Figure 9‑11 Average daily Tier 2 synchronized reserve offer by unit type (MW): January through June 2013
0
1,000
2,000
3,000
4,000
5,000
6,000
7,000
Steam CT Hydro DSR
MW
Mid-Atlantic DominionRFC
DSRDemand-side resources were permitted to participate in the Synchronized Reserve Markets effective August, 2006. DSR has a significant impact on the Synchronized Reserve Market. As currently implemented in the Synchronized Reserve Market, DSR is always an inflexible resource. In January through June 2013, DSR was 43.6 percent of all cleared Tier 2 synchronized reserves, compared to 22 percent for the same period in 2012. In 14.3 percent of the hours in which synchronized reserve was cleared, all cleared MW were DSR
(Table 9-17). In the hours when all cleared MW were DSR, the simple average SRMCP was $0.08. The simple average SRMCP for all cleared hours was $6.38.
Table 9‑17 Weighted average SRMCP, weighted average SRMCP when all cleared synchronized reserve is DSR, and percent of all cleared hours that all cleared synchronized reserve is DSR: January through June 2013 for Mid‑Atlantic Dominion Sub‑zone
Year Month Average SRMCPAverage SRMCP when all cleared
synchronized reserve is DSRPercent of cleared hours all synchronized reserve is DSR
2012 Oct $16.15 $1.69 2%2012 Nov $11.44 $0.72 4%2012 Dec $5.06 $0.40 5%2013 Jan $9.96 $0.13 16%2013 Feb $3.42 $0.07 8%2013 Mar $7.27 $0.05 18%2013 Apr $3.66 $0.00 18%2013 May $8.57 $0.25 19%2013 Jun $5.37 $0.00 7%
Market Performance
PriceFigure 9-12 shows the weighted average Tier 2 price and the cost per MW associated with meeting synchronized reserve demand in the Mid-Atlantic Dominion Sub-zone. The price of Tier 2 synchronized reserve is the Synchronized Reserve Market Clearing Price (SRMCP).
Table 9-18 shows the monthly weighted average SRMCP, all credits including LOC credits, MW scheduled by PJM, and MW added by either the IT SCED or RT SCED for the Mid-Atlantic Dominion subzone. The weighted average price for synchronized reserve in the Mid-Atlantic Dominion Subzone in January through June 2013 was $7.45 while the corresponding cost of synchronized reserve was $12.77. The price for synchronized reserve in January through June 2012 was $6.32 while the cost was $8.16.

Section 9 Ancillary Services
2013 Quarterly State of the Market Report for PJM: January through June 243© 2013 Monitoring Analytics, LLC
Table 9‑18 Mid‑Atlantic Dominion Sub‑zone weighted synchronized reserve market clearing prices, credits, and MWs: January through June 2013
Year Month
Weighted Synchronized
Reserve Market Clearing Price
Synchronized Reserve Credits
PJM Tier 2 and DSR Scheduled
Synchronized Reserve MW
Flexible Synchronized
Reserve Added by SCED (MW)
Self Scheduled MW
2013 Jan $9.96 $1,217,854 66,632 15,270 1022013 Feb $3.42 $1,203,289 86,561 41,251 5982013 Mar $7.27 $2,275,995 124,913 14,727 02013 Apr $3.66 $938,914 103,892 3,362 1652013 May $8.57 $766,400 45,746 5,815 1402013 Jun $5.37 $331,984 22,018 2,988 0
The RTO Reserve Zone synchronized reserve requirement was satisfied by Tier 1 in all but 33 hours of January through June 2013. In the MAD sub-zone the Synchronized Reserve and Primary Reserve Requirements were satisfied by a combination of Tier 1 and non-synchronized reserve in 69 percent of hours from January through June 2013. In the 31 percent of hours when synchronized reserve was needed to fill the synchronized reserve and/or primary reserve requirement the maximum clearing price was $207.42 and the weighted average clearing price was $7.17.
Price and CostA price to cost ratio close to 1.0 is an indicator of an efficient market design. In the Mid-Atlantic Subzone of the RFC Synchronized Reserve Market for January through June 2013, the price of Tier 2 synchronized reserves was 56 percent of the cost. In January through June 2012, the price to cost ratio was 79 percent.
Figure 9‑12 Comparison of Mid‑Atlantic Dominion Subzone Tier 2 synchronized reserve weighted average price and cost (Dollars per MW): January through June 2013
0%
10%
20%
30%
40%
50%
60%
70%
80%
$0.00
$2.00
$4.00
$6.00
$8.00
$10.00
$12.00
$14.00
$16.00
$18.00
$20.00
Jan Feb Mar Apr May Jun Jul Aug Sep Oct Nov Dec
Weighted Synchronized Reserve Market Clearing Price
Synchronized Reserve Cost
SR Price to Cost Ratio

2013 Quarterly State of the Market Report for PJM: January through June
244 Section 9 Ancillary Services © 2013 Monitoring Analytics, LLC
Table 9-19 shows the price and cost history of the Synchronized Reserve Market since 2005.
Table 9‑19 Comparison of yearly weighted average price and cost for PJM Synchronized Reserve, January through June 2005 through 2013
YearWeighted Synchronized
Reserve Market PriceWeighted Synchronized
Reserve CostSynchronized Reserve Price
as Percent of Cost2005 (Jan-Jun) $11.77 $15.52 76%2006 (Jan-Jun) $12.10 $18.25 66%2007 (Jan-Jun) $20.08 $22.89 88%2008 (Jan-Jun) $11.86 $17.46 68%2009 (Jan-Jun) $5.89 $10.15 58%2010 (Jan-Jun) $8.92 $12.13 74%2011 (Jan-Jun) $12.18 $15.72 77%2012 (Jan-Jun) $6.32 $8.16 77%2013 (Jan-Jun) $7.45 $12.77 58%
Before shortage pricing the reason for relatively low actual price to cost ratio was the difference in opportunity cost calculated using the forecast LMP and the actual LMP. In addition, the low price to cost ratio was in part a result of out of market purchases of Tier 2 synchronized reserve when PJM dispatchers needed the reserves for reliability reasons (Table 9-18). The problem of lower forecast LMPs than real-time LMPs was solved by the use of real-time pricing. But PJM Dispatch continues to add MW to the solved requirement.
Beginning with Shortage Pricing on October 1, 2012, PJM expanded its use of Tier 1 biasing (a technical term). Each market clearing engine (ASO, IT SCED, and RT SCED) can have its Tier 1 estimate manually biased. Negative Tier 1 biasing refers to the manual subtraction from the Tier 1 estimate that the market clearing engines uses to determine how much Tier 2 MW to schedule. A negative bias reduces the amount of Tier 1 estimated to be available and therefore increases the amount of inflexible Tier 2 which must be purchased. A negative bias means purchasing more inflexible Tier 2 MW than the market clearing software estimates it needs before the hour. The increased inflexible Tier 2 resources need to be compensated for their LOC and they must be paid even if they are not needed in real-time. This leads to Tier 2 synchronized reserves being assigned and paid when they are not needed or when the price
is zero. A price of $0 means that the Tier 2 synchronized reserve requirement was determined to be zero because there was enough Tier 1. From January through June, 2013, a total of 76,086 MW of Tier 2 synchronized reserve was purchased for hours when the price was later calculated to be $0. The charges (to compensate for lost opportunity costs) for this synchronized reserve were $407,193.
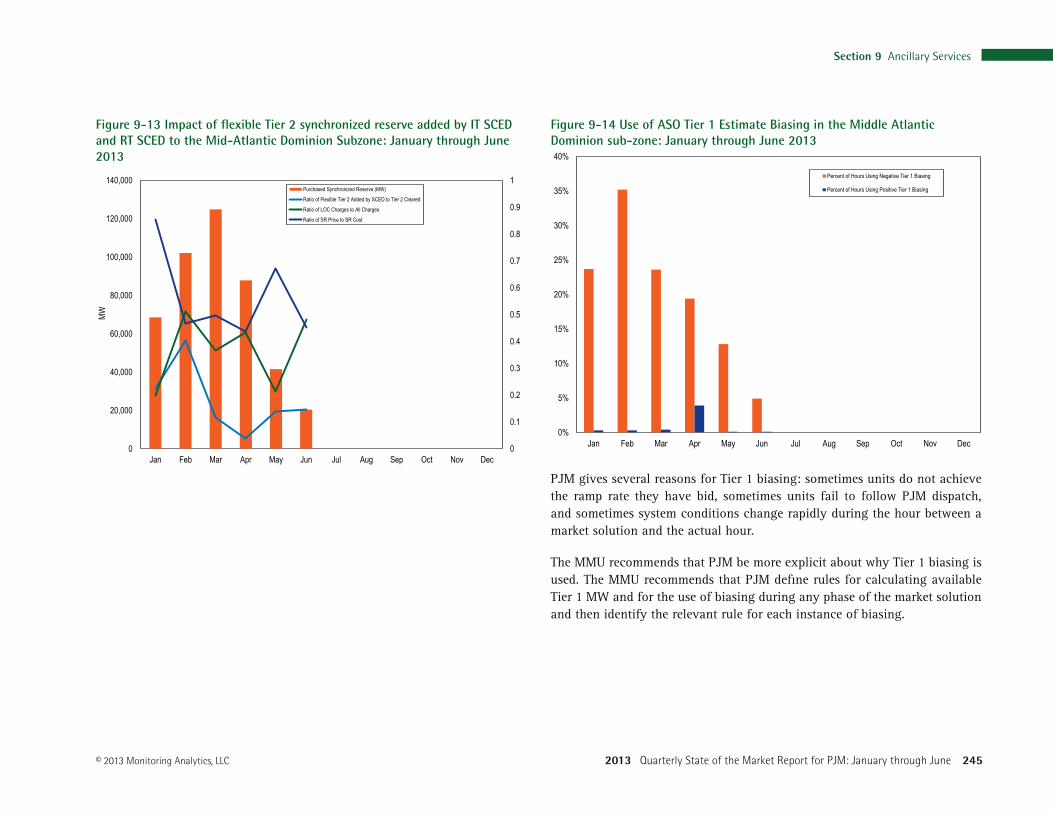
Between January and June, 2013 PJM has moderated its use of Tier 1 bias. Figure 9-14 shows by month the percentage of all hours ASO had its Tier 1 estimate biased. IT SCED biasing did not occur in Q2, 2013. RT SCED Tier 1 biasing occurred in April for a total of 47 hours, averaging 337 MW. In every hour which RT SCED Tier 1 biasing was used, it was used to add Tier 1 to the estimate, thereby lessening the need to schedule additional Tier 2 synchronized reserve.
Section 9 Ancillary Services
2013 Quarterly State of the Market Report for PJM: January through June 245© 2013 Monitoring Analytics, LLC
Figure 9‑13 Impact of flexible Tier 2 synchronized reserve added by IT SCED and RT SCED to the Mid‑Atlantic Dominion Subzone: January through June 2013
0
0.1
0.2
0.3
0.4
0.5
0.6
0.7
0.8
0.9
1
0
20,000
40,000
60,000
80,000
100,000
120,000
140,000
Jan Feb Mar Apr May Jun Jul Aug Sep Oct Nov Dec
MW
Purchased Synchronized Reserve (MW)
Ratio of Flexible Tier 2 Added by SCED to Tier 2 Cleared
Ratio of LOC Charges to All Charges
Ratio of SR Price to SR Cost
Figure 9‑14 Use of ASO Tier 1 Estimate Biasing in the Middle Atlantic Dominion sub‑zone: January through June 2013
0%
5%
10%
15%
20%
25%
30%
35%
40%
Jan Feb Mar Apr May Jun Jul Aug Sep Oct Nov Dec
Percent of Hours Using Negative Tier 1 Biasing
Percent of Hours Using Positive Tier 1 Biasing
PJM gives several reasons for Tier 1 biasing: sometimes units do not achieve the ramp rate they have bid, sometimes units fail to follow PJM dispatch, and sometimes system conditions change rapidly during the hour between a market solution and the actual hour.
The MMU recommends that PJM be more explicit about why Tier 1 biasing is used. The MMU recommends that PJM define rules for calculating available Tier 1 MW and for the use of biasing during any phase of the market solution and then identify the relevant rule for each instance of biasing.
2013 Quarterly State of the Market Report for PJM: January through June
246 Section 9 Ancillary Services © 2013 Monitoring Analytics, LLC
ComplianceNon-compliance in the Synchronized Reserve Market remains a problem. Non-compliance has two major components: failure to deliver cleared Tier 2 Synchronized Reserve MW during spinning events; and failure of non-emergency, generation resources capable of providing energy to provide a daily synchronized reserve offer.
The MMU has expressed increasing concern over noncompliance by Tier 2 synchronized reserve resources during spinning events since 2011.31 When synchronized reserve resources clear the Synchronized Reserve Market they are obligated to provide their full cleared Tier 2 MW in a spinning event. The MMU has observed a wide range of spinning event response levels, presented its data to PJM and urged PJM to take action to increase compliance rates. For spinning events in January through June, 2013, longer than 10 minutes, approximately half of the generation providers offering more than half of the cleared synchronized reserve complied at a rate of less than 70 percent of their committed synchronized reserve MW. For demand response providers the compliance rate was worse with approximately half of the providers and 75 percent of the committed synchronized reserve MW complying at less than a 70 percent rate. In April, 2013, PJM through its Operating Committee began to address this problem. Several possible remedies are proposed and under consideration. The must-offer requirement for synchronized reserve changes the market, the nature of offers, and the penalty for non-compliance.
The Shortage Pricing changes introduced on October 1, 2012, included a must offer requirement for most generators under normal conditions, and an expanded set of generators under well-defined abnormal conditions related to peak load. For all hours, all on-line, non-emergency, generating resources that are providing energy and are capable of providing synchronized reserve are deemed available for Tier 1 and Tier 2 synchronized reserve and they must have an offer and be available for reserve. When PJM issues a Primary Reserve Warning, Voltage Reduction Warning, or Manual Load Dump Warning, all other non-emergency, generation capacity resources must have an offer and be available for reserve. PJM members were reminded of this rule change at 31 See the 2011 State of the Market Report for PJM, Volume II, Section 9, “Ancillary Services” at pg. 250.
the June 5, 2013 Operating Committee meeting and PJM directed the MMU to enforce it. As of June 30, 2013, a significant number of generators are non-compliant.
FERC Order 719 imposes a synchronized reserve must-offer requirement. The MMU recommends that PJM remove the distinction between Tier 1 and Tier 2 synchronized reserve, remove the ability of participants to offer MW of synchronized reserve capability, remove the ability of participants to make reserve unavailable, and automatically dispatch primary reserve co-optimized with energy. In the interim, PJM should enforce a must-offer requirement for synchronized reserve based on physical capability (with physical capability the default offer) and increase penalties for non-compliance during spinning events.
History of Spinning EventsSpinning events (Table 9-20) are usually caused by a sudden generation outage or transmission disruption requiring PJM to load synchronized reserve.32 The reserve remains loaded until system balance is recovered. From January 2010 through June 2013, PJM experienced 104 spinning events, or between two and three events per month. Spinning events had an average length of 12.7 minutes.
32 See PJM. “Manual 12, Balancing Operations,” Revision 27 (December 20, 2012), pp. 36-37.

Section 9 Ancillary Services
2013 Quarterly State of the Market Report for PJM: January through June 247© 2013 Monitoring Analytics, LLC
Table 9‑20 Spinning Events, January 2010 through June 2013
Effective Time RegionDuration (Minutes) Effective Time Region
Duration (Minutes) Effective Time Region
Duration (Minutes) Effective Time Region
Duration (Minutes)
FEB-18-2010 13:27 Mid-Atlantic 19 JAN-11-2011 15:10 Mid-Atlantic 6 JAN-03-2012 16:51 RFC 9 JAN-22-2013 08:34 RTO 8MAR-18-2010 11:02 RFC 27 FEB-02-2011 01:21 RFC 5 JAN-06-2012 23:25 RFC 8 JAN-25-2013 15:01 RTO 19MAR-23-2010 20:14 RFC 13 FEB-08-2011 22:41 Mid-Atlantic 11 JAN-23-2012 15:02 Mid-Atlantic 8 FEB-09-2013 22:55 RTO 10APR-11-2010 13:12 RFC 9 FEB-09-2011 11:40 Mid-Atlantic 16 MAR-02-2012 19:54 RFC 9 FEB-17-2013 23:10 RTO 13APR-28-2010 15:09 Mid-Atlantic 8 FEB-13-2011 15:35 Mid-Atlantic 14 MAR-08-2012 17:04 RFC 6 APR-17-2013 01:11 RTO 11MAY-11-2010 19:57 Mid-Atlantic 9 FEB-24-2011 11:35 Mid-Atlantic 14 MAR-19-2012 10:14 RFC 10 APR-17-2013 20:01 RTO 9
MAY-15-2010 03:03 RFC 6 FEB-25-2011 14:12 RFC 10 APR-16-2012 00:20 Mid-Atlantic 9
MAY-28-2010 04:06 Mid-Atlantic 5 MAR-30-2011 19:13 RFC 12 APR-16-2012 11:18 RFC 8
JUN-15-2010 00:46 RFC 34 APR-02-2011 13:13 Mid-Atlantic 11 APR-19-2012 11:54 RFC 16
JUN-19-2010 23:49 Mid-Atlantic 9 APR-11-2011 00:28 RFC 6 APR-20-2012 11:08 Mid-Atlantic 7
JUN-24-2010 00:56 RFC 15 APR-16-2011 22:51 RFC 9 JUN-20-2012 13:35 RFC 7
JUN-27-2010 19:33 Mid-Atlantic 15 APR-21-2011 20:02 Mid-Atlantic 6 JUN-26-2012 17:51 RFC 7
JUL-07-2010 15:20 RFC 8 APR-27-2011 01:22 RFC 8 JUL-23-2012 21:45 RFC 18
JUL-16-2010 20:45 Mid-Atlantic 19 MAY-02-2011 00:05 Mid-Atlantic 21 AUG-03-2012 12:44 RFC 10
AUG-11-2010 19:09 RFC 17 MAY-12-2011 19:39 RFC 9 SEP-08-2012 04:34 RFC 12
AUG-13-2010 23:19 RFC 6 MAY-26-2011 17:17 Mid-Atlantic 20 SEP-27-2012 17:19 Mid-Atlantic 7
AUG-16-2010 07:08 RFC 17 MAY-27-2011 12:51 RFC 6 OCT-17-2012 10:48 RTO 10
AUG-16-2010 19:39 Mid-Atlantic 11 MAY-29-2011 09:04 RFC 7 OCT-23-2012 22:29 RTO 19
SEP-15-2010 11:20 RFC 13 MAY-31-2011 16:36 RFC 27 OCT-30-2012 05:12 RTO 14
SEP-22-2010 15:28 Mid-Atlantic 24 JUN-03-2011 14:23 RFC 7 NOV-25-2012 16:32 RTO 12
OCT-05-2010 17:20 RFC 10 JUN-06-2011 22:02 Mid-Atlantic 9 DEC-16-2012 07:01 RTO 9
OCT-16-2010 03:22 Mid-Atlantic 10 JUN-23-2011 23:26 RFC 8 DEC-21-2012 05:51 RTO 7
OCT-16-2010 03:25 RFCNonMA 7 JUN-26-2011 22:03 Mid-Atlantic 10 DEC-21-2012 10:29 RTO 5
OCT-27-2010 10:35 RFC 7 JUL-10-2011 11:20 RFC 10
OCT-27-2010 12:50 Mid-Atlantic 10 JUL-28-2011 18:49 RFC 12
NOV-26-2010 14:24 RFC 13 AUG-02-2011 01:08 RFC 6
NOV-27-2010 11:34 RFC 8 AUG-18-2011 06:45 Mid-Atlantic 6
DEC-08-2010 01:19 RFC 11 AUG-19-2011 14:49 RFC 5
DEC-09-2010 20:07 RFC 5 AUG-23-2011 17:52 RFC 7
DEC-14-2010 12:02 Mid-Atlantic 24 SEP-24-2011 15:48 RFC 8
DEC-16-2010 18:40 Mid-Atlantic 20 SEP-27-2011 14:20 RFC 7
DEC-17-2010 22:09 Mid-Atlantic 6 SEP-27-2011 16:47 RFC 9
DEC-29-2010 19:01 Mid-Atlantic 15 OCT-30-2011 22:39 Mid-Atlantic 10
DEC-15-2011 14:35 Mid-Atlantic 8
DEC-21-2011 14:26 RFC 18

2013 Quarterly State of the Market Report for PJM: January through June
248 Section 9 Ancillary Services © 2013 Monitoring Analytics, LLC
Figure 9‑15 Spinning events duration distribution curve, January through June 2010 to 2013
0
2
4
6
8
10
12
14
5 - 9 10 - 14 15 - 19 20 - 24 25 - 29
Numb
er of
Eve
nts
Spinning Event Duration Range (Minutes)
2010 (Jan-Jun)2011 (Jan-Jun)2012 (Jan-Jun)2013 (Jan-Jun)
AdequacyA synchronized reserve deficit occurs when the combination of Tier 1 and Tier 2 synchronized reserve is not adequate to meet the synchronized reserve requirement. No primary reserve shortages occurred between January 1, 2013 and June 30, 2013.
Non-Synchronized Reserve MarketThe primary reserve requirement is 150 percent of the largest contingency. For the RTO Reserve Zone this is 2,063 MW. For the Mid-Atlantic Dominion Reserve Zone this is 1,700 MW. The primary reserve requirement can be filled with Tier 1 synchronized reserve, Tier 2 synchronized reserve, or non-synchronized reserve subject to the requirement that there be 1,300 MW of synchronized
reserve in the Mid-Atlantic Dominion Reserve Zone. The Ancillary Services Optimizer determines the most economic combination of these products to fill the balance of the primary reserve requirement. As such there is no pre-defined hourly requirement for non-synchronized reserve.
Non-synchronized reserve is reserve MW available within ten minutes but not synchronized to the grid. PJM specifies that 1,300 MW of synchronized reserve must be available in the Mid-Atlantic Dominion Reserve Zone. The remainder can be made up of non-synchronized reserve. Examples of equipment that generally qualify in this category are shutdown run-of-river, pumped hydro, industrial combustion turbines, jet engine/expander turbines, combined cycle and diesels.33
As for Tier 1 synchronized reserve, PJM calculates the amount of non-synchronized reserve available each hour and every five minutes within the hour. The calculation is based upon a unit’s startup and notification time, energy ramp rate, and economic minimum. There is no non-synchronized reserve offer price. Prices are determined by the lost opportunity cost created by any deviation from economic merit order required to maintain the non-synchronized reserve commitment. In most hours the non-synchronized reserve clearing price is zero.
Figure 9-16 shows the daily average non-synchronized reserve market clearing price and average scheduled MW. The Mid-Atlantic Dominion Reserve Zone non-synchronized reserve market cleared in 148 hours from January through June, 2013. The clearing price was greater than zero in 111 hours from January through June of 2013 with a maximum of $128.70 on January 22, 2013. The non-synchronized reserve market clearing price for the RTO Reserve Zone cleared in eight hours with a maximum clearing price of $6.50.
33 See PJM. “Manual 11, Energy & Ancillary Services Market Operations” Revision 60 (June 1, 2013), p. 85.
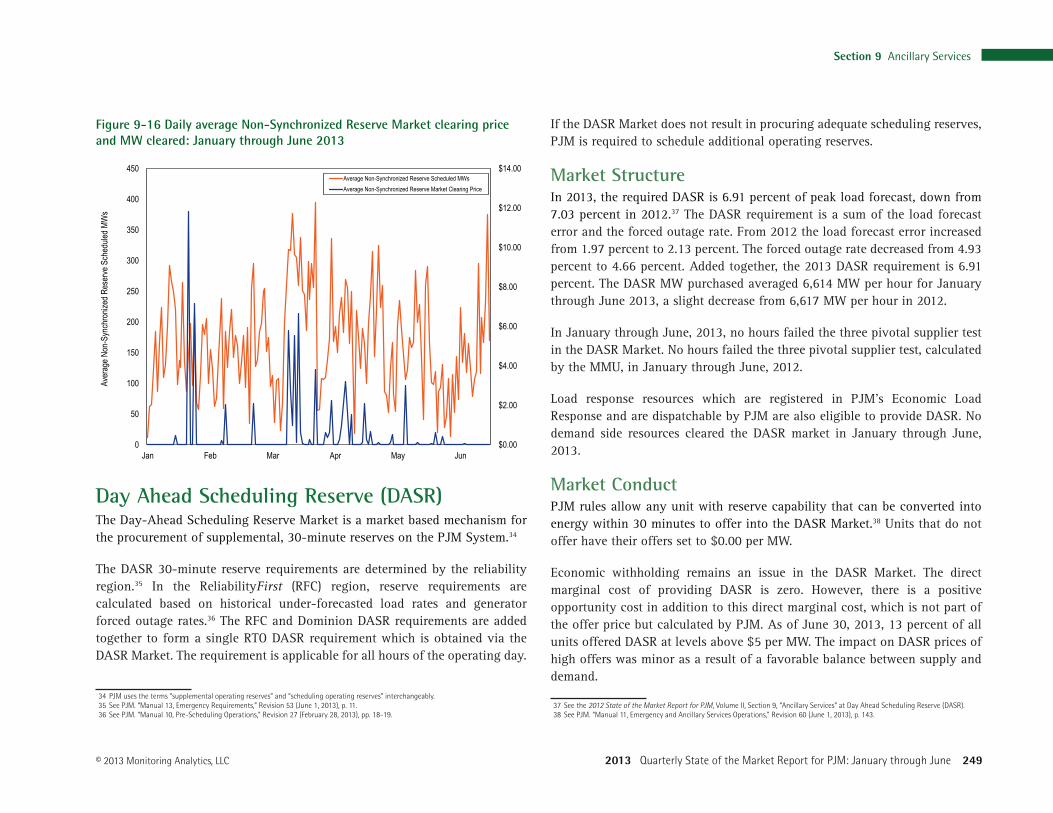
Section 9 Ancillary Services
2013 Quarterly State of the Market Report for PJM: January through June 249© 2013 Monitoring Analytics, LLC
Figure 9‑16 Daily average Non‑Synchronized Reserve Market clearing price and MW cleared: January through June 2013
$0.00
$2.00
$4.00
$6.00
$8.00
$10.00
$12.00
$14.00
0
50
100
150
200
250
300
350
400
450
Jan Feb Mar Apr May Jun
Aver
age N
on-S
ynch
roniz
ed R
eser
ve S
ched
uled M
Ws
Average Non-Synchronized Reserve Scheduled MWsAverage Non-Synchronized Reserve Market Clearing Price
Day Ahead Scheduling Reserve (DASR)The Day-Ahead Scheduling Reserve Market is a market based mechanism for the procurement of supplemental, 30-minute reserves on the PJM System.34
The DASR 30-minute reserve requirements are determined by the reliability region.35 In the ReliabilityFirst (RFC) region, reserve requirements are calculated based on historical under-forecasted load rates and generator forced outage rates.36 The RFC and Dominion DASR requirements are added together to form a single RTO DASR requirement which is obtained via the DASR Market. The requirement is applicable for all hours of the operating day.
34 PJM uses the terms “supplemental operating reserves” and “scheduling operating reserves” interchangeably.35 See PJM. “Manual 13, Emergency Requirements,” Revision 53 (June 1, 2013), p. 11.36 See PJM. “Manual 10, Pre-Scheduling Operations,” Revision 27 (February 28, 2013), pp. 18-19.
If the DASR Market does not result in procuring adequate scheduling reserves, PJM is required to schedule additional operating reserves.
Market StructureIn 2013, the required DASR is 6.91 percent of peak load forecast, down from 7.03 percent in 2012.37 The DASR requirement is a sum of the load forecast error and the forced outage rate. From 2012 the load forecast error increased from 1.97 percent to 2.13 percent. The forced outage rate decreased from 4.93 percent to 4.66 percent. Added together, the 2013 DASR requirement is 6.91 percent. The DASR MW purchased averaged 6,614 MW per hour for January through June 2013, a slight decrease from 6,617 MW per hour in 2012.
In January through June, 2013, no hours failed the three pivotal supplier test in the DASR Market. No hours failed the three pivotal supplier test, calculated by the MMU, in January through June, 2012.
Load response resources which are registered in PJM’s Economic Load Response and are dispatchable by PJM are also eligible to provide DASR. No demand side resources cleared the DASR market in January through June, 2013.
Market ConductPJM rules allow any unit with reserve capability that can be converted into energy within 30 minutes to offer into the DASR Market.38 Units that do not offer have their offers set to $0.00 per MW.
Economic withholding remains an issue in the DASR Market. The direct marginal cost of providing DASR is zero. However, there is a positive opportunity cost in addition to this direct marginal cost, which is not part of the offer price but calculated by PJM. As of June 30, 2013, 13 percent of all units offered DASR at levels above $5 per MW. The impact on DASR prices of high offers was minor as a result of a favorable balance between supply and demand.
37 See the 2012 State of the Market Report for PJM, Volume II, Section 9, “Ancillary Services” at Day Ahead Scheduling Reserve (DASR).38 See PJM. “Manual 11, Emergency and Ancillary Services Operations,” Revision 60 (June 1, 2013), p. 143.

2013 Quarterly State of the Market Report for PJM: January through June
250 Section 9 Ancillary Services © 2013 Monitoring Analytics, LLC
Market PerformanceFor 90 percent of hours in January through June, 2013, DASR cleared at a price of $0.00 (Figure 9-17). For January through June 2013, the weighted DASR price was $0.06. The highest price was $23.37 on May 30, 2013. DASR prices are calculated as the sum of the offer price plus the opportunity cost. For most hours the price is comprised entirely of offer price. When the DASR clearing price is greater than $0, 91 percent of the time the price consists solely of the offer price. The breakdown of price into offer and LOC is in Figure 9-17.
Table 9‑21 PJM Day‑Ahead Scheduling Reserve Market MW and clearing prices: January through June 2012 and 2013
Year Month
Average Required
Hourly DASR (MW)
Minimum Clearing
Price
Maximum Clearing
Price
Weighted Average Clearing
Price
Total DASR MW Purchased
Total DASR Credits
2013 Jan 6,965 $0.00 $2.00 $0.01 5,182,020 $45,3372013 Feb 6,955 $0.00 $0.75 $0.00 4,673,491 $20,0622013 Mar 6,543 $0.00 $1.00 $0.02 4,861,811 $75,0712013 Apr 5,859 $0.00 $0.05 $0.00 4,218,720 $8,8632013 May 6,129 $0.00 $23.37 $0.20 4,560,238 $873,9432013 Jun 7,262 $0.00 $15.88 $0.12 5,228,554 $615,5572012 Jan 6,944 $0.00 $0.02 $0.00 5,166,216 $6042012 Feb 6,777 $0.00 $0.02 $0.00 4,716,710 $2,0372012 Mar 6,180 $0.00 $0.05 $0.00 4,591,937 $5,0312012 Apr 5,854 $0.00 $0.10 $0.00 4,214,993 $5,5722012 May 6,491 $0.00 $5.00 $0.05 4,829,220 $226,8812012 Jun 7,454 $0.00 $156.29 $2.39 5,366,935 $11,422,377
Figure 9‑17 Hourly components of DASR clearing price: January through June 2013
$0.00
$5.00
$10.00
$15.00
$20.00
$25.00
Jan Feb Mar Apr May Jun
Offer
LOC
Black Start ServiceBlack start service is necessary to help ensure the reliable restoration of the grid following a blackout. Black start service is the ability of a generating unit to start without an outside electrical supply, or the demonstrated ability of a generating unit to automatically remain operating when disconnected from the grid.
PJM does not have a market to provide black start service, but compensates black start resource owners on the basis of an incentive rate or for the costs associated with providing this service.

Section 9 Ancillary Services
2013 Quarterly State of the Market Report for PJM: January through June 251© 2013 Monitoring Analytics, LLC
Individual transmission owners, with PJM, identify the black start units included in each transmission owner’s system restoration plan. PJM defines required black start capability zonally and ensures the availability of black start service by charging transmission customers according to their zonal load ratio share and compensating black start unit owners. (Table 9-22)
Following a stakeholder process in the System Restoration Strategy Task Force (SRSTF), substantial changes to the black start restoration and procurement strategy were introduced. The PJM and MMU proposal for system restoration was approved at the February 28, 2013, Markets and Reliability Committee (MRC).
The proposed changes include allowing PJM more flexibility in procuring black start resources by allowing cross zonal coordination between transmission zones, clarifying the responsibility for black start resources selection, revising the timing requirement for black start from 90 minutes to three hours, and implementing a process to revise black start plans on a five year basis in order to ensure system restoration needs are met. This proposal is a substantial improvement to current system restoration strategy, which does not give PJM adequate flexibility in procuring black start resources. This proposal also clarifies that PJM is the entity responsible for selecting the appropriate black start resources for each transmission zone based on system restoration requirements.
Black start payments are non-transparent payments made to units on the behalf of load to maintain adequate reliability to restart the system in case of a blackout. Current rules appear to prevent the publishing detailed data regarding these black start resources, hindering transparency and competitive replacement RFPs. The MMU recommends PJM revise the current confidentiality rules in order to specifically allow a more transparent disclosure of information regarding black start resources and their associated payments in PJM.
In January through June 2013, black start credits were $58.5 million. Black start zonal credits in January through June 2013 ranged from $0.03 per MW
in the ATSI zone (total credits: $70,284) to $11.42 per MW in the AEP zone (total credits: $48,178,521). For each zone, Table 9-22 shows black start revenue requirement credits, black start operating reserve credits, and black start rates (calculated as credits per MW).
Table 9‑22 Black start zonal credits for network transmission use: January through June 2013Zone Revenue Requirement Credits Operating Reserve Credits Black Start Rate ($/MW)AECO $281,884 $10,562 $0.58AEP $326,715 $47,851,806 $11.42AP $115,656 $3,211 $0.08ATSI $70,284 $0.03BGE $3,856,607 $6,079 $3.05ComEd $2,113,689 $13,303 $0.50DAY $123,779 $5,530 $0.20DEOK $167,948 $2,604 $0.17DLCO $30,291 $0.05DPL $295,076 $2,978 $0.40EKPC $32,271 $0.45JCPL $294,472 $0.26Met-Ed $382,123 $7,084 $0.71PECO $703,854 $29,505 $0.47PENELEC $274,994 $0.52Pepco $142,327 $7,242 $0.12PPL $91,658 $0.07PSEG $1,269,863 $34,625 $0.69

2013 Quarterly State of the Market Report for PJM: January through June
252 Section 9 Ancillary Services © 2013 Monitoring Analytics, LLC