ancient dna analysis of northeast pacific humpback...
TRANSCRIPT
ANCIENT DNA ANALYSIS OF NORTHEAST PACIFIC HUMPBACK WHALE
(MEGAPTERA NOVAEANGLIAE)
by
Ursula M. Arndt M.A., Johannes Gutenberg-Universität, 2004
DISSERTATION SUBMITTED IN PARTIAL FULFILLMENT OF THE REQUIREMENTS FOR THE DEGREE OF
DOCTOR OF PHILOSOPHY
In the Department of Archaeology,
Faculty of Environment
© Ursula M. Arndt 2011
SIMON FRASER UNIVERSITY
Fall 2011
All rights reserved. However, in accordance with the Copyright Act of Canada, this work may be reproduced, without authorization, under the conditions for Fair Dealing. Therefore, limited reproduction of this work for the purposes of private
study, research, criticism, review and news reporting is likely to be in accordance with the law, particularly if cited appropriately.

ii
Approval
Name: Ursula M. Arndt
Degree: Doctor of Philosophy
Title of Dissertation: Ancient DNA Analysis of Northeast Pacific Humpback Whale (Megaptera novaeangliae)
Examining Committee:
Chair: Dr. David Burley __________________________________________
___________________________________________
Dr. Dongya Yang Senior Supervisor Associate Professor, Achaeology
___________________________________________
Dr. Jonathan Driver Supervisor Professor, Archaeology; Vice-President, Academic and Provost
___________________________________________
Dr. Michael Hart Supervisor Professor, Biology
___________________________________________
Dr. Arne Mooers Internal Examiner Professor, Biology
___________________________________________
Dr. Hendrik Poinar External Examiner Associate Professor McMaster University, Hamilton, ON
Date Defended/Approved: December 16th 2011

iii
Partial Copyright Licence

iv
Abstract
The main goal of this ancient DNA-based study was to analyze archaeological whale skeletal remains from the west coast of Vancouver Island, British Columbia to investigate population genetic diversities of humpback whales pre-dating industrial whaling. This study also examined whale hunting practices of early indigenous people by revealing potential species selections. Nuu-chah-nulth people are believed to have hunted whales for millennia and numerous whale bones have been recovered from archaeological middens from the region.
Whale skeletal remains (N=264) from two archaeological sites (Ts’ishaa
and Huu7ii) were analyzed using ancient DNA techniques, with 84% of the samples yielding amplifiable DNA. Nearly 79% of the samples were identified as humpback whale based on cytochrome b and D-loop regions of mtDNA. The analysis was carried out in a dedicated ancient DNA facility, including strict contamination controls and multiple repeats of both PCR and sequencing. No systematic contamination was detected over the course of this study, further supporting the authenticity of the ancient DNA data obtained.
The mtDNA haplotypes of 105 of the humpback whales was determined using a 344bp D-loop sequence assembled from multiple overlapping DNA fragments. The genetic diversity of ancient humpback whales (π=0.0147 and h=0.804) falls within the range of modern Pacific humpback whales. Since some of the major genetic signatures can still be observed in today’s populations, results indicate a strong resilience despite industrial whaling during the 19th century.
The majority of whale remains in this study were identified as humpback whale and to a lesser degree as grey whale (13%), supporting the notion that the ancestors of the Nuu-chah-nulth people probably practised whaling almost 5000 years ago. Humpback whale could be more easily targeted using traditional techniques based on the whale’s speed and proximity to the shore. Other species such as finback and right whale (among others) only appear in archaeological records younger than 2000BP, which may indicate an improvement of hunting techniques over time. Keywords: ancient DNA; whaling; Megaptera novaeangliae; humpback whale; phylogeography; Nuu-chah-nulth

v
Acknowledgements
I would like to thank my supervisor Dongya Yang for taking me on as his
student; this project would not have happened without him and I am very grateful
for his academic and financial support. I am indebted to my committee member
Michael Hart for his ongoing generous support and invaluable input, not to
mention his patience. I am also grateful to Jonathan Driver for serving on my
committee and providing me with constructive feedback. By sharing their
knowledge with me, Dongya, Mike, and Jon have greatly improved the quality of
this work and have prepared me well for the future.
Thank you to Arne Mooers and Hendrik Poinar for taking time to serve as
my examining committee. Many thanks to Alan McMillan for the samples as well
as his valuable insight into the archaeology of Barkley Sound. Thank you to Ross
Jamieson and Cathy D`Andrea for being fantastic Graduate Chairs and always
having an open door. I also need to thank the staff of the Archaeology
Department, especially Merrill Farmer, Laura Nielson, Shannon Wood, Peter
Locher and Andrew Barton for their technical and administrative support. Thank
you to the Pacific ID team, Ian McKechnie, Becky Wigen, Susan Crockford, Gay
Frederick for helping me with the sampling and providing the zooarchaeological
Identification.
I also would like to thank Joachim Burger, who got me interested in
ancient DNA in the first place, for his mentorship and ongoing support.
Finally, thank you to all my colleagues and friends who were willing to
discuss and brainstorm, especially my lab mates, Camilla Speller, Krista McGrath
and Antonia Rodrigues, and my friends in Canada and Germany for their ongoing
friendship and support.
Last but not least, I owe everything to my family, my parents Gisela and
Konrad Arndt and my sister Stefanie, for their financial and personal support for
allowing me to wander 8000 km away with few complaints.
Danke !

vi
Table of Contents
Approval .......................................................................................................................... ii
Partial Copyright Licence ............................................................................................... iii
Abstract .......................................................................................................................... iv
Acknowledgements ......................................................................................................... v
Table of Contents ........................................................................................................... vi
List of Figures................................................................................................................ viii
List of Tables .................................................................................................................. ix
Chapter 1: Introduction .............................................................................................. 1
Chapter 2: General Background ................................................................................ 6
Ancient DNA Analysis in Archaeology ............................................................................. 6
Molecular Archaeology ............................................................................................ 6 Technical Challenges .............................................................................................. 7 Addressing Archaeological Questions ................................................................... 12
Archaeology and Conservation Biology ......................................................................... 16
Conservation biology ............................................................................................. 16 Ancient DNA analyses, Zooarchaeology and Phylogeography .............................. 19
Archaeological and Ethnographic Record ...................................................................... 24
Nuu-chah-nulth History at Barkley Sound .............................................................. 25 Society .................................................................................................................. 28
Megaptera novaeangliae ............................................................................................... 30
The history of whaling ........................................................................................... 33 The history of modern whaling .............................................................................. 35
Chapter 3: Material and Methods ............................................................................ 43
Sample Provenience ..................................................................................................... 43
Ts’ishaa ................................................................................................................ 44 Huu7ii .................................................................................................................. 46
Samples ........................................................................................................................ 47
Method .......................................................................................................................... 49
Sample preparation and extraction ........................................................................ 49 PCR setup and amplification ................................................................................. 51 Sequencing Analysis ............................................................................................. 53 Inhibition ............................................................................................................... 54
Chapter 4: Contamination Control and Ancient DNA Authenticity ....................... 57
Contamination control ................................................................................................... 59
Protocols implemented at SFU ...................................................................................... 61
Internal contamination controls .............................................................................. 62

vii
Reproducibility ...................................................................................................... 62 Biochemical preservation ...................................................................................... 63 Phylogenetic sense ............................................................................................... 64 Cloning .................................................................................................................. 64
Authenticity of samples ................................................................................................. 65
Chapter 5: Species Identification at Barkley Sound and the Implications for Whaling Practices .................................................................................................. 68
Abstract ......................................................................................................................... 68
Introduction ................................................................................................................... 69
Background ................................................................................................................... 71
Ethnographic and Archaeological whaling evidence .............................................. 71 Humpback Whale Migration .................................................................................. 81
Material and Methods .................................................................................................... 84
Results .......................................................................................................................... 87
Discussion ..................................................................................................................... 93
Conclusions ................................................................................................................ 108
Chapter 6: Population Genetic Diversity of Northeast Pacific Humpback Whale (Megaptera novaeangliae) from an Ancient DNA Perspective .................... 110
Abstract ....................................................................................................................... 110
Introduction ................................................................................................................. 111
Background ................................................................................................................. 113
Humpback whale populations.............................................................................. 113 Industrial Whaling ................................................................................................ 118
Material and Methods .................................................................................................. 119
Material ............................................................................................................... 119 Methods .............................................................................................................. 126 Statistical Analysis .............................................................................................. 129
Results ........................................................................................................................ 132
Discussion ................................................................................................................... 146
Conclusions ................................................................................................................ 165
Chapter 7: Final Discussion................................................................................... 167
Archaeology and Biogeography .................................................................................. 167
Sampling ..................................................................................................................... 178
Future studies ............................................................................................................. 182
Conclusion .................................................................................................................. 184
Chapter 8: Conclusions ......................................................................................... 186
Literature ................................................................................................................... 190
Appendix A: Samples processed including provenience ...................................... 218
Appendix B: Sample extraction and PCR amplifications ....................................... 226

viii
List of Figures
Figure 1: map of Barkley Sound with excavated sites (adapted after McMillan and St Claire 2005) 1: Ts’ishaa (DfSi 16 and 17) 2:Huu7ii (DfSh7) ...................... 43
Figure 2: Ancient DNA laboratory at SFU. Red arrows (solid) indicate positive pressure airflow. Blue arrows (dashed) path of samples. Material leaving the PCR set-up room will not be re-entered into the Decontamination room. ................................................................................. 61
Figure 3: Cytochrome B alignment of species identified in Barkley Sound. GenBank Sequences (see accession numbers next to species) for this alignment. ..................................................................................................... 87
Figure 4 Sex Identification using ZFX and SRY primer system. Note that all lanes are amplifications of the same sample (WH35). WH35a+b indicate SRY/ZFX co-amplification, WH35c SRY only amplification. WH35a successfully co-amplified at both loci (upper band=ZFX, lower band SRY), WH35b is missing the ZFX band. “Neg”control exhibits primer-dimer. ............................................................................................................ 92
Figure 5: tree of samples used in this study. Ancient haplotypes (red arrows) were not found in Genbank. Modern samples (pink) N=19 from Jackson et al (2009) .................................................................................... 135
Figure 6: Bayesian skyline plot. X-axis=time (moving backwards in time from left to right); Y-axis =population size. Black line= mean values; blue area= upper and lower 95% confidence interval. ................................................... 138
Figure 7: comparison of skyline plots: linear and constant population size prior. 35 ancient DNA samples. A and B: Washington Oregon (n=19), C and D: Washington, Oregon and Mexico (n=100) A and C=constant prior, B and D linear prior ........................................................................................ 141

ix
List of Tables
Table 1: Primer used in this study ................................................................................. 52
Table 2: Cytochrome b Primer used for species Identification. ...................................... 87
Table 3: Species distribution at Ts'ishaa and Huu7ii. ..................................................... 89
Table 4: Species identification by time depth for Ts’ishaa and Huu7ii. ........................... 90
Table 5: Number of individuals based on location by researcher. .................................. 93
Table 6: humpback whale samples used for mtDNA genetic diversity analysis. .......... 121
Table 7: D-loop Primers used ...................................................................................... 127
Table 8: nucleotide and haplotype diversity for this study compared to published data. All data in grey is based on published material only. .......................... 136
Table 9: unique haplotypes found in 105 ancient DNA sequences. ............................. 137
Table 10: changes in population size. All values are raw data (=Ne*tau) .................... 139
Table 11: effective population size based on Bayesian skyline plot ............................. 142
Table 12: changes in genetic diversity based on minimum and maximum estimated individuals ................................................................................... 145
Table 13: samples used including excavation information. .......................................... 219
Table 14:Extraction and PCR overview ....................................................................... 227

1
Chapter 1: Introduction
Whales have been a valuable source of meat, oil and other materials for
thousands of years and can be found in the oral traditions of cultures around the
world. While hunting large land mammals such as bison or mammoth would have
been challenging for humans in the past, hunting large sea mammals in small
boats on the open ocean would have been even more difficult. Nevertheless, the
use of whale evolved from utilizing stranded whales to sophisticated whaling
techniques, which included elaborate mythology surrounding the animal and the
act of whaling. While traditional whaling has been observed globally in coastal
regions, it remains uncertain when traditional whaling first developed.
On the other hand, industrial whaling is well recorded, starting with Basque
whaling in the 16th century. Industrial whaling in the 19th and early 20th centuries
greatly reduced the size of whale populations worldwide, driving some populations
to local extinction, including the Atlantic grey whale. Since the mid-twentieth
century, the recovery of whale populations has been variable, from almost no
changes in some populations such as the right whale, to an increase beyond
expectations as is the case with North Pacific humpback whales. Research over
the years has attempted to establish a solid baseline of humpback whale
population size, biogeography and genetic diversity, in an effort to aid future
management decisions surrounding indigenous whaling, as well as commercial
claims on whale stocks (Calambokidis et al. 2001, Calambokidis et al. 2004,

2
Jackson et al. 2007, Baker and Clapham 2004, Witteveen et al. 2004).
This study investigated the potential of using ancient DNA analysis to
provide additional information on Northeast Pacific humpback whale populations
prior to industrial whaling. The study analysed 264 archaeological whale bone
samples from two sites in Barkley Sound, which is located on the West Coast of
Vancouver Island, British Columbia: Ts'ishaa, located in the central part of Barkley
Sound on Benson Island (part of the Broken Group Islands) and Huu7ii, located on
the north end of Diana Island (part of the Deer Group Islands). Both sites were
important Nuu-chah-nulth villages and both demonstrated archaeological evidence
for active whaling. The overall goal of this study was to use previously excavated
whale bones from these two archaeological sites to investigate archaeological as
well as biogeographic questions. The specific objectives of this research were:
1) To investigate the antiquity of whaling in Barkley Sound and the impact the
development of whaling had on species diversity in the archaeological
record;
2) To establish genetic diversity of Northeast Pacific humpback whale
populations prior to the industrial whaling industry of the twentieth century
and to describe the changes in genetic diversity of this population through
time; and
3) To highlight the possible contributions of molecular archaeology to
biogeography and conservation biology.
The results of this analysis indicated that people hunted humpback whales

3
for at least 5000 years, with species other than humpback and grey whale being
present only in layers more recent than 2000 BP. Based on mitochondrial DNA
(mtDNA) analysis, the genetic diversity of humpback whales in Barkley Sound did
not change substantially over the last 5000 years. The study revealed several
contributions of molecular archaeology to various disciplines. For example, the
results of this research shed light on the antiquity of whaling in Barkley Sound and
will help reveal modes of marine subsistence development. This study also
demonstrated that phylogeographic data of pre-industrial whaling populations can
aid in the investigation of the long term changes of humpback whale population
size and genetic diversity in order to evaluate current population status.
While modern studies have investigated potential changes over time based
on current population variation, this study uses data collected from various points
in the past, and thus provides a baseline of population distribution and genetic
diversity. This study not only investigates the antiquity of whaling and the genetic
diversity of past whale populations in Barkley Sound, but also investigates how
archaeology, zooarchaeology, ancient DNA analysis, and ethnographic data
contribute to modern conservation biology. The use of molecular techniques,
especially DNA, has revolutionized both biogeography and archaeology in the past
20 years (Riddle et al. 2008, Hadly et al. 2004). Ancient DNA has the unique ability
to provide data comparable to modern DNA.
Humpback whales are a cosmopolite species, even today. In the North
Pacific, three subpopulations are further subdivided into multiple feeding grounds
in colder waters, only to mix during migration and at the breeding grounds located

4
in warmer regions. These complex migration and breeding patterns only came to
light with extensive studies of over 6000 individuals (Calambokidis et al. 2008,
Baker et al. 1998b, Baker et al. 2004). Barkley Sound is part of one of the feeding
grounds, encompassing southern British Columbia and Washington, USA. An
almost year-round presence of humpback whales in the area could have fostered
the development or settlement of whaling cultures in Barkley Sound.
Archaeological and ethnographic data from the Nuu-chah-nulth territory
have revealed a long history and extensive tradition in connection with whales and
the hunt of whales on the Northwest Coast. Zooarchaeological data suggest that
humpback whale was the common species hunted in the area for at least 2000
years (Monks 2001). However, in most cases whale bones are not identifiable to
the family or species level, and cannot be used to track species distribution or to
investigate changes in hunting patterns through time.
The general background information for this dissertation regarding ancient
DNA, archaeology and humpback whale biology is discussed in Chapter 2 while
more specific background on Nuu-chah-nulth culture and whale biology can be
found in Chapters 5 and 6, respectively. Chapters 3 and 4 describe the
methodology of this study, with Chapter 4 focusing on the authenticity of the
produced sequences. For this study, ancient DNA analysis was conducted to
provide species identification, as well as the mitochondrial haplotype of a subset of
the humpback whale samples. Chapter 5 discusses the results of the species
identification and its relevance to archaeology. Chapter 6 is focused on the
phylogeography of the humpback whale population present in the dataset,

5
discussing the results of the genetic diversity and comparing ancient DNA data to
previously published research results. The general discussion in Chapter 7
includes a discussion on the ability of archaeology to aid biogeographic research,
framing the separate archaeology (Chapter 5) and biogeography (Chapter 6)
results within a broader context and outlining the potential for future research.

6
Chapter 2: General Background
Ancient DNA Analysis in Archaeology
Molecular Archaeology
Molecular archaeology implements ancient DNA and protein analysis to
study archaeological samples. The spectrum of materials analysed range from
faunal remains and cooking residues, to floral remains and artifacts (excavated or
museum specimens) made from organic material. The following chapter will
discuss ancient DNA and specifically molecular archaeology research.
Ancient DNA research started 30 years ago and the initial 10 years were
filled with discoveries about contamination, DNA damage and realistic DNA
survival expectations. Prior to the development of the polymerase chain reaction
(PCR) technology (Mullis et al. 1986), ancient DNA research on museum samples
during the late 1980s used molecular cloning techniques to achieve the DNA
quantities necessary for analyses. The first published studies analysed the
phylogenetic position of the quagga, an extinct zebra subspecies (Higuchi et al.
1984) and an Egyptian mummy (Pääbo 1985). With the adoption of PCR
technology, ancient DNA analysis became more viable to a wider field of
researchers in palaeontology, archaeology and anthropology. Initially, research
focused on phylogenetic analyses of extinct species and early studies of human

7
evolution such as the first Neanderthal DNA research published in 1997 (Krings et
al. 1997). However, research quickly evolved beyond such questions to almost all
levels of anthropology and archaeology. Anthropologists in Europe have been
using ancient DNA since the 1990s to analyse burial populations (Handt et al.
1996) and famous interments, such as the Romanovs, a Russian Tsar family (Gill
et al. 1994). Over the past 10 years however, with technological developments and
access to larger datasets, the focus has shifted towards understanding species
phylogeography, which involves comparisons between populations and population
genetics of extinct and extant species, including Homo sapiens. One of the largest
studies to date (Shapiro et al. 2004) analysed over 400 samples for phylogenetic
and phylogeographic details of North American bison. With the advent of emulsion
PCR and next generation sequencing (currently 454 pyrosequencing by Roche,
Illumina/Solexa, and SOLiD by ABI), researchers are moving towards analysing
entire genomes of specimens, such as the cave bear, mammoth and Homo
neanderthalensis (Ronaghi 2001, Noonan et al. 2006, Hebsgaard et al. 2007, Wall
and Kim 2007). Future advances, which aim at larger datasets at lower overall
costs, will enable researchers to document extinct populations and environments
more comprehensively, allowing for more inclusive comparison of modern and
ancient datasets, and extending the time frame for statistical analyses by millennia
(Knapp and Hofreiter 2010).
Technical Challenges
Ancient DNA techniques are essentially the same as modern DNA

8
techniques, but age and preservation of samples introduces certain constraints to
the practical work. With the increase in research on ancient DNA, knowledge of
these constraints and problems has improved, leading to the development of
guidelines on proper research in ancient DNA laboratories. The application of
ancient DNA techniques does not hinge on a sample’s specific age, but rather the
environmental conditions under which it has been stored.
The major objectives are to detect or prevent contamination, and to detect
sequence damage, such as deamination, that could lead to incorrect results in the
final analysis (Hansen et al. 2001, Lindahl 1993). This detection is accomplished
by studying multiple sequences and, if necessary, bacterial cloning. However,
cloning has become less accepted as necessary (Kemp and Smith 2010). Another
way of detection is the use of Uracil-N-Glycosidase (UNG), an enzyme that
removes uracil, and one which is used during the early stages of PCR to
distinguish between taphonomic C-T changes and non-degraded unique base pair
changes (Pääbo et al. 2004, Hofreiter et al. 2001a). Apart from base pair damages,
the most visible result of degradation is the reduction in amplicon length; that is,
while well preserved samples yield amplicon length of >300bp - with the “normal”
range being between 150bp and 200bp per amplification reaction - badly preserved
samples yield amplicons in the range between 60bp and 100bp (Pääbo et al. 2004,
Gilbert et al. 2005, Hofreiter et al. 2001b, Bollongino et al. 2008b, Willerslev and
Cooper 2005).
Ancient DNA work is prone to contamination because of the low
concentration and degraded state of the DNA. PCR conditions in ancient DNA

9
work are designed to amplify short fragments of low quantity DNA. Therefore, even
relatively small quantities of modern DNA that would not be a problem in a modern
laboratory, can easily outcompete the ancient templates. Thus, laboratories and
workflow are designed to prevent possible introductions of non-specimen DNA,
and special procedures such as UV irradiation and bleach treatment are used to
remove possible contamination. The measurements are even stricter when working
with ancient human DNA, including early anatomical modern homo sapiens and
Neanderthals. Potential sources include the excavation team, laboratory team,
washing the bone at site, laboratory chemicals used and cross contamination
during preparation. The guidelines include strict contamination controls, multiple
extractions and PCR amplifications, and inter-laboratory controls where needed
(see Chapter 4 for details and application in this study). Contamination is one of
the limiting factors for anthropological and archaeological studies involving ancient
DNA (Mulligan 2006). Ancient DNA research requires planning to include possible
contamination prevention measures during excavations and special handling of
sample material (Bollongino et al. 2008b, Mulligan 2006).
DNA preservation has been subject to various studies and the factors that
determine the survival of biomolecules over time are still under investigation. Some
important factors in DNA survival are temperature, water, time, and soil
composition, especially pH-level (Bollongino et al. 2008b, Smith et al. 2003,
Axelsson et al. 2008, Gilbert et al. 2006). However, the effects of soil composition
are not fully understood. In addition, interactions between those components can
lead to different chemical reactions, complicating the predictions even further.

10
Chemical components in the burial environment may also create PCR
inhibition, another problem that remains unsolved and poorly understood. Inhibition
can either be caused by chemicals in the soil or by chemical changes in the DNA
strand. While some of the chemical inhibitors are known, such as humic acid and
tannins (King et al. 2009, Sutlovic et al. 2005), many of the activities and cross
reactions in soil environments are not understood. In some cases of inhibition, the
DNA strand is intact but chemical or biological agents prevent the amplification of
the DNA. Removing these agents would lead to amplifiable DNA, but could also
lead to a lower concentration of remaining DNA (Gilbert et al. 2003, Willerslev et al.
2004, Kemp et al. 2006).
The age of samples yielding amplifiable DNA generally ranges between 100
and 100 000 years. Researchers have used amino-acid racemisation to predict
DNA survival (Hofreiter et al. 2001b). However, amino-acid racemisation and
protein survival has not yielded the desired success in predicting DNA survival, and
recent studies refute the idea that amino-acid racemisation can reliably predict
DNA survival (Collins et al. 2009). Statistical analyses predict a maximum survival,
under ideal conditions, of about 100 000 years (Collins et al. 2002). Since most
samples are not stored under ideal conditions, thermal age (see also http://thermal-
age.eu/) has been introduced as a way to possibly estimate DNA survival rate
(Willerslev and Cooper 2005, Smith et al. 2003).
Molecular archaeology and generally ancient DNA research have never
been isolated fields, but both were primarily focused on historical and pre-historical
questions. Current research increasingly emphasises the importance of

11
multidisciplinary approaches (Leonard 2008). Also, research design in current
ancient DNA studies includes more hypotheses testing and is thus moving away
from sample-based data exploration. One important trend in ancient DNA work is
to combine various analytical methods with ancient DNA, including stable isotopes,
direct dating, modern comparison, as well as material culture archaeology and
ethnographic data. Using multiple lines of evidence improves the interpretation of
archaeological remains.
Depending on the hypothesis to be tested, different genetic loci are
analysed during a study. Because of the level of degradation, mtDNA is generally
preferred over nuclear DNA. The amount of mtDNA is significantly higher than
nuclear DNA: Each cell contains one copy of nuclear genome and up to 1000
copies of mitochondrial genome. Additionally, mtDNA is non-recombinant which
makes it possible to trace maternal lineages through time. Whether mitochondrial
genes or the non-coding control region (“D-loop”) are studied depends on the
question asked. Species identification is often done using the more conserved
cytochrome b gene or COI while intra-population studies utilize the generally faster
mutating D-loop. In addition, targeted fragments should be less than 200bp if
possible, while in good conditions, targeting 300bp or more is possible.
Overlapping fragments assure the sequence authenticity and provide additional
repeats of the amplified fragment.

12
Addressing Archaeological Questions
Ancient DNA research has been applied to a wide variety of archaeological
questions. Burial populations can be analysed to determine kinship (Gerstenberger
et al. 1999, Hummel and Herrmann 1996) and ancient DNA analysis is frequently
the only way to detect discrepancies between the burial and historical documents.
On an individual level, remains are being analysed to trace living descendants and
possible cultural affiliations. Examples of these studies include the DNA analysis of
Kwaday Dan Ts’inchi (Monsalve et al. 2002), Ötzi the Tyrolean ice man (Rollo et al.
2006), and the remains of individuals from Nevada (Kaestle and Smith 2001).
The first Neanderthal DNA was sequenced in 1997 using the specimen
discovered near Düsseldorf, Germany. Based on a 380bp mtDNA fragment of the
HV1 region on the D-loop, the Neanderthal was excluded from the direct ancestry
of modern Homo sapiens (Krings et al. 1997). More individuals were subsequently
analysed and the results corroborated the result that the Neanderthal D-loop
haplotype cannot be found in modern humans. In 2006, two research groups, one
in Berkley, USA (Noonan et al. 2006) and one in Leipzig, Germany (Green et al.
2006) used pyro-sequencing (454 technology) and emulsion PCR to sequence the
entire Neanderthal genome. The results of the two studies differed substantially
due to contamination and the German research group used the results sequenced
in Berkley for further analysis (Wall and Kim 2007, Krause et al. 2007). Another
widely discussed study was published in 2003 analysing two 24 000 BP Cro-
Magnon individuals (Caramelli et al. 2003). The results of this study suggested that
the Cro-Magnon Homo sapiens fell well within the range of modern Homo sapiens

13
mtDNA variation. Despite strictly following the protocols for authenticating ancient
DNA, discussions remained as to whether this result was indeed reliable (Pääbo et
al. 2004). In a follow up study, the Caramelli research group published a sequence
of a Cro-Magnon individual taking all possible contaminant sequences in the
analysis under consideration (Caramelli et al. 2008). To detect possible
contamination, Caramelli’s team determined the HV1 haplotype of the Paglicci 23
Cro-Magnon specimen by typing two bone fragments as well as typing all
individuals involved in the excavation and subsequent analysis. The 152 clonal
sequences of the Paglicci 23 specimens were compared to the reference samples
collected from the excavation and lab members. The researchers concluded that
the Cro-Magnon sequence, which carries the Cambridge reference sequence
haplotype, is different from all potentially contaminating personnel and thus should
be considered authentic (Caramelli et al. 2008).
Plant and animal domestication is an archaeological topic that has been
pursued for a long time (Zeder 2006). The origin of domesticated cattle in Europe,
for example, has been a prominent issue in ancient DNA research over the past 15
years. Even as modern DNA research has illustrated the geographic patterns of
haplotypes, migration and admixture over time play a crucial part in the
misinterpretation of these modern patterns (Bollongino et al. 2005, Loftus et al.
1999). Ancient DNA research has ultimately led to more realistic interpretations
regarding the origin and domestication events of European cattle (Bollongino et al.
2005, Beja-Pereira et al. 2006, MacHugh et al. 1999). Other domestication events
that have been analysed using ancient DNA are that of the horse (Vila et al. 2001,

14
Jansen et al. 2002), that of the dog (Verginelli et al. 2005, Vila et al. 1999) and that
of the pig (Larson et al. 2005, Larson et al. 2007), among others.
Food staples and food procurement studies can aid in understanding the
culture and settlement patterns in a region. Cannon and Yang (2006) showed
settlement seasonality based on different salmon species in Keatley Creek, British
Columbia. Haak et al. (2005) analysed the lactose gene in central European
Neolithic populations to trace the onset of dairy use, a substantial change in diet
that is still poorly understood. Originally, humans lost the ability to digest milk after
childhood; today many Europeans retain the ability to digest milk protein as adults.
This change probably happened during the Neolithic when cattle domestication
made cow milk readily available (Haak et al. 2005, Burger et al. 2007).
Through plant DNA analysis, the change from wild teosinte to domestic
maize was tracked in South and Central America (Freitas et al. 2003, Jaenicke-
Despres et al. 2003). These archaeological or paleontological plant DNA analyses
can be used for environmental reconstruction, seasonality studies, and the
detection of possible resource depressions (Willerslev and Cooper 2005, Gugerli et
al. 2005). In terms of human populations, plant DNA can help to understand past
lifeways and cultural adaptations (Zeder 2006, Jaenicke-Despres et al. 2003,
Kaestle 2002, Kaestle and Horsburgh 2002). When including coprolites as an
ancient DNA source, questions can also include the diet of extinct species or
ancient populations (Iniguez et al. 2003, Loreille et al. 2001).
Plant and animal DNA can be used by archaeologists to reconstruct past
environmental conditions and resources, as well as changes over time. This

15
information is not only relevant to archaeologists, as it can also be important for
modern biologists. Archaeologists have produced environmental and resource
reconstructions to establish population distribution and boundaries. Lee Lyman, for
example, used zooarchaeological methods in several instances to distinguish
indigenous taxa from exotic ones (Lyman 2006, Lyman and O'Brien 2005). In
Lyman and O’Brien’s study (2005), several subspecies considered indigenous
today were revealed to be historic migrants from different areas. The ability to
analyse these patterns enables biologists to evaluate current distributions and the
optimal steps that need to be taken in conservation areas. This study could have
been amended by using DNA to investigate these questions which would have
allowed for a more detailed analysis, helping to re-evaluate and assist in the
conservation of threatened species.
The option to use archaeological material to extend the window of
accessible data for aDNA studies has been discussed for years but rarely used.
Modern conservation biology relies strongly on genetic data to establish
phylogeography, population movements and boundaries, and biological distances
between populations. Such data can also be collected through ancient DNA
analyses of archaeological and palaeontological sample sets and compared to
modern data. Investigating extinction events can assist in investigating modern
populations in unstable environments, which is relevant research for current
conservation biologists and future conservation management policies.

16
Archaeology and Conservation Biology
Conservation biology
In 2008, almost 25% of known mammal species were listed as threatened
with extinction on the International Union for Conservation of Nature (IUCN) red list
for endangered species (Vié et al. 2008).
Conservation biology has expanded over the past 15 years as the impact of
human action on the environment has become more visible. A large body of
theoretical work supports today's conservation biology research and practice
(Bowen 1999, Amos and Balmford 2001, Desalle and Amato 2004), the goal of
which is sustainable equilibrium between a species’ habitat and the ecosystem, as
well as between species and human requirements. The term ‘conservation biology’
was coined in 1978 by Michael Soulé at a conference at the University of
California. Here, Soulé distinguished ‘conservation biology’ from other fields, such
as ‘wildlife management’. Conservation biology, according to Soulé, should be
focused on the general biodiversity of the ecosystem and its long term
development; furthermore, biodiversity should be preserved for its intrinsic value
(Soule 1985).
Conservation initiatives are often forced to make decisions based on
incomplete information and under time constraints (Halpern et al. 2007, Frankham
2005). With more accumulated data, the theoretical framework and case studies
are improving this situation, making more informed decision possible. Part of the
problem is identifying the correct management unit; that is, management decisions
regarding population transplantation or hybridisation often lack the knowledge of
17
previous population boundaries and might lack the foresight to predict the outcome
and effectiveness of a plan (Wiens and Graham 2005, Lyman and Cannon 2004).
By investigating past population boundaries, possible hybridization zones and gene
flow, the ideal population for re-introduction can be chosen (Lyman 2006, Lyman
and Cannon 2004). Analysing these population boundaries can also predict the
survival chance, based on the environmental conditions of the past population
(Brito 2005, Li et al. 2005).
Today, genetic analyses are an important component of conservation
biology and are used to investigate current and past population conditions through
species identification, population identification and by establishing population
genetic diversity and demographic histories (Desalle and Amato 2004, Avise
2004). A population’s genetic diversity is a critical factor in a species’ survival; a
high genetic diversity enhances a population’s ability to adapt to environmental
changes, and improves its survival chances (Hedrick 2001). Identifying breeding
units and establishing the genetic diversity is vital in developing appropriate
conservation protocols. However, since fauna and flora are subject to continuous
environmental changes, it is difficult to establish the natural condition of a species
or ecosystem prior to significant human alteration (Lyman 2006). Additionally, other
limitations such as small sample sizes and the need for immediate response
hamper the accuracy of conservation biology work.
Research over the past decades has provided evidence that factors for
species’ survival are multidimensional including genetic, demographic and
environmental components. While species diversity enhances the function of an

18
ecosystem, genetic diversity is relevant for a species as well as for the resilience of
the ecosystem, especially when species diversity is low (Reusch et al. 2005,
Hughes and Stachowicz 2004). In some cases, species collapses at a a
substantially faster rate than previously expected. Research suggests that
collapsing ecosystems were already damaged prior to modern human impact
(Jackson et al. 2001, Jackson 2001, Newsome et al. 2007).While this problem has
been observed in land ecosystems, the lack of detailed knowledge of the various
factors appears to be exaggerated in marine ecosystems. Marine ecosystems are
still poorly understood in most cases, making it difficult to establish effective marine
conservation areas. In addition, the invisibility of most of the marine wildlife, and
especially the depletion thereof, obstructs policy making in favour of human
resource use. While the disappearance of land animals is more noticeable,
destruction of marine resources only becomes visible if this resource is exploited
by humans. As Sloan and Jackson point out (Jackson et al. 2001; Jackson 2001),
protected areas are often a fraction of the theoretically needed size because of
human use requirements and lack of sufficient data.
To mitigate the lack of long term data, estimates of historic population size
and distribution are currently based on historic and ethnographic documents (such
as written documents of early settlers or explorers, and logbooks from fishing
vessels). The use of zooarchaeological resources can dramatically improve the
amount of information by estimating population size, as well as a species’ habitat
extent and habitation ecology directly from the past populations themselves
(Lyman 2006, Lyman and Cannon 2004, Lyman 1996, Rastogi et al. 2004).

19
Ancient DNA analyses, Zooarchaeology and Phylogeography
Environmental research in archaeology has helped identify the
environmental conditions in which past populations lived and tries to detect the
changes in those environments over time. These environmental changes can have
implications on human cultural society, as well as variations in technology.
Archaeologists have investigated prey choice, hunting pattern and faunal use in
general, shedding light on important subsistence patterns of past populations.
Results from these studies can be used as additional evidence to detect cultural
changes or the relationship between people and their environment.
Using ancient DNA analysis, research can reveal population demographics
and phylogeography prior to human impact. Newsome et al. (2007) used stable
isotopes and ancient DNA to analyse the past populations of northern fur seal in
relation to modern seal distribution. According to Newsome’s analysis, regional
extinction of northern fur seal in California predated European contact but did not
affect the fur seal populations to the north. According to this, Newsome claims, the
previous collapse can be attributed to hunting rather than climate change.
Ancient DNA research can also distinguish between the effects of human
impact and environmental changes on animal and plant populations (Hadly et al.
2004). Importantly, if research can reveal long term change, sensible management
decisions can be made with more accurate predictions of future outcomes. Without
DNA (that is, using only morphological analyses), the analysis of museum,
archaeological or palaeontological material may be handicapped by environmental
plasticity, especially in small sample sets (Hadly et al. 2004).

20
As Leonard (2008) noted, Pleistocene faunal studies can be used to analyse
the adaptation and extinction of mega fauna, whose pattern might help to predict
the survival abilities of extant species during the current or future climate change
(Hofreiter et al. 2004, Leonard et al. 2008). Hadly et al. (1998) used ancient DNA to
detect different responses to climate change in gopher and vole populations from
Lamar Cave in Yellowstone Park, USA. By subdividing their sample set in time, the
authors’ data demonstrated the changes in genetic diversity and population sizes
that had occurred in these two species over almost 3000 years (Hadly et al. 1998).
While some early researchers have presented romantic notions of past
people living in harmony with their environment (Raymond 2007), research has
since provided evidence of resource overexploitation (Jackson et al. 2001; Jackson
2001), both land and marine, leading to changes in prey size, resource depression
and finally changes in prey choice (Raymond 2007, Broughton 2002). In addition to
overexploitation, species introductions have led to artificial biodiversity increases,
disturbing the balance of the invaded ecosystem. For example, invasive species
and the subsequent environmental changes have been investigated in island
populations in Hawaii, Australia and Polynesia (Prebble and Wilmshurst 2009,
Kennett 2006). Being able to detect pre-historic changes resulting either from
natural occurrence or due to human intervention can be relevant background
information when dealing with rapid ecological destruction today, and can help
predict future response to ecosystem deteriorations.
In an effort to reconstruct phylogeographic patterns of past populations,
several resources have been used by archaeologists including pollen and faunal

21
analysis. While pollen analysis mostly detects species presence/absence as well
as the use of plants, faunal analysis can detect species presence/absence, species
abundance (based on the minimum number of individuals, MNI or the number of
identified specimens, NISP), and individual identification markers such as age, sex
and size. Middens in archaeological settlements contain only faunal material
deposited by local people. Culture has an important influence on material
deposition because the unintentional sampling process by humans may distort the
picture gained from these analyses, incorrectly implying the absence of a species
in an environment. On the other hand, some species would not be visible in the
fossil record without human action because of their life history, such as marine
organisms like fish or whales. Additional lines of evidence from palaeontological
research can help to distinguish between natural changes and cultural inference
where available.
A study published by Lee Lyman 15 years ago looked at the application of
zooarchaeology to conservation biology and wildlife management questions
(Lyman 1996). Having the ability to identify invasive species, changes in ecological
communities and species distribution, zooarchaeological assemblages can be
important windows into past ecosystems. Only a few studies in conservation
biology have made use of the long term data available in zooarchaeology. Lee
Lyman’s zooarchaeological study on pygmy rabbits in eastern Washington
revealed the original species distribution to be more extensive than the known
range today (Lyman 2004). In addition, his analysis concluded that the diminished
range of the pygmy rabbit probably correlated with the reduction of big sagebrush

22
distribution, used by the pygmy rabbit for food and shelter. The relatively close
distance between the northern and southern habitat in conjunction with
archaeological records of migration between the rabbit groups indicated that both
populations might be closely enough related to substitute the diminished northern
population in Washington State (Lyman 1996).
Virginia Butler’s (Butler 2000, Butler and Delacorte 2004) research on fish
species in Owens Lake demonstrates that the inclusion of r/K life history strategies
can be important factors when investigating ecosystem changes and species
survival over time. For this study, fish remains from seven archaeological sites in
the Owens Valley were compared between sites as well as over a temporal scale.
Results suggest that small fish (speckled dace and pupfish) were rare, either
naturally or because they were not targeted by fishers during that time, and that the
size of fish present in those sites became smaller over time. Importantly, Butler
notes that the absence of a species does not necessarily imply the absence in the
ecological community, but can be related to cultural practice (Butler and Delacorte
2004). Changes in size of prey can be due to environmental factors, or a sign of
overharvesting of larger fish (Butler and Delacorte 2004, Pauly 1995). Her analysis
of different species’ survival patterns over a 7000 year period can help fisheries
authorities explain modern patterns and make appropriate choices for future
policies.
As mentioned above, analysing extinction events helps in the investigation
of modern populations in unstable environments, and provides relevant results for
current and future environmental management policies. Using ancient DNA,

23
genetic properties of extinct populations can be analysed and applied to modern
populations (Shapiro et al. 2004). The modern focus on climate change provides a
venue for ancient DNA research on population genetic diversity and extinction to
make this research relevant to modern questions. The basic information has been
provided previously for various species, including extinct megafauna species, as
well as Pleistocene fauna (Bunce et al. 2005, Cooper et al. 2001, Cooper et al.
1996). However, in many cases, the connections are not being made between data
and the possible implications for modern conservation biology (DeMaster et al.
2006).
The idea that historical data in conservation biology has a very limited time
depth has extensive implications if the goal is to return an ecosystem to its natural
state. As Jackson and others points out (Jackson et al. 2001; Jackson 2001), this
historically recorded state is often not even the natural state of the ecosystem. In
most cases, human activity has already altered this natural environment. Recent
data indicate that previous overfishing or overhunting could have weakened the
ecosystem to a state that would have allowed for a faster collapse (Jackson et al.
2001; Jackson 2001, Rick and Erlandson 2009). Since fauna and flora are subject
to continuous environmental changes, it is difficult to establish the natural condition
of a species or ecosystem prior to significant human alteration unless long term
records are available (Lyman 2006). A long term ancient DNA study, including
archaeological and if available palaeontological data has the ability to reveal the
true baseline for a species population size, density and genetic diversity. If carried
out as an interdisciplinary project, including both archaeological data and modern

24
conservation biological data, the project would have the ability to determine not
only this urgently needed baseline but also the changes of this population over
time, independent of climactic changes (Butler 2003). Accurate baseline
information would help policy makers in long term planning, especially when facing
severely depleted ecosystems and current climate changes.
Finally, Jackson and others point out that assumptions about ‘natural’
ecosystems depend on people’s needs as well as expectations based on previous
knowledge (Jackson 2001, Jackson and Johnson 2001). Archaeological data might
adjust these expectations by revealing the original baseline, thus demonstrating
“what could be” and aiding in economic and ecological decision-making.
Archaeological and Ethnographic Record
The whale bones analysed in this study are associated with the Nuu-chah-
nulth on the West Coast of Vancouver Island, British Columbia, and reflect the
life-ways of past people. In order to put the samples into an appropriate
archaeological context and to correctly interpret the ancient DNA data, the
following section discusses the archaeology and ethnography of the dataset.
The geographic focus of this study was the traditional homeland of the Nuu-
chah-nulth, who have a long history and extensive tradition in connection with
whales and the hunting of whales.
Archaeological research has demonstrated continuous settlement and the
use of whales for more than 4000 years (Arima et al. 1991, Inglis and Haggarty

25
1986, McMillan 2009), allowing this research to investigate past whaling
practices prior to industrial whaling, European contact, and the use of modern
technology. The following section deals with Nuu-chah-nulth archaeology and
ethnography at Barkley Sound.
Nuu-chah-nulth History at Barkley Sound
The Nuu-chah-nulth people are part of the Northwest Coast culture area
which reaches geographically from today’s southeastern Alaska to southern
Oregon (Suttles and Jonaitis 1990). The Northwest Coast is culturally and
linguistically distinctive with 16 languages from five different language families, a
variety not seen anywhere else in Canada. Numerous groups live in the Northwest
Coast area; Nuu-chah-nulth, Kwakwaka’wakw and Coast Salish share Vancouver
Island (McMillan and Yellowhorn 2004). Nuu-chah-nulth territory reaches from
Cape Cook in the north, all the way along the West Coast of Vancouver Island to
just south of Barkley Sound, bordering in the north on Kwakwaka’wakw territory, in
the south on Ditidaht territory and in the southeast on Coast Salish territory
(McMillan 1999, Arima et al. 1991, Sumpter et al. 2002). The name Nuu-chah-nulth
was only adopted by the tribal council in 1978. “Nootka”, a term introduced by
Captain Cook was previously used for people all along the west coast of
Vancouver Island (McMillan 1999).
Archaeological research in Nuu-chah-nulth territory has traced human
settlement back to at least 5000 BP (McMillan and St.Claire 2005). Almost all of

26
the oldest sites in Nuu-chah-nulth territory are situated on the outer coast
(McMillan and St.Claire 2005). Due to the sea level changes over the past 10 000
years, sites older than 5000 BP may be either below water or further inland than
today’s shore line (McMillan 1999, 1998). Research in other areas of the West
Coast has suggested human occupation reaching back to 8000 BP (McMillan
1999, Hobler 1990, Carlson 1996). The sites excavated so far, however, in
conjunction with ethnographic data, yield an impressive amount of data.
Based on archaeological material excavated at Yuquot in Nootka Sound and
Hesquiat just south of Nootka Sound, Mitchell (1971,1990) coined the term “West
Coast culture type” to describe the common traits visible in the material culture of
the area. While Dewhirst originally believed this culture type to be continuous and
relatively static, later research has revealed variations and additions to the original
set of characteristics as well as variations over time and space (McMillan 1999).
The West Coast Culture type is typified by a relative lack of stone tools,
especially in later periods. Archaeological excavations at sites in Barkley Sound
have found cultural deposits similar to sites in the Strait of Georgia prior to
2000 BP (specifically Locarno Beach stage) and West Coast culture deposits after
2000 BP (McMillan 1998). The most commonly preserved tools in Barkley Sound
are made from bone and shell and are associated with fishing gear, indicating a
specialisation in marine resources. Implements of wood and bark, were not
preserved in archaeological record except at wet-sites such as Ozette and Nitinat
Lake Site (McMillan 1998, 1999). Ozette was a major Makah village on the
Olympic Peninsula, in Washington State. The village was buried under a mudslide
27
around 300 BP and yielded remarkable amounts of fauna, flora and material
culture. Organic material such as basketry and hunting gear were particularly well
preserved. As McMillan (1998) points out, the lack of preserved wooden and fibre
artifacts in many archaeological sites may mask a major part of Nuu-chah-nulth
material culture variation through time. Excavations at Ozette suggest that basketry
might be a better indicator for local variation and group affiliation (McMillan 1999,
Croes 1977).
Archaeological and ethnographic records indicate that people in Barkley
Sound changed settlement patterns from year round occupation to seasonal
settlements (McMillan 1999, McMillan 2009). It is unclear when the seasonal
pattern of movement between winter and summer villages developed. Sites such
as Ts’ishaa and Ch’uumat’a, for example, exhibit the oldest excavated deposits in
Nuu-chah-nulth territory, and analysis of the archaeological remains suggest a
year-round settlement (McMillan and St.Claire 2005). The pattern of bi-annual
movement seems only possible after the amalgamation of groups that expanded in
territory (Arima et al. 1991, McMillan 2009). Just prior to or around the first contact
with European explorers, war led to amalgamations, and to the ethnographically-
known territories (St. Claire 1991), substantially changing the political picture in
Barkley Sound. Several of the local groups living in Barkley Sound, were either
incorporated or destroyed by the winning party, with some groups fusing because
small groups of survivors were unable to defend themselves and other groups
disappearing completely, leaving almost no traces in the ethnographic record
(McMillan 1999, 2009).

28
The first recorded contact with European traders and seafarers on the
Northwest Coast was in 1774 (St. Claire 1991, McMillan 1999). Between 1774 and
1795, a more or less continuous contact took place through the trade of sea otter
pelts. After the decline of sea otters in the region, contact ceased for almost 70
years before Euro-Canadians permanently settled in the area. Disease and
conflicts between European seafarers and traders, and the local Nuu-chah-nulth
groups decimated the native population in Barkley Sound. From an estimated 25
000 in 1774, the population dropped to about thousand in the late 18th century
(McMillan 1999, Arima et al. 1991, McMillan 2009).
Society
Northwest Coast cultures have been described as stratified and ranked
semi-sedentary hunter-gatherer societies (McMillan 1999, Ames and Maschner
1999, Arima and Dewhirst 1990, Drucker 1951). The lowest class, people without
any rights, were slaves who could make up to 25% of the society (Ames and
Maschner 1999).
The local group, comprised of the chief and his extended family, was the
basic political unit (McMillan 2009, McMillan and St.Claire 2005, Drucker 1951).
Local groups were able to trace their heritage back to one common ancestor.
Marriage between groups fostered widespread social networks, which allowed
individuals to move between groups by switching residence (McMillan 1999). This
pattern was also important in trade and for defence. Allied groups also sometimes
shared winter villages (Drucker 1951). Despite some cultural and linguistic

29
differences, Nuu-chah-nulth, Ditidaht and Makah shared essentially a common
culture (McMillan 1999).
The household was the main economic unit, containing several related
families, and usually between 30 and 40 people (McMillan 1999). Chiefs were the
heads and owners of a household but their prestige depended on the productivity
of the unit. Ideally, a chief was the eldest son of an eldest son. Chiefs were seen
as elders rather than monarchs but their authority and power was real (McMillan
1999). Commoners had no property and no rank and thus could move easily
between groups and villages. They often were skilled trade workers, their skills
being handed down for generations in the family. Special skills were courted by
chiefs, sometimes allowing common individuals to gain prestige (McMillan and
St.Claire 2005). Chiefs owned hunting and collecting grounds, and gave access to
relatives and followers as needed. Importantly, the first harvest and the first hunted
animal of the season belonged to the respective chief (Monks 2005). Similarly, drift
whales were property of the local chief; in some cases, drift whales could lead to
altercations between chiefs when the location or source, for example as a result of
an attempted hunt, was disputed (McMillan and St. Claire 2005).
Chiefs were ranked within each village as well as the region. The higher the
rank, the more display was needed during potlatches. A chief from an outer coast
whaling village and his descendants generally had highest ranking position in
potlatch (Drucker 1951, Kirk 1986). The system of inheritance was based on
primogeniture, with chiefly rights and ranks being typically passed to eldest sons;
however, the rules regarding the sex and birth rank were mutable. Females tended

30
to inherit “portable wealth” like names, songs, dance and ceremony, and still
followed the patrilocal residence scheme, while male descendants inherited non-
portable wealth such as hunting grounds and locations for fish traps (St.Claire
1991, Drucker 1951).
For at least 5000 years, Barkley Sound was inhabited by people adapted to
a marine lifestyle. Fishing and collecting of marine resources contributed
considerably to the daily life and subsistence. The richness of marine species
available at Barkley Sound is evident in the archaeological record (Fredrick 2011,
Fredrick and Crockford 2005) One of the resources which permeated Nuu-chah-
nulth life on all levels was the humpback whale.
Megaptera novaeangliae
Cetaceans are comprised of the groups odontoceti (or toothed whales) and
mysticeti or baleen whales. Humpback whales are rorquals within the group of
baleen whales. Baleen whales are filter-feeders, inhaling large amounts of water
and pressing the water back out, catching krill and small fish between the baleen.
Eleven species of baleen whales in three families are known, including blue whale
(Balaenoptera musculus, the largest whale), grey whale (Eschrichtius robustus)
and humpback whale (Megaptera novaeangliae) (Clapham et al. 1999).
Megaptera novaeangliae (Borowski 1781) is the only member of the
Megaptera family. While it belongs to the Balaeonopteriadae (rorquals) family,
studies on the genetic relations between humpback whales and other

31
Balaeonopteriadea come to different results respectively depending on the loci
used (Sasaki et al. 2005, Jackson et al. 2009, Arnason et al. 1993). Like other
baleen whales, humpbacks exhibit throat grooves, allowing the whales to extend
the volume of their mouth during feeding. These grooves reach from the lower jaw
to the area around the navel, depending on sex and species. The body of M.
novaeangliae is shorter and rounder in build than other baleen whales. The fluke of
a humpback whale is easy to distinguish by its serrated edge, and the flipper grows
to about 1/3 of the entire body length. The body color is usually black with a white,
or a variation of black and white lower part. The variation of the fluke color is used
for individual identification, especially for photo identifications. Humpback whales
exhibit protuberances, with hair follicles around the face which are a unique feature
to this species.
While all humpback whales belong to the same species, some variation has
been described between populations in terms of body color and length. According
to Slijper (1979) North Pacific humpback whales are generally darker and a bit
smaller than those in the southern oceans. Due to the overlap in phenotypic
variation, however, these two attributes are not sufficient for distinguishing
membership in a particular population. Several studies have reported cultural
transmission of behaviour, suggesting that further inter-group interactions not
directly observable must be happening (Ramp 2010, Canning et al. 2011). Canning
et al. (2011) report that certain behavioural traits seem to be based on cultural
transmission, in the case of their study feeding and rolling behaviour. Investigating
the evolution of whale songs, Garland et al. (2011) report that the songs change

32
every year and are ocean specific, although not population specific as the variation
was observed to travel from one population to the next, in some cases crossing
ocean basins.
Humpback whales have between 350-370 black-brown keratinous baleen
on each side of their upper jaw with a length of about 60cm (Slijper 1979, Winn and
Reichley 1985). This enables them to feed on krill, plankton and schools of small
fish like mackerel, anchovy and herring. Humpback whales inhale large amounts of
water with their food. Feeding occurs at the summer grounds and to a smaller
extent during migration. Otherwise, humpback whales are fasting and accessing
the energy stored in their fat deposits called blubber. Slijper (1979) notes that
whales that were caught in their winter grounds, or on their way to the summer
grounds yielded considerably less fat and oil, supporting the notion that whales live
off of this energy for most of the year.
Female humpback whales are up to 1.5 m longer than male humpback
whales exhibiting body lengths of up to 19 m, and average lengths of around 14-15
m. The body weight can reach up to 53 t (Reeves and Kenney 2003, Perrin et al.
2002). Adult female humpback whales have a birth interval of two to three years.
Humpback whales either mate on their way to or at the winter breeding ground.
The gestation period is about 11.5 months and calves are usually born at the
winter breeding grounds in tropical waters. While most calves are born mid-winter,
some births occur during migration, before reaching the breeding grounds (Perrin
et al. 2002). Humpback whales return to their birth ground on a regular basis,
especially female whales, who return for the birth of their offspring. Newborn calves

33
stay close to the mother and are nursed for about a year; during the last six
months, calves also feed on solid food. A newborn calf is between four and five
meters long, and both male and female whales are seen to protect calves when
necessary. Sexual maturity is reached at about five years while physical maturity is
reached at about 14-30 years (Slijper 1979, Reeves and Kenney 2003, Perrin et al.
2002). The life expectancy of humpback whales is unknown. However, some
harpoon heads embedded in modern whales have been dated to at least 80 years,
indicating the longevity of these mammals.
The history of whaling
While species and modes of hunting have been analysed from the
archaeological record and oral tradition, little is known about how and why people
started to hunt large sea mammals. The transfer from using stranded to hunted
whales is especially difficult to discern. Various indigenous coastal groups around
the world claim to be the first whalers. This section provides a short survey of
whaling practices worldwide.
Multiple regions have evidence of whale use but no evidence of active
whaling. For example, the faunal material of archaeological sites in Tierra del
Fuego included (<1% NISP) whale bones dating as far back as 7000 BP uncal.
(Piana 2002). However, archaeologists have concluded that the technology used,
including the canoes and harpoon heads found in those sites excludes large
cetaceans from being actively hunted (Piana 2002). Sites in Alaska and Greenland

34
as well as the Okhotsk Sea have been dated to 2000 years and older. Befu and
Chard (1964) report whalebones in shell midden and pictures of whales on artifacts
and harpoon heads from Okhotsk Sea sites that could have been used for whaling.
The culture lasted from “centuries before Christ until the 17th century” (Befu and
Chard p.14) when the sites were abandoned. Arctic whalers in Greenland and
Alaska have been linked to sites dating as far back as 2000 years (Reeves and
Smith 2007, Savelle and McCartney 1999). Furthermore, several Thule sites in
Nunavut indicate a whaling culture that is at least 1000 years old, with houses
using whale bones as building material, as well as artifacts made of whale bone at
sites dating AD1200-AD1600 (McCartney and Savelle 1985). Meanwhile
archaeological material from Prince William Sound, on the south coast of Alaska,
includes sperm whales as well as unidentified baleen whales dating back to
4400 BP (Yarborough and Yarborough 1998). Finally, in South Korea, Rock Art at
Bangu-Dae believed to be 6000 years old includes numerous depictions of whales
including whaling activity (Lee and Robineau 2004). A nearby site contains a large
amount of whale bones and was occupied between 5000 BP and 1500 BP (Lee
and Robineau 2004). However, the difficulties in dating rock art makes these dates
somewhat unreliable. In addition, the depiction of whales or possible whaling in
cave art is an indirect line of evidence at best. Still, similar cave art has also been
found on Vancouver Island, suggesting that it might be possible to infer the cultural
importance of whales in these places (Canadian Rock Art Research Associates
1979).
In later centuries, after the 16th century several additional groups took up

35
whaling after being in contact with foreign whalers from Europe or North America.
Groups on the Lesser Antilles, Equatorial Guinea and the Philippines used whaling
technology that was likely introduced by whalers in the fifteenth century (Reeves
2002). A similar result has been reported from Tonga (Kandel and Conard 2003,
Reeves 2002) In the North Atlantic, archaeological sites containing cetacean
elements have been found in Scotland and the Outer Hebrides from the Mesolithic
onwards, with an increase during the Bronze Age and Iron Age (Mulville 2002a).
Interestingly, a study in an African site revealed only evidence for scavenging
whales in a location with frequent drift whale presence, but no evidence for active
whaling (Kandel and Conard 2003). In most cases, the onset of whaling cannot be
determined accurately, mainly because clear indicators are unknown or disputed
(Monks 2005, Savelle and McCartney 1999, Mulville 2002b). While whaling has
been a subsistence practice of people worldwide, secure evidence of active
whaling is scarce and mostly within the past 2000 years.
The history of modern whaling
Whale hunting is practiced in all regions and all oceans (Reeves and Smith
2007). Industrial whaling moved geographically from the North Atlantic over the
South Atlantic and Greenland, to the South Pacific and finally to the North Pacific.
Commercial whaling began with the Basques during the eleventh century (McLeod
et al. 2008, Jenkins 1971, Baldwin et al. 2010). Whales were not only hunted for
personal use and consumption, but also for their tradeable materials such as oil,
baleen, skin, bones, and whale meat which was considered fish and was allowed

36
in Catholic populations for consumption during Lent. Basque whalers mainly
hunted bowhead whale with small boats and hand held harpoons in the Bay of
Biscay (McLeod et al. 2008). Within 200 years, a decline in whales, the first known
record for a decline in local whale populations, led to an expansion of whaling
efforts to Greenland in the fourteenth century (Frost 1978, Francis 1990). By 1550,
bowhead whaling operations reached Labrador (McLeod et al. 2008, Frost 1978).
This time, other nations started to hunt whales, including the Dutch, British and
Norwegian fleets. During the eighteenth century, whaling was also conducted by
American and Japanese whalers (Reeves and Smith 2007, Tønnessen and
Johnsen 1982).
Industrial whaling is usually separated into old style whaling, using sail boats
and hand held devices for both shore based and pelagic (open sea) whaling, and
modern whaling, using steam powered ships and later, grenade harpoons (Reeves
and Smith 2007). The modern harpoon gun was developed by Sven Foyn, a
Norwegian whaling captain around 1864 (Tønnessen and Johnsen 1982). The gun
could be mounted on deck and equipped with a grenade that would explode on
impact (Tønnessen and Johnsen 1982, Webb 1988). Early pelagic whalers
stripped the blubber off the whale (a practice referred to as “flensing”) while
keeping the whale in the water next to the boat. After 1920, new factory ships could
haul the entire whale on board to process the carcass. With the invention of large
factory ships that allowed the dismemberment of whales while on the sea, vessels
were able to stay in pelagic waters for months at a time (Tønnessen and Johnsen
1982). Where possible, the whale oil was produced immediately by cooking the

37
blubber on board, as the oil was easier to store and longer lasting than the blubber
itself. Whale oil was one of the main products used in Europe and North America,
with different qualities depending on the whale species (Tønnessen and Johnsen
1982). At the beginning of the nineteenth century, the whaling industry in America
was producing almost 15 million gallons of oil per year, mostly used as fuel in oil
lamps (Bardi 2011, Starbuck 1878) but production later declined. Even with the
introduction of modern whaling technology towards the end of the nineteenth
century, it was impossible to repeat profits gained in the earlier years, because
whale populations had been depleted.
While whaling in the Atlantic started in the fifteenth century, the Pacific
whaling industry only developed during the eighteenth century. The first whaling
vessels to enter the Pacific in 1787 operated off the coast of Chile (Tønnessen and
Johnson 1982). From there, operations moved northwards towards California,
Japan, Canada and lastly, Alaska. Until the sixteenth century, whaling in Japanese
waters was subsistence or small scale commercial whaling. For a long time,
Japanese whalers hunted with nets, or bows and arrows, but in most cases relied
on drift whales (Hidemura and Fujimoto 1978 as cited in Kalland and Moeran
1992). Smaller cetaceans, such as dolphins and pilot whales, were caught ad hoc
with this method or driven into bays and towards the shoreline (Kalland and
Moeran 1992). Active whaling using harpoons started in the sixteenth century in
this region and net whaling was introduced in 1675 (Kalland and Moeran 1992).
For this method, whalers set their nets out on open water, waiting to attack
entangled whales with their harpoon.

38
Whaling grounds in Hawaii and Japan were discovered in 1820 by American
and British industrial whalers (Kalland and Moeran 1992). By 1845, almost 300
ships were based in the USA (Tønnessen and Johnsen 1982). A reduction in
whaling success by traditional Japanese whalers was noticeable within 10 years
(Kalland and Moeran 1992), which led to Japanese whalers turning to American
whaling methods. Whaling in Australia started in the eighteenth century, with
established whaling stations in New South Wales and Tasmania (Frost 1978). The
first deep sea whaling ship for Australia was built in 1805 after an abundance of
right and sperm whales were discovered off shore (Frost 1978).
In the North Pacific, modern industrial whaling started late with the discovery
of right whales in Alaska in 1848 (Tønnessen and Johnsen 1982, Kalland and
Moeran 1992). The first whaling station in the Northeast Pacific was build in San
Francisco in 1838, but coastal whaling in California did not start until 1854,
catching mainly grey whales. Traditional whaling methods lasted longer in the
North Pacific than in any other place because of the remoteness to Europe and the
North American east coast, and was only replaced by modern technology around
1900 (Tønnessen and Johnsen 1982).
The first whaling station on Vancouver Island was established in 1905 as
part of the Pacific Steam Whaling Company at Sechart in Barkley Sound
(Tønnessen and Johnsen 1982). While the first blue whale was caught in August
1905, the station did not commence work until the 1906 season because of
technical difficulties. Due to harsh weather during the winter in Barkley Sound, a
second station, Page’s Lagoon, was opened in the Georgia Strait, close to

39
Nanaimo, British Columbia. However, this station did not provide sufficient profit
and was closed three years later (Tønnessen and Johnsen 1982, Nichols et al.
2002). The two other whaling stations on Vancouver Island were built in Kyuquot
and in Coal Harbour, both located on northern Vancouver Island, in 1907 and 1948
respectively. At that time, Kyuquot was considered the “’world’s largest whaling
station’ with a 50% greater capacity than Sechart” (Tønnessen and Johnson 1982,
p116). Two more stations were built by the Queen Charlotte Islands Whaling Co.
on the Queen Charlotte Islands: Rose Harbour and Nade Harbour. Sechart in
Barkley Sound operated between mid-April and late October/early November. Very
soon, humpback whales were the main species caught (Nichol et al. 2002). The
main product was again whale oil, with some whale meat exported to Japan. The
Sechart whaling station caught, with over 75%, the highest amount of humpback
whales along the Canadian coast (Nichol et al., 2002). However, in 1917 the
whaling station in Sechart closed; most of the other stations closed between 1941
and 1943. Only Coal Harbour operated until the ban on commercial whaling in
1967. In total, whaling stations off Vancouver Island processed over 25 000 whales
(Nichol et al. 2002).
An improvement in technology and knowledge about whale distribution did
not help the whaling industry to repeat their previous success, even during the
increase in demand for whale oil during the First World War (1914-1918).
Tønnessen notes that later whaling operations off the shore of Mexico caught
predominantly female humpback whales in a late state of their pregnancy, which is
considered an “example of the cynical and irrational destruction of whale stocks”

40
(1982 p. 327). The time between the First and the Second World Wars was again
marked by initial success with a sharp and fast decline in catch rates. Apart from
the obvious collapse in whale stocks, companies collapsed due to bankruptcy as
well, some within two years of their incorporation (Tønnessen and Johnson 1982).
While early attempts to regulate whaling failed, 21 countries signed the
Geneva Convention for Whaling in Geneva, Switzerland in 1931. This agreement
only regulated the catch of baleen whales and the language was rather unspecific
and was later replaced in 1937 by a new regulation which included specifics
regarding time and catch quota (Frost 1978). The International Whaling
Commission (IWC) was established in 1946 during the inaugural conference in
Washington DC, USA. The convention was signed during this meeting by all
pelagic whaling nations, with the goal to “provide for the proper conservation of
whale stocks and thus make possible the orderly development of the whaling
industry” (International Whaling Commission 1946). Since then, the function of the
IWC has been to establish and regulate catch quotas, as well as to oversee
conservation management of cetaceans and tighten measures of sustainability. In
light of an increase in whaling efforts during the 1960s, a moratorium on
commercial whaling was put in place in 1984 to allow whale stocks to recover
before sustainable whaling could resume. Over the past years, several countries
have pushed to end the moratorium at the yearly meetings, arguing that whale
stocks have recovered. The yearly meetings of the IWC are today dominated by
political rows about the commercial whaling ban, making any proposals next to
impossible to pass.

41
The International Whaling Commission (IWC) meets on a yearly basis,
monitoring research progress and continuing the dialogue between nations and
whaling opponents. Their memoranda are under fire since it was first implemented.
Countries like Iceland, Norway and Japan consider it their right to whale on a
regular basis. Japan in particular is featured on a regular basis in the international
press because their ‘scientific whaling’ is seen as a cover for industrial whaling
(Gales et al. 2005). Another problem are the catch quotas that are set for five years
by a scientific commission of the IWC, and during this process representatives for
the whaling industry who are constantly lobbying for an increase in quota. Also, the
trade of catch quota can be seen as a problem since this means that different
populations are affected. Finally, a major political problem is the definition of
‘traditional whaling’ by First Nations/Aboriginal groups. Whether a group is granted
whaling rights or not depends on how well they can convince the Commission of
their long standing tradition. Even if whaling rights are granted, the public often
disagrees (Sullivan 2000). Critics of the IWC complain about the ineffectiveness of
this organization, as well as the lack of actual power over offenders. For the past
five years, Japan and Norway have been trying to convince countries to re-
evaluate and subsequently abandon the ban on commercial whaling. Modern
conservation biology not only monitors wild populations, but has also reached out
to collect samples from meat markets to get a better insight on species and the
extent of these hunting efforts (Baker et al. 2000a, Baker et al. 2000b, Baker and
Palumbi 1994).
Today, only some traditional whaling groups are allowed to hunt a certain

42
quota, and only if listed under the aboriginal subsistence whaling scheme set out
by the International Whaling Commission. For example, on the Northwest Coast,
the Makah on the Olympic Peninsula have the right to hunt and on May 17, 1999
the Makah in Neah Bay successfully took the first grey whale in 70 years with the
permission of both the International Whaling Commission and the US Marine
Protection (http://www.makah.com/ whalingrecent.html, last accessed October 22
2010).
After thousands of years of hunting, industrial whaling managed to remove
an estimated 90% of the world’s humpback whale population in less than 200
years. However, recent years have witnessed a remarkable recovery of humpback
whale populations. With the increase in data analysed, a complicated network of
male and female humpback whale migration in the North Pacific has become
apparent. Current biogeography suggests that humpback whale populations have
retained their genetic diversity without any major losses; access and time depth of
archaeological material in Barkley Sound makes this region an ideal place to
investigate these suggestions by examining pre-industrial whaling population
genetic diversity.

43
Chapter 3: Material and Methods
Sample Provenience
The whale bones processed during this study were excavated in Barkley
Sound, Vancouver Island during two archaeological projects. The first project
included two adjacent sites on Benson Island, Ts’ishaa (DfSi-16) and Himayis
(DfSi-17). Benson Island is located in the northwest corner of the Broken Group
Islands in central Barkley Sound (Figure 1, location 1). Samples were selected
from both the Ts’ishaa main village and Himayis, excavated from 1999 to 2001
(McMillan 2009, McMillan and St. Claire 2005). The age of the samples ranged
Figure 1: map of Barkley Sound with excavated sites (adapted after McMillan and St Claire 2005) 1: Ts’ishaa (DfSi 16 and 17) 2:Huu7ii (DfSh7)

44
from 4500 BP to 200 BP.
Huu7ii (Figure 1, location 2, DfSh7) is located in the Deer Group Islands on
the eastern side of Barkley Sound. The site at Huu7ii was excavated in 2004 and
2006. Samples were excavated from a large house structure as well as the pre-
house floor. Sample ages ranged from 1500 BP to 500 BP. An earlier occupation,
located on a raised back terrace dated to 5000BP-3000BP, was not sampled
because zooarchaeological analysis had not been done on this part of the
excavated material at that time.
Ts’ishaa
Ts’ishaa was the main village of the Tseshaht, a Nuu-chah-nulth political
unit. The Tseshaht occupied the Broken Group Islands and the central portion of
Barkley Sound. The original homeland of the Tseshaht included Benson Island,
and the surrounding islands. Oral traditions indicate that the site of Ts’ishaa was
the main village of the Tseshaht people. Ts’ishaa was occupied for around 5000
years (McMillan and St.Claire 2005). Ts’ishaa was a year round occupied village
for most of its history, but by early historic times used as a summer camp only
when the territory expanded towards the mainland of Vancouver Island.
Ts’ishaa (#1 on figure 1) was comprised of the main village, including a back
terrace, and Himayis, with up to six subgroups of the Tseshaht located at adjacent
beaches. While the back terrace includes occupation components dating to the
mid- Holocene, Himayis was occupied by the lowest ranked group (McMillan and

45
St. Claire 2005).
According to ethnographic records, there were favourite whaling and sea
otter hunting areas in the islets around Benson Island. During the spring, migration
routes led grey whales past the Broken Group and Deer Group Islands (McMillan
and St.Claire 2005). While few grey whales entered Barkely Sound, humpback
whales would enter, especially in fall. According to Sapir’s informant (Sapir 1915),
humpback whales were frequently sighted at Alberni, Uchucklesaht, Effingham
Inlet and the upper sound area from October to March (McMillan and St. Claire
2005). Other areas were known as whaling spots, included Pigot Islet and Turret
Island; other areas carried names connecting these locations to whales, such as
Dodd Island (“where there are many whales”) or Gilbert Island (“whale oil here”)
(McMillan and St. Claire 2005, Sapir 1915).
European contact in the late eighteenth century led to dramatic changes in
the life ways of the Tseshaht. These changes, which had begun prior to European
contact, included increased warfare, reduced population, and population
amalgamations or absorption of groups, leading to larger territories in the end
(McMillan 2009, McMillan and St.Claire 2005, McMillan et al. 1982). At the end of
these amalgamations, by about 1815, Tseshaht territory included the entire Broken
Group Islands, as well as much of the central Barkley Sound coastline and Alberni
inlet. At this time, Ts’ishaa was used only as a summer camp, occupied between
May and August. The major winter village shifted to Hiikwis on the Sechart
Channel of upper Barkley Sound and then to the top of Alberni Inlet (McMillan
1999, 2009, St. Claire 1991).

46
Huu7ii
Huu7ii (#2 on figure 1), located on Diana Island in the Deer Group Islands in
Barkley Sound and is the ancestral village of the Huu-ay-aht people (McMillan
2009, St. Claire 1991). Huu7ii was initially recorded in 1984 (Mackie and
Williamson 2003, McMillan 2009) and was excavated in 2004 and 2006. Huu-ay-
aht territory is located in the eastern portion of Barkley Sound, including the Deer
Group Islands and the southeastern part of Barkley Sound. Diana Island is part of
the original Huu-ay-aht territory, but the current boundaries are much larger due to
expansion through amalgamations (McMillan 2009, Inglis and Hagarty 1986, St.
Claire 1991, Fredrick 2011). Locations of ten to twelve previous house platforms
were easily visible based on their flat surfaces, partially bounded by midden ridges
(McMillan 2009, p. 627, Mackie and Williams 2003). The occupation at Huu7ii
lasted from approximately 1500 BP to 400 BP (McMillan 2009, Fredrick 2011). The
site was abandoned prior to European contact (McMillan 2009, St.Claire 1991).
The elevated back terrace dates to 5000-3000 BP (McMillan 2009). Based on
these specifications, Huu7ii was occupied roughly at the same time as Ts’ishaa
and of a similar size. The excavation took place primarily on the largest house
platform, which is presumed to indicate the house with the highest social status
(McMillan 2009). Samples came from house floor as well from the “pre-house”
deposit below the house floor. No samples came from the back-terrace dating to
5000-3000BP

47
Samples
Ts’ishaa samples were zooarchaeologically analysed by Gay Fredrick and
Susan Crockford prior to this study (Fredrick and Crockford 2005). Huu7ii whale
bones were sampled by the author based on prior zooarchaeological analysis
recorded in a database. The site location data and zooarchaeological species
identification for samples used in this study can be found in Appendix A. While
samples were well preserved in terms of genetic material, the morphological
preservation was poor. Due to the fragmented conditions, most bones were not
identifiable beyond genus level; at Ts’ishaa, for example, only 874 of the 1541
samples identified as sea mammal were identified to at least the order level
(McMillan and St.Claire 2005). Out of samples identifiable to at least order, 254
were identified as cetacean (McMillan and St.Claire 2005). Samples classified as
“cetacean” or “whale” were selected for the ancient DNA analysis. Ts’ishaa
samples were selected to minimize possible resampling of individuals (McKechnie
2010 pers.comm.), although some samples were labelled “possibly same bone”.
No MNI (Minimal number of individuals) was established during the
zooarchaeological analysis (McKechnie 2010 pers. comm). The fragmentation did
not allow for the selection of specific skeletal elements, an otherwise common
practice in zooarchaeology to prevent sampling an individual multiple times (Reitz
and Wing 1999). The poor physical preservation can be attributed to the butchering
process as well as natural taphonomic processes. Only a few bones were of value
for artefact manufacture. However, most of the whale skeleton remained at the
beach and was discarded (Monks et al. 2001). The majority of bone material found

48
in middens was probably attached to blubber or meat distributed after the hunt
(Monks et al. 2001). Specimens excavated were identified as “whale” and only in
few instances was a species identification or re-connection of bone fragments
attempted. How many individuals are represented in this sample set may be
relevant because re-sampling of individuals would potentially create a bias towards
a haplotype, influencing the genetic diversity of the population.
The question of redundancy of the sample set was approached via three
different analyses. The initial approach was to establish the sex of each bone [a],
followed by a zooarchaeological review of two independent researchers [b]. Finally,
the location of the sample was matched with the genetic haplotype and the species
identification [c]. Results for [a] and [b] are discussed in Chapter 5; results for [c]
are discussed in Chapter 6.
Samples for DNA analysis were labelled with consecutive numbers, starting
with WH26. For the statistical analysis, sample labels were changed to PT
(Ts’ishaa) and PH (Huu7ii). The total dataset of 264 bone samples was comprised
of 163 samples (WH 26-WH 176) from Ts’ishaa and 101 samples (WH 180-WH
279) from Huu7ii. The age of the samples used over the course of the analysis was
provided by Alan McMillan and Iain McKechnie based on direct and indirect C14
dating and occupation times.

49
Method
Sample preparation and extraction
Prior to sampling, pictures were taken of each bone. Sampling of the bones
was done using a handsaw blade available in hardware stores. To avoid cross
sample contamination, blades were used only once and then disposed of, and the
work surface was wiped with a 10% bleach solution between samples. The same
procedure was applied to the sampling process at Simon Fraser University (SFU)
for the Ts’ishaa samples as well as the sampling process at the University of
Victoria for the Huu7ii samples. About 1.5g of bone was cut, bagged in new sample
plastic bags and stored at room temperature until use. Laboratory ID numbers
were assigned in consecutive order starting with the number 26 with the prefix WH
denoting whale. Sample numbers 1-25 were used during a previous study (Watt
2003). Samples that had been identified as “possibly one bone” in the Ts’ishaa
collection were designated by -1 and -2 (e.g. WH 176-1 and WH176-2). The cut
portion of the bone was taken into the decontamination room of the ancient DNA
laboratory (Fig 2, Chapter 4). After taking a picture of the bone fragment, the
samples were decontaminated. In spite of existing laboratory protocol, the sample
surface was not removed using sandpaper. After initial attempts, this step was
abandoned due to the fragile nature of the bones. Instead, the time the sample
remained in bleach and acid was increased. Bones were rinsed in UV-irradiated
HPLC H2O and incubated in 100% commercial bleach (Javex©) for 8 to10 minutes.
The bleach was discarded and the sample rinsed twice in UV-irradiated HPLC H2O
to remove residual bleach. An acid wash was performed by submerging the

50
sample in 1N HCl for one minute and then neutralising with 1N NaOH. A final rinse
in UV-irradiated HPLC H2O was performed after discarding the NaOH, followed by
soaking the bones in UV-irradiated HPLC H2O for about 5 minutes. After soaking,
samples were UV irradiated for 30 minutes, flipped and UV irradiated for another
30 minutes. Bones were then crushed and stored in 15 ml tubes (Sarstedt) at -
18°C .
The extraction procedure followed standard laboratory protocol (Yang et al.
1998): 0.5-0.7 g of crushed bone was incubated in 3.5 ml lysis (0.5 M EDTA, pH
8.5, 0.5% SDS, 0.5 mg/ml proteinase K) overnight at 50°C in 15 ml Sarstedt
reaction tubes. The tube lids were wrapped in Parafilm™ and further wrapped in
paper towel and foil to control for possible leakage. After incubation, samples were
spun and 3 ml of the supernatant was transferred onto a 4 ml Amicon 30 k filter.
Samples were spun until the supernatant was concentrated to ≤100 µl. The
duration of this step varied from 1 hour to 2.5 hours, depending on the sample.
After concentrating, 600 µl commercial PE buffer (QiaQuick PCR purification kit or
nucleotide removal kit) was added to the Amicon, and the resulting solution
transferred into a PCR purification silica based spin column and spun to bind the
DNA to the filter column.
The remaining steps followed the manufacturer’s protocol. The column was
washed in two steps using 500 µl of PB wash buffer each time. The column was
transferred to a new collection tube, and 100 µl of elution buffer was added. The
column with the elution buffer was incubated at 64°C until the solution started to
drip through the filter. The column was then spun at 13 000 rpm/ 15 871 x g and

51
the solution was transferred into a new 100 µl tube for storage. A second elution
was produced similarly and stored in a separate 100 µl tube. Both elutions were
stored at -18°C. If the second elution was discoloured, a third elution was produced
in an attempt to recover non-inhibited DNA. At least one blank control per lysis
master mix was included with each extraction and included in PCR amplifications.
PCR setup and amplification
For the PCR setup, a premix was used containing 1.5x Buffer, 1x MgCl,
dNTP, BSA and H2O. This premix was prepared, alliquoted and frozen in the
ancient DNA laboratory. This allowed for a continuous contamination control
between researchers and a quality control of the PCR premix. To prepare a master
mix, primers (15 pmol/ µl stock solution) and AmpliTaq Gold™ (Applied
Biosystems) were added to the premix. The final volume of a PCR was 30 µl with
5 µl of sample DNA, and contained 50 mM KCl, 10 mM Tris-HCl, 2.5 mM MgCl2,
0.2 mM dNTP, 1.0 mg/ml BSA, 0.3 µM of each primer, 5.0 µl of DNA sample and
2.5-3.5 U AmpliTaq Gold™ or AmpliTaq Gold LD™. Negative controls were
included with each PCR setup. PCR conditions were 10 minutes at 94°C, followed
by 60 cycles of 94°C at 45 seconds, 54/56 or 52°C for 30 seconds, and 72°C at 40
seconds and concluded by a final extension step of 72°C for 10 minutes (see
Chapters 5 and 6 for details). After the PCR reaction, samples were stored at -
18°C until further handling. The success of the PCR was analysed on a 2%
Agarose gel with a 100 bp ladder (Invitrogen) using SYBRgreen (Invitrogen) as

52
staining agent. Successful samples were purified using QiaQuick PCR purification
kit and eluted in 12-15 µl of the PE Buffer (Qiagen, Hilden, Germany). Purified PCR
products were stored at -18°C.
Purified samples were sequenced at Macrogen Ltd. in Seoul, Korea, and at
McMaster University in Hamilton, Ontario. To improve the reading quality, samples
were sequenced using sequencing primers designed approximately 5-10 bp into
the original PCR product.
Table 1: Primer used in this study
name 5'-3' length
Cyt B WL-F1 ATGACCAACATCCGAAAAACAC 22
WL-R182 GTTGTTGTGTCTGGTGTGTAGTGTATT 27
D-loop WL-F86 AATTCGTGCATGTATGTACTACCACTAA 28
WL-F167 CACCACGAGCAGTTAAAGCTC 21
WL-F22 CCACCATCAGCACCCAAAGC 20
WL-R258 TGCTCGTGGTGTARATAATTGAATG 25
WL-F360 TATGTATAATCGTGCATTCAATTAT 25
WL-R569 GCGGGTTGCTGGTTTCAC 18
WL-F101 TGTACTACCACATAACCAACTGATAGCA 28
WL-R308 ATCTAATGGAGCGCCCATAGAGATC 25
WL-F322 AGCATGCCGCGTGAAACCA 19
WL-R588 CTGAGTCCGTGCAAGCCC 18
Sequencing Primer
WL-Fn86 AATTCGTGCATGTATGTACTACCACATA 28
WL-F86s ATAGCACCTTCCATGGGTATGTATA 25
WL-F322s TTGGCAGGGATCCCTCTTCT 20
WL-R588s AATACCAAATGTATGAAACCTCAG 24
ZFX/Y WL-ZFXY F1.1 CACCAAGAAGAAGTACCGCTGTAC 24
WL-ZFXY R1.2 CGTGAGAGAAATGCTTCCCACAT 23
WL-ZFXY R2.3 ATTCAATAACCCTTGTTCAGCTGTC 25
WL-ZFXY R2.4 TTGCTGTGGACTGCCAAAAGG 21
WL-ZFY F2.2 GGTGCATAAGGAAAAAGGAGCT 22
WL-ZFX F2 AGGCCATTGAATGCGATGAA 20
SRY WL-SRY F2 GATCAGTAAGCACTTGGGATACGAC 25
WL-SRY R2 GTATTTGTCTCGGTGCATGGCTC 23

53
Sequencing Analysis
Sequences were analysed visually using ChromasPro© (Technelysium
Pty Ltd). After a manual control of the sequences, the overlapping sequences
were assembled in ChromasPro and compared to published modern sequences
in GenBank (http://www.ncbi.nlm.nih.gov/nucleotide/). Only reliable sequences
were included in the final alignment. Quality control included analysing double-
peaks and stutter pattern, comparing absolute height to background noise and
finally, comparing sequences to repeats. Unreliable sequences were either re-
sequenced, shortened or excluded, depending on the sample.
Finalised sequences were aligned using BioEdit©
(http://www.mbio.ncsu.edu/BioEdit/bioedit.htm). Phylogenetic trees were
calculated using BEAST (see Chapter 6 for details) with finback whale
(Balaeonoptera physalus, NC_001321.1/GI:5819095) as outgroup species,
based on the analysis of the mitochondrial genome by Sasaki et al. (2005). The
program jmodeltest (Posada 2009, Posada 2008) was used to choose the best
model for the tree using the Bayesian Information Criterion (BIC). BEAST tree
outputs were prepared using FigTree Version 1.2.3
(http://tree.bio.ed.ac.uk/software/figtree) The Bayesian skyline plot was also
computed using the BEAST software package, using a population set (“popset”)
for California as a reference population (Jackson et al.2009). BEAST analyses
were carried out on the Bioportal (www.bioportal.uio.no) cluster and the
computational biology service unit (http://cbsuapps.tc.cornell.edu,
Beast@BioHCP) at Cornell University.

54
Inhibition
Forty-five samples remained dark during the extraction and purification
process. The subsequent elution had a discoloration that varied between pale
yellow to black. These samples either failed to amplify during PCR, or only
amplified in low frequencies. The inhibitors present appeared to have similar
qualities to DNA as they would bind to the silica filter during the purification step
and only move past the filter when the elution buffer (EB) was added to the filter.
To test the hypothesis that the discoloration is a sign of inhibition,
successfully amplified samples were spiked with discoloured samples. PCR was
carried out as described above, but with the addition of potentially inhibited
extract. In all cases, even 1 µl of additional DNA led to a complete drop out of
PCR product. McGrath (pers. comm., 2010) used the discoloured whale samples
to spike artificial DNA in order to test the changes in the efficiency of the artificial
control sample. Even a dilution of 104 of the inhibited sample inhibited the PCR
reaction completely. In an attempt to remove the inhibitor, a repeat silica step
was carried out on previously extracted samples as described in Kemp et al.
(2010). In this case, repeating the silica purification step did not improve the
success rate of the inhibited samples. However, Kemp repeated the step up to 4
times, a variation which was not tested in this study (Kemp pers. comm. 2007).
WH43 was used for further tests to determine possible venues to remove the
inhibitor because a partial profile was obtained from this sample despite strong
inhibition and almost black first elution and discoloured second and third elution.
The first test increased the HCL incubation during the decontamination step to 5

55
minutes; the second test heated the decontaminated bone sample (0.5 g) to
85°C for 90 minutes. The heating step was tested because McGrath (2010)
hypothesised that certain inhibitors might appear during the heating process (e.g
Maillard products) and dissolve when heated further. This heating could have
occurred during oil extraction at the site (Monks 2001). Both samples were
extracted using the standard silica-spin extraction method (see Sample
preparation and extraction for details above). In addition, WH43 was extracted
using a DTAB/CTAB extraction method, the protocol based on Manen et al.
(2003), Gustincich et al. (1991) and Allen et al.(2006) and modified for the SFU
Forensics Laboratory by Jason Moore. Samples were incubated for 30 minutes at
65°C in DTAB Buffer (5.5% DTAB, 1 M NaCL, 70 mM Tris-HCL, 30 mM EDTA),
inverting the sample 3 times. After centrifuging the samples for 10 minutes at
4400 rpm the supernatant was transferred into a new tube and washed with the
same amount (in this case 700 µl per sample) of Phenol-Chloroform-
Isoamylacohol (25:24:1) twice, moving the top (aqueous) phase between steps
into a new tube. After removing the Phenol Chloroform Isoamylalcohol, 1200 µl
CTAB Buffer (0.5% CTAB, 40 mM NaCL) was added and the sample was
incubated at room temperature for 30 min. To pellet the DNA, the solution was
centrifuged for 5 minutes at 4400 rpm. After removing the supernatant, the pellet
was washed in 100 µl 1.2M NaCL and 250 µl 95% EtOH, followed by a wash
step in 70% EtOH. The solutions were centrifuged and the liquid was removed
between steps. After removing the 70% EtOH, the sample was dried at room
temperature for 1 hour or until dried completely. The DNA pellet was re-

56
suspended in 100 µl TE Buffer (10 mM Tris-HCL, 1 mM EDTA). The WH43
extract was still slightly discoloured, but most of the discolouration was removed
during the Phenol-Chloroform step.
Subsequent PCR amplifications comparing the three extraction variations
yielded results for the sample incubated in HCL for 5min and the sample
incubated at 85°C for 1.5h but no improvement for the sample extracted using
DTAB/CTAB and Phenol-Chloroform. While this was only an initial test, results
point to simple changes that could be incorporated if this problem arises in the
future to gain access to otherwise inhibited DNA. It should be noted that WH26
worked well and did not exhibit any inhibition in the first extraction, but was
discoloured in the second extraction. Repeated extraction of WH43 did not
change the inhibition of the sample. More research is needed in this area to
pinpoint the source of the inhibition as well as the optimal way of removal.

57
Chapter 4: Contamination Control and Ancient DNA Authenticity
Contamination and DNA damage are two of the limiting factors for
anthropological and archaeological studies involving ancient DNA (Mulligan
2006). To provide a measure of authenticity to ancient DNA research, control
points have been discussed over the past years (Pääbo et al. 2004, Hofreiter et
al. 2001b, Willerslev and Cooper 2005, Gilbert et al. 2003, Cooper and Poinar
2000). These points are considered guidelines rather than fixed rules, taking the
variability of ancient DNA research into account. Depending on sample age,
history and origin, authors agree that guidelines may be adjusted to be more or
less stringent as seen fit.
Guidelines for quality control and reliability of ancient DNA research have
been expanded and improved, and include strict contamination controls and
measures of authenticity. These guidelines (Gilbert et al. 2005, Willerslev and
Cooper 2005, Cooper and Poinar 2000) currently contain nine criteria to establish
authenticity of ancient DNA research as outlined below:
(1) An isolated work area with dedicated preparation and PCR set-up
room, separated from all post-PCR activities. This also includes dedicated lab
equipment to prevent carry-over of PCR products or modern DNA into the pre-
PCR area.
(2) Negative controls during extraction and amplification as a screening

58
process for contaminated set-ups, both for cross contamination between samples
as well as contaminated chemicals.
(3) Appropriate molecular behaviour which includes amplification of
shorter DNA fragments and a lower available template compared to modern,
non-degraded samples.
(4) Reproduction of samples should be part of the protocol to control for
deamination and amplification errors. The reproduction schedule should include
re-extraction and re-amplification of samples to ensure that the result is indeed
reliable.
(5) The cloning of PCR products is used frequently to ensure the reliability
of the sequence and control for damage and contamination (i.e. both should be
random and absent in the majority of clones).
(6) An independent replication in a separate laboratory helps to control for
ubiquitous contamination within a lab as well as problems with different extraction
and amplification protocols.
(7) The observation of the biochemical preservation of samples should
generally point to a better preservation of younger samples.
(8) A quantification of samples, today usually done with real time PCR, is
used to verify differences between ancient DNA samples and modern controls.
(9) Finally, associated remains can be used to establish preservation and
presence of DNA at a site. When working on human DNA in particular,
associated remains of animals, which are less prone to contamination, can be an

59
important line of evidence.
These key criteria have been published to help the researcher design
sound experiments and, at the same time help, readers evaluate a published
result, but they do not guarantee reliable results. Common sense and multiple
lines of evidence are needed to support the result established during the study
(Pääbo et al. 2004, Gilbert et al. 2005, Hofreiter et al. 2001b). Gilbert et al. (2005)
include questions that need to be asked when evaluating obtained results.
Researchers should explicitly include the background of the sample such as age,
environmental history and preservation of the sample to evaluate the likelihood of
DNA survival, the contamination risk of the sample, including handling history
and macromolecular preservation (Gilbert et al. 2005). Similarly, data should be
scrutinized against possible contamination, jumping PCR or other PCR errors.
Finally, an overall assessment of the data makes sense in order to see if there is
further evidence to support the result. These strict measures paired with a critical
self assessment help to distinguish authentic results from artificial results based
on contamination or DNA damage.
Contamination control
The ancient DNA laboratory at SFU’s Department of Archaeology is a
facility designated for ancient DNA analysis. Protocols and work-flow are
designed to prevent or detect possible contamination and are outlined below.
The ancient DNA facility at SFU is made up of two general areas: the

60
ancient DNA area and the post-PCR/modern DNA area. The ancient DNA
laboratory (Figure 2) is divided into three separate rooms for sample
decontamination, extraction and PCR set up respectively. A positive air-pressure
system is included to minimize the transfer of aerosol and dust contaminants
between rooms, and from outside the laboratory. Material and samples can only
be transported from the ancient DNA laboratory into the post-PCR laboratory;
they cannot be returned to the ancient DNA laboratory (“One-Way-Rule”). Lab
material and equipment introduced into the ancient DNA laboratory are, where
possible, subjected to bleach treatment prior to use. Sample tubes are
additionally UV irradiated prior to use.
When working in the ancient DNA laboratory, researchers must change
from street-clothes into scrubs designated for the laboratory. These scrubs are
only worn inside the lab and on the way between the change room and the
ancient DNA laboratory. This dedicated clothing includes a set of shoes, which
get changed again at the entrance into the laboratory. The same procedure
applies to the post- PCR laboratory. The post-PCR laboratory consists of one
room for all post-PCR work, and was located in a different building (Robert Brown
Building) than the ancient DNA laboratory. The post-PCR laboratory has been
relocated to Saywell Hall (still separate from the ancient DNA laboratory) in the
spring of 2008. The new facility, equipped with separate ventilation, can only be
accessed via a separate entrance. The same strict conditions apply to the new
facility, including the ban from entering the hallway of the archaeology
department after the use of the post-PCR laboratory. Scrubs used in the post-

61
PCR laboratory do not leave the area.
Protocols implemented at SFU
The strict separation of pre- and post-PCR work was observed during this
study. Pictures were taken in a separate archaeology laboratory area at SFU
prior to entering the ancient DNA laboratory. No modern whale samples were
extracted in the ancient DNA laboratory at any time. Individual bone samples
were stored in new plastic bags and transferred into the ancient DNA area for
decontamination (see Chapter 3, for details). Following PCR setup, the PCR
reactions were transferred to the post-PCR area. All further steps were carried
out in the designated post-PCR area. No material could be returned from the
Figure 2: Ancient DNA laboratory at SFU. Red arrows (solid) indicate positive pressure airflow. Blue arrows (dashed) path of samples. Material leaving the PCR set-up room will not be re-entered into the Decontamination room.

62
post-PCR area to the ancient DNA laboratory. The researcher had to shower and
change clothes before re-entering the ancient DNA laboratory. Plastic bags
containing material to be sequenced were placed in an additional clean plastic
bag upon leaving the post-PCR laboratory. The transfer did not pass the ancient
DNA laboratory and bags were not opened before shipping.
Internal contamination controls
Internal controls included blank extracts and negative controls as well as
extraction and amplification of different species within the same batches. The
contamination control set-up in an extraction was called “blank control”,
containing all chemicals but no sample. The contamination control set-ups in
PCR setups were called “negative control”, containing the complete master mix
without sample DNA. The blank control was handled last during all extraction
steps to maximize the potential of detecting cross contamination or carry-over.
PCR amplification negative controls were handled in the same manner. If PCR
set-ups contained variations of chemicals between samples, for example addition
of BSA, separate negative controls were included. Some PCR set-ups included a
variety of species, which were also used as a contamination control between
samples using whale primer. No whale or human DNA was amplified in the 155
negative controls (146 PCR setups for a total of 2099 PCRs) or in the 59 blank
extraction control amplifications.
Reproducibility
Because of the potential for contamination, or damage/degradation of

63
sample DNA, repeating extraction and PCR amplifications is necessary to
confirm species and sequence haplotypes. Sequences were confirmed through
repeated PCR amplification, repeated sequencing and overlapping primer
systems. Both species and D-loop haplotype were reproduced during this study.
Sequences were reproduced by repeated PCR and direct sequencing as well as
with the overlapping primer system in the case of D-loop sequences. The species
of all humpback whale samples identified using the cytochrome b fragment was
confirmed using the D-loop primers. Grey whale samples, and a portion of the
other species samples collected at Ts’ishaa were also reproduced using this
approach. The D-loop sequence was amplified using four overlapping primer-
sets. Twenty samples were re-extracted and partially re-amplified (Appendix B).
No discrepancy was detected between the cytochrome b and D-loop species
identification or within D-loop haplotypes.
Biochemical preservation
Older samples are expected to amplify less and exhibit more deamination
(Pääbo et al. 2004, Hofreiter et al. 2001a, Gilbert and Willerslev 2007, Banerjee
and Brown 2004). In this study, whale bone samples ranged from 5000 BP to
approximately 150 BP. The overall preservation of the samples was excellent,
but the rate of samples that yielded no amplifiable DNA increased from 9% in the
2000-0 BP group to 34% in the 5000-3000 BP group. Moreover, the presence of
amplifiable nuclear DNA, in addition to the high success rate for mtDNA
amplification, supports the observation that the samples at Ts’ishaa and Huu7ii
were well preserved.

64
Sequence alignments from the same individual sample were visually
examined for base pair ambiguities and sequence quality.
Overall, the archaeological whale bone samples displayed very good
preservation of amplifiable DNA, based on overall success rate and
reproducibility. At the same time, the proportion of samples that failed to amplify
was comparable to other studies. It was therefore not found necessary to quantify
the amount of DNA present.
Phylogenetic sense
Both the species identification and the D-loop sequence were analysed for
phylogenetic sense during the study. The species identifications were congruent
with ethnographic and biological records of the area; no non-cetacean species
were detected and no species detected were outside of their modern geographic
range.
Haplotypes identified either match current whale haplotypes or were
closely related to known haplotypes. Base pair changes of new unique
haplotypes were undisputed based on repeat sequencing and repeat extraction.
Samples that were not sufficiently reproduced were not included in the final
analysis (Chapter 6).
Cloning
Cloning has been used to identify deamination and contaminations. In this
case, all sequences could be confirmed through repeat amplification and
sequencing, including deamination and PCR errors. No mixed sequences or

65
repeat deamination cases were detected. Additionally, cloning is not considered
a necessary step in ancient DNA research anymore (Kemp and Smith 2010).
While previous research included bacterial cloning as a relevant part of the
authentication process, this method has become less common in recent years;
indeed, in some cases, labs have completely abandoned bacterial cloning,
especially with the advent of next generation sequencing (Kemp and Smith 2010,
Bollongino pers. comm. 2010). In a letter to the editor, Kemp and Smith (2010),
point out that no consensus has ever been achieved as to how many clones are
necessary to validate a sequence. In one of the most extreme cases, Krause et
al. sequenced 104 clones to find the Neanderthal sequence they were looking for
in two sequences (Krause et al. 2007). On the other hand, most research has
sufficient results with 5-10 clones per amplicon (Bollongino et al. 2005, Ludwig et
al. 2008, Orlando et al. 2003). Similarly, Malmström and colleagues found in a
dog/human contamination study that the consensus would not always lead to the
correct result (Malmstrom et al. 2005). Finally, some researchers suggest that a
simple repeat direct sequencing offers the same information as the more time-
intensive cloning (Orlando et al. 2003). Because of the unambiguous results
achieved and the lack of any indication that cloning would provide additional
information, sequences were not cloned for this study.
Authenticity of samples
Whale samples yield a lower risk of contamination than other species that
are represented in the cultural or environmental context of a laboratory, because
66
whales are not commonly used for food, clothing or the production of laboratory
chemicals (Leonard et al. 2007). The risk of contamination is higher when
working with food or commensal species such as pigs, cattle, dogs or cats.
Nevertheless, all analysis and protocols were considered non-discretionary to
ensure the authenticity of the obtained sequence and to protect the integrity of
the laboratory. As described above, samples were analysed in a dedicated facility
which included physical and organizational separated pre- and post-PCR work
areas. Analyses included extraction controls and negative controls. No
contamination was detected over the course of this study. Cytochrome b and D-
loop sequences were used as control for species identification in 180 out of 222
samples. While contamination can be difficult to detect (Kemp and Smith 2010,
Pääbo 2004), negative controls, implemented protocols and consistency of the
acquired sequences are lines of evidence supporting the authenticity of the
dataset.
Eighty-four percent of the samples yielded amplifiable DNA and 60 well-
preserved samples yielded amplifiable nuclear DNA. While these results
demonstrate the excellent survival of the DNA in this dataset, a comparison of
samples shows the higher success rate of younger samples over older samples.
Compared to 7.6% in samples dating to 2000-0 BP, samples found in layers
5000-3000 BP had a failure rate of 33% at Ts’ishaa. No difference in success
rate was found at Huu7ii (84% success; 16% failure) where all samples came
from layers dating to 1500 BP and above. The higher success rate of younger
samples supports the authenticity of the sequences analysed here,

67
notwithstanding some of the oldest samples (WH69) yielding excellent DNA.
Samples were not analysed using long fragments (i.e. >200 bp) except for
some well preserved samples; instead the overlap of primer systems was used
as a control. However, nuclear DNA was present, allowing for successful
amplification of sex identifying SRY and Zinc Finger fragments. None of the
results indicate that the success rate is unusual or unexpected, given the
relatively young age of the samples and the temperate to cool environment.
While not yet quantified, the presence of salt water does not seem to have had
an adverse effect to the survival of DNA.
The complete haplotype sequences were created with partially
overlapping primer systems. Samples were included in the final analysis if they
were sufficiently reproduced and yielded sequences from all primer sets. Some
additional samples were also included even if one of the primer systems was not
reproduced; that is, if it displayed a sufficient sequence quality and a haplotype
that matched previously detected haplotypes, it was included. The presence of
previously observed haplotypes and expected species provides strong support
that the sequences, including the new haplotypes, can be accepted as authentic.
In conclusion, established contamination controls including blank and
negative controls which helped to establish the absence of contamination during
the analyses, repeat sequencing and the rep-extraction of 10% of the samples
supports the authenticity of D-loop sequences and species identifications used in
this study.

68
Chapter 5: Species Identification at Barkley Sound and the Implications for Whaling Practices
Abstract
Excavations have uncovered vast numbers of whale bones from
archaeological sites in Barkley Sound, Vancouver Island. These sites were once
the villages of the Nuu-chah-nulth people, well known for their prolific whaling
capabilities. While whaling gear and harpoon heads embedded in whale bone
represent some rare direct evidence for active whaling, the vast quantity of whale
bones found in these middens provide indirect evidence in strong support of long
term active hunting. This chapter reports a new line of evidence that supports
active whale hunting in Barkley Sound for the past 5000 years.
A total of 264 whale bone samples from two previously excavated sites,
Ts’ishaa and Huu7ii, were analysed using ancient DNA techniques. Out of 222
successful samples, 79% were identified as humpback whale (Megaptera
novaeangliae). Grey whale (making up 13% of the samples) and other species
were also identified in the remains. The dominance of humpback whales over the
entire 5000 year assemblage, as well as the increase in species diversity in later
time periods, supports active whale hunting for at least 5000 years, probably
longer. These results are a strong line of evidence for the antiquity of whaling in

69
Barkley Sound and support existing archaeological and zooarchaeological
evidence.
Introduction
While industrial whaling is well documented in historical records, the
antiquity of traditional whaling by aboriginal whalers was not well understood until
recently. Reports from different locations around the world, including Great
Britain (Mulville 2002a) and South Korea (Lee and Robineau 2004), have
discussed evidence of whaling in each corresponding region. However, direct
evidence for whale hunting is either hard to date or absent due to the degradation
of the hunting gear. Only embedded harpoons or the presence of whaling gear
can strictly be counted as direct evidence. Indirect evidence, such as a large
amount of whale bones present at a site and oral traditions can be used as a line
of evidence in favour of active whaling. Since the use of whale bones does not
prove active whaling because these could also have been obtained through
scavenging beached whales, the practice needs to be considered tentatively.
While topics such as land mammal hunting and domestication are well
documented and analysed in the archaeological record, the hunting of sea
mammals and especially the hunting of whales remains less well known. While
whaling is an important part of Nuu-chah-nulth history, supported by
archaeological and ethnographic data, little data is available to the antiquity of
whaling. The whale species that were hunted are only known for the latest

70
period, based on ethnographic data. Archaeological identification of whale
hunting practices is difficult in general because, in most cases, only little direct
evidence is available (see Chapter 2 “Whaling”). The reliance on whales as a
resource and the importance of these animals to indigenous cultures has led to
questions about the origin and antiquity of whaling on the Northwest Coast. The
aim of this study was to shed light on the whaling practices at Barkley Sound and
to investigate the potential commencement of active whaling in the region, using
evidence generated from ancient DNA analysis.
This research is the first comprehensive ancient DNA study of whale
remains found in shell middens from the sites of Ts’ishaa and Huu7ii in Barkley
Sound. This section will survey Nuu-chah-nulth culture and the migration of
humpback whales in the region to create a context for the data presented within
this study.
This research was designed:
To investigate the species used at Ts'ishaa and Huu7ii;
To investigate changes of species diversity over time; and
To investigate the antiquity of whaling by Nuu-chah-nulth in Barkley Sound
based on species composition in the dataset.
The hypothesis of this research was that the onset of active whaling should be
visible as a change in species composition, even if zooarchaeological and
archaeological results are ambiguous. Species diversity should differ through
time depending on the mode of procurement of the specimens. A midden

71
collection of scavenged stranded whales should have higher species diversity
than a targeted hunted whale population.
The following background highlights the relevant ethnographic and
archaeological records in terms of whaling, as well as the natural occurrence of
whales in Barkley Sound, through migration and stranding.
The samples in this study were excavated from archaeological sites
previously occupied by Nuu-chah-nulth people. Ethnographic and archaeological
evidence provides evidence for marine resources, especially whales, being a vital
part of their culture and subsistence. As a resource, whales were both
advantageous, due to their size and recurring migratory activities, and
inconvenient as hunting whale was a dangerous task that required great skills on
the part of the hunter as well as his companions. Previous research has not been
able to trace direct evidence of whaling beyond 1200 BP, while
zooarchaeological research is sparse in terms of species use. Vancouver Island’s
prime location along major cetacean migration routes made it an ideal place for
whaling cultures.
Background
Ethnographic and Archaeological whaling evidence
Oral traditions and archaeological research have revealed a rich history of
Nuu-chah-nulth whaling practices. More than 1000 years ago, people on the
Northwest Coast of Vancouver Island were hunting whales from canoes with

72
hand held harpoons (McMillan 1999). Judging from the number of bones
uncovered at archaeological sites, whales were an important source of food, oil
and raw materials (McMillan 1999, Balasse 2002).
Based on the ethnographic and archaeological records, marine resources
were the foundation of Nuu-chah-nulth economy and subsistence (McMillan
1999). On a broad scale, the Northwest coast is rich in resources, though local
differences in terrain and general climatic fluctuations lead to variations in
resource availability (Ames and Maschner 1999, McMillan 1999). Such climatic
fluctuations in Barkley Sound made terrestrial resource availability less
dependable than in the northern sounds (Arima and Dewhirst 1990). Fish were
an important part of the diet, including bluefin tuna, rockfish, salmon, halibut,
lingcod, pacific cod, greenling, herring and red snapper (McMillan 1999). Sea
lion, harbour seal and porpoise were hunted, as were several birds, including
water fowl (McMillan 1999). While certain resources dominated the economy,
indigenous groups used their environmental resources more broadly. Other
marine resources exploited throughout the year included clams, mussels and
other shellfish, chitons, sea urchins, sea cucumber, crab, and octopus (McMillan
1999, Ames and Maschner 1999, Drucker 1951). During the winter, land
mammals were hunted opportunistically (McMillan 1999, Drucker 1950). Plant
resources such as salmonberries, cow parsnips, camas bulbs, tiger lily bulbs and
clover rhizomes were collected depending on the season. In fall, salmon, halibut,
clam and some plants were dried for winter reserves, as was whale to a lesser
degree, supplemented by fresh fish caught whenever the winter weather

73
permitted.
Whales were one of the main marine mammals hunted (Fredrick and
Crockford 2005). Whales such as grey whale and humpback whale migrate semi-
annually, which made them a generally predictable food source for the Nuu-chah-
nulth. While the main hunting season was spring and summer, humpback whales
were also present during the winter and in inlets such as Alberni Inlet, Ukluleshat
Inlet and Effingham Inlet between November and February (Sapir n.d. notebook
XVIII: 11-: in Monks et al.2001). In addition, beached whales (“drift whales”) were
used when available (Arima and Dewhirst 1990, Monks et al. 2001).
Whales did not only provide meat but also provided raw materials for tools
and supplies. An adult whale, weighting about 25-40 t, could provide meat and
blubber for the village as well as thousands of litres of oil which was a valuable
trading good. Huelsbeck (1988) speculates that the amount of blubber and oil
available from whales at Ozette must have led to a resource surplus. Whale oil
and sinew were important trade commodities exchanged with other groups for
resources locally unavailable in a group’s territory, such as salmon, and cedar,
which was used for canoes and house planks (Drucker 1950).
In addition to the blubber, oil and meat, the bones were also important
resources used as raw material for tools and architectural applications (Mulville
2002b). Not all bones were brought into the village; most of the whale skeleton
was left on the beach after being butchered (Monks et al. 2001, Monks 2003). A
few bones were taken for raw material while the rest were fragmented during
butchering and oil extraction (Monks 2003). The butchering of whales on the

74
beach instead of in the village is one of the reasons why the number of whale
bones found at sites do not accurately reflect the number of whales exploited by
these groups (Monks 2001).
Ethnographically, grey whales, and to a lesser degree humpback whales,
were the species associated with Nuu-chah-nulth and Makah whaling (Kool 1982,
Monks et al. 2001, Drucker 1950). Grey whales arrived in Barkley Sound earlier
in spring than humpback whales, which usually reached Barkley Sound in May or
June (with some humpback whale remaining in the region almost year round,
feeding on small fish in the inlet). Accounts by early explorers and ethnographers
describe the impressive numbers of whales present in spring and early summer,
during the migration and feeding season, which made manoeuvring small boats
and canoes challenging (McMillan 1999, Monks 2001, Sapir 1919). Being part of
the feeding ground, Barkley Sound may have been an ideal location for early
whalers.
Ethnographic and historical whaling records relate the different behaviours
of humpback and grey whales during the hunt. Humpback whales were described
as a slower and less aggressive species while grey whales were more
aggressive and defensive when attacked (Davis et al. 1997). Other whale
species were less available for various reasons. For example, right whales
(Eubalaena japonica) may not have been frequently available as Vancouver
Island is just outside of their current range (Gregr and Coyle 2009). However,
right whales are mentioned as one of the hunted species in later ethnographic
descriptions (Drucker 1950, Kool 1982). Sperm whales (Physeter

75
macrocephalus) and blue whales (Balaeonoptera musculus) generally do not
migrate close to shore; this shore distance, along with migration speed and body
size, made them more difficult to hunt using traditional shore-based whaling
techniques. Kool (1982) has suggested that humpback whales were the most
frequently hunted species in Barkley Sound, based on their unique migratory
behaviour. Additionally, humpback whales surface more frequently than grey
whales, making them more visible to whalers. This theory has been supported by
data from Toquaht, an archaeological site in western Barkley Sound where 78%
of the identifiable whale bones (N=83) were classified as humpback whale
(McMillan 1999, Monks et al. 2001).
For the people in this region whaling was a ritual activity. At the site of
Ozette, in Washington State, a large effigy of a whale’s dorsal fin, the “whaler’s
saddle”, was found with sea otter tooth inlays (McMillan 1999). This
archaeological find implies that some pre-contact whaling rituals were very
similar to those known ethnographically (McMillan 1999, Balasse 2002). Several
whaling shrines are known in Nuu-chah-nulth territory (McMillan 1999). Ritual
preparations were carried out prior to the first whale hunt of the season, and
included the whaler’s wife and family. Ethnographic research indicates that
whalers were prepared to leave for the hunt throughout the entire whaling season
in case of a whale sighting (Kirk 1986, Drucker 1950).
Whale lookouts were stationed on off-shore islands and at defensive sites,
as these would have had far-ranging views to detect the whales (St. Claire pers.
comm 2007). For Ts’ishaa, the open ocean side of Benson Island was also a
76
spot to observe whales. Whalers would leave after midnight or early morning
from outer islands with eight men in a 12 m long dugout cedar canoe (Drucker
1966). Whaling was directed by the chief, who was also the initial harpooner. His
canoe was often accompanied by a second boat for assistance, with both crews
comprised of male relatives and sometimes slaves (Drucker 1966). The main
boat was described by Drucker to contain eight men and specific places for each
item. The harpooner would be in the bow, followed by three paddlers on each
side and the steersman on the aft (Drucker 1966). The harpoon was placed to
the right of the harpooner. Three of the floats were placed on the inside, next to
the right paddlers who also had the function to secure a smooth deployment of
the lanyard that was attached to the harpoon (Drucker 1966). The toggling
harpoon was a three-piece construction: The toggling harpoon head with mussel-
shell blade was mounted on a heavy shaft of yew, 3-4.5 m long (Monks et al.
2001, Losey and Yang 2007). A valve made of two bone or antler pieces was
attached to the mussel shell blade (Monks et al.2001). The head was attached to
several meters of line which in turn was tied to a seal-skin float. This toggling
harpoon head would turn and detach from the shaft when driven into the whale
(Monks et al. 2001, Sproat 1987). Whales were approached in the morning at
daybreak (Sproat 1987). Whalers paddled alongside the targeted whale, which
was struck by the harpooner as soon as it submerged with the fluke towards the
canoe. The streersman would give notice of the right moment, followed by the
harpooners’ strike (Drucker 1966). As soon as a whale was harpooned, the men
would paddle backwards to avoid being struck by the whale. The floats attached

77
to the harpoon line served to keep the whale afloat and as marker to track the
whale in the water as it swam away (Sproat 1987). A second harpoon was used
after the initial struggle to add a second line and more floats to aid in securing the
whale (Drucker 1966). When the whale could no longer pull the floats
underwater, the hunters would move in. The canoe was paddled close to the
whale again, and the whalers used a barbless spear (“killing lance”) to kill the
whale. One crew member was chosen to dive under the whale and tie the snout
closed with rope to prevent the whale from filling with water and sinking. The
whale was then towed back to the village and butchered on the beach (Drucker
1951, McMillan 2009).
The whalers hoped the whale would swim towards shore and not out into
open water. However, they sometimes had to tow their catch over many
kilometres back to the beach. Towing the whale to the beach was a group effort,
especially over long distances. The endeavour therefore needed to be well
organised and efficient. Fanfare and communal feasting welcomed the killed
whale to the village, along with songs and promises to the whale that it would be
honoured (Kirk 1985, Drucker 1951).
At most sites in Barkley Sound, whale bones were found in virtually every
layer (McMillan 1999), indicating that whales had been exploited, at least
opportunistically, for as long as 4000-5000 years. As McMillan (1999) points out,
reliable whaling techniques would have supported a larger human population
density along the outer coast. In Barkley Sound, this may have been as early as
2000 BP, when the human population increased rapidly (McMillan et al. 2004,

78
Balasse 2002, St.Claire 1991). In 1785, an explorer named Walker noted that he
saw 11 whale skeletons on a beach that had been killed no more than a year
prior to his visit in Hesquiaht or Ahousaht territory (Monks et al. 2001). On a
different occasion, Banfield observed that the Makah and Ditidaht “kill a lot of
whales” (Arima et al. 1991). Accounts of 10 whales killed at the same time
(McMillan 1999) and whalers attempting to fill the channel between Benson
Island and Clark Island with whale bones as a monument of their achievements
(Golla 2000) have been reported as well. On the other hand, John Jewitt, who
was a captive in Nootka Sound in 1803, noted in his diary that out of eight hunted
whales, only one was killed over a period of 53 days in total (Jewitt 2000). While
several accounts indicate an overall relatively low kill rate during whale hunting
(Golla 2000), some of the whales injured but not captured during the hunt
eventually ended up as drift whales. In these cases, the group that benefited from
the drift whale may not have been associated with the initial hunters. The
beaches where drift whales might strand were carefully guarded as property of
the individual chief. Based on the size of the animal, any species of whale,
whether taken or as drift, would have provided a large amount of food for the
group.
Ethnographic research recorded seven different species of whale known
to the Nuu-chah-nulth (Monks et al. 2001). Humpback (Megaptera novaeangliae)
and grey whale (Eschrichtius robustus) were the most prominent species. Both
species migrated in spring and fall past Vancouver Island. Grey whales migrated
during the spring closer to the shore and swam slower, making this species

79
better accessible than during their migration in fall further off-shore (Monks
2001). Right whales, a species preferred for their slow swimming speed and high
oil content in other cultures was not commonly mentioned. Finback whale, in
some publications translated from the same word as right whale, was not
mentioned explicitly. It is possible that this species was lumped with other
species for various reasons. In addition to being the second largest whale
following blue whale, it sank when it died, as did humpback whale. Baird’s
beaked whales, the largest of the beaked whales, were known to people on the
Northwest Coast but considered inedible (Monks et al. 2001). Blue and sperm
whales were considered too large to hunt but probably would have been used
when beached. Finally, Orca whales (Orcinus orca) were considered good
tasting, but generally were dangerous and too fast and thus hard to hunt, making
them suitable only for hunters who had to prove their ability (Monks et al. 2001).
Notably, information that can be retrieved from the ethnographic accounts
is limited as most of this research occurred after industrial whaling had depleted
most whale stocks in the Northeast Pacific. In addition, species naming was not
always consistent. Finally, recording happened at a time when whaling was a
part of oral tradition and active whaling was no longer taking place (McMillan
2009). Nevertheless, these documents give an important insight into some of the
species known in the region.
Several theories have been brought forward to shed light on the origin and
age of active whaling. Some researchers speculate that active whale hunting
originated early on in the settlement of the Northwest Coast. Other theories state

80
that whaling developed later as a response to new ecological settings, and as an
adaptation to an open ocean environment. According to Drucker, whaling may
have emerged to provide a reliable subsistence resource in the face of food
shortages (Drucker 1950). Another hypothesis is that whaling developed before
people came to the Northwest Coast (Lantis 1940). In that case, people would
have brought their whaling techniques along when moving into the new territories
such as Vancouver Island.
There is some debate as to the initial motivation behind whaling practices,
whether for economic or prestige purposes (McMillan 1999, McMillan and
St.Claire 2005, Arima and Dewhirst 1990). Dewhirst has noted that whaling could
have been economically less important than currently assumed. On the other
hand, Huelsbeck (1988) concludes, on the basis of finds at Ozette in Washington
State, that whales could have accounted for up to 80% of the meat and oil
present or represented by faunal elements. As Yesner points out in the case of
Thule whaling, fewer bones per individual are found on an archaeological site
when compared to smaller animals (Yesner 1988), making a correlation between
zooarchaeological material and subsistence importance more difficult.
While convincing arguments regarding the whale’s economic importance
have been proposed (Huelsbeck 1988, Golla 2000), the reason for active whaling
as opposed to the use of beached whales remains speculative. Early indications
of whale material usage were observed in Yuquot in Nootka Sound, Vancouver
Island, where whale bones were found throughout the deposit. In addition,
barnacles were found in layers dated to 2000 years ago that are associated most

81
often, but not exclusively, with humpback whales. However, archaeologists were
not able to confidently identify the whale species present at the site, or to
determine whether these whales were actively hunted. Similar results were found
in Hesquiaht sites, located just south of Nootka Sound and in Toquaht Sites
(McMillan 1999). Currently, the oldest known potential evidence for whaling is a
humpback scapula with marks that could have been caused by a harpoon head
from Ch’uumat’a, in a layer dated to approximately 3000-2500 BP (Monks et
al.2001). Dewhirst (1978) has speculated the full development of whale hunting
technology at 1200 BP and younger, based on the appearance of toggling
harpoon valves. The fact that most hunting gear does not survive in the
archaeological record, makes definitive answers difficult (Monks et al. 2001).
However, the sheer abundance at sites in Barkley Sound can be considered a
strong line of evidence that Nuu-chah-nulth people in this region did not rely on
drift whales, but were engaged in whaling activities (McMillan and St. Claire
2005, Monks et al. 2001). The development of whaling this early is certainly
supported by the fact that Barkley Sound is located along the migration routes for
humpback and grey whales.
Humpback Whale Migration
The migration of sea mammals, specifically humpback whales, is an
adaptation to the environmental fluctuations of their habitat (Rasmussen et al.
2007, Clapham 2001, Corkeron and Connor 1999). The seasonal pattern of

82
ocean productivity, which is generally very predictable, allows for a steady
migration pattern over thousands of kilometres. Baleen whales are known as the
mammal with the longest annual migration route (Rasmussen et al. 2007,
Lagerquist et al. 2008, Straley et al. 2009). Except for one group of humpback
whales in the Arabian Sea (American Cetacean Society 2004, Mikhalev 1997), all
humpback whale populations migrate between cooler areas during the summer
months and tropical areas during the winter. North Atlantic humpback whales
migrate between Greenland and Iceland to feeding grounds in the West Indies.
Southern Atlantic whales migrate between Antarctic whaling grounds and Brazil,
Australia, New Zealand and possibly the west coast of Africa (Baker and
Medrano-Gonzalez 2002, Reeves et al. 2004). North Pacific humpback whales
are separated into three stocks: eastern, central, and western Pacific
(Calambokidis et al. 2004, Witteveen et al. 2004, Baker et al. 1998b). Since the
seasons are reversed between the Northern and Southern hemispheres and thus
the migration between warmer and colder regions is reversed, genetic exchange
between the populations is limited (Baker and Clapham 2004, Roman and
Palumbi 2003).
Despite earlier assumptions of an even ratio of females and males in
winter and summer, more males migrate to the breeding grounds than females in
order to mate (Brown et al. 1995). Migration patterns vary not only by sex, but
also by age and reproductive class. The energy requirements of the individual
during feeding and breeding times (Perrin et al. 2002) are considered the link
between migration and resource patchiness (i.e. the mix of high and low

83
availability of resources) (Clapham 2001, Corkeron and Connor 1999, Pomilla
and Rosenbaum 2005). For example, pregnant females migrate to the feeding
ground first, followed by immature whales of both sexes and adult males. The
migration to the breeding ground happens in reverse order, starting with adult
males. In addition to these different migration times, there is little pressure to
migrate for immature individuals and non-breeding females. Some individuals do
not migrate in a season or travel only part of the way (Rick and Erlandson 2009,
Alter et al. 2009, Witteveen et al. 2009). Wiley et al. (1995) point out that it might
be more adaptive for juvenile animals to stay in latitudes closer to the feeding
ground, rather than migrating all the way to the resource depleted breeding
ground. Thus, whales can be found in and around the feeding ground year round,
potentially creating the illusion of local pods.
Whale Stranding
Alternatively to active hunting, people have frequently been using drift
whales (also called stranded whales) (Monks et al. 2001). While the majority of
stranded marine animals belong to the class Cetacea (Perrin et al. 2002, Geraci
and Lounsbury 2005), baleen whales such as humpback whales are not
commonly beached onshore. Even so, humpback whale strandings are known,
and have increased in frequency since the 1980s. Wiley et al. (1995) link most of
these beaching cases to incidents associated with commercial fisheries or cargo
ships. The increased frequency may also be due to an overall increase in
population size or changes in the migration pattern (Perrin et al. 2002, Geraci

84
and Lounsbury 2005). Geraci and Loundsbury (2005, p107) report “the stranding
frequency of humpback whales on the Northwest Pacific Coast (including Alaska)
to an average of more than 1/year but less than 1/month”, which is less than the
grey or finback whale for example. The highest frequency of humpback whale
stranding is reported from the Canadian Maritime region, which suggests an
average of more than 1 per week (Geraci and Lounsbury 2005).
The reasons for whale strandings are diverse and not well understood
(Wiley et al. 1995, Mustika et al. 2009). Collisions with ships, entanglements, and
lesions from sonar use are some of the anthropogenic reasons for stranding. On
the other hand, weakness due to natural illness can cause whales to strand as
well. Lastly, some species such as killer whales strand themselves on purpose in
an attempt to catch prey. In these cases, the whale generally has the ability to
return to the ocean (Perrin 2009).
Modern observation of whale strandings and the species composition of
stranded whales is relevant to the current study because one of the questions,
especially in the absence of direct evidence such as embedded harpoon heads,
is whether a whale bone found in the archaeological record is likely a hunted or
more likely a stranded whale.
Material and Methods
The samples in this study were excavated from two archaeological sites
previously occupied by Nuu-chah-nulth people. Ancient DNA analysis was

85
applied to 264 whale bones from these two sites in Barkley Sound; 163 bones
from Ts’ishaa and 101 samples from Huu7ii. Samples from Ts’ishaa were dated
to 5000 BP to 0 BP (Appendix 1). Samples from Huu7ii were from the house floor
excavation and dated to 1500 BP to 200 BP. Ts’ishaa samples were selected
with the goal of sampling as many individuals and as few duplicates as possible
(Ian McKechnie personal comment, 2010). Similarly, Huu7ii samples were
selected based on zooarchaeological identification as “cetacean”, sampling one
bone per sample bag to minimize re-sampling individuals.
Ancient DNA analysis was carried out as described in chapter three. To
identify the species of a sample, PCRs were performed using primers targeting
133bp of the cytochrome b (cytB) gene on the whale mtDNA (Table 2, Figure 3).
Cytochrome b is a conservative gene which is commonly used for species
identification. PCR was carried out in 30 µl reactions per sample, as described in
Chapter three. The PCR was run under the following conditions: 94°C/ 5min
followed by 60 cycles of 45s at 94°C, 30s at 54°C and 40 seconds at 64°C. The
final extension was at 72°C for 10 minutes. Samples were stored at -18°C until
further processing. Presence of PCR amplicons was established on a 2%
agarose gel with SyBrGreen stain. Positive PCR reactions were purified using a
Qiaquick purification column (Qiagen, Hilden, Germany) following the
manufacturer’s manual. Samples were sequenced at McMaster University’s
sequencing facility and at Macrogen Ltd. in Seoul, South Korea using either the
forward or reverse Primer (Table 2).
Results were visually edited and species identification was confirmed

86
using the NCBI database tool BLAST using the blastn algorithm, along with
phylogenetic analysis of other closely related species in Bioedit (Fig 3). All
humpback whale samples were also confirmed with the D-loop sequence (see
Chapter 5).
Sex identification was attempted using SRY and ZFX/Y co-amplification to
estimate a minimum number of individuals. The sex determining region Y (SRY)
is located on the Y-chromosome. The SRY gene encodes the male sex
determining SRY protein (with testis as the determining factor). The Zinc Finger
gene (ZFX/Y) used in this study is located on both the X and the Y chromosome.
Primers for sex identification were designed to amplify different lengths
depending on the ZFX or ZFY binding position, using one general and two
specific primers (X and Y) per reaction. The goal was to create an
electropherogram-based sex identification based on the presence or absence of
the SRY band with an additional ZFX/Y length polymorphism as positive control.
SRY was only sequenced to confirm that the amplified sequence was indeed
whale SRY.

87
Figure 3: Cytochrome B alignment of species identified in Barkley Sound.
GenBank Sequences (see accession numbers next to species) for this alignment.
Table 2: Cytochrome b Primer used for species Identification.
Name 5'-3' sequence Length Frag.
Length Location*
WLF1 ATGACCAACATCCGAAAAACAC 22bp 182/133bp
14206-14225
WLR182 GTTGTTGTGTCTGGTGTGTAGTGTATT 27bp 14361-14387
* Location based on humpback whale sequence X75584 (Sasaki 2002)
Results
Out of 264 whale bone samples processed in total, 222 yielded amplifiable
DNA. This constitutes an overall success rate of 83.3% for all samples. The
analysis established a species identification for 138 (84.6%) out of 163 samples
of the Ts’ishaa samples and 84 (83%) out of 101 of the Huu7ii samples. Well
preserved samples yielded an mtDNA fragment length of 300 bp (covered by
F101/R569), and the amplification of nuclear DNA for sex identification

88
demonstrated excellent preservation of DNA. Samples that did not yield
amplifiable DNA were classified as “no species ID” in the tables. Species
diversity was calculated excluding these failed samples.
Forty-five (17%) out of 264 samples remained discoloured after the
purification and final elution. The discoloration varied from a light tint to black,
and could not be removed by repeated purification steps as described in Kemp et
al. (2006). PCRs of discoloured samples were generally at least partially
inhibited. However, in some cases a second clear elution was obtained and
yielded amplifiable DNA. Discoloured samples WH43 and WH175 and WH185
were used to spike artificial DNA samples that had previously amplified and run
in a real-time PCR setup to determine the extent of the inhibition. The whale
samples completely inhibited the amplification of the artificial DNA, even when
diluted 1:10 (McGrath, pers comm 2010) (see Chapter 3 for more details).
The species distributions at the two sites can be found in Table 3. Out of
the 222 samples identified, 78.8% were identified as Megaptera novaeangliae. At
Ts’ishaa, 76% (105/138) of the identified samples were humpback whale,
whereas 83.3% (70/84) of identified samples at Huu7ii were humpback whale.
The second most common species was grey whale, accounting for 13% of all
identified samples.

89
Table 3: Species distribution at Ts'ishaa and Huu7ii.
Ts’ishaa Huu7ii
Species N %* N %*
humpback whale (Megaptera novaeangliae) 105 76 70 83.3
grey whale (Eschrichtius robustus) 18 13 11 13.1
finback whale (Balaeonoptera physalus) 9 6.5 2 2.4
blue whale (Balaenoptera musculus) 2 1.4 0
right whale (Eubalaena japonica) 3 2.2 1 1.2
Orca (“killer whale”, Orcinus orca) 1 0.7 0
Identified samples 138 100% 84 100%
No species identification 25 17
Total samples analysed 163 101
* percentage is calculated out of identified samples only.
The species distribution at Ts’ishaa and Huu7ii both show a similar
majority of humpback followed by grey whales. The Ts’ishaa set also had two
blue whales and one killer whale. The samples identified from Huu7ii included
humpback and grey whales as well as two finback whales and one right whale.
No blue whales or killer whales were found in this dataset. The chi square test
result (X(2)= 3.78, p=0.151) between sites indicates that there is no significant
difference between Huu7ii and Ts’ishaa in terms of species distribution. The
categories used in the chi-square were “humpback whale”, “grey whale” and
“other species”, lumping finback, right whale, orca and blue whale into one
category.

90
Table 4: Species identification by time depth for Ts’ishaa and Huu7ii.
Time (yBP) humpback grey others Chi square1
within site Chi square
1
between site
Ts’ishaa
χ2= 3.78, p=0.151
0-2000 86 (79%) 8(7%) 15 (14%)
Fin(9)blue(2) right(3) orca (1)
χ2= 14.14, p=0.0008
3000-5000 19(65.5%) 10(34.5%) 0
Huu7ii
500-1000 (house)
47(96%) 2(4%) 0 χ2= 9.76, p=0.007
1000-1500 (pre-house)
23(66%) 9(26%) 3(8.5%)
Fin(2) right(1)
1 For the chi-square, “other species” were considered as one category. “within site” compares the two time period. “Between sites” compares sites and lumps time. Yates correction was used because the expected frequency of some categories was less than 5.
The species distribution in the Ts’ishaa dataset can be roughly grouped by
date into 2000 BP to 100 BP and 5000 BP to 3000 BP. The gap between
3000 BP and 2000 BP is based on a gap in the excavation record. The part of the
site that would have been occupied between 3000-2000 BP has not been
excavated (McMillan pers. comm. 2010). Humpback and grey whales were
present over the entire span of 5000 years, while other species (blue, finback,
orca and right whale) were only present in the last 2000 years.
Huu7ii samples can be separated into house (900-0 BP) and pre-house
(~1500-1000 BP) deposits, with the house deposit further divided into early and
late levels. The species diversity at Huu7ii includes only humpback and grey
whales in the house deposit, while humpback, grey, right and finback whales
were found in the pre-house deposit.

91
Sex identification to individualise specimens
Sex identification was attempted as a means of estimating the minimum
number of unique individuals. To circumvent allelic dropout, the presence of the
Y chromosome was tested together with the presence of the Zinc Finger gene
(ZF), which is present on both the Y and the X chromosome. Allelic drop out is
prevalent in ancient DNA and can be avoided by designing short primer
amplicons and repeat amplification (Butler et al. 2003, Burger et al. 2007). While
a humpback whale reference sequence (GI:134287128, Nishida et al. 2003) was
available for SRY, no reference sequence and no modern whale DNA was
available to establish an lab-internal reference sequence for humpback whale
ZFX/Y. A grey whale sequence was used to design ZFX (GI: 13991118 and GI:
13991116) and ZFY (GI: 13991120) primer. The primer system for SRY and ZFX
genes were tested separately before analysing samples in a multiplex set-up.
The goal of this approach was a simple agarose gel-based screening of the
multiplex.
As seen in Figure 4, the results were not consistent, even within a well
preserved sample. In addition, it was determined that the planned screening of
the presence or absence of the Y chromosome would not yield sufficient
information to estimate a minimum number of individuals as opposed to loci with
more than two alleles.

92
Figure 4 Sex Identification using ZFX and SRY primer system. Note that all lanes are amplifications of the same sample (WH35). WH35a+b indicate SRY/ZFX co-amplification, WH35c SRY only amplification. WH35a successfully co-amplified at both loci (upper band=ZFX, lower band SRY), WH35b is missing the ZFX band. “Neg”control exhibits primer-dimer.
In an effort to narrow down the possible number of individuals sampled,
two researchers (B.T. Fothergill (BTF), C.F. Speller (CFS)) evaluated the
database (Appendix A) independently to estimate how many individuals could be
determined. The summarized results can be found in Table 5. Fothergill notes
that numbers provided could be overestimated because no detailed element
identification was provided. Identifying an MNI would be in this case “at best
guesswork” (Fothergill pers. comm. 2010). When adding the species into the
database, the number of possibly re-sampled specimens increases, even though
the DNA analysis is missing 42 samples not identified to a species level. When
counted by unit and layer, the total increased to 94 samples with species
identification. By adding haplotypes to the table, the total minimum number
increased to 132 (50%).

93
Table 5: Number of individuals based on location by researcher.
CFS BTF
Incl. DNA
species ID
(UA)
Inc species
ID and
haplotype
(UA)*
DfSh 7 (N=101) 20 27 33 51
DfSi 16 (N=152) 31 58 56 75
DfSi 17 (N=11) 2 4 5 6
Total (of 264
samples) 53 89 94 132
* haplotypes determined for part of the sample set only: DfSh7=44, DfSi16=63, DfSi17=3.
Remaining samples: species identification only.
Discussion
The objective of this study was to identify the species used at Ts’ishaa and
Huu7ii, to investigate the changes of species diversity over time, and to
investigate the antiquity of whaling by Nuu-chah-nulth in Barkley Sound based on
species composition in the dataset. Furthermore, this research attempted to
reveal when the people in this region began active whaling, and which whale
species were hunted in Barkley Sound. To answer these questions, a total of 264
whale bone samples were processed from two locations in Barkley Sound on the
west coast of Vancouver Island: 163 samples from Ts’ishaa and 101 samples
from Huu7ii. Eighty-three percent (83.3%; 222 out of 264) of the samples yielded
amplifiable DNA and 78.8% of the successful samples were identified as
humpback whale. In addition, grey whale, right whale and finback were identified
from both sites, and blue whale (n=2) and orca (n=1) were identified from
Ts’ishaa only. The orca sample was identified despite a primer mismatch (Figure
3). Humpback whales were the most common species and were consistently

94
found over the entire period of almost 5000 years. Grey whales were the second
most common species present in all time periods. All other species were
restricted to the last 2000 years and found in lower frequencies. At Huu7ii,
species other than humpback and grey whale were only found in the pre-house
levels (older than 900 years). The similar frequency between Huu7ii, Ts’ishaa
and published zooarchaeological results from the Toquat sites in Barkley Sound
(McMillan 1999, McMillan and St.Claire 2005, Monks et al. 2001) indicate that the
sample set was, in both cases, large enough to identify the major species
composition.
The results of this study indicate that the Nuu-chah-nulth at Ts’ishaa and
Huu7ii made use of the feeding ground and hunted predominately humpback
whales. While the intial analysis indicates a change in species diversity after
200BP, a χ2 comparison between Humpback and Grey whale as well as between
either of those and the “other species” category reveals that only if grey whale is
included, a significant difference over time is observed. The same is true for
Huu7ii comparison between the house floor and the pre-house level. This
suggests that grey whale changed significantly over time but neither humpback
nor “other species”. The taxonomic unevenness of large baleen whales is an
important line of evidence suggesting that the people in Barkley Sound actively
took whales as early as 5000 BP. If no whaling had taken place, higher
taxonomic evenness and fewer whale bones in general would have been found in
both sites in earlier times. If whaling had started after 5000 BP, a decrease in
species diversity or change taxonomic evenness should have been found.

95
This is the first study of indigenous whaling practices using ancient DNA
techniques. By identifying species present in shell middens, archaeologists can
gain insight into the lives of past peoples, including cultural and religious beliefs.
Previous interpretations of whaling practices relied solely on ethnographic and
zooarchaeological research. Ethnographic records can be highly informative and
were collected diligently, however the time depth is limited (St. Claire 1991) and
the socio-political context of the time the data is recorded needs to be considered
(McMillan 2009). Furthermore, the possibility that species may have been named
differently or misidentified by early researchers and explorers needs to be taken
into account when incorporating such material. One such case is the confusion
between right and finback whale (Monks 2001). Monks et al. (2003) previously
discussed the MNI using the NISP and MNE, but came to a number of individuals
as N=1 for similar reasons as mentioned above. The comparison of haplotype,
species identification and location from a subset of 105 samples (see Chapter 6)
indicates that very few samples are indeed likely from the same individual. A
zooarchaeological analysis of the whale bone assemblage at Toquaht, a site
located in the northern part of Barkley Sound (Figure 1), yielded similar results in
terms of humpback whale prevalence in the sample set (McMillan 1999).
However, this study was only possible on a relatively small number of bones
(NISP=89, Monks et al. 2001) complete enough for accurate identification.
Zooarchaeological analyses performed on samples from Ozette, WA, indicated
that the species distribution at the Makah site was almost equal between
humpback and grey whale (Huelsbeck 1988), possibly due to the geographically

96
exposed nature of Ozette, being located on a direct line along the humpback and
migration route. The exposed geography potentially constrained the time frame
during which hunting could take place to calm month while whales in Barkley
Sound could be hunted during calmer winter month as well due to a slightly more
sheltered geography. Alternatively, the difference between Ozette and Barkley
Sound is due to choices made by whalers based on cultural or political
incidences.
These studies have made important contributions to the interpretation of
indigenous whaling practices. However, the DNA collected in this study present a
more indepth analysis of the larger archaeological assemblage. In addition, the
DNA analysis here provides archaeologists with an unambiguous species
identification of the highly fragmented material. At Ts’ishaa for example, only
57% of the sea mammal bones were visually identified to a species level
(Fredrick and Crockford 2005). If only complete or somewhat complete bones are
used for identification, a species-specific use pattern, for example ritualistic
treatment of orca, could skew the overall interpretation.
The consistency of humpback whales as the prevalent species over the
entire 5000 year period analysed supports the hypothesis that Nuu-chah-nulth
active whaling is at least 5000 years old. If people had relied exclusively on
stranded whales, the taxonomic evenness should have been higher, with no
single species standing out as humpback whale does in this case. In addition, the
amount of whales should have been considerably less in general. This point has
been previously argued by archaeologists as a line of evidence supporting the

97
antiquity of whaling in Barkley Sound (McMillan and St.Claire 2005, McMillan
1998, Monks et al. 2001). With grey whale being the second most important
species, the two species identified ethnographically as the preferred species
hunted in this region, are indeed the most common in this sample set. The
assemblages seen in Ts’ishaa and Huu7ii however suggest a targeted hunt: a
consistent majority of humpback whale has been established through the entire
5000 year dataset, along with a consistent amount of cetacean bone over the
entire time (Fredrick and Crockford 2005). While the people at Ozette hunted
humpback and grey whales equally (Monks et al. 2001, Huelsbeck 1988), the fact
that sites in Barkley Sound provided mostly humpback whale remains supports
that humpback whales were the traditional choice in Barkley Sound. Given that
the distance from Barkley Sound and Ozette to the deep ocean (depth of >100m)
is approximately equal, indicating that both groups would have taken to boats as
opposed to hunting from the shore, the difference in species selection can
potentially be attributed to human behaviour. Alternatively, as discussed above,
the somewhat different access to more sheltered waters in a Sound instead of an
open coastline may expanded the time when whales could be hunted and thus
guided the selection towards predominantly hunting humpback whales.
Humpback whales were in many ways the “right whale to hunt” in Barkley
Sound; for example, humpback whales swim closer to the shore and even into
the Sound in search of herring. Ethnographic literature even refers to humpback
whales entering the Sound and its inlets on a regular basis (Drucker 1951, Monks
et al. 2001). This would have impacted past whalers’ choices as they would have

98
been equipped with cedar canoes, limiting their range on the open ocean.
Humpback whales are one of only a few species that come close to the
shoreline, while most other species in the Northeast Pacific remain in open water
(Gregr et al. 2000). Hunting whales that remained greater distances away from
the shore would have necessitated better seafaring and hauling technology. In
contrast to grey whales, humpback whales spend more time close to the water
surface, making them more easily detectable to the outlook and hunter (Slijper
1979). Therefore, humpback whales would have been the ideal species,
especially in the early years of active whaling. If Barkley Sound was part of a
feeding ground, the historical and ethnographic accounts of large numbers of
whales can be explained by this fact, instead of the previously proposed resident
population which would be uncommon for humpback whales. Feeding grounds
are frequented by whales year round, depending on the individual’s reproductive
status (Valsecchi et al. 2010, Craig et al. 2003).
The ratio of humpback and grey whales in the archaeological record could
be based on behavioural differences exhibited by these species when
approached. Humpback whales are more docile than the aggressive grey whale.
While hunting humpback whales still entailed great risks for the whaler, a
preference for humpback over grey whales seems reasonable. However,
research at Ozette (e.g Huelsbeck 1988), shows an almost even distribution of
humpback and grey whales in the zooarchaeological record, indicating that grey
whale was within the hunting range in terms of distance from shore, behaviour
and technological advances. The statistically significant decline of grey whale in

99
Barkley Sound over time may have had a variety of reason. Political changes
could have change the access to grey whales, A natural change in grey whale
distribution in the region could have lead to less access. Finally, a change in
culture could have simply lead to decline in grey whales being targeted.
However, at this time, none of these options can be justified with evidence.
Other species were generally considered to be unsuitable to hunt, being
either too fast or too large and in most cases, migrating further offshore than
humpback whales (Monks et al. 2001, McMillan and St. Claire 2005). Finback,
right and blue whales were generally considered as beached whales only (Monks
et al. 2001). While no “other species” were found in deposits prior to 2000 years,
the Chi square indicates that the absence of these species prior to 2000 years is
not significant.
Successfully hunting a blue whale would have been extraordinarily
difficult, based simply on sheer size and speed, suggesting that blue whale
specimens may indeed have been from beached animals. The presence of
finback and right whales can more likely be attributed to active whaling or whaling
attempts. A change in species actively approached would make sense if the
technology of the harpoon or the canoe improves. The earliest modern form of
toggling harpoon is found in the archaeological record at Yuquot and Hesquiat
Harbour around 1200 BP (McMillan 1999, Dewhirst 1978) but intermediate forms
are to be expected. However, whether these species were hunted or scavenged
is impossible to determine. Additional samples around 5000 BP and older may
yield species. Because the change of species diversity is not significant between

100
older and younger samples additional samples older than 3000 and especially
older than 5000 are needed to clarify if there are additional species present in
these older layers or if the current taxonomic diversity remains the same.
A potential change in species diversity and taxonomic evenness could be
a sign of political or cultural changes as well. This change could be either through
trade between groups, or through expanding territories, giving the chief extended
access to beaches (St. Claire 1991, McMillan 2009). The original territory of
Ts’ishaa has only limited exposed areas and few beaches (Sumpter 2005).
However, the expansion of the territories of the Tseshaht is not visible in the
archaeological record of Ts’ishaa and according to ethnographic accounts only
happened after contact with Europeans (McMillan and St.Claire 2005), postdating
the change in species diversity by 1700 years. On the other hand, archaeological
and ethnographic evidence indicates a possible cultural change prior to 2000
years (McMillan 2009, McMillan 1998). Earlier people related to Locarno Beach
culture in the Strait of Georgia were replaced (or absorbed) by people from the
north carrying the West Coast culture type. Incoming people could have brought
a different species preference or a higher acceptance for beached whales.
McMillan and St. Claire place the possible change in culture to around 2500 BP
(McMillan and St. Claire 2005, p.105), right between earlier and later samples in
this dataset. One change may be an increase in population size at Barkley
Sound, forcing whalers to go after more and larger whales for subsistence
purposes.
While finback, right, orca and blue whales were only found in later

101
deposits, these species were found at Huu7ii in the earlier beach (pre-house)
deposits (>1000 BP) but not in the house deposit (1000-500 BP). The
significance of this will only be resolved after further analysis of other sites in the
region. It is possible that finback and right whales were treated differently from
humpback or grey whales, and if so, this cultural difference could perhaps explain
their presence or absence in the archaeological record. While this scenario of
cultural differences is the most likely explanation based on the current data,
alternative arguments explaining the observed species distribution based on the
natural occurrence of the hunted species should be discussed, including
information on migration patterns, habitat distribution, and species behaviour.
To explain the difference in species distribution between earlier (5000-
3000 BP) and later (2000-0 BP) time periods based on natural causes, a
change in migration patterns or an overall change in species distributions in the
North Pacific could be the cause. Migration patterns of several species have
been linked to water temperature, with changes of as little as 1°C possibly
altering the timing of migrating species (Slijper 1979). Climate change on the
Northwest Coast has been recorded at around 4000 BP. Before 4000 BP, the
climate was warmer and dryer than today, as recorded in marine deposits
(Chang and Patterson 2005, Dallimore et al. 2005). After 4000 BP, the climate
became wetter and colder, accompanied by El Niño events, causing fauna and
flora to change (Benson et al. 1997, Clague et al. 1982). On a related note, one
of the factors that could have played a role in the change of species distribution
might have been the end of the neoglacial sea ice as described by Crockford and

102
Frederick (2007). The retreat of the sea ice in Alaska, for example, might have
caused an expansion of whale migration further north. If climate change was the
reason for the altered species distribution, the observed change should have
occurred earlier than 3000 BP. To further clarify if changes similar to those
observed herein occurred during that time, sampling should be concentrating on
the period just before 5000-4000 BP and after the ~3500-2000 BP climate
change event.
Apart from natural changes in whale distribution, human behaviour is the
alternative option to explain the different species distributions, as well as the
changing species frequencies over time. Three scenarios could link human
behaviour to the change in species distribution observed between 3000 BP and
2000 BP. Firstly, the distribution change could indicate the onset of active whale
hunting, with no discrimination between species. This would imply that the earlier
distribution of humpback and grey whales remains is based on beached whales
only. The absence of right and finback whales in earlier periods could be due to
the limited sample size (n=29) from this period. This however, would be contrary
to modern evidence that baleen whales are less likely than odontocete whales to
beach (Mustika et al. 2009, Borsa 2006). For example, a study in Indonesia
found only 3 cases of baleen whales out of 35 strandings (8.5%) over a period of
20 years (Mustika et al. 2009). As well, Borsa (2006) reports 423 stranded
animals in 72 single animal events and 5 mass strandings (32-199 individuals)
over a time of 128 years with only 5 reported baleen whales over the entire time
period. Dolphins and large toothed whales, especially sperm whales, made up

103
the rest of the beached species. Monks argues that an increase in beached
whales is to be expected with an increase of whaling activity as more whales
would potentially be struck but lost (Monks 2003).
The second scenario would be a shift to more effective whaling
techniques. Active whaling probably progressed through several phases. The
change from 62% humpback to 78% humpback whales during this time period
may be a sign that Nuu-chah-nulth whaling had developed into the highly skilled,
technologically advanced enterprise for which the Nuu-chah-nulth would be
famous. This scenario may explain the relative increase in humpback and an
increase in finback and right whale but not necessarily the change in grey whale
species since these should increase instead of decrease.
Thirdly, the species distribution could be due to a change from full time
occupation to seasonal summer occupation of sites in Barkley Sound. In this
case, the hunted species would be dependent upon the migration cycle of the
different species or temporal residency. All species identified in this study migrate
during roughly the same time period with at least humpback whales being
present almost year-round. As described above, ethnographic research indicates
that most whaling took place in late spring and summer during later time periods,
at times when humpback whales would have been found in nearby waters more
frequently. This ethnographically described practice is supported by reduced
accessibility to the ocean during the fall and winter seasons, as storms would
have jeopardized any whaling endeavours.
Samples collected at Ts’ishaa are distributed over 5000 years with a gap

104
between 2000 and 3000 years as this part of the site was not excavated. The
results show a shift in species distribution through time which is statistically
significant for grey whale but not statistically significant for other whale species.
Initially, species other than humpback and grey whales were assumed to be
stranded rather than hunted whales. However, alternative explanations are
possible. Generally, a change in species distributions can be an indication of
changing natural or anthropogenic influences. Natural factors influencing
population shifts include climate change and natural population expansion or
decline. Changes on an anthropogenic level include modifications to belief
systems, political alterations, and warring. In addition, technology transforms and
develops over time, as does the knowledge base for understanding and
manipulating the environment.
The species identification at Ts’ishaa should be considered an initial result
worth further investigation notwithstanding the small sample size for the earlier
time period (5000-3000 BP). To explain the change in species distribution,
ethnographic and archaeological evidence play a major role. Possible
anthropogenic factors could be either the beginning of whaling, or a new
development in whaling capability.
While the question of possible species shifts for sustainability reasons
cannot be answered conclusively, inferences can be drawn from the different
lines of evidence regarding human behaviour towards the environment. First, the
spiritual world that surrounded the daily life of the Nuu-chah-nulth guided their
behaviour towards animals and other natural resources (McMillan 1999, Drucker

105
1951, Kirk 1986, Monks et al. 2001). This helped to balance the immediate need
for a resource and the need for sustaining those resources for future generations.
A second point in the case of whaling, are the pre-requisites for a hunt: animals
were not randomly hunted, but could only be hunted by specific people, usually of
the highest ranks, and required rigorous spiritual preparation (Drucker 1951,
Monks et al. 2001). Such behaviour and regulations can be viewed as
environmental, although it might not have been a conscious environmentalism.
Since intent cannot be tracked through the archaeological, this would at best be a
philosophical discussion. Another factor limiting the impact of human behaviour
on the environment in this case was the need for a highly advanced technology
required for a successful hunt. The technology used for whaling, though
improving over time, was probably not efficient enough at this time to cause
serious harm to whale populations. In his diary, for example, John Jewitt reports
several unsuccessful whaling attempts by Maquinna, the chief he was held by
(Jewitt 2000). The size of whale would also limit human impact. Hunting a whale
was more difficult and dangerous than hunting a deer or salmon. Not only would
travelling by water be a hindrance, but moreover, the size of the animal and the
hugely uneven distribution of flexibility and power between the hunter and the
prey, would limit the number of whales caught. Genetic diversity discussed in
Chapter 6 does not indicate any loss but a stable diversity and population size.
To date, the oldest potential evidence for whaling in Barkley Sound has
been dated to over 2000 BP, from Ch’uumat’a (Monks et al.2001, McMillan
2009). Unfortunately, archaeological evidence of whaling is extremely rare due to

106
limited preservation of the materials used. Active whaling evidence includes
harpoon heads embedded in whale bones and actual whaling gear, most of
which only preserves in wet sites. Whaling gear, especially the harpoon valves,
were also kept for their spiritual and social relevance, so the cultural taphonomy
skewed the archaeological record further (see also Monks et al. 2001). While the
presence of whale bones is not evidence of active whaling in a strict sense
(Monks 2005, Mulville 2002b), the large amount of whale bone found in Ts’ishaa
and Huu7ii can be considered a strong line of evidence (McMillan 2005; 2009,
Monks 2001; 2003). Archaeological evidence of whale use over the entire time,
and ancient DNA evidence showing a continuous preference for humpback
whales over 5000 years, could be considered sufficient evidence to conclude
whaling took place at least 5000 BP, and probably longer.
The increase of species diversity in the time after 2000 BP is not related to
the introduction of active whaling. Three possible explanations have been
discussed here, including natural cause, technological advances and political
changes. It is possible that the change included both technological
advancements, such as toggling harpoon heads like those found at Yuquot and
Hesquiat Harbour (McMillan 1999, Dewhirst 1978), as well as increased
knowledge of successful hunting techniques and whale behaviour, and a different
perception towards beached whales. In later times, with an increase in human
population size and political upheaval, it may have been more important to hunt
faster and larger prey species in order to further increase the prowess of the
hunting chief to solidify his position during war times; this would ultimately lead to

107
more daring hunting excursions.
It is unlikely that the species distribution changes discussed here were the
result of the initial invention or introduction of whaling, as whale remains were
found at Ts’ishaa throughout the entire 5000 year period. As mentioned earlier,
modern records show that baleen whales are not commonly beached, despite
their frequent close proximity to the shore. The species distribution at Huu7ii is
probably different because the two excavated areas included the house floor, as
well as the pre-house level. The species differences could therefore be a
reflection of differences in the use of an area, occupation patterns, or political
changes. Similarly, an overall increase in sample size dating to 5000-3000 BP
might change the species distribution.
Further studies using samples dating to the time prior to 5000 BP might
illuminate the consistency of species choice and may find the onset of whaling,
which should be the change from random species to a selective humpback whale
hunt. While the change from hunting to domestication has been documented in
land mammals, the change from scavenging to hunting large sea mammals has
not been shown in the archaeological record. Both share the intentional
modification of species used by a group; in land mammals, the keeping of
animals with later control of breeding, and in sea mammals, from picking
“whatever is available” to developing technologies that enable humans to choose
the hunted species and hunting it. This can be due to either the change in sea
level or due to the possibility that people moving to Barkley Sound already
brought the technology with them.

108
Conclusions
Prior archaeological analyses of assemblages excavated on Nuu-chah-
nulth territory, as well as recorded oral traditions, have demonstrated the
importance and extensive use of whales over the past 4000-5000 years.
However, no direct evidence supports active whaling until about 2500 BP
(McMillan 1999, Monks et al. 2001). To date, the oldest evidence of active
whaling in Barkley Sound dated to 2500 BP and a harpoon head embedded in a
whale bone dated to 500 BP (McMillan and St. Claire 2005, McMillan 2009). Due
to the highly fragmented nature of the assemblages, zooarchaeological
identification to the species level has been practically impossible in many sites. In
this study, ancient DNA techniques were used to analyse a dataset of 264
samples from two sites dating to between 5000 BP and ~100 BP. The data
herein provide evidence suggesting that whales were being hunted in the region
at least 5000 years ago.
The consistently high numbers of humpback whales and, to a lesser
degree grey whale, can be used as an indicator of the time depth of whaling.
Other species appear after 2000 years in the archaeological record at Ts’ishaa
and Huu7ii which may be due to the higher amount of samples taken from these
layers. At least a portion of these “other” species are likely drift whales, especially
the blue whale samples. If all of these samples are exclusively from stranded
whales, they should also appear in the record prior to 3000 BP. Incorporation of
data from other sites in the region would be useful, including a longer time period

109
for Huu7ii samples to clarify the long term pattern, similar to that found for
Ts’ishaa.
This study is the first of its kind, using molecular archaeology as a tool to
detect ancient whaling practices and species diversity. While ancient DNA cannot
provide definitive answers, it is a strong line of evidence that, in combination with
biological, archaeological and ethnographic data, supports the hypothesis that
active whaling was practiced by the Nuu-chah-nulth by 5000 years BP. Further
research along the Northwest Coast, as well as in other whaling regions, could
shed light on the early development of whaling nations worldwide.

110
Chapter 6: Population Genetic Diversity of Northeast Pacific Humpback Whale (Megaptera novaeangliae) from an Ancient DNA Perspective
Abstract
Archaeological excavations in Barkley Sound, Vancouver Island unearthed
whale bones covering a time period from 5000 BP to 200 BP. Using ancient DNA
techniques, archaeology can trace genetic changes of populations over time
creating a baseline for genetic diversity. To investigate pre-industrial whaling
genetic diversity of Megaptera novaeangliae (humpback whale), 344 bp of the D-
loop sequence of 105 humpback whales samples from two sites in Barkley
Sound were analysed using ancient DNA techniques. Results were compared
within the dataset as well as with published extant data from North Pacific
feeding grounds.
Results indicated that the genetic diversity and haplotype diversity of
humpback whales in the Northeast Pacific did not change during industrial
whaling in the nineteenth and twentieth century. Population size estimates (Ne)
based on this dataset range between 1500 and 2500. However, previous
research has suggested that population size estimates based on D-loop diversity
alone only provide partial results, so further investigation is needed to obtain the
reliable pre-industrial whaling population size. The study herein found success
rate, as well as the presence of amplifiable nuclear DNA suggests that the

111
material is sufficiently preserved for future DNA analyses including nuclear DNA
marker such as STR or SNPs.
While the lack of change supports the reliability of modern DNA
investigation concerning the historic population status in this case, haplotypes not
recovered from modern humpback whale samples highlight the ability of ancient
DNA analysis of archaeological material to support modern biogeography
investigations and conservation biology.
Introduction
For millennia, whales were hunted in all areas of the world as a source for
meat, oil and raw material for subsistence and trade purposes. During the
industrial whaling phase in the nineteenth and twentieth century, up to 90% of the
population of humpback whales was destroyed. While today, humpback whales
seem to have recovered, and perhaps even reached their pre-nineteenth century
population size, other whale species, for example the eastern Pacific grey whale
or the North Atlantic right whale, are still threatened by extinction.
Recently, efforts have been made to estimate the historic population size
and genetic variability of humpback and other whale species. Based on whaling
logbooks and recent mtDNA analyses, Roman and Palumbi (2003) estimate the
historic population size of humpback, finback and minke whales to be up to
twenty times higher than the current estimates of the International Whaling
Commission (IWC). The implications of these results would be a long term

112
whaling ban until a sufficient population size is reached. This study was
challenged in a report to the IWC in 2005 (Clapham et al. 2006). Despite detailed
historic records and modern studies, the baseline of humpback whale population
genetic diversity and population size remains under debate. The increase of
Northeast Pacific humpback whale population estimates from 1500 in 1966 to 20
000 in 2006 (Calambokidis et al 2008), with increases of 4-7% over the last years
suggests a swift recovery of population. Because the ban on whaling hinges on
sustainable population sizes, it is vital for humpback whales that biologists are
able to accurately predict original population size and genetic diversity.
Using ancient DNA analysis can fill potential gaps in the modern record
such as pinpointing lost haplotypes or potentially lost populations. In addition,
historic documents of industrial whaling can be avoided because they are
potentially flawed by underreporting, not reporting struck-but-lost (potentially
fatally harpooned animals that were not captured), misrepresenting and
miscounting.
The objectives of this study were to investigate the past genetic diversity
of humpback whales in the Northeast Pacific, to analyse the changes over time
by comparing ancient DNA results with modern published data, and to investigate
the population size of humpback whales based on ancient DNA and modern
comparative material.

113
Background
Humpback whale populations
Humpback whales in the Northeastern Pacific were hunted in the late
nineteenth and early twentieth century. After industrial whaling effectively ended
in the 1960s, and especially after the official moratorium on whaling in 1983,
research on the biology and later genetic diversity of whales, and in particular
humpback whales increased rapidly. However, because of their large habitat and
long migration, population structure studies on humpback whales are
challenging. Information about the social structure improves the understanding of
the demographics, especially in cases of migrating animals, and thus may help to
explain genetic and stable isotope patterns observed.
Genetic analysis has shown populations to be structured based on feeding
and breeding grounds, but the social interaction is largely unknown (Clapham et
al 1996, Valsecci et al. 2002, Ersts et al 2003). The fact that populations are
genetically segregated was initially surprising because of the lack of barriers
within an ocean (Baker et al. 1998). Humpback whales return to their natal
breeding and feeding ground. The analysis by Alter et al. of the Baja California
grey whale population reveals that the fidelity to the breeding ground varies, with
some animals returning every year while others only return every couple of years
(Alter 2009, see also Craig et al. 1997). Witteveen (2009) reports high site fidelity
at feeding aggregations, based on genetic and trophic levels observed (see
details below). Reports of humpback whales re-sighting in other feeding grounds
are not uncommon though (Stevick 2004, Olavarria 2007, Friday 2008). These

114
results indicate that while feeding populations are somewhat coherent groups,
they are not closed, especially to neighbouring groups.
Within a feeding population, humpback whales were observed to loosely
interact with most individuals, but recent studies have uncovered different levels
of interaction. Ramp et al. (2010) found associations between non-lactating
females and males, as well as between non-lactating females over the course of
their study. Female-female bonds lasted longer, reaching up to 6 years. The
connections were maintained during the summer and disassociated during fall
migration only to re-assemble in the following spring when returning to the
feeding ground. Most associations of humpback whale pairs last between 2
weeks and a summer, with several years being an exception (Ramp et al. 2010).
Females were more social than males, especially during the feeding season. The
reason for this sex specific behaviour is unclear but has been investigated in
other species. Typical theories include survival of offspring and predator pressure
in general. However, in the case of humpback whales, lactating female are less
frequently found in female-female groups for a longer period of time and instead
group with their offspring. DNA analysis of pairs could help to reveal if the
observed pairings are in fact kin-based relations.
While affiliations seem to be somewhat sex specific, there is no sexual
segregration in terms of habitat use observable, but a class based foraging
differentiation, with juveniles foraging on the outer areas of a feeding area.
The group behaviour of humpback whales is different between feeding
and breeding grounds, along with a different sex ratio between male and female

115
in the different regions, varying between 1.5:1 to 2.5:1 in breeding areas
depending on the study and probably the time. In breeding grounds, as well as
on migration, population structure is male-biased with juvenile animals being
underrepresented. According to Brown et al. (1995), population patterns during
migration resemble more closely breeding than feeding populations. Previous
research has already determined a class specific migration, differentiating
juveniles from non-lactating females, males and lactating females. In addition, not
all animals migrate every year, depending on their energetic needs (Craig and
Herman 1997, Pomilla and Rosenbaum 2005, Felix and Botero-Acosta 2011).
Witteveen’s comparison of the Alaskan sub-regions of southeast Alaska,
Prince William Sound and Kodiak Islands reveals not only potential
subpopulations for these areas, based on re-sighting, DNA and stable isotope
analysis, but also differences between inshore and offshore animals, at least at
Prince William Sound visible on a trophic level. The differentiation of inshore
versus offshore was a research based differentiation, not based on
oceanographic or biological facts (Witteveen et al. 2009). Further research may
reveal other feeding grounds with similar differentiations between inshore and
offshore individuals. Witteveen’s study also suggests that the current
classification of a central pacific population may need re-classification as more
humpback whale data is available for a more differentiated landscape analysis
(Witteveen et al 2009).
Research on modern humpback whale populations reveals complex
migration networks between the feeding and breeding grounds of humpback

116
whale populations in the Pacific Ocean. Importantly, researchers are trying to
determine not only the current genetic diversity, but are also establishing a
baseline for whale genetic diversity and population size prior to industrial whaling.
These data would provide more accurate estimates for carrying capacities and
hunting quotas. Roman and Palumbi (2003) assessed current genetic diversity as
well as historical whaling records to estimate pre-industrial whaling humpback
population size. According to Roman and Palumbi, the population size in the
North Atlantic probably ranged between 156 000 and 401 000 individuals. The
current estimate of humpback whales by the IWC for the Northwest Atlantic is 11
600, and “at least 10 000” for the North Pacific (http://www.iwcoffice.org/
conservation/estimate.htm. retrieved Dec 10th 2009). Calambokidis (2008) et al.
estimate the North Pacific population to be at least 20 000 animals.
The seasonal pattern of ocean productivity, which is in general very
predictable, allows for a steady migration pattern over thousands of kilometres.
North Atlantic humpback whales migrate between Greenland and Iceland and to
breeding grounds in the West Indies. Southern Atlantic whales migrate between
Antarctic whaling grounds and Brazil, Australia, New Zealand and possibly the
west coast of Africa (Baker and Medrano-Gonzalez 2002, Reeves et al. 2004).
Five populations are recognized in the Southern Oceans based on their feeding
area (I-V) (Rasmussen et al. 2007, Baker et al. 1998a, Baker et al. 1993). North
Pacific humpback whales are separated into three subpopulations: the western
stock migrates between Japanese waters and the Aleutian Islands, the central
stock migrates between Hawaii and the feeding ground in Prince William Sound

117
and western Alaska (Calambokidis et al. 2001, Witteveen et al. 2004), and the
eastern North Pacific stock migrates between Mexican breeding grounds and
California/Oregon, Washington/southern British Columbia and southeast
Alaska/northern British Columbia during the summer feeding time (Witteveen et
al. 2009, Baker et al. 1993). A stable isotope study by Witteveen et al. suggests
that some of the whales feeding in British Columbia belong to the California/
Oregon/ Washington population (Witteveen et al. 2009). While these stocks are
somewhat defined, some whales seem to move between these defined feeding
and breeding grounds, for example migrating between Japanese waters and
Oregon (Darling and Cerchio 1993).
Since the seasons are reversed between the Northern and Southern
hemispheres, genetic exchange between the populations is limited (Baker and
Clapham 2004, Roman and Palumbi 2003). The average swimming speed of
migrating humpback whales has been measured at 4.2km/h and can vary
between 4 and 9.5 km/h (Lagerquist et al. 2008), but can reach a speed of up to
12km/h for a short period of time. Calves usually stay close to the mother and
those groups are slower during migration than solitary females and male
humpback whales (Lagerquist et al. 2008, Stevick et al. 2003).

118
Industrial Whaling
Long before whaling was a lucrative business, subsistence whaling was
carried out worldwide in coastal communities. Nuu-chah-nulth hunted whales
using dugout canoes made of cedar trees and harpoons, outfitted with seal
bladder floaters for at least 5000 years (Chapter 5). Industrial whaling is thought
to have begun in the 1600s with the Basques, who hunted bowhead whale
(Balaeonoptera mysticetus) and right whale (E. glacialis) (McLeod et al. 2008,
Higdon 2008, Logan and Tuck 1990); it quickly spread across the world. Within
200 years, a large scale whaling industry developed and covered the Atlantic and
Pacific Ocean from Greenland to Antarctica (Tønnessen and Johnsen 1982).
During the nineteenth century, whaling technology advanced rapidly and
floating factory ships and exploding harpoons were developed, supporting a
worldwide whaling industry. Whaling companies harvested regional populations
until it became unprofitable, and then expanded their harvest to new species
and/or new whaling grounds. Species were hunted systematically; right whales
and bowhead whales were the first species that were targeted, followed by other
species such as sperm whales and grey whales. M. novaeangliae (humpback
whales) was one of the last species hunted because of its relatively small size
and poor oil quality in comparison to right whales or sperm whales. However, the
collapse of the right whale, bowhead and grey whale populations led to an
intensified hunt of humpback whales.
Around Barkley Sound, whaling stations opened in 1903 and 1905 and
operated until 1965. In some cases, whaling stations operated less than 10 years

119
before the whale stocks collapsed, causing companies to go out of business. The
harvesting of humpback whales became unviable before the Second World War
but was continued after the war in an effort to keep the industry alive. The
International Whaling Commission (IWC) began protecting humpback whales by
ratifying a ban on whaling in 1963. A general moratorium on whaling was decided
in 1985 and was supposed to last at least 10 years. Industrial whaling practices
reduced the worldwide humpback whale population by an estimated 90% (Baker
2003). For the past 30 years, research has been assessing the population
structure and genetic diversity to determine the current state of these stocks.
With an increase in data collected, including fluke sightings and genetic
evidence, feeding and breeding ground relationships have been determined.
Using ancient DNA techniques, phylogeographic data can provide a new time
depth and potentially improve the current interpretation.
Material and Methods
Material
For this study, 105 humpback whale samples from Huu7ii and Ts’ishaa,
two sites archaeologically excavated, were analysed using ancient DNA
techniques. Sixty-one samples from Ts’ishaa and 44 samples from Huu7ii, dating
between 5000-0 BP were included in the final analysis (Table 6). The material
was excavated between 1999 and 2001 in Ts’ishaa (DfSi16 and DfSi17), and

120
between 2004 and 2006 at Huu7ii (DfSh7) by teams lead by Alan McMillan and
Denis St.Claire. The age of the samples is based on site stratigraphy, including
14C dates from Ts’ishaa and Huu7ii. The zooarchaeological analysis was carried
out at the University of Victoria in Victoria, BC. Samples were taken from shell
midden and house floors. The 105 samples were part of a larger collection
processed for this study (see Chapter 5 for details). Samples that could not be
sufficiently reproduced were excluded from this study.
Both archaeological sites had large amounts of whale bones in shell
midden and the house floor. For at least 5000 years, people were utilizing whales
in Barkley Sound, primarily humpback whales. Ethnographic records reveal a
high density of whales during spring and summer in this area and whale sightings
year round with whales swimming into the Sound and upstream (McMillan 2009,
StClaire 1991, Monks et al. 2001, Monks 2003).

121
Table 6: humpback whale samples used for mtDNA genetic diversity analysis.
WH_
_ Site Unit Level Layer Quad DBD Element Age1 H
2
26 DfSi 16 S58-60/W64-66 8 E 0.40-0.50 1 fragment 3600 CD3
31 DfSi 16 N10-12/W102-104 feature 57 C Jul-84
“flat peice of crania- may be
part of WB # 00-14 but does
not seem to fit in” G.
Frederick 250-1000 E1
37 DfSi 17 S5-7/W11-13 14 4.10-4.20 likely a whale but…. 250-500 A1
39 DfSi 16 S56-58/W66-68 5 E 0.40-0.50 fragment of “whale bone # 5” 3500-4500 E1
42 DfSi 16 S4-6/W98-100 2 A 3.00-3.10
thin slice of a scpula?
associated with “fauna
feature” from this level 250-500 CD3
44 DfSi 16 S10-12/W25-27 4 A 1.80-1.90 small cancellous fragment 250-500 A1
46 DfSi 16 S14-16/W25-27 37 G 4.70-4.80 solid rib fragment 1500-2000 CD3
50 DfSi 16 S16-18/W25-27 14 B 2.28-2.38 1 fragment 1000-1500 A1
55 DfSi 16 S60-62/W63-64 6 C
0.05 above-
0.05 below 1 fragment 3500-4500 CD3
57 DfSi 16 S8-10/W98-100 7 A 2.60-2.70 cancellous fragment 250-500 A1
58 DfSi 16 S12-14/W25-27 28 4.10-4.20 small rib fragment 1000-1500 E3
59 DfSi 16 S14-16/W25-27 20 C 3.00-3.10 rib frag 500-1000 E1
60 DfSi 16 S10-12/W25-27 12 2.60-2.70 small rib frag 250-1000? A1
64 DfSi 16 S58-60/W64-66 10 E 0.40-0.50 1 fragment 4500-5000 CD4
65 DfSi 16 S14-16/W25-27 36 G 4.60-4.70 large whale? 1500-2000 CD3
66 DfSi 17 N43-44/W53-55 2 A 4.85-4.95 1 small fragment 250-500 E1
68 DfSi 16 N10-12/W102-104? ? ? ?
WB 00-4 from feature 56 or
57? piece #2 500 E1

122
WH_
_ Site Unit Level Layer Quad DBD Element Age1 H
2
69 DfSi 16 S56-57/W50-52 17+ shovel test dense 4500-5000 E1
70 DfSi 16 S14-16/W25-27 21 C 3.00-3.10 2 mandible frag 1000-1500 CD7
71 DfSi 16 S8-10/W98-100 10 A 2.90-3.00 unfused phalange 4000-5000 E2
72 DfSi 16 S12-14/W25-27 19 Mar.18 ribfrag from precise depth 500-1000 A1
73 DfSi 16 N0-2/W98-100 7 A 5.70-5.80 cancellous frag 250-500 E1
74 DfSi 16 S56-58/W66-68 5 E 0.40-0.50 “whale bone # 5” 3500-4500 E1
76 DfSi 16 S56-58/W66-68 3 B 0.20-0.30 uncertain element 3500-4500 CD4
77 DfSi 16 N2-4/W102-104 5 C 6.00-6.10 2 fragments 250-500 A1
78 DfSi 16 N10-12/W102-104?
see feature
record-2000
WB 00-3 from feature 56 or
57 500 E1
79 DfSi 16 S12-14/W25-27 13 A 2.60-2.70 rib fragment 500-1000 E1
81 DfSi 16 N4-6/W102-104 8 C 6.35-6.45 1 fragment 500-1000 E2
82 DfSi 16 S54-56/W77-79 7 A
0.10-0.00
above ephyisis 3500-4500 CD3
85 DfSi 16 N10-12/W102-104
see feature
record
see
feature
record
see feature
record
WB 00-7 from a feature
(either 56 or 57) 500 CD3
86 DfSi 16 S12-14/W25-27 18 B 3.70-3.80 large rib frag 500-1500 E1
88 DfSi 16 N2-4/W102-104 23 D 7.80-7.90 I lage vert frag 500-1000 CD3
89 DfSi 16 S14-16/W25-27 17 B 2 rib frags 1000-1500 CD5
92 DfSi 16 N2-4/W102-104 31 D 8.60-8.70 1 rib frag 1000-1500 E1
96 DfSi 16 S12-14/W25-27 33 F 4.60-4.70 2 fragments of ephiysis 1500-2000 CD6
97 DfSi 16 S14-16/W25-27 5 A 1.50-1.60 vetebral epiphysis 250-500 A1
101 DfSi 16 S12-14/W25-27 14 2.70-2.80 500-1000 CD5
102 DfSi 16 N10-12/W102-104
Jul-84
cranial frag from the large
feature 500-1000 E1

123
WH_
_ Site Unit Level Layer Quad DBD Element Age1 H
2
106 DfSi 16 S62-64/W62-64 3 B 0.50-0.40 vert disc 3500-4500 CD3
107 DfSi 16 N4-6/W102-104 16 D 7.15-7.25 500-1000 CD3
112 DfSi 16 N4-6/W102-104 13 C 6.85-6.95 rib ? 500-1000 E1
113 DfSi 16 N4-6/W102-104 3 A 5.85-5.95 small frag 250-250 A1
125 DfSi16 N2-4/W102-104 20 D 7.50-7.60 unid level 500-1500 CD7
126 DfSi 16 S6-8/W98-100 9 A 2.85-2.95 vert disc 250-1000 CD3
127 DfSi 16 S10-12/W98-100 5 A 2.10-2.20 250-500 A1
129 DfSi 16 S10-12/W98-100 12 A 2.80-2.90 rib frag 250-1000 CD3
131 DfSi 16 S2-4/W98-100 2 A 3.5-3.6 small frag 0-500 A1
132 DfSi 16 S12-14/W25-27 14 2.7-2.8 500-1000 CD5
136 DfSi 16 S14-16/W25-27 3 A 1.25-1.35 large fragment 250-500 E1
138 DfSi 16 N0-2/W98-100 9 A 5.90-6.0 phalanx complete 250-500 A1
141 DfSi 16 S10-12/W25-27 15 A 3.10-3.20 500-1000 E1
142 DfSi 16 S12-14/W98-100 3 1.60-1.70 2 frags from same level bag 250-500 A1
143 DfSi 16 N4-6/W102-104 2 B 5.75-5.85 rib frag 250-500 E1
145 DfSi 16 S8-10/W98-100 1 A 1.85-2.10 vert disc 250-500 A1
146 DfSi 16 S12-14/W98-100 8 A 2.20-2.30 large vert disc frag 250-500 A1
150 DfSi 16 N4-6/W102-104 4 B 5.95-6.05 unid level 250-500 A1
151 DfSi 16 S12-14/W98-100 10 A 2.40-2.50 2 frags 250-500 A1
156 DfSi 16 S8-10/W98-100 1 A 1.85-2.10 small frag 250-500 A1
163 DfSi 16 S10-12/W98-100 5 A 2.10-2.20 cranial? 250-500 E4
165 DfSi 16 S14-16/W98-100 12 A 2.15-2.25 500-1000 E1
169 DfSi 17 S5-7/W11-13 6 3.30-3.40
whale? Large fragment in
paperbag, verebrae frag? 250-500 E1

124
WH_
_ Site Unit Level Layer Quad DBD Element Age1 H
2
185 Dfsh7 N18-20/E34-36 16 D NE 003.80-003.85 Vertebra (undet) 650-850 E4
186 Dfsh7 N18-20/E34-36 18 D NE 003.90-003.95 Unidentified (fragments) 650-850 E4
193 Dfsh7 N18-20/E34-36 32 F NE 004.60-004.65 Unidentified (fragments) 1200 CD3
196 Dfsh7 N18-20/E2-4
F 5.2 Vertebrae (complete) 1350 E2
198 Dfsh7 N10-12/E2-4 14 D
SW(NW?
) 3.48-3.53 Vertebra (undet) 450-650 CD3
199 Dfsh7 N18-20/E2-4 12 C NW 4.05 Rib 650-850 E3
203 Dfsh7 N14-16/E16-18 10 B1 SE 003.90-003.95 whale rib 650-850 E1
208 Dfsh7 N16-18/E26-28 19 C SW 004.20-004.25 Caudal vertebra (undet) 900 E2
209 Dfsh7 N16-18/E26-28 17 C SE 004.10-004.15 Phalanx (undet) 900 CD1
210 Dfsh7 N18-20/E2-4 21 D SW 4.55-4.60 Unidentified (fragments) 1100 A1
212 Dfsh7 N18-20/E2-4 14 C SW 4.20-4.25 Vertebra (undet) 650-850 E1
213 Dfsh7 N18-20/E6-8 28 E SW 4.90-4.95 Unidentified (fragments) 1300 CD2
214 Dfsh7 N18-20/E6-8 31 E NE 5.05-5.10 Vertebra (undet) 1300 E1
217 Dfsh7 N18-20/E6-8 13 C SE 4.15-4.20 Unidentified (fragments) 650-850 A1
219 Dfsh7 N18-20/E6-8 31 E NW 5.05-5.10 Unidentified (fragments) 1300 CD3
220 Dfsh7 N18-20/E6-8 18 E SE 4.40-4.45 Vertebra (undet) 1100 E4
221 Dfsh7 N18-20/E6-8 18 E NE 4.40-4.45 Vertebra (undet) 1100 A1
222 Dfsh7 N18-20/E6-8 18 E SW 4.40-4.45 Vertebra (undet) 1100 A1
223 Dfsh7 N18-20/E6-8 28 E SE 4.90-4.95 Unidentified (fragments) 1300 E1
225 Dfsh7 N18-20/E6-8 29 E NE 4.95-5.00 Unidentified (fragments) 1300 E2
227 Dfsh7 N18-20/E2-4 18 C NW 4.40-4.45 Unidentified (fragments) 650-850 A1
229 Dfsh7 N18-20/E2-4 21 D NW 4.55-4.60
Unidentified (unknown
element) 1100 CD3
230 Dfsh7 N18-20/E2-4 32 F NW 5.10-5.15 Unidentified (fragments) 1300 E1

125
WH_
_ Site Unit Level Layer Quad DBD Element Age1 H
2
233 Dfsh7 N18-20/E6-8 35 G SW 5.25-5.30 Vertebra (undet) 1350 A1
241 Dfsh7 N18-20/E6-8 20 E SW 4.50-4.55 Vertebra (undet) 1100 E3
246 Dfsh7 N10-12/E2-4 16 E SW 3.58-3.63 Unidentified (fragments) 450-650 CD3
247 Dfsh7 N10-12/E2-4 20 G NW 3.78-3.83 Vertebra (undet) 650-850 CD3
249 Dfsh7 N10-12/E2-4 20 F NE 3.78-3.83 Vertebra (undet) 650-850 A2
250 Dfsh7 N10-12/E2-4 21 G NW 3.83-3.88 Unidentified (fragments) 650-850 E1
251 Dfsh7 N10-12/E2-4 21 G SE 3.83-3.88 Unidentified (fragments) 650-850 E2
252 Dfsh7 N10-12/E2-4 20 F NW 3.78-3.83 Vertebra (undet) 650-850 CD3
253 Dfsh7 N10-12/E2-4 20 G SW 3.78-3.83 Rib 650-850 A1
254 Dfsh7 N10-12/E2-4 16 E NW 3.58-3.63 Unidentified (fragments) 450-650 CD3
256 Dfsh7 N10-12/E2-4 10 C SE 3.28-3.33 Vertebra (undet) 450-650 E1
257 Dfsh7 N10-12/E2-4 14 E SW 3.48-3.59 450-650 E1
261 Dfsh7 N10-12/E2-4 12 C SW 3.38-3.43 Unidentified (fragments) 450-650 CD3
265 Dfsh7 N18-20/E16-18 13-16 B SW 4.0-4.20 whale bone near feat.42 650-850 A1
268 Dfsh7 N18-20/E16-18 13 B SW 4.0-4.1 650-850 E1
271 Dfsh7 N18-20/E30-32 16-19 D/E/F NE/NW 4.05-4.35
whale rib, three pieces almost
complete 650-850 E4
275 Dfsh7 N18-20/E30-32 15-19 D/E NW 4.2-4.25 epiphysis 650-850 CD3
276 Dfsh7 N18-20/E30-32 16-19 D/E NW/NE 4.05-4.2 vertebrae 650-850 A1
277 Dfsh7 N18-20/E30-32 19 E NW 4.2-4.25 650-850 A1
278 Dfsh7 N12-14/E18-20 Nov-13 C SE 3.85-3.95 650-850 CD3
279 Dfsh7 N18-20/E30-32 16-17 D/E SW 4.05-4.25 650-850 E1
1=age estimate based on calibrated radiocarbon dates at Ts’ishaa/Huu7ii, age(stat)
2 =average used for statistical analysis. Estimated dates for
statistics for Huu7ii provided by A.McMillan. Site: DfSi16/17 Ts’ishaa, DfSh7=Huu7ii; 2H=haplotype determined in this study

126
Methods
Only samples identified as M. novaeangliae (humpback whale) during the
DNA species identification analysis (see Chapter 5) were incorporated in this
analysis. PCR analysis was carried out as described in Chapter three. D-loop
sequences were amplified using four overlapping primer systems (see Table 7)
designed to target a 400bp region (Figure 5). This variable region was used in
previous studies (Baker 1994, Baker and Medrano-Gonzalez 2002, Witteveen
2004) for population genetic purposes. The D-loop is frequently used for
population genetics of different species in ancient DNA studies because it is
usually the most variable mtDNA sequence available, and is suitable for studies
on levels below the species level.
Without primer system F22/R258, the first 100 bp of the D-loop are not
covered, therefore omitting the mutation distinguishing haplotypes A+ and A-
(position 28 of the humpback whale D-loop based on Genbank reference
sequence NC_006927). The D-loop primer system was later optimized to overlap
with previously published sequences for whale haplotypes. Additionally, primers
WL-F86 and WL-F167 were developed to replace WL-F101 and WL-F320, which
were located on polymorphic regions. Primers were designed using NetPrimer©
(PremierBiosoft International, Palo Alto, USA). Because the analysed part is
missing these variable sites, the nomenclature of the final haplotypes includes
the haplogroup as used widely in humpback whale genetics, followed by a simple
numbering to distinguish different haplotypes.

127
Table 7: D-loop Primers used
locus Name 5'-3' sequence length
D-loop
WL-F86 AATTCGTGCATGTATGTACTACCACTAA 28
WL-F167 CACCACGAGCAGTTAAAGCTC 21
WL-F22 CCACCATCAGCACCCAAAGC 20
WL-R258 TGCTCGTGGTGTARATAATTGAATG 25
WL-F360 TATGTATAATCGTGCATTCAATTAT 25
WL-R569 GCGGGTTGCTGGTTTCAC 18
WL-F101 TGTACTACCACATAACCAACTGATAGCA 28
WL-R308 ATCTAATGGAGCGCCCATAGAGATC 25
WL-F322 AGCATGCCGCGTGAAACCA 19
WL-R588 CTGAGTCCGTGCAAGCCC 18
Sequencing
Primer
WL-F22s CTCAGCACCCAAAGCTGAAATTCTA 25
WL-R258s GAATGCACGATTATACATCTCTAGG 25
WL-F86s ATAGCACCTTCCATGGGTATGTATA 25
WL-F101s AACTGATAGCACCTTCCATGAG 22
WL-R308s AGCGCCCATAGAGATCATTTGAC 23
WL-F322s GTGAAACCAGCAACCCGCTT 20
WL-R588s ATACCAAATGTATGAAACCTCAG 23
PCR was carried out in 30 µl reactions per sample as described in
Chapter three. The PCR was run under the following conditions: 94°C/ 5 minutes
followed by 60 cycles of 45 seconds at 94°C, 30 seconds at 54°C and 40
seconds at 64°C. The final extension was at 72°C for 10 minutes. PCR
amplifications that failed initially were re-amplified using an annealing
temperature of 52°C.
The presence of PCR amplicons was established on a 2% agarose gel
with SyBrGreen stain. Positive PCR reactions were purified using a Qiaquick
purification column (Qiagen, Hilden, Germany) following the manufacturer’s
manual. Samples were sequenced at McMaster University’s sequencing facility
and Macrogen Ltd in Seoul, South Korea, using either the forward or reverse
primer (Table 2). To optimize the sequencing result, nested sequencing primers

128
were designed located approximately 10 bp to the 3’ end of the original PCR
primer.
All sequences recovered from each individual sample were aligned in
ChromasPro© and the final sequence was exported to Bioedit. Variable sites
were exported to an Excel spreadsheet to confirm the haplotype designation.
Haplotypes were assigned by comparing the ancient DNA sequences to data
published in the NCBI Genbank and by using published description of haplotype
and haplogroup features (Medrano-Gonzales et al. 1998). Specific haplotype
designations for haplotype F were provided by Baker and Steel (Splash, 2010,
CS Baker, D.Steel pers.comm) Because different research groups have used
variations of beginning and end points of the D-loop sequence, the final overlap
of modern and ancient DNA was 344 bp (Figure 5), truncating the F322/R588
sequence.

129
Statistical Analysis
Statistic analyses, included bayesian coalescence analysis and a unique
sequence tree were carried out using the BEAST software package V1.6 and
V1.7 (Drummond and Rambaut 2007, Drummond et al.2012) while population
statistics was calculated using Arlequin V1.5 (Excoffier et al. 2007). The
appropriate substitution models for tree and skyline plot were chosen using
jmodeltest (Posada 2008).
The BEAST (Bayesian Evolutionary Analysis Sampling Trees) program
package implements Bayesian MCMC algorithm (Drummond et al. 2002,
Drummond and Rambaut 2007) for phylogenetic and demographic analysis. In
BEAST priors are optimized to infer posterior probabilities of the model
parameters using Bayesian statistics. The MCMC (Markov Chain Monte Carlo)
algorithm is “a stochastic algorithm that produces sample-based estimates of a
target distribution [in this case posterior distribution] of choice” (Drummond and
Rambaut, 2007; Drummond et al.2002)
The outcome of the chain is then used as a sample parameter. A long
chain creates a well mixed distribution, meaning the estimate is more accurate.
Bayesian re-analyses the probability of an outcome based on certain prior and
posterior information under inclusion of phylogenetic models (Salemi et al. 2009).
The Bayesian MCMC algorithms eventually can weight trees based on their
posterior probability. Since the age of the sample can be included in the
analyses, BEAST is ideal for the analysis of ancient DNA datasets.

130
The Bayesian skyline plot was produced to detect changes in population
size over time. For this step, all 105 ancient DNA sequences were used and
combined with a partial population set from GenBank (PopSet: 289473606),
published by Jackson et al. (2009). The final size of the dataset used for the
skyline plot included 124 samples in total spanning 344 bp.
In subsequent analysis, the dataset was adapted to test the robustness of
the skyline plot result. Instead of the entire 105 aDNA sequences, 46 were used
based on the MNI analysis (Table 12: changes in genetic diversity based on
minimum and maximum estimated individuals). In addition, datasets were run
with 70 and 35 sequences, removing the first 500 years because this time frame
appeared to have been sampled unevenly based on the genetic diversity indices
(Table 12). Because no modern dataset was available and the Jackson dataset
may not be optimal, runs were carried out with (1) samples from Washington and
Oregon only(n=19) (2) samples from Washington, Oregon and Mexico (n=100)
and (3) the entire popset from Jackson et al (n=100, same as (2)) and a popset
from Alaska (Jackson et al.2009). None of the tested alternatives provided a
more reliable skyline plot than the initially one.
The clock was not fixed to any published mutation rates because the data
contained ancient DNA data. Since ancient mutation rates may vary from modern
clock rates, the estimated clock might be the more accurate because the
substitution rate increases when ancient DNA data is added to a dataset (Kuhn,
pers. comm. 2009, Ho et al. 2005, Navascues et al. 2009). Previous studies used
substitution rates between 1.5 x10⁻⁸ bp-1 year-1 to 2.0x 10⁻⁸bp-1 year-1. (Roman

131
and Palumbi 2003), with the latest published substitution rate for the whale D-
loop being 3.9% per million years( (Jackson et al. 2009).
The Bayesian skyline plot was calculated using HKY+G as a substitution
model (Hasegawa et al. 1985, Yang 1993). The tree prior settings for the initial
analysis was the constant population size with 15 groups and a piecewise
constant skyline model. Operator weights were changed as follows for the skyline
plot: up/down substitution rate, subtree and narrow exchange: number of taxa/2,
wide exchange and wilson balding number of taxa/10 (Kuhn, pers. comm. 2008).
All other operator weights were left at a default rate or adapted based on
recommendations from previous runs. For the statistical analysis in BEAST,
dates before present (in full years) were attributed to the samples. The dates
were based on radiocarbon dates of the layers, or the relative dates of the layers
provided with the samples. Dates for Huu7ii were provided by Alan McMillan
(pers. com. 2009). Each analysis was run with 95 million MCMC steps to ensure
the chains converged to a stationary state. The 95 million iterations were
sampled every 9500 steps with an initial burn-in of 10%. The final analysis was
run five times to allow the MCMC to start from different points (called “seeds”).
The results of the BEAST runs were imported in Tracer 1.5 (Rambaut and
Drummond 2005). Tracer was used to create the Bayesian skyline plot output
graph. A Bayesian skyline plot was created in Tracer to estimate the effective
population size of the ancient dataset. The Tracer output of the population size
over time was exported into Excel (Microsoft Office 2007). The MCC (maximum
clade credibility) tree of the skyline plot was created in Tree Annotator (part of the

132
BEAST package) with a 10% burn-in and visualized using FigTree. The tree in
FigTree was rooted at midpoint.
A tree with unique haplotypes was calculated using BEAST with linear
population size change and an HKY+G model. For this step, the dataset for the
Bayesian skyline plot was truncated to unique sequences only. The final dataset
for the tree file was N=17 of both ancient and modern samples, and finback
(NC_001321; GI: 5819095) as outgroup. Results were evaluated in Trace V1.5 as
described for the skyline plot, and the tree was created in FigTree.v 1.3
(http://tree.bio.ed.ac.uk/). BEAST analyses were carried out on the Bioportal
(www.bioportal.uio.no) cluster and the computational biology service unit
(http://cbsuapps.tc.cornell.edu, Beast@BioHCP) at Cornell University.
Genetic diversity indices, specifically haplotype and nucleotide diversity,
Tajima’s D (Tajima 1989) and Fu’s Fs (Fu 1997) were calculated using Arlequin
1.5 using the frequencies of the haplotypes of the dataset used for the BEAST
skyline analysis. These indices were compared to modern published data. In
addition, possible changes of genetic diversity were tracked over time, following
Borges (2007) study on bowhead whales (Table 12).
Results
In total, 105 samples were completed for the D-loop fragment and
included in the analysis. 70 additional samples identified as humpback whale in
the archaeological dataset originally provided were not included because not all

133
samples had a complete and reproduced sequence. In addition, samples were
included despite a full profile if the authenticity of the haplotypes was in question.
However, results suggest that the 105 samples provide an accurate cross-section
of the archaeological whale population. The D-loop fragment used for this
analysis covers most of the consensus sequence but is missing the first 100bp
due to an alignment error early on. Because of this, haplotypes A cannot be
distinguished from A-, but this does not invalidate the analysis. To create the
highest possible overlap with published data, the alignment (Table 9) was
truncated to cover a length of 344 bp from position 120 to position 464 on the
humpback whale D-loop (Sasaki et al. 2005). A total of 13 haplotypes were found
in the ancient DNA dataset among 105 samples (Figure 5). Except for three
unique haplotypes, all haplotypes found here are extant and published in
Genbank. All of the new haplotypes are in the CD clade and are different from
the next known haplotype by 1 bp. While CD1 was found in PH209 only, CD4
and CD5 are found in 2 and 3 individuals respectively. The differences of the
haplotypes were confirmed through repeat sequencing. The three major
haplotypes were found in 23, 28 and 29 individuals respectively. All other
haplotypes are found in low frequency of 6 individuals or less. Haplotypes
present in the analysed dataset belong to the CD and AE clades as published by
Baker and others (Baker et al. 1994, 1998, Baker and Medrano Gonzalez 2002).
The distribution in A (27.6%), E (40.9%) and CD (31.4%) haplogroups differs
from the distribution reported from the California/Oregon/ Washington population
as well as the southeast Alaskan population. As discussed below,

134
Washington/southern BC used to be clustered with California/Oregon but have
lately been considered separate feeding aggregations (Witteveen et al. 2009).
California’s humpback whale population has 43% E and 50% CD with a total of
12 haplotypes (Witteveen et al. 2004, Baker and Medrano-Gonzalez 2002). On
the other hand, southeast Alaska has a reported 100% A, and no CD or E
samples (Witteveen et al. 2004). None of the samples analysed in this study that
are dated to older than 3000 BP display the A haplotype, although the sample
size may be too small with only 19 samples.

135
Figure 5: tree of samples used in this study. Ancient haplotypes (red arrows) were not found in Genbank. Modern samples (pink) N=19 from Jackson et al (2009)
C/D
A/E
Modern Washington/ Oregon
Modern Washington/ Oregon
Modern Washington/ Oregon
Red arrows: new haplotypes (CD5, CD4, CD1)
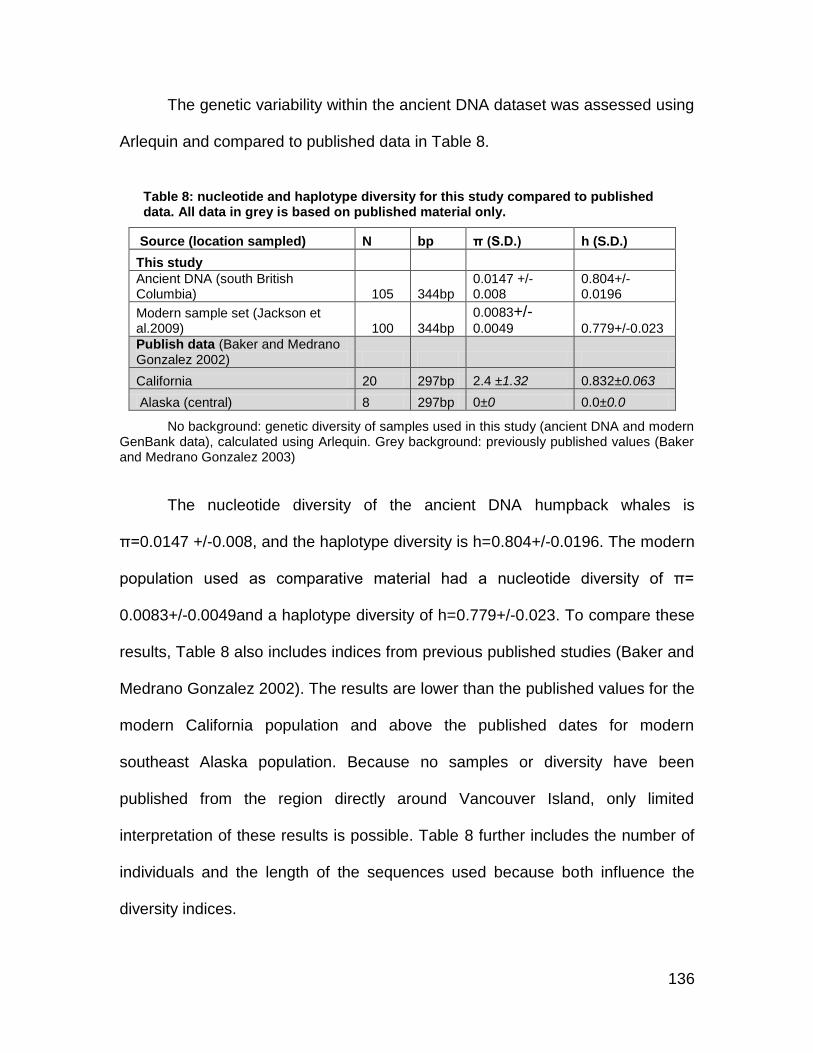
136
The genetic variability within the ancient DNA dataset was assessed using
Arlequin and compared to published data in Table 8.
Table 8: nucleotide and haplotype diversity for this study compared to published data. All data in grey is based on published material only.
Source (location sampled) N bp π (S.D.) h (S.D.)
This study
Ancient DNA (south British Columbia) 105 344bp
0.0147 +/- 0.008
0.804+/- 0.0196
Modern sample set (Jackson et al.2009) 100 344bp
0.0083+/-0.0049 0.779+/-0.023
Publish data (Baker and Medrano Gonzalez 2002)
California 20 297bp 2.4 ±1.32 0.832±0.063
Alaska (central) 8 297bp 0±0 0.0±0.0
No background: genetic diversity of samples used in this study (ancient DNA and modern GenBank data), calculated using Arlequin. Grey background: previously published values (Baker and Medrano Gonzalez 2003)
The nucleotide diversity of the ancient DNA humpback whales is
π=0.0147 +/-0.008, and the haplotype diversity is h=0.804+/-0.0196. The modern
population used as comparative material had a nucleotide diversity of π=
0.0083+/-0.0049and a haplotype diversity of h=0.779+/-0.023. To compare these
results, Table 8 also includes indices from previous published studies (Baker and
Medrano Gonzalez 2002). The results are lower than the published values for the
modern California population and above the published dates for modern
southeast Alaska population. Because no samples or diversity have been
published from the region directly around Vancouver Island, only limited
interpretation of these results is possible. Table 8 further includes the number of
individuals and the length of the sequences used because both influence the
diversity indices.

137
Table 9: unique haplotypes found in 105 ancient DNA sequences.
absolute location
1561
2
1562
0
1563
2
1564
8
1572
5
1573
2
1573
3
1573
4
1574
9
1575
0
1575
1
1575
2
1575
3
1575
5
1575
9
1580
2
1580
3
1586
6
relative position
5
13
25
41
118
125
126
127
142
143
144
145
146
148
152
195
196
259
NC_006927, Sasaki_et_al.2005 C G T T G T C C G T C C A C A T C C
haplotype
aDNA sample freq N
A1 PH217 0.27 28 . . . . . . . . . . . . . T . . . .
A2 PH249 0.01 1 . . . . . . . . . . . T . T . . . .
E1 PH203 0.27 29 . . . . . . . . . . . . . . . . . .
E2 PH208 0.06 6 . . . . A . . . . . . . G . . A . .
E3 PH199 0.03 3 . . . . . . . . . C . . . . . . . .
E4 PH271 0.05 5 . . . . . . . T . . . . . . . . . .
CD1 PH209 0.01 1 T A C C . C . . . . T . . T G . T .
CD2 PH213 0.01 1 T A C C . C . . . . T . G T G C T .
CD3 PT219 0.23 23 T A C C . C T . . . T . . T G C T .
CD4 PT076 0.02 2 T A C C . C . . A . T . . T G C T .
CD5 PT089 0.03 3 T A C . . C T . . . T . . T G C T .
CD6 PT096 0.01 1 T A C . . C . . . . T . . T G C T .
CD7 PT125 0.02 2 - - - C . C . . . . T . . T G C T T
Bold: unique haplotypes (CD1,CD4,CD5) not identified in GenBank. dots in this matrix display an agreement with the top sequence which is the reference sequence published by Sasaki et. al. 2005.

138
Figure 6: Bayesian skyline plot. X-axis=time (moving backwards in time from left to right); Y-axis =population size. Black line= mean values; blue area= upper and lower 95% confidence interval.

139
Table 10: changes in population size. All values are raw data (=Ne*tau)
mean (upper and lower 95%CI)
Time* Run A Run B Run C Run D Run E
Mean (all runs)
0 33679 (224305-411)
31274 (200301-419)
44586 (285391-829)
34832 (237876-403)
39597 (260375-506)
37275
(241650-514)
500 14550 (37671-4157)
14495 (39128-3584)
15417 (51457-2680)
14521 (37757-4142)
13704 (35710-3806)
14549
(40345-3674)
1000 28819 (74907-8061)
30191 (83217-8181)
25868 (69191-6526)
28736 (73898-8064)
28507 (76764-8175)
28150
(75595-7802)
2000 31652 (83688-9169)
29691 (79449-8450)
28974 (80269-7509)
31143 (80912-9101)
30494 (82955-9143)
30784
(81454-8675)
3000 32495 (92075-9021)
29728 (78321-7980)
29252 (80872-8042)
31919 (89227-8916)
29558 (79906-8625)
31144
(84058-8517)
4000 29462 (82159-8178)
27247 (74639-7936)
27227 (75195-7761)
28706 (79345-8191)
27117 (75941-7687)
28395
(77456-7951)
5000 27768 (78950-8136)
25605 (67785-7573)
25067 (67836-7288)
27176 (75927-8069)
25765 (68248-7668)
26709
(71749-7747)
6000 26676 (73273-8454)
24590 (61003-7851)
23164 (59822-6834)
26000 (67852-8328)
24973 (63729-8071)
25498
(65136-7908)
Bayesian skyline plots estimated the substitution rate as above the
published rate of 3.9% (between 4.3% and 4.7% depending on the run). All ESS
values were around or above 200 for runs with 95 million chains. The substitution
rate of 4.3%, being above the modern published rate, has been reported in
ancient DNA studies before. Navascues proposed that this elevated rate could
be a real change in molecular clock rate in older samples, citing the time
dependency of molecular rate theory by Ho et al. (2009), but that it could also be
attributed to an oversimplification of population demographic models, for example
as in this case assuming that all individuals sampled over 5000 years belong to
the same population (Navascues, 2009). The elevated mutation rate could simply

140
be due to the fragment use in this study, using the highly variable 3’ end but not
the less variable part of the cetacean control region.
The Bayesian skyline plot results (Figure 6) indicate a stable population
size up to about 1000 BP (Tables 10 and 11). After a decline in population size
after 1000 BP, the population size increases and exceeds this level in modern
times. While this appears to fit the recorded past of humpback whales as the
reduction in population seems to coincide with industrial whaling, the reasons for
the decrease may be due to sampling strategy. Specifically the change in
population size around 1000 BP may be due to a sampling error of the original
dataset, as discussed below, in the context of the number of individuals (Table
12). The decrease has to be taken with caution though because changes of the
population size range within the 95% confidence interval. The most recent
change as well as the increase of the 95% confidence interval may be due to the
use of a popset (Jackson et al. 2009) that is not from the same precise
geographic area as the ancient DNA samples. Using the ancient DNA dataset
alone for a Bayesian skyline plot analyses results in the same long term stable
population size as the dataset discussed here.
The Bayesian skyline plot result includes a relatively wide 95% HSP and is
almost completely flat. Flatness and large confidence interval are both indicators
of a locus with low information content and a poor fitting model. Alternative priors
yield the same results (Figure 7), supporting the result that the here used dataset
does not have the amount of information needed to correctly infer the past
changes in population size.

141
A
B
C
D
Figure 7: comparison of skyline plots: linear and constant population size prior. 35 ancient DNA samples. A and B: Washington Oregon (n=19), C and D: Washington, Oregon and Mexico (n=100) A and C=constant prior, B and D linear prior

142
The value on the y-axis of the skyline plot equals the breeding population
size (Ne) multiplied by the generation length (tau). To calculate the effective
breeding population Ne, this number is divided by the generation length.
Because different generation lengths are published, the equation in Table 11 was
repeated to cover the span in generation length (Slijper 1979, Perrin et al. 2002,
Clapham and Baker 2002), including the lower value of tau=12 used by Roman
and Palumbi (2004).
Table 11: effective population size based on Bayesian skyline plot
time Ne*tau (Table 10) Ne
tau=12 tau=16 tau=18 tau=20
0 37275 3106.3 2329.7 2070.8 1863.8
500 14549 1212.4 909.3 808.3 727.5
1000 28150 2345.8 1759.4 1563.9 1407.5
2000 30784 2565.3 1924.0 1710.2 1539.2
3000 31144 2595.3 1946.5 1730.2 1557.2
4000 28395 2366.3 1774.7 1577.5 1419.8
5000 26709 2225.8 1669.3 1483.8 1335.5
6000 25498 2124.8 1593.6 1416.6 1274.9
Number of Individuals analysed
The approach to control for the re-sampling of individuals was a
correlation between location, species/haplotype, and time. Specifically, if two
samples were from the same location (unit, layer and level) and were identified
as the same species, they were assumed to be the same individual. In particular,
several samples in the Ts’ishaa sample set were labelled by the excavating
archaeologist as “may be the same individual or bone” (Table 8 and Appendix A).

143
In some cases, the samples’ species identification designated the individuals as
different species. In other cases, only one of the two bones yielded amplifiable
DNA. However, with the size of a whale and the cultural tradition of sharing a
hunted whale, it is more than likely that the same individual would be found in
more than one location, and therefore possibly in more than one site.
Using species identification, D-loop sequence polymorphism and
zooarchaeological analysis, in correlation with the location in time and space
helps to distinguish between broken bone fragments. Using the DNA results
presented here, possible additional data were produced. Because no method of
counting would have been perfect, the approach was to count samples
repeatedly, distinguishing the database in various ways. Sorting the samples in
the database “by provided time across all sites” or alternatively “by unit only”
would be the worst case scenario, unlikely given the amount of whale bones
present. However, differentiating by time and location should produce a more
likely result given the amount of whale bones found at the sites, as well as
ethnographic data regarding whaling in Barkley Sound (see Chapter 2 and
Background of this chapter for details). In addition, the similar species distribution
between Huu7ii and Ts’ishaa supports that sampling was random enough to
create an accurate result.
The best case scenario was the calculation of individuals per layer
(instead of time) per unit. The assumption in this case was that the quantity of
whales on site must account for a larger quantity of whales. This would prevent
one bone from being sampled multiple times, but would also account for the
144
overall observation of the large quantity of whale bones at Ts’ishaa and Huu7ii
that, as mentioned before cannot be based on few whales (e.g one whale per
layer) being hunted (Monks 2001, Monks et al. 2001).
Utilizing the worst case scenario as described above would assume few
whales being butchered and shared between sites and a higher fragmentation
rate per whale. The worst case scenario does not match descriptions published
by early ethnographers; nor does the archaeological record of whale bones
support a hypothesis like this. The best case scenario accounts for many whales
being caught and a low inter-site distribution between Tseshat and Huuayhat. It
is possible that different whale species are represented slightly differently. The
amount of whale bone is related to the size of the whale, but also to the
procurement method; that is, drift whales should be represented less frequently
because these specimens were not necessarily butchered immediately but were
decomposing from the inside out, in some cases making only the very outer layer
consumable (Monks 2001). In addition, some whales were more suitable for oil
extraction than others, which should account for more bone material on site.

145
Table 12: changes in genetic diversity based on minimum and maximum estimated individuals
Min Max Complete
sequences All times 48 90 105
haplotype diversity 0.88(0.002) 0.813(0.02) 0.804(0.0196)
nucleotide diversity 0.018(0.009) 0.0168(0.009) 0.015(0.008)
Tajimas D 1.25 0.913 1.13
Fst 0.37 1.58 1.87
5000-3000
sequences 4 9 9
haplotype diversity 1.0 (0.17) 0.77(0.11) 0.77(0.11)
nucleotide diversity 0.0228 (0.016) 0.017(0.01) 0.017(0.01)
Tajimas D 1.67 1.43 1.43
Fst -0.094 2.77 2.77
2000-1000
sequences 18 22 25
haplotype diversity 0.928 (0.034) 0.905(0.035) 0.88(0.035)
nucleotide diversity 0.020(0.011) 0.02(0.011) 0.019(0.01)
Tajimas D 1.25 1.48 1.47
Fst -0.58 0.19 0.53
1000-200
sequences 26 59 71
haplotype diversity 0.87(0.03) 0.77(0.028) 0.76(0.029)
nucleotide diversity 0.017(0.009) 0.014(0.007) 0.013(0.007)
Tajimas D 0.87 0.78 0.74
Fst 0.91 2.32 2.55
1000-500
sequences 21 41 48
haplotype diversity 0.88(0.039) 0.79(0.034) 0.79(0.03)
nucleotide diversity 0.017(0.009) 0.016(0.009) 0.016(0.008)
Tajimas D 0.75 1.14 1.217
Fst 0.33 2.13 2.53
500-200
sequences 5 18 23
haplotype diversity 1.0(0.126) 0.66(0.08) 0.54(0.104)
nucleotide diversity 0.018(0.012) 0.006(0.004) 0.0051(0.0035)
Tajimas D -0.628 -1.79 (p=0.03) -1.94 (p=0.01)
Fst -1.14 0.46 0.23
The p-value for Tajimas D and Fst value is only shown if the value is significant. For the haplotype and nucleotide diversity, the standart deviation (SD) is shown in brackets.
The results of the re-sampling (MNI) estimates found in Table 12 can be
used to estimate the impact of re-sampling an individual multiple times by
comparing the total values to the lowest and highest estimates of individual
counts. The minimum number is based on time periods by site, with the time
period as provided in the database, but ignoring excavation units. The maximum
146
estimated number is based on unit and layer, taking provided time periods into
account. Except for the instances when the sample size drops to the number of
haplotypes, the genetic diversity varies very little between the minimum,
maximum and total sample number.
While this table cannot unambiguously establish the number of individuals
tested, Table 12 shows that a possible re-sampling did not bias the genetic
diversity established using all 105 bone samples. Based on archaeological and
ethnographic data, it is unlikely that nearly 50% of the dataset is based on re-
sampling.
The SRY system successfully co-amplified ZFX and SRY. Initial, not
reproduced tests suggest a ratio of 60:40 in favour of male individuals. This result
is based on fragment length identification. While the sequenced amplicons were
identifiable as the appropriate loci, this system would have required extensive
troubleshooting and no conclusive sequence analysis towards different allels was
made. Forty-three out of 62 tested samples (71%) yielded amplifiable nuclear
DNA over the course of this study.
Discussion
The aim of this study was to investigate the humpback whale population
present in Barkley Sound pre-industrial whaling including the genetic diversity,
possible changes over time, and an estimate of the population size based on
ancient DNA data analysis. Results indicate that despite large scale whaling

147
operations in the North Pacific that killed an estimated 28 000 animals over a
time of 60 years (Nichols et al. 2002), genetic diversity did not change
substantially. Comparisons between early (5000-3000) and late (2000-500)
samples indicate little change over a period of 5000 years in terms of population
genetic diversity. Population size estimated using ancient DNA data matches
previous published data (Rice 1978, Perry et al. 1990, Baker 1993). Based on
the current knowledge of the complex migration patterns in the Northeastern
Pacific, the here calculated population estimate is likely a partial estimate, and
not equal to the complete North Pacific population, in part because this study
only used one feeding ground. Adding feeding grounds to the ancient DNA
dataset would likely change the final number. In addition, results indicate that the
344bp used in this study do not yield the amount of information needed to infer
changes in population size in the past. Additional loci are needed to accurately
past population dynamics. Nevertheless, these results are an important insight
into past humpback whale population changes over time, and will provide an
important line of evidence towards our understanding of pre-industrial whaling
population size and diversity, as discussed below.
Genetic diversity
The population genetic diversity in this dataset display similar levels to the
genetic diversity found in most North Pacific feeding grounds today (Baker and
Medrano-Gonzalez 2002), indicating that the mitochondrial genetic diversity was
not lost through industrial whaling. Haplotypes found herein are, with few

148
exceptions, found in modern Pacific whale samples published in GenBank®.
Haplotypes absent from North Pacific datasets today are found in the ancient
DNA dataset in low frequency, even if found in several time periods. Haplotypes
found in low frequencies are lost in a population more easily through genetic drift,
and do not necessarily indicate a substantial loss or change in population size.
The three unique sequences found in four individual samples are closely related
to the common haplotypes by 1 and 2 base pairs difference (0.3% and 0.6%
difference respectively). Due to the low frequency, these sequences could
reasonably be discovered in future studies of modern humpback whales.
The lack of change in diversity was expected for several reasons.
Humpback whales have a long generation length (16-20 years), a life expectancy
of over 40 years and an overall slow mutation rate. The time elapsed since
industrial whaling is less than 45 years (1966 but whaling continued in some
areas beyond that date), which suggests that two generations or more of the
animals are probably still alive. Consequently, industrial whaling caused either no
change in genetic diversity, or a change that will become detectable in the future.
The hypothesis that genetic diversity has not changed despite large scale
hunting has been discussed previously by Amos (1996) as well as Baker (1995).
According to the research and theories provided, human impact happened too
recently to have had a substantial impact on whale populations and the mutation
rate of the humpback mtDNA was too slow. Based on the slow mutation rate, and
the recent halt of industrial whaling, a low genetic diversity of modern populations
consequently would not be an outcome of industrial whaling but it has to be

149
expected that the genetic variability likely remained at the same level as before.
Amos argues that the lack of change in genetic diversity does not imply a healthy
population and that protection is still warranted: “Inbreeding could be an
important factor capable of slowing or preventing recovery, and it is clearly
desirable to identify cases where this is so” (Amos 1996 p.658).
Even over a period of nearly 5000 years, the genetic diversity did not
change substantially, which supports a stable population over this period. The
change in genetic diversity in the subset between 500-200 BP is potentially due
to sampling error, as this is the subset with the most loss of samples (down to
21%) during the MNI testing (Table 12). If this is the case, the drop in population
size calculated in the BEAST analysis is an effect of this sampling error instead
of industrial whaling.
While the genetic diversity for south British Columbia has not been
published yet, both California/ Oregon as well as southeast Alaska/ northern BC
have been documented. Haplogroup variation matches the variation found in BC
today (Baker pers.comm 2010; Witteveen 2004), supporting the hypothesis that
southern BC is part of an independent feeding ground, and that the modern
population is part of the original population found in BC prior to industrial whaling.
Previous theories included an overlap of adjacent feeding grounds or a post-
whaling expansion into empty areas coming from California or Alaska. Indeed,
Witteveen’s (2009) research using stable isotopes suggests that whales in British
Columbia are difficult to distinguish from the California/Oregon whales.
According to Medrano-Gonzales and Baker, the clinal haplotype frequency

150
might be due to an expansion of North Pacific humpback whales northwards after
the retreat of the last glaciations (Baker and Medrano-Gonzalez 2002, Medrano-
Gonzalez et al. 1995). The population analysed in this study falls neatly between
California/Oregon and southeast Alaska feeding grounds in terms of haplotype
distribution. The Alaskan region is the most extreme in terms of cline with almost
exclusively AE haplogroup present (Witteveen et al. 2004). Most likely, this is a
post-glaciations founders effect, with a small population migrating into this area
after the feeding ground became accessible after 10 000 BP. Climate change
may have had a similar effect on humpback whale populations as on seal
populations. Based on zooarchaeological data by Crockford and Frederick
(2007), this happened to fur seal populations found before and after glaciers
retreated around 4000 BP (Crockford and Frederick 2007). During the previous
contraction of feeding and breeding area, the opportunities for gene-flow within
the southern hemisphere were higher (Medrano-Gonzalez et al. 1995). The
absence of haplogroup A in the earliest layers could be a stochastic error due to
the low sample size (19 samples), or a sign of a change in population structure in
the past. Further analysis of a larger sample set dating to 5000-3000 BP and
older would reveal whether haplogroup A can be found this early or whether the
haplotype diversity changed prior to 2000 BP. The hypothesis that intensive
hunting has reduced the genetic diversity is not supported by the dataset
analysed here.
Whether the reduction of the population has lead to a bottleneck has been
part of cetacean research from the beginning (Baker 1995, Amos 1996). The

151
results reported here are in concordance with previous findings, suggesting that
there was no major loss in mtDNA genetic diversity in the region due to industrial
whaling. While further studies are needed to explore the nuclear DNA genetic
diversity of past whale populations, studies thus far have found that the current
microsatellite diversity is largely matching mtDNA diversity (Roman and Palumbi
2003, Palsboll et al. 2004, Palumbi and Roman in: Estes 2007). Ancient DNA
research should therefore concentrate on potential changes in migration pattern
and the independence of feeding grounds.
Despite the lack of changes in mtDNA diversity, Amos notes that a
reduction in population size could potentially increase the frequency of previously
rare deleterious genes, making a possible future extinction more likely.
Additionally, current climate change will likely be in direct competition with the
potential whaling industry.
The implications of reducing higher trophic level mammals from the
marine community have been for example recorded in the case of sea otters in
the Northeast Pacific. Here, the hunt of sea otters, beginning with Aboriginal
hunters and increasing with fur traders, led to a depletion of sea kelp due to an
increase in sea urchins whose predator, the sea otter, had been removed. With
the recovery of sea otters, the kelp forest on the North Pacific Coast recovered
as well (Estes 1998, 2007, Springer 2008). Based on this example, the whale
population may not be the only species at risk in the marine environment.
Modern whales present in southern British Columbia are either remnants
of the archaeological population, or are migrating into an empty feeding ground

152
after the population previously present was wiped out. If the current population is
moving into an empty area, the genetic diversity of the stock in southern British
Columbia should match the California/Oregon/Washington feeding aggregation.
California/Oregon is more likely than Alaska because previous research has
suggested the similarity of humpback whales in this area to the California/Oregon
feeding ground (Witteveen 2009), based on stable isotopes. If this is the case,
the haplotype diversity should be different from the ancient population. However,
if current whales are remnants of a pre-industrial whaling population migrating
into Barkley Sound, a continuity of genetic diversity and haplotype diversity
should be visible. Today’s stocks (Baker and Medrano-Gonzalez 2002) may have
had more overlap prior to industrial whaling based on population size, and the
presence of an intermediate population in British Columbia is therefore possible.
In all scenarios, a severe bottleneck would potentially have left the species
with a low genetic diversity. A similar assumption was made prior to this study of
Northeast Pacific humpback whales. However, genetic diversity of ancient and
extant population suggests that the historic “bottleneck” was passed without
creating a detectable genetic bottleneck.
Two different roads of recovery are visible in humpback and right whale
populations. Neither humpback whales nor right whales exhibit a loss of mtDNA
genetic diversity, but the right whale populations remain at a low population
density. If humpback whales have retained their genetic diversity, the population
should theoretically be able to recover.
While this is the first study involving humpback whales and the first study
153
in the Northeast Pacific, research has been published involving historic whale
bones. Through these recent studies, which compare different species, biologists
can investigate how or why species recover, and how far this recovery is linked
to pre-industrial whaling genetic diversity.
Two other studies looking at historic and pre-historic whale bones in past
years have come to similar results in terms of genetic diversity. For example,
Borge (2007) investigated the genetic diversity of 99 bowhead whales collected
in Spitsbergen, concluding that the ancient bowhead whale population had a
similar genetic variability despite a severe decline in population, and suggesting
a migration between stocks around Spitsbergen and the Chuckchi-Beauford
Stock (Borge 2007).
In an ongoing study, Anderung et al. (presented at ISBA 2010 in
Copenhagen and pers. comm. 2010) sampled sperm and blue whale individuals
from museum samples at the Natural History Museum in London. These samples
were collected during industrial whaling in the eighteenth and nineteenth century.
In their study, Anderung et al. found 24 new haplotypes in blue whale samples,
but no increase in genetic diversity for sperm whale samples. Estimates for blue
whales suggest that the population was reduced from 239 000 animals in the
Antarctic to 360 individuals in 1960. Today, the population has recovered to 2280
individuals. On the other hand, sperm whales had an estimated 1.1 million
individuals. This population was hunted in two steps, both with open boat and the
full industrial use of exploding harpoons. In the end, an estimated 360 000
animals were left in the ocean (Whitehead and Planck 2002).

154
While only ancient DNA can accurately test the pre-industrial whaling
population genetic diversity, the population size did not change from earlier
estimates that were based on modern samples. Generally, both ancient and
modern estimates are relevant to modern biologists and conservation to identify
the current population levels and to estimate appropriate hunting quota in a
changing habitat of the twenty-first century.
The finding that genetic diversity was similar over the past 4000 years
without any significant loss due to commercial whaling explains the swift recovery
and the growth rate of 4-7% annually (Calambokidis et al. 2008).
Population size
Based on conventional information, the North Pacific humpback whale
population was reduced to an estimated 1500 individuals by 1960, but today has
grown to 18 000 to 20 000 individuals (Calambokidis and Barlow 2004). Initial
population size estimates (Rice 1978, Perry et al. 1990, Baker 1993) for North
Pacific humpback whales were between 15 000 and 20 000 animals prior to
industrial whaling. The analysis of the ancient DNA data suggests genetic
diversity has not changed much through industrial whaling. Using Bayesian
skyline plot analysis, the estimated effective population size prior to industrial
whaling in Barkley Sound was between 1500 and 2500 individuals. However, the
analysis also indicates that the d-loop did not have sufficient coalescence
relevant information to construct a reliable skyline plot, suggesting that additional
loci are needed to investigate the pre-industrial whaling population size of

155
humpback whales in the North Pacific.
An annual population increase of 4-7% was reported in 2009, based on
data collected during the SPLASH project (Calambokidis et al. 2008). While the
overall rate appears to show that humpback whales have recovered well, the
complexity of feeding and breeding ground populations has left specific groups at
risk. For example, the feeding aggregate of Washington/southern BC (of which
Barkley Sound is part of) is an estimated 200-400 individuals while northern
BC/southeastern Alaska is an estimated 3000-5000 individuals (Calambokidis
2008, 2009). Similarly, Eastern Pacific humpback whales found off Japan are
believed to be at a vulnerable low density.
The possible increase in population has been modeled by Zerbini et al.
(2010) and increase rates of 7-8% per year were described as based on
“optimistic parameters”. Higher estimates published previously were deemed
unlikely to impossible (Zerbini 2010, Clapham 2001, Mizroch 2004,
Gunnlaughsson and Sigurjonsson 1990). In cases with very high observed
population growth rates, other factors such as the increase in observation or
migration between populations might have played an important role (Zerbini
2010). Retaining their population genetic diversity may help the surviving
humpback whale population to rebound faster towards pre-industrial whaling
levels. If current population sizes exceed the estimated pre-whaling population
size without indicators of a halt or reduction in growth rate, it is likely that the
previous size has not been reached yet (Palumbi 2002).
While the Bayesian skyline plot indicates a long term stable population

156
size, further analysis reveals that the d-loop region used in this study lacks the
information to accurately infer the past population size of humpback whales.
Neither a change in modern or ancient DNA dataset nor a change in tree priors
modified the outcome of the skyline plot substantially. Additional analysis were
run with 70 ancient DNA samples, removing the 0-500BP time zone that may be
a mischaracterization of the population due to sampling error and 35 ancient
DNA samples which was the minimum number of individuals without the last 500
years as well (table 12).
If this dataset, which includes temporal data ranging from 500 to almost
5000 years is not informative enough because the first 344bp of the humpback
whale d-loop was used, modern conservation efforts relying on the same
fragment may misestimate the past population size and carrying capacity, which
in the worst case scenario would threatened a vulnerable population by
overharvest. Roman and Palumbi (2003) already pointed out the need for
additional loci to be included to provide a more accurate population size
estimate.
In the case of humpback whales, the d-loop sequence lacks the amount of
information necessary to create a reliable population demographic. The flatness
of the skyline plot points towards a lack of coalescence historic relevant
information, as does the high 95% HSP. The lack of evolutionary information is
partially due to the long generation length of 16-20 years and the general slow
mutation rate. As Baker and others pointed out before, these may be reasons
why a change in population genetic diversity cannot be detected (e.g Baker and

157
Clapham 2002, Baker et al. 1998).
It has been suggested previously that additional loci, specifically highly
informative nuclear loci, need to be added to the analysis to improve the
resolution necessary in this case. For example, Hart and Marko (2011), point out
that additional loci may provide more information than adding additional
individuals. Analysing the present dataset with 105 samples, 70 (without 0-
500BP), 46 and 35 respectively, supports this notion as neither of these datasets
provided new information, with exception to resolving the artifactual decline in
population size around 500-1000BP.
Based on the preliminary results, nuclear DNA is well preserved in the
Barkley Sound samples. The herein attempted sex identification using SRY with
ZFX/Y as a positive control has been used by most published studies analysing
the demographic of cetacean pods.
While this is a preliminary result, the data matches the hypothesised ratio.
Humpback whale pods are thought to have a roughly even distribution of male
and female animals (Ramp et al. 2010, Brown et al. 1995) in the feeding
grounds.
In the larger scope of this study, identifying male and female individuals
did not yield the required demographic data. In order to satisfy the need for
population demographic data, more individual-specific loci such as STR
(following the example by Valsecci et al. 1997) and SNP loci would be more
suitable. Using a multiplex of sex-specific and autosomal STRs would have
allowed both the sex identity of the individual and also delivered information on

158
highly variable loci, allowing for a more efficient identification of individual whales.
A multiplex of X and Y chromosome-specific loci as well as autosomal loci would
help to assess the number of individuals present in the dataset. Ancient DNA
studies have successfully used multiplex STR and SNP systems (von Wurmb-
Schwark et al. 2009, Kaestle and Horsburgh 2002, Schmidt et al. 2003, Haak et
al. 2005). STR loci have been identified in humpback whale samples and could
be an appropriate starting point. Often, STR primer systems can be optimised to
match the requirement of short amplicons while conserving the locus in question.
However, if looking towards coalescence based analysis such as population size
changes, alternative fast evolving loci may be more suitable
This study shows that nuclear DNA is retrievable from archaeological
humpback whale bones and therefore can play an important part in population
demographic analysis. For studies involving archaeology and conservation
biology, sex identification should be done using markers such as STR and SNP
suitable for population genetic diversity studies and coalescence statistics. By
doing so, archaeological data would seamlessly fit into larger datasets of modern
whale biology.
However, when adding additional loci, demands are different from current
loci used in ancient DNA analyses. As Ho et al (2011) point out, rather than just
screening for highly polymorphic loci, highly informative loci with a faster
mutation rate are more appropriate. Similar to modern geneticist using statistical
programs such as STRUCTURE (http://pritch.bsd.uchicago.edu/structure.html) to
estimate the amount of STR loci needed for an accurate population

159
characterization, potential loci should be tested for mutation rates and general
suitability prior to the beginning of such study. While mitochondrial DNA and
especially d-loop has been the go-to loci for analysis using ancient DNA for
reasons discussed previously, but a case like this one clearly shows the
inadequacy of d-loop as a single locus. While this study still provides relevant
information on the pre-exploitation genetic diversity and comparison between
estimates of past and current population size, in order to obtain an accurate
population size estimate, additional loci need to be included in future studies.
Because the current management procedure of the International Whaling
Commission (IWC) is based on the identification of discrete feeding and breeding
grounds (Jackson et al. 2007, Baker and Clapham 2004, Reeves 2002), the
identification of a distinct feeding ground and its population size is relevant for
improved management decisions. Specifically, the low population size in
southern British Columbia of around 400 individuals would lead to a different
catch quota, if any, than the feeding ground in California or southeast Alaska.
The current estimate of 200-400 humpback whales in the southern
BC/northern Washington feeding ground is probably still lower than the original
population and certainly lower than modeled in this study: an estimated 6000
thousand whales were hunted between 1905 and 1966 in British Columbia, with
an additional thousand taken in California (Nichol et al. 2002). Current estimates
on pre-exploitation humpback whale population size have been estimated by
adding the amount of recorded hunted whales to the current population size
estimate. The population size of the ancient population found in Barkley Sound

160
would have been at least within the same size range as California/Oregon or
southeast Alaska today, given these historic data as well as the estimates found
using ancient DNA data, even if migration between feeding grounds is taken
under consideration.
Analysis to estimate the historic population size and genetic variability of
humpback whales has been published both based on historic records and
genetic data. Rice (1978) predicted a pre-industrial whaling population size of 15
000 individuals. Based on whaling logbooks and recent mtDNA analyses, Roman
and Palumbi (2003) estimated the historic population size of Atlantic humpback,
finback and minke whales to be up to twenty times higher than the current
estimates of the IWC. The implications of these results are a long term whaling
ban until a sufficient population size is reached. This study was challenged in
several follow up publications, criticising both the assumptions as well as the
techniques used (Clapham et al. 2006, Holt 2004).
Based on the here presented analysis, neither of the mtDNA based
population size estimates previously published may be correct. In these cases,
comparing estimates based on logbooks and historic documents to DNA based
estimates may narrow down a ballpark number. However, a comprehensive
understanding of actual historic population size is needed to correctly assess the
current status of humpback whale populations. To obtain more precise data, a
large-scale effort of several research teams has been collecting skin samples
and fluke sightings over the past years. SPLASH now has over 6000 genetic
data of worldwide humpback whale individuals (Calambokidis et al. 2008). New

161
data will likely not be solely based on mitochondrial DNA but include nuclear
markers as well.
As noted elsewhere (Baker and Medrano-Gonzalez 2002), the insight into
past population size and adaptation to climate change may become relevant
amid current climate trends. While environmental changes and possible
subsequent changes in carrying capacity are part of the bigger picture,
conservation biology investigates optimal management units, which in this case
may be breeding aggregates.
Humpback whales migrate between their summer feeding ground in
southeast Alaska/northern British Columbia, southern British
Columbia/Washington or Oregon/California and their winter breeding and calving
ground in California, Mexico and Hawaii (Baker et al. 1998, 2002). However,
analyses of nuclear DNA, inherited both maternally and paternally, indicates less
geographical group distinctions, suggesting that all three groups are breeding in
the same area, and that the geographic mtDNA patterns are the result of female
whales returning to their own “birth place” to calve (Baker et al. 1993). With more
data available today, the complexity of North Pacific humpback whale
populations has become increasingly apparent with several feeding and breeding
ground (Baker et al. 2002, Witteveen et al. 2004; Calambokidis et al. 2008) and
strong site fidelity towards the feeding ground as opposed to breeding ground.
The haplotype diversity supports previously described theory that the maternally
directed fidelity following colonization of new feeding grounds has persisted for
thousands of years (Baker et al.1990). Since shared haplotypes could be caused

162
by either gene flow or a recent divergent time (Marko and Hart 2011), modern
biology needs to clarify the extend of which modern migration pattern have
influence on the genetic differentiation. The complicated migration pattern begs
the question in how far the lack of a definite modern comparative population
would interfere with the analysis. This is potentially a problem because while
general migration patterns are understood, gene-flow and individual migration
patterns are still poorly observed.
Beerli (2004) found that missing populations do not necessarily pose a problem,
mainly depending on the immigration rate into the population in question: the
deviation from the true population size increases when immigration increases. In
populations with low or moderate migration rates, Beerli expected more accurate
parameter estimates.
Given the humpback whale migration pattern, population size should be
estimated using breeding and feeding grounds and compared to investigate how
accurate each of these results is. Effective population size estimates in the
Bayesian skyline plot only changed slightly when using 19 samples from
Washington and Oregon as modern sample set as opposed to 100 samples from
Washington/Oregon/Mexico. However, it would be crucial to use a population
from Barkley Sound in future analysis to increase the robusticity of the analysis.
Migration has only been estimated between ocean populations so far
(Baker and Medrano-Gonzalez 2002, Baker 1990) except for one study on gene
flow (Baker 1998, Rizzo and Schulte 2009) for male DNA. A positive effect of
sampling feeding grounds, located in more temperate to cold climates, may

163
mean better preservation of nuclear DNA for additional marker analysis. Adding
additional feeding grounds will also provide a more comprehensive estimate for
the entire ocean.
The lack of an informative loci (d-loop) as well as the intricate migration
pattern may mean that the effective population size estimated from this dataset
may not depict the complete population, given the complexity of the population
found in the North Pacific today. This restriction is also a problem for previous
studies estimating maximal 24 000 animals in the North Pacific (Clapham 2005,
Calambokidis 2008, 2009). In order to estimate the population size for the entire
North Pacific, nuclear loci and more feeding grounds need to be sampled to
establish a more accurate pre-industrial whaling population size. In addition,
direct dating of the samples would increase the time estimates of changes in the
past.
The initial estimate of pre-industrial whaling humpback whale census was
based on whaling records, primarily log books of whaling vessels (Rice, 1978).
However, especially after the establishment of the International Whaling
Commission and the subsequent ban on whaling, those whaling reports became
politically sensitive. For instance, log books from Soviet whaling ships
demonstrate examples of massive underreporting, one of the incidences that
might have skewed initial estimates (Clapham, 2009, Jackson 2007). In addition,
log books only recorded caught whales but not struck but lost (animals that were
harpooned but not retained by the whaler) or, in some cases counted in “blue
whale unit” instead of individual animals. In cases like this, ancient DNA could
164
provide an additional line of evidence to test the accuracy of historical
documents. As Palumbi and Roman pointed out, historical data needs to be seen
in context, especially recognizing the limited precision of these estimates
(Palumbi and Roman 2007). Using DNA to investigate current and past
population size is therefore an important independent line of evidence. This study
highlights that ancient DNA has the capability to add an additional line of
evidence to studies in modern biology, independent of historical documents that
might be missing or recorded inaccurately. The three parts (historical data,
modern DNA and ancient DNA) serve as controls against each other to achieve
the most precise results. However, this will only be possible when DNA based
estimates are not based on the d-loop sequence alone but have been re-
estimated using additional nuclear loci. This is true for both aDNA and modern
DNA. Finally, gene-flow between populations needs to be quantified to chose
accurate analysis units and accurate models for statistical analysis. Future
analysis will need to include additional loci as well as alternative statistical
analysis, to test the robusticity of the analysis.
While this is not the first research done on ancient whales, it is one of the
most extensive; being able to compare humpback whales to other studies unveils
that pre- and post-whaling genetic diversity and population size can help to
evaluate the trajectory of a species’ growth and genetic diversity.

165
Conclusions
For this study 105 humpback whale samples from two archaeological sites
were analysed using ancient DNA techniques. The goal of this study was to
investigate the genetic diversity of humpback whales in Barkley Sound, southern
British Columbia, to compare these results to modern data, and to investigate the
population size of humpback whales based on ancient and extant data. To obtain
comparable results, the 344bp of the humpback whale D-loop sequence were
analysed. The genetic diversity found in the ancient DNA dataset fits the modern
population genetic diversity of North Pacific humpback whale feeding
aggregations. The haplogroup variation found differs from published data of
adjacent feeding grounds, but may match the unpublished haplogroup frequency
of southern British Columbia/ Washington feeding area. Results indicate only a
minimal, if any change in genetic diversity between ancient and extant data.
Bayesian skyline plot analysis revealed an effective population size between
2500 and 1500 prior to 1000 BP. However, the Bayesian skyline plot analysis
failed to infer changes in past population size because the d-loop does not
provide necessary information for a coalescence based analysis, making the
estimated population size a preliminary result until additional loci have been
added. Results of this study confirm modern estimates of humpback whale
mtDNA genetic diversity and support the presence of a separate feeding ground
at Barkley Sound. Based on the data found here, North Pacific humpback whales
have retained most of their genetic diversity despite a loss of 80-90% of their
original population size.

166
Using ancient DNA analysis of archaeological samples to investigate pre-
impact genetic diversity has the advantage to reach into time periods not covered
by written records or ethnographic data, revealing long term environmental
records. Thus, while ancient DNA does not provide a significant change in our
knowledge of humpback whale population size immediately prior to industrial
whaling, it can contribute to the long term data of humpback whale
phylogeography.

167
Chapter 7: Final Discussion
Archaeology and Biogeography
“Simply stating in an essay that zooarchaeological data are relevant to a
conservation problem was an insufficient warrant for its inclusion here. Similarly,
simply documenting that the structure of a prehistoric ecosystem was different
from a modern one was insufficient.” (Lyman and Cannon, 2004, p4)
Lyman and Cannon use this as inclusion criteria for case studies in their 2004
book “Zooarchaeology and Conservation Biology”. In order to make a case study
relevant to conservation biology, it needs to address current or upcoming
problems from a zooarchaeological perspective.
This study investigated the antiquity of whaling and the biogeography of
humpback whales in Barkley Sound, aiming to provide data for whale
biogeography and possibly conservation biology. In theory, molecular
archaeology can contribute to modern biogeography by providing data on past
populations and environmental conditions in a similar way as zooarchaeology
can contribute to wildlife management. While ancient DNA has been contributing
to biogeography, this study tested how molecular archaeology can provide a
unique, archaeological perspective.
After carrying out the presented research, the hypothesis that ancient
DNA improves the ability of archaeology to contribute to conservation genetics
cannot be refuted. However, it should be modified; that is, the impact of human

168
behaviour on a population, and therefore the impact of archaeological
interpretations on datasets, depends on the questions asked and on the
genus/species analysed. As discussed in more detail below, while the analysis of
ancient humpback whales reinforces results from modern studies, investigations
of other species may change the way conservation biology approaches a
population. Differences may be due to shorter generation length, faster evolution
or having undergone a genetic bottleneck. Molecular archaeological studies on
marine mammals and fish from archaeological contexts for biogeography
questions will undoubtedly benefit from archaeological lines of evidence
pertaining to human behaviour, culture and settlement pattern, as this will help
distinguish human behaviour from natural changes.
Despite these modifications, it is unquestionable that ancient DNA has
had an enormous influence in all applicable fields and that this research also
highlights the possibilities to expand the way data can be interpreted. Previous
research has highlighted benefits from the ancient DNA field (Burger et al. 2004,
Bunce et al. 2009, Yang et al. 2008, Yang et al. 2005), but often was carried out
in isolated circumstances within the field. Molecular archaeology has successfully
investigated life ways of ancient people and their environment (Haak et al. 2005,
Kaestle and Horsburgh 2002, Losey and Yang 2007, Speller et al. 2005). Ancient
DNA has become a regular part of biogeography and is increasingly relevant to
our knowledge of a species’ history (Di Bernardo et al. 2004, Mantooth and
Riddle 2011). Ancient DNA research has been applied to phylogenetic and
phylogeographic analysis for conservation biological research before, in some

169
cases using archaeological material. In previous ancient DNA studies,
archaeological samples were often analysed without including cultural or
ethnographic data relating to site occupation, continuity or hunting practices,
leading to potentially incomplete results in relation to the biogeographic history of
a species (Ludwig et al. 2008, Ludwig et al. 2009).
Zooarchaeology has been analysing ancient life ways, human-animal
relationships and environmental changes for decades. Including ancient DNA
improves not only the specificity of taxonomic identifications, especially in
fragmented datasets, but can also detect changes in the species’ genetic
variability, and distinguish between populations (Bollongino et al. 2005, Hadly et
al. 1998, 2008a, Hofreiter et al. 2004). In these cases, ancient DNA improves
zooarchaeological research to contribute data pertaining to changes in pre-
historic population distribution. These results are not only relevant to biologists,
but also to archaeologists while studying, for example, prey choice and
subsistence of ancient people. On the other hand, zooarchaeology has paved the
way for this study, providing almost exclusively baleen whales to be analysed in
this study. A sample set unanalysed by a zooarchaoelogist would have contained
a large amount of other cetacean, especially dolphins, which would have cost
researchers invaluable time and resources, and invariably would have led to a
smaller sample size relevant to the scope of the study.
In her 2008 paper, Leonard outlined how ancient DNA analysis can benefit
wildlife conservation by providing prehistoric population and species
identifications, gene flow, as well as information on geographic distributions.

170
While in most cases palaeontological material is the preferred material, the use
of archaeological material is sometimes the sole avenue if fauna are not found
otherwise, such as fish and sea mammals, or can increase the sample size
because of hunting activities (Leonard 2008). This is the case with humpback
whales, which otherwise would be invisible in the palaeontological record.
As an alternative to archaeological samples, ancient samples could be
obtained from historic museum samples where possible. This has recently been
done for the North Atlantic using sperm whale and blue whale samples
(Anderung, ISBA presentation Copenhagen 2010). Samples used were obtained
from eighteenth century industrial whaling ships. The advantages of museum
samples can be a more secure and detailed dating of the individual bone as well
as a better estimation of the number of individuals (provided that museum
provenience data are accurate). The disadvantage of museum samples is that in
many cases the time depth of available samples is only sufficient to detect the
most recent population diversity, but cannot detect long term variability. Archived
samples may help to detect diversity lost through industrial whaling, but the
possibility of detecting lost diversity due to natural causes remains low. Finally,
using museum samples from whaling ships obviously does not allow further
investigation of the human behaviour of pre-industrial whaling hunters as done in
this study. Taken together, remains from archaeological sites are not inferior to
non-archaeological sampling.
Archaeology has the unique expertise to provide insight into past human
behaviour leading to the formation of a zooarchaeological assemblage, as well

171
as taphonomic processes which affect those assemblages through time.
Ethnographic data may also elucidate human practices that influenced the
assemblage and the knowledge that was transferred through generations about
these species. Molecular archaeologists have the experience required to analyse
archaeological assemblages, including experience relating to questions of DNA
degradation and contamination concerns. On the other hand, conservation
biology brings the experience and theory of modern population genetics,
population migrations, and other animal behavioural issues into the equation.
This data can help in interpreting the assemblage from an environmental point of
view. In the case of whales, it is unlikely that large numbers of whale samples
can be obtained from palaeontological deposits. Additionally, anomalies in an
ancient genetic dataset can be compared to the archaeological record to identify
possible changes in human behaviour or, alternatively, environmental changes.
Ethnographic records may also provide important data relating to animal
behaviour, for example the reports from Barkley Sound of whales during the
summer and the presence of whales in a particular area year round. This
ethnographic information can help direct possible study areas for molecular
environmental archaeology.
In the case of whales, using archaeological data is probably the only
opportunity to investigate long term migration patterns and feeding ground
identity because the presence of ancient whale bones is tied to human
behaviour. In the case of humpback whales, archaeological and ethnographic
data does not provide unique or essential information relating to biogeography or

172
conservation biology, beyond the ancient DNA results. However, ancient DNA
provides pre-industrial whaling genetic diversity of humpback whales in Barkley
Sound which is not just valuable to establish a baseline of pre-whaling mtDNA
genetic diversity, but also includes a population size estimate.
Apart from whales, there are many potential avenues when archaeological
data becomes relevant, such as when studying the absence or presence of
archaeological species to determine which species to reintroduce as the most
“natural”. For example, the introduction of the Coho Salmon in the upper
Columbia River was assumed to be a re-introduction of a lost population. This
measurement was deemed necessary after four dams altered the spawning
habitat of salmon in the river in the 1970s and increased the mortality (Kareiva et
al. 2011, Gustafson et al. 2006). Similarly, the reintroduction of sturgeon into the
Baltic Sea required not only the knowledge of species appropriate for the current
conditions but also the historic species present in the Baltic Sea (Kirschbaum et
al. 2009, Gessner, 2006). Moreover, ancient DNA analysis of shell midden
remains can determine the presence of species (for example sturgeon or
salmon) while using contextual archaeological data can help to evaluate the
settlement pattern. A seasonal settlement pattern might coincide with the
absence of certain species, leading to a false negative result over the presence
of a species.
In terms of conservation biology, ancient whale population diversity, and
the changes in population diversity and size help modern biologists to refine
theories about a species’ future survival and adaptability. These types of long
173
term genetic analyses are especially important when studying a species with a
slow mutation rate such as whales. Sampling from both archaeological sources
and historic museum specimens can reveal a wealth of information, albeit
focused on different time periods. If available, museum collections can deliver
more samples from a narrow time span, safely identified as different individuals.
Often, additional information has been collected such as the species and sex.
Archaeological samples, on the other hand, may be collected from a much longer
time frame and provide insight into antiquity and change of human behaviour.
While archaeology has the expertise to investigate human behaviour
based on an excavated site, this human behaviour is not necessarily relevant to
the research question. In terms of hunted fauna, relevant human behaviour
includes the seasonality of hunting activities, prey choice, including the choice of
phenotypic characteristics, and finally the treatment of the carcass after the hunt,
which may include species- specific ritual or secular treatment. Because
research involving species identification relies on visible markers also chosen by
people, hunting may skew the environmental analysis. On the other hand, DNA
analysis relies on mostly invisible markers which cannot be chosen by the hunter.
The only exception here could be seasonality, if for example two populations
inhabit a region at different times, as is the case with transient killer whales and
resident killer whales (Pilot et al. 2010). A different treatment of species
depending on the cultural perception could lead to incorrect ethnographic
identification of species targeted during these ancient whaling expeditions.
Differential treatment of bones depending on hunted vs. beached or preferential

174
hunted vs. alternatives, leading to differences in bone presence and
completeness depending on the species. By using ancient DNA the possibility of
biased sampling was removed.
People in Barkley Sound have been hunting whales for more than 5000
years. Over the past 2000 years, species other than humpback and grey whales
were caught more frequently, possibly due to an improvement in hunting
technology. While there are plenty of historic records, both written documents
and logbooks of industrial whaling ships, records of native whalers is more
scattered despite its equal relevance. By unveiling native whaling “records”
(through ethnographic or oral traditions), questions can be answered concerning
both human behaviour and whale biology. Highlighting the antiquity of whaling in
non-western civilisations can aid the survival of these traditions and emphasize
the prolific ability of these people. In addition, the change of culture and the
development of hunting techniques can be inferred from archaeological and
ancient DNA data, especially when early hunting tools are lost to taphonomic
processes. Ancient DNA can counteract the uncertainties to which historical
records are generally subject. Using ancient DNA adds a solid line of evidence in
terms of species diversity at a site, independent of the bone fragmentation, as
well as the state of a population via population genetic diversity and population
size estimates.
The analysis of pre-industrial humpback whaling at Ts’ishaa and Huu7ii
suggests a stable population in terms of population size and genetic diversity
over more than 4000 years in Barkley Sound. The presence of a feeding

175
aggregation would have supported the development and maintenance of a
whaling culture. Based on the ancient DNA data from this study, it is unlikely that
the population at Barkley Sound was a non-migrating pod as previously assumed
by archaeologists. Studies on the non-migratory whale subpopulation in the
Arabian Sea indicate that local populations are distinct from other pods both
genetically and morphologically (Baldwin et al. 2010, Mikhalev 1997). This does
not seem to be the case in Barkley Sound. While most whales migrate bi-
annually, moving between feeding and breeding ground, analyses have indicated
that not all individuals migrate, and some only migrate part of the way (Stevick
2002, Valsecci 2010). Zooarchaeological data account for an ongoing presence
of humpback whales over 5000 years at least while ancient DNA results indicate
a continuum in population genetic diversity, suggesting that Barkley Sound was a
feeding ground then as it is now. If Barkley Sound had not been frequented by
the same population, ancient DNA genetic diversity would reveal a different
signature from reported modern populations.
The fact that humpback whale genetic diversity is on a similar level today
as it was prior to industrial whaling helps to define some long term goals for
whale conservation. Having a benchmark of genetic diversity allows us to
evaluate population growth found today or lack thereof. Humpback whales in the
North Pacific have had a remarkable population growth rate over the past 30
years, while other species, including right whales, have not. Having long term
data of conditions in Barkley Sound will help determine the optimal course of
action towards sustainable use of humpback whales. Based on the analysis of

176
mitochondrial haplotypes in this study, humpback whales in this region should be
able to recover. However, because of the multifaceted nature of this issue, no
definite conclusions can be drawn from one analysis. Analysing nuclear DNA, a
different site, as well as ongoing environmental changes will play a vital role
before any recommendations can be made. However, based on the results
obtained here, the protection of whales may have been timely and successful,
and modern genetic data accurately reflect pre-whaling population size. Any
management decisions, however, need to be tailored to the local feeding and
breeding grounds, given variability of genetic diversity and population size.
If modern data confirms the haplotype diversity in southern British
Columbia, the long term stable haplotype diversity could help to make a case to
treat the population as a separate feeding aggregate for whaling and catch quota
negotiations (Clapham et al. 2008). Further ancient DNA analyses in other
feeding grounds can help to answer questions of “what to preserve” such as
population boundaries that may have shifted due to a reduction in population
size, playing a vital part in answering the question of human impact on humpback
whale and subsequently other large cetacean populations. In this case, the
apparent absence of changes in population genetic diversity would indicate that
while the population was reduced substantially, genetic diversity was preserved,
minimizing the long term impact of human interaction. While data from
archaeological sites are too recent to detect changes in humpback whale
population diversity, it would be possible to detect changes in humpback whale
behaviour such as changing migration patterns, which would be genetically
177
visible in a change in haplotype composition (Baker and Clapham 2004, Baker
and Medrano-Gonzalez 2002, Calambokidis et al. 2008, Clapham et al. 2008). In
the case presented here, no such change was detected. In addition, to accurately
detect migration pattern and changes, multiple feeding grounds would need to be
examined (Palumbi 2011). Finally, adding further data would also support the
accurate assessment of pre-industrial whaling humpback whale population size
for the entire North Pacific.
In case of cetaceans in Barkley Sound, using archaeology and
ethnographic data was necessary to interpret the ancient DNA based species
identification data correctly but was not necessary to evaluate the biogeography.
If compared to Lyman’s use of zooarchaeology to conservation biology, ancient
DNA improves the zooarchaeological dataset and can do so for other faunal
datasets, as well providing conclusive species identifications and genetic
diversity markers. Whaling as a high status occupation limited the access to this
resource. Moreover, hunting technology developed over 5000 years and eye-
witness reports suggest low success rate at times. These ethnographic and
archaeological observations support the assumption that traditional whaling
techniques probably did not strongly influence the size or composition of whale
population in pre-contact time periods. Changes in population genetic diversity
and population size through time would have been therefore due to natural
causes (in pre-contact times) and more importantly, to the well-documented
industrial whaling practices in historic times. While the species composition of the
archaeological dataset changed over time, the genetic diversity of humpback
178
whale did not change substantially, indicating a stable and probably resilient
population amidst changes in climate over 4000 years.
In conclusion, molecular archaeology can provide important information
for biogeography and possibly conservation biology, especially in the case of
marine life that would not be available if not hunted by human settlers. Riddle et
al. (2008) point out that palaeontological sites available for phylogeographic
studies are rare. Archaeological sites may have species present over centuries
and millennia, documenting not only human subsistence practices but also a
repository for phylogeographic data. Only DNA analysis can provide the detailed
data, unaffected by short term environmental fluctuations, to observe changes
over time, making archaeological material directly comparable to modern DNA
studies.
The value of archaeological and ethnographic information in interpreting
the ancient DNA data depends not only on the question asked but also on the
type of fauna analysed. The strength of zooarchaeology to identify genera,
species and abundance has been integrated in ancient DNA analysis and can be
vital to the analysis, along with archaeological site information, especially in
biogeography studies.
Sampling
For this study, 264 cetacean identified samples were analysed using
ancient DNA techniques. Results suggest that archaeological sample sets are

179
viable for population genetic diversity studies such as this one. Neither hunting
nor zooarchaeological analysis/selection has led to a non-random selection. The
species identification of both sites resulted in similar species frequencies. The
population genetic diversity fits the expected outcome when compared to modern
data in the North Pacific and preliminarily seem to match the modern population
in this area.
While the hunting of land mammals might skew a zooarchaeological
dataset because hunters can choose for phenotypic characteristics such as
overall size, fur color/length or antler size, the hunt for humpback whales was
unlikely based on phenotypic choice but rather on availability. The results of this
dataset indicate that hunters selected certain species of whale, but within that
species, genetic diversity correctly mimics the source population.
The zooarchaeological nature of the dataset had additional advantages.
The sampling by a zooarchaeologist who is familiar with the site helps to
maximise the number of individuals. The zooarchaeologist who chose the
samples for Ts’ishaa tried to sample each specimen once based on his expertise
(McKechnie pers. comm. 2010). Species identified were consistent with
ethnographic description of hunting practices. In this study, all except for one
sample were large baleen whales, increasing the amount of humpback whales
present in the dataset. Without the support of zooarchaeology, the sample set
would have included larger amounts of non-baleen cetaceans. Zooarchaeological
selection for this study probably created a bias in the species identification
because only large cetaceans were sampled (McKechnie pers. comm. 2010,

180
McMillan pers. comm. 2007, 2010). A future smaller sample set should be tested
to test the true species diversity of cetaceans in general at Ts’ishaa and Huu7ii.
The match of general species distribution between zooarchaeological
analysis (Monks et al. 2001) and ancient DNA analysis indicates that in sites
with reasonable preservation of whale bones ancient DNA analysis may not be
necessary for species identifications. However, in cases like Ts’ishaa and Huu7ii,
the high degree of bone fragmentation would not allow for confident taxonomic
identifications of the material. Ancient DNA analysis provides further information
such as changes in species genetic diversity and can help narrow down the
number of individuals if appropriate markers are selected (STR or SNP analysis).
This information would be helpful in a study narrowing down the MNI and to
correlate changes in culture to changes in species abundance. If only species
identification is needed, a smaller sample size would be sufficient. Davis (2010)
reports that, in a zooarchaeological setting an increase by two magnitudes (100
samples to 10 000 samples) is needed in order to double the number of species
in a dataset. The chi-square test comparing Ts’ishaa and Huu7ii and the
comparison of species frequency between the two sites are a further indicator
that the sampling here is adequate for a species identification study at these
archaeological sites.
Future sampling should take genetic properties of the sampled species
into account. Because of the slow mutation rate of the humpback whale D-loop
and long generation length of the humpback whale, samples should be selected
from fewer time periods to improve discrete sample populations over a longer

181
period of time instead of trying to cover the entire 5000 years. Using
archaeological datasets allows for the selection of dated horizons while still
collecting sufficient amounts of data. If sampling was isochronous instead of
comprehensive, the collected samples would still be viable for archaeological
questions. Research using rodents in the Yellowstone National Park, for
example, implementing serial sampling of discrete time periods, successfully
distinguished environmental changes and population response over several
thousand years (Hadly et al. 2004).
The initial idea was to use the haplotype and sex of an individual, in
combination with the archaeological provenience information to estimate the
number of individual whales. However, even these three variables could not
provide a meaningful MNI. While it was possible to distinguish some individuals
based on dates and haplotype, all variables are afflicted with uncertainty. Non-
recombinant sequences, such as mtDNA, can be used to trace lineages but are
unsuitable for individual identification. In this case, nuclear DNA markers would
have been helpful. A multiplex system using sex chromosomal and autosomal
loci would have provided an optimal amount of information including sex
identification and population diversity markers. Second, indirect dating through
layers obscured the actual age of the sample. In addition, the date associated
with the layer does not necessarily correlates with the year of death, as people
might have used the bone for a while before discarding it. While using excavation
units as part of the individualisation process is an artificial classification, it helps
to account for an estimate of individual whales present at the site.

182
Overall, results in this study strongly support that the archaeological
dataset was sampled on a random basis, providing reliable species diversity as
well as humpback whale genetic diversity even with the above discussed
uncertainties.
Future studies
This study investigated the antiquity of whaling in Barkley Sound and the
humpback whale population genetic diversity in the area. While results support
that people were hunting whales over the period analysed and the population
remained stable over the last 5000 years, questions remain that are worth
investigating in future studies. Two of the possible studies are outlined below.
1. Investigating the age of whaling
The current results support the interpretation of whaling in Barkley Sound
but could not identify the onset of indigenous whaling. Future studies should
investigate sites older than 5000 years that exhibit signs of whale use. Results
here indicate that samples around 5000 BP are well preserved and ancient DNA
has the capability to investigate much older samples. Based on previous
research, two scenarios are possible: first, it is possible that future investigations
will not find a change in species distribution because whaling traditions and
technology was introduced by early settlers to Barkley Sound before 5000 BP.

183
Thus, the trial phase did not happen on Nuu-chah-nulth territory but prior to the
first settlement. Alternatively, researchers may identify the onset of whaling.
People probably used stranded whales before they actively hunted whales so the
species diversity should decrease at around the time that hunting was initiated.
Data should be added to cover the time gap (3000-2000) in this study to
investigate if changes in whaling technology as reported from the archaeological
record, can be linked to changes in species diversity during this time period
(Monks et al. 2001, Huelsbeck 1988, Monks 2003). It is possible, that non-DNA
zooarchaeological research may not detect this change because of a high
fragmentation, making it impossible to accurately identify the change in species
distribution.
Finally, this dataset can be used as a comparison to analyse sites
elsewhere, for example Nootka Sound. Because the political situation was
different, it is possible that zooarchaeological remains in sites are different, both
within the Sound as well as between Nootka and Barkley Sound.
2. Investigating genetic diversity in the North Pacific
This study only investigated Barkley Sound and the population using this
area as feeding ground. Further feeding grounds in the North Pacific should be
investigated to confirm conclusions drawn in this study. Specifically, feeding
grounds that were hunted earlier and longer would be beneficial as well as areas
of low extant population density and diversity. By comparing feeding grounds,
investigations into the antiquity of current migration patterns can be investigated.

184
In addition, the population size of the entire North Pacific can be established by
adding a broader geographic range. Future studies need to include nuclear DNA
to improve the resolution of the genetic data. Preliminary results in this study
indicate the preservation of nuclear DNA, even in older samples. Lessons
learned from this study will also help to improve the sampling strategy for future
studies with similar research questions. If available, sampling should be
expanded back in time to allow for possible changes. As seen in this study,
zooarchaeological data helps greatly to narrow down sample sets. Nevertheless,
sites from other areas would need to be tested prior to future studies to establish
the presence of humpback whales in sufficient quantities
Conclusion
In this study, whale samples taken from shell middens were analysed using
ancient DNA for species identification and D-loop haplotype. Previous
archaeological research indicated the use of large whales over the entire time
depth of the sites analysed. Ancient DNA results indicate that whaling took place
in Barkley Sound for at least 5000 years and that people drew from a stable
population of humpback whales using Barkley Sound as a feeding ground. While
the sampling strategy in this study can be considered appropriate, improvements
could be made: future whale research should consider obtaining more samples
from discrete time periods to cover more time as opposed to sampling all-over.
Considering the slow mutation rate of the humpback whale D-loop this approach

185
would not lead to a loss in information. Future studies should be expanded both
in time and geographically, including small scale expansions to neighbouring
Sounds. Studies like this would provide useful information to whale management
in terms of long term population boundaries or changes in populations, especially
when reaching further back in time.
Finally, this research highlights both the possibilities as well as the
limitations of archaeological data. While in some cases additional information are
needed to correctly identify changes found in a dataset, in some cases
archaeological data of human behaviour are not needed to use
zooarchaeological sample sets. In those cases, the contribution of archaeology is
solely through providing the material as well as zooarchaeological and ancient
DNA data.

186
Chapter 8: Conclusions
The goal of this study was to use previously excavated whale bones from
two Nuu-chah-nulth archaeological sites to investigate the genetic diversity and
population size of humpback whales prior to industrial whaling and to assess the
antiquity of whaling in Barkley Sound. A total of 264 whale bone samples from
two sites were analysed using ancient DNA techniques. Of those 264 samples,
84% yielded amplifiable DNA which facilitated species identification. One
hundred and five samples identified as humpback whale were analysed in the
phylogeographic portion of the study. The DNA in the samples was generally well
preserved and no contamination was detected over the course of this study.
Humpback whales have been the predominant species for at least 5000
years at archaeological sites in Barkley Sound. Grey whales were the second
most frequent exploited species, though considerably less frequently than
humpbacks. The whale species diversity at the two sites increases in later times
(post 2000 BP). The lack of species diversity, especially the lack of potential drift
whales, and the high frequency of the humpback whales, previously reported as
preferred hunted species, supports the conclusion that active whaling was taking
place for at least 5000 years in Barkley Sound. The increase in species
frequency after 2000 BP may be due to either an improvement in technology or
an increase in use of beached whales during a time of increased population size
in Barkley Sound. Additional samples from earlier layers (3000-5000BP) need to

187
confirm whether the change in species diversity is accurate or a stochastic error.
The mitochondrial genetic diversity of the ancient DNA sample set of
humpback whales is within the range of modern humpback whale populations in
the North Pacific. Preliminary comparisons suggest that the mtDNA haplotype
frequency matches that of a modern population in southern British Columbia. The
estimated effective population size prior to industrial whaling for this dataset
ranges between 1500 and 2500 individuals. The Bayesian skyline plot fails to
provide a meaningful result because of a lack of information on the d-loop
sequence of humpback whales, combined with long generation length of whales.
Further analysis is needed to obtain accurate estimates of populations size
changes in the past.
Results confirm that the genetic diversity of humpback whales has not
changed substantially due to industrial whaling. While further feeding grounds
and more importantly more loci are needed to establish the population size for
the entire North Pacific, these results indicate that the pre-industrial whale
population in Barkley Sound was likely larger than the current 200-400 individual.
This is also supported by ethnographic records, accounting for whales inhibiting
the passage of boats during the summer. While other areas in the North Pacific
are recovering well, the population southern British Columbia/northern
Washington may need considerably more time to recover before whaling can
resume. Recent data of population growth and the genetic diversity of humpback
whales established here, indicates that whales are recovering.
These results support the use of archaeological DNA in phylogeographic

188
studies of humpback whales to provide ancient population information without
having to resort to potentially inaccurate or fraudulent historical whaling records.
This research highlighted both the possibilities as well as the limitations of
archaeological contributions to phylogeographic research. Using ancient DNA
analysis, a variety of questions for both archaeology and biogeography
potentially can be answered. A collaborative approach is the optimal course of
action in a destructive and expensive analysis using non-renewable sources
such as archaeological bone samples. However, in some cases such the
analysis presented herein, the contribution of archaeology to phylogeographic
interpretation is limited for neutral markers such as D-loop haplotypes. Advances
in ancient DNA techniques will increase the accessibility to nuclear markers for
phylogeographic studies. Zooarchaeological analysis was an important part of
this study with respect to narrowing down potential samples but no data about
Nuu-chah-nulth culture or subsistence practices was used in the phylogeographic
interpretation. Results of this analysis suggest a population with a similar genetic
markup to the modern feeding population found in southern British Columbia.
These results support the initial assumption that archaeological remains can be
prime specimens for phylogeographic investigations.
This research extends the evidence for active whaling in Barkley Sound
back to 5000 years from previous under 2000 BP (Nootka Sound 2100 BP,
Barkley Sound 800 BP) and is the first genetic analysis in Barkley Sound.
Furthermore, this is the first study investigating genetic diversity for pre-industrial
humpback whale population. This dataset of 105 humpback whale samples

189
expands the time depth of humpback whale biogeography by 5000 years. The
ability to obtain concrete information on the genetic diversity and biogeography of
ancient humpback whales indicates that archaeological samples could be a
prime target for future studies on large sea mammals worldwide.

190
Literature
Allen, G.C., M.A. Flores-Vergara, S. Krasynanski, S. Kumar, and W.F. Thompson 2006 A modified protocol for rapid DNA isolation from plant tissues using cetyltrimethylammonium bromide. Nature protocols 1(5):2320-2325.
Alter, S., S. Ramirez, S. Nigenda, J. Ramirez, L. Bracho, and Stephen R. Palumbi 2009 Mitochondrial and Nuclear Genetic Variation across Calving Lagoons in Eastern North Pacific Grey Whales (Eschrichtius robustus). Journal of Heredity 100(1):34-46.
American Cetacean Society 2004 Fact Sheet-Humpback whale. http://www.acsonline.org/factpack/humpback.htm ed. Vol. 2009, American Cetacean Society, San Pedro, California.
Ames, K. M., and H. D. G. Maschner 1999 Peoples of the Northwest Coast: Their Archaeology and Prehistory. Thames and Hudson, London.
Amos, B. 1996 Levels of genetic variability in cetacean populations have probably changed little as a result of human activities. Report to the International Whaling Commission 46:657-659.
Amos, W., and A. Balmford 2001 When does conservation genetics matter? Heredity 87(Pt 3):257-265.
Arima E. Y., and J. Dewhirst 1990 Nootkans of Vancouver Island. In Handbook of North American Indians, Vol. V.7 Northwest Coast, edited by W. C. Sturtevant, pp. 391-411. Smithsonian Institution, Washington.
Arima E. Y., D. St.Claire, L. Clamhouse, J. Edgard, C. Jones, and J. Thomas 1991 Between Ports Alberni and Renfrew :Notes on West Coast peoples. Vol. 121, Canadian Museum of Civilization, Canadian Ethnology Service, Hull, Quebec.
Arnason, U., A. Gullberg, and B. Widegren 1993 Cetacean mitochondrial DNA control region: sequences of all extant baleen whales and two sperm whale species. Molecular biology and evolution 10(5):960-970.
Avise, J.C. 2004 Molecular markers, natural history, and evolution. 2nd ed. Sinauer Associates, Sunderland, Mass.
Axelsson, E., E. Willerslev, M. T. P. Gilbert, and R. Nielsen 2008 The effect of ancient DNA damage on inferences of demographic histories. Molecular biology and evolution 25(10):2181-2187.

191
Baker, C. S., A. Perry, J. L. Bannister, M. T. Weinrich, Robert B. Abernethy, J. Calambokidis, J. Lien, R. H. Lambertsen, J. U. Ramirez, O. Vasques, P. J. Clapham, A. Alling, S. J. O'Brien, and S. R. Palumbi 1993 Abundant Mitochondrial-Dna Variation and Worldwide Population-Structure in Humpback Whales. Proceedings of the National Academy of Sciences of the United States of America 90(17):8239-8243.
Baker, C. S., and S. R. Palumbi 1994 Which Whales are hunted - A Molecular-Genetic Approach to Monitoring Whaling. Science 265(5178):1538-1539.
Baker, C. S., L. Florez-Gonzalez, Robert B. Abernethy, H. C. Rosenbaum, R. X. Slade, J. Capella, and J. L. Bannister 1998a Mitochondrial DNA variation and maternal gene flow among humpback whales of the southern hemisphere. Marine Mammal Science 14(4):721-737.
Baker, C. S., L. Medrano-Gonzalez, J. Calambokidis, A. Perry, F. Pichler, H. C. Rosenbaum, J. M. Straley, J. Urban-Ramirez, M. Yamaguchi, and O. Von Ziegesar 1998b Population structure of nuclear and mitochondrial DNA variation among humpback whales in the North Pacific. Molecular ecology 7(6):695-707.
Baker, C. S., G. Lento, F. Cipriano, and S. R. Palumbi 2000a Predicted decline of protected whales based on molecular genetic monitoring of Japanese and Korean markets. Proceedings of the Royal Society of London Series B-Biological Sciences 267(1449):1191-1199.
Baker, C. S., G. M. Lento, F. Cipriano, M. L. Dalebout, and S. R. Palumbi 2000b Scientific whaling: source of illegal products for market? Science 290(5497):1695-1696.
Baker, C. S., and L. Medrano-Gonzalez 2002 Worldwide Distribution and Diversity of Humpback Whale Mitochondrial DNA Lineages. In Molecular and Cell Biology of Marine Mammals, edited by C. J. Pfeiffer, pp. 84-99. Krieger Publishing Company, Malabar, Florida.
Baker, C. S., and P. J. Clapham 2004 Modelling the past and future of whales and whaling. Trends in Ecology & Evolution 19(7):365-371.
Balasse, M. 2002 Reconstructing dietary and environmental history from enamel isotopic analysis: Time resolution of intra-tooth sequential sampling. International Journal of Osteoarchaeology 12(3):155-165.
Baldwin, R., T. Collins, G. Minton, K. Findlay, P. Corkeron, and A. Willson Arabian Sea Humpback Whales: Canaries for the Northern Indian Ocean?(SC/62/SH20).
Bandelt, H. J., P. Forster, and A. Rohl 1999 Median-joining networks for inferring intraspecific phylogenies. Molecular Biology and Evolution 16(1):37-48.

192
Banerjee, M., and T. A. Brown 2004 Non-random DNA damage resulting from heat treatment: implications for sequence analysis of ancient DNA. Journal of Archaeological Science 31(1):59-63.
Bardi, U. 2011 Modeling the Real World: Whaling in Nineteenth Century. The Limits to Growth Revisited :31-36.
Befu, H., and C. S. Chard 1964 A Prehistoric Maritime Culture of the Okhotsk Sea. American Antiquity 30(1):pp. 1-18.
Beja-Pereira, A., D. Caramelli, C. Lalueza-Fox, C. Vernesi, N. Ferrand, A. Casoli, F. Goyache, L. J. Royo, S. Conti, M. Lari, A. Martini, L. Ouragh, A. Magid, A. Atash, A. Zsolnai, P. Boscato, C. Triantaphylidis, K. Ploumi, L. Sineo, F. Mallegni, P. Taberlet, G. Erhardt, L. Sampietro, J. Bertranpetit, G. Barbujani, G. Luikart, and G. Bertorelle 2006 The origin of European cattle: Evidence from modern and ancient DNA. Proceedings of the National Academy of Sciences of the United States of America 103(21):8113-8118.
Benson, B. E., K. A. Grimm, and J. J. Clague 1997 Tsunami deposits beneath tidal marshes on northwestern Vancouver Island, British Columbia. Quaternary Research 48(2):192-204.
Beerli, Peter 2004 Effect of unsampled populations on the estimation of population sizes and migration rates between sampled populations. Molecular ecology 13(4):827-836.
Bollongino, R., C. J. Edwards, J. Burger, K. W. Alt, and D. G. Bradley 2005 Early history of European domestic cattle as revealed by ancient DNA. Biology letters
Bollongino, R., J. Elsner, J. Vigne, and J. Burger 2008a Y-SNPs Do Not Indicate Hybridisation between European Aurochs and Domestic Cattle. PLoS One 3(10):Article No.: e3418.
Bollongino, R., A. Tresset, and J.-D. Vigne 2008b Environment and excavation: Pre-lab impacts on ancient DNA analyses. Comptes Rendus Palevol 7(2-3):91-98.
Borge, T., L. Bachmann, G. Bjornstad, and O. Wiig 2007 Genetic variation in Holocene bowhead whales from Svalbard. Molecular ecology 16(11):2223-2235.
Borowski, G. H. 1781 Gemeinnützige Naturgeschichte des Thierreiches Vol. 2:21, Berlin.
Borsa, P. 2006 Marine mammal strandings in the New Caledonia region, Southwest Pacific. Comptes Rendus Biologies 329(4):277-288.

193
Bowen, B. W. 1999 Preserving genes, species, or ecosystems? Healing the fractured foundations of conservation policy. Molecular ecology 8(12 Suppl 1):S5-10.
Brito, P. H. 2005 The influence of Pleistocene glacial refugia on tawny owl genetic diversity and phylogeography in western Europe. Molecular ecology 14(10):3077-3094.
Broughton, J. M. 2002 Prey spatial structure and behavior affect archaeological tests of optimal foraging models: Examples from the Emeryville Shellmound vertebrate fauna. World Archaeology 34(1):60-83.
Brown M.R., Corkeron P.J., Hale P.T., Schultz K.W., and Bryden M.M. 1995 Evidence for a sex-segregated migration in the humpback whale (Megaptera novaeangliae). Vol. 259,
Bunce, M., T.H. Worthy, M.J. Phillips, R.N. Holdaway, E. Willerslev, J. Haile, B. Shapiro, R.P. Scofield, A. Drummond, P. J. J. Kamp, and others 2009 The evolutionary history of the extinct ratite moa and New Zealand Neogene paleogeography. Proceedings of the National Academy of Sciences 106(49):20646.
Bunce, M., M. Szulkin, H. R. Lerner, I. Barnet, B. Shapiro, A. Cooper, and R. N. Holdaway 2005 Ancient DNA provides new insights into the evolutionary history of New Zealand's extinct giant eagle. PLoS Biol. 3(1):e9.
Burger, J., W. Rosendahl, O. Loreille, H. Hemmer, T. Eriksson, A. Gotherstrom, J. Hiller, M. J. Collins, T. Wess, and K. W. Alt 2004 Molecular phylogeny of the extinct cave lion Panthera leo spelaea. Molecular phylogenetics and evolution 30(3):841-849.
Burger, J., M. Kirchner, B. Bramanti, W. Haak, and M.G. Thomas 2007 Absence of the lactase-persistence-associated allele in early Neolithic Europeans. Proceedings of the National Academy of Sciences 104(10):3736.
Butler, V. L. 2000 Resource depression on the Northwest Coast of North America. Antiquity 74(285):649-661.
Butler, V. L., and M. G. Delacorte 2004 Doing Zooarchaeology as if it Mattered: Use of Faunal Data to Address Current Issues in Fish Conservation Biology in Owens Valley, California. In Zooarchaeology and Conservation Biology,edited by R. L. Lyman and K. P. Cannon, pp. 25-44. The University of Utah Press, Salt Lake City.
Butler, J. M., Y. Shen, B. R. McCord 2003 The development of reduced size STR amplicons as tools for analysis of degraded DNA. Journal of forensic sciences 48(5):1054-1064.
Calambokidis, J., E. A. Falcone, T. J. Quinn, A. M. Burdin, P.J. Clapham, J.K.B. Ford, C.M. Gabriele, R. LeDuc, D. Mattila, L. Rojas-Bracho, and others

194
2008 SPLASH: Structure of populations, levels of abundance and status of humpback whales in the North Pacific. Final report for contract AB133F-03-RP0078.Cascadia Research Collective, Olympia, WA 57
Calambokidis, J., G. H. Steiger, J. M. Straley, L. M. Herman, Sal Cerchio, D. R. Salden, J. Urban, J. K. Jacobsen, O. von Ziegesar, K. C. Balcomb, C. M. Gabriele, M. E. Dahlheim, S. Uchida, G. Ellis, Y. Miyamura, P. L. de Guevara, M. Yamaguchi, F. Sato, S. A. Mizroch, L. Schlender, K. Rasmussen, J. Barlow, and T. J. Quinn 2001 Movements and population structure of humpback whales in the North Pacific. Marine Mammal Science 17(4):769-794.
Calambokidis, J., and J. Barlow 2004 Abundance of blue and humpback whales in the eastern North Pacific estimated by capture-recapture and line-transect methods. Marine Mammal Science 20(1):63-85.
Calambokidis, J., G. H. Steiger, D. K. Ellifrit, B. L. Troutman, and C. E. Bowlby 2004 Distribution and abundance of humpback whales (Megaptera novaeangliae) and other marine mammals off the northern Washington coast. Fishery Bulletin 102(4):563-580.
Canadian Rock Art Research Associates, Doris Lundy, and British Columbia Museum 1979 CRARA '77 :papers from the fourth biennial conference of the Canadian Rock Art Research Associates, October 27-30, 1977, Victoria, British Columbia. Vol. 8, British Columbia Provincial Museum, Victoria.
Canning, C., D. Crain, T. S. Eaton Jr, K. Nuessly, A. Friedlaender, T. Hurst, S. Parks, C. Ware, D. Wiley, and M. Weinrich 2011 Population-level lateralized feeding behaviour in North Atlantic humpback whales, Megaptera novaeangliae. Animal Behaviour
Cannon, A., and D. Y. Yang 2006 Early storage and sedentism on the Pacific northwest coast: Ancient DNA analysis of salmon remains from Namu, British Columbia. American Antiquity 71(1):123-140.
Caramelli, D., C. Lalueza-Fox, C. Vernesi, M. Lari, A. Casoli, F. Mallegni, B. Chiarelli, I. Dupanloup, J. Bertranpetit, G. Barbujani, and G. Bertorelle 2003 Evidence for a genetic discontinuity between Neandertals and 24,000-year-old anatomically modern Europeans. Proceedings of the National Academy of Sciences of the United States of America 100(11):6593-6597.
Carlson, R. L. 1996 The late prehistory of British Columbia. In Early human occupation in British Columbia, edited by Roy L. Carlson and Luke R. Dalla Bona, pp. 215-226. UBC Press, Vancouver, BC.
Chang, A. S., and R. T. Patterson 2005 Climate shift at 4400 years BP: Evidence from high-resolution diatom stratigraphy, Effingham Inlet, British Columbia, Canada. Palaeogeography Palaeoclimatology Palaeoecology 226(1-2):72-92.

195
Clague, J. J., J. R. Harper, R. J. Hebda, and D. E. Howes 1982 Late Quarternary sea leven changes and crustal movements, coastal British Columbia. Canadian Journal of Earth Science 19:597-618.
Clapham, P. J. 1996 The social and reproductive biology of humpback whales: an ecological perspective. Mammal Review 26(1):27-49.
Clapham, P.J., S. B. Young, and R. L. Brownell Jr. 1999 Baleen whales: conservation issues and the status of the most endangered populations. Mammal Review 29(1):35-60.
Clapham, P. J. 2001 Why do baleen whales migrate? A response to Corkeron and Connor. Marine Mammal Science 17(2):432-436.
Clapham, P.J., and C. S. Baker 2002 Whaling, Modern. In Encyclopedia of Marine Mammals, edited by W. F. Perrin, B. Würsig and J. G. M. Thewissen, pp. 1328-1332. Academic Press, New York.
Clapham, P. J., P. J. Palsboll, L. Pastene, T. D. Smith, and L. Walloe 2006 Annex S: Estimating Pre-whaling Abundance. In Report of the Scientific Committee-Chairs Report of the 57th Annual Meeting 2005, Vol. Suppl, pp. 386-387. International Whaling Commission, Cambridge, UK.
Clapham, P.J., A. Aguilar, and L. T. Hatch 2008 Determining spatial and temporal scales for management: lessons from whaling. Marine Mammal Science 24(1):183-201.
Collins, M. J., C. M. Nielsen-Marsh, J. Hiller, C. I. Smith, J. P. Roberts, R. V. Prigodich, T. J. Weiss, J. Csapo, A. R. Millard, and G. Turner-Walker 2002 The survival of organic matter in bone: A review. Archaeometry 44:383-394.
Collins, M. J., K. E. H. Penkman, N. Rohland, B. Shapiro, Reimer C. Dobberstein, S.Ritz-Timme, and M. Hofreiter 2009 Is amino acid racemization a useful tool for screening for ancient DNA in bone? Proceedings of the Royal Society B: Biological Sciences
Cooper, A., J. Rhymer, H. F. James, S. L. Olson, C. E. McIntosh, M. D. Sorenson, and R. C. Fleischer 1996 Ancient DNA and island endemics. Nature 381(6582):484.
Cooper, A., and H. N. Poinar 2000 Ancient DNA: do it right or not at all. Science (New York, N.Y.) 289(5482):1139.
Cooper, A., C. Lalueza-Fox, S. Anderson, A. Rambaut, J. Austin, and R. Ward 2001 Complete mitochondrial genome sequences of two extinct moas clarify ratite evolution. Nature 409(6821):704-707.
Corkeron, P. J., and R. C. Connor 1999 Why do Baleen Whales migrate? Marine Mammal Science 15(4):1228-1245.

196
Craig, A. S., and L. M. Herman 1997 Sex differences in site fidelity and migration of humpback whales (Megaptera novaeangliae) to the Hawaiian Islands. Canadian journal of zoology 75(11):1923-1933.
Craig, A. S., L. M. Herman, C. M. Gabriele, and A. A. Pack 2003 Migratory timing of humpback whales (Megaptera novaeangliae) in the central North Pacific varies with age, sex and reproductive status. Behaviour 140:981-1001.
Crockford, S. J., and S. G. Frederick 2007 Sea ice exansion in the Bering Sea during the Neoglacial: evidence from archaeozoology. The Holocene 17(6):699-706.
Croes, D. R. 1977 Basketry from the Ozette Village archaeological site: a technological, functional, and comparative study. Washington State University,
Dallimore, A., R. E. Thomson, and M. A. Bertram 2005 Modem to Late Holocene deposition in an anoxic fjord on the west coast of Canada: Implications for regional oceanography, climate and paleoseismic history. Marine Geology 219(1):47-69.
Darling, J.D., and S. Cerchio 1993 Movement of a humpback whale (Megaptera novaeangliae) between Japan and Hawaii. Marine Mammal Science 9(1):84-88.
Davis, S. J. M. 2010 A brief ABC of zooarchaeology for DNA people, or how we study bones. Paper presented at the presented at the 11th International Conference of Archaeozoology, Paris.
Davis, L.E., R. E. Gallman, and K. Gleiter 1997 In pursuit of Leviathan :technology, institutions, productivity, and profits in American whaling, 1816-1906. University of Chicago Press, Chicago; London.
DeMaster, D. P., A. W. Trites, P. J. Clapham, S. Mizroch, P. Wade, R. J. Small, and J. V. Hoef 2006 The sequential megafaunal collapse hypothesis: Testing with existing data. Progress in Oceanography 68(2-4):329-342.
Desalle, R., and G. Amato 2004 The Expansion of Conservation Genetics. Nature Reviews Genetics 5(Sept 2004):702-712.
Dewhirst, J. 1978 Nootka Sound: A 4,000 Year Perspective. In Nu.tka: the history and survival of Nootkan culture, edited by Barbara S. Efrat and W. J. Langlois, pp. 1-29. Aural History Provincial Archives of BC, Victoria,BC.
Di Bernardo, G., S. Del Gaudio, U. Galderisi, and M. Cipollaro 2004 2000 Year-old ancient equids: an ancient-DNA lesson from pompeii remains.

197
Journal of .Experimental .Zoolog B.Molecular and Developmental Evolution 302(6):550-556.
Drucker P. 1966 Nootka Whaling. in: McFeat (editor) Indians of the North Pacific Coast;studies in selected topics. Vol. 25, McClelland and Stewart, Toronto.
Drucker, P. 1951 The northern and central Nootkan tribes.
Drucker, P. 1950 Northwest coast. --. Vol. 9:3, University of California Press, Berkeley.
Drummond, A. J., G. K. Nicholls, A. G. Rodrigo, and W. Solomon 2002 Estimating mutation parameters, population history and genealogy simultaneously from temporally spaced sequence data. Genetics 161(3):1307-1320.
Drummond, AJ, A. Rambaut, B. Shapiro, and OG Pybus 2005 Bayesian coalescent inference of past population dynamics from molecular sequences. Molecular biology and evolution 22(5):1185-1192.
Drummond, A. J., and A. Rambaut 2007 BEAST: Bayesian evolutionary analysis by sampling trees. BMC evolutionary biology 7:214.
Drummond AJ, Suchard MA, Xie D and Rambaut A. 2012 Bayesian phylogenetics with BEAUti and the BEAST 1.7. Molecular Biology and Evolution
Estes, J. A., M. T. Tinker, T. M. Williams, and D. F. Doak 1998 Killer whale predation on sea otters linking oceanic and nearshore ecosystems. Science282(5388):473.
Estes, J. A. 2007 Whales, whaling, and ocean ecosystems. University of California Press, Berkeley.
Excoffier, L., G. Laval, and S. Schneider 2007 Arlequin (version 3.0): An integrated software package for population genetics data analysis. Evolutionary Bioinformatics 2005.
Félix, F., and N. Botero-Acosta 2011 Distribution and behaviour of humpback whale mother--calf pairs during the breeding season off Ecuador. Mar Ecol Prog Ser 426:277-287.
Francis, D. 1990 A history of world whaling. Viking, Markham, Ont.
Frankham, R. 2005 Conservation biology: ecosystem recovery enhanced by genotypic diversity. Heredity 95(3):183.
198
Frederick, S. G. 2011 Appendix A: Vertebrate Faunal Report for the Huu-ay-aht Archaeology Project: Results from the 2006 Huu7ii village excavations in: Huu7ii: Household Archaeology at a Nuu-chah-nulth Village Site in Barkley Sound Alan D. McMillan and Denis E. St. Claire.
Fredrick ,S. and Crockford,S. 2005 Appendix D: Analysis of the Vertebrate Fauna from Ts'ishaa Village, DfSi-16, Benson Island, B.C. In: McMillan, A. D., and D. E. St.Claire 2005 Ts'ishaa: Archaeology and ethnography of a Nuu-chah-nulth origin site in Barkley Sound. Archaeological Press, Burnaby.
Freitas, F. O., G. Bendel, R. G. Allaby, and T. A. Brown 2003 DNA from primitive maize landraces and archaeological remains: implications for the domestication of maize and its expansion into South America. Journal of Archaeological Science 30(7):901-908.
Friday, N., T. Smith, P. Stevick, J. Allen, and T. Ferndale 2008 Balancing bias and precision in capture-recapture estimates of abundance. Marine mammal Science 24(2):253-275.
Frost, S. 1978 Whales and whaling-Inquiry into Whales and Whaling (Australia). Vol. 1, Australian Govt. Pub. Service, Canberra.
Gales, N. J., T. Kasuya, P. J. Clapham, and R. L. Brownell Jr. 2005 Japan's whaling plan under scrutiny. Nature 435(7044):883-884.
Garland, E. C., A. W. Goldizen, M. L. Rekdahl, R. Constantine, C. Garrigue, N. D. Hauser, M. Poole, J. Robbins, and M. J. Noad 2011 Dynamic Horizontal Cultural Transmission of Humpback Whale Song at the Ocean Basin Scale. Current Biology 21(8):687-691.
“Craig” George, J., and J. Bockstoce 2008 Two historical weapon fragments as an aid to estimating the longevity and movements of bowhead whales. Polar Biology 31(6):751-754.
Geraci, J. R., and V. J. Lounsbury 2005 Marine mammals ashore: A field guide for strandings. National Aquarium in Baltimore,
Gerstenberger, J., S. Hummel, T. Schultes, B. Hack, and B. Herrmann 1999 Reconstruction of a historical genealogy by means of STR analysis and Y-haplotyping of ancient DNA. European Journal of Human Genetics 7(4):469-477.
Gessner, J., G. M. Arndt, R. Tiedemann, R. Bartel, and F. Kirschbaum 2006 Remediation measures for the Baltic sturgeon: status review and perspectives. Journal of Applied Ichthyology 22:23-31.
Gilbert, M. T., J. Binladen, W. Miller, C. Wiuf, E. Willerslev, H. Poinar, J. E. Carlson, J. H. Leebens-Mack, and S. C. Schuster

199
2006 Recharacterization of ancient DNA miscoding lesions: insights in the era of sequencing-by-synthesis. Nucleic acids research
Gilbert, M. T. P., A. J. Hansen, E. Willerslev, L. Rudbeck, I. Barnet, N. Lynnerup, and A. Cooper 2003 Characterization of genetic miscoding lesions caused by postmortem damage. American Journal of Human Genetics 72(1):48-61.
Gilbert, M. T. P., H. J. Bandelt, M. Hofreiter, and I. Barnet 2005 Assessing ancient DNA studies. Trends in Ecology & Evolution 20(10):541-544.
Gilbert, M. T. P., and E. Willerslev 2007 Rescuing ancient DNA. Nature biotechnology 25(8):872-874.
Gill, P., P. Gill, P. L. Ivanov, C. Kimpton, R. Piercy, N. Benson, G. Tully, I. Evett, E. Hagelberg, and K. Sullivan 1994 Identification of the remains of the Romanov family by DNA analysis. Nature genetics 6(2):130-135.
Golla, S. 2000 Legendary History of the Tsisha'ath: A Working Translation. In Nuu-chah-nulth Voices, Histories, Objects and Journey, edited by A. L. Hoover, pp. 133-171. Royal British Columbia Museum, Victoria.
Green, R. E., J. Krause, S. E. Ptak, A. W. Briggs, M. T. Ronan, J. F. Simons, L. Du, M. Egholm, J. M. Rothberg, M. Paunovic, and S. Pääbo 2006 Analysis of one million base pairs of Neanderthal DNA. Nature 444(7117):330-336.
Gregr, E. J., L. Nichol, J. K. B. Ford, G. Ellis, and A. W. Trites 2000 Migration and population structure of northeastern Pacific whales off coastal British Columbia: An analysis of commercial whaling records from 1908-1967. Marine Mammal Science 16(4):699-727.
Gregr, E. J., and K. O. Coyle 2009 The biogeography of the North Pacific right whale (Eubalaena japonica). Progress in Oceanography 80(3-4):188.
Gugerli, F., L. Parducci, and R. J. Petit 2005 Ancient plant DNA: review and prospects. New Phytologist 166(2):409-418.
Gunnlaughsson, T., and J. Sigurjonsson 1990 NASS-87: Estimation of whale abundance based on observations made onboard Icelandic and Faroese survey vessels. Rep.int.Whal.Commn 40:571-580.
Gustincich, S., G. Manfioletti, G. Del Sal, C. Schneider,P. Carninci. 1991 A fast method for high-quality genomic DNA extraction from whole human blood. BioTechniques 11(3):298-302.
Gustafson, R., J. Myers, L. Weitkamp, O. Johnson, J. Hard, R. Waples, G. Bryant, H. R. Huber, J. C. Jorgensen, V. L. Butler, G. Baker, and R. Stevens

200
2006 Pacific salmon extinctions: quantifying lost and remaining diversity; Can salmonids (Oncorhynchus spp.) be identified to species using vertebral morphometrics? Paper presented at the Northwest Fisheries Science Center Symposium “Looking to the Past to Envision the Future”,
Haak, W., P. Forster, B. Bramanti, S. Matsumura, G. Brandt, M. Tanzer, R. Villems, C. Renfrew, D. Gronenborn, K. W. Alt, and J. Burger 2005 Ancient DNA from the first European farmers in 7500-year-old Neolithic sites. Science 310(5750):1016-1018.
Hadly, E., U. Ramakrishnan, Y. Chan, M. van Tuinen, K. O'Keefe, and P. Spaeth 2004 Genetic response to climatic change: Insights from ancient DNA and phylochronology. Plos Biology 2(10):1600-1609.
Hadly, E. A., M. H. Kohn, J. A. Leonard, and R. K. Wayne 1998 A genetic record of population isolation in pocket gophers during Holocene climatic change. Proceedings of the National Academy of Sciences 95(12):6893.
Halpern, B. S., K. A. Selkoe, F. Micheli, and C. V. Kappel 2007 Evaluating and ranking the vulnerability of global marine ecosystems to anthropogenic threats. Conservation biology : the journal of the Society for Conservation Biology 21(5):1301-1315.
Handt, O., M. Krings, R. H. Ward, and S. Pääbo 1996 The retrieval of ancient human DNA sequences. American Journal of Human Genetics 59(2):368-376.
Hansen, A. J., E. Willerslev, C. Wiuf, T. Mourier, and P. Arctander 2001 Statistical evidence for miscoding lesions in ancient DNA templates. Molecular biology and evolution 18(2):262-265.
Hart, M. W., and P. B. Marko 2010 It’s about time: divergence, demography, and the evolution of developmental modes in marine invertebrates. Integrative and Comparative Biology 50(4):643-661.
Hebsgaard, M. B., C. Wiuf, M. T. Gilbert, H. Glenner, and E. Willerslev 2007 Evaluating Neanderthal genetics and phylogeny. Journal of Molecular Evolution 64(1):50-60.
Hedrick, P. W. 2001 Cosnervation genetics: where are we now? Trends in Ecology & Evolution 16(11):629-636.
Higdon, J. W. 2008 Second reply to the comment by Romero and Kannada on “Genetic analysis of 16th-century whale bones prompts a revision of the impact of Basque whaling on right and bowhead whales in the western North Atlantic”. Canadian journal of zoology 86(1):76-79.

201
Higuchi, R., B. Bowman, M. Freiberger, O. A. Ryder, and A. C. Wilson 1984 DNA sequences from the quagga, an extinct member of the horse family. Nature 312(5991):282-284.
Ho, S. Y. W., M. J. Phillips, A. Cooper, and A. J. Drummond 2005 Time dependency of molecular rate estimates and systematic overestimation of recent divergence times. Molecular biology and evolution 22(7):1561-1568.
Ho, S. Y. W., R. Lanfear, M. J. Phillips, I. Barnes, J. A. Thomas, S. O. Kolokotronis, B. Shapiro, S. Y. W. Ho, R. Lanfear, L. Bromham, M. J. Phillips, J. Soubrier, A. G. Rodrigo, and A. Cooper 2011 Bayesian estimation of substitution rates from ancient DNA sequences with low information content; Time-dependent rates of molecular evolution. Molecular ecology 60(3):366-375.
Hobler, P. M. 1990 Prehistory of the Central Coast of British Columbia. In Handbook of North American Indians, Vol. v7 Northwest Coast, edited by W. C. Sturtevant, pp. 298-305. Smithsonian Institution, Washington.
Hofreiter, M., V. Jaenicke, D. Serre, A. von Haeseler, and S. Pääbo 2001a DNA sequences from multiple amplifications reveal artifacts induced by cytosine deamination in ancient DNA. Nucleic acids research 29(23):4793-4799.
Hofreiter, M., D. Serre, H. N. Poinar, M. Kuch, and S. Pääbo 2001b Ancient DNA. Nature Reviews Genetics 2:353-359.
Hofreiter, M., G. Rabeder, V. Jaenicke-Despres, G. Withalm, D. Nagel, M. Paunovic, G. Jambresic, and S.Pääbo 2004 Evidence for reproductive isolation between cave bear populations. Current biology : CB 14(1):40-43.
Holt, S. J. 2004 Counting whales in the North Atlantic. Science 303(5654):39-39.
Huelsbeck, D. R. 1988 Whaling In The Precontact Economy Of The Central Northwest Coast. Arctic Anthropology 25(1):1-15.
Hughes, A. R., and J. J. Stachowicz 2004 Genetic diversity enhances the resistance of a seagrass ecosystem to disturbance. Proceedings of the National Academy of Sciences of the United States of America 101(24):8998.
Hummel, S., and B. Herrmann 1996 aDNA typing for reconstruction of kinship. Homo 47(1-3):215-222.
Inglis, R., and J. Haggarty 1986 Pacific Rim Ethnographic History. Vol. Project 257, Environment Canada Parks, Unpublished Report.

202
Iniguez, A. M., A. Araujo, L. F. Ferreira, and A. C. Vicente 2003 Analysis of ancient DNA from coprolites: a perspective with random amplified polymorphic DNA-polymerase chain reaction approach. Vol. 98 Suppl 1,
International Whaling Commission 1946 International Convention for the Regulation of Whaling. Washington, DC.
Jackson, J.B.C. 2001 What was natural in the coastal oceans? Proceedings of the National Academy of Sciences of the United.States of America 98(10):5411-5418.
Jackson, J., C. S. Baker, M. Vant, D. Steel, L. Medrano-Gonzalez, and S. R. Palumbi 2009 Big and Slow: Phylogenetic Estimates of Molecular Evolution in Baleen Whales (Suborder Mysticeti). Molecular biology and evolution 26(11):2427-2440.
Jackson, J. A., N. J. Patenaude, E. L. Carroll, and C. S. Baker 2007 How few whales were there after whaling? Inference from contemporary mtDNA diversity. Molecular ecology
Jackson, J. B. C., and K. G. Johnson 2001 Paleoecology - Measuring past biodiversity. Science 293(5539):2401-+.
Jackson, J. B. C., M. X. Kirby, W. H. Berger, K. A. Bjorndal, L. W. Botsford, B. J. Bourque, R. H. Bradbury, R. Cooke, J. Erlandson, J. A. Estes, T. P. Hughes, S. Kidwell, C. B. Lange, H. S. Lenihan, J. M. Pandolfi, C. H. Peterson, R. S. Steneck, M. J. Tegner, R. R. Warner, J. B. C. Jackson, and K. G. Johnson 2001; 2001 Historical overfishing and the recent collapse of coastal ecosystems; Paleoecology - Measuring past biodiversity. Science; Science 293; 293(5530; 5539):2401-+.
Jaenicke-Despres, V., E. S. Buckler, B. D. Smith, M. T. P. Gilbert, A. Cooper, J. Doebley, and S. Pääbo 2003 Early allelic selection in maize as revealed by ancient DNA. Science 302(5648):1206-1208.
Jansen, T., P. Forster, M. A. Levine, H. Oelke, M. Hurles, C. Renfrew, J. Weber, and K. Olek 2002 Mitochondrial DNA and the origins of the domestic horse. Proceedings of the National Academy of Sciences of the United States of America 99(16):10905-10910.
Jenkins, J. T. 1971; 1921 A history of the whale fisheries;from the Basque fisheries of the tenth century to the hunting of the finner whale at the present date. Kennikat Press, Port Washington, N.Y.
Jewitt, J. R. 2000 White slaves of Maquinna: John R. Jewitt's narrative of capture and confinement at Nootka. Heritage House Pub Co Ltd,
Jewitt, J. R. 2000 White slaves of Maquinna : John R. Jewitt's narrative of capture and confinement at Nootka. Heritage House Pub., Surrey, B.C.

203
Johnson, S. S., M. B. Hebsgaard, T. R. Christensen, M. Mastepanov, R. Nielsen, K. Munch, T. Brand, M. T. Gilbert, M. T. Zuber, Michael Bunce, R. Ronn, D. Gilichinsky, D. Froese, and E. Willerslev 2007 Ancient bacteria show evidence of DNA repair. Proceedings of the National Academy of Sciences of the United States of America 104(36):14401-14405.
Kaestle, F. 2002 The molecule hunt: Archaeology and the search for ancient DNA. Archaeology 55(5):68-68.
Kaestle, F. A., and D. G. Smith 2001 Ancient mitochondrial DNA evidence for prehistoric population movement: The Numic expansion. American Journal of Physical Anthropology 115(1):1-12.
Kaestle, F. A., and K. A. Horsburgh 2002 Ancient DNA in anthropology: Methods, applications, and ethics. Yearbook of Physical Anthropology 45:92-130.
Kalland, A., and B. Moeran 1992 Japanese whaling :end of an era? Vol. 61, Curzon Press, London.
Kandel, A. W., and N. J. Conard 2003 Scavenging and Processing of Whale Meat and Blubber by Later Stone Age People of the Geelbek Dunes, Western Cape Province, South Africa. The South African Archaeological Bulletin 58(178):91-93.
Kareiva, P., M. Marvier, and M. McClure 2000 Recovery and management options for spring/summer chinook salmon in the Columbia River Basin.Science 290(5493):977.
Kemp, B. M., C. Monroe, and D. G. Smith 2006 Repeat silica extraction: a simple technique for the removal of PCR inhibitors from DNA extracts. Journal of Archaeological Science 33(12):1680-1689.
Kemp, B. M., and D. G. Smith 2010 Letter to the Editor: Ancient DNA Methodology: Thoughts from Brian M. Kemp and David Glenn Smith on “Mitochondrial DNA of Protohistoric Remains of an Arikara Population from South Dakota”. Human Biology 82(2):7.
Kennett, D., A. Anderson, M. Prebble, E. Conte, and J. Southon 2006 Prehistoric human impacts on Rapa, French Polynesia. ANTIQUITY-OXFORD- 80(308):340
King, C. E., R. Debruyne, M. Kuch, C. Schwarz, and H. N. Poinar 2009 A quantitative approach to detect and overcome PCR inhibition in ancient DNA extracts. BioTechniques 47(5):941.
Kirk, R. 1986 Traditions and Change on the Northwest Coast. University of Washington Press, Seattle.

204
Kirschbaum, F., S. Wuertz, P. Williot, R. Tiedemann, A. Gerd-Michael, E. Anders, A. Krüger, R. Bartel, and J. Gessner 2009 Prerequisites for the Restoration of the European Atlantic Sturgeon, Acipenser sturio and the Baltic Sturgeon (A. oxyrinchusxA. sturio) in Germany. Biology, Conservation and Sustainable Development of Sturgeons :385-401.
Knapp, M., and M. Hofreiter 2010 Next Generation Sequencing of Ancient DNA: Requirements, Strategies and Perspectives. Genes 1(2):227-243.
Kool, R. 1982 Northwest Coast Indian Whaling: New Considerations. Canadian Journal of Anthropology 3(1):31-44.
Krause, J., L. Orlando, D. Serre, B. Viola, K. Prüfer, M. P. Richards, J. J. Hublin, C. Hänni, A. P. Derevianko, and S. Pääbo 2007 Neanderthals in central Asia and Siberia. Nature 449(7164):902-904.
Krings, M., A. Stone, R. W. Schmitz, H. Krainitzki, M. Stoneking, and Svante Pääbo 1997 Neandertal DNA sequences and the origin of modern humans. Cell 90(1):19-30.
Lagerquist, B. A., B. R. Mate, J.G. Ortega-Ortiz, M. Winsor, and J. Urban-Ramirez 2008 Migratory movements and surfacing rates of humpback whales (Megaptera novaeangliae) satellite tagged at Socorro Island, Mexico. Marine Mammal Science 24(4):815-830.
Lantis, M. 1940 Note on the Alaskan Whale Cult and Its Affinities. American Anthropologist 42(2, Part 1):366-368.
Larson, G., K. Dobney, U. Albarella, M. Fang, E. Matisoo-Smith, J. Robins, S. Lowden, H. Finlayson, T. Brand, E. Willerslev, P. Rowley-Conwy, L. Andersson, and A. Cooper 2005 Worldwide phylogeography of wild boar reveals multiple centers of pig domestication. Vol. 307,
Larson, G., U. Albarella, K. Dobney, P. Rowley-Conwy, J. Schibler, A. Tresset, J. D. Vigne, C. J. Edwards, A. Schlumbaum, A. Dinu, A. Balacsescu, G. Dolman, A. Tagliacozzo, N. Manaseryan, P. Miracle, L. Van Wijngaarden-Bakker, M. Masseti, D. G. Bradley, and A. Cooper 2007 Ancient DNA, pig domestication, and the spread of the Neolithic into Europe. Proceedings of the National Academy of Sciences of the United States of America 104(39):15276-15281.
Lee, Sang-Mog, and D. Robineau 2004 Les cétacés des gravures rupestres néolithiques de Bangu-dae (Corée du Sud) et les débuts de la chasse à la baleine dans le Pacifique nord-ouest. L'Anthropologie 108(1):137-151.
Leonard, J. A., O. C. Shanks, M. Hofreiter, E. Kreuz, L. Hodges, W. Ream, R. K. Wayne, and R. C. Fleischer 2007 Animal DNA in PCR reagents plague ancient DNA research. Journal of Archaeological Science 34:1361-1366.

205
Leonard, J. A. 2008 Ancient DNA applications for wildlife conservation. Mol. Ecol. :1-11.
Li, M., F. Wei, B. Goossens, Z. Feng, H. B. Tamate, M. W. Bruford, and S. M. Funk 2005 Mitochondrial phylogeography and subspecific variation in the red panda (Ailurus fulgens): implications for conservation. Vol. 36,
Lindahl, T. 1993 Instability and decay of primary structure of DNA. Nature 362:709-715.
Loftus, R. T., O. Ertugrul, A. H. Harba, M. A. El-Barody, D. E. MacHugh, S. D. Park, and D. G. Bradley 1999 A microsatellite survey of cattle from a centre of origin: the Near East. Molecular ecology 8(12):2015-2022.
Logan, J. A., and J. A. Tuck 1990 A Sixteenth Century Basque Whaling Port in Southern Labrador. APT Bulletin 22(3):65-72.
Loreille, O., E. Roumat, O. Verneau, F. Bouchet, and C. Hanni 2001 Ancient DNA from Ascaris: extraction amplification and sequences from eggs collected in coprolites. International journal for parasitology 31(10):1101-1106.
Losey, R. J., and D. Y. Yang 2007 Opportunistic Whale Hunting On The Northwest Coast: Ancient DNA, Artifact, And Ethnographic Evidence. American Antiquity 72(4):657-676.
Ludwig, A., U. Arndt, S. Lippold, N. Benecke, L. Debus, T. L. King, and S. Matsumura 2008 Tracing the first steps of American sturgeon pioneers in Europe. BMC evolutionary Biology 8(1):221.
Ludwig, A., U. Arndt, L. Debus, E. Rosello, and A. Morales 2009 Ancient mitochondrial DNA analyses of Iberian sturgeons. Journal of Applied Ichthyology 25(1):5-9.
Lyman, R. L. 1996 Applied zooarchaeology: the relevance of faunal analysis to wildlife managment. World Archaeology 28(1):110-125.
Lyman, R. L., and K. P. Cannon 2004 Zooarchaeology and conservation biology. University of Utah Press, Salt Lake City.
Lyman, R. L. 2006 Paleozoology in the service of conservation biology. Evolutionary Anthropology 15(1):11-19.
Lyman, R. L. 2004 Aboriginal overkill in the intermountain west of North America: zooarchaeological tests and implications. Human nature 15(2):169-208.

206
Lyman, R. L., and M.J. O'Brien 2005 Within-taxon morphological diversity in late-Quarternary Neotoma as a paleoenvironmental inidicator, Bonneville Basin, northwestern Utah, USA. Quaternary research 63(3):274-282.
Lyman, R.L. 2004 Biogeographic and paleoenvironmental implications of late Quaternary pygmy rabbits (Brachylagus idahoensis) in eastern Washington. Western N Am Nat 64:1-6.
MacHugh, D. E., C. S. Troy, F. McCormick, I. Olsaker, E. Eythorsdottir, and D. G. Bradley 1999 Early medieval cattle remains from a Scandinavian settlement in Dublin: Genetic analysis and comparison with extant breeds. Philosophical Transactions of the Royal Society of London Series B-Biological Sciences 354(1379):99-108.
Mackie, A. P., and L. Williamson 2003 Nuu-chah-nulth Houses: Structural Remains and Cultural Depressionson Southwest Vancouver Island.In Emerging from the Mist: Studies in Northwest Coast Culture History, edited by R. G. Matson, G. Coupland, andQ. Mackie. UBC Press,Vancouver.
Malmstrom, H., J. Stora, L. Dalen, G. Holmlund, and A. Gotherstrom 2005 Extensive human DNA contamination in extracts from ancient dog bones and teeth. Molecular biology and evolution 22(10):2040.
Manen, J. F., L. Bouby, O. Dalnoki, P. Marinval, M. Turgay, and A. Schlumbaum 2003 Microsatellites from archaeological Vitis vinifera seeds allow a tentative assignment of the geographical origin of ancient cultivars. Journal of Archaeological Science 30(6):721-729.
Mantooth, S. J., and B. R. Riddle 2011 Molecular Biogeography: The Intersection between Geographic and Molecular Variation. Geography Compass 5(1):1-20.
Marko, P. B., and M. W. Hart 2011 The complex analytical landscape of gene flow inference. Trends in ecology&evolution
Mascia, M., J. P. Brosius, T. A. Dobson, B. C. Forbes, L. Horowitz, M. A. Mckean, and N. J. Turner 2003 Conservation and Social Science. Cons. Biol. 17(3):649-650.
McCartney, A. P., and J. M. Savelle 1985 Thule Eskimo whaling in the central Canadian Arctic. Arctic Anthropology :37-58.
McFeat, T. 1966 Indians of the North Pacific Coast;studies in selected topics. Vol. 25, McClelland and Stewart, Toronto.
McGrath, K. M. 2010 The Effects of High Temperature on the Quantity and Quality of Mitochondrial and

207
Nuclear DNA in Non-Human Skeletal Remains. MA Thesis, Simon Fraser University, Burnaby, BC, Canada.
McLeod, B. A., M. W. Brown, M. W. Moore, W. Stevens, S. H. Barkham, M. Barkham, and B. N. White 2008 Bowhead Whales, Not right Whales, Were the Primary Target of 16th and 17th Century Basque Whalers in the Western North Atlantic. Arctic 61(1):61-75.
McMillan, A. D. 1999 Since the time of the transformers : the ancient heritage of the Nuu-chah-nulth, Ditidaht, and Makah. UBC Press, Vancouver.
McMillan, A. D., and D. E. St.Claire 2005 Ts'ishaa: Archaeology and ethnography of a Nuu-chah-nulth origin site in Barkley Sound. Archaeological Press, Burnaby.
McMillan, A. D., D. E. St. Claire 1982 Alberni prehistory : archaeological and ethnographic investigations on Western Vancouver Island. Published by the Alberni Valley Museum and Theytus Books, Penticton, B.C.
McMillan, A.D. 1998 Changing views of Nuu-chah-nulth culture history: evidence of population replacement in Barkley sound. Canadian journal of archaeology 22(1):5-18.
McMillan, A. D., E. Yellowhorn 2004 First peoples in Canada. 3rd ed. Douglas & McIntyre, Vancouver.
McMillan, A.D. 2009 A Tale of two Ethnographies:The Contributions of Edward Sapir and Philip Drucker to Nuu-chah-nulth Archaeology. In Painting the past with a broad brush :papers in honour of James Valliere Wright Vol. 170, edited by David L. Keenlyside, J. -. Pilon and Canadian Museum of Civilization, pp. 741. Canadian Museum of Civilization, Gatineau, Québec.
Medrano-Gonzalez, L., Anelio Aguayo-Lobo, J. Urban-Ramirez, and C. S. Baker 1995 Diversity and distribution of mitochondrial DNA lineages among humpback whales, megaptera novaeangliae, in the Mexican Pacific Ocean. Canadian Journal of Zoology-Revue Canadienne De Zoologie 73:1735-1743.
Mikhalev, Y. A. 1997 Humpback whales Megaptera novaeangliae in the Arabian Sea. Marine Ecology Progress Series 149(1):13-21.
Mitchell, D. H. 1971 Archaeology of the Gulf of Georgia area: a natural region and its culture types. British Columbia Provincial Museum,
Mitchell, D. H. 1990 Prehistory of the coasts of southern British Columbia and northern

208
Washington. Northwest coast.US Government Printing Office, Washington, DC (WC Sturtevant, general editor, Handbook of North American Indians 7):340-358.
Mizroch, S. A., L. M. Herman, J. M. Straley, D. A. Glockner-Ferrari, C. Jurasz, J. Darling, S. Cerchio, C. M. Gabriele, D. R. Salden, and O. Ziegesar 2004 Estimating the adult survival rate of central North Pacific humpback whales (Megaptera novaeangliae). Journal of Mammalogy 85(5):963-972.
Monks, G. G. 2001 Quit blubbering: an examination of Nuu'chah'nulth (Nootkan) whale butchery. International Journal of Osteoarchaeology 11(1-2):136-149.
Monks, G. G., A. D. McMillan, and D. St.Claire 2001 Nuu-chah-nulth Whaling: Archaeological insights into antiquity, species preferences, and cultural imporance. Arctic Anthropology 38(1):60-81.
Monks, G. G. 2005 The exploitation and cultural importance of sea mammals. Oxbow, Oxford.
Monks, G.G. 2003 The cultural taphonomy of Nuu-chah-nulth whale bone assemblages. In Emerging from the mist : studies in Northwest Coast culture history, pp. 188-212.
Monsalve, M. V., A. C. Stone, C. M. Lewis, A. Rempel, M. Richards, D. Straathof, and D. V. Devine 2002 Brief communication: Molecular analysis of the Kwaday Dan Ts'inchi ancient remains found in a glacier in Canada. American Journal of Physical Anthropology 119(3):288-291.
Mulligan, Connie J. 2006 Anthropological Applications of Ancient DNA: Problems and Prospects. Antiquity 71(2):365-380.
Mullis, K., F. Faloona, S. Scharf, R. Saiki, G. Horn, and H. Erlich 1986 Specific enzymatic amplification of DNA in vitro: the polymerase chain reaction. Cold Spring Harbor symposia on quantitative biology 51 Pt 1:263-273.
Mulville, J. 2002a The role of cetacea in prehistoric and historic Atlantic Scotland. International Journal of Osteoarchaeology 12(1):34-48.
Mulville, J. 2002b A Whale of a Problem? The use of Zooarchaeological Evidence in Modern Whaling. In The exploitation and Cultural Importance of Sea Mammals 9th ICAZ Conference, Durham 2002, edited by G. G. Monks, pp. 154-166. Oxbow, Oxford.
Mustika, P. L. K., P. Hutasoit, C. C. Madusari, F. S. Purnomo, A. Setiawan, K. Tjandra, and W. E. Prabowo 2009 Whale Strandings in Indonesia, Including the First Record of a Humpback Whale

209
(Megaptera Novaeangliae) in the Archipelago. Raffles Bulletin of Zoology 57(1):199-206.
Navascues, M., and B. C. Emerson 2009 Elevated substitution rate estimates from ancient DNA: model violation and bias of Bayesian methods. Molecular ecology 18(21):4390-4397.
Newsome, S. D., M. A. Etnier, D. Gifford-Gonzalez, D. L. Phillips, M. van Tuinen, E. A. Hadly, D. P. Costa, D. J. Kennett, T. P. Guilderson, and P. L. Koch 2007 The shifting baseline of northern fur seal ecology in the northeast Pacific Ocean. Proceedings of the National Academy of Sciences of the United States of America 104(23):9709-9714.
Nichol, L. M., E. J. Gregr, R. Flinn, J. K. B. Ford, R. Gurney, L. Michaluk, and A. Peacock 2002 British Columbia commercial whaling catch data 1908 to 1967: A detailed description of the BC historical whaling database. Canadian Technical Report of Fisheries and Aquatic Sciences
Nishida, M., M. Goto, L. A. Pastene, N. Kanda, and H. Koike 2007 Phylogenetic Relationships Among Cetaceans Revealed by Y-Chromosome Sequences. Zoological Science 24:723-732.
Noonan, J. P., G. Coop, S. Kudaravalli, D. Smith, J. Krause, J. Alessi, F. Chen, D. Platt, Svante Pääbo, J. K. Pritchard, and E. M. Rubin 2006 Sequencing and analysis of Neanderthal genomic DNA. Science (New York, N.Y.) 314(5802):1113-1118.
Orlando, L., J. A. Leonard, A. Thenot, V. Laudet, C. Guerin, and C. Hanni 2003 Ancient DNA analysis reveals woolly rhino evolutionary relationships. Molecular phylogenetics and evolution 28(3):485-499.
Olavarria, C., C. S. Baker, C. Garrigue, M. Poole, N. Hauser, S. Caballero, L. Florez-Gonzalez, M. Brasseur, J. L. Bannister, J. Capella, Phillip J. Clapham, R. Dodemont, M. Donoghue, C. Jenner, M. N. Jenner, D. Moro, M. Oremus, D. Paton, Howard C. Rosenbaum, and K. Russell 2007 Population structure of South Pacific humpback whales and the origin of the eastern Polynesian breeding grounds. Marine Ecology-Progress Series 330:257-268.
Palsboll, Per J., Martine Berube, Alex Aguilar, G. Notarbartolo-Di-Sciara, and R. Nielsen 2004 Discerning between recurrent gene flow and recent divergence under a finite-site mutation model applied to North Atlantic and Mediterranean Sea fin whale (Balaenoptera physalus) populations. Evolution 58(3):670-675.
Palumbi, S. R. 2001 Humans as the world's greatest evolutionary force. Science 293(5536):1786-1790.
Palumbi, S. R., and J. Roman 2006 The history of whales read from DNA. Pages: 102-115. Whales, whaling, and ocean ecosystems

210
Pauly, D., and others 1995 Anecdotes and the shifting baseline syndrome of fisheries. Trends in Ecology and Evolution 10(10):430.
Pääbo, S. 1985 Molecular cloning of ancient Egyptian mummy DNA.
Pääbo, S., H. N. Poinar, D. Serre, V. Jaenicke-Despres, J. Hebler, N. Rohland, M. Kuch, J. Krause, L. Vigilant, and M. Hofreiter 2004 Genetic analyses from ancient DNA. Annual Review of Genetics 38:645-679.
Perrin, W. F., B. G. Würsig, and J. G. M. Thewissen 2002 Encyclopedia of marine mammals. Academic Press, San Diego.
Perry, A., C. S. Baker, and L. M. Herman 1990 Population characteristics of individually identified humpback whales in the central and eastern North Pacific: a summary and critique. Rep.Int.Whal.Comm.(Special Issue 12) :307-317.
Piana, E. L. 2002 Cetacean and Human Beings at the uttermost Part of America: A Lasting Relationship in Tierra Del Fuego. In Exploitation and Cultural Importance of Sea Mammals 9th ICAZ Conference Durham, edited by G. G. Monks, pp. 121-137. Oxbow Books, Oxford.
Pilot, M., M.E. Dahlheim, and A.R. Hoelzel 2010 Social cohesion among kin, gene flow without dispersal and the evolution of population genetic structure in the killer whale (Orcinus orca). Journal of Evolutionary Biology 23(1):20-31.
Pomilla, C., and H. C. Rosenbaum 2005 Against the current: an inter-oceanic whale migration event. Biology Letters 1(4):476-479.
Posada, D. 2008 jModelTest: phylogenetic model averaging. Molecular biology and evolution 25(7):1253-1256.
Posada, D. 2009 Selection of models of DNA evolution with jModelTest. Methods in molecular biology (Clifton, N.J.) 537:93-112.
Prebble, M., and J. M. Wilmshurst 2009 Detecting the initial impact of humans and introduced species on island environments in Remote Oceania using palaeoecology. Biological Invasions 11(7):1529-1556.
Rambaut, A., and A. Drummond 2005 Tracer: a program for analysing results from Bayesian MCMC programs such as BEAST & MrBayes. Website http://evolve.zoo.ox.ac.uk/software.html

211
Ramp, C., M. Berube, P. J. Palsboll, W. Hagen, and R. Sears 2010 Sex-specific survival in the humpback whale Megaptera novaeangliae in the Gulf of St. Lawrence, Canada. Marine Ecology-Progress Series 400:267-276.
Ramp, C., W. Hagen, P. J. Palsboll, M. Berube, and R. Sears 2010 Age-related multi-year associations in female humpback whales (Megaptera novaeangliae). Behavioral Ecology and Sociobiology 64(10):1563-1576.
Rasmussen, K., D. M. Palacios, J. Calambokidis, M. T. Saborio, L. Dalla Rosa, E. R. Secchi, G. H. Steiger, Judith M. Allen, and G. S. Stone 2007 Southern Hemisphere humpback whales wintering off Central America: insights from water temperature into the longest mammalian migration. Biology letters 3(3):302-305.
Rastogi, T., M. W. Brown, B. A. McLeod, T. R. Frasier, R. Grenier, S. L. Cumbaa, J. Nadarajah, and B. N. White 2004 Genetic analysis of 16th-century whale bones prompts a revision of the impact of Basque whaling on right and bowhead whales in the western North Atlantic. Canadian Journal of Zoology-Revue Canadienne De Zoologie 82(10):1647-1654.
Raymond, H. 2007 The Ecologically Noble Savage Debate. Annual Review of Anthropology 36(1):177-190.
Reeves, R. R., and R. D. Kenney 2003 Baleen Whales: Right Whales and Allies. In Wild mammals of North America : biology, management, and conservation, edited by G. A. Feldhamer, B. C. Thompson and J. A. Chapman, pp. 425-463. Johns Hopkins University Press, Baltimore.
Reeves, R. R., and T. D. Smith 2007 A taxonomy of world whaling operations and eras. In Whales, Whaling and Ocean Ecosystems, edited by J. A. Estes, pp. 89-101. University of California Press, Berkeley.
Reeves, R. R. 2002 The origins and character of 'aboriginal subsistence' whaling: a global review. Mammal Review 32(2):71-106.
Reeves, R. R., T. D. Smith, E. A. Josephson, Phillip J. Clapham, and G. Woolmer 2004 Historical observations of humpback and blue whales in the North Atlantic Ocean: Clues to migratory routes and possibly additional feeding grounds. Marine Mammal Science 20(4):774-786.
Reitz, E.J., and E. S. Wing 1999 Zooarchaeology. Cambridge University Press, Cambridge England ; New York.
Reusch, T. B. H., A. Ehlers, A. Hämmerli, and B. Worm 2005 Ecosystem recovery after climatic extremes enhanced by genotypic diversity. Proceedings of the National Academy of Sciences of the United States of America 102(8):2826.

212
Rice, D.W. 1978 The humpback whale in the North Pacific: distribution, exploitation, and numbers. Report on a workshop on problems related to humpback whales. 29-44
Rick, T. C., and J. M. Erlandson 2009 Coastal Exploitation. Science 325:952-953.
Riddle, B. R., M. N. Dawson, E. A. Hadly, D. J. Hafner, M. J. Hickerson, S. J. Mantooth, and A. D. Yoder 2008 The role of molecular genetics in sculpting the future of integrative biogeography. Progress in Physical Geography 32(2):173.
Rollo, F., L. Ermini, S. Luciani, I. Marota, C. Olivieri, and D. Luiselli 2006 Fine characterization of the Iceman's mtDNA haplogroup. American Journal of Physical Anthropology 130(4):557-564.
Roman, J., and S. R. Palumbi 2003 Whales before whaling in the North Atlantic. Science 301(5632):508-510.
Ronaghi, M. 2001 Pyrosequencing sheds light on DNA sequencing. Genome research 11(1):3-11.
Salemi, M., A.-M. Vandamme, and P. Lemey 2009 The phylogenetic handbook :a practical approach to phylogenetic analysis and hypothesis testing. 2nd ed. Cambridge University Press, Cambridge, UK; New York.
Sapir, E. 1915 The Social Organization of the West Coast Tribes...
Sapir, E. 1919 A Flood Legend of the Nootka Indians of Vancouver Island. The Journal of American Folklore 32(124):351-355.
Sasaki, T., M. Nikaido, H. Hamilton, M. Goto, H. Kato, N. Kanda, L. A. Pastene, Y. Cao, R. E. Fordyce, M. Hasegawa, and N. Okada 2005 Mitochondrial phylogenetics and evolution of mysticete whales. Systematic Biology 54(1):77-90.
Savelle, J.M., and A.P. McCartney 1999 Thule Eskimo Bowhead Whale Interception Strategies. World Archaeology 30(3, Arctic Archaeology):437-451.
Schmidt, D., S. Hummel, and B. Herrmann 2003 Brief communication: Multiplex X/Y-PCR improves sex identification in aDNA analysis. American Journal of Physical Anthropology 121(4):337-341.
Shapiro, B., A. J. Drummond, A. Rambaut, M. C. Wilson, P. E. Matheus, A. V. Sher, O. G. Pybus, M. T. P. Gilbert, Ian Barnet, Jonas Binladen, E. Willerslev, A. J. Hansen, G. F. Baryshnikov, J. A. Burns, S. Davydov, J. C. Driver, D. Froese, C. R. Harington, G. Keddie, P. Kosintsev, M. L. Kunz, L. D. Martin, R. O. Stephenson, J. Storer, R. Tedford,

213
S. Zimov, and Alan Cooper 2004 Rise and fall of the Beringian steppe bison. Science 306(5701):1561-1565.
Slijper, E. J. 1979 Whales E. J. Slijper ; translated by A. J. Pomerans ; with a new foreword, concluding chapter and bibliography by Richard J. Harrison. --. 2d -- ed. Cornell University Press, Ithaca, N. Y.
Smith, C. I., A. T. Chamberlain, M. S. Riley, C. Stringer, and M.J. Collins 2003 The thermal history of human fossils and the likelihood of successful DNA amplification. Journal of human evolution 45(3):203-217.
Soule, M. E. 1985 What is Conservation Biology. Bioscience 35(11):727-734.
Speller, C. F., D. Y. Yang, and B. Hayden 2005 Ancient DNA investigation of prehistoric salmon resource utilization at Keatley creek, British Columbia, Canada. Journal of Archaeological Science 32(9):1378-1389.
Springer, A. M., J. A. Estes, G. B. van Vliet, T. M. Williams, D. F. Doak, E. M. Danner, and B. Pfister 2008 Mammal-eating killer whales, industrial whaling, and the sequential megafaunal collapse in the North Pacific Ocean: A reply to critics of Springer et al. 2003. Marine Mammal Science 24(2):414-442.
Sproat, G.M. 1966 Boatmanship in: McFeat (editor) 1966 Indians of the North Pacific Coast;studies in selected topics. Vol. 25, McClelland and Stewart, Toronto.
Sproat, G. M. 1987 The Nootka. Sono NIS Press, Victoria, BC.
Starbuck, A. 1878 History of the American whale fishery from its earliest inception to the year l876. The author
St.Claire, D. E. 1991 Barkley Sound Tribal Territories. In Between Ports Alberni and Renfrew: Notes on Westcoast Peoples, Vol. Mercury Series, Canadian Ethnology Service Paper 121, edited by E.Y.Arima et al., pp. 13-202. Canadian Museum of Civilization, Ottawa.
Stevick, P. T., J. Allen, Martine Berube, Phillip J. Clapham, S. K. Katona, F. Larsen, J. Lien, D. K. Mattila, Per J. Palsboll, J. Robbins, J. Sigurjonsson, T. D. Smith, N. Oien, and P. S. Hammond 2003 Segregation of migration by feeding ground origin in North Atlantic humpback whales (Megaptera novaeangliae). Journal of Zoology 259:231-237.
Stevick, P. T., A. Aguayo, J. Allen, I. C. Avila, J. Capella, C. Castro, K. Chater, L. Dalla Rosa, M. H. Engel, F. Félix, and others 2004 Migrations of individually identified humpback whales between the Antarctic

214
Peninsula and South America. Journal of Cetacean Research and Management 6(2):109-113.
Straley, J.M.,I.I. Quinn, J. Terrance, and C.M. Gabriele 2009 Assessment of mark-recapture models to estimate the abundance of a humpback whale feeding aggregation in Southeast Alaska. Journal of Biogeography 36(3):427-438.
Sullivan, R. 2000 A whale hunt. Scribner, New York.
Sumpter, I., D. E. St.Claire, and S. Peters 2002 Mid-Holocene Cultural Occupation Of Barkley Sound, West Vancouver Island. The Midden 34(4):10-11.
Sumpter, I. 2005 Appendix C: An Analysis of Three Shellfish Assemblages from Ts'ishaa, Site DfSi-16(204T), benson Island, Pacific RIm national Par Reserve of Canada. In Ts'ishaa: Archaeology and ethnography of a Nuu-chah-nulth Origin Site in Barkley Sound, edited by A. D. McMillan and D. E. St.Claire, pp. 136-173. Archaeology Press, Burnaby, B.C.
Sutlovic, D., M. D. Gojanovic, S. Andelinovic, D. Gugic, and D. Primorac 2005 Taq polymerase reverses inhibition of quantitative real time polymerase chain reaction by humic acid. Croatian medical journal 46(4):556-562.
Suttles, W., and A. Jonaitis 1990 History of Research in Ethnology. In Handbook of North American Indians, Vol. 7: Northwest Coast, edited by Wayne Suttles, pp. 73-87. Smithsonian Institution, Washington.
Tamura, K., and M. Nei 1993 Estimation of the number of nucleotide substitutions in the control region of mitochondrial DNA in humans and chimpanzees. Molecular biology and evolution 10(3):512.
Tajima, F. 1989 Statistical Method for Testing the Neutral Mutation Hypothesis by DNA Polymorphism. Genetics} 123(3):585-595.
Tønnessen, J. N., and A. O. Johnsen 1982 The history of modern whaling. C. Hurst, London.
Valsecchi, E., P. J. Corkeron, P. Galli, W. Sherwin, and G. Bertorelle 2010 Genetic evidence for sex-specific migratory behaviour in western South Pacific humpback whales. Marine Ecology-Progress Series 398:275-286.
Valsecchi, E., P.J. Palsboll, P. Hale, D. Glockner Ferrari, M. Ferrari, P.J. Clapham, F. Larsen, D. Mattila, R. Sears, J. Sigurjonsson, M. Brown, P. Corkeron, and B. Amos
1997 Microsatellite genetic distances between oceanic populations of the humpback whale (Megaptera novaeangliae). Molecular biology and evolution 14(4):355-362.

215
Verginelli, F., C. Capelli, V. Coia, M. Musiani, M. Falchetti, L. Ottini, R. Palmirotta, A. Tagliacozzo, M. I. de Grossi, and R. Mariani-Costantini 2005 Mitochondrial DNA from Prehistoric Canids Highlights Relationships between Dogs and South-East European Wolves. Molecular biology and evolution
Vié, J.C., C. Hilton-Taylor, and S.N. Stuart 2008 The 2008 review of the IUCN Red List of threatened species. IUCN, Gland, Switzerland
Vila, C., J. A. Leonard, A. Gotherstrom, S. Marklund, K. Sandberg, K. Liden, R. K. Wayne, and H. Ellegren 2001 Widespread origins of domestic horse lineages. Science 291(5503):474-477.
Vila, C., J. E. Maldonado, and R. K. Wayne 1999 Phylogenetic relationships, evolution, and genetic diversity of the domestic dog. Journal of Heredity 90(1):71-77.
Wall, J. D., and S. K. Kim 2007 Inconsistencies in Neanderthal genomic DNA sequences. PLoS genetics 3(10):1862-1866.
Watt, K. 2003 Species Identification of Whale Bones from Barkley Sound, Vancouver Island, British Columbia. Honors ed. Simon Fraser University,
Whitehead, H. 1998 Cultural selection and genetic diversity in matrilineal whales. Science 282(5394):1708-1711.
Whitehead, H., and M. Planck 2002 Estimates of the current global population size and historical trajectory for sperm whales. Marine Ecology Progress Series 242:295-304.
Whitehead, H., and R. Reeves 2005 Killer whales and whaling: the scavenging hypothesis. Biology Letters 1(4):415-418.
Whitehead, H., J. Christal, and S.Dufault 1997 Past and Distant Whaling and the Rapid Decline of Sperm Whales off the Galapagos Islands.Conservation Biology 11(6):1387-1396.
Wiens, J. J., and C. H. Graham 2005 Niche conservatism: Integrating evolution, ecology, and conservation biology. Annual Review of Ecology Evolution and Systematics 36:519-539.
Wiley, D., R. Asmutis, T. Pitchford, and D. Gannon 1995 Stranding and Mortality of Humpback Whales, Megaptera-Novaeangliae, In The Mid-Atlandic and Southeast United-States, 1985-1992. Fishery Bulletin 93(1):196-205.
Willerslev, E., and A. Cooper 2005 Ancient DNA. Proceedings of the Royal Society B 272(1558):3-16.

216
Willerslev, E., A. J. Hansen, and H. N. Poinar 2004 Isolation of nucleic acids and cultures from fossil ice and permafrost. Trends in ecology & evolution; Trends in ecology & evolution 19(3):141-147.
Winn, H. E., and N. E. Reichley 1985 Humpback Whale. Megaptera novaeangliae (Borowski, 1781). In Handbook of marine mammals, Vol. 3, edited by S. H. Ridgeway and R. J. Harrison, pp. 241-273. Academic Press Inc., London, Orlando.
Witteveen, B., G. Worthy, K. Wynne, and J. Roth 2009 Population structure of North Pacific humpback whales on their feeding grounds revealed by stable carbon and nitrogen isotope ratios. Marine Ecology Progress Series 379:299-310.
Witteveen, B. H., J. M. Straley, O. von Ziegesar, D. Steel, and C. S. Baker 2004 Abundance and mtDNA differentiation of humpback whales (Megaptera novaeangliae) in the Shumagin Islands, Alaska. Canadian Journal of Zoology-Revue Canadienne De Zoologie 82(8):1352-1359.
von Wurmb-Schwark, N., A. Preusse-Prange, A. Heinrich, E. Simeoni, T. Bosch, and T. Schwark
2009 A new multiplex-PCR comprising autosomal and y-specific STRs and mitochondrial DNA to analyze highly degraded material. Forensic Science International-Genetics 3(2):96-103.
Yang, D. Y., B. Eng, J. S. Waye, J. C. Dudar, and S. R. Saunders 1998 Technical note: Improved DNA extraction from ancient bones using silica-based spin columns. American Journal of Physical Anthropology 105(4):539-543.
Yang, D. Y., J. R. Woiderski, and J. C. Driver 2005 DNA analysis of archaeological rabbit remains from the American Southwest. Journal of Archaeological Science 32(4):567-578.
Yang, D. Y., Li Liu, X. Chen, and C. F. Speller 2008 Wild or domesticated: DNA analysis of ancient water buffalo remains from north China. Journal of Archaeological Science 35(10):2778-2785.
Yang, Z. 1993 Maximum-likelihood estimation of phylogeny from DNA sequences when substitution rates differ over sites. Molecular biology and evolution 10(6):1396.
Yarborough, M. R., and L. F. Yarborough 1998 Prehistoric maritime adaptations of Prince William Sound and the Pacific coast of the Kenai Peninsula. Arctic Anthropology: 132-145.
Yesner, D. R. 1988 Effects of prehistoric human exploitation on Aleutian sea mammal populations. Arctic Anthropology :28-43.

217
Zeder, M. A. 2006 Central questions in the domestication of plants and animals. Evolutionary Anthropology 15(3):105-117.
Zerbini, A. N., P. J. Clapham, and P. R. Wade 2010 Assessing plausible rates of population growth in humpback whales from life-history data. Marine Biology 157(6):1225-1236.

218
Appendix A: Samples processed including provenience

219
Table 13: samples used including excavation information.
DNA lab Zooarchaeological and archaeological information provided DNA lab results
Sample ID ## SITE UNIT LEVEL LAYER Quad
Depth Below Datum ELEMENT PORTION age DNA species ID Haplotype
WH 180 1 Dfsh7 N18-20/E34-36 06 C S end 003.30-003.35 Unidentified (fragments) incomplete 450-650 humpback
WH 181 1 Dfsh7 N18-20/E34-36 07 C 003.35-003.40 Unidentified (fragments) incomplete 450-650 humpback
WH 182 1 Dfsh7 N18-20/E34-36 10 C SW 003.50-003.55 Unidentified (fragments) incomplete 450-650 xx
WH 183 1 Dfsh7 N18-20/E34-36 11 C NW 003.55-003.60 Rib shaft 450-650 humpback
WH 184 1 Dfsh7 N18-20/E34-36 12 C NW 003.60-003.65 Unidentified (fragments) incomplete 450-650 humpback
WH 185 1 Dfsh7 N18-20/E34-36 16 D NE 003.80-003.85 Vertebra (undet) incomplete 650-850 humpback E4
WH 186 1 Dfsh7 N18-20/E34-36 18 D NE 003.90-003.95 Unidentified (fragments) incomplete 650-850 humpback E4
WH 187 1 Dfsh7 N18-20/E34-36 18 D NW 003.90-003.95 Rib incomplete 650-850 xx
WH 188 1 Dfsh7 N18-20/E34-36 26 E SE 004.30-004.35 Vertebrae, undisting. incomplete 1100 humpback
WH 189 1 Dfsh7 N18-20/E34-36 28 F NE 004.40-004.45 Unidentified (fragments) incomplete 1100 humpback
WH 190 1 Dfsh7 N18-20/E34-36 28 F NE 004.40-004.45 Vertebrae, undisting. 1100 humpback
WH 191 1 Dfsh7 N18-20/E34-36 30 F NE 004.50-004.55 Unidentified (fragments) incomplete 1100 grey
WH 192 1 Dfsh7 N18-20/E34-36 30 F NE 004.50-004.55 incomplete 1100 grey
WH 193 1 Dfsh7 N18-20/E34-36 32 F NE 004.60-004.65 Unidentified (fragments) incomplete 1200 humpback CD
WH 194 1 Dfsh7 N18-20/E34-36 36 F NW 004.80-004.85 Vertebra (undet) incomplete 1200 RIGHT
WH 195 1 Dfsh7 N18-20/E34-36 38 F SE 004.90-004.95 Unidentified (fragments) incomplete 1300 xx
WH 196 1 Dfsh7 N18-20/E2-4 F 5.2 Vertebrae (complete) 1350 humpback E5
WH 197 1 Dfsh7 N18-20/E2-4 40 F NW 5.50-5.55 metacarpal 1300 humpback
WH 198 1 Dfsh7 N10-12/E2-4 14 D SW(NW?) 3.48-3.53 Vertebra (undet) 450-650 humpback A1
WH 199 1 Dfsh7 N18-20/E2-4 12 C NW 4.05 Rib 650-850 humpback E6
WH 200 1 Dfsh7 N18-20/E6-8 31 E SE 5.05-5.10 Phalanx (undet) 1300 humpback
WH 201 1 Dfsh7 N12-14/E6-8 20 D NW/SW 4.32-4.44 long bone highly weathered 1350 CAL BP? 1350 xx
WH 202 1 Dfsh7 N10-12/E2-4 21 G SW 3.83-3.88 Vertebra (undet) 650-850 xx
WH 203 1 Dfsh7 N14-16/E16-18 10 B1 SE 003.90-003.95 whale rib 650-850 humpback E8
WH 204 1 Dfsh7 N14-16/E16-18 07 B1 NW 003.70-003.75 Vertebra (undet) incomplete 650-850 xx
WH 205 1 Dfsh7 N16-18/E26-28 19 C SW 004.20-004.25 Unidentified (fragments) incomplete 900 grey
WH 206 1 Dfsh7 N16-18/E26-28 11 B1 SW 003.85-003.90 Vertebra (undet) incomplete 650-850 xx
WH 207 1 Dfsh7 N10-12/E2-4 31-33 H NW 4.33-4.48 vertebrae 1100 xx
WH 208 1 Dfsh7 N16-18/E26-28 19 C SW 004.20-004.25 Caudal vertebra (undet) effectively complete 900 humpback E5
WH 209 1 Dfsh7 N16-18/E26-28 17 C SE 004.10-004.15 Phalanx (undet) effectively complete 900 humpback CD
WH 210 1 Dfsh7 N18-20/E2-4 21 D SW 4.55-4.60 Unidentified (fragments) 1100 humpback A1
WH 211 1 Dfsh7 N18-20/E2-4 14 C NW 4.20-4.25 Vertebra (undet) 650-850 humpback
WH 212 1 Dfsh7 N18-20/E2-4 14 C SW 4.20-4.25 Vertebra (undet) 650-850 humpback E8
WH 213 1 Dfsh7 N18-20/E6-8 28 E SW 4.90-4.95 Unidentified (fragments) 1300 humpback CD
WH 214 1 Dfsh7 N18-20/E6-8 31 E NE 5.05-5.10 Vertebra (undet) 1300 humpback E8
WH 215 1 Dfsh7 N18-20/E6-8 27 E SE 4.85-4.90 Unidentified (fragments) 1300 grey
WH 216 1 Dfsh7 N18-20/E6-8 13 C SE 4.15-4.20 Rib 650-850 humpback
WH 217 1 Dfsh7 N18-20/E6-8 13 C SE 4.15-4.20 Unidentified (fragments) 650-850 humpback A1
WH 218 1 Dfsh7 N18-20/E6-8 13 C SE 4.15-4.20 Vertebra (undet) 650-850 humpback

220
Table 13: samples used including excavation information.
DNA lab Zooarchaeological and archaeological information provided DNA lab results
Sample ID ## SITE UNIT LEVEL LAYER Quad
Depth Below Datum ELEMENT PORTION age DNA species ID Haplotype
WH 219 1 Dfsh7 N18-20/E6-8 31 E NW 5.05-5.10 Unidentified (fragments) 1300 humpback CD
WH 220 1 Dfsh7 N18-20/E6-8 18 E SE 4.40-4.45 Vertebra (undet) 1100 humpback E4
WH 221 1 Dfsh7 N18-20/E6-8 18 E NE 4.40-4.45 Vertebra (undet) 1100 humpback A1
WH 222 1 Dfsh7 N18-20/E6-8 18 E SW 4.40-4.45 Vertebra (undet) 1100 humpback A1
WH 223 1 Dfsh7 N18-20/E6-8 28 E SE 4.90-4.95 Unidentified (fragments) 1300 humpback E8
WH 224 1 Dfsh7 N18-20/E6-8 29 E NE 4.95-5.00 Vertebra (undet) 1300 grey
WH 225 1 Dfsh7 N18-20/E6-8 29 E NE 4.95-5.00 Unidentified (fragments) 1300 humpback E5
WH 226 1 Dfsh7 N18-20/E6-8 15 C NE 4.25-4.30 Vertebra (undet) 900 xx
WH 227 1 Dfsh7 N18-20/E2-4 18 C NW 4.40-4.45 Unidentified (fragments) 650-850 humpback CD
WH 228 1 Dfsh7 N18-20/E2-4 18 C SW 4.40-4.45 Vertebra (undet) 1300 grey
WH 229 1 Dfsh7 N18-20/E2-4 21 D NW 4.55-4.60 Unidentified (unknown element) 1100 humpback CD
WH 230 1 Dfsh7 N18-20/E2-4 32 F NW 5.10-5.15 Unidentified (fragments) 1300 humpback E8
WH 231 1 Dfsh7 N18-20/E2-4 38 F NW 5.40-5.45 Skull (fragment) 1300 humpback
WH 232 1 Dfsh7 N18-20/E2-4 28 D SW 4.90-4.95 Rib 1300 grey
WH 233 1 Dfsh7 N18-20/E6-8 35 G SW 5.25-5.30 Vertebra (undet) 1350 humpback CD
WH 234 1 Dfsh7 N18-20/E6-8 17 E SE 4.35-4.40 Unidentified (fragments) 900 humpback
WH 235 1 Dfsh7 N18-20/E6-8 36 G NE 5.25-5.30 Unidentified (fragments) 1300 grey
WH 236 1 Dfsh7 N18-20/E6-8 35 G NW 5.25-5.30 Unidentified (fragments) 1300 xx
WH 237 1 Dfsh7 N18-20/E2-4 16 C SW 4.30-4.35 Skull 650-850 humpback
WH 238 1 Dfsh7 N18-20/E2-4 24 D SW 4.70-4.75 Unidentified (fragments) 1200 humpback
WH 239 1 Dfsh7 N18-20/E2-4 24 D NE 4.70-4.75 Phalanx, prox/medial 1200 xx
WH 240 1 Dfsh7 N18-20/E2-4 18 C1 NE 4.40-4.45 Vertebrae, undisting. 1300 humpback
WH 241 1 Dfsh7 N18-20/E6-8 20 E SW 4.50-4.55 Vertebra (undet) 1100 humpback E6
WH 242 1 Dfsh7 N18-20/E2-4 21 C SE 4.55-4.60 Skull 1100 xx
WH 243 1 Dfsh7 N18-20/E2-4 21 D NE 4.55-4.60 Unidentified (fragments) 1100 xx
WH 244 1 Dfsh7 N18-20/E2-4 14 C NE 4.24-4.30 Rib 650-850 xx
WH 245 1 Dfsh7 N18-20/E2-4 40 F NW 5.50-5.55 ?longer bone?? 1300 finback
WH 246 1 Dfsh7 N10-12/E2-4 16 E SW 3.58-3.63 Unidentified (fragments) 450-650 humpback CD
WH 247 1 Dfsh7 N10-12/E2-4 20 G NW 3.78-3.83 Vertebra (undet) 650-850 humpback CD
WH 248 1 Dfsh7 N18-20/E2-4 14 C NE 4.24-4.30 Rib 650-850 xx
WH 249 1 Dfsh7 N10-12/E2-4 20 F NE 3.78-3.83 Vertebra (undet) 650-850 humpback A2
WH 250 1 Dfsh7 N10-12/E2-4 21 G NW 3.83-3.88 Unidentified (fragments) 650-850 humpback E8
WH 251 1 Dfsh7 N10-12/E2-4 21 G SE 3.83-3.88 Unidentified (fragments) 650-850 humpback CD
WH 252 1 Dfsh7 N10-12/E2-4 20 F NW 3.78-3.83 Vertebra (undet) 650-850 humpback CD
WH 253 1 Dfsh7 N10-12/E2-4 20 G SW 3.78-3.83 Rib 650-850 humpback A1
WH 254 1 Dfsh7 N10-12/E2-4 16 E NW 3.58-3.63 Unidentified (fragments) 450-650 humpback CD
WH 255 1 Dfsh7 N10-12/E2-4 33 G/H NW 4.43-4.48 1100 grey
WH 256 1 Dfsh7 N10-12/E2-4 10 C SE 3.28-3.33 Vertebra (undet) 450-650 humpback E8
WH 257 1 Dfsh7 N10-12/E2-4 14 E SW 3.48-3.59 450-650 humpback E8
WH 258 1 Dfsh7 N10-12/E2-4 21 G SW 3.83-3.88 Unidentified (fragments) 650-850 humpback

221
Table 13: samples used including excavation information.
DNA lab Zooarchaeological and archaeological information provided DNA lab results
Sample ID ## SITE UNIT LEVEL LAYER Quad
Depth Below Datum ELEMENT PORTION age DNA species ID Haplotype
WH 259 1 Dfsh7 N10-12/E2-4 12 D NE 3.38-3.43 Unidentified (fragments) 450-650 xx
WH 260 1 Dfsh7 N10-12/E2-4 14 C NE 3.48-3.53 Rib 450-650 xx
WH 261 1 Dfsh7 N10-12/E2-4 12 C SW 3.38-3.43 Unidentified (fragments) 450-650 humpback CD
WH 262 1 Dfsh7 N10-12/E2-4 27 G NE 4.13-4.18 Rib 900 humpback
WH 263 1 Dfsh7 N18-20/E16-18 15 B1 SW 4.1-4.15 long bone epiphysis complete 650-850 humpback
WH 264 1 Dfsh7 N18-20/E16-18 13 B SW 4.0-4.2 650-850 humpback
WH 265 1 Dfsh7 N18-20/E16-18 13-16 B SW 4.0-4.20 whale bone near feat.42 650-850 humpback CD
WH 266 1 Dfsh7 N16-18/E26-28 15 B1 SE 4.1-4.15 900 humpback
WH 267 1 Dfsh7 N18-20/E16-18 13 B SW 4.05 650-850 humpback
WH 268 1 Dfsh7 N18-20/E16-18 13 B SW 4.0-4.1 650-850 humpback E8
WH 269 1 Dfsh7 N18-20/E16-18 13 B SW 4.0-4.1 650-850 humpback
WH 270 1 Dfsh7 N18-20/E16-18 13 B1 SE 4.0-4.05 650-850 humpback
WH 271 1 Dfsh7 N18-20/E30-32 16-19 D/E/F NE/NW 4.05-4.35 whale rib, three pieces almost complete 650-850 humpback E4
WH 272 1 Dfsh7 N18-20/E30-32 19 D/E NE 4.2-4,25 skull 1300 Finback
WH 273 1 Dfsh7 N18-20/E30-32 16-19 D/E NW/NE 4.05-4.25 1300 grey
WH 274 1 Dfsh7 N18-20/E30-32 16-19 D/E NW/NE 4.05-4.25 skull fragment? 650-850 grey
WH 275 1 Dfsh7 N18-20/E30-32 15-19 D/E NW 4.2-4.25 epiphysis 650-850 humpback CD
WH 276 1 Dfsh7 N18-20/E30-32 16-19 D/E NW/NE 4.05-4.2 vertebrae complete 650-850 humpback A1
WH 277 1 Dfsh7 N18-20/E30-32 19 E NW 4.2-4.25 650-850 humpback A1
WH 278 1 Dfsh7 N12-14/E18-20 11-13 C SE 3.85-3.95 650-850 humpback CD
WH 279 1 Dfsh7 N18-20/E30-32 16-17 D/E SW 4.05-4.25 650-850 humpback E8
WH 280 1 Dfsh7 N18-20/E30-32 16-19 D/E NW/NE 4.05-4.25 cut marks on bone 650-850 humpback
WH 26 1 DfSi 16 S58-60/W64-66 8 E 0.40-0.50 1 fragment id’d level 3600 humpback CD
WH 28 1 DfSi 16 S62-64/W62-64 2 A 0.60-0.50 above rib frag killer whale? 3000-3500 humpback
WH 29 1 DfSi 16 S56-58/W66-68 2 A 0.10-0.20 very dense probably cranial (ear?) 3500-4500 xx
WH 30 1 DfSi 16 S56-58/W64-66 7 C 0.60-0.70 more chunks from feature# 24 3500-4500 grey whale
WH 31 1 DfSi 16 N10-12/W102-104 feature 57 C Jul-84
“flat peice of crania- may be part of WB # 00-14 but does not seem to fit in” G. Frederick glued fragment 250-1000 humpback E8
WH 32 1 DfSi 16 S56-58/W64-66 7 A 0.60-.70 large frag from feature 24 3500-4500 humpback
WH 33 1 DfSi 16 S56-58/W64-66 7 C 0.60-0.70 cranial fragment from feature #24 heavy chunk 3500-4500 grey whale
WH 34 1 DfSi 16 S14-16/W25-27 37 G 4.70-4.80 small cancellous frag from deep in the id’d unit from id’d level! 1500-2000 right whale
WH 35 1 DfSi 16 S12-14/W25-27 27 C 4.00-4.10 large cancellous frag with charcoal
candiate for direct dating? 1000-1500 humpback
WH 36 1 DfSi 16 S16-18/W25-27 25 C 3.48-3.58 1 fragment 1000-1500 finback
WH 38 1 DfSi 16 S10-12/W25-27 7 2.10-2.20 unfused phalange 500-1000 grey whale
WH 39 1 DfSi 16 S56-58/W66-68 5 E 0.40-0.50 fragment of “whale bone # 5” this is fragment 2 of 2 3500-4500 humpback E9

222
Table 13: samples used including excavation information.
DNA lab Zooarchaeological and archaeological information provided DNA lab results
Sample ID ## SITE UNIT LEVEL LAYER Quad
Depth Below Datum ELEMENT PORTION age DNA species ID Haplotype
WH 40 1 DfSi 16 S56-58/W64-66 7 A 0.60-0.70 large fragment of vertebral disc associated with feature #24 3500-4500 xx
WH 41 1 DfSi 16 S14-16/W25-27 26 D small frag from unid level 1000-1500 xx
WH 42 1 DfSi 16 S4-6/W98-100 2 A 3.00-3.10 thin slice of a scpula? associated with “fauna feature” from this level
68cm below surface in same level as lots of bluefin tuna 250-500 humpback CD
WH 43 1 DfSi 16 S56-58/W66-68 4 E 0.30-0.40 delicate vertebra fragment 3500-4500 humpback
WH 44 1 DfSi 16 S10-12/W25-27 4 A 1.80-1.90 small cancellous fragment 250-500 humpback A1
WH 45 1 DfSi 16 S12-14/W25-27 22 B 3.50-3.60 1 fragment 1000-1500 grey whale
WH 46 1 DfSi 16 S14-16/W25-27 37 G 4.70-4.80 solid rib fragment 1500-2000 humpback CD
WH 47 1 DfSi 16 S56-58/W64-66 7 A 0.60-0.70 large chunk from associated with feature #24 3500-4500 grey whale
WH 48 1 DfSi 16 N10-12/W102-104?
see feature record
see feature record see feature record WB -00-19
see feature record (56 or 57) around 500 Cal BP 500 humpback
WH 49 1 DfSi 16 S56-57/W50-52 6 B 0.40-0.50 1 fragment 3000-3500 grey whale
WH 50 1 DfSi 16 S16-18/W25-27 14 B 2.28-2.38 1 fragment has charcoal on it… 1000-1500 humpback A1
WH 51 1 DfSi 16 S10-12/W98-100 4 A 2.00-2.10 fragment with charcoal attached...
(could be a candiadate for dating?) 250-500 humpback
WH 52 1 DfSi 16 S56-58/W66-68 6 E 0.60-0.70 extensive cancellous frag from level bag
probably associated with feature #24 3500-4500 xx
WH 53 1 DfSi 16 S8-10/W98-100 12 A 3.10-3.20 whale frag 250-500 humpback
WH 54 1 DfSi 16 S56-58/W64-66 7 B 0.60-0.70 “cranial frag” from feature #24 3500-4500 grey whale
WH 55 1 DfSi 16 S60-62/W63-64 6 C 0.05 above-0.05 below 1 fragment 3500-4500 humpback CD
WH 56 1 DfSi 16 S16-18/W25-27 25 C 3.48-3.58 1 dense rib frag 1000-1500 finback
WH 57 1 DfSi 16 S8-10/W98-100 7 A 2.60-2.70 cancellous fragment 250-500 humpback A1
WH 58 1 DfSi 16 S12-14/W25-27 28 4.10-4.20 small rib fragment 1000-1500 humpback E6
WH 59 1 DfSi 16 S14-16/W25-27 20 C 3.00-3.10 rib frag 500-1000 humpback E8
WH 60 1 DfSi 16 S10-12/W25-27 12 2.60-2.70 small rib frag 250-1000? humpback A1
WH 61 1 DfSi 16 S14-16/W25-27 20 C 3.00-3.10 unid frag from unid level 500-1000 humpback
WH 62 1 DfSi 16 N4-6/W102-104 7 C 6.25-6.35 2 frags of lage element 250-500 grey whale
WH 63 1 DfSi 16 S14-16/W25-27 25 C 3.50-3.60 three fragments from id’d level unsure whether these are the same element 1000-1500 humpback
WH 64 1 DfSi 16 S58-60/W64-66 10 E 0.40-0.50 1 fragment from NW corner of unit 4500-5000 humpback CD
WH 65 1 DfSi 16 S14-16/W25-27 36 G 4.60-4.70 large whale? element? 1500-2000 humpback CD
WH 67 1 DfSi 16 S56-58/W66-68 5 E 0.40-0.50 1 fragment same text on bag as 171 3500-4500 xx
WH 68 1 DfSi 16 N10-12/W102-104? ? ? ?
WB 00-4 from feature 56 or 57? piece #2
see feature record, Frederick 2000 500 humpback E8
WH 69 1 DfSi 16 S56-57/W50-52 17+ shovel test dense oldest sample 4500-5000 humpback E8
WH 70 1 DfSi 16 S14-16/W25-27 21 C 3.00-3.10 2 mandible frag 1000-1500 humpback CD

223
Table 13: samples used including excavation information.
DNA lab Zooarchaeological and archaeological information provided DNA lab results
Sample ID ## SITE UNIT LEVEL LAYER Quad
Depth Below Datum ELEMENT PORTION age DNA species ID Haplotype
WH 71 1 DfSi 16 S8-10/W98-100 10 A 2.90-3.00 unfused phalange 4000-5000 humpback E5
WH 72 1 DfSi 16 S12-14/W25-27 19 Mar.18 ribfrag from precise depth distal fragment 500-1000 humpback A3
WH 73 1 DfSi 16 N0-2/W98-100 7 A 5.70-5.80 cancellous frag 2 fragments (1of2) 250-500 humpback E8
WH 74 1 DfSi 16 S56-58/W66-68 5 E 0.40-0.50 “whale bone # 5” fragment 1 of 2 3500-4500 humpback E7
WH 75 1 DfSi 16 S56-58/W66-68 6 E 0.50-0.60 soild chunk 3500-4500 xx
WH 76 1 DfSi 16 S56-58/W66-68 3 B 0.20-0.30 uncertain element 3500-4500 humpback CD
WH 77 1 DfSi 16 N2-4/W102-104 5 C 6.00-6.10 2 fragments 250-500 humpback A1
WH 78 1 DfSi 16 N10-12/W102-104?
see feature record-2000 WB 00-3 from feature 56 or 57
see feature record-2000 500 humpback E8
WH 79 1 DfSi 16 S12-14/W25-27 13 A 2.60-2.70 rib fragment 500-1000 humpback E8
WH 80 1 DfSi 16 S56-58/W66-68 5 E 0.40-0.50 1 fragment 3500-4500 grey whale
WH 81 1 DfSi 16 N4-6/W102-104 8 C 6.35-6.45 1 fragment 500-1000 humpback E5
WH 82 1 DfSi 16 S54-56/W77-79 7 A 0.10-0.00 above ephyisis 3500-4500 humpback CD
WH 84 1 DfSi 16 S54-56/W64-66 5 A 0.70-0.80 2 fragments from level bag probably the same element 3500-4500 xx
WH 85 1 DfSi 16 N10-12/W102-104
see feature record
see feature record see feature record
WB 00-7 from a feature (either 56 or 57) 2 fragments 500 humpback CD
WH 86 1 DfSi 16 S12-14/W25-27 18 B 3.70-3.80 large rib frag 500-1500 humpback E8
WH 88 1 DfSi 16 N2-4/W102-104 23 D 7.80-7.90 I lage vert frag rt scapula? 500-1000 humpback CD
WH 89 2 DfSi 16 S14-16/W25-27 17 B 2 rib frags 1000-1500 humpback CD
WH 90 2 DfSi 16 S56-58/W68-70 7 A 0.60-0.70 2 vert frags (in separate bags) assoc with feature 26 4000-5000 xx/xx
WH 91 1 DfSi 16 N0-2/W98-100 1 A 5.00-5.20 1 fragment 250-500 xx
WH 92 1 DfSi 16 N2-4/W102-104 31 D 8.60-8.70 1 rib frag 1000-1500 humpback E8
WH 93 2 DfSi 16 S56-58/W64-66 7 A 0.60-0.70 2 fragments from level bag 4000-5000 xx/xx
WH 94 2 DfSi 16 S56-57/W50-52 13 D 1.10-1.20 2 frags from level bag likely the same element 4000-4500 humpback/xx
WH 95 1 DfSi 16 S10-12/W25-27 2 1.57-1.67 1 fragment 250-500 grey whale
WH 96 1 DfSi 16 S12-14/W25-27 33 F 4.60-4.70 2 fragments of ephiysis 1500-2000 humpback CD
WH 97 1 DfSi 16 S14-16/W25-27 5 A 1.50-1.60 vetebral epiphysis fragment 250-500 humpback A1
WH 98 1 DfSi 16 S54-56/W77-79 2 B 0.60-0.50 above datum 1 fragment 3000-3500 grey whale
WH 99 1 DfSi 16 S56-57/W50-52 15 D 1.30-1.40 vetebral epiphysis 4000-4500 grey whale
WH 100 2 DfSi 16 S56-58/W68-70 4 A 0.30-0.40 2 frags from level bag probably the same element 3500-4500 humpback/xx
WH 101 1 DfSi 16 S12-14/W25-27 14 2.70-2.80 500-1000 humpback CD
WH 102 1 DfSi 16 N10-12/W102-104 Jul-84 cranial frag from the large feature Aug-00 500-1000 humpback E8
WH 103 1 DfSi 16 N0-2/W98-100 7 A 5.70-5.80 cancellous frag 2 fragments (2of2) 250-500 xx
WH 105 1 DfSi 16 S58-60/W64-66 6 A 0.0-0.10 unid whale frags from id’d level 2001 4000-5000 humpback
WH 106 1 DfSi 16 S62-64/W62-64 3 B 0.50-0.40 vert disc from id’d level 3500-4500 humpback CD
WH 107 1 DfSi 16 N4-6/W102-104 16 D 7.15-7.25 unid level 500-1000 humpback CD
WH 108 1 DfSi 16 S2-4/W98-100 8 A 4.10-4.20 1 frag unid level 250-500 humpback

224
Table 13: samples used including excavation information.
DNA lab Zooarchaeological and archaeological information provided DNA lab results
Sample ID ## SITE UNIT LEVEL LAYER Quad
Depth Below Datum ELEMENT PORTION age DNA species ID Haplotype
WH 110 1 DfSi 16 N4-6/W102-104 7 C 6.25-6.35 cranial id’d level 250-1000 finback
WH 111 1 DfSi 16 N2-4/W102-104 5 A 6.0-6.10 large cranial id’d level 250-500 grey whale
WH 112 1 DfSi 16 N4-6/W102-104 13 C 6.85-6.95 rib ? id’d level 500-1000 humpback E8
WH 113 1 DfSi 16 N4-6/W102-104 3 A 5.85-5.95 small frag id’d level 250-250 humpback A1
WH 114 1 DfSi 16 N2-4/W102-104 7 C 6.10-6.20 large chunk id’d level 500-1000 BLUE
WH 116 2 DfSi 16 S58-60/W64-66 10 E 0.40-0.50 cranial frag from NW corner of unit id’d level 4000-5000 grey whale
WH 117 1 DfSi 16 S12-14/W25-27 14 2.70-2.80 extracted chunk from large cranial element
may be worth looking at susan’s 1999 report 500-1000 humpback
WH 118 1 DfSi 16 S5-7/W11-13 6 3.30-3.40 vert frag 250-500 humpback
WH 119 1 DfSi 16 N2-4/W102-104 9 C 6.45-6.55 fragile cancellous 500-1000 humpback
WH 120 1 DfSi 16 N2-4/W102-104 11 C 6.6-6.7 vertebral disc id’d level 500-1000 humpback
WH 121 1 DfSi 16 S6-8/W98-100 10 A 2.95-3.05 scapula frag 500-1000 humpback
WH 122 1 DfSi 16 N0-2/W98-100 8 A 5.8-5.9 large frag unid level 250-500 humpback
WH 123 1 DfSi 16 S12-14/W25-27 21 B 3.40-3.50 cranial 1000-1500 orca
WH 124 2 DfSi 16 S59/W65.5-66 3 A 0.20-0.10 above frags of the same vertebra id’d level 3500-4500 xx/humpback
WH 125 1 DfSi 16 N2-4/W102-104 20 D 7.50-7.60 unid level 500-1500 humpback CD
WH 126 1 DfSi 16 S6-8/W98-100 9 A 2.85-2.95 vert disc 250-1000 humpback CD
WH 127 1 DfSi 16 S10-12/W98-100 5 A 2.10-2.20 250-500 humpback A1
WH 128 1 DfSi 16 N4-6/W102-104 29 D 8.45-8.55 1 of 2 fragments 1000-1500 humpback
WH 129 1 DfSi 16 S10-12/W98-100 12 A 2.80-2.90 rib frag 250-1000 humpback CD
WH 130 1 DfSi 16 S62-64/W62-64 3 A 0.50-0.40 above rib frag id’d level 3000-4000 xx
WH 131 1 DfSi 16 S2-4/W98-100 2 A 3.5-3.6 small frag 250-500 humpback
WH 132 1 DfSi 16 S12-14/W25-27 14 2.7-2.8 500-1000 humpback CD
WH 133 1 DfSi 16 S12-14/W98-100 6 1.90-2.00 250-500? humpback A1
WH 134 1 DfSi 16 N2-4/W102-104 1 A 5.50-5.70 rib frag id’d level 250-500 humpback
WH 135 1 DfSi 16 N4-6/W102-104 29 D 8.45.8.55 frag 2 of 2 1000-1500 xx
WH 136 1 DfSi 16 S14-16/W25-27 3 A 1.25-1.35 large fragment 250-500 humpback E8
WH 137 1 DfSi 16 N4-6/W102-104 8 C 6.35-6.45 vert process unid level 500-1000 humpback
WH 138 1 DfSi 16 N0-2/W98-100 9 A 5.90-6.0 phalanx complete unid level 250-500 humpback A1
WH 139 1 DfSi 16 S10-12/W25-27 11 2.50-2.60 250-1000? humpback
WH 140 2 DfSi 16 N4-6/W102-104 28 D 8.35-8.45 2 frags 1000-1500 Finback
WH 141 1 DfSi 16 S10-12/W25-27 15 A 3.10-3.20 500-1000 humpback E8
WH 142 2 DfSi 16 S12-14/W98-100 3 1.60-1.70 2 frags from same level bag 250-500 humpback A1
WH 143 1 DfSi 16 N4-6/W102-104 2 B 5.75-5.85 rib frag 250-500 humpback E8
WH 144 1 DfSi 16 N2-4/W102-104 9 D 6.40-6.50 cranial or scapula id’d level 500-1000 humpback
WH 145 1 DfSi 16 S8-10/W98-100 1 A 1.85-2.10 vert disc 250-500 humpback A1
WH 146 1 DfSi 16 S12-14/W98-100 8 A 2.20-2.30 large vert disc frag 250-500 humpback A1
WH 147 1 DfSi 16 S12-14/W25-27 21 B 3.40-3.50 large cranial chunk 500-1000 xx
WH 148 1 DfSi 16 S12-14/W25-27 24 C 3.70-3.80 small 500-1500 grey whale

225
Table 13: samples used including excavation information.
DNA lab Zooarchaeological and archaeological information provided DNA lab results
Sample ID ## SITE UNIT LEVEL LAYER Quad
Depth Below Datum ELEMENT PORTION age DNA species ID Haplotype
WH 149 1 DfSi 16 S10-12/W25-27 6 A 2.00-2.10 vert disc 250-1000 right whale
WH 150 1 DfSi 16 N4-6/W102-104 4 B 5.95-6.05 unid level 250-500 humpback A1
WH 151 2 DfSi 16 S12-14/W98-100 10 A 2.40-2.50 2 frags 250-500 humpback A1
WH 152 1 DfSi 16 N4-6/W102-104 11 C 6.65-6.75 vert disc 500-1000 humpback
WH 153 1 DfSi 16 S58-60/W64-66 8 D 0.20-0.30 heavy frag 4000-5000 humpback
WH 154 1 DfSi 16 S12-14/W25-27 24 C 3.70-3.80 500-1000 humpback
WH 155 1 DfSi 16 S14-16/W98-100 12 A 2.15-2.25 unid level 500-1000 humpback
WH 156 1 DfSi 16 S8-10/W98-100 1 A 1.85-2.10 small frag 250-500 humpback A1
WH 157 1 DfSi 16 N2-4/W102-104 8 C Jun-30 vert process 500-1000 humpback
WH 158 1 DfSi 16 S8-10/W98-100 8 A 2.70-2.80 250-500? humpback
WH 159 1 DfSi 16 N4-6/W102-104 18 D 7.35-7.45 whale frag 500-1000 humpback
WH 160 1 DfSi 16 N4-6/W102-104 19 D 7.45-7.55 whale from id’d level “unid whale” 500-1000 grey whale
WH 161 1 DfSi 16 S6-8/W98-100 14 A 3.35-3.45 very dense element >1000 Blue whale
WH 162 1 DfSi 16 S10-12/W25-27 15 A 2.90-3.00 bone from north wall 1000-2000 humpback
WH 163 1 DfSi 16 S10-12/W98-100 5 A 2.10-2.20 cranial? 250-500 humpback E4
WH 164 1 DfSi 16 N2-4/W102-104 17 D unid whale from id’d level id’d level 500-1000 humpback
WH 165 1 DfSi 16 S14-16/W98-100 12 A 2.15-2.25 500-1000 humpback E8
WH 166 2 DfSi 16 N4-6/W102-104 30 E 8.55-8.65 2 whale frags from level bag 1000-1500 xx/finback
WH 167 1 DfSi 16 S58-60/W64-66 3 A 0.20-0.10 above 2 frags id’d level 3500-4500 xx
WH 168 1 DfSi 16 S8-10/W98-100 4 A 2.30-2.40 2 frags of same element unid level 250-500 humpback
WH 171 1 DfSi 16 S56-58/W66-68 5 E 0.40-0.50 “bone #1 rib frag” 3500-4500 humpback
WH 172 1 DfSi 16 S56-58/W64-66 7 B 0.60-0.70 lrag cranial frag from feature # 24 3500-4500 grey whale
WH 173 1 DfSi 16 S2-4/W98-100 1 A 3.20-3.50 from top of 2000 trench charcoal attached! 250-500 humpback
WH 174 1 DfSi 16 S14-16/W25-27 20 C 3.00-3.10 small vertbral disc frag 500-1000 humpback
WH 176 2 DfSi 16 S14-16/W25-27 13 A 2.30-2.40 2 undet frags.. 500-1000 humpback
WH 37 1 DfSi 17 S5-7/W11-13 14 4.10-4.20 likely a whale but…. might be a sea lion 250-500 humpback A1
WH 66 1 DfSi 17 N43-44/W53-55 2 A 4.85-4.95 1 small fragment 250-500 humpback E8
WH 83 1 DfSi 17 N43-44/W53-55 7 C 5.35-5.45 2 vert frags (in separate bags) 250-1000 xx
WH 87 1 DfSi 17 S5-7/W11-13 4 A 3.10-3.20 1 fragment 250-500 grey whale
WH 104 1 DfSi 17 S5-7/W11-13 14 4.1-4.2 scapula? 1999 500-1000 finback
WH 109 1 DfSi 17 S5-7/W11-13 16 4.30-4.40 rib frag 1999 500-1000 finback
WH 115 2 DfSi 17 S5-7/W11-13 15 4.20-4.30 two large rib frags 1999 500-1000 finback/right whale
WH 170 1 DfSi 17 S5-7/W11-13 20 B 4.70-4.80 unfused phalange 500-1000 xx
WH 175 1 DfSi 17 N43-44/W53-55 2 A 4.85-4.95 1 fragment 250-1000 humpback
WH 169 1 DfSi17 S5-7/W11-13 6 3.30-3.40 whale? Large fragment in paperbag, verebrae frag? excavated July 1999 250-500 humpback E8

226
Appendix B: Sample extraction and PCR amplifications

227
Table 14:Extraction and PCR overview
sequences included in allignment
lab ID extraction PCR setup cytB F22/R258 F101/R308 F360/R569 F322/R588 RECODED
success/all(%) F86/R308 F167/R569 STATISTIC
WH026 23/01/06 12/14(86) C09 F C09 F C21 F C37 F G13 F/R G136F324 PT026
12/12/08 C36 F,C35 R G56F* G57R*
WH027 23/01/06 10/16(63) C09 F C09 F C35 R C18 R,C36 R G57 R PT027
C96 R C18 R C21F, C35F E99R
WH028 23/01/06 7/18(39) C09 F C09 F C18R C18R E90R PT028
23/03/09 C15 F/R C21 F C37R
WH031 23/01/06 13/17(76) C09 F C09 F C21F G33F,G56F G34R PT031
23/03/09 C15 R C98R,G60F C18R,C37F
WH033 23/01/06 14/18(78) C09 F C09 F C21 F,R E97 F E98 R PT033
C51 F C52 F C109 R C18R,C15F G61F
WH037 23/01/06 11/15(73) C14F C14F C21 R G7 F E75F PT037
C15 R C37R,C98R C37R,G59F G57R
WH039 23/01/06 11/15(73) C14F/R C15R C21 F/R E73 F E75 F/R PT039
G55F, C98R G59F D64F,R
WH042 31/01/06 11/21(52) C51 F C15F/R G36 R E73 F,G56F G13 F/R G136,F324 PT042
C21 F,R E98F D64 F/R,E90R
WH044 31/01/06 21/22(55) C51 F C96F G6 F/R,C35F E73 F G13 F/R,G57R PT044
C15R E88 F,C109F E89 F D64 F/R,D71R
WH046 31/01/06 12/12(100) C14F C14F C21 F/R C18 R G13 F/R PT046
C15R C18R, C98R G56 F G57 R
WH050 28/02/06 11/13(85) C29F C32R C56 F E73 F G34 R PT050
12/03/06 C32R C30F C98 R G33 F G57R
WH055 28/02/06 7/14(50) C32R C26F C98F E89 F D64F/F PT055
12/03/06 C26F C96R G55F G59F G13 F/R
WH057 28/02/06 9/11(82) C26F C26F C98 R,E73F G33 F G35R PT057
12/03/06 C32R C30F G55F G56F G61F
WH058 28/02/06 14/23(61) C26F C52F G6 F/R G33F,E89 D71F, D64F G139,F294 PT058
C96R G36 R G56F G13, G35R
WH059 28/02/06 11/15(73) C29F C30F C56 F, C98R D62F G13F/R PT059
C96R G55F G59F G35R
WH060 28/02/06 9/10(90) C32R C26F C98R D62F G13 F/R PT060

228
Table 14:Extraction and PCR overview
sequences included in allignment
lab ID extraction PCR setup cytB F22/R258 F101/R308 F360/R569 F322/R588 RECODED
success/all(%) F86/R308 F167/R569 STATISTIC
12/03/06 C26R C96R C56 F G56 F G35R
WH064 28/02/06 8/25(32) C51 F C96R C123 F G33 F G61 F,D71F G139 F294 PT064
C52F E98R
WH065 28/02/06 13/23(65) C30R G36 R,E91F G7F,G33 F E75 F/R PT065
C96F G6 F/R,C56F E89F G36F,D64F
WH066 28/02/06 8/12(67) C30R C123 F G56 F E75 F/R PT066
C96F D62F G57 R,D64F
WH068 28/02/06 9/11(82) C96F C123 F E73 F G57 R PT068
12/03/06 C30R G55F D60F E75 F/R
WH069 22/04/06 9/10(90) C53F C53F C98 R D62F D71 R G137 R409 PT069
C97R C56 F G56 F G57 R
WH070 22/04/06 9/9(100) C53F C97R C56 F D62F E75 F/R PT070
C53F G56 F G57 R, D71R
WH071 22/04/06 9/10(90) C53F C53F G55F E73 F E75 F/R G136F324 PT071
C97R C56F G56 F
WH072 22/04/06 9/9(100) C53F C53F G55F G56F E75 F/R PT072
C97R C56F D62F G61 F
WH073 22/04/06 8/10(80) C53F C53F G55F E73 F E75 F/R PT073
C97R C123 F D62F G61 F
WH074 22/04/06 11/15(73) C53F C124F G55F E93F G13F/R PT074
04/01/08 C53F C56F G56F G61F
WH076 22/04/06 11/11(100) C53F C53F G55F D62F G13F/R PT076
04/01/08 C97R C56F G56F/E73F E75F G139 F294
WH077 22/04/06 10/10(100) C53F C53F G6 F/R E74 F/R E75 F/R PT077
C97R C56 F D62F G32F,G57R
WH078 22/04/06 8/9(89) C53F C53F C56F E74F/F E75F/R PT078
C97R G55F G57R
WH079 22/04/06 7/8(88) C53F C53F C123F D62F E75F/R PT079
C97R
WH081 22/04/06 8/11(73) C53F C53F C56F E74F/R E98R G137 R409 PT081
G55F E97F G57R

229
Table 14:Extraction and PCR overview
sequences included in allignment
lab ID extraction PCR setup cytB F22/R258 F101/R308 F360/R569 F322/R588 RECODED
success/all(%) F86/R308 F167/R569 STATISTIC
WH082 22/04/06 9/12(75) C124F C123F G56F G13F/R PT082
G60F D62F
WH085 22/04/06 10/11(91) C124F C55F G56F G13F/R PT085
E71F D62F G61F
WH086 29/04/06 12/14(86) C57F C123F E74F/R G13F/R PT086
G55F G57R
WH088 29/04/06 12/13(92) C87F C69F C69R G13F/R PT088
G55F E2R E76R
WH089-1 29/04/06 9/10(90) C57F G55F,C123F G56F G13F/R PT089-1
C69F/R E74R G35R
WH092 29/04/06 10/11(91) C57F C69 F C69 R G13 F/R PT092
E1 F G7 F,E2R G57R
WH096 29/04/06 8/10(80) C57F E71F C69R G13F/R PT096
G59F,G56F G61F
WH097 29/04/06 10/12(83) C57F C69F C69R G13F/R PT097
E1F,G55F E2F G57R
WH101 29/04/06 11/11(100) C83F C69F C69R E76R G139 F294 PT101
E1R E02F G57R
WH102 12/05/06 7/14(50) C64F C83F C123F G07F G13F/R PT102
C80F/R E76R
WH106 12/05/06 7/8(88) C64F/R C83F C123F E74F/R G13F/R PT106
C80R G7 F E76R
WH107 12/05/06 10/12(83) C64F C83F G55F E74R E76R PT107
G123F G33F G35R,G32F
WH112 12/05/06 6/12(50) C64R C83F G123F E97F E98R PT112
23/03/09 G60F G57R
WH113 12/05/06 7/15(47) C83F G123F G7 F E98R PT113
G61F
WH125 19/05/06 7/9(78) C74F/R E92F E93F E98F PT125
23/03/09 D59F
WH126 19/05/06 7/10(70) C74F C84F G55F,E92F E93F E98R PT126

230
Table 14:Extraction and PCR overview
sequences included in allignment
lab ID extraction PCR setup cytB F22/R258 F101/R308 F360/R569 F322/R588 RECODED
success/all(%) F86/R308 F167/R569 STATISTIC
D59F G57R
WH127 19/05/06 8/10(80) C74F C84F E92F E93F E98R PT127
D59F G56F G57R
WH129 19/05/06 9/10(90) C74F C84F E72R E97F E98R PT129
G55F,D59F G61F,G57R
WH131 19/05/06 7/9(78) C74F C74F G58R E97F E98R PT131
D59F
WH132 19/05/06 6/10(60) C82R C84F G55F E99F E105R G139 F294 PT132
E104F
WH133 19/05/06 10/10(100) C74R E72R, D59F E97F E98R PT133
G60F,G55F G56F
WH136 19/05/06 7/7(100) C74R E72R E97F G13F/R PT136
D59F E98R
WH138 19/05/06 8/8(100) C74R G60F,D59F E99F E105R PT138
23/03/09 E104F,E72R
WH141 25/05/06 8/8(100) C75F E104F,E72R E99F E105R PT141
G60F,D60F
WH142-1 25/05/06 10/12(83) C75R E104F E99F E105R PT142
G63F G64R
WH143 25/05/06 5/8(63) C75R E104F E99F E105R PT143
23/03/09 D60F
WH145 25/05/06 9/9(100) C75R D60F G63F G64R PT145
E104F E99F E105R,G61F
WH146 25/05/06 10/11(91) C75F G32R,E104F E99F E105R PT146
G62F,D60F G63F G64R,G61F
WH150 25/05/06 8/8(100) C75F E104F E99F E105R PT150
D60F G63F G64R
WH151-2 25/05/06 9/10(90) C75F G6R/F E99F E105R G138 R432 PT151
E104F G63F G64R
WH156 25/05/06 8/8(100) C75F E104F E99F E105R PT156
G62F,D60F G63F G64R

231
Table 14:Extraction and PCR overview
sequences included in allignment
lab ID extraction PCR setup cytB F22/R258 F101/R308 F360/R569 F322/R588 RECODED
success/all(%) F86/R308 F167/R569 STATISTIC
WH163 27/05/06 9/9(100) C79F E104F E99F E105R PT163
G62F,D60F G63F G64R
WH165 27/05/06 9/9(100) C79F E104F E99F E105R PT165
G62F,D61F G63F G64R
WH169 27/05/06 9/11(82) C79F E104F E100F G13F/R PT169
C90F G62F,D61F G63F E105R
WH185 17/11/06 10/10(100) D125F G62F,E61F E100F E105R G138 R432 PH185
D154R E104F G63F G64R
WH186 17/11/06 7/8(88) D125F E104F E100F E105R PH186
G63F G64R
WH193 17/11/06 8/10(80) D146F G62F E100F E105R PH193
D154R E104F G63F G64R
WH196 06/01/08 8/8(100) E5R E104F E100F E105R PH196
E61F G63F G64R
WH198 06/01/08 7/8(88) E5R E104F E100F E105R PH198
G62F G63F G64R
WH199 06/01/08 9/9(100) E5R E104F,E61F E100F G13F/R G138 R432 PH199
G62F G63F E105R,G35R
WH200 06/01/08 6/10(60) E5F G32R E100F G64R PH200
E104F G63F E105R
WH203 06/01/08 7/7(100) E5F E104F E100F E105R PH203
G62F G63F G64R
WH208 12/02/08 6/6(100) E34R E168 F/R E169 F E170 F/R G138 R432 PH208
G61F
WH209 12/02/08 7/8(88) E34R E168F/R E169F/R G35R PH209
G58R G59F E170F/R
WH210 12/02/08 9/9(100) E34R G58R,E168F/R E169F/R E170F/R
23/03/09 G60F G7F G61F
WH212 12/02/08 6/9(67) E34R G60F E217F E218F/R PH212
23/03/09 E168F/R E169F/R
WH213 12/02/08 7/7(100) E34R E168F/R E169F/R E170F/R G139 F294

232
Table 14:Extraction and PCR overview
sequences included in allignment
lab ID extraction PCR setup cytB F22/R258 F101/R308 F360/R569 F322/R588 RECODED
success/all(%) F86/R308 F167/R569 STATISTIC
G58R G61F
WH214 12/02/08 6/6(100) E34R E168F/R E169F/R E170F/R PH214
23/03/09 G60F
WH216 12/02/08 7/11(64) E34R G32R E217F E218F/R PH216
G36R E169F/R
WH217 12/02/08 8/10(80) E34R E216 F/R E217 F E218 F/R PH217
E168R E169F/R,G59F
WH218 12/02/08 9/11(82) E34R E168F/R E169F/R E218F/R G139 F294 PH218
23/03/09 E217F G61R,G13R
WH219 12/02/08 7/7(100) E34R E168F/R E169F/R E170F/R PH219
G58R G61R
WH220 12/02/08 7/8(88) E34R E168 F/R E169 F/R E170 F/R PH220
23/03/09 G60F G61R
WH221 12/02/08 6/6(100) E34R E168F/R E169F/R E170F/R PH221
G61R
WH222 25/02/08 10/10(100) E52F G32 R E169 F/R E170 F/R PH222
E168 F G7 F E170R
WH223 25/02/08 6/6(100) E52F E168F/R E169F/R E170F/R PH223
G60F
WH225 25/02/08 7/8(100) E52F E168F/R E169F/R E170F/R PH225
E60F G59F G61R
WH227 25/02/08 6/7(86) E60F E168F/R E169F/R E170F/R PH227
E63F G61R
WH229 25/02/08 8/9(89) E60F E168F/R E169F/R E170F/R G139 F294 PH229
23/03/09 E63F G60F G61R
WH230 25/02/08 11/12(92) E60F E216F/R E217F G13,E170,E218 PH230
E168F/R E169F/R G35R,G32F
WH233 25/02/08 7/8(88) E60F E168F/R E169F/R E170F/R PH233
G59F G61R
WH241 02/03/08 9/9(100) E52F E173 F/R E174 F E175 F/R G139 F294 PH241
G25 F G26 F G34F/R,G61F

233
Table 14:Extraction and PCR overview
sequences included in allignment
lab ID extraction PCR setup cytB F22/R258 F101/R308 F360/R569 F322/R588 RECODED
success/all(%) F86/R308 F167/R569 STATISTIC
WH246 02/03/08 7/7(100) E52F E173F/R E174F/R E175F/R PH246
G25 F G26 F
WH247 02/03/08 7/7(100) E52F E173F/R E174 F/R E175F/R PH247
G25 F G26 F G27F
WH249 02/03/08 6/7(86) E52F E173 F/R E174 F/R G13F PH249
G35R,G61R
WH250 02/03/08 7/7(100) E52F G6F/R G7F G61R PH250
E173F/R E174F/R E175F/R
WH251 02/03/08 7/7(100) E52F E173F/R G26 F E175F/R PH251
G25 F E174 F/R G27 F
WH252 02/03/08 5/5(100) E52F E173 F/R E174 F E175 F/R PH252
G25 F G26 F G27 F
WH253 02/03/08 5/5(100) E52F E173 F/R E174 F E175 F/R PH253
WH254 02/03/08 10/10(100) E52F E173 R G26 F E175 R PH254
G25 F G7 F G13 F
WH256 02/03/08 7/7(100) E52F E173 F/R E174 F E175 F/R PH256
G25 F G26 F G27 F
WH257 02/03/08 7/7(100) E52F E173 F/R G26 F E175 F/R PH257
G25 F E174 F G27 F
WH261 02/03/08 7/7(100) E53R E173 F/R G26 F E175 F/R PH261
G25 F E174 F G27 F
WH265 03/03/08 7/7(100) E63F E173 F/R E174 F E175 F PH265
E53R G25F G26 F G27F/R
WH268 03/03/08 7/7(100) E53R E173 F/R E174 F E175 F/R PH268
G25 F G26 F G27F/R
WH271 03/03/08 8/8(100) E53R E173 F/R E174 F E175 F G138 R432 PH271
23/03/09 G25 F G26 F G27F/R
WH275 03/03/08 5/5(100) E53R G60F E174F E175 F/R PH275
23/03/09 E173 F/R
WH276 03/03/08 9/9(100) E53R G6R,E173F/R E174F E175 F/R PH276

234
Table 14:Extraction and PCR overview
sequences included in allignment
lab ID extraction PCR setup cytB F22/R258 F101/R308 F360/R569 F322/R588 RECODED
success/all(%) F86/R308 F167/R569 STATISTIC
G25 F G26 F,G7F G27 F
WH277 03/03/08 8/8(100) E53R E173 F/R E174 F E175 F/R PH277
G25 F,G6F/R G26 F G27 F
WH278 03/03/08 7/7(100) E53R E173F/R G26 F E175F/R PH278
G25F E174 F/R G27F
WH279 03/03/08 6/6(100) E53R E173F/R E174 F E175F/R PH279
G59 G61R
WH034 23/01/06 6/13(46) C9F C96F,C15R C37R
WH035 23/01/06 11/11(100) C09F C09F C21F/R,C98R C18R
WH036 23/01/06 4/7(57) C09F C15F/R, C9f
WH038 31/01/06 3/7(43) C14 C96F,C15R
WH041 31/01/06 1/8(13) C51F
WH043 31/01/06 5/19(26) C51F C107F C107F
WH045 31/01/06 2/6(33) C14F C15R,C96F C18R
WH047 31/01/06 3/4(75) C14F C96F
WH048 31/01/06 8/9(89) C14F C14F C96R,C21F/R E73F,C18R
WH049 28/02/06 5/11(45) C29F,C51F C95R,C52F
WH051 28/02/06 9/18(50) C96R,C52F E91F,C98F E89F D71F,D64F
WH053 28/02/06 4/5(80) C29F,C32R C30F,C26F C56F,C98R E73F
WH054 28/02/06 4/7(57) C26F C52F,C54F,C96R
WH056 28/02/06 4/5(80) C26F,C32R C26F,C30F
WH061 28/02/06 5/17(29) C26R,C32R C26R,C52F D64F
WH062 28/02/06 3/9(33) C51F C52F
WH063 28/02/06 7/20(35) C51F C52F,C96R D64F
WH079 28/02/06 6/7(86) C53F C97R,C53F C123F D62F E75F/R
WH080 22/04/06 1/3(33)
WH084 22/04/06 0/4(0) C14/F
WH087 22/04/06 1/3(33) C82R
WH094 29/04/06 2/5(40) C57F C57F/R

235
Table 14:Extraction and PCR overview
sequences included in allignment
lab ID extraction PCR setup cytB F22/R258 F101/R308 F360/R569 F322/R588 RECODED
success/all(%) F86/R308 F167/R569 STATISTIC
WH095 29/04/06 3/4(75) C61F C69F
WH098 29/04/06 2/6(33) C57R
WH099 29/04/06 2/3(67) C57R
WH100 29/04/06 2/9(22) C57F C69R E74F/R
WH104 12/05/06 3/8(38) C64R C83F
WH105 12/05/06 2/7(29) C64F/R,C80F E93F
WH108 12/05/06 3/16(19) C71F C83F
WH109 12/05/06 2/3(67) C64R C83F
WH110 12/05/06 3/5(60) C64F C83F
WH111 12/05/06 4/6(67) C64F C83F
WH114 12/05/06 2/4(50) C83F
WH115-1 12/05/06 3/4(75) C64F,C80F
WH115-3 12/05/06 1/5(20) C64R D64F
WH116-1 12/05/06 1/3(33) C64F
WH116-2 12/05/06 2/4(50) C82F
WH117 19/05/06 8/11(73) C64R,C80R D59F,E76F,E92F E93F,E74F/R, E76R
WH118 19/05/06 3/8(38) C64F,C90F C90R E74F/R
WH119 19/05/06 3/8(38) C74R C83F C123F E74R
WH120 19/05/06 3/6(50) C74F C83F E71F,D59F E74F/R E76R
WH121 19/05/06 6/7(86) C74R C83F E92F E93F
WH122 19/05/06 6/7(86) C74R C83F D59F/E71F E93F E98R
WH123 19/05/06 1/3(33) C74F/R
WH124-1 19/05/06 7/8(88) C74R E93F E98R
WH124-2 19/05/06 2/4(50) C74F E92F,D59F
WH128 19/05/06 4/6(67) C82R C84F E97F
WH130 19/05/06 1/3(33) C74R
WH134 19/05/06 5/7(71) C74F C74F D59F
WH137 19/05/06 7/7(100) C74F E104F,D59F,E72R E99F E105R
WH139 19/05/06 4/4(100) C74F D59F
WH140-1 25/05/06 2/2(100) C75F
WH140-2 25/05/06 1/2(50) C75F

236
Table 14:Extraction and PCR overview
sequences included in allignment
lab ID extraction PCR setup cytB F22/R258 F101/R308 F360/R569 F322/R588 RECODED
success/all(%) F86/R308 F167/R569 STATISTIC
WH141 25/05/06 8/8(100) C75F G60F,E72R,D60F.E104 E99F E105R
WH142-1 25/05/06 10/12(83) C75F E104F G63F,E99F G645,E105R
WH142-2 25/05/06 4/6(67) C75F E104F,D60F E99F E105R
WH144 25/05/06 1/5(20) C75F
WH147 25/05/06 1/3(33) C82R
WH148 25/05/06 2/3(67) C82R
WH149 25/05/06 1/2(50) C75F/R
WH151-1 25/05/06 3/4(75) C75R
WH152 25/05/06 4/4(100) C75R D60F E99F
WH153 25/05/06 4/5(80) C75F D60F E99F
WH154 25/05/06 1/3(33) C82R
WH155 25/05/06 2/4(50) C75R
WH157 25/05/06 1/4(25) C75R
WH158 25/05/06 1/4(25) C90F
WH159 25/05/06 3/6(50) C79F E104F E99F E105R
WH160 25/05/06 1/2(50) C79R
WH161 25/05/06 2/2(100) C79F
WH162 25/05/06 0/7(0) C79R,C90F
WH164 27/05/06 2/5(40) C79R E99F E105R
WH166 27/05/06 0/4(0) C79R
WH168 27/05/06 2/9(22) C90R E100F
WH171 27/05/06 1/5(20) C74R,C79R
WH172 27/05/06 1/2(50) C79F
WH173 27/05/06 2/3(67) C79R
WH174 27/05/06 2/3(67) C79F D61F
WH175 27/05/06 1/4(25) C79R D73F
WH176-1 27/05/06 2/3(67) C79F
WH176-2 27/05/06 2/3(67) C79R
WH180 17/11/06 3/7(43) D146F E71F
WH181 17/11/06 1/4(25) D146F
WH183 17/11/06 2/3(67) D125F E61F

237
Table 14:Extraction and PCR overview
sequences included in allignment
lab ID extraction PCR setup cytB F22/R258 F101/R308 F360/R569 F322/R588 RECODED
success/all(%) F86/R308 F167/R569 STATISTIC
WH184 17/11/06 5/7(71) D146F,D154R
WH188 17/11/06 2/5(40) D125F E100F E105R
WH189 17/11/06 2/5(40) D125F E100F
WH190 17/11/06 5/6(83) D146F E104F E100F E105R
WH191 17/11/06 2/2(100) D154R
WH192 17/11/06 1/1(100) D154R
WH194 17/11/06 2/3(67) D146F,D154R
WH197 06/01/08 1/6(17) E5R E100F
WH205 06/01/08 1/1(100) E5F
WH211 12/02/08 2/8(25) E34R E217F,E169F/R E218F/R
WH215 12/02/08 2/2(100) E34R
WH221 12/02/08 6/6(100) E34R E168F/R E169F/R E170F/R,G61
WH222 25/02/08 10/10(100) E52F E168F/R E169F/R,G7F,G33F E170F/R,G32F,G35R G61R588
WH223 25/02/08 6/6(100) E52F E168F/R E169F/R E170F/R G137R409
WH224 25/02/08 2/2(100) E52F
WH226 25/02/08 2/3(67) G59F
WH228 25/02/08 3/3(100) E60F,E63F
WH231 25/02/08 2/3(67) E60F
WH232 25/02/08 3/3(100) E60F,E63F
WH234 25/02/08 4/9(44) E60F E217F/R E218F/R
WH235 25/02/08 3/3(100) E60F,E63F
WH236 25/02/08 1/5(20) E60F
WH237 25/02/08 2/2(100) E52F
WH238 25/02/08 3/6(50) E60F,E63F E169F/R
WH240 02/03/08 1/3(33) E63F E169F/R
WH245 02/03/08 2/3(67) E60F,E63F
WH255 02/03/08 0/3(0) E63F
WH258 02/03/08 1/1(100) E53R
WH262 02/03/08 1/1(100) E53R
WH263 02/03/08 1/1(100) E53R
WH264 02/03/08 1/1(100) E53R

238
Table 14:Extraction and PCR overview
sequences included in allignment
lab ID extraction PCR setup cytB F22/R258 F101/R308 F360/R569 F322/R588 RECODED
success/all(%) F86/R308 F167/R569 STATISTIC
WH266 02/03/08 1/1(100) E53R
WH267 02/03/08 1/1(100) E53R
WH269 02/03/08 1/1(100) E53R
WH270 02/03/08 1/1(100) E53R
WH272 02/03/08 1/1(100) E53R E173F/R
WH274 02/03/08 1/1(100) E53R