anatomy of an enduring gender gap: the evolution of women ... · anatomy of an enduring gender gap:...
TRANSCRIPT

Full Terms & Conditions of access and use can be found athttp://www.tandfonline.com/action/journalInformation?journalCode=uhej20
Download by: [69.75.61.234] Date: 21 December 2016, At: 15:41
The Journal of Higher Education
ISSN: 0022-1546 (Print) 1538-4640 (Online) Journal homepage: http://www.tandfonline.com/loi/uhej20
Anatomy of an Enduring Gender Gap: TheEvolution of Women’s Participation in ComputerScience
Linda J. Sax, Kathleen J. Lehman, Jerry A. Jacobs, M. Allison Kanny, GloriaLim, Laura Monje-Paulson & Hilary B. Zimmerman
To cite this article: Linda J. Sax, Kathleen J. Lehman, Jerry A. Jacobs, M. Allison Kanny, GloriaLim, Laura Monje-Paulson & Hilary B. Zimmerman (2016): Anatomy of an Enduring GenderGap: The Evolution of Women’s Participation in Computer Science, The Journal of HigherEducation
To link to this article: http://dx.doi.org/10.1080/00221546.2016.1257306
Published online: 20 Dec 2016.
Submit your article to this journal
View related articles
View Crossmark data

Anatomy of an Enduring Gender Gap: The Evolution ofWomen’s Participation in Computer ScienceLinda J. Saxa, Kathleen J. Lehmana, Jerry A. Jacobsb, M. Allison Kannyc, Gloria Limc,Laura Monje-Paulsond, and Hilary B. Zimmermana
aGraduate School of Education & Information Studies, University of California, Los Angeles, LosAngeles, California, USA; bDepartment of Education, University of Pennsylvania, Philadelphia,Pennsylvania, USA; cStudent Affairs Information and Research Office, University of California, LosAngeles, Los Angeles, California, USA; dStudent Affairs Research and Assessment, Loyola MarymountUniversity, Los Angeles, California, USA
ABSTRACTGiven growing interest in computing fields, as well as a long-standing gender gap in computer science, this study used nation-wide survey data on college students during 4 decades to: (a)document trends in aspirations to major in computer scienceamong undergraduate women and men; (b) explore the charac-teristics of women and men who choose to major in computerscience and how this population has evolved over time; and (c)identify the key determinants of the gender gap in the selectionof computer science majors during the past 4 decades. The dataincluded 8 million students attending 1,225 baccalaureate-grant-ing institutions from 1971 to 2011, with selected-year multivariateanalyses of 18,830 computer science majors (and 904,307 stu-dents from all other majors). The results revealed heavy fluctua-tions in students’ interest in computer science from 1971 to 2011,with trends highlighting a significant downturn between the late1990s and 2011 as well as a persistent, sizeable underrepresenta-tion of women across all years. The study also showed that whilesome of the traditional explanations for the gender gap in com-puter science held true, there have been distinctive shifts in whopursues computer science and why some students may be parti-cularly interested in or dissuaded from the major.
ARTICLE HISTORYReceived 27 May 2015Accepted 4 October 2016
KEYWORDSCollege; computer science;gender; major selection;STEM
In recent years, women’s underrepresentation in science, technology, engi-neering, and math (STEM) fields has garnered widespread attention inpublic, academic, and policy circles. President Obama has indicated hiscommitment to addressing the lack of women in STEM fields through hisWhite House Educate to Innovate Program (The White House, 2013), and hemore recently targeted efforts to the field of computer science as part of theComputer Science for All Initiative (The White House, 2016).
Indeed, of all the STEM fields, the gender gap in computer science isamong the most apparent. Although women’s representation among
CONTACT Linda J. Sax [email protected] versions of one or more of the figures in the article can be found online at www.tandfonline.com/uhej.
THE JOURNAL OF HIGHER EDUCATIONhttp://dx.doi.org/10.1080/00221546.2016.1257306
© The Ohio State University

computer science bachelor’s degree recipients has fluctuated during the pastfour decades from a low of 13.6% (in 1971) to a high of 37.1% (in 1984),women presently comprise only 18.0% of computer science graduates(National Center for Education Statistics [NCES], 2014). Concurrent withthe declining proportion of women in the field since the mid-1980s, comput-ing and information technology has become a booming industry, under-scoring an important national need for individuals with college-level trainingin computer-related fields (Singh, Allen, Scheckler, & Darlington, 2007).Individuals with such training often go on to work as computer program-mers, computer systems analysts, systems engineers, and computer scientists(Bureau of Labor Statistics [BLS], 2014).
The dearth of women in these professions is more than just a matter ofnumbers, however, as the technology industry and society at large oftensuffer from inattention to women’s needs in the development process. Forexample, the use of “tech assistants” (e.g., Android’s Cortana or Apple’s Siri)has been criticized for being ill-equipped to respond to user requests regard-ing crises that predominantly affect women (e.g., sexual assault; Miner et al.,2016). Similarly, Apple faced heavy criticism in 2014 when its native healthapplication failed to include the ability to track a woman’s menstrual cycle(Alba, 2015). Some critics argued that these missteps reflect the male-cen-tered nature of the technology industry (Chemaly, 2016).
To help address such assertions and meet increased demand for trainedcomputer scientists, widespread efforts have encouraged participation in com-puting fields, especially among women (e.g., Code.org’s “Hour of Code” initia-tive; Google’s “Made With Code” campaign; the Girls Who Code organization;the National Center for Women and Information Technology; Code.org, 2013;Dockterman, 2014). While these are positive steps toward increasing participa-tion in computer science, such efforts would be bolstered by an awareness of thebackgrounds, characteristics, and personality orientations of students who aremost interested in computing. Further, there is no current empirical under-standing of whether computer science attracts the same types of women andmen today as it has in previous decades.
To address these gaps, this study had three primary aims: (a) to documentnationwide trends in aspirations to major in computer science among under-graduate women and men; (b) to explore the characteristics of women and menwho plan to major in computer science and how this population has evolvedover time; and (c) to identify key determinants of the gender gap in computerscience major aspirations during the past four decades.
Literature review
Despite a rich, several-decade history related to understanding the determinantsof women’s participation in STEM fields in the aggregate, only recently has
2 L. J. SAX ET AL.

discipline-specific, empirically based research begun to consider the reasons forwomen’s disparate participation in particular STEM fields, such as computerscience. This tradition within the literature is important given that research hasshown that students pursuing a computer science undergraduate degree arequite distinct from other STEM students with respect to background character-istics, self-ratings, and career aspirations (Lehman, Sax, & Zimmerman, 2016).Thus, in the sections that follow, extant literature related to the gender gap in thecomputer science major choice is reviewed against the backdrop of what isknown regarding determinants of the college STEM gender gap in general.
Personal inputs and background characteristics
A wealth of research has demonstrated that student background character-istics shape men and women’s plans to pursue a STEM major. In general, theliterature has suggested that lower-income, non-Asian racial/ethnic minori-ties, and first-generation college students are less likely to pursue STEMmajors; among these groups, women are even less likely than their malecounterparts to choose a STEM major (G. Huang, Taddese, & Walter, 2000;Seymour & Hewitt, 1997). Notably, the severity of the gender gap in STEMvaries by racial/ethnic group, with the most pronounced gaps favoring menoften occurring among Latino and African American students (Anderson &Kim, 2006; Smyth & McArdle, 2004).
Although few studies have examined the role of students’ backgroundcharacteristics in predicting plans to major in computer science, analyses ofnational enrollment and graduation data have revealed similar patterns incomputer science degree attainment with respect to race (National ScienceFoundation [NSF], 2015; NCES, 2012). Although non-Asian racial/ethnicminorities are generally underrepresented in the STEM fields, Black stu-dents—both male and female—are better represented in computer sciencethan they are among degree recipients across all fields.1 Specifically, Blackstudents constituted 16.7% of female and 8.6% of male bachelor’s degreeholders in computer science and only 10.9% of female and 7.7% of maledegree recipients across all fields. Asian students were also overrepresentedamong computer science bachelor’s degree recipients as they constituted10.0% of female and 7.9% of male computer science graduates, relative to6.2% of female and 7.0% of male college graduates across all fields. Whitewomen, by contrast, were less well-represented in computer science com-pared with their overall representation in higher education. In 2012, Whitewomen constituted 45.7% of female computer science graduates but earned61.2% of all bachelor’s degrees awarded to women. These statistics not onlyreveal differential representation of racial/ethnic groups among computerscience graduates, but they also highlight that the magnitude of the gendergap in computer science varies by race and ethnicity.
THE JOURNAL OF HIGHER EDUCATION 3

Family influences and expectations
Previous studies have revealed a link between the role of family influencesand expectations and students’ decisions to pursue STEM majors in generaland computer science specifically. Generally, families play a notable role asone of the earliest sources of influence on students’ exposure to and interestin STEM subjects. They do so by serving as role models through their owncareers, providing support or encouragement, and sending implicit andexplicit messages regarding the acceptability or potential for their childrento pursue STEM careers (H. S. Astin & Sax, 1996; Moakler & Kim, 2014).
Access to computing-related materials in the home is important for com-puting interest, with girls often exposed to computing later in life than boys(Margolis & Fisher, 2003). Relatedly, Margolis, Fisher, and Miller (2000) foundthat male computer science majors were more likely to report having ownedtheir own computer or having had the family computer located in their roomby an early age. Men also enter college with higher levels of confidence in theircomputing abilities compared with women; in fact, even men not intending tomajor in the field exhibit higher computing confidence than women who planto major in computer science (Beyer, Rynes, Perrault, Hay, & Haller, 2003).Such gender gaps are critical given the well-documented connection betweensubject-area confidence and major selection in STEM (Fredricks & Eccles,2002; Sax, Kanny, Riggers-Piehl, Whang, & Paulson, 2015).
K–12 experiences
Experiences within the K–12 environment (e.g., schools, teachers, pedagogy,curriculum, and classroom structure) also play an important role in predictingmen and women’s selection of a STEM major (P. M. Huang & Brainard, 2001;Kinzie, 2007). Research on STEM in the aggregate has revealed that increasedexposure to STEM-related classroom activities, such as labs or simply beingcalled upon by a teacher, positively predicts both male and female aspirationsto major in a STEM field. However, girls tend to be excluded from theseactivities at greater rates than boys (Leedy, LaLonde, & Runk, 2003). Specific tocomputer science, research has shown that early computer experience in theclassroom is a significant positive predictor of female students’ interests incomputer science (Margolis & Fisher, 2003; Tillberg & Cohoon, 2005). Hence,students’ early classroom experiences, particularly their computing experi-ences, may inform their plans to pursue computing in college.
Students’ precollege academic preparation and achievement are also keypredictors of the decision to major in a STEM field, and particularly to majorin computer science (Margolis, Fisher, & Miller, 2000; Seymour & Hewitt,1997). Of concern is the persistent gender gap in Advanced Placement (AP)computer science courses—often considered a gateway to college-level
4 L. J. SAX ET AL.
computing majors; only 20% of computer science AP exam takers in 2014were women (College Board, 2014).
Gender socialization, values, and perceptions
Differences in the way men and women are socialized and the impact ontheir subsequent value systems and perceptions contribute to their disparateparticipation in STEM fields (Eccles, 1987). In particular, women tend toperceive computer science as an individualistic field—one that does notemphasize societal impact—and are thus less likely to pursue computerscience as a major (Weinberger, 2004; Wilson, 2002). Beyer, Rynes, andHaller (2004) argued that because women’s values often do not align withthose of the computer science field, “the average woman is unlikely to believethat she (a) could succeed in the major and (b) would derive much satisfac-tion from a career in computer science” (p. 26).
Women’s awareness of STEM fields as being heavily male-dominatedalso negatively affects their participation in STEM (Blickenstaff, 2005;Carnevale, Smith, & Melton, 2011; Hill, Corbett, & St. Rose, 2010).Within computer science specifically, societal notions of computer scienceas a reclusive “hacker” field tend to discourage women from pursuingcomputing majors. The Geek Myth or the hacker image that is oftenassociated with computer scientists can be more damaging for women’sinterest than it is for men’s (Margolis & Fisher, 2003) and may deterwomen from entering the domain of computer science (Cheryan, Plaut,Davies, & Steele, 2009).
Women may also perceive STEM fields, particularly computing, to be overtlyunwelcoming to women and may avoid pursuing a STEM major as a result(Han, Sax, & Kim, 2007; Williams & Ceci, 2012). Women who take computerscience courses are less likely than men to view computing as a field that iscompatible with raising a family (Beyer et al., 2004). Further, sexism within thetechnology sector may contribute to women’s lack of interest in computerscience. As has been well publicized in the media, a number of women havereported instances of sexism or sexual harassment within the tech industry (e.g.,Carroll, 2014), which may dissuade others from pursuing or persisting incomputer science (Lemons & Parzinger, 2007; Orser, Riding, & Stanley, 2012).
Conceptual framework
As evidenced by the literature, individual and environmental factors andtheir relationships with one another influence individuals’ plans to pursue acertain career path. To conceptualize the present study, we drew from thebody of literature on career development and utilized social cognitive careertheory (SCCT) as a guiding framework (Lent, Brown, & Hackett, 1994).
THE JOURNAL OF HIGHER EDUCATION 5

SCCT describes the social cognitive process by which individuals developinterests and make career-related choices throughout their lifetime (seeFigure 1). More specifically, the model of career-related choice behavior(MCRCB) posits that personal characteristics (e.g., race and gender), back-ground contexts (e.g., parents’ education), and learning experiences createopportunities for social feedback messages regarding what careers are possi-ble and appropriate for certain individuals. These self-understandings resultin one’s perceived self-efficacy, outcome expectations, and interests regardingparticular career options.
Of the social-cognitive variables, self-efficacy—a person’s belief in his orher ability to succeed in a particular situation—has been shown to be themost central and pervasive mechanism of personal agency (Lent, Brown, &Hackett, 2002) and functions as an ever-evolving product of the interactionbetween a person’s self-concept and the environment (Bandura, 1989).Outcome expectations—“personal beliefs about the consequences or out-comes of performing particular behaviors”—are also learned and moldedthrough experiences (Lent et al., 2002, p. 262). Outcome expectations playa key role in motivating behavior and are directly influenced by learningexperiences and self-efficacy. Self-efficacy and outcome expectations regard-ing activities have a direct effect on the formation of career interests andsubsequent choice goals and actions (Lent et al., 2002).
Recognizing that interests develop early in childhood, SCCT describes howindividuals cycle through exposure and reinforcement to pursue certain activ-ities and achieve certain levels of performance. The more efficacious one feelsin his or her ability and the more valuable the outcomes, the more enduring theinterest will be. Furthermore, interests may exist around certain careers and
Figure 1. Model of Career-Related Choice Behavior (adapted from Lent et al., 1994).
6 L. J. SAX ET AL.
professional fields, but self-efficacy, outcome expectations, and context willinfluence whether or not these interests are developed into goals. Contextsinclude environments such as local economies and job markets and physicalaccess to developmental opportunities such as education and training.
Of relevance to this study are career choice goals. Within SCCT, career choicegoals are described as “the determination to engage in a particular activity or toeffect a particular future outcome” while choice actions are the action takenthrough consideration of goals and context (Lent et al., 2002, p. 263). Goals arean exercise of personal agency said to organize, guide, and sustain behaviorwithout external reinforcement and for long periods of time. Choice goalsdescribe the intent to engage while choice actions demonstrate the engagementin a specific activity or the act of affecting a particular outcome.
SCCT is a suitable framework for this study for several reasons. First,although numerous career development models exist (e.g., Eccles’s [2004]expectancy value theory, Gottfredson’s [1981] circumscription and compro-mise theory, and typology models such as Holland [1997], etc.), we deter-mined that SCCT most closely fits the literature on STEM major selection aswell as the variables we were interested in examining. SCCT also advancesour desired conceptual approach in which we consider the person and his/her contexts as intertwined and in a relationship of influence over time. Forexample, as this study is particularly focused on the role of gender, SCCT isalso appropriate as it positions gender (as well as other social identities) as aninterwoven feature of a person’s socially constructed world. SCCT empha-sizes how gender evokes reactions from social-cultural environments and canrelate to structures of opportunity within which career beliefs develop.
Second, Lent and colleagues suggested that the MCRCB is best applied tospecific contexts, and empirical research has upheld the use of this modelspecifically within the context of STEM education (Byars-Winston, Estrada,Howard, Davis, & Zalapa, 2010; Lent, Lopez, Lopez, & Sheu, 2008; Soldner,Rowan-Kenyon, Inkelas, Garvey, & Robbins, 2012; Wang, 2013). Finally, thisstudy contributes to one of the goals of SCCT, which is to bring together theconstructs of self-concept and self-efficacy into a more universal framework.Research has long shown self-concept and self-efficacy to be empiricallycorrelated (Bong & Clark, 1999; Lent, Brown, & Gore, 1997; Lent et al.,2002). In this study, we focused specifically on math self-concept as one formof self-efficacy, though we acknowledge that self-efficacy also refers to one’sconfidence to successfully apply their abilities to a given task (Bandura, 1997;Bong & Skaalvik, 2003).
Objectives
As highlighted in the previous sections, most research considers the factorscontributing to the gender gap in STEM fields in the aggregate rather than
THE JOURNAL OF HIGHER EDUCATION 7

within specific STEM fields, such as computer science. Further, research onthe gender gap in STEM fields has generally not examined how the salienceof various predictors of STEM major aspirations may have shifted acrosstime. Because the characteristics of male and female college students havechanged over the years (Sax, 2008) and perceptions of the STEM fields mayhave evolved as well, it is important to know whether individual STEMdisciplines attract different types of women and men today than in thepast. Accordingly, this study utilized national data on incoming collegestudents collected during the past four decades to address the followingresearch questions:
(1) How has the gender gap in incoming college students’ intent to majorin computer science changed during the past four decades?
(2) What are the determinants of women’s and men’s plans to major incomputer science versus all other fields? To what extent have thesedeterminants and/or their salience changed over time for women andmen?
(3) To what extent is the gender gap in college students’ plans to major incomputer science due to: (a) gender differences in student attributesversus (b) gender differences in the salience of these attributes? Howhas this changed over time?
Methods
Data source and sample
This study utilized data from the Cooperative Institutional Research Program(CIRP) Freshman Survey, the oldest and largest longitudinal study ofAmerican higher education. The survey is administered to entering collegestudents and covers a wide range of topics, including demographic back-ground, high school experiences, college expectations, self-concepts, values,and life goals as well as the students’ academic and career aspirations. TheCIRP Freshman Survey uniquely enabled this study to explore the changingtrends in students’ interest to major in computer science across four decadesand link this key variable to a common set of independent variables from1971 to 2011. Other national data sets do not go back as far as this surveydoes and/or follow only one cohort of students for an extended period oftime (e.g., National Education Longitudinal Study of 1988 [NELS:88],National Longitudinal Study of 1972 [NLS-72]).
This study was based on CIRP data from 1,225 baccalaureate-grantinginstitutions from 1971 to 2011. The trend analysis explored how the intent tomajor in computer science has varied by gender from 1971 to 2011 and wasbased on an unweighted sample of 8,038,061 respondents across the four
8 L. J. SAX ET AL.

decades (3,662,692 men and 4,375,369 women). The sample for the descrip-tive trend analysis was then weighted by student gender and institutionalcontrol, type, and selectivity so that it would reflect the population of first-time, full-time college students at all 4-year institutions in the United Statesfor each year. (See Pryor, Hurtado, Saenz, Santos, & Korn, 2007, for infor-mation on the weighting scheme, validity, and reliability.)
The regression analyses provided insight into the predictive power of keyvariables (described in the next section on measures) in men’s and women’scomputer science major plans and focused on five specific years of survey data:1976, 1986, 1996, 2006, and 2011. These years were selected because they con-tained the most consistent set of survey items at evenly spaced decade (and half-decade) intervals. The unweighted regression sample from across these 5 years wascomposed of 18,830 students intending to major in computer science (4,127women and 14,703 men) and 904,307 students (495,397 women and 408,910men) from all other majors.
Measures
Men’s and women’s self-reported plans to major in computer science (vs. allother majors) served as the dependent variable in this study. Given that thisstudy was focused on how the determinants of aspiring to a computer sciencemajor have shifted over the years, time served as a key independent variablein this study. Time was operationalized as a continuous year variable.
Additional independent variables were selected in line with Lent et al.’s(1994) MCRCB. They were placed into temporally sequenced blocks to bestunderstand predictors of enrollment into computer science. A series ofcorrelations and factor analyses were conducted to narrow the list of vari-ables to those that were most conceptually and statistically interesting inunderstanding how students make plans about their college major. Onlyvariables that were collected across each of the 5 years (1976, 1986, 1996,2006, 2011) were included in this analysis. Drawn from the CIRP FreshmanSurvey, the final set of 41 variables was categorized into eight blocks.
The blocks reflected constructs from the MCRCB to the extent possible by thevariables available in the data set.2 These blocks included: personal characteristics,background contexts, learning experiences, self-efficacy, outcome expectations, inter-ests, contextual influences, and choice goals. Personal characteristics and backgroundcontexts included variables that likely influence the development of career ideasduring one’s life span. High school grade point average fit under learning experi-ences as it represents the culmination of academic performance. Self-efficacy wasmost closely represented by math self-concept because a measure of computingself-efficacy was not available.Outcome expectations variables represent indicatorsof expected success or persistence in their major field. Interest variables representvarious goals and orientations that may encourage or discourage pursuit of a
THE JOURNAL OF HIGHER EDUCATION 9

specific academic path. Contextual influences (e.g., financial concerns, distancefromhome, institutional type) impact the perceived availability ofmajor choices orprograms and/or reflect environments that could influence the need for someindividuals to select future careers or majors based on their current economicsituation or other external needs. Under choice goals, degree type and careeraspiration goals represent broad motivators that could influence individuals toselect certain STEM or non-STEM majors. The dependent variable—intent tomajor in computer science—is also a career-related goal but is separate from theother goals because it is more proximal to the choice action of actually declaring acomputer science major. The complete list of independent variables used for theregression analysis, along with their coding schemes, is provided in Appendix A.
Factor analysis proceduresThe research team conducted factor analysis using principal axis factoringwith Promax rotation to determine what factors would be used for theregression analysis. Previously constructed factors from A. W. Astin’s(1993) model of student types as well as Sax’s (2008) typology and collegechoice factors guided factor analysis. Of the 65 independent variables con-sidered, seven factors were created. (See Appendix B for a list of factors, theirloadings, and reliability.) The threshold for reliability was set at a Cronbach’salpha of .65,3 and variables were only considered valid for inclusion in afactor if they loaded at .40 or higher (ultimately, all loadings exceeded .60).
Data analysis
Research Question 1 examined how the gender gap in incoming students’intent to major in computer science has changed since 1971. To address thisquestion, the 40-year trends were used to compare the proportions of menand women who reported plans to major in computer science on the CIRPFreshman Survey. We also reported long-term trends in the fraction of allcomputer science majors who were women.
Research Question 2 examined the determinants of intending to major incomputer science and explored if these determinants and/or their predictivepower have changed over time. To answer this research question, logistic regres-sion analyses were conducted separately by gender across the 5-year data set (i.e.,1976, 1986, 1996, 2006, and 2011) to predict the likelihood of incoming collegestudents planning to pursue computer science as their major (vs. all other majors).First, the model was run with all 41 variables to determine which variables werestatistically significant (p < .001). Those variables that were not significant foreither gender were removed from the model. Then, the logistic regressions werererun with the remaining variables, using identical models for women and men.Finally, Year × Variable interaction terms were added to identify if and how thesalience of each variable changed over time for each gender.
10 L. J. SAX ET AL.
Research Question 3 examined the extent to which the gender gap in computerscience major aspirations is due to gender differences in the attributes of under-graduate women and men versus gender differences in the salience of theseattributes and how this has changed over time. To answer this research question,we employed the regression-based decomposition technique designed for non-linear models (Fairlie, 2005). Decomposition analysis uses regression and meanreplacement to better understand how populations change over time and has beenused in research on gender and STEM careers (Xie & Shauman, 2003). This studyutilized the Blinder-Oaxaca decomposition technique, a well-knownmethod usedto identify the unique contributions of group differences to observed outcomegaps (e.g., those based on gender or race; Blinder, 1973; Fairlie, 2005; Oaxaca,1973). More specifically, the technique decomposed the group difference in anoutcome into: (a) the part attributable to differences in average characteristicsbetween the groups and (b) the part attributable to the group differences in thesalience (coefficient) of the characteristics (as well as residual errors in the modeldue to bias from omitted variables). Respectively, these decompositions are oftencalled the “explained” and “unexplained” portions of the gap.
The standard Blinder-Oaxaca decomposition cannot be directly used whenthe outcome measure is binary, such as selection of a computer science major(Fairlie, 2005). Therefore, we turned to the nonlinear extension of the Blinder-Oaxaca decomposition written by Fairlie (2005), which can handle decomposi-tion for binary outcomes, especially when the outcome is extreme (i.e., notlocated near the middle of distribution). Further, although decomposition canbe performed from the “perspective” of one group or another (e.g., choosingeither male or female as a base group), this study followed the suggestion byOaxaca and Ransom (1994) and used coefficient estimates from a pooled sampleof the two gender groups.
Results
Trends over time
Results from Research Question 1 revealed clear trends in men’s and women’sintent to major in computer science from 1971 to 2011 (see Figure 2). Across allyears, men were more likely than women to major in computer science, thoughinterest in this field fluctuated over time for both genders. Intent to major incomputer science grew substantially from the field’s nascency in the early 1970s(when it attracted only 0.85% of women and 1.3% of men in 1971) and spiked forboth genders in the early 1980s (reaching 6.7% of women in 1982 and 9.4% ofmenin 1983). However, interest in computer science quickly diminished during thenext decade as it declined to 1.5% of women and 3.3% of men by 1990. Renewedinterest in computer science was again evident in the mid-to-late 1990s (duringthe dot-com boom); however, this resurgence occurred almost exclusively for
THE JOURNAL OF HIGHER EDUCATION 11
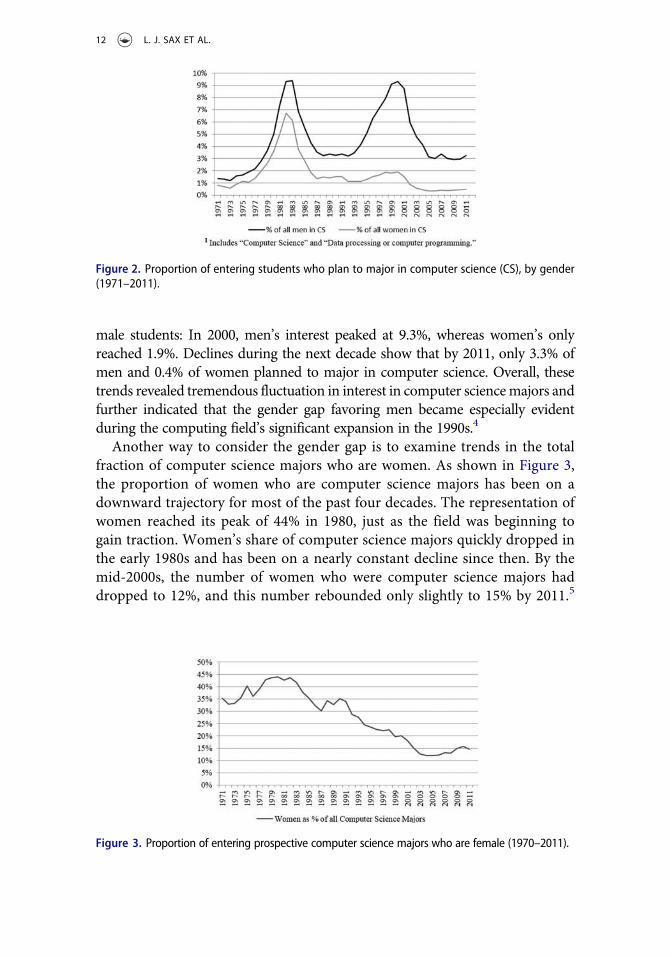
male students: In 2000, men’s interest peaked at 9.3%, whereas women’s onlyreached 1.9%. Declines during the next decade show that by 2011, only 3.3% ofmen and 0.4% of women planned to major in computer science. Overall, thesetrends revealed tremendous fluctuation in interest in computer sciencemajors andfurther indicated that the gender gap favoring men became especially evidentduring the computing field’s significant expansion in the 1990s.4
Another way to consider the gender gap is to examine trends in the totalfraction of computer science majors who are women. As shown in Figure 3,the proportion of women who are computer science majors has been on adownward trajectory for most of the past four decades. The representation ofwomen reached its peak of 44% in 1980, just as the field was beginning togain traction. Women’s share of computer science majors quickly dropped inthe early 1980s and has been on a nearly constant decline since then. By themid-2000s, the number of women who were computer science majors haddropped to 12%, and this number rebounded only slightly to 15% by 2011.5
Figure 2. Proportion of entering students who plan to major in computer science (CS), by gender(1971–2011).
Figure 3. Proportion of entering prospective computer science majors who are female (1970–2011).
12 L. J. SAX ET AL.
Logistic regression results
Research Question 2 examined which student characteristics predict men’sand women’s intent to major in computer science and tested whether thesalience of these predictors has changed over time. Of the 41 variablesincluded in the initial regression, 38 emerged as significant (p < .001) foreither women or men; these 38 variables were included in the final logisticregression models run separately by gender.
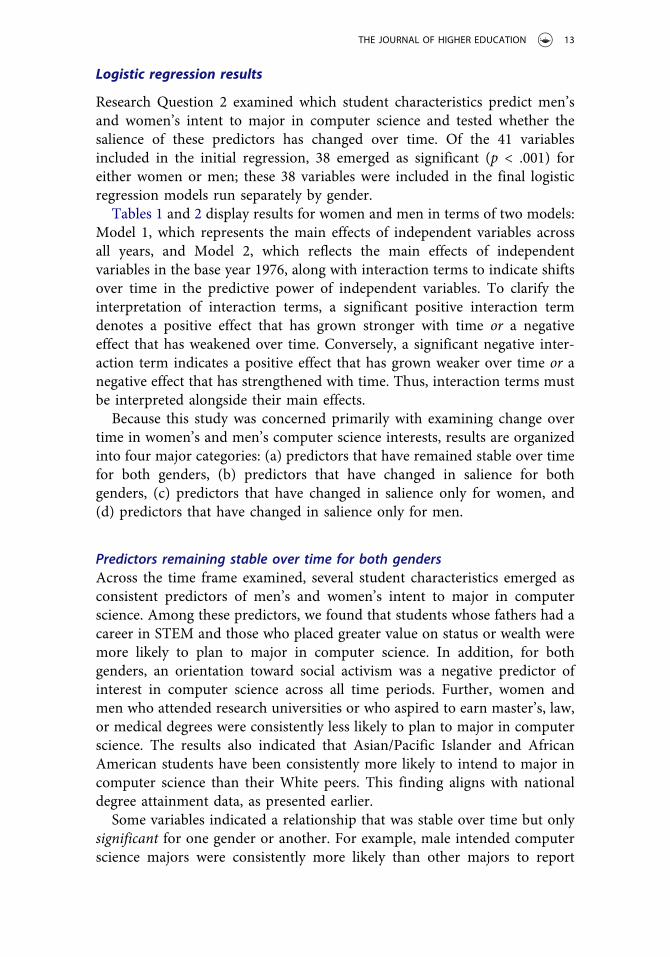
Tables 1 and 2 display results for women and men in terms of two models:Model 1, which represents the main effects of independent variables acrossall years, and Model 2, which reflects the main effects of independentvariables in the base year 1976, along with interaction terms to indicate shiftsover time in the predictive power of independent variables. To clarify theinterpretation of interaction terms, a significant positive interaction termdenotes a positive effect that has grown stronger with time or a negativeeffect that has weakened over time. Conversely, a significant negative inter-action term indicates a positive effect that has grown weaker over time or anegative effect that has strengthened with time. Thus, interaction terms mustbe interpreted alongside their main effects.
Because this study was concerned primarily with examining change overtime in women’s and men’s computer science interests, results are organizedinto four major categories: (a) predictors that have remained stable over timefor both genders, (b) predictors that have changed in salience for bothgenders, (c) predictors that have changed in salience only for women, and(d) predictors that have changed in salience only for men.
Predictors remaining stable over time for both gendersAcross the time frame examined, several student characteristics emerged asconsistent predictors of men’s and women’s intent to major in computerscience. Among these predictors, we found that students whose fathers had acareer in STEM and those who placed greater value on status or wealth weremore likely to plan to major in computer science. In addition, for bothgenders, an orientation toward social activism was a negative predictor ofinterest in computer science across all time periods. Further, women andmen who attended research universities or who aspired to earn master’s, law,or medical degrees were consistently less likely to plan to major in computerscience. The results also indicated that Asian/Pacific Islander and AfricanAmerican students have been consistently more likely to intend to major incomputer science than their White peers. This finding aligns with nationaldegree attainment data, as presented earlier.
Some variables indicated a relationship that was stable over time but onlysignificant for one gender or another. For example, male intended computerscience majors were consistently more likely than other majors to report
THE JOURNAL OF HIGHER EDUCATION 13

Table 1. Logistic regression predicting intent to major in computer science (compared to allother majors) among women across years (n = 499,524).
Model 1 Model 2
Variables b SE Ex(B) b SE Exp(B)
Year (continuous) −0.311 0.015 0.733 0.877 0.161 2.404Personal characteristicsReligion (vs. Protestant)Catholic 0.032 0.041 1.033 0.050 0.090 1.052Jewish 0.123 0.108 1.131 −0.476 0.232 0.621Other 0.464 0.050 1.591 0.345 0.125 1.413No religion 0.147 0.051 1.158 0.035 0.122 1.036
Race (vs. White)Other/Multi 0.394 0.073 1.483 0.501 0.200 1.650Asian/Pacific Islander 0.758 0.062 2.133 0.907 0.160 2.478Black 1.267 0.060 3.551 1.139 0.136 3.123Latino/a 0.694 0.086 2.002 1.391 0.223 4.018Political views 0.021 0.023 1.021 0.076 0.054 1.079
Background contextsMother’s education −0.051 0.010 0.951 −0.076 0.022 0.927Family income −0.107 0.014 0.898 −0.222 0.031 0.801Father’s career: STEM 0.342 0.041 1.407 0.136 0.095 1.145
Learning experiencesHigh school GPA −0.006 0.013 0.994 0.116 0.030 1.123
Self-efficacySelf-rating: math ability 0.747 0.020 2.111 1.092 0.046 2.979Leader (factor) −0.248 0.020 0.781 −0.029 0.046 0.971Scholar (factor) 0.041 0.023 1.041 −0.236 0.051 0.789
Outcome expectationsFuture act: change major field 0.058 0.018 1.060 0.120 0.039 1.128Future act: make at least a ‘B’ avg. 0.051 0.030 1.052 0.176 0.067 1.192
InterestsGoal: meaningful philosophy −0.029 0.019 0.971 −0.093 0.042 0.911Goal: theoretical scientific contrib. 0.303 0.020 1.354 0.141 0.046 1.152Goal: raising a family −0.091 0.017 0.913 0.104 0.038 1.110Social activist (factor) −0.331 0.023 0.718 −0.189 0.052 0.827Artistic (factor) −0.160 0.020 0.852 −0.393 0.047 0.675Status striver (factor) 0.192 0.019 1.212 0.154 0.044 1.166Educational reasons for college (factor) −0.097 0.018 0.908 −0.158 0.040 0.854Extrinsic reasons for college (factor) 0.229 0.021 1.258 0.305 0.046 1.356
Contextual influences proximal to choice behaviorDistance of institution from home −0.030 0.013 0.970 −0.001 0.029 0.999Number of institutions applied to −0.010 0.008 0.990 0.046 0.021 1.047Student-to-faculty ratio 0.007 0.004 1.008 0.020 0.011 1.020Institutional type: university −0.277 0.041 0.758 −0.451 0.090 0.637Institutional type: religious −0.247 0.059 0.781 −0.032 0.136 0.969Institutional Type: HBCU 0.194 0.085 1.214 0.115 0.189 1.122Institutional control: public 0.036 0.053 1.036 0.493 0.125 1.637
Choice goalsDegree aspirations (vs. BA)PhD −0.837 0.055 0.433 −0.723 0.131 0.485Law degree −1.699 0.155 0.183 −2.311 0.383 0.099Medical degree −3.093 0.149 0.045 −3.189 0.369 0.041Master’s degree/MDiv −0.242 0.036 0.785 −0.260 0.079 0.771
Interaction termsCatholic × Time −0.019 0.033 0.981Jewish × Time 0.233 0.078 1.263Other × Time 0.038 0.047 1.039
(Continued )
14 L. J. SAX ET AL.
more liberal political views, to expect that they will earn at least a “B” averagein college, and to attend college closer to home. Further, they were less likelythan men in other majors to identify as Catholic and more likely to indicateno religious preference. None of these variables were significant for womenat any time point; the one stable predictor for women (that has no predictivepower for men) was attending college for educational reasons, which con-sistently predicted women’s plans not to major in computer science.
Predictors changing in salience for both gendersMore than half of the variables predicting computer science major intentionsrevealed effects that have become more or less salient over time, with some
Table 1. (Continued).Model 1 Model 2
Variables b SE Ex(B) b SE Exp(B)
No Religion × Time 0.033 0.038 1.033Other/Multi × Time −0.038 0.057 0.963Asian/Pacific Islander × Time −0.044 0.049 0.957Black × Time 0.049 0.046 1.050Latino/a × Time −0.194 0.068 0.824Political Views × Time −0.025 0.018 0.975Mother’s Education × Time 0.008 0.007 1.009Family Income × Time 0.045 0.011 1.046Father’s Career: STEM × Time 0.074 0.031 1.077High School GPA × Time −0.050 0.011 0.951Self-Rating: Math Ability × Time −0.131 0.015 0.877Leader (factor) × Time −0.079 0.015 0.924Scholar (factor) × Time 0.100 0.017 1.105Future Act: Change Major Field × Time −0.023 0.014 0.977Future Act: Make “B” Average × Time −0.048 0.023 0.953Goal: Meaningful Philosophy × Time 0.022 0.014 1.023Goal: Theoretical Scientific Contribution × Time 0.060 0.015 1.062Goal: Raising a Family × Time −0.073 0.013 0.929Social Activist (factor) × Time −0.054 0.017 0.948Artistic (factor) × Time 0.083 0.015 1.086Status Striver (factor) × Time 0.017 0.015 1.017Educational Reasons for College (factor) × Time 0.025 0.014 1.025Extrinsic Reasons for College (factor) × Time −0.030 0.016 0.971Distance of Institution From Home × Time −0.014 0.010 0.986Number of Institutions Applied To × Time −0.017 0.006 0.983Student-to-Faculty Ratio × Time −0.004 0.004 0.996Institutional Type: University × Time 0.071 0.033 1.074Institutional Type: Religious × Time −0.071 0.046 0.931Institutional Type: HBCU × Time 0.060 0.063 1.062Institutional Control: Public × Time −0.169 0.042 0.845PhD × Time −0.029 0.043 0.972Law × Time 0.227 0.119 1.255Medical Degree × Time 0.044 0.116 1.045Master’s Degree/MDiv × Time 0.017 0.028 1.017
Note. Bold indicates p < .001. STEM = science, technology, engineering, and math; GPA = grade point average;HBCU = Historically Black Colleges and Universities.
THE JOURNAL OF HIGHER EDUCATION 15
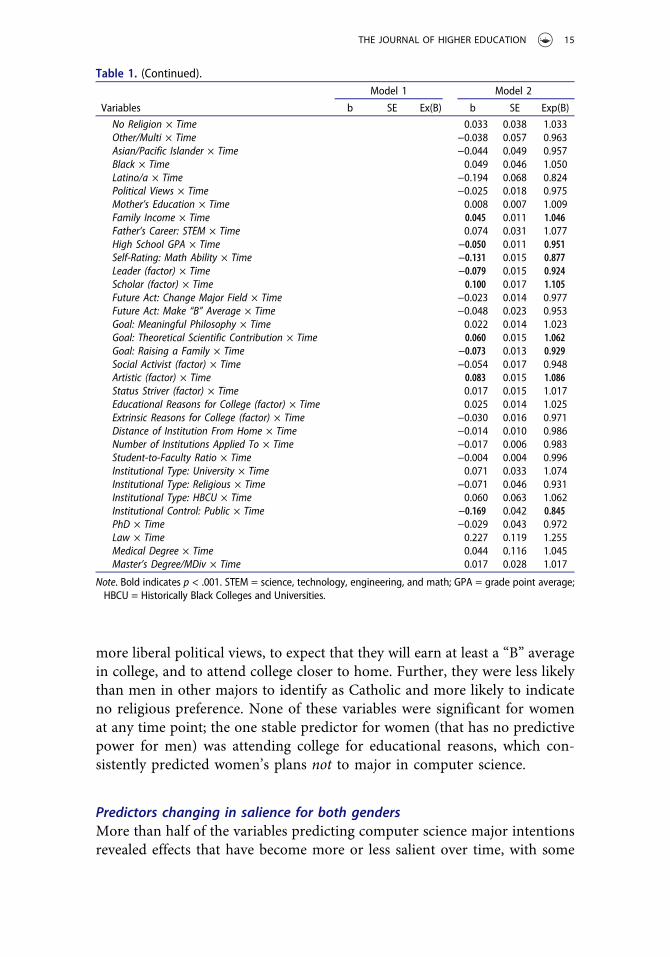
Table 2. Logistic regression predicting intent to major in computer science (compared to allother majors) among men across years (n = 423,613).
Model 1 Model 2
Variables b SE Ex(B) b SE Ex(B)
Year (continuous) 0.029 0.007 1.030 0.640 0.080 1.896Personal characteristicsReligion (vs. Protestant)Catholic −0.128 0.023 0.880 −0.117 0.056 0.889Jewish 0.095 0.052 1.100 −0.080 0.123 0.923Other 0.258 0.032 1.294 0.245 0.082 1.277No religion 0.097 0.024 1.102 0.090 0.065 1.095
Race (vs. White)Other/Multi 0.092 0.037 1.097 0.530 0.111 1.699Asian/Pacific Islander 0.243 0.035 1.276 0.468 0.105 1.596Black 0.458 0.044 1.580 0.766 0.112 2.151Latino/a 0.025 0.051 1.025 0.882 0.155 2.415Political views 0.051 0.011 1.052 −0.018 0.029 0.982
Background contextsMother’s education 0.010 0.005 1.010 0.052 0.013 1.054Family income −0.131 0.007 0.877 −0.190 0.018 0.827Father’s career: STEM 0.239 0.022 1.270 0.147 0.057 1.158
Learning experiencesHigh school GPA −0.036 0.007 .965 0.016 0.017 1.016
Self-efficacySelf-rating: math ability 0.344 0.011 1.410 0.480 0.029 1.616Leader (factor) −0.369 0.010 0.691 −0.190 0.027 0.827Scholar (factor) 0.141 0.012 1.151 −0.006 0.031 0.994
Outcome expectationsFuture act: change major field −0.220 0.010 0.803 −0.124 0.026 0.883Future act: make at least a ‘B’ avg. 0.075 0.016 1.078 0.154 0.042 1.167
InterestsGoal: meaningful philosophy −0.050 0.010 0.951 −0.202 0.026 0.817Goal: theoretical scientific contribution 0.368 0.010 1.445 0.336 0.027 1.399Goal: raising a family −0.043 0.010 0.958 0.107 0.025 1.113Social activist (factor) −0.355 0.012 0.701 −0.327 0.031 0.721Artistic (factor) −0.049 0.010 0.952 −0.025 0.028 0.976Status striver (factor) 0.087 0.011 1.091 0.018 0.028 1.018Educational reasons for College (factor) 0.008 0.009 1.009 −0.010 0.023 0.990Extrinsic reasons for College (factor) 0.138 0.011 1.148 0.275 0.027 1.316
Contextual influences proximal to choice behaviorDistance of institution from home −0.055 0.007 0.946 −0.057 0.018 0.945Number of institutions applied to −0.022 0.004 0.978 0.058 0.012 1.060Student-to-faculty ratio 0.017 0.002 1.017 0.026 0.006 1.027Institutional type: university −0.323 0.022 0.724 −0.345 0.055 0.708Institutional type: religious −0.239 0.032 0.788 0.090 0.083 1.094Institutional type: HBCU −0.024 0.069 0.976 0.010 0.167 1.010Institutional control: public −0.100 0.028 0.905 0.207 0.071 1.229
Choice goalsDegree aspirations (vs. BA)PhD −0.593 0.028 0.553 −0.280 0.071 0.756Law degree −1.825 0.094 0.161 −2.022 0.223 0.132Medical degree −2.816 0.082 0.060 −2.735 0.198 0.065Master’s degree/MDiv −0.194 0.020 0.823 −0.072 0.051 0.930
Interaction termsCatholic × Time −0.009 0.017 0.991Jewish × Time 0.048 0.038 1.049Other × Time −0.007 0.026 0.993
(Continued )
16 L. J. SAX ET AL.

indicating shifts for both genders. For example, interaction terms revealedthat having a scholarly orientation (i.e., a high degree of academic andintellectual self-confidence) was increasingly predictive of computer sciencemajor aspirations for both women and men. Further, men and women withorientations toward leadership or toward raising a family were increasinglydisinclined to intend to major in computer science.
However, two noteworthy predictors actually weakened in salience overtime: students’ mathematical self-concept and family income. While mathe-matical self-rating continued to be a significant positive predictor of planningto major in computer science, its predictive power became significantlyweaker over time. Family income was negatively associated with the intent
Table 2. (Continued).Model 1 Model 2
Variables b SE Ex(B) b SE Ex(B)
No Religion × Time −0.007 0.018 0.993Other/Multi × Time −0.123 0.030 0.884Asian/Pacific Islander × Time −0.065 0.029 0.937Black × Time −0.099 0.033 0.906Latino/a × Time −0.234 0.042 0.791Political Views × Time 0.023 0.009 1.023Mother’s Education × Time −0.015 0.004 0.985Family Income × Time 0.021 0.006 1.021Father’s Career: STEM × Time 0.029 0.017 1.030High School GPA × Time −0.018 0.005 0.982Self-Rating: Math Ability × Time −0.042 0.008 0.959Leader (factor) × Time −0.056 0.008 0.946Scholar (factor) × Time 0.043 0.009 1.044Future Act: Change Major Field × Time −0.031 0.008 0.969Future Act: Make “B” Average × Time −0.023 0.012 0.977Goal: Meaningful Philosophy × Time 0.050 0.008 1.051Goal: Theoretical Scientific Contribution × Time 0.010 0.008 1.010Goal: Raising a family × Time −0.050 0.007 0.952Social Activist (factor) × Time −0.007 0.009 0.993Artistic (factor) × Time −0.010 0.008 0.990Status Striver (factor) × Time 0.022 0.008 1.022Educational Reasons for College (factor) × Time 0.006 0.007 1.006Extrinsic Reasons for College (factor) × Time −0.045 0.008 0.956Distance of Institution From Home × Time −0.002 0.005 0.998Number of Institutions Applied to × Time −0.022 0.003 0.978Student-to-Faculty Ratio × Time −0.003 0.002 0.997Institutional Type: University × Time 0.015 0.017 1.015Institutional Type: Religious × Time −0.104 0.025 0.902Institutional Type: HBCU × Time −0.006 0.049 0.994Institutional Control: Public × Time −0.096 0.021 0.908PhD × Time −0.100 0.021 0.904Law × Time 0.068 0.067 1.070Medical Degree × Time −0.026 0.060 0.975Master’s Degree/MDiv × Time −0.041 0.015 0.960
Note. Bold indicates p < .001. STEM = science, technology, engineering, and math; GPA = grade pointaverage; HBCU = Historically Black Colleges and Universities.
THE JOURNAL OF HIGHER EDUCATION 17
to major in computer science for both women and men, but this relationshipdiminished in strength for both genders.
The predictive power of high school academic achievement also changedin salience for both genders but in slightly different ways. For men, thenegative predictive power of high school grades became stronger over time,suggesting that computer science has attracted increasingly lower-achievingmen. For women, though main effects of high school grades across all yearswere not significant, Model 2 revealed that high school grades positivelypredicted the selection of computer science in 1976 (base year), but thatrelationship became weaker over time.
Predictors changing in salience only for womenTwo variables evidenced a changing salience that was observed only forwomen. First, the variable of having a scientific orientation became an evenstronger positive predictor among women. In other words, having a com-mitment to scientific inquiry is now more strongly associated with women’sintent to major in computer science than it was in prior decades. On theother hand, one variable that consistently detracted from interest in com-puter science—students’ artistic orientation—became a weaker predictoramong women. This latter finding revealed that women who view them-selves as creative and artistic are now less likely to be deterred fromcomputer science.
Predictors changing in salience only for menSeveral variables revealed a strengthening or weakening in predictive poweronly for men. Among them, we found that men were increasingly less likelyto select computer science as their probable major if they applied to a greaternumber of colleges, or aspired to earn a Ph.D. Men who expected to changetheir major field were also increasingly less likely to plan to major incomputer science, suggesting that with time, male computer science majorshave become more committed to their choice of major. Male intendedcomputer science majors were also increasingly less likely to be found atpublic or religiously affiliated institutions.
Some variables became less salient over time for men only.Specifically, computer science historically attracted men who were lessinterested in developing a meaningful philosophy of life and moreinterested in college for its extrinsic benefits (i.e., better job and moremoney). However, these longstanding relationships became significantlyweaker over time, suggesting that men with more philosophical and lesspecuniary orientations became less likely to be deterred from majoringin computer science.
18 L. J. SAX ET AL.

Regression decomposition results
Whereas Research Question 2 focused on the predictors of computerscience major intentions for women and men, Research Question 3focused on the determinants of the gender gap itself. During the yearsused in the multivariate analysis (1976, 1986, 1996, 2006, and 2011), thegender gap among computer science majors (i.e., the difference in thepercentage of students from each gender selecting this major) fluctuatedfrom a low of 1% in 1976 to a high of 5% in 1996. For each year, Table 3shows the proportion of the gap that is attributable to differences in themean observable characteristics of women and men who identified com-puter science as their probable major (explained portion) versus genderdifferences in the salience of the variables that predicted computerscience major plans (unexplained portion).6 For example, in 1976, theexplained portion was 78.7% and the unexplained portion was 21.3%. Inother words, approximately 79% of the gender gap in the intent to majorin computer science could be explained by the fact that men and womendiffered in observable measures such as self-rated mathematical abilityand SAT math scores. The rest of the gender gap (approximately 21%)could be considered attributable to gender differences in the extent towhich the observable measures predicted computer science major plans.
In the years subsequent to 1976, the gender gap became primarilyattributable to gender differences in the predictive power of studentcharacteristics. Specifically, in 1986, 1996, 2006, and 2011, the unex-plained portion of the gender gap (approximately 56%–65%) in compu-ter science major intentions remained because women and men differedin the salience of the variables that predicted computer science majorplans. In other words, even if women and men had equivalent scores onkey predictors of intending to major in computer science (e.g., self-ratedmath ability), more than half of the gender gap would remain.
Table 4 provides additional detail on this explained portion by show-ing the proportion of the overall gap that is due to gender differences inspecific student characteristics. In other words, these percentages areestimates of the portion of the overall gender gap that would havebeen eliminated if men and women were (on average) the same ingiven characteristics. Most of the time, the percentage is indicated as a
Table 3. Decomposition of gender gap in intent to major in computer science.1976 (%) 1986 (%) 1996 (%) 2006 (%) 2011 (%)
Explained 78.7 44.0 39.1 35.5 34.9Unexplained 21.3 56.0 60.9 64.5 65.1Total gap 100.0 100.0 100.0 100.0 100.0
THE JOURNAL OF HIGHER EDUCATION 19

Table 4. Detailed regression decomposition of intent to major in computer science, by year.1976
(N = 168,787)1986
(N = 151,474)1996
(N = 201,665)2006
(N = 237,334)2011
(N = 170,096)
Total difference .008 .024 .047 .025 .025Unexplained .002 .014 .028 .016 .017Explained .006 .011 .018 .009 .009Personal characteristicsReligion (vs. Protestant) % of total % of total % of total % of total % of totalCatholic −0.20 −0.01 0.17 0.06 0.16Jewish −0.01 −0.01 0.18 −0.01 0.04Other 0.05 −1.41 0.09 −0.03 −0.06No religion −0.66 0.90 0.57 0.67 1.06
Race (vs. White)Other/Multi 0.08 0.05 −0.08 −0.02 −0.03Asian/Pacific Islander 0.14 0.62 0.52 0.00 −0.06Black −10.80 −5.47 −1.18 −1.07 −0.82Latino/a 0.21 −0.06 −0.08 −0.05 0.00Political Views −0.28 −0.44 0.38 −0.17 −0.37
Background contextsMother’s education −0.30 −0.56 −0.04 0.35 0.21Family income −3.97 −2.59 −0.90 −1.79 −0.61Father’s career: STEM 0.24 0.57 0.23 0.35 0.25
Learning experiencesHigh school GPA −1.20 1.86 3.00 3.24 1.56
Self-efficacySelf-rating: math ability 78.64 32.00 14.43 13.13 13.12Leader (factor) −4.00 −5.08 −2.39 0.55 −1.26Scholar (factor) −4.46 1.47 3.97 2.41 4.73
Outcome ExpectationsFuture act: changemajor field
0.01 0.70 0.43 −0.12 −0.20
Future act: make at leasta “B” average
0.11 0.31 0.08 −0.02 −0.01
InterestsGoal: meaningfulphilosophy
0.64 0.10 −0.02 −0.12 −0.02
Goal: theoreticalscientific contribution
12.01 14.88 6.38 4.44 5.21
Goal: raising a family −0.10 0.16 −0.04 0.60 0.16Social activist (factor) 6.62 6.85 9.54 8.53 8.56Artistic (factor) 8.61 1.35 0.14 1.37 1.29Status striver (factor) 0.19 0.99 2.67 0.35 0.57Educational reasons forcollege (factor)
8.71 2.67 1.85 1.92 1.03
Extrinsic reasons forcollege (factor)
5.33 1.31 0.77 0.41 0.21
Contextual influences proximalto choice behaviorDistance of institutionfrom home
−0.15 −1.22 −0.41 −0.42 −0.22
Number of institutionsapplied to
1.41 −0.35 −0.04 0.21 0.31
Student-to-faculty ratio 0.33 −0.17 −0.03 0.03 0.02Institutional type:university
−1.79 −2.33 −0.84 −1.04 −1.21
Institutional type:religious
2.71 0.32 0.38 1.74 2.48
(Continued )
20 L. J. SAX ET AL.

positive number (i.e., the gender gap in plans to pursue the computerscience major is attributable in part to men’s and women’s differingmeans on a particular variable). However, occasionally, the percentage isnegative, which indicates that the gender gap in computer science wouldhave been even larger if not for gender differences in the characteristic.7
Over time, three variables stood out as the most prominent explana-tions for the gender gap in computer science (i.e., those that account forat least 5% of the overall gap). The first, and by far the most important,variable was students’ self-rated math ability. Women’s tendency to ratethemselves lower than men on their mathematical skills was the primaryexplanation for the gender gap in computer science, though its saliencehas weakened over time; in 1976, gender differences in math self-ratingaccounted for 78.6% of the computer science gender gap, whereas by2011, it explained only 13.1% of the computer science gender gap(though it remained the top explanatory variable).
The second key variable from the decomposition analysis was students’commitment to making “a theoretical contribution to science.” Womentended to place less value on this goal than did men, a difference thataccounted for 4.4% to 14.9% of the gender gap in students’ computer sciencemajor intentions.
The third prominent explanation for the gender gap in computer sciencemajor aspirations was students’ commitment to social activism. The fact thatwomen placed greater value on social activism (i.e., helping others in diffi-culty and influencing social values) explained 6.6% to 9.5% of the gender gapin computer science. Many other variables in Table 4 were consideredstatistically significant determinants of the gender gap in computer science,but they either represented only a very small portion of the explanation ortheir salience diminished over time.
Table 4. (Continued).
1976(N = 168,787)
1986(N = 151,474)
1996(N = 201,665)
2006(N = 237,334)
2011(N = 170,096)
Institutional type: HBCU −2.26 −0.14 −0.14 0.09 −0.18Institutional control:public
1.65 0.26 −0.20 −0.83 −0.93
Choice goalsDegree aspirations (vs. BA)PhD −5.72 −2.23 −0.67 −0.17 −1.05Law degree −5.14 0.41 0.01 −0.02 −0.10Medical degree −7.48 −1.28 0.19 0.98 0.78Master’s and MDivdegree
−0.43 −0.43 0.20 −0.07 0.26
Note. Bold indicates p < .001. STEM = science, technology, engineering, and math; GPA = grade pointaverage; HBCU = Historically Black Colleges and Universities.
THE JOURNAL OF HIGHER EDUCATION 21

Limitations
This study builds on previous research and contributes to the knowledge baseabout the gender gap in computer science and how this gap has changed overtime. However, we acknowledge some important limitations. First, the sam-ple for this study included only first-time, full-time students entering 4-yearcolleges and universities and thus excluded community college students. Thisis an important area for future research given that community colleges enrolla higher proportion of nontraditional students (e.g., older, low-income,female, racial/ethnic-minority) than do 4-year institutions, and the commu-nity college is a key pathway for women and underrepresented studentspursuing STEM education (Berger & Malaney, 2003; Mooney & Foley,2011; Starobin & Laanan, 2005).
Additionally, the dependent variable only considered students’ intention tomajor in computer science upon entry to college. On the survey instrument,incoming college students were asked to identify their “probable field ofstudy” and could indicate only one major field. However, we do not knowif the intended computer science majors in our sample ultimately majored inthat field or continued on to complete a computer science degree. For thepurposes of this study, we included students who planned to major in either“computer science” or “data processing or computer programming” to beinclusive of all students intending to major in a computing field. However,we acknowledge that there may be distinct differences between the types ofstudents who selected these choices. Additionally, in the early years of ourstudy’s time frame, some students who planned to study computer sciencemay have identified under another major, such as mathematics, and thereforemay not be fully represented.8
The use of five distinct time points (i.e., 1976, 1986, 1996, 2006, and 2011)also presented challenges. First, because we limited our variables to thosesurvey items that were available for all five time points, we were not able toinclude all variables thought to be important to computer science majorselection (e.g., gender-role socialization, math and science coursework inhigh school). Second, our study may have failed to capture fluctuations inthe gender gap in the years in between our chosen time points. Additionally,the time variable was coded such that we were unable to capture nonlinearchanges in salience of relevant variables (i.e., some variables could haveincreased or decreased at an uneven pace). Finally, the most recent timepoint available for the variables used in this study was 2011; more recent dataregarding degree completion indicates that computer science has increased inpopularity since 2011 (NCES, 2014). Hence, future research should continueto consider the most recent data available to capture these emerging trends.
Finally, there were some important limitations to our use of SCCT as itapplied to the data for this study. First, self-efficacy figures prominently in
22 L. J. SAX ET AL.

SCCT, and Bandura (2006) argued that self-efficacy is most reliable as apredictor when it captures beliefs about performance within a specificdomain. Though a measure of self-efficacy related to performance in thefield of computer science would have been ideal for this study, one was notavailable for all years. However, previous research has shown that math self-concept is an important predictor of students’ plans to major in computerscience and was therefore included instead (Sax et al., 2015). Additionally,SCCT models direct and indirect effects of various factors on choice goals,such as students’ major plans. However, in this study, the methodologicalapproach precluded our ability to examine direct and indirect effects.Therefore, future research on this topic should employ additional techniques,such as structural equation modeling.
Summary and discussion
This study documents the ebb and flow of male and female intendedcomputer science majors over a 40-year period, from 1971 through 2011.By taking into account the historical context during which these shiftsoccurred, it is possible to draw important comparisons between men’s andwomen’s participation in the field in relation to the post-Sputnik computingboom and subsequent decline and then the dot-com boom and accompany-ing “bust.” These results underscore present-day concerns over a shortage oftrained computer scientists by revealing both a significant downturn betweenthe late 1990s and 2011 and a persistent, sizeable underrepresentation ofwomen.
While one may expect fluctuations in students’ career interests as oppor-tunities in the labor market change over time, computer science is note-worthy in that the observed patterns are so markedly different for womenand men, especially in the past two decades. It is important to consider whypatterns of computer science interest would be fairly similar for women andmen in the 1970s and 1980s but would take a different turn in the 1990s andbeyond. As suggested by Ensmenger (2012), in the early days of computerprogramming, computer science was not yet defined as a science but wasbelieved to be more clerical in nature. However, as demand for individualswith programming skills increased, computer science also sought legitimacyas a field, in large part by defining itself as a science. In doing so, computerscience distanced itself from skill sets traditionally thought to be well suitedto women and sought to align itself with other science fields, like engineer-ing, that had strong masculine connotations. Additionally, in the mid-1980s,the narrative around computing became gendered, such that tech companiesand the media portrayed computing as a predominantly male enterprise (e.g.,personal computers were initially marketed as toys for men and boys; Henn,2014). Further, media depictions of computing (e.g., films like Revenge of the
THE JOURNAL OF HIGHER EDUCATION 23
Nerds and Weird Science) emphasized the male computer nerd/geek stereo-type (Henn, 2014). Hence, computer science increasingly became a fieldpredominantly associated with men at the same time that opportunities forcareers in computer programming expanded. Finally, women’s decliningrepresentation in computing during the dot-com “bubble” of the late 1990sis owed in part to an increase in weed-out courses that, although intended tomanage growing enrollments, ultimately discouraged disproportionate num-bers of women from computer science (Aspray, 2016). Research shouldcontinue to investigate broader influences on women’s participation in com-puting, particularly given recent major efforts to make computing moreappealing to young women.
This study also used logistic regression and decomposition to examinepredictors of students’ aspirations to major in computer science, whetherthey differ by gender or have changed over time. Of the 38 independentvariables, 10 reflect attributes of prospective computer science majors thatare the same for women and men and that have remained stable forces forthe past four decades. Among these consistent predictors of majoring incomputer science, a few merit additional consideration and are discussed inturn in the following paragraphs.
First is the persistent negative association between social activist valuesand the pursuit of computing careers; women and men who place greaterimportance on helping others and effecting social change are less likely topursue computer science in college. Other research has also documented thenegative effect of social activist orientations on students’ STEM-relateddecisions, especially among women (Weinberger, 2004; Wilson, 2002).Further, the decomposition analysis showed that women’s relatively strongersocial activist orientation serves as one of the key explanations for the gendergap in computing.
Another stable but noteworthy finding relates to the role of race. Here wefound that for both women and men, being Asian American or AfricanAmerican was associated with a greater likelihood of majoring in computerscience. While the result for Asian students is consistent with longstandingpatterns of racial representation in STEM fields (NCES, 2012), the result forAfrican American students counters a common description of this populationas underrepresented in STEM. This discrepancy is owed to the fact that amongall STEM fields, computer science produces the greatest proportion of AfricanAmerican bachelor’s degree holders at rates even higher than their representa-tion among degree holders from all fields; this is especially true among women,as discussed earlier. Although these results appear to bode well for diversifyingcomputer science, we must also be cognizant of the current trajectory ofAfrican American women’s representation in computer science: The propor-tion of female computer science bachelor’s degree earners who are AfricanAmerican peaked in 2006 at 21.2% but fell steadily to 16.7% by 2012.
24 L. J. SAX ET AL.

Other noteworthy results reflect variables for which salience has changedover time for one or both genders. Of note is the role of students’ goal ofmaking theoretical contributions to science. Across all years, scientific orien-tations positively predicted both men’s and women’s intent to major incomputer science. Although this relationship has become more salient overtime for women, the fact is that women consistently rate their scientific goalslower than men. As the decomposition revealed, women’s consistently lowerscores on this variable are a key explanation for the gender gap amongstudents who plan to major in computer science. Thus, having a strongtheoretical commitment to science encourages students to pursue computerscience, but women’s lower scores on this variable serve to reinforce thegender disparity in computing.
Some regression results revealed positive trends in attracting women to thecomputer science major. For example, we found that although women’stendency toward lower math self-concept than men explained a sizeableportion of the gender gap in intent to major in computer science, the salienceof math self-concept is weakening over time. This shift is especially impor-tant for women because it suggests that having lower confidence in mathabilities is less of a deterrent to their plans to pursue computer science.
Additionally, having an artistic orientation, which our analysis showed is adeterrent to pursuing computer science for both genders, has over timebecome a weaker predictor for women. This finding indicates that womenwho view themselves as creative or artistic are becoming less likely to avoidcomputer science. This trend may due to the increasing applicability of acomputer science degree to the arts in areas such as music, film, or design(Takahashi, 2013), which may appeal to women or provide a new lensthrough which to view computer science. Though we have not yet reacheda point where artistically and creatively oriented students are more inclinedto major in computer science than other fields, for women, there is at least abroadening of the computer science pool to include more artistic and creativetypes than in years past.
Implications
As summarized, the findings of this study suggest that while some of thetraditional explanations for the gender gap in computer science continue tohold true, there are distinctive shifts in who pursues computer science andwhy some students may be particularly interested in or dissuaded from themajor. As scholars, college administrators, policymakers, and the Americanpublic alike seek explanations and solutions for the gender gap in computerscience, the findings from this study have important implications that caninform research and practice.
THE JOURNAL OF HIGHER EDUCATION 25
This study contributes in many ways to existing scholarship and alsoserves as a springboard for future research. First, unlike previous studiesthat have considered STEM fields in the aggregate, this study examined avariety of factors that predict college students’ intention to pursue thecomputer science major specifically. The findings from this study supportsuch an approach, as computer science as a field has nuances that make itdistinct from other STEM fields. For example, we found that computerscience increasingly attracts lower-achieving students, relative to other fields,most notably among men. This finding is interesting given that previousstudies have shown that other STEM fields (such as engineering) tend toattract the highest-achieving students (Sax et al., 2016). Hence, futureresearch should continue to focus its efforts on studying computer scienceseparately from other STEM fields.
Further, this study demonstrates the importance of examining the gendergap in computer science over time. The trend analysis revealed a persistentgender gap that is particularly pronounced at times of major growth in thecomputing industry, an insight that might have been overlooked without theinclusion of longitudinal data. Additionally, by including time elements inboth the logistic regression and decomposition analysis, our analyses showedthat there have been distinct shifts in the type of student, both male andfemale, who considers a degree in computer science and that some of themost important explanations for the gender gap in computer science, notablymath self-confidence, have become markedly less important in recent years.Therefore, future research should continue to look at participation in com-puter science within the context of time.
The findings of this study also support the importance of utilizing social-cognitive career theories, such as SCCT, when studying college major choice(Wang, 2013). Although our intention was not to explicitly test SCCT, ourstudy revealed that math self-concept remained the strongest predictor of thechoice to enroll in computer science, thereby supporting the importance thatSCCT places on self-perceptions and also suggesting the potential to adaptbehaviors by adapting self-beliefs (Lent, 2005). Given that many womendoubt whether they could succeed in a computer science major (Beyeret al., 2004), future studies should utilize the SCCT framework and includespecific measures of self-efficacy related to beliefs in succeeding in the field ofcomputer science.
This study also has important implications for policy and practice, as itcan inform efforts to increase women’s participation in computer science. Ofparticular importance is that the salience of some of the longstandingdeterrents to women’s participation in computing is diminishing.Specifically, two traits that have tended to discourage women from pursuingcomputer science—their weaker math confidence and stronger artistic orien-tations relative to men—are now less predictive of the decision to not major
26 L. J. SAX ET AL.

in computer science. Women’s perceptions of computing may be slowlyevolving to a point where they view computer science in broader terms,perhaps as more welcoming to those who may not fit the traditional “hackergeek” stereotype. Administrators and policymakers who seek to bring morewomen into computer science ought to capitalize on these trends by helpingmore women understand the range of creative opportunities afforded by acomputer science degree, rather than trying to recruit women who sharetraits with men who have traditionally majored in computer science.
Other findings from this study point to a lack of progress in attracting abroader range of women, but they also suggest opportunities to rebrand thefield. For example, women’s underrepresentation in computer scienceremains driven by gender differences in certain value orientations—women’sstronger commitment to social activism and weaker commitment to makingtheoretical contributions to science—with the latter influence gainingstrength over time. To counter these longstanding forces, efforts to attractmore women to computer science will need to highlight the ways in whichthe field positively impacts communities—locally and globally. These effortsmay help to increase interest among women with stronger activist orienta-tions but may also help them to understand the ways in which the fieldcontributes practically, not just theoretically, to improving the world aroundthem.
There are many current efforts to rebrand the field in ways consistent withthe recommendations presented in this article. An example is Google’s MadeWith Code initiative, which seeks to broaden women’s perceptions of com-puting as a means to attract more women to the field. The Made With Codeinitiative strives to show girls and young women that code “can be the mostcreative tool in your toolbox” through a series of online activities thatdemonstrate code’s applicability to art, music, videos, social networks, andsociety at large. Many colleges and universities have also sought to broadenundergraduate students’ perceptions of computer science though new majorsthat bring together computer science with other degree programs, such asinteractive media and digital art. Such efforts are at the heart of the Building,Recruiting, and Inclusion for Diversity (BRAID) Initiative, a programlaunched in the summer of 2014 by Harvey Mudd College and the AnitaBorg Institute. The BRAID Initiative encompasses 15 computer sciencedepartments across the country that are intentionally focusing on ways tomake computer science more attractive to women. BRAID departments areincorporating a variety of initiatives to diversify their departments, such ascreating inclusive classrooms that emphasize the societal benefits of comput-ing and incorporating interdisciplinary curricular pathways to a computerscience degree (e.g., a computer science minor and/or double majors). Eachof these programs seeks to make computer science welcoming to women,
THE JOURNAL OF HIGHER EDUCATION 27
such that more women feel like they belong in the field and can be successfulin a computing career.
Conclusion
Increasing the number of young people who major in computer science isvitally important; recruiting women in particular to computing is essential.Given that jobs in the technology industry are among the highest-paying andfastest-growing (BLS, 2014), increasing women’s participation in computerscience will not only broaden the talent pool in computing but may also helpto close the gender-pay gap (St. Rose, 2010). Further, having more womeninvolved in the development of technology will help make the tools of thefuture more functional for all individuals. This study offers importantinsights to inform policy around women’s participation in computing andprovides a strong foundation on which to base future research. At a timewhen higher education, private companies, nonprofit organizations, and thegovernment are making heavy investments in recruiting more women tocomputing, studies such as this one are crucial to ensuring that these invest-ments are directed appropriately.
Funding
This research was made possible by a grant from the National Science Foundation, HRD#1135727.
Notes
1. National Science Foundation, National Center for Science and Engineering Statistics,special tabulations of U.S. Department of Education, NCES, Integrated PostsecondaryEducation Data System, Completions Survey, 2002–12.
2. Because this study was restricted to the items available in the data set, some of theblocks representing SCCT constructs contain a limited number of variables. Still, SCCTproved useful in informing which variables could influence choice behaviors and theorder in which the existing variables could be organized temporally for the regressionanalysis.
3. We included some factors falling just below this threshold due to prior usage in severalmajor studies (e.g., A. W. Astin, 1993; Sax, 2008).
4. The ebb and flow of men’s and women’s intent to major in computer science mapsdirectly onto national data on degree attainment in computer science, including awidening of the gender gap as computer science degree attainment increased in the1990s (NSF, 2015).
5. National data on computer science degree attainment has shown a similar downwardtrajectory in women’s representation during the past 25 years, and it reached 15% by2011 (NSF, 2015).
6. Bias due to omitted variables also contributes to the unexplained portion, but itsmagnitude cannot be estimated.
28 L. J. SAX ET AL.

7. For instance, self-rated leadership ability explained approximately –5% of the gendergap in 1986. This result can be interpreted to mean that if men and women had equalratings on leadership self-efficacy, the gender gap in intent to major in computerscience would have been 5% larger in that year.
8. Computer science was first listed as a major in the CIRP Freshman Survey in 1970.Data processing or computer programming was later added as a potential major in1973. These two major options remained as part of the Freshman Survey through theendpoint of this study (2011). In more recent years, the field of computer science hasseen the emergence of new areas of study and a splintering of major choice optionsrelated to computing such as computer engineering, computer/management informa-tion systems, and other math and computer science. With the exception of computerengineering, which first appeared in 2002, these major options did not appear on thesurvey until after 2011.
References
Alba, D. (2015, September 9). Finally, you’ll be able to track your period in iOS. Wired.Retrieved from http://www.wired.com/2015/09/finally-youll-able-track-period-ios
Anderson, E. L., & Kim, D. (2006). Increasing the success of minority students in science andtechnology (No. 4). Washington, DC: American Council on Education.
Aspray, W. (2016). Women and underrepresented minorities in computing: A historical andsocial study. Cham, Switzerland: Springer International.
Astin, A. W. (1993). What matters in college? Four critical years revisited. San Francisco, CA:Jossey-Bass.
Astin, H. S., & Sax, L. J. (1996). Developing scientific talent in undergraduate women. In C.Davis, A. Ginorio, C. Hollenshead, B. Lazarus, & P. Rayman (Eds.), The equity equation:Women in science, mathematics, and engineering (pp. 96–121). San Francisco, CA: Jossey-Bass.
Bandura, A. (1989). Social cognitive theory. In R. Vasta (Ed.), Annals of child development:Vol. 6. Six theories of child development (pp. 1–60). Greenwich, CT: JAI.
Bandura, A. (1997). Self-efficacy: The exercise of control. New York, NY: Freeman.Bandura, A. (2006). Guide for constructing self-efficacy scales. In F. Pajares & T. C. Urdan
(Eds.), Self-efficacy beliefs of adolescents (pp. 307–337). Information Age.Berger, J. B., & Malaney, G. D. (2003). Assessing the transition of transfer students from
community colleges to a university. NASPA Journal, 40(4), 1–23. doi:10.2202/1949-6605.1299
Beyer, S., Rynes, K., & Haller, S. (2004). Deterrents to women taking computer sciencecourses. IEEE Technology and Society Magazine, 23(1), 21–28. doi:10.1109/MTAS.2004.1273468
Beyer, S., Rynes, K., Perrault, J., Hay, K., & Haller, S. (2003). Gender differences in computerscience students. ACM SIGCSE Bulletin, 53(1), 49–53. doi:10.1145/611892.611930
Blickenstaff, J. (2005). Women and science careers: Leaky pipeline or gender filter? Genderand Education, 17, 369–386. doi:10.1080/09540250500145072
Blinder, A. S. (1973). Wage discrimination: Reduced form and structural estimates. Journal ofHuman Resources, 8, 436–455. doi:10.2307/144855
Bong, M., & Clark, R. E. (1999). Comparison between self-concept and self-efficacy inacademic motivation research. Educational Psychologist, 34, 139–153. doi:10.1207/s15326985ep3403_1
THE JOURNAL OF HIGHER EDUCATION 29

Bong, M., & Skaalvik, E. M. (2003). Academic self-concept and self-efficacy: How differentare they really? Educational Psychology Review, 15, 1–40. doi:10.1023/A:1021302408382
Bureau of Labor Statistics. (2014). Computer and mathematical occupations. Retrieved fromhttp://www.bls.gov/oes/current/oes150000.htm
Byars-Winston, A. M., Estrada, Y. E., Howard, C. H., Davis, D., & Zalapa, J. (2010). Influenceof social cognitive and ethnic variables on academic goals of underrepresented students inscience and engineering. Journal of Counseling Psychology, 57, 205–218. doi:10.3102/0002831213488622
Carnevale, A. P., Smith, N., & Melton, M. (2011). STEM: Science technology engineeringmathematics. Washington, DC: Georgetown University Center on Education and theWorkforce. Retrieved from http://files.eric.ed.gov/fulltext/ED525297.pdf
Carroll, R. (2014, July 2). Sexism in Silicon Valley: Tinder, the ‘Dave rule’ and tech’s glassceiling. The Guardian. Retrieved from http://www.theguardian.com/technology/2014/jul/02/silicon-valley-sexism-tinder-culture-women-ageism
Chemaly, S. (2016, March 16). The problem with a technology revolution designed primarilyfor men. Quartz. Retrieved from http://qz.com/640302/why-is-so-much-of-our-new-technology-designed-primarily-for-men
Cheryan, S., Plaut, V. C., Davies, P. G., & Steele, C. M. (2009). Ambient belonging: Howstereotypical cues impact gender participation in computer science. Journal of Personalityand Social Psychology, 97, 1045–1060. doi:10.1037/a0016239
Code.org. (2013). Hour of code. Retrieved from https://code.org/learnCollege Board. (2014). Program summary report. Retrieved from http://media.collegeboard.
com/digitalServices/pdf/research/2014/Prog-Summary-Report-2014.pdfDockterman, E. (2014, June 19). Google aims to close the tech gender gap with $50 million
fund to get girls coding. Time. Retrieved from http://time.com/2901899/google-made-with-code-girls-in-tech
Eccles, J. S. (1987). Gender roles and women’s achievement-related decisions. Psychology ofWomen Quarterly, 11, 135–172. doi:10.1111/j.1471-6402.1987.tb00781.x
Eccles, J. S. (2004). Expectancy value theory in cross-cultural perspective. Big TheoriesRevisited, 4, 165.
Ensmenger, N. L. (2012). The computer boys take over: Computers, programmers, and thepolitics of technical expertise. Cambridge, MA: MIT Press.
Fairlie, R. W. (2005). An extension of the Blinder-Oaxaca decomposition technique to logitand probit models. Journal of Economic and Social Measurement, 30, 305–316.
Fredricks, J. A., & Eccles, J. S. (2002). Children’s competence and value beliefs from child-hood through adolescence: Growth trajectories in two ‘male-typed’ domains.Developmental Psychology, 38, 519–534. doi:10.1037/0012-1649.38.4.519
Gottfredson, L. S. (1981). Circumscription and compromise: A developmental theory ofoccupational aspirations. Journal of Counseling Psychology, 28(6), 545. doi: http://dx.doi.org/10.1037/0022-0167.28.6.545.
Han, J. C., Sax, L. J., & Kim, K. (2007). Having the talk: Engaging engineering students indiscussions on gender inequity. Journal of Women and Minorities in Science andEngineering, 13, 145–163. doi:10.1615/JWomenMinorScienEng.v13.i2.30
Henn, S. (2014, October 21). When women stopped coding. Morning Edition. Retrieved fromhttp://www.npr.org/sections/money/2014/10/21/357629765/when-women-stopped-coding
Hill, C., Corbett, C., & St. Rose, A. (2010). Why so few? Women in science, technology,engineering, and mathematics. Washington, DC: American Association of UniversityWomen.
Holland, J. L. (1997). Making vocational choices: A theory of vocational personalities and workenvironments. Odessa, FL: Psychological Assessment Resources.
30 L. J. SAX ET AL.

Huang, G., Taddese, N., & Walter, E. (2000). Entry and persistence of women and minorities incollege science and engineering education 2000. Washington, DC: National Center forEducation Statistics.
Huang, P. M., & Brainard, S. G. (2001). Identifying determinants of academic self-confidenceamong science, math, engineering, and technology students. Journal of Women andMinorities in Science and Engineering, 7, 315–337. doi:10.1615/JWomenMinorScienEng.v7.i4.40
Kinzie, J. (2007). Women’s paths in science: A critical feminist analysis. New Directions forInstitutional Research, 2007(133), 81–93. doi:10.1002/ir.206
Leedy, M. G., LaLonde, D., & Runk, K. (2003). Gender equity in mathematics: Beliefs ofstudents, parents, and teachers. School Science and Mathematics, 103, 285–292.doi:10.1111/j.1949-8594.2003.tb18151.x
Lehman, K. J., Sax, L. J., & Zimmerman, H. B. (2016). Women planning to major in computerscience: Who are they and what makes them unique? Computer Science Education, 26(4).doi:10.1080/08993408.2016.1271536
Lemons, M. A., & Parzinger, M. (2007). Gender schemas: A cognitive explanation ofdiscrimination of women in technology. Journal of Business and Psychology, 22, 91–98.doi:10.1007/s10869-007-9050-0
Lent, R. (2005). A social cognitive view of career development and counseling. In S. Brown &R. Lent (Eds.), Career development and counseling: Putting theory and research to work (pp.101–127). Hoboken, NJ: John Wiley & Sons.
Lent, R. W., Brown, S. D., & Gore, P. A., Jr. (1997). Discriminant and predictive validity ofacademic self-concept, academic self-efficacy, and mathematics-specific self-efficacy.Journal of Counseling Psychology, 44, 307–315. doi:10.1037/0022-0167.44.3.307
Lent, R. W., Brown, S. D., & Hackett, G. (1994). Toward a unifying social cognitive theory ofcareer and academic interest, choice, and performance. Journal of Vocational Behavior, 45,79–122. doi:10.1006/jvbe.1994.1027
Lent, R. W., Brown, S. D., & Hackett, G. (2002). Social cognitive career theory. In D. Brown &Associates (Eds.), Career choice and behavior (pp. 255–311). San Francisco, CA: JosseyBass.
Lent, R. W., Lopez, A. M., Lopez, F. G., & Sheu, H. (2008). Social cognitive career theory andthe prediction of interests and choice goals in the computing disciplines. Journal ofVocational Behavior, 73, 52–62. doi:10.1016/j.jvb.2008.01.002
Margolis, J., & Fisher, A. (2003). Unlocking the clubhouse: Women in computing. Cambridge,MA: MIT Press.
Margolis, J., Fisher, A., & Miller, F. (2000). The anatomy of interest: Women in under-graduate computer science. Women’s Studies Quarterly, 28(1/2), 104–127. Retrieved fromhttp://www.jstor.org/stable/40004448
Miner, A. S., Milstein, A., Schueller, S., Hegde, R., Mangurian, C., & Linos, E. (2016).Smartphone-based conversational agents and responses to questions about mental health,interpersonal violence, and physical health. JAMA Internal Medicine, 176, 619–625.doi:10.1001/jamainternmed.2016.0400
Moakler, M. W., & Kim, M. M. (2014). College major choice in STEM: Revisiting confidenceand demographic factors. Career Development Quarterly, 62, 128–142. doi:10.1002/j.2161-0045.2014.00075.x
Mooney, G. M., & Foley, D. J. (2011). Community colleges: Playing an important role in theeducation of science, engineering, and health graduates (NSF 11-317). Washington, DC:National Center for Science and Engineering Statistics. Retrieved from http://www.nsf.gov/statistics/infbrief/nsf11317/nsf11317.pdf
THE JOURNAL OF HIGHER EDUCATION 31

National Center for Education Statistics (NCES). (2012). Digest of education statistics:Bachelor's degrees conferred by degree granting institutions, by field of study. Retrievedfrom http://nces.ed.gov/programs/digest/d12/dt12_313.asp
National Center for Education Statistics. (2014). Digest of education statistics: Bachelor’sdegrees conferred by degree granting institutions, by field of study. Retrieved from https://nces.ed.gov/programs/digest/d15/tables/dt15_322.40.asp; https://nces.ed.gov/programs/digest/d15/tables/dt15_322.50.asp
National Science Foundation, National Center for Science and Engineering Statistics. (2012).Special Tabulations of U.S. Department of Education, 2002-12. National Center forEducation Statistics, Integrated Postsecondary Education Data System, CompletionsSurvey (WebCASPAR). Retrieved from: https://www.nsf.gov/statistics/data-tools.cfm.
National Science Foundation, National Center for Science and Engineering Statistics. (2015).IPEDS Completion Survey, 1987–2011, Integrated Science and Engineering Resources DataSystem (WebCASPAR). Retrieved from https://webcaspar.nsf.gov
Oaxaca, R. (1973). Male–female wage differentials in urban labor markets. InternationalEconomic Review, 14, 693–709. Retrieved from http://www.jstor.org/stable/2525981
Oaxaca, R. L., & Ransom, M. R. (1994). On discrimination and the decomposition of wagedifferentials. Journal of Econometrics, 61, 5–21. doi:10.1016/0304-4076(94)90074-4
Orser, B., Riding, A., & Stanley, J. (2012). Perceived career challenges and response strategiesof women in the advanced technology sector. Entrepreneurship & Regional Development,24, 73–93. doi:10.1080/08985626.2012.637355
Pryor, J. H., Hurtado, S., Saenz, V. B., Santos, J. L., & Korn, W. (2007). American freshman:Forty year trends. Los Angeles, CA: Higher Education Research Institute, UCLA.
Sax, L. J. (2008). The gender gap in college: Maximizing the developmental potential of womenand men. San Francisco, CA: Jossey-Bass.
Sax, L. J., Kanny, A., Jacobs, J., Whang, H., Weintraub, D. S., & Hroch, A. (2016).Understanding the changing dynamics of the gender gap in undergraduate engineeringmajors: 1971–2011. Research in Higher Education, 57, 570–600. doi:10.1007/s11162-015-9396-5
Sax, L. J., Kanny, M. A., Riggers-Piehl, T. A., Whang, H., & Paulson, L. (2015). ‘But I’m notgood at math’: The changing salience of mathematical self-concept in shaping women’sand men’s STEM aspirations. Research in Higher Education, 56, 813–842. doi:10.1007/s11162-015-9375-x
Seymour, E., & Hewitt, N. M. (1997). Talking about leaving: Why undergraduates leave thesciences. Boulder, CO: Westview.
Singh, K., Allen, K. R., Scheckler, R., & Darlington, L. (2007). Women in computer-relatedmajors: A critical synthesis of research and theory from 1994 to 2005. Review ofEducational Research, 77, 500–533. doi:10.3102/0034654307309919
Smyth, F. L., & McArdle, J. J. (2004). Ethnic and gender differences in science graduation atselective colleges with implications for admission policy and college choice. Research inHigher Education, 45, 353–381. doi:10.1023/B:RIHE.0000027391.05986.79
Soldner, M., Rowan-Kenyon, H., Inkelas, K. K., Garvey, J., & Robbins, C. (2012). Supportingstudents’ intentions to persist in STEM disciplines: The role of living–learning programsamong other social-cognitive factors. Journal of Higher Education, 83, 311–336.doi:10.1353/jhe.2012.0017
Starobin, S. S., & Laanan, F. S. (2005). Influence of pre-college experience on self-conceptamong community college students in science and engineering. Journal of Women andMinorities in Science and Engineering, 11, 209–230. doi:10.1615/JWomenMinorScienEng.v11.i3.10
32 L. J. SAX ET AL.
St. Rose, A. (2010). STEM major choice and the gender pay gap. On Campus With Women,39(1). Retrieved from http://archive.aacu.org/ocww/volume39_1/feature.cfm?section=1#
Takahashi, D. (2013, April 24). How Pixar made Monsters University, its latest technologicalmarvel. VentureBeat. Retrieved from http://venturebeat.com/2013/04/24/the-making-of-pixars-latest-technological-marvel-monsters-university
Tillberg, H. K., & Cohoon, J. M. (2005). Attaching women to the computer science major.Frontiers: A Journal of Women Studies, 26(1), 126–140. doi:10.1353/fro.2005.0016
Wang, X. (2013). Why students choose STEM majors: Motivation, high school learning, andpostsecondary context of support. American Educational Research Journal, 50, 1081–1121
Weinberger, C. J. (2004). Just ask! Why surveyed women did not pursue IT courses orcareers. Technology and Society Magazine, IEEE, 23(2), 28–35. doi:10.1109/MTAS.2004.1304399
The White House. (2013). Educate to innovate. Retrieved from https://www.whitehouse.gov/issues/education/k-12/educate-innovate
The White House. (2016). Computer science for all. Retrieved from https://www.whitehouse.gov/blog/2016/01/30/computer-science-all
Williams, W. M., & Ceci, S. J. (2012). When scientists choose motherhood. AmericanScientist, 100, 138–145.
Wilson, B. C. (2002). A study of factors promoting success in computer science includinggender differences. Computer Science Education, 12, 141–164. doi:10.1076/csed.12.1.141.8211
Xie, Y., & Shauman, K. A. (2003). Women in science: Career processes and outcomes (Vol. 26,No. 73.4). Cambridge, MA: Harvard University Press.
THE JOURNAL OF HIGHER EDUCATION 33

Appendix A
Table A1. Variable list and coding.Dependent variable
Intent to major in computerscience
Dichotomous: 0 = all others, 1 = data processing/computerprogramming/computer science
Personal inputsReligion (vs. Protestant)Catholic Dichotomous: 0 = “no,” 1 = “yes”Jewish Dichotomous: 0 = “no,” 1 = “yes”Other Dichotomous: 0 = “no,” 1 = “yes”None Dichotomous: 0 = “no,” 1 = “yes”
Race (vs. White)African American Dichotomous: 0 = “no,” 1 = “yes”Asian American Dichotomous: 0 = “no,” 1 = “yes”Latino/Chicano Dichotomous: 0 = “no,” 1 = “yes”Native American Dichotomous: 0 = “no,” 1 = “yes”Political orientation 5-point scale: 1 = “far right” to 5 = “far left”
Background characteristicsFather’s education 8-point scale: 1 = “grammar school or less” to 8 = “graduate degree”Mother’s education 8-point scale: 1 = “grammar school or less” to 8 = “graduate degree”Family income 25-point scale: 1 = “less than $6,000” to 25 = “$250,000 or more”Father’s career: STEM Dichotomous: 0 = “no,” 1 = “yes” (physician, engineer, health
professional, nurse, research scientist, or computer programmer)Mother’s career: STEM Dichotomous: 0 = “no,” 1 = “yes” (physician, engineer, health
professional, nurse, research scientist, or computer programmer)Learning experiencesHigh school GPA (averagegrade in H. S.)
8-point scale: 1 = “D” to 8 = “A or A+”
Self-EfficacySelf-rated mathematical ability 5-point scale: 1 = “lowest 10%” to 5 = “highest 10%”Leader personality factor See Appendix BScholar personality factor See Appendix B
Outcome ExpectationsFuture activity: change majorfield
4-point scale: 1 = “no chance” to 4 = “very good chance”
Future activity: make at least a‘B’ average
4-point scale: 1 = “no chance” to 4 = “very good chance”
InterestsGoal: develop a meaningfulphilosophy of life
4-point scale: 1 = “not important” to 4 = “essential”
Goal: make a theoreticalcontribution to science
4-point scale: 1 = “not important” to 4 = “essential”
Goal: raise a family 4-point scale: 1 = “not important” to 4 = “essential”Social activist personality factor See Appendix BArtistic personality factor See Appendix BStatus striver personality factor See Appendix BEducation reasons for choosinga college factor
See Appendix B
Extrinsic reasons for choosing acollege factor
See Appendix B
Contextual influences proximal tochoice behaviorDistance from home 5-point scale: 1 = “10 miles or less” to 5 = “more than 500 miles”
(Continued )
34 L. J. SAX ET AL.

Table A1. (Continued).
Dependent variable
Number of institutions applied 5-point scale: 1 = “none” to 5 = “four or more”Concern about finances 3-point scale: 1 = “none,” 2 = “some,” 3 = “major”Student faculty ratioInstitutional type: university/college
Dichotomous: 0 = college, 1 = university
Institutional type: religious/nonsectarian
Dichotomous: 0 = nonsectarian, 1 = religious
Institutional type: HBCU Dichotomous: 0 = non-HBCU, 1 = HBCUControl: public/private Dichotomous: 0 = private, 1 = public
Choice GoalsDegree aspirations (vs.bachelor’s or less)PhD Dichotomous: 0 = all others, 1 = PhDLaw Dichotomous: 0 = all others, 1 = lawMedical degree Dichotomous: 0 = all others, 1 = medicalMaster’s degree/MDiv Dichotomous: 0 = all others, 1 = master’s or MDiv
Note. STEM = science, technology, engineering, and math; GPA = grade point average; HBCU = HistoricallyBlack Colleges and Universities.
THE JOURNAL OF HIGHER EDUCATION 35

Appendix B. Factor variables, loadings, and reliabilities.Factor loading
Factor Men Women
Leader personality α = .66 α = .65Self-rating: drive to achieve .72 .71Self-rating: leadership ability .83 .83Self-rating: self-confidence (social) .77 .75Scholar personality α = .64 α = .64Self-rated: academic ability .80 .79Self-rated: self-confidence (intellectual) .78 .78Self-rated: writing ability .72 .73Social activist personality α = .76 α = .72Goal: influence social values .77 .74Goal: participate in a community action program .76 .75Goal: help others in difficulty .65 .61Goal: influence the political structure .72 .69Goal: become involved in programs to clean up the environment .67 .64Artistic personality α = .72 α = .69Goal: create artistic work .83 .82Self-rated: artistic ability .66 .72Goal: write original works .75 .67Goal: become accomplished in the performing arts .73 .66Status striver personality α = .64 α = .64Goal: obtain recognition from colleagues .78 .78Goal: be very well-off financially .64 .64Goal: become authority in my field .75 .74Goal: be successful in a business of my own .62 .62Education reasons for choosing college α = .63 α = .60Reason: to gain a general education and appreciation of ideas .79 .76Reason: to make me a more cultured person .78 .77Reason: to learn more about things that interest me .73 .73Extrinsic reasons for choosing college α = .67 α = .66Reason: to be able to get a better job .87 .86Reason: to be able to make more money .87 .86
36 L. J. SAX ET AL.