anatomy of readmissions21,000/yr chf admits per year 5.7% of admissions are for chf the average...
TRANSCRIPT

Anatomy of Readmissions
What this means for hospitals

How long have we been talking about readmissions?
“ Utilization and quality control (groups) are required to randomly select specific potential problematic cases for review (for example, readmissions within 15 days)”
What year was this published in the federal register?
HHA Copyright 2010

Recent SG2 Survey
Over the next year, how important will it be for your organization to reduce 30-day readmissions?
94% - Very important 6% - Moderately important0% - Not important
HHA Copyright 2010

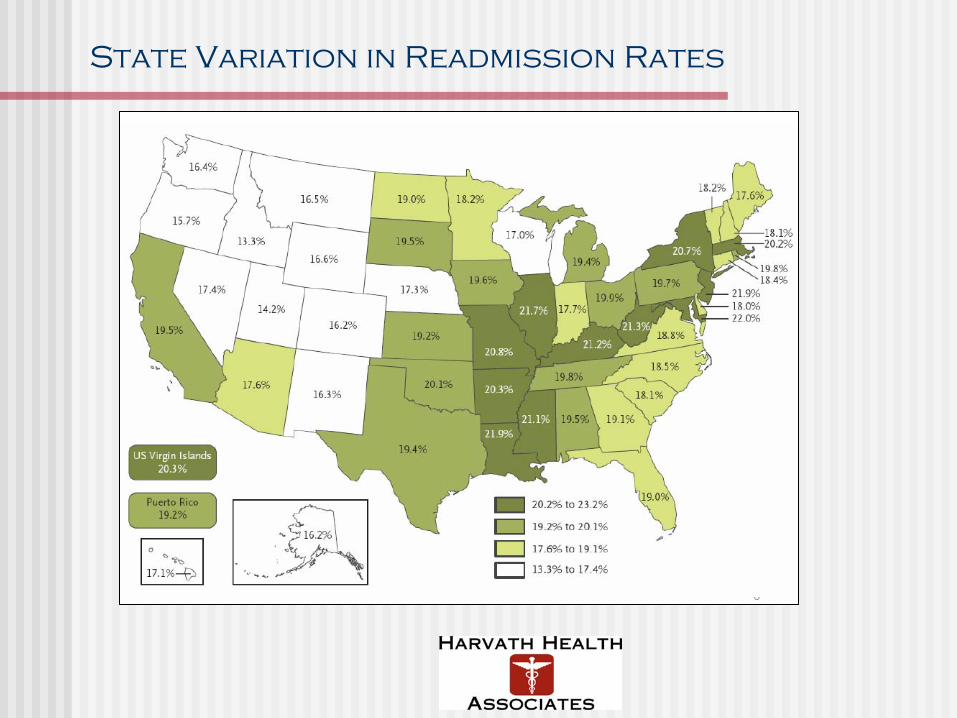
Readmissions are linked to total Medicare spend, with wide variation by state
Source: Commonwealth Fund; Lit search
Higher readmissions lead to higher
Medicare spend – and
create a large target for CMS
Large variation
across states suggests
opportunities for
improvement
Cost per Medicare
Enrollee not per
readmission
Avg. $6,400
Avg. 18%

What we’ve learned about Readmissions
Readmission rates and spending are significant~18% of patients readmitted within 30 days of discharge = $15B in 2005
Reducing readmission rates is both important and feasibleWide variation: ~12% to ~22% by city in 2005Medicare estimated savings > $100B over 10 years if high-cost areas brought to national average
Many readmissions are preventable75% of all 30-day Medicare readmissions were potentially preventable, with potential savings of $12B to Medicare, according to Medicare Payment Advisory Commission
CMS is targeting readmissions for three diagnoses:Congestive heart failure (CHF), Pneumonia, and Acute Myocardial Infarction (AMI):
• In the top 10 diagnoses for Medicare hospital discharges (CHF #1, Pne. #2, AMI #8)• These 3 makeup ~13% of total Medicare hospitalizations in 2006 • 2008 CMS began collecting information on these readmissions• 2009 CMS began reporting back readmission data to selected hospitals• 2010 CMS plans to expand readmission data collection and reporting• CMS is tasked with accomplishing the $$$ billion in savings earmarked in the
Healthcare legislation
State Variation in Readmission Rates
CMS targeting readmissions in three diagnoses
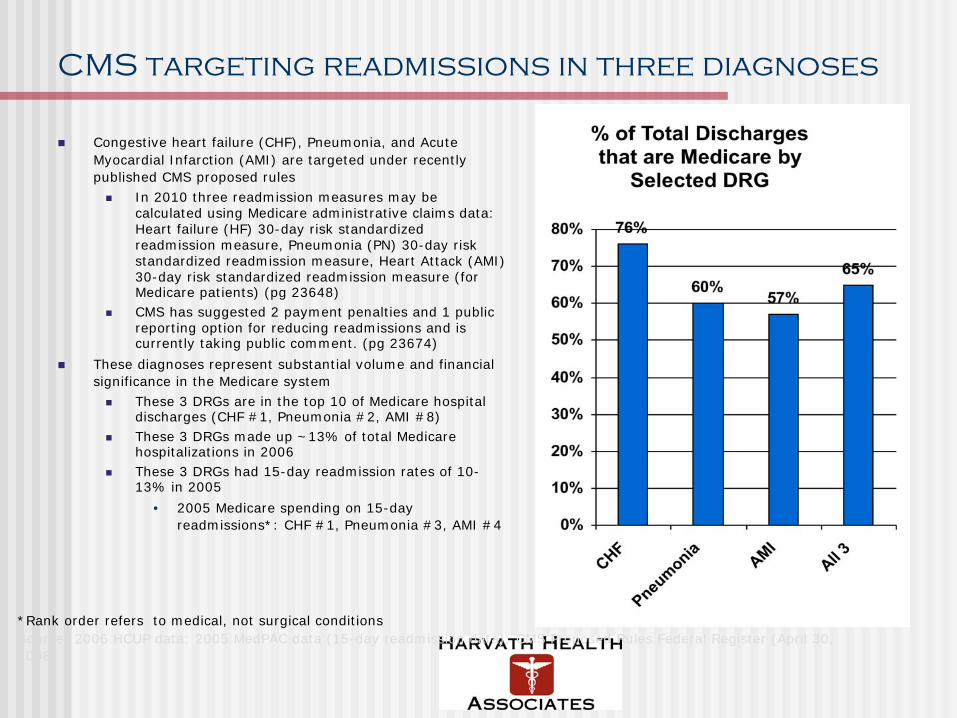
Congestive heart failure (CHF), Pneumonia, and Acute Myocardial Infarction (AMI) are targeted under recently published CMS proposed rules
In 2010 three readmission measures may be calculated using Medicare administrative claims data: Heart failure (HF) 30-day risk standardized readmission measure, Pneumonia (PN) 30-day risk standardized readmission measure, Heart Attack (AMI) 30-day risk standardized readmission measure (for Medicare patients) (pg 23648)CMS has suggested 2 payment penalties and 1 public reporting option for reducing readmissions and is currently taking public comment. (pg 23674)
These diagnoses represent substantial volume and financial significance in the Medicare system
These 3 DRGs are in the top 10 of Medicare hospital discharges (CHF #1, Pneumonia #2, AMI #8)These 3 DRGs made up ~13% of total Medicare hospitalizations in 2006These 3 DRGs had 15-day readmission rates of 10-13% in 2005
• 2005 Medicare spending on 15-day readmissions*: CHF #1, Pneumonia #3, AMI #4
*Rank order refers to medical, not surgical conditions Source: 2006 HCUP data; 2005 MedPAC data (15-day readmission data); CMS Proposed Rules Federal Register (April 30, 2008)

Potential Losses from CHF in a Typical Hospital
MetricMetric AssumptionsAssumptions VolumeVolume CostsCostsAdmits per year 250 bed hospital at 90% occupancy 21,000/yr
CHF admits per year 5.7% of admissions are for CHF
The average reimbursement for CHF is
-$500-$1000/admission average loss to cost of care
1,150/year $575,000
CHF 30-day readmissions per year
CHF DRG-specific 23% readmission rate
Median CMS reimbursement for CHF is $6,000/discharge
-with more than a 3 fold variation not attributable to clinical condition
265/year $1,590,000
Total Annual Loss $2,165,000
The Buzz around 30-Day
AHRQ/ HCUP report suggests that in 2006, hospitals spent $30.8 billion on 4.4 million hospital admissions that might have been avoidable. The report used its prevention quality indicators to decide when a hospital stay might have been preventable with good enough outpatient care. Medicare patients accounted for $20.1 billion of the full amount spent on possibly preventable admissions, while privately-insured patients were responsible for $4.7 billion of the $30.8 billion total. The report concluded that congestive heart failure and bacterial pneumonia were the two most common reasons for inpatient stays, mounting up $15.6 billion in costs.
• In 2006, hospital costs for potentially preventable conditions totaled nearly $30.8 billion—one of every 10 dollars of total hospital expenditures. As many as 4.4 million hospital stays could possibly have been prevented with better ambulatory care, improved access to effective treatment, or patient adoption of healthy behaviors.
• Congestive heart failure and bacterial pneumonia were the two most common reasons for potentially preventable hospitalizations, accounting for half of the total hospital costs ($8.4 billion and $7.2 billion, respectively) for all preventable hospitalizations.
• One in five (18 percent) Medicare admissions was for a potentially preventable condition. In fact, Medicare patients contributed to $20.1 billion (67 percent) of total hospital costs for potentially preventable hospitalizations among adults.
• Hospitalization rates for potentially preventable conditions were highest among residents in poorer communities and lowest among residents from wealthier communities. This disparity was particularly evident for diabetes without complications, where the admission rate in the poorest communities was more than 400 percent higher than the rate in the wealthiest communities.

The 30-Day Activity 2009

The 30-Day Activity 2009 & 2010
Commonwealth Fund/IHI: STAARAmy Boutwell
Commonwealth Fund/PHI: Barbara Harvath
Update: Brian Jack
Update: Robyn Golden
Update: Carolyn Clancy
Update: Barry Straube
HEALT
HCARE REF
ORM
VHA: 6 Leading Practices Blueprint to Reduce Readmissions
VNA Transitional Care:Robert Rosati
Payor Reform:Humana, Aetna, BCBSCIGNA’s Douglas Hadley
Reform Advocates:AMA, AHA,

Anatomy of a Readmission
HHA Copyright 2009

Issues surrounding readmissions by process steps
1st Hospitalization Discharged Patient 2nd Hospitalization
Timely Med Rec.
Pt. Psych, Cog etc
eval
Optimal Pt Cohort Care Paths
ID Pops at risk for Readmit
Homecare Coordination of DME, Logistics,
Teaching
Trained Staff in Complex
Chronic care
Shared DC plan goals
Self Managem
ent
Benchmarks for Success, Quality,
FinancialCustomer Sat.
Workforce
Shared Metrics for:
Coding standardBudget alignRisk share
PCP follow up
Coordination in Transitions in Episodes of
Care
Coordination in Transitions in Episodes of
Care
Unreliable Communications:Timely, Accurate, Complete, Standardized
Population Data

Understanding readmissions starts before the first admission
19% of 30-day readmissions are from admissions that didn’t need to happen in the first place.”AHRQ
Severity and complexity of underlying chronic problems contribute significantly to preventable readmissions.
At home deaths from medication mistakes saw a 7 fold increase between 1984 and 2004
Known deficits that impair a patient’s ability to follow through on a discharge plan• Economics• Transportation• Mental (ie. depression)• Cognitive (ie. memory) • Physical (ie. seeing, hearing)• Language (non-English speaking, illiterate)• Social supports
A recent study looking at 150,000 patients with diabetes on medications found that 50% of patients had medication issues but of those:
20% were patient issues (Economics and transportation issues, and depression accounting for the most)80% were provider issues (failure to intensify treatment to optimal range being the largest issue)
This changes how we need to start looking at compliance failure and what solutions we might implement
Top 3 issues for patient medication compliance failure
Most DC Planners would target lack of social support as the top issue in readmissions
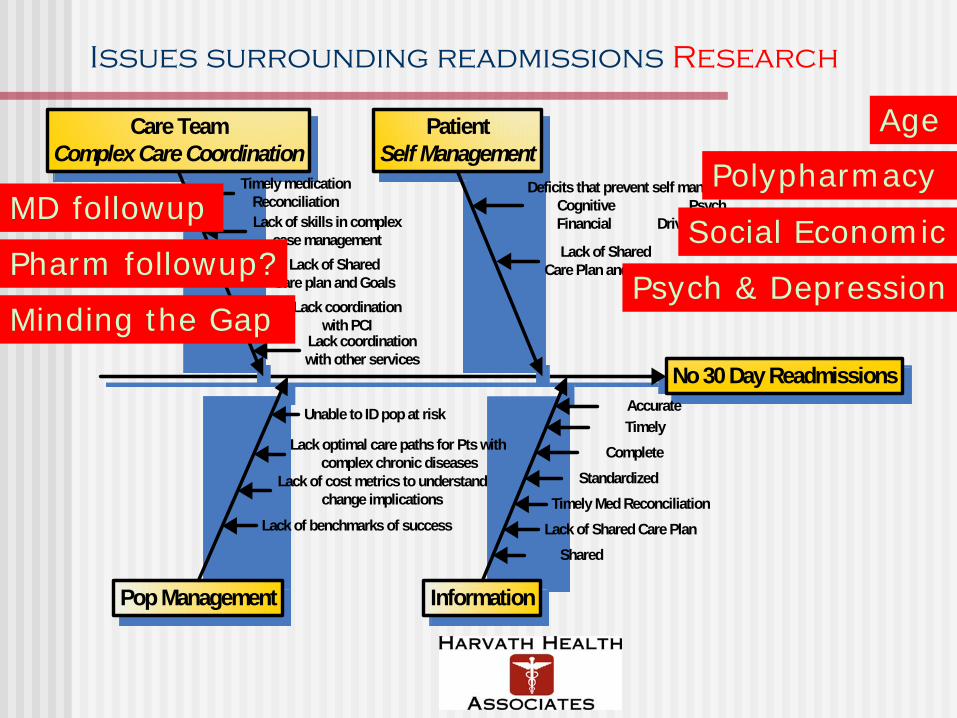
Issues surrounding readmissions Research
No 30 Day Readmissions
Care TeamComplex Care Coordination
PatientSelf Management
Pop Management Information
Deficits that prevent self managementCognitive PsychFinancial Driving etc.Lack of skills in complex
case management
Timely medication Reconciliation
Lack of Shared Care plan and Goals
Lack coordination with PCI
TimelyComplete
Standardized
Accurate
Timely Med ReconciliationLack of Shared Care Plan
Lack of Shared Care Plan and Goals
Unable to ID pop at risk
Lack optimal care paths for Pts with complex chronic diseases
Lack coordination with other services
Lack of benchmarks of success
Lack of cost metrics to understand change implications
Shared
Age
Social EconomicMD followup
Pharm followup?
Polypharmacy
Psych & DepressionMinding the Gap

Example Page
The tool includes an Example page that allows a user to see a properly filled out Evaluation page. The inputs will vary by organization, but the example page shows correct input logic. Yes & No
filled out for all
metrics
Manual/Elec/ Both filled out
for “Yes” metrics only
Degree of difficulty filled out for “No” metrics only

Connecting Technology & Innovation to Healthcare Challenges
BusinessChallenges, Opportunities
CriticalSuccess Factors
Innovation Technology
Innovations are strategic, technology is tactical
Which innovations and technologies will be truly disruptive?
How can these be leveraged to accomplish our strategy and mission?
How will they affect care processes, quality and sustainability?

A Wealth of Technologies
Which technologies will have the biggest impact on 30 day readmissions?How do high-impact technologies get disseminated quickly, efficiently and effectively?
Home MedsManagement
Video-BasedEducation
Shared Care Plan
TelemedicineHome
Monitoring
Smart Sensors
Wireless Networks

The Transitions of Care Matrix
The Transitions of Care Matrix map connects challenges to metrics to innovations to technologies

Connecting the Dots?
BusinessChallenges, Opportunities
CriticalSuccess Factors
Innovation Technology

Challenge Success Factor Innovation Technology
Lack of shared care plan and structures to advance self management:Clarity of Provider & Patient goals
• Patient medication compliance• Physician participation in goal
setting• Patient satisfaction• Patient connecting to caregivers
Use of telecommunications and remote monitoring to create shared care plan and monitor individual
Remote disease monitoring
Help highest utilizers with no insurance coverage and little or no continuity of care to better manage self-care, prevent hospitalizations and ED visits
Patient satisfactionPatients’ perceived connection to care teamAbility for patient to manage medsSF-12 scores34% ED visits32% Inpatient admissions49% Outpatient visits$747 per patient/ year
Use telecommunications and remote disease monitoring to manage high resource intensive diabetic patients for better self care
Used Health Buddy home monitoring tool and HealthHero case management software
Assessing Readmissions and a technology solution example: Mercy Laredo
BusinessChallenges, Opportunities
CriticalSuccess Factors
Innovation Technology

The Opportunity: RPM of patients with congestive heart failure
The New England Healthcare Institute’s Research Update: Remote Physiological Monitoring reports the following cost savings for all Class III and Class IV heart failure patients, assuming that 80% of the 1.59 million patients in these two classes, or 1.27 million patients, will be hospitalized in a year, at an annual cost of $2,052 per patient for the monitoring technology ($2,802 with DM software):
60% reduction in hospital readmissions compared to standard care and a 50 percent reduction in hospital readmissions compared to disease management programs without remote monitoring. Based on the potential to prevent between 460,000 and 627,000 heart failure-related hospital readmissions each year, NEHI estimates an annual national cost savings of up to $6.4 billion dollars.
The annual cost of a heart-failure related hospitalization per patient ranged from $5,632 for RPM patients to $11,387 for disease management without RPM patients to $13,468 for standard care patients. The net savings of RPM technology (i.e. savings after the costs associated with interventions) were $3,703 per patient per year for those with disease management programs and $5,034 for those with standard care.

Policy Change To Support Broad RPM Diffusion Will Drive Cost Savings
Analyzing data from the remote monitoring program at the VA, as well as other smaller programs, Better Health Care Together finds the US health care system could reduce costs by nearly $200 billion during the next 25 years if remote monitoring tools were utilized much more widely and supported by specific policy adjustments that include reimbursing health care organizations for remote care and encouraging continued investment in broadband infrastructure.
Net Present Value of Savings – Baseline Case
Net Present Value of Savings – Policy Case
Gain From Policy Change
CHF Patients $79.7 Billion $102.5 Billion $22.8 Billion
Diabetes Patients $42.3 Billion $54.4 Billion $12.1 Billion
COPD Patients $18.7 Billion $24.1 Billion $5.4 Billion
Chronic Skin Ulcer Patients $12.5 Billion $16.0 Billion $3.5 Billion
Total $153.2 Billion $197 Billion $43.8 Billion
Estimated Savings and Gain from Policy Implementation, by Condition
Source: Vital Signs via Broadband: Remote Health Monitoring Transmits Savings, Enhances Lives
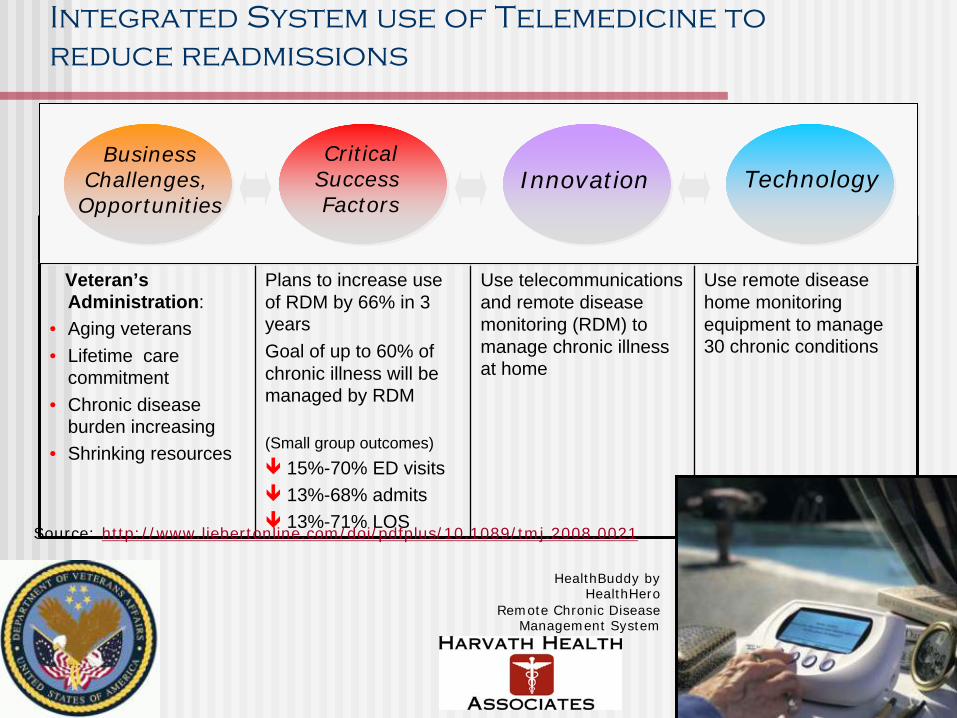
Integrated System use of Telemedicine to reduce readmissions
Challenge Success Factor Innovation Technology
Veteran’s Administration:
• Aging veterans• Lifetime care
commitment• Chronic disease
burden increasing• Shrinking resources
Plans to increase use of RDM by 66% in 3 years Goal of up to 60% of chronic illness will be managed by RDM
(Small group outcomes)15%-70% ED visits13%-68% admits13%-71% LOS
Use telecommunications and remote disease monitoring (RDM) to manage chronic illness at home
Use remote disease home monitoring equipment to manage 30 chronic conditions
HealthBuddy by HealthHero
Remote Chronic Disease Management System
BusinessChallenges, Opportunities
CriticalSuccess Factors
Innovation Technology
Source: http://www.liebertonline.com/doi/pdfplus/10.1089/tmj.2008.0021

The Early Adopter Experience: Veterans Health Administration
The cost of the program is $1,600 per patient per annum. This compares with direct cost of VHA’s home-based primary care services of $13,121 per patient per annum, and market nursing home care rates that average $77,745 per patient per annum.Since VHA implemented CCHT, a total of 43,430 patients have been enrolled in the program. CCHT patients increased from 2,000 to 31,570 from 2003 to 2007. VHA plans to increase its NIC services 100% above 2007 levels to provide care for 110,000 patients by 2011, or 50% of its projected NIC needs. VHA attributes the rapidity and robustness of its CCHT implementation to the “systems approach” taken to integrate the elements of the program. Wherever possible, CCHT incorporated existing business processes to reduce the program’s overhead costs and increase efficiency.
Age Distribution of all CCHT Patients

What you are going to get from this Morning
HHA Copyright 2010
Readmissions Tools – Project BOOST and the Enhanced Discharge Planning Program at Rush University Medical CenterRobyn Golden, LCSW, Director of Older Adult Programs
Break
Readmissions Tools - Use of Telemedicine in Preventing ReadmissionsPatricia Ryan MS RN, Director, VISN 8 Community Care Coordination Service Associate Chief Consultant, VHA Office of Telehealth ServicesU.S. Department of Veterans Affairs Washington, DC
Technology's Promise and Failure in Preventing ReadmissionsRavi Nemana, Former CITRIS Director UC Berkeley and Senior Advisor at HealthTech
Wrap-up

Thank You
Barbara S. Harvath
Harvath
Health Associates
1852 East 2700 South
Salt Lake City, UT 84106
Mobile: 415.730.3753
Message/Fax: 888.415.6987