analyzing the boundaries of balance theory in …
TRANSCRIPT
ANALYZING THE BOUNDARIES OF BALANCE THEORY IN EVALUATING CAUSE-RELATED MARKETING COMPATIBILITY
BY
JOSEPH T. YUN
DISSERTATION
Submitted in partial fulfillment of the requirements for the degree of Doctor of Philosophy in Informatics
in the Graduate College of the University of Illinois at Urbana-Champaign, 2018
Urbana, Illinois Doctoral Committee: Associate Professor Brittany R.L. Duff, Chair Associate Professor Itai Himelboim, University of Georgia Associate Professor Hari Sundaram Professor Patrick Vargas

ii
ABSTRACT
The phenomenon of brands partnering with causes is referred to as cause-related marketing
(CRM). This dissertation provides numerous steps forward within the realm of CRM research, as
well as balance theory research. Some CRM partnerships may seem less compatible than others,
but the level of perceived compatibility (also referred to as “fit”) differs from consumer to
consumer. I analyzed CRM compatibility through the lens of balance theory both via a survey-
based approach, as well as a social media analytics approach. My contributions to CRM and
balance theory are as follows: I found that a consumer’s attitude towards a brand, along with their
attitude towards a cause, predicts their perceptions of CRM compatibility. I also show that adding
continuous measures of attitude and attitude strength enabled the prediction of balanced and
unbalanced consumer evaluations of perceived CRM compatibility. This is the first time that
attitude strength has been incorporated into balance theory. I found evidence that a consumer’s
attitude towards a brand (or towards a cause), and the strength of that attitude, can spill from one
organization to another when brands and causes enter into CRM partnerships. Methodologically,
I present a novel way to indirectly measure the strength of attitudes towards brands and towards
causes through analyzing perceived conversation topic similarity via a self-reported survey
measure, but I was not able to provide evidence that attitude strength could be measured via a
social media analytics approach to conversation topic similarity. To dig deeper into this lack of
social media analytics results, I provide some considerations with regards to research conducted
using a hybridization of a survey-based approach tied to a social media analytics approach.
Practically, I share recommendations as to how to choose CRM partners for future CRM
partnerships, which should prove beneficial to CRM researchers, practitioners, and advertisers.
iii
ACKNOWLEDGEMENTS
I want to first thank God my Father, and my Lord Jesus Christ. You have been my
ultimate hope, joy, vision, and purpose throughout this process. You deserve all the credit for
this, as well as my whole life.
To my wife, Limee, your character and love inspires me every day, and this dissertation
is as much yours as it is mine. I genuinely believe we did this together. I love you.
To my daughters, Lydia and Mary, thank you for giving me joy on days that were not the
most fun. You will always be my little dancing and singing bundles of joy.
To my father and mother, Keun Heum and Kwang Sook Yun, I dedicate this dissertation
to you two. You went through so much for me to have opportunities like this, and I want you to
know that I love you and honor you.
To my sister, Jane Eun, thanks for supporting me all my life. To the rest of my extended
family, thank you for your prayers during this process.
To my advisor, Brittany R.L. Duff, I have tried to think about what words I should use to
thank you, and I just could not find words to do it justice. You were more than an advisor to me.
I still do not understand what you got out of this lopsided partnership, but I know that I will
always be thankful to you.
To my committee: Itai Himelboim, Hari Sundaram, and Patrick Vargas, your breadth of
expertise is a joy for me to learn from. I could not have dreamt up a better combination of
scholars, as well as caring individuals than you all.
To Mark Henderson and John Towns, without your support professionally and
personally, none of this could have happened. I would wager that there are not many doctoral

iv
students that have the full backing and support of their institution’s CIO, as well as one of the
nation’s foremost experts in supercomputing.
To Technology Services and the Social Media Lab team, thank you for supporting me in
various ways. Nick Vance, without you, I could not have had the time nor the energy to complete
this dissertation. Chen, Jason, and Nick, thank you for helping with the coding of the topic
similarity portion of this dissertation.
To my Covenant Fellowship Church family, thank you for supporting me through this
time in more ways than I can count.
To the statistics consulting service at the Library, you know how much you helped me
with this. Thank you for double-checking all of my math!
There are so many more that I want to thank, but for the sake of keeping this within
reason, I want to finally thank Illinois Informatics, and one person in particular: Karin Readel.
Karin, to me, you are the heart of this Informatics program. I have deeply enjoyed my time in
this program, and largely due to your tireless work. I hope you know that you have made a mark
on so many of our lives. Thank you.
Also, some funding acknowledgements:
This dissertation was supported by the 2018 American Academy of Advertising’s
Dissertation Competition Award.
This dissertation was also supported by the 16th Annual Robert Ferber and Seymour
Sudman Dissertation Honorable Mention Award.

v
TABLE OF CONTENTS
LIST OF IMPORTANT TERMS & PHRASES..........................................................vi LIST OF VARIABLES............................................................................................... vii CHAPTER 1: GENERAL INTRODUCTION AND DISSERTATION OUTLINE ......... 1 CHAPTER 2: CAN WE FIND THE RIGHT BALANCE IN CAUSE-RELATED MARKETING? ANALYZING THE BOUNDARIES OF BALANCE THEORY IN EVALUATING BRAND-CAUSE PARTNERSHIPS .................................................... 17 CHAPTER 3: PERILS AND PITFALLS OF SOCIAL MEDIA ANALYTICS: A COMPARISON BETWEEN SURVEY AND SOCIAL MEDIA ANALYTICS APPROACHES WHEN USING BALANCE THEORY TO MEASURE ATTITUDE STRENGTH IN CAUSE-RELATED MARKETING PARTNERSHIPS........................ 54 CHAPTER 4: GENERAL DISCUSSION AND CONCLUDING REMARKS ............. 98 REFERENCES .......................................................................................................... 110 APPENDIX A: SURVEY INSTRUMENT – RC AND WWF EXAMPLE ................. 119 APPENDIX B: ADDITIONAL SURVEY QUESTIONS – RC EXAMPLE ................ 120 APPENDIX C: TEXT RAZOR TOPICS OF EACH BRAND AND CAUSE.............. 121 APPENDIX D: IRB LETTER .................................................................................... 122

vi
LIST OF IMPORTANT TERMS & PHRASES
Brand A shortened name for a for-profit company.
Cause A shortened name for a not-for-profit company.
CRM An acronym for cause-related marketing. In this dissertation, I define CRM as a business strategy in which a brand partners with a cause through various types of engagements, to address both organizations’ objectives.
CRM Triad A triangular structure of three entities: a consumer, a brand, and a cause. In this triad, the consumer evaluates their attitude towards the brand, their attitude towards the cause, and their perception of compatibility between the brand and the cause in the CRM partnership. See Figure 1.1.
CSR An acronym for corporate social responsibility. CSR refers to corporate social actions that address social needs, while CRM is CSR in which a brand partners with a cause to address social needs. Thus, CRM is a subset of CSR.
vii
LIST OF VARIABLES
ASBRAND An individual’s self-reported strength of their attitude towards the brand within a CRM partnership.
ASCAUSE An individual’s self-reported strength of their attitude towards the cause within a CRM partnership.
ASDIFFERENCE The mathematical difference between ASBRAND and ASCAUSE (the absolute value) for an individual.
ATBRAND An individual’s self-reported attitude towards the brand within a CRM partnership.
ATCAUSE An individual’s self-reported attitude towards the cause within a CRM partnership.
ATDIFFERENCE The mathematical difference between the absolute values of ATBRAND and ATCAUSE (The lesser subtracted from the greater) for an individual.
ATASDIFFERENCE The mathematical difference between the absolute values of (ATBRAND x ASBRAND) and (ATCAUSE x ASCAUSE) (The lesser subtracted from the greater) for an individual.
BALANCECRM A binary variable (0 or 1) that denotes whether a CRM triad is balanced or not. I accept weak balance as a condition of balance throughout this dissertation.
COMPPERCEIVED An individual’s self-reported perceived CRM compatibility between a brand and a cause within a CRM partnership.
SURVEYSIMBRAND An individual’s self-reported perceived amount of conversation topics that an individual believes to be similar to a brand (how similar are the topics that I speak about to the topics that I believe a brand would speak about).
SURVEYSIMCAUSE An individual’s self-reported perceived amount of conversation topics that an individual believes to be similar to a cause (how similar are the topics that I speak about to the topics that I believe a cause would speak about).
CODERSIMBRAND Human coded similarity assessment between the dissertation participants’ self-reported SURVEYSIMBRAND and their Text Razor TWEETDIVBRAND.
CODERSIMCAUSE Human coded similarity assessment between the dissertation participants’ self-reported SURVEYSIMCAUSE and Text Razor TWEETDIVCAUSE.
RAWDIVBRAND The divergence (opposite of similarity) between computational raw word analysis of an individual’s Twitter feed and a brand’s Twitter feed.
RAWDIVCAUSE The divergence (opposite of similarity) between computational raw word analysis of an individual’s Twitter feed and a cause’s Twitter feed.
TWEETDIVBRAND The divergence (opposite of similarity) between computational conversation topic analysis of an individual’s Twitter feed and a brand’s Twitter feed.
TWEETDIVCAUSE The divergence (opposite of similarity) between computational conversation topic analysis of an individual’s Twitter feed and a cause’s Twitter feed.

1
CHAPTER 1: GENERAL INTRODUCTION AND DISSERTATION OUTLINE
CAUSE-RELATED MARKETING
In 1983, American Express launched an initiative to restore the Statue of Liberty and
Ellis Island (“American Express - Corporate Social Responsibility - Initiatives,” n.d.). They did
this in partnership with two causes: The World Monuments Fund and the National Trust for
Historic Preservation. This effort was widely considered a success, as they raised $1.7 million
through this partnership. American Express widely promoted this effort and trademarked it as,
“cause-related marketing” (CRM) (Welsh, 1999). Some years later, Varadarajan and Menon
(1988) provided a definition of CRM as follows:
Cause-related marketing is the process of formulating and implementing activities that are characterized by an offer from the firm to contribute a specified amount to a designated cause when customers engage in revenue-providing exchanges that satisfy organizational and individual objectives. (p. 60)
In the American Express partnership with the World Monuments Fund and the National
Trust for Historical Preservation, American Express contributed one cent for every credit card
charge, and a dollar per each new cardholder in the final quarter of 1983. This resulted in a 17%
increase in the number of credit cards and 28% more usage on American Express cards during
that period. This proved to American Express that CRM was a beneficial financial strategy, and
they were also able to promote their company as being socially responsible. In fact, this seems to
be the angle that they were most focused on, as they accentuate this point quite clearly:
These initiatives aim to increase public awareness of the importance of historic and environmental conservation, preserve global historic and cultural landmarks, educate visitors on sustainable tourism and strengthen local communities through preservation efforts (“American Express - Corporate Social Responsibility - Initiatives,” n.d.).

2
Barone, Miyazaki, and Taylor (2000) suggested that CRM has not just been limited to
donations that are dependent on revenue-providing exchanges, but can apply to other types of
cause-related partnerships, such as lump sum donations by brands to causes, or brands offering
discounts for members of causes. For example, Royal Caribbean pledged to donate $5 million as
a lump sum donation to the World Wildlife Fund in efforts to preserve the ocean environment
(Hancock, 2016). Whereas an example of a CRM partnership involving a discount between a
brand and a partnership is Wyndham Hotel’s ten percent discount given to National Rifle
Association members (Fairchild, 2013).
Cause-related marketing is sometimes used interchangeably with corporate social
responsibility (CSR), but they are separate, albeit related, concepts. Brønn and Vrioni (2001)
discussed the differences between the two, and suggested that CSR refers to corporate social
actions that address social needs, while CRM is CSR in which a brand partners with a cause to
address social needs. Thus, CRM is a subset of CSR. An example of CSR that is not CRM would
be a company deciding to use 100% recyclable materials in its products. They are not partnering
with a cause to do this (as in CRM), but it is an activity that a brand is conducting alone to
provide societal benefit.
Although research has shown that there are definitely skeptics that do not trust the
motivations behind CRM (Webb & Mohr, 1998), the phenomenon of CRM has substantially
grown in popularity. Engage for Good, an organization that helps educate individuals and
organizations about CRM, states that CRM spending has grown from $120 million in 1990 to
$2.05 billion in 2017 (“ESP’s Growth of Cause Marketing - Engage for Good,” 2017). The
growth and success of CRM has also been shown in newer advertising channels, such as in the
realm of social media. Adweek, an American advertising trade publication, recently analyzed
3
what topics companies promote via social media (Vijay, 2017). They found that the topics that
received the most engagement were the topics related to CRM. CRM researchers and
practitioners would be wise to dig deeper into researching CRM on social media, as a recent Pew
Research Center survey showed that up to 75% of adults in the United States use social media
(A. Smith & Anderson, 2018). They also show that this percentage grows to 94% within the age
range of 18 to 24 year olds with regards to social media use. Thus, these future consumers will
most likely be interfacing with brands and causes on social media platforms.
Some more recent CRM examples are Starbucks with (RED) to fight AIDS, Warby
Parker with Vision Spring to provide glasses for those in need, Fitbit with the American Heart
Association to promote heart health, and Coca-Cola with the World Wildlife Fund to preserve
polar bear habitats in the arctic. As another example of CRM effectiveness from these more
recent partnerships, the World Wildlife Fund heralded the success of their partnership with Coca-
Cola, as they were able to raise $2 million dollars for arctic conservation (“‘Arctic Home’
Generates over $2 Million in Donations for Polar Bear Conservation | Press Releases | WWF,”
2012).
Cause-Related Marketing Compatibility/Fit
Although the World Wildlife Fund advertised the success of their partnership with Coca-
Cola widely, it was not without controversy. Coca-Cola has been accused in the past to actually
be destroying the environment (e.g., “In hot water,” 2005), therefore there could be a perception
that a partnership between Coca-Cola and the World Wildlife Fund does not seem to be a natural
fit. This concept of assessing the compatibility of a brand and a cause within a CRM partnership
is commonly called CRM fit (e.g., Lafferty, Goldsmith, & Hult, 2004) or CRM compatibility
(e.g., Trimble & Rifon, 2006). CRM compatibility is an important concept within CRM
4
literature; in fact, a recent text-mining-based review of CRM literature found that brand-cause fit
(compatibility) was the most frequently occurring topic across CRM literature from 1988 to 2013
(Guerreiro, Rita, & Trigueiros, 2016). Practically speaking, CRM compatibility is important as
perceived compatibility has been shown to predict acceptance of CRM partnerships (Lafferty et
al., 2004). One could imagine that both Coca-Cola and the World Wildlife Fund would have
benefitted from understanding how consumers might accept or reject their partnership before
they entered into it and/or widely advertised it. Previous studies have looked at how
compatibility affects downstream variables such as attitudes towards partnerships and consumer
behavior (e.g., Basil & Herr, 2006; Gupta & Pirsch, 2006; Pracejus & Olsen, 2004; Simmons &
Becker-Olsen, 2006; Trimble & Rifon, 2006), but as far as I know, no studies have focused on
how to predict a consumer’s perception of compatibility in the first place. If we could understand
how to predict a consumer’s perceived CRM compatibility, then joining this together with
previous research that shows that perceptions of CRM compatibility predicts acceptance of
partnerships (e.g., Lafferty et al., 2004), there would be a possibility that we could predict this
acceptance prior to brands and causes entering into partnerships.
The realm of social media is a place where brands and causes have feeds that are
managed by individuals or groups working for those organizations. These social media managers
normally attempt to discuss topics that a brand or cause would care about, as these discussions
are also usually tied to their business mission and/or advertising strategies. As social media
usage continues to grow (A. Smith & Anderson, 2018), finding ways to use social media
analytics to predict aspects of CRM compatibility should provide great value to CRM
researchers and practitioners. This may help us to understand when social media backlash could
occur towards a CRM partnership. A recent example of CRM backlash is the case of the

5
#BoycottNRA social media campaign. After a series of recent mass shootings, consumers’
acceptance of CRM relationships between the National Rifle Association (NRA) and various
brands has substantially soured (Edevane, 2018). If I consider Lafferty et al.’s (2004) findings
that perceptions of CRM compatibility predicts CRM acceptance, then it may be helpful for the
partnering brands to understand how consumers construct their perception of CRM
compatibility. Additionally, as social media is increasingly becoming a platform for CRM
communication and advertising (Vijay, 2017), predicting aspects of CRM compatibility from
social media is an important area of investigation as well.
Therefore, to address this gap of understanding how to predict consumers’ perceived
CRM compatibility ratings, in this dissertation I will look into how consumers build their
perceptions of compatibility towards CRM partnerships (COMPPERCEIVED), namely by looking at
their pre-existing attitudes towards the brands (ATBRAND), and their pre-existing attitudes towards
the causes (ATCAUSE), that are participating in the partnership. I will also investigate how I can
understand CRM compatibility both from a survey approach, as well as a social media analytics
approach. One theory that might help in predicting this compatibility is balance theory. Basil and
Herr (2006) were the first (and quite probably, the only) researchers to investigate whether using
a balance theory framework could help us gain insight into CRM partnerships. Thus, I will
briefly explain balance theory next.
Balance Theory
Balance theory was conceptualized by Fritz Heider, in which he wrote, “Attitudes
towards persons and causal unit formations influence each other” (Heider, 1946, p. 107).
Through this statement, Heider was suggesting that when attitudinal relationships occur between
people, objects (unit formations), or some combination of people and objects, these attitudes
6
affect each other. To clarify what is an attitude, Eagly and Chaiken (1993) defined attitude as, “a
psychological tendency that is expressed by evaluating a particular entity with some degree of
favor or disfavor” (p. 1). Heider (1946) suggested that attitudinal relationships move towards a
state of balance. He defined balance as, “a harmonious state, one in which the entities comprising
the situation and the feelings about them fit together without stress” (Heider, 1946, p. 180). One
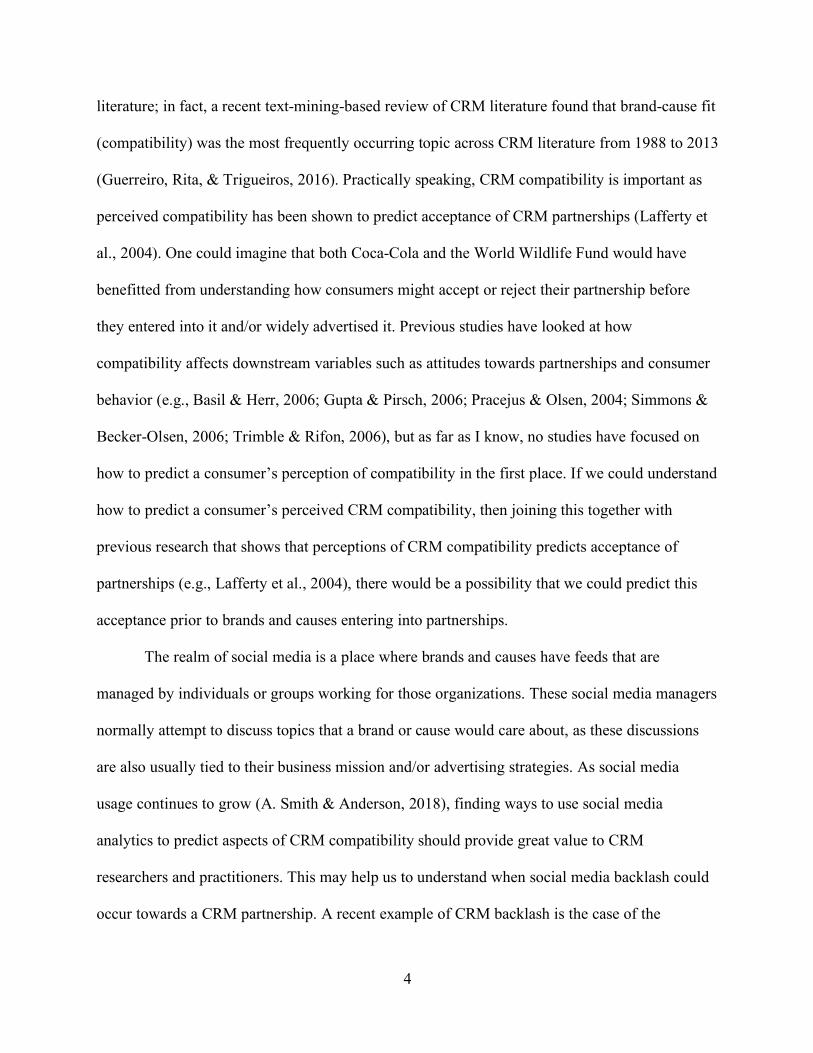
of the most well-known relationship structures of balance is the concept of triadic balance, where
three people are represented as having attitudinal relationships towards one another (see Figure
1.1).
Figure 1.1: Example of Heider’s (1946) Theory of Triadic Balance
In this example, Tina, Joe, and Tom all have relationships with each other. Positive signs
denote a positive attitude, whereas negative signs denote a negative attitude. In Heider’s original
conceptualization, directionality of attitudes was not considered, as it was assumed that if Joe
likes Tina, then Tina likes Joe. Although this is not always the case, this is in line with
explaining Heider’s original framework; this is also in line with evaluating CRM partnerships
(organizations versus people), which will be explained later in this dissertation. In Heider’s
framework, these triads are supposed to move towards attitudinal balance or harmony. In the first
triad (moving from left to right in Figure 1.1), Tina, Joe, and Tom all like each other, and

7
therefore there is a state of harmony or balance. In the second triad, Joe doesn’t like Tina, and
Tina doesn’t like Tom, so it is not a problem that Joe likes Tom. There is no inherent relational
stress in the second triad. In the third triad, Joe likes Tina, Tina likes Tom, but Joe does not like
Tom. This is a stressful relational situation. Maybe Tina would try to avoid Tom when Joe is
around, because Tina knows that Joe does not like Tom. Heider suggested that this is an
unbalanced triad, and therefore the system needs to change for balance to be restored. There are
numerous options as to how the system could change to bring it back into balance, but one of the
easiest conceptualizations of change for balance would be for Joe to reconcile with Tom and
enter into a positive relationship with each other. The fourth triad is an interesting one, as Heider
suggested that this was an unbalanced triad, but later research conceptualized this triad as
potentially balanced as well. Heider called three negative attitudes in a triad an unbalanced triad,
but Davis (1967) suggested that three negative attitudes in a triad were weakly balanced. In fact,
Davis (1967) pointed to the fact that even Heider suggested, “If two negative relations are given,
balance can be obtained either when the third relationship is positive or when it is negative,
though there appears to be a preference for the positive alternative” (Heider, 1958, p. 206). Thus,
although there is a strong tendency towards three negative relationships being imbalanced,
Heider (1958) and Davis (1967) acknowledged that there was the possibility of a weaker
tendency towards three negative relationships being balanced as well. Davis categorized this as a
condition of weak balance. I could conceptualize this when I consider the cliché, “an enemy of
my enemy is my friend.” This is essentially the second triad in Figure 1.1., where Joe doesn’t
like Tina, and Tina doesn’t like Tom, so Joe likes Tom. I can consider though that Joe does not
necessarily have to like Tom, and that would not necessarily cause relational stress on the
system. Therefore, an enemy of my enemy can also be my enemy. I accepted the condition of

8
weak balance throughout this dissertation, as weak triadic balance has been proven to hold in real
social data (Leskovec, Huttenlocher, & Kleinberg, 2010b). I will discuss Basil and Herr’s (2006)
connecting of triadic balance theory with CRM partnerships next. After this, I will move into
discussing dyadic balance theory, and its potential connection with CRM partnerships and social
media data.
Balance Theory and Cause-Related Marketing
Basil and Herr (2006) suggested that CRM partnerships could be considered as
psychological triads, in which a consumer evaluates a brand, a cause, and their perceived
compatibility between the brand and cause. Heider (1958) stated that triads could include both
persons as well as entities, and that these entities could have also have some form of unit
relationship to each other that was different than an attitudinal relationship (e.g., a person owning
an object, thus having an assumed positive attitude towards that object). Basil and Herr’s (2006)
conceptualized triad is shown in Figure 1.1.
Figure 1.2: Cause-Related Marketing Triad
I use their conceptualized CRM triad for the first major chapter of this dissertation
(Chapter 2), where I go into more detail about what Basil and Herr focused on in their study.
From a high-level perspective, they set a foundation for my study in which they showed that a

9
balance theory framework could help us understand various aspects of CRM compatibility and
attitudes towards CRM; with this said, they did not fully investigate how CRM compatibility
could be comprehensively predicted by using this balance theory framework. I took this next step
within this dissertation and found that perceived CRM compatibility (COMPPERCEIVED) could be
predicted through a consumer’s attitude towards a brand (ATBRAND), along with their attitude
towards a cause (ATCAUSE). I also question and dissect balance theory along the way.
One of the open questions within balance theory is the question of how continuous
attitude measures would affect balance (e.g., Antal, Krapivsky, & Redner, 2006). Heider’s
(1946) original conceptualization only dealt with a dichotomous handling of attitude (either
positive or negative, with no neutral), but attitudes have been shown to be continuous in nature
(Eagly & Chaiken, 1993). Recent studies in balance have shown evidence that balance holds
when attitudes are measured as continuous variables (e.g., Leskovec et al., 2010b), but less is
known about how continuous attitude measurement affects balance within CRM triads. An open
question therefore is whether using continuous attitude measures for ATBRAND and ATCAUSE (e.g.,
+2, -1, +3) versus dichotomous measures (e.g., +1, -1) will change whether or not
COMPPERCEIVED will have a valence that follows balance theory. Through measuring
participants’ ATBRAND, ATCAUSE, and COMPPERCEIVED, I assessed whether all three sides of the
CRM triad followed balance or not (BALANCECRM). I found that balance within a CRM triad
(BALANCECRM) could be predicted by looking at the degree of attitude valence differences
between a consumer’s attitude towards a brand and their attitude towards a cause (ATDIFFERENCE),
when participants had opposing valences of attitude towards a brand (ATBRAND) and their attitude
towards a cause (ATCAUSE; e.g., a consumer likes the brand but dislikes the cause). Specifically,
as the difference between a consumer’s attitude towards a brand and attitude towards a cause
10
(ATDIFFERENCE) grew larger, the probability that balance theory held grew smaller. This
conceptually makes sense, as this is basically suggesting that the further I get away from
Heider’s original conceptualization of the dichotomous attitude structure of balance theory, there
is more chance that CRM triads will be in states of imbalance (BALANCECRM = 0) versus being
balanced (BALANCECRM = 1).
The final aspect of triadic balance and CRM partnerships that I cover within this
dissertation is the question of whether adding attitude strength will benefit predictive models of
balance within CRM partnerships. Research has shown that attitude strength is a separate
construct than attitude, and that when attempting to predict behavioral change, attitude strength
is what moderates the predictive nature of attitude on behavior (Petty & Krosnick, 1995). To
clarify the difference between attitude and attitude strength, consider for example my attitudes
towards Mondays and my attitudes towards bigotry. If I was to rate my attitudes on a scale from
-5 to +5 (-5 being extremely negative, and +5 being extremely positive), my attitudes towards
Mondays and bigotry would both rate at -5. Now I know that there is something different about
those attitudes, but that difference does not show up in a simple valenced measurement of
attitude alone. The measurement that picks up on the difference in those two attitudinal arenas is
the measure of attitude strength. The strength of my attitude towards Mondays is fairly weak,
meaning that it could be easily moved. If my workplace provided free lunches on every Monday,
my attitude towards Mondays would quickly change to a +5. Since the strength of my attitude
towards Mondays is weak, it is easy to change my attitude. Now with the example of my -5
attitudes towards bigotry, free lunches would not change my attitude, because the strength of my
attitude towards that topic is very strong. In fact, there is potentially not much that I believe

11
someone could do to change my attitude on that topic. This example helps us to see the
difference between attitude and attitude strength as psychological constructs.
Balance theory suggests that attitudes may change to achieve states of balance (see
previous discussion on Figure 1.1). If balance theory considers systems in which attitudes are
potentially changed, and attitude strength is a construct that shows us how resistant attitudes are
to change, then it seems reasonable that considering attitude strength within balance theory
would be fruitful. The combination of attitude strength and balance theory has not been
previously researched within the realm of CRM partnerships. Therefore, I collected participants’
strength of their attitudes towards a brand (ASBRAND), and the strength of their attitudes towards a
cause (ASCAUSE) and found that attitude strength does improve my models in predicting balanced
CRM triads. I assessed balance within CRM triads by assessing the valences of participants’
ATBRAND, ATCAUSE, and COMPPERCEIVED. This could be potentially considered as the first step
towards a larger contribution to balance theory as a whole, but at the very least it is a furthering
of our understanding of CRM partnership evaluations.
Finally, I looked at analyzing CRM partnership attitude strengths via dyadic balance
theory and testing that relationship through survey measures as well as through social media
analytics. I explain this next, and finish with a high-level view of the overall dissertation outline.
Balance Theory, Cause-Related Marketing, and Social Media
When considering dyadic balance theory (balance theory within two person/entity
systems), Heider (1958) stated, “p similar to o induces p likes o, or p tends to like a similar o” (p.
184). Heider was suggesting that attitudes and unit formations influence each other even in two-
person situations. In this case, similarity produces some form of relational unit between two
people, and this affects their attitudes towards one another in a positive manner. Therefore,

12
Heider is suggesting that similarity influences attitude. In network analysis, a close phenomenon
to this is called homophily. McPherson et al. (2001) defines homophily as, “the principle that
contact between similar people occurs at a higher rate than among dissimilar people.” (p. 416).
This does not necessarily assume positive attitudinal contact, but it draws a connection between
similarity and behavior. Multiple studies have been conducted looking at homophily on social
networks (e.g., Choudhury, 2011; Weng & Lento, 2014; Youyou, Schwartz, Stillwell, &
Kosinski, 2017). Choudhury (2011) looked at homophily on Twitter by testing to see if there
were any factors of similarity that influenced behavior, namely behavior in how people followed
others on Twitter. The factors of similarity that she looked at were demographic attributes
(location, gender, ethnicity), political orientation, activity-specific attributes (activity pattern,
broadcasting behavior, interactiveness), and content-based attributes (topical interest, sentiment
expression). She found that people seemed to follow others on Twitter that engaged in similar
topical conversation as their own selves. Therefore, she found evidence that similarity of topic
conversation influenced behavioral movement on Twitter.
Thus, I have the case that Heider (1958) suggested that similarity influences attitude,
homophily suggests that similarity influences behavior, and Choudhury’s (2011) research
suggests that topic conversation similarity influences Twitter following. Heider did not consider
attitude strength in his original conceptualization of balance theory, but research has shown that
attitude strength moderates the ability to predict attitude change (Howe & Krosnick, 2017; Petty
& Krosnick, 1995), and balance theory involves the possibility of attitudes changing.
Additionally, previous research has shown evidence that one way to measure an individual’s
attitude strength towards a topic is if they talk about that topic, and how much they talk about it
(Krosnick, Boninger, Chuang, Berent, & Carnot, 1993).

13
Putting all of these pieces together, if a person talks about the same topics as a brand (or
cause), this suggests that they are similar (according to topics of conversation) with that brand
(or cause). According to Choudhury’s (2011) research, this similarity of topical conversation has
be found to correlate with Twitter following behavior, of which behavior is influenced by
attitude strength. Thus, I hypothesized that similarity of topics of conversations between a person
and a brand (or cause) could be a way to measure the strength of their attitude towards that brand
(or cause). As a clarifying note, attitude strength does not include valence (positive or negative),
therefore a person may have a strong attitude towards a cause because they talk about the same
topics (e.g., a person and the National Rifle Association both discussing guns), but the person
may be speaking of guns negatively, and the NRA may be speaking of the guns positively.
When considering brands and causes within CRM partnerships, they are both entities
with communications staff that promote certain topics according to their business mission or
their advertising strategies. Thus, in the second main study of my dissertation (Chapter 3), I
investigated the relationship between a consumer’s perceived similarity of topical conversation
with a brand (SURVEYSIMBRAND), and the strength of that consumer’s attitude towards the
brand (ASBRAND). I also investigated the relationship between a consumer’s perceived similarity
of topical conversation with a cause (SURVEYSIMCAUSE), and the strength of that consumer’s
attitude towards the cause (ASCAUSE). I found that a consumer’s perceived topic similarity with a
brand (SURVEYSIMBRAND) predicted the strength of their attitude towards that brand
(ASBRAND), and their perceived topic similarity with a cause (SURVEYSIMCAUSE) predicted the
strength of their attitude towards that cause (ASCAUSE). This new survey measure of the strength
of attitudes towards brands and towards causes in CRM partnerships is a contribution to the
realm of CRM, as it provides an indirect method of measuring attitude strength.

14
In the second portion of Chapter 3, I investigated if a social media analysis of the topics
that a consumer talks about could help me predict their attitude strength towards a brand or a
cause. I did this by comparing the divergence (the opposite of similarity) between a consumer’s
topics of conversation in their Twitter feed compared to the topics of conversation of a brand’s or
cause’s Twitter feed (TWEETDIVBRAND and TWEETDIVCAUSE respectively). If I can predict the
strength of consumers’ attitudes towards brands and causes via social media analytics, I will be
closer to creating a prediction model for CRM compatibility using solely social media analytics.
I did not find this social media analytics divergence method to be a way to measure the strength
of consumers’ attitudes towards a brand or a cause, but I did find that using a hybrid survey-
based and social media analytics approach may have issues that have not been previously
considered in social science research. Although there is no research using a hybrid survey-based
and social media analytics approach within the realm of CRM, there are many examples of this
type of method within social science research (e.g., J. Chen, Hsieh, Mahmud, & Nichols, 2014;
Golbeck, Robles, Edmondson, & Turner, 2011; Youyou et al., 2017). I provide an explanation of
some considerations when using this sort of hybrid method, as well as next steps in using this
sort of approach in future CRM research.
DISSERTATION OUTLINE
My aim within this dissertation is to understand how balance theory can help to give us
deeper insight into CRM compatibility, as well as how analyzing CRM compatibility could also
further our understanding of balance theory.
This dissertation contains a general introduction (Chapter 1), followed by two chapters
that are meant to be in publishable format as individual research journal papers. A summary of
these two research papers (Chapter 2 and 3) is presented below. I then conclude with a general

15
discussion on the overall findings of this dissertation (Chapter 4). Within the final chapter, I will
also discuss general limitations, future research thoughts, and indicate ways in which this
dissertation has evolved since the proposal stage.
Chapter 2 describes a study in which I was able to predict participants’ ratings of CRM
partnership compatibility (COMPPERCEIVED) via their self-reported attitude towards the brand
(ATBRAND), along with their self-reported attitude towards the cause (ATCAUSE). I was also able
to predict states of CRM triad balance/imbalance (BALANCECRM) within CRM partnership
evaluations through incorporating the consideration of continuous attitude and attitude strength
measures within balance theory. This allowed me to provide evidence that attitudes towards
brands and towards causes were spilling over into one another. I will give further detail on
spillover within Chapter 2. This study consisted of an online (N = 993) survey collection using
Amazon Mechanical Turk.
Chapter 3 describes a study in which I investigated various ways to measure attitude
strength within the realm of CRM and discussed the difficulties in comparing a survey approach
with a social media analytics approach. I asked participants how similar they believed the topics
that they talk about were with the topics that certain brands and causes talk about (the brands and
causes from my first study in Chapter 2). I found that I was able to predict participants’
assessments of the strength of their attitudes towards those brands and causes (ASBRAND and
ASCAUSE) from their perception of topic discussion similarity with those brands and causes
(SURVEYSIMBRAND and SURVEYSIMCAUSE respectively). This is a contribution to the realm of
CRM, as this is a novel way to measure strength of attitudes towards brands and towards causes
that may not suffer from social desirability bias as would a direct questioning of attitude strength.
I was not able to predict the strength of their attitudes towards brands and causes (ASBRAND and

16
ASCAUSE) through a computational analysis of participants’ Twitter feeds when compared to
topic discussion divergence (opposite of similarity) of brand’s or cause’s Twitter feeds
(TWEETDIVBRAND and TWEETDIVCAUSE respectively). I did find that my computational
method to assess the topics that brands (or causes) were talking about on Twitter produced topics
that were in line with what participants believed these brands (or causes) would be talking about.
I also share considerations and issues with using a social media analytics approach within social
science research. This study consisted of an online (N = 170) survey collection using Amazon
Mechanical Turk (a subset of the N = 993 from Chapter 2), and a data collection of Twitter social
media feed data from the participants in this study, as well as Twitter data from the brands and
causes in this study.

17
CHAPTER 2: CAN WE FIND THE RIGHT BALANCE IN CAUSE-RELATED
MARKETING? ANALYZING THE BOUNDARIES OF BALANCE THEORY IN
EVALUATING BRAND-CAUSE PARTNERSHIPS
The phenomenon of brands partnering with causes is referred to as cause-related marketing
(CRM). Some CRM partnerships may seem less compatible than others, but the level of perceived
compatibility (also referred to as “fit”) differs from consumer to consumer. We know a great deal
about how perceptions of compatibility affect attitude and behavior towards CRM partnerships,
but we know less about how to predict a consumer’s perception of compatibility. Therefore, my
purpose was to investigate the boundaries in which balance theory could be used to analyze CRM
partnerships, particularly in the context of attitude strength. This is the first study to consider the
construct of attitude strength (versus attitude alone) when considering balance theory. I found that
a consumer’s attitude towards a brand, along with their attitude towards a cause, predicts their
perceptions of CRM compatibility. I also found that CRM triadic balance could be predicted when
attitude strength was included in the models, and that balance theory allowed me to observe
preliminary evidence of attitude and attitude strength spillover effects when predicting the valence
of CRM compatibility ratings. This could be useful for advertising practitioners, as I explain how
they can use these insights to determine which organizations to partner with in the future, as well
as how advertising these partnerships may affect consumers.
18
“Unfortunately, it seems that a number of large environmental groups will not be challenging the corporate world anytime soon. Amazingly, several have "sold out" to the very companies that are destroying the environment. Some even have partnerships with the planet's most unethical corporations” (Filmore, 2013).
Fillmore’s (2013) negative remarks are in response to various environmental non-profits,
such as The World Wildlife Fund (WWF), forming business relationships with major
corporations like Coca-Cola in 2007 (“Coca-Cola | Partnerships | WWF,” 2017), or WWF
partnering recently with Royal Caribbean in 2016 (Hancock, 2016). This phenomenon of for-
profit businesses (brands) partnering with not-for-profit organizations (causes) is commonly
referred to as cause-related marketing (Varadarajan & Menon, 1988). As noted by Fillmore
(2013), some cause-related marketing (CRM) partnerships may seem more unusual or
incompatible than others, but the level of perceived compatibility (also referred to as “fit”) has
been shown to differ from consumer to consumer (Basil & Herr, 2006). Several studies have
explored how consumer perceptions of compatibility affect attitudes towards partnerships and
consumer behavior (Basil & Herr, 2006; Gupta & Pirsch, 2006; Pracejus & Olsen, 2004;
Simmons & Becker-Olsen, 2006; Trimble & Rifon, 2006), but no one has shown how we can
predict a consumer’s potential perception of compatibility prior to entering into a CRM
partnership by looking solely at their attitude towards a brand, and their attitude towards a cause.
This is important because perceived compatibility has been shown to predict acceptance of CRM
partnerships (Lafferty et al., 2004). Thus, if I could predict consumers’ potential perceived
compatibilities through their attitudes towards a brand, and their attitudes towards a cause, before
the organizations enter into a partnership, this could provide much practical value to CRM
practitioners and advertisers. Therefore, in line with this gap in understanding, my purpose was
to investigate the boundaries in which balance theory (Heider, 1946) can be used to analyze
CRM partnerships and predict consumer perceptions of CRM partnership compatibility.

19
I summarize my contributions and findings as follows: I provide a theoretical
contribution to the arena of CRM, as I found that a consumer’s current attitude towards a brand,
along with their current attitude towards a cause, predicts their perceptions of CRM
compatibility; I present a methodological contribution by contributing a means to predict
psychological balance towards CRM partnerships by incorporating both continuous attitude and
attitude strength measures into the prediction model; finally, I provide a practical contribution, as
I found preliminary evidence that spillover effects may be occurring from brands to causes (and
potentially vice versa) to affect perceived ratings of CRM compatibility. Simonin and Ruth
(1998) provided evidence that consumers’ attitudes towards brand partnerships have been found
to influence each other after they enter into a partnership (denoted by Simonin and Ruth as a
spillover effect), but this phenomenon has not been studied within CRM partnerships. The ability
to predict potential CRM compatibility perceptions, and to understand how consumers’ attitudes
and attitude strengths towards brands and causes are affected through CRM partnerships has
practical value for both brands as well as causes. As in Filmore’s (2013) previous example,
WWF and Royal Caribbean could have benefitted in understanding how people may perceive the
compatibility of their partnership prior to engaging in it. Additionally, advertisers of CRM
partnerships need to be able to understand how consumers will perceive partnerships before they
are entered into, or widely communicated.
Guiding Research Question: What are the boundaries of using balance theory to evaluate cause-
related marketing compatibility?
20
LITERATURE REVIEW
Cause-Related Marketing
Varadarajan and Menon (1988) defined CRM as follows:
Cause-related marketing is the process of formulating and implementing activities that are characterized by an offer from the firm to contribute a specified amount to a designated cause when customers engage in revenue-providing exchanges that satisfy organizational and individual objectives. (p. 60) Thus, in their definition, CRM is specifically limited to partnerships where a brand ties a
donation to a cause for every transaction that a consumer engages in with the brand. Barone,
Miyazaki, and Taylor (2000) suggest that CRM partnerships can have a broader definition, as
some CRM partnerships may not involve a direct donation to a cause per every brand purchase.
A brand could just make a large donation to a charity without any sales ties. A very recent
example of this was Royal Caribbean’s pledge to donate $5 million to the World Wildlife Fund
to support ocean conservation (Hancock, 2016). Thus, I define CRM as a business strategy in
which a brand partners with a cause through various types of engagements, to address both
organization’s objectives.
Varadarajan and Menon (1988) suggested that one of the driving factors in brands
partnering with causes is to boost sales through the association with causes that could help
brands tap into markets that were previously untapped. Brands may be attempting to associate
themselves with certain social positions to convince various segments of consumers to purchase
their products/services, such as in the case of Royal Caribbean and the WWF. This is in line
conceptually with Henderson et al.’s (1998) work in applying associative network analysis to
brands, as they found that certain concepts are associated with brands (e.g., the concept of
“value” associated with McDonald’s), and these concepts form networks with other brands and
concepts within the human mind. Thus, McDonald’s might be associated with Burger King in a

21
consumer’s mind, linked by the concept of “value”. One of the goals of CRM could be to take
the concept of “environmentally green” that is associated with the WWF and build an association
between “environmentally green” with Royal Caribbean by positioning a partnership between
WWF and Royal Caribbean.
However, the brands and causes entering into CRM partnerships may not have entirely
compatible associations. For example, while intentions of ocean conservation might seem
enticing, we have evidence that cruises themselves are contributing to the decline in ocean health
due to water and air pollution (Moodie, 2016). Therefore, there is the possibility that consumers
might reject the association between Royal Caribbean and WWF. Much research has been
conducted to analyze the effects of how CRM “fit” or “compatibility” influences consumer
behavior in response to CRM partnerships, but there is a gap in understanding what
psychological constructs contribute to the formation of this compatibility perception in each
consumer.
Cause-Related Marketing Compatibility/Fit
Assessing the fit between partnering companies has been studied not just in CRM
partnership research, but brand partnership research in general. Simonin and Ruth (1998) looked
at the phenomenon of brand partnerships (corporations partnering with corporations), and
analyzed the effects that these partnerships had on consumer attitudes towards those
partnerships. One of the factors found to affect consumer attitudes was the level of fit between
the two companies that formed a partnership together. They described fit to be the level of
cohesiveness and/or consistency that partnering brands possessed. Fit has also been found to be
important in CRM partnerships, and has been found to affect cause-brand partnership attitude
(Basil & Herr, 2006; Lafferty et al., 2004; Trimble & Rifon, 2006), brand equity (Simmons &
22
Becker-Olsen, 2006), consumer choice (Pracejus & Olsen, 2004), and purchase intentions (Gupta
& Pirsch, 2006). Guerreiro et al. (2016) recently conducted a text-mining analysis of journal
articles on the subject of CRM between 1988 and 2013, and found that brand-cause fit was the
most frequently used topic across the articles. Thus, it seems that the concept of fit is an
important topic within CRM research. Trimble and Rifon (2006) suggested that the term
“compatibility” is a more comprehensive term from all the terms that have previously been used.
Since compatibility is a term that conveys the meaning of these terms more naturally, I use the
term compatibility throughout this study.
In previous studies, researchers directly measured how participants rated compatibility
between brands and causes through self-reported survey measures (Gupta & Pirsch, 2006;
Lafferty et al., 2004; Myers & Kwon, 2013), asking questions such as how congruent,
compatible, or consistent were the CRM partnerships between the brands and causes. This is the
first study that attempts to dissect how participants construct that rating psychologically. For
example, this rating might be based on objective comparisons of the stated missions of the brand
and the cause, or it might be based more on subjective attitudes. Basil and Herr (2006) provided
a balance theory approach to investigate how attitudes towards a brand and a cause affect
attitudes towards CRM partnerships. Although it was not the focus on their study, they found
some interesting connections between balance theory and components of CRM compatibility. I
will review balance theory and Basil and Herr’s (2006) work next.
Balance Theory and CRM Triads
Heider (1946) wrote, “Attitudes towards persons and causal unit formations influence
each other” (p. 107). Thus, in this statement, Heider was acknowledging that people can have
attitudes towards other individuals as well as entities, and these attitudes influence each other.

23
Eagly and Chaiken (1993) defined attitude as, “a psychological tendency that is expressed by
evaluating a particular entity with some degree of favor or disfavor” (p. 1). Heider suggested that
attitudinal relationships move towards balanced states. A balanced state is explained as, “a
harmonious state, one in which the entities comprising the situation and the feelings about them
fit together without stress” (Heider, 1958, p. 180). Historically, work on balance has focused on
Heider’s triadic relationship work (three person or entity relationships). In a three-person triad
(with the three people being denoted as “A, B, and C”, “+” denotes mutual liking, and “-”
denotes mutual dislike), Heider hypothesized that balance (triadic balance) would be found in the
case where A+B, B+C, and A+C (all positive attitudinal sentiments in this triangle of
relationships). Balance can also occur when two relationships in the triad are negative and one is
positive. So, if I think of A-B, B-C, and A+C, this would also be balanced; in this case, A and C,
who are friends, have a mutual enemy of B. Heider added that individuals can have relationships
with entities as well, such as an individual owning a piece of property; this type of relationship
was not denoted as an attitudinal relationship, but rather just a positive association with an
object, and these unit formations fell under the umbrella of triadic balance theory as well.
As a slight departure from Heider’s original balance theory, Davis (1967) suggested that
an all negative relationship is a balanced state as well (e.g., an enemy of my enemy can still be
my enemy without apparent tension in the system). Including this additional state of balance is
considered assessing balance via weak balance (Easley & Kleinberg, 2010), and I incorporated
weak balance into this study.
Balance theory has been incorporated into consumer psychology research (Woodside &
Chebat, 2001), and more specifically, Basil and Herr (2006) took this triadic balance theory
framework and applied it to the realm of CRM partnerships. They pointed to the fact that Heider

24
(1958) specifically indicated that entities could have relationships to each other, and these
relationships were called unit relationships. Basil and Herr (2006) conceptualized CRM
partnerships as being a consumer, brand, and cause triad as shown in Figure 2.1. Instead of
conceptualizing the relationship between the brand and the cause as attitudes between the two
organizations, they suggested that we could view this triad as a one-way psychological
evaluation of a CRM partnership from the perspective of a consumer. Thus, they conceptualized
the relationship between the brand and the cause as a consumer’s assessment of the compatibility
between the brand and the cause.
Figure 2.1: Cause-Related Marketing Triad
Their focus was taking this CRM triad and using the balance theory framework to predict
aspects of participants’ attitudes towards CRM partnerships. They found that when consumers’
attitudes towards brands and their attitudes towards causes were both negative (consumer-brand
and consumer-cause), participants rated the partnerships to be appropriate, but not necessarily
appealing. This is important because they showed that there was a predictive relationship
between an attitude combination and ratings of appropriateness for the CRM partnerships. With
this said, they did not provide a comprehensive predictive model for taking separate attitudes
towards a brand and a cause and predicting CRM compatibility. Thus, I hypothesize that a
consumer’s attitude towards a brand (ATBRAND), along with their attitude towards a cause

25
(ATCAUSE), should positively predict a consumer’s perception of CRM compatibility
(COMPPERCEIVED) in CRM triads.
H1: Consumers’ attitudes towards a brand (ATBRAND), along with their attitudes towards a cause (ATCAUSE), will positively predict their perceptions of CRM compatibility (COMPPERCEIVED) in CRM triads.
Being able to predict CRM compatibility is important because we have evidence that
CRM compatibility predicts acceptance of CRM partnerships (Lafferty et al., 2004). Now this
hypothesis does not necessarily assume that all CRM triads will be balanced, but rather that
consumers’ attitudes towards brands and their attitudes towards causes can predict perceptions of
CRM compatibility.
The Boundaries of Predicting CRM Triadic Balance
In the original conceptualization of balance theory, all attitude relations were equal in
extremities (e.g., 1, 1, 1), but with potentially opposing valences (e.g., +1, -1, -1). In fact, even a
recent analysis of balance theory in online social networks only used two categorical conditions,
either positive or negative, in testing balance theory (Leskovec et al., 2010b), but attitudinal
evaluations have been shown to be continuous in nature (Eagly & Chaiken, 1993). How does
considering continuous attitudinal evaluations affect how we think about balance theory (e.g.,
instead of -1, +1, -1, we consider +5, -2, +3)? Previous research has entertained this exact
question, as Antal et al. (2006) concluded their research within social networks with the open
question of how continuous edge values affect balance theory (attitudes in triads can also be
called edges). Kułakowski et al. (2005) entertained the effect of continuous edge values on
mathematical models that simulated balance theory effects, and found that over time, continuous
edge values appear to also move towards balanced states. Marvel et al. (2011) also found this to
be the case with network graphs that were much larger than just an individual triad, but the
26
process of getting to a balanced state occurs over a period of time (all the triads within a larger
system end up balanced). When considering these continuous edge values and the transition
period from unbalanced to balance states, there is even the possibility that triads can end up in a
“jammed” state of imbalance (Antal, Krapivsky, & Redner, 2005), meaning that triads got stuck
in states of imbalance (e.g., a triad sits stuck at an imbalanced state of A+B, B-C, A+C, even
though this triad should move to a balanced state). Thus, I suggest that the expectation of CRM
triads being balanced is dependent on looking at the differences between separate continuous
attitudes towards brands and causes in which the valences are opposing each other. Let us
consider a clarifying example through Figure 2.2.
Figure 2.2: Separate Attitudes Difference to Predict Balance Example
John has a very negative attitude regarding Royal Caribbean (ATBRAND), and a very
positive attitude regarding WWF (ATCAUSE). John’s attitude towards Royal Caribbean and his
attitude towards WWF are identical in their extremities (ATDIFFERENCE = 0), but their valences are
opposing one another. This is a situation similar to which triadic balance theory was originally
27
conceptualized (Heider, 1958), and thus I predict that this triad would be balanced
(BALANCECRM = 1) when looking at the valences of ATBRAND, ATCAUSE, and COMPPERCEIVED.
Conversely, let us consider a consumer named Mary. She has a slightly negative attitude
regarding Royal Caribbean (ATBRAND), and a very positive attitude regarding WWF (ATCAUSE).
Mary’s attitude towards Royal Caribbean and attitude towards WWF are different in their
extremities (ATDIFFERENCE = 4, when taking the absolute values of ATBRAND and ATCAUSE), and
their valences are also opposing one another. Although Mary’s attitude towards Royal Caribbean
is negative, it is only slightly negative. This is now a situation that is not similar to which balance
theory was originally conceptualized, as the attitudes are continuous, and the extremity
difference between the separate attitudes (ATDIFFERENCE) is large.
As a clarification to my method in calculating ATDIFFERENCE, the reason I am using the
absolute values of ATBRAND and ATCAUSE is because I am focusing on the magnitude differences
between each attitude. In the example of John and Mary from Figure 2.2, John’s attitudes were
closer to the originally conceptualized balance theory by Heider (1946) as their magnitudes were
equal (ATBRAND = -5 and ATCAUSE = +5) even though their valences were different. Therefore, in
an attitude scale ranging from -5 to +5, one example of a combination of attitudes that are
furthest away from Heider’s (1946) originally conceptualized dichotomous structure of equal
magnitude valences (+1 and -1) would be Mary’s example from Figure 2.2 (ATBRAND = -1 and
ATCAUSE = +5, which leads to ATDIFFERENCE = 4 when taking the absolute values first of ATBRAND
and ATCAUSE). If I did not take the absolute values of ATBRAND and ATCAUSE first, but rather just
subtracted the values and then taken the absolute value of the result, this would not be in line
with comparing how far continuous attitudes take me from original balance theory (or keeps me
close to original balance theory). Looking at John’s example (ATBRAND = -5 and ATCAUSE = +5),

28
if I did not take the absolute values first of ATBRAND and ATCAUSE, ATDIFFERENCE would either
equal +10 or -10, depending on how you ordered the subtraction. This is against the goal of my
analysis, which is to create a variable that represents how close I am to original balance theory.
By taking the absolute values of ATBRAND and ATCAUSE for John first and subtracting the lesser
from the greater, I obtain an ATDIFFERENCE = 0, which is exactly the value I am looking for. This
also allows me to analyze attitudes with the same valence, but that have large differences in
magnitude (e.g., ATBRAND = +5 and ATCAUSE = +1, which still leads to ATDIFFERENCE = 4 when
taking the absolute values first of ATBRAND and ATCAUSE).
Simonin and Ruth (1998) found that when brands enter into partnerships with other
brands, their post-partnership attitudes changed the separate attitudes towards each of the brands
(which they called a “spillover effect”). More specifically, they found that in these brand
alliances (a brand partnering with another brand), consumers’ pre-existing attitudes towards each
brand affect their attitudes towards the partnership as a whole, and these attitudes towards the
partnership then change their post-partnership attitudes towards each brand. Thus, we have
evidence that attitudes towards entities in a partnership are spilling into (or influencing) one
another. As a clarification of this spilling or influencing effect, Osgood and Tannenbaum (1955)
found that more extreme attitudes tended to hold greater influence on end states of psychological
congruity when paired with less extreme attitudes. This is a concept very similar to balance
theory, as Osgood and Tannenbaum (1955) suggested that when previously independent attitudes
are paired together in some form of relationship (e.g., I do not like ice cream, but I do like the
flavor of chocolate, and now I am being presented with chocolate ice cream), this relationship
would change an individual’s attitudes (e.g., I might decide that I like ice cream a bit more,
maybe chocolate a bit less, or some combination of both). Thus, putting together insights from
29
Heider (1946), Simonin and Ruth (1998), and Osgood and Tannenbaum (1955), I should find
evidence that Mary’s attitude towards Royal Caribbean and her attitude towards the WWF will
spill into one another.
Thus, Mary may evaluate the CRM partnership to be positively compatible even though it
does not create a balanced CRM triad (ATBRAND is negative, ATCAUSE is positive, and
COMPPERCEIVED is positive, which is not a balanced triad). Therefore, the key to predicting
whether or not balance will hold in this CRM triad depends on the difference between the
extremities (ATDIFFERENCE) of Mary’s attitude towards the brand (ATBRAND), and her attitude
towards the cause (ATCAUSE). The larger that the difference (ATDIFFERENCE) grows, the further I
am getting away from Heider’s (1946) original balance theory. Therefore, in Mary’s case, a
CRM triad may not be balanced, but it may still result in a compatible partnership
(COMPPERCEIVED is positive, but BALANCECRM = 0). Thus, I am hypothesizing that as the
difference between consumers’ separate attitudes (ATDIFFERENCE) increases, the probability that
CRM triads will be balanced (BALANCECRM) will decrease.
H2: As the difference between the absolute values of consumers’ attitudes towards the brand and their attitudes towards the cause (ATDIFFERENCE) increases, the probability that CRM triads are balanced (BALANCECRM) will decrease.
Brands and causes have much to gain from understanding when unbalanced evaluations
occur in consumers. In Heider’s (1958) discussion on balance, unbalanced states were considered
as suboptimal, but unbalanced states may actually be positive situations for CRM partnerships. If
I revisit Mary’s situation, this is a case where the slightly disliked Royal Caribbean has the
potential to gain from a CRM partnership with the extremely liked WWF.
Now that I have looked at predicting balance through differences in attitudes
(ATDIFFERENCE), I would like to discuss a way to improve my predictive model by adding the
30
additional factor of attitude strength. Attitude strength has been shown to predict psychological
movement better than measures of attitude alone (Petty & Krosnick, 1995), therefore attitude
alone may not be able to give me a full picture of how balance theory may be affected by
continuous attitudinal values. Thus, I will discuss the difference between attitude and attitude
strength next.
Attitude and Attitude Strength within CRM triads
Attitudes are often measured with scales ranging from negative to positive extremities
(e.g., -5 to +5, Eagly & Chaiken, 1993), but one of the issues with this scale is that it does not
consider attitude strength. Petty and Krosnick (1995) defined attitude strength as the degree to
which attitudes possess the features of persistence, resistance to change, impact on information
processing and judgments, and guiding behavior. Attitude strength is a construct distinct from
attitude, and often measured with a positive scale (e.g., +1 to +11, Bassili, 1996). Since there is
evidence that attitude strength moderates the relationship between attitudes and behaviors (Petty
& Krosnick, 1995), adding attitude strength to my evaluation should improve my prediction of
balance. Since I am using logistic regression (as detailed in the methods section), I will look at
the change in Akaike information criterion (∆AIC) to assess whether the predictive model was
improved by the addition of attitude strength.
H3: Adding the measurement of attitude strength (ASBRAND and ASCAUSE) will improve the models (∆AIC) for predicting CRM triadic balance (BALANCECRM).
Let us go back to my example with John and Mary, but with the addition of attitude
strength to my model (See Figure 2.3).

31
Figure 2.3: Attitude X Attitude Strength Difference to Predict Balance Example
Let us say that John has a very negative attitude (ATBRAND) and very strong attitude
(ASBRAND) regarding Royal Caribbean, and a very positive (ATCAUSE) and very strong attitude
(ASCAUSE) regarding WWF. Although original balance theory did not consider attitude strength,
this is still a situation in which equal extremities of attitude and attitude strength
(ATASDIFFERENCE = 0) are close to the conceptualization of original balance theory, and thus I
predict that there is a greater probability that the CRM triad will be balanced (BALANCECRM =
1).
The major difference in my example comes into play if I consider Mary once again. Let
us consider that she has a slightly negative attitude (ATBRAND) regarding Royal Caribbean, but
that attitude is very weak in strength (ASBRAND); conversely, she has a very positive attitude
(ATCAUSE) regarding WWF, and that attitude is very strong in strength (ASCAUSE). Compared to
my previous consideration of Mary, since I have additional information as to the strength of
Mary’s attitudes towards WWF, my ability to predict balance should be improved with the
addition of attitude strength to my model. In my previous prediction model (hypothesis 2),

32
attitude alone was considered first, as original balance theory was only based on attitudes. With
this said, since psychological movement is better predicted by attitude strength (Petty &
Krosnick, 1995), this model should provide more predictive insight.
H4: As the difference between the absolute values of consumers’ attitudes x attitude strengths towards the brand and their attitudes x attitude strengths towards the cause (ATASDIFFERENCE) increases, the probability that CRM triads are balanced (BALANCECRM) will decrease.
METHODS
Pre-Test
My first task was to identify CRM partnerships to analyze for this study, as I wanted to
see how my predictions differed across a wide range of levels of average compatibility. Thus, I
tested to find three real CRM partnerships that were, on average, perceived as having high
compatibility, average compatibility, and low compatibility. The four CRM partnerships that I
pre-tested were Fitbit and American Heart Association (FitbitAHA), Royal Caribbean and the
World Wildlife Fund (RoyalWWF), Grey Goose and the National Gay and Lesbian Task Force
(GreyGooseNGLTF), and Wyndham Hotels and the National Rifle Association
(WyndhamNRA). I recruited thirty-seven staff members from a Midwest university to participate
in my pre-test. I chose university staff members due to their range of ages being closer to my
intended main study participants (rather than being limited to the ages of a college student
sample). This was important since my main study was going to use Amazon MTurk as its
sample, and Amazon MTurk has workers from 18 years old to 60+ years old (J. Ross, Zaldivar,
Irani, & Tomlinson, 2010). They were asked to evaluate how compatible each of the partnerships
were (COMPPERCEIVED) on an 11-point scale from -5 (Not compatible at all) to +5 (Extremely
compatible). For example, to assess a participant’s perception of CRM compatibility towards the
partnership between Royal Caribbean and the WWF, I asked, “How compatible do you think this

33
partnership is between Royal Caribbean and the World Wildlife Fund for Nature?” This
compatibility measure was adapted from Basil and Herr (2006), as they asked how strong
participants perceived CRM alliances to be on a -5 to +5 scale. The results were recoded to a
positive 11-point scale (one through eleven) for statistical analyses.
Due to violations of normality in the data when conducting Shapiro-Wilks normality
tests, I used nonparametric measures to compare means. Using a Kruskal Wallis test, I found that
on average, FitbitAHA was rated as having high compatibility (MCOMP_PERCEIVED=10.11,
SD=1.95), RoyalWWF as having average compatibility (MCOMP_PERCEIVED =6.23, SD=2.68),
GreyGooseNGLTF as having average compatibility (MCOMP_PERCEIVED =5.46, SD=2.89), and
WyndhamNRA as having low compatibility (MCOMP_PERCEIVED =3.59, SD=2.31); the differences
overall were significant (H(3)=73.28, p=.00) when compared against each other. With this said,
when conducting Mann-Whitney pairwise comparisons, I found that all comparisons were
significant (p<.01) except that GreyGooseNGLTF (MCOMP_PERCEIVED =5.46, SD=2.89) was not
significantly different from RoyalWWF (U=9.97, p=1.00), and GreyGooseNGLTF was not
significantly different from WyndhamNRA (U=22.51, p=.14). Therefore, I excluded
GreyGooseNGLTF and kept RoyalWWF as my average compatibility partnership.
Participants
For the main study, I collected survey responses from participants through Amazon
Mechanical Turk (MTurk) from September 6, 2017 to September 20, 2017. MTurk has been
found to be at least as reliable as data obtained by traditional methods (Buhrmester, Kwang, &
Gosling, 2011), and although there has been some controversy with regards to its validity when
being used for research studies, various studies have given insights into how to best manage
studies utilizing MTurk for use in research (Chandler & Shapiro, 2016; Mason & Suri, 2012).

34
They suggested things such as disguising the purpose of the study until the task was accepted,
monitoring evidence of cross-talk, and paying a fair wage. I followed these principles as I made
sure that the MTurk advertisement did not divulge the purpose of the study until workers
accepted, I made sure that finalization codes were randomized at the end of the survey to make
sure that workers were not sending codes to each other, and I calculated a fair wage. I used
Qualtrics to estimate the survey time length (eight to twelve minutes), multiplied that time to a
percentage of United States minimum wage, and compensated each participant accordingly
($1.45 each). Also, recently Kees et al. (2017) provided evidence that MTurk is a very good
platform for collection data for advertising research, and they also focused on the issue of paying
a fair wage to increase participant engagement.
I collected N=997 responses, but four participants were removed after reviewing the data.
One participant came very close to explaining what they thought the purpose of this study was,
one participant stated that they were confused as to what they were supposed to be doing, and
two participants expressed anger and annoyance at filling out the survey. Therefore, N=993
responses were analyzed for this study.
Measures
I collected attitude measures towards the brands (ATBRAND), and attitude measures
towards the causes (ATCAUSE) on 11-point scales from -5 (Extremely negative) to +5 (Extremely
positive), drawn from Basil and Herr (2006). For example, to assess a participant’s attitude
towards Royal Caribbean, I asked, “How would you rate your attitude towards Royal Caribbean
International?” I also collected attitude strength measures towards the brands (ASBRAND), and
attitude strength measures towards the causes (ASCAUSE), measured on 11-point scales from +1
(Not strong at all) to +11 (Extremely strong), which was adapted from Bassili (1996). As an
35
example, to assess a participant’s attitude strength towards Royal Caribbean, I asked, “How
strong is your attitude toward Royal Caribbean International?” I also asked a question assessing
the participant’s perception of CRM compatibility (COMPPERCEIVED) on an 11-point scale from -
5 (Not compatible at all) to +5 (Extremely compatible), which was adapted from Basil and Herr
(2006). For example, to assess a participant’s perception of CRM compatibility towards the
partnership between Royal Caribbean and the WWF, I asked, “How compatible do you think this
partnership is between Royal Caribbean and the World Wildlife Fund for Nature?” Each
participant was presented with all three partnerships, but the order of partnerships was presented
randomly. Additionally, for each partnership that was presented to the participants, the
presentation order of the brand and cause was also randomized. See Appendix 1 for the survey
instrument.
Analyses
To test the robustness of my results, I separated my analyses by each partnership to see if
my hypotheses were supported across a wide range of average perceived compatibilities.
Additionally, COMPPERCEIVED was recoded to a positive 11-point scale to better interpret the
statistical results.
For hypothesis 1, I used multi-regression analysis with the participant’s ATBRAND and
ATCAUSE as the predictor variables, and COMPPERCEIVED as the outcome variable. To test
hypotheses 2-4, I calculated four derived variables from this subset of data. I computed the first
variable, BALANCECRM, by categorizing each participant’s results, either balanced or not
balanced, by looking at the valences of ATBRAND and ATCAUSE, and the valence of their
COMPPERCEIVED. As a note, if an attitude value was zero, I removed these participants from the
testing of hypotheses 2-4. Heider’s (1958) balance theory does not consider neutral (a value of

36
zero) attitudes, and even recent balance theory work in real world social networks does not
include the analysis of neutral edges (Antal et al., 2006; Leskovec, Huttenlocher, & Kleinberg,
2010a). I discuss this further in the limitations and future research section.
I then computed the second variable, ATDIFFERENCE, by taking the absolute value of a
participant’s ATBRAND and ATCAUSE and subtracting the greater attitude value from the lesser
attitude value (e.g., the absolute value of -1 subtracted from the absolute value of +5 equals 4,
see Figure 2.2 for this example). Once ATDIFFERENCE was constructed, I ran a logistic regression
to see if an increasing ATDIFFERENCE would decrease the probability of BALANCECRM to test
hypothesis 2.
For hypotheses 3 and 4, I created the third variable, ASDIFFERENCE, by taking a
participant’s ASBRAND and their ASCAUSE and subtracting the lesser value from the greater value.
Finally, I computed the fourth variable, the ATASDIFFERENCE. I did this by first multiplying a
participant’s ATBRAND by their ASBRAND. Then I multiplied a participant’s ATCAUSE by their
ASCAUSE. Finally, I took the absolute values of both these results (for the same reason I took
absolute values as previously explained for ATDIFFERENCE), and subtracted the greater from the
lesser (e.g., -1 x +3 subtracted from +5 x +11 equals 52; see Figure 2.3 for this example); this
fourth variable functioned as the interaction variable in my analyses. Then I ran a logistic
regression to see if an increasing ATDIFFERENCE, ASDIFFERENCE, and ATASDIFFERENCE increases the
probability of BALANCECRM and strengthens my model.
RESULTS
By conducting manipulation checks using an one-way ANOVA test, I found that on
average, FitbitAHA was rated as having high compatibility (MCOMP_PERCEIVED =9.86, SD=1.57),
RoyalWWF as having average compatibility (MCOMP_PERCEIVED =7.57, SD=2.64), and

37
WyndhamNRA as having low compatibility (MCOMP_PERCEIVED =5.72, SD=3.41), and all three
were significantly different from one another (F(2,2976)=868.10, p=.00).
Hypothesis 1 stated that ATBRAND and ATCAUSE should predict COMPPERCEIVED in CRM
triads. Multiple regression analyses showed that hypothesis 1 was fully supported (see Table
2.1).
Table 2.1: Predicting CRM Compatibility with Attitude
Partnership Variables B SE B ß t p R2
Fitbit & American
Heart Association (N = 993)
Constant 6.08 .26 - 23.73 .00
.20 ATBRAND .26 .02 .33 10.95 .00
ATCAUSE .18 .03 .21 6.86 .00
Royal Caribbean & World Wildlife
Fund (N = 993)
Constant 2.38 .44 - 5.40 .00
.15 ATBRAND .44 .04 .32 10.60 .00
ATCAUSE .23 .04 .16 5.20 .00
Wyndham Hotels & National
Rifle Association (N = 993)
Constant 1.22 .36 - 3.38 .00
.28 ATBRAND .21 .05 .12 4.09 .00
ATCAUSE .43 .03 .48 17.16 .00
DV – COMPPERCEIVED
Hypothesis 2 stated that as ATDIFFERENCE increases, the probability that BALANCECRM is
balanced will decrease. Logistic regression analyses showed that ATDIFFERENCE significantly
predicted BALANCECRM, for RoyalWWF and WyndhamNRA, but not for FitbitAHA (see Table
2.2). For logistic regression, the odds ratio is the change in odds; when the odds ratio is under 1,

38
this tells me that as the predictor increases (ATDIFFERENCE), the odds of the outcome occurring
decreases (BALANCECRM). For WyndhamNRA, I found the odds ratio to be .82. Thus, in the
case of RoyalWWF and WyndhamNRA, hypothesis 2 was supported, but when I considered
each of the three partnerships, hypothesis 2 was only partially supported. Sample sizes for the
analyses were less than the sample sizes in hypothesis 1 because neutral attitudes were removed
from the analysis of hypotheses 2-4. This is discussed further in my limitations and future
research section.
Table 2.2: Predicting Balance with Attitude Differences
Partnership Variables B 95% CI for Odds Ratio p AIC Lower Odds Upper
Fitbit & American Heart
Association (N = 758)
Constant 2.44 7.87 11.45 17.23 .00 423.47
ATDIFFERENCE .01 .81 1.01 1.29 .92
Royal Caribbean & World
Wildlife Fund (N = 584)
Constant 1.98 4.95 7.15 10.58 .00 537.32
ATDIFFERENCE -.26 .64 .77 .93 .01
Wyndham Hotels &
National Rifle Association (N = 452)
Constant 1.54 3.29 4.67 6.76 .00
475.35 ATDIFFERENCE -.20 .67 .82 1.00 .05
DV – BALANCECRM
Hypothesis 3 stated that adding the measurement of attitude strength will strengthen the
models for predicting BALANCECRM. My prediction models were strengthened by the addition
of ASBRAND and ASCAUSE for FitbitAHA (∆AIC=-49.57), RoyalWWF (∆AIC=-9.99), and
WyndhamNRA (∆AIC=+2.84) (see Table 2.3). The Akaike Information Criterion (AIC)
estimates the quality of a model, relative to another model. When the change in AIC is negative,

39
that means the model was improved. Thus, in the case of FitbitAHA and RoyalWWF, hypothesis
3 was supported, but when I considered each of the three partnerships, hypothesis 3 was only
partially supported.
Table 2.3: Predicting Balance with Attitude X Attitude Strength Differences
Partnership Variables B 95% CI for Odds
Ratio p ∆AIC
Lower Odds Upper
Fitbit & American Heart Association
(N = 758)
Constant 2.96 12.47 19.22 30.82 .00
-49.57 ATDIFFERENCE -.43 .42 .65 .99 .04
ASDIFFERENCE -.80 .36 .45 .56 .00
ATASDIFFERENCE .12 1.08 1.13 1.19 .00
Royal Caribbean & World Wildlife
Fund (N = 584)
Constant 2.12 5.63 8.29 12.52 .00
-9.99 ATDIFFERENCE -.39 .48 .67 .93 .02
ASDIFFERENCE -.27 .66 .76 .88 .00
ATASDIFFERENCE .04 1.01 1.04 1.08 .02
Wyndham Hotels & National Rifle Association (N = 452)
Constant 1.50 3.09 4.48 6.63 .00
+2.84 ATDIFFERENCE -.33 .52 .72 .99 .04
ASDIFFERENCE -.00 .86 1.00 1.15 .98
ATASDIFFERENCE .01 .98 1.01 1.05 .38
DV – BALANCECRM
Hypothesis 4 stated that as ATASDIFFERENCE increases, the probability that
BALANCECRM is balanced will decrease. When I added attitude strength into the model, logistic

40
regression analyses showed that when ATDIFFERENCE increased, the probability that
BALANCECRM was balanced significantly decreased across all three partnerships, in line with
my hypothesis 4. Logistic regression also showed that when ASDIFFERENCE increased, the
probability that BALANCECRM was balanced significantly decreased in FitbitAHA and
RoyalWWF, but not for WyndhamNRA, which was partially in line with my hypothesis 4. With
this said, when ATASDIFFERENCE increased, the probability that BALANCECRM was balanced
significantly increased for FitbitAHA and RoyalWWF, which was against the direction of my
hypothesis 4. Thus overall, hypothesis 4 was only partially supported (see Table 2.3).
GENERAL DISCUSSION
My objective was to analyze CRM partnerships using a balance theory framework. Basil
and Herr (2006) took this triadic balance theory framework and applied it to the realm of CRM
partnerships, but they did not attempt to predict CRM compatibility from consumers’ separate
attitudinal ties to the brand and the cause. This is important because we have evidence that CRM
compatibility predicts acceptance of CRM partnerships (Lafferty et al., 2004). I found that
consumers’ attitudes towards a brand (ATBRAND), along with their attitudes towards a cause
(ATCAUSE), did in fact positively predict their perceptions of CRM compatibility
(COMPPERCEIVED) in CRM triads (see Table 2.1). One might think that a consumer would
evaluate the compatibility of a CRM partnership through an objective evaluation (without
attitudinal bias) of the compatible missions and attributes of the brand and cause, but I found
evidence that CRM partnership compatibility is strongly influenced by pre-existing attitudes.
This has important managerial relevance, as brands and causes cannot just rely on logically
compatible partnerships leading to consumers positively accepting CRM partnerships. This also
opens the door for partnerships that may not make the most logical sense when objectively

41
comparing the missions and attributes of the brand and cause. If the general public, on average,
has positive attitudes towards the brand, and positive attitudes towards the cause, this partnership
might end up being positively accepted, even if the objective missions of the brand and the cause
are at odds with each other. This also gives more evidence that advertisers of brands and causes
may want to make sure they do their due diligence to raise the publics’ attitudes towards a brand
and attitudes towards a cause, so that they are both positive (on average), before they enter into a
partnership, rather than relying on the partnership itself to raise attitudes towards the brand
and/or the cause. In 2010, KFC partnered with the breast cancer advocacy group Susan G.
Komen for the Cure to donate money to breast cancer research when people bought fried chicken
at KFC. This partnership was ridiculed as an incompatible partnership due to the illogical pairing
of unhealthy fried chicken with a health cause, with news headlines strongly challenging the
CRM partnership by stating, “What the cluck?” (Hutchinson, 2010). However, KFC has also
been rated as one of America’s most hated fast-food restaurants (Picchi, 2015), thus this
partnership may have gone wrong due to general attitudes towards KFC rather than the objective
incompatibility of the missions of the two entities.
I also looked at the issue of balance within CRM triads. The original conceptualization of
balance theory did not consider continuous attitude measures, and therefore I predicted that
incorporating the continuous nature of attitudes into my analyses would help me predict when
CRM triads would become unbalanced. I predicted that as the difference (ATDIFFERENCE) between
the absolute values of the consumers’ attitudes towards the brand (ATBRAND) and their attitudes
towards the cause (ATCAUSE) increases, the probability that CRM triads are balanced
(BALANCECRM) will decrease. I found that this was only supported in the two cases of
FitbitAHA and RoyalWWF (see Table 2.2). The likely reason that my hypothesis 2 was only

42
partially supported could be due to previous research suggesting that attitude strength must be
incorporated into my models when attempting to predict psychological movement (Petty &
Krosnick, 1995). Therefore, my third hypothesis looked at whether or not adding attitude
strength would strengthen my model for predicting balance, as attitude strength was not
previously considered when evaluating CRM triads. As far as I know, attitude strength has also
not been previously incorporated into balance theory. I hypothesized that adding attitude strength
into my model would strengthen the prediction of balance, and this held true for FitbitAHA and
RoyalWWF, but not for WyndhamNRA. The predictive model for balance in the case of
WyndhamNRA was basically unchanged with the addition of attitude strength (∆AIC=+2.84),
whereas the other two models were improved. Although this was only partial support for
hypothesis 3, when I added attitude strength, I was able to predict balance for all three
partnerships in line with hypothesis 4 (see Table 2.4). In all three cases, when attitude strength
was included in the models, as the difference between consumers’ attitudes towards the brand
and their attitudes towards the cause (ATDIFFERENCE) increased, the probability that CRM triads
were balanced (BALANCECRM) decreased, which followed the direction of hypothesis 4. This
provided evidence that more extreme attitudes are spilling into less extreme attitudes (and
possibly vice versa, which again will be discussed in my limitations section) and affecting the
valence of participants’ perceived compatibility ratings. I was only able to see this effect across
all three partnerships when I included attitude strength into the predictive models. Thus,
measuring attitude strength proved to be important when predicting balance in CRM
partnerships.
With regards to the main effect of ASDIFFERENCE, in the cases of FitbitAHA and
RoyalWWF, as the difference between the strength of consumers’ attitudes towards the brand

43
and the strength of their attitudes towards the cause (ASDIFFERENCE) increased, the probability that
CRM triads were balanced (BALANCECRM) decreased, which followed the direction of
hypothesis 4. This also provided evidence that for FitbitAHA and RoyalWWF, stronger attitudes
were spilling into weaker attitudes (and possibly vice versa, which again will be discussed in my
limitations section) and affecting the valence of participants’ perceived compatibility ratings.
This was not true though for WyndhamNRA.
Unexpectedly though, as the difference between consumers’ attitudes x attitude strengths
towards the brand and their attitudes x attitude strengths towards the cause (ATASDIFFERENCE)
increased, the probability that CRM triads are balanced (BALANCECRM = 1) slightly increased
for FitbitAHA and RoyalWWF, but not for WyndhamNRA. This was against the direction of
hypothesis 4, as this suggests that balance is more stable when ATASDIFFERENCE is greater
between consumers’ attitudes x attitude strengths towards the brand and their attitudes x attitude
strengths towards the cause. With this said, I believe that it is a strong possibility that this is an
artifact of manually multiplying the attitude and attitude strength measures for both the brand
and the cause before taking the extremity differences. As an example, there may be a different
coefficient needed in the multiplication of attitude and attitude strength measures for brands
versus causes. Understanding this dynamic of how a better interaction formula could be built for
adding attitude strength into balance theory would require a study testing different combination
of coefficients (and possibly additional mathematical models) with a large group of partnerships,
thus it was beyond the scope of my study. I provide a starting point for future research into the
deeper investigation this interaction. Attitude strength has not previously been considered in
balance theory, therefore I had to start from what I knew about general interaction effects.

44
Therefore, when looking at the results for hypotheses 3-4, WyndhamNRA seems to be
the outlier, as the addition of attitude strength does not seem to improve the model for predicting
balance in its CRM triads (BALANCECRM). My initial thought as to why this partnership was
different was that maybe the differences in attitudes (ATDIFFERENCE) towards Wyndham and the
NRA were on average much larger with greater separation across participants than with the other
two partnerships, but this was not true. The average difference of attitudes towards the brand and
attitudes towards the cause were very close to one another: FitAHA (MAT_DIFFERENCE=1.25,
SD=1.13), RoyalWWF (MAT_DIFFERENCE =1.47, SD=1.14), and WyndhamNRA (MAT_DIFFERENCE
=1.31, SD=1.12), although a one-way ANOVA showed there were significant differences
(F(2,1791)=6.48, p=.00). After running a Tukey post-hoc pairwise test, it was only the average
difference of attitudes for FitbitAHA that was significantly different than RoyalWWF (p=.00).
The only major difference I found was that NRA was the only organization where the
average of participants’ attitudes towards the NRA was close to neutral, but there was a much
wider variance to participants’ attitudes as shown by the difference in standard deviation as
compared to the other brands/causes (see Table 2.4). Additionally, after running a Tukey post-
hoc pairwise test, I confirmed that it was only the NRA that was different in attitude as compared
to AHA and WWF (p=.00 in both pairwise cases).

45
Table 2.4: One-Way ANOVA for ATBRAND and ATCAUSE
Brand/Cause M SD F(2,1791) p Fitbit (N = 758) 8.73 1.78
25.89 .00 Royal Caribbean
(N = 584) 7.99 2.10
Wyndham Hotels (N = 452)
8.29 1.83
American Heart Association (N = 758)
9.65 1.60
308.60 .00 World Wildlife
Fund (N = 584)
9.49 1.63
National Rifle Association (N = 452)
6.55 3.52
Even when looking at attitude strength across all the brands and causes, there was not a
large difference across the organizations (see Table 2.5).
Table 2.5: One-Way ANOVA for ASBRAND and ASCAUSE
Brand/Cause M SD F(2,1791) p Fitbit (N = 758) 7.59 2.46
11.06 .00 Royal Caribbean
(N = 584) 6.94 2.60
Wyndham Hotels (N = 452)
7.22 2.53
American Heart Association (N = 758)
8.61 2.20
8.11 .00 World Wildlife
Fund (N = 584)
8.58 2.29
National Rifle Association (N = 452)
8.08 2.67

46
Thus, it seems that the major difference was that attitudes towards the NRA were the only
attitudes that were both close to neutral on average, and also quite divided across the participants
in my sample. Since the mean of attitudes towards the NRA were so close to the midpoint of the
scale (MATCAUSE=6.55, on a scale from 1 to 11), and the standard deviation was much larger than
the rest of the brands and causes, I decided to look at how results for H4 would look if I split the
analyses by the midpoint, by separating participants with positive attitudes towards the NRA
(MATCAUSE > 6) from those with negative attitudes towards the NRA (MATCAUSE < 6). The results
can be found in Table 2.6.
Table 2.6: Predicting Balance with Attitude X Attitude Strength Differences for NRA Split by Positive and Negative Attitudes
Partnership Variables B 95% CI for Odds
Ratio p Lower Odds Upper
Wyndham Hotels & National Rifle Association, with
Negative Attitudes Towards the NRA (N = 183)
Constant 1.65 2.56 5.19 11.28 .00
ATDIFFERENCE -.22 .53 .80 1.22 .30
ASDIFFERENCE .06 .87 1.06 1.32 .57
ATASDIFFERENCE .00 .95 1.00 1.03 .83
Wyndham Hotels & National Rifle Association, with
Positive Attitudes Towards the NRA (N = 269)
Constant 1.54 2.99 4.70 7.62 .00
ATDIFFERENCE -.81 .24 .45 .81 .01
ASDIFFERENCE -.25 .60 .78 1.01 .06
ATASDIFFERENCE .07 1.01 1.08 1.15 .02
DV – BALANCECRM
As seen in Table 2.6, I gain much deeper insight into the prediction of BALANCECRM for
the NRA. By looking at ATDIFFERENCE for both the positive group and the negative group, I see

47
that H4 is partially supported only in the positive group. Thus, I only have evidence that attitudes
are spilling over when attitudes are positive towards the NRA. Moreover, I can see a significant
interaction effect between attitude and attitude strength (ATASDIFFERENCE) for the NRA in the
positive group when I split the groups by valence towards the NRA. Since I know that attitudes
towards Wyndham were on average positive (see Table 2.4), I have evidence that when a brand
that is generally viewed positively partners with a cause that is viewed positively (the split group
of participants that view the NRA positively), spillover is occurring across the brand and the
cause (ATDIFFERENCE predicts BALANCECRM) to influence changes in perceived compatibility of
the CRM partnership. What about when a brand such as Wyndham partners with a cause that is
viewed negatively? When looking at only the participants that had negative attitudes towards the
NRA, I find no evidence of spillover (ATDIFFERENCE does not predict BALANCECRM), and thus
no influence on changing perceived compatibility towards the CRM partnership. Judging from
these results, this study further confirms intuition that there does not seem to be any benefit from
partnering with a cause in which people generally hold negative attitudes towards.
Key Takeaways and Recommendations
I would like to conclude this discussion with a summarized list of key takeaways and
recommendations for CRM practitioners, advertisers, and researchers.
• I found that perceived compatibility of CRM partnerships is strongly formulated by consumers attitudes towards the brand and the cause in the partnership (subjective attitudes), therefore practitioners and advertisers should not rely on a CRM partnership to raise attitudes towards a brand or a cause, but rather should consider efforts to raise attitudes towards a brand and a cause prior to the partnership being widely advertised.
• When measuring attitudes towards brands and causes in CRM partnerships to predict balance, I found that including the measurement of the strength of attitudes towards those brands and causes was important, as attitude strength improved my models of predicting changes to peoples’ perceptions of CRM compatibility. Therefore, practitioners, advertisers, and researchers should consider the inclusion of attitude strength into their models of analyzing CRM partnerships’ effects on consumer behavior.

48
• When brands and causes, in which people hold generally positive attitudes towards,
partner with one another, I found evidence that attitudes towards the brand and towards the cause were spilling over into one another to change perceptions of compatibility. This could be considered a positive outcome, as it suggests that people are blending their views towards a brand and a cause together, which could be one of the aims of CRM.
• When brands, in which people hold generally positive attitudes towards, partner with causes, in which people hold generally negative attitude towards, I found no evidence that attitudes towards the brand and towards the cause were spilling over into one another to change perceptions of compatibility. Thus, there seems to be no benefits that I could find within this study for this type of partnership. The negatively viewed cause may be expecting that positive attitudes towards a well-liked brand could “rub-off” on the cause, but this does not seem to be the case.
LIMITATIONS AND FUTURE RESEARCH
Direction of Spillover Effects
Simonin and Ruth’s (1998) research into spillover effects within brand alliances used
structural equation modeling with the assessment of attitudes towards brands before and after
presentation of the alliance. Although finding the end state of attitudes towards brands and
causes, and the strength of those attitudes, was not the initial focus of this study, surveying these
downstream measures could have given me more insight into understanding if there is a
consistent direction with regards to the spillover effect that I found preliminary evidence for
within CRM triads. With my current analysis, a limitation was that I could not be for sure which
direction attitude, and the strength of those attitudes, are spilling over into/from. Future research
into CRM partnerships could benefit from combining my study’s methods with the Simonin and
Ruth’s (1998) to provide more insight into the effects of CRM partnerships (as they focused
solely on brand-brand alliances, and not brand-cause alliances). They used a structural equation
modeling approach that assessed participants’ attitudes pre-partnership and post-partnership (as
well as the strength of those attitudes), thus giving them insight into which direction the spill-
over effects were occurring.

49
Spillover Effects Analyses Over Time
Marvel et al. (2011) provided theoretical proof that triads (and larger systems that include
triads) become balanced over time, but this study focused only on a snapshot of time. In the
future, by collecting attitude, attitude strength, and perceived compatibility measures over time, I
could also see whether or not more CRM triads eventually end up in states of balance as was
proved by Marvel et al. (2011). Their findings were based on simulation data, but looking at how
continuous attitude, attitude strength, and perceived compatibility measures move with regards to
balance in CRM triads over time could provide empirical evidence to their findings.
Neutral Attitudes and Balance Theory
Another limitation was the prevalence of neutral separate attitudes towards brands and
causes in my sample. There was a total of 2,979 total responses across three partnerships (N=993
per partnership). The number of responses in which one of more of the separate attitudes towards
the brands and causes were neutral (ATBRAND=0 and/or ATCAUSE=0) was 1,185. This was a large
number of responses that were excluded from my analyses for hypotheses 2-4, as previous
studies on balance theory have not considered what to do with neutral attitudes. Future research
should work to understand how to handle neutral attitudinal edges within questions of balance;
additionally, researchers could consider expanding the initial sample size of data collection to
make sure that all partnerships have an appropriate number of data points even if neutral edges
need to be removed.
Single-Item vs. Multiple-Item Measures
This study used single-item measures for the measurement of attitude, attitude strength,
and perceived compatibility, which could be initially considered a limitation. With this said,
Bergkvist et al. (2007) compared the predictive validity of single-item measures and multiple-

50
item measures for attitudes towards advertising, and found that there was no difference in
predictive validity between single-item versus multiple-item. Future research could consider
incorporating multiple-item measures to see if there are any predictive differences in outcomes.
Interaction Variable for Attitude and Attitude Strength
Another limitation, as mentioned previously, was that my calculation of attitude x attitude
strength was an informed, but preliminary approach that may have contributed to my mixed
findings. This study seems to be the first to consider attitude strength in CRM partnership
research, and thus it is only a starting point. Thus, future CRM studies may find that taking a
more nuanced approach, looking at different statistical models to assess direction of spillover,
seeing how balance changes over time, researching how to handle neutral attitudes, testing
multiple-item measures, and considering coefficient differences for organizations, could prove
fruitful.
Attitude Strength and its Relationship with Arousal and Involvement
Petty and Krosnick (1995) suggested that measuring attitude strength alongside attitude
would enable us to better measure impact on information processing and judgments, as well as
help us predict behavior. Although I only measured attitude strength in this study with regards to
a construct that modifies the effect of attitude on processing and behavior, there have been other
psychological constructs that have shown to be moderators of information processing and
behavior.
For example, we have evidence that measuring arousal alongside with attitudes also
enables us to better measure impact on information processing, specifically helping to predict
how people process advertisements (Shapiro, MacInnis, & Park, 2002). Arousal has also been
measured alongside emotions within excitation transfer theory, in which emotion-arousing

51
situations affect behavior due to portions of “excitation” that transfer from previously related or
unrelated emotionally arousing situations (Zillmann, 2007). As implied from excitation transfer
theory, arousal is thus related to interest, and interest is another way to measure attitude strength
(Petty & Krosnick, 1995). Additionally, involvement has been suggested as a highly related
construct to attitude strength (Petty & Krosnick, 1995), and Kokkinaki and Lunt (1997) found
that involvement and attitude accessibility (attitude accessibility is yet another way to measure
attitude strength; Petty & Krosnick, 1995) predicted attitude-behavior consistency in how
participants chose consumer products. Kokkinaki and Lunt (1997) also found that involvement
and attitude accessibility were indeed separate, albeit related, constructs within their study.
Thus, as examples of additional psychological constructs that moderate behavior and
processing, there seems to be connections between attitude strength, arousal, and involvement.
Future research may benefit from looking at how either one of these constructs (or various
combinations of them) may affect behavior within CRM partnerships. One example could be
measuring attitude strength alongside a measure of involvement, such as the personal
involvement inventory (Zaichkowsky, 1994), which could provide a well-tested multiple-item
measure to pair alongside the measurement of attitude strength. I could look to see both the
correlations between the measurements of the different constructs, as well as see how a construct
such as involvement changes my results with regards to CRM partnerships and compatibility.
Alternate Ways to Predict Consumers’ Acceptance or Rejection of Partnerships
This study built upon Lafferty et al.’s (2004) findings that perceived compatibility
predicted CRM partnership acceptance, but what about the cases in which I found that perceived
compatibility was positive, but the CRM triad was not balanced (BALANCECRM=0)? A positive
perceived compatibility should predict positive acceptance of a CRM partnership according to

52
previous research (Lafferty et al., 2004), but if the CRM triad is not balanced, then Heider’s
(1946) balance theory suggests that the CRM triad may bring psychological pressure to change.
Future studies should look to study this apparent contradiction. Interestingly, when looking at the
distribution of balanced to unbalanced triads in this study’s data, the percentages of triads that
were balanced for each partnership were as follows: FitbitAHA (91.74%), RoyalWWF (80.06%),
and WyndhamNRA (69.99%). As of late February 2018 (after this study was conducted),
Wyndham Hotels ended their partnership with the National Rifle Association in the wake of the
Marjory Stoneman Douglas High School shooting in Parkland, Florida (Edevane, 2018). Future
research should look at if there is a potential connection between WyndhamNRA having the
lowest number of balanced CRM triads, and public backlash against the partnership.
CRM Research and Social Media Data
One final promising area of future research could be within the realm of social media
data, as researchers could potentially use social media data to assess attitudes towards brands and
towards causes (as well as the strength of those attitudes). This could provide a means for brands,
causes, and advertising practitioners to make even more informed decisions regarding the realm
of CRM. After the previous mentioned Florida school shooting, Wyndham Hotel’s Twitter
account was filled with tweets condemning their partnership with the NRA, thus providing even
more evidence that social media is an important arena for CRM partnership research.
CONCLUSION
The purpose of this study was to investigate the boundaries in which balance theory
(Heider, 1946) can be used to analyze CRM partnerships and predict consumer perceptions of
CRM partnership compatibility. Within this investigation, I brought together theoretical
understandings of balance theory and the difference between attitude and attitude strength to
53
predict balance in CRM triads. My findings benefit researchers, as they advance theory both for
balance theory as well as for CRM research, but they also bring value to CRM and advertising
practitioners. Having the understanding of how to predict potential CRM compatibility
perceptions is important, especially if it can be used prior to entering into a partnership.
Additionally, by providing insight into how to predict balance in CRM triads, this gives CRM
and advertising practitioners deeper understanding into how to choose future CRM partners, as
well as considering campaigns to advertise brands and causes individually to raise attitudes
towards them before entering into a partnership.

54
CHAPTER 3: PERILS AND PITFALLS OF SOCIAL MEDIA ANALYTICS: A
COMPARISON BETWEEN SURVEY AND SOCIAL MEDIA ANALYTICS APPROACHES
WHEN USING BALANCE THEORY TO MEASURE ATTITUDE STRENGTH IN CAUSE-
RELATED MARKETING PARTNERSHIPS
Social media has brought about many changes within the realm of cause-related marketing
(CRM). As in the case of recent social media backlash towards causes like the National Rifle
Association, it seems that consumers’ attitudes towards brands, as well as their attitudes towards
causes, can change in a very short period of time. Research has shown that the ease in which
attitudes towards organizations can be changed is dependent on how strong peoples’ attitudes are
towards those organizations. Therefore, in light of the importance of attitude strength within
CRM, my purpose was to compare different ways to measure the strength of consumers’
attitudes towards brands, and towards causes, within the domain of CRM. I examined two novel
ways of assessing consumers’ attitude strengths towards brands and causes through balance
theory: a survey measure assessing discussion topic similarity to indirectly measure attitude
strength, and a social media analytics method of analyzing social media discussion similarity as
another indirect measure of attitude strength. I found that by assessing the similarity of topic
conversation between a consumer and a brand (or cause), I could predict the strength of a
consumer’s attitude towards that brand (or cause) using a survey measure, but not using social
media analytics. I explain my thoughts on why one approach worked versus the other, as well as
share some considerations when conducting psychological research using a hybridization of a
survey approach and a social media analytics approach.
55
In late February 2018, after the mass shooting at Marjory Stoneman Douglas High School
in Parkland, Florida, ThinkProgress posted a list of all the companies that were engaged in a
cause-related marketing partnership with the National Rifle Association (NRA) to offer
discounts to NRA members (Lerner, 2018). Cause-related marketing (CRM) is a phenomenon of
for-profit businesses (brands) partnering with not-for-profit organizations (causes) for reasons
that are beneficial to both of the organizations’ objectives (Barone, Norman, & Miyazaki, 2007;
Varadarajan & Menon, 1988). ThinkProgress’ posting, alongside growing use of #BoycottNRA
and #NeverAgain on social media, started a domino-effect of companies ending their CRM
partnerships with the NRA (Edevane, 2018). It seems that the benefits that existed for the
companies partnering with the NRA were outweighed by the public anger towards the mass
shooting and the topic of gun-ownership in America. Some CRM partnerships may seem more
incompatible than others, and research has shown that perceived compatibility predicts
acceptance (or rejection) of CRM partnerships (Lafferty et al., 2004), consumer choice (Pracejus
& Olsen, 2004), and purchase intentions (Gupta & Pirsch, 2006). In Chapter 2 of this
dissertation, I investigated a CRM partnership between Wyndham Hotels and the NRA, and
found that this partnership was perceived, on average, as incompatible. Notably, Wyndham was
also a company that ended their relationship with the NRA in light of the backlash in February
2018. I also found that measuring attitude strength enables the prediction of consumers’
perceptions of CRM compatibility in ways that attitude alone cannot predict, therefore I believed
that it would be important to investigate novel ways to measure the strength of attitudes towards
brands, as well as the strength of attitudes towards causes, that participate (or will participate) in
CRM partnerships.

56
Investigating new ways to measure the strength of attitudes towards brands, as well as the
strength of attitudes towards causes, can provide an important step forward for the realm of CRM
research and practice. Previously, the only way to measure the strength of attitudes towards
people or objects was through self-reported survey measures and/or survey response latency
measurement, but a way to measure attitude strength via social media analytics does not
currently exist within research literature. Social media analytics is the process of using
computational methods and tools to extract insights from social media data (Fan & Gordon,
2013), and it is being widely used by companies to analyze consumer behavior (Yun & Duff,
2017). A recent Pew Research Center survey showed that up to 75% of adults in the United
States use social media (A. Smith & Anderson, 2018). They also show that this percentage grows
to 94% within the age range of 18 to 24-year-olds with regards to social media use. In August of
2017, AdWeek analyzed how people reacted to various topics of postings by brands on
Facebook, and they found that content that featured corporate social responsibility initiatives
(cause-related marketing is a form of a corporate social responsibility) received by far the most
engagement versus other topics of conversation (Vijay, 2017). If I could use social media
analytics to detect the strength of attitudes towards brands, and the strength of attitudes towards
causes, this would bring me one step closer to developing a social media analytics method to
predict potential CRM compatibility prior to organizations entering into CRM partnerships. In
this study, I experimented with a topic-based approach to measuring attitude strength (both via a
survey and social media analytics), as this could be a more indirect way to measure how strong
attitudes may be towards brands or towards causes. Since attitude strength is a measure of how
easily attitudes can be changed, cause-related advertisers should also be interested in different
ways to get at measuring attitude strengths towards brands and towards causes.

57
I only focused on the measurement of attitude strength within CRM partnerships for this
study, rather than looking at both attitude and attitude strength for the following reasons.
First, I was interested in investigating how I could use a social media analytics approach
to assessing attitude strength apart from assessing attitude, as the methodology and data needed
to assess either in the realm of CRM have key differences. Measuring attitudes towards people or
objects within social media has been previously researched (also referred to as opinion mining or
sentiment analysis; e.g., Eirinaki, Pisal, & Singh, 2012), but attitude strength has not been
previously measured through social media data as a separate psychological construct. Measuring
attitude towards CRM brands and causes would require acquiring data of social media users
talking directly about those brands and/or causes, and then I could use previously developed
methods of detecting attitude towards objects in text (e.g., Eirinaki et al., 2012). In contrast, I
hypothesized that CRM attitude strength could be detected in social media data that does not
directly discuss CRM brands and causes, and therefore it offered a way for CRM practitioners to
assess general strength of attitudes towards brands and causes across a broader set of data.
Secondly, this research considers Krosnick et al.’s (1993) study, in which they focused on
investigating the various different ways to measure attitude strength (apart from the measurement
of attitude). They found that each way to measure attitude strength (e.g., attitude certainty,
attitude importance) were distinct yet correlated measures, and that any given measure may be
more appropriate to ask for various circumstances or realms of assessment. I was interested in
seeing if I could identify a novel indirect survey-based measure of attitude strength specifically
within the realm of CRM, and that could potentially help avoid issues that come from directly
asking for attitude strength (e.g., the issue of social desirability bias).

58
Thus, due to the previously researched importance of attitude strength within CRM
partnerships (Chapter 2 of this dissertation), the lack of research within the computational realm
of detecting attitude strength from social text, the possibility that attitude strength could be
detected from social data that is more widely accessible, and the desire to find an alternative
measure of attitude strength within the realm of CRM, I chose to focus specifically on attitude
strength within this study.
By looking at measuring attitude strength both via a survey-based approach and a social
media analytics approach, I compare and contrast these methods in efforts to bring additional
insight into various considerations that researchers and practitioners should take when
considering using either approach (or a hybridized approach). With regards to a theoretical
framework, previous research has used Heider’s (1946) balance theory in analyzing CRM
partnerships (Basil & Herr, 2006; Chapter 2 of this dissertation). Thus, my purpose was to
investigate how I could use balance theory (Heider, 1946) to discover novel ways (both via
survey-based and social media analytics approaches) to measure the strength of attitudes towards
brands, as well as the strength of attitudes towards causes, participating (or that will participate)
in CRM partnerships.
Guiding Research Question: How can I use balance theory to discover novel ways to measure
the strength of attitudes towards brands, as well as the strength of attitudes towards causes, that
participate (or will participate) in cause-related marketing partnerships via a survey approach
as well as a social media analytics approach?

59
LITERATURE REVIEW
Cause-Related Marketing Compatibility and Attitude Strength
As previously stated, cause-related marketing (CRM) is a phenomenon of for-profit
businesses (brands) partnering with not-for-profit organizations (causes) for reasons that are
beneficial to both of the organizations’ objectives (Barone et al., 2007; Varadarajan & Menon,
1988). Some examples of CRM partnerships include Starbucks with (RED) to fight AIDS, or
Coca-Cola with the World Wildlife Fund to preserve polar bear habitats in the arctic. CRM has
grown in popularity over the years, as CRM spending has increased from $120 million in 1990 to
$2.05 billion in 2017 (“ESP’s Growth of Cause Marketing - Engage for Good,” 2017).
According to a recent text-mining analysis of CRM research between 1988 and 2013, the
concept of CRM fit (or CRM compatibility) was one of the most prominent topics discussed and
researched within the CRM realm (Guerreiro et al., 2016). Some CRM partnerships are
perceived as more compatible than others, as previous research has shown that the partnership
between Fitbit and the American Heart Association has been perceived on average as more
compatible versus the partnership between Wyndham Hotels and the NRA (Chapter 2 of this
dissertation). We have evidence that perceived CRM compatibility predicts acceptance of CRM
partnerships (Lafferty et al., 2004), consumer choice (Pracejus & Olsen, 2004), and purchase
intentions (Gupta & Pirsch, 2006). Thus, understanding how consumers form their perceptions of
CRM compatibility has practical importance for brand managers, public-relations professionals,
and cause-related advertisers. In Chapter 2 of this dissertation, I found that incorporating attitude
strength improved my models for predicting CRM compatibility across three CRM partnerships,
compared to predicting via attitude measures alone.

60
In describing attitude strength, Howe and Krosnick (2017) suggested that some attitudes
are strong versus weak, and it is strong attitudes that most affect our thoughts and behaviors.
Petty and Krosnick (1995) stated that strong attitudes are resistant to change, they are stable over
time, they influence our thoughts, and they are better predictors of behavior than weak attitudes.
An individual may have the same extreme attitude towards two topics, such an extremely
negative view towards pollution as well as an extremely negative view towards Mondays. With
this said, attitude strength deals with how resistant that attitude is to change, and how easily that
attitude can be influenced. That same individual’s views towards pollution may be very strong,
thus preventing any sort of change in attitudes.
With regards to how attitude strength specifically affected CRM compatibility, I found
evidence that degree differences in the attitudes towards brands and attitudes towards causes
(ATDIFFERENCE) was related to changes in participants’ perceptions of the compatibility of the
CRM partnership when attitude strength was included in my predictive models (Chapter 2 of this
dissertation). Thus, it is important to understand how to assess the strength of individuals’
attitudes towards brands and towards causes before they enter into a CRM partnership or
advertise the partnership widely.
Attitudes have historically been measured through a variety of measures and methods.
Some of these methods include self-reported survey measures (e.g., the Likert scale assessment
of attitudes, Likert, 1932), behavioral survey measures (e.g., the implicit association test,
Greenwald, McGhee, & Schwartz, 1998), and physiological methods (e.g., facial
electromyographic activity, Krosnick, Charles, & Wittenbrink, 2005). On the other hand, attitude
strength has only been assessed through self-reported survey measures of attitude strength (Petty
& Krosnick, 1995), or behaviorally measuring the response latency to survey questions (Bassili,

61
1993, 1996). Preceding the 1990 Ontario provincial election, Bassili (1993) asked participants
which political party they were going to vote for in, how certain they were of their choice, and
asked them which political party they actually voted for after the election. Assessing how certain
someone is of their attitudes is one of the many ways to measure self-reported attitude strength
(Petty & Krosnick, 1995). Bassili (1993) found that participants’ response latency towards the
question of which political party they were going to vote for was a stronger predictor of which
political party they actually voted for as compared to how they answered with regards to the
certainty of their choice. Attitude certainty was still a predictor of voting behavior, but response
latency was a much stronger predictor. Thus, response latency has been considered a valid
behavioral measure of attitude strength. Bassili (1996) later followed up with comparing the use
of response latency as a behavioral measure of attitude strength to a larger number of self-
reported measures of attitude strength (e.g., attitude certainty, attitude importance, attitude
knowledge, attitude strength, etc.), and found response latency to be the most predictive of
behavior.
Previous research has not measured strength of attitudes towards brands and towards
causes within CRM partnerships outside of directly asking this via a self-report survey (Chapter
2 of this dissertation). Self-reported measures of attitude and attitude strength may suffer from
both social desirability response bias as well as self-deception (Krosnick et al., 2005). Social
desirability response bias is the tendency to self-report in ways that are driven by a desire to be
viewed more favorably by others. As an example, an individual may actually like the National
Rifle Association, but they may believe that there is such negative media attention on the
association right now that they feel a bit embarrassed to report their attitude (and the strength of
their attitude) towards the NRA on a survey. Therefore, they may change their response due to
62
social desirability response bias. Self-deception works in a similar way, except the motive of this
bias is driven more from an individual’s desire to view their own self favorably. Thus, if I could
provide other indirect ways to predict consumers’ separate attitude strengths towards brands and
causes, this may provide strong value practically within the realm of CRM.
Using response latency could be an indirect way to measure attitude strength towards
brands and causes, but there have not been any previous studies to show that web-based surveys
via MTurk can provide enough time sensitivity (and consistency) required for detecting attitude
strength. Lab based studies using software such as DirectRT (Jarvis, 2016) have the benefit of
having controlled computational environments, but I focused on finding measures that would be
accessible to a range of people (e.g., practitioners within non-profits that may be looking for low-
cost methods to evaluate potential CRM partners), while still ensuring that there was the
potential to overcome issues such as social desirability bias. Thus, one of the main contributions
of this study is providing a new indirect survey measure of the strength of attitudes towards
brands and towards causes within the realm of CRM. To explain this novel method, I turn to
balance theory next.
Balance Theory and Attitude Strength
Heider’s balance theory (1946) is probably most well-known as applied to triads of
relationships, but he also spoke of the application of balance theory within two person/entity
systems. I will refer to this as dyadic balance theory. Heider suggested that individuals can have
attitudes towards other people and/or objects, and these attitudes influence each other. While
speaking about dyadic systems, he stated, “p similar to o induces p likes o, or p tends to like a
similar o” (Heider, 1958, p. 184). Therefore, he was stating that similarity affects attitudinal
evaluation, although he did not clarify similarity on what grounds. The relationship between
63
similarity and group formation has been studied in network analysis for quite some time as well.
In network analysis, this phenomenon is usually referred to as homophily. McPherson et al.
(2001) defines homophily as, “the principle that a contact between similar people occurs at a
higher rate than among dissimilar people. The pervasive fact of homophily means that cultural,
behavioral, genetic, or material information that flows through networks will tend to be
localized” (p. 416). Thus, the effects of similarity within balance theory runs alongside the
concept of homophily in network analysis.
Choudhury (2011) tested this concept of homophily on Twitter, as she looked at Twitter
users and any new people that they would follow over a period of time, and compared the new
people they followed with the original Twitter user to see if there was any correlation with the
following attributes: location (Twitter profile location), gender (Twitter first names compared to
US Census data on gender), ethnicity (Twitter last names compared with US Census data on
ethnicity), political orientation (words denoting political orientation in Twitter profiles), activity-
pattern (distribution of posting tweets over a 24 hour period), broadcasting behavior (fraction of
retweets to total posts), interactiveness (fraction of @mentions to total posts), topical interest
(topic codes derived from analyzing tweets via opencalais.com), and sentiment expression
(sentiment analysis of tweets utilizing Linguistic Inquiry Word Count; Pennebaker, Boyd,
Jordan, & Blackburn, 2015). Although she found mixed effects for most of the attributes, she
found that Twitter users tended to follow other users that were discussing topics similar to what
they were discussing.
One could imagine that people follow others on Twitter due to liking them or their
content, but they could also follow someone due to the topic that they are discussing regardless
of the valence of their attitude towards the Twitter account. For example, if someone was

64
interested in efforts to reduce carbon emissions worldwide, they might still follow Exxon
Mobil’s Twitter feed even if they strongly disliked Exxon Mobil. They might follow Exxon
Mobil on Twitter due to their strong attitude strength towards the topic of climate change,
regardless of their negative attitudes towards the brand. In fact, there is even a suggested term for
this on Twitter: Tweetenfreude (“the hate-follow”; Weissman, 2014). Thus, my explanation of
Choudhury’s (2011) findings is that there is a connection between similarity of topical discussion
and attitude strength. Interestingly, one of the ways that has been shown to measure the strength
of attitudes towards topics is by measuring what topics an individual talks about, and how often
they talk about those topics (Krosnick et al., 1993). Thus, by synthesizing insights together from
Choudhury (2011), Krosnick et al. (1993), and Heider (1958), I am proposing a new indirect
self-reported measure of the strength of attitudes towards brands and towards causes within the
realm of CRM. I hypothesize that a consumer’s perceived similarity of topical conversation
between themselves and a brand (SURVEYSIMBRAND) within CRM partnerships will predict the
strength of their attitude towards that brand (ASBRAND). I also hypothesize that a consumer’s
perceived similarity of topical conversation between themselves and a cause
(SURVEYSIMCAUSE) within CRM partnerships will predict the strength of their attitude towards
that cause (ASCAUSE).
H1a: As the perceived similarity of topics of discussion between a consumer and a brand (SURVEYSIMBRAND) increases, the strength of the consumer’s attitude towards that brand (ASBRAND) will increase.
H1b: As the perceived similarity of topics of discussion between a consumer and a cause
(SURVEYSIMCAUSE) increases, the strength of the consumer’s attitude towards that cause (ASCAUSE) will increase.

65
Social Media and Attitude Strength within Cause-Related Marketing
Social media has impacted the realm of CRM greatly. In August of 2017, AdWeek
analyzed how people reacted to various topics of postings by brands on Facebook, and they
found that content that featured corporate social responsibility initiatives (cause-related
marketing is a form of corporate social responsibility, or CSR) received by far the most
engagement versus other topics of conversation (Vijay, 2017). Bühler et al. (2016) looked at how
Facebook and YouTube advertising of a CRM campaign affected intentions to purchase the
CRM brand’s products, and found that using these social media platforms rivaled print
advertising and point of sale positioning. However, engagement with CRM does not uniformly
benefit companies. Hashtag campaigns such as #NeverAgain and #BoycottNRA have caused
some CRM partnerships to separate (Popken, 2018). Therefore, having a deeper understanding of
how CRM practitioners and advertisers could use social media should be a very practical area of
investigation.
We have evidence that Twitter is a platform in which similarity of topical discussion has
been found to be correlated with users following other users with the same topical interest
(Choudhury, 2011). Research has shown that one of the ways to measure the strength of attitude
towards a topic is by measuring how much an individual talks about that topic (Krosnick et al.,
1993). Sprout Social, a social media analytics company founded in 2010 that has customers such
as Microsoft, Hyatt, and Titleist, found that successful organizations are consistent with their
topics of conversation on social media (Jackson, 2017). They also suggest that most large
organizations have Twitter accounts, as it is both an avenue for public messaging as well as a
way for taking in customer services requests and responses. Thus, bringing together Choudhury’s
(2011) homophily findings on topical discussion, Heider’s (1958) theoretical framework of

66
dyadic balance, and the consideration that Twitter is a platform in which large organizations are
discussing various topics of organizational interest, I hypothesize that computational similarity
between a Twitter user’s discussion topics and a brand’s discussion topics (TWEETDIVBRAND)
within CRM partnerships should predict the strength of the user’s attitude towards that brand
(ASBRAND). I also hypothesize that computational similarity between a Twitter user’s discussion
topics and a cause’s discussion topics (TWEETDIVCAUSE) within CRM partnerships should
predict the strength of the user’s attitude towards that cause (ASCAUSE). As a clarifying point to
the hypothesis, I actually used the measure of divergence (the opposite of similarity) due to the
sparse nature of computational topic analysis. This will be explained further in the methods
section.
H2a: As the divergence of topics discussed on Twitter between a consumer and a brand (TWEETDIVBRAND) increases, the strength of the consumer’s attitude towards that brand (ASBRAND) will decrease.
H2b: As the divergence of topics discussed on Twitter between a consumer and a cause
(TWEETDIVCAUSE) increases, the strength of the consumer’s attitude towards that cause (ASCAUSE) will decrease.
METHODS
CRM Brands and Causes
I used the same brands and causes from my previous study (Chapter 2 of this
dissertation), as this current study was an extension of the survey instrument from Chapter 2 (see
Appendices 1 and 2). Therefore, the three partnerships that I included in this study were Fitbit
and American Heart Association (FitbitAHA), Royal Caribbean and the World Wildlife Fund
(RoyalWWF), and Wyndham Hotels and the National Rifle Association (WyndhamNRA). I
collected data from September 6, 2017 to September 20, 2017, which was five months before
Wyndham Hotels ended their partnership with the National Rifle Association.

67
Participants
For this study, I collected survey responses from participants through Amazon
Mechanical Turk (MTurk). Although there has been some debate about MTurk and its viability
for research studies, Kees et al. (2017) provided evidence that advertising research could reliably
use Amazon MTurk. I collected N=997 responses, but four participants were removed after
reviewing the data, due to concerns over their understanding of the purpose of the data, or
whether they were fit to fill out the survey due to their post-survey comments. Therefore, N=993
responses were remaining. Towards the end of my survey, I asked participants to provide their
Twitter usernames, so that I could compare analyses of their Twitter accounts to their surveyed
responses. I made sure that participants were well informed as to what would be happening with
their Twitter usernames if they provided it, and that they knew this step was optional (see
Appendix 2 for the exact verbiage given to participants). N=337 participants responded with their
Twitter usernames, but after checking to see if the usernames were actual Twitter accounts and
checking that they actually had any tweets in their timelines, the number of responses were
reduced to N=184. I also limited my scope to users with tweets within the year of 2017, so as to
standardize for those that have more years of tweets than others historically. All analyses were
thus conducted on these remaining N=170.
Measures
I collected additional survey questions that were not reported on the first study due to the
scope of the study (Chapter 2 of this dissertation). Please refer to Appendix 1 for the first study’s
survey instrument. Due to the importance of attitude strength to this current study, I re-iterate
that I collected strength of attitude towards the brands (ASBRAND), and strength of attitude
towards the causes (ASCAUSE; See Appendix 1). The attitude strength measures were adapted
68
from Bassili (1996) and were measured on an 11-point scale from +1 (Not strong at all) to +11
(Extremely strong). To assess this, I asked, “How strong is your attitude toward [brand/cause]?”
Each participant was presented with all three partnerships, but the order of partnerships (as well
as the presentation order of the brand and the cause) was presented randomly.
With regards to measures of topics of discussion and topic similarity, I first collected
participants’ self-reported similarity of topical conversation with a brand (SURVEYSIMBRAND)
or a cause (SURVEYSIMCAUSE) by asking, “The topics that [brand/cause] would talk about are
consistent with the topics that I talk about.” This was measured on an 11-point scale from -5 (Not
consistent at all) to +5 (Extremely consistent). My measure of computational topics divergence
between a participant and a brand (TWEETDIVBRAND) or cause (TWEETDIVCAUSE) was derived
through running a divergence analysis between the topics discussed on a participant’s Twitter
feed and a brand/cause’s Twitter feed. The reason why I used a divergence analysis instead of a
similarity analysis was due to the issue of symmetric similarity comparisons producing a large
number of zero overlapping topics of discussion. For example, if Joe talks about religion, nature,
and basketball, and a brand talks about boxing, fishing, and rodeos, the similarity would be zero.
With regards to running statistical analyses against attitude strength, this would pose a
mathematical problem. Therefore, I used a divergence measure called Kullback-Leibler
divergence (KL divergence). KL divergence is not a similarity measure, but rather an
asymmetric comparison of probability distributions (Joyce, 2011). The formula for KL
divergence is represented in Equation 3.1.
𝐷"#(𝑝||𝑞) = ∑ 𝑝(𝑥-) ∙ 𝑙𝑜𝑔2(34)5(34)
6-78 (3.1)
P(x) and q(x) are two probability distributions of a discrete random variable x. As a
clarifying example, you may use KL divergence to assess how far a study’s data frequency

69
distribution (p(x)) strays from a normal distribution (q(x)). In this case, a normal distribution is
your reference point, and KL divergence looks at each frequency level, and calculates how all of
them in aggregate stray from a normal distribution. Therefore, if the two distributions are exactly
the same, the KL divergence value is zero (lower values = greater similarity in distributions). As
the distribution under consideration grows further away from the prototype, the KL divergence
grows in value. Thus, going back to my example of Joe and the brand, I have six total topics
between Joe and the brand (religion, nature, basketball, boxing, fishing, and rodeos). If I were to
consider this as a distribution of topic frequency, while keeping the order of the topics the same,
a probability distribution vector that includes all the topics would look like [1, 1, 1, 1, 1, 1]. If I
just consider the topics that the brand talks about, its probability distribution vector looks like [0,
0, 0, 1, 1, 1]. This is my prototype distribution if I am considering KL divergence. A smoothing
constant must be added to the zero values within the distributions as zero values would create
undefined KL divergence values, as dividing by a zero in Equation 3.1 would result in an
undefined value (Han & Kamber, n.d.). With the addition of this smoothing constant (.001 in this
case), Joe’s original distribution vector for the topics he talks about would be represented as [1,
1, 1, .001, .001, .001]. Therefore, with regards to similarity analysis, [1, 1, 1, .001, .001, .001]
compared against [.001, .001, .001, 1, 1, 1] would be zero, but with KL divergence it would be
the non-zero number of DKL(Joe||Brand) = 6.89. Having these non-zero KL divergence numbers
are important if I am calculating statistical correlations between computational topics divergence
(TWEETDIVBRAND or TWEETDIVCAUSE) and attitude strength (ASBRAND or ASCAUSE
respectively). I used the SciPy entropy function to calculate KL divergence (Jones, Oliphant, &
Peterson, 2014), and added a smoothing constant of .001 to each value within the topic
distribution vectors.

70
To actually compute the topics being discussed on the Twitter feeds of the participants
and the brands and the causes, I used Text Razor’s machine-learned topic tagging API
(“TextRazor - The Natural Language Processing API,” n.d.). Describing their tool, they write,
“TextRazor's topic tagger uses millions of Wikipedia pages to help assign high level topics to
your content with no additional training on your data, using our knowledgebase of entity and
word category relationships.” When I sent this tool a Twitter timeline, it sent me back a listing of
predefined topic terms with their associated probabilities of occurring within the timeline. As an
example, when I sent the National Rifle Association’s Twitter timeline to Text Razor’s Topic
Tagging API, the first topic that it returned was “Handgun” with a 100% probability that it was
being discussed in the timeline. After analyzing the frequencies of topics for each brand/cause
and their associated probabilities, I set a cutoff probability of 80% for topic inclusion within my
analyses. The 80% probability cutoff point was also the top 5% of topics for each brand/cause
(See Appendix 3 for all of the 80% probability and above topics for each brand/cause).
Text Razor has been shown to be one of the most effective toolsets for named-entity
recognition (computationally identifying entities such as persons or organizations within bodies
of text) (Rizzo, van Erp, & Troncy, 2014). With this said, I do not believe their topic-tagging tool
has been used previously in scholarly research. Additionally, since they are a for-profit company,
details of the machine learned model training process for their topic-tagging is proprietary, and
therefore the model is “black-box”. Therefore, as a validation check to compare against this
“black-box” topic-tagging, I also conducted a term-frequency (TF) matrix divergence analysis of
words between a participant’s Twitter feed and the words on a brand’s (or cause’s) Twitter feed.
I will refer to this as a participant’s raw word divergence with a brand (RAWDIVBRAND) or with
a cause (RAWDIVCAUSE) throughout the rest of this study. As a computationally clarifying note,

71
before I conducted the TF analysis, I tokenized (normalizing word-casing), removed stop words,
stemmed, vectorized, and then converted each Twitter timeline into a TF matrix. Tokenization
(in my context) is breaking down tweets into tokens, which could be words, hashtags, URLs, etc.
I used the TweetTokenizer within the NLTK toolkit, which is a custom made tokenizer to
recognize tokens appropriately within tweets (Loper & Bird, 2002). Stemming is the process of
taking various forms of a word and reducing them to their most basic stem (e.g., running and
runs both reduce to the stem “run”). This is important when frequency distributions of words are
being created. I used the same NLTK toolkit for this stemming function as well. Vectorization
and the subsequent conversion into TF matrices is the process of taking all the stemmed tokens
and creating term frequency matrices (similar to the frequency vectors for topics previously
mentioned), and then conducting a divergence analysis. I used the scikit vectorizer functions to
vectorize (Pedregosa et al., 2012), and I conducted the KL divergence analysis using the SciPy
entropy function (Jones et al., 2014). Just as with my KL divergence analysis of topics, I added a
smoothing constant of .001 to each value within the raw word frequencies to prevent undefined
values.
Finally, as a validation check between the measure of self-reported similarity of topical
conversation (SURVEYSIMBRAND and SURVEYSIMCAUSE) and the measure of computational
topics divergence (TWEETDIVBRAND and TWEETDIVCAUSE respectively), I collected thought-
listings of what topics participants believed each brand or cause would talk about. I provided
twelve open-ended text boxes, with a minimum required topic listing of one, as this was in line
with Cacioppo and Petty’s (1981) paper on using a thought-listing technique. This was also
similar to Ross et al.’s (2006) recent thought-listing procedure in collecting participant’s brand
associations towards sports teams. The question I asked was, “If [brand/cause] was a person,

72
what topics do you think [brand/cause] would talk about? Please provide up to 12 topics, with a
minimum of 1 topic.”
Analyses
For all of my hypotheses, I separated my analyses by each brand and cause to see if my
results could be validated six times with six different organizations. I also normalized
SURVEYSIMBRAND and SURVEYSIMCAUSE from a -5 to +5 scale to a +1 to +11 scale, as this
allowed for a more straightforward statistical analysis against ASBRAND and ASCAUSE
respectively. For hypothesis 1a, I used linear regression analysis with SURVEYSIMBRAND as the
predictor variable, and ASBRAND as the outcome variable. For hypothesis 1b, I used linear
regression analysis with SURVEYSIMCAUSE as the predictor variable, and ASCAUSE as the
outcome variable. To test hypothesis 2a, I used linear regression analysis with TWEETDIVBRAND
as the predictor variable, and ASBRAND as the outcome variable. To test hypothesis 2b, I used
linear regression analysis with TWEETDIVCAUSE as the predictor variable, and ASCAUSE as the
outcome variable. To conduct a validation check on hypothesis 2a, I used linear regression
analysis with RAWDIVBRAND as the predictor variable, and ASBRAND as the outcome variable. To
conduct a validation check on hypothesis 2b, I used linear regression analysis with
RAWDIVCAUSE as the predictor variable, and ASCAUSE as the outcome variable.
RESULTS
Descriptive Statistics
Descriptive statistics for ASBRAND and ASCAUSE are presented within Table 3.1. A one-
way ANOVA test showed that the averages for both the brands and the causes were significantly
different than one another.

73
Table 3.1: Descriptive Statistics for Attitude Strength
Brand/Cause (N = 170)
M SD F(2,507) p
Fitbit 7.28 2.67 14.35 .00 Royal Caribbean 6.27 2.87
Wyndham Hotels 5.66 2.90 American Heart
Association 8.58 2.00
11.47 .00 World Wildlife
Fund 8.15 2.49
National Rifle Association
7.26 3.11
Descriptive statistics for SURVEYSIMBRAND and SURVEYSIMCAUSE are presented
within Table 3.2. A one-way ANOVA test showed that the averages for both the brands and the
causes were significantly different than one another.
Table 3.2: Descriptive Statistics for Self-Reported Similarity of Topical Conversation
Brand/Cause (N = 170)
M SD F(2,507) p
Fitbit 8.14 2.05 24.46 .00 Royal Caribbean 6.87 2.55
Wyndham Hotels 6.32 2.74 American Heart
Association 8.00 2.05
62.42 .00 World Wildlife
Fund 7.99 2.08
National Rifle Association
5.34 3.28
Descriptive statistics for TWEETDIVBRAND and TWEETDIVCAUSE are presented within
Table 3.3. A one-way ANOVA test showed that the averages for the brands were significantly
different than one another, but not for the causes.

74
Table 3.3: Descriptive Statistics for Computational Topics Divergence
Brand/Cause (N = 170)
M SD F(2,507) p
Fitbit 5.54 1.58 58.04 .00 Royal Caribbean 4.99 1.53
Wyndham Hotels 3.79 1.49 American Heart
Association 6.23 1.71
2.53 .08 World Wildlife
Fund 6.43 1.75
National Rifle Association
6.02 1.68
Descriptive statistics for RAWDIVBRAND and RAWDIVCAUSE are presented within Table
3.4. A one-way ANOVA test showed that the averages for both the brands and the causes were
significantly different than one another.
Table 3.4: Descriptive Statistics for Raw Word Divergence
Brand/Cause (N = 170)
M SD F(2,507) p
Fitbit 5.44 1.29 18.30 .00 Royal Caribbean 6.08 1.35
Wyndham Hotels 6.23 1.19 American Heart
Association 5.30 1.41
3.41 .04 World Wildlife
Fund 5.64 1.31
National Rifle Association
5.30 1.46
Hypotheses Results
My hypothesis 1a was that as SURVEYSIMBRAND increases, ASBRAND will increase.
Linear regression analyses showed that hypothesis 1a was fully supported (see Table 3.5). My
hypothesis 1b was that as SURVEYSIMCAUSE increases, ASCAUSE will increase. Linear

75
regression analyses showed that hypothesis 1b was also fully supported (see Table 3.5). As a
note, the R2 values for WWF (R2=.04) and NRA (R2=.03) were concerningly low, and I address
this in the general discussion section.
Table 3.5: Predicting Attitude Strength with Self-Report Topic Similarity
Brand/Cause Variables B SE B t p R2
Fitbit (N=170)
Constant 3.51 .78 4.52 .00 .12
SURVEYSIMBRAND .46 .09 5.01 .00
Royal Caribbean (N=170)
Constant 1.43 .51 2.83 .01 .36
SURVEYSIMBRAND .70 .07 10.23 .00
Wyndham Hotels
(N=170)
Constant 2.48 .49 5.10 .00 .21
SURVEYSIMBRAND .50 .07 7.07 .00
American Heart
Association (N=170)
Constant 5.00 .56 8.98 .00 .19
SURVEYSIMCAUSE .44 .07 6.59 .00
World Wildlife Fund
(N=170)
Constant 6.10 .73 8.31 .00 .04
SURVEYSIMCAUSE .25 .09 2.84 .00
National Rifle Association
(N=170)
Constant 6.29 .44 14.36 .00 .03
SURVEYSIMCAUSE .17 .07 2.52 .01
DV – ASBRAND or ASCAUSE
My hypothesis 2a was that as TWEETDIVBRAND increases, ASBRAND will decrease.
Linear regression analyses showed that hypothesis 2a was not supported (see Table 3.6). My

76
hypothesis 2b was that as TWEETDIVCAUSE increases, ASCAUSE will decrease. Linear regression
analyses showed that hypothesis 2b was not supported (see Table 3.6).
Table 3.6: Predicting Attitude Strength with Computational Topic Divergence
Brand/ Cause Variables B SE B t p R2
Fitbit (N=170)
Constant 7.71 .88 8.78 .00 .00
TWEETDIVBRAND -.05 .15 -.35 .73
Royal Caribbean (N=170)
Constant 6.71 .88 7.66 .00 .00
TWEETDIVBRAND -.09 .17 -.53 .60
Wyndham Hotels
(N=170)
Constant 5.11 .61 8.34 .00 .01
TWEETDIVBRAND .15 .15 .97 .34
American Heart
Association (N=170)
Constant 9.18 .61 15.00 .00 .00
TWEETDIVCAUSE -.08 .09 -.83 .41
World Wildlife
Fund (N=170)
Constant 7.80 .79 9.85 .00 .01
TWEETDIVCAUSE .11 .12 .91 .37
National Rifle
Association (N=170)
Constant 7.46 1.49 5.01 .00 .00
TWEETDIVCAUSE -.03 .24 -.13 .90
DV – ASBRAND or ASCAUSE

77
Raw Tweet Divergence Validation Check
Since the Text Razor topic tagging tool is a proprietary “black box” machine-learned
model, I also ran a raw term-frequency divergence analysis. When I conducted this analysis, I
found that as RAWDIVBRAND increased, ASBRAND significantly increased (see Table 3.7).
Additionally, as RAWDIVCAUSE increased, ASCAUSE significantly increased only for American
Heart Association (see Table 3.7). For the four results that were significant, the effect size ranges
were extremely low (R2 = .02–.07). The low effect sizes suggest that these results are not of
practical significance, and statistical significance was not found across all brands/causes. Thus,
hypotheses 2a and 2b were not supported when conducting this raw word divergence validation
check.
Table 3.7: Predicting Attitude Strength with Raw Word Divergence
Brand/Cause Variables B SE B t p R2
Fitbit (N=170)
Constant 4.87 .87 5.60 .00 .04
RAWDIVBRAND .44 .16 2.85 .00
Royal Caribbean (N=170)
Constant 2.89 .98 2.94 .00 .06
RAWDIVBRAND .56 .16 3.52 .00
Wyndham Hotels
(N=170)
Constant 1.56 1.15 1.36 .18 .07
RAWDIVBRAND .66 .18 3.63 .00
American Heart
Association (N=170)
Constant 7.34 .60 12.37 .00 .02
RAWDIVCAUSE .23 .11 2.15 .03

78
Table 3.7 (cont.)
Brand/Cause Variables B SE B t P R2
World Wildlife Fund
(N=170)
Constant 6.80 .84 8.08 .00 .01
RAWDIVCAUSE .24 .15 1.65 .10
National Rifle Association
(N=170)
Constant 7.17 .90 7.95 .00 -.01
RAWDIVCAUSE .02 .16 .11 .92
DV – ASBRAND or ASCAUSE
GENERAL DISCUSSION AND CONSIDERATIONS FOR SOCIAL MEDIA
ANALYTICS RESEARCH
My guiding research question for this study was figuring out how I could use balance
theory to discover new ways to measure strength of attitudes towards brands and towards causes
that participate (or will participate) in cause-related marketing partnerships. I was able to use
principles of dyadic balance theory, homophily, and attitude strength measured via topics of
discussion, to predict the strength of attitudes towards brands and causes within CRM
partnerships using a survey-based approach. When I asked participants to report their perceived
similarity of topical conversation with a brand (SURVEYSIMBRAND), I found evidence that this
predicted the strength of participant’s self-reported attitude towards the brand (ASBRAND) across
all three brands (supporting hypothesis 1a). When I asked participants to report their perceived
similarity of topical conversation with a cause (SURVEYSIMCAUSE), I found evidence that this
predicted the strength of participants’ self-reported attitude towards the cause (ASCAUSE) across
all three causes (supporting hypothesis 1b). This is an important contribution to cause-related
practitioners and advertisers, as this provides an indirect way to assess the strength of

79
consumers’ attitudes towards brands and/or causes. Due to being an indirect survey measure, it
has the potential to help in overcoming social desirability bias or self-deception bias than when
just asking for attitude strength directly.
One issue with the results from hypotheses 1a and 1b was the low R2 values for WWF
(R2=.04) and NRA (R2=.03). A potential reason for such low fit for these two organizations is the
possibility that these two organizations may have a stronger potential to suffer from social
desirability bias compared to all the other organizations in my study. The issues of climate
change and gun ownership have proven to be very divisive issues in America (Funk, 2016;
Parker, 2017), and this could have affected some participants’ responses to the attitude strength
question of, “How strong is your attitude toward the World Wildlife Fund (or the National Rifile
Association)?” This would then affect the linear fit (R2) between attitude strength measured
directly and attitude strength measured indirectly. If this was the case, future CRM studies that
measure the strength of attitudes towards brands and towards causes could benefit from adopting
this study’s indirect measure of attitude strength for brands and for causes.
When I assessed the computational topical conversation divergence between participants’
Twitter feeds and the Twitter feeds of brands (TWEETDIVBRAND) and causes
(TWEETDIVCAUSE), this did not predict participants’ self-reported attitude strengths (ASBRAND
and ASCAUSE respectively; hypotheses 2a and 2b). I will now dig a bit deeper into the results of
hypotheses 2a and 2b within the following sections, with an additional focus on outlining some
considerations when comparing a social media analytics approach to a survey approach. More
specifically, I present some of the issues that can arise from automated analysis of social media
data when forecasting psychological constructs, such as attitude strength. I provide additional
analyses from the data within this study to address some of the issues within this study, as well

80
as provide commentary on how to potentially address issues that could not be investigated
further within this study’s current dataset.
Consideration #1: Nuances of Survey Measure Wording Affecting Computational Analysis
Comparisons
There could be many reasons why hypotheses 2a and 2b were not supported, but one
reason could have been due to a discrepancy between what topics participants believed that a
brand (or cause) talked about, versus what that brand (or cause) actually talks about on Twitter.
For example, when a participant was asked, “The topics that Fitbit would talk about are
consistent with the topics that I talk about,” they could have assumed that Fitbit talks about
vacations, and then assessed that they were very similar in conversational topics with Fitbit
because they also talked a lot about vacations. This could have caused an issue with the
computational analysis of topics, because Fitbit’s Twitter does not mention the topic of
vacations, and therefore a participants self-reported topic similarity with Fitbit would be
fundamentally different than their Twitter topic similarity with Fitbit. Due to this potential
discrepancy, I investigated this in greater detail with my validity checks on participants’ thought
listings of topics for each brand and cause. As shown in Appendix 2, I asked each participant to
list what topics they believed each brand and cause would talk about (up to 12 topics, with 1
minimum topic listed). I then recruited three full-time employees from a large Midwestern
university to help code my data. I presented each coder with what topics a participant thought a
brand (or cause) would talk about, and what topics the Text Razor Topic Tagging engine
produced for the Twitter timeline of the brand (or cause). An example can be found in Table 3.8.

81
Table 3.8: Thought-Listing Coding Example of Fitbit
Participant’s Thought-Listing of What Topics Fitbit Discusses
Text Razor’s Topic Tagging of Topics from Fitbit’s Twitter Feed
Fitness, being healthy, exercise, sleep, workout routines, tracking your activities
Fitbit, Smartwatch, Motivation, Physical exercise, Physical fitness, Health, Weight loss, Dieting,
Relaxation (psychology), Sleep, Personal trainer
I wanted to assess how similar participants’ perceptions of what topics each brand and
causes talks about is to what Text Razor’s Topic Tagging model pulled out of each brand or
cause’s Twitter feed. I had each coder rate the self-report to Text Razor similarity
(CODERSIMBRAND and CODERSIMCAUSE) across the two cells (e.g., the two cells in Table 3.3)
on a scale of -2, -1, +1, and +2. I met with all the coders to discuss each rating, and we came to a
consensus that +2 would be when the stemmed form of a word (e.g., walking to walk) or more
was in both cells, +1 would be that no words are shared between cells but the topics are very
related to one another, -1 would be that the topics are very distantly related to one another, and -2
would be that there is absolutely no relationship between the two cells. After coding, inter-rater
reliability was assessed using a two-way, absolute agreement, average-measures intra-class
correlation (ICC) (McGraw & Wong, 1996) to assess the agreement between coders. The
resulting ICCs were in the excellent range for Fitbit (ICCCODERSIM_BRAND=.93), American Heart
Association (ICCCODERSIM_CAUSE=.84), World Wildlife Fund (ICCCODERSIM_CAUSE=.82), and the
National Rifle Association (ICCCODERSIM_CAUSE=.78) according to Cicchetti (1994). Royal
Caribbean (ICCCODERSIM_BRAND=.46) and Wyndham Hotels (ICCCODERSIM_BRAND=.57) were in the fair
range according to Cicchetti (1994). When discussing with the coders as to what might have
caused problems with Royal Caribbean, they indicated that the topic of “emergency evacuation”
on Royal Caribbean’s Twitter timeline caused some confusion (see Appendix 3). With regards to

82
Wyndham Hotels, Wyndham’s Twitter timeline only produced one topic via Text Razor’s Topic
Tagging tool: Tourism. Since coders only had one topic to compare against, they stated that it
was much more of a subjective call when comparing this one topic against all the topics that the
participants listed.
To gain more insights into the issues with Royal Caribbean and Wyndham’s Twitter
timelines, I conducted a term frequency analysis of their timelines. After Twitter tokenization
with NLTK TweetTokenizer (Loper & Bird, 2002) and stop word removal, the top fifty term
frequencies are represented in Table 3.9.
Table 3.9: Top Fifty Terms for Royal Caribbean and Wyndham Hotels
Brand Top Fifty Terms
Royal Caribbean
('hi', 753), ("we're", 487), ('sorry', 423), ('please', 405), ('us', 403), ('sailing', 367), ('changes', 348), ('hey', 347), ("we'll",
343), ('info', 293), ('updates', 228), ('time', 222), ("i'm", 214), ('onboard', 206), ('dm', 196), ('welcome', 193), ('stay', 179), ('guests', 175), ('booking', 173), ('still', 171), ('made', 169), ('thanks', 159), ('tuned', 153), ('soon', 152), ('cruise', 146), ('make', 145), ('know', 139), ('update', 134), ('help', 131), ('zack', 128), ('hear', 124), ('visit', 123), (':)', 120), ('look',
118), ('see', 116), ('kiki', 116), ('monitoring', 112), ('nat', 110), ('keep', 107), ('check', 106), ('understand', 106), ('ana', 104),
('working', 104), ('storm', 104), ('itinerary', 103), ('sure', 102), ('sail', 100), ('like', 99), ('website', 97), ('let', 94)
Wyndham
('please', 131), ('sorry', 127), ('hear', 119), ('colleagues', 104), ('assist', 91), ('experience', 84), ('@whgsupport', 80), ('us',
71), ('may', 68), ('contact', 62), ('email', 60), ('[email protected]', 58), ('dm', 55), ('apologize',
48), ('assistance', 45), ('concerns', 43), ('matter', 41), ('whgsupport', 37), ('contacting', 36), ('concern', 24), ('issue', 23), ('situation', 21), ('wyndham', 14), ('friends', 13), ('aware', 12), ('troubling', 12), ('know', 12), ('taking', 12), ('seriously', 12), ('investigating', 12), ('owner', 12), ('@wyndhamchamp',
12), ('@wyndham', 12), ('would', 11), ('look', 11), ('#wyndhamchamp', 11), ('sure', 10), ('hotel', 9), ('love', 8), ("i'm", 8), ('able', 7), ('help', 6), ('community', 6), ('w', 6), ('@whg_news', 6), ('support', 5), ('happy', 5), ('local', 5),
('ceo', 5), ('hospitality', 5)
During the time period of my Twitter timeline collection, Hurricane Harvey forced Royal
Caribbean and other cruise lines to cancel their cruises (Young, 2017). Thus, this is likely why
the topic of “emergency evacuation” was found in the Text Razor topic list of Royal Caribbean

83
(see Appendix 3), and why many of the terms that are frequently appearing for Royal Caribbean
in Table 3.9 have to do with an emergency (e.g., monitoring, changes, updates, sorry). With
regards to Wyndham, there were many terms shown in Table 3.9 indicating that Wyndham is
using their Twitter timeline primarily for customer service complaints (e.g., sorry, heart, assist,
experience, aware, troubling, investigating, etc.). Upon deeper analysis of Wyndham’s tweets
from my collection period, one of the most prevalent tweets is the following tweet (although it is
modified slightly for each response): “We apologize for your experience. Please contact our
colleagues @WHGSupport so they may assist you with your concerns.” Therefore, Text Razor’s
topic tagging engine most likely did not have enough unique tweets to work with, which
probably contributed to Wyndham having only the one Text Razor topic tag of “tourism”.
Additionally, Text Razor has stated that their topic tagging is derived from data taken from
Wikipedia, which poses an issue for a topic such as customer service. If Text Razor is using the
descriptions of Wikipedia entries to predict the Wikipedia entry name via machine learning,
topics such as customer service would not come up in a topic tagging assessment of a social
media feed. This is due to the fact that the Wikipedia entry for customer service describes what
customer service is, but it does not give examples of how organizations apply customer service
conversationally on social media.
The averages and standard deviations (in parentheses) of the coder ratings for the brands
and the causes were MCODERSIM_BRAND=1.52 (1.17) for Fitbit, MCODERSIM_CAUSE=1.68 (0.95) for AHA,
MCODERSIM_BRAND=0.24 (1.13) for Royal Caribbean, MCODERSIM_CAUSE=1.54 (0.94) for WWF,
MCODERSIM_BRAND=-0.13 (1.13) for Wyndham Hotels, and MCODERSIM_CAUSE=1.48 (1.16) for the
National Rifle Association. For all of the brands and causes that had excellent ICCs, they had
averages that were MCODERSIM=1.48 or higher, which means that what participants believed a

84
brand/cause would talk about were quite close to the topics that Text Razor’s Topic Tagging
model found on the brand/cause Twitter timelines. This functioned as an important validation
step between participants’ survey assessment of their topics of conversation as compared to a
brand (or cause).
As one additional follow-up to the topic of emergency evaluation causing confusion with
Royal Caribbean, I looked at what would happen to my attitude strength prediction results from
hypothesis 2 if I removed the emergency evacuation topic from the Text Razor topic output.
Even with the emergency evacuation topic removed, TWEETDIVBRAND still did not predict
ASBRAND (see Table 3.10).
Table 3.10: Predicting Attitude Strength with Computational Topic Divergence
Brand/Cause Variables B SE B t p R2
Royal Caribbean (N=170)
Constant 6.70 .85 7.90 .00 .00
RAWDIVCAUSE -.09 .17 -.53 .60
DV – ASBRAND
Thus, in general, participants were assessing correctly as to what topics brands and
causes were actually talking about. At the same time, I show that comparing and contrasting a
survey approach against social media analytics approach should not be treated lightly. Additional
validation steps should be taken to make sure that researchers are measuring appropriately across
the two approaches. I share a few more insights on limitations of my comparison of attitude
strength across the survey and social media results in the limitations section.

85
Consideration #2: Accuracy of Computational Topic Detection on Social Media Data
Another consideration that I entertained was whether or not computational topic tagging
is accurate enough to conduct this study’s analysis. Since there is an extensive body of
knowledge that deals with a structured human assessment of content called content analysis (e.g.,
Harwood & Garry, 2003; Krippendorff, 2012; Skalski, Neuendorf, & Cajigas, 2017), I wanted to
see how Text Razor’s topic tagging analysis compared to the gold-standard of human content
analysis. Thus, I conducted two phases of content analysis reviews of the social media data from
this study.
First, I recruited two full-time employees from a large Midwestern university to conduct
the content analyses, with myself functioning as the facilitator. The first content analysis phase
was an effort to decide on which topics should be included in the set of topics that they would
look for when reviewing the Twitter timelines for the brands and the causes. I adopted a
provisional coding approach (Saldaña, 2009), which begins a coding process with a “start-list” of
potential codes to start with prior to coding. My start-list was taken from the survey responses in
which I asked each participant to list what topics they believed each brand and cause would talk
about (up to 12 topics, with 1 minimum topic listed; see Appendix 2). After reviewing the
suggested topics across all the brands and causes, I found enough consistency in responses
between the following topics: Business Travel, Charitable Giving, Climate Change, Cruises,
Customer Service, Diet, Environmentalism, Exercise, Fashion, Firearms, Gun Politics, Gun
Violence, Health, Heart, Hotels, Hunting, Marketing, Medicine, Nature, Oceans, Religion,
Sports, Technology, Vacations, Weather, and Wildlife. I then presented each coder with the
Twitter timelines from the three brands (Fitbit, Royal Caribbean, and Wyndham Hotels) and the
three causes (AHA, WWF, and NRA) separately as HTML web pages. Upon discussion, the

86
coders suggested that 100-150 tweets were as much as they could process visually and
cognitively when attempting to look for topics being discussed, so I ran a random selection script
to choose 150 tweets from each brand and each cause to be presented as separate HTML pages.
The coders reviewed each Twitter timeline and indicated on a separate spreadsheet as to what
topics they believed were being discussed from the previously constructed start-list of topics.
They also were given the opportunity to write in suggestions of other topics being discussed that
were not covered by the provided start-list of topics. Upon completion of this coding task, I ran a
reliability analysis and found substantial agreement (k=.70) between the two coders according to
Viera and Garrett (2005). Additionally, after discussion of potential topics that were not part of
the original start-list, the coders came to a joint conclusion that the start-list was comprehensive
enough of a list without any necessary topics missing. They did indicate though that two topics
from the start-list did not seem to be discussed across the three brands and the three causes,
namely the topics of Business Travel and Religion. Thus, I removed those two topics from
consideration for the next phase of coding.
When analyzing this first phase of coding, one of the most apparent discrepancies was
between Text Razor’s topic tagging of Wyndham’s Twitter timeline and a human coded topic
coding of Wyndham’s Twitter timeline. Text Razor’s topic tagging of Wyndham’s timeline only
produced the topic of “Tourism”, whereas a human topic coding exercise of that same timeline
produced the topics: Charitable Giving, Customer Service, Environmentalism, Health, Hotels,
Marketing, Technology, and Vacations. Although Text Razor does not give details as to how
their topic tagging was built, they do mention that they use “millions of Wikipedia pages” to
assign “hundreds of thousands of different topics at different levels of abstraction” (“TextRazor -
The Natural Language Processing API,” n.d.). Judging from this description, they are using a

87
supervised machine-learned classification approach (Kotsiantis, 2007) in which they use
Wikipedia page titles as the name of the topic (e.g., Customer Service), and the page body as the
training data for that topic (e.g., for customer service,
https://en.wikipedia.org/wiki/Customer_service). One of the biggest indicators of this is the fact
that when Text Razor’s topic tagging API reviewed the Twitter timeline for Wyndham, it only
returned the topic of “Tourism”, but not the topic of “Customer Service”. As seen in Table 3.9
though, Wyndham clearly uses much of their Twitter account for customer service. The reason
why Text Razor did not pick that topic up, and the reason why I suspect that they are using a
supervised machine-learned approach to classify topics through the content of Wikipedia pages,
is because Wikipedia’s entry on “Customer Service” describes customer service only, rather than
also providing examples of people providing actual service to customers. This is clearly a major
pitfall to using social media analytics, especially with regards to black-box machine-learned
models, as this provides more evidence that it is very important to know how a machine-learned
model was trained and built. In this case, a human coded topic analysis was dramatically
different than the machine-learned model.
For the second phase of content analysis, I presented the same two coders from the first
phase with separate HTML pages for each of the 170 Twitter timelines from the participants
from this study. I ran a random selection script to choose 150 tweets from each timeline when
constructing the HTML pages, which was in line with what the coders had indicated that they
could handle visually and cognitively in the previous coding phase. The coders reviewed each
HTML page of participants’ tweets and marked as many topics as they could determine were
being discussed from the topic list that was created from the previous coding phase. After
running reliability analysis, I found that their coding had moderate agreement (k=.42) according

88
to Viera and Garrett (2005). This was not enough agreement to run additional analyses, but the
disagreement brings about important insights. I went through extensive training with both coders
in the first phase where we walked through how they would process what a topic is and what a
topic isn’t, and they achieved substantial agreement in phase one when analyzing brand and
cause Twitter feeds. With this said, when they analyzed users’ Twitter timelines, they found it
much more difficult to code topics for these timelines. Interestingly, when I discussed with the
coders as to which Twitter timelines were problematic, there was a mix of agreement and
disagreement. They both agreed that timelines that were mostly in different languages should be
removed from analysis, but they disagreed as to what level of photo to word ratio, English to
other language ratio, or marketing to personal posts ratio was acceptable. This is yet another
example of how “black-box” computational models really veil some complicated issues with the
underlying data.
As a final point to this consideration, I wanted to address why I did not use traditional
topic modeling (Blei, 2012; Blei et al., 2003) in this study. Topic modeling was originally
developed to summarize a large corpus of documents, to provide a quick way to summarize what
the documents were about (Blei et al., 2003). Thus, topic modeling assumed that there were
many documents within a corpus, and each document had many words. The problem with
applying topic modeling to Twitter is the question of what you consider a document. If you
decide to consider each tweet a document, then there is not enough data within a tweet to
adequately work to what topic modeling was originally conceptualized for. More recent topic
modeling methods created specifically for Twitter have attempted to work around this limitation
through various strategies, such as considering each conversation string between Twitter users as
separate documents (Alvarez-Melis & Saveski, 2016), considering all the tweets that mention the

89
same hashtag as a document (Mehrotra, Sanner, Buntine, & Xie, 2013), or considering all the
tweets from the same author as a document (Hong & Davison, 2010).
Hong and Davison’s (2010) strategy may seem like an appropriate method for this study,
but the next issue is that traditional topic modeling does not actually output topics, but rather
outputs words from the documents that are related to one another (e.g., instead of outputting a
topic such as “environment”, a topic modeling exercise would output a grouping of words such
as: tree, climate change, oceans, green). A researcher must then code those topics, which is not a
trivial task, and proper coding of topics should be based on theoretical knowledge and context-
specific expertise (Humphreys & Wang, 2018; Saldaña, 2009). In some senses, this nullifies the
allure of social media analytics, as part of the reason why a researcher may look to a social
media analytics method is so that prior coding and training work from experts could be leveraged
in a fully automatic way (without the need for intensive human coding). In fact, I would argue
that running traditional topic modeling on social media data is actually not much different than
running traditional content analysis of manually coding topics with human coders, with the
additional help of grouping words that seem similar to one another. With this said, even the
additional help of computationally grouping words together may also be erroneous in the case of
this current study. This is due to the fact that the topics I am interested in would be the topics
from my three brands and three causes, which using Hong and Davison’s (2010) strategy would
produce just six documents. Topic modeling was created based on the need to parse through
thousands, if not millions, of documents rather than just six.
Thus, I chose to use a previously trained machine-learned model that has been trained on
millions of topics and that can be used in a fully automatic fashion. Looking at my results from
the human coding of topics, I can see that there is potential for danger with using these fully-

90
automated social media analytics models. The majority of these machine-learned topic discovery
models do not have published articles explaining the inner-workings of the training of the models
(e.g., “Classification by Taxonomy · Text Analysis API | Documentation,” n.d.; “TextRazor -
The Natural Language Processing API,” n.d.; “Thomson Reuters | Open Calais,” n.d.), but even
the ones that do have articles associated with them do not actually publish the machine-learned
model itself (which could be done as a Python pickle file) or any of the data used to train the
model (e.g., Quercia, Askham, & Crowcroft, 2012).
Therefore, researchers and practitioners should be very cautious when running social
media analytics methods such as topic discovery. It may still be the case that human coding is the
best way to go about topic discovery in many cases. On the computational side, I have also
shown evidence as to why we need more computational models where the details on the training
of the model, as well as the model itself, is published. I would suggest that researchers should
also consider publishing the data used to build the machine-learned models, but there are
additional concerns with that practice, namely in the areas of privacy, data ethics, and social
media platform terms of service. One example of a machine-learned model that has both
sufficient published details of the training of the model, and the model itself is published, is
IBM’s Personality Insights model (Arnoux et al., 2017).
Consideration #3: Differences in Results Depending on Social Media Platform
There are clearly numerous other potential reasons why my social media analytics
approach to predicting attitude strength did not work. One obvious reason is that maybe a social
media analytics approach is not a viable way to measure attitude strength, but this conclusion
seems a bit premature due to the vast landscape of additional social media platforms and topic
tools that are available. In light of this, one of my limitations could have been that Twitter may

91
not be the optimal social media platform for this kind of analysis. Rosenstiel et al. (2015)
surveyed 4,713 social media users, and found that 90% of Twitter users in the survey said that
they used Twitter for reading and sharing news. Only 30% of those Twitter users stated that they
used Twitter to tell others what they were doing and what they were thinking about. This could
be a major reason why my social media analytics approach did not work, as only certain topics
are being discussed in the news at any given time. Thus, a topic tagging tool running on Twitter
timelines would pick up only a small set of topics being discussed in the news. Future research
should consider using other social media platforms (e.g., Facebook, Reddit, Tumblr, etc.) in
which people may talk about a wider range of topics.
In line with the consideration of differences across social media platforms, previous
research has looked at how individuals interact with brands via various social media platforms.
Smith, Fischer, and Yongjian (2012) analyzed brand-related user-generated posts (UGC) across
Twitter, Facebook, and YouTube, and found that Twitter hosted the most percentage of posts in
which brands were the focus of the UGC (76% of all brand-related UGC, as opposed to 66% for
Facebook, and 42% for YouTube). Studies like this provide additional evidence that people
operate differently depending on the social media platform that they are using, and thus one
platform may be more appropriate for certain computational methods, whereas others may not.
This is both an important consideration for researchers, as well as an open-area of research with
regards to testing to see what methods are appropriate for which platforms.
Consideration #4: Lack of A-Priori Hypotheses in Previous Machine-Learned Social Media
Studies
This potential inability to use Twitter for the analysis of individuals’ full topics of
conversation also brings about a deeper question for research using social media data. Social

92
science studies that deal with social media generally fall into three camps: studies that ask
participants to self-report about their behavior on social media platforms (e.g., Blackwell,
Leaman, Tramposch, Osborne, & Liss, 2017; Marshall, Lefringhausen, & Ferenczi, 2015;
Tandoc, Ferrucci, & Duffy, 2015), studies that analyze actual social media data directly (e.g., K.-
J. Chen, Lin, Choi, & Hahm, 2015; Leskovec et al., 2010b; Ranganath, Morstatter, Hu, Tang, &
Liu, 2015; Zhang, Bhattacharyya, & Ram, 2016), and studies that bridge between some form of
self-reported data and correlating this data with actual social media data (e.g., J. Chen et al.,
2014; Golbeck et al., 2011; Markovikj, Gievska, Kosinski, & Stillwell, 2013; Park et al., 2015;
Youyou, Kosinski, & Stillwell, 2015; Youyou et al., 2017). For the studies that ask participants
to self-report about their social media usage, a critique of this research is that self-reported social
media behavior and observed social media behavior could be different. The studies that directly
analyze social media data solely could be criticized for different reasons, such as not knowing if
accounts are bots, or not really understanding what deeper psychological markers could be
driving any observed effects. Therefore, it seems that a combined approach that has participants
both fill out a survey and give access to their social media data could be an ideal way to conduct
research within the realm of social media. Part of this assumption is that social psychological
measures that are self-reported should be detectable via online social media data. Previous
research seems to show that this is possible, as there has been much research conducted that
looks at correlating participants’ self-reported personality tests with what words they use on
social media (e.g. Arnoux et al., 2017; Golbeck et al., 2011; Kern et al., 2014; Schwartz et al.,
2013). With this said, in all of these previous research studies, personality scores were first
calculated by self-reported personality tests, and then machine-learning was used to correlate
whatever words could be correlated to various personality score combinations to build a

93
predictive model. There was no prediction prior to building the machine-learned model as to
which words would correlate with what personality dimensions; whereas in this study, I had a
specific hypothesis that the divergence score of topics of conversation would predict one self-
reported social psychological measure (attitude strength). Future research should look into this
discrepancy, especially to see if there are certain ways or directions in which a survey-based
approach does or does not work when correlated against social media data.
Consideration #5: Potential Differences in Self-Presentation on Social Media
Finally, one of the more fundamental questions when comparing social media data to
self-reported psychological assessments is whether or not people present themselves on social
media in the same way that they would present themselves in everyday offline settings. An
assumption of my study, as well as previous studies correlating self-reported psychological
measures and social media behavior (e.g. Arnoux et al., 2017; Golbeck et al., 2011; Kern et al.,
2014; Schwartz et al., 2013), is that people present themselves on social media platforms in ways
that are approximately close to who they really are in offline settings. Hogan (2010) refers to the
interesting dilemma that social media brings when considering the platform in light of
Goffman’s (1959) dramaturgical approach in which Goffman suggests that an individual presents
himself/herself in an idealized way when appearing “front stage” to certain audiences, and yet
showing their true selves when appearing “back stage” to another subset of audiences (and/or to
their own selves). The dilemma lies in how an individual now conceptualizes what is front stage
and back stage within the realm of social media. Marwick and Boyd (2011) took this one step
further and suggested that figuring out who is actually watching (the audience) becomes
increasingly confusing on social media platforms. They directly surveyed 226 Twitter users by
directly @mentioning them, asking them questions such as: Who do you imagine reading your

94
tweets? Who do you tweet to? What they found was that peoples’ perceptions as to who their
actual audience was on Twitter varied widely even though all the individuals had fully public
facing Twitter accounts. Thus, a platform like Twitter could be an environment where people
may be presenting a different self than they would normally present, and this could present issues
when correlating a private self-report measurement of psychological measures to a public-facing
social media platform. Future research should consider the potential differences in how people
present themselves online, and how that may affect the types of consumer research we could
reliably conduct using social media analytics.
LIMITATIONS
Survey Measures for Topic Similarity and Attitude Strength
Although I found support for conversation topic similarities predicting attitude strengths
via an indirect survey measure, there are limitations to this measurement for conversation topic
similarity. The specific survey question regarding conversation topic similarity was as follows,
“The topics that Royal Caribbean International would talk about are consistent with the topics
that I talk about” (Royal Caribbean example). As far as I know, attitude strength with CRM has
not previously been measured via similarity, thus I had to make a decision as to how to word this
measure. I chose this “consistency” wording because I believed that it was a more natural way to
ask this question, but research has shown that minor changes in how questions are worded can
substantially affect results (Schwarz, 1999). Therefore, the word “similarity” could possibly have
provided different results than the word “consistency”. Additionally, I did not ask them to
consider arenas of discussion, as people may talk about certain topics at work, but other topics at
home. Future studies should consider how changing the wording of the measure affects
outcomes.

95
Another potential limitation to my dissertation is the way that I measured attitude
strength. I measure attitude strength by asking, “How strong is your attitude toward Royal
Caribbean International?” (Royal Caribbean example; adapted from Bassili, 1996). Although this
was not an incorrect way to measure attitude strength, research has shown that there are
numerous different ways to measure attitude strength (e.g., attitude accessibility, attitude
importance; Petty & Krosnick, 1995). While many measures of attitude strength correlate with
one another, they each have been shown to represent different dimensions of attitude strength
(Krosnick et al., 1993). Therefore, adding additional measures of attitude strength could have
given me broader insight into its effects within CRM partnerships. We have evidence that
another way to measure attitude strength is through response latency (Bassili, 1996), in which
attitude strength has been reliably assessed by how quickly an individual responds to a question
about their attitude towards a topic. For future research, attitude strength could be assessed by
taking various self-reported survey measures of attitude strength, while also recording the
response latency for each participant towards those questions. With this said, previous research
has shown that the validity of response latency measurement for attitude strength measurement
depends on how sensitive the mechanism is that picks up the time latencies (Bassili & Fletcher,
1991). This kind of response latency measurement would likely require surveys administered in a
physical lab setting with computers that have very precise software installed for measuring
response latency, such as DirectRT (Jarvis, 2016).
Frequency of Topics Beings Discussed
Another limitation of my study was that my method of computationally comparing topic
similarity (divergence) to predict attitude strength was based simply on whether that topic was
being discussed or not on a Twitter timeline. It did not account for the amount a topic was being

96
discussed on a Twitter timeline, which is a portion of Krosnick et al.’s (1993) findings on topic
conversation predicting attitude strength. Machine-learned topic tagging does not currently count
occurrences that a topic is being discussed in a body of text, but rather probabilities. With this
said, future research could consider running topic tagging on smaller segments of social media
feeds to get at an approximation of the frequency of the topics being discussed, but this would
require filtering feeds that are much closer in number of posts to one another. Thus, this could
have contributed to the lack of findings for hypotheses 2a and 2b.
Survey-Based Topic Similarity Measurement
Another consideration that was not brought up within Chapter 3 was the possibility that I
was not comparing apples to apples when it came to comparing my indirect survey-based
measure of attitude strength with a social media analytics approach. Maybe a more appropriate
comparison would have been to ask each participant what topics they talk about as well as ask
them what topics they believed a brand (or cause) talks about. Then I could have run a similar
topic similarity (or divergence) comparison between the two to see if that correlates with the
surveyed attitude strength as my base case. Another possibility would be to ask participants what
topics of discussion would be in common with a brand (or cause), and what topics of discussion
would be not in common with a brand (or cause). The ratio of common to not common could
potentially be another way that is closer in comparison to the social media analytics approach.
This is another avenue for future research in this area.
CONCLUSION
In this day and age where CRM partnerships are being actively discussed and debated on
social media, cause-related advertisers and practitioners should benefit from understanding
various ways in which attitude strength towards brands and causes can be measured. I provided

97
an indirect survey-based measure in which attitude strength could be measured towards brands
and towards causes, but I was not able to prove out a social media analytics approach to
detecting attitude strength towards brands and towards causes on social media. I also brought to
light deeper considerations when conducting research across self-reported surveys and actual
social media data. As social media environments become more and more segmented by various
affiliations and beliefs, even beyond CRM debates, the search for how to detect attitude strength
on social platforms becomes ever more important.

98
CHAPTER 4: GENERAL DISCUSSION AND CONCLUDING REMARKS
GENERAL DISCUSSION
CRM Compatibility Predictions by Attitudinal Bias
The focus of this dissertation was to understand how balance theory can help to give us
deeper insight into CRM compatibility, as well as to analyze how CRM compatibility could also
further our understanding of balance theory. One of my most important findings was that CRM
compatibility can be predicted via consumers’ attitudes towards brands, alongside their attitudes
towards causes. Simmons and Becker-Olsen (2006) wrote that, “Compatibility between a firm
and a sponsored cause is high when the two are perceived as congruent (i.e., as going together),
whether that congruity is derived from mission, products, markets, technologies, attributes, brand
concepts, or any other key association” (p. 155). With regards to the examples that they list, they
are suggesting that consumers’ assessments of congruence are based on some sort of logical
comparison of metrics between the partnering organizations. What I found suggests that CRM
compatibility is not just based on logical comparisons of key congruence metrics between a
brand and a cause (if at all), but rather simply on separate subjective attitudes towards brands and
towards causes. This is not that surprising, as previous research in human decision making has
shown that people are prone to using biases in judgments rather than objective reasoning (Lord,
Ross, & Lepper, 1979). Many times, we may be unaware that this is happening cognitively. In
fact, Nisbett and Wilson (1977) showed that when people were asked to report on why we
responded to things in a certain way, they were incredibly poor in accurately assessing what
drove their responses. By understanding that we could assess consumers’ perceptions of CRM
compatibility by measuring their attitudes towards a brand, alongside their attitude towards a

99
cause, this opens up the possibility of predicting how consumers would perceive CRM
compatibility between a brand and a cause before they actually enter into a CRM partnership.
CRM practitioners and advertisers could measure attitudes towards brands and towards causes
first, and then make a decision as to whether or not certain brands should partner with certain
causes.
This gives further evidence then that CRM practitioners and advertisers should not rely
largely on logical comparisons of brands and causes when considering future partnerships.
Rather, they should be very concerned about general attitudes that people have towards brands
and causes prior to entering into any form of CRM partnership. One consideration for CRM
practitioners and advertisers could be that much work would still need to be done to increase
consumers’ attitudes towards a brand, as well as their attitudes towards a cause, prior to entering
into a CRM partnership. In fact, it may be appropriate to include this stage as part of the overall
timeline of the CRM partnership timeline and strategy. If consumers’ attitudes cannot be
changed positively prior to the partnership being publicly advertised, it may be wise to
discontinue (or modify) the plans to partner.
Using Attitude Strength within Balance Theory
Attitude strength has not been considered previously within balance theory, and this is the
first series of studies to consider attitude strength when predicting perceived CRM compatibility
within CRM triads. Previous studies that found balance theory to hold in real world data (e.g.,
Leskovec et al., 2010a, 2010b) only looked at dichotomous attitude values (+1 or -1), but I
focused on considering attitudes as continuous values within this dissertation. When only
continuous measures of attitude towards the brand and towards the cause were considered, I was
only able to predict whether or not CRM triads would be balanced in two out of the three CRM

100
partnerships within Chapter 2. Attitude strength has been shown to predict psychological
movement better than measures of attitude alone (Petty & Krosnick, 1995), and balance theory is
conceptually based on the prediction of psychological movement. Therefore, when I included
continuous measures of attitude strength within the calculations of balance in CRM triads, I was
able to predict balance for all three CRM partnerships. A consideration for future research could
be that adding attitude strength to balance theory beyond CRM research may also show benefit
to models of balance prediction. In fact, a recent review of attitude strength suggested that
attitude strength may play a role in balance theory (Howe & Krosnick, 2017). With regards to the
realm of CRM research, I have provided evidence that future studies should consider adding
attitude strength when considering perceived CRM compatibility.
Spillover of Attitude within CRM Partnerships
Another major finding was the discovery that when attitude strength was included in my
predictive model, I found evidence across all three partnerships that consumers’ attitude towards
brands and towards causes were spilling over into one another within CRM evaluations of
compatibility. As mentioned earlier, Wyndham Hotels cut ties with the NRA in February 2018,
due to consumers’ responses to the recent mass shootings in the United States. In fact, one news
report showed a Twitter snapshot to emphasize the work that Wyndham was doing to assuage
consumers’ concerns (Taylor, 2018, see Figure 4.1).

101
Figure 4.1: Twitter Snapshot from Business Insider Report (Names Blacked Out)
I assume that part of Wyndham’s business reason for ending the partnership was that they
believed that attitudes towards their brand was being negatively affected by the partnership with
the NRA, especially due to all the activity they were receiving from social media users that I can
assume have negative attitudes towards the NRA. Looking at the data from my dissertation
though, it may not have been that case that attitudes towards Wyndham was being negatively
affected by peoples’ attitudes towards the NRA. In fact, when I looked at participants who had
negative attitudes towards the NRA, I did not find any evidence that those negative attitudes
were spilling into the attitudes towards Wyndham (or from Wyndham to the NRA). If I were to
look only at the dataset within this dissertation, it seems that Wyndham’s decision to end the
partnership with the NRA might have been pre-mature. With that said, I considered analyzing the
data for WyndhamNRA by looking at those who had positive attitudes towards Wyndham and
negative attitudes towards NRA (N=158) and comparing it to those who had negative attitudes
towards Wyndham and negative attitudes towards the NRA (N=25), but the sample size of the

102
latter was far too small to make any sort of statistical conclusions from. Lakens and Evers (2014)
suggest that a minimum sample size of N=126 is needed before most statistical conclusions can
be made for most social psychology studies. With this said, I already stated in Chapter 2 that I
could find no benefit from a well-liked brand partnering with a disliked cause, and therefore it
seems that the safest bet is for CRM practitioners and advertisers to stay away from a partnership
such as the one between Wyndham and the NRA.
Topic Similarity Scope Changes Since the Dissertation Proposal
My findings on conversation topic similarity predicting attitude strength requires some
further explanation as compared to the originally approved dissertation proposal. This
dissertation has stayed largely on track with the committee approved dissertation proposal from
the spring of 2017. The major change started theoretically within the first study (Chapter 2), as
the original proposal suggested that I could also predict perceived compatibility from consumers’
conversation topic similarities with a brand, alongside their conversation topic similarities with a
cause. This hypothesis suggested that conversation topic similarity could predict both the
measures of attitude and attitude strength together at the same time. Upon later consideration,
and subsequent conversation with committee members, I realized that the measure of attitude
(valence and degree of favor) could not be predicted from conversation topic similarity. I only
have evidence that it is attitude strength (not attitude) that can be predicted by what topics an
individual talks about, and how often they talk about those topics (Krosnick et al., 1993).
Thus, due to this change, the scope of the second study (Chapter 3) changed. One of the
original intentions of the second study was to provide a comprehensive computational prediction
model for CRM compatibility using social media data. To do this, I would also need to detect
participants’ attitudes towards brands and towards causes via a social media analytics approach.

103
Since one of the focuses of this dissertation was to compare participants’ social media data with
their surveyed responses, one way to measure participants’ attitudes towards brands and towards
causes would have been to run feature-based sentiment analysis on participants’ social media
data. Feature-based sentiment analysis is the measurement of attitude towards words (sometimes
called tokens or features in the computational sciences) in a dataset (Eirinaki et al., 2012). The
reason why this was not possible for the dataset in this dissertation was due to the fact that I was
limited to the social media feeds of the Amazon Turk participants from my studies. To run
feature-based sentiment analysis, the participants would have needed to be speaking about the
specific brands (Fitbit, Royal Caribbean, and Wyndham Hotels) and the specific causes
(American Heart Association, WWF, NRA) within their social media feeds. These brand (or
cause) names would have been the features in which feature-based sentiment analysis could have
been run on, but not enough participants had these features appearing within their social media
feeds.
To illustrate this, I ran an analysis of all N=170 participants’ Twitter feeds to see if there
was enough mentions of the brands and/or causes to run feature-based sentiment analysis. For
each brand and/or cause, I focused on looking for the following words/phrases: Royal Caribbean
(‘Royal Caribbean’, ‘RoyalCaribbean’); WWF (‘WWF’, ‘World Wildlife Fund’); Fitbit
(‘Fitbit’); American Heart Assocation (‘American Heart Association’, ‘AHA’,
‘AmericanHeart’); Wyndham Hotels (‘Wyndham’, ‘Wyndham Hotels’); NRA (‘NRA’, ‘National
Rifle Association’). Across the N=170 participants, only one participant mentioned words related
to Royal Caribbean, one participant mentioned words related to WWF, eight participants
mentioned words related to Fitbit, seventeen participants mentioned words related to AHA, no
participants mentioned words related to Wyndham Hotels, and seventeen participants mentioned
104
words related to NRA. Thus, even in the best case of having seventeen participants that spoke
about the NRA on their Twitter feeds, this would not have been enough to run a regression
analysis against self-reported attitudes towards the NRA.
Since I could not predict consumers’ attitudes towards the brands and towards the causes
within CRM partnerships, I focused on one piece of the predictive model, namely attitude
strength. What I found was that although I could predict attitude strength from surveyed
conversation topic similarities with brands (or causes), I could not predict attitude strength using
a social media analytics approach. This brought about larger questions as to whether or not we
can use a hybrid survey to social media analytics approach to answer specifically hypothesized
social science questions with social media data. I have evidence that a hybrid approach works
when there are no a priori hypotheses of what variables may correlate with a participants’ survey
responses and their social media data (e.g., Golbeck et al., 2011; Kern et al., 2014; Youyou et al.,
2017), but I have less evidence that an a priori hypothesized correlation will work between
participants’ surveyed responses and their social media data. For this dissertation, I specifically
hypothesized that topic similarity between a consumer and a brand (or cause) would predict their
surveyed attitude strength. Although this was supported via an indirect survey measure, it was
not supported via a social media analytics approach.

105
Prediction of Attitude Strengths via Topic Similarities
Part of the focus of this dissertation was to find new ways to measure attitude strength
within CRM partnerships, and I found that participants’ self-report of their perceived similarity
of topical conversation with a brand (or a cause) was an indirect way to measure their self-
reported attitude strength towards that brand (or that cause) when using a survey method.
Conversation topic similarity may be a way for CRM practitioners to assess attitude strength
more discretely towards brands and causes prior to entering into a CRM partnership, and this
novel method could potentially suffer less from social desirability bias and self-deception bias
concerns when using a survey to measure attitude strength.
Future Research on CRM Partnerships with Social Media Data
Moving forward, there is great potential for additional insights for CRM partnerships via
social media data, including the following considerations.
Sentiment analysis for assessing separate attitudes towards brands and causes. In
future studies, if a larger sample of participants that mention brands/causes directly on their
social media feeds could be acquired, I could run sentiment analyses towards these brands and
causes. Another strategy could be to find social media users that are talking about brands and
causes within their feeds, and directly asking them if they would like to take a survey of their
attitudes and attitude strengths towards those brands and causes. Drawing from my work on
using perceived conversation topic similarity to predict attitude strength, there may be a
possibility to detect attitudes towards brands and towards causes by assessing consumers’
attitudes towards the topics that are most associated with a brand or a cause. For example, if I
look at the topic tagging data from Fitbit’s Twitter feed (see Appendix 3 from Chapter 3), I see
that one of the topics that Fitbit discusses is physical fitness. If I was able to run sentiment

106
analysis towards the topic of physical fitness on consumers’ Twitter feeds (for the consumers
that discuss physical fitness), could this predict their attitude towards Fitbit? As mentioned in
Chapter 3, Twitter may not be the best social media platform to assess this, as the breadth of
topic discussion may be limited. However, pairing the computational assessment of separate
attitudes towards brands and causes with the assessment of separate attitude strengths towards
brands and causes could provide the pieces to create a computational predictive model for CRM
compatibility using social data.
Computational topic similarity prediction of attitude strength via image analysis.
Another consideration for future research would be attempting to predict attitude strength
through entity recognition via social media images. Instagram is a social media platform in
which each social media post requires the sharing of some sort of image or picture. Amongst 18-
24 year old Americans, Instagram is one of the most popular social media platforms today (A.
Smith & Anderson, 2018). As individuals share vast numbers of photos and images on
Instagram, there is an interesting opportunity to analyze these photos to understand what the
individuals are interested in. Advances in machine learning, and specifically deep learning, have
produced tools that allow us to analyze image similarity (e.g., van der Walt et al., 2014) and
recognize entities (e.g., bicycle, female, dog) within images (e.g., “Amazon Rekognition – Video
and Image - AWS,” n.d.). Entities that are detected within images could potentially be correlated
with topics that the posting individual is interested in. Therefore, I could compare the similarity
of entities within images that are shared on brand (or cause) Instagram accounts with the
Instagram accounts of consumers to check for a correlation between this similarity and attitude
strength. I could also consider a raw image similarity analysis (without the entity recognition) as
a baseline analysis between Instagram accounts. This Instagram study could also give me more

107
insight as to whether correlating social media data with a specifically hypothesized social
psychological measure could work.
LIMITATIONS
Neutral Attitudes and Balance Theory
Heider (1958) briefly discussed neutral edges within balance theory, but excluded their
consideration in his final models of balance. More recently, Altafini (2012) studied how opinions
are formed within structurally balanced networks, and he commented on neutral edges within
structural balance by stating, “Also for this more general definition (the one adopted in this
paper) structural balance implies a lack of ambiguity in the way each individual classifies each
other individual as a friend or as an enemy” (p. 1). Other studies have pointed to the fact that
there needs to be further research in considering neutral edges within balance theory (e.g., Antal
et al., 2005, 2006), but I could not find any that actually included them in their studies. I did not
realize this issue until I was in the data analysis stage of this dissertation, thus the only
reasonable decision I could make was to exclude triads that included neutral attitudes from my
analyses. At the very least, future studies should consider using an even-numbered scale, as that
will obviously prevent anyone from denoting a neutral attitude.
Number of CRM Partnerships Pre-Tested
The four CRM partnerships that I pre-tested were Fitbit and American Heart Association,
Royal Caribbean and the World Wildlife Fund, Grey Goose and the National Gay and Lesbian
Task Force, and Wyndham Hotels and the National Rifle Association. My aim was to find three
partnerships that exhibited, on average, high perceived compatibility, mid-level perceived
compatibility, and low perceived compatibility. The three partnerships that I chose were
FitbitAHA (MCOMP_PERCEIVED=10.11, SD=1.95), RoyalWWF (MCOMP_PERCEIVED=6.23, SD=2.68),

108
and WyndhamNRA (MCOMP_PERCEIVED=3.59, SD=2.31). I had made the assumption that amongst
the four partnerships being tested, I was going to find the three levels of perceived compatibility,
and this was indeed the case. With this said, pre-testing more partnerships would have been the
safer route, and would have potentially given me even greater separation between perceived
compatibilities. There could have also been the possibility of including a range of perceived
compatibilities that spanned across four or more partnerships, although I would have had to
consider survey fatigue for the participants at a certain point.
CONCLUDING REMARKS
In this dissertation, I analyzed CRM compatibility through the lens of balance theory both
via a survey-based approach, as well as a social media analytics approach. I found evidence that
a consumer’s attitudes towards a brand, along with their attitudes towards a cause can predict
their perceived CRM compatibility, and that attitude and attitude strength can spill over within
CRM partnerships. I also showed that attitude strength can be measured indirectly through
analyzing perceived conversation topic similarity via a self-reported survey measure. Although
this does not give me the final picture that I need to predict CRM compatibility both from a
survey-based approach and a social media analytics approach, this dissertation provides
numerous steps forward within the realm of CRM research, as well as balance theory research.
As far as I know, this was the first series of studies that included attitude strength within balance
theory. I also provided insight and subsequent questions into research conducted using a
hybridization of a survey-based approach tied to a social media analytics approach. Building on
this, I provided some considerations for future research building upon these methods, especially
in the context of newer computational techniques to analyze social media data. Lastly, this
dissertation provided insights that are beneficial to CRM researchers, practitioners, and

109
advertisers as we move forward in our efforts to acquire a greater understanding of CRM
partnerships as a whole.

110
REFERENCES
Altafini, C. (2012). Dynamics of opinion forming in structurally balanced social networks. Proceedings of the IEEE Conference on Decision and Control, 7(6), 5876–5881. https://doi.org/10.1109/CDC.2012.6427064
Alvarez-Melis, D., & Saveski, M. (2016). Topic Modeling in Twitter: Aggregating Tweets by Conversations. In Icwsm16 (pp. 519–522). Retrieved from evernote:///view/779439927/s24/8594e3b8-85b2-4f4c-8fc8-1f4b55e818cb/8594e3b8-85b2-4f4c-8fc8-1f4b55e818cb/
Amazon Rekognition – Video and Image - AWS. (n.d.). Retrieved March 20, 2018, from https://aws.amazon.com/rekognition/
American Express - Corporate Social Responsibility - Initiatives. (n.d.). Retrieved February 14, 2018, from http://about.americanexpress.com/csr/pip.aspx
Antal, T., Krapivsky, P. L., & Redner, S. (2005). Dynamics of Social Balance on Networks. Arxiv, 1, 1–10. https://doi.org/10.1103/PhysRevE.72.036121
Antal, T., Krapivsky, P. L., & Redner, S. (2006). Social balance on networks: The dynamics of friendship and enmity. Physica D: Nonlinear Phenomena, 224(1–2), 130–136. https://doi.org/10.1016/j.physd.2006.09.028
“Arctic Home” Generates over $2 Million in Donations for Polar Bear Conservation | Press Releases | WWF. (2012). Retrieved February 14, 2018, from https://www.worldwildlife.org/press-releases/arctic-home-generates-over-2-million-in-donations-for-polar-bear-conservation
Arnoux, P.-H., Xu, A., Boyette, N., Mahmud, J., Akkiraju, R., & Sinha, V. (2017). 25 Tweets to Know You: A New Model to Predict Personality with Social Media. ArXiv, (April). Retrieved from http://arxiv.org/abs/1704.05513
Barone, M. J., Miyazaki, A. D., & Taylor, K. A. (2000). The Influence of Cause-Related Marketing on Consumer Choice: Does One Good Turn Deserve Another? Journal of the Academy of Marketing Science, 28(2), 248–262. https://doi.org/10.1177/0092070300282006
Barone, M. J., Norman, A. T., & Miyazaki, A. D. (2007). Consumer response to retailer use of cause-related marketing: Is more fit better? Journal of Retailing, 83(4), 437–445. https://doi.org/10.1016/j.jretai.2007.03.006
Basil, D. Z., & Herr, P. M. (2006). Attitudinal Balance and Cause-Related Marketing: An Empirical Application of Balance Theory. Journal of Consumer Psychology, 16(4), 391–403. https://doi.org/10.1207/s15327663jcp1604_10
Bassili, J. N. (1993). Response latency versus certainty as indexes of the strength of voting intentions in a Cati survey. Public Opinion Quarterly, 57(1), 54. https://doi.org/10.1086/269354
Bassili, J. N. (1996). Meta-Judgmental versus Operative Indexes of Psychological Attributes: The Case of Measures of Attitude Strength. Journal of Personality and Social Psychology, 71(4), 637–653. https://doi.org/10.1037/0022-3514.71.4.637
Bassili, J. N., & Fletcher, J. F. (1991). Response-time measurement in survey research. Public Opinion Quarterly, 55, 331–346.
Bergkvist, L., & Rossiter, J. R. (2007). The Predictive Validity of Multiple-Item Versus Single-Item Measures of the Same Constructs. Journal of Marketing Research, 44(2), 175–184. https://doi.org/10.1509/jmkr.44.2.175

111
Blackwell, D., Leaman, C., Tramposch, R., Osborne, C., & Liss, M. (2017). Extraversion, neuroticism, attachment style and fear of missing out as predictors of social media use and addiction. Personality and Individual Differences, 116, 69–72. https://doi.org/10.1016/j.paid.2017.04.039
Blei, D. M. (2012). Probabilistic topic models. Communications of the ACM, 55(4), 77–84. https://doi.org/10.1109/MSP.2010.938079
Blei, D. M., Edu, B. B., Ng, A. Y., Edu, A. S., Jordan, M. I., & Edu, J. B. (2003). Latent Dirichlet Allocation. Journal of Machine Learning Research, 3, 993–1022. https://doi.org/10.1162/jmlr.2003.3.4-5.993
Brønn, P. S., & Vrioni, A. B. (2001). Corporate social responsibility and cause-related marketing: an overview. International Journal of Advertising, 20(2), 207–222. https://doi.org/10.1080/02650487.2001.11104887
Bühler, J., Cwierz, N., & Bick, M. (2016). The Impact of Social Media on Cause-Related Marketing Campaigns. In Social Media: The Good, the Bad, and the Ugly (Vol. 9844, pp. 105–119). Springer. https://doi.org/10.1007/978-3-319-45234-0
Buhrmester, M., Kwang, T., & Gosling, S. D. (2011). Amazon’s Mechanical Turk: A new source of inexpensive, yet high-quality, data? Perspectives on Psychological Science, 6(1), 3–5. https://doi.org/10.1177/1745691610393980
Cacioppo, J. T., & Petty, R. E. (1981). Social psychological procedures for cognitive response assessment: The thought listing technique. Cognitive Assessment, 388–438.
Chandler, J., & Shapiro, D. (2016). Conducting Clinical Research Using Crowdsourced Convenience Samples. Annual Review of Clinical Psychology, 12, 53–81. https://doi.org/10.1146/annurev-clinpsy-021815-093623
Chen, J., Hsieh, G., Mahmud, J. U., & Nichols, J. (2014). Understanding individuals’ personal values from social media word use. In Proceedings of the 17th ACM conference on Computer supported cooperative work & social computing - CSCW ’14 (pp. 405–414). New York, New York, USA: ACM Press. https://doi.org/10.1145/2531602.2531608
Chen, K.-J., Lin, J.-S., Choi, J. H., & Hahm, J. M. (2015). Would You Be My Friend? An Examination of Global Marketers’ Brand Personification Strategies In Social Media. Journal of Interactive Advertising, 15(2), 97–110. https://doi.org/10.1080/15252019.2015.1079508
Choudhury, M. De. (2011). Tie formation on twitter: Homophily and structure of egocentric networks. Proceedings - 2011 IEEE International Conference on Privacy, Security, Risk and Trust and IEEE International Conference on Social Computing, PASSAT/SocialCom 2011, 465–470. https://doi.org/10.1109/PASSAT/SocialCom.2011.177
Cicchetti, D. V. (1994). Guidelines, Criteria, and Rules of Thumb for Evaluating Normed and Standardized Assessment Instruments in Psychology. Psychological Assessment, 6(4), 284–290. https://doi.org/10.1037/1040-3590.6.4.284
Classification by Taxonomy · Text Analysis API | Documentation. (n.d.). Retrieved March 13, 2017, from http://docs.aylien.com/docs/classify-taxonomy
Coca-Cola | Partnerships | WWF. (2017). Retrieved March 3, 2017, from http://www.worldwildlife.org/partnerships/coca-cola
Davis, J. A. (1967). Clustering and Structural Balance in Graphs. Human Relations. https://doi.org/0803973233
Eagly, A. H., & Chaiken, S. (1993). The Psychology of Attitudes. Orlando: Harcourt Brace Jovanovich College Publishers.

112
Easley, D., & Kleinberg, J. (2010). Networks, crowds, and markets : reasoning about a highly connected world. Cambridge University Press. Retrieved from http://www.cambridge.org/us/academic/subjects/computer-science/algorithmics-complexity-computer-algebra-and-computational-g/networks-crowds-and-markets-reasoning-about-highly-connected-world#xFIUTLTC7UKjPG3J.97
Edevane, G. (2018). NRA Boycott Causes Hotel Chains, Rental Car Companies to Cut Ties. Retrieved February 24, 2018, from http://www.newsweek.com/car-rental-hotels-ditch-nra-following-boycott-818226
Eirinaki, M., Pisal, S., & Singh, J. (2012). Feature-based opinion mining and ranking. Journal of Computer and System Sciences, 78(4), 1175–1184. https://doi.org/10.1016/j.jcss.2011.10.007
ESP’s Growth of Cause Marketing - Engage for Good. (2017). Retrieved February 14, 2018, from http://engageforgood.com/iegs-growth-cause-marketing/
Fairchild, C. (2013). NRA “Members-Only Discount Program” Offers Reduced Prices On Hotels, Car Rentals And More | HuffPost. Retrieved February 17, 2018, from https://www.huffingtonpost.com/2013/03/05/nra-members-only-discount-program_n_2807281.html
Fan, W., & Gordon, M. D. (2013). Unveiling the Power of Social Media Analytics. Communications of the ACM, 12(JUNE 2014), 1–26. https://doi.org/10.1145/2602574
Filmore, N. (2013). Has the WWF Sold Out? Retrieved March 2, 2017, from http://www.huffingtonpost.ca/nick-fillmore/wwf-corporation_b_3496810.html
Funk, C. (2016). The Politics of Climate Change in the United States. Retrieved June 4, 2018, from http://www.pewinternet.org/2016/10/04/the-politics-of-climate/
Goffman, E. (1959). The Presentation of Self in Everyday Life. New York, New York, USA: Anchor Books. https://doi.org/10.2307/2089106
Golbeck, J., Robles, C., Edmondson, M., & Turner, K. (2011). Predicting personality from twitter. Proceedings - 2011 IEEE International Conference on Privacy, Security, Risk and Trust and IEEE International Conference on Social Computing, PASSAT/SocialCom 2011, 149–156. https://doi.org/10.1109/PASSAT/SocialCom.2011.33
Greenwald, A. G., McGhee, D. E., & Schwartz, J. L. K. (1998). Measuring individual differences in implicit cognition: The implicit association test. Journal of Personality and Social Psychology, 74(6), 1464–1480. https://doi.org/10.1037/0022-3514.74.6.1464
Guerreiro, J., Rita, P., & Trigueiros, D. (2016). A Text Mining-Based Review of Cause-Related Marketing Literature. Journal of Business Ethics, 139(1), 111–128. https://doi.org/10.1007/s10551-015-2622-4
Gupta, S., & Pirsch, J. (2006). The company-cause-customer fit decision in cause-related marketing. Journal of Consumer Marketing, 23(6), 314–326. https://doi.org/10.1108/07363760610701850
Han, J., & Kamber, M. (n.d.). Kullback-Leibler Divergence. In Data Mining: Concepts and Techniques. Retrieved from http://web.engr.illinois.edu/~hanj/cs412/bk3/KL-divergence.pdf
Hancock, L. (2016). Royal Caribbean Cruises Ltd. and World Wildlife Fund (WWF) announce global partnership to support ocean conservation. Retrieved March 10, 2017, from http://www.worldwildlife.org/press-releases/royal-caribbean-cruises-ltd-and-world-wildlife-fund-wwf-announce-global-partnership-to-support-ocean-conservation
Harwood, T. G., & Garry, T. (2003). An Overview of Content Analysis. The Marketing Review,

113
3(4), 479–498. https://doi.org/10.1362/146934703771910080 Heider, F. (1946). Attitudes and cognitive organization. The Journal of Psychology, 21(1), 107–
112. https://doi.org/10.1080/00223980.1946.9917275 Heider, F. (1958). The Psychology of Interpersonal Relations. Hillsdale: Lawrence Erlbaum
Associates, Inc. Henderson, G. R., Iacobucci, D., & Calder, B. J. (1998). Brand diagnostics: Mapping branding
effects using consumer associative networks. European Journal of Operational Research, 111(2), 306–327. https://doi.org/10.1016/S0377-2217(98)00151-9
Hogan, B. (2010). The Presentation of Self in the Age of Social Media: Distinguishing Performances and Exhibitions Online. Bulletin of Science, Technology & Society, 30(6), 377–386. https://doi.org/10.1177/0270467610385893
Hong, L., & Davison, B. (2010). Empirical study of topic modeling in twitter. Proceedings of the First Workshop on Social …, 80–88. https://doi.org/10.1145/1964858.1964870
Howe, L. C., & Krosnick, J. A. (2017). Attitude Strength. Annual Review of Psychology, 68(1), 327–351. https://doi.org/10.1146/annurev-psych-122414-033600
Humphreys, A., & Wang, R. J.-H. (2018). Automated Text Analysis for Consumer Research. Journal of Consumer Research.
Hutchinson, C. (2010). Fried Chicken for the Cure? Retrieved February 15, 2018, from http://abcnews.go.com/Health/Wellness/kfc-fights-breast-cancer-fried-chicken/story?id=10458830
In hot water. (2005). Retrieved February 17, 2018, from http://www.economist.com/node/4492835
Jackson, D. (2017). 10 Social Media Branding Strategies. Retrieved March 2, 2018, from https://sproutsocial.com/insights/social-media-branding/
Jarvis, B. G. (2016). MediaLab and DirectRT Psychology Software and DirectIN Response Hardware. Empirisoft. New York, New York, USA: Empirisoft Corporation. Retrieved from http://www.empirisoft.com/directrt.aspx
Jones, E., Oliphant, T., & Peterson, P. (2014). SciPy: open source scientific tools for Python. Joyce, J. M. (2011). Kullback-Leibler Divergence. International Encyclopedia of Statistical
Science, 720–722. https://doi.org/10.1007/978-3-642-04898-2_327 Kees, J., Berry, C., Burton, S., & Sheehan, K. (2017). An Analysis of Data Quality: Professional
Panels, Student Subject Pools, and Amazon’s Mechanical Turk. Journal of Advertising, 46(1), 141–155. https://doi.org/10.1080/00913367.2016.1269304
Kern, M. L., Eichstaedt, J. C., Schwartz, H. A., Dziurzynski, L., Ungar, L. H., Stillwell, D. J., … Seligman, M. E. P. (2014). The Online Social Self: An Open Vocabulary Approach to Personality. Assessment, 21(2), 158–169. https://doi.org/10.1177/1073191113514104
Kokkinaki, F., & Lunt, P. (1997). The relationship between involvement, attitude accessibility and attitude-behaviour consistency. British Journal of Social Psychology, 36(4), 497–509. https://doi.org/10.1111/j.2044-8309.1997.tb01146.x
Kotsiantis, S. B. (2007). Supervised Machine Learning: A Review of Classification Techniques. Informatica. https://doi.org/10.1115/1.1559160
Krippendorff, K. (2012). Content Analysis: An Introduction to Its Methodology. Language Arts & Disciplines, 79, 441. Retrieved from http://www.abebooks.com/book-search/isbn/0761915451/
Krosnick, J. A., Boninger, D. S., Chuang, Y. C., Berent, M. K., & Carnot, C. G. (1993). Attitude Strength - One Construct or Many. Journal of Personality and Social Psychology, 65(6),
114
1132–1151. Krosnick, J. A., Charles, M. J., & Wittenbrink, B. (2005). The measurement of attitudes. The
Handbook of Attitudes, 21–76. https://doi.org/10.4324/9781410612823.ch2 Kulakowski, K., Gawronski, P., & Gronek, P. (2005). The Heider balance: A continuous
approach. International Journal Of Modern Physics C, 16(5), 707–716. https://doi.org/10.1142/S012918310500742X
Lafferty, B. A., Goldsmith, R. E., & Hult, G. T. M. (2004). The impact of the alliance on the partners: A look at cause-brand alliances. Psychology and Marketing, 21(7), 509–531. https://doi.org/10.1002/mar.20017
Lakens, D., & Evers, E. R. K. (2014). Sailing From the Seas of Chaos Into the Corridor of Stability: Practical Recommendations to Increase the Informational Value of Studies. Perspectives on Psychological Science, 9(3), 278–292. https://doi.org/10.1177/1745691614528520
Lerner, K. (2018). The NRA is being supported by these companies. Retrieved February 24, 2018, from https://thinkprogress.org/corporations-nra-f0d8074f2ca7/
Leskovec, J., Huttenlocher, D., & Kleinberg, J. (2010a). Predicting Positive and Negative Links. International World Wide Web Conference, 641–650. https://doi.org/10.1145/1772690.1772756
Leskovec, J., Huttenlocher, D., & Kleinberg, J. (2010b). Signed networks in social media. Conference on Human Factors in Computing Systems, 1361–1370. Retrieved from http://portal.acm.org/citation.cfm?id=1753326.1753532
Likert, R. (1932). A technique for the measurement of attitudes. Archives of Psychology. https://doi.org/2731047
Loper, E., & Bird, S. (2002). NLTK: The Natural Language Toolkit. https://doi.org/10.3115/1118108.1118117
Lord, C. G., Ross, L., & Lepper, M. R. (1979). Biased assimilation and attitude polarization: The effects of prior theories on subsequently considered evidence. Journal of Personality and Social Psychology. https://doi.org/10.1037/0022-3514.37.11.2098
Markovikj, D., Gievska, S., Kosinski, M., & Stillwell, D. (2013). Mining Facebook data for predictive personality modeling. Proceedings of the 7th International AAAI Conference on Weblogs and Social Media (ICWSM 2013), Boston, MA, USA, 23–26.
Marshall, T. C., Lefringhausen, K., & Ferenczi, N. (2015). The Big Five, self-esteem, and narcissism as predictors of the topics people write about in Facebook status updates. Personality and Individual Differences, 85, 35–40. https://doi.org/10.1016/j.paid.2015.04.039
Marvel, S. A., Kleinberg, J., Kleinberg, R. D., & Strogatz, S. H. (2011). Continuous-time model of structural balance. Proceedings of the National Academy of Sciences of the United States of America, 108(5), 1771–1776. https://doi.org/10.1073/pnas.1013213108
Marwick, A. E., & Boyd, D. (2011). I tweet honestly, I tweet passionately: Twitter users, context collapse, and the imagined audience. New Media & Society, 13(1), 114–133. https://doi.org/10.1177/1461444810365313
Mason, W., & Suri, S. (2012). Conducting behavioral research on Amazon’s Mechanical Turk. Behavior Research Methods, 44(1), 1–23. https://doi.org/10.3758/s13428-011-0124-6
McGraw, K. O., & Wong, S. P. (1996). Forming Inferences about Some Intraclass Correlation Coefficients. Psychological Methods, 1(1), 30–46. https://doi.org/10.1037/1082-989X.1.1.30

115
McPherson, M., Smith-Lovin, L., & Cook, J. M. (2001). Birds of a Feather: Homophily in Social Networks. Annual Review of Sociology, 27(January), 415–44. https://doi.org/10.3410/f.725356294.793504070
Mehrotra, R., Sanner, S., Buntine, W., & Xie, L. (2013). Improving LDA topic models for microblogs via tweet pooling and automatic labeling. In Proceedings of the 36th international ACM SIGIR conference on Research and development in information retrieval - SIGIR ’13 (p. 889). https://doi.org/10.1145/2484028.2484166
Moodie, A. (2016). How environmentally friendly is your cruise holiday? | Guardian Sustainable Business | The Guardian. Retrieved March 15, 2017, from https://www.theguardian.com/sustainable-business/2016/jun/12/cruise-ships-environment-ocean-liners-emissions-waste
Myers, B., & Kwon, W.-S. (2013). A model of antecedents of consumers’ post brand attitude upon exposure to a cause– brand alliance. International Journal of Nonprofit and Voluntary Sector Marketing, 18(2), 73–89. https://doi.org/10.1002/nvsm
Nisbett, R. E., & Wilson, T. D. (1977). Telling more than we can know: Verbal reports on mental processes. Psychological Review, 84(3), 231–259. https://doi.org/10.1037/0033-295X.84.3.231
Osgood, C. E., & Tannenbaum, P. H. (1955). The principle of congruity in the prediction of attitude change. Psychological Review, 62(1), 42–55. https://doi.org/10.1037/h0048153
Park, G., Schwartz, H. A., Eichsteadt, J. C., Kern, M. L., Kosinski, M., Stillwell, D. J., … Seligman, M. E. P. (2015). Automatic personality assessment through social media language. Journal of Personality and Social Psychology, 108(6), 1–25. https://doi.org/10.1037/pspp0000020
Parker, K. (2017). America’s Complex Relationships With Guns. Retrieved June 4, 2018, from http://www.pewsocialtrends.org/2017/06/22/americas-complex-relationship-with-guns/
Pedregosa, F., Varoquaux, G., Gramfort, A., Michel, V., Thirion, B., Grisel, O., … Duchesnay, É. (2012). Scikit-learn: Machine Learning in Python. Journal of Machine Learning Research, 12, 2825–2830. https://doi.org/10.1007/s13398-014-0173-7.2
Pennebaker, J. W., Boyd, R. L., Jordan, K., & Blackburn, K. (2015). The development and psychometric properties of LIWC2015. UT Faculty/Researcher Works, (SEPTEMBER 2015), 1–22. https://doi.org/10.15781/T29G6Z
Petty, R. E., & Krosnick, J. A. (1995). Attitude strength : antecedents and consequences. Mahwah: Erlbaum.
Picchi, A. (2015). 5 most loved and most hated fast-food restaurants. Retrieved February 15, 2018, from https://www.cbsnews.com/media/5-most-loved-and-hated-fast-food-restaurants/7/
Popken, B. (2018). More companies cut ties with the NRA after customer backlash. Retrieved February 24, 2018, from https://www.nbcnews.com/business/consumer/companies-cut-ties-nra-after-customer-backlash-n850686
Pracejus, J. W., & Olsen, G. D. (2004). The role of brand/cause fit in the effectiveness of cause-related marketing campaigns. Journal of Business Research, 57(6), 635–640. https://doi.org/10.1016/S0148-2963(02)00306-5
Quercia, D., Askham, H., & Crowcroft, J. (2012). TweetLDA: Supervised Topic Classification and Link Prediction in Twitter. Proceedings of the 3rd Annual ACM Web Science Conference on - WebSci ’12, 247–250. https://doi.org/10.1145/2380718.2380750
Ranganath, S., Morstatter, F., Hu, X., Tang, J., & Liu, H. (2015). Predicting Online Protest
116
Participation of Social Media Users. CoRR, arXiv:1512(March), 1–8. Rizzo, G., van Erp, M., & Troncy, R. (2014). Benchmarking the Extraction and Disambiguation
of Named Entities on the Semantic Web. In LREC 2014, Ninth International Conference on Language Resources and Evaluation (pp. 4593–4600). Retrieved from http://www.lrec-conf.org/proceedings/lrec2014/pdf/176_Paper.pdf
Rosenstiel, T., Sonderman, J., Loker, K., Ivancin, M., & Kjarval, N. (2015). How people use Twitter in general. Retrieved January 9, 2018, from https://www.americanpressinstitute.org/publications/reports/survey-research/how-people-use-twitter-in-general/
Ross, J., Zaldivar, A., Irani, L., & Tomlinson, B. (2010). Who are the Turkers? Worker Demographics in Amazon Mechanical Turk. Chi Ea 2010, (July 2016), 2863–2872. https://doi.org/10.1145/1753846.1753873
Ross, S. D., James, J. D., & Vargas, P. T. (2006). Development of a Scale to Measure Team Brand Associations in Professional Sport. Journal of Sport Management, 20, 260–279.
Saldaña, J. (2009). The Coding Manual for Qualitative Researchers. (J. Saldaña, Ed.) (1st ed.). London: Sage Publications. https://doi.org/10.1017/CBO9781107415324.004
Schwartz, H. A., Eichstaedt, J. C., Kern, M. L., Dziurzynski, L., Ramones, S. M., Agrawal, M., … Ungar, L. H. (2013). Personality, Gender, and Age in the Language of Social Media: The Open-Vocabulary Approach. PLoS ONE, 8(9). https://doi.org/10.1371/journal.pone.0073791
Schwarz, N. (1999). Self-reports: How the questions shape the answers. American Psychologist, 54(2), 93–105. https://doi.org/10.1037/0003-066X.54.2.93
Shapiro, S., MacInnis, D. J., & Park, C. W. (2002). Understanding Program-Induced Mood Effects: Decoupling Arousal from Valence. Journal of Advertising, 31(4), 15–26. https://doi.org/10.1080/00913367.2002.10673682
Simmons, C. J., & Becker-Olsen, K. L. (2006). Achieving Marketing Objectives Through Social Sponsorships. Journal of Marketing, 70(4), 154–169. https://doi.org/10.1509/jmkg.70.4.154
Simonin, B. L., & Ruth, J. A. (1998). Is a Company Known by the Company It Keeps? Assessing the Spillover Effects of Brand Alliances on Consumer Brand Attitudes. Journal of Marketing Research, 35(1), 30–42. https://doi.org/10.2307/3151928
Skalski, P. D., Neuendorf, K. A., & Cajigas, J. A. (2017). Content Analysis in the Interactive Media Age. In K. A. Neuendorf (Ed.), The Content Analysis Guidebook (2nd ed., pp. 201–242). Thousand Oaks: Sage Publications. Retrieved from http://academic.csuohio.edu/kneuendorf/SkalskiVitae/SkalskiNeuendorfCajigas17.pdf
Smith, A., & Anderson, M. (2018). Social Media Use in 2018. Pew Research Center. Retrieved from http://www.pewinternet.org/2018/03/01/social-media-use-in-2018/
Smith, A. N., Fischer, E., & Yongjian, C. (2012). How Does Brand-related User-generated Content Differ across YouTube, Facebook, and Twitter? Journal of Interactive Marketing, 26(2), 102–113. https://doi.org/10.1016/j.intmar.2012.01.002
Tandoc, E. C., Ferrucci, P., & Duffy, M. (2015). Facebook use, envy, and depression among college students: Is facebooking depressing? Computers in Human Behavior, 43, 139–146. https://doi.org/10.1016/j.chb.2014.10.053
Taylor, K. (2018). Best Western, Wyndham cut ties with NRA after gun control boycotts - Business Insider. Retrieved March 17, 2018, from http://www.businessinsider.com/best-western-wyndham-cut-ties-with-nra-after-gun-control-boycotts-2018-2
TextRazor - The Natural Language Processing API. (n.d.). Retrieved March 3, 2018, from

117
https://www.textrazor.com/topic_tagging Thomson Reuters | Open Calais. (n.d.). Retrieved March 10, 2017, from
http://www.opencalais.com/ Trimble, C. S., & Rifon, N. J. (2006). Consumer perceptions of compatibility in cause-related
marketing messages. International Journal of Nonprofit and Voluntary Sector Marketing, 11(1), 29–47. https://doi.org/10.1002/nvsm.42
van der Walt, S., Schönberger, J. L., Nunez-Iglesias, J., Boulogne, F., Warner, J. D., Yager, N., … Yu, T. (2014). scikit-image: image processing in Python. PeerJ, 2, e453. https://doi.org/10.7717/peerj.453
Varadarajan, P. R., & Menon, A. (1988). Cause-related marketing: A coalignment of marketing strategy and corporate philanthropy. Journal of Marketing, 52(3), 58–74. https://doi.org/10.2307/1251450
Viera, A. J., & Garrett, J. M. (2005). Understanding Interobserver Agreement: The Kappa Statistic. Family Medicine, (May), 360–363. https://doi.org/Vol. 37, No. 5
Vijay, D. (2017). How Cause-Related Social Marketing Drives Results for CPG Brands – Adweek. Retrieved February 14, 2018, from http://www.adweek.com/digital/darsana-vijay-unmetric-guest-post-cause-related-social-marketing-cpg-brands/
Webb, D. J., & Mohr, L. a. (1998). A Typology of Consumer Responses to Cause-Related Marketing: From Skeptics to Socially Concerned. Journal of Public Policy & Marketing, 17(2), 226–238. https://doi.org/10.2307/30000773
Weissman, S. (2014). Tweetenfreude: The psychology of the hate-follow. Retrieved June 1, 2018, from https://digiday.com/marketing/twisted-art-hate-follow/
Welsh, J. C. (1999). Good Cause, Good Business. Retrieved February 14, 2018, from https://hbr.org/1999/09/good-cause-good-business
Weng, L., & Lento, T. (2014). Topic-Based Clusters in Egocentric Networks on Facebook. Icwsm, 623–626.
Woodside, A. G., & Chebat, J. C. (2001). Updating Heider’s balance theory in consumer behavior: A Jewish couple buys a German car and additional buying-consuming transformation stories. Psychology and Marketing, 18(5), 475–495. https://doi.org/10.1002/mar.1017
Young, S. J. (2017). Harvey Update: Royal Caribbean, Carnival Cancel Cruises | Travel Agent Central. Retrieved April 14, 2018, from https://www.travelagentcentral.com/cruises/royal-caribbean-and-carnival-cancel-two-voyages-two-others-shortened-port-galveston-closed
Youyou, W., Kosinski, M., & Stillwell, D. (2015). Computer-based personality judgments are more accurate than those made by humans. Proceedings of the National Academy of Sciences, 112(4), 1036–1040. https://doi.org/10.1073/pnas.1418680112
Youyou, W., Schwartz, H. A., Stillwell, D., & Kosinski, M. (2017). Birds of a Feather Do Flock Together : Method Reveals Personality Similarity Among Couples and Friends. Psychological Science, 1–9. https://doi.org/10.1177/0956797616678187
Yun, J. T., & Duff, B. R. L. (2017). Consumers as Data Profiles: What Companies See in the Social You. In K. S. Burns (Ed.), Social Media: A Reference Handbook (1st ed., pp. 155–161). Denver, Colorado: ABC-CLIO, LLC.
Zaichkowsky, J. L. (1994). Research notes: The personal involvement inventory: Reduction, revision, and application to advertising. Journal of Advertising, 23(4), 59–70. https://doi.org/10.1080/00913367.1943.10673459
Zhang, K., Bhattacharyya, S., & Ram, S. (2016). Large-scale network analysis for online social
118
brand advertising. MIS Quarterly, 40(4), 849–868. Zillmann, D. (2007). Excitation transfer theory. The International Encyclopedia of
Communication.

119
APPENDIX A: SURVEY INSTRUMENT – RC AND WWF EXAMPLE
These questions pertain to Royal Caribbean International. Royal Caribbean International is a for-profit cruise line brand. How would you rate your attitude towards Royal Caribbean International? -5 (Extremely negative) -4 -3 -2 -1 0 (Neither negative nor positive) 1 2 3 4 5 (Extremely positive) How strong is your attitude toward Royal Caribbean International? 1 (Not strong at all) 2 3 4 5 6 7 8 9 10 11 (Extremely strong) -- page break -- These questions pertain to the World Wildlife Fund for Nature. The World Wildlife Fund for Nature (WWF) is a non-profit organization focused on nature conservation. How would you rate your attitude towards the World Wildlife Fund for Nature? -5 (Extremely negative) -4 -3 -2 -1 0 (Neither negative nor positive) 1 2 3 4 5 (Extremely positive) How strong is your attitude toward World Wildlife Fund for Nature? 1 (Not strong at all) 2 3 4 5 6 7 8 9 10 11(Extremely strong) -- page break – In 2016, Royal Caribbean International and the World Wildlife Fund for Nature (WWF) announced a global partnership to support ocean conservation. How compatible do you think this partnership is between Royal Caribbean and the World Wildlife Fund for Nature? -5 (Not compatible at all) -4 -3 -2 -1 0 (Neither compatible nor incompatible) 1 2 3 4 5 (Extremely compatible) -- End of Survey –
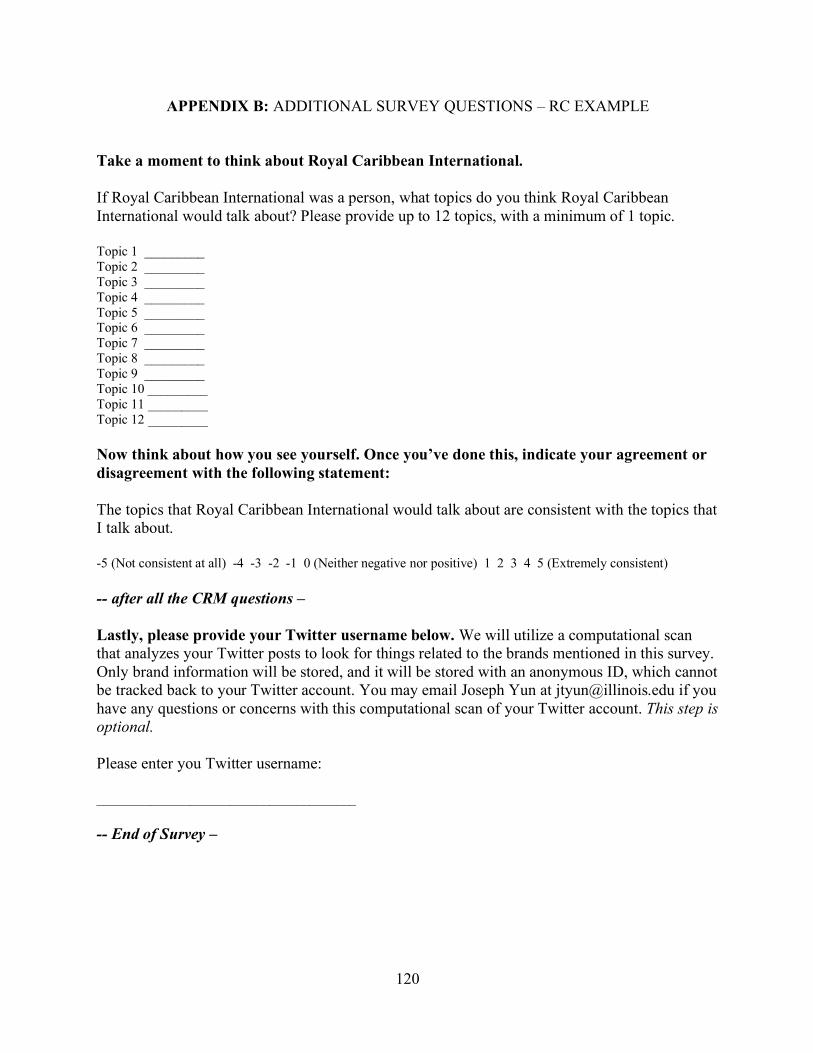
120
APPENDIX B: ADDITIONAL SURVEY QUESTIONS – RC EXAMPLE
Take a moment to think about Royal Caribbean International. If Royal Caribbean International was a person, what topics do you think Royal Caribbean International would talk about? Please provide up to 12 topics, with a minimum of 1 topic. Topic 1 _________ Topic 2 _________ Topic 3 _________ Topic 4 _________ Topic 5 _________ Topic 6 _________ Topic 7 _________ Topic 8 _________ Topic 9 _________ Topic 10 _________ Topic 11 _________ Topic 12 _________ Now think about how you see yourself. Once you’ve done this, indicate your agreement or disagreement with the following statement: The topics that Royal Caribbean International would talk about are consistent with the topics that I talk about. -5 (Not consistent at all) -4 -3 -2 -1 0 (Neither negative nor positive) 1 2 3 4 5 (Extremely consistent) -- after all the CRM questions – Lastly, please provide your Twitter username below. We will utilize a computational scan that analyzes your Twitter posts to look for things related to the brands mentioned in this survey. Only brand information will be stored, and it will be stored with an anonymous ID, which cannot be tracked back to your Twitter account. You may email Joseph Yun at [email protected] if you have any questions or concerns with this computational scan of your Twitter account. This step is optional. Please enter you Twitter username: _______________________________________ -- End of Survey –
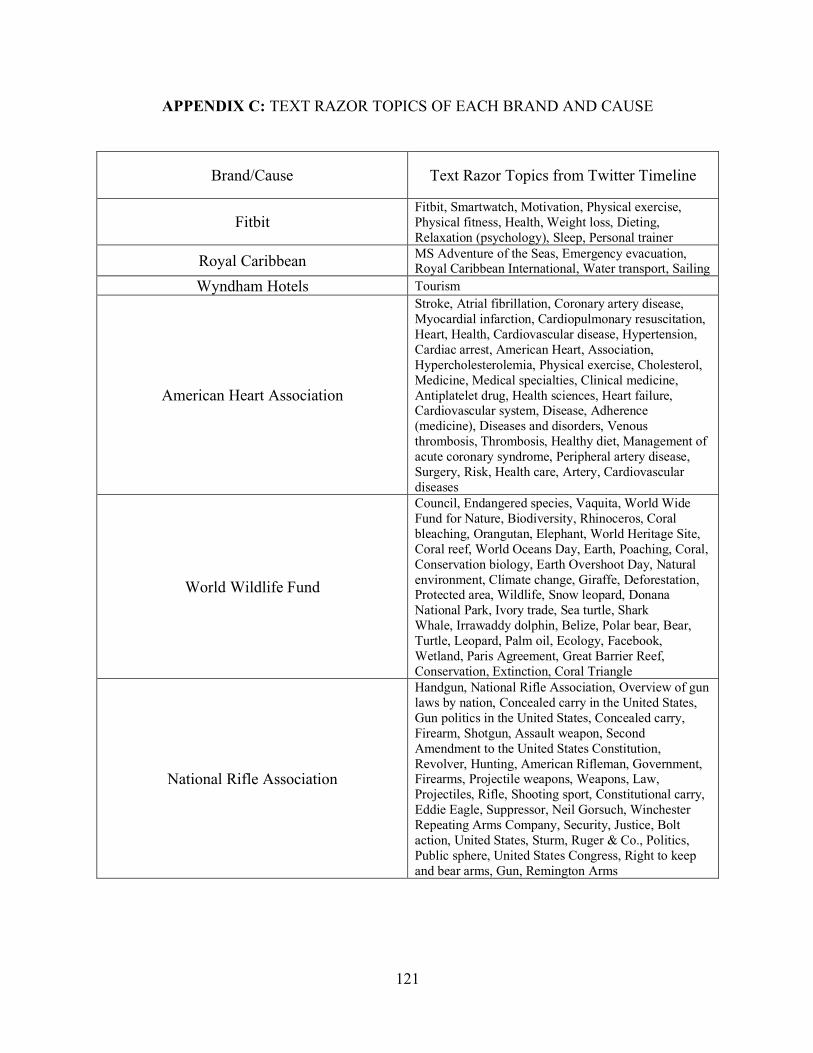
121
APPENDIX C: TEXT RAZOR TOPICS OF EACH BRAND AND CAUSE
Brand/Cause Text Razor Topics from Twitter Timeline
Fitbit Fitbit, Smartwatch, Motivation, Physical exercise, Physical fitness, Health, Weight loss, Dieting, Relaxation (psychology), Sleep, Personal trainer
Royal Caribbean MS Adventure of the Seas, Emergency evacuation, Royal Caribbean International, Water transport, Sailing
Wyndham Hotels Tourism
American Heart Association
Stroke, Atrial fibrillation, Coronary artery disease, Myocardial infarction, Cardiopulmonary resuscitation, Heart, Health, Cardiovascular disease, Hypertension, Cardiac arrest, American Heart, Association, Hypercholesterolemia, Physical exercise, Cholesterol, Medicine, Medical specialties, Clinical medicine, Antiplatelet drug, Health sciences, Heart failure, Cardiovascular system, Disease, Adherence (medicine), Diseases and disorders, Venous thrombosis, Thrombosis, Healthy diet, Management of acute coronary syndrome, Peripheral artery disease, Surgery, Risk, Health care, Artery, Cardiovascular diseases
World Wildlife Fund
Council, Endangered species, Vaquita, World Wide Fund for Nature, Biodiversity, Rhinoceros, Coral bleaching, Orangutan, Elephant, World Heritage Site, Coral reef, World Oceans Day, Earth, Poaching, Coral, Conservation biology, Earth Overshoot Day, Natural environment, Climate change, Giraffe, Deforestation, Protected area, Wildlife, Snow leopard, Donana National Park, Ivory trade, Sea turtle, Shark Whale, Irrawaddy dolphin, Belize, Polar bear, Bear, Turtle, Leopard, Palm oil, Ecology, Facebook, Wetland, Paris Agreement, Great Barrier Reef, Conservation, Extinction, Coral Triangle
National Rifle Association
Handgun, National Rifle Association, Overview of gun laws by nation, Concealed carry in the United States, Gun politics in the United States, Concealed carry, Firearm, Shotgun, Assault weapon, Second Amendment to the United States Constitution, Revolver, Hunting, American Rifleman, Government, Firearms, Projectile weapons, Weapons, Law, Projectiles, Rifle, Shooting sport, Constitutional carry, Eddie Eagle, Suppressor, Neil Gorsuch, Winchester Repeating Arms Company, Security, Justice, Bolt action, United States, Sturm, Ruger & Co., Politics, Public sphere, United States Congress, Right to keep and bear arms, Gun, Remington Arms

122
APPENDIX D: IRB LETTER