analyzing roadside safety implications of future vehicle
TRANSCRIPT

1 Copyright © 2014 by ASME
ANALYZING ROADSIDE SAFETY IMPLICATIONS OF FUTURE VEHICLE DESIGNS
Tejas Ruparel National Crash Analysis Center George Washington University
Washington, DC, USA [email protected]
Karma Yonten National Crash Analysis Center George Washington University
Washington, DC, USA [email protected]
Azim Eskandarian National Crash Analysis Center George Washington University
Washington, DC, USA [email protected]
ABSTRACT To meet new Corporate Average Fuel Economy (CAFE)
standards, future vehicles are expected to be more
environmentally friendly and fuel efficient. In addition to
introducing innovative manufacturing methods and structural
modifications, automobile manufacturers are primarily adopting
lightweighting technologies to meet the demands for more fuel
efficient vehicles. It is seen from prior research that by focusing
on lightweight (LW) designs alone, the average new vehicle
could weigh 28% less in 2016 than it does today. Using LW
designs is not without its challenges though. These designs
represent significantly different dynamic characteristics and
crashworthiness response when compared against original
designs. Accordingly, it is necessary to evaluate the safety
implications of these LW vehicles under impact scenarios with
various roadside infrastructures. It is also necessary to ensure
that the existing infrastructure can satisfy required safety
standards in protecting the occupants under different crash
conditions.
In this paper, we adopt Finite Element Method (FEM) for
modeling and simulating different crash scenarios in order to
evaluate the safety implications of future LW vehicle designs.
Baseline (BL) models for three vehicles – Toyota Yaris, Ford
Taurus and Chevy Silverado are appropriately LW modeled
with 15% (LW15) and 25% (LW25) reduction in weight, whilst
maintaining structural stiffness and Center of Gravity.
Numerical simulations are then performed for a 25° impact
angle against three common roadside infrastructures – Concrete
median barrier, Strong post W-beam guardrail and W-beam
transition barrier at three different speeds – 50, 70 and 100
km/hr. The goal is to conduct a matrix of simulations in order to
provide comprehensive and relative safety assessment. Barrier
performance is then gauged in accordance to the MASH
(Manual for Assessing Safety Hardware) [1] criteria wherein the
metrics take into account evaluation factors such as structural
adequacy and occupant risk.
INTRODUCTION For several years, government agencies, automotive
industries and researchers have collectively undertaken a
variety of efforts to increase roadside safety. One of such tasks
is the crash testing of roadside hardware and infrastructure in
order to assess its safety performance when impacted by errant
vehicles. In the early 20th
century, state highway agencies
designed and tested their hardware under the procedures and
criteria’s they developed. Although this approach helped
identify effective roadside hardware, the methods and criteria’s
used distinctly varied from state to state and hence lacked
information sharing for consistent performance assessment. The
first de facto national standard for crash testing was published
in the Highway Research Correlation Service Circular 482 in
the year 1962. It accounted for and classified most common
cars and accordingly set standards for impact speeds, angle of
approach and evaluation criteria’s. Ever since, the protocols on
how to perform crash tests have evolved from National
Cooperative Highway Research Program (NCHRP) Report 153
in 1974 to NCHRP Report 230 in 1980 and eventually to
NCHRP Report 350 in 1993 [2], which was formally adopted
by Federal Highway Administration (FHWA) and established in
1998 for new hardware installation on the National Highway
System (NHS). An updated version of evaluation procedures
and implementation plans was published by the American
Association of State Highway and Transportation Officials
(AASHTO) in the year 2009, called MASH [1]. Primary focus
of modifications in this manual included:
Updated test vehicles and impact condition
Elimination of ambiguities and inconsistencies
Consolidation of test matrices and
Rigorous reporting procedures.
Over the past couple of decades, FHWA has acknowledged
and motivated the use of Finite Element (FE) based crash
simulations for safety assessment and innovative design
Proceedings of the ASME 2014 International Mechanical Engineering Congress and Exposition IMECE2014
November 14-20, 2014, Montreal, Quebec, Canada
IMECE2014-38167

2 Copyright © 2014 by ASME
developments. This provides a means for developers of safety
features to assess impact performance without actual crash
testing. The National Crash Analysis Center (NCAC) at George
Washington University in Washington DC has been a pioneer
institute in development and validation of such FE models
(vehicles, roadside hardware and infrastructure) that are widely
used for computer simulations and crash data analysis by
researchers across the globe. The FHWA and National Highway
Traffic Safety Administration (NHTSA), through NCAC, have
put together a comprehensive archive of FE models that have
great potential to significantly improve the criteria’s and tools
used to design highways and various roadside elements
associated with them. References [3], [4], [5] and [6] are among
several other relevant research reports that successfully use
FEM in conjugation with LS-DYNA to simulate roadside crash
scenarios and hence assess roadside safety implications.
With recent developments in CAFE standards dictating the
need for environment friendly and fuel efficient cars,
automobile manufactures have focused their technologies on
lightweighting their vehicle designs. LW designs are definitely
among the most eligible candidates for future vehicles;
accordingly the significance of their interaction, under impact
conditions, with existing roadside hardware needs to be
evaluated for safety performance. References [7] and [8],
explored and analyzed various modeling techniques used to
evaluate impact response of composite materials in automotive
structures and investigated the opportunities in vehicle weight
reduction in order to evaluate their impact on crashworthiness.
Complimentary to this research, we present a comprehensive
evaluation of safety performance of LW vehicle models under
interaction with existing roadside hardware, in accordance with
the MASH criteria.
MODEL DESCRIPTIONS Primary objectives under this research included the
development of detailed FE models for test vehicles, baseline as
well as lightweight models (BL and LW), and the most common
roadside safety hardware – longitudinal barriers (test articles) in
order to perform computer based crash simulations and
subsequently evaluate their impact performance, hence
providing a detailed analysis of roadside safety assessment for
future vehicle designs under MASH guidelines.
Vehicle Models Three vehicle models with AASHTO designation 1100C,
1500A and 2270P, Table 1, were selected as representative test
vehicles under this research. From the available archive of FE
models at NCAC – 2010 Toyota Yaris (small car), 2001 Ford
Taurus (midsize sedan) and 2007 Chevy Silverado (pickup
truck), were identified as belonging to the selected classification
of AASHTO designations and accordingly utilized in this study.
A comprehensive description on development and validation of
these FE models can be found under references – [9], [10], [11],
[12], [13] and [14].
Table 1. Vehicle designation and gross static mass
Test Vehicle Designation and Type
Target vehicle weight, lb (kg)
Acceptable variation, lb (kg)
1100C (Passenger Car) 2420 (1100) ± 55 (25)
1500A (Passenger Car) 3300 (1500) ± 220 (110)
2270P (Pickup Truck) 5000 (2270) ± 110 (50)
Table 2. Selected test vehicle and their corresponding LW variants
(a) 2010 Toyota Yaris AASHTO Designation – 1100C
BL LW15 LW25
1100 kg (2420 lbs.)
935 kg (2061 lbs.)
825 kg (1819 lbs.)
(b) 2001 Ford Taurus AASHTO Designation – 1500A
BL LW15 LW25
1500 kg (3307 lbs.)
1275 kg (2811 lbs.)
1125 kg (2480 lbs.)
(c) 2007 Chevy Silverado AASHTO Designation – 2270P
BL LW15 LW25
2270 kg (5000 lbs.)
1930 kg (4255 lbs.)
1703 kg (3755 lbs.)
Selected FE models (BL version) were developed using
reverse engineering and were thoroughly verified using New
Car Assessment Program (NCAP) frontal impact tests. These
models were also successfully validated against side impact
tests; IIHS (Insurance Institute for Highway Safety) offset
deformable barrier tests and centerline pole tests, assuring their
robustness across various impact scenarios. Since the primary
focus of this research is to evaluate barrier performance under
interaction with LW design vehicles, selected BL models were
appropriately scaled in density to generate two LW variants
with 15% (LW15) and 25% (LW25) reduction in weight, Table
2. Relevant FE model info and density scaling parameters for
the LW variants are listed in Table 3.
Table 3. Test vehicle FE model info and LW parameters
Toyota Yaris
1100C Ford Taurus
1500A Chevy Silverado
2270P
Nodes 393,255 921,945 262,061
Elements 378,422 973,370 251,425
Parts 921 803 603
LW parts 729 609 491
Density Scaling LW15 0.75 % 0.79 % 0.75 %
LW25 0.567 % 0.65 % 0.567 %
3 Copyright © 2014 by ASME
Rigorous LW modeling techniques such as plastic and
composite intensive material modeling were not exercised under
this research since the goal was to assess barrier performance
and not vehicle crashworthiness. Also, new material modeling
would implicitly require extended validation and verification of
modified FE models. Accordingly, BL models were only scaled
in density whilst maintaining structural stiffness and Center of
Gravity (CG) location. This enabled generating theoretical LW
variants for existing BL models; which in turn would represent
future vehicle designs. Another reason for maintaining BL
material models, structural stiffness and CG locations, was to
have minimum distinct variables within analyzed cases so that
LW models can be relatively compared against BL models, with
gross static mass being the only distinct variable.
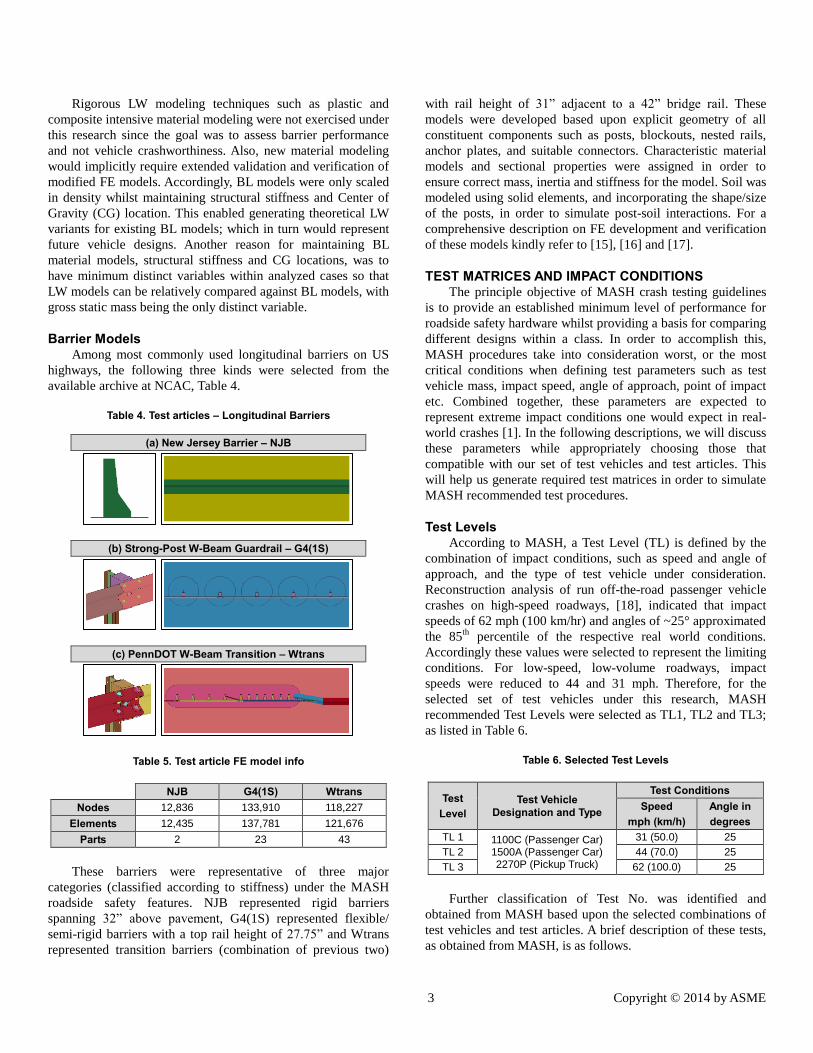
Barrier Models Among most commonly used longitudinal barriers on US
highways, the following three kinds were selected from the
available archive at NCAC, Table 4.
Table 4. Test articles – Longitudinal Barriers
(a) New Jersey Barrier – NJB
(b) Strong-Post W-Beam Guardrail – G4(1S)
(c) PennDOT W-Beam Transition – Wtrans
Table 5. Test article FE model info
NJB G4(1S) Wtrans Nodes 12,836 133,910 118,227
Elements 12,435 137,781 121,676
Parts 2 23 43
These barriers were representative of three major
categories (classified according to stiffness) under the MASH
roadside safety features. NJB represented rigid barriers
spanning 32” above pavement, G4(1S) represented flexible/
semi-rigid barriers with a top rail height of 27.75” and Wtrans
represented transition barriers (combination of previous two)
with rail height of 31” adjacent to a 42” bridge rail. These
models were developed based upon explicit geometry of all
constituent components such as posts, blockouts, nested rails,
anchor plates, and suitable connectors. Characteristic material
models and sectional properties were assigned in order to
ensure correct mass, inertia and stiffness for the model. Soil was
modeled using solid elements, and incorporating the shape/size
of the posts, in order to simulate post-soil interactions. For a
comprehensive description on FE development and verification
of these models kindly refer to [15], [16] and [17].
TEST MATRICES AND IMPACT CONDITIONS The principle objective of MASH crash testing guidelines
is to provide an established minimum level of performance for
roadside safety hardware whilst providing a basis for comparing
different designs within a class. In order to accomplish this,
MASH procedures take into consideration worst, or the most
critical conditions when defining test parameters such as test
vehicle mass, impact speed, angle of approach, point of impact
etc. Combined together, these parameters are expected to
represent extreme impact conditions one would expect in real-
world crashes [1]. In the following descriptions, we will discuss
these parameters while appropriately choosing those that
compatible with our set of test vehicles and test articles. This
will help us generate required test matrices in order to simulate
MASH recommended test procedures.
Test Levels According to MASH, a Test Level (TL) is defined by the
combination of impact conditions, such as speed and angle of
approach, and the type of test vehicle under consideration.
Reconstruction analysis of run off-the-road passenger vehicle
crashes on high-speed roadways, [18], indicated that impact
speeds of 62 mph (100 km/hr) and angles of ~25° approximated
the 85th
percentile of the respective real world conditions.
Accordingly these values were selected to represent the limiting
conditions. For low-speed, low-volume roadways, impact
speeds were reduced to 44 and 31 mph. Therefore, for the
selected set of test vehicles under this research, MASH
recommended Test Levels were selected as TL1, TL2 and TL3;
as listed in Table 6.
Table 6. Selected Test Levels
Test Level
Test Vehicle Designation and Type
Test Conditions Speed
mph (km/h) Angle in degrees
TL 1 1100C (Passenger Car) 1500A (Passenger Car) 2270P (Pickup Truck)
31 (50.0) 25
TL 2 44 (70.0) 25
TL 3 62 (100.0) 25
Further classification of Test No. was identified and
obtained from MASH based upon the selected combinations of
test vehicles and test articles. A brief description of these tests,
as obtained from MASH, is as follows.
4 Copyright © 2014 by ASME
Table 7. Test Matrices
Test Level
Test Article Test No. *
Test Vehicle
Test Vehicle Variants
Impact Speed mph (km/h)
Impact Angle θ, degrees
Impact Point, c
Evaluation Criteria, b
TL 1 NJB / G4(1S) /
Wtrans
1-10 1-11 1-20
d
1-21
1100C 1500A 2270P
BL LW15 LW25
31 (50.0) 25 CIP A,D,F,H,I
TL 2 NJB / G4(1S) /
Wtrans
2-10 2-11 2-20
d
2-21
1100C 1500A 2270P
BL LW15 LW25
44 (70.0) 25 CIP A,D,F,H,I
TL 3 NJB / G4(1S) /
Wtrans
3-10 3-11 3-20
d
3-21
1100C 1500A 2270P
BL LW15 LW25
62 (100.0) 25 CIP A,D,F,H,I
b – See Table 8, c - See Figure 1, d - Test is Optional
* Test No. -10, -20 refer to passenger cars whereas -11 and -21 refer to pickup trucks
Test 10 is designed to investigate a barrier’s ability to
successfully contain and redirect small passenger vehicles
impacting within the length-of-need. For small cars, the primary
concerns are the potential for vehicle under-ride, wheel snag,
rollover, and head-slap. In order to evaluate full range of barrier
impact performance, testing should be conducted with the
barrier at the maximum allowable height for small car tests.
This is especially true for post-and-beam barrier systems to
maximize the risk of under-ride and wheel snag.
Tests 11 and 21 provide maximum strength tests for Test
Levels 1 through 3 and verify a barriers performance for
impacts involving light trucks and SUVs. Due to the high
rollover frequencies observed in crash data historical full-scale
crash testing with light truck vehicles, Tests 11 and 12 are
required for all barrier systems. These tests are also required to
meet all occupant risk measures, including both lateral and
longitudinal occupant impact velocity (OIV) and occupant
ridedown acceleration (ORA) values.
Test 20 for a transition section is an optional test to
evaluate the occupant risk and post-impact trajectory for all Test
Levels. It should be conducted if there is reasonable uncertainty
regarding the impact performance of the system for impacts
with small passenger vehicles.
Accordingly, Test Levels from Table 6 were augmented
with recommended Test No. and are reflected in final test
matrices along with corresponding evaluation criteria’s for
longitudinal barriers, Table 7.
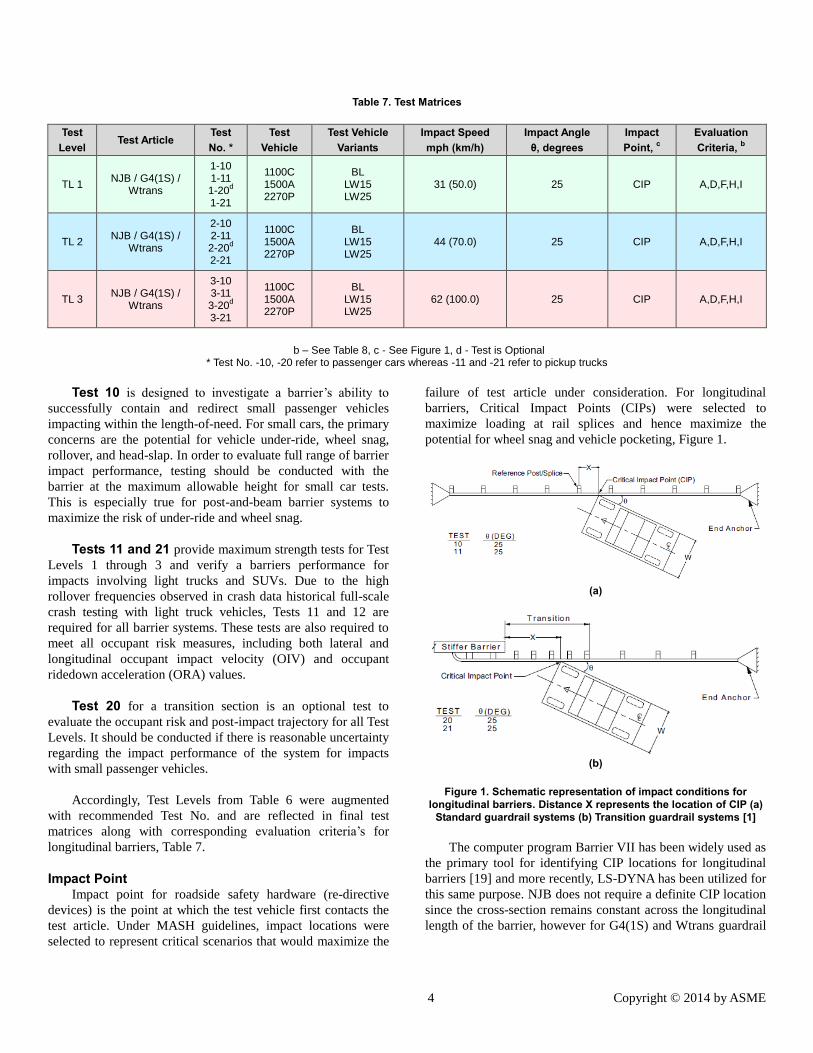
Impact Point Impact point for roadside safety hardware (re-directive
devices) is the point at which the test vehicle first contacts the
test article. Under MASH guidelines, impact locations were
selected to represent critical scenarios that would maximize the
failure of test article under consideration. For longitudinal
barriers, Critical Impact Points (CIPs) were selected to
maximize loading at rail splices and hence maximize the
potential for wheel snag and vehicle pocketing, Figure 1.
(a)
(b)
Figure 1. Schematic representation of impact conditions for
longitudinal barriers. Distance X represents the location of CIP (a) Standard guardrail systems (b) Transition guardrail systems [1]
The computer program Barrier VII has been widely used as
the primary tool for identifying CIP locations for longitudinal
barriers [19] and more recently, LS-DYNA has been utilized for
this same purpose. NJB does not require a definite CIP location
since the cross-section remains constant across the longitudinal
length of the barrier, however for G4(1S) and Wtrans guardrail

5 Copyright © 2014 by ASME
systems, CIP was identified by ensuring that the selected
location resulted in maximum loading of the rail splice.
CRASH SIMULATIONS A total of 81 numerical simulations encompassing the
entire spectrum of test vehicles (3), vehicle variants (×3), test
articles (×3) and test levels (×3) were designed according to test
matrices defined under Table 7. Simulation time of 0.5 sec was
selected all cases in order to allow sufficient time for the test
vehicle to traverse post-impact so that relevant dynamics
performance factors can be computed. Discussing the entire set
of results from 81 simulations, their analysis, and their
corresponding MASH assessments is beyond the scope of this
paper, accordingly we shall focus on the following pairs of test
vehicles and test articles where entire pool of results cannot be
presented:
1) Yaris v/s G4(1S)
2) Taurus v/s NJB and
3) Silverado v/s Wtrans
In order to identify specific cases, from within the entire
matrix of simulations, we shall use the following case ID
nomenclature – VAM_S.
Where:
V ≡ first initial of test vehicle name
A ≡ first initial of test article name
M ≡ test vehicle model identifier
S ≡ Test level speed.
For example:
Yaris – NJB – Baseline – 50 km/hr ≡ YNBL_50
Taurus – G4(1S) – LW15 – 70 km/hr ≡ TG15_70
Silverado – Wtrans – LW25 – 100 km/hr ≡ SW25_100
First and foremost, every case was assessed for stability by
assessing the distribution of energy associated with the crash
event. Figure 2 provides the global energy summaries for
YGBL_100, TNBL_100 and SWBL_100. These plots indicate
a relatively constant total energy, suggesting that there is no
unusual characterization in the simulation that would result in
unrealistic sink (trough) or spike (peak) of energy. The kinetic
energy associated with the motion of the vehicle gradually
decreases post-impact and consequently internal energy
increases as vehicle components absorb energy via deformation.
Interface energy, which is associated with the friction between
internal components and vehicle-to-barrier interaction, also
gradually increases during the simulation. Hourglass energy
also remains negligible, compared to other energies, throughout
the simulations, ensuring efficient and consistent element
formulation.
(a)
(b)
(c)
Figure 2. Energy Balance (a) YGBL_100 (b) TNBL_100 (c) SWBL_100. Note: X axis represents time in sec and Y axis
represents global energies in Joules

6 Copyright © 2014 by ASME
Table 8. MASH recommended Safety Evaluation Guidelines
Evaluation Factors Evaluation Criteria Applicable
Tests *
Structural Adequacy
A. Test article should contain and redirect the vehicle or bring the vehicle to a controlled stop; the vehicle should not penetrate, underride, or override the installation although controlled lateral deflection of the test article is acceptable.
10, 11, 20, 21, …
B. The test article should readily activate in a predictable manner by breaking away, fracturing or yielding.
…
C. Acceptable test article performance may be by redirection, controlled penetration or controlled stopping of the vehicle.
…
Occupant Risk
D. Detached elements, fragments, or other debris from the test article should not penetrate or show potential for penetrating the occupant compartment, or present undue hazard to other traffic, pedestrians, or personnel in a work zone. Deformations of, or intrusions into, the occupant compartment should not exceed limits set forth in Section 5.3 and Appendix E [1]
All
E. Detached elements, fragments, or other debris from the test article, or vehicular damage should not block the driver’s vision or otherwise cause the driver to lose control of the vehicle.
…
F. The vehicle should remain upright during and after collision. The maximum roll, pitch, and yaw angles are not to exceed 75 degrees.
All except those listed in Criteria G
G. It is preferable, although not essential, that the vehicle remain upright during and after collision. …
H. Occupant Impact Velocities (OIV) should satisfy the following limits:
Component Preferred Maximum
Longitudinal and Lateral 30 ft/sec (9.1 m/sec) 40 ft/sec (12.2 m/sec) 10, 11, 20, 21, …
Longitudinal 10 ft/sec (3.0 m/sec) 16 ft/sec (4.9 m/sec) …
I. Occupant Ridedown Acceleration (ORA) should satisfy the following limits:
Component Preferred Maximum
Longitudinal and Lateral 15.0 G 20.49 G 10, 11, 20, 21, …
Post-impact Vehicular Response
J. Through M. reserved
N. Vehicle trajectory behind the test article is acceptable …
* Only tests conducted under this research have been listed under Applicable Tests, the rest are indicated in (…)
EVALUATION CRITERIA We will now focus on the evaluation of MASH
recommended dynamic performance factors: (1) Structural
Adequacy, (2) Occupant Risk and (3) Post-impact Vehicular
Response and their corresponding evaluation criteria’s, Table 8,
for the test matrices selected under this research. Based on
simulation results and corresponding evaluations, we will
discuss the safety implication of future vehicle designs. We will
address each relevant criterion and present a comprehensive and
relative assessment between BL and LW models.
1) Structural Adequacy Structural adequacy represents the preliminary set of safety
evaluation criteria’s that must be satisfied by all test articles
under assessment. Every roadside safety feature, depending on
its intended function, must be able to redirect the vehicle, by
stopping the vehicle in a controlled manner, or by permitting the
vehicle to break through the device [1].
Criteria A: As described in Test Matrices, Table 7,
selected test articles must satisfy Criteria A, Table 8. This
criterion assesses the feature from a structural and a mechanical
point of view. For longitudinal barriers, structural strength is
examined by requiring vehicle containment and redirection – in
a controlled manner. The condition of controlled stopping while
the vehicle remains in contact with the rail is also considered
satisfactory [1]. Geometrical features of a barrier, such as
guardrails, are assessed by examining the engagement zone
between the vehicle and the barrier, hence ensuring that the test
vehicle does not underride or override the installation.
In Annex A, Figure 5, we plot the trace of CG for the test
vehicle as it approaches and departs from the barrier post-
impact. By visual inspection and by noticing the change in slope
of the trace, we can see that the barrier is capable of containing
and redirecting the vehicle. We also notice that the barrier
maintains its structural integrity; that is the vehicle does not
penetrate or rupture the barrier. We also analyze the crash
scenario in different perspectives and at different time instants,
making sure the vehicle does not underride, override or snag
across the barrier. Similar evaluations were made for all

7 Copyright © 2014 by ASME
simulations and it was observed that the barriers satisfied
Criteria A under all Test Levels and for all LW variants.
2) Occupant Risk Risk of occupant injury during impact with a highway
safety feature largely depends on the crashworthiness of the
impacting vehicle. It also depends on several other factors such
as the design of occupant compartment, its structural integrity,
equipped restraint systems, seating positions, airbags, occupant
physiology etc. Consequently, relationship between occupant
risk and vehicle dynamics during interaction with a roadside
hardware is extremely difficult to quantify since it involves such
important but widely varying factors. As a de facto standard,
MASH recommends measuring occupant risk based on gross
vehicular accelerations; that is parameters should be measured
with respect to accelerations measured near the vehicle Center
of Gravity [1]. This circumvents any vehicle/occupant
dependent variables, which would normally differ from case to
case. As described in Table 7, selected test articles must satisfy
Criteria D, Criteria F, Criteria H, and Criteria I, Table 8.
Criteria D evaluates occupant risk by taking into account
the deformations and intrusions within the occupant
compartment. MASH recommends limiting values for these
evaluations, that are defined to ensure that deformation and
intrusions do not cause serious injuries. These recommended
values were made whilst considering the limitations of
suggested test procedures and methodologies used to estimate
occupant risk [1]. Since the LW variants were developed solely
by density scaling (as opposed to rigorous material modeling),
occupant compartment deformations and intrusions were
assumed to be “not accurate” representations of the actual
future vehicle designs. Accordingly, Criteria D was not
evaluated under this study.
Criteria F: According to MASH, a key requirement for
occupant risk evaluation is for the impacting vehicle to remain
upright during and after the collision. As an indication of
vehicle stability, the maximum roll or pitch angles, Figure 3, of
the vehicle during and after impact sequence should not exceed
75°, Table 8.
Figure 3. Vehicle Stability Parameters
MASH recommended format for documentation and
reporting of findings under this evaluation includes the
measurements of vehicle angular displacements (roll, pitch and
yaw) in the form of plots, Figure 4, and maximum values,
Annex B Table 9. We can see from Table 9 that test vehicles
remain upright during the course of impact and do not roll,
pitch or yaw over 75°, ensuring successful barrier performance.
Criteria H: MASH also recommends evaluating occupant
risk by measuring the response of a hypothetical, unrestrained
front seat occupant whose motion relative to the occupant
compartment is solely dependent on vehicular accelerations [1].
According to MASH, the “point-mass” occupant is assumed to
move through space until it impacts a hypothetical instrument
panel, windshield, or side structure and consequently is
assumed to experience vehicular accelerations perpendicular to
the contact surface while remaining in contact with the interior
surface. Occupant Impact Velocity (OIV) is one such
performance criteria that takes into account longitudinal and
lateral component of occupant velocity at the instant of impact
[1]. OIV is calculated using the following equation [1]:
*
, ,
0
x y
t
I x yV a dt (1)
Subscripts x and y represent impact velocity in the x or y
direction, a represents vehicular acceleration and t* is the time
when the hypothetical occupant has travelled either 2 ft (0.6 m)
forward or 1 ft (0.3 m) laterally, whichever is smaller [1]. t* is
determined by incremental integration using:
* *
2
,
0 0
,
t t
x yX Y a dt (2)
Where X = 2 ft (0.6 m) and Y = 1 ft (0.3 m). Acceleration is
integrated twice with respect to time to find the value of t* (t
*x
or t*y) at which the RHS equals X or Y. t
* in Eq. (1) is then
taken as the smallest of t*x or t
*y. MASH recommended limits
for OIV under applicable tests are listed in Table 8 and the
results obtained from simulation crash data analysis are listed in
Annex C Table 10. We can see that all crash scenarios, except
for a few, evaluate to preferred OIV values (less than 9.1
m/sec), ensuring successful barrier performance.
Criteria I: Occupant Ridedown Acceleration (ORA) is
another safety performance criteria that takes into account the
highest lateral and longitudinal component of resultant
vehicular accelerations, averaged over the 10 ms (millisecond)
interval of the collision pulse subsequent to the occupant impact
with the associated interior surface [1]. That is, an average of
instantaneous vehicular accelerations subsequent to time t*. In
general however, the averaging duration used to produce

8 Copyright © 2014 by ASME
(a) (b) (c)
Figure 4. Vehicle Roll, Pitch and Yaw angles (a) Yaris v/s G4(1S) (b) Taurus v/s NJB (c) Silverado v/s Wtrans.
Note: x-axis represents time in sec and y-axis represents angular displacements in degrees
occupant injury measurements can range from 0.007 to 0.04 sec
depending on the body component [20]. MASH recommended
limits for ORA assessed under applicable tests are listed in
Table 8 and the results obtained from simulation crash data
analysis are listed in Annex C Table 11. We can see that most
crash scenarios evaluate to preferred ORA values (less than 15
G). However two cases, SN15_100 and SN25_100, surpass the
maximum allowable ORA of 20.49G. These are representative
extreme cases since; 1) Silverado is the heaviest test vehicle
under consideration, 2) Both LW15 and LW25 fail the
evaluation at 100 km/hr, the highest Test Level and 3) NJB is
rigid barrier, meaning it undergoes no deformation; accordingly
it does not absorb impact energy and hence results in higher
ORAs.
3) Post-impact Vehicular Response Post-impact vehicular trajectory is a measure of the
potential of the vehicle to result in a secondary collision with
other vehicles and/or fixed objects, thereby increasing the risk
of injury to the occupants of the impacting vehicle and/or other
vehicles [1]. Recommended matrices for selected set of test
vehicles and test articles do not require the evaluation of this
dynamics performance factor and accordingly the barriers were
not assessed under this criterion.
CONCLUSIONS In this paper, we utilize FEM for modeling and simulating
different crash scenarios in order to evaluate the safety
implications of future lightweight (LW) vehicle designs. Three
representative vehicle models, conforming to MASH weight
classification, were selected from the FE library available at
NCAC. These baseline (BL) models were appropriately LW
modeled whilst maintaining structural stiffness and CG
locations. Two variants per test vehicle, one with 15% and
another with 25% reduction in weight were modeled to simulate
hypothetical versions of future LW vehicles. Entire set of test
vehicles was then analyzed under crash conditions with 3
different longitudinal barriers in order to evaluate their safety

9 Copyright © 2014 by ASME
performance. Based on MASH guidelines, appropriate test
matrices and impact conditions were selected and the test
articles were evaluated under 3 Test Levels. Subsequently, each
crash scenario was successfully assessed for structural adequacy
and occupant risk following MASH evaluation criteria.
Preliminary stability analysis was performed on each case
by gauging global energy distribution during the course of
simulation and ensuring that the physical law of energy balance
is satisfied. Under MASH guidelines for safety assessment,
each scenario was then evaluated for Criteria A, F, H and I.
When compared against reference BL models, LW variants
show very good conformance in overall impact dynamics and
vehicle stability. Selected barriers successfully performed under
Criteria A (vehicle containment and redirection) with no wheel
snag, underride or override. They also successfully performed
under Criteria F (vehicle stability), with roll, pitch and yaw
angles within MASH critical limits. Barriers also performed
well under Criteria H and I (OIV and ORA), ensuring occupant
safety. Results under this study show that existing roadside
infrastructure designs are efficient in protecting occupants of up
to 25% LW vehicles at up to 100 km/hr impact velocities.
However, a rigorous approach with future LW design material
models is recommended for detailed analysis, including the
evaluation of occupant compartment intrusions.
ACKNOWLEDGMENTS We would like to thank Eduardo Arispe from DOT for his
continual support. This research task is sponsored under DOT
IDIQ No. DTFH61-09-D-00001.
REFERENCES [1] “Manual for Assessing Safety Hardware (MASH)”, 2009,
published by the American Associations of State Highway
& Transportation Officials (AASHTO), Washington, DC.
[2] Ross, H. E., Sicking, D. L., Zimmer, R. A., Michie, J. D.,
1993, “Recommended Procedures for the Safety
Performance Evaluation of Highway Features,” National
Cooperative Highway Research Program (NCHRP) Report
350. Transportation Research Board, National Research
Council, Washington, DC.
[3] Marzougui, D., Cui, C., Kan, C. and Opiela, K., “Assessing
Options for Improving Barrier Crashworthiness Using
Finite Element Models and Crash Simulation,” 2012,
NCAC Working Paper NCAC 2012-W-008.
[4] Esfahani, E. S., Marzougui, D. and Opiela, K., “Safety
Performance of Concrete Median Barriers under Updated
Crashworthiness Criteria,” 2008, NCAC 2008-W-002.
[5] Marzougui, D., Buyuk, M. and Kan, C., “Performance
Evaluation of Portable Concrete Barriers,” 2007, NCAC
Report 2007-R-004.
[6] Marzougui, D., Mohan, P., Kan, C. and Opiela, K.,
“Evaluation of Rail Height Effects of the Safety
Performance of W-Beam Barriers,” 2007, NCAC Working
Paper NCAC 2007-W-002.
[7] Brecher, A., “A Safety Roadmap for Future Plastics and
Composites Intensive Vehicles,” 2007, DOT NHTSA
Technical Report No. DOT HS 810 863.
[8] Park, C. K., Kan, C., Hollowell, W. T. and Hill, S.,
“Investigation of Opportunities for Lightweight Vehicles
Using Advanced Plastics and Composites,” 2012, DOT
NHTSA Technical Report No. DOT HS 811 692.
[9] “Development & Validation of a Finite Element Model for
the 2010 Toyota Yaris Passenger Sedan,” 2011, NCAC
Technical Summary NCAC 2011-T-001.
[10] Marzougui, D., Samaha, R. R., Cui, C., Kan, C. and Opiela,
K., “Extended Validation of the Finite Element Model for
the 2010 Toyota Yaris Passenger Sedan,” 2012, NCAC
Working Paper NCAC 2012-W-005.
[11] “Development & Validation of a Finite Element Model for
the 2001 Ford Taurus Passenger Sedan,” 2008, NCAC
Technical Summary NCAC 2008-T-005.
[12] Marzougui, D., Samaha, R. R., Cui, C. and Kan, C.,
“Extended Validation of the Finite Element Model for the
2001 Ford Taurus Passenger Sedan,” 2012, NCAC
Working Paper NCAC 2012-W-004.
[13] “Development & Initial Validation of a 2007 Chevrolet
Silverado Finite Element Model,” 2009, NCAC Technical
Summary NCAC 2009-T-005.
[14] Marzougui, D., Samaha, R. R., Cui, C. and Kan, C.,
“Extended Validation of the Finite Element Model for the
2007 Chevrolet Silverado Pick-Up Truck,” 2012, NCAC
Working Paper NCAC 2012-W-003.
[15] Marzougui, D., Kan, C. and Opiela, K., “Comparison of the
Crash Test and Simulation of an Angle Impact of a 2007
Chevrolet Silverado Pick-Up Truck into a New Jersey-
Shaped Concrete Barrier for MASH Conditions,” 2010,
NCAC Working Paper NCAC 2010-W-001.
[16] Marzougui, D., Mohan, P. and Kan, C., “Evaluation of Rail
Height Effects on the Safety Performance of W-Beam
Barriers,” 2007, NCAC Working Paper NCAC 2007-W-
002.
[17] Marzougui, D., Kan, C. and Opiela, K., “Comparison of
Crash Test and Simulation of an Angle Impact of a 2007
Chevrolet Silverado Pickup Truck into a W-Beam
Transition for MASH Conditions,” 2014, Transportation
Research Board (TRB) 93rd Annual Meeting, Washington,
DC.
[18] Mak, K. K., Sicking, D. L., and Ross, H. E., “Real World
Impact Conditions for Run Off-the-Road Accidents,”1986,
Transportation Research Record N1065, Roadside Safety,
Washington, DC.
[19] Reid, J. D., Sicking, D. L. and Bligh, R. P., “Critical Impact
Point for Longitudinal Barriers,” 1998, Journal of
Transportation Engineering, Vol 124, No. 1. Pp 65-72,
American Society of Civil Engineers, Reston, VA.
[20] Viano, D. C., and Lau, I. V., 1989, “Biomechanics of
Impact Injury,” Research publication GMR-6894. General
Motors Research Laboratories, Warren, MI.

10 Copyright © 2014 by ASME
ANNEX A: STRUCTURAL ADEQUACY
0 .0 sec 0 .2 sec 0 .35 sec 0 .5 sec
(a) Yaris – G4(1S) – BL – 50 km/hr
0 .0 sec 0 .2 sec 0 .35 sec 0 .5 sec
(b) Taurus – NJB – LW15 – 70 km/hr
0 .0 sec 0 .2 sec 0 .35 sec 0 .5 sec
(c) Silverado – Wtrans – LW25 – 100 km/hr
Figure 5. Vehicle containment and redirection (a) YGBL_50 (b) TN15_70 (c) SW25_100

11 Copyright © 2014 by ASME
ANNEX B: OCCUPANT RISK– VEHICLE STABILITY (ROLL, PITCH AND YAW)
Preferred Critical
Angular Displacement < 75° > 75°
Table 9. Maximum values for vehicle roll, pitch and yaw in degrees
Criteria F 2010 Toyota Yaris
2001 Ford Taurus
2010 Chevy Silverado NJB G4(1S) Wtrans NJB G4(1S) Wtrans NJB G4(1S) Wtrans
BL
TL1 Roll 6.48 3.87 2.40 9.79 1.98 2.73 5.24 0.97 3.75
Pitch 8.21 1.67 1.92 2.96 1.57 2.37 7.42 2.19 1.69
Yaw 37.36 31.99 35.08 31.13 29.24 28.70 37.53 22.79 32.59
TL2 Roll 3.62 7.44 3.91 17.11 2.15 3.18 13.34 11.76 12.16
Pitch 12.97 1.52 3.79 4.88 2.72 3.08 14.37 12.87 7.33
Yaw 39.95 32.25 37.89 38.16 39.06 33.29 29.38 30.41 36.79
TL3 Roll 6.79 8.18 11.84 20.09 6.10 6.56 8.19 17.36 33.18
Pitch 8.96 4.00 11.75 5.10 8.35 6.49 8.08 17.33 26.57
Yaw 36.21 37.08 43.32 41.81 29.83 48.12 30.37 32.47 43.25
LW15
TL1 Roll 7.41 2.75 2.31 9.56 2.25 2.73 5.81 1.05 2.90
Pitch 8.69 1.17 1.24 2.99 1.31 2.25 7.54 1.92 1.50
Yaw 38.34 36.05 35.17 31.30 33.59 28.55 36.96 20.65 31.94
TL2 Roll 3.87 7.21 4.04 12.98 3.23 2.52 21.72 2.27 10.77
Pitch 13.87 1.31 3.16 3.96 3.59 3.39 19.05 5.07 7.01
Yaw 40.45 35.54 36.78 38.27 33.88 35.27 31.05 36.73 35.91
TL3 Roll 5.12 16.66 5.09 18.72 6.12 7.47 9.88 13.14 37.02
Pitch 11.99 4.64 6.36 4.62 7.54 4.42 9.44 17.03 26.51
Yaw 38.25 36.14 42.30 43.98 35.77 49.71 29.94 34.99 37.74
LW25
TL1 Roll 4.48 2.11 2.25 9.79 1.85 2.35 5.94 2.28 2.41
Pitch 11.26 1.01 1.11 3.36 1.22 1.90 7.72 1.81 2.08
Yaw 39.33 37.21 35.27 36.89 32.32 27.78 36.22 23.42 31.11
TL2 Roll 4.31 6.60 2.74 10.99 1.62 3.17 21.15 16.03 10.55
Pitch 17.62 1.99 3.31 3.61 1.16 3.49 17.38 16.84 6.36
Yaw 39.67 37.69 36.73 36.98 39.44 34.74 34.04 28.01 35.59
TL3 Roll 4.25 8.15 4.74 16.61 2.64 7.51 11.04 11.47 37.37
Pitch 13.95 5.92 7.33 4.42 2.90 4.18 11.69 17.45 26.07
Yaw 37.08 48.03 38.03 45.00 46.14 48.65 29.33 36.29 37.36

12 Copyright © 2014 by ASME
ANNEX C: OCCUPANT RISK – OIV AND ORA
Preferred Safe Critical
OIV OIV < 9.1 9.1 < OIV < 12.2 12.2 < OIV
ORA ORA < 15 15 < ORA < 20.49 20.49 < ORA
Table 10. Occupant Impact Velocity (OIV) in m/sec
Criteria H – OIV 2010 Toyota Yaris
2001 Ford Taurus
2010 Chevy Silverado NJB G4(1S) Wtrans NJB G4(1S) Wtrans NJB G4(1S) Wtrans
BL
TL1 Longitudinal 3.37 4.31 3.83 2.81 3.85 3.21 2.63 4.13 3.24
Lateral 4.63 4.63 4.52 4.51 3.95 4.78 4.42 3.22 4.08
TL2 Longitudinal 4.71 5.88 6.43 4.37 5.34 4.89 3.01 5.27 4.92
Lateral 6.30 5.23 6.40 5.80 4.83 6.97 5.23 4.13 5.68
TL3 Longitudinal 5.96 8.17 8.93 6.18 7.86 7.21 4.98 6.70 7.14
Lateral 8.41 5.58 8.86 7.98 4.90 9.73 7.92 4.68 7.70
LW15
TL1 Longitudinal 3.37 3.93 3.74 2.65 3.65 3.31 2.67 4.39 3.00
Lateral 4.56 4.73 4.51 4.15 4.10 4.50 4.26 3.35 4.03
TL2 Longitudinal 4.62 5.43 5.92 4.32 5.02 4.79 3.04 5.52 4.53
Lateral 6.26 5.68 6.53 5.77 4.67 6.85 5.39 4.07 5.66
TL3 Longitudinal 6.03 8.14 8.40 6.21 7.92 7.12 4.64 6.51 6.54
Lateral 8.68 5.81 9.27 8.19 5.20 9.68 7.76 5.25 7.95
LW25
TL1 Longitudinal 3.18 4.00 3.61 2.89 3.33 3.09 2.50 4.33 3.08
Lateral 4.36 4.81 4.43 4.44 4.42 4.19 4.09 3.66 3.95
TL2 Longitudinal 4.52 5.51 6.10 4.08 5.12 4.68 3.18 5.45 4.93
Lateral 6.28 5.61 6.42 6.08 4.95 6.75 5.79 4.09 5.50
TL3 Longitudinal 6.03 7.60 8.30 6.04 7.76 6.91 4.85 6.78 6.72
Lateral 8.67 6.05 9.35 8.29 5.90 10.01 7.31 5.21 7.82
Table 11. Occupant Ridedown Acceleration (ORA) in G’s
Criteria I – ORA 2010 Toyota Yaris
2001 Ford Taurus
2010 Chevy Silverado NJB G4(1S) Wtrans NJB G4(1S) Wtrans NJB G4(1S) Wtrans
BL
TL1 Longitudinal 1.25 4.23 1.20 2.33 8.14 1.76 4.50 7.87 4.69
Lateral 2.80 3.13 3.25 4.51 9.45 5.25 5.21 5.37 6.86
TL2 Longitudinal 1.94 10.1 3.32 3.07 6.92 3.13 8.47 7.77 5.59
Lateral 2.97 5.94 3.75 5.83 7.88 7.68 10.42 6.08 8.19
TL3 Longitudinal 2.57 12.2 14.42 4.33 15.15 11.29 13.60 11.31 12.69
Lateral 7.16 8.2 13.62 6.71 16.98 11.2 18.86 10.94 8.34
LW15
TL1 Longitudinal 2.51 3.12 1.77 2.95 6.62 3.84 3.68 7.34 5.01
Lateral 3.01 3.36 5.19 4.78 6.82 8.72 8.18 4.19 6.00
TL2 Longitudinal 1.82 12.59 2.31 3.58 8.94 4.13 5.60 9.27 4.98
Lateral 3.65 4.61 8.28 5.89 8.30 10.47 15.32 8.45 8.34
TL3 Longitudinal 2.87 13.45 10.42 3.69 19.68 8.49 15.40 12.06 12.01
Lateral 8.24 9.59 11.06 7.97 19.62 9.39 22.13 8.26 11.14
LW25
TL1 Longitudinal 1.59 2.58 1.60 2.66 2.43 2.15 3.03 6.82 3.75
Lateral 4.91 2.46 5.94 3.71 4.40 7.42 7.06 4.62 5.36
TL2 Longitudinal 2.39 10.81 2.80 4.45 10.18 2.96 5.72 7.26 5.46
Lateral 4.54 6.31 8.98 6.9 8.38 10.05 17.27 5.35 9.67
TL3 Longitudinal 2.88 12.31 9.54 5.02 11.20 7.84 12.16 11.88 9.45
Lateral 9.31 11.51 12.18 7.73 14.64 9.5 20.75 10.59 11.18