analyzing food safety cultures: a means to improve food
TRANSCRIPT
Analyzing Food Safety Cultures: A Means to Improve Food Safety in the Catering Sector
by
Sara Elizabeth Ghezzi
A thesis submitted to the Graduate Faculty of
Auburn University
in partial fulfillment of the
requirements for the Degree of
Master of Science
Auburn, Alabama
May 9, 2011
Keywords: Food, Safety, Food Handling, Personal Hygiene, Equipment, Catering
Copyright 2011 by Sara Elizabeth Ghezzi
Approved by
Baker Ayoun, Chair, Assistant Professor of Nutrition, Dietetics, and Hospitality Management
Alecia Douglas, Assistant Professor of Nutrition, Dietetics, and Hospitality Management
Kyungmi Kim, Assistant Professor of Nutrition, Dietetics, and Hospitality Management

! ii!
Abstract
Food safety is one of the most pertinent issues in the food service industry. Food borne
illness and food poisoning can be lethal and can destroy the reputation of a catering
establishment. A review of the literature points out that even though catering employees may
have been formally trained with a certificate of completion, they still may not routinely practice
the appropriate food safety measures and practices. More research and studies need to be
conducted to survey just how widespread the neglect of proper food safety malpractices are
occurring, and what kinds of remedies can be provided to make the catering service a safer food
service for the consumer.
This study aimed at assessing the knowledge and practices of employees in the catering
industry. A quantitative approach was utilized in this study. A questionnaire was presented to
557 respondents, representing over 40 chapters in the National Association of Catering
Executives. The questionnaire was divided into three sections of food safety and included the
following: Food Handling, Equipment, and Personal Hygiene. Questions asked about knowledge
and the frequency of certain tasks and practices. This study analyzes descriptive, t-tests and
ANOVA statistics to find differences between gender, training, management status, and
employment status with regard to knowledge and practices. Results suggested that employees in
the catering industry who work part-time need more training and development. Management
was seen as more knowledgeable than non-management personnel and was seen to have more
training. Overall the study found that there is a need to focus on training for employees, with

! iii!
even greater emphasis for new employees. The study also found that management in the catering
sector needs to focus on food safety training for part-time employees. All areas need
improvement and continued research needs to focus on exactly why catering servers do not
perform certain tasks related to food safety.

! iv!
Table of Contents
Abstract…………………………………………………………………………………………....ii
List of Tables..................................................................................................................................vi
Chapter 1 Introduction………………………………………………………………………….....1
Background………………………………………………………………………………..1
Purpose of the Study……………………………………………………………………....4
Significance of the Study……………………………………………………………….....4
Research Questions………………………………………………………………………..6
Organization of the Study………………………………………………………………....6
Chapter 2 Literature Review……………………………………………………………………....7
Food Safety Culture…………………………………………………………………….....7
Personal Hygiene……………………………………………………………………….....8
Equipment and Food Handling…………………………………………………………..11
Literature Implications for the Current Study…………………………….……………...15
Chapter 3 Methods…………………………………………………………………………….…18
Sampling and Data Collection………………………………………………………….. 18
Survey Instrument…………………………………………………………………...….. 21
Pilot Study………………………………………………………………………………..23
Non-response Bias……………………………………………………………………….23
Ethical Considerations…………………………………………………………...………24
Data Analysis…………………………………………………….………………………24

! v!
Chapter 4 Results……….………………………………………………………………………..26
Overall Results…………………………………………………………………………...26
Food Handling…………………………………………………………………………...27
Equipment…………………………………………………………………….………….43
Personal Hygiene………………………………………………………………………...56
Chapter 5 Discussion, Conclusion, and Implications……………………………………….…...71
Discussion………………………………………………………………………………..71
Implications………………………………………………………………………………75
Study Limitations………………………………………………………………………...77
Future Research………………………………………………………………………….78
References………………………………………………………………………….…………….80
Appendix I Information Letter……………..………………………………………………….…84
Appendix II Survey Instrument……….…………………………………………………………87

! vi!
List of Tables
Table 1: Demographic Profile of Respondents .............................................................................20
Table 2: Professional Characteristics of the Participants...............................................................21
Table 3: t-test Analysis on Food Handling Knowledge.................................................................28
Table 4: ANOVA Analysis of Age and Food Handling Knowledge ............................................30
Table 5: Tukey Post Hoc Test Age and Food Handling Knowledge.............................................31
Table 6: t-test Analysis on Food Handling Frequencies................................................................34
Table 7: ANOVA Analysis of Age and Food Handling Frequencies............................................36
Table 8: Tukey Post Hoc Significant Findings Age and Food Handling Frequencies..................37
Table 9: ANOVA Analysis of Experience and Food Handling Knowledge.................................39
Table 10: Tukey Post Hoc Results Experience and Food Handling Knowledge…………..........40
Table 11: ANOVA Analysis of Experience and Food Handling Frequencies..............................42
Table 12: Tukey Post Hoc Findings Experience and Food Handling Frequencies.......................43
Table 13: t-test Analysis on Equipment Knowledge.....................................................................46
Table 14: ANOVA Analysis of Age and Equipment Knowledge.................................................48
Table 15: Tukey Post Hoc Findings of Age and Equipment Knowledge......................................49
Table 16: t-test Analysis on Equipment Frequencies....................................................................51
Table 17: ANOVA Analysis of Age and Equipment Frequencies................................................52
Table 18: Tukey Post Hoc Findings Age and Equipment Frequencies.........................................53
Table 19: ANOVA Analysis of Experience and Equipment Knowledge......................................54
Table 20: Tukey Post Hoc Results Experience and Equipment Knowledge.................................55

! vii!
Table 21: ANOVA Analysis of Experience and Equipment Frequencies.....................................56
"#$%&!''(!")*&+!,-./!0-1!2345346.!78)39:&4/!2;&8)&413&.<<<<<<<<<<<<<<<<<<<<<<<<<<<<<<<<<<<<<<<<<<<<<<<<<<<<<<<<<<<<<<=>!
"#$%&!'?(!"#/&./@4#%+.3.!-A!,&;.-4#%!0+63&4&!2;&8)&413&.<<<<<<<<<<<<<<<<<<<<<<<<<<<<<<<<<<<<<<<<<<<<<<<<<<<<<<<<<<<<<<<<<<=B!
Table 24: t-test Analysis of Personal Hygiene Knowledge...........................................................59
Table 25: ANOVA Analysis of Age and Personal Hygiene Knowledge......................................62
Table 26: Tukey Post Hoc Findings Age and Personal Hygiene Knowledge...............................63
Table 27: ANOVA Analysis of Age and Personal Hygiene Frequencies.....................................65
Table 28: Tukey Post Hoc Test Findings Age and Personal Hygiene Frequencies.......................66
Table 29: ANOVA Analysis of Experience and Personal Hygiene Knowledge...........................67
Table30: Tukey Post Hoc Test of Findings Experience and Personal Hygiene Knowledge.........68
Table 31: ANOVA Analysis of Experience and Personal Hygiene Frequencies..........................69
Table 32: Tukey Post Hoc Test Findings Experience and Personal Hygiene Frequencies……...70

1
Chapter 1 Introduction
This chapter addresses pertinent reasons why research needs to be conducted to explore
food safety practices in the catering segment in particular. One of the most important issues of
concern is the risk of food borne illness. The purpose of this study and its significance will also
be attended to in this chapter.
Background
Food Safety should be practiced at all times no matter where the location. The possibility
of contracting food borne illnesses can happen at home, at a restaurant, or at an event that is
being catered at the beach. Without proper precautions and utilizing the practices in food safety,
people are put into a risky situation. In 2006 there were 1,270-reported food borne disease
outbreaks in the USA, resulting in 27,634 illnesses and eleven deaths (CDC, 2010). Some of
these statistics could be prevented if the proper education and training of food safety is given to
all food service industry employees. Even more disturbing are the estimates provided by the
CDC in 2010 that these diseases sicken seventy-six million Americans per year, causing 300,000
hospitalizations and 5,000 deaths. The CDC contends that many of these illnesses do not get
recorded (CDC, 2010). A 2009 study by Scharff estimated that food borne illnesses cost the
United States $152 billion dollars per year in healthcare, workplace, and in other economic
losses The American public has also experienced nationwide alarm, as outbreaks of toxic E. coli
O157:H7 has been discovered in spinach. In 2006 two hundred and five individuals were
infected in 26 states and three people died in the outbreak (US FDA, 2007). In the summer of

2
2008 a salmonella outbreak sickened over 14,000 people in the United States. The FDA first
cited that tomatoes were the source of the illness but later discovered that Serrano peppers were
to blame (US FDA, 2008). Food borne pathogens have been discovered in produce that can
become part of a meal at a restaurant, a fast-food establishment, or a catered affair. The threat of
these pathogens in the American food base is disturbing and becomes another critical reason why
food service establishments need to practice methods to reduce and prevent the passage of food
borne pathogens.
Norovirus and salmonella were the leading causes of food borne disease outbreaks in
2006, the latest year for which statistics are available (CDC, 2010). Food borne outbreaks of
norovirus occur most often when infected food handlers fail to wash their hands correctly after
using the restroom. With so many people contracting a food borne illness every year this is a
critical problem that affects all aspects of the hospitality industry, including the catering
segment. Millions of people attend conferences, weddings, and other special events every year
and hence catering employees need to have a basic knowledge of food safety. A caterer is
defined as a service “providing single event-based food services” (US Census Bureau, 2000).
These establishments generally have equipment and vehicles to transport meals and snacks to
events and or prepare food at an off-premise site. Banquet halls with catering staff are included
in this industry (US Census Bureau, 2000). The US catering industry includes about 10,000
companies, with combined annual revenue of $5 billion dollars (National Restaurant
Association, 2008; Valuation Resources, 2011). The very nature of catering sets up red flags
when considering the risk of food borne illness outbreaks. Events demand a very fast paced
delivery and many times stressful circumstances for employees. Large numbers of people are
served while the food may be transported to an off-site location. The food must be kept at proper

3
temperatures on route and at the serving location. All of these variables can add to the increased
risk of developing a food safety issue. Therefore with food borne illness still at an all-time high
and millions of people attending special event functions every year, catering servers and
employees need to have proper food safety training and education.
Practicing proper food safety methods and maintaining food safety in the food industry is
critical for the consumer. Food borne illness poses a risk whether an individual dines at home, at
a restaurant, or at an elegant catered event. Proper food safety techniques and food handling
must be practiced in order to protect the consumer from serious consequences. Food borne
illnesses have resulted in thousands of deaths and hospitalizations (Scharff, 2009; Yasuda 2010).
One outbreak of food poisoning can result in millions of dollars of penalties, lost business,
expensive lawsuits, and a tarnished reputation.
The special nature of catering events makes it very critical to practice and follow through
with safe food handling methods. Events may dictate that food has to be transported long
distances or the timing of the event may be off schedule due to some unforeseen incidents.
Therefore those in charge must be responsive and flexible to ensure that the food will be stored
and served at the correct temperature. Not only do the managers need to oversee the proper
preparation, storage, and serving of the food, but all those involved in any aspect of food
handling must be knowledgeable and dedicated to safe food handling practices. This includes
the servers, cooks, and clean-up employees. In most catering or banquet facilities, servers handle
the food in the back of the establishment and therefore it is vital that they are trained to maintain
the safety of the food about to be served. Proper hygiene is a must for anyone coming into
contact with the food. Training and consistent reinforcement of safe food handling practices is
especially important for all employees performing catering and or banquet functions.

4
The Retail-Foodservice Food Safety Consortium conducted six focus group sessions on the
topic of food safety education and training in 2008. A series of questions were asked to thirty
participants who had training and were educated in food safety. It was found that food safety at
retail and foodservice levels was in extreme need of improvement. It is surprising that with all
the education and training that is available that many food service employees do not have the
knowledge needed to keep guests safe. Operators who participated in the study showed a lack of
understanding why food safety practices are required and lacked basic knowledge or simply do
not care (Nummer, Fraser, & Klein, 2009).
Purpose of the Study
The purpose of this study is to explore food safety measures in catering and special event
programs, especially with respect to the knowledge and implementation of behaviors of food
handlers in the catering sector. This study anticipates that there will be an even higher need for
education and training in the catering sector due to high turnover, the expense of training part-
time employees, and the high paced environment of catering which may inhibit proper food
safety practices. It is also pointed out that catering servers may feel that it is not their
responsibility or since they are not involved with the cooking of the food, they may feel their
actions do not affect the safety or quality of the food that they are serving.
Significance of the Study
Catering is a growing industry. With over 10,000 catering companies in the United
States there is a growing need for servers in this industry (National Restaurant Association,
2008; Valuation Resources, 2011). As food safety continues to be an issue in the food service
industry and since food borne illness outbreaks continues to happen, maintaining a healthy

5
environment, which can eliminate the chance of any outbreaks, should be a top priority for
business owners. Yet many companies do not take a proactive approach in guaranteeing that all
employees are trained in this important area (Nummer et al., 2009). With limited studies
evaluating and targeting the catering/special event industry, this study highlights the need for
greater improvement in overall food safety knowledge. This research sets out to show how
knowledge of food safety affects the behaviors being implemented specifically in the catering
sector. There are several reasons why food safety is even more important in this area than of
others. Given that there are off-site events which food is either prepared off-site or transported
off-site, food safety becomes more important than just making food in a restaurant. This is
particularly important given that many US states do not have regulations for off-site catering.
The unique challenges of food delivery, either to off-premise locations miles away from
the production area or merely as far as executing service on the opposite side of a hotel add to
the criticality of proper food handling in a catering situation. Unlike restaurant servers, all
catering personnel are, in essence, food production employees. Servers are responsible for
setting buffet stations and also keeping the stations replenished. It is imperative that servers keep
food covered properly and monitor the temperature of the food in the back of the house when
running buffet style events. Catering servers are responsible for ensuring a quality product is
reaching the guest as well as ensuring the guest is receiving a product safe for consumption. The
unique amount of food handling required in catering situations highlights the importance of this
study. The specific tasks of catering servers cannot be measured by the same standards as a
restaurant server. These factors were taken into consideration when reviewing the literature and
experts in the field of catering in order to develop a survey to target what catering servers should
be implementing. The lack of attention to food safety in catering is seen as a weakness in the

6
current literature. This study offers new insight and examination of this important area and thus
makes an original contribution to the literature.
Research Questions
This study set out to answer the following questions:
RQ1 To what extent are catering employees knowledgeable in the widely accepted food safety
measures?
RQ2 To what extent are catering employees implementing the widely accepted food safety
measures?
RQ3 Are there differences in catering employee’s knowledge of the widely accepted food safety
measures based on their gender, management, training, employment status, age, and
experience?
RQ4 Are there differences in how often catering employees implement the widely accepted food
safety measures based on their gender, management, training, employment status, and
experience?
Organization of the Study
Chapter 1 introduced a background to the research and presented the purpose and
significance of this study. Chapter 2 is a review of the relevant literature on the subject. Next, in
chapter 3 the research methods of the study are discussed. Results are shown in chapter 4, finally
in chapter 5 the findings are discussed along with implications, limitations and future research
that could be conducted.

7
Chapter 2 Literature Review
In this chapter a literature review relating to key factors that have direct impact on safe
food practices will be explored. These key factors involve the practice of personal hygiene of
those coming into contact with the food, the maintenance and sanitation practices of equipment
and food preparation areas, and the practices of safe food handling. These particular areas can
constitute passage of pathogens if the recommended rules of safety are not taking place, and they
serve as critical areas in which proper training of personnel must take place. It is important to
understand and recognize the various knowledge and behaviors of the personnel as they carry out
their role.
Food Safety Culture
A relatively new emerging risk factor in the food industry is food safety culture (Griffith,
Livesey, & Clayton, 2010). Griffith et al., (2010) propose a definition of food safety culture as
the aggregation of the prevailing, relatively constant, learned, shared attitudes, values and beliefs
contributing to the hygiene behaviors used within a particular food handling environment.
Further studies investigating and understanding the underlying attitudes and beliefs may help to
discover why and how to make a positive and balanced food safety culture at all levels.
An organization’s culture is ultimately its beliefs, attitudes and values that the employee
is exposed to everyday (Griffith et al., 2010). For example, if an employee observes a manager
continuously coming to work late, the employee may then think the lateness is an acceptable
behavior in this particular work environment. In other words the workplace culture constitutes

8
workplace practices that reflect the visible symbols that can be specific to a business culture and
maybe subject to planned change (Hofstded, 1998). Investigating the culture of an
establishment and understanding the beliefs and attitudes toward food safety may help
understand why employees do not perform safe practices while working. Corrective measures
can then take place to rectify and improve the workplace culture especially concerning food
safety practices.
Yiannas (2009) states that organizations can choose to create a strong food safety culture.
Leaders are accountable for instigating a strong food safety culture since they have the power
and influence to create such an atmosphere. Practicing a positive food safety culture may have
the potential to reduce the global burden of food borne illness. Creating a positive food safety
culture can support this process by actually changing the thoughts, behaviors, and beliefs of
individuals within a group (Yiannas, 2009). Therefore it appears that by investigating the beliefs
and knowledge of catering employees, specific factors which contribute to poor practices may be
identified and may further suggest what management can implement in the workplace to help
develop a more positive food safety culture.
Personal Hygiene
Personal hygiene with strong emphasis on hand washing is one of the most important
practices of a positive food safety culture. Poor hand hygiene has been identified as a significant
risk factor in spreading food borne illnesses (Guzewich, 1995; Kilgore et al., 1996; Kassa, 2001).
Research conducted by Redmond, Griffith, Slader, & Humphrey, (2004), further demonstrates
that improper food handling practices can lead to dangerous contamination especially from raw
foods. Further research in a laboratory setting (Daniels et al., 2000; Olsen et al., 2001),

9
emphasizes that if food handlers become infected and/or equipment becomes contaminated with
pathogens, poor hand hygiene could definitely transmit those pathogens to customers. A
majority of food caterers in a United Kingdom study acknowledged their awareness of the
importance of good hand hygiene and were able to state reasons for this important behavior, that
is an activity or conduct that supports reducing the passage of food borne pathogens (Food
Standards Agency, 2002). However, acknowledging the importance of a behavior does not
guarantee that an individual will consistently practice that behavior.
Janz and Becker (1984) suggest that individuals evaluate the perception of risk by
determining whether or not they are really liable to a threat or perceived susceptibility and
whether or not the threat is truly severe or a perceived severity. Therefore, even if an individual
acknowledges the importance of good hand hygiene they may not practice the activity
consistently. Employees who perceive a stronger severity and/or a weaker barrier may be more
likely to practice protective health action (Janz & Becker, 1984). Proper training practices in the
importance of personal hygiene and the enforcement of these practices can improve food safety
for the public. In addition this study notes that management must limit any barriers that may
deter personnel from executing hand washing or other hygiene activities.
Several models have been used in the past to investigate a wide range of behaviors that
have been used to study hand washing practices in hospitals (O’Boyle & Larson, 2001) and in
the home (Ralston, Brent, Starke, Riggins, & Linn, 2002). Clayton and Griffith (2008) initiated a
study on hand washing, since the previous studies have been limited in actually applying
quantitative psychological theory, to predict and understand the implementation of specific food
safety activities and practices in the work setting. In their model they generated two
components, the internal cognitive control or “perceived difficulty of hand washing”, and the

10
more general external factors or “perceived barriers to hand washing”. The study showed a
thirty-four per cent variance in hand hygiene malpractices and twenty-four per cent of the
variance in intentions. Even though the variance seemed relatively small it was greater than the
average proportion of variance explained in previous studies using objective measures of
behavior (Armitage & Conner, 2001). Another interesting finding was that the caterers’ hand
hygiene practices were influenced by subjective norms or social pressures in addition to personal
considerations. Clayton and Griffith (2008) attribute this to the organizational setting of their
study and that this may provide some explanation for the importance of normative beliefs.
Overall, this study confirmed previous findings that there is an important distinction between
perceptions of others beliefs and perceptions of others’ actions.
The food safety practices of workers, coworkers, and supervisors did affect the caterers’
intentions to carry out hand hygiene practices. Clayton and Griffith (2008) reiterate that in order
to improve caterers’ hand hygiene practices it is important to target all members of the
workplace. This includes those in a supervisor role. Providing off-site training in food hygiene
to individual food handlers without training all members of the food handlers in the business
may be ineffective in changing the caterers’ practices (Clayton & Griffith, 2008).
Clayton and Griffith (2008) have pointed out that individuals may know the importance
of carrying out a duty but under certain circumstances they just don’t do it. This study clarifies
that management of catering businesses cannot depend on one short preliminary training to
guarantee that employees will perform the correct procedures.
Hertzman and Barrash (2007) conducted a study in Las Vegas which investigated the
knowledge of catering employees with regards to personal hygiene practices and other food

11
safety concerns. The study found that many of the employees violated a battery of hygiene
responsibilities. The following are major personal hygiene violations that occurred during the
study: Hands not washed after touching body, uniform etc. (160 occurrences), and Not wearing
gloves when working with ready to eat foods (131 occurrences). Other violations were hands not
washed before event starts, and drinking out of improper containers near food.
The study shows a need to further gather information concerning the knowledge level of
catering employees with respect to the above violations and why these violations are happening
so often. Practicing personal hygiene is a key element in the prevention of passing on any type
of food borne illness. A review of the literature shows a limited number of studies concerning
personal hygiene with respect to catering employees, as a larger majority of studies are geared to
other food service establishments.
Equipment and Food Handling
Proper food handling not only dictates that employees practice personal hygiene
measures, but that equipment and service areas are free from contaminants. A number of studies
have been conducted with reference to determining correct procedures in this area of food safety.
Clayton and Griffith (2004) used notational analysis in their study to record and observe caterers’
implementation of specific food safety practices. The sample used in the study came from a total
of 170 businesses in the Cardiff Food Premises Register from South Wales. The study only used
catering businesses that handled high risk foods. Prior to carrying out the notational analysis,
four major food safety actions were identified as actions that food handlers consider to be
important in preventing food poisoning in the work setting.

12
These critical actions were noted as follows:
1. Hand washing
2. Cleaning equipment, utensils, and surfaces.
3. Preventing cross-contamination
4. Ensuring that food is cooked thoroughly (Clayton, Griffith, Price, & Peters, 2003).
The results of the study determined that only 31% of the caterers followed appropriate
cleaning of surfaces and equipment. The results also revealed no attempt to correctly clean
surfaces and equipment 77 % of the time of the conducted observations. Eighty-five per cent of
these inappropriate actions resulted in the surfaces coming into contact with potentially
contaminated objects (Clayton & Griffith, 2004). A food handler, “any person involved in a
food business who handles or prepares food whether open (unwrapped) or packaged (food
includes drinks and ice)” (Food Safety and Hygiene Working Group, 1997) must practice
appropriate safety measures in order to prevent the passage of contaminants. As seen in the
Clayton and Griffith (2004) study the quantity of inappropriate actions performed by the food
handlers was excessive. Further studies are needed to determine how common these
inappropriate actions are taking place in the catering sector, and how the situation can be
improved. Catering employees that have been working for several years may gain greater
experience in understanding their role in the business operation and may also gain greater
knowledge about correct food safety procedures. Farrish, Kitterlin, Hertzman, and Stefanelli
(2009) conducted a study to determine if the younger inexperienced workers would show a

13
greater tendency to violate and or participate in risky behaviors in a food service setting. The
study did not show any significant difference in the age factor or food service experience
compared to the number of self-reported food safety practices. However, the study did show
significance in noting that students of hospitality in a higher-level institution do show a greater
positive practice and knowledge about food safety, compared to employees who have not been
involved in an educational program of hospitality at the college level.
The very nature of how catering foods are prepared, stored, transported, and the designs
of the kitchens and other food preparation sites, makes the potential for food borne illness and
contamination a real threat to the consumer. Therefore, the food handlers in this industry must
be involved in preventing the spread of pathogens and must be aware of their vital role in this
prevention. The researchers involved in the notational analysis of tracking and observing the
behaviors of food handlers in the catering realm reveal that cross-contamination and
inappropriate hand hygiene is a definite issue. The study by Clayton and Griffith (2004) did not
show that the notational method of observations helped to monitor temperature issues involved
in safe food preparation and storage, but it did prove to be very helpful in monitoring proper
hand hygiene and cleaning to prevent cross-contamination. Still observations of this type would
be time consuming and may be impractical for many businesses to employ. Research in this
study shows that notational analysis could be a useful tool for management in assessing the risk
of cross-contamination in their facility or work site.
The study of Hertzman and Barrash (2007) also looked at assessing the knowledge of
catering employees in Las Vegas. This study found a major concern relating to food handling.
When employees moved food from warming or refrigerated equipment the temperature was not
monitored. This is an alarming concern especially since the management was not aware of the

14
situation. When food temperature is not checked food could be served to guests in the danger
zone. The danger zone may allow bacteria to grow. The danger zone temperature is 40 to 135
degrees F. The study shows a clear need of better training and education for catering employees
involved in the food industry.
The Retail-Foodservice Food Safety Consortium conducted six focus group sessions on
the topic of food safety education and training in 2008. This group which operates as part of a
U.S. Department of Agriculture Cooperative State Research, Education, and Extension Service
Grant, recognizes that regardless of the size or complexity of any food service operation, the on-
site management of each food establishment shares a common responsibility. The focus groups
representing the Retail-Foodservice Food Safety Consortium asked a series of questions related
to food safety at retail and various food service levels. The same questions were asked to a total
of thirty participants who had stated that they had been trained and educated in the topic of food
safety at their job site. It was discovered after the sessions had concluded that food safety at the
retail and food service level was in extreme need of improvement. The individual comments on
the food safety topic showed that many of the food handlers questioned failed to observe and use
proper safety procedures and techniques. Some of the comments included the following:
1. It takes longer to be safe or it is inconvenient.
2. Operators do not understand why food safety practices are required, (they lack basic
knowledge or simply do not care).
3. Operators practice unsafe food practices at home and bring that experience with them to the
job site.
4. Operator management does not provide the correct incentives to get food-safe behaviors which

15
are proper training, motivation, supervision, and reward.
The conducted study of food safety awareness clearly showed a need for improvement in
this area. The focus group participants remarked that there are barriers to learning and practicing
food safety. Some of their responses in reference to these barriers are as follows: some of the
workers have diversity of languages; there is a lack of time and money to incorporate proper
training, socioeconomic standards, lack of interest, cultural differences, skill level, motivation of
the employees, operators’ lack of time, and lack of feedback on safe food behaviors. One of the
most common comments related by focus groups was that many people know better, but just do
not practice the correct food safety behaviors anyway. They also remarked that management
does not emphasize food safety as a priority and that they are so overwhelmed with their duties
that other tasks are more pressing to work on (Nummer et al., 2009).
This study raises a red flag in the food service industry. .This study shows that more
information is needed to understand the “barriers” that the respondents remarked about. Barriers
that inhibit employees from practicing safe behaviors should be identified. Future studies can
focus on better training of employees and especially management, to determine how to expand
better communication between the two in order to curtail these barriers. In addition studies on
safety awareness should be conducted on a broader scale thereby gaining more reliable data to
understand the scope of the problem
Literature Implications for the Current Study
Indeed there have been several studies addressing the issue of food safety concerning the
general public. However, a vast majority of these studies have centered on fast-food
establishments, restaurants, school and hospital cafeterias, and other eateries. The unique

16
differences between the catering sector and the above establishments call for more studies that
analyze the practices of food safety in catering. A study completed by Mitchell, Fraser, and
Beacon (2007) determined that job stress, work pressure, and a high-paced environment can
definitely contribute to poor food safety on the worksite. The catering worksite is quite
demanding and lends to a stressful, fast-paced environment making it vulnerable to food safety
malpractice.
Studies completed in reference to catering and food safety issues such as that of
Hertzman and Barrash (2007) appear to be hampered by various limitations. For example, the
Hertzman and Barrash (2007) study provided a very low response rate given by the caterers.
This particular study was only conducted in the Las Vegas area, and though it did survey
eighteen different events, all the events were organized by the same company. This study needs
a larger geographical sampling thereby providing more respondents in order to show
discrepancies in the knowledge of the catering personnel. The study was conducted by the use of
a snowball sample and may have exposed biased results. The researchers did not ask the
employees surveyed about their exposure to any safety training programs or about their
educational backgrounds. The Hawthorne Effect may have taken place since the servers and
employees were openly observed during work time. Other studies including several by Clayton
and Griffith (2002, 2004, 2008) though notable were completed outside of the US and
predominately in the United Kingdom. The studies provided in the United States are few and
seem to only cover limited areas. The present study will provide a national survey representing a
large geographic area of the United States. It focuses on servers, front-line staff, and includes
management. Research exclusive to the catering industry has not yet examined the United States
as a whole. This study also combines the safety issues of equipment, personal hygiene, and food

17
handling addressed in other research (Nummer et al.2009; Yiannas 2009; Clayton et al., 2003;
Clayton, 2004; Clayton & Griffith, 2002, 2004, 2008; Griffith et al., 2010) into one study as a
whole.
Summary
This chapter has reviewed the relevant literature regarding food handling culture,
personal hygiene, proper equipment, and food handling, while examining the implications of a
comprehensive food safety understanding. This review found strong links between processes
and procedures and the creation of a food safe culture. As stated at the outset, there has been a
lack of applying these concepts to catering operations and personnel. The review of the food
safety literature has served to inform the research conducted in this study and offers the
foundation upon which the ultimate conclusions and implications made in this study are drawn.

18
Chapter 3 Methods
This chapter discusses the methods employed in this study. Topics included are the
sampling and data collection procedures, instrument development, ethical considerations, and
statistical analyses.
Sampling and Data Collection
A survey-based design was used in this study. The participants who received the survey
were the member businesses in the National Association of Catering Executives. This association
is the largest and oldest of its kind in the world. Established in 1958 in New York City, this
association includes approximately 3,500 members from different aspects of the catering
industry. The mission of this association is to provide catering and event professionals the
resources, education, and networking to succeed in the catering industry. This association
includes fifty chapters in thirty US states. Each chapter averages twenty catering/banquet
businesses. Members include a wide range of employees in the industry including catering
executives, management personnel, servers and cooks (NACE, 2011). Email addresses were
obtained on the NACE website by looking at each chapter. To the knowledge of the researcher,
these addresses have not been used in another academic study. Companies included were floral
design, disc jockeys, and table and chair rental businesses; other companies that do not have
catering were not invited to participate. In total, 557 individuals, representing many different
companies were asked to participate in this study. An informational email was initially sent to
these businesses one week prior to the invitation for participation. These emails were sent to
managers and supervisors who were then asked to forward the emails onto their staff. The

19
emails were also sent to those servers and other employees that belong to the association. In the
informational message, the potential respondents were encouraged to participate in this effort
and were assured of the anonymous nature of the activity. Another email was sent that included a
link to the survey, which could be taken online for convenience. Two follow up emails were sent
out to the participants to urge them to participate in the study.
Due to a slow pace of completed surveys returning, four companies were willing to
participate and preferred the research to be completed by a hard copy handout. The hard copy
surveys were dropped off for participants to complete. The surveys were picked up by the
researcher after the event was over. The format, design, and content of the hard copy survey
were exactly the same as the survey on the Internet. When investigating the responses obtained
from the two formats, that is Internet-based and hard copy handout, there were no remarkable
response variations between the two methods. Of the initial emails sent to the 557 individuals
and the hard copies that were distributed by the researcher to these four companies, 98 responses
were submitted via the Internet survey and 157 responses were completed from the hard copy
surveys. Tables 1 and 2 below provide the demographics and professional information of the
participants.
Table 1 shows a general even spilt between male and female participants. Male respondents
accounted for 47.8% of the sample, while females accounted for 52.2% of the sample.
Approximately 62% of the respondents classified themselves between the ages of 20 to 29 years
of age. About half of the respondents have obtained some college/technical school courses and
approximately 26% of the respondents have received a High School diploma. Respondents who
have less than one year of experience to one year accounted for 43.9% of the sample and
respondents who have worked in the industry over 3 years accounted for 42% of the sample.

20
Only 13.7% of the group had experience from 2 to 3 years. Most of the respondents, 72%, were
servers in the catering/banquet industry while those serving as captains accounted for 7.5 %.
The working status of most of the respondents was part-time (59.2%) and the full time
employees accounted for 39.6% of the sample.
Table 1: Demographic Profile of Respondents
Gender N %
Male 122 47.8
Female 133 52.2
Status
Part-time 151 59.2
Full-time 101 39.6
Years of Experience
<1 to 1 year 112 43.9
2 to 3 years 35 13.7
> 3 years 107 42
Missing* 1 .4
Age
Younger than 20 years 32 12.5
20-29 years 160 62.7
30-39 years 25 9.8
40-49 years 28 11.0
50-59 years 4 1.6
60 years or older 6 2.4
Education Level
None/Some High School 3 1.2
High School Graduate 67 26.3
Some College/technical school 129 50.6
College Graduate 49 19.2
Graduate School 7 2.7
*Denotes non response
Information from Table 2 clearly shows that ServSafe (NRAEF, 2010) was the most
utilized program that was used for employees that had previous food safety training. This is a
nationally recognized food safety-training program. However, this table also shows that training
was not prevalent with 72.9% of the group answering that they had not received any prior
training.

21
Table 2: Professional Characteristics of the Participants
Food safety programs completed
N %
ServSafe 54 21.2
Responsible Vendor 7 2.7
Food Safety Manager’s Certification 6 2.4
Barista Training 2 .8
CARE 1 .4
TAP Series 1 .4
None 182 71.4
Management Position N %
Yes 46 18
No 209 82
Previous Food Safety Training N %
Yes 69 27.1
No 186 72.9
Responsible for Training N %
Yes 54 21.2
No 200 78.4
Survey Instrument
The development of the survey instrument went through several stages. First, literature was
gathered and reviewed to find main focal points of what has been studied and what survey
instruments were used. After reviewing main points from the literature, several county health
inspection checklists were examined from several counties in the state of Alabama, USA. After
reviewing the information more focus points were added that were used in focus groups utilized
specifically for this study. Focus groups consisting of three groups of ten for a total of thirty
participants were formed. Three different groups of catering servers and managers employed by

22
catering and banquet facilities with experience of 5 years attended meetings on Sunday May 2,
2010 at 3:00 P.M., Wednesday May 5, 2010 at 7:00 P.M., and Sunday May 9, 2010 at 3:00 P.M.
Thirty of these participants were employed in the state of Alabama. The sessions were
moderated by the researcher. A total of three sessions lasting on an average of forty-five minutes
were conducted. The first session lasted forty minutes and consisted of five females and five
males all employed by the same establishment. Four participants were part of the management
team and six were front line servers. The participants were asked what factors they felt were
important in addressing food safety in general. Specific food safety questions were addressed in
reference to catering and banquet functions. Notes were taken by the researcher and a list of the
discussed factors was compiled. The same process was repeated for two more sessions. The
second session consisted of six females and four males, all of which were servers and worked at
four different establishments. This session lasted sixty minutes in length. The third session had
five females and five males, whereas four participants were management employees. This
session lasted thirty five minutes.
The information was then sent via email to the participants after all responses from the
three sessions were compiled. The respondents were asked to add any other factors that they felt
would be of value or any factors that were not discussed during the focus group meetings but
were not included in the compiled list. The revised list was collected one week later. The list
was emailed to all participants asking them to again refine the list by adding any factors missed
or what could be added. All the participants responded within two weeks. The entire process
was repeated and yielded more results. The mode of questioning used in the process was the
Delphi Technique, defined as a small group of experts selected from a particular industry who
make responses. Responses given are then compiled and repeated (Kaynak, Boom, & Leibold,

23
1994).
The resulting survey instrument consisted of eleven general questions about demographics.
In addition to the demographic questions, the survey included 32 statements about the holding of
food, personal hygiene, and equipment. Participants were asked to evaluate these statements on
a 5-point scale on how much they agreed with the statement and also were asked to rate
statements on the frequency that they occurred in their area. The survey instrument used in the
research is available in Appendix II.
Pilot Study
Following the development of the initial survey instrument, and to minimize ambiguity of
the survey instrument, a pilot study was used. The instrument was administered to banquet and
catering servers in the Lee County area of Alabama. It was administered to 50 participants in the
area who have several years of employment in the catering sector and did not participate in the
focus groups. These employees were chosen at random. Feedback and comments were received
about relevance and clarity of the survey questions. The participants were timed while
completing the survey, which took on average 10 minutes to complete. The instrument was then
revised according to select comments and feedback from the participants.
Non-Response Bias
Primary data used in this study was collected through both Internet and printed formats.
There were no seen marked response variations between the two methods. The format used for
both methods was exactly the same as seen on the Internet and in the handout version of the
survey. A common method to assess non-response bias is to compare characteristics between

24
early respondents and late respondents. If no significant differences are found then the survey
results are likely to be more general to the population. The sample in this study was split between
those that answered before the reminder emails and those that answered after the final reminder
email. Handout surveys were split between those that were answered during the time of the
reminder emails being sent out and after they were sent. Analysis was used to compare group
means from food handling, equipment, and personal hygiene, using an independent samples t-
test. No significant differences were found between the groups. This offers support and a
general sense of confidence in the findings of this study.
Furthermore, data collected was also checked for normality of distribution, which met all
standards. Visual and statistical test (i.e., kolmogorov-Smirnov) indicated that there were no
significant differences between the different groups of one variable. However, due to the notable
difference in the number of management and non-management participants, a random sample of
the management group was generated by SPSS random number generation function, which
showed no significant differences in the results.
Ethical considerations
The instrument used in the study was constructed to meet standards required for conducting
human research. The researcher is CITI trained and certified. The Internal Review Board of
Auburn University reviewed the study prior to administration. All ethical considerations were
met and have been approved for conducting research.
Data Analysis
Using the Windows version of SPSS 18.0, Statistical Package for Social Sciences, each

25
section of the survey (i.e., Equipment, Personal Hygiene, and Food Handling ) were compared
along the variables of gender, managerial position, previous training, and employment status.
Independent samples t-tests were employed for this purpose. One- way ANOVA tests were
performed to examine any group differences construed with regards to the main dimensions
(Equipment, Personal Hygiene, and Food Handling) between the different age groups of
participants as well as the range of experience that participants have. Additional analyses utilized
several descriptive statistics.
Summary
This chapter discussed the research methods employed in this study. The process of
developing the survey instrument was discussed. The statistical analysis procedures were also
reviewed.

26
Chapter 4 Results
This chapter presents the results obtained in the study. It will be divided into three
sections. The first section will include results from the survey respondents in the areas of food
handling, equipment, and personal hygiene of t-tests to show differences in the areas of gender,
training, management, and employment status. Section two will show the results concerning
amount of experience and age using an ANOVA test to pinpoint significant differences. Section
three is a summary of all the results found.
Overall Results
Overall this study found that the lack of training of employees greatly affects their skills
needed to perform their job with respect to food safety regulations (t=6.936, p<.000). Taking
into account that management tended to have certification and knowledge about correct food
safety; the food handlers and servers that are those who most often are actually coming into
contact with the food also need training to succeed. The study revealed a lack of training
especially in the sections concerning use of equipment, personal hygiene, and food handling for
non-management personnel. The study found that experience and employment status are linked
to an employee’s knowledge and frequencies in performing tasks associated with personal
hygiene, equipment, and food handling. Information from the study shows that many times
management feels that proper procedures are performed more often than non-managerial
employees. The study reveals a clear gap between these groups regarding their opinions of
whether or not correct safety measures are taking place.

27
Food Handling
The results in Table 3 shows one significant difference between male and female
respondents with regard to the items related to food handling (t=-2.530, p<.012). Information
gathered from Table 3 relates some statistically significant differences in food handling with
regards to whether respondents were managers or non-managers. The agreed responses were
higher for managers in all questions regarding food handling when compared to the non-
managerial responses. There were significant differences noted in all questions including: 13,
(t=2.542, p<.012), 15 (t=3.927, p<.000), and 16 (t=3.966, p<.000). One noticeable difference
was found in Question 15, which asks about items being covered and labeled properly. The
responses from managers were significantly higher than what servers and other non- managerial
employees thought. Management feels that their establishment understands and knows proper
guidelines more so than what is shown by the results. Other significant findings were in
questions 11 (t=.5.147, p<.000), 12 (t= 5.051, p<.000, and 14 (t=2.650, p<.009.
Statistically significant differences were found when comparing the responses of
employees who have had training as opposed to those who have not had training in all questions.
Those who have had training agree that food is kept safe during transportation while those who
do not have training responded that the food is not kept safe (t=6.936, p<.000). A difference in
response was also noted between these two groups when questioned about the way cold food
items are monitored. Trained employees remarked that food is monitored and those who are not
trained disagreed significantly (t=6.797, p<.000). Survey question 13 which asks if employees
feel checking food temperature prevents food borne illness, shows a significant difference
between those trained and not trained (t=4.625, p<.000). Those who are not trained are more
likely not to agree.

28
There were also several differences found when comparing the groups who work part-
time and those that work full-time. Full-time workers were more likely to agree that food was
kept safe during transportation (t=-5.194, p<.000) and also that cold food items are monitored
correctly. Full-time employees were also more likely to agree that food stored in other locations
is covered and labeled properly (t=-4.236, p<.000). Perhaps the differences in the responses may
be due to the fact that full-time employees have had more time on the job and have learned from
their extra experiences.
Table 3: t-test Analysis on Food Handling Knowledge
Item Mean S.D t-Value Sig
Male 3.84 .856 Gender
Female 3.78 .924
.484
.629
Yes 4.39 .774 Management No 3.68 .865
5.147
.000
Yes 4.39 .826 Training
No 3.59 .815
6.936
.000
Part-time 3.58 .882
In my area, food is kept safe during
transportation to off-site events.
Status
Full-time 4.15 .792
-5.194
.000
Male 3.16 1.143 Gender
Female 2.92 1.181
1.636
.103
Yes 3.78 1.228 Management
No 2.87 1.088
5.051
.000
Yes 3.78 1.199 Training
No 2.75 1.026
6.797
.000
Part-time 2.69 1.008
I feel that in my area cold food items are
properly monitored for temperature.
Status
Full-time 3.51 1.197
-5.910
.000
Male 4.35 1.020 Gender
Female 4.48 .884
-1.079
.281
Yes 4.74 .681 Management
No 4.35 .989
2.542
.012
Yes 4.86 .355 Training
No 4.26 1.049
4.625
.000
Part-time 4.28 .1.084
I feel checking food temperature can
prevent food borne illness.
Status
Full-time 4.64 .626
-3.062
.002
Male 3.75 1.154 Gender
Female 4.36 2.577
2.530
.012
Yes 4.46 .690 Management
No 3.98 2.227
2.650
.009
Yes 4.59 .577 Training No 3.87 2.340
2.536
.000
Part-time 3.97 2.536
I ensure chafers are properly lit and
functioning before food is placed in
them.
Status
Full-time 4.29 .841
-1.224
.006

29
Male 2.65 1.272 Gender
Female 2.39 1.308
1.586
.114
Yes 3.17 1.495 Management
No 2.37 1.202
3.927
.000
Yes 3.03 1.350 Training
No 2.32 1.223
3.983
.000
Part-time 2.34 1.166
I ensure cold food items are always
placed on ice to keep temperature
correct.
Status
Full-time 2.73 1.435
-2.400
.017
Male 3.68 1.062 Gender
Female 3.49 1.091
1.362
.2175
Yes 4.13 .957 Management
No 3.46 1.069
3.966
.000
Yes 3.88 1.105 Training
No 3.47 1.051
2.817
.005
Part-time 3.35 1.078
I often ensure in the back of the house
backup items for buffets are labeled and
covered properly.
Status Full-time 3.92 .997
-4.236
.000
As indicated in Table 4, there were distinct differences found between the age group of
individuals younger than 20 compared to the age group of 30 and 40. A key difference was
found in post hoc tests for survey question 13. Question 13 discusses if checking the
temperature of food will prevent food borne illnesses. Results show that the older age groups
agree with this statement more so than younger employees (F=4.769, p<.000). The difference in
judgment may be explained in that the older workers have had more training that the younger
workers and have had more on the job experience. Question 16 which discusses if backup items
of food are properly labeled and covered revealed a disparity in response from the two age
groups as well. The older age group feels that these food items are more likely to be covered and
labeled properly more so than the younger group. The older group may make this judgment
again because of their extended experience and training.

30
Table 4: ANOVA Analysis of Age and Food Handling Knowledge
Item Mean Sum of
Squares
d.f. Mean
Square
F
p-
value
Between
Groups
8.580 5 1.716
In my area, food is
kept safe during
transportation to off-
site events.
Younger
than 20
20-29
30-39
40-49
50-59
60 or
over
3.44
3.79
4.12
3.96
4.25
4.00
Within
Groups
193.004 249 .775
2.214 .053
Between
Groups
15.500 5 3.100
I feel that in my area
cold food items are
properly monitored
for temperature.
Younger
than 20
20-29
30-39
40-49 50-59
60 or
over
2.91
2.95
3.48
3.42 2.00
2.83
3.03
Within
Groups
330.249 249 1.326
2.337 .043
Between
Groups
20.108 5 4.022
I feel checking food
temperature can
prevent food borne
illness.
Younger
than 20
20-29
30-39
40-49
50-59
60 or
over
3.93
4.35
4.72
4.89
5.00
5.00
Within
Groups
209.994 249 .843
4.769 .000
Between
Groups
59.371 5 11.874
I ensure chafers are
properly lit and
functioning before
food is placed in
them.
Younger
than 20
20-29 30-39
40-49
50-59
60 or
over
2.87
3.99 4.28
4.61
4.25
4.83
Within
Groups
1002.496 249 4.026
2.949 .013
Between
Groups
17.414 5 3.483
I ensure cold food
items are always
placed on ice to keep
temperature correct.
Younger
than 20
20-29
30-39
40-49
50-59
60 or
over
2.13
2.50
2.48
2.79
2.50
3.83
Within
Groups
408.288 249 1.640
2.124 .063
Between
Groups
35.798 5 7.160 I often ensure in the
back of the house
backup items for
buffets are labeled
and covered
properly.
Younger
than 20 20-29
30-39
40-49
50-59
60 or
over
3.00
3.46
3.92
4.25
4.25
4.50
Within Groups
260.304 249 1.045
6.849 .000

31
Table 5: Tukey Post Hoc Test of Age and Food Handling Knowledge
Mean Difference
Standard Error
Significance
In my area, food is kept
safe during
transportation to off-site
events.
Younger than 20 years 20-29 years 30-39 years 40-49 years 50-59 years
60 & over
-.35000 -.68250 -.52679 -.81250
-.56250
.17049
.23500
.22783
.46691
.39167
.316
.046
.193
.507
.705
I feel that in my area cold
food items are properly
monitored for
temperature.
Younger than 20 years 20-29 years 30-39 years 40-49 years 50-59 years 60 & over
-.04375 -.57375 -.52232 .90625 .07292
.22302 .30741 .29802 .61076 .51234
1.00 .425 .498 .675 1.00
I feel checking food
temperature can prevent
food borne illness.
Younger than 20 years 20-29 years 30-39 years 40-49 years 50-59 years 60 & over
-.41250 -.78250 -.95536
-1.06250 -1.06250
.17784
.24513
.23764
.48702
.40855
.190
.020
.001
.250
.101
I ensure chafers are
properly lit and
functioning before food is
placed in them.
Younger than 20 years 20-29 years 30-39 years 40-49 years 50-59 years 60 & over
-1.1875 -1.40500 -1.73214 -1.37500 -1.95833
.25442
.35069
.33998
.69675
.58448
.000
.001
.000
.361
.012
I ensure cold food items
are always placed on ice
to keep temperature
correct.
Younger than 20 years 20-29 years 30-39 years 40-49 years
50-59 years 60 & over
-.37500 -.35500 -.66071
-.37500 -1.70833
.24797
.34180
.33136
.67909
.56967
.657
.904
.349
.994
.305

32
I often ensure in the back
of the house backup items
for buffets are labeled and
covered properly.
Younger than 20 years 20-29 years 30-39 years 40-49 years 50-59 years 60 & over
-.46875 -.92000
-1.25000 -1.25000 -1.50000
.19757 .27233 .26401 .54107 .45388
.170 .011 .000 .194 .014
A section of the survey asked questions concerned with how often these tasks are
performed while working. Table 6 below presents the results. One significant difference was
seen in question 20, which asks how often food is maintained about 141 degrees F (t=-3.131,
p<.002). Food that is not properly monitored and placed in cold chafers may not allow the
temperature of the food to stay above 141 degrees F. There is a higher chance that food safety
can be compromised if proper temperatures are not maintained. Question 17 revealed that
managers feel that items are monitored appropriately more so than non-management employees
(t=3.992, p<.000). One explanation for this difference is that managers of their own
establishment are more likely to feel their establishment is doing everything correctly. Non-
management employees may be more aware of what happens on a daily basis and may come into
more direct contact with the food handling in order to make their judgment. The survey pointed
out that servers without training stated that they mixed fresh food with food that had been sitting
out more so than servers who had received training (t=-3.394, p<.001). Overall the findings in
this section show that management stated that proper procedures are being implemented while
non-management employees generally disagree that this is happening. Also with all questions
training was found to be significant factor. Those who have had training answered that they were
performing correct behaviors and feel that these issues are all important. Table 4 shows a clear
gap between management and non-management with respect to the concept of maintaining

33
correct food temperature. Management believes that food is always maintained above the proper
temperature of 141 degrees F while non-management, the group working directly with the food
does not believe this is true (t=4.320, p>.000). Management knows what the proper temperature
should be but they may be depending on the non-management staff to follow through on this
critical point. Temperature monitoring may be overlooked as one group is depending on the
other to check it. Another reason is due to the high stress nature of catering. Food might be set
out in a hurry and stenos are not lit within the proper time period thereby not keeping the food
hot enough. There are many instances where setting up can be rushed however, the temperature
setting of the food must be monitored and maintained.

34
Table 6: t-test Analysis on Food Handling Frequencies
Frequency of: Mean S.D t-Value Sig
Male 2.82 1.164 Gender
Female 2.56 1.144
1.820 .070
Yes 3.28 1.205 Management
No 2.55 1.109
3.992 .000
Yes 3.32 1.157 Training
No 2.45 1.070
5.657 .000
Part-time 2.40 1.103
Monitoring of
temperature of cold food
Status
Full-time 3.05 1.108
-4.546 .000
Male 3.92 .896 Gender
Female 3.82 1.093
.783 .435
Yes 4.33 .871 Management
No 3.77 1.004
3.507 .001
Yes 4.20 .850 Training
No 3.74 1.028
3.325 .001
Part-time 3.58 .989
Removal of food that has
been out for too long
Status
Full-time 4.28 .885
-5.695 .000
Male 2.88 1.244 Gender
Female 2.88 1.243
-.017 .986
Yes 2.37 1.218 Management
No 2.99 1.221
-3.124 .000
Yes 1.99 1.157 Training
No 3.21 1.102
-7.773 .000
Part-time 2.96 1.296
Food placed in chafers
before checked and lit
Status
Full-time 2.71 1.125
1.564 .119
Male 4.05 1.003 Gender
Female 4.62 2.040
-3.131 .002
Yes 5.33 3.253 Management
No 4.13 .881
4.320 .000
Yes 4.99 2.682 Training
No 4.11 .941
3.874 .000
Part-time 4.05 .878
Hot food temperature
above 141degrees F
Status
Full-time 4.84 2.288
-4.541 .000
Male 2.64 1.312 Gender
Female 2.65 1.200
-.094 .925
Yes 3.57 1.167 Management
No 2.44 1.180
5.840 .000
Yes 3.62 1.152 Training
No 2.28 1.085
8.603 .000
Part-time 2.42 1.241
Temperature is
monitored in the back
ups of food
Status
Full-time 2.99 1.170
-3.632 .000
Male 2.02 1.230 Gender
Female 1.88 .921
1.070 .285
Yes 1.48 .863 Management
No 2.05 1.097
-3.329 .000
Yes 1.58 .755 Training
No 2.09 1.150
-3.394 .001
Part-time 1.99 .986
Fresh food is mixed with
food that has been out
Status
Full-time 1.80 1.096
1.394 .165
35
A significant gap is indicated on Table 7 with reference to those having training as
opposed to those who do not have training when asked about mixing food that has been out and
added to fresh food (F=4.762, p<.000). Trained individuals know that mixing these foods
together would be a food safety issue. The non-trained individual may try to save time in a busy
period. They may not know the ramifications of mixing these foods together and how this could
lead to cross-contamination or other safety concerns. The disparity in this response shows the
importance of training everyone who will be handling the food.
Overall this section found that the younger servers lack knowledge concerning basic food
safety practices. This could be due to their educational background and their maturity level.
Younger employees may not take their position in this work area as serious as the older
employee. Older age groups are more likely to have catering as their career of choice and may
take greater pride in their work. The older age groups tend to have more experience and know
more basic knowledge about catering. The lack of knowledge demonstrated by the younger age
groups shows a need for more training.

36
Table 7: ANOVA Analysis of Age and Food Handling Frequencies
Frequency of: Mean Sum of
Squares
d.f. Mean
Square
F p-
value
Between
Groups
12.608 5 2.522
Monitoring of
temperature of cold food
Younger
than 20
20-29
30-39
40-49
50-59 60 or over
2.68
2.57
2.88
3.21
2.00 2.67
Within
Groups
328.663 249 1.320
1.910 .093
Between Groups
11.266 5 2.253
Removal of food that has
been out for too long
Younger than 20
20-29
30-39
40-49
50-59
60 or over
3.50
3.84
4.00
4.32
3.50
4.00
Within Groups
244.201 249 .981
2.297 .046
Between
Groups
10.737 5 2.147
Food placed in chafers
before checked and lit
Younger
than 20
20-29
30-39
40-49
50-59
60 or over
3.00
2.95
2.84
2.43
3.85
2.16
Within
Groups
380.494 249 1.528
1.405 .223
Between
Groups
30.891 5 6.178
Hot food temperature
above 141degrees F
Younger
than 20 20-29
30-39
40-49
50-59
60 or over
3.50
4.23
4.64
4.75
4.25
4.83
Within Groups
226.983 249 .915
6.750 .000
Between
Groups
32.562 5 6.512
Temperature monitored
in the back of the house
Younger
than 20
20-29
30-39
40-49
50-59
60 or over
2.16
2.58
2.88
3.46
1.75
3.00
Within
Groups
365.673 249 1.469
4.435 .001
Between
Groups
25.864 5 5.173
Fresh food is mixed with
food that has been out
Younger
than 20 20-29
30-39
40-49
50-59
60 or over
2.50
1.98
1.48
1.50
3.00
1.67
Within Groups
270.473 249 1.086
4.762 .000

37
Table 8: Tukey Post Hoc Findings of Age and Food Handling Frequencies
Mean Difference
Standard Error
Significance
Monitoring of
temperature of cold food
Younger than 20 years
20-29 years
30-39 years
40-49 years
50-59 years
60 or over
-.73270
-1.14000
-.82143
.00000
-.5000
.19177
.26434
.25627
.52519
.44057
.996
.989
.486
.869
1.00
Removal of food that has
been out for too long
Younger than 20 years
20-29 years
30-39 years
40-49 years
50-59 years
60 or over
.-.34375
-.50000
-.82143
.00000
-.5000
.19177
.26434
.25627
.52519
.44057
.472
.410
.019
1.00
.866
Food placed in chafers
before checked and lit
Younger than 20 years
20-29 years
30-39 years
40-49 years 50-59 years
60 or over
.04375
.16000
.57143 -.25000
.83333
.23938
.32996
.31989
.65557
.54994
1.00
.997
.476
.999
.655
Hot food temperature
above 141degrees F
Younger than 20 years
20-29 years
30-39 years
40-49 years
50-59 years
60 or over
-.73270
-1.14000
-1.25000
-.75000
-1.33333
.18536
.25537
.24757
.50736
.42561
.001
.000
.000
.678
.024
Temperature monitored
in the back of the house
Younger than 20 years
20-29 years
30-39 years
40-49 years
50-59 years
60 or over
-.41875
-.72375
-1.30804
.40625
-.84375
.23467
.32347
.31359
.64268
.53912
.478
.224
.001
.989
.622
Fresh food is mixed with
food that has been out
Younger than 20 years
20-29 years
.52500
.20183
.101

38
30-39 years
40-49 years
50-59 years
60 or over
1.02000
1.00000
-.50000
.83333
.27820
.26920
.55272
.46366
.004
.003
.945
.469
In Table 9 the results show a statistically significant finding except for question 13 in
Tukey post-hoc testing between employees having less than a year of experience to having over
3 years of experience. Survey question 11 which discuses keeping food secure during
transportation revealed that employees having over 3 years of experience felt that the food was
secure (F=6.422, p<.002). The group having 3 years of experience showed a significant
difference as opposed to the group of only one year of experience. This can be linked back to the
veteran employees learning from all of their experiences and the fact that they have had more
training. The next survey question, which asks about cold food items being monitored for
temperature showed the same difference in response. The group consisting of 3 years of
experience consistently answered correctly more so than the group of one year experience. The
next question, which asks if checking food temperatures can prevent food borne illness, showed
that those of 3 years experience felt the statement to be true. This group marked the statement to
be true with an average of 4.26 of the respondents answering true. Those with one year of
experience answered true with an average of 3.64 responding true. Experienced staff members
would be more likely to answer this way since they have more experience in the industry and
have had more exposure. New employees who have been working less than three years require
training in order to prepare them for these specific safety issues.

39
Table 9: ANOVA Analysis of Experience and Food Handling Knowledge
Item Mean Sum of
Square
s
d.f. Mean
Squa
re
F p-
value
Between Groups
9.776 2 4.888 In my area, food is kept safe
during transportation to off-
site events.
0-1 year 2-3 years
3 years &
over
3.59 3.89
4.00
Within
Groups
191.808 252 .761
6.422 .002
Between
Groups
14.376 2 7.188 I feel that in my area cold
food items are properly
monitored for temperature
0-1 year
2-3 years 3 years &
over
2.78
3.05 3.28
Within
Groups
331.373 252 1.315
5.466 .005
Between
Groups
2.125 2 1.063 I feel checking food
temperature can prevent
food borne illness
0-1 year
2-3 years 3 years &
over
4.33
4.40 4.52 Within
Groups 227.977 252 .905
1.175 .311
Between
Groups
22.009 2 11.00
4 I ensure chafers are properly
lit and functioning before
food is placed in them.
0-1 year
2-3 years 3 years &
over
3.64
4.14 4.26 Within
Groups 464.799 252 1.844
5.966 .003
Between
Groups
23.438 2 11.71
9 I ensure cold food items are
always placed on ice to keep
temperature correct.
0-1 year
2-3 years
3 years & over
2.27
2.20
2.87
Within Groups
402.264 252 1.596
7.341 .001
Between
Groups
19.651 2 9.826 I often ensure in the back of
the house backup items for
buffets are labeled and
covered properly.
0-1 year
2-3 years
3 years & over
3.26
3.80
3.83 Within Groups
274.607 252 1.090
9.017 .000

40
Table 10: Tukey Post Hoc Results of Experience and Food Handling Knowledge
Mean Difference
Standard Error
Significance
In my area, food is kept
safe during
transportation to off-site
events.
0-1years 2-3 years
3 years & over
-.29279
-.41643
.16877
.11768
.194
.001
I feel that in my area
cold food items are
properly monitored for
temperature
0-1years
2-3 years
3 years & over
-.27838
-.51096
.22183
.15468
.422
.003
I feel checking food
temperature can prevent
food borne illness
0-1years
2-3 years
3 years & over
-.07257
-.19593
.18399
.12830
.918
.280
I ensure chafers are
properly lit and
functioning before food
is placed in them.
0-1years
2-3 years
3 years & over
-.49684
-.61566
.26272
.18319
.143
.003
I ensure cold food items
are always placed on ice
to keep temperature
correct.
0-1years
2-3 years
3 years & over
.07434
-.59482
.24441
.18319
.950
.003
I often ensure in the
back of the house
backup items for buffets
are labeled and covered
properly.
0-1years
2-3 years 3 years & over
-.53451 -.59482
.20194
.17043
.023
.002
41
The results of the food handling section with regards to the amount of experience
individuals have in catering are presented in Table 11. Significant findings were determined
when comparing responses from the employees who have worked up to one year as opposed to
those who have worked over 3 years. Survey question 17 which asks if servers feel that cold
food items are monitored for proper temperature showed that those with over 3 years of
experience feel that temperature is monitored more than those who have less experience.
Question 18 which asks if food that has been out too long is removed was answered by servers
with over 3 years of experience as a positive and the average of their responses was 4.03.
Servers with less experience than three years answered positive with a 3.64 average. It was
found that those individuals with less experience answered that temperature is monitored and
food does not sit out too long.
The next question asks if food is placed in chafers when they are lit and ready to hold hot
food. Significant findings were found between all of the age groups (F=7.923 p<.000). In the
catering industry events can be extremely fast paced and things can fall behind quickly. Chafers
may not be prepared and ready for use. The next question asks about how often hot food
temperature is maintained above 141 degrees F. It was found that those with over a year of
experience felt that the temperature was maintained very often. The servers with more
experience will check this more often and continue to maintain the proper temperature because
they know the importance of maintaining the correct temperatures of the food. The new
employees may not know or understand the importance of the proper temperature settings.
There were no significant findings found in the survey question which asked about monitoring
food temperature in the back up of food items. The last question in this section asks about mixing
fresh food with food that had been sitting out. It was found that newer employees were more

42
likely to mix these food items.
Table 11: ANOVA Analysis of Experience and Food Handling Frequencies
Frequency of: Mean Sum of
Squares
d.f. Mean
Square
F p-
value
Between
Groups
21.657 2 10.828 Monitoring of
temperature of cold
food
0-1 year
2-3 years
3 years &
over
2.39
2.57
3.01 Within
Groups
319.614 252 1.268
8.538 .000
Between
Groups
9.890 2 4.945 Removal of food that
has been out for too
long
0-1 year
2-3 years
3 years &
over
3.65
2.43
2.68
Within
Groups
245.577 252 .975
5.074 .007
Between
Groups
23.145 2 11.573
Food placed in chafers
before checked and lit
0-1 year
2-3 years
3 years &
over
3.20
2.43
2.69 Within
Groups
368.086 252 1.461
7.923 .000
Between
Groups
13.785 2 6.892
Hot food temperature
above 141degrees F
0-1 year
2-3 years
3 years &
over
3.99
4.51
4.44 Within
Groups
244.089 252 .972
7.088 .001
Between
Groups
8.625 2 4.313 Temperature
monitored in the back
of the house
0-1 year
2-3 years
3 years &
over
2.47
2.57
2.86 Within
Groups
389.610 252 1.546
2.789 .063
Between
Groups
13.788 2 6.894 Fresh food is mixed
with food that has been
out
0-1 year
2-3 years
3 years & over
2.14
1.43
1.92 Within
Groups
282.549 252 1.121
6.149 .002

43
Table 12: Tukey Post Hoc Findings of Experience and Food Handling Frequencies
Mean Difference
Standard Error
Significance
Monitoring of
temperature of cold food
0-1years
2-3 years
3 years & over
-.17320
-.62046
.21786
.15191
.706
.000
Removal of food that has
been out for too long
0-1years
2-3 years
3 years & over
-.41113
-39137
.19096
.13316
.082
.010
Food placed in chafers
before checked and lit
0-1years
2-3 years
3 years & over
.77497
.52130
.23379
.16303
.003
.004
Hot food temperature
above 141F
0-1years
2-3 years
3 years & over
-.52321
-.44818
.19096
.13331
.018
.003
Temperature monitored
in the back of the house
0-1years
2-3 years
3 years & over
-.10240
-.39079
.24053
.16772
.905
.054
Fresh food is mixed with
food that has been out
0-1years
2-3 years
3 years & over
.71302
.22571
.20484
.14283
.002
.256
Equipment:
The section on Equipment asked respondents about how often proper equipment
procedures were completed and how respondents felt about general use and care of equipment.

44
In regards to management all questions were found to be significant. The two questions that
showed significant differences were: " I believe there is no need to check chafers before an
event” with management answering with an average of 1.39 and non-management answering
with 2.37(t=-5.202, p<.000). The second question: “I feel that ice can be mixed with raw and
cooked foods and be safe for consumption" showed management answering with an average of
1.07 vs. the non-management employees answering with 1.76(t=-3.775, p<.000). Also with
regards to training all questions were found to be significant. Another significant finding was
found between the responses of the trained personnel vs. the non-trained personnel as the trained
group answered with 1.26 on average and the non-trained group answered with a 1.77 (t=-3.183,
p<.002).
Table 13 reveals a strong gender disparity in regards to the food safety issue of whether
or not it is acceptable to mix ice with raw and cooked foods. More of the male food handlers
declare that is acceptable to mix the ice with the raw and cooked foods while the females feel
this practice is incorrect (t=1.966, p<.050). It is a basic fact of food safety to never mix anything
raw with anything that is cooked, especially ice.
Table 13 also shows a major gap in respect to the question concerning mixing raw and
cooked foods with ice. Responses given in Table 13 show a disparity with respect to the
management belief and/or non-management belief in whether or not this is an acceptable
practice. Non-management believes that this is an acceptable practice more so than management
(t=-3.775, p<.000). Another interesting find was that management felt there was no need to
check chafers before an event, while non-management felt it was an important task to complete
(t=-5.202, p<.000) . Management may feel that the servers would check and clean the chafers
when cleaning up after an event and then would be able to identify any issues with the chafers.

45
Proper food safety practices would account that management check that all equipment is working
correctly since the responsibility ultimately rests on them. As seen from the previous section,
there are also major differences with regards to training and/or lack of training. Those who have
received training answered more items correctly than those who have not been trained.
Differences were found between status, management, and training. Once again there
appears to be a gap between employees who have training and those who do not have formal
training. This section shows a difference with equipment use among the responses given by the
part-time group vs. the full-time group of employees along with differences between males and
females.
The analysis shows that employees with full-time status also feel that chafers need to be
checked before events more so than part-time employees (t=5.531, p<.000). Again it can be
emphasized that full-time employees have more experience and know from their training the
correct use of equipment and procedures in contrast to the part-time group.

46
Table 13: t-test Analysis on Equipment
Item Mean S.D t-Value Sig
Male 3.63 1.194 Gender
Female 3.47 1.247
1.028 .305
Yes 3.85 1.210 Management
No 3.48 1.217
1.841 .067
Yes 3.91 1.292 Training
No 3.41 1.170
2.941 .004
Part-time 3.42 1.257
I feel that chafers are
cleaned after each use
in my area.
Status
Full-time 3.73 1.165
-1.968 .050
Male 4.06 .965 Gender
Female 4.18 .936
-1.034 .302
Yes 4.33 .896 Management
No 4.08 .958
1.618 .107
Yes 4.35 .921 Training
No 4.04 .949
2.337 .020
Part-time 4.09 .919
I feel it is important to
ensure glassware is
free of chips.
Status
Full-time 4.22 .955
-1.042 .298
Male 2.16 1.164 Gender
Female 2.23 1.267
-.506 .613
Yes 1.39 .954 Management
No 2.37 1.199
-5.202 .000
Yes 1.52 1.066 Training
No 2.45 1.176
-5.715 .000
Part-time 2.52 1.216
I believe there is no
need to check chafers
before an event.
Status
Full-time 1.70 1.054
5.531 .000
Male 3.28 1.268 Gender
Female 3.55 1.171
-1.769 .078
Yes 3.74 1.290 Management
No 3.35 1.200
1.968 .050
Yes 3.88 1.278 Training
No 3.25 1.159
3.789 .000
Part-time 3.38 1.243
I feel you should only
work with food at an
off-site event when
there is coverage
overhead. Status
Full-time 3.50 1.154
-.778 .437
Male 1.78 1.256 Gender
Female 1.50 1.034
1.966 .050
Yes 1.07 .250 Management
No 1.76 1.234
-3.775 .000
Yes 1.26 .678 Training
No 1.77 1.259
-3.183 .002
Part-time 1.67 1.094
I feel that ice can be
mixed with raw and
cooked foods and be
safe for consumption.
Status
Full-time 1.50 1.154
1.140 .255
Results shown in Table 14 found difference between the separate age groups with regards
to questions concerning equipment. Survey question 35 which asks if chafers are cleaned after

47
each use, shows that there were significant differences (F=4.954, p<.000) from the responses of
the younger than 20 age group compared to the 30 to 40 year old groups. Post hoc tests also
found a gap between the 20 age group and the thirty-year-old group response to question 35. It
was found that the older age groups felt that chafers were cleaned more so than the younger
groups. Question 36 which asks respondents about ensuring glassware is free of chips also
showed gaps in the responses given from the two separate age groups. Post hoc tests show
differences between the younger than 20 group and the 20 to 30 year old age groups. Although
question 37 found a significant difference between the age groups, the post hoc tests did not
show a difference between the two age groups. The differences in opinion with respect to this
question could be attributed to the lack of training of the younger age group and/or the greater
amount of knowledge the older group has gained over their careers in the catering field. The
results show that more attention needs to be focused on the younger employee since they would
probably be the newly hired employee.

48
Table 14: ANOVA Analysis of Age and Equipment Knowledge
Item Mean Sum of
Squares
d.f. Mean
Square
F p-
value
Between
Groups
34.304 5 6.881
I feel that chafers are cleaned
after each use in my area.
Younger
than 20
20-29
30-39
40-49
50-59 60 or over
3.06
3.43
4.40
3.96
3.25 4.00
Within
Groups
344.833 249 1.385
4.954 .000
Between Groups
13.811 5 2.762
I feel it is important to ensure
glassware is free of chips.
Younger than 20
20-29
30-39
40-49
50-59
60 or over
3.66
4.19
4.44
3.96
4.75
3.67
Within Groups
215.420 249 .865
3.193 .008
Between
Groups
20.120 5 4.024
I believe there is no need to
check chafers before an
event.
Younger
than 20
20-29
30-39
40-49
50-59
60 or over
2.65
2.25
1.76
2.03
1.00
1.67
Within
Groups
356.076 249 1.430
2.814 .017
Between
Groups
15.306 5 3.061
I feel you should only work
with food at an off-site event
when there is coverage
overhead.
Younger
than 20 20-29
30-39
40-49
50-59
60 or over
2.90
3.46
3.28
3.64
4.00
4.17
Within Groups
364.796 249 1.465
2.090 .067
Between
Groups
19.448 5 3.890
I feel that ice can be mixed
with raw and cooked foods
and be safe for consumption.
Younger
than 20
20-29
30-39
40-49
50-59
60 or over
2.21
1.62
1.64
3.06
1.14
1.00
1.50
Within
Groups
317.901 249 1.277
3.047 .011

49
Table 15: Tukey Post Hoc Findings of Age and Equipment Knowledge
Mean Difference
Standard Error
Significance
I feel that chafers are
cleaned after each use in
my area.
Younger than 20
20-29 years
30-39 years
40-49 years
50-59 years
60 or over
-.36875
-1.33750
-.90179
-.18750
-.93750
.22789
.31412
.30453
.62410
.52354
.587
.000
.039
1.00
.474
I feel it is important to
ensure glassware is free
of chips.
Younger than 20
20-29 years
30-39 years
40-49 years
50-59 years
60 or over
-.53750
-.24625
.22946
-.55625
.52708
.18012
.20003
.19054
.47084
.38678
.037
.022
.796
.233
1.00
I believe there is no need
to check chafers before
an event.
Younger than 20
20-29 years
30-39 years 40-49 years
50-59 years
60 or over
-1.33750
-.90179 .62054
-.96875
-.98958
.31412
.30453
.30945
.25308
.53200
.000
.039
.952
.002
.429
I feel you should only
work with food at an off-
site event when there is
coverage overhead.
Younger than 20
20-29 years
30-39 years
40-49 years
50-59 years 60 or over
-53750
-.78375
-.73661
-1.09375 -1.026742
.18012
.24828
.31322
.36191
.53848
.037
.022
.178
.530
.184
I feel that ice can be
mixed with raw and
cooked foods and be safe
for consumption.
Younger than 20
20-29 years
30-39 years
40-49 years
50-59 years
-.60000
-.57875
1.07589
1.21875
.21881
.30161
.29239
.59923
.071
.393
.004
.326

50
60 or over .71875 .50268 .709
Table 16 presents the results pertaining to equipment frequencies. Although not
significant, it was found that females on average felt utensils were cleaned and checked and that
hot holding devices were properly functioning more so than the males. It was found that those
who have had training clean utensils after each use more often than those who lack training
(t=5.498, p<.000). Management stated that utensils were cleaned after each use more so that
non-management respondents which was also found to be of significance.

51
Table 16: t-test Analysis on Equipment Frequencies
Frequency of: Gender Mean S.D. t-Value Sig.
Male 4.16 1.023 Cleaning of Utensils
Female 4.25 1.018
-.658 .511
Male 4.09 1.378
Hot holding devices checked for temperature
Female 4.22 1.971
1.376 .170
Male 2.52 1.016
No hand washing facility available
Female 1.70 .991
-.554 .580
Yes 4.63 .799 Management
Cleaning of Utensils No 4.11 1.041
3.160 .002
Yes 3.54 1.425
Hot holding devices checked for temperature
No 2.44 1.709
5.080 .000
Yes 1.70 1.113
No hand washing facility available
No 2.08 .965
-2.385 .018
Yes 4.75 .434 Training
Cleaning of Utensils No 4.01 1.098
5.498 .000
Yes 3.65 2.381
Hot holding devices checked for temperature
No 2.26 1.190
6.776 .000
Yes 2.01 1.022
No hand washing facility available
No 2.01 .997
.026 .979
Part-time 4.16 .939
Cleaning of Utensils
Full-time 4.36 1.045
-1.564 .119
Part-time 2.52 1.907
Hot holding devices checked for temperature
Full-time 2.85 1.374
-2.096 .037
Part-time 2.07 1.001
No hand washing facility available
Full-time 1.93 1.012
1.100 .272

52
Significant differences indicated in Table 17 were found in questions about checking hot
holding devices (F=3.254, p<.007) and addressing hand washing if there is not a hand washing
facility available off-site (F=3.420, p<.005). It was found in post hoc testing that the 30 year old
age group and 40 year old age group did check on the holding devices at times, however the
younger age groups rated this question as checking temperature rarely and/or never. Post-hoc
analyses showed significance for the following age groups: “younger than 20 years”, “20-29
years”, and “30-39 years” at the .05 significance level. The younger age groups answered that
sometimes there is no hand washing facility available for them. The 30 to 40 age group
answered that there is never a hand washing facility available for them at off-site events.
Table 17: ANOVA Analysis of Age and Equipment Frequencies
Frequency of: Mean Sum of
Squares
d.f. Mean
Square
F p-
value
Between
Groups
9.140 5 1.828
Cleaning of Utensils
Younger than 20
20-29 30-39 40-49 50-59 60 or over
3.88
4.24 4.44 4.32 3.25 4.17
Within
Groups
254.844 249 1.023
1.786 .116
Between
Groups
32.554 5 6.511
Hot holding devices
checked for temperature
Younger
than 20 20-29 30-39 40-49 50-59 60 or over
2.44
2.44 3.28 3.07 1.75 3.67
Within
Groups
498.230 249 2.001
3.254 .007
Between
Groups
16.384 5 3.277
No hand washing facility
available
Younger
than 20 20-29 30-39 40-49 50-59 60 or over
2.41
2.05 1.40 1.85 2.50 1.83
Within
Groups
238.581 249 .958
3.420 .005

53
Table 18: Tukey Post Hoc Findings of Age and Equipment Frequencies
Mean Difference
Standard Error
Significance
Cleaning of Utensils
Younger than 20
20-29 years
30-39 years
40-49 years 50-59 years
60 or over
-.36875
-.56500
-.44643 .62500
-.29167
.19591
.27004
.26179
.53652
.45007
.416
.295
.530
.853
.987
Hot holding devices
checked for temperature
Younger than 20
20-29 years
30-39 years
40-49 years
50-59 years
60 or over
.35625
1.00625
.54911
-.09375
.57292
.18955
.26128
.25330
.51912
.43547
.512
.247
.995
.502
.937
No hand washing facility
available
Younger than 20
20-29 years
30-39 years
40-49 years
50-59 years
60 or over
20-29 years
30-39 years
.35625
1.00625
.54911
-.09375
.57292
.65000
.18955
.26128
.25330
.51912
.43547
.21051
.417
.002
.257
1.00
.776
.027
Significant findings were found in Table 19 with regards to employees with over 3 years
of experience with their responses concerning if they feel that chafers are cleaned after each use
(F=5.799, p<.003). The positive response by this group can be attributed to their commitment to
work and their personal standards of professionalism. It is important to have chafers cleaned
because food sitting out on these pieces can breed large amounts of bacteria which in turn can be
passed on to other food when the chafer is used again. The employees with over 3 years of
experience also scored positive with the statement about checking the chafers before the event
(F=3.984, p<.020). This was also found to be significant in the Tukey Post-hoc tests. The buddy

54
system could be utilized by teaming individuals with over 3 years of experience with younger
and less experienced employees in order for the newer individuals to learn important techniques
and procedures. Teaming also helps managers save money on certifying all employees.
Certifying veteran employees who may be staying with a company for extended time is a good
strategy. In addition the veterans who are certified can then help and teach the new employees.
Table 19: ANOVA Analysis of Experience and Equipment Knowledge
Item Mean Sum of
Squares
d.f Mean
Square
F p-
value
Between
Groups
16.680 2 8.340 I feel that chafers are cleaned
after each use in my area.
0-1 years
2-3 years
3 & over
years
3.26
3.68
3.80 Within
Groups
362.457 252 1.438
5.799 .003
Between
Groups
6.320 2 3.160
I feel it is important to ensure
glassware is free of chips.
0-1 years
2-3 years
3 & over
years
4.00
4.49
4.13
Within
Groups
222.911 252 .885
3.573 .030
Between
Groups
11.530 2 5.765 I believe there is no need to
check chafers before an
event.
0-1 years
2-3 years
3 & over
years
2.42
1.82
2.08
Within
Groups
364.666 252 1.447
3.984 .020
Between
Groups
.274 2 .137 I feel you should only work
with food at an off-site event
when there is coverage
overhead.
0-1 years
2-3 years
3 & over years
3.39
3.40
3.46 Within
Groups
379.828 252 1.507
.091 .913
Between
Groups
4.155 2 2.078 I feel that ice can be mixed
with raw and cooked foods
and be safe for consumption.
0-1 years
2-3 years 3 & over
years
1.66
1.31 1.70 Within
Groups 333.194 252 1.322
1.571 .210

55
Table 20: Tukey Post Hoc Results of Experience and Equipment Knowledge
Mean Difference
Standard Error
Significance
I feel that chafers are
cleaned after each use in
my area.
0-1 years
2-3 years 3 years & over
-.42023 -.53825
.23200
.16177
.168
.003
I feel it is important to
ensure glassware is free
of chips.
0-1 years
2-3 years
3 years & over
-.48571
-.13084
.18194
.12687
.022
.558
I believe there is no need
to check chafers before
an event.
0-1 years
2-3 years
3 years & over
.58736
.33182
.23270
.16227
.033
.104
I feel you should only
work with food at an off-
site event when there is
coverage overhead.
0-1 years
2-3 years
3 years & over
-.01062
-.06856
.23749
.16561
.999
.910
I feel that ice can be
mixed with raw and
cooked foods and be safe
for consumption.
0-1 years
2-3 years 3 years & over
.34943 -.03722
.22244
.15511
.260
.969

56
Table 21: ANOVA Analysis of Experience and Equipment Frequencies
Frequency of: Mean Sum of
Squares
d.f. Mean
Square
F p-
value
Between
Groups
7.344 2 3.672
Cleaning of Utensils
0-1 years
2-3 years
3 & over
years
4.02
4.37
4.35 Within
Groups
256.641 252 1.018
3.605 .029
Between
Groups
12.679 2 6.339
Hot holding devices
checked for temperature
0-1 years
2-3 years
3 & over
years
2.38
2.57
2.85
Within
Groups
518.106 252 2.056
3.083 .048
Between
Groups
10.384 2 5.192
No hand washing facility
available
0-1 years
2-3 years
3 & over
years
2.23
1.71
1.88
Within
Groups
244.581 252 .971
5.349 .005
Table: 22 Tukey Post Hoc Findings of Experience and Equipment Frequencies
Mean Difference
Standard Error
Significance
Cleaning of Utensils
0-1 years
2-3 years
3 years & over
-.35373
-.33744
.19522
.13613
.168
.037
Hot holding devices
checked for temperature
0-1 years
2-3 years
3 years & over
-.19090
-.47928
.27737
.19341
.771
.037
No hand washing facility
available
0-1 years
2-3 years 3 years & over
.51580
.35158
.19058
.13289
.020
.023
Personal Hygiene:
With regard to the results from the personal hygiene portion of the survey, there was a
significant difference noted between those employees who worked full time compared to those
who work part-time when asked if they wash their hands from returning from a break (t=-4.458,
p<.000). Perhaps the part-time employees are not following this practice because this position is

57
not their career of choice or they are not concerned about following the strict standards and rules
of the job description. There may not be as much guidance overseeing these individuals or the
guidance may only come in critical times when absolutely necessary. The findings showed no
significant difference that training has an effect on washing hands from returning from a break
(t=.258, p<.796). However, the mean was slightly higher for those who did have training. The
findings also showed that management practices washing their hands more frequently after a
break when compared to non-management (t=2.715, p<.007). The data draws attention to this
critical area of concern and points out that management needs to keep a close eye on employees
with respect to hand washing. Personal hygiene is a major area of concern in the food industry
and proper practices must take place.
Table 23: t-test Analysis of Personal Hygiene Frequencies
Frequency of: Mean S.D. t-Value Sig.
Male 4.33 .922 Gender
Female 4.38 .876
-.427 .670
Yes 4.67 .762 Management
No 4.28 .910
2.715 .007
Yes 4.38 .806 Training
No 4.34 .930
.258 .796
Part-time 4.18 .932
Hand washing when returning from a break.
Status
Full-time 4.66 .697
-4.458
.000
Male 3.16 1.188 Gender
Female 3.20 1.113
-.271 .786
Yes 3.76 1.099 Management
No 3.06 1.121
3.867 .000
Yes 3.58 1.049 Training
No 3.04 1.150
3.422 .001
Part-time 3.05 1.157
Hand washing when touching your face or hair.
Status
Full-time 3.37 1.120
-2.179 .030
Differences in responses based on gender were noted (see Table 23). The male
respondents scored higher than the female respondents with respect to the statement concerning

58
if there is a need to be reminded to wash hands (t=-4.915, p<.000). This was a surprising find as
our society might expect the female to be more conscientious in personal hygiene than males.
It was found that managers feel that servers do need to be reminded to wash their hands
after clearing dirty dishes. This shows that even with training servers still need to be reminded to
properly wash their hands after dealing with dirty dishware. It was also found that non-
managerial workers feel that it is slightly acceptable to eat and drink in the back of the off-site
facility. It is not surprising that management answered that this should never happen. However,
servers do eat and drink in the back of off-site establishments. This is a serious issue and is
against the health code. The non-management respondents felt that jewelry does not affect the
safety of food. Rings and bracelets should not be worn while working with food or when serving
food to others. Management answered on average of 1.59 and non-management answered on
average with a 2.8 on the jewelry question (t=5.881,p<003). Significant findings in regards to
training were seen in several questions. Trained personnel did not agree with the statement about
eating or drinking in the back of the house (t=-3.092, p<.002). Trained employees also agreed
with having a clean uniform (t=5.137, p<.000). Status of employment was seen to be significant
in question 29 and 31, which asked about eating and drinking in the back of the house (t =3.856,
p<.000)and about drying hands on their uniform (t=4.455, p<.000).

59
Table 24: t-test Analysis of Personal Hygiene Knowledge
Item Mean S.D t-
Value Sig
Male 4.2459 .95616 Gender
Female 4.1278 .98791 .968 .334
Yes 4.0870 1.00722 Management
No 4.2057 .96614 -.749 .454
Yes 4.1304 .99872 Training
No 4.2043 .96489 -.538 .591
Part-time
4.1457 .96883
I firmly believe that I should wash my hands every time
I serve food.
Status Full-time
4.2772 .93935
-1.069 .286
Male 3.3361 1.20337 Gender
Female 4.0150 .99989 -4.915 .000
Yes 3.8478 1.36573 Management
No 3.6555 1.09894 1.026 .306
Yes 3.8551 1.12819 Training
No 3.6290 1.15642 1.396 .164
Part-time
3.6159 1.17110
I think there is a need to be reminded after clearing
dirty plates and silverware to wash hands before serving
food again.
Status Full-time
3.8218 1.09905
-1.402 .162
Male 3.7541 1.05479 Gender
Female 3.7820 1.18921 -.197 .844
Yes 3.6957 1.19014 Management
No 3.7847 1.11224 -.485 .628
Yes 3.6812 1.11794 Training
No 3.8011 1.12860 -.756 .451
Part-
time 3.8013 1.18895
I think that the temperature of water should be at least
warm for proper hand washing.
Status Full-time
3.7228 1.04037
.540 .590
Male 4.0246 1.19547 Gender
Female 4.1353 .98305 -.811 .418
Yes 4.0000 1.15470 Management
No 4.1005 1.07616 -.566 .572
Yes 4.0580 .98345 Training
No 4.0914 1.12813 -.217 .828
Part-time
4.0464 1.10356
I think there should always be a hand washing facility
available at off-site events.
Status Full-time
4.1881 1.02677
-1.027 .305
Male 3.2705 1.31134 Gender
Female 3.6767 1.29421 -2.488 ..013
Yes 3.6957 1.22691 Management
No 3.4354 1.33261 1.216 .225
Yes 4.1449 1.12819 Training
No 3.2366 1.29780 5.137 .000
Part-time
3.5695 1.36387
I believe that coming to work in a dirty uniform will
affect food safety.
Status Full-time
3.4158 1.20223
.919 .359
Male 1.6311 .94651 Gender
Female 1.8496 1.33992 -1.492 .137
I feel if I am sick I will not affect a guest’s chance of
becoming ill while I am at work.
Management Yes 1.3696 1.08236 -2.425 .016

60
No 1.8278 1.17629
Yes 1.4783 1.18332 Training
No 1.8441 1.15426 -2.233 .026
Part-time
1.8742 1.25062
Status Full-time
1.5248 1.00592
2.345 .020
Male 2.5328 1.31855 Gender
Female 2.4962 1.32359 .221 .826
Yes 1.5870 1.08681 Management
No 2.7177 1.27917 -5.567 .000
Yes 2.1014 1.31892 Training
No 2.6667 1.28890 -3.092 .002
Part-time
2.7682 1.23528
I feel that eating or drinking in the back of the house
does not affect the safety of food in my area.
Status Full-time
2.1287 1.36867
3.856 .000
Male 3.0820 1.28944 Gender
Female 3.1654 1.07436 -.563 .574
Yes 3.4348 1.22297 Management
No 3.0574 1.16295 1.974 .348
Yes 3.4203 1.15562 Training
No 2.6667 1.28890 2.453 .015
Part-time
3.0662 1.21474
I feel single use gloves should be worn at all times when
preparing food.
Status Full-time
3.642277 1.13913
-1.060 .049
Male 2.0492 .95218 Gender
Female 2.2481 1.12416 -1.518 .130
Yes 1.5870 1.14651 Management
No 2.2775 .98524 -4.174 .511
Yes 1.6667 1.05254 Training
No 2.3333 .99004 -4.696 .000
Part-
time 2.3642 1.04870
I feel it is acceptable if I dry my hands on my uniform
after washing them.
Status Full-time
3.642277 1.13913
4.455 .000
Male 2.5000 1.36212 Gender
Female 2.6767 1.36264 -1.035 .794
Yes 1.5870 1.10707 Management
No 2.8134 1.31508 -5.881 .003
Yes 2.0870 1.35841 Training
No 2.7796 1.31922 -3.695 .512
Part-time
2.8940 1.29693
I don’t believe that jewelry affects the safety of food.
Status Full-time
2.1089 1.32590
4.667 .389
The results of the study pertaining to personal hygiene and age are given in Table 25.
Several significant findings were seen in survey questions 23, 24, 26, 27, 30, 31, and 32.
Question 23 asks if respondents firmly believe they should wash their hands every time they

61
serve food. Post-hoc tests show that major differences occurred between the age groups of the
20 to 30 year old group and also the 30 to 60 and over age group. A difference was seen in
survey question 24 which asks if they feel there is a need to be reminded of hand washing. Post-
hoc tests reveal a notable difference between the younger than 20 group and the 30 year old age
group.
Survey question 26 asks if there needs to be a hand washing facility at off-site events.
Management must provide a hand washing facility at an off-site location in observance of
standard law. The results show that the 30-year-old age group agreed with this statement more
than the 60 and over age group.
Survey question 27 which is about the cleanliness of a uniform also showed a statistically
significant finding (F=3.885, p<.002). This question showed differences between the age groups
of younger than 20 and the 30 to 20-year-old group. The older age groups felt that a dirty
uniform would affect food safety more than the younger than 20 age group. Lack of knowledge
or a lack of professionalism may be why the younger group answered this way. The next
question which refers to the drying of hands on a uniform found that the 60 and older group
disagreed with the statement more than the younger group (F=3.323, p<.006). It is unacceptable
for a server to dry their hands on their uniform. The uniform can contain bacteria which could
be passed through the food. The final question discusses jewelry and food safety. It was found
that the younger than 20 groups differed from the 30, 50, and 60 and older age group. The
younger age group did not feel that jewelry would affect food safety when indeed it does.

62
Table 25: ANOVA Analysis of Age and Personal Hygiene Knowledge
Item Mean Sum of
Squares
d.f. Mean
Square
F p-
value
Between Groups
13.744 5 2.749
I firmly believe that I should wash my
hands every time I serve food.
Younger than 20
20-29 30-39 40-49 50-59 60 or over
4.31
4.08 4.76 4.28 4.00 3.50
Within Groups
226.593 249 .910
3.021 .011
Between
Groups
18.181 5 3.636
I think there is a need to be reminded
after clearing dirty plates and
silverware to wash hands before
serving food again.
Younger
than 20 20-29 30-39 40-49 50-59 60 or over
3.28
3.68 4.24 3.82 4.00 2.83
Within Groups
318.344 249 1.278
2.844 .016
Between Groups
4.519 5 .904
I think that the temperature of water
should be at least warm for proper
hand washing.
Younger than 20 20-29 30-39 40-49 50-59 60 or over
3.81 3.68 4.12 3.82 4.00 3.83
Within Groups
316.830 249 1.272
.710 .616
Between Groups
30.705 5 6.141
I think there should always be a hand
washing facility available at off-site
events.
Younger than 20 20-29 30-39 40-49 50-59 60 or over
3.87 4.01 4.84 4.39 3.75 2.66
Within Groups
460.997 249 1.851
3.317 .006
Between Groups
31.820 5 6.364
I believe that coming to work in a
dirty uniform will affect food safety
Younger than 20 20-29 30-39 40-49 50-59 60 or over
2.71 3.63 3.92 3.21 3.75 2.83
Within Groups
407.850 249 1.638
3.885 .002
Between Groups
11.661 5 2.332
I feel if I am sick I will not affect a
guest’s chance of becoming ill while I
am at work.
Younger than 20 20-29 30-39 40-49 50-59 60 or over
2.15 1.72 1.88 1.39 1.00 1.67
Within Groups
336.771 249 1.352
1.724 .130
Between Groups
8.918 5 1.784
I feel that eating or drinking in the
back of the house does not affect the
safety of food in my area.
Younger than 20 20-29 30-39 40-49 50-59 60 or over
2.53 2.61 2.08 2.50 2.00 2.00
Within Groups
432.784 249 1.783
1.026 .403

63
Between Groups
17.983 5 3.597
I feel single use gloves should be worn
at all times when preparing food.
Younger than 20 20-29 30-39 40-49
50-59 60 or over
2.71 3.23 2.56 3.35
3.50 3.50
Within Groups
336.001 249 1.349
2.665 .023
Between Groups
17.983 5 3.491
I feel it is acceptable if I dry my hands
on my uniform after washing them.
Younger than 20 20-29 30-39 40-49
50-59 60 or over
2.43 2.24 1.96 1.75
2.00 1.00
Within Groups
261.579 249 1.051
3.323 .006
Between Groups
40.462 5 8.092
I don’t believe that jewelry affects the
safety of food.
Younger than 20 20-29 30-39 40-49
50-59 60 or over
3.06 2.71 2.04 2.39
1.00 1.17
Within Groups
431.122 249 1.731
4.674 .000
Table 26: Tukey Post Hoc Findings of Age and Personal Hygiene Knowledge
Mean Difference
Standard Error
Significance
I firmly believe that I
should wash my hands
every time I serve food.
Younger than 20 20-29 years 30-39 years 40-49 years 50-59 years 60 or over
-.23125 -.44750 .02679 .31250 .81250
.18473 .25463 .24686 .50591 .42439
.811 .495 1.00 .990 .396
I think there is a need to be
reminded after clearing
dirty plates and silverware
to wash hands before
serving food again.
Younger than 20 20-29 years
30-39 years 40-49 years 50-59 years 60 or over
-.40625
-.95875 -.54018 -.71875 .44792
.21896
.30182
.29260
.59965
.50303
.432
.021
.438
.837
.949
I think that the
temperature of water
should be at least warm for
proper hand washing.
Younger than 20 20-29 years 30-39 years 40-49 years 50-59 years 60 or over
.12500 -.30750 -.00893 -.18750 -.02083
.21844
.30110
.29190
.59822
.50183
.993
.991 1.00 1.00 1.00
I think there should always

64
be a hand washing facility
available at off-site events.
Younger than 20 20-29 years 30-39 years
40-49 years 50-59 years 60 or over
-.13750 -.96500
-.51786 .12500
1.20833
20150 .27775
.26926
.55183
.46291
.984 .008
.390 1.00 .099
I believe that coming to
work in a dirty uniform
will affect food safety
Younger than 20
20-29 years 30-39 years 40-49 years 50-59 years 60 or over
-.91250 -1.20125 -.49554
-1.03125 -.41158
.24784
.34162
.33119
.34162
.56937
.004
.007
.667
.652 1.00
I feel if I am sick I will not
affect a guest’s chance of
becoming ill while I am at
work.
Younger than 20 20-29 years 30-39 years 40-49 years 50-59 years 60 or over
.43125 .27625 .76339
1.15625 .48958
.22521 .31043 .30095 .61676 .51738
.395 .949 .118 .420 934
I feel that eating or
drinking in the back of the
house does not affect the
safety of food in my area
Younger than 20 20-29 years 30-39 years
40-49 years 50-59 years 60 or over
-.08125 .45125
.03125
.53125
.53125
.25530 .35191
.34116
.69917
.58651
1.00 .795
1.00 .974 .945
I feel single use gloves
should be worn at all times
when preparing food.
Younger than 20 20-29 years
30-39 years 40-49 years 50-59 years 60 or over
-.51250
.15875 -.63839 -.78125 -.78125
.22495
.31007
.30060
.61650
.51679
.207
.996
.278
.802
.657
I feel it is acceptable if I dry
my hands on my uniform
after washing them.
Younger than 20 20-29 years 30-39 years 40-49 years 50-59 years 60 or over
.19375 .47750 .68750 .43750
1.43750
.19848 .27359 .26523 .54356 .45598
.925 .503 .103 .996 .022
I don’t believe that jewelry
affects the safety of food.
Younger than 20 20-29 years 30-39 years 40-49 years 50-59 years
.35000 1.02250 .66964
2.06250
.25481
.35123
.34050
.69783
.743
.045
.365
.040

65
60 or over 1.89583 .58538 .017
It was found from Table 27 that the younger than 20 age group answered that they
sometimes wash their hands when returning back to work (F=4.584, p<.001). The older age
groups responded that they wash their hands very often. The differences found between these
two age groups with response to hand washing frequency maybe a result of immaturity or a
perception that hand washing is not that important. Again proper training is critical to make all
employees conscious of proper hygiene.
Table 27: ANOVA Analysis of Age and Personal Hygiene Frequencies
Frequency of: Mean Sum of
Squares
d.f. Mean
Square
F p-
value
Between
Groups
17.216 5 3.443
Hand washing when
returning from a break.
Younger
than 20
20-29
30-39 40-49
50-59
60 or over
3.72
4.42
4.60 4.57
4.25
4.00
Within
Groups
187.020 249 .751
4.584 .001
Between
Groups
19.378 5 2.333
Hand washing after
touching face or Hair
Younger
than 20
20-29
30-39
40-49
50-59
60 or over
2.88
3.20
3.52
3.25
3.75
2.33
Within
Groups
165.786 249 1.296
1.800 .113
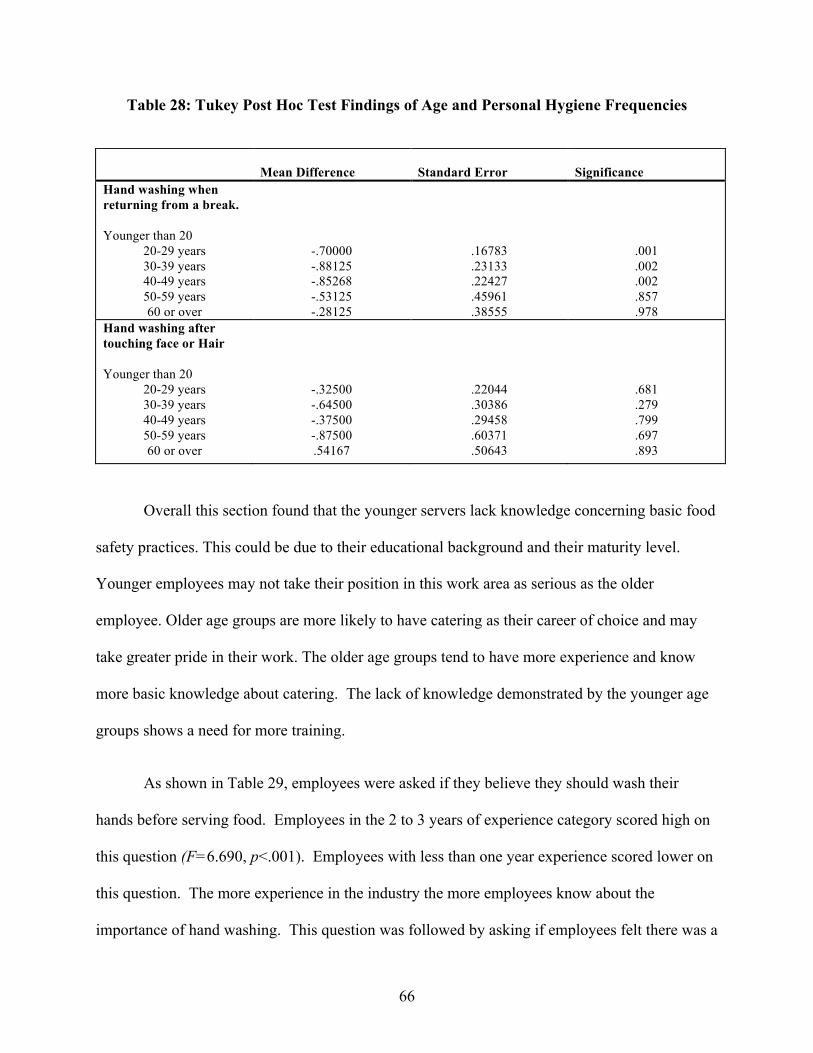
66
Table 28: Tukey Post Hoc Test Findings of Age and Personal Hygiene Frequencies
Mean Difference
Standard Error
Significance
Hand washing when
returning from a break.
Younger than 20
20-29 years
30-39 years 40-49 years
50-59 years
60 or over
-.70000
-.88125 -.85268
-.53125
-.28125
.16783
.23133
.22427
.45961
.38555
.001
.002
.002
.857
.978
Hand washing after
touching face or Hair
Younger than 20
20-29 years
30-39 years
40-49 years
50-59 years
60 or over
-.32500
-.64500
-.37500
-.87500
.54167
.22044
.30386
.29458
.60371
.50643
.681
.279
.799
.697
.893
Overall this section found that the younger servers lack knowledge concerning basic food
safety practices. This could be due to their educational background and their maturity level.
Younger employees may not take their position in this work area as serious as the older
employee. Older age groups are more likely to have catering as their career of choice and may
take greater pride in their work. The older age groups tend to have more experience and know
more basic knowledge about catering. The lack of knowledge demonstrated by the younger age
groups shows a need for more training.
As shown in Table 29, employees were asked if they believe they should wash their
hands before serving food. Employees in the 2 to 3 years of experience category scored high on
this question (F=6.690, p<.001). Employees with less than one year experience scored lower on
this question. The more experience in the industry the more employees know about the
importance of hand washing. This question was followed by asking if employees felt there was a

67
need to be reminded to have their hands washed. Employees in the 2 to 3 year range scored
higher (F=11.406, p<.000). Employees may forget to wash their hands and need constant
reminders. Employees may become so busy that they purposely do not follow through on correct
procedures.
Table 29: ANOVA Analysis of Experience and Personal Hygiene Knowledge
Item Mean Sum of
Squares
d.f. Mean
Square
F p-
value
Between Groups
12.117 2 6.058 I firmly believe that I should wash
my hands every time I serve food.
0-2 years 2-3 years
3 & over years
4.04 4.71
4.16 Within Groups
228.221 252 .906
6.690 .001
Between Groups
27.934 2 13.967 I think there is a need to be
reminded after clearing dirty plates
and silverware to wash hands before
serving food again.
0-1 years 2-3 years 3 & over
years
3.35 4.58 3.85 Within
Groups 308.591 252 1.225
11.406 .000
Between Groups
6.947 2 3.473 I think that the temperature of water
should be at least warm for proper
hand washing.
0-1 years 2-3 years 3 & over years
3.58 3.94 3.90 Within
Groups 314.402 252 1.248
2.784 .064
Between Groups
4.900 2 2.450 I think there should always be a
hand washing facility available at
off-site events.
0-1 years 2-3 years 3 & over years
3.95 4.37 4.12 Within
Groups 296.371 252 1.176
2.083 .127
Between
Groups
9.757 2 4.879 I believe that coming to work in a
dirty uniform will affect food safety
0-1 years
2-3 years 3 & over years
3.38
3.97 3.42 Within
Groups 429.913 252 1.706
2.860 .059
Between Groups
1.448 2 .724 I feel if I am sick I will not affect a
guest’s chance of becoming ill while I
am at work.
0-1 years 2-3 years 3 & over years
1.66 1.86 1.79 Within
Groups
346.984 252 1.377
.526 .592
Between Groups
1.172 2 .586 I feel that eating or drinking in the
back of the house does not affect the
safety of food in my area.
0-1 years 2-3 years 3 & over years
2.58 2.37 2.50
Within Groups
440.530 252 1.748
.335 .715
Between Groups
1.896 2 .948 I feel single use gloves should be
worn at all times when preparing
food.
0-1 years 2-3 years 3 & over years
3.10 2.94 3.21 Within
Groups 352.088 252 1.397
.679 .508
Between Groups
12.998 2 6.499 I feel it is acceptable if I dry my
hands on my uniform after washing
them.
0-1 years 2-3 years
3 & over years
2.35 2.31
1.88 Within Groups
266.038 252 1.056
6.156 .002
Between Groups
25.094 2 12.547 I don’t believe that jewelry affects
the safety of food. 0-1 years 2-3 years 3 & over years
2.92 2.11 2.39 Within
Groups
446.491 252 1.772
7.081 .001

68
Table 30: Tukey Post Hoc Test Findings of Experience and Personal Hygiene Knowledge
Mean Difference
Standard Error Significance
I firmly believe that I
should wash my hands
every time I serve food.
0-1 years
2-3 years 3 years and over
.67004
.55541
.18409
.18531
.001
.008
I think there is a need
to be reminded after
clearing dirty plates
and silverware to wash
hands before serving
food again.
0-1 years
2-3 years 3 years and over
-.93173 -.49648
.21407
.14927
.000
.003
I think that the
temperature of water
should be at least
warm for proper hand
washing.
0-1 years
2-3 years
3 years and over
-.35879
-.32247
.21607
.15067
.223
.084
I think there should
always be a hand
washing facility
available at off-site
events.
0-1 years
2-3 years
3 years and over
-.41568
-.16574
.20979
.14638
.119
.495
I believe that coming to
work in a dirty
uniform will affect
food safety
0-1 years
2-3 years
3 years and over
-.58205
-.03118
.25267
.17619
.057
.983
I feel if I am sick I will
not affect a guest’s
chance of becoming ill
while I am at work.
0-1 years
2-3 years
3 years and over
-.19343
-.13068
.22699
.15828
.671
.688

69
I feel that eating or
drinking in the back of
the house does not
affect the safety of food
in my area.
0-1 years 2-3 years
3 years and over
.20379
.07989
.25577
.17835
.705
.895
I feel single use gloves
should be worn at all
times when preparing
food.
0-1 years
2-3 years
3 years and over
.16334
-.09941
.22866
.15944
.755
.807
I feel it is acceptable if
I dry my hands on my
uniform after washing
them.
0-1 years
2-3 years 3 years and over
.03970
.46613
.19876
.13860
.978 .003
I don’t believe that
jewelry affects the
safety of food.
0-1 years
2-3 years
3 years and over
.81492
.53668
.25749
.17955
.005
.009
Table 31: ANOVA Analysis of Experience and Personal Hygiene Frequencies
Frequency of: Mean Sum of
Squares
d.f Mean
Square
F p-
value
Between
Groups
1.826 2 .913 Hand washing from
returning from a break
0-3 years
2-3 years
3 & over
years
4.28
4.54
4.36 Within
Groups
202.409 252 .803
1.137 .322
Between
Groups
13.798 2 6.899
Hand washing after
touching face or hair
0-1 years
2-3 years
3 & over
years
2.96
3.63
3.28 Within
Groups
320.539 252 1.272
5.424 .005

70
Table 32: Tukey Post Hoc Test Findings of Experience and Personal Hygiene Frequencies
Mean Difference
Standard Error Significance
Hand washing from
returning from a break
0-1 years
2-3 years 3 years and over
-.25967 -.08130
.17337
.12089
.294
.780
Hand washing after
touching face or hair
0-1 years 2-3 years
3 years and over
-.67282
-.32462
.21017
.15213
.006
.085
Summary
This chapter presented the statistical findings found in this research. Independent sample
t-tests were conducted to measure differences between these sections and find differences
between gender, training, management, and employment status. The next chapter will provide a
discussion of the findings and present implications for the industry and recommendations for
future research.

71
Chapter 5 Discussion, Conclusions and Implications
This chapter includes three sections: a discussion of the results of the study, conclusions
with a review of the significance of the study, and the implications of the study. The limitations
of the study and directions for future research in such areas of proper food handling, equipment
use, and personal hygiene issues will be offered.
Discussion of the Results
This study poses agreement to Griffith’s et al. (2010) study concerning food safety
culture. An individual’s age and amount of experience relates to their knowledge in performing
certain safety practices. The present study also agrees with the findings of Yiannas (2009) in
that management must be more vocal and strive to create a positive culture. This study found
that management tends to have more training in food safety than non-management personnel.
The lack of training for non-management personnel can pose a tremendous detriment to a
catering group since these individuals come into direct contact with the food presented to the
consumer. In order to ensure that food safety practices are in place and that they are being
adhered to, management must take a leadership role in providing training regiments to all
members of its staff. The benefits of training are consistent in this study. Many of the positive
responses in the survey were directly related to the amount of training and/or experience that the
respondent possessed. Therefore, training must be given to all individuals, including part-time
and seasonal help.
Management can implement innovative practices to train their employees. In order to

72
keep costs down the “buddy system” of pairing experienced staff members with less experienced
individuals or even better pairing certified employees with non-certified employees can be
utilized. If management focuses on the goal of training its employees and continues to monitor
their dedication to following the food safety practices they will succeed in developing a positive
food safety culture. Reinforcement of proper practices and modeling these practices will also
help to develop a positive culture. In addition, management can find ways to reward successful
behaviors. A positive work environment can breed more positives and ultimately develop into
not only a positive culture but a safe food culture.
This study shows that there is a remarkable gap in knowledge about safe practices in food
handling and equipment use especially for the non-trained food servers. As identified in
previous studies of Nummer et al. (2009), Clayton and Griffith (2002), and Hertzman & Barrash
(2007), there is a definite lack of training for employees in the catering segment of the food
service industry. This study parallels the findings as Nummer et al. (2009) in that the catering
management employees did have training while the servers and other front-line employees did
not have training. In this study it was found that 27.1% of the respondents had some previous
food safety training, which included all of the 18% management positions that participated in the
study. An overwhelming 72.9% of the respondents surveyed did not have any type of previous
food safety training. It is quite astonishing to note that these individuals are working in a high
risk environment without proper training. The catering industry should be put on alert and take
notice of this sobering discovery.
This study also gathered similar findings with respect to hand washing practices as did
Clayton and Griffith’s (2008) study. This study confirms that it is extremely important to target
all members of the work force to improve proper hand washing practices and to be consistent in

73
completing this task. The study also confirms that food handlers and servers without previous
training will not necessarily change their behavior and attitude and thereby may not practice
consistent hand washing hygiene. The study points out that most servers and food handlers do
not have previous training and without any type of training no one can assume that their behavior
and/or attitude will improve. Clayton and Griffith (2008) determined that personal hygiene can
be influenced by social pressures. This study found that individuals with more catering
experience, those that are older, those that are full-time employees, and those that are in a
management role are more prone to perform proper hygiene procedures more often than their
counterparts. This shows why management must focus on the training of younger and less
experienced employees.
This study also agrees with the findings of Hertzman and Barrash (2007) and Farrish et
al. (2009) that there is an overwhelming need for better training and educational programs for the
catering employee. Significant disparities were noted in general knowledge between those who
were trained compared to those who were not trained. For example, this study and the Hertzman
and Barrash’s (2007) studies confirmed that there is a lack of temperature monitoring in food
items, especially high-risk items. This study also discovered that temperature was not
adequately monitored in the back-up of food items. Both studies determined that employees did
not correctly practice wearing gloves when working around ready to eat food. Hertzman and
Barrash (2007) found 131 violations in this component of food safety while the present study
found that those without training on average answered that they neither disagree nor agree with
wearing gloves when working with food. The average respond rate was 3.4 (on 5-point scale)
for this question.
Overall it was found that employees with more experience tend to show more knowledge

74
concerning proper food safety procedures. As mentioned above managers can learn from this
and tap into a resource of training that they might not have thought of. Practicing with a partner
such as a buddy training system not only teaches new employees the proper way to do things but
also encourages and models the correct food safety guidelines that must be practiced. Another
strategy that can improve the food safety procedures in a catering business is to place
experienced servers into a national food safety program such as ServSafe (The National
Restaurant Association Educational Foundation, 2010). The veteran server will become more
proficient and knowledgeable in this area and can then pass on their skills and knowledge to the
less experienced individuals. This can save costs since only a part of the team is taking the actual
course while the benefits of the program can help all involved. It really does not matter what the
employment status of a food worker is since one or time or another they will come into contact
with the food. Training for only the full-time help cannot be justified. The catering industry is a
popular and growing business. Effort should be made to make sure it is a safe and positive
experience for all.
The study also detected a significant gap between the perceptions of management and
front line workers. As most managers are required to be food safety certified it is disturbing to
find that they feel their establishments and workers have the appropriate knowledge when they
do not. It was also found that over time and with years of experience workers adapt and learn
proper procedures themselves. The age and experience level is a defining factor that will lend to
performing proper safety measures. This study found that age and experience is significant
while the Farrish et al., (2009) study did not. This shows that managers can utilize their talented
workers to help train and teach proper food safety procedures to part-time and beginning
employees.

75
Implications
The implications of this research point toward management. Managers need to be aware
of the importance of training. Understandably, managers may be concerned with many other
details besides food safety, but food safety must be a top priority. This study found that 72.9% of
the respondents answered that they have not received any training in food safety. Therefore an
effort must take place to formulate training for a greater population of the catering employees.
The results of this study also revealed that there is a lack of knowledge by the younger workers
in essence due to the lack of training and experience on the job. Training is a critical key that
will help a catering business reduce the instances of food borne illness and or the passage of
these illnesses. The more aware and the better-informed employees are about food safety then
the better the likelihood these harmful situations can be reduced.
Many companies pay for managers to become certified. Ironically these individuals may
not deal with the food directly. All food handlers should be certified since they pose a greater
risk to pass on a contaminated food or fail to compile with proper food safety measures.
ServSafe (NRAEF, 2010) certification is an expensive program and may not be included in the
budget for many companies, however the rewards from this program will be very beneficial. If
possible a catering business should consider this certification program. If ServSafe (NRAEF,
2010) is not a feasible avenue then there are other ways to cut costs and still train and impart
important knowledge to the employees. New employees can be paired with veteran employees
who have experience and perform proper procedures on a daily basis. Employees working
together in a buddy system until they are properly trained will help teach basic knowledge of
food safety while saving costs on expensive certification programs. Inexperienced employees
can benefit from the teaming method. The major focus areas that the lead employee can help

76
model for their partner would be personal hygiene with special emphasis on hand washing,
correct equipment usage and maintenance, knowledge of food handling, exhibiting knowledge
and practice of correct food temperatures when storing or serving food, and how to avoid mixing
raw and cooked foods together.
This study detected that the amount of experience a server has attained will impact the
amount of knowledge that the individual will take in and practice with regards to food safety.
This was a significant finding that did not agree with previous studies (Farrish et al., 2009).
Unfortunately, there is a large turnover rate for employees in the catering field. Management of
a catering business should try to keep their employees and develop stability in their staff thereby
developing a more experienced food handler.
Management is ultimately responsible for the safety of their patrons and must do all that
is necessary to ensure their safety. Another major implication of this study points to the training
aspect of the catering personal. All employees need to be trained in some way to safeguard the
health of the consumer. Management should routinely examine certification and training
procedures to ensure that they are keeping their guests safe.
Educational institutions can also help to remedy the food safety issue. Hospitality
schools should include food safety education in the curriculum or may need to devote more time
and emphasis on food safety. Institutions can also upgrade their requirements by including a
nationally recognized food safety certification as part of the graduation requirements of their
program.
The results of this study can provide significant information that can be examined at the
national level. The Food and Drug Administration does not provide federal guidelines in

77
regulating catering businesses (US FDA, 2010). The FDA does provide regulation for many
other food service establishments including restaurants, schools, health-care facilities,
correctional facilities, and grocery stores. Regulations for catering businesses are developed by
city, county, or state levels thereby leaving the US without uniform regulations for all catering
establishments and operations. The results of this study show a need for uniform regulations for
all catering establishments at the federal level in order to ensure that all catering businesses meet
the same food safety guidelines.
Furthermore the results of this study provide significant evidence that greater emphasis
must take place to require proper training of all employees in the catering sector. An educational
training program that focuses on the catering sector can be developed by utilizing the usable
factors gained from literature studies, focus groups, and county health checklists. A national
recognized program such as ServSafe (NACF, 2010) could examine the findings of this study
and incorporate the major factors of food safety issues into a specific certification for catering
employees.
Study Limitations
The limitations of this study are due to the fact that there were two different methods of
distribution. Even though no remarkable differences were observed in the responses, this should
be noted. There may be a bias since there was a low response rate from the online responses and
since there was an administration of some of the surveys given out at several catering
establishments. Although every effort was taken to lower any potential bias by management, this
procedure may have produced bias. The managers at these establishments were present and the
surveys were completed at the place of employment. Another limitation that can be pointed out

78
is that identifiable information was not taken from the respondents, therefore it is not known how
even the distribution was across the country. Social desirability may also have an effect on this
study. Respondents may have answered more favorably than they actually perform and this
should be taken into consideration.
Future Research
This research can serve as a starting point to examine food safety in the catering sector
but more studies in this area are needed and more possibilities should be explored.
Research should be extended to examine the actual behaviors of servers while in action,
compared to what behaviors are being reported. Employees could be tested to determine if they
are actually performing behaviors that they claim they are doing. Testing these behaviors will be
difficult and poses limitations in direct observation of the individuals. Also it might be difficult
to find willing employers who would allow direct observations of their operations on the job site.
Another study that can be implemented is to specifically observe off-site events to see
what precautions are used to ensure food safety. Observing servers in both situations may find
differences in attitude and practices involving food safety by comparing on-site operations vs.
off-site operations. An observation study should be followed by this research to find if
employees actually perform the tasks properly. It would be beneficial to see exactly what types
of shortcuts are taking place during the most hectic times of an event. It would be important to
determine what tasks are not being performed properly due to the high stress environment.
Studies could also investigate any relationship between higher guest count and the occurrence of
food borne outbreaks. Another avenue that can be examined is how the size of a catering or
banquet operation affects their ability to implement proper food safety procedures. Studies could

79
be undertaken to compare the food safety procedures and implementation of these procedures in
smaller scale operations to that of operations over a million square feet of conference space.
Such studies would help in understanding if larger operations would need to modify their
training procedures.
Additional studies should take place that examines the amount of experience employees
possess with respect to their knowledge and practice of food safety. This study found that a
greater amount of experience tended to yield the proper perception of food safety. However,
more research is needed to solidify this conclusion.

80
References
Armitage, C.J. & Conner M. (2001). Efficacy of the theory of planned behavior: A meta-
analytic review. British Journal Social Psychology, 40 (4), 471-499.
Center for Disease Control and Prevention. (2010). Retrieved from http://www.cdc.gov/
Clayton, D.A. (2004). Understanding and predicting food handlers’ implementation of
specific food safety practices using social cognition models. UK: University of
Wales.
Clayton, D.A. & Griffith C. J. ( 2002). Food handlers’ beliefs and self-reported practices.
International Journal of Environmental Health Research, 12: 25-39.
Clayton, D.A., Griffith C.J. ( 2004).Observation of food safety practices in catering using
notational analysis. British Food Journal, 106 (3): 211-228.
Clayton, D.A., Griffith C.J., Price P.E. & Peters, A.C. (2003). Food handlers’ beliefs and
self- reported practices. International Journal of Environmental Health Research, 12
(1): 25-39.
Clayton, D.A. & Griffith C.J. (2008). Efficacy of an extended theory of planned behavior
model predicting caterers’ hand hygiene practices. International Journal of
Environmental Health Research, 18 (2): 84-96.
Daniels, N.A., Bergmire-Sweat, D.A., Schwab, K.J., Hendriks, K.A., Reddy, S., Rowe,
S.M., Frankhauser, R.L., Monroe, S.S., Atmar, R.L., et al. (2000). A food borne
outbreak of gastroenteritis associated with Norwalk-like viruses: First molecular trace
back to deli sandwiches contaminated during preparation. Journal of Infectious
Disease, 181:1467-1470.

81
Farrish, John R.,Kitterlin, Miranda D., Hertzman, Jean, & Stefanelli, John ( 2009). Work
Experience and education: Their effect on food safety practices of university students.
International CHRIE Conference- Refereed Track, ScholarWorks@UMass Amherst.
Food Safety and Hygiene Working Group. (1997), Industry guide to good hygiene
practice: Catering guide: London: Chadwick House Group Ltd.
Food Standards Agency. (2000). Food hygiene trade campaign. communications on
behalf of the food standards agency: IFF Research Ltd. Retrieved from
http://www.foodstandards.gov.uk
Griffith, C.J. Livesey, K.M. & Clayton, D.A. (2010). Food safety culture: The evolution
of an emerging risk factor? British Food Journal, 112 (4): 426-438.
Guzewich, J.J. (1995). The anatomy of a glove rule. Environmental Digest, Fall: 4-13.
Hertzman, J & Barrash, D. (2007). An assessment of food safety knowledge and practices
of catering employees. British Food Journal, 109: 7.
Hofstede, G. (1998). Attitudes, values, and organizational culture: Disentangling the
concepts. Organizational Studies, 19 (3): 477-92.
Janz, N.K., Becker, M.H. (1984). The health belief model: A decade later. Health
Education Quarterly. 11 (1): 1-47.
Kassa, H. (2001). An outbreak of Norwalk-like viral gastroenteritis in a frequently
penalized food service operation. Journal of Environmental Health, 64 (5): 9-33.
Kaynak, E., Bloom, J.,& Leibold, M. (1994). Using Delphi technique to predict
future tourism potential. International Journal of Managing Projects in
Business, 2 (1):19-20.
Kilgore, P.E., Belay, E.D., Hamlin, D.M., Noel, J.S., Humphrey, C.D., Gary, H.E., Ando,
T., Monroe, S.S., Kludt, P.E., Rosenthal, D.S., et al. (1996). University outbreak of
gastroenteritis due to a small round-structured virus: Application of molecular

82
diagnostics to identify the etiologic agent and patterns of transmission. Journal of
Infectious Diseases, 173 (4):787- 793.
Mitchell, Robert.,Fraser, Angela M., Bearon, Lucille B. (2007). Preventing food borne
illness in food service establishments: Broadening the framework for intervention and
research on safe food handling behaviors. International Journal of Environmental
Health Research, 17 (1): 9-24.
National Association of Catering Executives. (2010). Retrieved from
http://www.nace.net/
National Restaurant Association Educational Foundation. ServSafe 2010. Retrieved
from http://www.servsafe.com
National Restaurant Association.(2008). Retrieved from http://www.restaurant.org/
Nummer, B., Fraser, A., Marcy, J. & Klein, R. (2009). Assessing food safety training
needs of environmental health specialists in the us: Focus group summary. Journal of
Environmental Health, 72 (8): 16-17.
O’Boyle, C., Henly, S.J., Larson, E. (2001). Understanding adherence to hand hygiene
recommendations: The theory of planned behavior. American Journal of Infection
Control, 29:352-360.
Olsen, S.J., Hansen, G.R., Bartlett, L., Fitzgerald, C., Sonder, A., Manjrekar, R., Riggs,
T., Kim, J. et al. (2001). An outbreak of campylobacter jejuni infections associated
with food handler contamination: The use of pulsed-field gel electrophoresis. Journal
of Infectious Disease, 183:164-167.
Ralston, K., Brent, C.P., Starke, Y., Riggins, T., Lin, C.T.J. (2002). Consumer food
safety behavior: A case study in hamburger cooking and ordering. Consumer Food
Safety Behavior, (Unpublished report).
Redmond, D.M., Griffith, C.J., Slader, J., Humphrey, T. ( 2004). Microbiological and

83
observational analysis of cross-contamination risks during domestic food
preparation. British Food Journal, 106 (8):581-597.
Retail Food-Service Food Safety Consortium. (2010). Retrieved from
http://www.extension.usu.edu/
Scharff, Robert. Health-related costs from food borne illness in the united states. (2009).
Retrieved from http://www.producesafetyproject.org
United States Census Bureau. (2006). Retrieved from http://www.census.gov
United States Food and Drug Administration. (2007- 2008). Retrieved from
http://www.fda.gov/
Valuation Resources, LLC. (1999-2011). Retrieved from
http://www.valuationresources.com
Yasuda, Tomohide. (2010). Food safety regulation in the united states: An empirical and
theoretical examination. Independent Review, 15 (2): 201-226.
Yiannas, F. (2009). Food Safety Culture: Creating A Behavior Based Food Safety
Management System, Springer, NY.

84
Appendix I
Auburn University
College of Human Sciences
Department of Nutrition and Food Science
328 Spidle Hall
Auburn, Alabama 36849
334-844-4261
INFORMATION LETTER
for a Research Study entitled
“Analyzing Food Safety Cultures: A Means to Improve Food Safety in the Catering Sector”
You are invited to participate in a research study. The purpose of this study is to analyze behavior perceptions of the food server with regards to food safety practices in the catering arena. As food borne illnesses are still a critical concern for patrons and catering management, increasing knowledge about how food handlers perceive their role would be beneficial in identifying weaknesses in the prevention of these illnesses. The study is being conducted by Sara Ghezzi, Graduate Student, under the direction of Dr. Baker Ayoun of the Auburn University Department of Hotel and Restaurant Management. You were selected as a possible participant because you are employed in the field of catering and/or special events, a member of the National Association of Catering Executives and are of legal age in the state in which you reside (19 in AL and NE).
What will be involved if you participate? If you decide to participate in this research study, you will be asked to acknowledge your acceptance of participation via e-mail sent to [email protected]. You can choose to have the survey mailed or if you wish to take the survey electronically a link is attached at the bottom of this E-mail. If not a packet including surveys will be sent to your business or another address in which you supply in your acceptance

85
E-mail. You will need to complete the surveys and to then send the completed surveys back in the pre-paid postage envelope. Your total time commitment will be approximately ten minutes to complete the survey. If you take the survey electronically, you only need to submit online when you are finished.
Are there any risks or discomforts? The only possible risk associated with participation in this study could be the risk of breach of confidentiality. To minimize this risk we will not collect any identifiable information from you.
Will you receive compensation for participating? To thank you for your time, you will be offered a copy of all results and information on how to improve food safety in the catering sector that was gathered from this study. If you would like a copy of the results E-mail [email protected] with information on where to send the results.
If you change your mind about participating can you withdraw from this study? You can withdraw at any time during this study. Your participation is completely voluntary. If you choose to withdraw, your data can be withdrawn as long as it is identifiable. Your decision about whether or not to participate or to stop participating will not jeopardize your future relations, with the Department of Hotel and Restaurant Management of Auburn University.
Any data obtained in connection with this study will remain anonymous. We will protect your privacy and the data you provide by not having identifiable information present. The information collected through your participation may be used to fulfill an educational requirement specifically for a thesis.
If you have questions about this study please do not hesitate to ask. Please contact Ms. Sara Ghezzi at ( 305)-803-1919 or email [email protected] or contact Dr. Baker Ayoun at
If you have questions about your rights as a research participant please contact the

86
university. You may contact the Auburn University Office of Research Compliance or the Institutional Review Board by phone (334)-844-5966 or email [email protected] or [email protected].
HAVING READ THE INFORMATION PROVIDED, YOU MUST DECIDE IF YOU WANT TO PARTICIPATE IN THIS RESEARCH PROJECT. IF YOU DECIDE TO PARTICIPATE, THE DATA YOU PROVIDE WILL SERVE AS YOUR AGREEMENT TO DO SO. THIS LETTER IS YOURS TO KEEP.
"The Auburn University Institutional Board has approved this document from July 11, 2010 to July 10, 2011. Protocol #10-184 EX 1007."
___________________________________
Investigator's Name Date
______________________________
Co-Investigator Date
https://auburnoira.qualtrics.com/SE/?SID=SV_6gswQnUbqvre5KI

87
Appendix II
Survey Instrument
1. Your Gender?
• Male
• Female
2. Please choose your age range.
• Younger than 20 years
• 20-29 years
• 30-39 Years
• 40-49 Years
• 50-59 Years
• 60 or over years
3. Please enter your number of years of experience in Catering and/or Special Events. 4. Please list your current work title/position. 5. Do you consider your current work position a management position?
• Yes
• No 6. Have you had any previous food safety training?
• Yes
• No 7. What is your highest formal education?

88
• None/ Some High School
• High School Graduate
• Some College/ Technical School
• College Graduate
• Graduate School
• Military 8. Please list any food safety training programs you have attended or completed. 9. Are you responsible for training employees or implementing programs in food safety?
• Yes
• No 10. What is your employment status?
• Part-time
• Full-time
The following section includes factors regarding the holding of food. Please choose the answer choice that best represents what you think: 11. In my area, food is kept safe during transportation to off-site events.
• Strongly Disagree
• Disagree
• Neither Agree nor Disagree
• Agree
• Strongly Agree
12. I feel that in my area cold food items are properly monitored for temperature.
• Strongly Disagree
• Disagree
• Neither Agree nor Disagree
• Agree
• Strongly Agree
13. I feel checking food temperatures can prevent food borne illnesses.

89
• Strongly Disagree
• Disagree
• Neither Agree nor Disagree
• Agree
• Strongly Agree 14. I ensure chafers are properly lit and functioning before food is placed in them.
• Strongly Disagree
• Disagree
• Neither Agree nor Disagree
• Agree
• Strongly Agree 15. I ensure cold food items are always placed on ice to keep temperature correct.
• Strongly Disagree
• Disagree
• Neither Agree nor Disagree
• Agree
• Strongly Agree
16. I often ensure in the back of the house backup items for buffets are labeled and covered properly.
• Strongly Disagree
• Disagree
• Neither Agree nor Disagree
• Agree
• Strongly Agree
Please rate how often the following happens in your area. 17. How often do you think the temperature of cold food items in your area are monitored appropriately?"
• Never
• Rarely
• Sometimes
• Very Often
• Always 18. How often is food that has been out for too long removed?

90
• Never
• Rarely
• Sometimes
• Very Often
• Always 19. How frequently is food placed in chafers before they are lit and checked for proper functioning?
• Never
• Rarely
• Sometimes
• Very Often
• Always 20. How often is hot food in your area maintained at a temperature above 141F?
• Never
• Rarely
• Sometimes
• Very Often
• Always 21. How often is temperature monitored in the backup of food items in the back of the house?
• Never
• Rarely
• Sometimes
• Very Often
• Always 22. How often do you mix food that has been sitting out with fresh food?
• Never
• Rarely
• Sometimes
• Very Often
• Always
The following section discusses factors related to Personal Hygiene. Please choose the answer choice that best represents what you think: 23. I firmly believe that I should wash my hands every time I serve food.

91
• Strongly Disagree
• Disagree
• Neither Agree nor Disagree
• Agree
• Strongly Agree 24. I think there is a need to be reminded after clearing dirty plates and silverware to wash hands before serving food again.
• Strongly Disagree
• Disagree
• Neither Agree nor Disagree
• Agree
• Strongly Agree
25. I think that the temperature of water should be at least warm for proper hand washing.
• Strongly Disagree
• Disagree
• Neither Agree nor Disagree
• Agree
• Strongly Agree
26. I think there should always be a hand washing facility available at off-site events
• Strongly Disagree
• Disagree
• Neither Agree nor Disagree
• Agree
• Strongly Agree
27. I believe that coming to work in a dirty uniform will affect food safety.
• Strongly Disagree
• Disagree
• Neither Agree nor Disagree
• Agree
• Strongly Agree
28. I feel if I am sick I will not affect a guest’s chance of becoming ill while I am at work.
• Strongly Disagree
• Disagree
• Neither Agree nor Disagree

92
• Agree
• Strongly Agree
29. I feel that eating or drinking in the back of the house does not affect the safety of food in my area.
• Strongly Disagree
• Disagree
• Neither Agree nor Disagree
• Agree
• Strongly Agree
30. I feel single use gloves should be worn at all times when preparing food.
• Strongly Disagree
• Disagree
• Neither Agree nor Disagree
• Agree
• Strongly Agree •
31. I feel it is acceptable if I dry my hands on my uniform after washing them.
• Strongly Disagree
• Disagree
• Neither Agree nor Disagree
• Agree
• Strongly Agree •
32. I don’t believe that jewelry affects the safety of food.
• Strongly Disagree
• Disagree
• Neither Agree nor Disagree
• Agree
• Strongly Agree
Please rate how often you do the following: 33. How often do you wash your hands when returning from a break?
• Never
• Rarely

93
• Sometimes
• Very Often
• Always 34. How frequently do you wash your hands after you touch your face and hair?"
• Never
• Rarely
• Sometimes
• Very Often
• Always
The following section discusses factors related to various Equipment. Please choose the answer choice that best represents what you think: 35. I feel that chafers are cleaned after each use in my area.
• Strongly Disagree
• Disagree
• Neither Agree nor Disagree
• Agree
• Strongly Agree 36. I feel it is important to ensure glassware is free of chips.
• Strongly Disagree
• Disagree
• Neither Agree nor Disagree
• Agree
• Strongly Agree
37. I believe there is no need to check chafers before an event.
• Strongly Disagree
• Disagree
• Neither Agree nor Disagree
• Agree
• Strongly Agree 38. I feel you should only work with food at an off-site event when there is coverage overhead.

94
• Strongly Disagree
• Disagree
• Neither Agree nor Disagree
• Agree
• Strongly Agree 39. I feel that ice can be mixed with raw and cooked foods and be safe for consumption.
• Strongly Disagree
• Disagree
• Neither Agree nor Disagree
• Agree
• Strongly Agree Please rate how frequently the following happens in your area. 40. How often are utensils cleaned after each use?
• Never
• Rarely
• Sometimes
• Very Often
• Always 41. How often are hot holding devices checked for the proper temperature during an event?
• Never
• Rarely
• Sometimes
• Very Often
• Always 42. How often is there no hand washing facility available at an off-site event?
• Never
• Rarely
• Sometimes
• Very Often
• Always